
Circulating microRNAs in endometriosis
268
Circulating microRNAs in endometriosis Victoria Nisenblat The Robinson Institute Research Centre for Reproductive Health, Discipline of Obstetrics and Gynaecology, University of Adelaide, Adelaide, Australia A thesis submitted to the University of Adelaide in fulfilment of the requirements for admission to the degree Doctor of Philosophy July 2013
-
Upload
khangminh22 -
Category
Documents
-
view
0 -
download
0
Transcript of Circulating microRNAs in endometriosis

Circulating microRNAs
in endometriosis
Victoria Nisenblat
The Robinson Institute
Research Centre for Reproductive Health,
Discipline of Obstetrics and Gynaecology,
University of Adelaide, Adelaide,
Australia
A thesis submitted to the University of Adelaide in fulfilment of the
requirements for admission to the degree Doctor of Philosophy
July 2013


Victoria Nisenblat I
TABLE OF CONTENTS
TABLE OF CONTENTS ______________________________________________________ I
ABSTRACT __________________________________________________________ VI
DECLARATION _________________________________________________________ VIII
ACKNOWLEDGMENTS ____________________________________________________ IX
PUBLICATIONS ARISING FROM THIS THESIS ___________________________________ XI
COMMERCIAL POTENTIAL ARISING FROM THIS THESIS _________________________ XI
ABSTRACTS ARISING FROM THIS THESIS ____________________________________ XII
LIST OF FIGURES _______________________________________________________ XIII
LIST OF TABLES ________________________________________________________ XVI
ABBREVIATIONS _______________________________________________________ XIX
Introduction _________________________________________________ 1
1.1 Structure of the thesis _____________________________________________________ 2
1.2 Background to the study ___________________________________________________ 4
1.2.1 The enigma known as endometriosis ___________________________________________ 4
1.2.2 MiRNAs – small molecules with a huge potential _________________________________ 19
1.3 The need for the study ___________________________________________________ 28
1.4 Hypotheses and objectives ________________________________________________ 28
Experimental strategies for circulating miRNA research _____________ 31
2.1 Introduction ____________________________________________________________ 32
2.2 Quantification of circulating miRNAs ________________________________________ 32

II Victoria Nisenblat
2.2.1 Pre‐analytical variables and sample preparation __________________________________ 32
2.2.2 MiRNA extraction __________________________________________________________ 35
2.2.3 RNA concentration and quality determination ___________________________________ 38
2.2.4 Detection of miRNA expression _______________________________________________ 40
2.3 Guidelines for publication of the expression profiling data _____________________ 59
2.4 Summary points ________________________________________________________ 60
Materials and Methods ______________________________________ 63
1.1 Establishment of tissue bank (blood and endometrial tissue samples) ____________ 64
3.1.1 Recruitment of participants __________________________________________________ 64
3.1.2 Sample collection and processing _____________________________________________ 65
3.2 Optimization of RNA isolation from plasma __________________________________ 66
3.2.1 Plasma to Trisol ratio, plasma dilution, plasma volume ____________________________ 66
3.2.2 Spike‐ in synthetic miRNAs ___________________________________________________ 68
3.2.3 Inter‐ and intra‐assay variability and use of carrier for small RNA ____________________ 70
3.2.4 Intra‐operator variability ____________________________________________________ 71
3.2.5 Assessment of miRNA quality and quantity ______________________________________ 72
3.3 The protocol of RNA isolation from plasma, established in our laboratory _________ 74
3.4 MiRNA extraction from endometrial tissue __________________________________ 75
3.4.1 MiRNA extraction __________________________________________________________ 75
3.4.2 MiRNA quantification and quality control _______________________________________ 76
3.5 MiRNA profiling in plasma ________________________________________________ 76
3.5.1 TaqMan Low density Human miRNA RT‐PCR arrays _______________________________ 77
3.5.2 Singleplex qRT–PCR_________________________________________________________ 81
3.6 MiRNA profiling in endometrial tissue ______________________________________ 84
3.6.1 MiRNA microarray and analysis _______________________________________________ 84
3.7 Statistical analysis ______________________________________________________ 85

Victoria Nisenblat III
3.7.1 Demographic characteristics _________________________________________________ 85
3.7.2 TLDA miRNA experiment in plasma ____________________________________________ 85
3.7.3 Affymetrix hybridisation miRNA microarray in endometrial tissue ___________________ 86
3.7.4 Heat maps and Venn diagrams _______________________________________________ 87
3.7.5 qRT‐PCR experiment _______________________________________________________ 87
3.7.6 Subgroup analyses (study presented in Chapter 7) ________________________________ 87
3.7.7 Diagnostic performance of plasma miRNAs _____________________________________ 88
3.8 Identification of predicted miRNA targets and in silico functional analysis _________ 88
3.9 Strategy for conducting the diagnostic accuracy study __________________________ 90
Expression profile of plasma miRNAs across the menstrual cycle in
women with and without endometriosis ________________________________________ 95
4.1 Introduction ____________________________________________________________ 96
4.2 Materials and Methods ___________________________________________________ 96
4.2.1 Study participants _________________________________________________________ 96
4.2.2 Blood collection and miRNA extraction _________________________________________ 97
4.2.3 MiRNA profiling ___________________________________________________________ 97
4.2.4 Identification of predicted miRNA targets and in silico functional analysis _____________ 97
4.3 Results ________________________________________________________________ 97
4.3.1 Study participants _________________________________________________________ 97
4.3.2 Performance of the miRNA TLDA______________________________________________ 98
4.3.3 Expression of the miRNAs across the menstrual cycle ____________________________ 101
4.3.4 Differential expression of circulating miRNAs in endometriosis _____________________ 102
4.3.5 Correlation of plasma miRNA profile in endometriosis with previously published data on
miRNA signatures in endometrial tissue __________________________________________________ 106
4.3.6 Validation of the array results with qRT‐PCR analysis of miRNA expression ___________ 108
4.3.7 The role of the circulating miRNAs in endometriosis _____________________________ 108
4.4 Discussion ____________________________________________________________ 113

IV Victoria Nisenblat
4.4.1 Influence of the menstrual cycle on expression of circulating miRNAs ________________ 113
4.4.2 The plasma miRNA profile in endometriosis ____________________________________ 115
4.4.3 Functional involvement of dysregulated plasma miRNAs in endometriosis ____________ 116
4.4.4 Limitations ______________________________________________________________ 119
4.5 Conclusions ___________________________________________________________ 119
Insight on the function of the dysregulated circulating miRNAs _____ 121
5.1 Introduction __________________________________________________________ 122
5.2 Materials and methods _________________________________________________ 122
5.3 Results _______________________________________________________________ 122
5.3.1 The experimentally validated functions and inter‐relationships of the circulating miRNAs 122
5.3.2 Review of the role of circulating miRNAs in human disease ________________________ 124
5.4 Conclusions ___________________________________________________________ 133
MiRNA expression profile in eutopic endometrium in endometriosis _ 135
6.1 Introduction __________________________________________________________ 136
6.2 Materials and Methods _________________________________________________ 137
6.2.1 Study Participants _________________________________________________________ 137
6.2.2 Tissue collection, RNA extraction and sample quality control _______________________ 138
6.2.3 MiRNA profiling ___________________________________________________________ 139
6.3 Results _______________________________________________________________ 139
6.3.1 Study Participants _________________________________________________________ 139
6.3.2 Summary on QC of the microarray data ________________________________________ 140
6.3.3 Differentially expressed miRNAs _____________________________________________ 142
6.4 Discussion ____________________________________________________________ 148
6.5 Limitations ___________________________________________________________ 152
6.6 Conclusions ___________________________________________________________ 152

Victoria Nisenblat V
Plasma miRNAs as a non‐invasive diagnostic tool for endometriosis __ 155
7.1 Introduction ___________________________________________________________ 156
7.2 Materials and Methods __________________________________________________ 157
7.2.1 Study design _____________________________________________________________ 157
7.2.2 Study participants ________________________________________________________ 157
7.2.3 Processing of the samples and miRNA profiling _________________________________ 158
7.2.4 Selection of targets to explore for a diagnostic test ______________________________ 159
7.3 Results _______________________________________________________________ 159
7.3.1 Phase I ‐ Marker discovery __________________________________________________ 159
7.3.2 Phases II‐III – Marker selection and large scale validation _________________________ 161
7.4 Discussion ____________________________________________________________ 181
7.5 Limitations ____________________________________________________________ 187
7.6 Conclusions ___________________________________________________________ 188
General discussion and conclusions ____________________________ 191
8.1 Introduction ___________________________________________________________ 192
8.2 Quantification of circulating miRNA and approach to the data analysis ___________ 193
8.3 Influence of the menstrual cycle on expression of circulating miRNAs ____________ 194
8.4 Plasma miRNA profile in endometriosis _____________________________________ 194
8.5 Functional involvement of dysregulated plasma miRNAs in endometriosis ________ 195
8.6 MiRNA expression in eutopic endometrium in endometriosis ___________________ 196
8.7 Plasma miRNAs as diagnostic markers for endometriosis ______________________ 197
8.8 Future perspectives _____________________________________________________ 198
References ________________________________________________ 201

VI Victoria Nisenblat
ABSTRACT
Endometriosis is defined as the presence of endometrial tissue outside the uterus and is the
leading cause of disability in reproductive‐age women. The pathogenesis of endometriosis
remains unclear and no blood test is available for early diagnosis of the disease. MicroRNAs
(miRNAs) are endogenous small ribonucleic acids (RNAs) that have important gene‐regulatory
roles via posttranscriptional suppression of target genes. The biological importance of
miRNAs, initially demonstrated in cancer, has more recently been confirmed in other diseases.
In light of the sustained presence of miRNAs in the circulation and given the emerging
evidence on aberrant miRNA expression in endometriotic tissue, we hypothesized that
endometriosis is associated with unique plasma miRNA signatures that have diagnostic
potential and possibly contribute to disease pathogenesis.
In order to test this hypothesis, we established a procedure to measure plasma miRNAs and
created a tissue bank of prospectively collected blood and eutopic endometrium samples.
Next, by using qRT‐PCR‐based arrays we screened the plasma of a small set of women (n = 16)
with or without endometriosis for miRNA content at 3 different phases of the menstrual cycle.
We demonstrated that plasma miRNAs do not fluctuate across the cycle and identified 12
plasma miRNAs that are differentially abundant in endometriosis. In silico functional analyses
revealed that these miRNAs and their predicted targets have functional relevance in
endometriosis, being involved in molecular pathways known to be associated with the
disease.
Using a microarray methodology, we profiled miRNAs in eutopic endometrium from women
with and without endometriosis. We demonstrated no correlation between dysregulated
miRNAs in endometrium and plasma, suggesting that the differentially abundant circulating
miRNAs are not released from the endometrium. Mir‐551a and mir‐148a* were significantly
dysregulated in the endometrium from women with endometriosis, and thus are putative
diagnostic markers and therapeutic targets. We also identified differences in miRNA
expression between endometriosis‐free women with and without pelvic pain, suggesting that
pelvic pain might independently modify the endometrial miRNA profile.
Finally, we assessed the value of plasma miRNAs as molecular markers for endometriosis in a
prospective diagnostic study in a larger cohort (n = 68) of symptomatic women by using
singleplex qRT‐PCR. The diagnostic accuracy of circulating miRNAs for patients with

Victoria Nisenblat VII
endometriosis was assessed with a predictive algorithm incorporating miRNA expression
levels and clinical parameters. A model that included mir‐155, mir‐574‐3p, mir‐133a and mir‐
30c, history of infertility and previous miscarriages demonstrated an accuracy of 84.1% with
93.5% sensitivity, 58.8% specificity and AUC = 0.831.
This thesis presents potential novel biomarkers for early detection of endometriosis, laying
the ground work for future efforts to develop blood‐based biomarkers for this disease. An
accurate non‐invasive test would reduce the need for a surgical diagnosis, would be more
accessible to women, and is likely to lead to an earlier diagnosis and treatment of
endometriosis. Our results need to be confirmed in larger independent patient groups in
different populations. In addition, this work raises the possibility that plasma miRNAs may
provoke some of the adverse health epiphenomenon associated with endometriosis, which
potentially could be altered by therapeutic manipulations of endometriosis‐associated plasma
miRNAs. Future studies and broader miRNA profiling may elucidate a relationship between
miRNAs, endometriotic disease and its severity.

VIII Victoria Nisenblat
DECLARATION
This work contains no material which has been accepted for the award of any other degree or
diploma at any university or other tertiary institution and, to the best of my knowledge and
belief, contains no material previously published or written by another person, except where
due reference has been made in the text.
I give consent to this copy of my thesis, when deposited in the University Library, being made
available for loan and photocopying, subject to the provisions of the Copyright Act 1968. I also
give permission for the digital version of my thesis to be made available on the web, via the
University’s digital research repository, the Library catalogue, the Australian Digital Thesis
Program and also through web search engines, unless permission has been granted by the
University to restrict access for a period of time.
Victoria Nisenblat
July 2013

Victoria Nisenblat IX
ACKNOWLEDGMENTS
It is a pleasure to thank the people without whom this thesis would not have been possible.
First and foremost, I would like to thank my supervisors Dr Louise Hull for her able guidance,
constructive criticism, timely motivation and mentoring, Professor Sarah Robertson for
appraising my work with a level of professionalism I have come to be envious of, and to
Professor Rob Norman for support and for giving me the opportunity to undertake this project.
I also offer my profound thanks to Associate Professor Cristin Print for productive discussions
and his patience in teaching me statistics, bioinformatics and far beyond that. I consider it as
an honour to work with such talented and dedicated people, each of you has been an
inspiration.
I am indebted to my friends and colleagues at the department that I have had the pleasure of
working with. I owe my sincere thanks to Wee Ching Kong for her friendship, moral support
and advice on different research aspects; you were always there when I needed you. I would
like to express my gratitude to John Schjenken, David Sharkey and Melinda Jasper for teaching
me the experimental work and for valuable suggestions regarding my project. I would also like
to thank Laura Watson for her willingness to help every time I run into trouble with the
Thermocycler, including weekends and after hours. I would like to say a huge thank you to the
past and present members of the Endometriosis group for their support and readiness to
share ideas, in particular to Maria Teague, Mohammad Zahied Johan, Zhao Wang and
Jonathan McGuane.
I would like to acknowledge Dr. Susan Evans and surgical team of the Women’s and Children’s
Hospital for enthusiasm, help in recruitment of patients and collection of the samples. I would
also like to recognise Mark van der Hoek and Rosalie Kenyon for their assistance with the
microarray experiments and Thomas Sullivan for statistical advice.
I extend my appreciation to Virginia Furness and Kay Govin for all their help with
administrative matters. I am grateful to the University of Adelaide and the Robinson institute
for my postgraduate scholarship and travel grants.
I offer a sincere thanks to my colleagues at the Women’s and Children’s Hospital who enabled
me to combine the hectic years of research with clinical practice in a new country, particularly
to Dr. Geoff Matthews and Associate Professor John Svigos for their tremendous support and

X Victoria Nisenblat
to Dr. Namiko Kobayashi, Dr. Nicole Dryer, Dr Vamsee Thalluri and Dr. Tristan Hardy for their
friendship and encouragement.
I take this opportunity to thank Lynnette Zedov, Alex and Natalie Koifman, Nyra and Albert
Bensimon, TChow‐table mates and many other dear friends of mine for your support, patience
and understanding. Thank you for bearing with me, for giving me space and for helping me to
get on with life; I am very lucky to have you all.
Lastly, and most importantly, I would like to express my love and gratitude to my dear family,
Mum, Dad, Pol, Tal and Michelle, whose unfailing love and support over the years has been
beyond measure. Undoubtedly, my husband Pol deserves as much credit for the completion
of this thesis as I do. You always stood by me through the good times and bad; without you I
would not be where I am today.

Victoria Nisenblat XI
PUBLICATIONS ARISING FROM THIS THESIS
Non‐invasive tests for the diagnosis of endometriosis. Protocol for the Cochrane review.
Nisenblat V, Farquhar C, Akoum A, Fraser I, Bossuyt PMM, Hull ML.
The Cochrane library, January 2012
Plasma miRNA profiles in women with and without endometriosis – additional
considerations towards development of a miRNA‐based blood test.
Nisenblat V, Print C, Evans S, Ohlsson‐Teague EMC, Robertson S, Hull ML.
Submitted for review, Human Reproduction, January 2013.
Role of miRNAs in endometrial disease in association with reproductive disorders and
prospects for circulating miRNAs in diagnosis of endometrial function.
Nisenblat V, Hull ML.
RBM Online, in press 2013.
COMMERCIAL POTENTIAL ARISING FROM THIS THESIS
Patent
Method for identifying endometriosis.
Key contributors: Nisenblat V, Print C, Robertson SA, Ohlsson Teague EMC, Hull ML.
Provisional specification supported by Adelaide Research and Innovation (ARI). Patent filed
20.10.2012
Funding for further work
This thesis served a basis for successful grant application for further work to develop a
validated prototype blood test for diagnosis of endometriosis.
Commercial Development Initiative (CDI) fund of $97,000 + GST was awarded in 2012 by
BioInnovation SA (BioSA) to Nisenblat V, Print C, Robertson SA, Hull ML.

XII Victoria Nisenblat
ABSTRACTS ARISING FROM THIS THESIS
Menstrual cycle variations in plasma microRNA expression profiles
Ohlsson Teague EMC, Nisenblat V, Robertson SA, Hull ML
Poster presentation. Presented at SRB conference on 23‐26.08.2009, Adelaide, Australia.
A unique plasma microRNA expression profile is identified in women with endometriosis
Nisenblat V, Print CG, Evans S, Ohlsson Teague EMC, Robertson SA, Hull ML.
Poster presentation. Presented at the 11th World Congress of Endometriosis on 4‐7.09.2011,
Montpelier, France.
Plasma miRNAs as non‐invasive biomarkers for endometriosis
Nisenblat V, Robertson SA, Evans SF, Hull ML.
Poster presentation. Presented at the ASRM annual meeting on 22‐26.10.2012, San Diego,
USA.
Circulating microRNAs as potential biomarkers for endometriosis.
Nisenblat V, Wang Z, Robertson SA, Evans SF, Hull ML.
Oral presentation. Presented at Fertility Society of Australia (FSA) conference 28‐31.10.12,
Auckland, NZ.

Victoria Nisenblat XIII
LIST OF FIGURES
Figure 1.1 Concordance between the published miRNA profiling studies in endometriosis... 22
Figure 1.2 Molecular events associated with the establishment of endometriotic lesions and
the list of the associated miRNAs ............................................................................................. 23
Figure 1.3 Biogenesis, mechanism of action and extracellular secretion of miRNAs .............. 25
Figure 2.1 The three most commonly used methods for qRT‐PCR quantification of miRNAs . 43
Figure 2.2 The structure of LNA monomer and RNA monomer. .............................................. 43
Figure 2.3 Principles of miRNA microarrays ............................................................................. 45
Figure 2.4 MiRNA profiling with next generation sequencing (RNA‐seq) ................................ 46
Figure 3.1 Optimisation of the RNA extraction – results of RT‐PCR performed on the RNA
sample extracted from different plasma – Trisol LS ratios ....................................................... 67
Figure 3.2 Optimisation of the RNA extraction – results of RT‐PCR performed on the RNA
samples extracted from diluted and from non‐diluted plasma samples. ................................ 67
Figure 3.3 Correlation between the input amount of spike‐in synthetic miRNAs and PCR
results. ....................................................................................................................................... 68
Figure 3.4 Relative measures of the 3 spiked‐in synthetic templates across various
samples. .................................................................................................................................... 69
Figure 3.5 Raw and median‐normalised Cq values of endogenous miRNA recovered from
plasma ....................................................................................................................................... 69
Figure 3.6 Assessment of the intra‐operator variability of plasma RNA extraction ................ 71
Figure 3.7 Kinetics of RT reaction ............................................................................................. 73
Figure 3.8 Kinetics of PCR reaction ........................................................................................... 73
Figure 3.9 Flow chart for STARD (Standards for reporting diagnostic accuracy) checklist. ..... 91
Figure 4.1 Variability measures of the data, comparison between normalisation
approaches .............................................................................................................................. 100

XIV Victoria Nisenblat
Figure 4.2 Venn diagram representing a comparison between lists of differentially expressed
miRNAs in endometriosis, according to the phase of menstrual cycle .................................. 104
Figure 4.3 Heat map analysis representing the top ranked plasma miRNAs dysregulated in
endometriosis ......................................................................................................................... 106
Figure 4.4 Comparison of the differentially expressed plasma miRNAs in endometriosis with
previously published data on miRNA profile in endometrial tissue (eutopic and ectopic
endometrium) ......................................................................................................................... 107
Figure 4.5 Validation of the TLDA data with individual qRT‐PCR assays ................................ 109
Figure 4.6 Ingenuity Pathways Analysis of the 3144 predicted targets of endometriosis‐
associated circulating miRNAs ................................................................................................ 111
Figure 4.7 Plasma miRNA interactions with endometriosis associated mRNAs .................... 112
Figure 5.1 Example of the network enriched with 12 plasma miRNAs dysregulated in
endometriosis, identified in IKB, IPA software. ...................................................................... 123
Figure 6.1 The relationship between endometrial miRNA levels measured by qRT‐PCR and
RIN ........................................................................................................................................... 139
Figure 6.2 Diagnostic plots ‐ exploratory analysis of the microarray data, Quality Control .. 141
Figure 6.3 MiRNAs dysregulated in eutopic endometrium in endometriosis demonstrated
with 2 different analyses, ANOVA and LIMMA....................................................................... 143
Figure 6.4 Heat map analysis ‐ the top ranked endometrial miRNAs dysregulated in
endometriosis ......................................................................................................................... 144
Figure 7.1 Expression levels of the 2 candidate miRNAs stratified by severity of
endometriosis and by presence of endometrioma ................................................................ 173
Figure 7.2 ROC analysis using plasma miR‐155 ...................................................................... 177
Figure 7.3 ROC analysis using plasma miR‐574‐3p. ................................................................ 177
Figure 7‐4 ROC analysis for the combination of plasma miR‐155 + miR‐574‐3p ................... 178

Victoria Nisenblat XV
Figure 7.5 ROC analysis of regression model using miR‐574‐3p, miR‐133a, miR‐30c to
discriminate endometriosis .................................................................................................... 178
Figure 7.6 ROC analysis of regression model using the combination of clinical parameters
(infertility and number of miscarriages) with miR‐574‐3p, miR‐133a, miR‐155 and miR‐30c to
discriminate endometriosis .................................................................................................... 181

XVI Victoria Nisenblat
LIST OF TABLES
Table 1‐1 Genes aberrantly expressed in endometrium in association with endometriosis ... 11
Table 1‐2 Comparative appraisal of current diagnostic approaches to endometriosis ........... 15
Table 1‐3 Serum and endometrial markers investigated for diagnosis of endometriosis ....... 17
Table 1‐4 Global miRNA profiling studies in endometriosis ..................................................... 21
Table 1‐5 Functional studies of the selected miRNAs in endometriosis .................................. 22
Table 2‐1 Large‐scale miRNA profiling, comparison between the platforms .......................... 41
Table 3‐1 Measures of inter and intra‐experimental variability of miRNA extraction by the
modified Trisol LS method used in our experiments ................................................................ 71
Table 3‐2 Measures to identify the more suitable normalisation approach; assessment a
degree of variability of the raw and normalised data .............................................................. 80
Table 3‐3 The QUADAS (Quality assessment of the diagnostic accuracy studies) tool............ 92
Table 4‐1 Characteristics of the study population ................................................................... 98
Table 4‐2 List of the top ranked miRNAs identified across the menstrual cycle in disease‐free
controls and in women with endometriosis ........................................................................... 101
Table 4‐3 Differentially expressed miRNAs, wide‐scale profiling with TLDA, comparisons by
the phase of menstrual cycle .................................................................................................. 103
Table 6‐1 Laboratory characteristics of the samples.............................................................. 138
Table 6‐2 Characteristics of the study population ................................................................. 140
Table 6‐3 Dysregulated miRNAs in eutopic endometrium in endometriosis (n = 5) vs. overall
disease‐free controls (n = 8) ................................................................................................... 142
Table 6‐4 Dysregulated miRNAs in eutopic endometrium in endometriosis (n = 5) vs.
symptomatic controls (n = 4) .................................................................................................. 145
Table 6‐5 Dysregulated miRNAs in eutopic endometrium in endometriosis (n = 5) vs.
asymptomatic controls (n = 4) ................................................................................................ 146

Victoria Nisenblat XVII
Table 6‐6 Dysregulated miRNAs in eutopic endometrium in asymptomatic (n = 4) vs.
symptomatic controls (n = 4) .................................................................................................. 147
Table 7‐1 Dysregulated miRNAs in plasma in endometriosis, study phase I ......................... 160
Table 7‐2 General characteristics of the study population .................................................... 162
Table 7‐3 Clinical characteristics of the study population ...................................................... 163
Table 7‐4 miRNA expression in plasma in endometriosis (n = 10) and in disease‐free women
(n = 10), study phase II ............................................................................................................ 167
Table 7‐5 miRNA expression in plasma set by severity of endometriosis, study phase II ..... 168
Table 7‐6 Summary of the candidate miRNAs selected in the study phase II for further
validation ................................................................................................................................ 169
Table 7‐7 Expression of the 8 candidate miRNAs in women with endometriosis (n = 49) and in
disease‐free controls (n = 19), study phase III ........................................................................ 170
Table 7‐8 Expression of the 8 candidate miRNAs set by severity of endometriosis, study
phase III ................................................................................................................................... 172
Table 7‐9 Univariate logistic regression model for association of clinical parameters with
endometriosis ......................................................................................................................... 179
Table 7‐10 Comparison of predictive models for endometriosis identified with multivariate
logistic regression analyses ..................................................................................................... 180

XVIII Victoria Nisenblat
“…I'm just a normal woman except that I have a horrifying disease called endometriosis. Every
month my cycles seem to get worse, making work difficult. I don't enjoy calling in sick and
being perceived as being unreliable. I suffer from migraines daily, along with fatigue and
pelvis/ back pains … and I never feel well. I feel like its one thing after another and I'm tired of
seeing so many doctors. I'm taking 8 pills a night and I'm only 19. When does it end!!! This has
to be one of the most frustrating conditions in the world. Peoples reaction seems to be suck it
up, it won't kill you be thankful for that. But what kind of life is this?” Sarah
“… It took me 3 years for a doctor to finally listen to me. I begged doctors to listen to my
symptoms....they all assumed I just wanted the pain‐relief pills. I hate depending on anything.
I can't do the hormones anymore. I want my life back...” Hannah
“My family doesn't quite understand and I've lost almost all of my friends due to the fact that
I can't stay out for longer than a couple of hours without feeling drained and ill. My boyfriend
of 3 years thinks that I use it as an excuse to not be more active and it’s starting to tear us
apart. I don't know what to do and I feel completely alone and hopeless at this point. I've lost
all hope in the chance that I’ll become better ...” Fiona
“… The pain has made me jealous of so many things. Jealous of people who don’t have pain,
jealous of people who have been able to easily start families, jealous of people who have never
known what it feels like to have to make the choices I do. Like should I go out tonight or stay
home? Should I take these pain killers and feel better but damage my insides even
more? Should I eat this now and feel like crap for days after? Sometimes I think jealousy is
the worst side effect of this disorder”. Tracey
(Quotations taken from women diagnosed with endometriosis, 2010‐2012)

Victoria Nisenblat XIX
ABBREVIATIONS
3’‐UTR 3’‐untranslated regions AE amplification efficiency Ago argonaute proteins AID activation‐induced cytidine deaminase AML acute myeloid leukaemia ANOVA analysis of variance Anti ‐2HSG 2 Heremans‐Schmidt glycoprotein ANXA 1 annexin 1 AUC area under the ROC curve Bax BCL2‐associated X protein BCL‐2 B‐cell lymphoma protein2 B‐H Benjamini‐Hochberg method Bic B cell integration cluster gene C. Elegans Caenorhabditis elegans Ca‐125 cancer antigen 125 CASP caspase, apoptosis related cysteine peptidase CCND1 cyclin D1 CDC42 targets cell division cycle 42 protein CDKN cyclin‐dependent kinase inhibitor cDNA complementary DNA cEBP CCAAT enhancer binding protein CK1a Cysteine kinase 1 alpha CLL chronic lymphocytic leukaemia cMaf musculoaponeurotic fibrosarcoma oncogene homolog COL collagen‐matrix proteins COX cyclooxygenase Cq quantification cycle CREBBP CREB binding protein Ct cycles to threshold CTNNB1 β‐catenin CV coefficient of variance CXCL chemokine (C‐X‐C motif) ligand CYP19A1 cytochrome P450, family 19, subfamily A, polypeptide CYR61 cysteine‐rich, heparin‐binding protein DNA deoxyribonucleic acid DNMT DNA‐(cytosine‐5‐methyltransferase DUSP5 dual specificity phosphatase 5 E2 oestradiol E2F8 E2F transcription factor 8 EGF epidermal growth factor EGFR epidermal growth factor receptor ER oestrogen receptor ERBB v‐erb‐erythroblastic leukaemia viral oncogene homolog ERK extracellular signal‐regulated kinase ESCs endometrial stromal cells FADD Fas associated death domain protein FC fold change FDR false discovery rate FGF fibroblast growth factor FOXO3 fork head box O3 gene

XX Victoria Nisenblat
FSH follicle‐stimulating hormone GBM glioblastoma multiforme GBS glial cells missing binding site GEO gene expression omnibus GM‐CSF granulocyte macrophage colony‐stimulating factor GNRH gonadotropin‐releasing hormone HCC hepatocellular carcinoma HDL high‐density lipoprotein HESF human endometrial stromal fibroblasts HGF hepatocyte growth factor HIF‐1α hypoxia inducible transcription factor ‐1 alpha HLA human leukocyte antigen ICAM intercellular adhesion molecule IFN interferon IGF insulin‐like growth factor IgG immunoglobulin G IKB ingenuity knowledge base IKKB inhibitor of kappa light polypeptide gene enhancer in B‐cells, kinase beta IKKέ IkB kinase epsilon IL interleukin ILGF insulin‐like growth factor INF Interferon IPA ingenuity systems pathway analysis IRS‐1 insulin receptor substrate‐1 JNK c‐Jun N‐terminal kinase KRAS Kirsten ras oncogene homolog LDL low density lipoprotein LH luteinizing hormone LIF leukaemia inhibitory factor LIMMA linear models for microarray analysis LNA locked nucleic acid LOWESS locally weighted regression and smoothing scatterplots LPS Lipopolysaccharide MAPK mitogen‐activated protein kinase MAQC microarray quality control MCAP monocyte chemoattractant protein MCL1 myeloid leukaemia cell differentiation protein MESDC1 mesoderm development candidate 1 MET‐ proto‐oncogene MNNG HOS Transforming gene MGMT methyl guanine methyl transferase MIF migration inhibitory factor MIP macrophage inflammatory protein MIP macrophage inflammatory protein MIQE minimum information for publication of qRT‐PCR experiments miRNA micro RNA MMP matrix metalloproteinase MRI magnetic resonance imaging mRNA messenger ribonucleic acid MSC mesenchymal stem cells MSH melanocyte‐stimulating hormone MSP miRNAs‐specific reverse transcription primer MTMMP membrane type matrix metalloproteinase MVB multivesicular bodies

Victoria Nisenblat XXI
NFkB nuclear factor kappaB ng nanograms NK cells natural killer cells NP1 nucleoplasmin 1 NPM1 nucleophosmin NRT no reverse transcriptase nSMase2 sphingomyelinase 2 NTC no template controls OD optical density P4 Progesterone PAE percentile amplification efficiency PAGE polyacrylamide gel electrophoresis PCA principal components analysis PCOS polycystic ovary syndrome PCR polymerase chain reaction PDGF platelet‐derived growth factor PG prostaglandin pg picograms PGP 9.5 protein gene product 9.5 PP14 serum placental protein/ glycodelin A PPARα peroxisome proliferator‐activated receptor, alpha PR progesterone receptor pre‐miRNA precursor miRNA pri‐miRNA primary miRNA PRL‐3 phosphatase regenerating liver‐3 gene PTEN phosphatase and tensin homolog qRT‐PCR quantitative reverse transcriptase PCR
QUADAS quality assessment of diagnostic accuracy studies included in systematic reviews
rs Spearman correlation coefficient rASRM revised American Society of Reproductive Medicine classification REST RE1‐silencing transcription factor RHOA Ras homolog gene family, member A RIN RNA integrity number RIPK1 receptor interacting serine–threonine kinase1 RISC RNA‐induced silencing complex RNA ribonucleic acid ROC receiver‐operating characteristics RQI RNA quality index RXRα retinoid X receptor, alpha SD standard deviation sEcadherin soluble E‐cadherin SEM standard error of mean sEselectin soluble E‐selectin SF steroidogenetic factor SHIP‐1 Src homology 2‐containing inositol phosphatase‐1 sICAM soluble intercellular adhesion molecules SMAD Sma‐ and Mad‐related protein SMRT single‐molecule real‐time sequencing SMS single‐molecule sequencing SNR signal‐to‐noise ratio SOCS suppression of suppressor of cytokine signalling Sox17 sex determining region Y‐related HMG box‐17

XXII Victoria Nisenblat
SQSTM1 Sequestome1 gene StAR steroidogenic acute regulatory protein STARD standards for reporting of diagnostic accuracy STAT signal transducer and activator of transcription sVCAM soluble vascular cell adhesion molecule TCF4 transcription factor 4 TCL1 T cell leukaemia/lymphoma 1 TDP‐43 TAR‐DNA‐binding protein‐43 TGF transforming growth factor Th T helper cells TIMP tissue inhibitors of MMP TLDA TaqMan Low Density miRNA array TLR Toll‐like receptor TNF tumour necrosis factor TP‐53 tumour protein p‐53 TP‐53INP1 TP‐53‐induced nuclear protein 1 TR4 [NR2C2] nuclear receptor subfamily 2 group C member 2 TSP‐1 thrombospondin 1 angiogenic protein UPS ubiquitin proteasome system US ultrasound VEGF vascular endothelial growth factor VENTX VENT homeobox VIP vasoactive intestinal peptide VSN variance stabilizing normalization XIAP X‐linked inhibitor of apoptosis protein ZFP36 zinc finger protein 36

Victoria Nisenblat XXIII

XXIV Victoria Nisenblat

CHAPTER 1
Victoria Nisenblat 1
Introduction

CHAPTER 1
2 Victoria Nisenblat
1.1 Structureofthethesis
This thesis investigates the role of circulating plasma miRNAs in women with endometriosis
with the intent to establish microRNA (miRNA)‐based non‐invasive diagnostic test for the
disease. The included studies provide insight into circulating miRNAs within the field of
endometriosis research and highlight further, more specific areas of investigation by bringing
the experimental findings into a clinical context. A brief outline of the studies included in this
thesis is presented below.
The background of the study is presented in Chapter 1 and is subdivided into 2 topics. The first
topic summarises the available evidence on clinical, epidemiological, social and experimental
issues associated with endometriosis. The data presented emphasises the complexity
associated with this enigmatic disease and underscores the need in novel approaches to
investigate the associated pathogenetic mechanisms and to establish a non‐invasive
diagnostic test. The second topic focuses on miRNAs, a class of recently discovered regulators
of vital cellular functions via complex fine‐tuning of gene expression networks. The unique
qualities of miRNAs and the fast moving field of molecular diagnostics make these small non‐
coding RNAs an attractive tool in physiological and diagnostic research. Based on the literature
overview and incorporating aspects of clinical relevance, a set of working hypotheses of the
involvement of circulating miRNAs in endometriosis was generated.
In order to test the above hypotheses we first overviewed the methodological aspects of
miRNA quantification and analysis with emphasis on circulating miRNAs. The detailed
discussion on the experimental and analytical methods of miRNA research as well as the gaps
and controversies in the existent knowledge in the field is presented in Chapter 2.
Chapter 3 outlines how the experimental methodology was established. The main focus was
the initiation of the tissue bank and prospective collection of samples as a source of
experimental material. In addition to this, the development of the process for miRNA
extraction from plasma samples is described. Finally, revision of the methods for proper
design and conduct of the diagnostic accuracy study are documented. This chapter also
includes the description of the laboratory techniques and statistical analyses implemented in
the project.
Chapter 4 identifies an endometriosis‐specific plasma miRNA profile and its dependence on
physiological menstrual cycle stage. Further, computational analyses were implemented to

CHAPTER 1
Victoria Nisenblat 3
assess the molecular events associated with the set of identified endometriosis‐specific
miRNAs and their predicted targets.
Chapter 5 examines existing knowledge on the role of identified miRNAs in human disease.
This includes the data obtained from functional, comparative and computational studies in
various diseases and tissues. The rationale for conducting this review was to assess the
functional relevance of these miRNAs in endometriosis. Considering that the identified
miRNAs have not been previously documented in association with endometriosis, an
assumption was made that specific miRNAs might exert a comparable function in different
diseases with similar underlying pathologies. Therefore, pathological processes similar to
those known to occur in endometriosis were of the most interest.
Chapter 6 presents a study in which the miRNA profile was examined in secretory eutopic
endometrium in women with and without endometriosis and its concordance with the miRNA
signature identified in plasma is analysed. The study included 2 subgroups of disease‐free
controls: women with symptoms suggestive of endometriosis (pain ± infertility) and women
who were symptom‐free. The rationale for inclusion of the 2 control subgroups was based on
the assumption that pelvic pain may alter the endometrial milieu and consequently the miRNA
profile irrespective of endometriosis. Thus, the choice of control subgroups in the studies of
endometriosis may have an influence on the results obtained.
Chapter 7 includes a prospective cohort diagnostic accuracy study that implements a stepwise
approach for discovery, selection and validation of circulating miRNA biomarkers for diagnosis
of endometriosis. Putative plasma miRNA biomarkers were identified and their diagnostic
accuracy, alone or in combination with clinical parameters, was assessed.
Finally, the findings of the preceding chapters are summarised in Chapter 8, which also
outlines areas for future research. This thesis served as a basis for provisional patent
application for a biomarker panel for endometriosis. Since every chapter was written to be
read on its own, some repetition and overlap across chapters is inevitable.

CHAPTER 1
4 Victoria Nisenblat
1.2 Backgroundtothestudy
1.2.1 Theenigmaknownasendometriosis
1.2.1.1 Definitionofendometriosis
Endometriosis is identified by the presence of endometrial‐like tissue in ectopic sites outside
the physiologically normal location of the uterine cavity, typically affecting the pelvic organs
and peritoneum (1). The term endometriosis is derived from the ancient Greek: end means
inside, metra means womb, osis means disease, and was introduced to indicate the presence
of ectopic tissue, which possesses the comparable histologic structure and function to the
uterine mucosa.
The clinical forms of endometriosis depend on the location and characteristics of ectopic
endometrial implants, occurring singly or in combination. Peritoneal endometriosis consists
of implants on the surface of the pelvic peritoneum and adjacent organs; ovarian
endometriosis is defined by the presence of ovarian cysts lined by endometrioid tissue
(endometrioma); and recto‐vaginal endometriosis is defined by the presence of a complex
mass of endometriotic, adipose and fibro‐muscular tissue in the recto‐vaginal septum (1).
More rare forms of endometriosis include lesions at sites distant from the pelvic cavity, such
as in the umbilicus, spleen, liver, pleura, lung, pericardium or brain. Whether different forms
of endometriosis are caused by different mechanisms or represent the variants of the same
pathologic process remains debatable (2‐3). However, endometriotic lesions share common
histological features that include presence of endometrial stromal or epithelial cells, chronic
bleeding and signs of inflammation.
Since the first description by Carl Von Rokitansky in 1860 (4), significant knowledge has been
gained on the epidemiology, genetics and pathological mechanisms of endometriosis.
However, the aetiology and pathogenesis of endometriosis remain poorly understood and
little progress has been made in relation to its diagnosis or cure.
1.2.1.2 Prevalenceestimatesofendometriosis
Endometriosis affects women of reproductive age of all ethnic and social groups. The true
prevalence of the disease is hard to establish. The prevalence estimates vary significantly
depending on diagnostic criteria and populations studied and range from 2‐22% in the general
female population and in up to 82% in women suffering from either abdominal pain or
infertility (5). Figures that are commonly cited in literature by the experts in the field refer to

CHAPTER 1
Victoria Nisenblat 5
prevalence of 6‐10% in the general population, and 35‐50% in women with pain, infertility or
both (1, 6‐7).
1.2.1.3 Clinicalpresentationsofendometriosis
Endometriosis is a disease with a broad differential diagnosis and a wide spectrum of clinical
symptoms from completely asymptomatic to severely debilitating presentations.
Chronic pelvic pain and infertility are the most prominent features of endometriosis, reported
in 98% and 69% of affected women, respectively (8). Endometriosis accounts for more than
one third of the diagnoses made in women with chronic pelvic pain with significant variability
of reported prevalence in this group ranging from 2 to 74% (9). More than two thirds of
adolescent girls (69.6%) with chronic pelvic pain and failure to respond to medical treatment
were found to have endometriosis at laparoscopy (10). Severe forms of disease result in
adhesions and distortion of local anatomy that contribute to clinical presentation. Overall,
endometriosis is widely acknowledged as a leading cause of disability in young women (7).
The symptoms usually resolve with menopause.
Endometriosis is a leading reason for gynaecologic hospitalisation (11). A population‐based,
retrospective cross‐sectional and longitudinal analysis of 53,385 hospital admissions
demonstrated that 27% of women hospitalized for a surgical treatment for endometriosis will
be readmitted for additional surgery within 4 years, and one in 10 will have a hysterectomy
(12). Another study reported a reoperation rate of 51% within 10 years in women with
endometriosis (13). Without treatment, endometriotic lesions tend to progress in severity in
about half of the patients (14). A recurrence rate of endometriosis after either medical or
surgical treatment is high, estimated as 21.5% at 2 years and 40‐ 50% at 5 years (15). Taken
together, the above observations indicate that although not life threatening, endometriosis is
a progressive disease that severely compromises patient health and leads to a repeated
necessity for surgical intervention.
1.2.1.4 Endometriosis–systemicdisease
There is growing evidence that endometriosis induces systemic effects beyond its common
gynaecological presentation. Indeed, women with endometriosis present with a range of
health problems. This involves increased risk of certain types of cancer (16‐19), auto‐immune,
endocrine and atopic disorders (20‐21), susceptibility to infection (22) and cardiovascular
disease (23‐24). Consistent with epidemiological observations, endometriosis is associated

CHAPTER 1
6 Victoria Nisenblat
with characteristic abnormalities in function of macrophages, B cells, T cells and natural killer
(NK) cells along with the presence of auto‐antibodies, inflammatory mediators and other
active substances (i.e. growth factors, oxidative stress parameters and vasoactive substances)
in the systemic circulation, peritoneal fluid and endometrial tissue, reviewed in (1, 6, 25‐30).
1.2.1.5 Predisposingriskfactorsforendometriosis
Risk factors for endometriosis, include vaginal outflow obstruction, longer exposure to
menstruation (early menarche, late menopause, short cycles and heavy periods) (31‐32). In
addition, in‐utero exposure to potent oestrogens (diethylstilbestrol), exposure to
environmental toxins (chemotoxic organo‐chlorines such as dioxin and polychlorinated
biphenyl), and alcohol and caffeine intake have been identified as additional risk factors
(31‐35).
1.2.1.6 Geneticsofendometriosis
Animal and human studies have revealed a genetic predisposition to endometriosis with an
incidence of up to 6‐7 times higher among first‐degree relatives of affected subsets than in
the general population (36‐39). Familial and epidemiologic studies indicate that endometriosis
follows a polygenic/multi‐factorial inheritance pattern (40). Although multiple genetic
variations have been explored by several research groups, earlier replication studies are
commonly inconsistent. In the meta‐analyses by Guo (2006), no linkage or functional data
were found to support a putative relationship of candidate gene polymorphisms with
endometriosis (41). A recent genome‐wide association meta‐analysis of 4,604 endometriosis
cases and 9,393 controls of Japanese and European ancestry identified seven genetic variants
associated with endometriosis, each of which was replicated in an independent cohort (42).
Thus, the search for genetic variants predisposing women to endometriosis continues to
generate a lot of interest, even though convincing evidence of a specific genetic defect in
endometriosis is still lacking.
1.2.1.7 Socialandeconomicaspectsofendometriosis
Endometriosis can severely affect quality of life. Symptoms have a pervasive effect on lifestyle,
impair psychological and social functioning, and may interfere with education, employment
and sexual relationships (43). According to the US Health Interview Survey, the average annual
number of days off work associated with sick leave for women with endometriosis has been
estimated at 17.8 (44). Women with endometriosis experience a higher rate of depressive

CHAPTER 1
Victoria Nisenblat 7
symptoms, a sense of lack of control and powerlessness, feelings of social isolation and lost
chance for motherhood, or concerns that their daughters might develop endometriosis
(45‐46).
Endometriosis has a significant economic impact being associated with substantial health care
costs and costs of productivity loss, attaining 22 billion dollars annually in the US; comparable
high cost estimates have been reported from Europe (47‐48). The endometriosis‐associated
costs to society are significantly higher when outpatient investigations and fertility treatments
expenses are included. In November 2011, an Australian initiative, endorsed by pain Australia
and the faculty of pain medicine, assessed the burden associated with conditions causing
chronic pain in the pelvic pain report (49). The estimated direct cost per annum of medical
and surgical treatments for endometriosis in Australia is 6 billion dollars for women and 600
million dollars for adolescent girls. This includes the direct cost per annum of medical and
surgical treatments and indirect costs of parents taking leave from work and disability
pensions. Although the exact estimates regarding the costs of endometriosis are lacking, the
literature that endometriosis places a considerable burden on patients and society is
indisputable (50). Given its high prevalence, progressive nature and the impact on general
health and social wellbeing, endometriosis is recognized as one of the top major public health
problems (51).
1.2.1.8 Pathogenesisofendometriosis
1.2.1.8.1 Pathogeneticmodels
Endometriosis remains a disease of uncertain aetiology. Several mechanisms have been
proposed to have a role in the genesis of endometriotic lesions. Sampson’s hypothesis
suggests implantation and development on the peritoneal surface of refluxed endometrial
cells that reach the abdominal cavity after retrograde menstrual flow through the fallopian
tubes (52). Induction of retrograde menstruation in primate models has been successfully
used to induce endometriosis (53). Sampson’s theory is also supported by the facts that
endometriosis almost exclusively affects menstruating species and does not appear before
menarche (54). Women with endometriosis have higher volumes of retrograde menstrual
blood flow and the disease is more common in women with vaginal outlet obstruction and
thus a higher extent of retrograde menstruation (55‐56). Other theories that propose either
local differentiation of the mesothelial peritoneal cells into endometrial tissue (coelomic

CHAPTER 1
8 Victoria Nisenblat
metaplasia hypothesis) or transport of endometrial tissue through blood or lymphatic vessels
from the uterine cavity to distant sites (vascular theory) may explain certain types of
endometriosis, however they are more challenging to prove or refute (57).
Sampson’s theory remains the most widely accepted explanation for the development of
endometriosis. Current modifications of this concept assume underlying endometrial or
immune alterations that are imperative for implantation of endometrial tissue at the ectopic
sites and help to explain why amongst the majority of women experiencing retrograde
menstruation (90%), only certain individuals (10‐15%) develop the disease (1). It is thought
that molecular abnormalities of the endometrium or the substrate tissue promote survival of
the implants; whereas abnormalities of the immune system contribute to diminished
clearance of the foreign tissue from the atypical location (1).
Investigation of the biochemical mechanisms involved in endometriosis clearly indicates that
endometriosis represents an oestrogen‐dependent, inflammatory systemic pathologic
condition, rather than a local disease of the peritoneum. Inflammation, one of the prominent
features of the disease, is associated with overproduction of prostaglandins (PGs), cytokines,
matrix metalloproteinases (MMPs) and chemokines. Chronic inflammation is responsible for
the main clinical features of the disease and mediates pain via stimulation of pelvic nerve
endings and presumably also underpins infertility (6). Peritoneal fluid in women with
endometriosis, which contains activated macrophages and pro‐inflammatory mediators, has
been shown to have a deleterious effect on sperm function, embryo quality and uterine
endometrial receptivity that would thereby result in reduced pregnancy rate (58‐59). Steroid‐
related pathologic processes involved in endometriosis include excessive production of
oestradiol (E2) and development of progesterone (P4) resistance. E2 in turn enhances
proliferation of endometriotic tissue and promotes inflammatory response and production of
PGs that add to pain and infertility (60). Excessive PGs and inflammatory mediators produced
by endometriotic lesions further induce E2 production by positive feedback mechanisms via
nuclear oestrogen receptors (ER) and enzymatic pathways (6). An aberrant immune response,
inflammation and hormonal aberrations are the most prominent features of the disease that
have been observed in 3 major compartments: eutopic intrauterine endometrium, peritoneal
fluid and blood.
The cause‐effect relationship between inflammation and the progression of endometriosis is
not established. The implantation of endometrial tissue at an ectopic site has been shown to

CHAPTER 1
Victoria Nisenblat 9
be a complex interaction between the peritoneum and the ectopic endometrium. Infiltrating
host site cells such as neutrophils, macrophages, vascular endothelial cells and myofibroblasts
participate in cellular events in the ectopic endometrium including tissue breakdown,
inflammation, activation of the healing response and glandular remodelling and repair. This
implies that endometriotic lesions might induce a systemic response that alters the eutopic
endometrium. Alternatively, underlying systemic immune alterations might favour
progression of endometriotic lesions and impact eutopic endometrial function.
1.2.1.8.2 Eutopicendometrium
Eutopic endometrium in women with endometriosis is postulated to have endogenous
characteristics that predispose to the attachment, invasion, and survival of eutopic
endometrium on the peritoneal surface. The eutopic endometrium in women with
endometriosis appears histologically normal; however comparison with unaffected women
revealed molecular distinctions that include aberrant steroidogenesis, P4 resistance, and
over‐production of prostaglandins, inflammatory mediators and growth factors (61‐63).
The inflammatory characteristics include over‐expression of MMP‐7 and MMP‐11, involved in
degradation of cellular matrix components and hepatocyte growth factor (HGF) that
stimulates proliferation of endometrial cells. As well, several interleukins (IL‐1, IL‐6, IL‐8),
epidermal growth factor (EGF), fibroblast growth factor (FGF), insulin‐like growth factor (ILGF),
platelet‐derived growth factor (PDGF), vascular endothelial growth factor (VEGF) are
dysregulated and potentially contribute to angiogenesis and establishment of endometriotic
lesions (1, 6, 28, 64). Increased expression of glutathione peroxidase and catalase in eutopic
endometrium in endometriosis suggests the possibility of free radical involvement in
endometriosis (65).
Overproduction of E2 and P4 resistance is a distinctive feature of endometriosis.
Endometriotic tissue and eutopic endometrium in affected women express a complete set of
steroidogenesis genes, with aberrant expression of aromatase and nuclear ER
[steroidogenetic factor 1 (SF1), ER‐β] that lead to continuous local production of E2 (6).
Eutopic endometrium in endometriosis demonstrates decreased expression of molecular
markers of P4 action (epithelial glycodelin and prolactin) and low P4 receptor levels.
Resistance to P4 action leads to decreased P‐mediated inactivation of E2 (66). Thereby,
increased synthesis and reduced deactivation result in high local concentration of E2 that
would act to further promote growth of the endometriotic lesions and enhance inflammation.

CHAPTER 1
10 Victoria Nisenblat
Additional findings, associated with decreased receptivity in the endometrium from women
with endometriosis, include reduced expression of integrin α and β, two markers of uterine
receptivity; leukaemia inhibitory factor (LIF) and HOX genes, required for decidualisation;
pathologic upregulation of endometrial‐bleeding associated factor in the implantation phase
and aberrant expression of genes involved in cellular mitosis, embryonic attachment, and
embryo toxicity (67).
The impact of the peritoneal lesions on eutopic endometrium is clearly recapitulated in the
animal models of endometriosis (53, 62, 68‐69). Dysregulation of proteins involved in invasion,
angiogenesis, cell growth, and steroid hormone action have been observed in eutopic
endometrium after induction of endometriosis in baboons (68). Furthermore, CYR61 mRNA,
which encodes a pro‐angiogenic factor that mediates diverse roles in development, cell
proliferation, and tumourogenesis, was found to be elevated in the eutopic endometrium of
baboons following peritoneal inoculation with menstrual endometrium, which suggests that
endometriotic lesions induce a shift in gene expression patterns in the eutopic endometrium
(69).
1.2.1.8.3 Peritonealfluid
Compromised immune surveillance is thought to be one of the crucial factors in the
development of endometriosis. There is much evidence that endometriosis is associated with
activation of lymphocytes and peritoneal macrophages that consequently mediate the
inflammatory reaction associated with endometriosis. Activated immune cells perpetuate
elevated production of intraperitoneal growth factors and cytokines in endometriosis. A
concomitant decrease in phagocytosis by macrophages and compromised NK cell activity in
peritoneal fluid of women with endometriosis is thought to allow shed endometrial cells to
escape immune surveillance and become established in the peritoneal cavity (70‐72).
Increased levels of acute inflammatory cytokines found in peritoneal fluid from women with
endometriosis, such as IL‐1β, IL‐6 (73), and tumour necrosis factor‐ α (TNF‐α) (74), may
enhance the adhesion of shed endometrial tissue fragments onto peritoneal surfaces and
participate in growth promotion of established endometriotic lesions (72). Proteolytic MMPs
are presumed to further facilitate implantation on the ectopic sites (72). Gene expression
profiling of the peritoneum from subjects with and without endometriosis demonstrated up‐
regulation of MMP‐3, intercellular adhesion molecule‐1 (ICAM‐1), transforming growth factor‐
β (TGF‐β), and IL‐6 (75). Monocyte chemoattractant protein‐1 (MCP‐1), IL‐8, interferon‐γ (INF‐

CHAPTER 1
Victoria Nisenblat 11
γ) and regulated upon activation normal T cell expressed and secreted (RANTES) that have
been detected in peritoneal fluid in endometriosis (76), induce the recruitment of
granulocytes, NK cells and macrophages into the endometriotic lesion. Positive feedback loops
would ensure further accumulation of these immune cells, cytokines and chemokines in
established lesions.
1.2.1.8.4 Peripheralblood
The peripheral blood reflects immune abnormalities in women with endometriosis that
involve cell‐mediated and humoural immunity with increased incidence of auto‐ and anti‐
endometrial antibodies, along with abnormalities in function and increased counts of B cells
and T cells (77). In addition, an increased concentration of pro‐inflammatory mediators have
been described in blood with many of the same factors elevated as seen in peritoneal fluid,
supports the central role of a chronic systemic inflammation in the pathogenesis of the disease
(27, 78‐79).
1.2.1.8.5 Moleculareventsassociatedwithendometriosis
The molecular events associated with endometriosis have been extensively investigated
through studies in endometriosis lesions and eutopic endometrium. Global gene‐expression
has revealed candidate genes related to tissue invasion, cell survival and growth and aberrant
steroidogenesis (80‐93). The most characterized molecular abnormalities, which involve up‐
regulation of the gene transcripts that mediate the abovementioned responses, are presented
in Table 1‐1 (94).
Table 1‐1 Genes aberrantly expressed in endometrium in association with endometriosis
Up‐regulated transcript Associated function
IL‐1, TNF‐α pro‐inflammatory response
CREBBP, HIF‐1α, VEGF cell proliferation and angiogenesis
IRS‐1 , KRAS cell proliferation and survival
CDKN1A/1B cell cycle repressors (mediate survival of ectopic lesions)
COL1A1, COL3A1, COL5A1 tissue remodellingBCL‐2 apoptosis resistance
COX‐2 proliferation and steroidogenesis
CREBBP ‐ CREB binding protein; HIF‐ hypoxia inducible transcription factor; IRS ‐ insulin receptor substrate; KRAS ‐ Kirsten ras oncogene homolog; CDKN ‐ cyclin‐dependent kinase inhibitor; COL ‐ collagen‐matrix proteins; BCL ‐ B‐cell lymphoma protein; COX – cyclooxygenase.

CHAPTER 1
12 Victoria Nisenblat
The most significant signalling pathways associated with endometriosis include TGF‐B
signalling that promotes tissue remodelling and invasiveness, inhibitor of kappa light
polypeptide gene enhancer in B‐cells, kinase beta (IKBKB)/ nuclear factor kappa B (NFkB)
pathway involved in inflammation, mitogen‐activated protein kinase (MAPK) signalling
involved in proliferation, as well as JUN/FOS signalling involved in cell migration and cancer
metastasis (94).
Interestingly, the eutopic endometrium in women with endometriosis shares molecular
events observed within the lesions, which supports the assumption that endogenous
abnormalities in endometrium might predispose to the attachment, invasion, and survival of
eutopic endometrium on the peritoneal surface. Global gene‐expression profiling of
endometrium from women with endometriosis has revealed candidate genes related to tissue
invasion, cell survival, angiogenesis, impaired endometrial receptivity and decreased
apoptosis as compared with endometrium from disease‐free women (95). Additionally, a
parallel gene expression analysis of endometrial specimens obtained during the early
secretory phase demonstrated a signature of P‐regulated genes, confirming the observation
of an attenuated P4 response (96).
1.2.1.9 Diagnosisofendometriosis
1.2.1.9.1 Diagnosticdelayinendometriosis
Endometriosis remains a significantly under‐diagnosed disorder. Women with endometriosis
usually experience substantial diagnostic delay, frequently associated with a long and
expensive diagnostic search. Studies reported in different health care systems reveal a mean
delay in diagnosis of 4 to 12 years, which is longer in younger women (97‐101). Two thirds of
women with surgically diagnosed endometriosis reported onset of symptoms during
adolescence with significantly longer time to diagnosis than those whose symptoms began as
adults, occurring due to the combination of a longer period before seeking medical attention
and a longer time to receiving a diagnosis (8).
The delayed diagnosis is mainly due to variability in presentation, lack of pathognomonic
features and deferred referral to secondary care. Diagnostic laparoscopy is the standard
investigation of endometriosis and is considered the only diagnostic test that can reliably rule
out the disease. The absence of an accurate non‐invasive diagnostic test and reluctance for
surgery significantly contribute to diagnostic delay.

CHAPTER 1
Victoria Nisenblat 13
1.2.1.9.2 Doesthedelayindiagnosismatter?
Increased time to diagnosis has been correlated with more severe forms of the disease (102).
This may result in more severe clinical presentations and poorer treatment outcomes, which
could have been avoided with earlier diagnosis. Advanced endometriosis is associated with
higher incidence of infertility, a fall in pregnancy rates obtained, and lower success of ART
cycles involving poor ovarian reserve, and low oocyte and embryo quality (58, 103‐106).
Accurate diagnosis allows early referral to secondary care, tailoring of the most appropriate
therapy and multidisciplinary follow up for associated disorders. Early diagnosis potentially
limits the number of investigations, thus minimizing cost and possible associated side effects
of management (107). Moreover, prompt diagnosis diminishes associated psychological and
social disadvantages. It provides relief from fear of existence of other significant pathologies,
gives women a reasonable explanation for their symptoms, legitimizes absence from work and
allows referral to support groups (98, 108).
1.2.1.9.3 The“goldstandard”methodfordiagnosisofendometriosis
The diagnosis of endometriosis is mainly a histological one, achieved after surgical excision of
the suspected lesion, commonly performed by laparoscopy. The classic endometriotic lesions
lie under the peritoneal surface and are typically of blue‐black colour. The endometriotic
lesions can appear in atypical forms and may exhibit red, brown, black, white or yellow colours
(109). Histological confirmation of diagnosis is strongly recommended by most authorities,
especially in the case of atypical lesions (110). During laparoscopy endometriosis is classified
according to the revised American Society of Reproductive Medicine criteria (rASRM) that
include location and size of the lesions (111). This classification allows uniform documentation
of the extent of disease but has little value in clinical implications due to lack of correlation
between laparoscopic staging and the severity of disease (112‐114).
There are several reasons to review the place of laparoscopy in the diagnosis of endometriosis,
including high costs, invasiveness and arguable diagnostic accuracy. Laparoscopy requires
trained personnel, together with full operating theatre and recovery facilities. It carries the
risk of complications that, although rare, can lead to substantial morbidity and even mortality,
including 0.1/1000 risk of death, 2.4% of bowel, bladder or blood vessel injury, in which the
majority of cases will need extensive surgical repair (115‐116). Laparoscopy can lead to
anaesthesia‐related complications and result in increased adhesion formation that further
compromise fertility. Only one third of diagnostic laparoscopies in women with suspected

CHAPTER 1
14 Victoria Nisenblat
disease reveal endometriosis, thus two thirds of women undergoing surgery are exposed to
unnecessary risks (117).
It is increasingly apparent that laparoscopy fails to diagnose endometriosis with the accuracy
expected from a “gold standard” test. The quality of diagnosis depends on the skills of the
surgeon to visualize suspected lesions and on the ability of pathologists to recognize the
features of endometriosis within the excised tissue, both of which are subject to considerable
inter‐individual variability (118). The positive predictive value of laparoscopic visualization of
endometriosis is estimated to be about 43‐45% and depends on lesion type and location of
lesion (119‐120). A systematic review that assessed the diagnostic value of laparoscopy in
endometriosis reported the overall sensitivity of 94% (95% CI 80–98%) and specificity of 79%
(95% CI 67–87%) according to the four studies included in the meta‐analysis. However the
authors highlighted the paucity of good quality literature available with need for cautious
interpretation of the results (121). The main reasons for poor visual diagnosis include
confusion with other types of lesions and the presence of microscopic endometriosis in
visually normal peritoneum (122). Positive histology for endometriosis confirms about 75% of
excised lesions and 58% of subtle lesions (123‐124). Up to 59% of histologically documented
endometriosis was not reported by the surgeon at laparoscopy (125). Histological
confirmation increases diagnostic accuracy with an overall positive predictive value of 86.5%
when biopsies are obtained from multiple sites (126). Unfortunately, while remaining the best
diagnostic option available, laparoscopy verified by histology fails to confirm the disease in a
subset of women (127). Advances of laparoscopic techniques with implementation of auto‐
fluorescence, narrowband imaging, and use of the endorectal probes promise an advantage
to conventional laparoscopic modalities in detecting endometriotic lesions (128‐130).
Considerable costs, associated complications, and unsatisfactory accuracy, particularly in the
diagnosis of mild and atypical forms of disease, underpin the need for a reliable non‐invasive
diagnostic test for this debilitating progressive disease. Provided surgery effectively alleviates
symptoms and improves fertility, a significant proportion of patients will require laparoscopy
despite the initial method of diagnosis. In this case, non‐invasive diagnostic tests would allow
a more specific focus on the subgroup of women that will benefit from the intervention.
1.2.1.9.4 Non‐invasiveapproachesfordiagnosisofendometriosis
The need for a non‐invasive test for endometriosis has been acknowledged worldwide (131).
The abundance of recently published literature concerning the role of clinical, imaging and

CHAPTER 1
Victoria Nisenblat 15
laboratory markers or their combinations in the diagnosis of endometriosis shows variation in
accuracy estimates and in the populations studied. Currently, none of the non‐invasive tests
is particularly helpful in making or confirming a diagnosis of endometriosis (132‐133). The
comparative appraisal of the existent diagnostic approaches to endometriosis is summarised
in Table 1‐2.
Table 1‐2 Comparative appraisal of current diagnostic approaches to endometriosis
Test Cost Invasiveness Specificity Sensitivity Safety
Laparoscopy High High High Moderate to High Potential riskQuestionnaires Low Low Low Low SafeUltrasound Moderate Moderate High Low to Moderate* SafeMRI Imaging High Moderate High Low to Moderate* SafeSerum markers Low Low Some High Low to Moderate* SafeEndometrial markers
Moderate Moderate Variable# (potentially high)
Variable# (potentially high)
Safe
*Increased in severe disease or presence of endometrioma; # Dependent on immunohistochemical stain and research group.
1.2.1.9.5 Clinicalparameters
The decision about progressing to an invasive procedure is usually based on a patient history,
physical examination and imaging. Although certain symptoms are more frequently associated
with endometriosis, history alone is a poor discriminator given the broad differential diagnosis
and the heterogeneity of presentations (134). Self‐administered questionnaires based on
symptoms, demographic characteristics and medical history have proven to be efficient in
highly symptomatic women, mainly for better location of endometriotic sites and planning of
surgery (135‐136). Given the high prevalence of asymptomatic endometriosis of 2‐50% in
various reports, questionnaires are of no value as an independent diagnostic tool in the wider
cohort of patients (137). Abnormalities on clinical examination, including nodules and
indurations on retro‐cervical and utero‐sacral ligaments, decreased uterine mobility and
adnexal mass correlate with findings of endometriosis on laparoscopy in 70‐90% (138‐139).
However the differential diagnosis of these clinical findings is broad. Abnormal findings on
clinical examination can raise clinical suspicion and be of value for further investigations but
are not sufficient for an accurate diagnostic test. A normal pelvic examination does not
exclude endometriosis as most women, particularly those with mild or moderate disease,
show no abnormalities on physical examination. Laparoscopically proven disease has been
diagnosed in more than 50% of women with normal pelvic examination prior to surgery (139).

CHAPTER 1
16 Victoria Nisenblat
The utility of traditional clinical evaluation methods in patients with suspected endometriosis
is limited, especially in women with mild or moderate disease.
1.2.1.9.5.1 Imaging modalities
Widely implemented in gynaecological practice, ultrasound (US) correctly diagnoses ovarian
masses but is unreliable in diagnosis of non‐ovarian endometriosis (140‐141). Moore et al.
systematically reviewed 67 papers on the validity of US for the detection of pelvic
endometriosis, out of which seven fulfilled the inclusion criteria and focused on US imaging of
ovarian endometriomas. Sensitivities, specificities, positive likelihood ratio (LR+) and negative
likelihood ratio (LR−) in six studies using grey‐scale ultrasonography ranged between 64‐89%,
89‐100%, 7.6‐29.8 and 0.1‐0.4, respectively (141).
Sensitivities of plain transvaginal ultrasonography for diagnosis of non‐ovarian pelvic
endometriosis have been reported to range from 34% to 64% and specificity from 50% to 88%
(139, 142), in which higher accuracy estimates have been reported for deep infiltrating lesions
(143). Studies of modified US scanning (tenderness‐guided approach, adding of water contrast
in rectum, rectal US) or using bowel preparation suggest good predictive values for diagnosis
of pelvic, rectal and vaginal involvement (144‐148). For example, a study on 72 patients with
different locations of endometriosis demonstrated sensitivity of 74‐91% (95% CI, 79–97%),
specificity of 88‐89% (95% CI, 81–93%) for the diagnosis of endometriosis in vaginal wall and
rectovaginal septum when associated with a tenderness‐guided transvaginal sonography. The
authors reported lower sensitivity (ranging 67‐33%) with a comparable specificity for other
locations of endometriosis (144). Notably, most of these studies enrolled a highly selected
group of symptomatic patients and specially trained personnel. Thus it is difficult to
extrapolate this data to the general population with endometriosis. Magnetic resonance
imaging (MRI) appears to display good diagnostic sensitivity and specificity in all localizations
of endometriosis, particularly in deeply invasive lesions (149‐150), but the accuracy estimates
of MRI diagnosis vary between the studies and largely depend on the size and depth of
invasion of the lesions, reviewed in (151). The diagnostic ability of both US and MRI is highly
dependent on the operators’ skills. Negative results of imaging cannot be used as definitive
evidence to exclude endometriosis and it is still unclear if any of the imaging techniques are a
reliable diagnostic option in women with mild or superficial forms of endometriosis in the
absence of gross anatomical findings.

CHAPTER 1
Victoria Nisenblat 17
1.2.1.9.5.2 Laboratory tests
Recent endometriosis research, including advances in genomic, proteomic and microarray
technologies, has focused on the development of accurate, non‐invasive diagnostic methods.
Reviewing the literature, we found more than 1000 papers exploring laboratory based
diagnostic tests for endometriosis. Multiple biomarkers in peripheral blood, endometrium or
peritoneal fluid have been evaluated as candidate diagnostic tools. Endometrial fluid aspirated
from the uterine cavity has been suggested as a potential sample for non‐invasive diagnostics
(152). Factors associated with abnormal steroidogenesis, inflammation, and altered cellular
and humoural immunity have been correlated with the presence of the disease. Investigated
markers for the diagnosis of endometriosis are presented in Table 1‐3.
Table 1‐3 Serum and endometrial markers investigated for diagnosis of endometriosis
Serum markers
Growth factors TGF‐α, TGF‐β, EGFR, VEGF, SF, HGF, FGF, PDGF, EGF, IGF‐I Hormones LH, P, LeptinProteolytic enzymes MMP‐1, MMP‐2, MMP‐3, MMP‐9, TIMP‐1, TIMP‐2 Glycoproteins Ca‐125, Ca‐19‐9, Follistatin, Osteopontin, PP 14 Soluble adhesion molecules sICAM, sVCAM‐1, sEcadherin, sEselectinImmune cells alterations T helper/T suppressor ratio, NK activity, total complement levels
Autoantibodies anti‐endometrial, anti‐phospholipid, anti‐sialyate‐T, anti‐Thomsen Friedenreich antigen, anti‐transferrin, anti‐LDL, HLA class 1/ class 2, anti‐laminin‐1, anti‐2HSG, anti‐thyroid
Cytokines IL‐1, IL‐6, IL‐8, IL‐12, IL‐13, MCP‐I, MIF, Fas ligand, TNF‐α Endometrial markers Cell adhesion molecules Integrins, Selectins, CadherinsHormones/hormone receptors Aromatase P450, ER, PRProteolytic enzymes MMP‐2, MMP‐3, TIMP‐2, TIMP‐3, MTMMP‐1
Other polypeptides PP 14, Osteopontin, PGP 9.5, ANXA 1, CYR61
ANXA – annexin; anti‐2HSG ‐ 2 Heremans‐Schmidt glycoprotein; Ca‐125 ‐ Cancer antigen 125; CYR61 ‐ cysteine‐rich, angiogenic inducer 61; EGFR ‐ epidermal growth factor receptor; HLA ‐ human leukocyte antigen; IGF – insulin‐like growth factor; LDL ‐ low density lipoprotein; LH –luteinising hormone;
MIF ‐ migration inhibitory factor; MTMMP ‐ membrane type matrix metalloproteinase; TIMP ‐ tissue inhibitors of MMP; PGP 9.5 ‐ protein gene product 9.5; PP 14 ‐ serum placental protein/ glycodelin A; PR – progesterone receptor; sEcadherin ‐ soluble E‐cadherin; sEselectin ‐ soluble E‐selectin; sICAM ‐ soluble intercellular adhesion molecules; sVCAM ‐ soluble vascular cell adhesion molecule.
The literature varies in accuracy estimates and the populations studied. Most of the studied
markers, either single or combined in a panel, appear to have low accuracy and to lack of
sufficient diagnostic power (152‐157). Although many of the reported markers distinguish
women with and without endometriosis in small pilot studies, there are profound differences
between research groups in reported sensitivities and specificities for most of the tests. There

CHAPTER 1
18 Victoria Nisenblat
is little consensus in the published literature and most studies are of low methodological
quality.
Ca‐125, the glycoprotein expressed by coelomic epithelium and the most extensively studied
marker, has a limited value as a screening or a diagnostic test for endometriosis, especially in
mild‐moderate forms of the disease (158). The meta‐analysis that assessed the diagnostic
accuracy of Ca‐125 in endometriosis showed that Ca‐125 has a limited diagnostic
performance. Depending on the chosen cut‐off values, Ca‐125 has been reported to show
specificity of 90% with sensitivity of 28% or specificity of 72% with sensitivity of 50%. Another
promising biomarker for endometriosis is the immunohistochemical identification of small
nerve fibres in the functional layer of the endometrium using an antibody against PGP 9.5
(159). A further study demonstrated that the density of small nerve fibres was about 14 times
higher in endometrium from patients with minimal–mild endometriosis compared to disease‐
free women. The authors demonstrated that the combined analysis of neural markers such as
PGP 9.5, anti‐vasoactive intestinal peptide (VIP), anti‐neurofilament protein and anti‐
substance P could predict the presence of minimal–mild endometriosis with 95% sensitivity,
100% specificity and 97.5% accuracy (160). These findings require validation in large
prospective clinical trials.
Given the association of endometriosis with various molecular events, many research groups
anticipated that messenger RNA (mRNA) and proteomic assessments would reveal diagnostic
markers. However many transcripts thought to be associated with endometriosis were not
identified in the published microarray studies of endometriosis and in silico analysis revealed
a mismatch between the expression levels of transcriptomes and proteins associated with the
disease (161‐163).
1.2.1.10 Summary
Decades of research suggest that endometriosis is a complex disorder, with varying severity,
onset and progression. However, endometriosis remains an enigmatic under‐diagnosed
disease with substantial associated morbidities. No useful specific diagnostic biomarker for
endometriosis has been identified. Understanding the mechanism of disease and establishing
a reliable non‐invasive test remain major priorities in endometriosis research, which is
currently focused on new genomic approaches.

CHAPTER 1
Victoria Nisenblat 19
1.2.2 MiRNAs–smallmoleculeswithahugepotential
1.2.2.1 MiRNAsasregulatorsofgeneexpression
MiRNAs comprise a family of highly conserved 9‐22 nucleotide long non‐protein‐encoding
RNAs that post‐transcriptionally regulate gene expression via suppression of specific target
mRNAs (164‐165). MiRNAs are involved in the regulation of translation and degradation of
target mRNAs through base pairing to complementary or partially complementary sites in the
3’‐untranslated regions (3’‐UTR) of mRNAs. As regulators of post‐transcriptional gene
expression, miRNAs play an essential role in a large number of biological and pathological
processes, including the regulation of development, cell proliferation, apoptosis, and
differentiation.
MiRNAs represent only a small fraction (~0.01%) of the total RNA mass. However, since their
initial discovery in Caenorhabditis elegans (C. Elegans) approximately two decades ago,
miRNAs have been found to regulate approximately 30% of the human genome and are
involved in multiple biologic pathways, such as cell survival, proliferation and metabolism
(166‐169). Currently, 25141 mature miRNA sequences have been identified in 193 species, as
listed on the latest version (v.19) of miRBase sequence database, including 2216 mature
human sequences (170). The post‐transcriptional gene repression by miRNAs involves
complex systems of interactions in which each miRNA can target several mRNAs and each
mRNA can be the target of different miRNAs. Consequently, each miRNA can regulate, on
average, the expression of approximately several hundred target genes (166). Some miRNAs
with common mRNA targets are co‐expressed from a single miRNA gene cluster, generating
an amplified repressive effect on cellular functions. Furthermore, miRNAs and their mRNA
targets can form regulatory loops, through which reciprocal regulation provides additional
control of gene expression (165‐166). It is emerging that miRNAs act via complex networks
that integrate thousands of interacting miRNA‐target mRNA associations and thus fine tune
target protein expression.
1.2.2.2 MiRNAs–biogenesisandfunction
MiRNAs originate from large precursors and their biogenesis is governed by many regulatory
checkpoints. The majority of mammalian miRNA genes are embedded in intronic regions of
protein encoding genes and are transcribed in the nucleus into precursor molecules called
primary miRNA (pri‐miRNA) (171). Pri‐miRNAs fold into hairpin structures containing

CHAPTER 1
20 Victoria Nisenblat
imperfectly base‐paired stems and are processed into 60‐ to 100‐nt hairpins known as
precursor miRNAs (pre‐miRNAs) by the enzyme Drosha in the cell nucleus (172). The pre‐
miRNAs are exported from the nucleus to the cytoplasm by exportin 5 (173), where, in general,
they are cleaved by the endonuclease Dicer to yield imperfect double stranded miRNA (174).
The current belief is that the “guide strand”, known as the miRNA, binds to RNA‐induced
silencing complex (RISC) where it produces its effect on target gene translation. In contrast,
the “complementary strand”, known as miRNA* (miRNA star), is degraded and was initially
thought to have no functional relevance. However recent reports have noted that miRNA* is
readily detectable and can play a significant role in gene regulation (167). The conserved seed
sequence of the miRNA provides target specificity by base‐pairing to target mRNAs, whereas
Argonaute proteins (Ago1‐4) and other RISC ribonucleoproteins execute the various forms of
miRNA‐directed RNA processing (175). Mammalian miRNAs bind by imperfect base‐pairing to
multiple sites in 3’‐UTR and sometimes protein‐encoding open reading frames of target
mRNAs. Partial complementarity generally leads to mRNA decay and/or translational
inhibition, whereas highly complementary target sites (which are mainly confined to plants),
result in endonucleotic mRNA cleavage and degradation (176). Additional factors influencing
miRNA target repression include the number of miRNA target sites within an mRNA sequence,
as the magnitude of miRNA directed translational repression is amplified by target site
multiplicity. The repressed mRNAs accumulate in cytoplasmic structures called P‐bodies
where they are degraded or stored (175). During cellular stress, miRNA repression appears to
be reversible; there is evidence that mRNAs can be released from P‐bodies and become
transactionally active (177). There is also evidence that miRNAs might have a stimulatory
effect on target mRNA translation, but this appears to be less common (178).
1.2.2.3 MiRNAsinhumandisease
As miRNAs influence most of the biological processes, miRNA‐based regulation has a major
role in the aetiology and pathogenesis of a variety of disease states (164). There is a constantly
increasing amount of data connecting aberrant miRNA expression to the development of
various diseases, including malignancies, heart disease, hypertension, diabetes, pregnancy,
immune and reproductive diseases and others (94, 167‐169, 179‐197). MiRNA mutation have
been shown to have a pathogenic role in human genetic diseases (189). MiRNA research has
opened new horizons in our understanding of molecular pathogenetic events of the disease
and has brought the development of the diagnostic markers to a new level.

CHAPTER 1
Victoria Nisenblat 21
1.2.2.4 MiRNAsasbiomarkers
MiRNAs have been detected in most tissues and biological fluids. Unlike other RNAs, miRNAs
are not subject to degradation by RNases and therefore are more stable than mRNAs and can
be reliably extracted from archived frozen and formalin‐fixed paraffin embedded tissues
(198). MiRNA profiling appears to be more accurate than mRNA profiling in disease
classification (188, 199) and therefore are thought to have considerable potential as
biomarkers for targeted screening of many diseases. The discovery of miRNAs in the systemic
circulation in a highly stable cell‐free form highlighted the possibilities for development of
blood miRNA‐based diagnostics (200‐203). While the potential diagnostic usefulness of
circulating miRNAs has been observed in a range of diseases (200‐201, 203‐204), studies on
miRNA in endometriosis are just beginning to emerge.
1.2.2.5 MiRNAsinendometriosis
The studies on miRNAs in endometriosis mainly addressed miRNA profile in endometrial
tissue. Five previously published large‐scale experiments that explored the miRNA profile in
eutopic and/or ectopic endometrial tissue in association with endometriosis used either deep
sequencing (205) or hybridisation microarray platforms (206‐209) and indicated panels of the
differentially expressed miRNAs (Table 1‐4). These studies compared different types of tissue
[endometrioma vs. eutopic endometrium in endometriosis (207), peritoneal lesions vs.
eutopic endometrium in endometriosis (208), endometrioma vs. eutopic endometrium in
controls, eutopic endometrium in endometriosis vs. in controls (206), or multiple comparisons
of peritoneal implants vs. eutopic endometrium in endometriosis and in controls (209)],
showing only partial concordance between the obtained results (Figure 1.1).
Table 1‐4 Global miRNA profiling studies in endometriosis
Study Sample tested Cycle phase Results
Burney RO, 2009 eutopic in endometriosis (n = 4) vs. eutopic controls (n = 3)
Early secretory 6 miRNAs
Ohlsson Teague EM, 2009
eutopic vs. ectopic (n = 8) in endometriosis
Proliferative and Secretory
22 miRNAs
Filigheddu N.J, 2010 eutopic vs. ectopic (n = 13) in endometriosis
Early proliferative 50 miRNAs
Hawkins SM, 2011 eutopic in controls (n = 11) vs. ectopic in endometriosis (n = 10)
Proliferative and Secretory
22 miRNAs
Pan Q, 2007 paired ectopic‐eutopic in patients (n= 4), ectopic in pts (n = 4), eutopic in controls (n = 4)
Early‐mid secretory 50 miRNAs

CHAPTER 1
22 Victoria Nisenblat
Figure 1.1 Concordance between the published miRNA profiling studies in endometriosis. Venn diagram represents
comparison between the miRNA studies and demonstrates the number of overlapping miRNAs.
Recently, several studies addressed the functional relevance of selected miRNAs in
endometriosis via characterization of miRNA‐mRNA relationships and loss of function
manipulations in endometrial and ectopic endometrial cell lineages (Table 1‐5).
Table 1‐5 Functional studies of the selected miRNAs in endometriosis
Study miRNA tested Sample tested Conclusion
Dai L, 2012 miR‐199a Endometrioma vs. eutopic endometrium (pts, n = 12; ctrl, n = 12)
Increase in cell invasion, activation of NFkB‐pathway, elevation of IL‐8
Lin SC, 2012 miR‐20a Ectopic vs. eutopic endometrium (pts, n = 37; ctrl, n = 17)
Up‐regulation of angiogenic genes and FGF‐9, stimulation of proliferation
Petracco R, 2011
miR‐135a/b Eutopic endometrium (pts, n = 32; ctrl, n = 50)
Down‐regulation of HOXA‐10 that regulates endometrial receptivity
Ramon LA, 2011 miR‐125a, miR‐222 miR‐17‐5p
Endometrioma vs. eutopic endometrium (pts, n = 58; ctrl, n = 38)
Lower expression of VEGF‐A; higher expression of the angiogenic inhibitor TSP‐1
Red colour – up‐regulated miRNAs in endometriosis; green colour – down‐regulated miRNAs in endometriosis.
Functional in silico analyses have identified molecular networks regulated by miRNA
transcripts and linked miRNAs with the establishment of endometriotic lesions (Figure 1.2), as
comprehensively presented in (94, 210). However, the evidence supporting the hypotheses
regarding the mode of action of miRNAs in endometriotic disease is largely indirect and is
predominantly based on computational analyses.
Endometriosis lesion vs. eutopic endometrium in patients or in controls
miR‐34c‐5p overlapped
Eutopic endometrium inpatients vs. eutopic endometrium in controls

CHAPTER 1
Victoria Nisenblat 23
Figure 1.2 Molecular events associated with the establishment of endometriotic lesions and the list of the
associated miRNAs. Adopted from Ohlsson Teague EMC et al., 2010 (94).
Two studies exploring circulating miRNAs in endometriosis have been published (211‐212),
when this thesis was in the final stages of drafting. The authors identified largely independent
panels of endometriosis‐associated miRNAs in serum and plasma, focusing on their diagnostic
potential. These studies are further discussed in Chapter 7.
1.2.2.6 CirculatingmiRNAs–originsandputativemechanismofaction
It is presently unclear which molecular mechanisms are responsible for alterations in serum
miRNA levels in certain disease conditions. Earlier observations that circulating miRNAs reflect
passive release from the damaged cells (213) have been recently challenged by the
observation of actively secreted miRNAs from tissues or cells, which raises the prospect that
miRNAs might serve as messengers to influence gene transcription in distant target sites (214‐
215). Growing evidence suggests that circulating miRNAs can reside in microvesicles and
lipoprotein complexes, including exosomes, microparticles, and apoptotic bodies, which offer
protection to circulating miRNAs from endogenous RNase activity (215‐219). Exosomes and

CHAPTER 1
24 Victoria Nisenblat
microparticles are formed through the inward budding of endosomal or plasma membrane,
giving rise to intracellular multivesicular bodies (MVB) that contain miRNAs and are later
released to the circulation via fusion with the cell membrane (216, 218, 220). The formation
and release of exosomes and microparticles is dependent on calcium influx, cytoskeleton
reorganization and sphingomyelinase 2 activity (nSMase2), a rate limiting enzyme in ceramide
biosynthesis, which is involved in control of exosome release from the cells (220). Whereas
the expression of certain miRNAs is higher in microvesicles than in the cells of origin (215),
nearly 30% of the released miRNAs in vitro and in vivo do not reflect the expression profile
found in donor cells (221), suggesting that specific miRNAs are selected to be intracellularly
retained or released by exosomes. Moreover, different stimuli alter the number, composition
and origin of microparticles (222), and modify the release of miRNAs (223), supporting the
assumption that packaging and extracellular transport of miRNAs is a highly regulated process.
Additionally, the extravesicular mechanisms of transport of circulating miRNAs occurs in
association with lipoprotein and protein complexes, including high‐density lipoprotein (HDL)
(214), Ago2, which is part of the miRNA silencing complex (224‐225) and nucleophosmin
(NPM1) (218). Recent studies demonstrated that potentially 90% of the plasma and serum
miRNAs are co fractionated with the protein and lipoprotein complexes (200). The suggested
mechanism of biogenesis and function of circulating miRNAs is presented in Figure 1.3.
Despite the fact that conclusive data on the functional role of endogenous extracellular
miRNAs are still missing, increasing evidence suggests that circulating miRNAs can serve as
messengers to influence gene transcription and modulate cell function at distant target sites.
Exosomal miRNAs have been demonstrated to promote gene silencing similar to cellular
miRNAs (220, 226). Further, microvesicles isolated from the circulation of atherosclerosis
patients, were noted to induce responses in endothelial cells similar to the response observed
in monocytes in atherosclerosis, suggesting their role in mediation of miRNA crosstalk
between the donor and target cells (223). Circulating miRNAs are taken up by the recipient
cells by endocytosis or through receptor‐ligand interactions via binding to receptors present
at the recipient cellular membrane capable of recognizing RNA‐binding proteins. Similarly,
miRNA‐lipoprotein complexes have been demonstrated not just to carry circulating miRNAs,
but also to affect the expression of target genes with the potential to induce cellular
responses.
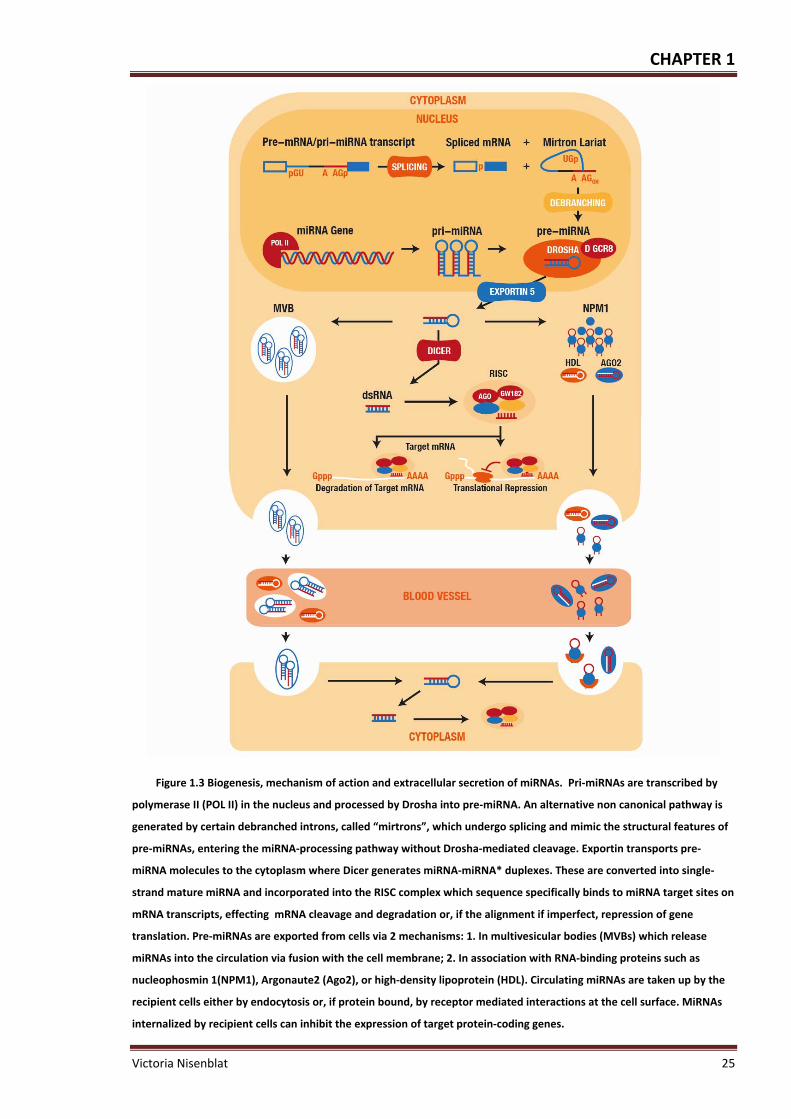
CHAPTER 1
Victoria Nisenblat 25
Figure 1.3 Biogenesis, mechanism of action and extracellular secretion of miRNAs. Pri‐miRNAs are transcribed by
polymerase II (POL II) in the nucleus and processed by Drosha into pre‐miRNA. An alternative non canonical pathway is
generated by certain debranched introns, called “mirtrons”, which undergo splicing and mimic the structural features of
pre‐miRNAs, entering the miRNA‐processing pathway without Drosha‐mediated cleavage. Exportin transports pre‐
miRNA molecules to the cytoplasm where Dicer generates miRNA‐miRNA* duplexes. These are converted into single‐
strand mature miRNA and incorporated into the RISC complex which sequence specifically binds to miRNA target sites on
mRNA transcripts, effecting mRNA cleavage and degradation or, if the alignment if imperfect, repression of gene
translation. Pre‐miRNAs are exported from cells via 2 mechanisms: 1. In multivesicular bodies (MVBs) which release
miRNAs into the circulation via fusion with the cell membrane; 2. In association with RNA‐binding proteins such as
nucleophosmin 1(NPM1), Argonaute2 (Ago2), or high‐density lipoprotein (HDL). Circulating miRNAs are taken up by the
recipient cells either by endocytosis or, if protein bound, by receptor mediated interactions at the cell surface. MiRNAs
internalized by recipient cells can inhibit the expression of target protein‐coding genes.

CHAPTER 1
26 Victoria Nisenblat
For example, miRNAs within HDL were demonstrated to alter the cellular miRNA pool and
resulted in loss of corresponding miRNA targets through activation of a ceramide signalling
pathway (214). Release of miRNAs from the donor cells and their uptake by recipient cells
represents an additional largely undiscovered level of regulation of circulating miRNAs. More
studies are necessary to elucidate how miRNAs are loaded into exosomes and how they can
be internalized by recipient cells. Given that endometriosis is acknowledged as chronic‐
progressive systemic disease and in view of the extensive regulatory capacity of miRNAs, it is
tempting to assume that miRNAs have a regulatory role in this condition via the systemic
circulation.
1.2.2.7 MiRNAsandendometrialfunction
Endometrium is a complex, dynamic, steroid hormone‐responsive tissue that undergoes
highly organized cyclic structural changes in preparation for embryo implantation during the
reproductive years. Large number of miRNAs has been identified in reproductive tract tissues,
including endometrium in both normal and disease states. In vitro and animal studies showed
the role of miRNAs in implantation and decidualisation of endometrium, which defined as
differentiation of stromal cells in preparation for pregnancy. For example in vitro cultures of
primary human endometrial stromal fibroblasts (HESF) identified 49 differentially expressed
miRNA unique for decidualisation (227). The loss of function studies revealed that miR‐222
and miR‐29c affected endogenous gene expression of genes important in biological adhesion
and extracellular matrix formation (227). An over expression of miR‐29c in HESF cells resulted
in a blunted decidualisation response (205). Work in the rat and mouse uterus has shown that
let‐7a and miR‐320 are up‐regulated in implantation sites (228‐229), miR‐101a and miR‐199a
regulate COX2 expression during implantation (230), and miR‐21 plays an important role in
blood vessel remodelling in implantation through signals from the blastocyst (231).
Additionally, a next‐generation sequencing study of delayed implantation in the mouse
indicated that implantation sites may have additional editing of miRNAs (232). Using in vitro
cultures of human primary endometrial stromal or epithelial cells, variations in miRNA
expression were observed between the different cell types (209, 233), suggesting that miRNAs
are involved in regulation of endometrial function and likely to mediate a cross talk between
the uterine epithelium and stroma.

CHAPTER 1
Victoria Nisenblat 27
1.2.2.8 MiRNAsandovariansteroids
MiRNAs are known to target genes involved in steroidogenesis, and their expression is
modulated by ovarian steroids in in‐vitro experiments. MiRNAs have been profiled in the
mouse uterus in response to E2 or ER antagonist treatment (234). They have also been profiled
using human endometrial epithelial cells from late proliferative phase for the maximum E2
effect and mid‐secretory phase for maximum P4 effect of the human menstrual cycle to define
the miRNA that may be E‐ and P‐responsive in the endometrium (235). E2 and P4, alone or in
combination with their antagonists were shown to alter the expression of miR‐20a, miR‐21
and miR‐26a in isolated endometrial cells (209). The same group demonstrated ovarian
steroid dependence of miR‐17‐5p, miR‐23a, miR‐23b and miR‐542‐3p and of their targets,
namely cytochrome P450, family 19, subfamily A, polypeptide (CYP19A1), steroidogenic acute
regulatory protein (StAR), and COX‐2, that play a central role in endometrial proliferation
(233). Additionally, regulatory interactions between the ovarian steroids and miRNAs were
observed in other steroid sensitive cells or steroid‐dependent conditions reviewed in (180,
197, 236‐237). The understanding of the interaction between miRNA and ovarian steroids is
just beginning to emerge, and E‐dependent association with Drosha complex or inhibition of
miRNA maturation at the level of processing of pri‐miRNAs are among the suggested
mechanisms (237‐239).
Whereas the enriched supra‐physiological hormonal milieu present under experimental
conditions can clearly alter miRNA expression, there is no strong evidence that physiological
hormonal levels alter miRNA signatures in vivo. Although miRNAs appear to be influenced by
the menstrual cycle in human endometrium (235, 240‐241), there is no data regarding cycle
stage effect on circulating miRNAs.
1.2.2.9 Summary
MiRNAs are emerging as important modulators of gene expression and regulators of vital cell
processes. A growing body of evidence links miRNAs with a range of pathologic conditions,
suggesting their role in the pathogenesis and diagnosis of disease. Evidence of dysregulated
miRNA expression in endometriosis tissue raises the prospect of circulating miRNAs as
modulators of the systemic effects associated with endometriosis, as well as potential
diagnostic tools for the disease.

CHAPTER 1
28 Victoria Nisenblat
1.3 Theneedforthestudy
Many women with endometriosis suffer a diagnostic delay, which is associated with significant
physical and psychosocial morbidity and poses a substantial burden on health service
worldwide. The diagnosis of endometriosis requires surgery, which is associated with
potentially dangerous side effects, high costs and is one of the reasons for diagnostic delay.
An accurate non‐invasive test for endometriosis would reduce the need for a surgical
diagnosis, would be more accessible to women, and is likely to lead to an earlier diagnosis and
treatment of endometriosis. Although multiple markers have been explored as diagnostic
tests for endometriosis, none of them can reliably diagnose endometriosis and none of these
tests has been implemented routinely in clinical practice. A reliable readily available cost
effective non‐invasive test for endometriosis is yet to be established. The development of such
a test remains one of the major priorities in endometriosis research.
This research aims to advance the understanding of miRNAs in the biological mechanisms
underlying the long term systemic effects of endometriosis. Furthermore, given that miRNAs
can be detected in blood according to the models of other pathologies, the study will
investigate whether miRNA detection in blood can serve as a basis for establishment of a
disease‐specific non‐invasive diagnostic test. Establishing such a test would have substantial
benefit for women with the disease, their treating clinicians, and health service providers.
Better knowledge on menstrual cycle dependent alterations in circulating miRNAs in
reproductive age women will improve understanding of the physiology of miRNA regulations.
Additionally it will have utility for biomarker research, since there is a possible impact of the
menstrual cycle stage on performance of any miRNA based test, with the possibility of
preferable test timing in women across the menstrual cycle.
1.4 Hypothesesandobjectives
Considering the material presented above, we hypothesized:
1. Endometriosis is associated with a unique plasma miRNA profile.
2. Plasma miRNAs are regulated in a menstrual cycle phase dependent manner.
3. Circulating miRNAs have a role in the development of endometriosis and may mediate
systemic effects of the disease.
4. Endometriosis is associated with a unique miRNA profile in eutopic endometrium that
is concordant with the endometriosis‐specific signatures in plasma.

CHAPTER 1
Victoria Nisenblat 29
5. Circulating miRNAs can underpin a non‐invasive diagnostic test.
In order to test these hypotheses, we formulated the following objectives:
1. To profile plasma miRNAs in a group of reproductive age women across the
menstrual cycle to assess whether the levels of circulating miRNAs fluctuate with the
cycle stage.
2. To profile plasma miRNAs in a group of women with and without endometriosis to
determine whether the plasma miRNA expression pattern modulated by
endometriosis.
3. To assess the possible biological functions and pathways linked with target genes
regulated by the circulating miRNAs using computational approach.
4. To profile miRNAs in eutopic endometrium in women with and without
endometriosis and correlate this profile with that observed in plasma.
5. To validate the endometriosis‐specific miRNA profile in a larger‐scale study to
determine diagnostic accuracy and progress towards establishing a miRNA‐based
non‐invasive diagnostic test for endometriosis.

CHAPTER 1
30 Victoria Nisenblat

CHAPTER 2
Victoria Nisenblat 31
ExperimentalstrategiesforcirculatingmiRNAresearch

CHAPTER 2
32 Victoria Nisenblat
2.1 Introduction
The utility of miRNA‐based biomarkers in the clinical setting is strengthened by their
remarkable stability and ability to be detected in a wide range of tissue sources, both in fresh
and in archived material. On the other hand, an accurate quantification of miRNAs might be
challenging due to their unique structure and biogenesis. This includes their short length,
relatively low abundance (~ 0.01% of total RNA), high sequence similarity within miRNA
families as well as the need to distinguish the premature precursors from the mature targets
of interest (242‐244).
Although most tissues are RNA abundant and yield high quality miRNA that is suitable for
profiling studies, the minute amounts of RNA typically recovered from biological fluids (e.g.
plasma and serum) hamper miRNA quantification. Circulating miRNAs are of considerable
interest as biomarkers of disease because of the implicit non‐invasiveness of obtaining clinical
sample via venesection. Rapid advancements in molecular diagnostic technologies have
resulted in introduction of a series of sensitive experimental and analytical tools to study the
expression and biological function of miRNAs. However, a lack of consensus on the best
performing experimental method and continuing inconsistency in the analytical approach is
likely to account for the discrepant results that have been reported in the miRNA
literature (242).
Bearing in mind that meticulous selection of the research methods improves the accuracy and
reliability of the results, we chose to summarise the available knowledge on the advances and
limitations of miRNA research, prior to presenting of our experimental data. This section will
discuss each step in the pipeline leading to successful analysis of circulating miRNAs as well as
the rationale behind the selection of the experimental approaches in the current project.
2.2 QuantificationofcirculatingmiRNAs
2.2.1 Pre‐analyticalvariablesandsamplepreparation
Circulating miRNAs present in serum and plasma are presumed to be remarkably stable and
resistant to degradation (245‐248). However, miRNAs can be degraded under experimental
conditions during sample preparation. Moreover, the reliability of miRNA detection can be
also compromised by degradation of total RNA that affects both the gene expression analyses
(249‐250) and miRNA profiling (251). Therefore, the sample collection procedure, RNA

CHAPTER 2
Victoria Nisenblat 33
stabilization, RNA isolation and further downstream processes, which contribute to RNA
integrity, consequently influence the quantitative miRNA analysis (242‐244, 249, 252‐255).
2.2.1.1 Samplecollection,processingandstorage
Several variables associated with the blood collection may plausibly affect the amount and
quality of miRNA recovered from a given plasma or serum sample (244, 253, 256‐257). Blood
cell lysis and contamination of the sample with the skin plug obtained at the skin puncture can
contribute a significant amount of confounding miRNAs due to a cellular carryover, as cells
have a much higher concentration of miRNA than plasma or serum. In our experiments, blood
was collected by 21‐gauge needles, which are usually employed to draw blood for testing
purposes. All samples were processed by the same operator under the similar centrifugation
conditions and special care was taken to avoid carryover from the cellular pellet. Haemolytic
samples, detected by the colour of the supernatant, were discarded.
Pre‐analytic variables affect miRNA content (252), although reports on the influence of most
of these variables on miRNA quality are still lacking. Such factors include a diurnal variation in
miRNA levels, fasting vs. non‐fasting state at blood collection (e.g. fatty meals can cause
lipaemia that could affect RNA extraction efficiency) and blood cell counts. Therefore, in the
absence of such data, it is prudent to try to match as many variables as possible in the
collection and/or selection of case and control samples for research studies. We did not adjust
for these parameters in our study; however blood collection for the verification phase of this
study (Chapter 7) was performed from fasted individuals.
It is also important to consider the type of the tubes for blood collection and transportation.
For plasma samples, anticoagulants can affect the performance of the downstream profiling.
Heparin cannot be removed during RNA extraction; it binds to calcium and magnesium in the
polymerase chain reaction (PCR) Mastermix and potently inhibits subsequent PCR. Citrate can
be used for circulating miRNA quantification; however, it causes dilution of plasma and may
trigger haemolysis. EDTA is therefore the anticoagulant of choice for collection of plasma
samples for miRNA experiments (244, 252). For the collection of blood for generating serum,
at least two alternative types of tubes are in common use: a simple tube in which the clotted
blood is simply centrifuged with recovery of supernatant (serum), alternatively a serum
separator tube in which a gel is included that allows more discrete separation of the clot from
serum during the centrifugation process. Although both are effective, it is important that the

CHAPTER 2
34 Victoria Nisenblat
type of collection tube used be standardized within a study to avoid confounding the results
(252). For the purpose of our experiments, all samples were collected in EDTA collection tubes.
Additional consideration should include whether the duration of time taken between blood
collection and processing of plasma or serum affects miRNA levels, e.g. via degrading RNases.
Several research groups reported that miRNAs in plasma appear to be stable for extended
periods at room temperature (at least up to 24 hours) (245‐248), however this effect has not
been universally established for all the investigated miRNAs. The majority of published studies
included specimens that were processed to generate plasma or serum within 4 hours of
collection. In the absence of solid data on this variable, it is prudent in designing studies to
standardize conditions as much as possible with respect to the time elapsed between whole
blood collection and processing for plasma or serum. All blood samples collected for the
current study were processed within 8 hours of blood collection and were kept at +4⁰C in the
hospital or laboratory fridge; overall the samples were kept at room temperature for no more
than 1 hour.
Storage of plasma or serum at ‐80⁰C appears to be acceptable as freeze–thawing does not
appear to influence the quantitative assessment of miRNA extracted, at least for the
previously examined abundant miRNAs (247‐248, 253, 258). A recent study demonstrated that
storing of serum samples for up to 10 years at ‐80⁰C did not impact on the integrity of miRNAs;
moreover, miRNA levels were stable when plasma samples were stored at ‐20⁰C for 2‐4 years
(259). Although the majority of the published studies include the analysis of specimens that
are several years old, the effect of duration of storage on miRNA levels has not yet been
carefully evaluated, and it seems best to match case and control specimens with respect to
duration of storage as much as possible and unnecessary freeze‐thawing should be avoided
(244, 252). For optimal results from archived samples, care should be taken to select only
samples that have been collected and processed according to the same sampling protocol. All
plasma samples included in our study were frozen immediately after separation, stored at ‐
80⁰C, have not been exposed to repeat freeze‐thawing and were processed within 2 years of
storage.
2.2.1.2 Plasmavs.Serum
Plasma is the cell‐free supernatant obtained after centrifuging of blood that has been
collected in the presence of an anticoagulant. Serum is the cell‐free supernatant obtained

CHAPTER 2
Victoria Nisenblat 35
after centrifuging blood that has been allowed to spontaneously clot, after being collected in
the absence of anticoagulant. Both plasma and serum are acceptable types of specimen for
circulating miRNA analysis. MiRNA measurements between plasma and serum were found to
be highly correlated (245, 248, 260), whereas some observed that the quantification cycle (Cq)
values from plasma tend to be slightly lower than for serum indicating a higher miRNA content
(258, 261‐262). In general, plasma is a better controlled and more time efficient method of
preparation (immediate centrifugation vs. spontaneous coagulation), compared to serum.
Also 10%‐15% more plasma is obtained from the same amount of blood and there are minimal
coagulation‐induced changes, such as cell lysis and activation of the cellular components
induced by fibrinogen. The main disadvantage of plasma over serum is the use of
anticoagulants that may interfere with the downstream analytical methods. Given that a
global comparison of miRNA expression between plasma and serum has not yet been
performed, mixing specimen types within a study is not recommended. We used plasma
samples in our experiments after recognising the advantages cited above.
2.2.2 MiRNAextraction
2.2.2.1 ChallengesinextractionofcirculatingmiRNAs
The classical mRNA expression studies demonstrated that different RNA isolation methods
greatly influence the quality of the experiments, which also holds true for miRNA expression
profiling (255, 263). Reproducible isolation of cell‐free circulating miRNAs presents a challenge
for a number of reasons. First, plasma and serum contain abundant proteins and lipids that
can potentially interfere with sample preparation and the detection assay. Secondly, RNA
purified from plasma can also contain chemical contaminants, i.e. reagents used for
extraction, which interfere with the accuracy of the profiling platform, e.g. inhibit PCR
efficiency. Further, the extracellular circulating miRNAs exist in 2 distinct physical states,
within small membrane vesicles (215‐216, 219‐220) or in a free form, complexed with the
proteins (218, 224‐225). Even though both of these miRNA states exhibit remarkable stability
and resistance to degradation from endogenous RNase activity (213, 264), different types of
extraction can differently affect these compounds and result in different miRNA profiles. In
addition, the yield of RNA from plasma or serum samples usually falls below the limit of
accurate assessment by the routine methods, which calls for an alternative way to assess the
efficiency of miRNA recovery.

CHAPTER 2
36 Victoria Nisenblat
2.2.2.2 MethodsofmiRNAextraction
The principles for isolating miRNA are similar to those used in isolation of total RNA except
that are often modified to retain (and sometimes to enrich) the small RNA fraction (265).
MiRNA isolation is carried out in three main steps: 1. lysis and denaturation, 2. organic solvent
extraction, 3. RNA precipitation.
The first protocols were based on the use of Trisol reagent, a monophasic solution of phenol
and guanidinium isothiocyanate, that simultaneously solubilises biological material, facilitates
lysis of tissues, denatures proteins, removes most of the cellular deoxyribonucleic acid (DNA)
and inhibits RNases. For serum and plasma samples, Trisol is substituted by a concentrated
product, Trisol LS reagent, which is designed for the processing of liquid samples. After
solubilisation, the addition of chloroform results in phase separation with the RNA remaining
in the aqueous phase. RNA extraction is completed by isopropanol precipitation, followed by
an ethanol wash and re‐suspension of the RNA pellet.
Widely available commercial extraction kits typically combine a phenol/chloroform organic
solvent step with a purification step that involves binding and eluting from a silica or glass‐
fibre column, e.g. MirVana PARIS (Ambion) or the miRNeasy kit (RNeasy Mini Kit; Qiagen, Inc.)
reviewed in (242, 244, 255). Denaturing polyacrylamide gel electrophoresis (PAGE) for
recovery and enrichment of small low molecular weight RNA involves substantial loss of RNA
(266) and therefore is not routinely used for challenging samples, like plasma or serum. The
traditional Trisol LS method without column purification has been reported to perform well
with different profiling platforms, comparably to small RNA‐enriched total RNA (253‐254, 263,
267). The direct comparison between Trisol LS and column‐based protocols in plasma
demonstrated that although the Trisol protocol exhibited the highest extraction efficiency, the
signal intensities differed between different methods depending on a type of detection
platform (268). In our hands, the Trisol LS method with modifications to the manufacturers’
protocol showed good performance. The detailed protocol as well as the steps of its
optimisation and evaluation of efficiency will be presented in Chapter 3.
In order to improve miRNA recovery from clinical samples with very small starting amounts of
RNA, a carrier RNA is added during the extraction procedure. The presence of a carrier, such
as glycogen or bacteriophage MS2, enhances the efficiency of the RNA extraction (up to 2 Cq)
and ensures a higher and more consistent RNA yield (248, 269). This was demonstrated in our
experiments (Chapter 3) and our protocol included the addition of glycogen carrier.

CHAPTER 2
Victoria Nisenblat 37
The efficiency of the RNA extraction step can be assessed by addition of non‐human synthetic
miRNAs (e.g. from C. Elegans) that are not expressed in the tested biological samples (248,
252). The synthetic miRNAs are “spiked‐in” in a known quantity in the initial phases of miRNA
isolation after the denaturation of plasma or serum (to avoid degradation by RNases present
in fresh samples). These synthetic templates then go through the entire RNA isolation process
and are ultimately measured by quantitative reverse transcriptase PCR (qRT‐PCR) in the final
RNA elute, providing an internal reference for normalization to assess technical variations
between the samples. This step is important to adjust for sample‐to‐sample variability in both
protein and lipid content of plasma and serum, which could affect the efficiency of RNA
extraction, and introduce potential PCR inhibitors. In our experience, each one of the synthetic
templates performs similarly to the average of all 3 and can serve as independent normaliser
(Chapter 3). We routinely use spiked‐in synthetic miRNA cel‐miR‐54 to assess the efficiency of
miRNA extraction.
Another important variable in RNA extraction is the expertise of the individuals who perform
the experiment and how meticulous they are to prevent RNase contamination of the reagents
and degradation of the RNA sample. Even slight deviations from protocol were reported to
induce relatively large changes in experimental outcome (255). Our experimental results
showed high concordance between the 2 operators with different levels of experience, when
the protocol steps were carefully followed, indicating high reproducibility (Chapter 3).
Several new technologies have been recently introduced to the market. They avoid an organic
separation step, hence minimising the sample contamination with phenol and exposure to
hazardous chemicals. This includes spin column chromatography using proprietary resin or
silica membrane as the separation matrix (e.g. Norgen’s Total RNA Purification Kit, Norgen
Biotek Corporation, Ontario, Canada; NucleoSpin miRNA plasma, Macherey‐Nagel GmbH &
Co. KG, Düren, Germany) or magnetic bead‐based technology (e.g. miRACLE isolation kit,
Jinfiniti Biosciences). The efficiency and appropriateness of these methods still needs to be
established.

CHAPTER 2
38 Victoria Nisenblat
2.2.3 RNAconcentrationandqualitydetermination
2.2.3.1 Challengesinquantityandqualityassessmentofcirculating
miRNAs
Assessment of the quality and quantity of the extracted RNA is important for reproducibility
and accuracy in miRNA‐profiling studies, as miRNA quantification depends on high quality RNA
(270). Classical methods for measuring the concentration of nucleic acids do not allow
discriminating between different fractions of small RNAs. Fortunately, many profiling methods
can be performed using total RNA and specific assessment of the miRNA population is not
always necessary. However, this does not apply to plasma and serum samples, which usually
have total RNA yields that are too low to be accurately quantified. The standard methods for
measurement of the RNA yield and quality include measurement of optical density (OD) with
spectrophotometry, use of automated capillary electrophoresis instruments, or use of
denaturing gel electrophoresis (242, 244, 267).
2.2.3.2 Spectrophotometry
RNA purity and quantity can be measured photometrically by measuring the OD at different
wave lengths: 230 nanometre (nm) (A230, absorption of contaminants & background
absorption), 260 nm A260, (absorption maxima of nucleic acids), 280 nm (A280, absorption
maxima of proteins), and 320 nm (A320, absorption of contaminants & background
absorption). The spectrophotometric method to quantify RNA involves measuring the
absorbance at A260 based on the RNA extinction coefficient (1 unit A260 = 40 ng/μl). The
A260/A280 ratio provides an indication of RNA purity (1.8‐2.0 suggests RNA of good quality),
whereas A260/230 and A260/320 should be maximized as these represent the degree of
background absorption and contaminants (265, 270).
The use of an RNA carrier in plasma and serum samples makes the measurements of RNA
optical density non informative, since the signal from the carrier is too dominant relative to
the other RNA species and shields the signal for the RNA of interest. Even if the carrier is not
included during the isolation, the concentration of RNA recovered from plasma or serum is
below the limit for reliable quantification with spectrophotometry, being represented by
aberrant spectra (244, 252). Similarly, our experience showed that the spectrophotometric
RNA quantification was not successful for plasma samples, demonstrating low A260/A280
ratios and unusual spectral patterns (Chapter 3).

CHAPTER 2
Victoria Nisenblat 39
2.2.3.3 Gelelectrophoresis
A classical way to access RNA quantity and quality is to run a RNA sample on a denaturing
acrylamide or 1‐4% agarose gel to separate the different fractions of RNA subunits (5S, 18S,
28S). For RNA of good quality a 28S/18S ratio of 2.0 is assumed. The technique requires
relatively high amount of input material, about 500 ng, and therefore is limited to the tissues
with much higher concentration of RNA than that in plasma or serum. Moreover, the
subjective interpretation of the gel images strongly depends on the experience and
examination of the individual researcher and can hardly be compared between different users
and laboratories (270).
2.2.3.4 Automatedcapillaryelectrophoresis
Today, lab‐on‐chip technology for automated capillary electrophoresis is state of the art and
is recommended for standardized RNA integrity control. Different lab‐on‐chip instruments are
commercially available like the 2100 Bioanalyzer (Agilent Technologies, Waldbronn, Germany)
and the Experion (Bio‐Rad Laboratories, Munich, Germany). Both devices are sensitive, highly
reproducible and suitable for a reliable quality control of RNAs (270) . After the sample
components are electrophoretically separated and dye is incorporated, their fluorescence,
which depends on the size of each component, is determined against internal standards using
the software tool. For visualization and better interpretation, an electropherogram and a
virtual gel image are generated. The 28S/18S ratio is calculated by assessing the peaks
recorded in the electropherogram and the bands occurring on the gel‐like image. Additionally,
to simplify the assessment of RNA integrity the instrument software calculates a numerical
value: RNA integrity number (RIN) on the 2100 Bioanalyzer and RNA quality index (RQI) on the
Experion. An RQI or RIN value of 1 represents almost fragmented and degraded RNA while an
RQI or RIN of 10 represents intact non‐fragmented RNA (271).
In miRNA‐abundant tissues, the RIN value that is obtained for total RNA can be an indirect
indicator of overall sample and, consequently, of miRNA quality (251, 270). However, this is
not applicable for the challenging samples such as plasma and serum. A 2100 Bioanalyzer chip
for small RNAs can analyse small RNA of less than 200 nucleotides and recognize fragments of
15–40 nucleotides as miRNAs. The concentration of miRNA is calculated as absolute amount
in pg and as a percentage of a total small RNAs, however this does not estimate miRNA quality.
The estimation of miRNA abundance by this method may only be accurate when overall total
RNA integrity is very high. Small fragments of degraded RNA can reach the analytical range

CHAPTER 2
40 Victoria Nisenblat
analysed by the chip and therefore lead to an overestimation of the miRNA amount (270). For
the same reason, spike‐in synthetic templates to control for RNA extraction efficiency
introduce significant bias to the Bioanalyzer readings. We used 2100 Agilent Bioanalyzer chips
for small RNA on the non‐spiked samples, as will be explained in more detail in Chapter 3.
2.2.4 DetectionofmiRNAexpression
2.2.4.1 ChallengesinprofilingofcirculatingmiRNAs
The short length of mature miRNAs and lack of a common sequence for universal primer‐
binding, such as a poly (A) tail, prevents sufficient annealing to traditional reverse
transcription and PCR primers. Moreover, the short length and variance in GC content of
miRNAs leads to a wide variance in melting temperatures for annealing reactions, creating
miRNA‐specific biases (272). Due to sequence homology between the mature and precursor
miRNA forms and due to the high degree of similarity between the mature miRNAs within a
family, miRNAs must be selectively detected in a background of other diverse RNA species to
the accuracy of a single nucleotide. Finally, there can be sequence length variability in
biological samples even for a single miRNA that results in co‐variants (isomiRs) with different
miRNA stability and mRNA targeting efficacy (242). In order to cope with the above limitations,
a range of technical platforms was developed for miRNA research. Overall, due to the low
yield of RNA from body fluids and difficulty to precisely measure miRNA content, a fixed
volume of eluted RNA is routinely used for all downstream applications, rather than a fixed
quantity of input RNA (248, 252, 269).
2.2.4.2 GeneraltypesofmiRNAprofiling
Profiling studies generally include two major steps: a discovery phase and a validation step.
The discovery phase typically includes large‐scale miRNA profiling that aims to screen for
differentially expressed miRNAs in normal and disease tissue with as many targets as possible.
A following validation step is based on the less complex and more sensitive techniques for
discriminative assessment of each of the selected targets.
2.2.4.3 Large‐scalemiRNAprofiling
The majority of currently well‐established high‐throughput platforms for the large‐scale
miRNA profiling are based on three major approaches: 1. qRT‐PCR, 2. hybridization‐based
methods and 3. next‐generation sequencing (273‐277). Each of these techniques is described
below and summarised in Table 2‐1.

CHAPTER 2
Victoria Nisenblat 41
Table 2‐1 Large‐scale miRNA profiling, comparison between the platforms. Adopted from Pritchard, 2012 (242)
Advantages Disadvantages Platform examples1 Sample required
Cost2
qRT‐PCR based array
Established method Sensitive and specific Can be used for absolute quantification
Cannot identify novel miRNAs Labour intense Medium‐through put (less detectors per sample)
TaqMan TLDA microfluidic cards (Applied Biosystems) TaqMan open array (Applied Biosystems) Biomark HD system (Fluidigm) miScript miRNA PCR array (Qiagen) miRCURY LNA qPCR (Exiqon)
1 – 20 ng $$
miRNA microarray
Established method Low cost High‐throughput
Lower specificity Cannot be used for absolute quantification Cannot identify novel miRNAs
GeneChip miRNA array (Affymetrix) GenoExplorer (Genosensor) MiRNA microarray (Agilent) Mercury LNA miRNA array (Exiqon) Sentrix array matrix and Bead Chips (Illumina)
30‐100 ng $
RNA sequencing: next‐generation sequencing platforms
Detects novel miRNAs High accuracy in distinguishing miRNAs with similar sequence, isomiRs High‐ throughput
Cannot be used for absolute quantification Substantial computational support needed
HiSeq 2000 (Illumina) SOLiD (ABI) GS FLX + (Roche) Ion Torrent (Invitrogen) MiSeq (Illumina)
100 ng $$$
1This is not meant as a comprehensive list, but as a sample of commercially available platforms; 2 The more ‘$’ symbols there are, the more expensive the materials per sample are.
Even though each of these technologies is robust and reproducible, there is no absolute
standard for miRNA expression profiling. Commercially available microarrays differ in the
number of detectors, species coverage and sensitivity, therefore the results are not always
concordant across the array platforms (242). Studies that compared different platforms found
high intra‐platform repeatability and comparability to individual qRT‐PCR but lower inter‐
platform overlap between the lists of the differentially expressed miRNAs (275, 278‐279).
2.2.4.3.1 qRT‐PCR‐basedmethods
This approach relies on reverse transcription of miRNA to complementary DNA (cDNA),
followed by qPCR with real‐time monitoring of reaction product accumulation. The reactions
are carried out in a parallel high‐throughput form that allows for hundreds of simultaneous
qRT‐PCR reactions to measure multiple miRNAs under the same reaction conditions. The
common strategies used for priming the reverse transcription reaction to generate cDNA that
have been adjusted for miRNA research (Figure 2.1) include enzymatic addition of a poly(A)
tail (e.g. miScript miRNA PCR array, SABiosciences/Qiagen) and generation of a reverse
transcription primer binding site using a stem–loop primer (TaqMan technology, Applied

CHAPTER 2
42 Victoria Nisenblat
Biosystems). A detailed description of these techniques, including pros and cons, is presented
below in a section “Validation of miRNA profiling”. Commercially available customizable plates
and microfluidic cards use pre‐plated PCR primers that are typically distributed across multi‐
well dishes or alternatively across microfluidic cards containing nanolitre‐scale wells. A PCR
reaction is run on a thermocycler and the amplification values are calculated for the entire set
of miRNAs, based on an intensity of fluorescence which is proportional to the amount of an
amplified product. A complementary pre‐amplification step can be used to enhance the
sensitivity of the megaplex reactions and is considered a method of choice for PCR‐based high‐
throughput miRNA profiling (280).
An additional strategy to improve the performance of such platforms is incorporation into
primers of locked nucleic acids (LNAs), which are the synthetic RNA/DNA analogues
characterized by increased thermo‐stability, which help to standardize miRNA primer
hybridization conditions (miRCURY LNA qPCR, Exiqon) (224). LNAs are RNA monomers with a
modified sugar phosphate backbone that has a 2’‐O‐4’‐C methylene bridge. The bridge
increases the monomer’s thermal stability, reduces its flexibility, and increases the
hybridization interactions of the base. When used with standard bases (A,C,G,T, or U), probes
synthesized using LNA have greater thermal stability when compared to conventional DNA or
RNA and form a stronger bond with the complementary sequence. The structures of LNA and
RNA monomers are presented in Figure 2.2. LNA probes have a more rigid structure and
hybridization strength that confers greater sensitivity and discrimination, which enables them
to discriminate between highly homologous targets with a single base difference (281‐282).
LNA primer based qPCR profiling improves a sensitivity of the platform but is reported to have
lower specificity compared to the stem‐loop approach (276).
The main advantage of qRT‐PCR based platforms is that it is a comprehensive, fast and
affordable method that requires a small amount of input material. It is also easily incorporated
into the workflow for laboratories that are familiar with qRT‐PCR. This approach has been
widely used for profiling circulating miRNAs (214, 225, 248, 283) and it seems to have higher
sensitivity than microarray‐based assays (274). In our experiments, we used commercially
available microfluidic cards based on qRT‐PCR TaqMan chemistry, considering the high
specificity and need for low input amount of RNA of this technique.

CHAPTER 2
Victoria Nisenblat 43
Figure 2.1 The three most commonly used methods for qRT‐PCR quantification of miRNAs : a) Stem‐loop primers, b)
Poly(A) tailing of mature miRNAs, c) Locked nucleic acid –based primers. Adopted from Zampetaki A & Mayr M,
2012 (244).
Figure 2.2 The structure of LNA monomer and RNA monomer. The key difference between RNA and LNA monomers
is the Oxymethylene Bridge between the C20 and C40 atoms of the ribose ring. The resulting bicyclic sugar ring system
imposes a locked RNA‐like conformation.
2.2.4.3.2 Hybridization‐basedmethods
Microarrays were among the first methods to be used for parallel analysis of large numbers
of miRNAs. This method includes different techniques for fluorescent labelling of the miRNA
in a biological sample (either by enzymatic or by chemical approach), followed by subsequent
hybridization to DNA‐based probes on the array or on beads. The expression of the targets is
detected via scanning of the slides and quantification of the fluorescence, which is
proportional to the target‐probe hybridisation. Each of the labelling approaches has some
limitations and benefits, but all may be associated with labelling of other RNAs in a sample,

CHAPTER 2
44 Victoria Nisenblat
which can contribute to background signal as well as to cross‐hybridization with specific
miRNA probes. A recent innovation in miRNA profiling is the Nanostring nCounter system, in
which a multiplexed probe library is created using two target‐specific capture probes, a 3’
capture probe containing biotin to allow absorbance to the solid phase via streptavidin and a
second 5’ reporter with an individual colour‐coded sequence, that are tailored to each miRNA
of interest. No amplification or labelling of miRNA is required with this method. The method
provides high accuracy in discriminating between similar variants, but involves high costs and
the distribution of the hard‐ and soft‐ware supporting this technology is still limited.
Microfluidic primer extension assays (MPEA) is another type of microarray in which DNA
polymerase I is added directly into the channels for specific elongation and labelling of
hybridised miRNAs, thus eliminating a labelling step before hybridisation (284). LNAs can be
incorporated into capture probes on the arrays to improve the sensitivity and detection
efficiency for miRNAs (267). Different methods of miRNA microarrays are illustrated in
Figure 2.3.
Hybridisation‐based miRNA microarrays have the advantage of being less expensive and yet
they allow large numbers of parallel measurements. Their limitations include being more
difficult to use for absolute quantification, having a lower specificity for closely related
miRNAs, and requiring a larger minimum sample (~100 ng RNA) compared to qRT‐PCR
platforms. LNA and MPEA miRNA arrays require less RNA (30 ng and 20 ng, respectively),
which makes these methods more feasible for the samples with minute amount of RNA (242,
244). Microarrays based on each of the abovementioned technologies have been successfully
used for the profiling of plasma miRNAs and show good correlation with the qRT‐PCR platform
(261, 269, 285‐287).

CHAPTER 2
Victoria Nisenblat 45
(A) miRNA microarray
DNA‐based capture probes
capture fluorescently
tagged miRNAs, followed
by scanning of slides and
quantification of
fluorescence
(B) Nanostring nCounter
A bridge oligonucleotide
templates ligation of an
miRNA to a specific tag.
Capture and detection is
done by two target‐specific
probes.
(C) MPEA
The hybridized sncRNA
functions as a primer for
an enzymatic elongation in
which biotinylated
nucleotides are
incorporated.
Figure 2.3 Principles of miRNA microarrays: Panel A – hybridisation oligonucleotide microarray; Panel B ‐ Nanostring
nCounter; Panel C ‐ Microfluidic primer extension assays (MPEA). Adopted from Pritchard CC et al., 2012 [Panels A, B]
(242) and from Vorwerk S et al., 2008 [Panel C] (284).
2.2.4.3.3 Next‐generationsequencingplatforms,RNA‐seq
This approach involves the reverse transcription of miRNA from the sample of interest to a
cDNA library, which is then affixed to a solid phase (HiSeq 2000 or Genome Analyser IIX
(Illumina)) or to beads for emulsion PCR (SOLiD (Applied Biosystems) and GS FLX+ (Roche)), as

CHAPTER 2
46 Victoria Nisenblat
illustrated in Figure 2.4. This is followed by the ‘massively parallel’ sequencing of millions of
individual cDNA molecules from the library. Bioinformatics analysis of the sequence reads
identifies both known and novel miRNAs in the data sets and provides relative quantification
using a digital approach (a relative abundance is the number of sequence reads for a given
miRNA relative to the total reads in the sample) (288). Currently established RNA‐seq
platforms begin with reverse transcription of miRNA to a cDNA library. Adaptor ligation then
allows the library either to be affixed to a solid phase or to beads for emulsion PCR.
Figure 2.4 MiRNA profiling with next generation sequencing (RNA‐seq). Adopted from Pritchard CC et al., 2012 (242).
The major advantages of next‐generation sequencing for miRNA profiling is the detection of
both novel and known miRNAs with precise identification of miRNA sequences (including
sequences that differ by a single nucleotide and isomiRs of varying length), reviewedin (242).
However, sequence‐specific biases related to enzymatic steps in small RNA cDNA library
preparation methods have been noted (289). Although next‐generation sequencing
technology has been projected to replace the use of the microarray in the near future (290),
its current application is limited due to cost, labour, substantial computation and need for
professional bioinformatics support (275, 279). Single‐molecule real‐time (SMRT) sequencing
or single‐molecule sequencing (SMS) methods promise faster and less biased output than
methods that are currently in use, although they are not yet widely available and are
associated with higher error rates and higher cost (242, 291). Next generation sequencing
technology has been successfully applied to the measurement of circulating miRNAs
(292‐293).
2.2.4.4 AnalysisandinterpretationofmiRNAmicroarraydata
The processes that constitute basic miRNA‐profiling data analysis can be summarized as 1.
data processing and quality assessment, 2. data normalization, 3. calculation of differential
expression and 4. tools for integration of mRNA and miRNA profiling datasets.

CHAPTER 2
Victoria Nisenblat 47
2.2.4.4.1 Dataprocessingandqualityassessment
The raw data is generated and exported by using the software incorporated into the
instrument used for profiling (e.g. thermocycler). The data pre‐processing includes platform
and vendor specific steps, such as e.g., baseline adjustment and threshold setting for qRT‐PCR
analyses, background correction for microarray technology, or filtering for small RNA‐
sequence data. Investigation of whether any of the automated pre‐processing steps can
influence the analysis is important.
Quality assessment is essential for obtaining of valid and meaningful results and can be
performed manually or automatically as an integrated algorithm in various data analysis
packages. This step includes evaluation of the performance of internal controls, assessment
of batch to batch variability and identification of outliers. Data quality control across samples
can be assessed via diagnostic aids such as density distributions, box plots, scatter plots and
histograms to provide a domain‐relevant insight into the data. The plotting of log2 intensities
or Cq values allows visualisation and identification of any substantial artefacts and systematic
patterns (294).
Negative controls, including no template controls (NTC) should exhibit weak or no
amplification, to demonstrate the absence of contamination by DNA. The performance of an
internal reference (standard sample or template that is run across different batches) can help
to estimate the overall performance of each array as well as the batch effects related to run‐
to‐run variation. The batch effects can be minimized by making sure that each batch of
samples includes a mix of samples from the different comparison groups (295).
The signal‐to‐noise ratio (SNR) is a statistical tool that measures the quality of the signals that
are obtained from hybridisation arrays. When SNR is low, the background noise could
dominate the measured expression signal and thus increase the uncertainty in evaluating gene
expression levels. The SNR is not computed for qRT‐PCR based arrays due to lack of estimates
for the background noise on these platforms (279).
The analysis of technical replicates (i.e. repeated measurements of the same sample in the
same run) minimises variation bias and permits removal of outliers prior to aggregation of
replicates into a single measurement value. The applicable replicate variability threshold is
0.3‐0.5 Cq in qRT‐PCR based methods. The biological variability is often much larger than the
technical variability; however it is not advisable to remove any of the biological replicates
unless the sample size is sufficiently large (295‐297). A principal components analysis (PCA)

CHAPTER 2
48 Victoria Nisenblat
and an array‐array heatmap based on the Spearman distance that is produced as part of the
results, allow post‐facto review of quality of the experiment. Finally, it is important to ensure
that a data‐handling error has not occurred during the uploading in the analysis software or
spread sheet, particularly after merging of multiple data files (242). Quality assessment
algorithms that control for the above parameters are incorporated in commercially available
software (e.g. REST, qBASE, StatMiner) and in the Bioconductor packages designed for gene
expression and miRNA analysis.
2.2.4.4.2 Normalisationmethods
Data normalization is crucially important for obtaining accurate results when comparing
different samples and conditions and is known to have a profound impact on experimental
accuracy (242, 295, 298‐300). The goal of normalization is to adjust the data to minimize the
effects of systematic experimental bias and technical variations, thereby making it easier to
identify the relevant biological differences. Various approaches have been used in the
literature, and some of the discrepancies between miRNA‐profiling studies may be explained
by the application of different normalization approaches.
The first microarray experiments employed no normalisation, using background subtraction
followed by normalizing to a median or scaling based on total array intensities (266, 299).
More recent approaches range from the relatively simple methods to more complex
algorithms and most of them are suitable for several experimental platforms.
Perhaps the most common approach for normalization of qRT‐PCR data is the use of one or a
few invariant endogenous controls or “housekeeping” reference miRNAs that are found to be
largely stable across the samples (252, 300). This approach adjusts the data for differences in
input RNA as well as differences in sample quality that may influence the efficiency of qRT‐
PCR. The danger of using a priori selected “predefined” endogenous controls lies in the
assumption that a specific miRNA exhibits exactly the same pattern of expression in all sample
types independently of the experimental condition. At present, there is no consensus
regarding universal specific miRNAs or a set of miRNAs that can be used as reliable
endogenous controls (298, 300). The factors that lead to biological variation are not known,
and their effects on specific miRNAs in different sample sets have not been characterized.
Gene expression analyses have shown that many genes assumed to be constant in their
expression can vary between conditions (301‐302). Thus, selection of normalisers that are
specific to the experimental sample set outperforms the normalization strategy that uses
CHAPTER 2
Victoria Nisenblat 49
predefined universal endogenous controls, such as the small RNAs proposed by the
manufacturers (e.g. Mammalian U6) (298, 303‐304).
Whereas a single miRNA normaliser may be sufficient in some experimental situations, a
geometric averaging of more than one may be required to produce accurate data. The
strength of using geometric averaging is in smoothing the individual variation of the
expression value of a single reference gene, which reduces the errors in normalized data (305).
Selection of invariant miRNAs from the experimental dataset can be identified by algorithms
specifically developed for reference gene or miRNA evaluation and selection. Examples of
algorithm to identify normalisers include: 1. GeNorm based on the ranking of the putative
controls and stepwise elimination of the least stable ones (305), 2. NormFinder based on
statistical linear mixed‐effects modelling (306) and 3. BestKeeper, based on repeated pairwise
correlation and regression analysis (307). The optimal number of stable controls is
recommended to be determined by a pairwise variation analysis between subsequent
normalization factors using a cut‐off value of 0.15 (305). Ideally these candidate references
should belong to different functional classes, significantly reducing the possibility of
confounding co‐regulation (298). Only the miRNAs that are expressed across all the samples
are commonly used for a screening search for stable references.
An alternative approach that has been used for large‐scale miRNA‐profiling datasets is to use
a global measure of the miRNA expression data as the normaliser. This strategy is based on
the assumption that although specific miRNAs may vary across biological samples, the overall
pattern of expression of the majority of miRNAs is expected to be invariable and therefore a
global measure of expression can be used to correct for technical and/or sample quality
differences. Several authors have discussed approaches along this line (298‐299, 303, 308‐
309). The most commonly investigated approaches include the normalisation to Global Mean
expression, Locally Weighted Regression and Smooting Scatterplots (LOWESS) normalisation,
variance stabilizing normalization (VSN) and Quantile normalisation.
The Global Mean expression applies a normalisation to the mean expression of all miRNAs
that were found to be expressed in a given sample (303). The approach has been found
superior to normalisation to a range of endogenous controls in qRT‐PCR based arrays and was
validated using multiple data sets, including those from hybridisation microarrays (309).
The VSN is based on a parameterized arsinh transformation (instead of a logarithmic
transformation) that calibrates sample‐to‐sample variations and renders variance
CHAPTER 2
50 Victoria Nisenblat
independent of the mean intensity. However, VSN strongly affects the distribution of the large
fraction of miRNAs whose expression is near or at background, resulting in the large increase
of variability for those miRNAs (295, 299).
LOWESS normalizations and its variants are widely preferred transformation based methods,
which use local regression via locally weighted scatter plot smooth (295, 308). This method
corrects for intensity‐specific artefacts of the spots/channels on each array that can be
visualised via plot of the spot intensities vs. an average brightness of the chip. The LOWESS
detects the systematic deviations on the plot and corrects them by carrying out a local
weighted linear regression as a function of the log10 (intensity) and by subtracting the
calculated best‐fit average log2 (ratio) from the experimentally observed ratio for each data
point.
Quantile normalization assumes that on average, the distribution of the transcript levels
within the cell remains nearly constant across samples, so that if the expression of one
transcript increases, that of another decreases. A quantile is a measure that allows assessing
the degree of spread in a data set, which is divided into n‐regular intervals, which are
equivalent to the number of data points. The algorithm equalizes the distributions of
expression intensities across arrays by fitting the intensities of all probes on each array into
one standard distribution shape and then maps every value on any one array to the
corresponding quantile of the standard distribution by assigning rank order for each value
(310). Originally proposed for oligonucleotide arrays by Bolstad et al., 2003, it is now widely
used for different platforms and was confirmed as one of the most robust methods (298‐299,
301, 311‐312). This method works as well as most of the more complex procedures, and is
available in affy, qPCRNorm and other packages distributed through the Bioconductor project
(www.bioconductor.org), which has become the most widely used suite of freeware tools for
microarrays (294, 301).
LOWESS and Quantile algorithms assume that most targets are not differentially expressed
and differentially expressed spots are homogeneously distributed with respect to both, over‐
and under‐expressed miRNAs. These assumptions may not hold true in case large numbers of
miRNAs are differentially expressed or expressed in only one direction, in which case
algorithms that make only the minimal (e.g. stable control‐based) or no assumptions (e.g.
VSN) might be more appropriate for the respective datasets (298‐299).

CHAPTER 2
Victoria Nisenblat 51
A third approach is the use of spiked‐in synthetic control miRNAs that are introduced into the
RNA sample at a range of known input amounts and that are not normally present in the
sample (252, 295). Mitchell et al. (2008), introduced the concept of spiked‐in synthetic non‐
human miRNAs, which are added to a plasma sample prior to extraction (248) to adjust for
differences in efficiency of RNA recovery between samples and as internal normalisers for
downstream PCR quantification. The lack of the sequence homology of such miRNAs to human
miRNAs and absence of empiric hybridization to human miRNA probes on miRNA microarrays
made this approach particularly attractive. This method has the advantages of providing
rigorous quality control, correcting for many aspects of technical variation (for example,
sample‐to‐sample differences in miRNA‐labelling efficiency for microarrays or reverse
transcription for qRT‐PCR‐based profiling). It requires that assays for the spiked‐in controls
should be available on the platform that is being used, however their use does not control for
technical variations other than process‐related losses of miRNA abundance (266).
For miRNA profiling by next‐generation sequencing, normalization methods are much less
well‐developed (298). Currently, a common approach is to represent the abundance of a given
miRNA in a sample as the percentage of total reads. This approach, however, assumes similar
distributions of overall miRNA reads between the samples, which might not be true. In the
future, the development of a statistical framework for adjusting for differences in miRNA
frequency distribution, and the use of synthetic miRNA spike‐in approaches may provide
improved data normalization between samples and improved quantification ability in RNA‐
seq experiments.
It remains unclear, which method uniformly outperforms the others under different biological
context and if there is any single approach for different experimental set ups. Evaluation of
several normalization strategies to find the optimal one for the dataset in consideration or
even a combination of two normalization methods have been suggested as more robust
approach (277, 299, 308, 311). We applied several normalisation approaches to data obtained
from the array experiment. Quantile method appeared to outperform other techniques by
more significantly reducing the variability measures within the data, as demonstrated in
Chapter 4.

CHAPTER 2
52 Victoria Nisenblat
2.2.4.4.3 Calculatingdifferentialexpressionanddeterminationofstatistical
significance
Depending on whether or not annotation to identify the experimental groups is used, the
analyses can be classified into supervised or unsupervised learning. In unsupervised learning,
data is classified into groups with similar patterns, i.e. similar expression profiles, without
giving a priori annotation to the groups. Clustering methods is one of the widely used
unsupervised approaches and can be hierarchical (grouping objects into clusters by specifying
relationships among objects resembling a phylogenetic tree) or non‐hierarchical (grouping
into clusters without specifying relationships between objects in a cluster) (313).
Supervised learning in miRNA‐profiling experiments involves making comparisons between
the predefined groups, i.e. disease and normal state, typically by the calculation of differential
miRNA expression. The data from the profiling experiments is usually presented as a relative
measurement and the absolute units are not necessary to assess up‐ or down‐regulation
across two different conditions (313). In addition to the relative expression values, the data
can be presented by using the fold‐changes (FC) between the conditions. In such cases, a ratio
of 4000/100 will lead to the same result as 40/10, which does not provide any information on
absolute measurement, but represents a meaningful comparison across different conditions.
The degree of fold‐difference that constitutes meaningful differential expression will depend
on the experimental context. An acceptable recommendation FC cut‐off is 1.5, but can be
raised up to 5 if more than 5% of the targets are selected, in order to direct further
investigation on the limited number of differentially expressed targets (314). The FC can be
represented as log2 values, which allows mapping of up‐ and down‐regulation and down‐
regulation in a symmetric manner, e.g. no difference is presented as 0 (log2 1 = 0), up‐
regulation as a positive value (log240/10 = 2) and down‐regulation as a negative value
(log210/40 = ‐2).
Among multiple statistical methods, LIMMA (linear models for microarray analysis) is
considered as highly robust for differential expression analysis under varying experimental
designs. LIMMA uses a moderated t‐statistic that allows “borrowing information from the
ensemble of genes which can assist in inference about each gene individually” (315). LIMMA
has improved power over other approaches for low sample sizes, is tolerant of data having
both normal and some non‐normal distributions and supports both blocked and non‐blocked
designs and is useful for ranking genes by likelihood of differential expression (315‐316).

CHAPTER 2
Victoria Nisenblat 53
Several studies that assessed a large number of statistical methods, found that the method
implemented by LIMMA performs well for both large and small numbers of samples and has
been proved to be much more reliable than other examined methods, including Significance
Analysis for Microarrays (SAM), Analysis of Variance (ANOVA), the T‐test, VarMixt, RankProd,
and others (317‐320).
Every statistical test is related to a single hypothesis per detector and per experimental
condition comparison, thus the number of tests is equal to the number of miRNAs in the
project. Increasing the number of tests increases the probability of finding a significant p‐value
by chance. Generally, a correction for multiple comparisons requires raising the bar for
significance from what would be called significant for a single test (p value = 0.05) to a level
dependent on the number of tests being run in parallel. This minimises the effect of the False
Discovery Rate (FDR), which is defined as the expected proportion of false positives among
the declared significant results. There are several methodologies to implement the correction
for multiple testing which negatively adjust the p‐values according to the number of total
tests. The most popular is the Benjamini‐Hochberg (B‐H) method that assumes that the multi‐
tests are dependent and that the expression of the detectors has some level of correlation
(321). Other methods to adjust for multiple testing include Bonferroni, Hochberg or Holm’s
methods. Therefore, in high‐throughput analysis targets are usually filtered for statistical
significance using FDR testing, with an industry‐standard FDR‐adjusted p‐value cut‐off of 0.05.
However, if less than 0.1% of the expressed targets are found as differentially expressed, the
raw p‐values without correction for multiple testing can be used to rank genes by likelihood
of differential expression (with a cut‐off of 0.05). Some experts believe that correction for
multiple testing can be omitted in a discovery type of experiments (322). In such experiments,
the main objective is to generate the hypothesis that needs to be followed up further. For this
reason, producing too many type 2 errors by applying a multiple test correction can deter
potentially exciting observations, some of which may later prove to be false. In this scenario,
the authors have to be clear in setting objectives and cautious in interpreting the results. We
used LIMMA for statistical analyses of micro array experiment and, in accordance to the
presented above, did not apply a correction for multiple testing as a mandatory criterion for
the significance of differential expression in this discovery stage.
The major analytical challenge associated with analysis of the circulating miRNAs and their
association with disease is that the circulating miRNAs are highly correlated, which affects the
CHAPTER 2
54 Victoria Nisenblat
precision of conventional statistics. This might lead to over fitting and potentially biased effect
estimates. Application of the computational networks to miRNA data that account for the
relationships between miRNAs as well as between miRNA clusters and pathologic conditions,
have been proposed. The utility and methodological approach of such algorithms is currently
under investigation (323).
2.2.4.4.4 IntegrativeanalysesofmiRNAsandmRNAprofilesingeneregulatory
networks
A major area of interest in miRNA‐profiling analysis is integration of miRNA profiles with mRNA
profiles and other large‐scale genomic data sets (324). This has the potential to yield a better
understanding of gene regulation and to improve systems‐level modelling. In silico tools are
increasingly becoming available for the functional analysis of altered miRNA subsets and for
interrogation of miRNA regulatory networks (325‐329). The overview of current
bioinformatics approaches towards identification of the biologically important miRNA targets,
including assessment of their limitations, is summarised in several recent excellent reviews
(330‐331).
2.2.4.5 ValidationofmiRNAprofiling
miRNA microarrays are best used as discovery tools rather than as quantitative assay
platforms, thus independent confirmation of microarray results is generally advisable for the
key findings in every experiment (332). The validation can be performed using additional
microarrays, qRT‐PCR, northern blot, or other techniques. QRT‐PCR remains the gold standard
for quantification of gene and miRNA expression. It has been widely employed as a validation
method for microarray studies, due to its wide dynamic range, high accuracy and ability to
provide absolute miRNA quantification (278, 296, 304). The efficient cDNA synthesis methods,
integration of amplification efficiency, inclusion of suitable internal controls, rational outlier
exclusions and sufficient replication are the bases for the accuracy and reproducibility of
results.
2.2.4.5.1 SynthesisofcDNA
There are several different methods to reverse transcribe miRNAs (304). MiRNAs can be
reverse transcribed individually by using miRNAs‐specific reverse transcription primers
(MSPs). Alternatively, miRNAs are first tailed with a common sequence and then reverse
transcribed by using a universal primer. As a general rule, the use of MSPs decreases

CHAPTER 2
Victoria Nisenblat 55
background, whereas universal reverse transcription is useful if several different amplicons
need to be analysed from a small amount of starting material. Another alternative can be to
multiplex miRNAs reverse transcription by pooling MSPs. The resulting cDNA is then used as a
template for qPCR with one MSP and a second universal primer. While the 3’‐end of the MSP
has to be complementary to the miRNA, there are two different approaches to design the 5’‐
end of a MSP: with either a stem‐loop or a linear structure. Stem‐loop primers (used in
TaqMan technology) are designed to have a short single‐stranded part that is complementary
to the 3’end of miRNA, a double‐stranded part (the stem) and the loop that contains the
universal primer‐binding sequence. Stem‐loop primers are more difficult to design but their
structure increases specificity of the assay by reducing annealing of the primer to pre‐ and pri‐
miRNAs. The 3’‐end of linear primers is designed to complement the target miRNA, to enable
reverse transcription, while the 5’‐end of the primer encodes a universal sequence that is used
to achieve qPCR amplification. A main disadvantage of linear primers is that they may not
discriminate between mature miRNA and their precursors. Incorporation of LNAs into a primer
increases sensitivity of the assay by increasing melting temperatures, but contributes to a
higher cost.
Out of a number of fluorescent technologies available for qPCR, two are used for miRNA
detection; SYBR Green and TaqMan probes. The SYBR Green chemistry is based on the
increase of the fluorescent signal proportionally to the accumulation of the amplification
products, but cannot discriminate between different PCR products and binds to all double
stranded DNAs, including non‐specific products such as primer‐dimers. Therefore,
methodologies that assess the specificity of the amplification products, such as a melting point
analysis, are often required to monitor the homogeneity of the qPCR products. TaqMan
primers incorporate the dual‐labelled hydrolysis probes that contain a fluorescent reporter
and quencher upon adjacent nucleotides. The close proximity of the fluorescent reporter to
its quencher molecule prevents the emission of fluorescence. During the amplification
process, the primer loop unfolds upon denaturation and Taq polymerase hydrolyses the
probe. This results in increased distance from the quenching group and in increase of
fluorescence, proportional to the amount of the amplicon. Given that a non‐specific
amplification will not generate any fluorescent signal, this method allows more accurate
quantification of the amplified target.

CHAPTER 2
56 Victoria Nisenblat
2.2.4.5.2 NormalisationofRT‐PCRdata
As with high‐throughput analysis, the reliability of the validation miRNA experiments requires
appropriate normalisation. For cases in which a small number of miRNAs are being profiled,
the approaches based on global measures (e.g. quantile or a global means of expressed
miRNAs) are not a suitable strategy. In such cases, an appropriate method is normalisation to
the specific endogenous controls, which are identified in a pilot large‐scale profiling study on
a subset of samples using one of the abovementioned methods (297, 301, 303). The use of
microarrays to identify candidate internal references for qRT‐PCR normalization has been
successful, but this extrapolation requires some caution due to differences between the
microarray and validation experiments. The main source of discrepancy is likely to be due to
differences in the types of the samples, in the platform design or in data transformation
procedures during normalization. As even small variations of an internal control could lead to
non‐reliable expression data, it is critical to validate that the expression of reference miRNAs
is stable prior to their use for normalization in qRT‐PCR analysis (302). However, testing of the
expression stability of the putative normalisers for the circulating miRNAs in qRT‐PCR
experiments can be challenging. This is because this type of experiments is based on the input
volume and not the exact amount of miRNA, unlike gene‐ or miRNA‐abundant tissue studies.
Normalisation by using synthetic miRNAs spiked‐in as controls has also been described (248,
252), however this approach is not as accurate as appropriately selected internal references.
2.2.4.5.3 Realtimequantification
2.2.4.5.3.1 ∆∆Cq vs. efficiency‐calibrated method
The principle of qRT‐PCR is based on the detection, in real‐time, of a fluorescent reporter
molecule whose signal intensity correlates with amount of DNA present in each cycle of
amplification. qRT‐PCR exploits the fact that the quantity of PCR reagents is not limited in the
exponential phase, therefore PCR product increases exponentially in proportion to the
quantity of initial template. Ideally, PCR product will double during each cycle if efficiency is
perfect, i.e. 100%. The cycle number at the threshold level of log‐based fluorescence is defined
as Cycles to Threshold (Ct), more recently termed as the Cq number. This is the observed value
in most qRT‐PCR experiments, and therefore the primary statistical metric of interest.
Real‐time PCR data are quantified absolutely and relatively. Absolute quantification is
important if the exact transcript copy number needs to be determined, however, relative

CHAPTER 2
Victoria Nisenblat 57
quantification is sufficient for most physiological and pathological studies (333). Two
mathematical models for calculation of the relative expression are widely applied: the
efficiency calibrated model (334) and the ΔΔCq model (335). Both methods are based on
similar experimental models and rely on the comparison between expression of a target
miRNA versus a reference miRNA. The ΔΔCq method involves two subtractions: the first
between the endogenous control expression value from the target of interest measured in the
control sample and the second, the endogenous control in the experimental sample from the
target of interest measured in the experimental sample (335). Comparison between the two
conditions is possible by comparing normalized expression (∆Cq) of the two conditions or by
calculating the fold change of the expression, i.e. the expression ratio, (∆∆Cq). The ΔΔCq
method assumes the percentile amplification efficiency (PAE) is 100% and calculates the ratio
based on 2–ΔΔCq, where 2 corresponds to a doubling of PCR products per cycle. However, this
approach does not take into consideration possible variations of amplification efficiencies
from one sequence or sample to the other and thus may not accurately estimate relative DNA
amounts in different conditions.
The efficiency‐calibrated model assumes that different targets are not amplified with the
same efficiency, thus the comparison of their expression levels requires some adjustment. PCR
amplification efficiency can be either defined as percentage (PAE) (from 0 to 100%) or as time
of PCR product increase per cycle, i.e. amplification efficiency (AE) (from 1 to 2). The AE can
be estimated by the analysis of the standard (dilution) curves, by individual graph analysis
based on the rate of fluorescence accumulation within the exponential region or by
mathematical model fitting (336). The standard curve method calculates the AE based on Cq
numbers from a serial (usually 5‐log) dilution of templates, via plotting of the Cq values versus
the log of the dilution and applying a linear regression (337). For each dilution, a standard qRT‐
PCR protocol should be performed in triplicate for all the primer pairs to be used in the
experiment. The equation of the linear regression line, along with Pearson’s correlation
coefficient (r) or the coefficient of determination (R2), can then be used to evaluate whether
the qPCR assay is optimized. AE = 10‐1/slope and AE = 2PAE, thus PAE = log2AE (336). Standard
deviation (SD) on the efficiencies calculated with the standard curve are evaluated from the
SD of the slope of the regression using a Taylor expansion to the first order for error
propagation: ∆AE= √ (AE x ln10 x ∆m)2, where ∆E is a SD of the efficiency, and ∆m is the SD
of the slope of the regression (337).

CHAPTER 2
58 Victoria Nisenblat
The original formula implemented in the efficiency‐calibrated model is: a relative fold change
= AE‐∆Cq target (sample – control) / AE‐∆Cq reference (sample – control) (334). A more flexible approach introduces
adjusted Cq values, in which the raw Cq values are adjusted for amplification efficiency to the
level they would be if they had been amplified at 100% efficiency (336‐337) as following:
adjusted Cq = Cq x log2(AE). Then standard ∆∆Ct method formulas can be applied by using the
standard formulas: relative expression = 2‐Cq (target ‐ reference), fold change = 2‐∆Cq sample (target ‐
reference) / 2‐∆Cq control (target – reference). Even though proper efficiency adjustments can often
improve the data quality, the standard ∆∆Ct method may be a method of choice for the
discovery stage of the experiment, allowing for quick assessment of large amount of targets.
2.2.4.6 StatisticalanalysisofRT‐PCRdata
Intra‐assay variation can be calculated for every single sample of every reaction if the real‐
time PCR experiments are performed in triplicate, with a pooled variance for all sets of PCR
triplicates representing statistical power. Inter‐assay variation should be quantified in cases
where comparisons are made of results from separate assay runs and can be performed using
data from either a internal control or standard sample that are included on all plates (338).
KOD and Grubbs’ test have been proposed as outlier exclusion methods and can be integrated
for data analysis (336). Several methods to overcome problems with missing values can be
applied: 1. discard unexpressed targets to avoid false results, 2. set undetermined values to a
maximum Cq (e.g. 40), 3. perform an imputation if the Cq value is totally absent (an imputation
is performed by using the values of the other biological replicates via selection of the median
as aggregation method between samples with the same experimental condition).
Not many publications deal with the statistical analysis of expression data generated by qRT‐
PCR. Common statistical methods include parametric tests, such as the Student’s t‐test or
ANOVA or non‐parametric tests, such as the Mann‐Whitney U‐test or the Kruskal‐Wallis test
(339‐341). The assumptions of normality of PCR data can be violated since the relative
expression values are derived from the ratios and not absolute values, or because the
experimental design of most PCR experiments is confined to a limited sample size. When
normality is not proven, using a non‐parametric test (not assuming normality) reduces the risk
of misinterpretation of the results. However, a non‐parametric test is less powerful than
parametric test when the data are normally distributed. Logarithmic transformation is
recommended for expression analyses, mainly because an accurate estimation of the
distribution of the Cq values might be challenging and this transformation gives the data a

CHAPTER 2
Victoria Nisenblat 59
“normal” distribution (339, 342). An alternative suggestion is to assess qRT‐PCR data in a linear
scale first, i.e. to convert Cq values to the relative expression values. This is because raw Cq
values are logarithmic in nature and therefore grossly underestimate the true degree of
variation that would be evident if the Cq values were converted into linear values (343). High
Cq values tend to exhibit higher variance (344), whereas the same change in Cq with increase
in Cq values means a different raw change in the number of initial copies represented and
therefore a different associated variance/error. Moreover, the error is not equal above and
below each bar on log‐ transformed qPCR data plotted on bar graphs due to this.
2.3 Guidelinesforpublicationoftheexpressionprofilingdata
Given the highly dynamic nature of miRNA transcription and the potential variables
introduced in sample handling and in the downstream processing steps, a standardized
approach to each step of the analysis workflow is critical for reliable and reproducible results.
This is assured via development of the universal set of guidelines to establish a solid
experimental approach.
The Microarray Quality Control (MAQC) consortium began in February 2005 as a Food and
Drug Administration (FDA) initiative with the goal of addressing various microarray reliability
concerns raised in publications. The first phase of this project (MAQC‐I) extensively focused
on the technical aspects of the profiling experiments with the microarray platforms (345),
while the second phase of the project (MAQC‐II) has focused on the multivariate gene
expression–based prediction models (297). MAQC does not include straightforward FDA
recommendation for regulatory submissions, but rather provides useful general guidelines for
planning, conducting and evaluation of high‐throughput experiments.
The Minimum Information for Publication of Quantitative Real‐Time PCR Experiments (MIQE)
provides a standardized approach to each step of the qRT‐PCR workflow towards generation
of the reliable and reproducible results, providing guidance for assessment and presentation
of PCR data (346‐347).
Finally, all miRNA‐profiling data has to be accessible to other researchers, particularly for
metaanalyses, in which combining of several experiments helps to increase power without
further costly experimental work. The data needs to be available to the reader in both raw
and normalized fashions; multiple experiments and multiple readings for the same probe must

CHAPTER 2
60 Victoria Nisenblat
be made available without averaging. This can be done by addition to public databases such
as Gene Expression Omnibus (GEO) and the use of supplemental data but is often done best
via peer‐to‐peer Internet sites (312).
2.4 Summarypoints
Several technical aspects and pre‐analytical differences in sample collection and
preparation may influence the outcome of miRNA profiling studies.
It is not clear which of the existent RNA purification techniques is technically superior;
miRNA extraction appears to be detection‐platform dependent.
High‐throughput assays are an initial discovery step in miRNA profiling. Several
platforms are available and there is no absolute consensus on the preferred method.
Simultaneous profiling of hundreds of targets introduces potential biases due to the
complex data manipulations and thus the data require validation.
qRT‐PCR is the method of choice to validate the results of high‐throughput analyses.
Application of an optimal normalization method has a significant impact on the
results of the profiling experiments. It remains unclear whether specific methods
uniformly outperform the others; selection of the optimal normalization method
should depend on the characteristics of the dataset. Normalisation based on global
measures of expression is more robust for high‐throughput datasets, whereas
endogenous controls are a method of choice for the low‐scale validation
experiments.
The optimal statistical treatment for qRT‐PCR includes precise data modelling,
integration of amplification efficiency and rational outlier exclusions.

CHAPTER 2
Victoria Nisenblat 61

CHAPTER 2
62 Victoria Nisenblat

CHAPTER 3
Victoria Nisenblat 63
MaterialsandMethods

CHAPTER 3
64 Victoria Nisenblat
1.1 Establishmentoftissuebank(bloodandendometrialtissuesamples)
3.1.1 Recruitmentofparticipants
First, we established a system to recruit patients and to collect blood and tissue samples in
order obtain material for the planned experiments. Overall, the experiments were of 2
designs: case–control and prospective cohort.
An initial case‐control study included healthy women and women with endometriosis who
had responded to an advertising poster. Women with endometriosis were identified from the
list of patients awaiting surgery for diagnosis and treatment of pelvic pain. For those who
agreed to participate in the study and satisfied the inclusion criteria, 3 appointments for blood
collection were planned based on the day of the last menstrual period. Of note, blood from
women with endometriosis was collected prior to surgery and samples were excluded if
endometriosis was not surgically confirmed.
The cohort study included all women scheduled for surgery for suspected endometriosis
based on clinical symptoms (pain, infertility or both). This was planned as a large‐scale study,
thus to optimise the process of recruitment we established a collaborative network with the
nursing and medical staff in 2 clinical settings: the Women’s and Children’s Hospital, Adelaide
SA, a tertiary university public hospital and the Burnside War Memorial Hospital, a private
practice of gynaecologic laparoscopist and endometriosis specialist Dr. Susan Evans. We
organised to meet with the staff in each of the above institutions to explain the project and to
decide on the most efficient method of patients’ recruitment that would not disturb the
clinical work flow. As a result of the collaborative agreement, we developed a system to
approach and to recruit the patients which was specific to each of the clinical settings.
An information flyer with a general outline of the project was designed for the patients
attending private practice. This flyer did not substitute the original information sheet and
consent form approved by the Human Research Ethics Committee.
Overall, we managed to create a tissue bank of blood and eutopic endometrial samples from
more than 100 participants. This comprised blood at 3 phases of the menstrual cycle from 12
controls and 15 women with suspected endometriosis, an endometrial biopsy from 11
controls and 17 participants with suspected endometriosis and paired plasma‐endometrial
biopsy from 68 participants with suspected endometriosis. Both serum and plasma were

CHAPTER 3
Victoria Nisenblat 65
separated from each blood sample; serum was used for hormonal measurements to assess
menstrual cycle stage, plasma was used for miRNA isolation. Each case of suspected
endometriosis was further verified by surgery and subsets were classified as endometriosis or
symptomatic controls. Staging of endometriosis was performed according to the rASRM
classification system (47, 348). All samples were well characterised; obtained data included
demographic parameters and general medical, gynaecological and family history.
Written informed consent was obtained for all participants. The study was approved by the
HREC of the Women’s and Children’s hospital and the Burnside War Memorial Hospital (REC
2121/11/11).
3.1.2 Samplecollectionandprocessing
Each sample in our tissue bank was processed and stored under similar conditions in
accordance with the appropriate well established protocols. After collection, the blood and
tissue samples were stored at 4°C, were not exposed to room temperature for more than one
hour and were processed within 8 hours post collection.
Peripheral blood (5‐10 ml) was collected by venipuncture from each participant into EDTA‐
containing tubes. All blood samples were kept at 4˚C and centrifuged within 4 hours at 1200 x
g for 10 minutes at 4˚C. Haemolytic samples, defined as pink‐stained supernatant after
centrifugation, were discarded. Thereafter a supernatant (plasma) was transferred into
RNase‐free eppendorf tubes in 0.5 ml aliquots and stored at ‐80°C until use. To eliminate any
remaining cells, plasma was centrifuged again at 1200 x g for 10 minutes at 4˚C after thawing,
immediately prior to RNA extraction. Each plasma aliquot was discarded after one freezing‐
thawing cycle.
Endometrial samples were collected under general anaesthesia prior to laparoscopy using a
Pipelle suction curette (Pipelle de Cornier, Laboratoire C.C.D, Paris, France). All biopsies were
immediately divided into 2 samples: 1. placed in RNA Later (Invitrogen, Carlsbad, CA) and
stored at ‐80⁰ C for later RNA extraction; 2. immersed in 4% neutral‐buffered Formalin for 24‐
72 hours, washed x3 in 75% Ethanol, placed in tissue cassettes and stored in 75% Ethanol up
to 2‐4 weeks until further processed and paraffin embedded. The samples were processed by
using Processor LEICA TP 1020 following the manufacturer’s protocol, which included
dehydration in 2 changes of 95% Ethanol and 3 changes of 100% Ethanol for 30 minutes each
and clearing with 3 consecutive baths of pre‐cooled Xylene for 30 minutes each. Then samples

CHAPTER 3
66 Victoria Nisenblat
were embedded in Paraffin at 56°C and cooled at 4°C overnight. Formalin fixed paraffin
embedded blocks were stored at room temperature in a standard block storage unit, and were
used for histological evaluation of the tissue. Sectioning was carried out with a microtome into
5 µm thick sections, and after a few seconds of flotation in 40°C bath, the stretched section
was picked up with a clean glass slide, dried at 65°C for 30 minutes and transferred to the
histopathology unit at the Women’s and Children’s Hospital for staining and evaluation.
3.2 OptimizationofRNAisolationfromplasma
At the time of project commencement, published studies on circulating miRNAs were very few
in numbers. Of these, each differed in the applied methodology. Moreover, the technical
details and the quality assurance process were presented vaguely. Considering that we were
one of the first to isolate miRNA from plasma, we put a substantial amount of work into the
development of reliable reproducible techniques.
We chose to base the extraction process on the manufacturers’ protocol for the Trisol LS
reagent (Invitrogen, Life Technologies, Paisley, UK), which is a modified version of Trisol
reagent, designed for liquid samples. For optimisation of the RNA isolation protocol, we
performed a series of experiments, using a pooled sample collected from healthy volunteers.
The factors assessed in the process of optimisation included: 1. determination of the optimal
plasma to Trisol ratio, 2. identifying the optimal dilution of the plasma prior to extraction, 3.
assessing the contribution of the small RNA carrier and 4. observations of the spike‐in
synthetic miRNAs as controls for extraction efficiency. Conventional spectrophotometric RNA
quantification with a Nanodrop is not suitable for plasma samples, therefore the efficiency of
the extraction process was validated by performance of qRT‐PCR. qRT‐PCR kinetics were
assessed in the extracted samples, with inter and intra‐experimental variability as well as
inter‐operator variability.
3.2.1 PlasmatoTrisolratio,plasmadilution,plasmavolume
Given that lipids and protein in plasma are known to inhibit the PCR reaction, we decided to
establish if a more diluted sample or a larger amount of denaturation solution (Trisol LS)
resulted in better performance of qRT‐PCR. We also determined the optimal starting volume
of plasma that resulted in a good miRNA yield and was practically feasible.
First, we performed RNA extraction using 3 different starting volumes of plasma: 500 µl, 250
µl and 125 µl with a similar amount of Trisol LS in each experiment, testing different plasma
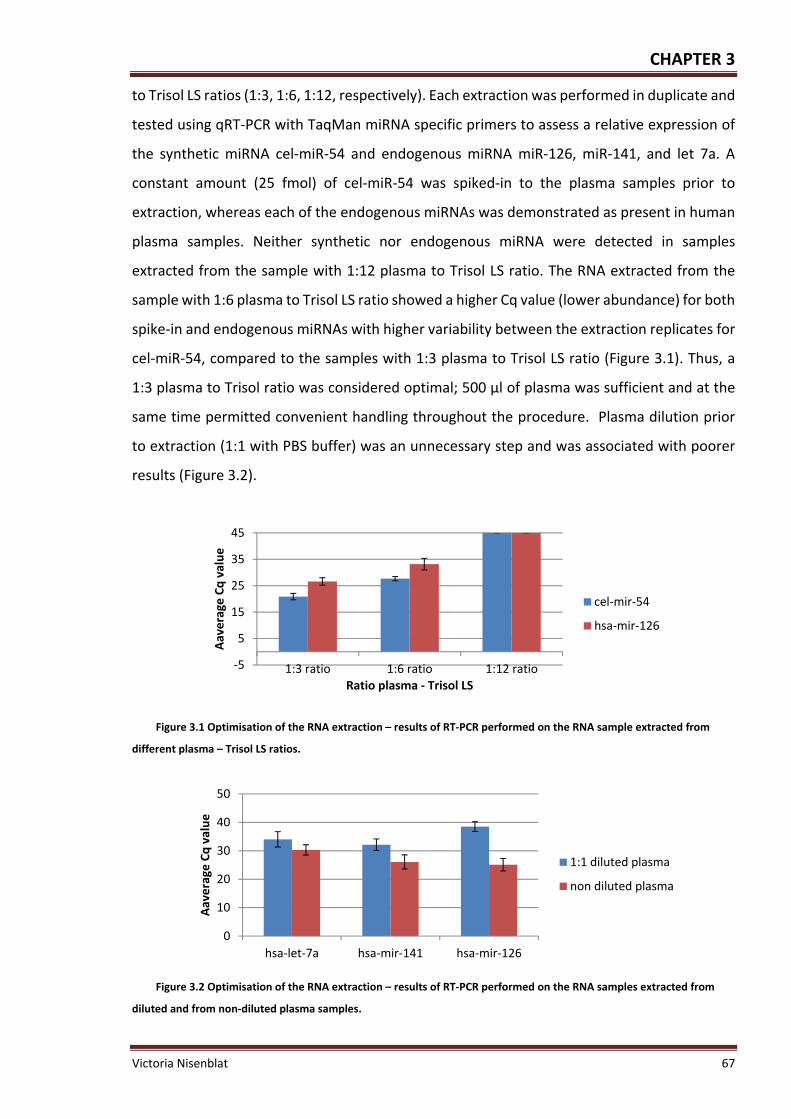
CHAPTER 3
Victoria Nisenblat 67
to Trisol LS ratios (1:3, 1:6, 1:12, respectively). Each extraction was performed in duplicate and
tested using qRT‐PCR with TaqMan miRNA specific primers to assess a relative expression of
the synthetic miRNA cel‐miR‐54 and endogenous miRNA miR‐126, miR‐141, and let 7a. A
constant amount (25 fmol) of cel‐miR‐54 was spiked‐in to the plasma samples prior to
extraction, whereas each of the endogenous miRNAs was demonstrated as present in human
plasma samples. Neither synthetic nor endogenous miRNA were detected in samples
extracted from the sample with 1:12 plasma to Trisol LS ratio. The RNA extracted from the
sample with 1:6 plasma to Trisol LS ratio showed a higher Cq value (lower abundance) for both
spike‐in and endogenous miRNAs with higher variability between the extraction replicates for
cel‐miR‐54, compared to the samples with 1:3 plasma to Trisol LS ratio (Figure 3.1). Thus, a
1:3 plasma to Trisol ratio was considered optimal; 500 µl of plasma was sufficient and at the
same time permitted convenient handling throughout the procedure. Plasma dilution prior
to extraction (1:1 with PBS buffer) was an unnecessary step and was associated with poorer
results (Figure 3.2).
Figure 3.1 Optimisation of the RNA extraction – results of RT‐PCR performed on the RNA sample extracted from
different plasma – Trisol LS ratios.
Figure 3.2 Optimisation of the RNA extraction – results of RT‐PCR performed on the RNA samples extracted from
diluted and from non‐diluted plasma samples.
‐5
5
15
25
35
45
1:3 ratio 1:6 ratio 1:12 ratio
Aaverage
Cq value
Ratio plasma ‐ Trisol LS
cel‐mir‐54
hsa‐mir‐126
0
10
20
30
40
50
hsa‐let‐7a hsa‐mir‐141 hsa‐mir‐126
Aaverage
Cq value
1:1 diluted plasma
non diluted plasma

CHAPTER 3
68 Victoria Nisenblat
3.2.2 Spike‐insyntheticmiRNAs
Mitchell et al. (2008), introduced concept of spike‐ing for qRT‐PCR normalisation, suggesting
a combination of 3 synthetic miRNAs from the C. Elegans species (cel‐miR‐39, cel‐miR‐54, and
cel‐miR‐238) as a mixture of 25 fmol each in a 5 µl total volume of water (248). Determination
of a normalized Cq value for the spiked‐in miRNA, termed median‐normalised Cq, was
validated using the formula: Median‐normalised Cq = Raw Cq value ‐ [(spike‐in average Cq
value of the given sample) ‐ (median spike‐in Cq value)].
We assessed the use of the abovementioned spiked‐in synthetic miRNAs as a putative internal
control. Three synthetic miRNAs from C. Elegans (cel‐miR‐54, cel‐miR‐39 and cel‐miR‐238)
were added to the plasma prior to RNA extraction in different quantities ranging from 6.25 to
50 fmol. This set of experiments aimed to determine the optimal amount of the spiked‐in
templates for our samples as well as to demonstrate that the technique was sensitive enough
to correlate the Cq values with a changing amount of template in the sample. The Cq values
for each of the miRNAs were within detectable range, showing a linear relationship with a
strong correlation between the input amount and PCR measurements (Figure 3.3).
Figure 3.3 Correlation between the input amount of spike‐in synthetic miRNAs and PCR results.
Even though we did not observe a direct relationship between the relative amount of input
template and the recovery of the synthetic miRNAs measured as Cq values, (e.g. 8 times
difference between the lowest and the highest spike‐in amount corresponded to 4‐5.7 post
extraction difference or 2‐2.5 Cq values), a clear difference between lower and higher amount
of spiked‐in templates was evident. The lack of an absolute correlation between input amount
and Cq values could be explained either by partial loss of the input material during the
extraction process or by a certain degradation level of the synthetic templates by endogenous
RNases. Thus, we accepted that the spiked‐in amount of 25 fmol, as suggested by others,
resulted in reasonable Cq values and was included in the extraction protocol.

CHAPTER 3
Victoria Nisenblat 69
Considering the similarity in expression levels of the 3 synthetic miRNAs, we assessed the
necessity of using all 3 vs. 1 selected template. The rationale behind this experiment was to
try to reduce the number of spiked‐in controls, and thus the subsequent RT‐PCR reactions for
their detection, making the quality control process less labour intensive. Overall, all the 3
spike‐in synthetic miRNAs (cel‐miR‐39, cel‐miR‐54 and cel‐miR‐238) exhibited very similar
patterns of expression across the samples, and any substantial sample‐to‐sample variability
was reflected by very concordant Cq values for each of the 3 miRNAs (Figure 3.4).
Figure 3.4 Relative measures of the 3 spiked‐in synthetic templates across various samples.
The median‐normalised Cq of endogenous miRNA, has‐miR‐16, showed similar values when
normalised to each of the spike‐in miRNAs or to their average, suggesting that each one of the
synthetic templates performs similarly to the average of all 3 and can serve as an independent
normaliser (Figure 3.5). We spiked‐in one synthetic template, cel‐miR‐54 in the amount of 25
fmol in all experimental protocols.
Figure 3.5 Raw and median‐normalised Cq values of endogenous miRNA (hsa‐miR‐16) recovered from plasma.
Normalisation was performed to the geometric average of the 3 miRNAs (as suggested by Mitchell) or separately to each
spiked in miRNA.
Given the limited options to assess the quality of our samples, we used spike‐ins as an
important tool for assessing RNA extraction quality. The levels of cel‐miR‐54 were measured
in each RNA sample and a SD was calculated for each PCR plate. Samples in which cel‐miR‐54
variance was above 2SD were considered as poorly recovered. RNA from these samples was
then re‐extracted from a fresh plasma aliquot. We also used spiked‐in cel‐miR‐54 as a
20
22
24
26
28
1--1 1--2 1--3 2--1 2--2 2--3
Cq
val
ue
sample ID
cel-mir 238
cel-mir 54
cel-mir 39

CHAPTER 3
70 Victoria Nisenblat
reference to normalise the data across the samples in qRT‐PCR experiments included in
Chapter 4, as previously demonstrated by others (225, 248, 252, 258, 349). However, as we
gained more experience, we ultimately decided not to use the normalisation method based
on spike‐in miRNAs in the next set of experiments. This decision was based on the fact that,
unlike endogenous controls, a spiked‐in template could not fully account for the technical
variability associated with PCR performance, other than the extraction process. This for
example includes lipids and proteins, which escaped denaturation and are known to inhibit
the PCR reaction, as well as any difference in plasma input resulting from the pipetting errors.
Our further experiments included endogenous controls that were specific to the experimental
dataset. The putative endogenous controls were selected in the array experiment with the
GeNorm algorithm and validated by qRT‐PCR as stable, abundantly expressed miRNAs, as
described in Chapter 7 and suggested in the recent methodological papers in the field (298,
304).
3.2.3 Inter‐andintra‐assayvariabilityanduseofcarrierforsmallRNA
To test the reproducibility of the extraction method, we quantified the synthetic spike‐in
miRNA, cel‐miR‐54 and 2 endogenous miRNAs (has‐miR‐16 and has‐miR‐126) in RNA samples
extracted on the different days in three replicates each from the same pooled sample. MiR‐
16 was suggested by previous studies to be a stable endogenous control that is abundant and
consistent across the plasma samples (252), whereas miR‐126 has been previously detected
in plasma in various concentrations (245, 248). Initially, the variation in miRNA quantification
between separate RNA isolations, as measured by the Cq values of spike‐in miRNAs, was lower
for the extractions performed on the same day, but was substantially higher between different
days of extraction, whereas endogenous miRNAs had more substantial inter and intra‐assay
variability (Table 3‐1). The addition of RNase‐free small RNA carrier prior to the precipitation
stage of extraction, improved RNA yield and reduced variability, similar to the reports of
others (252, 269). The intra‐experimental variability was reduced for both synthetic and
endogenous miRNAs after plasma and Trisol LS were mixed by vortexing rather than by
pipetting (data not shown). We implemented several steps to reduce intra‐and inter‐
experimental variability, which included vortexing of samples after the addition of Trisol LS
reagent and the addition of a small RNA carrier.

CHAPTER 3
Victoria Nisenblat 71
Table 3‐1 Measures of inter and intra‐experimental variability of miRNA extraction by the modified Trisol LS method
used in our experiments1
cel‐miR‐54 hsa‐miR‐126 hsa‐miR‐16
‐ small RNA carrier
+ small RNA carrier
‐ small RNA carrier
+ small RNA carrier
‐ small RNA carrier
+ small RNA carrier
Average Cq values 29.4 24.6 30.4 27.3 29.2 28.1Intra‐experimental variability
2.5 Cq 1.9 Cq 6.3 Cq 3.1 Cq 3.6 Cq 1.6 Cq
Inter‐experimental variability
2.1 Cq 0.7 Cq 3.9 Cq 2.5 Cq 4.5 Cq 2.2 Cq
1 The variability was assessed across the extraction replicates from the same pooled sample and measured by
Cq values of one synthetic spike‐in miRNA and 2 endogenous human miRNAs.
3.2.4 Intra‐operatorvariability
We assessed the performance of the technique performed by 2 different operators. One
operator was experienced in miRNA extraction from plasma samples (VN), whereas the
second operator was familiar with the RNA extraction from tissues, but was extracting miRNAs
from plasma for the first time. Three plasma samples were extracted in parallel by each
investigator; extraction efficiency and yield was assessed by measuring cel‐miR‐54 in RT‐PCR
as well as by 2100 Bioanalyzer chip for small RNAs. Overall, the variability measured by qRT‐
PCR did not exceed 1 Cq. The Bioanalyzer readings differed more substantially, particularly in
samples with very low and very high miRNA abundance, but in general were consistent
between the operators (Figure 3.6). This suggested that the technique is reproducible and the
inter‐operator variability did not exceed the intra‐experimental variability of the extraction
performed in the same hands. Despite this, all the RNA samples analysed in the current work
were extracted by the same operator (VN).
Figure 3.6 Assessment of the intra‐operator variability of plasma RNA extraction. The plasma samples from 3
individuals were extracted by 2 operators (VN and ZW). The extraction quality and miRNA yield were assessed by
measuring expression levels of cel‐miR‐54 with qRT‐PCR (Cq values presented as bar charts) and by 2100 Agilent
Bioanalyzer, chip for small RNAs. The concentration assessed with Bioanalyzer is presented as numbers above each
corresponding bar.
17.5
18
18.5
19
19.5
20
sample 1 sample 2 sample 3
Aaverage
Cq values
Operator 1 VN
Operator 2 ZW
162.1pg/ul
54.7pg/ul
545.6pg/ul
508 pg/ul
2331.4pg/ul
1164.3pg/ul

CHAPTER 3
72 Victoria Nisenblat
3.2.5 AssessmentofmiRNAqualityandquantity
In our hands, the spectrophotometric RNA quantification was not successful for plasma
samples, presumably due to the low yield of recovered RNA that is below the limit of accurate
quantification. We observed unusual spectra on Nanodrop, including very low 260/280 ratios,
low 260/230 ratios and a very noticeable peak at 270nm were probably due to phenol
contamination. However, testing with the TaqMan qRT‐PCR indicated the presence of RNA
and demonstrated that miRNA was of sufficient quantity and quality for quantification by qRT‐
PCR. A dilution of the sample (1:1 dilution of the input RNA and 1:10 dilution of the cDNA) was
found to substantially minimise the effect of inhibitors on the reaction.
The quantities of miRNAs in the samples were assessed using Agilent 2100 Bioanalyzer (Agilent
Technologies, Germany) chips for small RNAs. The miRNA across the plasma samples that
were included in the further experiments accounted for 55%‐92% of total small RNAs. The
estimated median miRNA extracted with our modified Trisol LS protocol from 0.5 ml of plasma
was 346.3 pg/µl, with values ranging from 154‐796 pg/μl. This is equivalent to 7 – 16 ng per 1
ml of plasma and is consistent with the reports of others (245). RIN was not calculated with
the Bioanalyzer due to low RNA concentration in plasma. For the same reason we did not
perform RNA fractioning on agarose gels for RNA quality assessment.
We assessed RT‐PCR kinetics as a sample quality measure, by using TaqMan miRNA assays.
The RT reaction for both assays had reasonable efficiency and a dynamic range of 112%,
detecting across 6 log10 dilution for cel‐miR‐54 and 110% with 5 log10 dilution for has‐miR‐
126, respectively (Figure 3.7A).
Plotting of miR‐126 Cq values normalized to cel‐miR‐54 (∆Cq) suggested that the accuracy of
RT reaction was compromised with very high and very low RNA concentrations. Higher
precision was demonstrated for cel‐miR‐54 with SD of PCR replicates = 0.7 R2 = 0.99 compared
to miR‐126, with SD = 1.1 and R2 = 0.74 (Figure 3.7B).
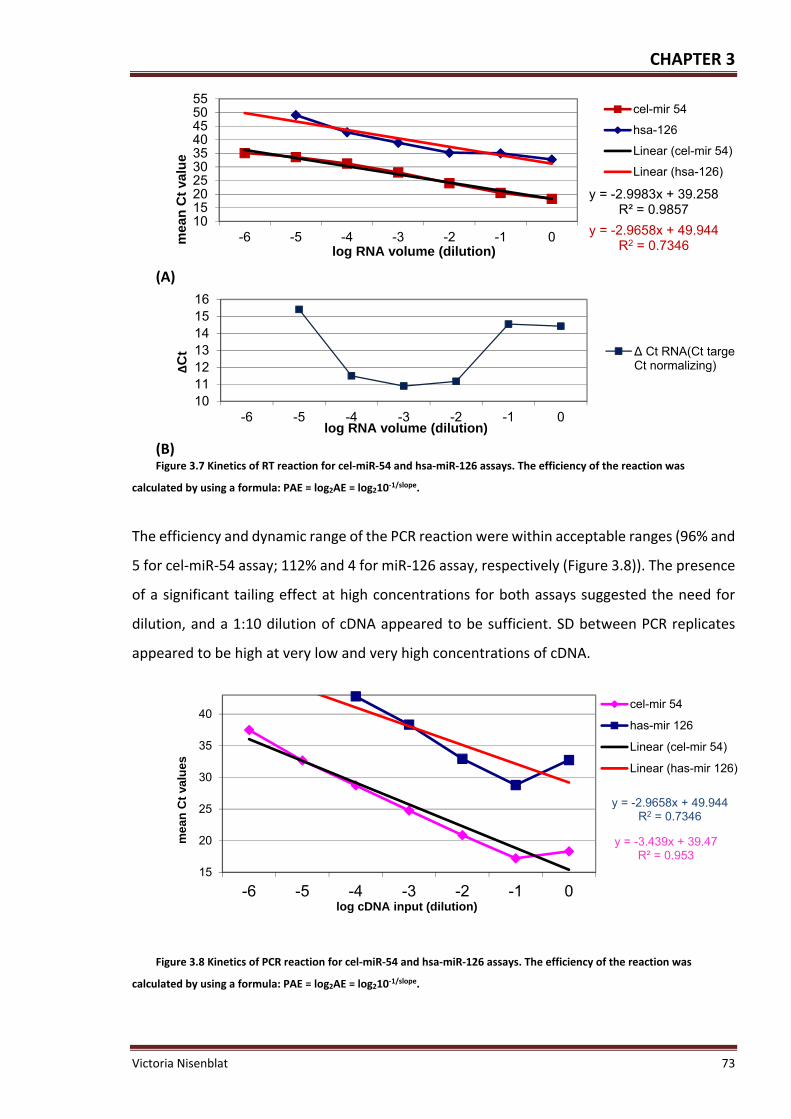
CHAPTER 3
Victoria Nisenblat 73
(A)
(B) Figure 3.7 Kinetics of RT reaction for cel‐miR‐54 and hsa‐miR‐126 assays. The efficiency of the reaction was
calculated by using a formula: PAE = log2AE = log210‐1/slope.
The efficiency and dynamic range of the PCR reaction were within acceptable ranges (96% and
5 for cel‐miR‐54 assay; 112% and 4 for miR‐126 assay, respectively (Figure 3.8)). The presence
of a significant tailing effect at high concentrations for both assays suggested the need for
dilution, and a 1:10 dilution of cDNA appeared to be sufficient. SD between PCR replicates
appeared to be high at very low and very high concentrations of cDNA.
Figure 3.8 Kinetics of PCR reaction for cel‐miR‐54 and hsa‐miR‐126 assays. The efficiency of the reaction was
calculated by using a formula: PAE = log2AE = log210‐1/slope.
y = -2.9983x + 39.258R² = 0.9857
y = -2.9658x + 49.944R2 = 0.7346
10152025303540455055
-6 -5 -4 -3 -2 -1 0mea
n C
t va
lue
log RNA volume (dilution)
cel-mir 54
hsa-126
Linear (cel-mir 54)
Linear (hsa-126)
10111213141516
-6 -5 -4 -3 -2 -1 0
∆C
t
log RNA volume (dilution)
∆ Ct RNA(Ct targetCt normalizing)
y = -3.439x + 39.47R² = 0.953
y = -2.9658x + 49.944R2 = 0.7346
15
20
25
30
35
40
-6 -5 -4 -3 -2 -1 0
mea
n C
t va
lues
log cDNA input (dilution)
cel-mir 54
has-mir 126
Linear (cel-mir 54)
Linear (has-mir 126)

CHAPTER 3
74 Victoria Nisenblat
3.3 TheprotocolofRNAisolationfromplasma,establishedinourlaboratory
Total RNA was extracted from 0.5 ml of plasma using the Trisol LS reagent for liquid samples
(Invitrogen, Carlsbad, CA) following the manufacturer’s protocol with slight modifications as
following:
1. Plasma was thawed on ice and Trisol LS reagent is added to plasma samples in
volumetric ratios 1:3, the samples are mixed by vortex.
2. Then 25 fmol (5 µl of 5 nM stock solution) of synthetic C. Elegans miRNA cel‐miR‐54
was added to plasma samples (after addition of Trisol to avoid degradation by
endogenous RNases).
3. After 5 min of incubation at room temperature, aqueous and organic phase separation
was achieved by addition of molecular grade chloroform (400 µl per 1.5 µl of Trisol LS)
followed by 15 seconds (sec) of shaking and 10 min of incubation at 4˚C.
4. The samples were then centrifuged at 12000 x g for 15 minutes at 4˚C, the upper
aqueous phase was carefully transferred into a fresh tube and incubated for 10
minutes at room temperature with 2 volumes of isopropyl alcohol (Isopropanol, Sigma
Aldridge) and with 75 µg of RNase‐free carrier of small RNAs, glycoBlue (Invitrogen) to
allow the RNA precipitation.
5. The mixture was then centrifuged at 12000 x g for 10 minutes at 4˚C, the supernatant
was removed, while the pellet is washed with 4 volumes of 75% Ethanol by vortexing
and centrifugation (7500 x g, 5 minutes, 4˚C).
6. Finally, the supernatant was discarded, and the RNA pellet is dried for 5‐10 minutes at
room temperature, dissolved in 10 μl of DEPC‐treated water and stored at ‐80˚C.
Each plasma sample was extracted in duplicate, one replicate with and one replicate without
the spike‐in of a synthetic template.
The expression of spike‐in cel‐miR‐54 was measured in triplicates by using qRT‐PCR in 96 well
plates, to control for the extraction efficiency and to identify PCR inhibitors in RNA samples.
The expression levels of all samples were compared to the average expression of the plate.
Samples with Cq values of > 2SD from the mean Cq of the plate were excluded and re‐
extracted. The yield of miRNA fraction was analysed in the second extraction replicate free of
spike‐in miRNAs by using Agilent 2100 Bioanalyzer (Agilent Technologies, Germany) chips for
small RNAs.

CHAPTER 3
Victoria Nisenblat 75
3.4 MiRNAextractionfromendometrialtissue
3.4.1 MiRNAextraction
Total RNA was extracted from 100 mg of frozen whole‐tissue endometrial specimens
homogenized in Trisol solution (Invitrogen Carlsbad, California) and subjected to DNase
treatment according to the manufacturer’s instructions. Briefly, endometrial tissue was
thawed on ice, Trisol LS reagent was added to tissue samples in ratios 1 ml per 100 mg of
tissue and homogenised with Ultra Turrax T8 Homogeniser. Trisol‐homogenised samples were
incubated for 5 minutes at room temperature and centrifuged at 12000 x g (13,000 rpm) for
10 minutes at 4°C. Supernatant containing RNA was transferred to a fresh 2 ml eppendorf
tube, incubated at room temperature for 5 minutes to allow for dissociation of nucleoprotein
complexes and vortexed. Aqueous and organic phase separation was achieved by addition of
molecular grade chloroform (200 μl per 1.0 ml of Trisol LS) followed by 15 seconds of shaking
and 3 minutes of incubation at room temperature. Then samples were centrifuged at 12 000
g for 15 minutes at 4°C, aqueous phase was transferred to a fresh 2 ml eppendorf tube and
incubated for 10 minutes at room temperature with isopropyl alcohol (Isopropanol, Sigma
Aldridge) (1 ml per 1 ml Trisol), mixed with a pipette and incubated for 10 min at room
temperature to allow the RNA precipitation. The mixture was then centrifuged at 12000 x g
for 10 minutes at 4˚C, the supernatant was removed, while the pellet was washed with 75%
of ice cold Ethanol (1 ml per 1 ml Trisol) by vortexing and centrifugation (7500 x g, 5 minutes,
4˚C) to re‐pellet RNA. Finally, the supernatant was discarded, and the RNA pellet was dried for
1‐5 minutes at room temperature, dissolved in 50 μl of DEPC‐treated water and incubated for
10 minutes on ice, followed by incubation at 55‐60°C for 10‐15 minutes with repeated
pipetting to completely redissolve the RNA containing pellet. For the removal of
contaminating DNA from RNA samples, DNase treatment was performed by using Ambion
DNA‐free™ kit (Invitrogen, Carlsbad, CA). 5 µg of RNA sample was diluted in 20 µl DEPC‐treated
H2O and incubated with 2 µl of 10 x DNase 1 buffer (or 0.1 x volume of RNA) and 1 µl of
rDNase1 for 25 ‐30 minutes at 37°C. DNase inactivation reagent was resuspended by vortexing
and gentle shaking and 5l (or 0.1 volume, whichever is greatest) was added to RNA solution.
The mixture was incubated at room temperature for 2 minutes by occasionally mixing the
contents of the tube 2‐3 times to redisperse DNase inactivation reagent and then centrifuged
at 10 000 x g for 1.5 minutes at room temperature to pellet DNase inactivation reagent. The

CHAPTER 3
76 Victoria Nisenblat
supernatant containing total RNA was transferred to a fresh 1.5 ml Eppendorf tube. The RNA
samples were stored at ‐ 80°C until use.
3.4.2 MiRNAquantificationandqualitycontrol
RNA concentration and purity was assessed using a Nanodrop spectrophotometer, ND‐1000
(Thermo Fisher Scientific Inc., Waltham, MA, USA), by using 1 µl of RNA. Contamination from
protein was assessed by ratio for sample absorbance at 260/280 (A260/A280), accepting
A260/2A80 ratio of 2.0; contamination from organic compounds was assessed by ratio
A260/A230, a ratio of 2.0 ‐ 2.2 was consistent with the highest purity.
RNA integrity was assessed by using agarose gel electrophoresis, which uses the resolution of
distinct 28s and 18s RNA bands to indicate the quality of the RNA. Briefly, 1% agarose gel was
made by mixing of 0.6 gram agarose in 60 ml of 1 x TAE (Tris‐acetate‐EDTA) buffer (TAE is
prepared from the mixture of 40 mM Tris‐base, 1mM EDTA and 1.142 nl glacial acid).
Agarose/TAE solution was heated for 1 min to dissolve agarose and cooled for 10 minutes.
The 2 µl of 10mg/ml ethidium bromide (Sigma‐Aldrich) was mixed into the solution. Gel was
poured into a gel cassette, cooled for 10 minutes and placed into the gel tank covered with 1
x TAE buffer. Then 500 ng of RNA , diluted in 10 µl of DEPC water, was mixed with 2 µl of 6x
gel loading buffer (the buffer is prepared by mixing of 30% glycerol [3ml 100% Glycerol] with
0.25% Bromophenol blue [25mg Bromophenol blue] and 10 ml of DEPC water). The RNA–
loading buffer samples were loaded into gel, run at 80V for 40 minutes and read by using UV
transilluminator. RNA quality was additionally assessed by using the 2100 Bioanalyzer (Agilent
Technologies, Foster City, CA, USA), accepting RNA integrity number (RIN) > 7 as high quality
RNA, RIN 4‐7 as average quality and RIN < 4 as low quality RNA.
3.5 MiRNAprofilinginplasma
The expression levels of circulating miRNAs were assessed by using 2 techniques: miRNA
arrays and individual qRT‐PCR assays. For miRNA expression screening in plasma we use
TaqMan Low Density Human miRNA arrays (TLDA) v2.0 (Applied Biosystems, Foster City, CA,
USA). The TLDA platform has been selected because it requires smaller amounts of RNA, less
than 1 ng per experiment, which is about ~20 times less than what is required for other
microarray hybridization platforms. TLDA consists of 2 pre‐configured 384‐well micro fluidic
card sets (card A and card B) that permit screening of 674 human miRNAs which are mapped
using miRNAs Sanger MiRBase v14.0 entry names. The names of the miRNAs of interest

CHAPTER 3
Victoria Nisenblat 77
presented in the results section of Chapter 4 and Chapter 6 were manually updated to the
MiRBase v.18.0. Each array includes 1 negative control (ath‐miR159a), unrelated to any
mammalian species. Array card A contains generally highly characterized miRNAs, while card
B contains many of the more recently discovered miRNAs. The majority of the targets on each
array card are presented in single replicates, with the exception of the endogenous controls
suggested by the manufacturer that are presented in several (2–4) technical replicates.
Expression profile of miRNAs, selected on the basis of the miRNA array panel, was validated
by qRT–PCR using single TaqMan miRNA assay kits (Applied Biosystems, Foster city, CA, USA).
In contrast to RNA extracted from tissue, only minute quantity of RNA are able to be extracted
e from plasma and can not be measured reliably by UV‐absorbance and the small chip
Bioanalyzer. Therefore, the only available estimate of quantity in plasma miRNA work is
volume. In our experiment fixed volumes rather than fixed amounts of RNA were used for the
initial RT reaction in both array and individual qRT‐PCR assays. The upload of the same volume
into the RT reaction means that the RNA in the samples cannot be accurately quantified;
however, this is considered a reasonable approach in the literature as all samples are handled
in the same way (252, 262). We acknowledge that in order to develop a miRNA‐based
diagnostic blood test, better measures of quality and quantity for miRNAs retrieved from
blood samples require development.
3.5.1 TaqManLowdensityHumanmiRNART‐PCRarrays
3.5.1.1 Procedure
All reagents were manufactured and supplied by Applied Biosystems, Foster City, CA, USA.
CDNA was made by using Megaplex primer pools A and B followed by pre‐amplification and
PCR amplification steps. TaqMan Megaplex™ RT Primers are predefined pools of up to 381
primers for the one‐tube megaplex reverse transcription of mature miRNA forms, which are
complemented by the respective Megaplex TaqMan PCR probes. Preamplification of cDNA
was undertaken using Megaplex™ PreAmp Primer pools consisting of forward primers specific
for each of the miRNAs and a universal reverse primer. This step is recommended by the
manufacturer both to generate enough miRNA cDNA template for the following PCR and to
increase the sensitivity of the TaqMan miRNA profiling in samples with minute amounts of
RNA. An initial RNA volume input of 3 µl per array was used. The total RNA plasma extract was
reverse transcribed using the primers pool and reverse transcription kit in 7.5 µl containing 3
µl of RNA extract, 0.8 µl of sequence of Megaplex RT primers, 0.2 µl of 100 mM dNTPs, 1.5 µl

CHAPTER 3
78 Victoria Nisenblat
of Multiscribe Reverse Transcriptase (50 U µl ‐1), 0.8 µl of 10 x reverse transcription buffer,
0.9 µl of MgCl2, 0.1 µl of RNase inhibitor (20 U µl ‐1) and 0.2 µl of nuclease‐free water. For
cDNA synthesis the reaction mixtures were incubated for 40 cycles at 16°C for 2 minutes, at
42°C for 1 minute, at 50°C for 1 second, followed by incubation at 85°C for 5 minutes and then
held at 4°C. Pre‐amplification was performed in 25 µl reactions, including 2.5 µl of RT product
(cDNA), 12.5 µl of pre‐amplification master mix, 2.5 µl of Megaplex pre‐amplification primers
and 7.5 µl of nuclease‐free water. The reaction mixes were incubated at 95°C for 10 minutes,
at 55°C for 2 minutes, at 72°C for 2 minutes, followed by 12 cycles of 95°C for 12 seconds and
60°C for 4 minutes, then incubated at 99.9°C for 10 minutes and held at 4°C. The pre‐amplified
cDNA was diluted with 75 µl of nuclease‐free water and stored at ‐20°C. The pre‐amplified RT
products were subsequently amplified with Megaplex human pool PCR primers; 9 µl of RT
products were added to 441 µl nuclease free water and mixed with 450 µl TaqMan Universal
Master Mix, no AmpErase UNG, then dispensed into the 384 wells by centrifugation and
amplified using an ABI 7900HT Thermal Cycler (Cycling conditions: 95°C for 10 minutes,
followed by 55 cycles of 95°C for 15 seconds and 60°C for 1 minute).
3.5.1.2 Qualitycontrolanddownstreamanalysis
The results were reported as the Cq values, corresponding to the number of cycles required
for FAM fluorescent signal to cross the threshold in RT‐PCR. Raw Cq values were obtained
using SDS v.2.3 and RQ Manager v.1.2 software (automatic baseline, threshold = 0.1). Cq
values > 32 were considered to be below the detection limit and only miRNAs that showed a
Cq ≤ 32 were considered as expressed. This threshold was set according to the manufacturer’s
recommendations for the TaqMan array analysis, suggesting that Cq values > 32 in multiplex
reactions indicate target sequences of negligible abundance which cannot be precisely or
reliably measured. All detectors with Cq > 32, or that failed amplification (marked as
“Undetected” or “NA”), were assigned a value of 33. For the targets presented in more than 1
technical replicate, the Cq values were averaged if the replicates had SD < 0.5 across all
samples. The technical replicates with SD ≥ 0.5 were removed from the analyses if there were
more than 2 replicates, or analysed separately in case of duplicates.
In an attempt to identify the outliers amongst the biological replicates, visual inspection of the
raw data per array plate was performed. We were cautious regarding the exclusion of the
biological replicates and performed the separate analyses with and without exclusion of the
poor performing “low abundance” plates. To assess the main source of variation in the

CHAPTER 3
Victoria Nisenblat 79
experiment, we applied unsupervised hierarchical clustering presented as a heat map. In order
to evaluate if the data handling prior to analysis altered the conclusions, we performed
separate analyses, including a broader range of the data by setting a detection limit cut‐off at
Cq > 35 and by including the “low call” detectors, i.e. the detectors present at least in 1 sample.
3.5.1.3 Identificationofthe“lowcall”detectors
In the study presented in Chapter 4, detectors not expressed in above 50% of samples in each
subgroup for each card were considered as “low call” detectors and were removed from
further consideration. In the study presented in Chapter 7, any detectors expressed in less
than 70% of samples in each subgroup for each card were considered “low call” detectors and
were removed (see below in section entitled “Differences in analytical approach to TLDA data
between 2 sets of experiments (Chapter 4 and Chapter 7)”).
3.5.1.4 Identificationofnormalizingmethod
As no consensus on normalisation has been defined for high throughput miRNA array
experiments and given that different ways of normalising data can potentially influence the
results, we investigated several normalisation approaches incorporated in qPCRNorm package
from the Bioconductor: 1. quantile normalisation, 2. rank invariant normalisation and 3.
normalisation by the reference (house‐keeping) miRNAs detected with the GeNorm algorithm
(305). We compared the normalisation methods by using approaches presented in Table 3‐2.
For the GeNorm‐based method, we evaluated the putative reference miRNAs amongst
miRNAs that were readily expressed and present in all samples using GeNorm algorithm,
separately for each array card (A and B). In the GeNorm program, an average expression
stability value M was calculated for all candidate genes and those genes with the lowest M
values were considered to be the most stable. The optimal number of endogenous controls
required for accurate normalization was obtained by calculating the pair‐wise variation values
(V(n/n+1)) between each combination of sequential normalization factors, using the
suggested cut‐off value of 0.15, below which the inclusion of any additional controls does not
result in a significant improvement of the precision (305).
Relative expression was calculated by the equation 2‐quantile normalised Cq. FC was
calculated by ∆∆Ct with the formula FC = 2–(quantile normalised Cq in endometriosis – quantile normalised Cq in
controls). The FC represents the least FC, given all Cq values above 32 were not precisely

CHAPTER 3
80 Victoria Nisenblat
quantified, and thus the actual magnitude of the differential expression was under‐estimated.
The normalised data was analysed using the LIMMA.
Table 3‐2 Measures to identify the more suitable normalisation approach; assessment a degree of variability of the
raw and normalised data
Comparison measures Description
Boxplot Presents a degree of dispersion and skewness in the data, via presenting a sample minimal and maximal observations, median as well as lower and upper quartile
Histogram Represents the density of data, by plotting tabular frequencies vs. signal intensities (Ct values)
Coefficient of variation (CV) Is defined as a ration of the SD to the mean, generally used to compare the dispersion in the data between two datasets
Visual pair wise comparisons between the normalisation algorithms
The log2‐ratio of variances of 2 normalisation algorithms Q1 and Q2 obtained for each target Y = log2 [Q1‐normalized: Q2‐normalized] is plotted on the y‐axis against its expression (mean Ct value) on the x‐axis. The regions where the data points fall in the graph give us an indication of which normalization algorithm produces noisier data and whether there is a differential bias in expression for genes most affected by this noise (301).
3.5.1.5 DifferencesinanalyticalapproachtoTLDAdatabetween2sets
ofexperiments(Chapter4andChapter7)
The array experiment on the same set of samples was used as a basic screening tool in 2
included studies (Chapter 4 and Chapter 7). Considering different aims in each of these
studies, we undertook different approaches to the experimental array data analyses. The
study presented in Chapter 4 was a basic research study that aimed to characterise a miRNA
profile in women with and without endometriosis across the different stages of the menstrual
cycle. Therefore, miRNAs that were present in above 50% of the samples were selected for
the analysis and analysis was performed separately at each menstrual cycle stage. The study
presented in Chapter 7 aimed to identify diagnostic markers for endometriosis. Several
modifications to the data analysis were performed to select a broad range of the putative
biomarkers suitable for further validation. Firstly, any detectors expressed in less than 70% of
samples in each subgroup for each card were considered “low call” detectors and were

CHAPTER 3
Victoria Nisenblat 81
removed. We undertook this approach assuming that a reliable biomarker should be
expressed in the majority of the samples. Secondly, we increased the power of the analysis by
combining all 3 time points of the cycle and compared all endometriosis to all control samples
unrelated to the cycle stage. This analysis was only able to be performed because we did not
demonstrate any significant differences in miRNA expression across the menstrual cycle
(Chapter 4).
3.5.2 SingleplexqRT–PCR
3.5.2.1 Procedure
The expression profile of miRNAs of interest, selected on the basis of the miRNA array panel,
was validated by qRT–PCR using single TaqMan miRNA assay kits (Applied Biosystems, Foster
city, CA, USA) according to the manufacturer’s instructions. Briefly, RNA samples were reverse
transcribed using assay‐specific primers and a reverse transcription kit in 7.5 μl containing 2.5
μl of RNA extract, 0.15 μl of 100 mM dNTPs, 1 μl of Multiscribe Reverse Transcriptase (50 U μl
‐1), 1.5 μl of 10 x reverse transcription buffer, 0.19 μl of RNase inhibitor (20 U μl ‐1), 3 μl of
sequence‐specific miRNA primers and 4.16 μl of nuclease‐free water. For synthesis of cDNA
the reaction mixtures were then incubated for 40 cycles at 16°C for 2 minutes, at 42°C for 1
minute, at 50°C for 1 second, followed by incubation at 85°C for 5 minutes and then held at
4°C. PCR amplification was carried out by using miRNA‐specific primers in a final volume of 10
μl, containing 0.665 μl of the cDNA, 0.5 μl of primer, 5 μl of Master Mix with no AmpErase
UNG and 3.8 μl of nuclease‐free water. Three RT replicates per sample were used for
amplification on an ABI 7900HT Thermal Cycler under the cycling conditions that similar to the
TLDA experiments. No Reverse Transcriptase (NRT) and NTC controls were run simultaneously
in duplicates.
3.5.2.2 AnalysisofthedataobtainedinthesingleplexqRT‐PCR
experimentsinthestudypresentedinChapter4
The Cq values were calculated using the SDS v2.3 software (Applied Biosystems) (automatic
baseline, threshold = 0.2). A Cq value > 35 was taken as an indication of absence of the target
miRNA (350). We normalised the data across the samples to a spiked control [cel‐miR‐54]
using the median normalisation procedure, as shown previously (225, 248, 252, 258, 349). Due
to the lack of agreement as to which endogenous controls are superior for the validation RT‐
PCR experiments, and because the set of reference controls identified by GeNorm showed

CHAPTER 3
82 Victoria Nisenblat
considerable variability in our array experiment, we assumed that adding the same amount
of spiked‐in RNA with an equal volume of plasma would provide a stable reference control.
MiRNA‐quantification results were expressed as median normalised Cq values: Normalized Cq
value for the miRNA in the sample = Raw Cq value ‐ [(Spike‐in Cq value of the given sample) ‐
(Median Spike‐in Cq value in all tested samples)]. The molar concentrations of the spike‐in
were derived empirically to produce Cq values comparable to those of moderately abundant
miRNAs measured in blood from human plasma (248). As shown in our preliminary
experiments and supported by others (258), the imprecision in miRNA results is not altered by
the number of spiked‐in miRNAs.
3.5.2.3 AnalysisofthedataobtainedinthesingleplexqRT‐PCR
experimentsinthestudypresentedinChapter7
The expression levels of miRNAs were calculated using corrected for efficiency comparative
∆Cq method (334). Following an export of the raw data and after removal of the Cq values >
35, Cq values were corrected for amplification efficiency of each individual miRNA primer,
established using the standard curve method. Standard curves were generated for each of the
tested assays based on 5 ten‐fold serial dilutions of the input sample. The input product for
the standard curves included pooled RT product of the tested samples. Amplification
efficiency was calculated based on the slope of Cq plotted against the logarithm of the amount
of input miRNAs using formula: and PAE = log210‐1/slope. Corrected Cq was calculated using
formula Cq*logbase2 (10‐1/slope), corresponding to what the averaged Cq values would have
been had they amplified at 100% Efficiency.
We questioned the spiked‐in synthetic miRNAs as internal controls. While able to correct for
the RNA extraction quality, spiked‐in synthetic templates are not able to control for the
variations in starting sample quantity and for variable PCR efficiency due to numerous
inhibitors contained in plasma that contaminate the purified RNA and interfere with
subsequent enzymatic reactions. Therefore, we assumed that reliable endogenous controls
should be inherently present in the plasma samples, subjected to identical conditions
(purification method, storage, etc.) as target molecules and should undergo the same
detection process on the same reaction plate. This allows controlling for as many technical
variables as possible and makes all subsequent calculations independent of from RNA input of
the samples.

CHAPTER 3
Victoria Nisenblat 83
The levels of miRNAs were normalized to a normalization factor [geometric averaging of
miRNAs selected as a reference], so that all subsequent calculations were independent from
RNA input of the samples. The ∆Cq was calculated by subtracting the Cq values of normaliser
from the Cq values of the miRNA of interest. The ∆∆Cq was then calculated by subtracting ∆Cq
of the controls (disease‐free) from the ∆Cq of endometriosis samples. Expression levels were
calculated by the equation 2‐∆Cq = 2‐[Cq target‐Cq normaliser]. Fold changes were calculated as 2‐∆∆Cq =
2‐[∆Cq endometriosis‐∆Cq controls]. All samples were processed under the same conditions and run by
the single operator blinded to the surgical outcomes. The expression levels of the investigated
miRNAs between the groups were compared using non‐parametric statistics considering the
number of the samples in each group and lack of the normal distribution of the data.
3.5.2.3.1 Selectionandvalidationoftheendogenouscontrolsforquantification
ofplasmamiRNAs
A systematic approach was undertaken to identify suitable endogenous controls. First, we
identified a set of putative normalisers in the PCR array experiment via GeNorm algorithm.
Next, the selected endogenous controls were subjected to qRT‐PCR assay using 20 samples.
An ideal endogenous control generally demonstrates expression that is relatively constant and
highly abundant across the samples. Additionally, the reference miRNAs have to belong to
different families to minimize the risk of co‐regulation. Unlike profiling studies on miRNA‐
abundant tissues, where the same amount of miRNA is used for each experiment, the
experiments on circulating miRNAs are based on the volume input, which can be associated
with up to 4‐5 times difference in miRNA amount. Endogenous controls would be expected to
control for this level of disparity, however this difference could interfere with level of the
controls themselves. Although endogenous controls were expected to demonstrate
variability, the expression difference between the study groups should be minimal. Given that
the megaplex primers were separate for each card and the PCR reactions in each pool were
run on separate plates, we aimed to select separate normalisers for the assays in pool A and
B. The assessment of validity of the endogenous controls included the following:
1 – each of the selected candidate controls should demonstrate negative NTC signals; 2 ‐ the
serial dilutions of the purified RNA samples should reveal excellent assay linearity; 3 ‐ each of
the selected candidate endogenous controls should be readily detected across the samples; 4
– the candidate controls should have small variation across the samples; 5 – the putative

CHAPTER 3
84 Victoria Nisenblat
endogenous controls should not exhibit expression differences between the groups
(endometriosis vs. controls).
3.6 MiRNAprofilinginendometrialtissue
3.6.1 MiRNAmicroarrayandanalysis
RNA samples were hybridized to the GeneChip miRNA 2.0 Array (Affymetrix, Inc, Santa Clara,
California), with 15,644 miRNA probe‐sets for mature miRNAs which have 100% coverage of
miRBase v15 (135 organisms) The samples prepared for microarray analysis according to the
Affymetrix protocol, at the Adelaide Microarray Centre, Hanson Institute, Institute of Medical
and Veterinary Science (IMVS) Core Facility. Briefly, 500 ng of total RNA was tailed and ligated
to FlashTag‐Biotin‐HSR using the Genisphere FlashTag Biotin HSR RNA Labelling Kit for
Affymetrix GeneChip miRNA Arrays (Affymetrix). For poly‐A tailing, the volume of RNA was
adjusted to 8 μl with Nuclease‐Free Water, transferred to ice and spiked with 2 μl RNA Spike
Control Oligos. The 10 μl RNA/Spike Control Oligos was mixed with 5 μl of master mix for a
total volume of 15 μl. The master mix included 1.5 μl 10X Reaction Buffer, 1.5 μl 25 mM MnCl2,
1.0 μl diluted ATP Mix (the ATP mix was diluted 1:2000 in 1mM Tris, the dilution factor was
calculated according to the formula 1000 ÷ μg input total RNA), 1.0μl PAP Enzyme. The mixture
was gently mixed and incubated in a 37°C heat block for 15 minutes. For flash tag Biotin HSR
ligation, 15 μl of tailed RNA was placed on ice, mixed with the 4 μl 5X FlashTag Biotin HSR
Ligation Mix and 2 μl of T4 DNA Ligase followed by incubation at 25°C for 30 minutes. The
reaction was stopped by adding 2.5 μl HSR Stop Solution. The ligated RNA was then hybridised
to Affymetrix miRNA v2.0 arrays. The hybridisation step included mixture of 21.5 μl of the
biotin‐labelled sample with 50 μl 2X Hybridization Mix (from GeneChip Hyb, Wash and Stain
Kit), 15 μl 27.5% Formamide , 10 μl DMSO (from GeneChip Hyb, Wash and Stain Kit), 5 μl 20X
Eukaryotic Hybridization Controls (from GeneChip Eukaryotic Hyb Control Kit), 1.7 μl Control
Oligonucleotide B2, 3 nM (from GeneChip Eukaryotic Hyb Control Kit) followed by incubation
at 99°C for 5 minutes, then at 45°C for 5 minutes and injection of 100 μl of the reaction mix
into an array. The array trays were then loaded into the hybridization oven and incubated at
48°C and 60 rpm for 16 hours.
The data were scanned according to the protocol described in Assay Manual from Affymetrix
using an HR3000 scanner. The data generated by the Affymetrix GeneChip Operating Software
analysis of the scanned array images were imported into Partek Genomics Suite software

CHAPTER 3
Victoria Nisenblat 85
(Partek, Inc, St. Louis, Missouri, US). The data files containing the probe level intensities were
processed using the Partek Robust Multi‐Chip Average analysis adjusted for the GC content of
probe sequence (GCRMA), which included the background adjustment, normalization, and
log2 transformation of perfect match values. The normalized data were used in pairwise
comparisons of endometriosis and symptomatic control groups, endometriosis and
asymptomatic controls as well as endometriosis and all controls. The miRNAs that were
differentially expressed were identified using the one‐way ANOVA as implemented in the
Partek tool. The data presented as intensity values for each probe cell (cel.file) was also
analysed by using the Affy package, Bioconductor. The data was background corrected,
quantile normalised, summarised using the standard RMA method and analysed by using
LIMMA.
3.7 Statisticalanalysis
3.7.1 Demographiccharacteristics
Values are expressed as mean ± SD or medians (range). The patients’ baseline demographic
and clinical characteristics were compared using Student’s t‐test or Mann‐Whitney U test
when appropriate for continuous variables and Fisher’s exact test for categorical variables.
The Shapiro‐Wilk test was used to establish whether the continuous data followed the normal
distribution.
The Spearman rank order correlation test was used to examine correlation relationships
between the variables. Correlation coefficients (rs) with a magnitude of 0.9 ‐ 1.0 indicate very
highly correlated variables, 0.7 ‐ 0.9 ‐ highly correlated variables, 0.5 ‐ 0.7 ‐ moderately
correlated variables and 0.3 ‐ 0.5 indicate low correlation. Little if any correlation between the
variables was indicated by correlation coefficients of < 0.3.
3.7.2 TLDAmiRNAexperimentinplasma
The statistical analysis of the microarray data has been performed in consultation with
Associate Professor Cristin Print, the head of the Bioinformatics Institute, Auckland University,
Auckland, NZ. Comparative analyses of the array data were made applying empirical Bayesian
moderation of standard errors and linear models for microarray data [LIMMA, Bioconductor
tools in R (version 2.13.0)]. In the experiment presented in Chapter 4, the comparison of
miRNA levels between three time points of menstrual cycle: early proliferative, late
proliferative and mid‐luteal and was made separately within each group (women with

CHAPTER 3
86 Victoria Nisenblat
endometriosis and healthy controls) using a nested F‐test approach. If the overall F‐statistic is
significant, then the function assesses which t‐statistic is most likely to have contributed to
this result. The comparisons between endometriosis and control groups were made
separately for each stage of the cycle using moderated t statistics. MiRNAs with p‐values <
0.01 and FC > 1.5 were considered as differentially expressed. In parallel, a B–H method for
multiple‐testing correction was applied to keep the FDR under 5%. Considering the
exploratory “hypothesis generating” nature of the study and in order to avoid too many type
2 errors, we did not apply the correction for multiple testing as a mandatory criterion for the
significance of differential expression (322). The probability level for trend for statistical
significance was determined as 0.01 < p < 0.05.In the experiment presented in Chapter 7, the
analysis was performed between the endometriosis and control groups irrespective of the
menstrual cycle stage. In this study, only miRNAs that significantly differed between the
groups and passed a test for multiple test correction, keeping FDR < 5%, were considered for
the subsequent validation.
The power calculation to determine the sample size for the validation RT‐PCR experiment
(presented in Chapter 7) was not calculated. This is because it appears challenging to establish
the two important components of the power calculations in context of the microarray
experiment, i.e. the variance of the relative expression levels across the arrays and the
magnitude of the effect of interest for individual miRNAs (351). Therefore, we included the
maximal available number of samples in the validation experiment. Due to relatively small
sample size, no subgroup analyses were performed to differentiate between the different
types of endometriosis, i.e. ovarian vs. peritoneal or between the endometriosis sufferers with
and without infertility for the participants included in the array experiment (presented in
Chapter 4).
3.7.3 AffymetrixhybridisationmiRNAmicroarrayinendometrialtissue
Two computational methods (ANOVA and LIMMA) were used to estimate differential
expression of miRNAs between the groups and miRNAs that were common to both methods
were selected as differentially expressed. An estimate of the associated FDR was computed
per miRNA using the method of B‐H in both analyses, aiming to keep the FDR < 5%. Similarly
to stated in Chapter 4, we did not apply the correction for multiple testing as a mandatory
criterion for the significance of differential expression (322) in order to avoid premature
CHAPTER 3
Victoria Nisenblat 87
elimination of potentially useful observations. However, we applied stringent selection criteria
for the miRNAs that did not pass the correction for multiple testing. The miRNA transcripts
were considered to be significantly differentially expressed if they obtained p‐value < 0.01 and
were significant according to both methods. The probability level for trend for statistical
significance was determined as 0.01 < p < 0.05.
3.7.4 HeatmapsandVenndiagrams
Heat maps were used to look for similarities between miRNA levels within each sample and
were represented by the row Z‐score, which was calculated by subtracting the mean of the
row from every value and then dividing the resultant values by the SD of the row Z‐score. A
heatmap graphically depicts the measured intensity values of the miRNAs with the
dendrogram illustrating relationships between the specimens and was generated by using
gplots package in R, Bioconductor (352). Venn diagrams for comparing between the datasets
were constructed by using Venny, the online interactive tool
(http://bioinfogp.cnb.csic.es/tools/venny/index.html) (353).
3.7.5 qRT‐PCRexperiment
Expression levels of plasma miRNAs in single RT‐PCR were compared using the Mann‐Whitney
U test or the Kruskal‐Wallis test where appropriate. The post hoc analyses were done with
Mann‐Whitney U test using Bonferroni adjusted p‐values. All p‐values were exact two‐sided
and p < 0.05 was considered the threshold for statistically significant differences. P‐values of
0.05 – 0.099 were considered to be suggestive of a trend of statistical significance. To assess
if any of the demographic or clinical parameters that significantly varied between the groups
had confounding effect, a correlation between miRNA expression (for each of the tested
miRNAs) and a parameter of interest was assessed separately in each group.
3.7.6 Subgroupanalyses(studypresentedinChapter7)
To examine whether the plasma levels of the investigated miRNAs may fluctuate under
different conditions, the subgroup analyses were performed on a cohort of the participants
stratified based on the factor of interest. The impact of the severity of endometriosis on
miRNA expression was tested in 2 subgroups, minimal – mild disease (rASRM stage I‐II) and
moderate – severe disease (rASRM stage III‐IV), providing there were no significant expression
differences between the pooled together rASRM stages. To examine whether the plasma
levels of the investigated miRNAs vary across a menstrual cycle, the participants were

CHAPTER 3
88 Victoria Nisenblat
stratified by the 4 stages of the cycle: menstrual or early proliferative, corresponding to day
1‐4 of the cycle, proliferative, consistent with day 5‐12, peri‐ovulatory, day 13‐14 and luteal,
day 16‐26. These subgroup analyses were limited only to women with regular menstrual cycles
and not on contraceptive hormonal medications; menstrual cycle stage was determined based
on verbal confirmation of a day of the cycle with consideration of the cycle length. Additional
discriminative factors of interest for the subgroup analyses included: 1. endometrioma, 2.
recurrent endometriosis, 3. hormonal treatment. When meaningful subgroup analysis was not
possible due to limited sample size in one of the subgroups (n < 5), analysis was performed
after exclusion of the subgroup of interest as an indirect way to assess the impact of an
excluded parameter on the miRNA expression in the cohort. This was applied to 1. pelvic
pathologies and general medical conditions on miRNA expression, which included a list of low
prevalent conditions; 2. previous endometriosis in currently disease‐free women; 3.
hormonal treatment.
3.7.7 DiagnosticperformanceofplasmamiRNAs
Receiver‐operating characteristics (ROC) curves were established to evaluate the diagnostic
value of plasma miRNAs for differentiating between endometriosis and controls for each
individual miRNA and by the combinations of the selected miRNAs. The area under the ROC
curve (AUC) was used as a measurement of the level of separation of settings. Univariate
logistic regression analyses were taken to select the variables for the multivariable analyses.
A multivariate logistic regression model was established. The Hosmer‐Lemeshow test was
used to test for goodness of fit in the logistic regression model. The sensitivity and the
specificity were calculated according to the standard formulas. Statistical analyses were
performed using R v2.13 and SPSS 18.0 software (SPSS, Inc., Chicago, IL).
3.8 IdentificationofpredictedmiRNAtargetsandinsilicofunctionalanalysis
To identify targets of dysregulated miRNAs, two different methods were applied: the IPA
miRNA Target filter, Ingenuity Systems Pathway Analysis software (IPA last updated
08.05.2012, Ingenuity Systems, Inc., Redwood, CA) and MirTarget2 tool incorporated miRDB
database (www.miRDB.org), version 4.0, released January 2012, last updated 03.04. 2012. The
miRNA Target Filter in IPA identified miRNA–mRNA interactions from TargetScan algorithm
(TargetScan Human 5.1), TarBase v.5c, miRecords, and Ingenuity Knowledge database (IKB).
TargetScan identifies predicted mRNA targets for miRNAs by searching for the presence of a

CHAPTER 3
Victoria Nisenblat 89
conserved seed match (i.e., perfect Watson‐Crick complementarity [A:U or G:C matches]
between nucleotides 2‐7 of the miRNA) and a 6 nucleotide section of the 3 UTR of the mRNA),
and either a conserved anchoring A (which is an A nucleotide on the 3' UTR just downstream
of the seed match) or a conserved m8‐t8 match (which is an A:U or G:C match between the
eighth nucleotide of the miRNA and the corresponding position on the 3' UTR), or both. These
relationships are binned into high and moderate predicted confidence. High confidence is
assigned either when the relationship is between a conserved or highly conserved miRNA and
at least one conserved site on the targeted sequence, or the total context score, as defined by
TargetScan, is ‐0.4 or less. Moderate confidence is assigned if the total context score, as
defined by TargetScan, is ‐0.2 or less. TarBase, miRecords and IKB are the manually curated
collections that identify experimentally demonstrated miRNA/mRNA relationships from
thousands of miRNA‐related findings from the peer‐reviewed literature. Only targets that
were experimentally validated or predicted with the high confidence were selected.
MiRDB is an online database for miRNA target prediction and a functional annotation that
implicates a SVM learning machine based bioinformatics tool MirTarget2 for target prediction.
The computational target prediction algorithm assigns a prediction score of 50 – 100 to each
target, which directly correlates with the prediction confidence. Only targets with a prediction
score of > 80 were included in functional analysis. This additional target prediction algorithm
(MirTarget2 tool) was implemented to ensure the completeness of the predicted mRNA target
lists incorporated in the IPA and both target datasets were merged.
In silico functional analysis of the identified targets was performed by using IPA core analysis
and IPA Path Explorer in order to identify the signalling pathways, molecular networks and
biological processes that are most significantly perturbed in the dataset of interest. IPA uses
information retrieved from the IKB, including manually curated collections that identify
experimentally demonstrated miRNA/mRNA relationships from thousands of the peer‐
reviewed papers.
The top biological functions and canonical pathways identified in IPA were selected based on
significance for the likelihood of association between the selected molecules and a given
process. The p‐value was calculated using the right‐tailed Fisher’s exact test by considering
the number of functional analysis molecules that participate in that function and the total
number of molecules that are known to be associated with that function in the IKB.

CHAPTER 3
90 Victoria Nisenblat
The molecular networks were developed from information contained in the application and
were ranked according to their degree of relevance to the network eligible molecules in the
dataset. The ranking score represents a numerical value that takes into account the number
of network eligible molecules in the network, the total number of molecules analysed and the
total number of molecules in the IKB that could potentially be included in networks. The
network score is based on the hypergeometric distribution and is calculated with the right‐
tailed Fisher's exact test to estimate the approximate "fit" between each network and the
network eligible molecules in a dataset, corresponding to the negative log of this p‐value.
Additional analysis was restricted to the predicted targets in current study that intersected
with the 4 previously published datasets of mRNAs identified in endometriosis. Four gene
micro array datasets were downloaded from the GEO repository
http://www.ncbi.nlm.nih.gov/projects/geo; with accession numbers GSE23339 (205) and
GSE7305 (84) for endometrioma and eutopic control endometrium comparisons as well as
GSE11691(85) and GSE5108(83) for ectopic and eutopic endometrium comparisons. There
were 116 up‐regulated and 72 down‐regulated genes that intersected these 4 datasets (205)
and these miRNAs were included in an in silico functional IPA analysis.
3.9 Strategyforconductingthediagnosticaccuracystudy
The studies of diagnostic accuracy compare results from one or more tests to the reference
standard on the same subjects and are a vital step in the evaluation of any new diagnostic
technology (354). Exaggerated results from poorly designed studies can trigger premature
adoption of diagnostic tests and can mislead the clinical and research community to incorrect
decisions about applicability of the test. The methodological quality of many of the reported
studies was found to be less than optimal and information on key elements of design, conduct
and analysis of diagnostic studies was often not reported (355). We revised the criteria for
conducting and reporting of the diagnostic accuracy studies based on the STARD (Standards
for Reporting of Diagnostic Accuracy) statement (356) and the QUADAS tool (the quality
assessment of studies of diagnostic accuracy included in systematic reviews) (357‐360). The
results of this work were incorporated into our published protocol for a systematic review of
the literature on the non‐invasive tests for endometriosis for the Cochrane collaboration. We
also implemented this methodology in our prospective diagnostic accuracy study on plasma
miRNAs as diagnostic markers of endometriosis, presented in Chapter 7.

CHAPTER 3
Victoria Nisenblat 91
Both STARD and QUADAS provide the checklists and flow diagrams that should be followed
for optimal study design, which aims at an unbiased diagnostic study. The flow chart for the
STARD checklist is presented in Figure 3.9. This flow chart outlines the method of patient
recruitment, the order of test execution, and the selection of an appropriate reference
standard test. Each flow phase includes a section for an inconclusive test finding and provides
a venue by which this can be identified.
The QUADAS tool, presented in Table 3‐3, provides an organised format, which includes 14
components addressing a process of the patients’ recruitment and allocation, execution of an
index test and a reference test and approach to the data.
Figure 3.9 Flow chart for STARD (Standards for reporting diagnostic accuracy) checklist.

CHAPTER 3
92 Victoria Nisenblat
Table 3‐3 The QUADAS (Quality assessment of the diagnostic accuracy studies) tool
The principles applied by us in designing the diagnostic study included:
1. Study design
1.1. The study should be of prospective cohort design, recruiting all the patients with the
suspected condition;
1.2. The included patients must have a similar clinical presentation that requires further
discrimination by the investigated (index) test and are representative of the patients
who will receive the test in practice, to minimise selection and spectrum bias;
1.3. The participants should be recruited from the consecutive list of candidates to
minimise selection bias;
2. Reference standard
2.1. The selected reference test (reference standard) should be a standard test
implemented routinely in clinical practice known to accurately diagnose the
condition, to minimise diagnostic bias;
2.2. All the participants must undergo testing by the reference standard, to minimise and
partial verification bias;
2.3. The time between an index and a reference test should be minimal (preferably up to
several weeks’ time) to minimise disease progression bias;

CHAPTER 3
Victoria Nisenblat 93
2.4. The same reference standard must be used across the study, to minimise differential
verification bias;
2.5. The reference standard should be independent of the index test to minimise
incorporation bias;
2.6. The execution and interpretation of the reference standard should be performed
without knowledge of the results of the index test and vice versa, to minimise
diagnostic review bias;
2.7. If index test is performed by several operators, the results of inter‐observer variation
should be reported to assess inter‐observer bias;
2.8. The quality parameters of the laboratory or inter‐and intra‐experimental
variability should be performed;
3. Approach to the data
3.1. The same clinical data should be available when the index test results are interpreted
as would be available when the test is used in practice, to minimise clinical review
bias;
3.2. Both intermediate results (when index test is not clearly positive or negative) and
non‐interpretable results (if a test is unable to be performed or measured) should be
reported, to minimise diagnostic performance bias;
3.3. Withdrawals from the study should be reported and explained, to minimise
diagnostic performance bias.

CHAPTER 3
94 Victoria Nisenblat

CHAPTER 4
Victoria Nisenblat 95
ExpressionprofileofplasmamiRNAsacrossthemenstrualcycleinwomenwithandwithoutendometriosis

CHAPTER 4
96 Victoria Nisenblat
4.1 Introduction
Given the deficiencies associated with current techniques of diagnosis, the ability to utilise a
novel biological parameter to assist in the identification of endometriosis would be highly
advantageous. As an initial step towards development of miRNA‐based test, we aimed at
identification of endometriosis‐specific miRNA profile in plasma and assessment of the
menstrual cycle phase effect on the expression pattern of plasma miRNAs in reproductive‐
aged women. Supra‐physiological hormone levels generated in in vitro experiments result in
aberrant miRNA expression (180, 197, 209, 233, 236‐237), however the physiologic effect of
reproductive steroids on miRNA signatures in humans is only starting to be delineated. In
eutopic endometrial tissues, the cycle phase impacts significantly on the miRNAome;
conversely this tissue undergoes dynamic, hormone‐ dependent, morphological changes that
are likely to be regulated by miRNAs (235, 240‐241). We measured circulating miRNA levels at
3 different phases of the menstrual cycle in healthy asymptomatic volunteers and in women
with endometriosis, to determine whether hormonal fluctuations across the menstrual cycle
could confound miRNA profiling. We expected this information would also reveal the best
cycle phase to reliably measure blood miRNA biomarkers for endometriosis and other
diseases. Finally a functional bioinformatics analysis of circulating endometriosis‐associated
miRNAs was performed, to delineate their potential biological effects in women with this
disabling disease.
4.2 MaterialsandMethods
4.2.1 Studyparticipants
In this prospective case control study, women with pelvic pain were recruited from the
outpatient gynaecology clinics prior to undertaking a diagnostic laparoscopy and only women
with endometriosis confirmed at surgery were included. The women in the control group were
asymptomatic healthy volunteers who responded to an advertising poster, who did not suffer
from pelvic pain and had no family history of endometriosis. All women were between 18‐45
years of age, had regular natural menstrual cycles and no record of chronic disease. Women
were excluded if they had symptoms of acute infection or allergic reaction within 2 weeks of
blood collection. The severity of endometriosis was classified according to the rASRM
classification system. Every surgical team included one of three senior gynaecologic

CHAPTER 4
Victoria Nisenblat 97
laparoscopists with more than 10 years’ experience in the diagnosis and management of
endometriosis to minimise diagnostic inaccuracy.
4.2.2 BloodcollectionandmiRNAextraction
Blood was collected at 3 phases of the menstrual cycle: early proliferative phase (day 3‐5 of
the menstrual cycle with circulating E2 < 265 pmol/L and P4 < 4 nmol/L), late proliferative
phase (day 9‐12, E2 = 350‐1500 pmol/L and P4 < 4 nmol/L) and mid secretory phase (day 18‐
24, E2 > 150 pmol/L and P4 > 12 nmol/L). For women with pelvic pain, blood tests were taken
before and within 2 months of surgery, which was performed between February 2010 and
May 2011. The detailed description of blood processing, miRNA extraction and quality
assessment of the samples are presented in Chapter 3.
4.2.3 MiRNAprofiling
TLDA A and B v.2.0 were used for a screening of miRNA expression and TaqMan miRNA assays
were used for validation of the array findings. All samples were processed under similar
conditions and run in single replicate for the array experiment and in triplicate measurements
for the verification qRT‐PCR experiments, as presented in Chapter 3.
4.2.4 IdentificationofpredictedmiRNAtargetsandinsilicofunctionalanalysis
The detailed description of identification of predicted targets and in silico functional analyses
is presented in Chapter 3.
4.3 Results
4.3.1 Studyparticipants
A total of 16 women, 8 women with endometriosis and 8 healthy controls met the inclusion
criteria and were included in the study. Patient characteristics are summarised in Table 4‐1.
Menstrual cycle characteristics were comparable. The average age of women with
endometriosis was significantly lower than the control group (33.4 ± 5.6 vs. 39.5 ± 4.8, p =
0.035), however this difference was of no clinical significance. The patients in both groups
designated themselves as Caucasians. Four of the women in endometriosis group suffered
from chronic pelvic pain and 4 women suffered from pelvic pain and infertility. Five women
were diagnosed with minimal‐mild endometriosis (rASRM stage I‐II), and 3 women were
diagnosed with moderate‐severe endometriosis (rASRM stage III‐IV). All women had pelvic

CHAPTER 4
98 Victoria Nisenblat
endometriosis and 2 women had both pelvic and ovarian involvement. The extent of surgery
varied depending on the disease stage from minimal cauterisation to extensive excision and
all blood test were taken before a surgical treatment commenced. Three women in the control
group underwent surgical sterilisation 6 months preceding recruitment and had a surgical
confirmation of normal pelvis. No significant differences in endocrine profiles were found
between women with and without endometriosis (data not shown). None of the patients that
underwent surgery had other pelvic pathologies, such as fibroid uterus, hydrosalpinx, ovarian
masses (other than endometriomas), inflamed appendix or pelvic inflammatory disease.
Table 4‐1 Characteristics of the study population
Characteristic Endometriosis n = 8 patients (23 blood samples)
Healthy Controls n = 8 patients (24 blood samples)
p‐value
Age (years),
mean ± SD (range)
33.4 ± 5.6 (25‐43)
39.5 ± 4.8 (30‐44)
0.035
Surgical inspection of pelvis/abdomen, n (%)
8 (100%)
3 (37.5%)
Endometriosis stage (rASRM), n (%) Minimal‐Mild (I‐II) Moderate‐Severe (III‐IV)
5 (62.5%) 3 (37.5%)
Indications for surgery, n (%) pain pain + infertility sterilisation
4 (50%) 4 (50%)
3 (100%)
4.3.2 PerformanceofthemiRNATLDA
The miRNA across the plasma samples accounted for 41%‐84% of total small RNAs with a
concentration range of 255‐530 pg/μl.
In total, 674 miRNAs were screened (381 on card A in 47 plasma samples and 293 on card B in
37 plasma samples). Ath‐mir159a, a miRNA unrelated to mammalian species and used as a
negative control on both array cards, was present in 2 samples on card A and in 1 samples on
card B, at borderline Cq values of 31.6, 29.9, 31.5, respectively. Mammalian U6 was used as a
positive control, all the samples were positive for the replicates of U6 on both cards.
Of the 502 miRNAs detected in at least one sample (316 miRNAs on card A and 186 miRNAs
on card B), 128 displayed consistent expression across all samples (104 on card A and 24 on
card B). A total of 370 miRNAs were detected in above 50% of the samples (241 miRNAs on
card A and 129 miRNAs on card B).

CHAPTER 4
Victoria Nisenblat 99
Out of the 47 samples of array card A, 8 samples exhibited less than 50% detected targets.
The remainder samples contained 50%‐70% of the detected targets. Out of the 37 samples of
array card B, 1 sample contained less than 10% of the detected targets, 5 samples 10‐20% of
the detected targets and the rest of the samples contained 20‐48% of the detected targets.
We assumed that “lower abundance” samples might be associated with poorer performance
related to technical issues in RNA extraction or RT‐PCR experiments, rather than with
biological variability. This assumption was supported by the fact that the targets identified on
the “low abundance samples” had poorer correlation with the targets on the “high abundance
samples”, compared to the correlation between the samples with similar abundance of the
expressed targets. The Spearman rank correlation coefficients were above 0.96 for each of
the “high abundant” array plates on card A and above 0.86 on card B, above 0.77 for “high
abundant” vs. “low abundant” plates on card A and above 0.43 on card B, above 0.83 and 0.78
between the “low abundant” plates on card A and B, respectively; p < 0.01. The only plate
from card B that contained less than 10% of the expressed targets poorly correlated with other
samples (rs = 0.15‐0.54, p < 0.01) and therefore was excluded in the analysis.
Putative endogenous controls were identified by the GeNorm algorithm. A pair‐wise
comparison determined that up to 2 endogenous controls were sufficient to normalize
expression levels for each of the array cards (V 2/3 = 0.012 for card A and V 2/3 = 0.008 for
card B). Interestingly, mammalian U6, suggested by most as a stable and reliable endogenous
control, had the highest M‐value and was less abundant compared to the other miRNAs
identified by GeNorm, therefore it did not appear to be a suitable endogenous control for our
data. The selection of the optimal normalisation method was based on comparison of
variability measures in the data normalised in different ways, including coefficient of variance,
spread of the data and a visual pair‐wise comparison between the different normalised
profiles. Quantile normalised data expressed less variability and was selected as a method of
choice for normalisation in the array experiment (Figure 4.1).

CHAPTER 4
100 Victoria Nisenblat
(A) (B)
(C) (D)
(E) (F) Figure 4.1 Variability measures of the data, comparison between normalisation approaches: not normalised data
(raw data), quantile normalisation, rank‐invariant normalisation and normalisation to the endogenous controls identified
with GeNorm algorithm (HK). Data from the array cards A. Panel A represents raw Cq values of the stable detectors
chosen by GeNorm ranks (red), comparison with Mammalian U6 (Blue). Panel B represents coefficients of variation (CV);
Panels C‐F represent a degree of dispersion and skewness in the data demonstrated by the box plots, via presenting a
sample minimal and maximal observations, median as well as lower and upper quartile; each box‐plot corresponds to
one array.

CHAPTER 4
Victoria Nisenblat 101
4.3.3 ExpressionofthemiRNAsacrossthemenstrualcycle
First, we compared the relative expression of miRNAs between different menstrual cycle
stages separately in the endometriosis and in control groups. The list of the top ranked
miRNAs identified by LIMMA within each group is presented in Table 4‐2. None of the miRNAs
exhibited differential expression between the stages of the cycle at a significance level of p <
0.01, either in women with endometriosis, or healthy controls. There were certain stages of
the cycle where some of these miRNAs had a p‐value of 0.01 < p < 0.05 without a correction
for multiple testing. For example, miR‐138 had a p‐value of 0.038 in healthy controls when
late proliferative phase was compared with mid luteal, see Table 4‐2. Similar results were
obtained when a broader range of the targets were included in the analysis, i.e. targets
expressed in at least one sample or when the detection limit cut‐off was set at Cq > 35 (data
not shown).
Table 4‐2 List of the top ranked miRNAs identified across the menstrual cycle in disease‐free controls and in women
with endometriosis*
ID
A mean1 t2
T1‐T2 t2
T1‐T3 t2
T2‐T3 P3
T1‐T2 P3
T1‐T3 P3
T2‐T3 F4
F.p‐value5
Healthy controls
miR‐212 28.00 ‐1.15 1.48 2.64 0.255 0.145 0.012 3.50 0.039
miR‐138 29.06 2.34 0.20 ‐2.14 0.024 0.843 0.038 3.35 0.044
miR‐150 18.06 0.52 2.32 1.80 0.604 0.025 0.079 2.97 0.062
let‐7g 21.23 1.56 ‐0.76 ‐2.32 0.126 0.452 0.025 2.79 0.072
miR‐642 29.68 1.69 2.23 0.54 0.098 0.031 0.590 2.72 0.077
miR‐135a 29.79 1.61 2.08 0.47 0.114 0.043 0.641 2.38 0.104
Endometriosis
miR‐141 29.48 ‐2.54 ‐0.91 1.66 0.015 0.367 0.104 3.29 0.046
miR‐205 30.66 0.53 2.49 1.88 0.598 0.017 0.067 3.40 0.042
miR‐130b 24.74 ‐0.67 ‐2.22 ‐1.48 0.505 0.031 0.147 2.58 0.087
miR‐331‐3p 20.39 ‐1.12 ‐2.08 ‐0.89 0.269 0.043 0.377 2.17 0.126
miR‐382 23.54 ‐0.46 ‐2.06 ‐1.53 0.646 0.045 0.133 2.31 0.111
miR‐511 29.67 1.09 ‐0.97 ‐2.03 0.283 0.336 0.049 2.05 0.141
miR‐939 31.69 ‐2.40 ‐1.55 0.81 0.022 0.129 0.425 3.00 0.062 * Results of the analysis by using linear models with application of moderated t statistics and nested F‐test
approach (LIMMA package); separate analysis for women with endometriosis and healthy controls across the three time points of the menstrual cycle;
1 A mean – average normalised Cq values for each probe over all the arrays; 2 t – empirical Bayes T statistics; 3 p‐value – p‐value corresponding to T statistics; 4 F – F statistics; 5 F p‐value – p‐value corresponding to F statistics; Statistical significance is determined by p < 0.01 C – controls, E ‐ endometriosis, T1 – early proliferative stage of the cycle, T2 – late proliferative stage of the
cycle, T3 – mid‐luteal stage of the cycle.

CHAPTER 4
102 Victoria Nisenblat
4.3.4 DifferentialexpressionofcirculatingmiRNAsinendometriosis
Control and endometriosis plasma samples were compared at each independent cycle stage.
Three differentially expressed miRNAs (miR‐23a, miR‐574‐3p, miR‐662) passed the correction
for multiple testing at, at least one stage of the cycle. An additional 9 miRNAs were
significantly differentially expressed (p < 0.01) but did not pass the correction for multiple
testing. Overall, our analysis revealed 12 miRNAs that differed between the endometriosis
and control groups (FC > 1.5, p < 0.01), of which 7 miRNAs exhibited differences in expression
in the early proliferative stage of the cycle, 10 miRNAs in the late proliferative stage of the,
and 6 miRNAs in the mid luteal stage of the cycle (Table 4‐3). Five of the miRNAs remained
differentially expressed at all 3 stages of the menstrual cycle (Figure 4.2A). In total, 6 miRNAs
were down‐regulated (miR‐23a, miR‐574‐3p, miR‐224, miR‐425, miR‐29a*, miR‐376a*) and 6
miRNAs were up‐regulated in endometriosis (miR‐155, miR‐128, miR‐362‐3p, miR‐ 598, miR‐
93*, miR‐662).
Surprisingly, RNU‐6B also known as U6 was identified as being significantly differentially
expressed in the plasma of women with endometriosis. This supports others observations that
RNU‐6B does not exhibit stable expression across the samples and should not be used as a
reliable endogenous control (361). This small nuclear non coding 45 nucleotide long RNA
[Hugo Gene Nomenclature Committee ID HGNC:10228, official symbol RNU6‐2, GeneBank
accession:K03099, RefSeq accession: NR_002752; sequence
(CTGCGCAAGGATGACACGCAAATTCGTGAAGCGTTCCATATTTTT)] does not belong to any
known miRNA family and was excluded from the functional analyses and validation
experiments.
Another 45 miRNAs showed a trend for significance (0.01 < p < 0.05) in differential expression
between at least at one of the stages of the menstrual cycle and were considered as a group
with borderline pattern of dysregulation (19 in early proliferative stage, 19 in late proliferative
stage and 19 in mid luteal stage) (Figure 4.2B). These miRNAs all showed a similar expression
pattern across the stages, which was not altered by the stage of endometriotic disease.

CHAPTER 4
Victoria Nisenblat 103
Table 4‐3 Differentially expressed miRNAs, wide‐scale profiling with TLDA, comparisons by the phase of menstrual
cycle*
ID Endometriosis Healthy controls
Mean1 SEM2 Median395% CI4
Mean1 SEM2 Median3 95% CI4
p‐value5 adj.p‐value6
FC7 B8
T1 Early proliferative stage of menstrual cycle
miR‐23a 29.07 0.37 28.68 0.02 26.81 0.31 26.71 0.02 < 0.001 0.017 ‐4.76 1.49
miR‐574‐3p 25.23 1.39 27.44 0.09 20.76 0.38 20.93 0.02 0.003 0.241 ‐22.16 ‐1.62
miR‐155 23.70 0.31 23.61 0.02 28.87 1.61 30.92 0.10 0.003 0.241 3.60 ‐1.70
miR‐93* 22.15 0.17 22.19 0.01 23.81 0.31 23.92 0.02 < 0.001 0.057 3.16 ‐0.02
miR‐662 28.66 0.60 28.62 0.04 31.38 0.70 31.95 0.04 0.001 0.062 6.59 ‐0.71
miR‐29a* 32.23 0.18 32.17 0.01 30.48 0.38 30.48 0.02 0.003 0.109 ‐3.36 ‐1.57
miR‐376a* 32.32 0.22 32.39 0.01 30.87 0.57 30.76 0.04 0.010 0.251 ‐2.71 ‐2.74
T2 Late proliferative stage of menstrual cycle
miR‐23a 29.38 0.32 29.17 0.02 27.26 0.38 26.94 0.02 < 0.001 0.047 ‐4.32 0.33
miR‐574‐3p 26.27 1.44 26.90 0.09 20.67 0.35 20.44 0.02 < 0.001 0.047 ‐48.50 ‐0.04
miR‐128 24.42 0.27 24.16 0.02 26.03 0.47 25.62 0.03 0.001 0.101 3.05 ‐1.10
miR‐155 23.44 0.31 24.00 0.02 28.94 1.71 31.32 0.11 0.002 0.142 45.25 ‐1.67
miR‐224 25.53 0.29 25.68 0.02 24.45 0.19 24.22 0.01 0.006 0.239 ‐2.11 ‐2.48
miR‐362‐3p 28.31 0.11 28.29 0.01 29.42 0.37 29.25 0.02 0.006 0.239 2.16 ‐2.51
miR‐598 25.04 0.11 24.94 0.01 26.03 0.48 25.56 0.03 0.007 0.240 1.99 ‐2.65
miR‐662 28.53 0.11 28.65 0.01 31.89 0.66 32.97 0.04 < 0.001 0.019 10.34 0.93
miR‐93* 22.62 0.11 22.52 0.01 24.07 0.34 24.09 0.02 0.003 0.175 2.73 ‐1.70
miR‐29a* 32.06 0.34 32.35 0.02 30.48 0.34 30.41 0.02 0.009 0.362 ‐2.99 ‐2.70
T3 Mid‐secretory stage of menstrual cycle
miR‐155 23.36 0.36 23.25 0.02 28.54 1.62 30.21 0.10 0.003 0.408 36.25 ‐1.85
miR‐574‐3p 25.04 1.63 27.34 0.10 20.68 0.28 20.97 0.02 0.003 0.408 ‐20.68 ‐1.95
miR‐23a 29.22 0.36 29.32 0.02 27.74 0.47 27.44 0.03 0.006 0.427 ‐2.77 ‐2.40
miR‐425 22.47 0.24 22.29 0.02 21.64 0.16 21.69 0.01 0.007 0.427 ‐1.77 ‐2.47
miR‐662 28.66 0.26 28.83 0.02 31.93 0.51 32.42 0.03 < 0.001 0.041 9.65 0.26
miR‐93* 22.58 0.11 22.76 0.01 23.92 0.41 23.68 0.03 0.007 0.453 2.51 ‐2.49
*Results of the analysis using linear models with application of moderated t statistics (LIMMA package); comparison between women with endometriosis and healthy controls separately at each time point of menstrual cycle;
1Mean ‐ average normalised Cq values within a group; 2 SEM ‐ standard error of the mean; 3Median – median normalised Cq within a group; 495% CI – 95% confidence interval of the median miRNA expression within a group; 5p‐value – p‐value corresponding to T statistics; 6adj. p‐value – p‐value after adjustment for multiple testing by Benjamini and Hochberg’s method; 7FC – fold change. Negative FC designates downregulated miRNAs, positive FC – upregulated miRNAs. FC
represents “least FC”; 8B –log‐odds that the target is differentially expressed (B statistics).

CHAPTER 4
104 Victoria Nisenblat
(A)
(B)
Figure 4.2 Venn diagram representing a comparison between lists of differentially expressed miRNAs in
endometriosis, according to the phase of menstrual cycle (T1, early proliferative phase; T2, late proliferative phase; T3,
mid luteal phase). Panel A represents significantly differentially expressed miRNAs (p < 0.01), panel B represents
comparison of the miRNAs that exhibited trend for significance in differential expression in endometriosis
(0.05 > p > 0.01).

CHAPTER 4
Victoria Nisenblat 105
Hierarchical clustering broadly demonstrated that endometriosis patients cluster separately
from non‐endometriosis controls as expected (Figure 4.3). However the individual was a
stronger influence on clustering than disease status and cycle phase. This supported our initial
findings that none of the endometriosis‐ associated miRNAs were cycle phase dependent.
Notably, a subgroup of 3 control patients clustered separately with 3 endometriosis patients.
This was an unexpected finding. It could not be explained by the technical issues as all samples
were handled in a similar way by the same investigators and had similar quality of miRNA. The
hormonal and demographic profile of separately clustering endometriosis patients was
comparable to other endometriosis sufferers. Two of them had mild endometriosis (rASRM I‐
II) and one had severe disease (rASRM III‐IV) and none of them had additional pelvic pathology
or a history of any other medical condition that could confound the findings. Similarly, 3 of the
non‐endometriosis controls that exhibited similarity of molecular profile with the above
endometriosis subgroup did not have any features discriminating them from the rest of the
control group. The average age in this subgroup was higher than for other controls (38 vs.
33.3); however the age difference was comparable to the one with endometriosis group
(33.4±5.6) and complied with the study inclusion criteria.
A subgroup analysis excluding these patients was performed to determine if there was
significant confounding by these patients on the dataset. As in the original analysis, none of
the miRNAs demonstrated variations in expression across the menstrual cycle. However, the
number of the differentially expressed miRNAs at p < 0.01 was increased (n = 37) and within
the subgroup analysis 8 rather than 3 miRNAs now passed the correction for multiple testing
(data not shown). As the heterogeneity of our samples is likely to represent true biological
variability and the original analysis conservatively captured the most significantly
dysregulated miRNAs, we continued to explore the main dataset.
The results of the analysis on the data with a higher detection limit cut off (Cq > 35) or when
miRNAs present only in 1 sample were included, showed substantial overlap with the reported
results, suggesting that the choice of the most significantly differentially expressed miRNAs
was not substantially influenced by the ways the data was handled (data not shown).

CHAPTER 4
106 Victoria Nisenblat
Figure 4.3 Heat map analysis representing the top ranked plasma miRNAs dysregulated in endometriosis. The
analysis is based on p‐values generated with the moderate t statistics. The rank of the miRNAs is determined by
clustering based on the similarity of the miRNA expression patterns.
4.3.5 CorrelationofplasmamiRNAprofileinendometriosiswithpreviouslypublisheddataonmiRNAsignaturesinendometrialtissue
To explore whether plasma miRNAs correlate with the earlier established endometriosis‐
specific miRNA profile in the endometrium, we compared the list of differentially expressed
miRNAs with the previously published data from five large‐scale experiments. These studies

CHAPTER 4
Victoria Nisenblat 107
explored miRNA profiles in eutopic and/or ectopic endometrial tissue in women with and
without endometriosis, by using deep sequencing (205) or hybridisation microarray platforms
(206‐209).
(A)
(B)
Figure 4.4 Comparison of the differentially expressed plasma miRNAs in endometriosis with previously published
data on miRNA profile in endometrial tissue (eutopic and ectopic endometrium). Panel A represents comparison with 12
significantly dysregulated miRNAs, panel B – comparison with 45 miRNAs exhibiting trend for dysregulation.

CHAPTER 4
108 Victoria Nisenblat
Three of the 12 differentially expressed plasma miRNA were previously identified as
dysregulated in endometriosis in endometrial tissues (Figure 4.4A). The direction of regulation
of miR‐23a (209) and miR‐425‐5p (207), but not miR‐574‐3p (205), was concordant between
plasma and endometrial tissue. Of note, 11 out of 45 miRNAs with a trend for significance
were previously identified in association with endometriosis and 4 of these miRNAs were
identified in more than 1 study (Figure 4.4B).
4.3.6 ValidationofthearrayresultswithqRT‐PCRanalysisofmiRNAexpression
To confirm the comparability of TLDA‐based genome‐wide profiling with individual
quantifications, we further quantified the expression levels of 6 miRNAs using qRT‐PCR,
namely miR‐23a, miR‐155, miR‐128, miR‐662, miR‐93* and miR‐574‐3p that were amongst the
top ranked differentially expressed miRNAs. In this experiment we aimed to validate whether
experimental variables such as megaplex primer pools and preamplification step as well as
different principles of the analyses, e.g. ways of normalisation and statistical methods, had an
impact on final conclusions. We carried out the individual TaqMan mature miRNA expression
assays on the same group of subsets at 3 time points of the menstrual cycle.
Out of the 6 tested miRNAs that showed differential expression in plasma from endometriosis
patients by TLDA analysis, the levels of 4 miRNAs (miR‐128, miR‐155, miR‐662 and miR‐93*)
differed significantly in this singleplex qPCR at least at one phase of the cycle and when cycle
stage was disregarded in the analysis (Figure 4.5). Both miR‐662 and miR‐93* were
dysregulated at each stage of the menstrual cycle. MiR‐128 differed significantly at 2 and miR‐
155 at one stage of the cycle with an observed trend for differential expression at the other
cycle stages.
4.3.7 TheroleofthecirculatingmiRNAsinendometriosis
4.3.7.1 IdentificationofthepredictedmiRNAtargetsandinsilico
functionalanalysis
To analyse the possible role of the differentially expressed circulating miRNAs in
endometriosis, we determined the target mRNAs of the 12 differentially expressed miRNAs
by using the IPA Target filter. Experimental confirmation was available for 166 targets of 5
miRNAs and a further 2904 targets for 9 miRNAs were predicted with high level of confidence.

CHAPTER 4
Victoria Nisenblat 109
Figure 4.5 Validation of the TLDA data with individual qRT‐PCR assays. Expression profiles of the 4 significantly altered
miRNAs identified in plasma from women with and without endometriosis (Endo vs. Con, n = 8 in each group) across the 3
phases of menstrual cycle. Left panels: total samples irrespective of cycle phase; right panels: menstrual cycle phase
separate comparisons (T1 – early proliferative phase, T2 – late proliferative phase, T3 – mid luteal phase). Data are
presented as relative expression values normalised to spiked in cel‐miR‐54. [Median (middle line), interquartile range (top
and bottom lines)], statistical significance (Mann‐Whitney U test) was defined as p < 0.05. *** designates p ≤ 0.001;
**designates p < 0.01; *designates p < 0.05; NS designates “non‐significant”.

CHAPTER 4
110 Victoria Nisenblat
To ensure the completeness of the predicted mRNA target lists, we implemented an additional
target prediction algorithm (MirTarget2 tool) incorporated in the miRDB database and merged
both target datasets. Additional 264 targets predicted with high confidence (score > 80) were
identified. Overall, 3144 targets identified for 11 miRNAs with high confidence by both
methods (Supplemental Material on the enclosed CD, Table 1S) were subjected to an IPA core
analysis. The predicted targets were significantly enriched for several biological functions
known to be involved in endometriosis, including: gene expression, cellular movement, cell
death, and cellular growth and proliferation. Cancer, haematological disease, reproductive
disorders, immunological and inflammatory disease were among the diseases significantly
associated with the investigated targets (Figure 4.6A). The top canonical pathways enriched
for these predicted targets included molecular mechanisms of cancer, TGF‐β signalling,
peroxisome proliferator‐activated receptor‐α/ retinoid X receptor‐α (PPARa/RXRα) activation,
Wnt/CTNNB1 signalling, and gonadotropin‐releasing hormone (GNRH) signalling (Figure 4.6B).
Using a score of > 20 as a cut‐off, 14 molecular networks were identified by IPA and were
constituted by 464 predicted targets. The 2 top networks of gene expression and cell cycle,
tissue and embryonic development centre on CTNNB1 [β‐catenin [cadherin‐associated
protein)] and CCND1 (cyclin D1), both of which encode for multifunctional proteins that play
essential roles in development and tissue maintenance (Figure 4.6C). Other significant
networks of the identified targets converged on NFkB – TGFβR1/2, ER, PR and LH/follicle‐
stimulating hormone (FSH) all of which are associated with the endometriotic disease process.
The full list of the biological functions, canonical pathways and molecular networks associated
with the predicted targets are presented as Supplemental Material on the enclosed CD,
Table 2S.
4.3.7.2 Agreementbetweenthepredictedtargetsofderegulated
circulatingmiRNAswithvalidateddysregulatedgenesinendometriosis
Next, we investigated whether the predicted targets of the differentially expressed miRNAs
were in accordance with the results of the previously published mRNA profiles in
endometriosis in humans. Four publically available gene micro array datasets have been
deposited into the Gene Expression Omnibus http://www.ncbi.nlm.nih.gov/projects/geo;
with accession numbers GSE23339 (205) and GSE7305 (84) for endometrioma and eutopic
control endometrium, GSE11691 (85) and GSE5108 (83) for ectopic and eutopic endometrium
in endometriosis.

CHAPTER 4
Victoria Nisenblat 111
Figure 4.6 Ingenuity Pathways Analysis of the 3144 predicted targets of endometriosis‐associated circulating miRNAs.
(A) Most significant biological functions; (B) Most significant canonical pathways; (C) Molecular networks enriched by the
predicted targets centred around β‐catenin (CTNNB1) and cyclin D1 (CCND1): Gene expression, Cell cycle, Tissue
development, Renal development and function, Cardiovascular system development and function.

CHAPTER 4
112 Victoria Nisenblat
Hypothesising that the differentially expressed genes common to all the above studies are
likely to be specific to endometriosis independently of the site of the lesion, we focused only
on the list of genes that overlapped between the datasets. Hawkins et al., identified 116 up‐
regulated and 72 down‐regulated genes that intersect the 4 datasets (205). When the
intersect of the miRNA predicted target genes from 4 published studies was compared to
transcript targets of the differentially regulated plasma miRNAs, 59 overlapping transcripts
were identified (39 up‐regulated and 20 down‐regulated). The list of the mRNAs predicted to
be regulated by endometriosis associated plasma miRNAs that were also validated to be
dysregulated in endometrial tissue in endometriosis are presented as Supplemental Material
on the enclosed CD, Table 3S. The above mRNAs appeared to be predicted targets of the 11
out of 12 miRNAs (with an exception for miR‐93‐3p). An inverse correlation of expression was
observed for some miRNA‐mRNA pairs but not for others (Figure 4.7).
Figure 4.7 Plasma miRNA interactions with endometriosis associated mRNAs (overlapping between the predicted
targets identified in the current study and previously experimentally validated transcripts in 4 gene expression studies).
Functional activity is listed in figure panel for each transcript; up‐regulated (red), down‐regulated (green). An expected
inverse correlation of expression was observed for some but not all miRNA‐mRNA pairs.

CHAPTER 4
Victoria Nisenblat 113
An IPA analysis revealed that the top functions enriched in the predicted target genes involved
Cellular Function and Maintenance, p = 1.52E‐03 ‐ 4.91E‐02, Amino Acid Metabolism, p =
3.86E‐03 ‐ 3.86E‐03, Cell Morphology, p = 3.86E‐03 ‐ 3.05E‐02, Cell‐To‐Cell Signalling and
Interaction, p = 3.86E‐03 ‐ 4.91E‐02 and Cellular Assembly and Organization, p = 3.86E‐03 ‐
4.91E‐02. The investigated targets were incorporated in 6 molecular networks of cell cycle,
cell to cell signalling, cell survival, cellular development and immune cell trafficking. The 3
most significant networks centred on CCND1, NR3C1/TCR, and NFkB/CTNNB1. The list of the
biological functions and molecular networks associated with these targets are presented as
Supplemental Material on the enclosed CD, Table 4S.
4.4 Discussion
In this study we characterised the circulating miRNA profile in women of reproductive age
with and without endometriosis throughout the menstrual cycle. We used an RT‐PCR based
array platform to assess the miRNA expression in subsets with well characterised hormonal
profiles and absence of other pathologies, followed by in silico functional analyses of the
miRNAs of interest.
4.4.1 InfluenceofthemenstrualcycleonexpressionofcirculatingmiRNAs
This study revealed differences in plasma miRNA expression between women with and
without endometriosis across and at different phases of the menstrual cycle. However, cyclical
changes in reproductive steroids appeared to have little impact on plasma miRNA profiles in
either healthy control or endometriotic populations. This suggests there is considerable
potential to develop a non‐invasive diagnostic test using plasma miRNAs, although larger
samples numbers are required to optimise diagnostic algorithms, then determine the
sensitivity and specificity of the measurements prospectively in a test population.
Global miRNA profiling in whole blood has been performed in healthy reproductive age
women and demonstrated age related differences in miRNA plasma levels (362), however no
attempt was made to determine if cycle phase confounded the results. To our knowledge, this
is the first study to address the impact of the menstrual cycle stage on circulating miRNAs.
The regulation of miRNAs by ovarian steroids and vice versa is well documented in in‐vitro
experiments reviewed in (180, 197, 236‐237). Oestrogen‐dependent miRNA association with
the Drosha complex or inhibition of miRNA maturation at the level of processing pri‐miRNAs

CHAPTER 4
114 Victoria Nisenblat
are among the suggested mechanisms of this interaction (237‐239). E2 and P4, alone or in
combination with their antagonists (ICI‐182780 and RU486, respectively) altered the
expression of miR‐20a, miR‐21 and miR‐26a in isolated endometrial cells (209). MiR‐17‐5p,
miR‐23a, miR‐23b and miR‐542‐3p and their targets CYP19A1, StAR, and COX‐2 also exhibited
reproductive steroid dependence in human endometrial cell lines. As these miRNAs act to
promote cell proliferation, it was postulated that they may have a role in promoting
endometriotic lesion development, which is enhanced by an estrogenic environment (233).
Kuokkanen et al., identified 24 miRNAs that were differentially expressed when endometrial
epithelium from healthy women was analysed in the proliferative vs. secretory phase of the
menstrual cycle (235). Predicted targets of the menstrual phase specific miRNAs were
identified in a parallel mRNA microarray analysis and were associated with DNA replication,
cell cycle progression and cell proliferation. Menstrual phase specific endometrial
transcriptome signatures were characterised in several other wide genome mRNA profiling
studies (96, 363‐364).
In contrast, a miRNA profile sub‐analysis of eutopic endometrial tissues failed to demonstrate
menstrual phase differences in miRNA expression, although it was confined to a small
population of women with endometriosis (208). Other small studies have measured the
expression of individual miRNAs in human endometrium across the menstrual cycle and
identified cycle specific expression patterns. In one study, miR‐135a and miR‐135b showed a
reduction in endometrial expression levels at the time of ovulation in women with and without
endometriosis (240). Ramon et al., reported increased levels of miR‐15b, miR‐20a and miR‐
221 in secretory phase eutopic endometrium in healthy controls (241), despite a previous
report failing to observe cycle dependence in these miRNAs (235). Interestingly, researchers
were able to demonstrate a significant increase in miR‐15b, miR‐17‐5p, miR‐20a, miR‐125a,
miR‐221 and miR‐222 in secretory compared to proliferative phase endometrioma but did not
detect any cycle‐related expression differences in eutopic endometrium from women with
endometriosis.
The absence of significant menstrual phase variations in plasma miRNA expression does not
exclude the existence of miRNA‐hormonal interactions nor does it contradict the previous
reports of cycle‐dependant miRNA pattern in endometrial cells and tissue. Endometrial tissue
has a higher local concentration of reproductive steroid hormones than the systemic
circulation, thus E2 and P4 are likely to have a greater impact on endometrial miRNA profiles.

CHAPTER 4
Victoria Nisenblat 115
Secondly, cycle‐dependent hormonal changes induce multiple cellular events that are likely to
be regulated by and influence the levels of miRNAs (365). The circulatory miRNA profile is
comprised of miRNAs that have originated from various tissues and organs in the body. The
contribution of endometrial miRNAs may be masked by miRNAs of other origins and their
contribution to the cyclicity of miRNAs may not be able to be evaluated. Finally, the power of
our study may not have detected small but significant miRNA cycle phase variations in plasma
miRNAs and larger studies are warranted to explore this possibility. None of the miRNAs
identified in our study as having a trend to cycle phase variation have demonstrated steroid
dependence in vitro.
Our data indicates that the miRNA profile in reproductive age women is disease‐specific,
rather than cycle dependent and this applies to any miRNA and not only the ones linked with
endometriosis. This information is of particular importance in biomarker research, indicating
that the stage of the menstrual cycle in which blood is drawn, or the use of the hormonal
medications do not have a negative impact on the performance of a miRNA‐based test.
4.4.2 TheplasmamiRNAprofileinendometriosis
This is one of the first studies to identify endometriosis‐associated circulating miRNAs, in
which, we demonstrated a distinct miRNA expression pattern in the plasma from
endometriosis sufferers. The main objective of this study was to substantiate the hypothesis
via looking for promising lead markers that need to be followed up further. For this reason we
decided to minimise type 2 errors produced by correction for multiple testing, in order to
avoid exclusion of potentially important observations even if they may later prove to be false.
Therefore, the correction for multiple testing was applied to the data but was not considered
to be an eliminating factor in the selection of potentially relevant plasma miRNAs. Three levels
of confidence were assigned for observed dysregulated miRNAs: 1 – ‘highly significant’, which
was in keeping with an FDR of up to 5%; 2 – ‘significant’, for the type 1 error was below 1%
without correction for multiple testing, and 3 – ‘exhibiting trend for significance’, i.e. type 1
error 1‐5%, without correction for multiple testing. In this report, miRNAs detected at the first
2 levels were considered significant.
Six plasma miRNAs were up‐regulated and 6 down‐regulated in endometriosis compared to
healthy controls whereas 45 plasma miRNAs showed a trend to significantly differential
regulation in endometriosis. Interestingly, although we did not find menstrual cycle
dependent miRNA expression levels in either the control or endometriosis groups, 7 of the 12

CHAPTER 4
116 Victoria Nisenblat
miRNA transcripts were able to distinguish women with and without endometriosis only at
certain phases of the cycle. The late proliferative stage appeared to be the best sampling
phase with 10 of the miRNAs demonstrating an ability to distinguish women with
endometriosis from healthy controls. It may be that women with endometriosis have a mild
divergence from the usual physiological responsiveness to steroid hormones in the late
follicular phase that is apparent only when women with and without endometriosis are
compared. This could explain why women with endometriosis tend to have a prolonged
proliferative phase and are resistant to P4 compared to healthy controls (366).
Surprisingly 3 out of 8 disease‐free women clustered with the endometriosis cohort. Notably,
all were asymptomatic and had surgical verification of a normal pelvis. It is possible that
confounders such as smoking, nutritional status, subclinical infection or toxin exposure
influenced the data, despite an extensive history being taken (244, 252). A past history of tubal
sterilisation was the only common feature of this group; however blood sampling was
performed at least 6 month after surgery. It is possible that a chronic inflammatory host
response to necrotic fallopian tube tissue crushed by a Filshie clip could create a shift in miRNA
profile even 6 months after application. The inclusion of these patients did not generate false
positive findings from the dataset, as exclusion of these patients did not alter the list of
differentially expressed miRNAs and improved rather than reduced the significance level of
discrimination.
4.4.3 FunctionalinvolvementofdysregulatedplasmamiRNAsinendometriosis
Molecular networks constituted by the endometriosis‐associated predicted targets converged
on molecules involved in inflammation (NFkB), proliferation (MAPK), tissue remodelling (TGF‐
β) and steroidogenesis (ER, PR, LH, FSH), which is consistent with our current understanding
of the cellular events that occur in endometriosis. The top functional networks converged on
CTNNB1, and its downstream target CCND1. CTNNB1 is a key factor in the Wnt signalling
pathway and the MAPK and IKKB/NFkB cascades, all of which have a known association with
endometriosis (367‐368). Enhanced CTNNB1 signalling has been identified in ovarian cancer
and is thought to have a role in the malignant transformation of endometriosis (367, 369‐370).
The MAPK/pERK12 cascade, which has been shown to be up‐regulated in endometriosis, was
shown to increase CCND1 activity in early secretory endometrial stromal cells from women
with endometriosis, which consequently led to an aberrant endometrial proliferation (371).

CHAPTER 4
Victoria Nisenblat 117
Several plasma miRNAs identified in the current study are known to regulate CCND1, either
directly (miR‐155‐5p, miR‐23a, miR‐224‐5p, and miR‐425‐5p), or indirectly by targeting
transcription factors that regulate CCND1. For example CCND1 is attenuated by TR4 [NR2C2]
(nuclear receptor subfamily 2 group C member 2) and by VENTX (VENT homeobox), which are
both repressed by the endometriosis‐associated plasma miRNA miR‐362‐3p. CCND1 is also
up‐regulated by TCF4 (transcription factor 4) and E2F8 (E2F transcription factor 8), which are
repressed by miR‐128, miR‐155‐5p, miR‐23a, and by miR‐23a respectively. Interestingly, in
liposarcoma enhanced CTNNB1/CCND1 activity is also evident and this is linked to over‐
expression of miR‐155 (372)
Many studies have demonstrated that miR‐155 can act as an oncogenic miRNA (oncomir),
promoting tumourogenesis and cancer progression via translational inhibition of tumour
suppressor genes (372‐378) such as forkhead box O3 (FOXO3) gene, MNNG HOS transforming
gene (MET‐proto‐oncogene), cysteine kinase 1‐α (CK1α), a p53‐induced nuclear tumour
protein 1, and CCAAT enhancer binding protein‐β (cEBP‐β) (372, 375‐376, 379‐383). In our
study, endometriosis sufferers demonstrated higher plasma levels of miR‐155 than controls
and it is possible the increased epidemiological risk of developing cancer seen in women with
endometriosis, is conferred by this miRNA.
In summary, functional analyses of endometriosis‐associated miRNAs and their predicted
targets allowed identification of mRNA targets, biological and functional pathways and
molecular networks that demonstrate concordance with our current knowledge of the cellular
and molecular events associated with endometriosis. Additionally these analyses raise the
possibility that plasma miRNAs may provoke some of the adverse health epiphenomenon
associated with endometriosis. If this was validated in further study, therapeutic alteration of
endometriosis‐associated plasma miRNAs levels might have potential utility to reduce the risk
of health sequelae from endometriotic disease.
A subset of the identified target transcripts was previously found to be differentially expressed
in eutopic or ectopic endometrial tissue in endometriosis that has been shown by the
intersection of miRNA data with 4 available wide genome profiling studies. The interaction
between miRNAs under study and validated endometriosis associated genes did not show
reciprocal relationship for all miRNA‐mRNA pairs. Despite the fact that miRNAs negatively
regulate the expression of their target genes, this observation does not necessarily show lack
of functional relevance between the miRNA and mRNA in the datasets. Firstly, miRNAs act not

CHAPTER 4
118 Victoria Nisenblat
only through inducing target degradation, but also via translational repression, in which case
only protein levels would be altered. Moreover, miRNAs were also described as being able to
activate translation of their targets through binding to 3’ UTR sites, additionally supporting
that negative correlation of miRNA‐target transcript abundance does not necessarily hold true
(178). Finally, since each miRNA modulates translation of many genes simultaneously and vice
versa can be subjected to multiple sources of regulation, the relationship between miRNAs
and their targets is likely to involve complex mechanisms that might be particularly evident
for the interactions between different compartments. Collectively, our results further
highlight the putative role of miRNAs as contributors to endometriosis pathogenesis with their
main biological functions linked to the disease.
The origin of endometriosis‐associated circulating miRNAs remains unknown. Few miRNAs
were dysregulated in both plasma and endometrial tissue comparisons and all of the miRNAs
that were concordant in both types of study, were down‐regulated in plasma. It is therefore
unlikely that the direct excretion of miRNAs from endometriotic tissues into the circulation
accounts for the presence of endometriosis‐associated miRNAs. Endometriosis is associated
with well documented disturbances in several immune cell lineages (27) and endothelial cell
activation (24). It is plausible that systemic changes associated with endometriotic disease
enhance miRNA secretion into the plasma from altered immune or endothelial cells. For
example, the expression of miR‐155 is greatly increased in CD4+ T cells (384) and has been
shown to be induced by interferon‐β (IFN‐β), TNF‐α, IL‐1β and Toll‐like receptor ligand in
various immune cells (373, 385). The simultaneous regulation of many miRNAs may also
reflect a modulation of miRNA processing, as it is known that cellular stressors can affect the
expression of the enzyme Dicer that is essential for the biogenesis of mature miRNAs (386).
The discrepancy between the expression patterns between circulating miRNAs and miRNAs
from endometrial sources could be attributed to miRNA turnover in the blood. Thus, it is still
possible that some circulating miRNAs originate from the endometrium or endometriotic
lesions. There is no information available on the bioavailability and half life of the circulating
miRNAs at present to permit further evaluation of this possibility. Further experimental
studies are necessary to explore the mechanism by which endometriosis affects tissue versus
circulating miRNA levels.

CHAPTER 4
Victoria Nisenblat 119
4.4.4 Limitations
Our results should be interpreted with several limitations in mind. The first drawback of our
study is its small sample size. The data presented need to be confirmed in larger clinical
populations, particularly because the analysis of the disease severity and clinical subgroups
(i.e. pain vs. infertility) is hampered by small numbers of patients available in these sub‐
cohorts. Secondly, we could not provide molecular insights into the cause of the dysregulation.
It has been recently shown that exosomes and microparticles containing miRNAs can be
released into the extracellular environment and then be internalized by other cells. Therefore,
future studies will need to establish whether endometriosis‐specific miRNAs in the
bloodstream are contained in exosomes or microparticles, whether they can enter cells and,
eventually, which cells and whether they have any biological action. Moreover, since the
targets of miRNAs presented in the current study are just predictions based on mathematical
algorithms, the validation of miRNA targets in vitro in a cellular system, is essential to evaluate
the contribution of each miRNA to the overall modulation of gene expression. Overall, the
mechanisms underlying the dysregulation, as well as the putative impact of the changes in
circulating miRNAs levels in the physiology or pathophysiology of endometriosis remain to be
determined.
4.5 Conclusions
In summary, this study provides an initial insight into the nature and function of circulating
miRNAs associated with endometriotic disease. The results of the present study open two
main areas of investigation. An improved understanding of the source, regulation and
mechanism of action of circulating miRNAs may reveal new insights into the pathophysiology
and systemic manifestations of endometriosis. Additionally, these miRNAs may prove to be
biomarkers of disease or therapeutic targets for treatment of endometriosis. However, the
results need to be confirmed and expanded in larger clinical populations. This will be
particularly beneficial to determine if factors like disease severity and differences in clinical
symptomatology impact on circulating miRNA profiles.

CHAPTER 4
120 Victoria Nisenblat

CHAPTER 5
Victoria Nisenblat 121
Insightonthefunctionofthedysregulatedcirculating
miRNAs

CHAPTER 5
122 Victoria Nisenblat
5.1 Introduction
In the experiments reported in the previous chapter, we identified endometriosis specific
miRNAs in plasma. Next, we wished to determine if these miRNAs are known to be associated
with pathways linked to endometriosis and to understand how circulating miRNAs may
contribute to the endometriotic disease process. For this purpose, we performed a review of
seminal articles in the field with particular emphasis on the miRNA functional studies. In
parallel, we retrieved the data compiled in IKB regarding the functional interactions between
the dysregulated plasma miRNAs of interest.
Most of the circulating miRNAs identified by us have not been previously mentioned in the
context of endometriosis. We therefore evaluated their role across different pathological
conditions that share underlying pathophysiological mechanisms with endometriosis. In view
of the inflammatory (1, 6, 28, 77, 387‐388) nature of endometriosis and given that aspects of
the process of endometriotic disease resemble that of metastatic lesions in malignancy (1, 6,
16), it was of particular interest to identify the involvement of the investigated miRNAs in
aberrant immune function and in oncogenic processes.
5.2 Materialsandmethods
The current literature regarding each of the 12 miRNAs identified as significantly differentially
expressed in plasma in endometriosis was reviewed, with particular emphasis on their
involvement in human disease. The articles were identified using combinations of the
following search terms in Entrez Pubmed and Google scholar: miRNA and disease;
inflammation; immunity; endometriosis; reproductive tract; endocrine; E; P4 and the
particular miRNAs (miR‐155, miR‐128, miR‐362‐3p, miR‐662, miR‐93*, miR‐598, miR‐224, miR‐
425, miR‐23a, miR‐574‐3p, miR‐29a*, miR‐376a‐5p). In addition, IPA software was used to
access the experimentally validated data on the interrelationships of the miRNAs of interest.
5.3 Results
5.3.1 Theexperimentallyvalidatedfunctionsandinter‐relationshipsofthecirculatingmiRNAs
Using the IPA software, we were able to gain additional insights into the validated functions
and inter‐relationships between the circulating miRNAs. Reproductive system disorder, cancer
and endocrine disorder were the most significantly associated pathologies with these miRNAs.
Experimentally validated relationships were identified for 6 out of the 12 dysregulated miRNAs

CHAPTER 5
Victoria Nisenblat 123
and these were integrated into a transcriptional network converging on connective tissue
disorders, inflammatory disease and inflammatory response, as presented in Figure 5.1.
Figure 5.1 Example of the network enriched with 12 plasma miRNAs dysregulated in endometriosis, identified in IKB,
IPA software. The network is associated with Connective tissue disorders, Inflammatory disease, Inflammatory response;
score = 14.
Within the dataset, miR‐155 appeared to be one of the most highly connected to inter‐ and
intracellular molecular regulators with well characterised interactions. The regulatory loops
of miR‐155 involved TGF‐β and TP‐53 (tumour protein p‐53) signalling as well as KRAS and MET
proteins, which are at the heart of networks underpinning various malignancies. Additionally,
miR‐155 has been shown to interact with various inflammatory mediators, including TNF, ILs
and MMPs. This suggests that miRNAs, particularly miR‐155 might be a key factor linking
inflammation, immunity and neoplasia with endometriosis. MiR‐425‐5p and miR‐23a* were
demonstrated to be involved in the same functional network with miR‐155 via inflammatory
or oncogenic mediators, suggesting complex interactive regulation of these miRNAs and the

CHAPTER 5
124 Victoria Nisenblat
possibility of joint mechanisms of action. Hypoxia‐induced changes of Ago2, a critical
component of RISC, have been linked with aberrant expression of miR‐128, miR‐23a, miR‐376‐
5p and miR‐29a‐5p observed in cell lines (PASMC cells) (389). This suggests hypoxia as a
possible regulatory mechanism underpinning miRNA expression as well as the involvement of
these miRNAs in hypoxia‐mediated events in endometriosis, particularly in aberrant
angiogenesis and E2 signalling via possible modulation of the VEGF and HIF‐1α, respectively
(390‐391).
5.3.2 ReviewoftheroleofcirculatingmiRNAsinhumandisease
An outline of the pathological processes associated with the deregulated miRNAs, based on
the literature survey, is summarised in Supplemental Material on the enclosed CD, Table 5S.
5.3.2.1 Up‐regulatedmiRNAs
5.3.2.1.1 MiR‐155
MiR‐155 is one of the best described miRNAs and its aberrant expression has been reported
in the context of inflammatory, auto‐immune and malignant diseases (373, 384‐385, 392‐396).
Contained within the non‐coding B cell integration cluster (Bic) gene (397), miR‐155 has been
identified to regulate lymphoid development and immunity via modulation of the Toll‐like
receptor (TLR)‐, IFN‐β and TNF‐α ‐mediated acquired and innate immune responses (373, 384‐
385, 398‐401). In chronic inflammation, which is at the heart of autoimmune diseases, miR‐
155 exhibits increased expression in activated B, T and dendritic cells and is associated with
altered functions of these cells. In particular, the expression of miR‐155 is greatly increased in
CD4+ T cells, which is associated with the skewing toward the T‐helper 17 (Th17) cell lineage,
along with promotion of expression of the cytokines required for inflammatory T cell
development (384). Experimental mouse models show that miR‐155 deficient mice are
characterised by defective B and T cell immunity, and by substantial increase of IL‐10, a
cytokine associated with immunosuppressive activity against cell‐mediated responses and by
resistance to experimental induction of autoimmune conditions (384, 400‐402). Further, miR‐
155 has been shown to be induced by IFN‐β, TNF‐α, IL‐1β and TLR ligand in multiple immune
cell lineages (373, 385, 393, 403‐404). In an acute response, miR‐155 is characterized as a
component of the primary macrophage response to different types of inflammatory
mediators (405).

CHAPTER 5
Victoria Nisenblat 125
Aberrant expression of miR‐155 appears to mediate both pro‐ and anti‐inflammatory
activities, each of which could be involved in endometriosis (373, 384‐385, 392‐396).
The immune modulating effect of miR‐155 is a complex multifaceted process that appears to
involve many targets and pathways. For example, miR‐155 has been demonstrated to down‐
regulate the transcription factor PU.1, associated with reduction of immunoglobulin1 (IgG1)
class‐switched differentiation in B cells and thus enhances production of IgG antibodies (402).
On the other hand, activation‐induced cytidine deaminase (AID), another in vivo validated
target of miR‐155, is required for high‐affinity IgG antibody repertoire in antigen‐activated B
cells, in which case negative regulation by miR‐155 provides an opposite result (406‐407). In
chronic inflammation, miR‐155 might function to block the inhibitory impact of cytokines such
as IL‐4 and IFN‐γ on CD4+ T cells through repression of c‐Maf (408), and direct targeting of
IFN‐γ (409). Recent studies found that miR‐155 targets Sma‐ and Mad‐related protein 5
(SMAD5) in B cell lymphoma cells (410) and activates signal transducer and activator of
transcription 3 (STAT3) in breast cancer cells (375), factors involved in TGF‐β and IL‐6 signalling
with impact on Th cell lineage decisions.
MiR‐155 has been linked with an inhibitory role on inflammatory cytokine production in
response to microbial stimuli in activated antigen presenting dendritic cells via a negative
feedback loop in the TLR/IL‐1 cascade (399). Indeed, the silencing of miR‐155 in dendritic cells
has been associated with increased expression of the inflammation‐related genes, including
pro‐inflammatory cytokines IL‐1α, IL‐1β, IL‐6, IL‐8, TNF‐α and IL‐23, the chemokines
macrophage inflammatory protein (MIP)‐1α/β, MIP‐2α/β and MIP‐3α and IL‐1β‐converting
enzyme, caspase‐1 [apoptosis related cysteine peptidase] (CASP‐1) (399). Additionally, over
expression of miR‐155, induced by inflammatory cytokines, down‐regulates the production of
MMPs 1 and 3, the markers of the destructive inflammatory effects, suggesting a role for miR‐
155 in controlling tissue damage due to inflammation (393). Negative regulation of immune
responses by miR‐155 has been also observed through the targets of miR‐155 that encode
proteins involved in Lipopolysaccharide (LPS)/TNFα and TLR/IL‐1 signalling, such as the Fas
associated death domain protein (FADD), the IkB kinase epsilon (IKKέ) and the receptor
interacting serine–threonine kinase1 (RIPK1) (373, 405). Moreover, miR‐155 targets the
transcription factor cEBP, which activates IL‐6 gene expression (411).
In contrast, miR‐155 can promote an inflammatory response via increased production of
cytokines and chemokines, namely TNF‐α, IL‐6, IL‐1β, IL‐8, as demonstrated in CD14+ myeloid

CHAPTER 5
126 Victoria Nisenblat
cells in rheumatoid arthritis. Similarly, up‐regulation of miR‐155 provoked by exposure to LPS,
enhances TNF‐α production in mouse models (373, 405). The pro‐inflammatory effect of miR‐
155 has been observed, for example, through a mechanism involving reduced Src homology
2‐containing inositol phosphatase‐1 (SHIP‐1) that inhibits inflammation (392) and via
suppression of suppressor of cytokine signalling‐1 (SOCS1), a critical regulator of STAT
signalling (412). It has been also hypothesized that miR‐155 could increase cytokine levels
directly by augmenting transcript stability through binding to their 3’UTR (373).
In view of the above, deregulation of miR‐155 appears to be one of the central events in
pathogenesis of endometriosis. Indeed, various cytokines associated with an aberrant
immune response have been linked to the distant cell implantation (413), which also holds
true for establishment of endometriotic lesions (1, 6) and thus might be linked to the pro‐
inflammatory features of miR‐155. Moreover, a diminished immune response mediated by
miR‐155 and known to be associated with endometriosis would be expected to attenuate
clearance of endometrial implants from the peritoneum and further promote the enhanced
endometrial cell survival on the ectopic sites.
In line with these observations are the findings that miR‐155 modulates expression of
transcripts, namely IL‐1α, CASP1, Serpine [plasminogen activator inhibitor type 1], chemokine
(C‐X‐C motif) ligand‐1 (CXCL1) and epidermal growth factor receptor (EGFR), that in addition
to generation of inflammatory response are also involved in the genesis of many of the cellular
events described in endometriosis (381, 399, 414). This includes chemotaxis, angiogenesis,
axonal degeneration, cell migration, proliferation, apoptosis, production of PG‐E2 as well as
aberrant transcription factor NFkB, MAPK and TGF‐β1 signalling (1, 6, 30, 371, 415‐421). In
turn, the regulation of miR‐155 levels is hypothesized to be controlled, at least in part, by NFkB
(405), MAPK and by c‐Jun N‐terminal kinase (JNK) pathways (404), all of which have been
documented to have aberrant signalling in endometriosis (208, 371, 419‐420, 422‐425).
Multiple lines of evidence strongly support the significant role that miR‐155 plays in tumour
genesis and progression, acting predominantly as an oncogenic miRNA (oncomir) (373‐378,
426). An oncogenic effect of miR‐155 is demonstrated via translational inhibition of the
tumour suppressor genes, including mRNAs coding for transcriptional regulatory proteins,
receptors, kinases, and nuclear and DNA binding proteins. The direct targets of miR‐155 in the
context of cancer include FOXO3, Ras homolog gene family, member A (RHOA), melanocyte‐
stimulating hormone‐2 (MSH2), MSH6, SOCS1, MET proto‐oncogene, CK1a, SHIP and cEBP‐β

CHAPTER 5
Victoria Nisenblat 127
(375‐376, 379‐383, 426). Regulatory feedback loop of miR‐155 control involves aberrant TGF‐
β signalling, that is at the heart of various malignancies (427‐429) . Expression of miR‐155 is
induced by TGF‐β through Smad4 in animal models (376), whereas inhibition of TGF‐β1 in
siRNA transfected cervical carcinoma cell cultures (HeLa cells) results in decreased levels of
miR‐155 (429). MiR‐155 interacts with tumour protein p‐53 (TP‐53) signalling, which is a key
player in the cellular response to a variety of extra‐ and intracellular insults, such as DNA
damage and oncogenic activation. TP‐53 has been previously found to be over‐expressed in
endometriotic lesions (430), being linked to apoptosis resistance and enhanced survival of
endometrial implants (431). The activation of TP‐53 in lung cancer cell lines (H1299 cells)
increases expression of miR‐155 (432), whereas miR‐155 attenuates TP‐53 signalling via
repression of TP‐53‐induced nuclear protein 1 (TP‐53INP1), a proapoptotic gene downstream
of TP‐53 signalling (380).
5.3.2.1.2 MiR‐128
MiR‐128 is a brain‐enriched miRNA that promotes neural differentiation (433) and has been
found to be implicated in different cancers; for example, it is down‐regulated in glioblastoma
(434) however is up‐regulated in endometrial cancers (435). Although the underlying
mechanism of miR‐128 involvement in tumourogenesis is just beginning to emerge, previous
reports clearly demonstrate an anti‐proliferative effect of this miRNA. For example, over‐
expression of miR‐128 inhibits proliferation of glioma cells (436), reduces motility and
invasiveness of neuroblastoma cells (437), negatively regulates prostate cancer cell invasion
(438) and induces apoptosis pathways in embryonic kidney cells via modulation of the
proapoptotic BCL2‐associated X protein (Bax) (439). The expression of miR‐128 in bone
marrow of AML patients has been shown to be modulated by nucleoplasmin (NP1) (374), a
nucleolar protein involved in tumour‐associated chromosomal translocations and regulating
the stability and activity of TP‐53 (440), that in turn is involved in regulation of miR‐155 and
miR‐224.
5.3.2.1.3 MiR‐362‐3p
MiR‐362‐3p, associated with mesenchymal stem cells (MSC) (441), which are also referred to
as multipotent stromal cells, capable of self‐renewing and differentiating into multiple cell
lineages. MiR‐362‐3p has been found to be over‐expressed in the peripheral blood in
inflammatory bowel disease (442‐443), and in serum of patients with enteroviral infections

CHAPTER 5
128 Victoria Nisenblat
(444). MiR‐362‐3p is deregulated in blood cells of melanoma patients (445), is over‐expressed
in plasma in glioblastoma (446) and is over‐expressed in CD34+ cells from bone marrow in
acute myeloid leukaemia (AML) (447). In human myeloid leukemic cell line, AML‐193, miR‐
362‐3p is found to be regulated by the cytokines involved in growth and differentiation of
myeloid progenitors, namely IL‐3 and granulocyte macrophage colony‐stimulating factor (GM‐
CSF) (448). Further, miR‐362‐3p is down‐regulated in cerebral ischemia and is involved in
pathways associated with inflammation and apoptosis (449). MiR‐362‐3p is predicted to
target sex determining region Y‐related HMG box‐17 (Sox17), an inhibitor of Wnt signalling
pathway (450). Interestingly, the Wnt/ CTNNB1 pathway has been shown to be required for
the E‐induced proliferation of eutopic endometrium (451). Therefore, silencing of Sox17 by
elevated expression of miR‐362‐3p may result in a similar up‐regulation of the Wnt signalling
pathway and promote growth of ectopic lesions in endometriosis.
5.3.2.1.4 MiR‐662
While not much is known of miR‐662, it was recently shown that it is transiently up‐regulated
in response to high doses of X‐ray radiation in human fibroblasts (452) and was found to be
more frequently gained in cell lines highly resistant to chemotherapeutics (453). MiR‐662 is
up‐regulated in lupus nephritis (454), in lung cancer (455), in pituitary adenomas (456) and is
down‐regulated in cholangiocarcinoma (457) and ovarian cancer (458). The negative
correlation observed between miR‐662 and dual specificity phosphatase 5 (DUSP5) gene in
monocytic cell lines, suggests their functional interaction and involvement of miR‐662 in
monocytic differentiation via MAPK signalling (459). Hence, miR‐662 might have a similar
effect in endometriosis.
5.3.2.1.5 MiR‐93*
Although there are no reports that directly address the functional role of miR‐93* (miR‐93‐
3p), this miRNA belongs to the miR‐17 family, members of which, namely miR‐17, miR‐20a/b,
miR‐106a/b, and miR‐93, act as oncogenes and immune‐modulators within the functional
cluster miR‐17‐92 (460‐461). These miRNAs influence cell‐cycle progression via targeting of
CDKN1A, a potent negative regulator of the G1/S checkpoint (462‐463). They also directly
target proapoptotic gene BCL2L11/BIM, induce the angiogenesis inducer c‐Myc oncogene and
are involved in aberrant TGF‐β signalling (460, 464). The established relevance of the above
mechanisms in endometriosis supports the importance of miR‐93‐3p in the disease.

CHAPTER 5
Victoria Nisenblat 129
5.3.2.1.6 MiR‐598
MiR‐598 appears to be important for B lymphocyte development and is highly expressed in
human peripheral blood mononuclear cells, especially activated B cells (465). A previous
report showed that miR‐598 expression is up‐regulated in neural growth factor‐treated rat
pheochromocytoma PC12 cells (466), that might suggest its involvement in neo‐innervation
events that characterise endometriosis. MiR‐598 has been found to be down‐regulated in
glioblastoma (467) and in hepatocellular carcinoma (HCC) (468), but up‐regulated in chronic
lymphocytic leukaemia (CLL) (469) and in colorectal carcinoma (470). The putative binding
sites of the transcriptional factor Glial cells missing binding site (GBS), involved in cell cycle
signalling, have been identified in the promotor of miR‐598, indicating the involvement of GBS
pathway in regulation of miR‐598 expression (471). MiR‐598 is an endogenous inhibitor of
Sirtuin1 and the modulation of miR‐598 affects senescence, proliferation, and differentiation
in human adipose tissue‐derived MSC (472). Finally, the observed binding of miR‐598‐3p to
DNA‐cytosine‐5‐methyltransferase‐3 alpha (DNMT‐3α), known to be involved in DNA
replication, methylation and gene transcription, points toward a putative regulatory role of
this miRNA in fundamental cell processes (473).
5.3.2.2 Down‐regulatedmiRNAs
5.3.2.2.1 MiR‐224
MiR‐224 is highly over‐expressed in prostate, bladder and in HCC, but is down‐regulated in
ovarian epithelial and lung cancer (474‐475). MiR‐224 directly targets cell division cycle 42
protein (CDC42) (476) that contributes to G1/S phase progression through p70 S6 kinase‐
mediated induction of cyclin‐E expression, indicating the possible positive role of decreased
miR‐224 on cell development via eliminating translational suppression on G1 arrest (477).
Further, down‐regulation of miR‐224 in endometriosis attenuates other functions attributed
to this miRNA, such as inhibition of cell proliferation (478), promotion of apoptosis by
suppressing the apoptosis inhibitor API‐6 (479), mediation of TGF‐β1‐induced granulosa cell
proliferation via targeting SMAD4 and promotion of E2 release from granulosa cells via
CYP19A1 (480). Moreover, the loss of function study demonstrated that silencing of miR‐224
is associated with decreased expression of MMP9 (481), suggesting a pro‐inflammatory effect
of this miRNA. Similarly to miR‐155, the expression of miR‐224 is up‐regulated by factors

CHAPTER 5
130 Victoria Nisenblat
involved in inflammation, namely LPS, TNF‐α and NFkB pathway as well as the oncogene TP‐
53 (432, 482‐483).
5.3.2.2.2 MiR‐425
Over‐expression of miR‐425 has been described in several human cancer cells (484‐485),
supporting involvement of this miRNA in cell proliferation and oncogenic activity. MiR‐425
was identified activated in human sarcoma in association with RAS‐signalling (486) and down‐
regulated in a subset of human primary medulloblastoma in association with aberrant
Hedgehog signalling (487). MiR‐425 has recently been identified as over‐expressed in MSC
(441) and was demonstrated to promote osteoblast differentiation of MSC via targeting of
Sequestome1 (SQSTM1) involved in NFkB regulation (488). This suggests a possible role of
miR‐425 in the molecular mechanisms underlying cell self‐renewal, differentiation, replicative
senescence, and wound healing. Transfection of bone marrow CD133+ cells with miR‐425 led
to their significantly decreased proliferation and differentiation, likely via repression of the
ubiquitin proteasome system (UPS). MiR‐425 was found to be decreased in the CD133+
population in glioblastoma multiforme (GBM) where it inhibited neurosphere formation
through SMAD3 and SMAD4 activation in GBM stem cells (489). Thus, the down‐regulation of
miR‐425 in endometriosis might enhance proliferation and neurogenesis. Recently, it has been
shown that miR‐425 is regulated by the transcriptional repressor RE1‐silencing transcription
factor (REST), which is essential to prevent precocious neuronal differentiation and self‐
renewal of neural stem cells (490). MiR‐425 is over‐expressed in Treg cells, required for the
maintenance of immune homeostasis, including anti‐tumour immune response (385). MiR‐
425 is involved in human NK cell activation through IL‐2, IL‐15 and IL‐21 stimulation (491).
MiR‐425 is up‐regulated in cirrhosis and in human HCC cell lines (483), suggesting its role in
liver pathology and disease progression. MiR‐425 has been predicted to target methyl guanine
methyl transferase (MGMT) (492), an evolutionarily conserved DNA repair enzyme (493) that
restores guanine nucleotides that are alkylated at the O6 position to the native, undamaged
form. The under‐expression of miR‐425 observed in plasma in endometriosis can lead to
increased MGMT protein level, similar to that observed in normal immune cells that infiltrate
the tumour mass (494). Additional predicted targets of miR‐425 include DICER1 and SMAD2
(495). SMAD is involved in the regulation of DROSHA, another key player in small RNA
processing (496), indicating that aberrant expression of miR‐425 might have important effects
in the biogenesis of small RNAs.

CHAPTER 5
Victoria Nisenblat 131
5.3.2.2.3 MiR‐23a
MiR‐23a is linked to cell cycle, proliferation, differentiation, haematopoiesis, cardiac and
inflammatory disease (442‐443, 497). Similarly to other miRNAs, miR‐23a is involved in
progression and development of human cancers in cell‐dependent manner, being down‐
regulated in some types of cancers (prostate, lymphoma, leukaemia) and up‐regulated in
others (colorectal, bladder, gastric, breast, pancreatic cancer, glioblastoma, and HCC) (498).
MiR‐23a is one of the important players in the reproductive tract disorders (499). In human
granulosa cells, miR‐23a has been associated with inhibition of testosterone, cell proliferation
and apoptosis (478). MiR‐23a was found to be over‐expressed in plasma of women with
premature ovarian failure and appeared to have regulatory effects on proliferation and
apoptosis by targeting X‐linked inhibitor of apoptosis protein (XIAP), Phosphatase and tensin
homolog (PTEN), and CASP‐7 in human ovarian granulosa cells (500). Some other authors have
demonstrated down‐regulation of mir‐23a in ectopic compared to eutopic endometrium in
endometriosis (209, 233), while others observed up‐regulation in ovarian endometriomas
compared to eutopic endometrium in controls (207). While the expression of miR‐23a was
further down‐regulated by E2 and P4 in endometrial stromal cells, miR‐23a appear to play an
important role in steroidogenesis via targeting genes that play a central role in this process,
namely StAR, CYP19A1 and COX‐2 (233). Even though multiple mechanisms of miR‐23a activity
have been described, the particular relevance to the molecular events in endometriosis can
be also observed via the involvement of this miRNA in TNF‐α and TGF‐β1 signalling. The down‐
regulation of miR‐23a in endothelial cells has been shown to increase TNF‐α‐induced
endothelial cell apoptosis through regulation of the CASP‐7 and serine/threonine kinase4
pathways, suggesting protective effect of miR‐23a against TNF‐α activity (501). Additionally,
miR‐23a was found to be regulated by TGF‐β1 in a SMAD‐dependent manner in lung
adenocarcinoma cells and in contrast was demonstrated to regulate TGF‐β‐induced epithelial‐
mesenchymal transition by targeting E‐cadherin (502).
5.3.2.2.4 MiR‐574‐3p
Aberrant expression of miR‐574‐3p has been reported in association with several malignancies
and autoimmune diseases. MiR‐574‐3p is down‐regulated in bladder (503), lung (504) and
gastric cancer (505), however it is up‐regulated in urine of prostate cancer patients (506), in
lymphocytes in B‐cell lymphoma (507), in serum of HCC (508) and in salivary glands in Sjogren’s
syndrome (509). A tumour suppressor role of miR‐574‐3p has been demonstrated in

CHAPTER 5
132 Victoria Nisenblat
functional studies where miR‐574‐3p over‐expression inhibited the proliferation, migration
and invasion ability of gastric cancer cells (505). One of the proposed mechanisms involves
direct targeting of mesoderm development candidate 1 (MESDC1), which stimulates
proliferation and invasion ability in bladder cancer cells (503). Hence, the down‐regulation of
miR‐574‐3p observed in plasma in the current study may be associated with development and
progression of the endometriotic lesions. Although the regulatory mechanism of miR‐574‐3p
is largely unknown, miR‐574‐3p appears to be regulated by CTNNB1/TCF4 pathway, which is
embedded in the Wnt‐signalling network (510), shown to be deregulated in endometriosis
(511‐512). A recent functional study demonstrated that knock‐down of TAR‐DNA‐binding
protein‐43 (TDP‐43) caused significant reduction of miR‐574‐3p levels in HEK293T‐derived cell
lines (513). TDP‐43 is homologous to the heterogeneous ribonucleoproteins, which are
involved in RNA processing, and its abnormal function is a key feature of the
neurodegenerative diseases and decreased axonal growth (513‐514). Considering the well
documented state of aberrant innervation in endometriosis (515), it is possible to assume that
this, at least in part, is linked with alterations in TDP‐43 metabolism, that consequently leads
to a decrease in miR‐574‐3p expression, which further contributes to the pathogenesis of
endometriosis.
5.3.2.2.5 MiR‐29a*
MiR‐29a* (miR‐29a‐5p) belongs to the miR‐29 family, members of which share a common
seed region sequence and are predicted to target largely overlapping sets of genes. Even
though there are no reports on the functional relevance of miR‐29a*, the members of the
miR‐29 family are important regulators of human diseases (516‐519). Mir 29s have been
shown to have strong anti‐fibrotic and proapoptotic effects, along with involvement in cell
differentiation and immune regulation (519). For example, miR‐29 is down‐regulated in
activated immune cells and controls innate and adaptive immune responses by directly
targeting INF‐γ (520) as well as T cell polarization, and B cell oncogenic transformation (521).
The involvement of miR‐29 in malignancy has been linked to its ability to directly target the
series of oncogenes T cell leukaemia/lymphoma 1 (TCL1) and myeloid leukaemia cell
differentiation protein (MCL1) as well as to cause epigenetic changes characteristic of
malignancies. Members of the miR‐29 family have been shown to be down‐regulated in
aggressive and invasive forms of cancer, namely AML, CLL, breast and lung cancer, HCC and
cholangiocarcinoma (522). The miR‐29 family is known to target and down‐regulate DNMT3A,

CHAPTER 5
Victoria Nisenblat 133
DNMT3B, and DNMT1 (523), in which case down‐regulation of miR‐29 is linked with distortion
of the DNA methylation pattern with consecutive effect on genes involved in tumourogenesis
and apoptosis (524). TGF‐β1 signalling, a key driver of fibrosis, as well as the elevated NFkB
levels triggers silencing of the miR‐29 family (518, 525‐526). Therefore it is tempting to assume
that down‐regulation of plasma miR‐29a* observed in the current study might be directly
associated with aberrant TGF‐β1 and NFkB signalling in endometriosis.
5.3.2.2.6 MiR‐376a‐5p
MiR‐376a‐5p has been deregulated in a wide range of the diseases, including traumatic brain
injury, Alzheimer’s disease, squamous oesophageal carcinoma, pancreatic carcinoma,
endometrial carcino‐sarcomas, lung cancer, breast cancer, pleomorphic adenomas of the
salivary gland, primary pigmented nodular adrenocortical disease and medulloblastoma (527).
MiR‐376a‐5p is involved in signal transduction, long‐term potentiation, as well as negative
regulation of microtubule depolymerisation and microfilament motor activity.
5.4 Conclusions
In this chapter, we summarised the existing evidence on involvement of endometriosis‐
specific plasma miRNAs in human disease. Aberrant expression of these miRNAs has been
described in context of inflammatory, auto‐immune and malignant diseases. The functional
associations and regulatory mechanisms for most of the miRNAs under study is just beginning
to emerge, however it is evident that TP‐53, TGF‐β, MAPK, NFkB and Wnt signalling are likely
to modulate the expression of these miRNAs. Notably, for most of the investigated miRNAs,
the direction of deregulation tends to vary in different types of malignancy, suggesting their
ability to act as oncogene and as tumour‐suppressors, presumably in a tissue‐ or disease‐
specific manner. A similar pattern has been observed in the inflammatory response, being
particularly evident for miR‐155. Hence, the pro‐ and anti‐inflammatory as well as oncogenic
responses are finely regulated by miRNAs in different and still not entirely understood ways.
Altogether, these data point out that aberrantly expressed plasma miRNAs are involved in
numerous biological processes that have been linked to systemic and local tissue effects in
endometriosis. Moreover, miRNAs are closely integrated into regulatory networks and their
function depends on complex homeostasis of various miRNAs and their targets.

CHAPTER 5
134 Victoria Nisenblat

CHAPTER 6
Victoria Nisenblat 135
MiRNAexpressionprofileineutopicendometriumin
endometriosis

CHAPTER 6
136 Victoria Nisenblat
6.1 Introduction
Current models of endometriosis assume that endometriosis is characterised by intrinsic
endometrial abnormalities that also give rise to the impaired implantation and infertility
associated with the disease (1, 30). However, the mechanism by which the presence of disease
alters the eutopic endometrium is not established. Moreover, it remains unclear whether
alterations of the eutopic endometrium are the consequence of endometriosis or can be also
causally related to establishment of the disease.
We have identified endometriosis‐specific miRNA signatures in plasma (Chapter 4), which
raises provocative questions regarding their origin and potential biological role in the
pathogenesis of the disease. While the mechanism for how miRNAs reach the systemic
circulation is still unknown, we hypothesised that miRNAs are released from aberrant eutopic
endometrial tissue. Another possibility is that circulating miRNAs could directly influence
endometrial cells in both ectopic lesions and eutopic endometrium. Thus, characterisation of
the miRNA profile in eutopic endometrium can promote our understanding of the origin of
circulating miRNAs and of the molecular events involved in endometriosis. Previously, only
one group has specifically looked at miRNA expression in eutopic endometrium in
endometriosis, in comparison to women with leiomyoma (206). Even though no leiomyoma
associated miRNAs (528) were found to be dysregulated in the study, complex
interrelationships between miRNAs make it difficult to completely exclude that the study
findings were not confounded by leiomyoma.
We wanted to explore the correlation between dysregulated miRNAs in eutopic endometrium
and those identified in plasma in endometriosis (Chapter 4). An additional aim was to
determine if miRNA signatures in eutopic endometrium can discriminate between
symptomatic women with and without endometriosis and thus have potential as an
endometrial biopsy‐based test to diagnose endometriosis.
Two main confounders were addressed by the study. Firstly, several previous reports
suggested menstrual cycle dependent differences in miRNA (235) and gene expression (364)
in eutopic cycling endometrium in healthy subsets as well as in eutopic endometrium from
women with surgically proven endometriosis (96). In order to reduce the confounding effect
of cycle stage and given that transcriptome of the secretory stage of the cycle is the best
characterised in the literature, we focused on secretory endometrium. Additionally, the

CHAPTER 6
Victoria Nisenblat 137
selection of the control group is important as we assumed that endometrium of
endometriosis‐free women with pain or infertility might differ from that of disease‐free
women without any symptoms. We conducted large‐scale miRNA profiling using the
Affymetrix microarray platform using secretory endometrium obtained from symptomatic
(pain ± infertility) women with a surgically proven diagnosis of endometriosis and from the
groups of symptomatic and asymptomatic controls with surgically confirmed normal pelvis.
Each comparative analysis was performed separately for each control group as well as for the
combination of both.
6.2 MaterialsandMethods
6.2.1 StudyParticipants
Patients undergoing surgery for suspected endometriosis (pain ± infertility) or benign
disorders were approached for participation. The samples were collected in the period from
March 2010 to April 2011. The inclusion criteria were: women 18‐45 years of age with regular
menstrual cycles (21‐35 days), and a willingness to participate in the study. The exclusion
criteria were: breast feeding, pregnancy, cancer or any other systemic medical condition,
including acute infection at any site from 2 weeks prior to sample collection; known uterine
pathology, and any type of medical treatment at least 3 months preceding surgery. Menstrual
cycle phase was determined from the history of the last menstrual period and confirmed by a
serum hormonal profile and by histological evaluation of the tissue according to Noyes
criteria, which was performed by an experienced pathologist (529). Endometrial tissue was
obtained from the 17 participants undergoing laparoscopy for diagnosis and treatment of
pelvic pain ± infertility and from 11 asymptomatic participants undergoing laparoscopy for
benign disorders. A total of 13 patients were in the secretory phase of the cycle and were
included in the study.

CHAPTER 6
138 Victoria Nisenblat
6.2.2 Tissuecollection,RNAextractionandsamplequalitycontrol
The methodology used for tissue collection, RNA extraction and assessment of the quality and
quantity of the isolated miRNA samples are presented in Chapter 3. The characteristics of the
samples are presented in Table 6‐1.
Table 6‐1 Laboratory characteristics of the samples
Sample code nanodrop readings pre Dnase tx
Dilution
nanodrop readings post Dnase tx
Gel quality
Bioanalyser, RIN
A260/280
nm A260/230
nm Concentration
ng/ul
A260/280 nm
A260/230 nm
Concentration ng/ul
P1 2.02 1.57 917.75 X 2 1.96 1.57 250.24 good 6.2
P2 2.02 1.67 1660.23 X3 1.98 1.57 181.02 good 3.4
P3 1.94 1.62 423.25 1.96 1.56 169.24 good 5.7
P4 1.91 1.48 318.48 1.99 1.54 209.17 good 8.1
P5 1.99 1.26 235.03 1.93 1.25 175.56 good 8.2
Asympt ctrl 1 2.05 2.02 1144.54 X 2 1.98 1.79 289.3 good 4.1
Asympt ctrl 2 1.89 1.65 600.71 1.97 1.67 276.27 good 2.4
Asympt ctrl 3 1.8 1.94 3075.38 X 5 1.95 1.86 405.23 good 5.1
Asymp ctrl 4 2.03 1.46 1846.04 X5 2.02 1.45 181.97 good 3
Sympt ctrl 1 1.98 2.01 1072.59 X 2 1.97 1.82 230.88 good 8.3
Sympt ctrl 2 2.04 1.51 919.44 X3 2 1.57 196.4 good 6.6
Sympt ctrl 3 2.06 2.03 1105.53 X6 1.99 1.74 163.7 good 2.9
Sympt ctrl 4 1.92 1.36 162.38 1.9 1.32 124.06 poor 2.6
Despite adequate RNA integrity demonstrated by agarose gel electrophoresis in all the
samples, some had low RIN, suggesting degraded RNA. We could not explain the discrepancy
between these methods. It was unclear how this finding (the combination of low RIN and
appropriate charge and size separation on gel) could influence miRNA profiling. Both gel
electrophoresis and Bioanalyzer assessment did not directly assess the quality of miRNA in the
sample. Given the higher stability of miRNA compared to mRNA, it is possible that miRNAs in
a sample are preserved with good quality in a presence of degraded total RNA. Additionally,
spectrophotometric assessment revealed relatively low absorbance ratio A260/A230,
suggesting contamination of organic compounds. Repeat precipitation with isopropanol
followed by a wash with ethanol improved the result but it remained below the expected
value of 2.0. The consequence of this on the performance of the hybridisation array was
unclear. Thus, we undertook additional sample quality testing by performing qRT‐PCR,
assuming that the factors responsible for RT‐PCR inhibition are likely to interfere with
performance of hybridisation. We selected to test the samples with low RIN and 2 samples
with high RIN for miRNA expression by using TaqMan miRNA assays, aiming to exclude the
samples with poor PCR performance from the microarray experiment. The selected miRNAs
for testing with qRT‐PCR included miR‐222, that was reported as abundantly expressed miRNA

CHAPTER 6
Victoria Nisenblat 139
in luteal endometrium (235) and small RNA mammalian U6, known to be readily present in a
range of tissues and considered by many as a useful endogenous control. Overall, the assays
performed well in all the samples with SD of the technical replicates < 0.5 Cq. No direct
correlation was observed between the Cq values and RIN (Figure 6.1), thus all the samples
were included in the microarray experiment.
Figure 6.1 The relationship between endometrial miRNA levels measured by qRT‐PCR and RIN: expression of
miRNAs measured by qRT‐PCR in the samples with low and high RIN. No direct correlation was observed between the
quality of total RNA measured by RIN (Bioanalyzer) and the expression levels of miRNAs (miR‐222 and Mammalian U6)
expressed as Cq values (qRT‐PCR).
6.2.3 MiRNAprofiling
For miRNA expression screening in endometrial tissue, we used Affymetrix hybridisation
miRNA microarray, as presented in Chapter 3.
6.3 Results
6.3.1 StudyParticipants
A total of 13 participants met the inclusion criteria and were included in the study. Five women
were diagnosed with endometriosis (4 with minimal/mild, rASRM stage I‐II and 1 with
moderate, rASRM stage III), and 8 were surgically confirmed non endometriosis controls (4
women had the symptoms of pelvic pain and 4 were pain ‐free who had a laparoscopy for
surgical sterilisation, n = 3 or for uterine prolapse, n = 1). The patients age ranged from 27 to
42 years, all participants had a regular menstrual cycle, were documented not to be pregnant,
0
5
10
15
20
25
30
HC‐1 HC‐2 HC‐4 P‐2 P‐4 SC‐2 SC‐3 SC‐4
Mean
Cq ±SD
Sample ID
mir‐222
mammU6
RIN
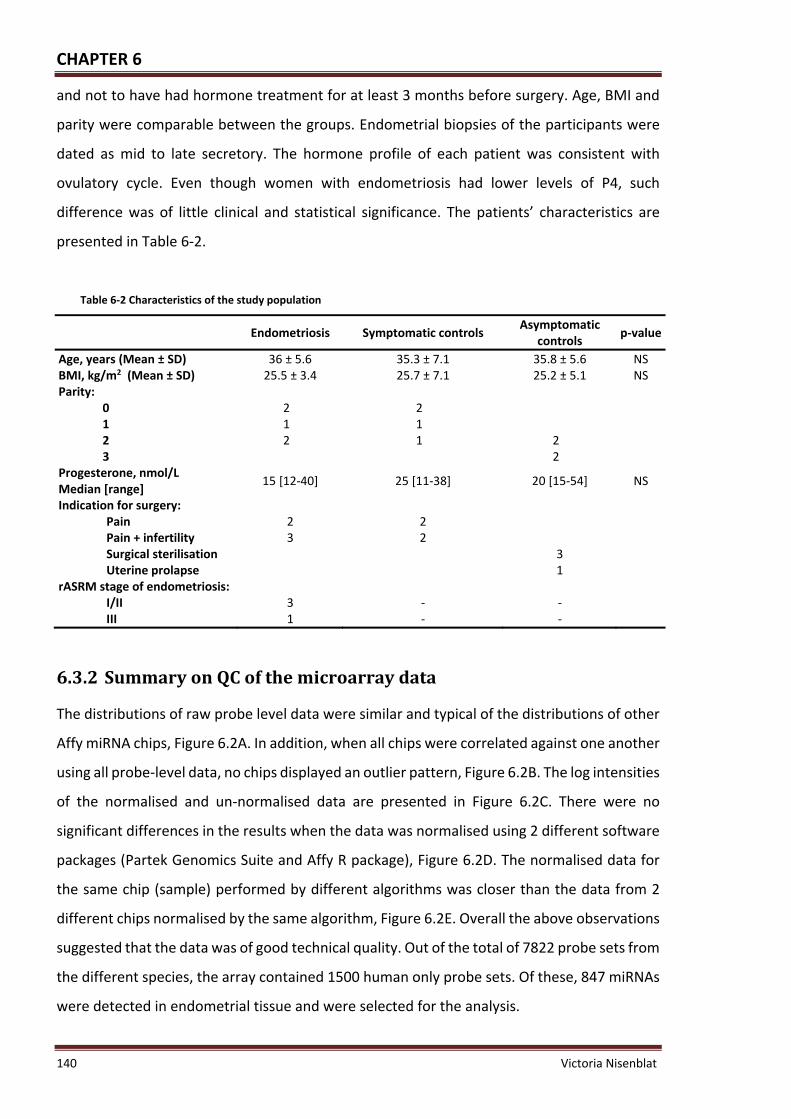
CHAPTER 6
140 Victoria Nisenblat
and not to have had hormone treatment for at least 3 months before surgery. Age, BMI and
parity were comparable between the groups. Endometrial biopsies of the participants were
dated as mid to late secretory. The hormone profile of each patient was consistent with
ovulatory cycle. Even though women with endometriosis had lower levels of P4, such
difference was of little clinical and statistical significance. The patients’ characteristics are
presented in Table 6‐2.
Table 6‐2 Characteristics of the study population
Endometriosis Symptomatic controls Asymptomatic
controls p‐value
Age, years (Mean ± SD) 36 ± 5.6 35.3 ± 7.1 35.8 ± 5.6 NS BMI, kg/m2 (Mean ± SD) 25.5 ± 3.4 25.7 ± 7.1 25.2 ± 5.1 NS Parity:
0 2 2 1 1 1 2 2 1 2 3 2
Progesterone, nmol/L Median [range]
15 [12‐40] 25 [11‐38] 20 [15‐54] NS
Indication for surgery: Pain 2 2 Pain + infertility 3 2 Surgical sterilisation 3 Uterine prolapse 1
rASRM stage of endometriosis: I/II III
3 1
‐ ‐
‐ ‐
6.3.2 SummaryonQCofthemicroarraydata
The distributions of raw probe level data were similar and typical of the distributions of other
Affy miRNA chips, Figure 6.2A. In addition, when all chips were correlated against one another
using all probe‐level data, no chips displayed an outlier pattern, Figure 6.2B. The log intensities
of the normalised and un‐normalised data are presented in Figure 6.2C. There were no
significant differences in the results when the data was normalised using 2 different software
packages (Partek Genomics Suite and Affy R package), Figure 6.2D. The normalised data for
the same chip (sample) performed by different algorithms was closer than the data from 2
different chips normalised by the same algorithm, Figure 6.2E. Overall the above observations
suggested that the data was of good technical quality. Out of the total of 7822 probe sets from
the different species, the array contained 1500 human only probe sets. Of these, 847 miRNAs
were detected in endometrial tissue and were selected for the analysis.

CHAPTER 6
Victoria Nisenblat 141
(A)
(B)
(C)
(D) (E)
Figure 6.2 Diagnostic plots ‐ exploratory analysis of the microarray data, Quality Control. Panel A represent the density
plots of distribution of the signal intensity between the arrays, raw data. All the arrays demonstrated similar unimodal
distribution, indicative for good quality with similar background intensities and absence of spatial artefacts. Panel B
represent the Heat map, demonstrating the distance between the arrays when all probe data of each array is plotted vs.
the others. The data exhibit reasonable correlation with no particular outliers. Panel C represent distribution of the array
intensities before and after normalisation, one box plot per array. After normalisation all the boxes had similar spread,
centring at the same level, suggestive of comparable quality homogenous data and absence of outliers. Panels D and E
demonstrate correlation of the normalised data between the 2 arrays (the normalised log2 intensities of each array
included in comparison is plotted on the separate axis (x and y): Panel D shows correlation between the same chip
normalised by 2 softwares, whereas Panel E shows correlation between 2 chips normalised by the same technique, both
are suggestive of good correlation within the data.

CHAPTER 6
142 Victoria Nisenblat
6.3.3 DifferentiallyexpressedmiRNAs
Two computational methods (ANOVA and LIMMA) were used to estimate differential
expression of miRNAs between the groups and miRNAs that were common to both methods
were added to the final miRNA list. Only 2 miRNAs were significantly differentially expressed
between the endometriosis and control groups (p < 0.01), of which one miRNA was
up‐regulated (miR‐551a) and 1 miRNA was down‐regulated (miR‐221). An additional 13
miRNAs demonstrated trend for statistical significance (0.01 < p < 0.05), (Table 6‐3 and
Figure 6.3). None of the miRNAs were significantly differentially expressed when multiple
testing correction was applied, thus the likelihood of “false discovery” was high.
Table 6‐3 Dysregulated miRNAs in eutopic endometrium in endometriosis (n = 5) vs. overall disease‐free
controls (n = 8)*
Endometriosis vs. All controls
ID FC1
LIMMA
FC1 ANOVA
p‐value2 LIMMA
p‐value2 ANOVA
adj. p‐value3 LIMMA/ANOVA
t4 LIMMA
t4 ANOVA
miR‐551a 1.83 1.77 0.002 0.003 0.76 3.82 3.98
miR‐221 ‐1.44 ‐1.43 0.007 0.003 0.94 ‐3.18 ‐3.82
miR‐335 ‐2.70 ‐2.54 0.002 0.012 0.76 ‐3.89 ‐3.04
miR‐615‐5p 1.68 1.38 0.003 0.012 0.94 3.50 3.04
miR‐223 2.18 2.13 0.010 0.027 0.94 2.99 2.59
miR‐141 3.78 3.67 0.011 0.030 0.94 2.93 2.52
miR‐214* ‐1.62 ‐1.67 0.014 0.021 0.94 ‐2.80 ‐2.74
miR‐513a‐5p ‐1.64 ‐1.65 0.023 0.006 0.94 ‐2.55 ‐3.47
miR‐629* 1.73 1.80 0.024 0.024 0.94 2.53 2.65
miR‐302c 1.38 1.29 0.024 0.047 0.94 2.52 2.27
miR‐134 ‐1.39 ‐1.38 0.025 0.024 0.94 ‐2.50 ‐2.67
miR‐409‐3p ‐1.44 ‐1.45 0.029 0.032 0.94 ‐2.43 ‐2.48
miR‐99a* 2.09 2.24 0.030 0.043 0.94 2.41 2.32
miR‐661 1.43 1.43 0.035 0.013 0.94 2.33 3.03
miR‐1287 ‐2.08 ‐2.31 0.040 0.020 0.94 ‐2.26 ‐2.77 * Summary of the miRNAs that overlap in both analyses, LIMMA and ANOVA; the level of significance was determined as p < 0.01, the trend for significance was determined as 0.01 < p < 0.05; 1 FC = Fold change = Expression E/Expression C. Negative FC means down‐regulated miRNAs in
endometriosis vs. controls, positive FC – up‐regulated miRNAs; 2 p‐value – probability of significant difference between the groups, not corrected for multiple testing; 3 adj. p‐value – associated p‐value after adjustment for multiple testing by Benjamini and Hochberg’s
method; 4 t = t‐statistics; miRNAs significant by both methods (p < 0.01) are presented in bold.

CHAPTER 6
Victoria Nisenblat 143
(A) (B)
Figure 6.3 MiRNAs dysregulated in eutopic endometrium in endometriosis demonstrated with 2 different analyses,
ANOVA and LIMMA. Panel A represents significantly dysregulated miRNAs, p < 0.01; Panel B represents miRNAs
exhibiting significance and trend for significance, p < 0.05.
Heat maps for the top ranked miRNAs showed segregation of the samples according to the
endometriosis and control status, with the exception for one endometriosis, and one control
from each subgroup, as presented in Figure 6.4. Considering separate clustering of the control
subgroups, we performed separate analyses by comparing samples of endometriosis with
each type of controls. Two miRNAs were significantly differentially expressed between
endometriosis and symptomatic controls (miR‐551a, miR‐148a*) and 2 miRNAs between
endometriosis and asymptomatic controls (miR‐551a, miR‐412), whereas 21 and 17 miRNAs
exhibited a trend to significance between the subgroups, respectively (Table 6‐4, Table 6‐5).
Little concordance was demonstrated between the lists of dysregulated miRNAs obtained
when endometriosis was compared separately to symptomatic or asymptomatic controls.
A direct comparison of the eutopic endometrium miRNA profile from symptomatic vs.
asymptomatic controls, revealed 4 significantly differentially expressed miRNAs of which 3
were up‐regulated (miR‐412, miR‐934, miR‐148a*) and 1 down‐regulated (miR‐1256) in
symptomatic controls and additional 27 miRNAs that differed with a trend for significance
(Table 6‐6).
Taken together, our results indicate that eutopic endometrium in endometriosis has a
distinctive miRNA profile. However, eutopic endometrium in women without endometriosis

CHAPTER 6
144 Victoria Nisenblat
represents a heterogeneous entity, exhibiting varying miRNA expression patterns in women
with pelvic pain and in symptom‐free women.
Figure 6.4 Heat map analysis ‐ the top ranked endometrial miRNAs dysregulated in endometriosis. The ordering of
the miRNAs is given by clustering based on the similarity of the miRNA expression patterns.

CHAPTER 6
Victoria Nisenblat 145
Table 6‐4 Dysregulated miRNAs in eutopic endometrium in endometriosis (n = 5) vs. symptomatic controls (n = 4)*
ID FC1
LIMMA FC1 ANOVA
p‐value2 LIMMA
p‐value2 ANOVA
adj.p‐value3 LIMMA/ ANOVA
t4 LIMMA
t4 ANOVA
miR‐551a 1.83 1.78 0.008 0.007 0.99 3.13 3.41
miR‐148a* ‐2.83 ‐2.51 0.003 0.008 0.99 ‐3.65 ‐3.33
miR‐365 ‐1.81 ‐1.61 0.003 0.018 0.99 ‐3.55 ‐2.82
miR‐335 ‐2.89 ‐2.81 0.004 0.017 0.99 ‐3.43 ‐2.87
let‐7f‐1* 2.58 2.21 0.013 0.039 0.99 2.86 2.38
miR‐221 ‐1.47 ‐1.46 0.016 0.006 0.99 ‐2.77 ‐3.46
miR‐140‐3p 1.68 1.66 0.016 0.018 0.99 2.75 2.82
miR‐223 2.35 2.44 0.018 0.027 0.99 2.71 2.60
miR‐181b ‐1.59 ‐1.61 0.020 0.016 0.99 ‐2.65 ‐2.89
miR‐767‐5p ‐2.16 ‐2.08 0.022 0.043 0.99 ‐2.59 ‐2.31
miR‐629* 1.94 2.03 0.023 0.022 0.99 2.57 2.71
miR‐513a‐5p ‐1.81 ‐1.74 0.023 0.009 0.99 ‐2.56 ‐3.26
miR‐1287 ‐2.62 ‐2.98 0.024 0.012 0.99 ‐2.55 ‐3.07
miR‐615‐5p 1.57 1.37 0.025 0.029 0.99 2.53 2.55
miR‐1299 ‐3.08 ‐3.02 0.025 0.038 0.99 ‐2.53 ‐2.39
miR‐27b* ‐1.59 ‐1.60 0.032 0.041 0.99 ‐2.39 ‐2.35
miR‐934 ‐1.62 ‐1.64 0.042 0.034 0.99 ‐2.25 ‐2.45
miR‐7 ‐1.58 ‐1.57 0.042 0.035 0.99 ‐2.25 ‐2.43
miR‐183* ‐1.87 ‐1.79 0.042 0.032 0.99 ‐2.25 ‐2.50 * Summary of miRNAs that overlap in both analyses, LIMMA and ANOVA; the level of significance was
determined as p < 0.01, the trend for significance was determined as 0.01 < p < 0.05; 1 FC = Fold change = Expression E/Expression C. Negative FC means down‐regulated miRNAs in
endometriosis vs. controls, positive FC – up‐regulated miRNAs; 2 p‐value – probability of significant difference between the groups, not corrected for multiple testing; 3 adj. p‐value – associated p‐value after adjustment for multiple testing by Benjamini and Hochberg’s
method; 4 t = t‐statistics; miRNAs significant by both methods (p < 0.01) are presented in bold.

CHAPTER 6
146 Victoria Nisenblat
Table 6‐5 Dysregulated miRNAs in eutopic endometrium in endometriosis (n = 5) vs. asymptomatic controls (n = 4)*
ID FC1
LIMMA FC1 ANOVA
p‐value2 LIMMA
p‐value2 ANOVA
adj.p‐value3
LIMMA/ ANOVA
t4 LIMMA
t4 ANOVA
miR‐412 1.86 1.90 0.004 0.000 0.93 3.45 5.06
miR‐551a 1.83 1.76 0.008 0.007 0.93 3.14 3.35
miR‐615‐5p 1.80 1.39 0.005 0.026 0.93 3.31 2.62
miR‐367* ‐1.67 ‐1.51 0.007 0.013 0.93 ‐3.22 ‐3.01
let‐7g* 3.13 2.47 0.007 0.026 0.93 3.16 2.61
let‐7i* 2.69 2.47 0.008 0.040 0.93 3.11 2.36
miR‐335 ‐2.52 ‐2.30 0.010 0.044 0.93 ‐2.98 ‐2.31
miR‐564 ‐2.46 ‐2.11 0.012 0.041 0.93 ‐2.92 ‐2.34
miR‐429 4.23 3.85 0.012 0.041 0.93 2.90 2.35
miR‐135b* 1.50 1.41 0.014 0.023 0.93 2.83 2.69
miR‐1256 ‐1.63 ‐1.74 0.015 0.002 0.93 ‐2.78 ‐4.10
miR‐141 4.40 4.34 0.018 0.036 0.93 2.71 2.42
miR‐454* ‐1.56 ‐1.76 0.019 0.003 0.93 ‐2.67 ‐3.94
miR‐214* ‐1.71 ‐1.76 0.023 0.028 0.93 ‐2.58 ‐2.57
miR‐302c* ‐1.92 ‐1.87 0.023 0.029 0.93 ‐2.57 ‐2.56
miR‐548f ‐1.81 ‐1.60 0.024 0.043 0.93 ‐2.55 ‐2.32
miR‐874 1.67 1.82 0.028 0.048 0.93 2.46 2.25
miR‐221 ‐1.41 ‐1.40 0.029 0.013 0.93 ‐2.45 ‐3.03
miR‐146b‐3p 2.61 2.51 0.031 0.036 0.93 2.41 2.42
miR‐302c 1.44 1.39 0.036 0.035 0.93 2.33 2.44
miR‐935 1.64 1.77 0.043 0.043 0.93 2.24 2.31
miR‐134 ‐1.42 ‐1.41 0.048 0.038 0.93 ‐2.18 ‐2.39
miR‐127‐3p ‐1.45 ‐1.46 0.049 0.041 0.93 ‐2.16 ‐2.35 * Summary of miRNAs that overlap in both analyses, LIMMA and ANOVA; the level of significance was
determined as p < 0.01, the trend for significance was determined as 0.01 < p < 0.05; 1 FC = Fold change = Expression E/Expression C. Negative FC means down‐regulated miRNAs in;
endometriosis vs. controls, positive FC – up‐regulated miRNAs; 2 p‐value – probability of significant difference between the groups, not corrected for multiple testing; 3 adj. p‐value – associated p‐value after adjustment for multiple testing by Benjamini and Hochberg’s
method; 4 t = t‐statistics; miRNAs significant by both methods (p < 0.01) are presented in bold.

CHAPTER 6
Victoria Nisenblat 147
Table 6‐6 Dysregulated miRNAs in eutopic endometrium in asymptomatic (n = 4) vs. symptomatic controls (n = 4)*
ID FC1 AveExpr2 t3 p‐value4 adj.p‐value5
B6
miR‐412 ‐2.41 3.62 ‐4.62 0.000 0.39 ‐3.35
miR‐1256 1.92 2.23 3.52 0.004 0.95 ‐3.68
miR‐934 ‐2.17 3.10 ‐3.44 0.004 0.95 ‐3.71
miR‐148a* ‐2.55 3.76 ‐3.11 0.008 0.95 ‐3.83
miR‐106a* 2.09 2.50 3.01 0.010 0.95 ‐3.87
miR‐671‐3p ‐2.52 5.22 ‐2.85 0.014 0.95 ‐3.93
miR‐29a* ‐1.59 2.05 ‐2.83 0.014 0.95 ‐3.94
let‐7g* ‐2.87 4.92 ‐2.77 0.016 0.95 ‐3.96
miR‐454* 1.62 2.46 2.74 0.017 0.95 ‐3.97
miR‐18b* ‐1.65 3.20 ‐2.71 0.018 0.95 ‐3.99
miR‐1322 1.49 2.27 2.67 0.019 0.95 ‐4.00
miR‐1305 ‐1.55 2.88 ‐2.66 0.019 0.95 ‐4.00
miR‐1294 ‐1.87 3.07 ‐2.61 0.021 0.95 ‐4.02
miR‐548f 1.89 2.87 2.60 0.022 0.95 ‐4.03
miR‐429 ‐3.89 4.55 ‐2.59 0.022 0.95 ‐4.03
let‐7f‐1* 2.45 4.13 2.57 0.023 0.95 ‐4.04
miR‐219‐2‐3p ‐1.77 2.71 ‐2.53 0.025 0.95 ‐4.05
miR‐374a ‐2.56 3.43 ‐2.48 0.027 0.95 ‐4.07
miR‐519b‐3p ‐1.51 4.21 ‐2.44 0.029 0.95 ‐4.09
miR‐421 ‐1.91 7.86 ‐2.43 0.030 0.95 ‐4.09
miR‐140‐3p 1.61 11.93 2.42 0.031 0.95 ‐4.10
miR‐217 1.57 2.46 2.40 0.032 0.95 ‐4.11
miR‐1296 1.59 7.32 2.30 0.038 0.95 ‐4.15
miR‐181d ‐1.74 8.23 ‐2.29 0.039 0.95 ‐4.15
miR‐212 ‐1.57 7.22 ‐2.25 0.042 0.95 ‐4.17
miR‐624* 1.43 2.38 2.23 0.043 0.95 ‐4.18
miR‐7 ‐1.61 2.43 ‐2.23 0.044 0.95 ‐4.18
miR‐567 1.50 2.76 2.23 0.044 0.95 ‐4.18
miR‐200c* ‐2.02 5.87 ‐2.22 0.044 0.95 ‐4.18
miR‐367* 1.44 2.33 2.17 0.049 0.95 ‐4.20
miR‐301a ‐3.02 4.13 ‐2.17 0.049 0.95 ‐4.20 * Summary of miRNAs that overlap in both analyses, LIMMA and ANOVA; the level of significance was determined as p < 0.01, the trend for significance was determined as 0.01 < p < 0.05; 1 FC = Fold change = Expression E/Expression C. Negative FC means down‐regulated miRNAs in
endometriosis vs. controls, positive FC – up‐regulated miRNAs; 2 AveExpr ‐ average normalised intensity values for each probe over all the arrays; 3 p‐value – probability of significant difference between the groups, not corrected for multiple testing; 4 adj. p‐value – associated p‐value after adjustment for multiple testing by Benjamini and Hochberg’s
method; 5 t = t‐statistics; 6 B –log‐odds that the target is differentially expressed (B statistics).

CHAPTER 6
148 Victoria Nisenblat
6.4 Discussion
Endometrium is a complex, dynamic, steroid hormone‐responsive tissue that undergoes
highly organized cyclic structural changes in preparation for embryo implantation during the
reproductive years. It has been suggested that miRNAs regulate endometrial function in a
steroid‐dependent manner and mediate cross talk between the uterine epithelium and
stroma.
The eutopic endometrium of women with endometriosis shares changes with ectopic tissue
and these changes are not found in the eutopic endometrium of disease‐free women,
suggesting that the primary defect in endometriosis are to be found in the eutopic
endometrium (530). MiRNAs have been profiled and compared from eutopic endometrium
from women in the secretory phase of the menstrual cycle of women with and without
endometriosis (206). This study revealed down‐regulation of miR‐9 and miR‐34 miRNA
families in endometriosis, reported to target BCL2 gene encoding for anti‐apoptotic protein
and p53 gene, encoding for oncoprotein TP53, respectively. Further, comparison of eutopic
endometrium from women with either mild or severe disease revealed an increased
expression of miR‐21 and DICER in severe disease (531).
In the present study, array based miRNA global profiling revealed differentially expressed
miRNAs in secretory eutopic endometrium in women with endometriosis. We profiled miRNAs
in whole endometrium, including both endometrial and stromal compartments, in well
characterised prospectively recruited subsets with surgical confirmation of having
endometriosis or being disease‐free. This experiment was conducted independently of the
circulating miRNAs profiling. Biopsy specimens were obtained during secretory phase of the
menstrual cycle to assure sampling of sufficient amount of endometrial lining which is
considerably thicker at this stage of the cycle. Also, we aimed to enable comparison with the
previously published work on endometrial miRNA profiling which was performed on secretory
endometrium (206).
Only a small number of miRNAs appeared to be differentially expressed in eutopic
endometrium in women with endometriosis in our study. However, our results revealed no
correlation with the previously published data (206). This could be explained by differences in
samples processing, in detection platforms as well as by differences in the type of control
subsets. Disease‐free controls in the study conducted by Burney et al., included endometrial

CHAPTER 6
Victoria Nisenblat 149
tissue samples obtained from women undergoing hysterectomy for uterine leiomyomas and
retrieved from the tissue bank, whereas in our study controls were prospectively enrolled
women without uterine pathology. Although none of the leiomyoma‐associated miRNAs (528)
appeared to be differentially expressed in this study, allowing the authors to assume that
leiomyomas were unlikely to affect expression of endometrial miRNAs, other characteristics
such as acute or chronic co‐morbidities could be an issue. Moreover, the previous study
included only moderate‐severe forms of endometriosis, whereas endometriosis in our study
was mainly of minimal‐mild form (4 out of 5 patients). There are recent reports of molecular
differences in the endometrium from women with mild vs. severe endometriosis (531). These
differences could reflect the miRNA signatures observed in both studies.
The results of this study showed little concordance with the previously published studies that
compared miRNA expression between eutopic and ectopic endometrium in endometriosis
(207‐208) and unpaired eutopic – ovarian endometrioma samples (205). These studies
compared 2 different tissue types in women with endometriosis and whereas all of our
experiments have compared the same tissue types between women with and without
endometriosis, thus, miRNA profile would be expected to be different. Inherent differences in
the sample population and in patient selection criteria as well as technical differences in these
studies could also contribute to these divergent findings. Together this emphasises the need
for further work in the miRNA field involving larger numbers of women.
Our results did not reveal a correlation between eutopic endometrium and the plasma miRNA
profile in endometriosis, suggesting that miRNAs in plasma do not reflect a passive release
from eutopic endometrial tissue. Growing evidence suggests that circulating miRNAs are
actively secreted by cells within the micro vesicles, micro particles, and protein complexes via
complex and still largely undisclosed mechanism (200, 214‐219). Nearly 30% of the released
miRNAs in vitro and in vivo do not reflect the expression profile found in donor cells (221). It
is thus possible that different stimuli alter the number, composition and origin of
microparticles (222), and modify the release of miRNAs (223), supporting the assumption that
packaging and extracellular transport of miRNAs is highly regulated process.
Changes in eutopic endometrium may be secondary to the peritoneal and plausibly peripheral
circulation alterations associated with endometriosis. Exosomal miRNAs have been
demonstrated to promote gene silencing in a similar fashion to cellular miRNAs (220, 226).
Furthermore, microvesicles isolated from the circulation of atherosclerotic patients, were

CHAPTER 6
150 Victoria Nisenblat
noted to induce response in endothelial cells similar to those observed in cells from
atherosclerotic lesions, suggesting involvement of circulating miRNAs in mediation of crosstalk
between the donor and target cells (223). Thus, circulating miRNAs may hypothetically serve
as messengers to influence gene transcription and modulate cell function of eutopic
endometrium through receptor‐ligand interactions. In this situation, endometrial cells would
not be expected to have a profile similar to plasma. In animal models eutopic endometrium
changes were observed after induction of endometriosis (53, 62, 68‐69), suggesting that
endometrial alterations are likely related to the disease progression, rather than an initiating
pathogenetic event.
Interestingly, hierarchical clustering of differentially expressed miRNAs in secretory
endometrium samples from our study showed segregation not only by endometriosis status,
but also by the type of control, i.e. the miRNA profile was different when disease‐free women
with pelvic pain were compared to those without pain. One of the possible explanations for
this finding is that the subgroup of endometriosis‐free controls with pelvic pain could have
had endometriosis that was overlooked at surgery. Although laparoscopy is still the gold
standard, it has some limitations in terms of false negative findings, such as mistaking lesions
for corpus luteum cyst, or missing a peritoneal lesion in difficult locations. The positive
predictive value of laparoscopic visualization of endometriosis is estimated at about 43‐45%
and depends on lesion type and location of lesion (119‐120), with overall sensitivity of 94%
and specificity of 79% of a laparoscopic diagnosis. Moreover, early stages of endometriosis
have been described as dynamic event that occurs intermittently in most women, suggesting
that the lesions that are not observed in certain women can appear later and vice versa (532).
Another reason may be that chronic pain alters the eutopic endometrium irrespective of
endometriosis. Previously, eutopic endometrium and myometrium in women with
endometriosis has been characterised by increased density of small unmyelinated sensory C
nerve fibres (533). These nerve fibres were also found in ectopic peritoneal endometriotic
lesions and in deep infiltrating endometriosis (534) and expressed a wide range of neural
function markers, such as VIP, neuropeptide Y, Substance P and calcitonin gene‐related
peptide, considered responsible for one of the mechanisms of pelvic pain in endometriosis
(535). Although the presence of the nerve fibres in functional layer of eutopic endometrium
was described as striking characteristic of endometriosis, 6 out of 35 women who did not have
endometriosis at laparoscopy, displayed endometrial nerve fibres which was strongly

CHAPTER 6
Victoria Nisenblat 151
associated with severe pain and infertility (159). It is possible that the neural markers and
associated active substances are increased in women with pelvic pain and modulate miRNA
profile.
In summary, the distinctive miRNA profile in endometrium revealed a set of miRNAs unique
for endometriosis. Although different miRNAs were differentially expressed when
comparisons with different type of controls were applied, over‐expression of miR‐551a
appeared to be consistently unique to endometriosis. MiR‐551a is a member of the cancer
inhibitory miRNA family and its down‐regulation has been found in prostate cancer (536), in
childhood acute lymphoblastic leukaemia (537), and in gastric cancer (538). Although the role
of this miRNA in endometrium and in endometriosis is still unclear, the targets of miR‐551a
were found to be involved in the molecular events associated with the disease. The gain of
function in vitro experiment with mimics of miR‐551a, demonstrated the suppressive effect of
miR‐551a on phosphatase regenerating liver‐3 (PRL‐3) gene, which is associated with
metastasis in gastric cancer, and is believed to play a causative role by promoting tumour cell
motility, invasion, and metastasis (538). PRL‐3 is over‐expressed in endometriotic tissue
compared to eutopic endometrium in endometriosis or in healthy controls and was associated
with the progression and recurrence of endometriosis (539). It is possible that the elevated
levels of miR‐551a found by us in eutopic endometrium in endometriosis represent a
compensatory mechanism to suppress PRL‐3 gene in endometrium. As indicated by data
obtained from miRBase, the predicted targets of miR‐551a include transcripts that have a
functional relevance in endometriosis. For example, one of the targets is Latrophilin 1, which
encodes for a subfamily of G‐protein coupled receptors that function in both cell adhesion and
signal transduction. Latrophilin 1 has been identified down‐regulated in eutopic endometrium
in endometriosis compared to ectopic endometriotic lesions (83), which is in agreement to
up‐regulated miR‐551a in our study. Another target, zinc finger protein 36 (ZFP36), is involved
in regulation of apoptosis and modulates TNF‐α‐induced regulation of IL‐6 and IL‐8, both of
which were found to be dysregulated in eutopic endometrium in endometriosis (540‐541).
Members of ZFP36 family, particularly ZFP36l1 were demonstrated to inhibit VEGF translation
in mice and thus down‐regulation of this transcript is required for angiogenesis (542), which
is one of the well‐described events in pathogenesis of endometriosis (543). Increased levels
of VEGF were detected in eutopic endometrium (544), in peritoneal fluid (545) and blood of
women with endometriosis (546). Finally, v‐erb‐erythroblastic leukaemia viral oncogene

CHAPTER 6
152 Victoria Nisenblat
homolog 4 (ERBB4) which is targeted by miR‐551a, is a member of the Tyr protein kinase
family and EGFR or subfamily that encodes for membrane protein able to induce a variety of
cellular responses including mitogenesis and differentiation (547), which are likely to play a
role in endometriosis.
As well as providing a better understanding of molecular events involved in endometriosis,
identification of the miRNA profile in eutopic endometrium could provide a basis for a
diagnostic testing via a minimally invasive endometrial biopsy procedure. The comparison
between women with pelvic pain ± infertility with and without endometriosis revealed 2
differentially expressed miRNAs, miR‐551a and miR‐148a*, which might become promising as
endometrial biomarkers of the disease and require further investigation.
6.5 Limitations
The main limitations of the current study include the small numbers in each group and lack of
verification by singleplex PCR. Moreover, the current study is descriptive and does not
examine the effect of miRNAs in endometrium. Further functional studies are required to
determine the role of miRNAs in eutopic endometrium in endometriosis.
None of the miRNAs identified in the current study passed correction for multiple testing,
which is most likely explained by the limited power of the study. To minimise the risk of false
positive results, we applied the stringent criteria including higher threshold for the level of
significance (p < 0.01) and selection of the results at the intersection of 2 types of statistical
analyses. Having said that, we cannot confidently state that the observed differences are free
of bias and do not contain expression differences found by chance.
6.6 Conclusions
In summary, this pilot study is the first report of the large‐scale miRNA profile in secretory
eutopic endometrium in association with endometriosis that addresses dysregulation
patterns of miRNAs in comparison to laparoscopically proven endometriosis‐free population.
The results of the current study indicate that altered miRNA expression profile in eutopic
endometrium provides putative candidates for further investigation of pathogenetic effects
associated with the disease as well as for the targeted drug discovery for endometriosis‐based
effects on endometrium. Our results also provide an initial insight into discovery of miRNA‐
based diagnostic test for endometriosis, which can incorporate endometrial biopsy either
solely or in combination with the blood test.

CHAPTER 6
Victoria Nisenblat 153

CHAPTER 6
154 Victoria Nisenblat

CHAPTER 7
Victoria Nisenblat 155
PlasmamiRNAsasanon‐invasivediagnostictoolfor
endometriosis

CHAPTER 7
156 Victoria Nisenblat
7.1 Introduction
The current diagnosis of endometriosis relies heavily on visualisation of the endometriotic
lesions at surgery. This is a procedure which carries considerable costs, confers risks such as
bleeding, infection and damage to adjacent organs and is one of the reasons for a significant
diagnostic delay (97, 99, 101, 548). Increased time between the onset of symptoms and a
diagnosis of endometriosis has been associated with: 1. worsened prognosis for fertility, 2.
increased physical and psychological morbidity due to a long duration of undiagnosed pain,
and 3. increased risk of repeated operative procedures (102). The younger a patient is when
symptoms start, the longer the delay to diagnosis of endometriosis (100). The development
of a non‐invasive diagnostic test for endometriosis is likely to reduce the long delay between
onset of symptoms and diagnosis and to improve patient quality of life. An effective non‐
invasive test for endometriosis would also promote clinical research, allowing development
and testing of novel therapeutic approaches. Despite the numerous studies that have been
performed in an attempt to identify a clinically useful marker for endometriosis that can
substitute for current invasive test for endometriosis, none are sensitive and specific enough
to be implemented routinely in clinical practice (133, 153).
The current study explores the potential usefulness of circulating miRNAs as a non‐invasive
diagnostic test for endometriosis. We developed methods to accurately and reproducibly
measure miRNA levels in plasma (Chapter 3) and identified a distinctive miRNA profile in
plasma of women with endometriosis by using miRNA arrays (Chapter 4). We also
demonstrated that the expression of the endometriosis‐modulated miRNAs does not vary
with the stage of the menstrual cycle (Chapter 4).
Here we present a prospective cohort diagnostic study in which we apply quantitative qRT‐
PCR measurements to a panel of endometriosis‐associated miRNAs isolated from plasma of
well characterised women with and without endometriosis. A panel of miRNAs that most
strongly differentiate women with and without endometriosis was selected for further
validation. The resulting miRNA profiles in plasma samples are correlated with diagnosis,
demographic and clinical parameters of the study population.

CHAPTER 7
Victoria Nisenblat 157
7.2 MaterialsandMethods
7.2.1 Studydesign
This study was divided into 3 phases: phase I – marker discovery, phase II – marker selection
and phase III – large‐scale validation and optimisation of the diagnostic model.
7.2.1.1 PhaseI‐Markerdiscovery
The marker discovery phase was a case‐control study based on global miRNA profiling in
plasma of women with endometriosis and disease‐free controls. Importantly, we used the
experimental array data presented in Chapter 4, but the approach to selection of the putative
targets and the group analyses was different, as described in Chapter 3. Differentially
expressed miRNAs identified at this stage were used for further analyses.
7.2.1.2 PhasesII‐III–Markerselectionandlarge‐scalevalidation
This was a study of prospective cohort design and included consecutive patients undergoing
laparoscopy for diagnosis and treatment of pelvic pain or infertility. In this set of experiments,
the putative miRNA markers identified in phase I were verified first in a small sample set
(phase II) and further validated and optimized on a larger set of samples (phase III).
7.2.2 Studyparticipants
Two different sets of patients were recruited for the study: symptomatic patients with
surgically verified endometriosis as well as asymptomatic healthy controls (for the study phase
I) and a cohort of symptomatic women with surgical diagnosis of either endometriosis or
disease‐free status (for the study phases II and III). With the exception of the asymptomatic
healthy controls, the participants included in both sets were recruited prior to the surgical
diagnosis.
7.2.2.1 PhaseI–markerdiscovery
The endometriosis group included 8 women with symptoms suggestive of endometriosis
(pelvic pain ± infertility) with surgical confirmation of the diagnosis and 8 asymptomatic
disease‐free women. The patients’ characteristics as well as the inclusion and exclusion
criteria are presented in Chapter 4.

CHAPTER 7
158 Victoria Nisenblat
7.2.2.2 PhasesII‐III–Markerselectionandlarge‐scalevalidation
A cohort of additional women with clinically suspected endometriosis who were admitted for
laparoscopy for investigation of pelvic pain ±infertility was prospectively enrolled. The
patients were identified at a preadmission outpatient visit and were operated between March
2010 and November 2011.
The inclusion criteria were: reproductive age (16‐48), clinical suspicion of endometriosis, and
willingness to undergo surgery for investigation and management of chronic pelvic pain.
Women on hormonal contraception or hormonal treatment were accepted. The surgery was
carried out at any stage of the menstrual cycle. Patients were excluded if their age was outside
of the inclusion criteria, they had a post or current malignant condition or history of chemo‐
or radiotherapy, had signs of ongoing acute infectious disease, or refused to participate in the
study.
A detailed medical history was taken from all participants. This included menstrual history,
pain symptoms, infertility, number and outcome of previous pregnancies, chronic diseases,
current medications, previous surgery and family history. Blood samples from all participants
were collected on the day of surgery prior to anaesthesia. The diagnosis of endometriosis was
made at surgery by direct visualization of the pelvic cavity. Suspected lesions were sent for
histopathology. The severity of endometriosis was classified according to the rASRM
classification system. Every surgical team included a senior gynaecologic laparoscopist with
more than 10 years’ experience in the diagnosis and management of endometriosis.
7.2.3 ProcessingofthesamplesandmiRNAprofiling
Blood processing, miRNA extraction and quality assessment of the samples was performed
using the techniques described in Chapter 3. TLDA A and B were used for a screening of miRNA
expression in phase I of the study. Only miRNAs that significantly differed between the groups
and passed a test for multiple test correction were considered for the subsequent validation
step by the singleplex assays with qRT‐PCR in phases II and III. All samples were processed
under similar conditions and run in single replicate for the array experiment and in triplicate
measurements for qRT–PCR for validation of selected putative target miRNAs. The techniques
of the miRNA profiling and approach to the data analysis are presented in Chapter 3.

CHAPTER 7
Victoria Nisenblat 159
7.2.4 Selectionoftargetstoexploreforadiagnostictest
7.2.4.1 StudyphaseII
Firstly, miRNAs identified in the array experiment were assessed using singleplex qRT‐PCR in
a small randomly selected set of plasma samples from 10 women with endometriosis and 10
controls. At this stage of analysis, we considered any changes that occurred between disease‐
free and endometriosis groups or between disease‐free and any of the subgroups of
endometriosis stratified by the severity of the disease to be of interest. Differences were
considered of interest if they appeared either at the level of statistical significance or showed
a trend for significance, which was defined as 0.05 < p < 0.1. A type I error of 10% was
considered acceptable for selection of miRNAs chosen for further follow up, given the
explorative nature of this experiment, with the aim of proceeding to a further validation step.
7.2.4.2 StudyphaseIII
Markers that appeared to be differentially expressed at the level of statistical significance or
by showing a trend for significance were validated in a large‐scale set of plasma from women
within the same cohort (49 women with endometriosis and 19 controls).
7.3 Results
7.3.1 PhaseI‐Markerdiscovery
A description of the participants recruited for this experiment is presented in the results
section of Chapter 4; the characteristics of the participants are summarised in Table 4‐1.
In total, out of 674 screened miRNAs, 325 were detectable in the blood in > 70% of the samples
and were used for the subsequent analyses (221 miRNAs on card A and 104 miRNAs on card
B). The performance of the arrays and quality control of the samples are presented in
Chapter 4.
We found a total of 76 miRNAs that were differentially expressed in plasma in women with
and without endometriosis. Of these, 25 miRNAs remained significant after correction for
multiple testing (13 miRNAs on card A and 12 miRNAs on card B) and were selected for further
validation by qRT‐PCR (Table 7‐1). Amongst these miRNAs, 16 were up‐regulated and 9 were
down‐regulated in endometriosis. None of the selected 25 endometriosis modulated miRNAs
showed fluctuation in the expression across the menstrual cycle in the endometriosis or in the
control group. The panel included RNU‐6B, a small nuclear non coding RNA also known as U6.

CHAPTER 7
160 Victoria Nisenblat
Even though it is not formally classified as miRNA, we included RNU‐6B in validation
experiments as a potential marker.
Table 7‐1 Dysregulated miRNAs in plasma in endometriosis, study phase I
miR name logFC1 AveExpr2 t3 p‐value3 adj. p‐val4 B5
miR 574‐3p 4.82 23.07 5.94 < 0.001 < 0.001 6.55
miR 155 ‐5.50 26.30 ‐5.87 < 0.001 < 0.001 6.31
miR 23a 1.95 28.30 5.72 < 0.001 < 0.001 5.82
miR 128 ‐1.23 25.13 ‐4.43 < 0.001 0.004 1.60
miR 362‐3p ‐1.00 29.09 ‐4.23 < 0.001 0.006 0.98
miR 148a ‐0.81 24.07 ‐4.16 < 0.001 0.006 0.78
miR 148b ‐0.59 25.02 ‐3.98 < 0.001 0.009 0.22
miR 30c ‐0.59 18.27 ‐3.56 < 0.001 0.026 ‐1.01
miR 502‐3p ‐0.86 28.65 ‐3.55 < 0.001 0.026 ‐1.01
miR 433 1.02 25.83 3.50 0.001 0.028 ‐1.16
miR 425 0.58 22.00 3.38 0.001 0.036 ‐1.48
miR 135b ‐0.81 30.75 ‐3.35 0.002 0.037 ‐1.59
miR 133a ‐1.00 23.63 ‐3.24 0.002 0.046 ‐1.87
miR‐662 ‐3.11 30.50 ‐6.99 < 0.001 < 0.001 9.20
miR‐93* ‐1.50 23.27 ‐6.09 < 0.001 < 0.001 6.45
miR‐29a* 1.47 31.52 4.58 < 0.001 0.002 1.81
RNU6B 1.21 31.66 4.14 < 0.001 0.007 0.53
miR‐378* ‐0.96 30.68 ‐3.41 0.002 0.039 ‐1.50
miR‐923 1.95 23.19 3.39 0.002 0.039 ‐1.54
miR‐630 1.91 31.35 3.32 0.002 0.040 ‐1.73
miR‐625* ‐0.93 21.47 ‐3.23 0.003 0.040 ‐1.95
miR‐661 2.00 28.30 3.20 0.003 0.0340 ‐2.02
miR‐550 ‐0.87 30.68 ‐3.12 0.003 0.044 ‐2.24
miR‐10b* ‐1.42 28.06 ‐3.19 0.003 0.040 ‐2.04
miR‐145* ‐0.95 29.23 ‐3.07 0.004 0.044 ‐2.35 1 log FC ‐ log2(‐fold change); FC = 2‐logFC; 2 AveExpr ‐ average normalised Cq values across all arrays in the experiment; 3 t ‐ moderated t‐statistics; 4 adj. p‐value –associated p‐value after adjustment for multiple testing by Benjamini and Hochberg’s
method; 5 B ‐ B‐statistics = log‐odds that the target is differentially expressed.

CHAPTER 7
Victoria Nisenblat 161
7.3.2 PhasesII‐III–Markerselectionandlargescalevalidation
7.3.2.1 Studyparticipants
Out of 76 women with clinically suspected endometriosis that were recruited for the study, 8
participants were excluded, because the blood samples collected from these women
underwent haemolysis and were inappropriate for testing. In total, samples from 68 women
were included for the analysis: 42 women were recruited from a private practice and 26
women from a public system. Altogether, 49 women were diagnosed with endometriosis, of
them 34 women with minimal‐mild disease (18 women at stage I, 16 women at stage II) and
15 women with moderate‐severe disease (12 women at stage III, 3 women at stage IV),
according to the rASRM endometriosis classification. Pelvic biopsy was performed in 46
(67.5%) women and confirmed the diagnosis based on visual inspection.
The mean age of the study population was 31.4 ± 9.4, ranging 16 ‐ 48 years. The mean BMI of
the study population was 25.4 ± 5.0, ranging 17.0 ‐ 41 kg/m2. The baseline characteristics of
this population are summarised in Table 7‐2. No significant differences in age, BMI, smoking,
stage or pattern of the menstrual cycle, general medical history, presence of polycystic ovary
syndrome (PCOS) or family history of endometriosis were found when the women with and
without endometriosis were compared. Few women used hormonal medications
(predominantly the combined oral contraceptive pills in our study population), however
hormonal use was significantly more common in women diagnosed with endometriosis than
in disease‐free women.
The Spearman correlation coefficients between expression levels of each of the tested miRNAs
and hormonal treatment were below 0.2 in both endometriosis and in control groups, which
indicated no association between hormonal treatment and miRNA expression and thus
suggested that hormonal treatment is not a confounding variable in this context.
The endometriosis group had a larger proportion of nulliparous women compared to the
control group, however a substantial proportion of women had never tried to conceive [26
(56.5%) in endometriosis group and 4 (22.2%) in the disease‐free group]. An analysis of women
who attempted conception showed similar parity and miscarriage rates for both groups.

CHAPTER 7
162 Victoria Nisenblat
Table 7‐2 General characteristics of the study population
Characteristics Endometriosis, n = 49 Controls, n = 19 p‐value
Age, years Mean ± SD Median [range]
30.04 ± 8.95 31 [16‐45]
34.74 ± 9.84 36 [22‐48]
0.069*
BMI, kg/m2 Mean ± SD Median [range]
25.13 ± 4.61 24 [18.1‐37.1]
25.98 ± 6.05 24.4 [17‐40.6]
0.617*
Smokers, n (%) 5 (10.9%)2 4 (25%)3 0.219*** Stage of menstrual cycle, n (%)
Early proliferative (day 1‐8) Late proliferative (day 9‐14) Luteal (day 15‐28) Undetermined
12 (24.5%) 12 (24.5%) 12 (24.5%) 13 (26.5%)
4 (21.05%) 2 (10.5%) 9 (47.4%) 4 (21.05%)
0.317***
Pattern of menstrual cycle, n (%) Regular (21‐35 days) Irregular Amenorrhea
41 (85.4%)1 7 (14.6%) 0 (0%)
16 (84.2%) 2 (10.5%) 1 (5.3%)
0.360***
Medical history, n (%) No chronic diseases Asthma Hypothyroidism Diabetes Mellitus Rheumatoid arthritis Anxiety disorder Heart transplant IBS
40 (81.6%) 3 (6.25%) 2 (4.1%) 0 (0%) 0 (0%) 3 (6.1%) 1 (2%) 0 (0%)
13 (68.4%) 1 (5.3%) 0 (0%) 1 (5.3%) 1 (5.3%) 2 (10.5%) 0 (0%) 1 (5.3%)
0.327***
PCOS, n (%) 5 (10.2%) 1 (5.3%) 1.0*** Family history of endometriosis, n (%)
No endometriosis Endometriosis
33 (71.7%)2 13 (28.2%)
13 (76.5%)4 4 (23.5%)
1.0***
Hormonal medications, n(%) 19 (39.6%) 2 (10.5%) 0.022*** Parity, n (%)
0 1 2 3
33 (70.2%)5 7 (14.9%) 6 (12.8%) 1 (2.1%)
7 (38.9%)6 7 (38.9%) 2 (11.1%) 2 (11.1%)
0.036***
Parity7, n (%) 0 1 2 3
7 (33.3%) 7 (33.3%) 6 (28.6%) 1 (4.8%)
3 (21.4%) 7 (50%) 2 (14.3%) 2 (14.3%)
0.451***
Miscarriages7, n (%) 0 1 2 3 4
13 (65%) 6 (30%) 0 (0%) 0 (0%) 1 (5%)
6 (42.9%) 4 (28.6%) 1 (7.1%) 2 (14.3%) 1 (7.1%)
0.279***
*Mann Whitney U test; *** Fisher’s exact test; 1 not recorded for 1 patient (2%); 2 not recorded for 3 patients (6%); 3 not recorded for 3 controls (16%); 4 not recorded for 2 controls (11%); 5 not recorded for 2 patients (4%); 6 not recorded for 1 control (5%); 7 in women who attempted conception, n = 34.

CHAPTER 7
Victoria Nisenblat 163
The clinical parameters, which included symptoms, duration of symptoms, and type of
infertility, are presented in Table 7‐3. All the women included in the study suffered from
chronic abdominal pain. The majority of women in both groups experienced pain from the age
of 12‐16 years (30 (63.8%) in endometriosis group and 9 (52.9%) in disease‐free women) with
no difference between the duration of the pain symptoms between the groups.
An assessment within the cohort of women who had tried to conceive, demonstrated no
difference in infertility rate or infertility type (primary vs. secondary infertility) between the 2
groups. Women with endometriosis and disease‐free women had comparable rates of
abnormal uterine bleeding (heavy menstrual or intermenstrual bleeding) and headaches.
Table 7‐3 Clinical characteristics of the study population
Characteristics Endometriosis, n = 49 Controls, n = 19 p‐value
Clinical setting, n (%) Private practice, n = 42 Public system, n = 26
37 (75.5%) 12 (24.5%)
5 (26.3%) 14 (73.7%)
< 0.001***
Symptoms, n (%) Pain Infertility Infertility3 Abnormal uterine bleeding
49 (100%) 10 (21.7%)1 10 (50%) 10 (20.8%)4
18 (100%) 9(50%)2 9 (64.3%) 6 (33.3%)2
0.029*** 0.495*** 0.340***
Duration of pain symptoms Since teenage years, n (%) Duration, years
Mean ± SD Median [range]
30 (63.8%)5 9.06 ± 6.96 7[1‐25]
9 (52.9%)6 11.18 ± 7.9 10[3‐28]
0.563*** 0.305** 0.240*
Types of infertility7, n (%) Primary Secondary Recurrent miscarriages
3 (30%) 6 (60%) 1 (10%)
0 (0%) 6 (66.7%) 3 (33.3%)
0.224***
Migraines, n (%) 20 (45.5%)8 10 (55.6%)2 0.579***Previous laparoscopies, n (%)
Endometriosis found Endometriosis not found
14 (29.2%)4 3 (6.3%)
4 (22.2%)2 6 (33.3%)
0.023***
Type of surgery, n (%) Laparoscopy Laparoscopic hysterectomy
45 (91.8%) 4 (8.2%)
15 (78.9%) 4 (21.1%)
0.206***
Other findings at surgery Fibroids 3 (6.1%) 2 (10.5%) 0.541***Endometrioma 8 (16.3%) Hydrosalpinx 1 (2%) 1 (5.3%) 0.632***CIN III 1 (2%) 0 (0%)
*Mann Whitney U test; ** Student t‐test; *** Fisher’s exact test; 1 not recorded for 3 patients (6%); 2 not recorded for 1 control (5%); 3 in women who attempted conception, n = 34; 4 not recorded for 1 patient (2%); 5 not recorded for 2 patients (4%); 6 not recorded for 2 controls (11%); 7 within infertile population, n = 19; 8 not recorded for 5 patients (10%).

CHAPTER 7
164 Victoria Nisenblat
A total of 27 women had previous laparoscopic surgery for investigation of pelvic pain. Women
in the endometriosis group had a higher rate of previous laparoscopies with positive findings
of endometriosis and a lower rate of laparoscopies negative for endometriosis compared to
controls p = 0.023, Fisher’s exact test. In 18 women a diagnosis of endometriosis was
confirmed at previous surgery (14 (29.2%) from endometriosis and 4 (22.25) from disease‐free
group) and in 9 women the endometriotic lesions were not detected at previous surgery (3
(6.3% in endometriosis and 6 (33.3%) in the disease‐free group).
There was no statistically significant difference in type of surgery, laparoscopy or laparotomy,
between the groups. There was a comparable rate of fibroids and hydrosalpinges between
the 2 groups of women. Endometrioma was present in 8 women (16.3%) in the endometriosis
group.
There were no statistically significant differences between women attending private practice
or the public health system for any of the considered demographic, clinical or surgical
variables. Exception was the rate of infertility and miscarriages that were more prevalent in
patients attending public service (data not shown). Patients attending the private practice had
a higher rate of diagnosis, especially for severe disease, however this is unsurprising as this
practice predominantly received tertiary referrals.
7.3.2.2 QualitycontrolofthesamplesandmiRNAassays
The average Cq values of the spiked‐in synthetic cel‐miR‐54 in all selected samples were
19.5 ± 0.6, 20.9 ± 0.5, 20.2 ± 1.2, 20.7±0.4 (mean ± SD, presented separately per each PCR
reaction plate), with a coefficient of variance (CV) of 3%, 2.5%, 5.9% and 1.9%, respectively.
The above results suggested a satisfactory and comparable RNA extraction efficiency across
the samples. The miRNA across the plasma samples accounted for 55%‐92% of total small
RNAs with median concentration of 346.3 pg/µl, ranging 154‐796 pg/μl. The summary of the
samples with cel‐miR‐54 levels and Bioanalyzer results are presented in the Supplemental
Material on CD, Table 5S.
The SD of the sample replicates for each of the assays for investigated miRNAs did not exceed
0.5 Cq. The amplification efficiency for the majority of included assays was between 90% and
110%, ranging from 88% to 175%. A Spearman's Rank Order correlation was run in 20 samples
for each detector to determine the relationship between corrections to efficiency of
amplification vs. assumption of efficiency of 100%. There was a strong, positive correlation

CHAPTER 7
Victoria Nisenblat 165
between corrected and uncorrected raw CT values for each detector, which was statistically
significant at the 0.01 level, rs = 1 for each miRNA, implying that a correction for efficiency did
not change the expression pattern of tested miRNAs.
7.3.2.3 Selectionandvalidationoftheendogenouscontrolsfor
quantificationofplasmamiRNAs
For the purpose of this study, we used a systematic approach to identify suitable endogenous
controls, as described in Chapter 3. First, we identified a set of putative normalisers via
application of GeNorm algorithm in the array experiment. The expression stability M value
was lowest for 3 miRNAs for card A out of the 43 candidates and for 3 miRNAs for card B out
of the 24 candidates. According to the pair‐wise variation V value, 2 endogenous controls
turned out to be sufficient to normalize expression levels for each of the array cards (V 2/3 =
0.012 for card A and V 2/3 = 0.008 for card B). Interestingly, mammalian U6, used as a stable
and reliable endogenous control in other studies (211, 549), had the highest M‐value and was
less abundant compared to the other miRNAs identified by GeNorm. Two endogenous
controls from card A (miR‐28‐5p and miR‐30b) and 3 endogenous controls from card B (miR‐
30a, miR‐30d and miR‐30e‐3p) were selected for validation and were subjected to qRT‐PCR
assay using 20 samples. The assessment of validity of the endogenous controls included the
following: 1 – each of the selected candidate controls demonstrated negative NTC signals; 2 ‐
the serial dilutions of the purified RNA samples revealed excellent assay linearity; 3 ‐ each of
the selected candidate endogenous controls was readily detected across the samples ; 4 –all
the candidate controls had small variation across the samples with coefficient of variance <
0.05; 5 – None of the putative endogenous controls exhibited expression differences between
the groups (endometriosis vs. controls). Notably, one of the putative endogenous controls
miR‐30c was also identified to be one of the significantly differentially expressed miRNA when
quantile normalisation was performed. Considering that miR‐30c did not exhibit any superior
qualities to other normalisers, we decided to treat it as a target and omitted it from the list of
the normalisers. Given that using more than one endogenous control ensures the least
variation due to untested samples and conditions (305), we selected miR‐28‐5p and miR‐30b
as normalisers for the assays originated from card A and miR‐30a, miR‐30d and miR‐30e‐3p
for normalising the assays form card B. A geometric mean of these miRNAs was selected as a
normalisation control for quantification of plasma miRNAs in single qRT‐PCR experiments.
CHAPTER 7
166 Victoria Nisenblat
7.3.2.4 Markerselection
To validate the putative markers for endometriosis identified in the array experiment, we first
examined the expression levels of the candidate miRNAs by using qRT‐PCR on a small set of
randomly selected plasma samples from 10 women with endometriosis and 10 disease‐free
women. The investigated candidate miRNAs included 13 miRNAs identified on card A (miR‐
128, miR‐133a, miR‐135b, miR‐148a, miR‐148b, miR‐155, miR‐23a, miR‐30c, miR‐362‐3p, miR‐
425, miR‐433, miR‐502‐3p, miR‐574‐3p) and 11 miRNAs identified on card B (miR‐662, miR‐
93‐3p, miR‐29a‐5p, miR‐RNU6B, miR‐378a‐5p, miR‐630, miR‐625‐3p, miR‐661, miR‐550a‐5p,
miR‐10b‐3p, miR‐145‐3p). MiR‐923, identified on the array card B, has been removed from
the Sanger database v.18 as it appeared to be a fragment of the 28S ribosomal RNA, and
therefore was not included in the validation experiments.
Our data indicated that miR‐135b, miR‐662, miR‐29a‐5p and miR‐RNU6B were expressed
below the established detection threshold in both endometriosis and disease‐free groups and
thus were excluded from the subsequent analyses. The circulating expression levels of the
remaining 20 miRNAs were analysed (12 miRNAs identified on the card A of the array and 8
miRNAs identified on the card B). The expression levels and fold changes of the candidate
miRNAs assessed in the study phase II are summarised in Table 7‐4.
Although there was no significant difference in the expression levels of any of the investigated
miRNAs between endometriosis and disease‐free groups, miR‐155, miR‐574‐3p and miR‐630
tended to be down‐regulated in endometriosis, exhibiting a trend for statistical significance
(FC = 1.8, p = 0.075 and FC = 1.7, p = 0.063 and FC = 1.2, p = 0.075, respectively).
In the endometriosis group, 5 women had minimal–mild disease (rASRM stage I‐II) and 5
women had moderate–severe disease (rASRM stage III‐IV). The analysis revealed that the
expression levels of 4 miRNAs were lower in minimal‐mild endometriosis than in disease‐free
women [miR‐155 (FC = 2.3, p = 0.04), miR‐30c (FC = 1.3, p = 0.075), miR‐425 (FC = 1.9, p =
0.099), 574‐3p (FC = 1.9, p = 0.099)] (Table 7‐5). There was a tendency towards an increase in
the expression levels of these miRNAs in the more severe forms of the disease.

CHAPTER 7
Victoria Nisenblat 167
Table 7‐4 miRNA expression in plasma in endometriosis (n = 10) and in disease‐free women (n = 10); validation of
the TLDA results by qRT‐PCR*
miRNA MirBase accession number
Disease‐free controls n = 10 Endometriosis n = 10 Average Fold Change
p‐value Mean ± SEM
Median (range)
Mean ± SEM
Median (range)
miR‐128 MIMAT0000424 1.43 ± 0.46 1.05
(0.68‐5.53) 0.97 ± 0.11
0.92 (0.61‐1.73)
‐1.24 0.393
miR‐133a MIMAT0000427 3.34 ± 1.32 2.04
(0.87‐14.34) 3.18 ± 0.44
3.42 (0.67‐4.91)
1.21 0.156
miR‐148a‐3p MIMAT0000243 0.05 ± 0.03 0.03
(0.02‐0.28) 0.03 ± 0.004
0.025 (0.02‐0.05)
‐1.22 0.796
miR‐148b‐3p MIMAT0000759 0.06 ± 0.03 0.03
(0.02‐0.03) 0.04 ± 0.003
0.04 (0.02‐0.05)
‐1.14 0.853
miR‐155 MIMAT0000646 1.65 ± 0.45 1.18
(0.63‐5.52) 0.87 ± 0.14
0.94 (0.26‐1.64)
‐1.79 0.075
miR‐23a‐3p MIMAT0000078 0.01 ± 0.002 0.01
(0.003‐0.02) 0.01 ± 0.001
0.01 (0.004‐ 0.01)
‐1.1 0.684
miR‐30c‐5p MIMAT0000244 7.72 ± 0.87 7.88
(3.10‐13.51) 6.68 ± 0.40
6.53 (4.36‐8.69)
‐1.11 0.280
miR‐362‐3p MIMAT0004683 0.47 ± 0.33 0.2
(0.03‐2.46) 0.15 ± 0.04
0.13 (0.003‐ 0.04)
‐1.46 0.669
miR‐425‐5p MIMAT0003393 9.76 ± 4.96 5.84
(1.57‐54.05) 3.62 ± 0.58
3.35 (1.80‐8.12)
‐1.69 0.143
miR‐433 MIMAT0001627 0.02 ± 0.01 0.02
(0.003‐0.05) 0.02 ± 0.01
0.016 (0.003‐0.07)
‐1.35 0.606
miR‐502‐3p MIMAT0004775 0.04 ± 0.02 0.01
(0.002‐0.25) 0.01 ± 0.003
0.01 (0.003‐0.04)
‐1.38 0.796
miR‐574‐3p MIMAT0003239 3.80 ± 0.93 2.690
(1.53‐10.74) 2.01 ± 0.24
1.82 (0.88‐2.90)
‐1.68 0.063
miR‐10b‐3p (10b*)
MIMAT0004556 0.03E‐02 ± 0.58E‐03
0.002 (0.001‐0.01)
0.15E‐02 ± 0.22E‐03
0.0015 (0.001‐0.002)
‐1.21 0.436
miR‐145‐3p (145*)
MIMAT0004601 4.85E‐05 ± 1.48E‐05
2.34E‐05 (0.9E‐05‐12.7E‐05)
3.91E‐05 ± 9.76E‐06
3.08E‐05 (2.5E‐05‐ 8.8E‐05)
‐1.07 0.631
miR‐378a‐5p (378*)
MIMAT0000731 2.45E‐06 ± 4.87E‐07
2.0E‐06 (6.8E‐07‐6.4E‐06)
1.93E‐06 ± 2.90E‐07
2.0E‐06 (8.5E‐07‐3.1E‐06)
‐1.17 0.562
miR‐550a‐5p (550)
MIMAT0004800 0.01 ± 0.001 0.01
(0.002‐0.01) 0.58E‐02 ± 0.11E‐02
0.01 (0.002‐0.01)
‐1.33 0.481
miR‐625‐3p (625*)
MIMAT0004808 0.23 ± 0.06 0.171
(0.09‐0.65) 0.23 ± 0.06
0.19 (0.111‐0.521)
1.21 0.280
miR‐630 MIMAT0003299 1.82E‐06 ± 4.79E‐07
0.13E‐05 (0.1E‐05‐0.6E‐05)
1.52E‐06 ± 4.39E‐07
9.76E‐07 (7.77E‐07‐3.95E‐06)
‐1.20 0.075
miR‐661 MIMAT0003324 1.27 ± 0.34 1.0
(0.282‐3.370) 1.14 ± 0.45
0.73 (0.23‐2.96)
‐1.40 0.529
miR‐93‐3p (93*)
MIMAT0004509 4.75 ± 0.51 4.56
(1.79‐7.19) 3.69 ± 0.27
3.84 (2.54‐4.51)
‐1.12 0.143
* Values are presented as relative expression, mean ± SEM. Fold change represents a relative fold change of endometriosis group compared to disease‐free controls. Statistically significant differences between the disease‐free controls and endometriosis were determined using Mann‐Whitney U test; the level of significance was determined as p < 0.05, the trend for statistical significance was determined as 0.05 ≤ p ≤ 0.099.

CHAPTER 7
168 Victoria Nisenblat
Table 7‐5 miRNA expression in plasma set by severity of endometriosis: disease‐free controls (n = 10), endometriosis
(n = 10), rASRM stage I‐II (n = 5), rASRM stage III‐IV (n = 5); validation of the TLDA results by qRT‐PCR*
miRNA Mild Endometriosis Mean ± SEM
Fold Change1
p‐value1Severe Endometriosis Mean ± SEM
Fold Change2
p‐value2
miR‐128 0.90 ± 0.11 ‐1.30 0.371 1.03 ± 0.2 ‐1.18 0.679
miR‐133a 2.51 ± 0.73 ‐1.12 0.898 3.85 ± 0.35 1.64 0.029
miR‐148a 0.03 ± 0.01 ‐1.31 0.679 0.03 ± 0.01 ‐1.13 1.0
miR‐148b 0.03 ± 0.01 ‐1.16 1.0 0.04 ± 0.01 ‐1.13 0.768
miR‐155 0.68 ± 0.18 ‐2.33 0.040 1.05 ± 0.18 ‐1.37 0.440
miR‐23a 0.01 ± 0.001 1.09 1.0 0.01 ± 0.001 ‐1.32 0.513
miR‐30c 5.74 ± 0.38 ‐1.28 0.075 7.63 ± 0.36 1.05 1.0
miR‐362‐3p 0.12 ± 0.03 ‐1.83 0.432 0.19 ± 0.07 ‐1.16 1.0
miR‐425 3.12 ± 0.51 ‐1.89 0.099 4.12 ± 1.07 ‐1.51 0.513
miR‐433 0.02 ± 0.01 ‐1.96 0.435 0.02 ± 0.01 1.18 1.0
miR‐502‐3p 0.01 ± 0.003 ‐1.53 0.768 0.02 ± 0.01 ‐1.24 0.953
miR‐574‐3p 1.84 ± 0.39 ‐1.88 0.099 2.18 ± 0.30 ‐1.49 0.206
miR‐10b‐3p(10b*) 9.3E‐04 ± 3.9E‐04 ‐1.36 0.440 0.002 ± 1.6E‐04 ‐1.18 0.679
miR‐145‐3p(145*) 2.9E‐05 ± 2.0E‐06 ‐1.43 0.859 4.5E‐05 ± 1.46E‐05 1.64 0.310
miR‐378a‐5p(378*) 1.0E‐06 ± 4.0E‐07 ‐1.74 0.273 2.0E‐06 ± 3.0E‐07 ‐1.13 1.0
miR‐550a‐5p(550) 0.01 ± 0.004 ‐1.09 0.953 0.57E‐02 ± 0.92E‐03 ‐1.13 0.310
miR‐625‐3p(625*) 0.32 ± 0.20 1.53 0.206 0.18 ± 0.03 ‐1.37 0.679
miR‐630 1.0E‐06 ± 1.0E‐07 ‐1.22 0.371 2.0E‐06 ± 7.0E‐07 ‐1.32 0.055
miR‐661 1.08 ± 0.85 ‐1.46 0.953 1.17 ± 0.63 1.05 0.371
miR‐93‐3p(93*) 3.72 ± 0.25 ‐1.09 0.206 3.68 ± 0.41 ‐1.16 0.310
* Values are presented as relative expression, mean ± SEM. Fold change represents a relative fold change of endometriosis compared to disease‐free controls. Statistically significant differences between the disease‐free controls and endometriosis were determined using Mann‐Whitney U test; the level of significance was determined as p < 0.05, the trend for statistical significance was determined as 0.05 ≤ p ≤ 0.099;
1 minimal‐mild endometriosis compared to controls; 2 moderate‐severe endometriosis compared to controls.
Severity of disease had a prominent effect on miR‐30c, which showed significant up‐regulation
in moderate‐severe endometriosis in comparison to mild‐moderate disease (FC = 1.3, p =
0.008). In contrast, miR‐630 demonstrated decreased expression with an increased severity
of the disease (FC = 1.3, p = 0.055). The expression level of miR‐133a did not change in
minimal‐mild disease but was higher by 1.6 fold in moderate‐severe endometriosis than in
disease‐free subjects (p = 0.029). MiR‐145‐3p was up‐regulated and miR‐625‐3p was
down‐regulated in moderate‐severe endometriosis, compared to its minimal‐mild forms (FC
= 1.8, p = 0.056 and FC = 1.6, p = 0.095, respectively).

CHAPTER 7
Victoria Nisenblat 169
Thus, in keeping with our criteria for selection of the miRNAs of interest, 8 miRNAs were
chosen for further validation: miR‐155, miR‐574‐3p, miR‐425, miR‐133a, miR‐30c, miR‐630,
miR‐145‐3p and miR‐625‐3p, as summarised in Table 7‐6.
Table 7‐6 Summary of the candidate miRNAs selected in the study phase II for further validation*
Compared groups miRNA Fold Change
Fold Change
p‐value
Endometriosis vs. Disease‐free miR‐155miR‐574‐3p miR‐630
0.560.6 0.83
‐1.79 ‐1.68 ‐1.20
0.0750.063 0.075
Minimal‐mild Endometriosis vs. Disease‐free
miR‐155miR‐574‐3p miR‐425 miR‐30c
0.430.53 0.53 0.78
‐2.33 ‐1.88 ‐1.89 ‐1.28
0.040.099 0.099 0.075
Moderate‐severe Endometriosis vs. Disease‐free
miR‐133amiR‐630
1.640.76
1.64 ‐1.32
0.0290.055
Moderate‐severe Endometriosis vs. Minimal‐mild Endometriosis
miR‐30cmiR‐145‐3p miR‐625‐3p
1.341.78 0.63
1.34 1.78 ‐1.48
0.0080.056 0.095
* Fold change represents a relative fold change of endometriosis compared to disease‐free controls or between the stages of severity in endometriosis. Statistically significant differences between the disease‐free controls and endometriosis were determined using Mann‐Whitney U test; the level of significance was determined as p < 0.05, the trend for statistical significance was determined as 0.05 ≤ p ≤ 0.099.
7.3.2.5 Validationoftheselectedmarkersinlargersetofthepatients
7.3.2.5.1 TheexpressionofthecandidatemiRNAsinendometriosis
The expression levels of miR‐155, miR‐574‐3p, miR‐425, miR‐133a, miR‐30c, miR‐630, miR‐
145* and miR‐625* were measured on a total of 68 plasma samples, including 49 women with
endometriosis (18 with rASRM stage I, 16 with rASRM stage II, 12 with rASRM stage III and 3
with rASRM stage IV) and 19 disease‐free women (Table 7‐7). All the investigated miRNAs
were readily amplified and detected in all samples, with the exception of miR‐133a, which was
undetected in one sample from the disease‐free group. Both miR‐155 and miR‐574‐3p were
significantly down‐regulated in plasma samples from patients with endometriosis compared
with those from the disease‐free group (p = 0.009 and p = 0.03, respectively), by 1.44 fold
each. Expression of the remainder of the investigated miRNAs did not differ significantly
between the endometriosis cohort and disease‐free controls.

CHAPTER 7
170 Victoria Nisenblat
Table 7‐7 Expression of the 8 candidate miRNAs in women with endometriosis (n = 49) and in disease‐free controls
(n = 19); study phase III*
miRNA MirBase name
MirBase accession number
Expression of miRNAs in Disease‐free controls n = 19
Expression of miRNAs in Endometriosis n = 49 Average
Fold Change
p‐value Mean
± SEM Median (range)
Mean ± SEM
Median (range)
miR‐155 MIMAT0000646 0.10 ± 0.02
0.01(0.05‐0.27)
0.070 ± 0.004
0.07(0.02‐0.13)
‐1.44 0.009
miR‐574‐3p MIMAT0003239 0.322 ± 0.05
0.23(0.12‐0.78)
0.205 ± 0.013
0.19(0.08‐0.53)
‐1.44 0.030
miR‐30c‐5p MIMAT0000244 0.62 ± 0.04
0.62(0.33‐0.97)
0.627 ± 0.019
0.63(0.35‐0.97)
1.01 0.957
miR‐133a MIMAT0000427 0.27 ± 0.09
0.14 (0.06‐1.49)
0.249 ± 0.026
0.18(0.03‐0.80)
1.10 0.419
miR‐425‐5p MIMAT0003393 0.66 ± 0.161
0.38(0.13‐2.67)
0.367 ± 0.032
0.28(0.11‐1.18)
‐1.45 0.120
miR‐630 MIMAT0003299 1.60E‐06 ±0.4E‐06
1.54E‐06 (0.2E‐06 – 8.20E‐06)
1.49E‐06 ±0.39E‐06
0.88E‐06 (0.18E‐06 – 18E‐06)
‐1.18 0.248
miR‐625‐3p MIMAT0004808 0.20 ± 0.04
0.141 (0.05‐0.82)
0.215 ± 0.035
0.13 (0.045‐1.51)
1.02 0.962
miR‐145‐3p MIMAT0004601 6.64E‐05 ± 1.19E‐05
4.03E‐05 (1.26E‐05‐16.88E‐05)
39.57E‐05 ± 33.11E‐05
4.37E‐05 (1.31E‐05 – 1529.02E‐05)
1.17 0.633
* For each miRNA values are presented as Relative expression, mean ± SEM and median (range). Fold change represents a relative fold change of endometriosis group compared to disease‐free controls. Statistically significant differences between the disease‐free controls and endometriosis were determined using Mann‐Whitney U test; the level of significance was determined as p < 0.05.
7.3.2.5.2 MiRNAsandtheseverityofendometriosis
The expression levels did not differ between rASRM stages I and II and between rASRM stages
III and IV for any of the investigated miRNAs (data not shown), suggesting that the rASRM
stages could be pooled together into larger subgroups: minimal‐mild disease (stages I‐II, n =
34) and moderate‐severe disease (stages III‐IV, n = 15).
Between the three subgroups (disease‐free, minimal‐mild and moderate‐severe) there was a
statistically significant difference in the expression of the three miRNAs miR‐155, miR‐574‐3p
and miR‐30c (Table 7‐8). MiR‐155 and miR‐574‐3p were down‐regulated in the minimal‐mild
forms of the disease by an average fold change of 1.5 (p = 0.003, p = 0.009, respectively). The
differential expression of both miR‐155 and miR‐574‐3p was more notable between disease‐
free controls and mild‐minimal forms of endometriosis, than it was between disease‐free
controls and moderate‐severe forms of endometriosis (FC = 1.25, p = 0.286 and FC = 1.21,
p = 0.515, respectively). Indeed, miR‐155 was down‐regulated by 1.5 fold or more in 53% and
by 2 fold or more in 29% of women with minimal‐mild endometriosis, compared to only 27%
and 13%, respectively, in women with moderate‐severe disease. An analogous pattern was

CHAPTER 7
Victoria Nisenblat 171
observed for miR‐574‐3p, with a 1.5 fold or more decrease in 56% and 2 fold or more decrease
in 29% of the women with minimal‐mild disease, compared to 27% and 20% in women with
moderate‐severe forms. MiR‐155 and miR‐574‐3p showed mild up‐regulation in more severe
forms of the disease, but this difference did not reach statistical significance between the
groups of minimal‐mild and moderate‐severe endometriosis. In general, the expression of
miR‐155 and miR‐574‐3p exhibited a similar trend, with plasma levels demonstrating a
positive Spearman rank correlation (rs = 0.65, p < 0.005).
MiR‐425 was down‐regulated in the endometriosis group by 1.45 fold compared to the
disease‐free group, exhibiting reduced expression levels in both mild and severe forms of the
disease by 1.5 and 1.4 fold, respectively. However, none of these changes appeared to be
statistically significant, which can be explained by largely dispersed data with the highest
measurements of variability for miR‐425 compared to the remainder of the investigated
miRNAs.
The expression levels of miR‐30c and miR‐133a in minimal‐mild endometriosis were
comparable to those in the disease‐free group (FC = ‐1.05, p = 0.413 and FC = ‐1.05, p = 0.977,
respectively) but exhibited up‐regulation in moderate‐severe forms (FC = 1.2, p = 0.089 and
FC = 1.5, p = 0.03, respectively). These expression changes reached statistical significance only
in comparison between mild and severe forms of the disease for miR‐30c (FC = 1.23, p = 0.001)
and showed a trend for significance in a similar comparison for miR‐133a (and FC = 1.6,
p = 0.07).

CHAPTER 7
172 Victoria Nisenblat
Table 7‐8 Expression of the 8 candidate miRNAs set by severity of endometriosis; study phase III*
miRNA
minimal‐mild endometriosis (rASRM I‐II), n = 34
moderate‐severe endometriosis (rASRM III‐IV), n = 15
p‐value1
FC2 p‐
value2FC3
p‐value3
FC4 p‐
value4Mean ± SEM
Median (range)
Mean ± SEM
Median (range)
miR‐155 0.07
± 0.004 0.06
(0.02‐0.13) 0.08 ± 0.01
0.08(0.03‐0.13)
0.009 ‐1.53 0.003 ‐1.25 0.286 1.22 0.107
miR‐574‐3p 0.19 ± 0.02
0.17(0.08‐0.53)
0.24 ± 0.02
0.23(0.13‐0.38)
0.015 ‐1.56 0.009 ‐1.21 0.515 1.29 0.042
miR‐30c 0.59 ± 0.02
0.58(0.35‐0. 78)
0.73 ± 0.04
0.73(0.42‐0.97)
0.010 ‐1.05 0.413 1.17 0.089 1.23 0.001
miR‐133a 0.22 ± 0.03
0.14(0.03‐0.80)
0.31 ± 0.04
0.31(0.05‐0.54)
0.095 ‐1.05 0.977 1.54 0.030 1.62 0.070
miR‐425 0.37
± 0.041 0.28
(0.11‐1.18) 0.37 ± 0.05
0.33(0.14‐0.78)
0.262 ‐1.49 0.109 ‐1.37 0.354 1.09 0.629
miR‐630 0.16E‐05 ± 0.06E‐05
0.91E‐06 (0.18E‐06 – 18.01E‐06)
0.13E‐05 ± 0.03E‐05)
0.83E‐06 (0.4E‐06 – 5.33E‐06)
0.476 ‐1.20 0.273 ‐1.12 0.391 1.08 0.660
miR‐625‐3p 0.24 ± 0.05
0.12 (0.05‐ 1.51)
0.16 ± 0.02
0.13(0.07‐ 0.29)
0.998 1.06 0.985 ‐1.06 0.945 0.90 (‐1.12)
1.000
miR‐145‐3p 0.53E‐03 ± 0.47E‐03
0.41E‐04 (0.13E‐04 –1.52E‐04)
0.78E‐04 ± 0.18E‐04
0.52E‐04 (0.17E‐04 – 2.34E‐04)
0.608 1.15 0.807 1.23 0.461 1.07 0.327
*The data for each miRNA are presented as relative expression, mean ± SEM and median (range). Statistically significant differences between the disease‐free controls and the subgroups of endometriosis stratified by the severity of the disease were determined using Kruskal‐Wallis test (statistical significance is defined as p < 0.05), followed by post hoc tests using Mann‐Whitney U test with Bonferroni correction. The level of significance for post hoc tests was defined as p < 0.017 (0.05/3 [number of comparisons]);
1 Kruskal‐Wallis test; 2 rASRM I‐II vs. controls; 3 rASRM III‐IV vs. controls; 4 rASRM I‐II vs. rASRM III‐IV.
7.3.2.5.3 MiRNAsandendometrioma
Ovarian involvement with endometrioma was detected in more than half of women with
moderate‐severe disease in our cohort (n = 8, 53%). In the subgroup analyses stratified by the
presence of endometrioma, both miR‐30c and miR‐133a exhibited up‐regulation in the
presence of endometrioma. Women with endometrioma had higher expression of miR‐30c
and miR‐133a than disease‐free controls (FC = 1.25, p = 0.034 and FC = 1.96, p = 0.004,
respectively) and minimal‐mild endometriosis group (FC = 1.31, p < 0.001 and FC = 2.01, p =
0.024, respectively). In contrast, the expression of miR‐30c and miR‐133a in women with
moderate‐severe endometriosis without endometrioma did not differ significantly from the
disease‐free (FC = 1.19, p = 0.611 and FC = 1.17, p = 0.574, respectively) or minimal‐mild
endometriosis groups (FC = 1.15, p = 0.144 and FC = 1.23, p = 0.647, respectively) (Figure 7.1).
There were no expression differences for any other of the investigated miRNAs (data not
shown).

CHAPTER 7
Victoria Nisenblat 173
Figure 7.1 Expression levels of the 2 candidate miRNAs stratified by severity of endometriosis and by presence of
endometrioma. Number of subjects per group: controls n = 19, endometriosis n = 49, rASRM I‐II n = 34, rASRM III‐IV
n = 15, rASRM III‐IV with endometrioma n = 8, rASRM III‐IV without endometrioma n = 7. Box and whiskers plots
represent expression levels of the candidate miRNAs. The lines inside the boxes denote the medians. The boxes mark the
interval between the 25th and 75th percentiles. The whiskers denote the highest and lowest values that are not outliers
or extreme values. Statistically significant differences between the disease‐free controls and the stages of endometriosis
were determined using Kruskal‐Wallis test (p < 0.05 considered as significant), followed by post hoc tests using Mann‐
Whitney U test with Bonferroni correction ( p < 0.008 (0.05/6 [number of comparisons] defined significance). * indicates
statistically significant differences.
p=0.097 [Kruskal‐Wallis test]
Mann‐Whitney U post hoc tests:
_p=0.613__p=0.024_
_______p=0.647______
__________________p=0.574__________
______*p=0.004_________
Mann‐Whitney post hoc tests:
_p=0.463__*p<0.001_
____________p=0.034_____
_________p=0.144______
________________p=0.611____________

CHAPTER 7
174 Victoria Nisenblat
7.3.2.5.4 MiRNAsandotherpathologicconditions
In total there were 16 women with pelvic pathology [8 (16%) women in the endometriosis and
8 (42%) women in the disease‐free group] as presented in Table 7‐3. Uterine fibroids were
detected in 3 (6.1%) women from the endometriosis group and in 2 (10.5%) women from the
disease‐free group; hydrosalpinges were noticed in 1 (2%) woman from the endometriosis and
in 1 (5.3%) woman from the disease‐free group; CIN III was diagnosed in 1 (2%) woman from
the endometriosis group based on a cervical biopsy obtained at surgery. Additionally, several
women in the cohort [3 (6%) in the endometriosis group and 6 (32%) in the disease‐free group
were noted to have an enlarged bulky uterus, that could be suggestive of adenomyosis or
intramural fibroids. The histological diagnosis of adenomyosis was obtained for 2 women from
the endometriosis group who underwent hysterectomy. Unfortunately, we were not able to
compare the expression levels of the investigated miRNAs between women with and without
pelvic pathology because of the small sample size of the pelvic pathology group. However, the
exclusion of these clinical subsets did not alter the findings obtained in the analysis of the
whole cohort.
The impact of other co‐morbidities on the data was then explored. Five (10.2%) women from
the endometriosis group and 1 (5.3%) woman from the disease‐free group were previously
diagnosed with PCOS based on their menstrual pattern, signs of hyper‐androgenism and/or
ovarian morphology. Endocrine and metabolic states were not specifically assessed in this
study. Nine (18.4%) women from the endometriosis group and 6 (32%) women from the
disease‐free controls suffered from chronic medical conditions such as asthma, diabetes
mellitus, hypothyroidism, rheumatoid arthritis, cardiomyopathy, irritable bowel syndrome,
and mood disorders. Women with PCOS and women who suffered from chronic medical
conditions were excluded in separate sub‐analyses. The exclusion of the subsets with PCOS
did not change the differential expression pattern for miR‐155 (p = 0.005) and miR‐574‐3p (p
= 0.027). In the analysis limited to the subsets without any chronic medical conditions (12
women in the disease‐free group and 38 women in the endometriosis group), miR‐155
demonstrated an expression profile comparable to that detected in a whole cohort with a
significant difference between endometriosis and disease‐free groups (p = 0.020). Although
the median expression of miR‐574‐3p remained lower in endometriosis (0.172 (0.081‐0.535)
vs. 0.234 (0.122‐0.703) in disease‐free group), its differential expression did not appear
significant (p = 0.091).

CHAPTER 7
Victoria Nisenblat 175
7.3.2.5.5 MiRNAsandrecurrentendometriosis
Fourteen (29.2%) women from the endometriosis group had a previous laparoscopy for pelvic
pain with identification and surgical treatment of endometriotic lesions. No significant
difference was observed in the levels of any of the investigated miRNAs between the
endometriosis patients with and without previous surgically treated endometriosis, i.e. with
and without recurrent disease.
7.3.2.5.6 MiRNAsandendometriosisinthepast
Ten (55%) of the disease‐free women had had a previous laparoscopy for pelvic pain.
Endometriosis was surgically diagnosed and treated in 4 (22%) women, whilst the absence of
the disease was surgically confirmed in 6 (33%). In addition, some of the disease‐free women
had pelvic findings suggestive of endometriosis in the past, which included peritoneal scarring
noted in 3 women and severe adhesions in 1 woman. Three out of these 4 women had had a
laparoscopy in the past for investigation and treatment of pelvic pain, with surgically
confirmed endometriosis in 1 woman. To evaluate the homogeneity of our disease‐free group,
we performed comparative analyses after exclusion of the subsets with pelvic findings from
the disease‐free group. The patterns of expression and the levels of significance concerning
candidate miRNAs did not differ from the results obtained on the whole group of controls. The
analysis performed after exclusion of the additional 3 women with previous surgical diagnosis
of endometriosis and currently normal pelvis from the disease‐free group revealed similar
results. The subgroup analyses within the disease‐free women classified by presence or
absence of endometriosis in the past were not performed due to the limited sample size in
each subgroup.
7.3.2.5.7 MiRNAsandhormonaltreatment
Nineteen (39.6%) women from the endometriosis group and 2 (10.5%) women from the
disease‐free group were treated with hormonal medications at the time of blood collection,
predominantly the combined oestrogen – progesterone contraceptive pill. A comparison of
the investigated miRNAs expression between women who did and did not receive hormonal
therapy separately within endometriosis and disease‐free groups showed no statistically
significant difference. However this comparison was meaningful only in the endometriosis
group due to the limited sample size in the disease‐free subgroups of patients treated and not
treated with hormonal medications (n = 2 and n = 17, respectively). Exclusion of the subsets
using hormonal treatment from both endometriosis and disease‐free groups did not alter the

CHAPTER 7
176 Victoria Nisenblat
differential expression and the significance levels for any of the investigated miRNAs except
miR‐133a. The expression of miR‐133a was decreased in subsets on hormonal treatment and
appeared to be significantly up‐regulated in moderate‐severe endometriosis compared to
either disease‐free or to minimal‐mild endometriosis groups when only subsets without
hormonal treatment were analysed. However, according to Spearman’s correlation
coefficient, no significant correlation was found between the hormonal treatment and the
expression of miR‐133 in the endometriosis (rs = ‐0.409, p = 0.092) or disease‐free group (rs =
‐0.166, p = 0.255) or in the overall cohort (rs = ‐0.166, p = 0.178). No correlation was identified
between the hormonal treatment and the remainder of the investigated miRNAs.
7.3.2.5.8 MiRNAsandthephasesofthemenstrualcycle
Twenty five women in the endometriosis group and 15 women in the disease‐free group had
regular menstrual cycles and were not using contraceptive hormonal medications. The cycle
length for the majority of the women in our cohort was 26‐30 days, with the exception of 5
women (2 from the endometriosis and 3 from disease‐free group) who had a 21 day cycle.
Women were classified by the phases of the cycle as following: menstrual phase (1 woman
with endometriosis and 2 disease‐free women), proliferative phase (10 women with
endometriosis and 3 disease‐free women), peri‐ovulatory phase (7 women with
endometriosis) and luteal phase (7 women from each group). There was no change in the
levels of the investigated miRNAs across the phases of the menstrual cycle in the
endometriosis group. Unfortunately, analyses concerning phases of the cycle in disease‐free
group were not possible because of the limited sample size in the subgroups.
7.3.2.6 DiagnosticaccuracyofthecandidatemiRNAs
ROC curve analyses revealed that both miR‐155 and miR‐574‐3p are potential biomarkers for
endometriosis detection, resulting in AUC (area under the ROC curve) = 0.705, (95% CI, 0.575‐
0.835), p = 0.009, and AUC = 0.67, (95% CI, 0.524‐0.816), p = 0.03, respectively (Figure 7.2 and
Figure 7.3). The optimal sensitivity, specificity and overall percentage of accuracy using the
probability cut‐off of 0.5 were 95.9%, 26.3% and 76.5% for miR‐155 and 98%, 26.3% and 77.9%
for miR‐574‐3p, respectively.

CHAPTER 7
Victoria Nisenblat 177
Figure 7.2 ROC analysis using plasma miR‐155.
Figure 7.3 ROC analysis using plasma miR‐574‐3p.
At the cut off value of 0.060 for miR‐155, the sensitivity was 84% and the specificity was 45%.
At the cut off value of 0.162 for miR‐574‐3), the sensitivity was 84% and the specificity was
37%. The odds ratio for miR‐155 being associated with endometriosis was 0.805 (95% CI,
0.684‐0.946) and for miR‐574‐3p the odds ratio was 0.942 (95% CI, 0.901‐0.985) for each 0.01
point decrease on the scale of miRNA level.
An addition of miR‐574‐3p could not improve the differentiation between women with and
without disease (AUC = 0.701, (95%CI, 0.569‐0.834)), indicating an overlap between the
diagnostic values of miR‐155 and miR‐574‐3p (Figure 7‐4).
AUC = 0.705Std Error = 0.066 p = 0.009 95%CI [0.575, 0.835]
AUC = 0.670Std Error = 0.075 p = 0.030 95%CI [0.524, 0.816]

CHAPTER 7
178 Victoria Nisenblat
Figure 7‐4 ROC analysis for the combination of plasma miR‐155 + miR‐574‐3p
Interestingly, incorporation of miR‐133a and miR‐30b into a predictive model improved the
discriminatory power of miR‐155 and miR‐574‐3p to distinguish the endometriosis and
disease‐free groups. Analyses of the ROC curves for plasma miRNAs showed that the AUC was
greatest for the combination of miR‐574‐3p, miR‐133a and miR‐30c resulting in AUC = 0.774,
(95% CI, 0.656‐0.893) with 98% sensitivity, 33% specificity and 80.6% of overall accuracy with
a cut off of predicted probability at 0.5, indicating the additive effect in the diagnostic value
of these 3 miRNAs (Figure 7.5).
Figure 7.5 ROC analysis of regression model using miR‐574‐3p, miR‐133a, miR‐30c to discriminate endometriosis.
AUC = 0.701Std Error = 0.068 p = 0.010 95%CI [0.569, 0.834]
AUC = 0.774Std Error = 0.060 p = 0.001 95%CI [0.656, 0.893]

CHAPTER 7
Victoria Nisenblat 179
Next, we examined a predictive model incorporating clinical parameters combined with the
identified miRNAs. With the univariable logistic regression model, infertility, history of
miscarriage and number of the past miscarriages was significantly correlated with
endometriosis. Spearman rank order coefficient suggested only a weak negative relationship
with endometriosis for each of the abovementioned parameters, as following: infertility
(rs = ‐0.278, p = 0.026), history of miscarriage (rs = ‐0.258, p = 0.038), and number of past
miscarriages (rs = ‐0.311, p = 0.012). No significant correlation was found between
endometriosis and the rest of the demographic and clinical characteristics, such as age, BMI,
smoking, parity, regularity of the menstrual cycle, migraine, abnormal uterine bleeding,
duration of symptoms and a family history of endometriosis (Table 7‐9). Using multivariate
logistic regression, several predictive models were created (Table 7‐10). A predictive model
that included parameters such as infertility, previous miscarriages and the expression of miR‐
155, miR‐574‐3p, miR‐133a and miR‐30c demonstrated an overall accuracy of 84.1% with
93.5% sensitivity, 58.8% specificity and AUC = 0.831, (95% CI, 0.719‐0.943), p < 0.001
(Figure 7.6)
Table 7‐9 Univariate logistic regression model for association of clinical parameters with endometriosis
B1 SE2 Wald3 p‐value4 Exp (B)5 95% CI for Exp (B)6
Infertility 1.281 0.592 4.688 0.030 3.600 1.129, 11.478Previous miscarriage
1.217 0.602 4.088 0.043 3.378 1.038, 10.992
Number of previous miscarriages
‐.705 0.324 4.750 0.029 0.494 0.262, 0.931
Age ‐.055 0.031 3.292 0.070 0.946 0.891, 1.004BMI ‐0.033 0.053 0.397 0.528 0.967 0.872, 1.073Smoking 1.006 0.747 1.813 0.178 2.733 0.632, 11.813Parity ‐0.582 0.307 3.587 0.058 0.559 0.306, 1.020Pattern of the menstrual cycle
0.094 0.750 0.016 0.901 1.098 0.252, 4.780
Migraine 0.405 0.563 0.519 0.471 1.500 0.498, 4.519Uterine bleeding 0.642 0.613 1.095 0.295 1.900 0.571, 6.323Duration of the symptoms
0.039 0.038 1.066 0.302 0.961 0.892, 1.036
Family history of endometriosis
‐0.247 0.659 0.141 0.708 0.781 0.215, 2.841
1 B – the coefficients for logistic regression equation for predicting the dependent variable from the independent variable (log‐odds units); the prediction equation is: log(p/1‐p) = b0 + b1*x1 + b2*x2 + b3*x3 + b4*x4);
2 SE – standard error around the coefficients; 3 Wald – Wald chi‐square test that tests the null hypothesis that the coefficient (parameter) equals 0; 4 p‐value – significance of the Wald test; 5 Exp (B) – the odds ratios for the predictors; 6 CI – confidence interval.

CHAPTER 7
180 Victoria Nisenblat
Table 7‐10 Comparison of predictive models for endometriosis identified with multivariate logistic regression
analyses
Model
Omnibus test of model coefficients
Model summary
H‐L test
Classification table
AUC (95%, CI)
Χ2 df p ‐2 LL Ra2 Rb2
Sensitivity
Specificity
Overall
accuracy
Previous miscarriages, infertility, miR‐155, miR‐574‐3p, miR‐133a, miR‐30c
22.435 6 0.001 51.036 0.300 0.435 0.929 93.5% 58.8% 84.1% 0.830
(0.719, 0.941)
Previous miscarriages, infertility, miR‐155, miR‐574‐3p, miR‐30c
18.886 5 0.002 57.163 0.256 0.368 0.632 95.7% 44.4% 81.3% 0.785
(0.653, 0.917)
Previous miscarriages, infertility, miR‐155, miR‐574‐3p, miR‐133a
22.326 5 <0.001 51.145 0.298 0.433 0.176 93.5% 58.8% 84.1% 0.831
(0.719, 0.943)
Previous miscarriages, infertility, miR‐155, miR‐574‐3p
18.768 4 0.001 57.281 0.254 0.366 0.780 95.7% 44.4% 81.3% 0.796
(0.668, 0.923)
Previous miscarriages, infertility, miR‐574‐3p, miR‐133a
19.917 4 0.001 55.553 0.271 0.394 0.708 93.5% 58.8% 84.1% 0.809
(0.686, 0.933)
Previous miscarriages, infertility, miR‐155, miR‐133a
18,682 4 0.001 54.789 0.257 0.373 0.313 93.55 35.3% 77.8% 0.825
(0.715, 0.935)
Previous miscarriage, miR‐155, miR‐574‐3p, miR‐133a
18.513 4 0.001 55.581 0.251 0.366 0.667 95.7% 41.2% 81.3% 0.810
(0.692, 0.927)
Previous miscarriage, miR‐574‐3p, miR‐133a
16.362 3 0.001 57.462 0.229 0.334 0.536 93.6% 41.2% 79.7% 0.787
(0.660, 0.915)
Previous miscarriage, miR‐155, miR‐574‐3p
15.804 3 0.001 60.899 0.216 0.312 0.385 97.5% 27.8% 78.5% 0.771
(0.640, 0.901)
Infertility, miR‐155, miR‐574‐3p, miR‐133a, miR‐30c
18.226 5 0.003 55.245 0.251 0.365 0.376 95.7% 35.3% 79.4% 0.824
(0.709, 0.938)Infertility, miR‐155, miR‐574‐3p, miR‐30c
15.630 4 0.004 60.419 0.217 0.312 0.377 97.8% 33.3% 79.7% 0.762
(0.629, 0.896)Infertility, miR‐155, miR‐574‐3p, miR‐133a
18.048 4 0.001 55.423 0.249 0.362 0.504 95.7% 35.3% 79.4% 0.812
(0.695, 0.929)
X2 – chi –square statistics; df – number of degrees of freedom for the model; p – probability of obtaining chi‐square statistics given that the null hypothesis is true (no effect of the
independent variables); ‐2LL – 2‐log likelihood for the final model (used to compare nested (reduced) models; Ra2 and Rb2 – Cox & Snell R Square and Nagelkerke R Square, respectively (the pseudo R‐squares); H‐L test – Hosmer – Lemeshov test (test for goodness of fit for logistic regression models).

CHAPTER 7
Victoria Nisenblat 181
Figure 7.6 ROC analysis of regression model using the combination of clinical parameters (infertility and number of
miscarriages) with miR‐574‐3p, miR‐133a, miR‐155 and miR‐30c to discriminate endometriosis.
7.4 Discussion
This study was to evaluate circulating miRNAs in a clinically well‐described cohort with
surgically confirmed diagnosis of endometriosis. A set of 4 miRNAs displayed aberrant
expression in plasma of women with endometriosis compared with disease‐free women,
suggesting that the measurement of miRNAs in plasma may be useful in blood based detection
methods for endometriosis.
MiR‐155 and miR‐574‐3p levels were significantly decreased in plasma from endometriosis
patients. However, the lowest levels of both miRNAs were detected in women with minimal‐
mild disease. In moderate‐severe forms, both miR‐155 and miR‐574‐3p displayed lower
concentration than that observed in disease‐free women, but a higher concentration than in
minimal‐mild disease. A positive Spearman rank correlation was observed between miR‐155
and miR‐574‐3p and there was a similarity in the expression pattern suggesting that these
miRNAs are likely to be co‐regulated in endometriosis and might share common regulation
pathways.
The expression levels of two miRNAs, miR‐133a and miR‐30c remained unchanged in minimal‐
mild forms, but were elevated in the severe forms of endometriosis, suggesting that these
miRNAs might reflect the severity of endometriosis. None of the demographical or clinical
parameters appeared to confound the expression of the identified miRNAs.
AUC = 0.830Std Error = 0.057 p < 0.001 95%CI [0.719, 0.941]

CHAPTER 7
182 Victoria Nisenblat
Both linear and logistics regression analyses further demonstrated that age, BMI, smoking,
parity and previous miscarriages did not influence the plasma levels of miR‐155, miR‐574‐3p,
miR‐133a and miR‐30c, suggesting their usefulness as potential biomarkers for a broad
unselected population.
It is unclear why miRNA expression differed with different stages of endometriosis. We can
hypothesise that the extent and depth of infiltration associated with severe forms of the
disease result in increased cell mass in the endometriotic lesions, which could possibly lead to
increased release of certain miRNAs into the circulation. It has been shown that deep
endometriotic nodules more readily secrete more CA‐125 and PP14 into the blood stream,
whereas superficial, mild, pelvic endometriosis with less developed blood supply tends to
secrete CA‐125 and PP14 into the peritoneal cavity rather than into the blood (550).
Mild and severe forms of endometriosis also might represent different entities with distinct
pathophysiology and thus may be associated with different miRNA profile. This is supported
by previously demonstrated differences in the characteristics of peritoneal fluid (551), in the
phenotype of immune cells and macrophages in peritoneum (552) and in the genome profiles
of eutopic endometrium (531) between severe and mild forms of endometriosis.
We can also assume that over‐expression of miR‐133a and miR‐30c might be a cause rather
than consequence of the disease. MiR‐133a, known for its functions in controlling myoblastic
proliferation and differentiation, was found to be significantly expressed in mitochondria,
suggestive of being involved in a mitochondrial mRNA silencing regulation (553). Mitochondria
provide metabolic energy, initiate apoptosis and synthesise the steroid hormones, and it may
be that miR‐133a plays an important role in regulation of these events, which are important
in the progression of endometriosis. MiR‐30c has been reported to suppress apoptosis via
inhibition of p53 expression (554). Both miRNAs, miR‐133a and miR‐30c, were previously
found to be co‐expressed in rodent models of heart disease (555).
Another possibility is that both miR‐30c and miR‐133a are associated specifically with
endometriomas, rather than with severe endometriosis, as they were elevated in women with
ovarian endometrioma. Previous reports have identified endometrioma as a distinctive clinical
form compared with peritoneal disease (556). It is tempting to speculate that an
endometrioma miRNA profile exists. If this is the case, concurrent miRNA testing may improve
the sensitivity of imaging to discriminate endometrioma from other types of ovarian tumours.
Finally, the possibility cannot be excluded that this expression pattern could be observed

CHAPTER 7
Victoria Nisenblat 183
simply due to random association and may not be apparent in a larger group. Further studies
are required to confirm and to characterise the miRNA profile associated with different
disease stages and with the presence of endometrioma.
Both miR‐155 and miR‐574‐3p levels remained suppressed after exclusion of participants with
any chronic diseases or other pelvic pathologies, although miR‐574‐3p lost statistical
significance when only women without chronic medical conditions were included in the
analysis. This presumably was related to a reduced sample size, but this study could not
conclusively establish that other co‐morbidities did not confound the expression of miR‐574‐
3p. Women with malignant disease or with acute infection were excluded from the present
study in order to avoid a possible bias associated with the ability of these conditions to
modulate miRNA expression. The impact of different medical conditions, including malignancy
and infection on circulating miRNAs associated with endometriosis requires further validation
in a larger cohort.
Recurrent endometriosis and a previous diagnosis of endometriosis in currently disease‐free
women did not appear to affect the discriminative ability of miR‐155 and miR‐574‐3p. It may
be that both miRNAs reflect only active ongoing disease and could be valuable indicators of
the recurrence or response to treatment. However, again this speculation requires further
validation in a larger cohort.
Treatment with hormonal medications was not associated with altered expression of miR‐155,
miR‐574‐3p and miR‐30c, but may suppress expression of miR‐133a. However, the subgroup
analysis was limited by the small sample size of women not taking hormonal medications.
MiR‐155 and miR‐574‐3p were not influenced by the phase of the menstrual cycle or the
physiological hormonal environment.
All the dysregulated plasma miRNAs are associated with other pathologies and are not specific
for endometriosis. For example, miR‐155 has been demonstrated to target multiple
components of the inflammatory cytokine production cascade, TLR and intracellular signalling
pathways, exhibiting pro‐and anti‐inflammatory qualities (557‐558). Circulating levels of miR‐
155 were significantly up‐regulated in rheumatoid arthritis and in inflammation‐induced liver
injury (559) and down‐regulated in patients with coronary artery disease (261) and various
cancer types (262, 560‐561). Aberrant expression of miR‐574‐3p has been reported in
association with several malignancies and autoimmune diseases (503‐507). MiR‐133a is well
documented in heart and lung disease as well as in various types of cancers (202, 562) and in
CHAPTER 7
184 Victoria Nisenblat
endometrial endometrioid adenocarcinoma (563‐565). MiR‐30c has been found to be
up‐regulated in ovarian cancer (566) and was connected to a range of human diseases
including heart disease and other types of cancer (327). Therefore, a combined panel of
biomarkers rather than a single biomarker is more likely to be a more specific diagnostic
discriminator.
The reduced concentration of circulating miR‐155 and miR‐574‐3p detected in patients with
endometriosis was surprising, because one might expect that inflammation associated with
endometriosis would induce the expression of miR‐155, thereby elevating its levels.
Moreover, if miRNAs were released into the systemic circulation from endometriotic tissue
(248), we would anticipate that miR‐574‐3p would be up‐regulated in plasma as it is present
in high levels in endometriotic tissues (205), and it could be anticipated that miR‐574‐3p would
be elevated in plasma in patients with endometriosis.
Notably, out of 24 miRNAs that were selected by the array experiment, only 4 were found to
be significantly dysregulated in endometriosis in this validation study. Furthermore, the
magnitude of the relative fold changes differed between the miRNA arrays and the singleplex
qRT‐PCR experiments. Such disagreement can be attributed to the differences in
normalisation approaches and data analysis methods. Unexpectedly, miR‐155 was found to
be down‐regulated in endometriotic plasma in this experiment, whereas it was noted to be
up‐regulated on the arrays. This suggests a possible increased sensitivity of this miRNA to
differences in design between the microarray and qPCR primers, the array pre‐amplification
step and/or different normalisation approaches. Although some differences were seen in the
2 alternate experimental settings, both methods provided largely concordant direction of
expression for the remaining tested circulating miRNAs.
Another possible explanation for discrepancy between the array and qRT‐PCR experiments
might be the use of different control groups in each of the experiments, i.e. a prospective
cohort of symptomatic women in the qRT‐PCR‐based validation study, as opposed to
asymptomatic healthy controls in the array experiment. It is also possible that chronic pelvic
pain syndrome modulates circulating miRNAs even in the absence of endometriosis. Finally, a
bias related to an incorrect diagnosis of endometriosis at surgery, particularly in minimal
forms of the disease, is possible. The early stages of endometriosis have been described as a
dynamic event that occurs intermittently in most women, suggesting that the presence of
lesions is dynamic and can change over time (532), which could negatively impact on correct

CHAPTER 7
Victoria Nisenblat 185
allocation to analysis groups. Even though selection of symptomatic controls may have an
impact on the differential expression of miRNAs between the groups, this is exactly the
population that would need to be distinguished from those with endometriosis and a non‐
invasive test would be used in.
A common problem in circulating miRNA research is that no consensus has been reached
regarding internal controls. Normalization is a key step for the accurate quantification of RNA
levels with qRT‐PCR, which is particularly relevant in diagnostic studies. In this study we
established a method to reproducibly and accurately measure miRNAs in plasma, carefully
selecting endogenous controls in the screening array experiment and verifying their stability
by using qRT‐PCR in a subset of experimental samples.
A recently published study by Wang et al., 2012, identified endometriosis‐associated miRNAs
in serum from 60 patients and 25 controls and suggested that a panel of 4 differentially
expressed miRNAs had a 93.2% sensitivity and 96 % specificity for predicting endometriosis in
a retrospective cohort (211). While this is exciting, the choice of miRNAs was based on pooled
un‐replicated experiments, therefore we suggest that potentially useful diagnostic miRNAs
may have been missed. Endometriosis associated differential expression > 2 fold was seen in
145 miRNAs, whereas 61 demonstrated a > 10 FC difference. Of these only 1 was identified in
our study (miR‐145*), and we were unable to replicate these findings in our dataset when we
normalised to U6 in concordance with the Wang et al. methodology.
Jia et al. performed another microRNA microarray analysis comparing plasma samples from
groups of 3 women with and without endometriosis (212). Twenty seven down‐regulated
microRNAs were identified when the data set was normalised to a preselected endogenous
control miR‐16. Only one miRNA, miR‐23a, was concordant with the miRNAs identified in our
study, and another, miR‐122, was identified by Wang et al., but was differentially expressed
in the opposite direction. This inconsistency between the 3 studies could be due to inherent
differences in the sample population, including geographic and ethnic differences as well as
differences in patient selection criteria. For example, most control patients in the Wang et al’
study suffered from infertility without pelvic pain, whereas control patients in the Jia et al.
study included women with leiomyoma and ovarian masses, which raises the question
whether these women truly represent the population that would be routinely tested for
endometriosis using a plasma miRNA assay. Technical differences in data analysis and

CHAPTER 7
186 Victoria Nisenblat
normalisation are also likely to play role, which emphasises the need for further work in the
plasma miRNA diagnostic field, and especially for studies involving larger numbers of women.
It is clear that normalisation is a critical step in data analysis and different methods can lead
large variations in outcomes using the same dataset (205‐209, 240‐241). Wang et al.’s study
was unable to use a data‐driven approach to select an optimal normalisation method since
their pooled study had no replicates, and therefore a default normalisation approach of U6
was used. However, others have found that U6 is not a reliable endogenous control (31) and
this proved true in our dataset, where RNU‐6B, a small nuclear non coding RNA also known as
U6, appeared to be differentially expressed between endometriotic and control patients.
Other studies demonstrated that RNU‐6B does not fulfil criteria for endogenous controls and
should be abandoned as a normaliser in miRNA qRT‐PCR experiments (567‐568). The use of
standard single reference genes like U6 and miR‐16 is increasingly difficult to support given
the frequently observed variation of standard genes across experimental conditions (569).
Quantile normalisation has proved the most effective normalisation strategy for this current
study, in accord with previous evaluations by others (301). However this approach is less
effective when only small numbers of miRNAs are assayed, as is likely to occur as clinical
plasma miRNA assays are developed and tested. Therefore, plasma miRNA normalisation
strategies based on miRNAs specific to the experimental sample set, or assays based on
complex ratios between multiple miRNAs will need to be developed in order to develop robust
plasma miRNA assays for endometriosis.
All 3 studies, however, revealed a distinct miRNA expression pattern in the circulation of
endometriosis sufferers indicating that further exploration is required in this field. To date, no
study has assessed the diagnostic value of circulating miRNAs in a test cohort which is a crucial
evaluation of the robustness of a potential diagnostic test.
The diagnostic accuracy estimates presented in this thesis suggest that a plasma miRNA‐based
predictive model is no more accurate than surgical diagnosis, given moderate specificity of
58.8%. However, the high sensitivity of 93.5% suggests the possibility of using this model as a
triage test. A triage test would permit a more thorough selection of candidates for surgery and
provide an opportunity to intervene at an earlier time. Although a non‐invasive test with high
sensitivity and specificity would be ideal, from a clinical perspective it is important to be able
to screen large numbers of symptomatic women in a less invasive, less expensive and
relatively simple way. It is important that women with endometriosis who might benefit from

CHAPTER 7
Victoria Nisenblat 187
early surgery are not missed by the test. Therefore, a triage test for endometriosis is required
to have a higher sensitivity, with a low number of false‐negative results, i.e. a low number of
patients who have a negative test and who do have endometriosis. This test might have a
lower specificity, which implies a higher number of false‐positive results, i.e. a higher number
of patients who have a positive test but who do not have endometriosis requiring surgery.
Without higher specificity, there would be women who would undergo unnecessary surgery,
but the number of surgeries on women without endometriosis would be less than it would be
without test. Further studies are needed to validate and address the potential diagnostic role
of miRNA profiles in endometriosis, including in combination with other types of biomarkers,
and their possible use in stratifying patients with respect to clinical parameters and severity
of the disease. Moreover, profiling plasma miRNA expression before and after surgical
treatment for endometriosis could also assess the correlation between plasma miRNA profiles
and tissue load and determine if plasma miRNAs had potential as markers of disease
progression. We aim to recruit women for this type of study in the near future.
7.5 Limitations
It should be noted that consideration of circulating miRNAs as biomarkers for endometriosis
is at present based on our results from a relatively small sample size and larger clinical studies
are clearly required to establish the case. As described in a sentinel review on this subject by
Yang and Speed (351), it is difficult to estimate the number of patients needed for this kind of
follow‐on genomics study. Our experience suggests that plasma miRNA expression values may
in general have more variability than tissue miRNA expression levels. If we use the median
variance of the differentially expressed miRNAs within our TaqMan array data set, power
calculations suggest that over 150 patients in each of the control and endometriotic groups
may be required to have a 90% chance of detecting a true two‐fold difference in plasma
miRNA abundance between the groups. The recruitment of subjects for these types of studies
is challenging. We were not able to recruit sufficient amount of subjects (above 300) to fully
comply with the above power calculation due to substantial financial and time constrains.
Given that, we acknowledge that further investigation in this field with larger amount of
subsets in each subgroup is mandatory and we are undertaking a larger study as a part of
commercial development of miRNA‐based product in order to validate the findings presented
in this thesis.

CHAPTER 7
188 Victoria Nisenblat
Furthermore, 24 miRNAs carefully selected with the array experiment were initially validated
only in 20 subsets. This may result in underestimation of the discriminative ability of some of
the miRNAs that were not chosen for validation in the remained samples. Moreover, we
initially screened for 674 miRNAs, whilst the majority of the circulating miRNAs remain
untested and we can make no claims about their association with endometriosis. Finally, we
cannot provide molecular insights into the cause of the dysregulation. The levels of circulating
miRNAs may be affected by multiple parameters, ranging from the multifactorial pathogenetic
mechanisms to the stability of miRNAs in plasma.
7.6 Conclusions
The results of the current study present potential novel biomarkers for early detection of
endometriosis. Our patient and control groups are not sufficiently large to claim that we have
characterized a new biomarker, but the present study does lay the groundwork for future
efforts to identify and develop miRNA blood‐based biomarkers for endometriosis. Future
studies with broader miRNA profiling may reveal additional aetiology‐specific miRNA
signatures and would also investigate the relationship between the miRNAs and the disease
severity.

CHAPTER 7
Victoria Nisenblat 189

CHAPTER 7
190 Victoria Nisenblat

CHAPTER 8
Victoria Nisenblat 191
Generaldiscussionand
conclusions

CHAPTER 8
192 Victoria Nisenblat
8.1 Introduction
Endometriosis is a common disabling disease of young women, with significant morbidities
and costs associated with diagnosis and treatment. The invasive nature of the current surgical
diagnostic method is associated with a substantial diagnostic delay and limits our ability to
research the effectiveness of non‐surgical therapies. Our lack of understanding of the cellular
mechanisms of endometriosis limits our ability to identify biomarkers with the potential to
diagnose the disease non‐invasively. A growing body of evidence suggests that endometriosis
affects multiple organ systems, which could be the due to systemic alterations in women with
endometriosis. Identifying unique circulatory signatures of endometriosis could result in a
better understanding of the disease as well as the development of a non‐invasive diagnostic
test.
MiRNAs regulate important cellular processes via fine tuning of gene networks and appear to
be a powerful tool in biomedical research. In particular, miRNA signatures detected in plasma
and serum have been proposed as diagnostic markers in various diseases. The advantage of
using miRNAs as biomarkers is that the traditional protein‐based biomarker discovery
pipelines often require a priori knowledge of the biomarker candidates, whereas currently
available high throughput miRNA technologies facilitates the simultaneous screening of
hundreds of miRNAs. This increases the efficiency of the identification of disease‐specific
panels of dysregulated miRNAs as well as their gene and protein targets. Furthermore, miRNAs
can be precisely quantified using qRT‐PCR that provides exceptionally high sensitivity and
specificity of detection and also allows absolute quantification of miRNAs down to the level of
copy number per RNA sample, potentially providing precise cut‐off concentrations for the
purpose of diagnosis.
The work presented in this thesis centres on the expression of plasma miRNAs in
endometriosis, addressing the relevance of these miRNAs in pathophysiology of the disease,
and their correlation with expression in eutopic endometrium. The endpoint of the project
was to assess the utility of plasma miRNAs for diagnosis of endometriosis. At the
commencement of this project, miRNA profiles have been identified in eutopic and ectopic
endometrium in endometriosis, but there were no data on the expression of miRNAs in the
systemic circulation in association with this disease.

CHAPTER 8
Victoria Nisenblat 193
A step‐wise approach was undertaken in attempting to investigate the expression of
circulating miRNAs in endometriosis. Firstly, we developed a methodology for reliable and
reproducible quantification of circulating miRNAs (Chapter 3), based on a detailed analysis of
the existing knowledge in the field (Chapter 2). Secondly, in order to assess influence of
physiological fluctuations of ovarian steroids on miRNA expression in reproductive‐age
women, we screened for miRNA expression across the different phases of menstrual cycle in
a healthy population and in women with endometriosis (Chapter 4). Thirdly, we identified an
endometriosis‐specific miRNA profile and demonstrated a concordance between the micro
array results and singleplex qRT‐PCR, which is the gold standard for miRNA detection (Chapter
4). Next, in order to assess functional relevance of the identified miRNAs in endometriosis, we
performed in silico functional analyses of the predicted targets of dysregulated miRNAs
(Chapter 4) and summarised the literature on the functional involvement of these miRNAs in
biological processes similar to those known to occur in endometriosis (Chapter 5). In order to
identify a relationship between miRNAs in the circulation and in the eutopic endometrium in
endometriosis, we identified the eutopic endometrial miRNA profile in women with and
without endometriosis (Chapter 6). Finally, we conducted a prospective diagnostic accuracy
study on a larger cohort to assess the validity of circulating miRNAs for diagnosis of
endometriosis (Chapter 7).
8.2 QuantificationofcirculatingmiRNAandapproachtothedataanalysis
MiRNA research is a relatively new field of molecular biology and there is no consensus
regarding the measurement and analysis of miRNA data, particularly with respect to low
abundant circulating miRNAs (Chapter 2). It is clear that different methodological approaches
alter the experimental results and can have significant impact on the final conclusions. In this
project we established a method to reproducibly and accurately measure miRNAs in plasma
(Chapter 3). Normalization is a key step for the accurate quantification of RNA levels with qRT‐
PCR and we deduced that quantile normalisation is optimal for large‐scale experiments,
whereas singleplex qRT‐PCR quantification requires endogenous controls that should be
carefully selected for the experimental dataset. RNU6B, a member of small RNA U6 family has
been previously suggested as a stable endogenous control, however in our datasets it was not
stable between the groups in our experiments (Chapter 4), which led to its exclusion as a
control. Additionally, we explored the exclusion of “low call detectors” as a process to obtain

CHAPTER 8
194 Victoria Nisenblat
more meaningful diagnostic results. This strategy of miRNA identification (Chapter 3) was an
important step in development of the technique to measure miRNAs from plasma and/or
serum with sufficient sensitivity and precision to be clinically effective.
8.3 InfluenceofthemenstrualcycleonexpressionofcirculatingmiRNAs
Cyclical changes in reproductive steroids appeared to have little impact on plasma miRNA
profiles in either healthy control or endometriotic populations. Our data indicates that plasma
diagnostic tests based on the miRNAs identified as disease‐specific are likely to be accurate at
any time in the menstrual cycle in reproductive aged women. This information is of particularly
important in biomarker research, where the stage of the menstrual cycle in which blood is
drawn, or the use of the hormonal medications, might have a negative impact on the
performance of a miRNA‐based test. The absence of significant menstrual phase variations in
plasma miRNA expression does not exclude the existence of miRNA‐hormonal interactions nor
does it contradict the previous reports of cycle‐dependant miRNA pattern in endometrial cells
and tissue, in which high local concentration of reproductive steroid hormones are likely to
have a greater impact on miRNA profiles.
8.4 PlasmamiRNAprofileinendometriosis
We demonstrated a distinct miRNA expression pattern in the plasma from endometriosis
sufferers (Chapter 4). Six plasma miRNAs were up‐regulated and 6 down‐regulated in
endometriosis compared to healthy controls whereas 45 plasma miRNAs showed a trend to
significant differential regulation in endometriosis. This suggests there is considerable
potential to develop a non‐invasive diagnostic test using plasma miRNAs.
Although we did not find menstrual cycle dependent miRNA expression levels in either the
control or endometriosis groups, 7 of the 12 miRNA transcripts were able to distinguish
women with and without endometriosis only at certain phases of the cycle. The late
proliferative stage appeared to be the best sampling phase with 10 of the miRNAs
demonstrating an ability to distinguish women with endometriosis from healthy controls. It
may be that women with endometriosis have a mild divergence from the usual physiological
responsiveness to steroid hormones in the late follicular phase that is apparent only when
women with and without endometriosis are compared. This could explain why women with
CHAPTER 8
Victoria Nisenblat 195
endometriosis tend to have a prolonged proliferative phase and are resistant to P4 compared
to healthy controls.
Few miRNAs were dysregulated in both plasma (in our study) and endometriotic lesions
(published data from other groups) and all of the miRNAs that were concordant in both
compartments were down‐regulated in plasma. It is therefore unlikely that the direct
excretion of miRNAs from endometriotic tissues into the circulation accounts for the presence
of endometriosis‐associated miRNAs. Even though the origin of endometriosis‐associated
circulating miRNAs remains unknown, this observation supports an assumption that miRNAs
are actively secreted from the cells, rather than passively released from the damaged
endometriotic cells.
8.5 FunctionalinvolvementofdysregulatedplasmamiRNAsinendometriosis
Functional analyses of endometriosis‐associated miRNAs and their predicted targets allowed
identification of mRNA targets, biological and functional pathways and molecular networks
that demonstrate concordance with our current knowledge of the cellular and molecular
events associated with endometriosis (Chapter 4). The top functional networks converged on
CTNNB1, which is a key factor in the Wnt, MAPK and NFkB signalling and on its downstream
target CCND1. Additional molecular networks constituted by the endometriosis‐associated
predicted targets converged on molecules involved in inflammation (NFkB), proliferation
(MAPK), tissue remodelling (TGF‐β) and steroidogenesis (ER, PR, LH, FSH). These functional
analyses raise the possibility that plasma miRNAs may provoke some of the adverse health
epiphenomenon associated with endometriosis. If this was validated in further study,
therapeutic alteration of endometriosis‐associated plasma miRNAs levels might have
potential utility to reduce the risk of health sequelae from endometriotic disease.
Even though most of the deregulated plasma miRNAs were not directly linked to
endometriosis, their aberrant expression has been described in the context of inflammatory,
auto‐immune and malignant diseases (Chapter 5). Functional associations and regulatory
mechanisms indicate that TP‐53, TGF‐β, MAPK, NFkB and Wnt‐signalling pathways are likely
to modulate the expression of the miRNAs identified in our study. For most of the investigated
miRNAs, the direction of dysregulation varies in different types of medical conditions,
suggesting a tissue‐ or disease‐specific action. Collectively, our results further highlight the

CHAPTER 8
196 Victoria Nisenblat
putative role of miRNAs in the pathogenesis of endometriosis as their main biological
functions linked to endometriotic disease.
8.6 MiRNAexpressionineutopicendometriuminendometriosis
Array based global miRNA profiling in secretory eutopic endometrium, including both
endometrial and stromal compartments, revealed differentially expressed miRNAs in women
with endometriosis (Chapter 6). Our results did not correlate with previously published data,
which could be explained by differences in samples processing, in detection platforms as well
as by differences in the endometriosis and control subsets between the studies. The
comparison between women with pelvic pain ± infertility with and without endometriosis
revealed 2 differentially expressed miRNAs, miR‐551a and miR‐148a*. It is possible that these
miRNAs could become endometrial biomarkers for endometriosis; however an endometrial
biopsy either solely or in combination with the blood test would be required.
The miRNA profile was different when disease‐free women with pelvic pain were compared
to those without pain, suggesting that chronic pain alters the eutopic endometrium
irrespective of endometriosis. It might be possible that the neural markers and associated
active substances, earlier demonstrated to be increased in women with pelvic pain, modulate
the miRNA profile. Further investigation into this entity might promote our understanding of
the pelvic pain mechanism and development of the therapies for women with chronic pelvic
pain. This information is also valuable to assess confounding effect of pelvic pain in further
studies of miRNAs in eutopic endometrium.
Over‐expression of miR‐551a appeared to be consistently unique to the eutopic endometrium
from women with endometriosis. MiR‐551a promotes tumour cell motility, invasion, and
metastasis via suppression of PRL‐3 gene in gastric cancer and thus may have a role in ectopic
endometrial implantation in the pelvis. Additionally the predicted targets of miR‐551a include
transcripts that alter TNF‐α‐induced regulation of IL‐6/IL‐8 and VEGF translation which has
functional relevance for endometriosis.
Finally, our results did not reveal a correlation between eutopic endometrium and the plasma
miRNA profile in endometriosis, suggesting that miRNAs in plasma are not passively released
from eutopic endometrial tissue. However, circulating miRNAs may modulate cell function in

CHAPTER 8
Victoria Nisenblat 197
eutopic endometrium, further supporting an assumption that endometrial alterations are
likely related to the disease progression, rather than an initiating pathogenetic event.
8.7 PlasmamiRNAsasdiagnosticmarkersforendometriosis
In a prospective diagnostic study on clinically well‐described cohort of 68 women, a set of 4
miRNAs (miR‐155, miR‐574‐3p, miR‐133a and miR‐30c) displayed aberrant expression in
plasma in endometriosis and were incorporated into a predictive model in combination with
clinical parameters (Chapter 7). The expression of the identified miRNAs was not confounded
by any of the demographic or clinical parameters, suggesting their usefulness as potential
biomarkers for a broad unselected population. The differential expression of the miRNAs was
not influenced by recurrent disease or a previous diagnosis of endometriosis in currently
disease‐free women, suggesting that the plasma miRNAs reflect only active ongoing disease,
and thus may be valuable as indicators of disease recurrence or response to treatment.
MiR‐133a and miR‐30c were over‐expressed only in the severe forms of the disease
particularly in women with ovarian endometrioma. It is possible that these miRNAs represent
a unique miRNA profile of endometrioma. If this is the case, concurrent miRNA testing may
improve our ability to discriminate endometrioma from other types of ovarian tumours after
an ultrasound diagnosis of an ovarian mass.
Our diagnostic accuracy estimates suggest that a plasma miRNA‐based predictive model is no
more accurate than surgical diagnosis. Further development of the miRNA‐based diagnostic
algorithm with incorporation of clinical data and biochemical parameters suggest a promising
role in improvement of the diagnostic potential of this test. This study was the basis for a
provisional patent and successful application for commercial funding to enable investigation
of a broader range of miRNA‐based markers in larger set of samples. In its present form the
model proposed by us can be utilised as a triage test, which would improve surgical selection
and provide an opportunity to intervene at earlier time. The lower specificity means that some
women will undergo unnecessary surgery, but the number of women without endometriosis
who have surgery will be lower than without the test.
When this thesis was in the final stages of drafting, 2 studies on diagnosis of circulating miRNAs
in endometriosis were published (211‐212), demonstrated inconsistency in the obtained
results. Discrepancy between studies on miRNA expression has been demonstrated in other

CHAPTER 8
198 Victoria Nisenblat
diseases and tissues, including studies on endometrial tissue in endometriosis. Both technical
and biological variability of miRNA expression highlights the complexity of miRNA research
and indicates that further exploration is required in the field before we are able to make a
confident claim for miRNA‐based biomarkers.
In summary, the results of the study included in this thesis present potential novel biomarkers
for early detection of endometriosis, although larger sample numbers are required to optimise
diagnostic algorithms. The strength of this study was in its prospective nature and in the
meticulous design of methodology for both laboratory and clinical aspects of the project, i.e.
miRNA quantification, biomarker selection and conduct of the diagnostic study.
8.8 Futureperspectives
This study provides an initial insight into circulating miRNAs in association with endometriotic
disease. The results of the present study open several areas of investigation.
Firstly, an improved understanding of the source, regulation and mechanism of action of
circulating miRNAs may reveal new insights into the pathophysiology and systemic
manifestations of endometriosis. A better understanding of the mechanisms through which
miRNAs are released in the systemic circulation and/or are taken up by recipient cells will help
unravel the role of circulating miRNAs and the mechanism of their regulation. Future studies
will need to establish whether endometriosis‐specific miRNAs in the bloodstream are
contained in exosomes or microparticles, whether they can enter cells and, eventually, which
cells and whether they have any biological action.
The present study lays the groundwork for future efforts to identify and develop miRNAs as a
novel class of blood‐based biomarkers for endometriosis. Our results need to be confirmed in
larger patient groups in different populations. Subgroup analyses are required to determine if
factors like race, geographical area, disease severity or differences in clinical symptomatology
impact on circulating miRNA profiles. Further studies are also required to confirm and to
characterise the miRNA profile associated with the presence of ovarian endometrioma and to
assess the diagnostic value of these miRNAs to differentiate endometrioma from other
ovarian tumours in combination with the imaging modalities. It would also be interesting to
assess the diagnostic value of the integrated models, in which miRNA profiles are combined
with other types of biomarkers, i.e. Ca‐125, VEGF, IL6, IL8, TGF‐β and TNF‐α. Finally, studies

CHAPTER 8
Victoria Nisenblat 199
that assess broader miRNA profiling or using different detection platforms may potentially
reveal additional markers.
There is considerable need for a better understanding of the pathophysiology of
endometriosis and its epiphenomena and better strategies to translate this knowledge into
clinically effective outcomes. Identification of circulating biomarkers of endometriosis with
the potential to be developed as a non‐invasive blood test for endometriosis has considerable
clinical relevance and is expected to reduce the complications of endometriosis, to minimise
the healthcare costs and to promote research towards development of more efficient
therapies.

CHAPTER 8
200 Victoria Nisenblat

CHAPTER 9
Victoria Nisenblat 201
References

CHAPTER 9
202 Victoria Nisenblat
1. Giudice LC, Kao LC. Endometriosis. Lancet. 2004;364(9447):1789‐99.
2. Brosens I. Endometriosis rediscovered? Hum Reprod. 2004;19(7):1679‐80.
3. Garry R. The endometriosis syndromes: a clinical classification in the presence of aetiological confusion and therapeutic anarchy. Hum Reprod. 2004;19(4):760‐8.
4. Batt RE. A History of Endometriosis: Springer Verlag; 2011.
5. Guo SW, Wang Y. Sources of heterogeneities in estimating the prevalence of endometriosis in infertile and previously fertile women. Fertil Steril. 2006;86(6):1584‐95.
6. Bulun SE. Endometriosis. N Engl J Med. 2009 Jan 15;360(3):268‐79.
7. Farquhar CM. Extracts from the "clinical evidence". Endometriosis. BMJ. 2000;320(7247):1449‐52.
8. Greene R, Stratton P, Cleary SD, Ballweg ML, Sinaii N. Diagnostic experience among 4,334 women reporting surgically diagnosed endometriosis. Fertil Steril. 2009;91(1):32‐9.
9. Guo SW, Wang Y. The prevalence of endometriosis in women with chronic pelvic pain. Gynecol Obstet Invest. 2006;62(3):121‐30.
10. Laufer M, Goitein L, Bush M, Cramer D, Emans S. Prevalence of endometriosis in adolescent girls with chronic pelvic pain not responding to conventional therapy. J Pediatr Adolesc Gynecol. 1997;10(4):199‐202.
11. Eskenazi B, Warner ML. Epidemiology of endometriosis. Obstet Gynecol Clin North Am. 1997;24(2):235‐58.
12. Weir E, Mustard C, Cohen M, Kung R. Endometriosis: what is the risk of hospital admission, readmission, and major surgical intervention? J Minim Invasive Gynecol. 2005;12(6):486‐93.
13. Cheong Y, Tay P, Luk F, Gan H, Li TC, Cooke I. Laparoscopic surgery for endometriosis: How often do we need to re‐operate? J Obstet Gynecol. 2008;28(1):82‐5.
14. Farquhar C. Endometriosis. BMJ. 2007;334(7587):249‐53.
15. Guo SW. Recurrence of endometriosis and its control. Hum Reprod Update. 2009;15(4):441‐61.
16. Somigliana E, Vigano P, Parazzini F, Stoppelli S, Giambattista E, Vercellini P. Association between endometriosis and cancer: a comprehensive review and a critical analysis of clinical and epidemiological evidence. Gynecol Oncol. 2006;101(2):331‐41.
17. Van Gorp T, Amant F, Neven P, Vergote I, Moerman P. Endometriosis and the development of malignant tumours of the pelvis. A review of literature. Best Pract Res Clin Obstet Gynaecol. 2004;18(2):349‐71.

CHAPTER 9
Victoria Nisenblat 203
18. Nezhat F, Datta MS, Hanson V, Pejovic T, Nezhat C. The relationship of endometriosis and ovarian malignancy: a review. Fertil Steril. 2008;90(5):1559‐70.
19. Swiersz L. Role of endometriosis in cancer and tumor development. Ann N Y Acad Sci. 2002;955(1):281‐92.
20. Clauw D, Chrousos G. Chronic pain and fatigue syndromes: overlapping clinical and neuroendocrine features and potential pathogenic mechanisms. Neuroimmunomodulation. 1997;4(3):134‐53.
21. Sinaii N, Cleary SD, Ballweg M, Nieman LK, Stratton P. High rates of autoimmune and endocrine disorders, fibromyalgia, chronic fatigue syndrome and atopic diseases among women with endometriosis: a survey analysis. Hum Reprod. 2002;17(10):2715‐24.
22. Gemmill JAL, Stratton P, Cleary SD, Ballweg ML, Sinaii N. Cancers, infections, and endocrine diseases in women with endometriosis. Fertil Steril. 2010;94(5):1627‐31.
23. Mu F, Rich‐Edwards J, Rimm E, Mukamal K, Missmer S. A prospective study of endometriosis and coronary heart disease risk. Fertil Steril. [conference proceeding]. 2012;98(3):S67‐S.
24. Santoro L, D'Onofrio F, Campo S, Ferraro PM, Tondi P, Campo V, et al. Endothelial dysfunction but not increased carotid intima‐media thickness in young European women with endometriosis. Hum Reprod. 2012;27(5):1320‐6.
25. Podgaec S, Abrão MS. The role of immunology in the etiopathogenesis, diagnosis and treatment of endometriosis. Review Einstein. 2005;3(3):203‐6.
26. Bedaiwy M, Falcone T. Peritoneal fluid environment in endometriosis. Minerva Ginecol. 2003;55:1‐13.
27. Olovsson M. Immunological Aspects of Endometriosis: An Update. Am J Reprod Immunol. 2011;66:101‐4.
28. Agic A, Xu H, Finas D, Banz C, Diedrich K, Hornung D. Is endometriosis associated with systemic subclinical inflammation? Gynecol Obstet Invest. 2006;62(3):139‐47.
29. Pasoto SG, Abrao MS, Viana VST, Bueno C, Leon EP, Bonfa E. Endometriosis and systemic lupus erythematosus: a comparative evaluation of clinical manifestations and serological autoimmune phenomena. American Journal of Reproductive Immunology. 2005;53(2):85‐93.
30. Augoulea A, Alexandrou A, Creatsa M, Vrachnis N, Lambrinoudaki I. Pathogenesis of endometriosis: the role of genetics, inflammation and oxidative stress. Arch Gynecol Obstet. 2012;286(1):99‐103.
31. Matalliotakis IM, Cakmak H, Fragouli YG, Goumenou AG, Mahutte NG, Arici A. Epidemiological characteristics in women with and without endometriosis in the Yale series. Arch Gynecol Obstet. 2008;277(5):389‐93.

CHAPTER 9
204 Victoria Nisenblat
32. Missmer SA, Hankinson SE, Spiegelman D, Barbieri RL, Michels KB, Hunter DJ. In utero exposures and the incidence of endometriosis. Fertil Steril. 2004;82(6):1501‐8.
33. Cramer DW, Wilson E, Stillman RJ, Berger MJ, Belisle S, Schiff I, et al. The relation of endometriosis to menstrual characteristics, smoking, and exercise. JAMA. 1986;255(14):1904‐8.
34. Reichman ME, Judd JT, Longcope C, Schatzkin A, Clevidence BA, Nair PP, et al. Effects of alcohol consumption on plasma and urinary hormone concentrations in premenopausal women. J Natl Cancer Inst. 1993;85(9):722‐7.
35. Signorello LB, Harlow BL, Cramer DW, Spiegelman D, Hill JA. Epidemiologic determinants of endometriosis: a hospital‐based case‐control study. Ann Epidemiol. 1997;7(4):267‐74.
36. Moen MH. Endometriosis in monozygotic twins. Acta Obstet Gynecol Scand. 1994;73(1):59‐62.
37. Moen MH, Magnus P. The familial risk of endometriosis. Acta Obstet Gynecol Scand. 1993;72(7):560‐4.
38. Simpson J, Elias S, Malinak L, Buttram Jr V. Heritable aspects of endometriosis. I. Genetic studies. Am J Obstet Gynecol. 1980;137(3):327‐31.
39. Zondervan KT, Weeks DE, Colman R, Cardon LR, Hadfield R, Schleffler J, et al. Familial aggregation of endometriosis in a large pedigree of rhesus macaques. Hum Reprod. 2004;19(2):448‐55.
40. Di W, Guo SW. The search for genetic variants predisposing women to endometriosis. Curr Opin Obstet Gynecol. 2007;19(4):395‐401.
41. Guo SW. The association of endometriosis risk and genetic polymorphisms involving dioxin detoxification enzymes: a systematic review. Eur J Obstet Gynecol Reprod Biol. 2006;124(2):134‐43.
42. Nyholt DR, Low SK, Anderson CA, Painter JN, Uno S, Morris AP, et al. Genome‐wide association meta‐analysis identifies new endometriosis risk loci. Nature Genet. 2012;44(12):1355‐9.
43. Gao X, Yeh YC, Outley J, Simon J, Botteman M, Spalding J. Health‐related quality of life burden of women with endometriosis: a literature review. Curr Med Res Opin. 2006;22(9):1787‐97.
44. Kjerulff KH, Erickson B, Langenberg P. Chronic gynecological conditions reported by US women: findings from the National Health Interview Survey, 1984 to 1992. Am J Public Health. 1996;86(2):195‐9.
45. Jones G, Jenkinson C, Kennedy S. The impact of endometriosis upon quality of life: a qualitative analysis. J Psychosom Obstet Gynaecol. 2004;25(2):123‐33.

CHAPTER 9
Victoria Nisenblat 205
46. Siedentopf F, Tariverdian N, Rücke M, Kentenich H, Arck PC. Immune Status, Psychosocial Distress and Reduced Quality of Life in Infertile Patients with Endometriosis. Am J Reprod Immunol. 2008;60(5):449‐61.
47. Simoens S, Hummelshoj L, D'Hooghe T. Endometriosis: cost estimates and methodological perspective. Hum Reprod Update. 2007;13(4):395‐404.
48. Luisi S, Lazzeri L, Ciani V, Petraglia F. Endometriosis in Italy: From cost estimates to new medical treatment. Gynecol Endocrinol. 2009;25(11):734‐40.
49. Buch DE, S. Vancaillie, T The $6 billion woman and the $600 million girl. The pelvic pain report. 2011.
50. Gao X, Outley J, Botteman M, Spalding J, Simon JA, Pashos CL. Economic burden of endometriosis. Fertil Steril. 2006;86(6):1561‐72.
51. Bianconi L, Hummelshoj L, Coccia ME, Vigano P, Vittori G, Veit J, et al. Recognizing endometriosis as a social disease: the European Union‐encouraged Italian Senate approach. Fertil Steril. 2007;88(5):1285‐7.
52. Sampson JA. Metastatic or Embolic Endometriosis, due to the Menstrual Dissemination of Endometrial Tissue into the Venous Circulation. Am J Pathol. 1927;3(2):93‐110.
53. Grümmer R. Animal models in endometriosis research. Hum Reprod Update. 2006;12(5):641‐9.
54. D’Hooghe TM, Debrock S. Endometriosis, retrograde menstruation and peritoneal inflammation in women and in baboons. Hum Reprod Update. 2002;8(1):84‐8.
55. Halme J, Hammond MG, Hulka JF, Raj SG, Talbert LM. Retrograde menstruation in healthy women and in patients with endometriosis. Obstet Gynecol. 1984;64(2):151‐4.
56. Nunley Jr WC, Kitchin III JD. Congenital atresia of the uterine cervix with pelvic endometriosis. Arch Surg. 1980;115(6):757‐8.
57. Nap AW, Groothuis PG, Demir AY, Evers JL, Dunselman GA. Pathogenesis of endometriosis. Best Pract Res Clin Obstet Gynaecol. 2004 Apr;18(2):233‐44.
58. Stovall DW, Bowser LM, Archer DF, Guzick DS. Endometriosis‐associated pelvic pain: evidence for an association between the stage of disease and a history of chronic pelvic pain. Fertil Steril. 1997;68(1):13‐8.
59. Barnhart K, Dunsmoor‐Su R, Coutifaris C. Effect of endometriosis on in vitro fertilization. Fertil Steril. 2002;77(6):1148‐55.
60. Shifren JL, Tseng JF, Zaloudek CJ, Ryan IP, Meng YG, Ferrara N, et al. Ovarian steroid regulation of vascular endothelial growth factor in the human endometrium: implications for angiogenesis during the menstrual cycle and in the pathogenesis of endometriosis. J Clin Endocrinol Metab. 1996;81(8):3112‐8.

CHAPTER 9
206 Victoria Nisenblat
61. Fedele L, Marchini M, Bianchi S, Dorta M, Arcaini L, Fontana P. Structural and ultrastructural defects in preovulatory endometrium of normo‐ovulating infertile women with minimal or mild endometriosis. Fertil Steril. 1990;53(6):989‐93.
62. Jones C, Denton J, Fazleabas A. Morphological and glycosylation changes associated with the endometrium and ectopic lesions in a baboon model of endometriosis. Hum Reprod. 2006;21(12):3068‐80.
63. Agic A, Djalali S, Diedrich K, Hornung D. Apoptosis in endometriosis. Gynecol Obstet Invest. 2009;68(4):217‐23.
64. Kyama C, Mihalyi A, Simsa P, Mwenda J, Tomassetti C, Meuleman C, et al. Non‐steroidal targets in the diagnosis and treatment of endometriosis. Curr Med Chem. 2008;15(10):1006‐17.
65. Gupta S, Agarwal A, Krajcir N, Alvarez JG. Role of oxidative stress in endometriosis. Reprod Biomed Online. 2006;13(1):126‐34.
66. Bulun SE, Cheng YH, Yin P, Imir G, Utsunomiya H, Attar E, et al. Progesterone resistance in endometriosis: link to failure to metabolize estradiol. Mol Cell Endocrinol. 2006;248(1):94‐103.
67. Wei Q, St Clair JB, Fu T, Stratton P, Nieman LK. Reduced expression of biomarkers associated with the implantation window in women with endometriosis. Fertil Steril. 2009;91(5):1686‐91.
68. Hastings JM, Fazleabas AT. A baboon model for endometriosis: implications for fertility. Reprod Biol Endocrinol. 2006;4(Suppl 1):S7.
69. Gashaw I, Hastings JM, Jackson KS, Winterhager E, Fazleabas AT. Induced endometriosis in the baboon (Papio anubis) increases the expression of the proangiogenic factor CYR61 (CCN1) in eutopic and ectopic endometria. Biol Reprod. 2006;74(6):1060‐6.
70. Kyama C, Mihalyi A, Simsa P, Falconer H, Fulop V, Mwenda J, et al. Role of cytokines in the endometrial‐peritoneal cross‐talk and development of endometriosis. Front Biosci (Elite Ed). 2009;1:444‐54.
71. Ulukus M, Arici A. Immunology of endometriosis. Minerva Ginecol. 2005;57(3):237‐48.
72. Burney RO, Giudice LC. Pathogenesis and pathophysiology of endometriosis. Fertil Steril. 2012.
73. Harada T, Yoshioka H, Yoshida S, Iwabe T, Onohara Y, Tanikawa M, et al. Increased interleukin‐6 levels in peritoneal fluid of infertile patients with active endometriosis. Am J Obstet Gynecol. 1997;176(3):593‐7.
74. Eisermann J, Gast M, Pineda J, Odem R, Collins J. Tumor necrosis factor in peritoneal fluid of women undergoing laparoscopic surgery. Fertil Steril. 1988;50(4):573‐9.

CHAPTER 9
Victoria Nisenblat 207
75. Lucidi RS, Witz CA, Chrisco M, Binkley PA, Shain SA, Schenken RS. A novel in vitro model of the early endometriotic lesion demonstrates that attachment of endometrial cells to mesothelial cells is dependent on the source of endometrial cells. Fertil Steril. 2005;84(1):16‐21.
76. Akoum A, Lemay A, McColl S, Turcot‐Lemay L, Maheux R. Elevated concentration and biologic activity of monocyte chemotactic protein‐1 in the peritoneal fluid of patients with endometriosis. Fertil Steril. 1996;66(1):17‐23.
77. Nothnick WB. Treating endometriosis as an autoimmune disease. Fertil Steril. 2001;76(2):223‐31.
78. Gupta S, Agarwal A, Sekhon L, Krajcir N, Cocuzza M, Falcone T. Serum and peritoneal abnormalities in endometriosis: potential use as diagnostic markers. Minerva Ginecol. 2006;58(6):527‐51.
79. Pasoto SG, Abrao MS, Podgaec S, Bonfa E. Endometriosis and Autoimmunity. In: Walker SE, Jara LJ, editors. Handbook of Systemic Autoimmune Diseases: Elsevier; 2008. p. 103‐11.
80. Pelch KE, Schroder AL, Kimball PA, Sharpe‐Timms KL, Davis JW, Nagel SC. Aberrant gene expression profile in a mouse model of endometriosis mirrors that observed in women. Fertil Steril. 2010;93(5):1615‐27. e18.
81. Aghajanova L, Velarde MC, Giudice LC. Altered gene expression profiling in endometrium: evidence for progesterone resistance. Semin Reprod Sci. 2010;28(1):51‐8.
82. Eyster KM, Hansen KA, Winterton E, Klinkova O, Drappeau D, Mark‐Kappeler CJ. Reciprocal communication between endometrial stromal cells and macrophages. Reprod Sci. 2010;17(9):809‐22.
83. Eyster KM, Klinkova O, Kennedy V, Hansen KA. Whole genome deoxyribonucleic acid microarray analysis of gene expression in ectopic versus eutopic endometrium. Fertil Steril. 2007;88(6):1505‐33.
84. Hever A, Roth RB, Hevezi P, Marin ME, Acosta JA, Acosta H, et al. Human endometriosis is associated with plasma cells and overexpression of B lymphocyte stimulator. Proc Natl Acad Sci U S A. 2007;104(30):12451‐6.
85. Hull M, Escareno C, Godsland J, Doig J, Johnson C, Phillips S, et al. Endometrial‐peritoneal interactions during endometriotic lesion establishment. Am J Pathol. 2008;173(3):700‐15.
86. Klinkova O, Hansen KA, Winterton E, Mark CJ, Eyster KM. Two‐way communication between endometrial stromal cells and monocytes. Reprod Sci. 2010;17(2):125‐36.
87. Borghese B, Mondon F, Noël JC, Fayt I, Mignot TM, Vaiman D, et al. Research resource: gene expression profile for ectopic versus eutopic endometrium provides new insights into endometriosis oncogenic potential. Mol Endocrinol. 2008;22(11):2557‐62.

CHAPTER 9
208 Victoria Nisenblat
88. Kao LC, Germeyer A, Tulac S, Lobo S, Yang JP, Taylor RN, et al. Expression profiling of endometrium from women with endometriosis reveals candidate genes for disease‐based implantation failure and infertility. Endocrinology. 2003;144(7):2870‐81.
89. Flores I, Rivera E, Ruiz LA, Santiago OI, Vernon MW, Appleyard CB. Molecular profiling of experimental endometriosis identified gene expression patterns in common with human disease. Fertil Steril. 2007;87(5):1180‐99.
90. Umezawa M, Tanaka N, Tainaka H, Takeda K, Ihara T, Sugamata M. Microarray analysis provides insight into the early steps of pathophysiology of mouse endometriosis model induced by autotransplantation of endometrium. Life Sci. 2009;84(23‐24):832‐7.
91. Sherwin J, Sharkey A, Mihalyi A, Simsa P, Catalano R, D'Hooghe T. Global gene analysis of late secretory phase, eutopic endometrium does not provide the basis for a minimally invasive test of endometriosis. Hum Reprod. 2008;23(5):1063‐8.
92. Mettler L, Salmassi A, Schollmeyer T, Schmutzler A, Püngel F, Jonat W. Comparison of c‐DNA microarray analysis of gene expression between eutopic endometrium and ectopic endometrium (endometriosis). J Assist Reprod Genet. 2007;24(6):249‐58.
93. Arimoto T, Katagiri T, Oda K, Tsunoda T, Yasugi T, Osuga Y, et al. Genome‐wide cDNA microarray analysis of gene‐expression profiles involved in ovarian endometriosis. Int J Oncol. 2003;22(3):551‐60.
94. Ohlsson Teague EMC, Print CG, Hull ML. The role of microRNAs in endometriosis and associated reproductive conditions. Hum Reprod Update. 2010;16(2):142‐65.
95. Kao L, Germeyer A, Tulac S, Lobo S, Yang J, Taylor R, et al. Expression profiling of endometrium from women with endometriosis reveals candidate genes for disease‐based implantation failure and infertility. Endocrinology. 2003;144(7):2870‐81.
96. Burney RO, Talbi S, Hamilton AE, Vo KC, Nyegaard M, Nezhat CR, et al. Gene expression analysis of endometrium reveals progesterone resistance and candidate susceptibility genes in women with endometriosis. Endocrinology. 2007;148(8):3814‐26.
97. Hadfield R, Mardon H, Barlow D, Kennedy S. Delay in the diagnosis of endometriosis: a survey of women from the USA and the UK. Hum Reprod. 1996;11(4):878‐80.
98. Dmowski WP, Lesniewicz R, Rana N, Pepping P, Noursalehi M. Changing trends in the diagnosis of endometriosis: a comparative study of women with pelvic endometriosis presenting with chronic pelvic pain or infertility. Fertil Steril. 1997;67(2):238‐43.
99. Ballard K, Lowton K, Wright J. What’s the delay? A qualitative study of women’s experiences of reaching a diagnosis of endometriosis. Fertil Steril. 2006;86(5):1296‐301.
100. Arruda M, Petta C, Abrao M, Benetti‐Pinto C. Time elapsed from onset of symptoms to diagnosis of endometriosis in a cohort study of Brazilian women. Hum Reprod. 2003;18(4):756‐9.

CHAPTER 9
Victoria Nisenblat 209
101. Husby GK, Haugen RS, Moen MH. Diagnostic delay in women with pain and endometriosis. Acta Obstet Gynecol Scand. 2003;82(7):649‐53.
102. Matsuzaki S, Canis M, Pouly JL, Rabischong B, Botchorishvili R, Mage G. Relationship between delay of surgical diagnosis and severity of disease in patients with symptomatic deep infiltrating endometriosis. Fertil Steril. 2006;86(5):1314‐6.
103. Barnhart K, Dunsmoor‐Su R, Coutifaris C. Effect of endometriosis on in vitro fertilization. Fertility and sterility. 2002;77(6):1148‐55.
104. Sinaii N, Plumb K, Cotton L, Lambert A, Kennedy S, Zondervan K, et al. Differences in characteristics among 1,000 women with endometriosis based on extent of disease. Fertil Steril. 2008;89(3):538‐45.
105. Osuga Y, Koga K, Tsutsumi O, Yano T, Maruyama M, Kugu K, et al. Role of laparoscopy in the treatment of endometriosis‐associated infertility. Gynecol Obstet Invest. 2002;53‐59(1):33‐9.
106. Brosens I. Endometriosis and the outcome of in vitro fertilization. Fertil Steril. 2004;81(5):1198‐200.
107. Vercellini P, Somigliana E, Viganò P, Abbiati A, Barbara G, Fedele L. Chronic pelvic pain in women: etiology, pathogenesis and diagnostic approach. Gynecol Endocrinol. 2009;25(3):149‐58.
108. Price J, Farmer G, Harris J, Hope T, Kennedy S, Mayou R. Attitudes of women with chronic pelvic pain to the gynaecological consultation: a qualitative study. BJOG. 2006;113(4):446‐52.
109. Redwine DB. The visual appearance of endometriosis and its impact on our concepts of disease. Prog Clin Biol Res. 1990;323:393‐412.
110. Kennedy S, Bergqvist A, Chapron C, D’Hooghe T, Dunselman G, Greb R, et al. ESHRE guideline for the diagnosis and treatment of endometriosis. Hum Reprod. 2005;20(10):2698‐704.
111. Canis M, Donnez JG, Guzick DS, Halme JK, Rock JA, Schenken RS, et al. Revised american society for reproductive medicine classification of endometriosis: 1996. Fertil Steril. 1997;67(5):817‐21.
112. Vercellini P, Trespidi L, De Giorgi O, Cortesi I, Parazzini F, Crosignani P. Endometriosis and pelvic pain: relation to disease stage and localization. Fertil Steril. 1996;65(2):299‐304.
113. Guzick DS, Silliman NP, Adamson GD, Buttram VC, Canis M, Malinak LR, et al. Prediction of pregnancy in infertile women based on the American Society for Reproductive Medicine's revised classification of endometriosis. Fertil Steril. 1997;67(5):822‐9.
114. Chapron C, Fauconnier A, Dubuisson JB, Barakat H, Vieira M, Bréart G. Deep infiltrating endometriosis: relation between severity of dysmenorrhoea and extent of disease. Hum Reprod. 2003;18(4):760‐6.

CHAPTER 9
210 Victoria Nisenblat
115. Jansen FW, Kapiteyn K, Trimbos‐Kemper T, Hermans J, Trimbos J. Complications of laparoscopy: a prospective multicentre observational study. BJOG. 1997;104(5):595‐600.
116. Chapron C, Querleu D, Bruhat MA, Madelenat P, Fernandez H, Pierre F, et al. Surgical complications of diagnostic and operative gynaecological laparoscopy: a series of 29,966 cases. Hum Reprod. 1998;13(4):867‐72.
117. Howard FM. The role of laparoscopy in the evaluation of chronic pelvic pain: pitfalls with a negative laparoscopy. J Am Assoc Gynecol Laparosc. 1996;4(1):85‐94.
118. Buchweitz O, Wülfing P, Malik E. Interobserver variability in the diagnosis of minimal and mild endometriosis. Eur J Obstet Gynecol Reprod Biol. 2005;122(2):213‐7.
119. Walter AJ, Hentz JG, Magtibay PM, Cornella JL, Magrina JF. Endometriosis: correlation between histologic and visual findings at laparoscopy. Am J Obstet Gynecol. 2001;184(7):1407‐13.
120. Stratton P, Winkel CA, Sinaii N, Merino MJ, Zimmer C, Nieman LK. Location, color, size, depth, and volume may predict endometriosis in lesions resected at surgery. Fertil Steril. 2002;78(4):743‐9.
121. Wykes CB, Clark TJ, Khan KS. REVIEW: Accuracy of laparoscopy in the diagnosis of endometriosis: a systematic quantitative review. BJOG. 2004;111(11):1204‐12.
122. Winkel CA. Evaluation and management of women with endometriosis. Obstet Gynecol. 2003;102(2):397.
123. El Bishry G, Tselos V, Pathi A. Correlation between laparoscopic and histological diagnosis in patients with endometriosis. J Obstet Gynaecol. 2008;28(5):511‐5.
124. Stegmann BJ, Sinaii N, Liu S, Segars J, Merino M, Nieman LK, et al. Using location, color, size, and depth to characterize and identify endometriosis lesions in a cohort of 133 women. Fertil Steril. 2008;89(6):1632‐6.
125. Martin D, Hubert G, Vander Zwaag R, El‐Zeky F. Laparoscopic appearances of peritoneal endometriosis. Fertil Steril. 1989;51(1):63‐7.
126. Kazanegra R, Zaritsky E, Lathi RB, Clopton P, Nezhat C. Diagnosis of stage I endometriosis: comparing visual inspection to histologic biopsy specimen. J Minim Invasive Gynecol. 2008;15(2):176‐80.
127. Marchino GL, Gennarelli G, Enria R, Bongioanni F, Lipari G, Massobrio M. Diagnosis of pelvic endometriosis with use of macroscopic versus histologic findings. Fertil Steril. 2005;84(1):12‐5.
128. Buchweitz O, Staebler A, Tio J, Kiesel L. Detection of peritoneal endometriotic lesions by autofluorescence laparoscopy. Am J Obstet Gynecol. 2006;195(4):949‐54.
129. Barrueto FF, Audlin KM. The use of narrowband imaging for identification of endometriosis. J Minim Invasive Gynecol. 2008;15(5):636‐9.

CHAPTER 9
Victoria Nisenblat 211
130. Griffiths A, Koutsouridou R, Penketh R. Rectovaginal endometriosis‐a frequently missed diagnosis. J Obstet Gynaecol. 2007;27(6):605‐7.
131. Rogers PAW, D'Hooghe TM, Fazleabas A, Gargett CE, Giudice LC, Montgomery GW, et al. Priorities for endometriosis research: recommendations from an international consensus workshop. Reprod Sci. 2009;16(4):335‐46.
132. May K, Conduit‐Hulbert S, Villar J, Kirtley S, Kennedy S, Becker C. Peripheral biomarkers of endometriosis: a systematic review. Hum Reprod Update. 2010;16(6):651‐74.
133. May KE, Villar J, Kirtley S, Kennedy SH, Becker CM. Endometrial alterations in endometriosis: a systematic review of putative biomarkers. Hum Reprod Update. 2011;17(5):637‐53.
134. Ballard K, Seaman H, De Vries CS, Wright J. Can symptomatology help in the diagnosis of endometriosis? Findings from a national case–control study—Part 1. BJOG. 2008;115(11):1382‐91.
135. Chapron C, Barakat H, Fritel X, Dubuisson JB, Bréart G, Fauconnier A. Presurgical diagnosis of posterior deep infiltrating endometriosis based on a standardized questionnaire. Hum Reprod. 2005;20(2):507‐13.
136. Fedele L, Bianchi S, Carmignani L, Berlanda N, Fontana E, Frontino G. Evaluation of a new questionnaire for the presurgical diagnosis of bladder endometriosis. Hum Reprod. 2007;22(10):2698‐701.
137. Fauconnier A, Chapron C. Endometriosis and pelvic pain: epidemiological evidence of the relationship and implications. Hum Reprod Update. 2005;11(6):595‐606.
138. Ling FW. Randomized controlled trial of depot leuprolide in patients with chronic pelvic pain and clinically suspected endometriosis. Obstet Gynecol. 1999;93‐98(1):51‐8.
139. Eskenazi B, Warner M, Bonsignore L, Olive D, Samuels S, Vercellini P. Validation study of nonsurgical diagnosis of endometriosis. Fertil Steril. 2001;76(5):929‐35.
140. Alcázar JL, Laparte C, Jurado M, Lopez‐Garcia G. The role of transvaginal ultrasonography combined with color velocity imaging and pulsed Doppler in the diagnosis of endometrioma. Fertil Steril. 1997;67(3):487‐91.
141. Moore J, Copley S, Morris J, Lindsell D, Golding S, Kennedy S. A systematic review of the accuracy of ultrasound in the diagnosis of endometriosis. Ultrasound Obstet Gynecol. 2002;20(6):630‐4.
142. Dessole S, Farina M, Rubattu G, Cosmi E, Ambrosini G, Battista Nardelli G. Sonovaginography is a new technique for assessing rectovaginal endometriosis. Fertil Steril. 2003;79(4):1023‐7.
143. Bazot M, Thomassin I, Hourani R, Cortez A, Darai E. Diagnostic accuracy of transvaginal sonography for deep pelvic endometriosis. Ultrasound Obstet Gynecol. 2004;24(2):180‐5.

CHAPTER 9
212 Victoria Nisenblat
144. Guerriero S, Ajossa S, Gerada M, Virgilio B, Angioni S, Melis GB. Diagnostic value of transvaginal ‘tenderness‐guided’ultrasonography for the prediction of location of deep endometriosis. Hum Reprod. 2008;23(11):2452‐7.
145. Abrao MS, Gonçalves MOC, Dias Jr JA, Podgaec S, Chamie LP, Blasbalg R. Comparison between clinical examination, transvaginal sonography and magnetic resonance imaging for the diagnosis of deep endometriosis. Hum Reprod. 2007;22(12):3092‐7.
146. Bazot M, Malzy P, Cortez A, Roseau G, Amouyal P, Darai E. Accuracy of transvaginal sonography and rectal endoscopic sonography in the diagnosis of deep infiltrating endometriosis. Ultrasound Obstet Gynecol. 2007;30(7):994‐1001.
147. Bazot M, Bornier C, Dubernard G, Roseau G, Cortez A, Daraï E. Accuracy of magnetic resonance imaging and rectal endoscopic sonography for the prediction of location of deep pelvic endometriosis. Hum Reprod. 2007;22(5):1457‐63.
148. Menada MV, Remorgida V, Abbamonte L, Nicoletti A, Ragni N, Ferrero S. Does transvaginal ultrasonography combined with water‐contrast in the rectum aid in the diagnosis of rectovaginal endometriosis infiltrating the bowel? Hum Reprod. 2008;23(5):1069‐75.
149. Chamié LP, Blasbalg R, Gonçalves MOC, Carvalho FM, Abrão MS, de Oliveira IS. Accuracy of magnetic resonance imaging for diagnosis and preoperative assessment of deeply infiltrating endometriosis. Int J Gynecol Obstet. 2009;106(3):198‐201.
150. Bazot M, Lafont C, Rouzier R, Roseau G, Thomassin‐Naggara I, Daraī E. Diagnostic accuracy of physical examination, transvaginal sonography, rectal endoscopic sonography, and magnetic resonance imaging to diagnose deep infiltrating endometriosis. Fertil Steril. 2009;92(6):1825‐33.
151. Kinkel K, Frei KA, Balleyguier C, Chapron C. Diagnosis of endometriosis with imaging: a review. Eur Radiol. 2006;16(2):285‐98.
152. Bedaiwy MA, Falcone T. Laboratory testing for endometriosis. Clinica chimica acta. 2004;340(1):41‐56.
153. May KE, Conduit‐Hulbert SA, Villar J, Kirtley S, Kennedy SH, Becker CM. Peripheral biomarkers of endometriosis: a systematic review. Hum Reprod Update. 2010;16(6):651‐74.
154. Brosens J, Timmerman D, Starzinski‐Powitz A, Brosens I. Noninvasive diagnosis of endometriosis: the role of imaging and markers. Obstet Gynecol Clin North Am. 2003;30(1):95.
155. Matalliotakis IM, Vassiliadis S, Goumenou AG, Fragouli Y, Athanassakis I. Suggested markers for the diagnosis of endometriosis. Curr Womens Health Rev. 2008;4(1):25‐8.
156. Othman EEDR, Hornung D, Salem HT, Khalifa EA, El‐Metwally TH, Al‐Hendy A. Serum cytokines as biomarkers for nonsurgical prediction of endometriosis. Eur J Obstet Gynecol Reprod Biol. 2008;137(2):240‐6.

CHAPTER 9
Victoria Nisenblat 213
157. Yang WCV, Chen HW, Au HK, Chang CW, Huang CT, Yen YH, et al. Serum and endometrial markers. Best Pract Res Clin Obstet Gynaecol. 2004;18(2):305‐18.
158. Mol BWJ, Bayram N, Lijmer JG, Wiegerinck MAHM, Bongers MY, van der Veen F, et al. The performance of CA‐125 measurement in the detection of endometriosis: a meta‐analysis. Fertil Steril. 1998;70(6):1101‐8.
159. Al‐Jefout M, Dezarnaulds G, Cooper M, Tokushige N, Luscombe G, Markham R, et al. Diagnosis of endometriosis by detection of nerve fibres in an endometrial biopsy: a double blind study. Hum Reprod. 2009;24(12):3019‐24.
160. Bokor A, Kyama C, Vercruysse L, Fassbender A, Gevaert O, Vodolazkaia A, et al. Density of small diameter sensory nerve fibres in endometrium: a semi‐invasive diagnostic test for minimal to mild endometriosis. Hum Reprod. 2009;24(12):3025‐32.
161. Ferrero S, Gillott DJ, Remorgida V, Ragni N, Venturini PL, Grudzinskas JG. Proteomics technologies in endometriosis. Expert Rev Proteomics. 2008;5(5):705‐14.
162. Wren JD, Wu Y, Guo SW. A system‐wide analysis of differentially expressed genes in ectopic and eutopic endometrium. Hum Reprod. 2007;22(8):2093‐102.
163. Siristatidis CS. What have the'omics done for endometriosis? Med Sci Monit. 2009;15(5):RA116.
164. Carthew RW, Sontheimer EJ. Origins and Mechanisms of miRNAs and siRNAs. Cell. 2009;136(4):642‐55.
165. Flynt AS, Lai EC. Biological principles of microRNA‐mediated regulation: shared themes amid diversity. Nat Rev Genet. 2008;9(11):831‐42.
166. Bartel DP. MicroRNAs: target recognition and regulatory functions. Cell. 2009;136(2):215‐33.
167. Bhayani MK, Calin GA, Lai SY. Functional relevance of miRNA sequences in human disease. Mutat Res. 2012;731(1‐2):14‐9.
168. Chang TC, Mendell JT. microRNAs in vertebrate physiology and human disease. Annu Rev Genomics Hum Genet. 2007;8:215‐39.
169. Hammond SM. RNAi, microRNAs, and human disease. Cancer Chemother Pharmacol. 2006;58 Suppl 1:s63‐8.
170. Griffiths‐Jones S, Saini HK, van Dongen S, Enright AJ. miRBase: tools for microRNA genomics. Nucleic Acids Res. 2008;36(Database issue):D154‐8.
171. Cai X, Hagedorn CH, Cullen BR. Human microRNAs are processed from capped, polyadenylated transcripts that can also function as mRNAs. RNA. 2004;10(12):1957‐66.
172. Lee Y, Ahn C, Han J, Choi H, Kim J, Yim J, et al. The nuclear RNase III Drosha initiates microRNA processing. Nature. 2003;425(6956):415‐9.

CHAPTER 9
214 Victoria Nisenblat
173. Yi R, Qin Y, Macara IG, Cullen BR. Exportin‐5 mediates the nuclear export of pre‐microRNAs and short hairpin RNAs. Genes Dev. 2003;17(24):3011.
174. Chendrimada TP, Gregory RI, Kumaraswamy E, Norman J, Cooch N, Nishikura K, et al. TRBP recruits the Dicer complex to Ago2 for microRNA processing and gene silencing. Nature. 2005;436(7051):740‐4.
175. Filipowicz W, Bhattacharyya SN, Sonenberg N. Mechanisms of post‐transcriptional regulation by microRNAs: are the answers in sight? Nat Rev Genet. 2008;9(2):102‐14.
176. Bartel DP. MicroRNAs: genomics, biogenesis, mechanism, and function. Cell. 2004;116(2):281‐97.
177. Bhattacharyya SN, Habermacher R, Martine U, Closs EI, Filipowicz W. Relief of microRNA‐mediated translational repression in human cells subjected to stress. Cell. 2006;125(6):1111‐24.
178. Vasudevan S, Tong Y, Steitz JA. Switching from repression to activation: microRNAs can up‐regulate translation. Science. 2007;318(5858):1931‐4.
179. Bauersachs J, Thum T. Biogenesis and regulation of cardiovascular microRNAs. Circ Res. 2011;109(3):334‐47.
180. Carletti M, Christenson L. MicroRNA in the ovary and female reproductive tract. J Anim Sci. 2009;87(14 suppl):E29‐E38.
181. Costa A, Osorio C, Dias S. MicroRNA expression profiling in bone marrow: implications in hematological malignancies. Biotechnol J. 2009;4(1):88‐97.
182. Furer V, Greenberg JD, Attur M, Abramson SB, Pillinger MH. The role of microRNA in rheumatoid arthritis and other autoimmune diseases. Clin Immunol. 2010;136(1):1‐15.
183. Garofalo M, Condorelli G, Croce CM. MicroRNAs in diseases and drug response. Curr Opin Pharmacol. 2008;8(5):661‐7.
184. Hutchison ER, Okun E, Mattson MP. The Therapeutic Potential of microRNAs in Nervous System Damage, Degeneration and Repair. Neuromolecular Med. 2009;11(3):153‐61.
185. Jay C, Nemunaitis J, Chen P, Fulgham P, Tong AW. miRNA profiling for diagnosis and prognosis of human cancer. DNA Cell Biol. 2007 May;26(5):293‐300.
186. Kuss AW, Chen W. MicroRNAs in brain function and disease. Curr Neurol Neurosci Rep. 2008;8(3):190‐7.
187. Li M, Marin‐Muller C, Bharadwaj U, Chow KH, Yao Q, Chen C. MicroRNAs: control and loss of control in human physiology and disease. World J Surg. 2009;33(4):667‐84.
188. Lu J, Getz G, Miska EA, Alvarez‐Saavedra E, Lamb J, Peck D, et al. MicroRNA expression profiles classify human cancers. Nature. 2005;435(7043):834‐8.

CHAPTER 9
Victoria Nisenblat 215
189. Meola N, Gennarino VA, Banfi S. microRNAs and genetic diseases. Pathogenetics. 2009;2(1):7.
190. Pauley KM, Chan EK. MicroRNAs and their emerging roles in immunology. Ann N Y Acad Sci. 2008;1143:226‐39.
191. Rachagani S, Kumar S, Batra SK. MicroRNA in pancreatic cancer: pathological, diagnostic and therapeutic implications. Cancer Lett. 2010;292(1):8‐16.
192. Sassen S, Miska EA, Caldas C. MicroRNA: implications for cancer. Virchows Arch. 2008;452(1):1‐10.
193. Singh SK, Pal Bhadra M, Girschick HJ, Bhadra U. MicroRNAs‐‐micro in size but macro in function. FEBS J. 2008;275(20):4929‐44.
194. Soifer HS, Rossi JJ, Saetrom P. MicroRNAs in disease and potential therapeutic applications. Mol Ther. 2007;15(12):2070‐9.
195. Visone R, Croce CM. MiRNAs and Cancer. Am J Pathol. 2009;174(4):1131‐8.
196. Yendamuri S, Calin GA. The role of microRNA in human leukemia: a review. Leukemia. 2009;23(7):1257‐63.
197. Pan Q, Chegini N. MicroRNA signature and regulatory functions in the endometrium during normal and disease states. Semin Reprod Med. 2008;26(6):479‐93.
198. Hasemeier B, Christgen M, Kreipe H, Lehmann U. Reliable microRNA profiling in routinely processed formalin‐fixed paraffin‐embedded breast cancer specimens using fluorescence labelled bead technology. BMC Biotechnol. 2008;8(1):90.
199. Liu A, Tetzlaff MT, VanBelle P, Elder D, Feldman M, Tobias JW, et al. MicroRNA Expression Profiling Outperforms mRNA Expression Profiling in Formalin‐fixed Paraffin‐embedded Tissues. Int J Clin Exp Pathol. 2009;2(6):519‐27.
200. Cortez MA, Bueso‐Ramos C, Ferdin J, Lopez‐Berestein G, Sood AK, Calin GA. MicroRNAs in body fluids—the mix of hormones and biomarkers. Nat Rev Clin Oncol. 2011;8(8):467‐77.
201. Kosaka N, Iguchi H, Ochiya T. Circulating microRNA in body fluid: a new potential biomarker for cancer diagnosis and prognosis. Cancer Sci. 2010;101(10):2087‐92.
202. Reid G, Kirschner MB, van Zandwijk N. Circulating microRNAs: Association with disease and potential use as biomarkers. Crit Rev Oncol Hematol. 2010.
203. Scholer N, Langer C, Dohner H, Buske C, Kuchenbauer F. Serum microRNAs as a novel class of biomarkers: a comprehensive review of the literature. Exp Hematol. 2010;38(12):1126‐30.
204. Weiland M, Gao XH, Zhou L, Mi QS. Small RNAs have a large impact: Circulating microRNAs as biomarkers for human diseases. RNA Biol. 2012;9(6):850‐9.

CHAPTER 9
216 Victoria Nisenblat
205. Hawkins SM, Creighton CJ, Han DY, Zariff A, Anderson ML, Gunaratne PH, et al. Functional microRNA involved in endometriosis. Mol Endocrinol. 2011;25(5):821‐32.
206. Burney RO, Hamilton AE, Aghajanova L, Vo KC, Nezhat CN, Lessey BA, et al. MicroRNA expression profiling of eutopic secretory endometrium in women with versus without endometriosis. Mol Hum Reprod. 2009;15(10):625‐31.
207. Filigheddu N, Gregnanin I, Porporato PE, Surico D, Perego B, Galli L, et al. Differential expression of microRNAs between eutopic and ectopic endometrium in ovarian endometriosis. J Biomed Biotechnol. 2010;2010:369549.
208. Ohlsson Teague EM, Van der Hoek KH, Van der Hoek MB, Perry N, Wagaarachchi P, Robertson SA, et al. MicroRNA‐regulated pathways associated with endometriosis. Mol Endocrinol. 2009 Feb;23(2):265‐75.
209. Pan Q, Luo X, Toloubeydokhti T, Chegini N. The expression profile of micro‐RNA in endometrium and endometriosis and the influence of ovarian steroids on their expression. Mol Hum Reprod. 2007;13(11):797‐806.
210. Hawkins SM, Buchold GM, Matzuk MM. Minireview: the roles of small RNA pathways in reproductive medicine. Mol Endocrinol. 2011;25(8):1257‐79.
211. Wang WT, Zhao YN, Han BW, Hong SJ, Chen YQ. Circulating MicroRNAs Identified in a Genome‐Wide Serum MicroRNA Expression Analysis as Noninvasive Biomarkers for Endometriosis. J Clin Endocrinol Metab. 2012:published ahead of print November 1, doi:10.1210/jc.2012‐415.
212. Jia S, Yang Y, Lang J, Sun P, Leng J. Plasma miR‐17‐5p, miR‐20a and miR‐22 are down‐regulated in women with endometriosis. Hum Reprod. 2012;published online November 30.
213. Wang K, Zhang S, Marzolf B, Troisch P, Brightman A, Hu Z, et al. Circulating microRNAs, potential biomarkers for drug‐induced liver injury. Proc Natl Acad Sci U S A. 2009;106(11):4402‐7.
214. Vickers KC, Palmisano BT, Shoucri BM, Shamburek RD, Remaley AT. MicroRNAs are transported in plasma and delivered to recipient cells by high‐density lipoproteins. Nat Cell Biol. 2011;13(4):423‐33.
215. Valadi H, Ekstrom K, Bossios A, Sjostrand M, Lee JJ, Lotvall JO. Exosome‐mediated transfer of mRNAs and microRNAs is a novel mechanism of genetic exchange between cells. Nat Cell Biol. 2007;9(6):654‐9.
216. Pegtel DM, Cosmopoulos K, Thorley‐Lawson DA, van Eijndhoven MA, Hopmans ES, Lindenberg JL, et al. Functional delivery of viral miRNAs via exosomes. Proc Natl Acad Sci U S A. 2010;107(14):6328‐33.
217. Taylor DD, Gercel‐Taylor C. MicroRNA signatures of tumor‐derived exosomes as diagnostic biomarkers of ovarian cancer. Gynecol Oncol. 2008;110(1):13‐21.

CHAPTER 9
Victoria Nisenblat 217
218. Wang K, Zhang S, Weber J, Baxter D, Galas DJ. Export of microRNAs and microRNA‐protective protein by mammalian cells. Nucleic Acids Res. 2010;38(20):7248‐59.
219. Hunter MP, Ismail N, Zhang X, Aguda BD, Lee EJ, Yu L, et al. Detection of microRNA expression in human peripheral blood microvesicles. PLoS One. 2008;3(11):e3694.
220. Kosaka N, Iguchi H, Yoshioka Y, Takeshita F, Matsuki Y, Ochiya T. Secretory mechanisms and intercellular transfer of microRNAs in living cells. J Biol Chem. 2010;285(23):17442‐52.
221. Pigati L, Yaddanapudi SCS, Iyengar R, Kim DJ, Hearn SA, Danforth D, et al. Selective release of microRNA species from normal and malignant mammary epithelial cells. PLoS One. 2010;5(10):e13515.
222. Pula G, Perera S, Prokopi M, Sidibe A, Boulanger CM, Mayr M. Proteomic analysis of secretory proteins and vesicles in vascular research. Proteomics Clin Appl. 2008;2(6):882‐91.
223. Zhang Y, Liu D, Chen X, Li J, Li L, Bian Z, et al. Secreted monocytic miR‐150 enhances targeted endothelial cell migration. Molecular cell. 2010;39(1):133‐44.
224. Arroyo JD, Chevillet JR, Kroh EM, Ruf IK, Pritchard CC, Gibson DF, et al. Argonaute2 complexes carry a population of circulating microRNAs independent of vesicles in human plasma. Proc Natl Acad Sci U S A. 2011;108(12):5003‐8.
225. Turchinovich A, Weiz L, Langheinz A, Burwinkel B. Characterization of extracellular circulating microRNA. Nucleic Acids Res. 2011;39(16):7223‐33.
226. Iguchi H, Kosaka N, Ochiya T. Secretory microRNAs as a versatile communication tool. Commun Integr Biol. 2010;3(5):478‐81.
227. Qian K, Hu L, Chen H, Li H, Liu N, Li Y, et al. Hsa‐miR‐222 is involved in differentiation of endometrial stromal cells in vitro. Endocrinology. 2009;150(10):4734‐43.
228. Xia HF, Jin XH, Song PP, Cui Y, Liu CM, Ma X. Temporal and spatial regulation of let‐7a in the uterus during embryo implantation in the rat. J Reprod Dev. 2010;56(1):73‐8.
229. Xia HF, Jin XH, Song PP, Cui Y, Liu CM, Ma X. Temporal and spatial regulation of miR‐320 in the uterus during embryo implantation in the rat. Int J Mol Sci. 2010;11(2):719‐30.
230. Chakrabarty A, Tranguch S, Daikoku T, Jensen K, Furneaux H, Dey SK. MicroRNA regulation of cyclooxygenase‐2 during embryo implantation. Proc Natl Acad Sci U S A. 2007;104(38):15144‐9.
231. Chandana EPS, Maeda Y, Ueda A, Kiyonari H, Oshima N, Yamamoto M, et al. Involvement of the Reck tumor suppressor protein in maternal and embryonic vascular remodeling in mice. BMC Dev Biol. 2010;10(1):84.

CHAPTER 9
218 Victoria Nisenblat
232. Su RW, Lei W, Liu JL, Zhang ZR, Jia B, Feng XH, et al. The integrative analysis of microRNA and mRNA expression in mouse uterus under delayed implantation and activation. PLoS One. 2010;5(11):e15513.
233. Toloubeydokhti T, Pan Q, Luo X, Bukulmez O, Chegini N. The expression and ovarian steroid regulation of endometrial micro‐RNAs. Reprod Sci. 2008;15(10):993‐1001.
234. Nothnick WB, Healy C, Hong X. Steroidal regulation of uterine miRNAs is associated with modulation of the miRNA biogenesis components Exportin‐5 and Dicer1. Endocrine. 2010;37(2):265‐73.
235. Kuokkanen S, Chen B, Ojalvo L, Benard L, Santoro N, Pollard JW. Genomic profiling of microRNAs and messenger RNAs reveals hormonal regulation in microRNA expression in human endometrium. Biol Reprod. 2010;82(4):791‐801.
236. Chegini N. Uterine microRNA signature and consequence of their dysregulation in uterine disorders. Anim Reprod. 2010;7(3):117‐28.
237. Klinge CM. miRNAs and estrogen action. Trends Endocrinol Metab. 2012;23(5):223‐33.
238. Yamagata K, Fujiyama S, Ito S, Ueda T, Murata T, Naitou M, et al. Maturation of microRNA is hormonally regulated by a nuclear receptor. Mol Cell. 2009;36(2):340‐7.
239. Cochrane DR, Cittelly DM, Richer JK. Steroid receptors and microRNAs: relationships revealed. Steroids. 2011;76(1):1‐10.
240. Petracco R, Grechukhina O, Popkhadze S, Massasa E, Zhou Y, Taylor HS. MicroRNA 135 regulates HOXA10 expression in endometriosis. J Clin Endocrinol Metab. 2011;96(12):E1925‐33.
241. Ramon LA, Braza‐Boils A, Gilabert‐Estelles J, Gilabert J, Espana F, Chirivella M, et al. microRNAs expression in endometriosis and their relation to angiogenic factors. Hum Reprod. 2011;26(5):1082‐90.
242. Pritchard CC, Cheng HH, Tewari M. MicroRNA profiling: approaches and considerations. Nat Rev Genet. 2012;13(5):358‐69.
243. van Rooij E. The art of microRNA research. Circ Res. 2011 Jan 21;108(2):219‐34.
244. Zampetaki A, Mayr M. Analytical challenges and technical limitations in assessing circulating MiRNAs. Thromb Haemost. 2012;108(2).
245. Chen X, Ba Y, Ma L, Cai X, Yin Y, Wang K, et al. Characterization of microRNAs in serum: a novel class of biomarkers for diagnosis of cancer and other diseases. Cell Res. 2008;18(10):997‐1006.
246. Chim SS, Shing TK, Hung EC, Leung TY, Lau TK, Chiu RW, et al. Detection and characterization of placental microRNAs in maternal plasma. Clin Chem. 2008;54(3):482‐90.

CHAPTER 9
Victoria Nisenblat 219
247. Gilad S, Meiri E, Yogev Y, Benjamin S, Lebanony D, Yerushalmi N, et al. Serum microRNAs are promising novel biomarkers. PLoS One. 2008;3(9):e3148.
248. Mitchell PS, Parkin RK, Kroh EM, Fritz BR, Wyman SK, Pogosova‐Agadjanyan EL, et al. Circulating microRNAs as stable blood‐based markers for cancer detection. Proc Natl Acad Sci U S A. 2008;105(30):10513‐8.
249. Fleige S, Pfaffl MW. RNA integrity and the effect on the real‐time qRT‐PCR performance. Mol Aspects Med. 2006;27(2‐3):126‐39.
250. Fleige S, Walf V, Huch S, Prgomet C, Sehm J, Pfaffl MW. Comparison of relative mRNA quantification models and the impact of RNA integrity in quantitative real‐time RT‐PCR. Biotechnol Lett. 2006;28(19):1601‐13.
251. Ibberson D, Benes V, Muckenthaler MU, Castoldi M. RNA degradation compromises the reliability of microRNA expression profiling. BMC Biotechnol. 2009;9:102.
252. Kroh EM, Parkin RK, Mitchell PS, Tewari M. Analysis of circulating microRNA biomarkers in plasma and serum using quantitative reverse transcription‐PCR (qRT‐PCR). Methods. 2010;50(4):298‐301.
253. Cerkovnik P, Perhavec A, Zgajnar J, Novakovic S. Optimization of an RNA isolation procedure from plasma samples. Int J Mol Med. 2007;20(3):293‐300.
254. Mraz M, Malinova K, Mayer J, Pospisilova S. MicroRNA isolation and stability in stored RNA samples. Biochem Biophys Res Commun. 2009;390(1):1‐4.
255. Nelson PT, Wang WX, Wilfred BR, Tang G. Technical variables in high‐throughput miRNA expression profiling: much work remains to be done. Biochim Biophys Acta. 2008;1779(11):758‐65.
256. Kirschner MB, Kao SC, Edelman JJ, Armstrong NJ, Vallely MP, van Zandwijk N, et al. Haemolysis during Sample Preparation Alters microRNA Content of Plasma. PLoS One. 2011;6(9).
257. Pritchard CC, Kroh E, Wood B, Arroyo JD, Dougherty KJ, Miyaji MM, et al. Blood Cell Origin of Circulating MicroRNAs: A Cautionary Note for Cancer Biomarker Studies. Cancer Prev Res. 2012;5(3):492‐7.
258. McDonald JS, Milosevic D, Reddi HV, Grebe SK, Algeciras‐Schimnich A. Analysis of circulating microRNA: preanalytical and analytical challenges. Clin Chem. 2011;57(6):833‐40.
259. Grasedieck S, Scholer N, Bommer M, Niess JH, Tumani H, Rouhi A, et al. Impact of serum storage conditions on microRNA stability. Leukemia. 2012;26(11):2414‐6.
260. D'Alessandra Y, Devanna P, Limana F, Straino S, Di Carlo A, Brambilla PG, et al. Circulating microRNAs are new and sensitive biomarkers of myocardial infarction. Eur Heart J. 2010;31(22):2765‐73.

CHAPTER 9
220 Victoria Nisenblat
261. Fichtlscherer S, De Rosa S, Fox H, Schwietz T, Fischer A, Liebetrau C, et al. Circulating microRNAs in patients with coronary artery disease. Circ Res. 2010;107(5):677‐84.
262. Heegaard NH, Schetter AJ, Welsh JA, Yoneda M, Bowman ED, Harris CC. Circulating micro‐RNA expression profiles in early stage nonsmall cell lung cancer. Int J Cancer. 2012;130(6):1378‐86.
263. Wang WX, Wilfred BR, Baldwin DA, Isett RB, Ren N, Stromberg A, et al. Focus on RNA isolation: obtaining RNA for microRNA (miRNA) expression profiling analyses of neural tissue. Biochim Biophys Acta. 2008;1779(11):749‐57.
264. Weber JA, Baxter DH, Zhang S, Huang DY, Huang KH, Lee MJ, et al. The microRNA spectrum in 12 body fluids. Clin Chem. 2010;56(11):1733‐41.
265. Accerbi M, Schmidt SA, De Paoli E, Park S, Jeong D‐H, Green PJ. Methods for Isolation of Total RNA to Recover miRNAs and Other Small RNAs from Diverse Species. Methods Mol Biol 2010;592:31‐50.
266. Davison TS, Johnson CD, Andruss BF. Analyzing micro‐RNA expression using microarrays. Part B: Databases and Statistics. Methods Enzymol 2006;411:14‐34.
267. Castoldi M, Benes V, Hentze MW, Muckenthaler MU. miChip: A microarray platform for expression profiling of microRNAs based on locked nucleic acid (LNA) oligonucleotide capture probes. Methods. 2007;43(2):146‐52.
268. Sergueeva Z, Dow S, Collins H, Parrish ML, editors. Optimization of miRNA Extraction from Serum. Molecular Med Tri Conference; 2012; San Francisco, California.
269. Andreasen D, Fog JU, Biggs W, Salomon J, Dahslveen IK, Baker A, et al. Improved microRNA quantification in total RNA from clinical samples. Methods. 2010;50(4):S6‐9.
270. Becker C, Hammerle‐Fickinger A, Riedmaier I, Pfaffl MW. mRNA and microRNA quality control for RT‐qPCR analysis. Methods. 2010;50(4):237‐43.
271. Schroeder A, Mueller O, Stocker S, Salowsky R, Leiber M, Gassmann M, et al. The RIN: an RNA integrity number for assigning integrity values to RNA measurements. BMC Mol Biol. 2006;7:3.
272. Davis N, Biddlecom N, Hecht D, Fogel GB. On the relationship between GC content and the number of predicted microRNA binding sites by MicroInspector. Comput Biol Chem. 2008;32(3):222‐6.
273. Ach RA, Wang H, Curry B. Measuring microRNAs: comparisons of microarray and quantitative PCR measurements, and of different total RNA prep methods. BMC Biotechnol. 2008;8:69.
274. Chen Y, Gelfond JA, McManus LM, Shireman PK. Reproducibility of quantitative RT‐PCR array in miRNA expression profiling and comparison with microarray analysis. BMC Genomics. 2009;10:407.

CHAPTER 9
Victoria Nisenblat 221
275. Git A, Dvinge H, Salmon‐Divon M, Osborne M, Kutter C, Hadfield J, et al. Systematic comparison of microarray profiling, real‐time PCR, and next‐generation sequencing technologies for measuring differential microRNA expression. RNA. 2010;16(5):991‐1006.
276. Jensen SG, Lamy P, Rasmussen MH, Ostenfeld MS, Dyrskjot L, Orntoft TF, et al. Evaluation of two commercial global miRNA expression profiling platforms for detection of less abundant miRNAs. BMC Genomics. 2011;12:435.
277. Pradervand S, Weber J, Lemoine F, Consales F, Paillusson A, Dupasquier M, et al. Concordance among digital gene expression, microarrays, and qPCR when measuring differential expression of microRNAs. Biotechniques. 2010;48(3):219‐22.
278. Sato F, Tsuchiya S, Terasawa K, Tsujimoto G. Intra‐platform repeatability and inter‐platform comparability of microRNA microarray technology. PLoS One. 2009;4(5):e5540.
279. Wang B, Howel P, Bruheim S, Ju J, Owen LB, Fodstad O, et al. Systematic evaluation of three microRNA profiling platforms: microarray, beads array, and quantitative real‐time PCR array. PLoS One. 2011;6(2):e17167.
280. Mestdagh P, Feys T, Bernard N, Guenther S, Chen C, Speleman F, et al. High‐throughput stem‐loop RT‐qPCR miRNA expression profiling using minute amounts of input RNA. Nucleic Acids Res. 2008;36(21):e143.
281. McTigue PM, Peterson RJ, Kahn JD. Sequence‐dependent thermodynamic parameters for locked nucleic acid (LNA)‐DNA duplex formation. Biochemistry. 2004;43(18):5388‐405.
282. Kauppinen S, Vester B, Wengel J. Locked nucleic acid (LNA): High affinity targeting of RNA for diagnostics and therapeutics. Drug Discovery Today: Technologies. 2005;2(3):287‐90.
283. Zampetaki A, Kiechl S, Drozdov I, Willeit P, Mayr U, Prokopi M, et al. Plasma microRNA profiling reveals loss of endothelial miR‐126 and other microRNAs in type 2 diabetes. Circ Res. 2010;107(6):810‐7.
284. Vorwerk S, Ganter K, Cheng Y, Hoheisel J, Stahler PF, Beier M. Microfluidic‐based enzymatic on‐chip labeling of miRNAs. N Biotechnol. 2008;25(2‐3):142‐9.
285. Li S, Zhu J, Zhang W, Chen Y, Zhang K, Popescu LM, et al. Signature microRNA expression profile of essential hypertension and its novel link to human cytomegalovirus infection. Circulation. 2011;124(2):175‐84.
286. Tijsen AJ, Creemers EE, Moerland PD, de Windt LJ, van der Wal AC, Kok WE, et al. MiR423‐5p as a circulating biomarker for heart failure. Circ Res. 2010;106(6):1035‐9.
287. Lodes MJ, Caraballo M, Suciu D, Munro S, Kumar A, Anderson B. Detection of cancer with serum miRNAs on an oligonucleotide microarray. PLoS One. 2009;4(7):e6229.

CHAPTER 9
222 Victoria Nisenblat
288. Metzker ML. Sequencing technologies ‐ the next generation. Nat Rev Genet. 2010;11(1):31‐46.
289. Tian G, Yin X, Luo H, Xu X, Bolund L, Zhang X, et al. Sequencing bias: comparison of different protocols of microRNA library construction. BMC Biotechnol. 2010;10:64.
290. Werner T. Next generation sequencing in functional genomics. Brief Bioinform. 2010;11(5):499‐511.
291. Krzyzanowski PM, Muro EM, Andrade‐Navarro MA. Computational approaches to discovering noncoding RNA. Wiley Interdiscip Rev RNA. 2012;3(4):567‐79.
292. Keller A, Backes C, Leidinger P, Kefer N, Boisguerin V, Barbacioru C, et al. Next‐generation sequencing identifies novel microRNAs in peripheral blood of lung cancer patients. Mol Biosyst. 2011;7(12):3187‐99.
293. Yang Q, Lu J, Wang S, Li H, Ge Q, Lu Z. Application of next‐generation sequencing technology to profile the circulating microRNAs in the serum of preeclampsia versus normal pregnant women. Clin Chim Acta. 2011;412(23‐24):2167‐73.
294. Dvinge H, Bertone P. HTqPCR: high‐throughput analysis and visualization of quantitative real‐time PCR data in R. Bioinformatics. 2009;25(24):3325‐6.
295. Sarkar D, Parkin R, Wyman S, Bendoraite A, Sather C, Delrow J, et al. Quality assessment and data analysis for microRNA expression arrays. Nucleic Acids Res. 2009;37(2):e17.
296. D'Haene B, Vandesompele J, Hellemans J. Accurate and objective copy number profiling using real‐time quantitative PCR. Methods. 2010;50(4):262‐70.
297. Shi L, Campbell G, Jones WD, Campagne F, Wen Z, Walker SJ, et al. The MicroArray Quality Control (MAQC)‐II study of common practices for the development and validation of microarray‐based predictive models. Nat Biotechnol. 2010;28(8):827‐38.
298. Meyer SU, Pfaffl MW, Ulbrich SE. Normalization strategies for microRNA profiling experiments: a 'normal' way to a hidden layer of complexity? Biotechnol Lett. 2010;32(12):1777‐88.
299. Pradervand S, Weber J, Thomas J, Bueno M, Wirapati P, Lefort K, et al. Impact of normalization on miRNA microarray expression profiling. RNA. 2009;15(3):493‐501.
300. Peltier HJ, Latham GJ. Normalization of microRNA expression levels in quantitative RT‐PCR assays: identification of suitable reference RNA targets in normal and cancerous human solid tissues. RNA. 2008;14(5):844‐52.
301. Mar JC, Kimura Y, Schroder K, Irvine KM, Hayashizaki Y, Suzuki H, et al. Data‐driven normalization strategies for high‐throughput quantitative RT‐PCR. BMC Bioinformatics. 2009;10:110‐9.

CHAPTER 9
Victoria Nisenblat 223
302. Hruz T, Wyss M, Docquier M, Pfaffl MW, Masanetz S, Borghi L, et al. RefGenes: identification of reliable and condition specific reference genes for RT‐qPCR data normalization. BMC Genomics. 2011;12:156.
303. Mestdagh P, Van Vlierberghe P, De Weer A, Muth D, Westermann F, Speleman F, et al. A novel and universal method for microRNA RT‐qPCR data normalization. Genome Biol. 2009;10(6):R64.
304. Benes V, Castoldi M. Expression profiling of microRNA using real‐time quantitative PCR, how to use it and what is available. Methods. 2010;50(4):244‐9.
305. Vandesompele J, De Preter K, Pattyn F, Poppe B, Van Roy N, De Paepe A, et al. Accurate normalization of real‐time quantitative RT‐PCR data by geometric averaging of multiple internal control genes. Genome Biol. 2002;3(7):RESEARCH0034.
306. Andersen CL, Jensen JL, Orntoft TF. Normalization of real‐time quantitative reverse transcription‐PCR data: a model‐based variance estimation approach to identify genes suited for normalization, applied to bladder and colon cancer data sets. Cancer Res. 2004;64(15):5245‐50.
307. Pfaffl MW, Tichopad A, Prgomet C, Neuvians TP. Determination of stable housekeeping genes, differentially regulated target genes and sample integrity: BestKeeper‐‐Excel‐based tool using pair‐wise correlations. Biotechnol Lett. 2004;26(6):509‐15.
308. Risso D, Massa MS, Chiogna M, Romualdi C. A modified LOESS normalization applied to microRNA arrays: a comparative evaluation. Bioinformatics. 2009;25(20):2685‐91.
309. Wylie D, Shelton J, Choudhary A, Adai AT. A novel mean‐centering method for normalizing microRNA expression from high‐throughput RT‐qPCR data. BMC Res Notes. 2011;4:555.
310. Bolstad BM, Irizarry RA, Astrand M, Speed TP. A comparison of normalization methods for high density oligonucleotide array data based on variance and bias. Bioinformatics. 2003;19(2):185‐93.
311. Deo A, Carlsson J, Lindlof A. How to choose a normalization strategy for miRNA quantitative real‐time (qPCR) arrays. J Bioinform Comput Biol. 2011;9(6):795‐812.
312. Sarver AL. Toward understanding the informatics and statistical aspects of micro‐RNA profiling. J Cardiovasc Transl Res. 2010;3(3):204‐11.
313. Babu MM. Introduction to microarray data analysis. In: Grant RP, editor. Computational Genomics: Theory and Application: UK, Horizon Press. ; 2004. p. 225‐49.
314. Halpert RL, Sanga S. Robust Unattended Microarray Analysis2011.
315. Smyth GK. Linear models and empirical bayes methods for assessing differential expression in microarray experiments. Stat Appl Genet Mol Biol. 2004;3:Article3.

CHAPTER 9
224 Victoria Nisenblat
316. Smyth GK, Yang YH, Speed T. Statistical issues in cDNA microarray data analysis. Methods Mol Biol. 2003;224:111‐36.
317. Jeanmougin M, de Reynies A, Marisa L, Paccard C, Nuel G, Guedj M. Should we abandon the t‐test in the analysis of gene expression microarray data: a comparison of variance modeling strategies. PLoS One. 2010;5(9):e12336.
318. Dondrup M, Huser AT, Mertens D, Goesmann A. An evaluation framework for statistical tests on microarray data. J Biotechnol. 2009;140(1‐2):18‐26.
319. Tusher VG, Tibshirani R, Chu G. Significance analysis of microarrays applied to the ionizing radiation response. Proc Natl Acad Sci U S A. 2001;98(9):5116‐21.
320. Jeffery IB, Higgins DG, Culhane AC. Comparison and evaluation of methods for generating differentially expressed gene lists from microarray data. BMC Bioinformatics. 2006;7:359.
321. Benjamini Y, Hochberg Y. Controlling the false discovery rate: a practical and powerful approach to multiple testing. J R Statist Soc B. 1995;57(1):289‐300.
322. Streiner DL, Norman GR. Correction for Multiple Testing. Chest. 2011;140(1):16‐8.
323. Zampetaki A, Willeit P, Drozdov I, Kiechl S, Mayr M. Profiling of circulating microRNAs: from single biomarkers to re‐wired networks. Cardiovasc Res. 2012;93(4):555‐62.
324. Gunaratne PH, Creighton CJ, Watson M, Tennakoon JB. Large‐scale integration of MicroRNA and gene expression data for identification of enriched microRNA‐mRNA associations in biological systems. Methods Mol Biol. 2010;667:297‐315.
325. Bisognin A, Sales G, Coppe A, Bortoluzzi S, Romualdi C. MAGIA2: from miRNA and genes expression data integrative analysis to microRNA‐transcription factor mixed regulatory circuits (2012 update). Nucleic Acids Res. 2012 May 21;40((Web Server issue)):W13‐21.
326. Huang GT, Athanassiou C, Benos PV. mirConnX: condition‐specific mRNA‐microRNA network integrator. Nucleic Acids Res. 2011;39(Web Server issue):W416‐23.
327. Jiang Q, Wang Y, Hao Y, Juan L, Teng M, Zhang X, et al. miR2Disease: a manually curated database for microRNA deregulation in human disease. Nucleic Acids Res. 2009 Jan;37(Database issue):D98‐104.
328. Lagana A, Forte S, Giudice A, Arena MR, Puglisi PL, Giugno R, et al. miRo: a miRNA knowledge base. Database (Oxford). 2009;2009:bap008.
329. Ulitsky I, Maron‐Katz A, Shavit S, Sagir D, Linhart C, Elkon R, et al. Expander: from expression microarrays to networks and functions. Nat Protoc. 2010;5(2):303‐22.
330. Thomas M, Lieberman J, Lal A. Desperately seeking microRNA targets. Nat Struct Mol Biol. 2010;17(10):1169‐74.

CHAPTER 9
Victoria Nisenblat 225
331. Thomson DW, Bracken CP, Goodall GJ. Experimental strategies for microRNA target identification. Nucleic Acids Res. 2011;39(16):6845‐53.
332. Chuaqui RF, Bonner RF, Best CJ, Gillespie JW, Flaig MJ, Hewitt SM, et al. Post‐analysis follow‐up and validation of microarray experiments. Nat Genet. 2002;32 Suppl:509‐14.
333. Bustin SA, Benes V, Nolan T, Pfaffl MW. Quantitative real‐time RT‐PCR‐‐a perspective. J Mol Endocrinol. 2005;34(3):597‐601.
334. Pfaffl MW. A new mathematical model for relative quantification in real‐time RT‐PCR. Nucleic Acids Res. 2001;29(9):e45.
335. Livak KJ, Schmittgen TD. Analysis of relative gene expression data using real‐time quantitative PCR and the 2(‐Delta Delta C(T)) Method. Methods. 2001;25(4):402‐8.
336. Yuan JS, Wang D, Stewart Jr CN. Statistical methods for efficiency adjusted real‐time PCR quantification. Biotechnol J. 2008;3(1):112‐23.
337. Karlen Y, McNair A, Perseguers S, Mazza C, Mermod N. Statistical significance of quantitative PCR. BMC Bioinformatics. 2007;8:131.
338. Wong ML, Medrano JF. Real‐time PCR for mRNA quantitation. Biotechniques. 2005;39(1):75‐85.
339. Rieu I, Powers SJ. Real‐time quantitative RT‐PCR: design, calculations, and statistics. Plant Cell. 2009;21(4):1031‐3.
340. Yuan JS, Reed A, Chen F, Stewart CN, Jr. Statistical analysis of real‐time PCR data. BMC Bioinformatics. 2006;7:85.
341. Pfaffl MW, Horgan GW, Dempfle L. Relative expression software tool (REST) for group‐wise comparison and statistical analysis of relative expression results in real‐time PCR. Nucleic Acids Res. 2002;30(9):e36.
342. Pfaffl MW, Vandesompele J, Kubista M. Data analysis software. Real‐time PCR: current technology and applications Caister Academic Press Norfolk, UK. 2009:65‐83.
343. Garson JA, Huggett JF, Bustin SA, Pfaffl MW, Benes V, Vandesompele J, et al. Unreliable real‐time PCR analysis of human endogenous retrovirus‐W (HERV‐W) RNA expression and DNA copy number in multiple sclerosis. AIDS Res Hum Retroviruses. 2009;25(3):377‐8.
344. Lockey C, Otto E, Long Z. Real‐time fluorescence detection of a single DNA molecule. Biotechniques. 1998;25(5):744‐6.
345. Shi L, Reid LH, Jones WD, Shippy R, Warrington JA, Baker SC, et al. The MicroArray Quality Control (MAQC) project shows inter‐ and intraplatform reproducibility of gene expression measurements. Nat Biotechnol. 2006;24(9):1151‐61.

CHAPTER 9
226 Victoria Nisenblat
346. Bustin SA, Benes V, Garson JA, Hellemans J, Huggett J, Kubista M, et al. The MIQE guidelines: minimum information for publication of quantitative real‐time PCR experiments. Clin Chem. 2009;55(4):611‐22.
347. Taylor S, Wakem M, Dijkman G, Alsarraj M, Nguyen M. A practical approach to RT‐qPCR‐Publishing data that conform to the MIQE guidelines. Methods. 2010;50(4):S1‐5.
348. Schenken RS, Guzick DS. Revised endometriosis classification: 1996. Fertil Steril. 1997;67(5):815‐6.
349. Lorenzen JM, Kielstein JT, Hafer C, Gupta SK, Kümpers P, Faulhaber‐Walter R, et al. Circulating miR‐210 predicts survival in critically ill patients with acute kidney injury. Clin J Am Soc Nephrol. 2011;6(7):1540‐6.
350. Guthrie J, Seah C, Brown S, Tang P, Jamieson F, Drews S. Use of Bordetella pertussis BP3385 to establish a cutoff value for an IS481‐targeted real‐time PCR assay. J Clin Microbiol. 2008;46(11):3798‐9.
351. Yang YH, Speed T. Design issues for cDNA microarray experiments. Nature Rev Genet. 2002;3(8):579‐88.
352. Eisen MB, Spellman PT, Brown PO, Botstein D. Cluster analysis and display of genome‐wide expression patterns. Proc Natl Acad Sci U S A. 1998;95(25):14863‐8.
353. Oliveros J. VENNY. An interactive tool for comparing lists with Venn Diagrams. http://bioinfogp.cnb.csic.es/tools/venny/index.html; 2007.
354. Sackett DL, Haynes RB. The architecture of diagnostic research. BMJ. 2002;324(7336):539‐41.
355. Reid MC, Lachs MS, Feinstein AR. Use of methodological standards in diagnostic test research. JAMA. 1995;274(8):645‐51.
356. Bossuyt PM, Reitsma JB, Bruns DE, Gatsonis CA, Glasziou PP, Irwig LM, et al. The STARD statement for reporting studies of diagnostic accuracy: explanation and elaboration. Clin Chem. 2003;49(1):7‐18.
357. Whiting P, Rutjes AWS, Reitsma JB, Bossuyt PMM, Kleijnen J. The development of QUADAS: a tool for the quality assessment of studies of diagnostic accuracy included in systematic reviews. BMC Med Res Methodol 2003;3(1):25.
358. Whiting PF, Rutjes A, Westwood ME, Mallett S, Deeks JJ, Reitsma JB, et al. QUADAS‐2: a revised tool for the quality assessment of diagnostic accuracy studies. Ann Intern Med. 2011;155(8):529‐36.
359. Whiting P, Weswood M, Rutjes A, Reitsma J, Bossuyt P, Kleijnen J. Evaluation of QUADAS, a tool for the quality assessment of diagnostic accuracy studies. BMC Med Res Methodol. 2006;6(1):9.

CHAPTER 9
Victoria Nisenblat 227
360. Cook C, Cleland J, Huijbregts P. Creation and critique of studies of diagnostic accuracy: Use of the STARD and QUADAS methodological quality assessment tools. J Man Manip Ther 2007;15(2):93‐102.
361. Davoren PA, McNeill RE, Lowery AJ, Kerin MJ, Miller N. Identification of suitable endogenous control genes for microRNA gene expression analysis in human breast cancer. BMC Mol Biol. 2008;9(1):76‐86.
362. Sredni ST, Gadd S, Jafari N, Huang CC. A parallel study of mRNA and microRNA profiling of peripheral blood in young adult women. Front Genet. 2011;2:49‐54.
363. Dennis Jr G, Sherman BT, Hosack DA, Yang J, Gao W, Lane HC, et al. DAVID: database for annotation, visualization, and integrated discovery. Genome Biol. 2003;4(5):P3.
364. Borthwick JM, Charnock‐Jones DS, Tom BD, Hull ML, Teirney R, Phillips SC, et al. Determination of the transcript profile of human endometrium. Mol Hum Reprod. 2003;9(1):19‐33.
365. King AE, Critchley HOD. Oestrogen and progesterone regulation of inflammatory processes in the human endometrium. J Steroid Biochem Mol Biol. 2010;120(2‐3):116‐26.
366. Gupta S, Goldberg JM, Aziz N, Goldberg E, Krajcir N, Agarwal A. Pathogenic mechanisms in endometriosis‐associated infertility. Fertil Steril. 2008;90(2):247‐57.
367. MacDonald BT, Tamai K, He X. Wnt/β‐catenin signaling: components, mechanisms, and diseases. Dev Cell. 2009;17(1):9‐26.
368. Huang K, Zhang JX, Han L, You YP, Jiang T, Pu PY, et al. MicroRNA roles in beta‐catenin pathway. Mol Cancer. 2010;9(1):252‐63.
369. Higashiura Y, Kajihara H, Shigetomi H, Kobayashi H. Identification of multiple pathways involved in the malignant transformation of endometriosis (Review). Oncol Lett. 2012;4(1):3‐9.
370. Stewart CJR, Leung Y, Walsh MD, Walters RJ, Young JP, Buchanan DD. KRAS mutations in ovarian low‐grade endometrioid adenocarcinoma: association with concurrent endometriosis. Hum Pathol. 2012;43(8):1177‐83.
371. Velarde MC, Aghajanova L, Nezhat CR, Giudice LC. Increased mitogen‐activated protein kinase kinase/extracellularly regulated kinase activity in human endometrial stromal fibroblasts of women with endometriosis reduces 3′, 5′‐cyclic adenosine 5′‐monophosphate inhibition of cyclin D1. Endocrinology. 2009;150(10):4701‐12.
372. Zhang P, Bill K, Liu J, Young E, Peng T, Bolshakov S, et al. MiR‐155 is a liposarcoma oncogene that targets casein kinase‐1alpha and enhances beta‐catenin signaling. Cancer Res. 2012;72(7):1751‐62.
373. Faraoni I, Antonetti FR, Cardone J, Bonmassar E. miR‐155 gene: a typical multifunctional microRNA. Biochim Biophys Acta. 2009;1792(6):497‐505.

CHAPTER 9
228 Victoria Nisenblat
374. Garzon R, Garofalo M, Martelli MP, Briesewitz R, Wang L, Fernandez‐Cymering C, et al. Distinctive microRNA signature of acute myeloid leukemia bearing cytoplasmic mutated nucleophosmin. Proc Natl Acad Sci U S A. 2008;105(10):3945.
375. Jiang S, Zhang HW, Lu MH, He XH, Li Y, Gu H, et al. MicroRNA‐155 functions as an OncomiR in breast cancer by targeting the suppressor of cytokine signaling 1 gene. Cancer research. 2010;70(8):3119‐27.
376. Kong W, Yang H, He L, Zhao JJ, Coppola D, Dalton WS, et al. MicroRNA‐155 is regulated by the transforming growth factor beta/Smad pathway and contributes to epithelial cell plasticity by targeting RhoA. Mol Cell Biol. 2008;28(22):6773‐84.
377. Medina PP, Slack FJ. microRNAs and cancer. Cell Cycle. 2008;7(16):2485‐92.
378. Schetter AJ, Heegaard NHH, Harris CC. Inflammation and cancer: interweaving microRNA, free radical, cytokine and p53 pathways. Carcinogenesis. 2010;31(1):37‐49.
379. Costinean S, Sandhu SK, Pedersen IM, Tili E, Trotta R, Perrotti D, et al. Src homology 2 domain–containing inositol‐5‐phosphatase and CCAAT enhancer‐binding protein β are targeted by miR‐155 in B cells of Eμ‐MiR‐155 transgenic mice. Blood. 2009;114(7):1374‐82.
380. Gironella M, Seux M, Xie MJ, Cano C, Tomasini R, Gommeaux J, et al. Tumor protein 53‐induced nuclear protein 1 expression is repressed by miR‐155, and its restoration inhibits pancreatic tumor development. Proc Natl Acad Sci U S A. 2007;104(41):16170.
381. Selbach M, Schwanhäusser B, Thierfelder N, Fang Z, Khanin R, Rajewsky N. Widespread changes in protein synthesis induced by microRNAs. Nature. 2008;455(7209):58‐63.
382. Valeri N, Gasparini P, Fabbri M, Braconi C, Veronese A, Lovat F, et al. Modulation of mismatch repair and genomic stability by miR‐155. Proc Natl Acad Sci U S A. 2010;107(15):6982.
383. Wang Y, Li X, Hu H. Transcriptional regulation of co‐expressed microRNA target genes. Genomics. 2011;98:(6):445‐52.
384. O'Connell RM, Kahn D, Gibson WSJ, Round JL, Scholz RL, Chaudhuri AA, et al. MicroRNA‐155 promotes autoimmune inflammation by enhancing inflammatory T cell development. Immunity. 2010;33(4):607‐19.
385. Ha TY. The role of microRNAs in regulatory T cells and in the immune response. Immune Netw 2011;11(1):11‐41.
386. Wiesen JL, Tomasi TB. Dicer is regulated by cellular stresses and interferons. Mol Immunol. 2009;46(6):1222‐8.
387. Berkkanoglu M, Arici A. Immunology and endometriosis. Am J Reprod Immunol. 2003;50(1):48‐59.
388. Gleicher N, el‐Roeiy A, Confino E, Friberg J. Is endometriosis an autoimmune disease? Obstet Gynecol. 1987;70(1):115‐22.

CHAPTER 9
Victoria Nisenblat 229
389. Wu C, So J, Davis‐Dusenbery BN, Qi HH, Bloch DB, Shi Y, et al. Hypoxia potentiates microRNA‐mediated gene silencing through posttranslational modification of Argonaute2. Mol Cell Biol. 2011;31(23):4760‐74.
390. Ren Q, Qian Z, Jia S, Xu Z. Vascular endothelial growth factor expression up‐regulated by endometrial ischemia in secretory phase plays an important role in endometriosis. Fertil Steril. 2011;95(8):2687‐9.
391. Wu MH, Lu CW, Chang FM, Tsai SJ. Estrogen receptor expression affected by hypoxia inducible factor‐1α in stromal cells from patients with endometriosis. Taiwan J Obstet Gynecol. 2012;51(1):50‐4.
392. Kurowska‐Stolarska M, Alivernini S, Ballantine LE, Asquith DL, Millar NL, Gilchrist DS, et al. MicroRNA‐155 as a proinflammatory regulator in clinical and experimental arthritis. Proc Natl Acad Sci U S A. 2011;108(27):11193‐8.
393. Stanczyk J, Pedrioli DML, Brentano F, Sanchez‐Pernaute O, Kolling C, Gay RE, et al. Altered expression of MicroRNA in synovial fibroblasts and synovial tissue in rheumatoid arthritis. Arthritis Rheum. 2008;58(4):1001‐9.
394. Pauley KM, Satoh M, Chan AL, Bubb MR, Reeves WH, Chan EKL. Upregulated miR‐146a expression in peripheral blood mononuclear cells from rheumatoid arthritis patients. Arthritis Res Ther. 2008;10(4):R101.
395. Junker A, Krumbholz M, Eisele S, Mohan H, Augstein F, Bittner R, et al. MicroRNA profiling of multiple sclerosis lesions identifies modulators of the regulatory protein CD47. Brain. 2009;132(12):3342‐52.
396. Steinman L. Mixed results with modulation of TH‐17 cells in human autoimmune diseases. Nat Immunol. 2009;11(1):41‐4.
397. Lagos‐Quintana M, Rauhut R, Yalcin A, Meyer J, Lendeckel W, Tuschl T. Identification of tissue‐specific microRNAs from mouse. Curr Biol 2002;12(9):735‐9.
398. Baltimore D, Boldin MP, O'Connell RM, Rao DS, Taganov KD. MicroRNAs: new regulators of immune cell development and function. Nat Immunol 2008;9(8):839‐45.
399. Ceppi M, Pereira PM, Dunand‐Sauthier I, Barras E, Reith W, Santos MA, et al. MicroRNA‐155 modulates the interleukin‐1 signaling pathway in activated human monocyte‐derived dendritic cells. Proc Natl Acad Sci U S A. 2009;106(8):2735‐40.
400. Rodriguez A, Vigorito E, Clare S, Warren M, Couttet P, Soond D, et al. Requirement of bic/microRNA‐155 for normal immune function. Science 2007;316(5824):608‐11.
401. Thai TH, Calado DP, Casola S, Ansel K, Xiao C, Xue Y, et al. Regulation of the germinal center response by microRNA‐155. Science 2007;316(5824):604‐8.
402. Vigorito E, Perks KL, Abreu‐Goodger C, Bunting S, Xiang Z, Kohlhaas S, et al. microRNA‐155 regulates the generation of immunoglobulin class‐switched plasma cells. Immunity. 2007;27(6):847‐59.

CHAPTER 9
230 Victoria Nisenblat
403. Taganov KD, Boldin MP, Chang KJ, Baltimore D. NF‐κB‐dependent induction of microRNA miR‐146, an inhibitor targeted to signaling proteins of innate immune responses. Proc Natl Acad Sci U S A. 2006;103(33):12481‐6.
404. O'Connell RM, Taganov KD, Boldin MP, Cheng G, Baltimore D. MicroRNA‐155 is induced during the macrophage inflammatory response. Proc Natl Acad Sci U S A 2007;104(5):1604‐9.
405. Tsitsiou E, Lindsay MA. microRNAs and the immune response. Curr Opin Pharmacol. 2009;9(4):514‐20.
406. Dorsett Y, McBride KM, Jankovic M, Gazumyan A, Thai TH, Robbiani DF, et al. MicroRNA‐155 suppresses activation‐induced cytidine deaminase‐mediated Myc‐Igh translocation. Immunity. 2008;28(5):630‐8.
407. Teng G, Hakimpour P, Landgraf P, Rice A, Tuschl T, Casellas R, et al. MicroRNA‐155 is a negative regulator of activation‐induced cytidine deaminase. Immunity. 2008;28(5):621‐9.
408. Rodriguez A, Vigorito E, Clare S, Warren M, Couttet P, Soond D, et al. Requirement of bic/microRNA‐155 for normal immune function. Science 2007;316(5824):608‐11.
409. Banerjee A, Schambach F, DeJong CS, Hammond SM, Reiner SL. MicroRNA‐155 inhibits IFN‐γ signaling in CD4+ T cells. Eur J Immunol. 2010;40(1):225‐31.
410. Rai D, Kim SW, McKeller MR, Dahia PLM, Aguiar RCT. Targeting of SMAD5 links microRNA‐155 to the TGF‐β pathway and lymphomagenesis. Proc Natl Acad Sci U S A. 2010;107(7):3111‐6.
411. Kuilman T, Michaloglou C, Vredeveld LCW, Douma S, van Doorn R, Desmet CJ, et al. Oncogene‐induced senescence relayed by an interleukin‐dependent inflammatory network. Cell. 2008;133(6):1019‐31.
412. Lu LF, Thai TH, Calado DP, Chaudhry A, Kubo M, Tanaka K, et al. Foxp3‐dependent microRNA155 confers competitive fitness to regulatory T cells by targeting SOCS1 protein. Immunity. 2009;30(1):80‐91.
413. Donskov F, von der Maase H. Impact of immune parameters on long‐term survival in metastatic renal cell carcinoma. J Clin Oncol. 2006;24(13):1997‐2005.
414. Martinez‐Nunez RT, Louafi F, Sanchez‐Elsner T. The Interleukin 13 (IL‐13) Pathway in Human Macrophages Is Modulated by MicroRNA‐155 via Direct Targeting of Interleukin 13 Receptor {alpha}1 (IL13R{alpha}1). J Biol Chem. 2011;286(3):1786‐94.
415. Weil SJ, Wang S, Perez MC, Lyttle CR. Chemotaxis of macrophages by a peritoneal fluid protein in women with endometriosis. Fertil Steril. 1997;67(5):865‐9.
416. Groothuis P. Angiogenesis and Endometriosis. In: Giudice LC, Evers JLH, Healy DL, editors. Endometriosis: Wiley Online Library; 2012. p. 190‐9.

CHAPTER 9
Victoria Nisenblat 231
417. Harada T, Kaponis A, Iwabe T, Taniguchi F, Makrydimas G, Sofikitis N, et al. Apoptosis in human endometrium and endometriosis. Hum Reprod Update. 2004;10(1):29‐38.
418. Taylor RN, Yu J, Torres PB, Schickedanz AC, Park JK, Mueller MD, et al. Mechanistic and therapeutic implications of angiogenesis in endometriosis. Reprod Sci. 2009;16(2):140‐6.
419. Bianco B, Lerner TG, Trevisan CM, Cavalcanti V, Christofolini DM, Barbosa CP. The nuclear factor‐kB functional promoter polymorphism is associated with endometriosis and infertility. Hum Immunol 2012;73(11):1190‐3.
420. Ponce C, Torres M, Galleguillos C, Sovino H, Boric MA, Fuentes A, et al. Nuclear factor κB pathway and interleukin‐6 are affected in eutopic endometrium of women with endometriosis. Reproduction. 2009;137(4):727‐37.
421. Zhang F, Yang Y, Wang Y. Association between TGF‐β1‐509C/T polymorphism and endometriosis: a systematic review and meta‐analysis. Eur J Obstet Gynecol Reprod Biol 2012;164(2):121‐6.
422. Matsuzaki S, Canis M, Vaurs‐Barriere C, Pouly J, Boespflug‐Tanguy O, Penault‐Llorca F, et al. DNA microarray analysis of gene expression profiles in deep endometriosis using laser capture microdissection. Mol Hum Reprod. 2004;10(10):719‐28.
423. Agarwal N, Subramanian A. Endometriosis–Morphology, Clinical Presentations and Molecular Pathology. J Lab Physicians. 2010;2(1):1‐9.
424. Yoshino O, Osuga Y, Hirota Y, Koga K, Hirata T, Harada M, et al. Possible Pathophysiological Roles of Mitogen‐Activated Protein Kinases (MAPKs) in Endometriosis. Am J Reprod Immunol. 2004;52(5):306‐11.
425. Cakmak H, Guzeloglu‐Kayisli O, Kayisli U, Arici A. Immune‐endocrine interactions in endometriosis. Front Biosci (Elite Ed). 2009;1:429‐43.
426. Zhang P, Bill K, Liu J, Young E, Peng T, Bolshakov S, et al. MiR‐155 is a liposarcoma oncogene that targets casein kinase‐1alpha and enhances beta‐catenin signaling. Cancer Res. 2012;72(7):1751‐62.
427. Chegini N. TGF‐beta system: the principal profibrotic mediator of peritoneal adhesion formation. Semin Reprod Med. 2008;26(4):298‐312.
428. Omwandho COA, Konrad L, Halis G, Oehmke F, Tinneberg HR. Role of TGF‐βs in normal human endometrium and endometriosis. Hum Reprod. 2010;25(1):101‐9.
429. Dogar AM, Towbin H, Hall J. Suppression of Latent Transforming Growth Factor (TGF)‐β1 Restores Growth Inhibitory TGF‐β Signaling through microRNAs. J Biol Chem. 2011;286(18):16447‐58.
430. Toki T, Nakayama K. Proliferative activity and genetic alterations in TP53 in endometriosis. Gynecol Obstet Invest. 2000;50 Suppl 1:33‐8.

CHAPTER 9
232 Victoria Nisenblat
431. Braun DP, Ding J, Shaheen F, Willey JC, Rana N, Dmowski WP. Quantitative expression of apoptosis‐regulating genes in endometrium from women with and without endometriosis. Fertil Steril. 2007;87(2):263‐8.
432. Tarasov V, Jung P, Verdoodt B, Lodygin D, Epanchintsev A, Menssen A, et al. Differential regulation of microRNAs by p53 revealed by massively parallel sequencing: miR‐34a is a p53 target that induces apoptosis and G1‐arrest. Cell Cycle. 2007;6(13):1586‐93.
433. Bruno IG, Karam R, Huang L, Bhardwaj A, Lou CH, Shum EY, et al. Identification of a microRNA that activates gene expression by repressing nonsense‐mediated RNA decay. Mol Cell. 2011;42(4):500‐10.
434. Ciafrč S, Galardi S, Mangiola A, Ferracin M, Liu CG, Sabatino G, et al. Extensive modulation of a set of microRNAs in primary glioblastoma. Biochem Biophys Res Commun. 2005;334(4):1351‐8.
435. Myatt SS, Wang J, Monteiro LJ, Christian M, Ho KK, Fusi L, et al. Definition of microRNAs that repress expression of the tumor suppressor gene FOXO1 in endometrial cancer. Cancer Res. 2010;70(1):367‐77.
436. Zhang Y, Chao T, Li R, Liu W, Chen Y, Yan X, et al. MicroRNA‐128 inhibits glioma cells proliferation by targeting transcription factor E2F3a. J Mol Med. 2009;87(1):43‐51.
437. Evangelisti C, Florian MC, Massimi I, Dominici C, Giannini G, Galardi S, et al. MiR‐128 up‐regulation inhibits Reelin and DCX expression and reduces neuroblastoma cell motility and invasiveness. FASEB J. 2009;23(12):4276‐87.
438. Khan AP, Poisson LM, Bhat VB, Fermin D, Zhao R, Kalyana‐Sundaram S, et al. Quantitative proteomic profiling of prostate cancer reveals a role for miR‐128 in prostate cancer. Mol Cell Proteomics. 2010;9(2):298‐312.
439. Adlakha YK, Saini N. MicroRNA‐128 downregulates Bax and induces apoptosis in human embryonic kidney cells. Cell Mol Life Sci. 2011;68(8):1415‐28.
440. Colombo E, Marine JC, Danovi D, Falini B, Pelicci PG. Nucleophosmin regulates the stability and transcriptional activity of p53. Nat Cell Biol. 2002;4(7):529‐33.
441. Guo L, Zhao RCH, Wu Y. The role of miRNAs in self‐renewal and differentiation of mesenchymal stem cells. Exp Hematol. 2011;39(6):608‐16.
442. Wu F, Guo NJ, Tian H, Marohn M, Gearhart S, Bayless TM, et al. Peripheral blood microRNAs distinguish active ulcerative colitis and Crohn's disease. Inflamm Bowel Dis. 2011;17(1):241‐50.
443. Paraskevi A, Theodoropoulos G, Papaconstantinou I, Mantzaris G, Nikiteas N, Gazouli M. Circulating MicroRNA in inflammatory bowel disease. J Crohns Colitis 2012;6(9):900‐4.
444. Cui L, Qi Y, Li H, Ge Y, Zhao K, Qi X, et al. Serum MicroRNA Expression Profile Distinguishes Enterovirus 71 and Coxsackievirus 16 Infections in Patients with Hand‐Foot‐and‐Mouth Disease. PLoS One. 2011;6(11):e27071.

CHAPTER 9
Victoria Nisenblat 233
445. Leidinger P, Keller A, Borries A, Reichrath J, Rass K, Jager S, et al. High‐throughput miRNA profiling of human melanoma blood samples. BMC cancer. 2010;10(1):262.
446. Roth P, Wischhusen J, Happold C, Chandran PA, Hofer S, Eisele G, et al. A specific miRNA signature in the peripheral blood of glioblastoma patients. J Neurochem 2011;118(3):449‐57.
447. Ramsingh G, Koboldt DC, Trissal M, Chiappinelli KB, Wylie T, Koul S, et al. Complete characterization of the microRNAome in a patient with acute myeloid leukemia. Blood. 2010;116(24):5316‐26.
448. Favreau AJ, Sathyanarayana P. miR‐590‐5p, miR‐219‐5p, miR‐15b and miR‐628‐5p are commonly regulated by IL‐3, GM‐CSF and G‐CSF in acute myeloid leukemia. Leuk Res. 2012;36(3):334‐41.
449. Madathil SK, Nelson PT, Saatman KE, Wilfred BR. MicroRNAs in CNS injury: potential roles and therapeutic implications. BioEssays. 2011;33(1):21‐6.
450. Wang Y, Krivtsov AV, Sinha AU, North TE, Goessling W, Feng Z, et al. The wnt/{beta}‐catenin pathway is required for the development of leukemia stem cells in AML. Science 2010;327(5973):1650‐3.
451. van der Horst PH, Wang Y, van de Zee M, Burger CW, Blok LJ. Interaction between sexhormones and WNT/[beta]‐catenin signal transduction in endometrial physiology and disease. Mol Cell Endocrinol 2012;358(2):176‐84.
452. Maes OC, An J, Sarojini H, Wu H, Wang E. Changes in MicroRNA expression patterns in human fibroblasts after low‐LET radiation. J Cell Biochem. 2008;105(3):824‐34.
453. Enfield KSS, Stewart GL, Pikor LA, Alvarez CE, Lam S, Lam WL, et al. MicroRNA Gene Dosage Alterations and Drug Response in Lung Cancer. J Biomed Biotechnol. 2011;2011(474632):Epub 2011 Mar 31.
454. Dai Y, Sui W, Lan H, Yan Q, Huang H, Huang YS. Comprehensive analysis of microRNA expression patterns in renal biopsies of lupus nephritis patients. Rheumatol Int. 2009;29(7):749‐54.
455. Leidinger P, Keller A, Borries A, Huwer H, Rohling M, Huebers J, et al. Specific peripheral miRNA profiles for distinguishing lung cancer from COPD. Lung Cancer. 2011;74(1):41‐7.
456. Mao ZG, He DS, Zhou J, Yao B, Xiao WW, Chen CH, et al. Differential expression of microRNAs in GH‐secreting pituitary adenomas. Diagn Pathol. 2010;5(1):79.
457. Selaru FM, Olaru AV, Kan T, David S, Cheng Y, Mori Y, et al. MicroRNA‐21 is overexpressed in human cholangiocarcinoma and regulates programmed cell death 4 and tissue inhibitor of metalloproteinase 3. Hepatology. 2009;49(5):1595‐601.
458. Dahiya N, Sherman‐Baust CA, Wang TL, Davidson B, Shih IM, Zhang Y, et al. MicroRNA expression and identification of putative miRNA targets in ovarian cancer. PLoS One. 2008;3(6):e2436.

CHAPTER 9
234 Victoria Nisenblat
459. Wang J, Xiang G, Mitchelson K, Zhou Y. Microarray profiling of monocytic differentiation reveals miRNA‐mRNA intrinsic correlation. J Cell Biochem. 2011;112(9):2443‐53.
460. Mendell JT. miRiad roles for the miR‐17‐92 cluster in development and disease. Cell. 2008;133(2):217‐22.
461. Wu T, Wieland A, Araki K, Davis CW, Ye L, Hale JS, et al. Temporal expression of microRNA cluster miR‐17‐92 regulates effector and memory CD8+ T‐cell differentiation. Proc Natl Acad Sci U S A. 2012;109(25):9965‐70.
462. Petrocca F, Visone R, Onelli MR, Shah MH, Nicoloso MS, De Martino I, et al. E2F1‐regulated MicroRNAs impair TGF [beta]‐dependent cell‐cycle arrest and apoptosis in gastric cancer. Cancer cell. 2008;13(3):272‐86.
463. Ivanovska I, Ball AS, Diaz RL, Magnus JF, Kibukawa M, Schelter JM, et al. MicroRNAs in the miR‐106b family regulate p21/CDKN1A and promote cell cycle progression. Mol Cell Biol. 2008;28(7):2167‐74.
464. Concepcion CP, Bonetti C, Ventura A. The MicroRNA‐17‐92 Family of MicroRNA Clusters in Development and Disease. Cancer J. 2012;18(3):262‐7
465. Lawrie C, Saunders N, Soneji S, Palazzo S, Dunlop H, Cooper C, et al. MicroRNA expression in lymphocyte development and malignancy. Leukemia. 2008;22(7):1440‐6.
466. Hamada N, Fujita Y, Kojima T, Kitamoto A, Akao Y, Nozawa Y, et al. MicroRNA expression profiling of NGF‐treated PC12 cells revealed a critical role for miR‐221 in neuronal differentiation. Neurochem Int. 2012;60(8):743‐50.
467. Skalsky RL, Cullen BR. Reduced Expression of Brain‐Enriched microRNAs in Glioblastomas Permits Targeted Regulation of a Cell Death Gene. PLoS One. 2011;6(9):e24248.
468. Wong CM, Wong CCL, Lee JMF, Fan DNY, Au SLK, Ng IOL. Sequential alterations of miRNA expression in hepatocellular carcinoma development and venous metastasis. Hepatology. 2011.
469. Pallasch CP, Patz M, Park YJ, Hagist S, Eggle D, Claus R, et al. miRNA deregulation by epigenetic silencing disrupts suppression of the oncogene PLAG1 in chronic lymphocytic leukemia. Blood. 2009;114(15):3255‐64.
470. Mosakhani N, Sarhadi VK, Borze I, Karjalainen‐Lindsberg ML, Sundström J, Ristamäki R, et al. MicroRNA profiling differentiates colorectal cancer according to KRAS status. Genes Chromosomes Cancer 2012;51(1):1‐9.
471. Jha A, Mehra M, Shankar R. The regulatory epicenter of miRNAs. J Biosci. 2011;36(4):621‐38.

CHAPTER 9
Victoria Nisenblat 235
472. Shin KK, Kim YJ, Hong CP, Yang JW, Bae YC, Jung JS. miR‐598 induces replicative senescence in human adipose tissue‐derived mesenchymal stem cells via silent information regulator 1. Molecular and Cellular Biochemistry. 2012:1‐9.
473. Park CW, Zeng Y, Steer CJ. Human DNA methyltransferase 3a does not associate with microRNAs in the regulation of DNA methylation. J Cardiovasc Transl Res. 2010;3(3):290‐5.
474. Koturbash I, Zemp FJ, Pogribny I, Kovalchuk O. Small molecules with big effects: the role of the microRNAome in cancer and carcinogenesis. Mutat Res. 2011;722(2):94‐105.
475. Dahiya N, Morin PJ. MicroRNAs in ovarian carcinomas. Endocr Relat Cancer. 2010;17(1):F77‐F89.
476. Izumiya M, Okamoto K, Tsuchiya N, Nakagama H. Functional screening using a microRNA virus library and microarrays: a new high‐throughput assay to identify tumor‐suppressive microRNAs. Carcinogenesis. 2010;31(8):1354‐9.
477. Sinha S, Yang W. Cellular signaling for activation of Rho GTPase Cdc42. Cell Signal. 2008;20(11):1927‐34.
478. Sirotkin AV, Lauková M, Ovcharenko D, Brenaut P, Mlynček M. Identification of microRNAs controlling human ovarian cell proliferation and apoptosis. J Cell Physiol. 2010;223(1):49‐56.
479. Wang Y, Lee CGL. MicroRNA and cancer–focus on apoptosis. J Cell Mol Med. 2009;13(1):12‐23.
480. Yao G, Yin M, Lian J, Tian H, Liu L, Li X, et al. MicroRNA‐224 is involved in transforming growth factor‐β‐mediated mouse granulosa cell proliferation and granulosa cell function by targeting Smad4. Mol Endocrinol. 2010;24(3):540‐51.
481. Li Q, Wang G, Shan JL, Yang ZX, Wang HZ, Feng J, et al. MicroRNA‐224 is upregulated in HepG2 cells and involved in cellular migration and invasion. J Gastroenterol Hepatol. 2010;25(1):164‐71.
482. Moschos S, Williams A, Perry M, Birrell M, Belvisi M, Lindsay M. Expression profiling in vivo demonstrates rapid changes in lung microRNA levels following lipopolysaccharide‐induced inflammation but not in the anti‐inflammatory action of glucocorticoids. BMC Genomics. 2007;8(1):240.
483. Scisciani C, Vossio S, Guerrieri F, Schinzari V, De Iaco R, D'Onorio de Meo P, et al. Transcriptional regulation of miR‐224 upregulated in human HCCs by NFkappaB inflammatory pathways. J Hepatol. 2012;56(4):855‐61.
484. Landgraf P, Rusu M, Sheridan R, Sewer A, Iovino N, Aravin A, et al. A mammalian microRNA expression atlas based on small RNA library sequencing. Cell. 2007;129(7):1401‐14.

CHAPTER 9
236 Victoria Nisenblat
485. Ferracin M, Calin GA, Negrini M. MicroRNAs in Cancer (An Overview). In: Cho WCS, editor. MicroRNAs in Cancer Translational Research: Springer Science+Business Media B.V.; 2011. p. 1‐71.
486. Fountzilas E, Kelly AD, Perez‐Atayde AR, Goldsmith J, Konstantinopoulos PA, Francoeur N, et al. A microRNA activity map of human mesenchymal tumors: connections to oncogenic pathways; an integrative transcriptomic study. BMC Genomics. 2012;13(1):332.
487. Ferretti E, De Smaele E, Miele E, Laneve P, Po A, Pelloni M, et al. Concerted microRNA control of Hedgehog signalling in cerebellar neuronal progenitor and tumour cells. EMBO J. 2008;27(19):2616‐27.
488. Vimalraj S, Selvamurugan N. MicroRNAs: Synthesis, Gene Regulation and Osteoblast Differentiation. Curr Issues Mol Biol 2012;15(1):7‐18.
489. Gal H, Pandi G, Kanner AA, Ram Z, Lithwick‐Yanai G, Amariglio N, et al. MIR‐451 and Imatinib mesylate inhibit tumor growth of Glioblastoma stem cells. Biochem Biophys Res Commun. 2008;376(1):86‐90.
490. Gao Z, Ding P, Hsieh J. Profiling of REST‐dependent microRNAs reveals dynamic modes of expression. Front Neurosci. 2012;6(67):Epub 2012 May 10.
491. Liu X, Wang Y, Sun Q, Yan J, Huang J, Zhu S, et al. Identification of microRNA transcriptome involved in human natural killer cell activation. Immunol Lett. 2012;143(2):208‐17.
492. Ramakrishnan V, Kushwaha D, Koay DC, Reddy H, Mao Y, Zhou L, et al. Post‐transcriptional regulation of O^{6}‐methylguanine‐DNA methyltransferase MGMT in glioblastomas. Cancer Biomark. 2011;10(3):185‐93.
493. Tano K, Shiota S, Collier J, Foote RS, Mitra S. Isolation and structural characterization of a cDNA clone encoding the human DNA repair protein for O6‐alkylguanine. Proc Natl Acad Sci U S A 1990;87(2):686‐90.
494. Sasai K, Nodagashira M, Nishihara H, Aoyanagi E, Wang L, Katoh M, et al. Careful exclusion of non‐neoplastic brain components is required for an appropriate evaluation of O6‐methylguanine‐DNA methyltransferase status in glioma: relationship between immunohistochemistry and methylation analysis. Am J Surg Pathol. 2008;32(8):1220‐7.
495. Romero‐Cordoba S, Rodriguez‐Cuevas S, Rebollar‐Vega R, Quintanar‐Jurado V, Maffuz‐Aziz A, Jimenez‐Sanchez G, et al. Identification and Pathway Analysis of microRNAs with No Previous Involvement in Breast Cancer. PLoS One. 2012;7(3):e31904.
496. Davis BN, Hilyard AC, Lagna G, Hata A. SMAD proteins control DROSHA‐mediated microRNA maturation. Nature. 2008;454(7200):56‐61.
497. Chhabra R, Dubey R, Saini N. Cooperative and individualistic functions of the microRNAs in the miR‐23a~ 27a~ 24‐2 cluster and its implication in human diseases. Mol Cancer. 2010;9(1):232.

CHAPTER 9
Victoria Nisenblat 237
498. Wang Z, Wei W, Sarkar FH. miR‐23a, a Critical Regulator of “migR” ation and Metastasis in Colorectal Cancer. Cancer Discov. 2012;2(6):489‐91.
499. Nothnick WB. The role of micro‐RNAs in the female reproductive tract. Reproduction. 2012;143(5):559‐76.
500. Yang X, Zhou Y, Peng S, Wu L, Lin HY, Wang S, et al. Differentially expressed plasma microRNAs in premature ovarian failure patients and the potential regulatory function of mir‐23a in granulosa cell apoptosis. Reproduction. 2012;144(2):235‐44.
501. Ruan W, Xu J, Li S, Yuan L, Dai R. Effects of down‐regulation of microRNA‐23a on TNF‐α‐induced endothelial cell apoptosis through caspase‐dependent pathways. Cardiovasc Res. 2012;93(4):623‐32.
502. Cao M, Seike M, Soeno C, Mizutani H, Kitamura K, Minegishi Y, et al. MiR‐23a regulates TGF‐β‐induced epithelial‐mesenchymal transition by targeting E‐cadherin in lung cancer cells. Int J Oncol 2012;41(3):869‐75.
503. Tatarano S, Chiyomaru T, Kawakami K, Enokida H, Yoshino H, Hidaka H, et al. Novel oncogenic function of mesoderm development candidate 1 and its regulation by MiR‐574‐3p in bladder cancer cell lines. International journal of oncology. 2011.
504. Moriya Y, Nohata N, Kinoshita T, Mutallip M, Okamoto T, Yoshida S, et al. Tumor suppressive microRNA‐133a regulates novel molecular networks in lung squamous cell carcinoma. J Hum Genet. 2011;57(1):38‐45.
505. Su Y, Ni Z, Wang G, Cui J, Wei C, Wang J, et al. Aberrant expression of microRNAs in gastric cancer and biological significance of miR‐574‐3p. Int Immunopharmacol. 2012;13(4):468‐75.
506. Bryant R, Pawlowski T, Catto J, Marsden G, Vessella R, Rhees B, et al. Changes in circulating microRNA levels associated with prostate cancer. Br J Cancer. 2012;106(4):768‐74.
507. Malumbres R, Sarosiek KA, Cubedo E, Ruiz JW, Jiang X, Gascoyne RD, et al. Differentiation stage–specific expression of microRNAs in B lymphocytes and diffuse large B‐cell lymphomas. Blood. 2009;113(16):3754‐64.
508. Gui J, Tian Y, Wen X, Zhang W, Zhang P, Gao J, et al. Serum microRNA characterization identifies miR‐885‐5p as a potential marker for detecting liver pathologies. Clin Sci (Lond) 2011;120(5):183‐93.
509. Alevizos I, Illei GG. MicroRNAs in Sjögren's syndrome as a prototypic autoimmune disease. Autoimmun Rev. 2010;9(9):618‐21.
510. Schepeler T, Holm A, Halvey P, Nordentoft I, Lamy P, Riising E, et al. Attenuation of the beta‐catenin/TCF4 complex in colorectal cancer cells induces several growth‐suppressive microRNAs that target cancer promoting genes. Oncogene. 2011;31(22):2750‐60.

CHAPTER 9
238 Victoria Nisenblat
511. Pabona JMP, Simmen FA, Nikiforov MA, Zhuang DZ, Shankar K, Velarde MC, et al. Krüppel‐Like Factor 9 and Progesterone Receptor Coregulation of Decidualizing Endometrial Stromal Cells: Implications for the Pathogenesis of Endometriosis. J Clin Endocrinol Metab. 2012;97(3):E376‐E92.
512. Shigetomi H, Higashiura Y, Kajihara H, Kobayashi H. A potential link of oxidative stress and cell cycle regulation for development of endometriosis. Gynecol Endocrinol. 2012;28(11):897‐902.
513. Kawahara Y, Mieda‐Sato A. TDP‐43 promotes microRNA biogenesis as a component of the Drosha and Dicer complexes. Proc Natl Acad Sci. 2012;109(9):3347‐52.
514. Van Hoecke A, Schoonaert L, Lemmens R, Timmers M, Staats KA, Laird AS, et al. EPHA4 is a disease modifier of amyotrophic lateral sclerosis in animal models and in humans. Nat Med. 2012;18(9):1418‐22.
515. Arnold J, Barcena de Arellano ML, Rüster C, Vercellino GF, Chiantera V, Schneider A, et al. Imbalance between sympathetic and sensory innervation in peritoneal endometriosis. Brain Behav Immun. 2011;26(1):132‐41.
516. Xiong Y, Fang JH, Yun JP, Yang J, Zhang Y, Jia WH, et al. Effects of MicroRNA‐29 on apoptosis, tumorigenicity, and prognosis of hepatocellular carcinoma. Hepatology. 2010;51(3):836‐45.
517. Mo YY. MicroRNA regulatory networks and human disease. Cell Mol Life Sci. 2012:1‐3.
518. Wang H, Garzon R, Sun H, Ladner KJ, Singh R, Dahlman J, et al. NF‐[kappa] B‐YY1‐miR‐29 Regulatory Circuitry in Skeletal Myogenesis and Rhabdomyosarcoma. Cancer cell. 2008;14(5):369‐81.
519. Kriegel AJ, Liu Y, Fang Y, Ding X, Liang M. The miR‐29 family: genomics, cell biology, and relevance to renal and cardiovascular injury. Physiol Genomics. 2012;44(4):237‐44.
520. Ma F, Xu S, Liu X, Zhang Q, Xu X, Liu M, et al. The microRNA miR‐29 controls innate and adaptive immune responses to intracellular bacterial infection by targeting interferon‐[gamma]. Nat Immunol. 2011;12(9):861‐9.
521. Liston A, Linterman M, Lu LF. MicroRNA in the adaptive immune system, in sickness and in health. J Clin Immunol. 2010;30(3):339‐46.
522. Iorio MV, Croce CM. MicroRNAs in cancer: small molecules with a huge impact. J Clin Oncol. 2009;27(34):5848‐56.
523. Garzon R, Liu S, Fabbri M, Liu Z, Heaphy CEA, Callegari E, et al. MicroRNA‐29b induces global DNA hypomethylation and tumor suppressor gene reexpression in acute myeloid leukemia by targeting directly DNMT3A and 3B and indirectly DNMT1. Blood. 2009;113(25):6411‐8.
524. Portela A, Esteller M. Epigenetic modifications and human disease. Nat Biotechnol. 2010;28(10):1057‐68.

CHAPTER 9
Victoria Nisenblat 239
525. Wang B, Komers R, Carew R, Winbanks CE, Xu B, Herman‐Edelstein M, et al. Suppression of microRNA‐29 Expression by TGF‐β1 Promotes Collagen Expression and Renal Fibrosis. J Am Soc Nephrol. 2012;23(2):252‐65.
526. Mendell JT, Olson EN. MicroRNAs in stress signaling and human disease. Cell. 2012;148(6):1172‐87.
527. Benetatos L, Hatzimichael E, Londin E, Vartholomatos G, Loher P, Rigoutsos I, et al. The microRNAs within the DLK1‐DIO3 genomic region: involvement in disease pathogenesis. Cell Mol Life Sci. 2012:1‐20.
528. Wang T, Zhang X, Obijuru L, Laser J, Aris V, Lee P, et al. A micro‐RNA signature associated with race, tumor size, and target gene activity in human uterine leiomyomas. Genes Chromosomes Cancer. 2007;46(4):336‐47.
529. Noyes R, Hertig A, Rock J. Dating the endometrial biopsy. Am J Obstet Gynecol. 1975;122(2):262‐3.
530. Sharpe‐Timms KL. Endometrial anomalies in women with endometriosis. Ann N Y Acad Sci. 2001;943(1):131‐47.
531. Aghajanova L, Giudice LC. Molecular evidence for differences in endometrium in severe versus mild endometriosis. Reprod Sci. 2011;18(3):229‐51.
532. Koninckx PR. Is mild endometriosis a disease?: Is mild endometriosis a condition occurring intermittently in all women? Hum Reprod. 1994;9(12):2202‐5.
533. Tokushige N, Markham R, Russell P, Fraser IS. Different types of small nerve fibers in eutopic endometrium and myometrium in women with endometriosis. Fertil Steril. 2007;88(4):795‐803.
534. Wang G, Tokushige N, Markham R, Fraser IS. Rich innervation of deep infiltrating endometriosis. Hum Reprod. 2009;24(4):827‐34.
535. Tokushige N, Markham R, Russell P, Fraser IS. Nerve fibres in peritoneal endometriosis. Hum Reprod. 2006;21(11):3001‐7.
536. Wang L, Tang H, Thayanithy V, Subramanian S, Oberg AL, Cunningham JM, et al. Gene networks and microRNAs implicated in aggressive prostate cancer. Cancer Res. 2009;69(24):9490‐7.
537. Zhang H, Luo XQ, Zhang P, Huang LB, Zheng YS, Wu J, et al. MicroRNA patterns associated with clinical prognostic parameters and CNS relapse prediction in pediatric acute leukemia. PLoS One. 2009;4(11):e7826.
538. Li Z, Cao Y, Jie Z, Liu Y, Li Y, Li J, et al. MiR‐495 and miR‐551a inhibit the migration and invasion of human gastric cancer cells by directly interacting with PRL‐3. Cancer Lett. 2012;323(1):41‐7.

CHAPTER 9
240 Victoria Nisenblat
539. Ruan F, Lin J, Wu RJ, Xu KH, Zhang XM, Zhou CY, et al. Phosphatase of regenerating liver‐3: a novel and promising marker in human endometriosis. Fertil Steril. 2010;94(6):1980‐4.
540. Tseng JF, Ryan IP, Milam T, Murai J, Schriock E, Landers D, et al. Interleukin‐6 secretion in vitro is up‐regulated in ectopic and eutopic endometrial stromal cells from women with endometriosis. J Clin Endocrinol Metab. 1996;81(3):1118‐22.
541. Akoum A, Lawson C, McColl S, Villeneuve M. Ectopic endometrial cells express high concentrations of interleukin (IL)‐8 in vivo regardless of the menstrual cycle phase and respond to oestradiol by up‐regulating IL‐1‐induced IL‐8 expression in vitro. Mol Hum Reprod. 2001;7(9):859‐66.
542. Bell SE, Sanchez MJ, Spasic‐Boskovic O, Santalucia T, Gambardella L, Burton GJ, et al. The RNA binding protein Zfp36l1 is required for normal vascularisation and post‐transcriptionally regulates VEGF expression. Dev Dyn. 2006;235(11):3144‐55.
543. Lebovic DI, Mueller MD, Taylor RN. Immunobiology of endometriosis. Fertil Steril. 2001;75(1):1‐10.
544. Donnez J, Smoes P, Gillerot S, Casanas‐Roux F, Nisolle M. Vascular endothelial growth factor (VEGF) in endometriosis. Hum Reprod. 1998;13(6):1686‐90.
545. McLaren J, Prentice A, Charnock‐Jones D, Smith S. Vascular endothelial growth factor (VEGF) concentrations are elevated in peritoneal fluid of women with endometriosis. Hum Reprod. 1996;11(1):220‐3.
546. Xavier P, Belo L, Beires J, Rebelo I, Martinez‐de‐Oliveira J, Lunet N, et al. Serum levels of VEGF and TNF‐α and their association with C‐reactive protein in patients with endometriosis. Arch Gynecol Obstet. 2006;273(4):227‐31.
547. Kozomara A, Griffiths‐Jones S. miRBase: integrating microRNA annotation and deep‐sequencing data. Nucleic Acids Res. 2011;39(suppl 1):D152‐D7.
548. Zondervan KT, Yudkin PL, Vessey MP, Dawes MG, Barlow DH, Kennedy SH. Prevalence and incidence of chronic pelvic pain in primary care: evidence from a national general practice database. BJOG. 1999;106(11):1149‐55.
549. Akbas F, Coskunpinar E, Aynaci E, Musteri Oltulu Y, Yildiz P. Analysis of serum micro‐RNAs as potential biomarker in chronic obstructive pulmonary disease. Exp Lung Res. 2012;38(6):286‐94.
550. Koninckx P, Riittinen L, Seppala M, Cornillie F. CA‐125 and placental protein 14 concentrations in plasma and peritoneal fluid of women with deeply infiltrating pelvic endometriosis. Fertil Steril. 1992;57(3):523‐30.
551. Meresman GF, Baranao RI, Tenenbaum A, Singla J, Neuspiller N, Rumi LS. Effect of peritoneal fluid from patients with mild and severe endometriosis on endometrial stromal cell proliferation. Arch Gynecol Obstet. 1997;259(3):109‐15.

CHAPTER 9
Victoria Nisenblat 241
552. Becker JL, Widen RH, Mahan CS, Yeko T, Parsons AK, Spellacy WN. Human peritoneal macrophage and T lymphocyte populations in mild and severe endometriosis. Am J Reprod Immunol. 1995;34(3):179‐87.
553. Barrey E, Saint‐Auret G, Bonnamy B, Damas D, Boyer O, Gidrol X. Pre‐microRNA and mature microRNA in human mitochondria. PLoS One. 2011;6(5):e20220.
554. Li J, Donath S, Li Y, Qin D, Prabhakar BS, Li P. miR‐30 regulates mitochondrial fission through targeting p53 and the dynamin‐related protein‐1 pathway. PLoS Genet. 2010;6(1):e1000795.
555. Zhang C. MicroRNAs: role in cardiovascular biology and disease. Clin Sci. 2008;114:699‐706.
556. Nisolle M, Donnez J. Peritoneal endometriosis, ovarian endometriosis, and adenomyotic nodules of the rectovaginal septum are three different entities. Fertil Steril. 1997;68(4):585‐96.
557. Nahid MA, Satoh M, Chan EKL. MicroRNA in TLR signaling and endotoxin tolerance. Cell Mol Immunol. 2011;8(5):388‐403.
558. Bala S, Marcos M, Kodys K, Csak T, Catalano D, Mandrekar P, et al. Up‐regulation of microRNA‐155 in macrophages contributes to increased tumor necrosis factor α (TNFα) production via increased mRNA half‐life in alcoholic liver disease. J Biol Chem. 2011;286(2):1436‐44.
559. Bala S, Petrasek J, Mundkur S, Catalano D, Levin I, Ward J, et al. Circulating microRNAs in exosomes indicate hepatocyte injury and inflammation in alcoholic, drug‐induced and inflammatory liver diseases. Hepatology. 2012;56(5):1946‐57.
560. Roth C, Rack B, Müller V, Janni W, Pantel K, Schwarzenbach H. Circulating microRNAs as blood‐based markers for patients with primary and metastatic breast cancer. Breast Cancer Res. 2010;12(6):R90.
561. Zheng D, Haddadin S, Wang Y, Gu LQ, Perry MC, Freter CE, et al. Plasma microRNAs as novel biomarkers for early detection of lung cancer. Int J Clin Exp Pathol. 2011;4(6):575‐86.
562. Sayed D, Abdellatif M. MicroRNAs in development and disease. Physiol Rev. 2011;91(3):827‐87.
563. Ratner ES, Tuck D, Richter C, Nallur S, Patel RM, Schultz V, et al. MicroRNA signatures differentiate uterine cancer tumor subtypes. Gynecol Oncol. 2010;118(3):251‐7.
564. Gilabert‐Estelles J, Braza‐Boils A, Ramon LA, Zorio E, Medina P, Espana F, et al. Role of microRNAs in gynecological pathology. Curr Med Chem. 2012;19(15):2406‐13.
565. Devor EJ, Hovey AM, Goodheart MJ, Ramachandran S, Leslie KK. microRNA expression profiling of endometrial endometrioid adenocarcinomas and serous adenocarcinomas reveals profiles containing shared, unique and differentiating groups of microRNAs. Oncol Rep. 2011;26(4):995‐1002.

CHAPTER 9
242 Victoria Nisenblat
566. Häusler S, Keller A, Chandran P, Ziegler K, Zipp K, Heuer S, et al. Whole blood‐derived miRNA profiles as potential new tools for ovarian cancer screening. Br J Cancer. 2010;103(5):693‐700.
567. Wotschofsky Z, Meyer HA, Jung M, Fendler A, Wagner I, Stephan C, et al. Reference genes for the relative quantification of microRNAs in renal cell carcinomas and their metastases. Anal Biochem. 2011;417(2):233‐41.
568. Ng EK, Chong WW, Jin H, Lam EK, Shin VY, Yu J, et al. Differential expression of microRNAs in plasma of patients with colorectal cancer: a potential marker for colorectal cancer screening. Gut. 2009 Oct;58(10):1375‐81.
569. Dheda K, Huggett J, Chang J, Kim L, Bustin S, Johnson M, et al. The implications of using an inappropriate reference gene for real‐time reverse transcription PCR data normalization. Anal Biochem. 2005;344(1):141‐3.