Splice site identification using probabilistic parameters and SVM classification
15
BioMed Central Page 1 of 15 (page number not for citation purposes) BMC Bioinformatics Open Access Proceedings Splice site identification using probabilistic parameters and SVM classification AKMA Baten*, BCH Chang, SK Halgamuge and Jason Li Address: Dynamic Systems and Control Research Group, DoMME, The University of Melbourne, Victoria 3010, Australia Email: AKMA Baten* - [email protected]; BCH Chang - [email protected]; SK Halgamuge - [email protected]; Jason Li - [email protected] * Corresponding author Abstract Background: Recent advances and automation in DNA sequencing technology has created a vast amount of DNA sequence data. This increasing growth of sequence data demands better and efficient analysis methods. Identifying genes in this newly accumulated data is an important issue in bioinformatics, and it requires the prediction of the complete gene structure. Accurate identification of splice sites in DNA sequences plays one of the central roles of gene structural prediction in eukaryotes. Effective detection of splice sites requires the knowledge of characteristics, dependencies, and relationship of nucleotides in the splice site surrounding region. A higher-order Markov model is generally regarded as a useful technique for modeling higher-order dependencies. However, their implementation requires estimating a large number of parameters, which is computationally expensive. Results: The proposed method for splice site detection consists of two stages: a first order Markov model (MM1) is used in the first stage and a support vector machine (SVM) with polynomial kernel is used in the second stage. The MM1 serves as a pre-processing step for the SVM and takes DNA sequences as its input. It models the compositional features and dependencies of nucleotides in terms of probabilistic parameters around splice site regions. The probabilistic parameters are then fed into the SVM, which combines them nonlinearly to predict splice sites. When the proposed MM1-SVM model is compared with other existing standard splice site detection methods, it shows a superior performance in all the cases. Conclusion: We proposed an effective pre-processing scheme for the SVM and applied it for the identification of splice sites. This is a simple yet effective splice site detection method, which shows a better classification accuracy and computational speed than some other more complex methods. Background Advances in the genome sequencing technology have cre- ated a vast amount of sequence data and completed genomic sequences. Identification of all genes is one of the major objectives of a genome sequencing project. In eukaryotic genomes, the detection of a coding region also from International Conference in Bioinformatics – InCoB2006 New Dehli, India. 18–20 December 2006 Published: 18 December 2006 BMC Bioinformatics 2006, 7(Suppl 5):S15 doi:10.1186/1471-2105-7-S5-S15 <supplement> <title> <p>APBioNet – Fifth International Conference on Bioinformatics (InCoB2006)</p> </title> <editor>Shoba Ranganathan, Martti Tammi, Michael Gribskov, Tin Wee Tan</editor> <note>Proceedings</note> </supplement> © 2006 Baten et al; licensee BioMed Central Ltd This is an open access article distributed under the terms of the Creative Commons Attribution License (http://creativecommons.org/licenses/by/2.0), which permits unrestricted use, distribution, and reproduction in any medium, provided the original work is properly cited.
Transcript of Splice site identification using probabilistic parameters and SVM classification
BioMed CentralBMC Bioinformatics
ss
Open AcceProceedingsSplice site identification using probabilistic parameters and SVM classificationAKMA Baten*, BCH Chang, SK Halgamuge and Jason LiAddress: Dynamic Systems and Control Research Group, DoMME, The University of Melbourne, Victoria 3010, Australia
Email: AKMA Baten* - [email protected]; BCH Chang - [email protected]; SK Halgamuge - [email protected]; Jason Li - [email protected]
* Corresponding author
AbstractBackground: Recent advances and automation in DNA sequencing technology has created a vastamount of DNA sequence data. This increasing growth of sequence data demands better andefficient analysis methods. Identifying genes in this newly accumulated data is an important issue inbioinformatics, and it requires the prediction of the complete gene structure. Accurateidentification of splice sites in DNA sequences plays one of the central roles of gene structuralprediction in eukaryotes. Effective detection of splice sites requires the knowledge ofcharacteristics, dependencies, and relationship of nucleotides in the splice site surrounding region.A higher-order Markov model is generally regarded as a useful technique for modeling higher-orderdependencies. However, their implementation requires estimating a large number of parameters,which is computationally expensive.
Results: The proposed method for splice site detection consists of two stages: a first orderMarkov model (MM1) is used in the first stage and a support vector machine (SVM) with polynomialkernel is used in the second stage. The MM1 serves as a pre-processing step for the SVM and takesDNA sequences as its input. It models the compositional features and dependencies of nucleotidesin terms of probabilistic parameters around splice site regions. The probabilistic parameters arethen fed into the SVM, which combines them nonlinearly to predict splice sites. When theproposed MM1-SVM model is compared with other existing standard splice site detectionmethods, it shows a superior performance in all the cases.
Conclusion: We proposed an effective pre-processing scheme for the SVM and applied it for theidentification of splice sites. This is a simple yet effective splice site detection method, which showsa better classification accuracy and computational speed than some other more complex methods.
BackgroundAdvances in the genome sequencing technology have cre-ated a vast amount of sequence data and completed
genomic sequences. Identification of all genes is one ofthe major objectives of a genome sequencing project. Ineukaryotic genomes, the detection of a coding region also
from International Conference in Bioinformatics – InCoB2006New Dehli, India. 18–20 December 2006
Published: 18 December 2006
BMC Bioinformatics 2006, 7(Suppl 5):S15 doi:10.1186/1471-2105-7-S5-S15<supplement> <title> <p>APBioNet – Fifth International Conference on Bioinformatics (InCoB2006)</p> </title> <editor>Shoba Ranganathan, Martti Tammi, Michael Gribskov, Tin Wee Tan</editor> <note>Proceedings</note> </supplement>
© 2006 Baten et al; licensee BioMed Central Ltd This is an open access article distributed under the terms of the Creative Commons Attribution License (http://creativecommons.org/licenses/by/2.0), which permits unrestricted use, distribution, and reproduction in any medium, provided the original work is properly cited.
Page 1 of 15(page number not for citation purposes)
BMC Bioinformatics 2006, 7(Suppl 5):S15
depends on the precise identification of the exon-intronstructures. However, the vast length and structural com-plexity of sequence data makes it a very challenging task.Recent genome analysis shows that the human genomecontains approximately 3 billion base pairs and 20,000–25,000 protein-coding genes [1]. However, it was statisti-cally estimated that the number of genes in humangenome should be around 100,000 [2]. This differenceshows that either a large number of genes are yet to beidentified or there are many alternative splicing events yetto be detected [3,4]. Various computational methods havebeen proposed in the last decade for the identification ofeukaryotic genes. Most of those methods perform well toa certain extent and have their own limitations. So despiteof many years of intensive research in this area, the overallperformance of the gene prediction algorithms is still notsatisfactory [5,6].
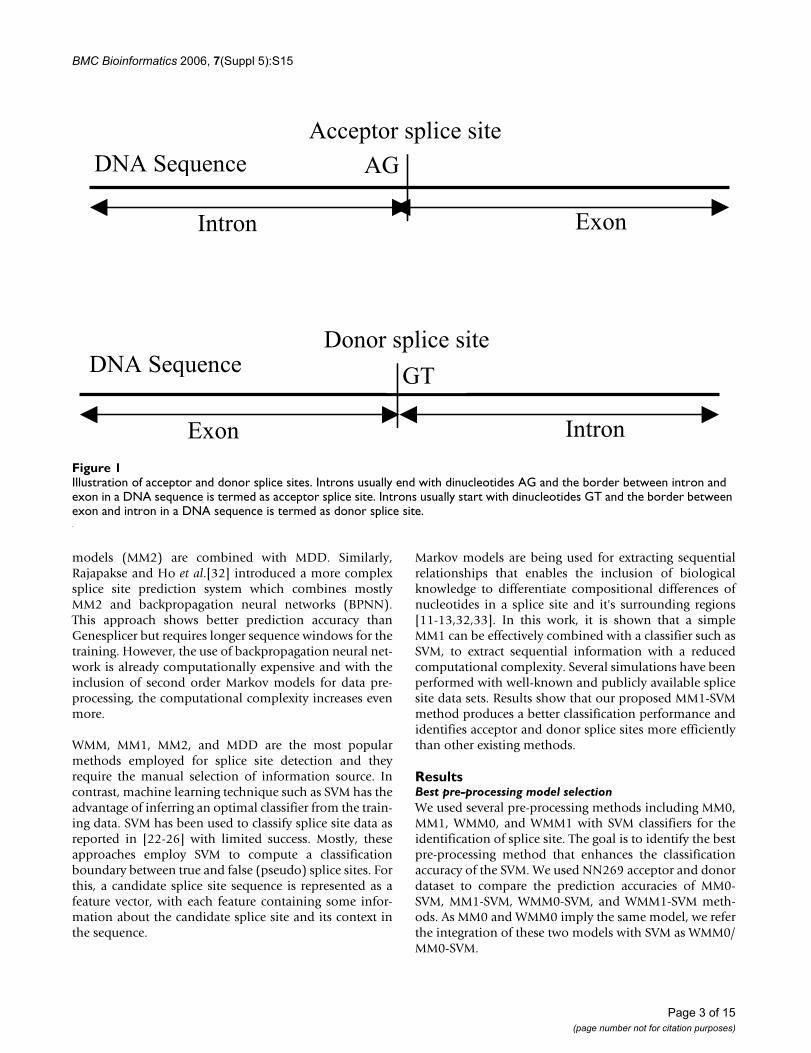
Most of the eukaryotic protein coding genes consist ofintrons and exons. The exons are the protein codingregion of a gene and they are interspersed with interven-ing sequences of introns. Introns are termed as proteinnon coding regions as their biological significance is notwell known yet. The borders between introns and exonsare termed as splice sites. The splice site in the upstreampart of an intron is called the donor splice site (in thedirection 5' to 3') and the downstream part is termed asthe acceptor splice site (in the direction 3' to 5'). Theacceptor and donor splice sites with consensus AG (corre-spond to the end of an intron) and GT (correspond to thebeginning of an intron) respectively are known as canon-ical splice sites as shown in Figure 1. These canonicalacceptor and donor splice sites are recognized by themajor class, or U2-type spliceosome, which is universal toeukaryotes [7]. The non canonical splice sites are thosewith minor consensus such as GC and AC and are recog-nized by the minor class or U12-type spliceosome, whichmay not be present in some organisms [8]. Approximately99% of the splice sites are canonical AG/GT splice sites[7]. As AG and GT represent possible acceptor and donorsplice sites, every AG and GT of a DNA sequence is a can-didate acceptor or donor splice site and they need to beclassified as either a real (true) splice site or a pseudo(false) splice site.
In eukaryotes, introns are removed from gene transcripts(exons) in a biological process known as pre-mRNA splic-ing. This is an enzymatic reaction that involves a largemulti component ribonucleoprotein catalytic complexknown as spliceosome. Mass spectrometry analysis is atechnique to identify the spliceosome and splicing factorsthat participate in the pre-mRNA splicing. In 1999,around 100 splicing factors were identified [8]. However,recent improved and more sensitive mass spectrometersand sample preparation techniques found more than 300
polypeptide that participate in the splicing which mayinclude some more complex mechanism beyond our cur-rent knowledge of pre-mRNA splicing mechanism [9,10].
Various computational methods have been developed forsplice site detection, and they can be grouped into severalcategories including the probabilistic approaches [3,6,11-17], the neural network and support vector machineapproaches [18-26], the methods based on discriminantanalysis [27,28] and the information theoreticapproaches [29-31]. These methods are based on seekingthe consensus patterns or features and try to identify theunderlying relationships among nucleotides in a splicesite and the surrounding region. Neural networks andsupport vector machines (SVM) learn the complex fea-tures of neighbourhoods surrounding the consensus di-nucleotides AG/GT by a complex non-linear transforma-tion. Probabilistic models estimate position specific prob-abilities of splice sites by computing likelihoods ofcandidate signal sequences. The discriminant analysisuses several statistical measures to evaluate the presence ofspecific nucleotides, recognizing the splice sites withoutexplicitly determining the probability distributions.
In the past, researchers also attempted to identify splicesites using the weight matrix method (WMM) inspired bythe presence of apparent consensus AG and GT in thesplicing junctions [19,31]. WMM was also adopted inmethods NetPlantGene [20] and NNSplice [18]. Later,Salzberg et al. and Zhang et al. [13,14] achieved a goodsplice site prediction accuracy using a linear first orderMarkov model (MM1, WAM). However, MM1 alone can-not model the complex higher-order dependencies thatexist among the nucleotides in both acceptor and donorsplice sites. The unavailability of high quality trainingdata encourages researchers to design models which canlearn the complex nucleotide dependencies efficientlyfrom the limited available training data. To overcome thelimitations of MM1 without a high quality and large train-ing dataset, Burge et al. proposed the Genscan [6] method.Genscan is a computational method based on the maxi-mal dependence decomposition (MDD) algorithm,which is a decision tree process that captures dependen-cies among nucleotides. The MDD is designed to capturethe most significant dependencies between adjacent andnon-adjacent nucleotides. Even though the Bayes networkmodel [16] and MDD are complex splice site detectionmethods, they do not produce a dramatic improvement insplice site detection with respect to simpler models thatassume dependencies only between adjacent positions. Ithas been suggested that a significant improvement in thedetection of splice sites is possible if one of the base statis-tical models, such as WMM, MM1, MDD etc., is combinedwith other signal/content methods [11]. GeneSplicer is amethod of this category [11], where second order Markov
Page 2 of 15(page number not for citation purposes)
BMC Bioinformatics 2006, 7(Suppl 5):S15
models (MM2) are combined with MDD. Similarly,Rajapakse and Ho et al.[32] introduced a more complexsplice site prediction system which combines mostlyMM2 and backpropagation neural networks (BPNN).This approach shows better prediction accuracy thanGenesplicer but requires longer sequence windows for thetraining. However, the use of backpropagation neural net-work is already computationally expensive and with theinclusion of second order Markov models for data pre-processing, the computational complexity increases evenmore.
WMM, MM1, MM2, and MDD are the most popularmethods employed for splice site detection and theyrequire the manual selection of information source. Incontrast, machine learning technique such as SVM has theadvantage of inferring an optimal classifier from the train-ing data. SVM has been used to classify splice site data asreported in [22-26] with limited success. Mostly, theseapproaches employ SVM to compute a classificationboundary between true and false (pseudo) splice sites. Forthis, a candidate splice site sequence is represented as afeature vector, with each feature containing some infor-mation about the candidate splice site and its context inthe sequence.
Markov models are being used for extracting sequentialrelationships that enables the inclusion of biologicalknowledge to differentiate compositional differences ofnucleotides in a splice site and it's surrounding regions[11-13,32,33]. In this work, it is shown that a simpleMM1 can be effectively combined with a classifier such asSVM, to extract sequential information with a reducedcomputational complexity. Several simulations have beenperformed with well-known and publicly available splicesite data sets. Results show that our proposed MM1-SVMmethod produces a better classification performance andidentifies acceptor and donor splice sites more efficientlythan other existing methods.
ResultsBest pre-processing model selectionWe used several pre-processing methods including MM0,MM1, WMM0, and WMM1 with SVM classifiers for theidentification of splice site. The goal is to identify the bestpre-processing method that enhances the classificationaccuracy of the SVM. We used NN269 acceptor and donordataset to compare the prediction accuracies of MM0-SVM, MM1-SVM, WMM0-SVM, and WMM1-SVM meth-ods. As MM0 and WMM0 imply the same model, we referthe integration of these two models with SVM as WMM0/MM0-SVM.
Illustration of acceptor and donor splice sitesFigure 1Illustration of acceptor and donor splice sites. Introns usually end with dinucleotides AG and the border between intron and exon in a DNA sequence is termed as acceptor splice site. Introns usually start with dinucleotides GT and the border between exon and intron in a DNA sequence is termed as donor splice site.
Intron Exon
AGDNA Sequence
Acceptor splice site
Exon Intron
GT
Donor splice site DNA Sequence
Page 3 of 15(page number not for citation purposes)
BMC Bioinformatics 2006, 7(Suppl 5):S15
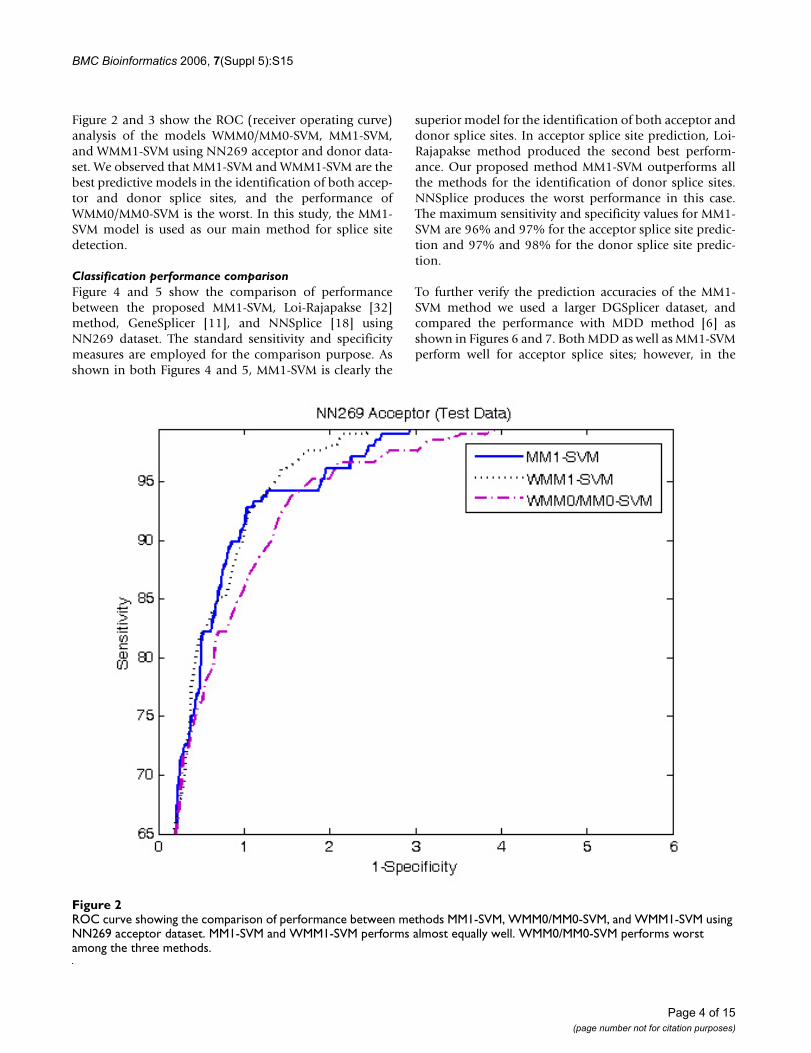
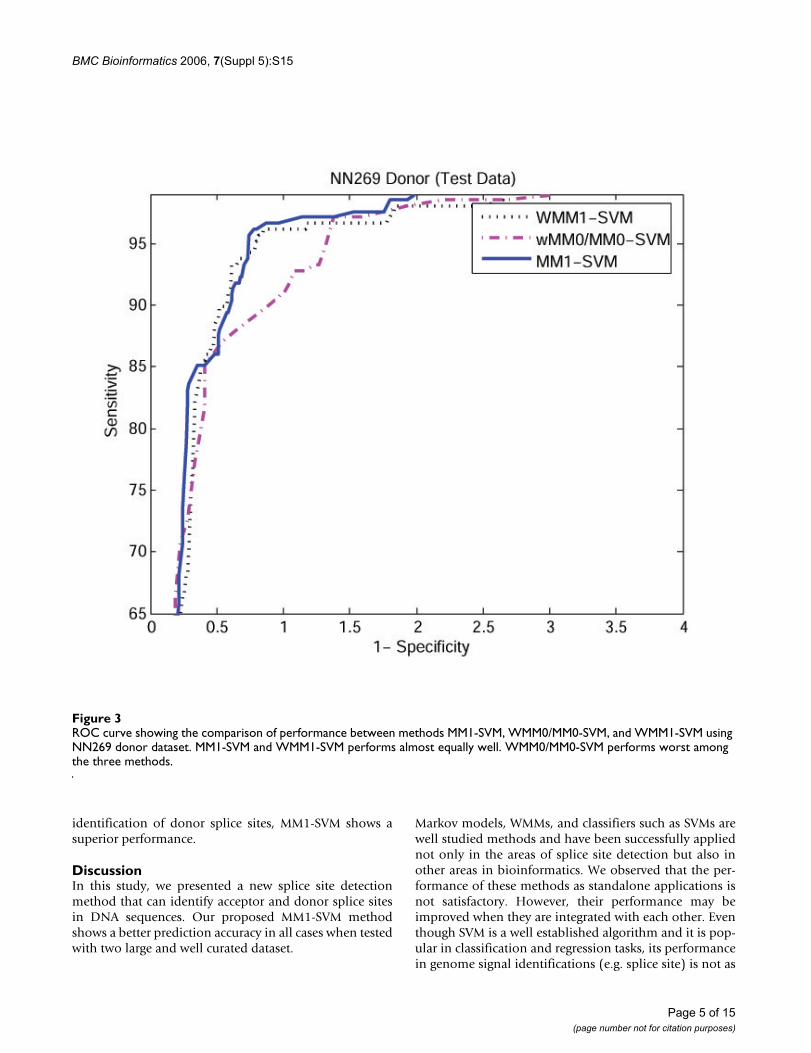
Figure 2 and 3 show the ROC (receiver operating curve)analysis of the models WMM0/MM0-SVM, MM1-SVM,and WMM1-SVM using NN269 acceptor and donor data-set. We observed that MM1-SVM and WMM1-SVM are thebest predictive models in the identification of both accep-tor and donor splice sites, and the performance ofWMM0/MM0-SVM is the worst. In this study, the MM1-SVM model is used as our main method for splice sitedetection.
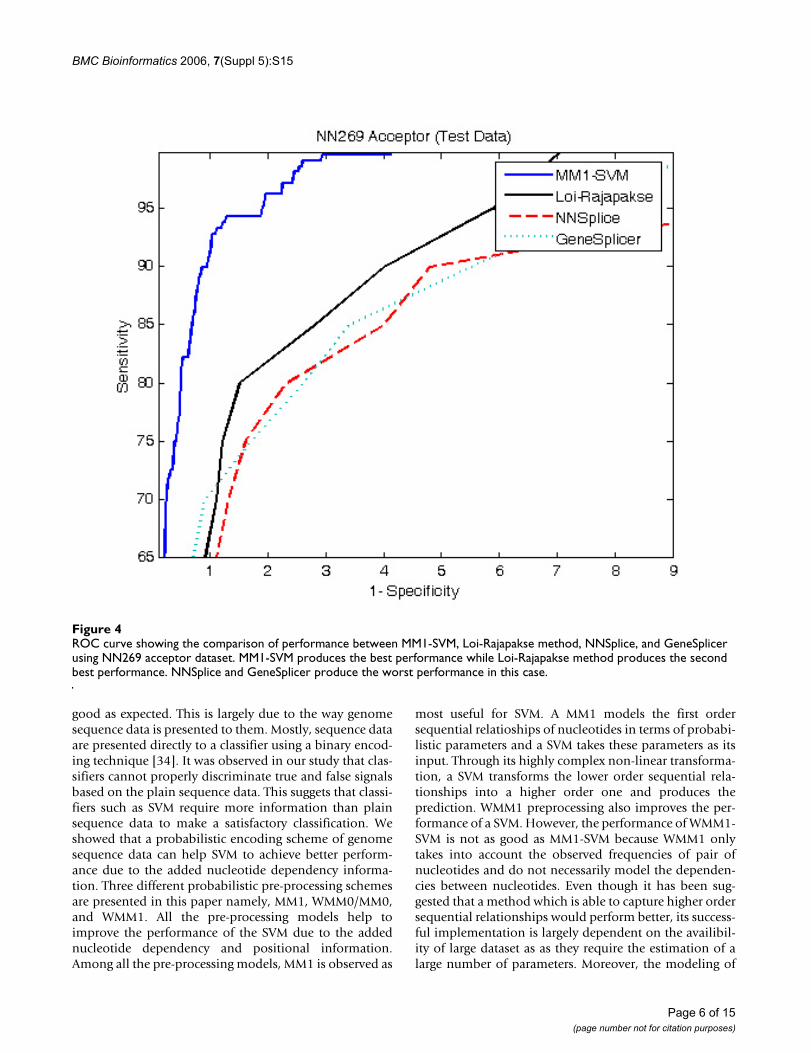
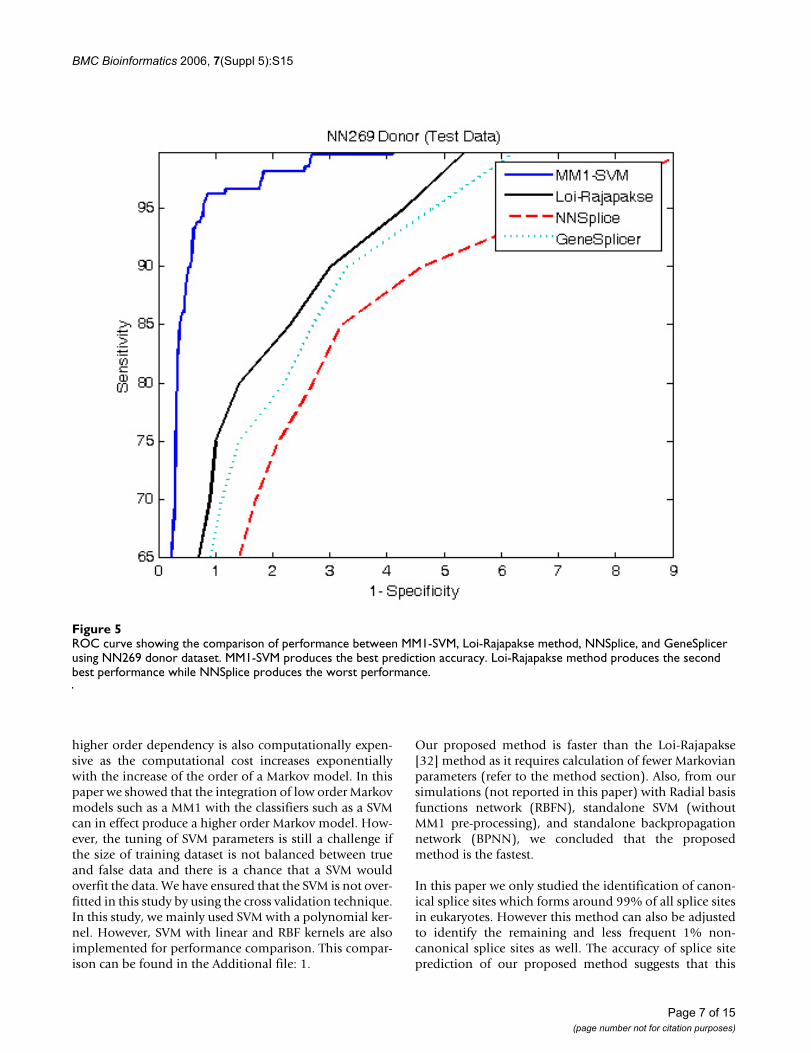
Classification performance comparisonFigure 4 and 5 show the comparison of performancebetween the proposed MM1-SVM, Loi-Rajapakse [32]method, GeneSplicer [11], and NNSplice [18] usingNN269 dataset. The standard sensitivity and specificitymeasures are employed for the comparison purpose. Asshown in both Figures 4 and 5, MM1-SVM is clearly the
superior model for the identification of both acceptor anddonor splice sites. In acceptor splice site prediction, Loi-Rajapakse method produced the second best perform-ance. Our proposed method MM1-SVM outperforms allthe methods for the identification of donor splice sites.NNSplice produces the worst performance in this case.The maximum sensitivity and specificity values for MM1-SVM are 96% and 97% for the acceptor splice site predic-tion and 97% and 98% for the donor splice site predic-tion.
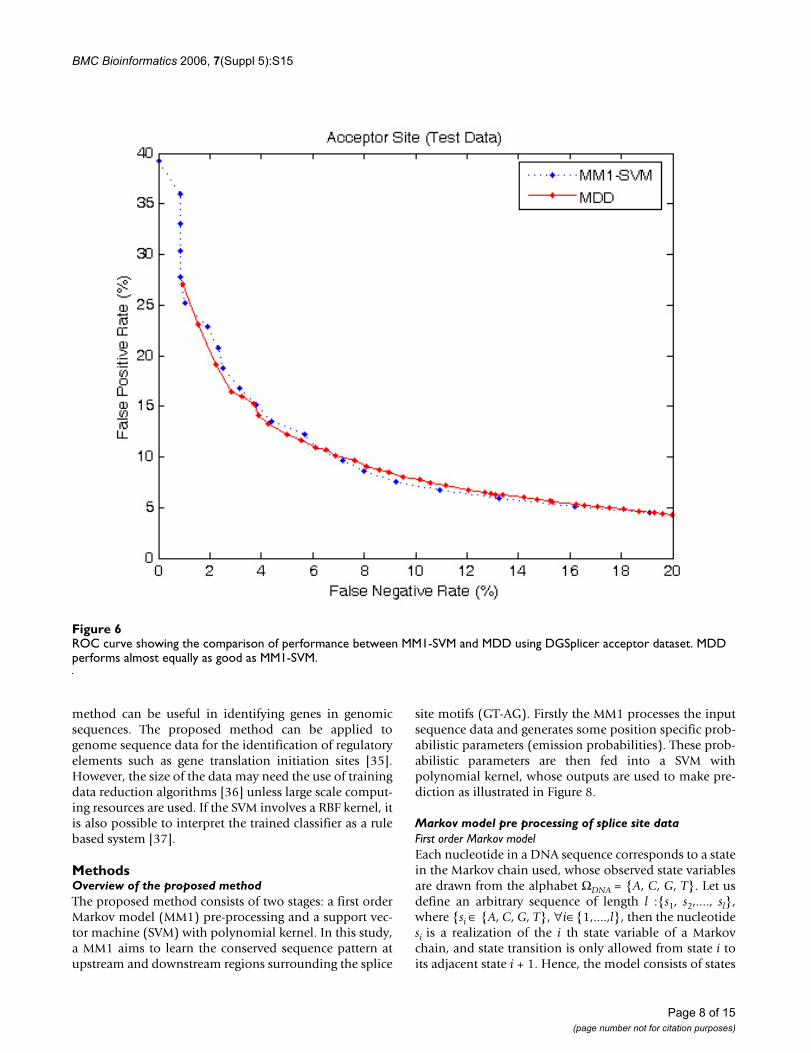
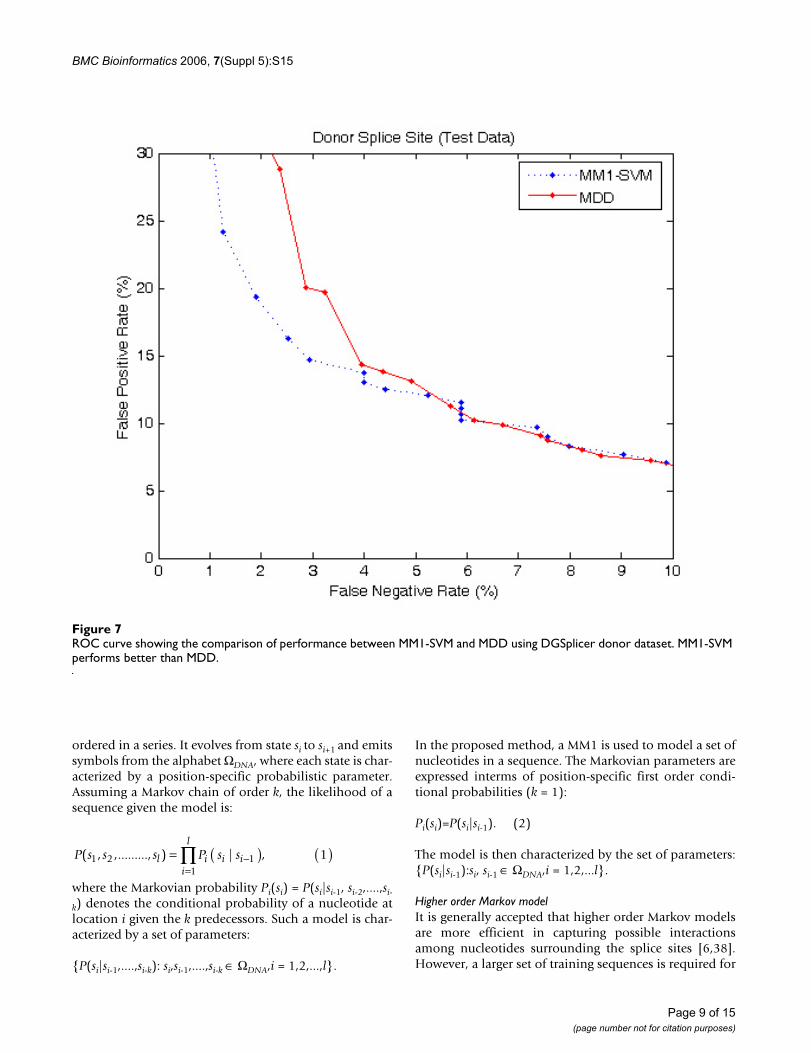
To further verify the prediction accuracies of the MM1-SVM method we used a larger DGSplicer dataset, andcompared the performance with MDD method [6] asshown in Figures 6 and 7. Both MDD as well as MM1-SVMperform well for acceptor splice sites; however, in the
ROC curve showing the comparison of performance between methods MM1-SVM, WMM0/MM0-SVM, and WMM1-SVM using NN269 acceptor datasetFigure 2ROC curve showing the comparison of performance between methods MM1-SVM, WMM0/MM0-SVM, and WMM1-SVM using NN269 acceptor dataset. MM1-SVM and WMM1-SVM performs almost equally well. WMM0/MM0-SVM performs worst among the three methods.
Page 4 of 15(page number not for citation purposes)
BMC Bioinformatics 2006, 7(Suppl 5):S15
identification of donor splice sites, MM1-SVM shows asuperior performance.
DiscussionIn this study, we presented a new splice site detectionmethod that can identify acceptor and donor splice sitesin DNA sequences. Our proposed MM1-SVM methodshows a better prediction accuracy in all cases when testedwith two large and well curated dataset.
Markov models, WMMs, and classifiers such as SVMs arewell studied methods and have been successfully appliednot only in the areas of splice site detection but also inother areas in bioinformatics. We observed that the per-formance of these methods as standalone applications isnot satisfactory. However, their performance may beimproved when they are integrated with each other. Eventhough SVM is a well established algorithm and it is pop-ular in classification and regression tasks, its performancein genome signal identifications (e.g. splice site) is not as
ROC curve showing the comparison of performance between methods MM1-SVM, WMM0/MM0-SVM, and WMM1-SVM using NN269 donor datasetFigure 3ROC curve showing the comparison of performance between methods MM1-SVM, WMM0/MM0-SVM, and WMM1-SVM using NN269 donor dataset. MM1-SVM and WMM1-SVM performs almost equally well. WMM0/MM0-SVM performs worst among the three methods.
Page 5 of 15(page number not for citation purposes)
BMC Bioinformatics 2006, 7(Suppl 5):S15
good as expected. This is largely due to the way genomesequence data is presented to them. Mostly, sequence dataare presented directly to a classifier using a binary encod-ing technique [34]. It was observed in our study that clas-sifiers cannot properly discriminate true and false signalsbased on the plain sequence data. This suggets that classi-fiers such as SVM require more information than plainsequence data to make a satisfactory classification. Weshowed that a probabilistic encoding scheme of genomesequence data can help SVM to achieve better perform-ance due to the added nucleotide dependency informa-tion. Three different probabilistic pre-processing schemesare presented in this paper namely, MM1, WMM0/MM0,and WMM1. All the pre-processing models help toimprove the performance of the SVM due to the addednucleotide dependency and positional information.Among all the pre-processing models, MM1 is observed as
most useful for SVM. A MM1 models the first ordersequential relatioships of nucleotides in terms of probabi-listic parameters and a SVM takes these parameters as itsinput. Through its highly complex non-linear transforma-tion, a SVM transforms the lower order sequential rela-tionships into a higher order one and produces theprediction. WMM1 preprocessing also improves the per-formance of a SVM. However, the performance of WMM1-SVM is not as good as MM1-SVM because WMM1 onlytakes into account the observed frequencies of pair ofnucleotides and do not necessarily model the dependen-cies between nucleotides. Even though it has been sug-gested that a method which is able to capture higher ordersequential relationships would perform better, its success-ful implementation is largely dependent on the availibil-ity of large dataset as as they require the estimation of alarge number of parameters. Moreover, the modeling of
ROC curve showing the comparison of performance between MM1-SVM, Loi-Rajapakse method, NNSplice, and GeneSplicer using NN269 acceptor datasetFigure 4ROC curve showing the comparison of performance between MM1-SVM, Loi-Rajapakse method, NNSplice, and GeneSplicer using NN269 acceptor dataset. MM1-SVM produces the best performance while Loi-Rajapakse method produces the second best performance. NNSplice and GeneSplicer produce the worst performance in this case.
Page 6 of 15(page number not for citation purposes)
BMC Bioinformatics 2006, 7(Suppl 5):S15
higher order dependency is also computationally expen-sive as the computational cost increases exponentiallywith the increase of the order of a Markov model. In thispaper we showed that the integration of low order Markovmodels such as a MM1 with the classifiers such as a SVMcan in effect produce a higher order Markov model. How-ever, the tuning of SVM parameters is still a challenge ifthe size of training dataset is not balanced between trueand false data and there is a chance that a SVM wouldoverfit the data. We have ensured that the SVM is not over-fitted in this study by using the cross validation technique.In this study, we mainly used SVM with a polynomial ker-nel. However, SVM with linear and RBF kernels are alsoimplemented for performance comparison. This compar-ison can be found in the Additional file: 1.
Our proposed method is faster than the Loi-Rajapakse[32] method as it requires calculation of fewer Markovianparameters (refer to the method section). Also, from oursimulations (not reported in this paper) with Radial basisfunctions network (RBFN), standalone SVM (withoutMM1 pre-processing), and standalone backpropagationnetwork (BPNN), we concluded that the proposedmethod is the fastest.
In this paper we only studied the identification of canon-ical splice sites which forms around 99% of all splice sitesin eukaryotes. However this method can also be adjustedto identify the remaining and less frequent 1% non-canonical splice sites as well. The accuracy of splice siteprediction of our proposed method suggests that this
ROC curve showing the comparison of performance between MM1-SVM, Loi-Rajapakse method, NNSplice, and GeneSplicer using NN269 donor datasetFigure 5ROC curve showing the comparison of performance between MM1-SVM, Loi-Rajapakse method, NNSplice, and GeneSplicer using NN269 donor dataset. MM1-SVM produces the best prediction accuracy. Loi-Rajapakse method produces the second best performance while NNSplice produces the worst performance.
Page 7 of 15(page number not for citation purposes)
BMC Bioinformatics 2006, 7(Suppl 5):S15
method can be useful in identifying genes in genomicsequences. The proposed method can be applied togenome sequence data for the identification of regulatoryelements such as gene translation initiation sites [35].However, the size of the data may need the use of trainingdata reduction algorithms [36] unless large scale comput-ing resources are used. If the SVM involves a RBF kernel, itis also possible to interpret the trained classifier as a rulebased system [37].
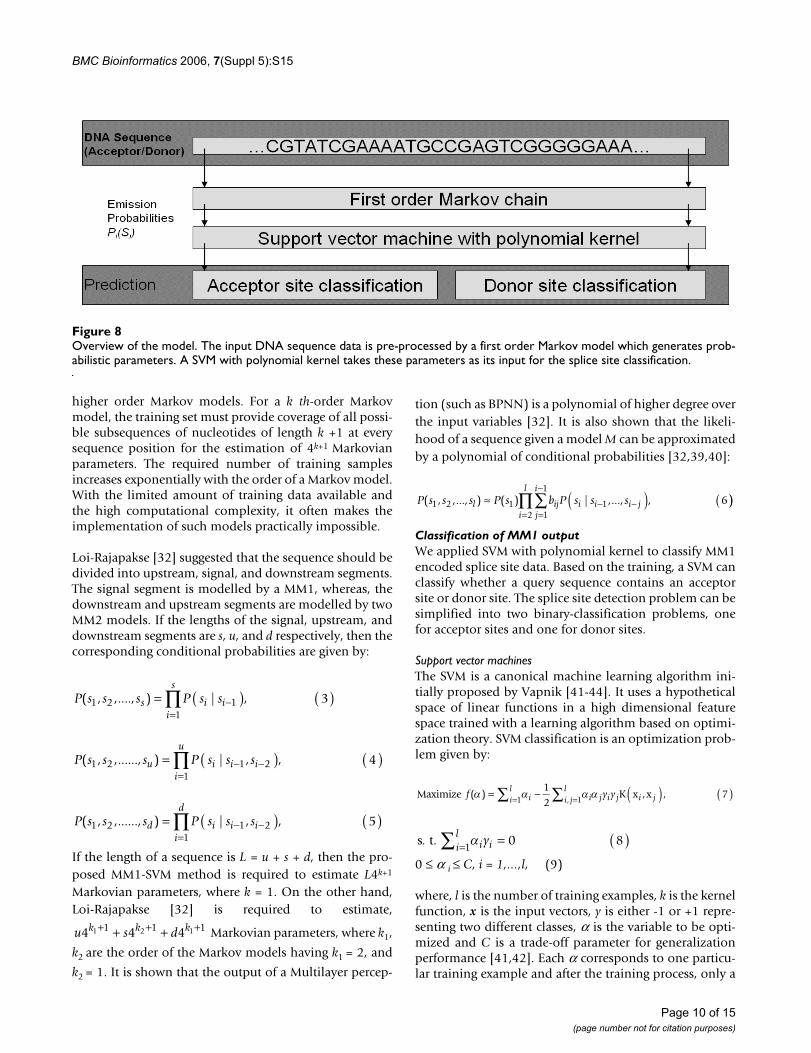
MethodsOverview of the proposed methodThe proposed method consists of two stages: a first orderMarkov model (MM1) pre-processing and a support vec-tor machine (SVM) with polynomial kernel. In this study,a MM1 aims to learn the conserved sequence pattern atupstream and downstream regions surrounding the splice
site motifs (GT-AG). Firstly the MM1 processes the inputsequence data and generates some position specific prob-abilistic parameters (emission probabilities). These prob-abilistic parameters are then fed into a SVM withpolynomial kernel, whose outputs are used to make pre-diction as illustrated in Figure 8.
Markov model pre processing of splice site dataFirst order Markov modelEach nucleotide in a DNA sequence corresponds to a statein the Markov chain used, whose observed state variablesare drawn from the alphabet ΩDNA = {A, C, G, T}. Let usdefine an arbitrary sequence of length l :{s1, s2,...., sl},where {si ∈ {A, C, G, T}, ∀i∈{1,....,l}, then the nucleotidesi is a realization of the i th state variable of a Markovchain, and state transition is only allowed from state i toits adjacent state i + 1. Hence, the model consists of states
ROC curve showing the comparison of performance between MM1-SVM and MDD using DGSplicer acceptor datasetFigure 6ROC curve showing the comparison of performance between MM1-SVM and MDD using DGSplicer acceptor dataset. MDD performs almost equally as good as MM1-SVM.
Page 8 of 15(page number not for citation purposes)
BMC Bioinformatics 2006, 7(Suppl 5):S15
ordered in a series. It evolves from state si to si+1 and emitssymbols from the alphabet ΩDNA, where each state is char-acterized by a position-specific probabilistic parameter.Assuming a Markov chain of order k, the likelihood of asequence given the model is:
where the Markovian probability Pi(si) = P(si|si-1, si-2,....,si-
k) denotes the conditional probability of a nucleotide atlocation i given the k predecessors. Such a model is char-acterized by a set of parameters:
{P(si|si-1,....,si-k): si,si-1,....,si-k ∈ ΩDNA,i = 1,2,...,l}.
In the proposed method, a MM1 is used to model a set ofnucleotides in a sequence. The Markovian parameters areexpressed interms of position-specific first order condi-tional probabilities (k = 1):
Pi(si)=P(si|si-1). (2)
The model is then characterized by the set of parameters:{P(si|si-1):si, si-1 ∈ ΩDNA,i = 1,2,...l}.
Higher order Markov modelIt is generally accepted that higher order Markov modelsare more efficient in capturing possible interactionsamong nucleotides surrounding the splice sites [6,38].However, a larger set of training sequences is required for
P s s s P s sl i i ii
l( , ,........., ) | ,1 2 1
1
1= ( ) ( )−=∏
ROC curve showing the comparison of performance between MM1-SVM and MDD using DGSplicer donor datasetFigure 7ROC curve showing the comparison of performance between MM1-SVM and MDD using DGSplicer donor dataset. MM1-SVM performs better than MDD.
Page 9 of 15(page number not for citation purposes)
BMC Bioinformatics 2006, 7(Suppl 5):S15
higher order Markov models. For a k th-order Markovmodel, the training set must provide coverage of all possi-ble subsequences of nucleotides of length k +1 at everysequence position for the estimation of 4k+1 Markovianparameters. The required number of training samplesincreases exponentially with the order of a Markov model.With the limited amount of training data available andthe high computational complexity, it often makes theimplementation of such models practically impossible.
Loi-Rajapakse [32] suggested that the sequence should bedivided into upstream, signal, and downstream segments.The signal segment is modelled by a MM1, whereas, thedownstream and upstream segments are modelled by twoMM2 models. If the lengths of the signal, upstream, anddownstream segments are s, u, and d respectively, then thecorresponding conditional probabilities are given by:
If the length of a sequence is L = u + s + d, then the pro-posed MM1-SVM method is required to estimate L4k+1
Markovian parameters, where k = 1. On the other hand,Loi-Rajapakse [32] is required to estimate,
Markovian parameters, where k1,
k2 are the order of the Markov models having k1 = 2, and
k2 = 1. It is shown that the output of a Multilayer percep-
tion (such as BPNN) is a polynomial of higher degree overthe input variables [32]. It is also shown that the likeli-hood of a sequence given a model M can be approximatedby a polynomial of conditional probabilities [32,39,40]:
Classification of MM1 outputWe applied SVM with polynomial kernel to classify MM1encoded splice site data. Based on the training, a SVM canclassify whether a query sequence contains an acceptorsite or donor site. The splice site detection problem can besimplified into two binary-classification problems, onefor acceptor sites and one for donor sites.
Support vector machinesThe SVM is a canonical machine learning algorithm ini-tially proposed by Vapnik [41-44]. It uses a hypotheticalspace of linear functions in a high dimensional featurespace trained with a learning algorithm based on optimi-zation theory. SVM classification is an optimization prob-lem given by:
0 ≤ α i ≤ C, i = 1,...,l, (9)
where, l is the number of training examples, k is the kernelfunction, x is the input vectors, y is either -1 or +1 repre-senting two different classes, α is the variable to be opti-mized and C is a trade-off parameter for generalizationperformance [41,42]. Each α corresponds to one particu-lar training example and after the training process, only a
P s s s P s ss i ii
s( , ,...., ) | ,1 2 1
1
3= ( ) ( )−=∏
P s s s P s s su i i ii
u( , ,......, ) | , ,1 2 1 2
1
4= ( ) ( )− −=∏
P s s s P s s sd i i ii
d( , ,......, ) | , ,1 2 1 2
1
5= ( ) ( )− −=∏
u s dk k k4 4 41 2 11 1 1+ + ++ +
P s s s P s b P s s sl ij i i i jj
i
i
l( , ,..., ) ( ) | ,..., ,1 2 1 1
1
1
2
6≈ ( ) (− −=
−
=∑∏ ))
Maximize K x xf y yi i j i ji jl
i jil( ) , ,
,α α α α= − ( ) ( )== ∑∑ 1
27
11
s t. . αi iil
y = ( )=∑ 0 81
Overview of the modelFigure 8Overview of the model. The input DNA sequence data is pre-processed by a first order Markov model which generates prob-abilistic parameters. A SVM with polynomial kernel takes these parameters as its input for the splice site classification.
Page 10 of 15(page number not for citation purposes)
BMC Bioinformatics 2006, 7(Suppl 5):S15
subgroup of α will have non-zero values. This subgroup ofα and their corresponding training examples are called thesupport vectors. In this study, two separate SVM classifiersare required, one for acceptor and one for donor. The classlabels y in the two classifiers would then indicate true (y =+1) or false sites (y = -1) for acceptor and donor accord-ingly. Input x would always be a vector of MM1 probabil-ities.
Given a query DNA segment z, the trained SVM classifiesbased on the decision function:
where v is the set of support vectors.
The kernel function in our classifiers is a second order pol-ynomial:
K(x, z) = (⟨x·z⟩ + 1)2, (11)
where ⟨·⟩ indicates a dot product.
Expanding (11), we obtain
where n is the number of dimensions in vectors x and z,and xi and zi are the i-th element in vectors x and z respec-tively. Substituting (12) into (10), the output o(z)becomes a second-order polynomial over z, with the pol-ynomial constants determined by α and x of the set ofsupport vectors. Since z is a vector of conditional proba-bilities of a sequence of length l:
z = [P(S2 | S1), P(S3 | S2),..., P(Sl | Sl-1)], (13)
the output o(z) in its polynomial form resembles equation(6). Such a polynomial of first order conditional probabil-ities suggests that a SVM classifier with the kernel functionin (11) can approximate a higher order Markov model.Higher order polynomial kernels may also be used con-
o y Ki ii v
( ) ( , ) ,z x zi=⎡
⎣⎢⎢
⎤
⎦⎥⎥
( )∈∑sign α 10
K x x z z
x z
i j i ji j
n n
i ii
n
( , ) ( )( )
,
( , ) ( , )
( , )
x z = +
( )( ) +
(=
=
∑
∑
11
1
2 2 1
12 ))
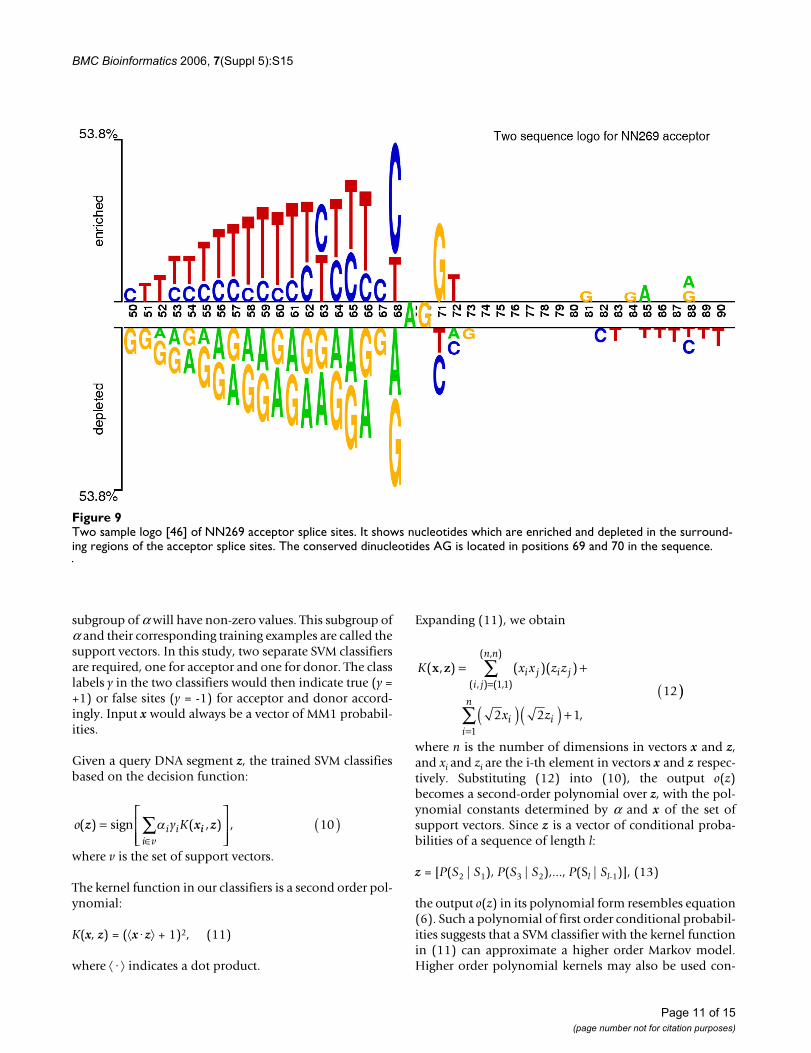
Two sample logo [46] of NN269 acceptor splice sitesFigure 9Two sample logo [46] of NN269 acceptor splice sites. It shows nucleotides which are enriched and depleted in the surround-ing regions of the acceptor splice sites. The conserved dinucleotides AG is located in positions 69 and 70 in the sequence.
Page 11 of 15(page number not for citation purposes)
BMC Bioinformatics 2006, 7(Suppl 5):S15
sidering the trade-off of more complex decision functionand larger training time. However, numerical instabilityoften arises when higher order polynomial kernels areused.
DatasetWe have conducted several simulations to evaluate theperformance of the proposed algorithm using two stand-ard and publicly available splice site datasets.
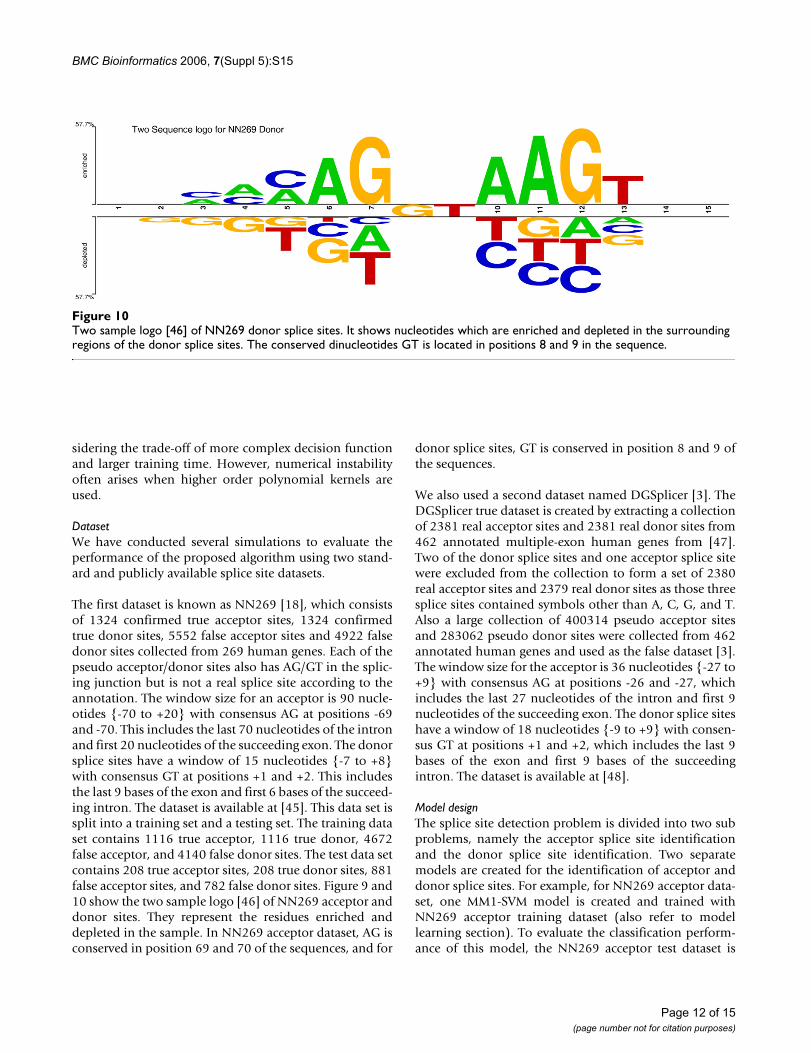
The first dataset is known as NN269 [18], which consistsof 1324 confirmed true acceptor sites, 1324 confirmedtrue donor sites, 5552 false acceptor sites and 4922 falsedonor sites collected from 269 human genes. Each of thepseudo acceptor/donor sites also has AG/GT in the splic-ing junction but is not a real splice site according to theannotation. The window size for an acceptor is 90 nucle-otides {-70 to +20} with consensus AG at positions -69and -70. This includes the last 70 nucleotides of the intronand first 20 nucleotides of the succeeding exon. The donorsplice sites have a window of 15 nucleotides {-7 to +8}with consensus GT at positions +1 and +2. This includesthe last 9 bases of the exon and first 6 bases of the succeed-ing intron. The dataset is available at [45]. This data set issplit into a training set and a testing set. The training dataset contains 1116 true acceptor, 1116 true donor, 4672false acceptor, and 4140 false donor sites. The test data setcontains 208 true acceptor sites, 208 true donor sites, 881false acceptor sites, and 782 false donor sites. Figure 9 and10 show the two sample logo [46] of NN269 acceptor anddonor sites. They represent the residues enriched anddepleted in the sample. In NN269 acceptor dataset, AG isconserved in position 69 and 70 of the sequences, and for
donor splice sites, GT is conserved in position 8 and 9 ofthe sequences.
We also used a second dataset named DGSplicer [3]. TheDGSplicer true dataset is created by extracting a collectionof 2381 real acceptor sites and 2381 real donor sites from462 annotated multiple-exon human genes from [47].Two of the donor splice sites and one acceptor splice sitewere excluded from the collection to form a set of 2380real acceptor sites and 2379 real donor sites as those threesplice sites contained symbols other than A, C, G, and T.Also a large collection of 400314 pseudo acceptor sitesand 283062 pseudo donor sites were collected from 462annotated human genes and used as the false dataset [3].The window size for the acceptor is 36 nucleotides {-27 to+9} with consensus AG at positions -26 and -27, whichincludes the last 27 nucleotides of the intron and first 9nucleotides of the succeeding exon. The donor splice siteshave a window of 18 nucleotides {-9 to +9} with consen-sus GT at positions +1 and +2, which includes the last 9bases of the exon and first 9 bases of the succeedingintron. The dataset is available at [48].
Model designThe splice site detection problem is divided into two subproblems, namely the acceptor splice site identificationand the donor splice site identification. Two separatemodels are created for the identification of acceptor anddonor splice sites. For example, for NN269 acceptor data-set, one MM1-SVM model is created and trained withNN269 acceptor training dataset (also refer to modellearning section). To evaluate the classification perform-ance of this model, the NN269 acceptor test dataset is
Two sample logo [46] of NN269 donor splice sitesFigure 10Two sample logo [46] of NN269 donor splice sites. It shows nucleotides which are enriched and depleted in the surrounding regions of the donor splice sites. The conserved dinucleotides GT is located in positions 8 and 9 in the sequence.
Page 12 of 15(page number not for citation purposes)
BMC Bioinformatics 2006, 7(Suppl 5):S15
used. Similarly a separate MM1-SVM model is trained andtested with NN269 donor training and donor test dataset.
Model LearningThe training of a model was conducted in two stages: theMM1 parameters estimation and the SVM with secondorder polynomial kernel training. The training sequenceswere aligned with respect to the consensus dinucleotidesprior to stage one. The estimates of the MM1 are the ratiosof the frequencies of each dinucleotide in each sequenceposition as shown in (14). Only the true splice site train-ing sequences were used to create the Markov model. Thedesired output level is set to +1 or -1 depending on thetrue or false splice site class label.
We used the LIBSVM [49] implementation of the supportvector machine, which is freely available at [50].
Model extension and comparisonTo verify the usefulness of our proposed MM1-SVMmethod and to compare its performance with others, wealso implemented several other methods that are closelyrelated to the proposed method. We used different pre-processing scheme with a SVM and compare their per-formances. For instance, we combined a SVM with thezero order Markov model (MM0), which is also wellknown as WMM model. WMM assumes that the probabil-ity of observing a certain nucleotide at any position doesnot depend on the occurrence of any other nucleotides inany position of that sequence. A zero order WMM (i.e.WMM0) is obtained by counting the frequency of eachnucleotide in each position. Similarly, higher orderWMMs can be created by counting dinucleotides, trinucle-otides etc. Literally MM0 and WMM0 are the same interms of their working principle. In this study we have cre-ated several models including MM0-SVM, WMM0-SVM,MM1-SVM, and WMM1-SVM and we applied all the mod-els in splice site identification.
Predictive accuracy measuresThe classification performance is defined by the sensitivity(SN), specificity (SP), false positive ratio (FPR), and falsenegative ratio (FNR) of the model. The sensitivity, alsoknown as true positive rate (TPR), is the percentage of cor-
rect prediction of true sites and specificity is the percent-age of correct prediction of false sites. Specificity is thecorrect prediction of the false sites as defined below:
where, TP, TN, FP, and FN denote the number of true pos-itives, true negatives, false positives, and false negatives(see Table 1) [29]. All the results in this paper refer to thecanonical (GT/AG) splice sites leaving detection of themuch less frequent (0.5–1%) non-canonical splice sites asa feature to be implemented in the future.
ROC analysisReceiver operator curve (ROC) analysis is an effective andwidely used method of assessing the performance of mod-els [29]. It is a graphical representation of sensitivity andspecificity of a classification model. ROC may also be cre-ated from the FPR and FNR of models [3]. When a ROC iscreated from the sensitivity (the y axis) and specificity (thex axis) of a model, the closer a curve follows the left-handborder and then the top of the border of the ROC plot, themore accurate the model [29] (refer to Figure 2, 3, 4 and5). When the ROC is created from the FPR (on the y axis)and FNR (on the x axis) of the model, the closer a curveapproaches the (0,0) point, the more accurate the model(refer to Figure 6 and 7).
Leave one out cross validationA five fold cross validation technique is applied to deter-mine the MM1-SVM splice site prediction accuracy and tocompare the predictive accuracy with other standard pub-lished methods. The cross validation is performed by ran-domly partitioning the data into five independent subsets.Each of the subsets does not share any repeatingsequences. Each model was trained by selecting four of thesubsets (training data) and was tested on the fifth unusedsubset. Finally, we took the average of the five predictionaccuracies as the final prediction measure of the model.
Proper window selectionChen et al., [3] have conducted an extensive study forselecting a proper window size for the acceptor and donorsplice site sequence. Based on the compositional charac-teristics of nucleotides and the presence of consensus inthe sequence, they suggested an optimal length for thedonor and acceptor splice site for the DGSplicer dataset.The study suggests a window from 9 bases upstream to 9
ˆ ( )#
#,P s
s
si i
i ki
i ki
=( )( ) ( )
−
−−1
14
Sensitivity STP
TP FNSpecificity S
TN
TN FPFPR
FP
TN FN P( ) , ( ) ,=+
=+
=+ PP
FNRFN
TP FN⎛⎝⎜
⎞⎠⎟
=+
⎛⎝⎜
⎞⎠⎟
,
Table 1: Definition of TP, TN, FP and FN
Predicted positive predicted negative
real positive true positives, TP false negatives, FNreal negative true negatives, TN false positives, FP
Page 13 of 15(page number not for citation purposes)
BMC Bioinformatics 2006, 7(Suppl 5):S15
bases downstream (i.e.18 nucleotide) for exon/intronboundary best represents the donor splice site, and a win-dow from 27 bases upstream to 9 bases downstream ofthe intron/exon (acceptor) best represents the acceptorsplice site (i.e.36 nucleotides). For the DGSplicer dataset,we used the same acceptor and donor window length assuggested by [3].
ConclusionIn this paper we presented a new method for the identifi-cation of eukaryotic gene splice sites. Unlike many exist-ing methods, our proposed method is simple andeffective. This method can be applied to identify splicesites in a large scale in newly sequenced genomes. Moreo-ver this scheme can also be employed in the identificationof other regulatory motifs in DNA sequences.
AvailabilityCodes used in implementing the present method is freelyavailable for academic use at [51]
Authors' contributionsA. B. provided the conception and design of this study,implementation of the method as well as its analysis. B.C., S. K. H., and J. L. contributed to the design of the studyand the interpretation of the results. All the authors con-tributed to the writing and critically revising the manu-script.
Additional material
AcknowledgementsWe thank the anonymous reviewers for their comments and suggestions. We acknowledge Dr. Chih Wei Hsu for his valuable comments regarding SVM and also for providing the LIBSVM implementation. We thank Profes-sor Chung-Chin for providing the DGSplicer dataset, Dr. Hsu for proof-reading of this manuscript and Dr. Sen Ling Tan for his valuable discussions. This research is partially supported by Australian Research Council (ARC).
This article has been published as part of BMC Bioinformatics Volume 7, Sup-plement 5, 2006: APBioNet – Fifth International Conference on Bioinfor-matics (InCoB2006). The full contents of the supplement are available online at http://www.biomedcentral.com/1471-2105/7?issue=S5.
References1. International Human Genome Sequencing Consortium: Finishing
the euchromatic sequence of the human genome. Nature2004, 431:931-945.
2. Bauren G, Wieslander L: Splicing of Balbiani ring 1 gene pre-mRNA occurs simultaneously with transcription. Cell 1994,76:183-192.
3. Chen T-M, Lu , Chung-Chin , Li , Wen-Hsiung : Prediction of splicesites with dependency graphs and their expanded bayesiannetworks. Bioinformatics 2005, 21(4):471-482.
4. Lander ES, Linton LM, Birren B, Nusbaum C, Zody MC, Baldwin J,Devon K, Dewar K, Doyle M, fitzHugh W: Initial sequencing andanalysis of the human genome. Nature 2001, 409:860-921.
5. Stanke M, Schoffmann O, Morgenstern B, Waack S: Gene predic-tion in eukaryotes with a generalized hidden Markov modelthat uses hints from external sources. BMC Bioinformatics 2006,7:62.
6. Burge C, Karlin S: Prediction of complete gene structure inhuman genomic DNA. Journal of Molecular Biology 1997,268(1):78-94.
7. Burset M, Seledtsov A, Solovyeva VV: Analysis of canonical andnon-canonical splice sites in mammalian genomes. NucleicAcids Research 2000, 28(21):4364-4375.
8. Burge C, Tuschl T, Sharp P: Splicing of Precursors of mRNA bythe Spliceosomes. The RNA World 1999, 2:525-560.
9. Jurica MS, Moore MJ: Pre-mRNA Splicing:Awash in a Sea ofProteins. Molecular Cell 2003, 12:5-14.
10. Rappsilber JA, Ryder U, Lamond AI, Mann M: Large-scale pro-teomic analysis of the human spliceosome. Genome Research2002, 12:1231-1245.
11. Pertea M, Lin X, Salzberg SL: GeneSplicer: a new computationalmethod for splice site prediction. Nucleic Acids Res 2001,29(5):1185-1190.
12. Marashi SA, Eslahchi , Changiz , Pezeshk H, Sadeghi M: Impact ofRNA structure on the prediction of donor andacceptorsplice sites. BMC Bioinformatics 2006, 7:297.
13. Salzberg SL: A method for identifying splice sites and transla-tional start sites in eukaryotic mRNA. Compu Appl Biosci 1997,13(4):365-376.
14. Zhang M, Marr T: A weight array method for splicing signalanalysis. Comput Appl Biosci 1993, 9:499-509.
15. Castelo R, Guigo R: Splice site identification by idlBNs. Bioinfor-matics 2004, 20(Suppl 1):I69-I76.
16. Cai D, Delcher A, Kao B, Kasif S: Modeling splice sites with Bayesnetworks. Bioinformatics 2000, 16(2):152-158.
17. Staden R: The current status and portability of our sequencehandling software. Nucleic Acids Research 1986, 14:217-231.
18. Reese MG, Eeckman F, Kupl D, Haussler D: Improved splice sitedetection in Genie. Journal of Computational Biology 1997,4(3):311-324.
19. Brunak S, Engelbrecht J, Knudsen S: Prediction of mRNA donorand acceptor sites from the DNA sequence. Journal of MolecularBiology 1991, 220:49-65.
20. Hebsgaard SM, korning PG, Tolstrup N, Engelbrecht J, Rouze P, Bru-nak S: Splice site prediction in Arabidopsis Thaliana pre-mRNA by combining local and global sequence information.Nucleic Acids Research 1996, 24:3439-3452.
21. Reese MG: Application of a time-delay neural network to pro-moter annotation in the Drosophila melanogaster genome.Comput chem 2001, 26(1):51-56.
22. Zhang XH-F, Katherine , Heller A, Ilana , Hefter , Christina , Leslie S,Lawrene , Chasin A: Sequence Information for the Splicing ofHuman Pre-mRNA Identified by Support Vector MachineClassification. Genome Research 2003, 13:2637-2650.
23. Sun YF, Fan XD, Li YD: Identifying splicing sites in eukaryoticRNA: Support vector machine approach. Comput Biol Med2003, 33:17-29.
24. Sonnenburg S: New methods for detecting splice junction sitesin DNA sequence. In Master's Thesis Humbold University, Germany;2002.
25. Ratsch G, Sonnenburg S, Schafer C: Learning Interpretable SVMsfor Biological Sequence Classification. BMC Bioinformatics 2006,7(suppl 1):S9.
26. Degroeve S, Saeys Y, Baets BD, Rouze P, Peer YVD: SpliceMachine:predicting splice sites from high-dimensionallocal contextrepresentations. Bioinformatics 2005, 21(8):1332-1338.
Additional File 1Additional file contains two figures showing the performance comparison of SVM with polynomial, linear and RBF kernels in terms of NN269 acceptor and donor dataset. It also contains two tables showing the sensi-tivity and specificity values of different methods.Click here for file[http://www.biomedcentral.com/content/supplementary/1471-2105-7-S5-S15-S1.pdf]
Page 14 of 15(page number not for citation purposes)
http://www.ncbi.nlm.nih.gov/entrez/query.fcgi?cmd=Retrieve&db=PubMed&dopt=Abstract&list_uids=8287477
http://www.ncbi.nlm.nih.gov/entrez/query.fcgi?cmd=Retrieve&db=PubMed&dopt=Abstract&list_uids=8287477
http://www.ncbi.nlm.nih.gov/entrez/query.fcgi?cmd=Retrieve&db=PubMed&dopt=Abstract&list_uids=9149143
http://www.ncbi.nlm.nih.gov/entrez/query.fcgi?cmd=Retrieve&db=PubMed&dopt=Abstract&list_uids=9149143
http://www.ncbi.nlm.nih.gov/entrez/query.fcgi?cmd=Retrieve&db=PubMed&dopt=Abstract&list_uids=8293321
http://www.ncbi.nlm.nih.gov/entrez/query.fcgi?cmd=Retrieve&db=PubMed&dopt=Abstract&list_uids=8293321
http://www.ncbi.nlm.nih.gov/entrez/query.fcgi?cmd=Retrieve&db=PubMed&dopt=Abstract&list_uids=3511446
http://www.ncbi.nlm.nih.gov/entrez/query.fcgi?cmd=Retrieve&db=PubMed&dopt=Abstract&list_uids=3511446
http://www.ncbi.nlm.nih.gov/entrez/query.fcgi?cmd=Retrieve&db=PubMed&dopt=Abstract&list_uids=9278062
http://www.ncbi.nlm.nih.gov/entrez/query.fcgi?cmd=Retrieve&db=PubMed&dopt=Abstract&list_uids=9278062
http://www.ncbi.nlm.nih.gov/entrez/query.fcgi?cmd=Retrieve&db=PubMed&dopt=Abstract&list_uids=2067018
http://www.ncbi.nlm.nih.gov/entrez/query.fcgi?cmd=Retrieve&db=PubMed&dopt=Abstract&list_uids=2067018
http://www.ncbi.nlm.nih.gov/entrez/query.fcgi?cmd=Retrieve&db=PubMed&dopt=Abstract&list_uids=8811101
BMC Bioinformatics 2006, 7(Suppl 5):S15
Publish with BioMed Central and every scientist can read your work free of charge
"BioMed Central will be the most significant development for disseminating the results of biomedical research in our lifetime."
Sir Paul Nurse, Cancer Research UK
Your research papers will be:
available free of charge to the entire biomedical community
peer reviewed and published immediately upon acceptance
cited in PubMed and archived on PubMed Central
yours — you keep the copyright
Submit your manuscript here:http://www.biomedcentral.com/info/publishing_adv.asp
BioMedcentral
27. Chuang JSaR D: Splice site prediction using a sparse networkof winnows. Technical Report, University of Illinois, Urbana-Champaign2001.
28. Zhang M: Identification of protein coding regions in humangenome by quadratic discriminant analysis. Proc of Internationalconference on Genome Informatics 1997, 13:192-200.
29. Yeo G, Burge CB: Maximum Entropy Modeling of ShortSequence Motifs with Applications to RNA Splicing Signals.J Comput Biol 2004, 11(2-3):377-394.
30. Zhang M, Gish W: Improved spliced alignment from an infor-mation theoretic approach. Bioinformatics 2006, 22(1):13-20.
31. Arita M, Tsuda Koji, Asai K: Modeling splicing sites with pairwisecorrelations. Bioinformatics 2002, 18(2):S27-S34.
32. Rajapakse JCaH LS: Markov encoding for detecting signals ingenomic sequences. IEEE/ACM Transactions on Computational Biol-ogy and Bioinformatics 2005, 2(2):131-142.
33. Burge C: Identification of genes in human genomic DNA. PhDThesis, Stanford University 1997.
34. Hua S, Sun Z: A novel method of protein secondary structureprediction with high segment overlap measure: Supportvec-tor machine approach. Journal of molecular biology 2001,308:397-407.
35. B Chang SKH, Tang S: Analysis of SD sequences in completedmicrobial genomes: Non SD-led genes are as common asSD-led genes. Gene: An International Journal on Genes and Evolution2006, 373:90-99.
36. Koggalage R, Halgamuge SK: Reducing the number of trainingsamples for Fast Support Vector Machine Classification.Neural Information Processing Letters and Reviews 2004, 2(3):57-65.
37. Halgamuge SK: Self-evolving neural networks for rule-baseddata processing. IEEE Transactions on Signal Processing 1997,45(11):2766-2773.
38. Bajic VB, Seah SH, Chong A, Krishnan SP, Koh JL, Brusic V: Compu-ter model for recognition of functional transcription startsites in RNA polymerase II promoters of vertebrates. J MolGraph Model 2003, 21(5):323-332.
39. Loi SH, Rajapakse JC: Splice site detection with a higher-orderMarkov model implemented on a Neural network. GenomeInformatics 2003, 14:64-72.
40. Pinkus A: Approximation theory of the MLP model in neuralnetworks. Acta Numerica 1999:143-195.
41. Vapnik v: The nature of statistical learning theory. Springer,New York; 1995.
42. Cristianini N, Shawe-Taylor J: An introduction to support vectormachine and kernel based learning methods. Cambridge Univer-sity press, Cambridge; 2000.
43. Cortes C, Vapnik V: Support vector network, Machine Learn-ing. Machine Learning 1995, 20:273-293.
44. Drucker H, Wu D, Vapnik V: Support vector machines for spamcategorization. IEEE transaction on Neural Networks 1995,10:1054-1084.
45. Genie Dataset [http://www.fruitfly.org/seq_tools/datasets/Human/GENIE_96/]
46. Vacic VILM, Radivojac P: Two Sample Logo: A Graphical Repre-sentation of the Differences between Two Sets of SequenceAlignments. Bioinformatics 2006, 22(12):1536-1537.
47. BDGP Data [http://www.fruitfly.org/sequence/human-datasets.html]
48. DGSplicer Dataset [http://csrl.ee.nthu.edu.tw/bioinf/DGSplicer/DGSplicer.php]
49. Chih-Wei Hsu C-CC, Chih-Jen Lin: LIBSVM: a library for supportvector machines. 2001.
50. LIBSVM [http://www.csie.ntu.edu.tw/~cjlin/libsvm]51. Source [http://www.mame.mu.oz.au/bioinformatics/splicesite/]
Page 15 of 15(page number not for citation purposes)