IBM System Storage N series OnCommand Unified Manager ...
308
IBM System Storage N series OnCommand Unified Manager Operations Manager Administration Guide for Use with Core Package 5.2 GA32-1015-02
-
Upload
khangminh22 -
Category
Documents
-
view
1 -
download
0
Transcript of IBM System Storage N series OnCommand Unified Manager ...
IBM System Storage N series
OnCommand Unified ManagerOperations Manager AdministrationGuide for Use with Core Package 5.2
GA32-1015-02
���


Contents
Preface ......................................................................................................... 17Supported features ..................................................................................................... 17Websites .................................................................................................................... 17Getting information, help, and service ...................................................................... 17Before you call .......................................................................................................... 18Using the documentation ........................................................................................... 18Hardware service and support ................................................................................... 18Firmware updates ...................................................................................................... 18How to send your comments ..................................................................................... 19
Introduction to Operations Manager ....................................................... 20What DataFabric Manager server does ..................................................................... 20What a license key is ................................................................................................. 20Access to Operations Manager .................................................................................. 20Information to customize in the DataFabric Manager server .................................... 21Administrator accounts on the DataFabric Manager server ...................................... 21Authentication methods on the management server ................................................. 22
Authentication with native operating system ................................................ 22Authentication with LDAP ............................................................................ 22
Understanding information relevant to 7-Mode and clusteredenvironments .......................................................................................... 23
7-Mode: List of tasks and information ..................................................... 24Clustered environment: List of tasks and information ........................... 38What the discovery process is .................................................................... 49
Discovery by the DataFabric Manager server ........................................................... 49What SNMP is ........................................................................................................... 49
When to enable SNMP .................................................................................. 49SNMP versions to discover and monitor storage systems ............................ 50What the Preferred SNMP Version option is ................................................ 51How the DataFabric Manager server chooses network credentials for
discovery .................................................................................................. 51Discovery process using SNMPv1 or SNMPv3 ............................................ 52Monitoring process using SNMPv1 .............................................................. 52
Table of Contents | 3
Monitoring process using SNMPv3 .............................................................. 53Setting SNMPv1 or SNMPv3 as the preferred version for storage system
discovery .................................................................................................. 53Setting SNMPv1 as the only SNMP version ................................................. 53Setting SNMPv1 or SNMPv3 to monitor a storage system .......................... 54Modifying the network credentials and SNMP settings ................................ 54Deleting SNMP settings for the network using the Operations Manager
console ..................................................................................................... 55Addition of a storage system from an undiscovered network ....................... 55Diagnosis of SNMP connectivity .................................................................. 55
What host discovery is .............................................................................................. 56Ping methods in host discovery ................................................................................. 56What host-initiated discovery is ................................................................................ 56Discovery of vFiler units (7-Mode environments only) ............................................ 57Discovery of storage systems .................................................................................... 57Discovery of storage systems and networks ............................................................. 58Methods of adding storage systems and networks .................................................... 59
Guidelines for editing discovery options ...................................................... 59Discovery of a cluster by Operations Manager (clustered environments only) ........ 61
Adding clusters (clustered environments only) ............................................. 62Cluster monitoring tasks using Operations Manager (clustered environments
only) ..................................................................................................................... 62Unsupported tasks for cluster monitoring in Operations Manager
(clustered environments only) ................................................................. 62Tasks performed for the gateway SAN-attached storage management in
Operations Manager (7-Mode environments only) ............................................. 63Limitations of the gateway SAN-attached storage management in
Operations Manager (7-Mode environments only) ................................. 63Tasks performed from the Storage Controller Details page for the
gateway (7-Mode environments only) ..................................................... 64Viewing configuration details of storage arrays connected to the
gateway (7-Mode environments only) ..................................................... 64Role-based access control in the DataFabric Manager server ............... 65
What role-based access control does ......................................................................... 65Configuring vFiler unit access control (7-Mode environments only) ....................... 65Logging in to the DataFabric Manager server .......................................................... 66
4 | OnCommand Unified Manager Operations Manager Administration Guide

What default administrator accounts are ....................................................... 66List of predefined roles in the DataFabric Manager server ....................................... 67Active Directory user group accounts ....................................................................... 68Adding administrative users ...................................................................................... 68How roles relate to administrators ............................................................................ 69
What predefined global roles are .................................................................. 69What inheritance roles are ............................................................................. 71What capabilities are ..................................................................................... 72Role precedence and inheritance ................................................................... 72Creating roles ................................................................................................ 72Modifying roles ............................................................................................. 72
What an RBAC resource is ....................................................................................... 73Granting restricted access to RBAC resources ............................................. 73Access restriction on Windows Administrators group users ........................ 74Access check for application administrators ................................................. 75
How reports are viewed for administrators and roles ............................................... 75What global and group access control is ................................................................... 75Management of administrator access ........................................................................ 76
Prerequisites for managing administrator access (7-Mode environmentsonly) ......................................................................................................... 76
Limitations in managing administrator access .............................................. 77User access control for cluster management (clustered environments
only) ......................................................................................................... 77Summary of the global group (7-Mode environments only) ......................... 77Who local users are (7-Mode environments only) ........................................ 77What domain users are (7-Mode environments only) ................................... 83What user groups are (7-Mode environments only) ...................................... 85What roles are (7-Mode environments only) ................................................ 87What jobs display (7-Mode environments only) ........................................... 90
What groups and objects are ..................................................................... 91What group types are ................................................................................................. 91
What homogeneous groups are ..................................................................... 91What mixed-type groups are ......................................................................... 92
What a Global group is .............................................................................................. 92What hierarchical groups are ..................................................................................... 93Creating groups ......................................................................................................... 93
Table of Contents | 5
Creating groups from a report ................................................................................... 94What configuration resource groups are ................................................................... 94Guidelines for creating groups .................................................................................. 95Guidelines for creating configuration resource groups ............................................. 95Guidelines for adding vFiler units to the appliance resource group (7-Mode
environments only) .............................................................................................. 96Editing group membership ........................................................................................ 96What group threshold settings are ............................................................................. 97What group reports are .............................................................................................. 97What summary reports are ........................................................................................ 97What subgroup reports are ........................................................................................ 98What cluster-related objects are (clustered environments only) ............................... 98
Creating a group of cluster objects (clustered environments only) ............. 100Storage monitoring and reporting .......................................................... 101
The DataFabric Manager server monitoring process .............................................. 101Cluster monitoring with Operations Manager (clustered environments only) ........ 103
What the cluster-management LIF is (clustered environments only) ......... 103Information available on the Cluster Details page (clustered
environments only) ................................................................................ 103Viewing the utilization of resources ............................................................ 104
Links to FilerView (7-Mode environments only) ................................................... 105Query intervals ........................................................................................................ 105
Guidelines for changing monitoring intervals ............................................. 106What SNMP trap listener is ..................................................................................... 106
What SNMP trap events are ........................................................................ 106How SNMP trap reports are viewed ........................................................... 107When SNMP traps cannot be received ........................................................ 107SNMP trap listener configuration requirements .......................................... 107How SNMP trap listener is stopped ............................................................ 108Configuration of SNMP trap global options ............................................... 108Information about the DataFabric Manager server MIB ............................. 108
What events are ....................................................................................................... 109Viewing events ............................................................................................ 109Managing events ......................................................................................... 109Operations on local configuration change events ....................................... 109List of events and severity types ................................................................. 110
6 | OnCommand Unified Manager Operations Manager Administration Guide
Alarm configurations ............................................................................................... 134Guidelines for configuring alarms ............................................................... 134Creating alarms ........................................................................................... 134Testing alarms ............................................................................................. 135Comments in alarm notifications ................................................................ 136Example of alarm notification in e-mail format .......................................... 136Example of alarm notification in script format ........................................... 137Example of alarm notification in trap format .............................................. 137Response to alarms ...................................................................................... 137Deleting alarms ........................................................................................... 138
Working with user alerts ......................................................................................... 138What user alerts are ..................................................................................... 138Differences between alarms and user alerts ................................................ 138User alerts configurations ............................................................................ 139How you specify email addresses for alerts ................................................ 139Domains in user quota alerts ....................................................................... 140What the mailmap file is ............................................................................. 140Guidelines for editing the mailmap file ....................................................... 141How the contents of the user alert are viewed ............................................ 141How the contents of the e-mail alert are changed ....................................... 141What the mailformat file is .......................................................................... 141Guidelines for editing the mailformat file ................................................... 142
Introduction to DataFabric Manager server reports ................................................ 143Introduction to report options ...................................................................... 143Introduction to report catalogs .................................................................... 144Custom reports you can create in Operations Manager .............................. 144What performance reports do (7-Mode environments only) ....................... 148Configuring custom reports ......................................................................... 149Deleting custom reports .............................................................................. 150Putting data into spreadsheet format ........................................................... 150What scheduling report generation is .......................................................... 150Methods to schedule a report ...................................................................... 152What Schedules reports are ......................................................................... 154What Saved reports are ............................................................................... 156
Data export in the DataFabric Manager server ....................................................... 158How to access DataFabric Manager server data ......................................... 158
Table of Contents | 7

Where to find the database schema for the views ....................................... 159Data types for export ................................................................................... 159Files and formats for storing exported data ................................................. 160Format for exported the DataFabric Manager server data .......................... 160Format for exported Performance Advisor data (7-Mode environments
only) ....................................................................................................... 161Format for last updated timestamp .............................................................. 161
Security configurations ............................................................................ 163Types of certificates in the DataFabric Manager server ......................................... 163
Self-signed certificates in the DataFabric Manager server ......................... 163Trusted Certificate Authority (CA)-signed certificates in the DataFabric
Manager server ...................................................................................... 163Creating self-signed certificates in the DataFabric Manager server ........... 164Obtaining a trusted CA-signed certificate ................................................... 164Enabling HTTPS ......................................................................................... 165
Secure communications with the DataFabric Manager server ................................ 165How clients communicate with the DataFabric Manager server ................ 165SecureAdmin for secure connection with the DataFabric Manager server
clients ..................................................................................................... 166Requirements for security options ............................................................... 166Guidelines to configure security options in Operations Manager ............... 166
Managed host options .............................................................................................. 167Where to find managed host options ........................................................... 167Guidelines for changing managed host options .......................................... 167Comparison between global and storage system-specific managed host
options ................................................................................................... 168Limitations in managed host options .......................................................... 168
Changing password for storage systems in the DataFabric Manager server ........... 169Changing passwords on multiple storage systems .................................................. 169Issue with modification of passwords for storage systems ..................................... 170Using hosts.equiv to control authentication in the DataFabric Manager server
(7-Mode environments only) ............................................................................. 170Editing HTTP and monitor services to run as different user ................................... 172
User quotas ................................................................................................ 173Why you use quotas ................................................................................................ 173Overview of the quota process ................................................................................ 173
8 | OnCommand Unified Manager Operations Manager Administration Guide

User quota management using Operations Manager ............................................... 173Prerequisites for managing user quotas using Operations Manager ........... 174
Where to find user quota reports in Operations Manager ....................................... 174Monitor interval for user quotas in Operations Manager ............................ 175
Modification of user quotas in Operations Manager ............................................... 175Prerequisites to edit user quotas in Operations Manager ............................ 175Editing user quotas using Operations Manager ........................................... 176
Configuring user settings using Operations Manager ............................................. 176What user quota thresholds are ............................................................................... 176
What the DataFabric Manager server user thresholds are ........................... 177User quota thresholds .................................................................................. 177Ways to configure user quota thresholds in Operations Manager .............. 177Precedence of user quota thresholds in the DataFabric Manager server ..... 177
Management of LUNs, Windows and UNIX hosts, and FCP targets . . 179Management of SAN components .......................................................................... 179SAN and DataFabric Manager Host Agent software (7-Mode environments
only) ................................................................................................................... 180List of tasks you can perform using DataFabric Manager Host Agent software
(7-Mode environments only) ............................................................................. 180List of tasks performed to monitor targets and initiators ........................................ 180
Prerequisites to manage targets and initiators ............................................. 181Prerequisites to manage SAN hosts ............................................................ 181
Reports for monitoring LUNs, FCP targets, and SAN hosts .................................. 182Information available on the LUN Details page ..................................................... 183
Tasks performed from the LUN Details page ............................................. 184Information about the FCP Target Details page ...................................................... 184Information provided in the Host Agent Details page (7-Mode environments
only) ................................................................................................................... 185Tasks you can perform from the Host Agent Details page (7-Mode
environments only) ................................................................................ 185How storage systems, SAN hosts, and LUNs are grouped ..................................... 186
Granting access to storage systems, SAN hosts, and LUNs ....................... 186Introduction to deleting and undeleting SAN components ..................................... 187
Deleting a SAN component ......................................................................... 187How a deleted SAN component delete is restored ...................................... 187
Where to configure monitoring intervals for SAN components ............................. 187
Table of Contents | 9

File system management .......................................................................... 189 Access to storage-related reports ............................................................................ 189Storage capacity thresholds in Operations Manager ............................................... 189
Modification of storage capacity thresholds settings .................................. 189Changing storage capacity threshold settings for global group .................. 190Changing storage capacity threshold settings for an individual group ....... 190Changing storage capacity threshold settings for a specific aggregate,
volume, or qtree ..................................................................................... 190Management of aggregate capacity ......................................................................... 191
Volume space guarantees and aggregate overcommitment ........................ 191Available space on an aggregate ................................................................. 191Considerations before modifying aggregate capacity thresholds ................ 192Aggregate capacity thresholds and their events .......................................... 192
Management of volume capacity ............................................................................ 196Volume capacity thresholds and events ...................................................... 196Normal events for a volume ........................................................................ 201Modification of the thresholds .................................................................... 201
Management of qtree capacity ................................................................................ 201Volume Snapshot copy thresholds and events ............................................ 201Qtree capacity thresholds and events .......................................................... 203
How Operations Manager monitors volumes and qtrees on a vFiler unit (7-Mode environments only) .................................................................................. 204
How Operations Manager monitors qtree quotas ........................................ 205Where to find vFiler storage resource details (7-Mode environments
only) ....................................................................................................... 205What clone volumes are .......................................................................................... 205
Identification of clones and clone parents ................................................... 206Why Snapshot copies are monitored ....................................................................... 206
Snapshot copy monitoring requirements ..................................................... 206Detection of Snapshot copy schedule conflicts ........................................... 206Dependencies of a Snapshot copy ............................................................... 207
What storage chargeback reports are ...................................................................... 207When is data collected for storage chargeback reports ............................... 208Determine the current month’s and the last month’s values for storage
chargeback report .................................................................................. 208Chargeback reports in various formats ........................................................ 208
10 | OnCommand Unified Manager Operations Manager Administration Guide

The chargeback report options ................................................................................ 209Specifying storage chargeback options at the global or group level ........... 210The storage chargeback increment .............................................................. 210Currency display format for storage chargeback ........................................ 210Specification of the annual charge rate for storage chargeback .................. 211Specification of the Day of the Month for Billing for storage chargeback . 211Formatted charge rate for storage chargeback ............................................ 212
What happens when storage objects are deleted ..................................................... 212Reports of deleted storage objects ............................................................... 212Undeleting a storage object for monitoring ................................................. 213
Storage system management ................................................................... 214Management tasks you can perform from Operations Manager ............................. 214Operations Manager components for managing your storage system .................... 214Storage system groups ............................................................................................. 215Custom comment fields in Operations Manager ..................................................... 215Consolidated data and reports for storage systems and vFiler units (7-Mode
environments only) ............................................................................................ 216Tasks performed by using the storage system and vFiler unit report
pages (7-Mode environments only) ....................................................... 216Where to find information about a specific storage system .................................... 217
Tasks performed from a Details page of Operations Manager ................... 217Editable options for storage system or vFiler unit settings ......................... 217What the storage controller tools list is (7-Mode environments only) ........ 218What the cluster tools list is (clustered environments only) ....................... 219What the Diagnose Connectivity tool does ................................................. 219The Refresh Monitoring Samples tool ........................................................ 219The Run a Command tool ........................................................................... 219The Run Telnet tool ..................................................................................... 220Console connection through Telnet ............................................................. 220
Managing HA pairs using the DataFabric Manager server (7-Modeenvironments only) ............................................................................................ 221
Viewing the status of an HA pair by using cluster console (7-Modeenvironments only) ................................................................................ 221
What the takeover tool does (7-Mode environments only) ......................... 221What the giveback tool does (7-Mode environments only) ........................ 222DataFabric Manager server CLI to configure storage systems ................... 223
Table of Contents | 11

Methods for remote configuration of storage systems (7-Mode environmentsonly) ................................................................................................................... 223
Prerequisites for running remote CLI commands from OperationsManager ................................................................................................. 223
Running commands on a specific storage system ....................................... 224Running commands on a group of storage systems from Operations
Manager ................................................................................................. 224Remote configuration of a cluster (clustered environments only) .......................... 224
Running commands on a specific cluster (clustered environments only) ... 225Running commands on a specific node of a cluster (clustered
environments only) ................................................................................ 225Storage system management using FilerView (7-Mode environments only) ......... 226
What FilerView is (7-Mode environments only) ........................................ 226Configuring storage systems by using FilerView (7-Mode environments
only) ....................................................................................................... 226Introduction to MultiStore and vFiler units (7-Mode environments only) ............. 227
Monitoring of vFiler units with the DataFabric Manager server (7-Modeenvironments only) ................................................................................ 227
Prerequisites for monitoring vFiler units (7-Mode environments only) ..... 227vFiler unit management tasks (7-Mode environments only) ...................... 228
Configuration of storage systems (7-Mode environments only) .......... 230Management of storage system configuration files (7-Mode environments only) . 230
Prerequisites to applying configuration files to storage systems andvFiler units (7-Mode environments only) .............................................. 230
List of access roles to manage storage system configuration files (7-Mode environments only) ...................................................................... 231
List of tasks for configuration management (7-Mode environments only)................................................................................................................ 231
What configuration files are (7-Mode environments only) ......................... 232What a configuration plug-in is (7-Mode environments only) ................... 232Comparison of configurations (7-Mode environments only) ...................... 232Verification of a successful configuration push (7-Mode environments
only) ....................................................................................................... 232Configuring the DataFabric Manager server to monitor configuration
changes (7-Mode environments only) ................................................... 232What a configuration resource group is (7-Mode environments only) ................... 233
12 | OnCommand Unified Manager Operations Manager Administration Guide

List of tasks for managing configuration groups (7-Mode environmentsonly) ....................................................................................................... 233
Guidelines for creating configuration groups (7-Mode environmentsonly) ....................................................................................................... 234
Creating configuration resource groups (7-Mode environments only) ....... 234Parent configuration resource groups (7-Mode environments only) .......... 235
Configuring multiple storage systems or vFiler units (7-Mode environmentsonly) ................................................................................................................... 236
Maintenance and management ............................................................... 237Accessing the DataFabric Manager server through the CLI ................................... 237Where to find information about the DataFabric Manager server commands ........ 237Audit logging ........................................................................................................... 238
Events audited in the DataFabric Manager server ...................................... 238Global options for audit log files and their values ...................................... 239Format of events in an audit log file ........................................................... 239Permissions for accessing the audit log file ................................................ 241
What the remote platform management interface is ............................................... 241RLM card monitoring in the DataFabric Manager server ........................... 241Prerequisites for using the remote platform management interface ............ 242
Scripts overview ...................................................................................................... 242Commands that can be used as part of the script ........................................ 242Package of the script content ....................................................................... 243What script plug-ins are .............................................................................. 243What the script plug-in directory is ............................................................. 243What backup scripts do (7-Mode environments only) ................................ 244
Overview of the DataFabric Manager server database backup process .................. 244When to back up data .................................................................................. 244Where to back up data ................................................................................. 245Recommendations for disaster recovery ..................................................... 245Backup storage and sizing ........................................................................... 245Limitations of Snapshot-based backups ...................................................... 245Access requirements for backup operations ................................................ 246Changing the directory path for database backups ...................................... 246Starting database backup from Operations Manager .................................. 246Scheduling database backups from Operations Manager ........................... 247Specifying the backup retention count ........................................................ 247
Table of Contents | 13

Disabling database backup schedules ......................................................... 248Listing database backups ............................................................................. 248Deleting database backups from Operations Manager ................................ 248Displaying diagnostic information from Operations Manager ................... 248Exportability of a backup to a new location ................................................ 249
What the restore process is ...................................................................................... 249Restoring the database from the archive-based backup .............................. 249Restoring the database from the Snapshot copy-based backup ................... 250Restoration of the database on different systems ........................................ 250
Disaster recovery configurations (7-Mode environments only) ............................. 251Disaster recovery using the N series Management Console data
protection capability (7-Mode environments only) ............................... 251Disaster recovery using SnapDrive (7-Mode environments only) .............. 256
Troubleshooting in Operations Manager ............................................... 257AutoSupport in the DataFabric Manager server ..................................................... 257
Reasons for using AutoSupport ................................................................... 257Types of AutoSupport messages in the DataFabric Manager server .......... 257Protection of private data by using AutoSupport ........................................ 258Configuring AutoSupport ............................................................................ 258
DataFabric Manager server logs ............................................................................. 259Access to the DataFabric Manager server logs ........................................... 259Accessing the logs through the DataFabric Manager server CLI ............... 259Apache and Sybase log rotation in the DataFabric Manager server ........... 260
Common DataFabric Manager server problems ..................................................... 260Communication issues between the DataFabric Manager server and
routers .................................................................................................... 260E-mail alerts not working in the DataFabric Manager server ..................... 260
How discovery issues are resolved .......................................................................... 260Use of the Diagnose Connectivity tool for a managed storage system ....... 261Use of the Diagnose Connectivity tool for an unmanaged storage system . 261Where to find the Diagnose Connectivity tool in Operations Manager ...... 261Reasons why the DataFabric Manager server might not discover your
network .................................................................................................. 262Troubleshooting network discovery issues ............................................................. 262Troubleshooting appliance discovery issues with Operations Manager ................. 263How configuration push errors are resolved ........................................................... 263
14 | OnCommand Unified Manager Operations Manager Administration Guide

Issues related to SAN events ................................................................................... 264Offline LUNs ............................................................................................... 264Snapshot copy of LUN not possible ............................................................ 264High traffic in HBA Port ............................................................................. 264
Custom reports do not display any data .................................................................. 265Import and export of configuration files ................................................................. 266How inconsistent configuration states are fixed ..................................................... 266Data ONTAP issues impacting protection on vFiler units (7-Mode
environments only) ............................................................................................ 266Report fields and performance counters (7-Mode environments
only) ...................................................................................................... 268Report fields and performance counters for filer catalogs (7-Mode environments
only) ................................................................................................................... 268Report fields and performance counters for vFiler catalogs (7-Mode
environments only) ............................................................................................ 270Report fields and performance counters for volume catalogs (7-Mode
environments only) ............................................................................................ 271Report fields and performance counters for qtree catalogs (7-Mode
environments only) ............................................................................................ 273Report fields and performance counters for LUN catalogs (7-Mode
environments only) ............................................................................................ 274Report fields and performance counters for aggregate catalogs (7-Mode
environments only) ............................................................................................ 274Report fields and performance counters for disk catalogs (7-Mode environments
only) ................................................................................................................... 275Protocols and port numbers used by the DataFabric Manager server
................................................................................................................ 276DataFabric Manager server communication ........................................................... 276DataFabric Manager server access to storage systems ............................................ 276DataFabric Manager server access to host agents (7-Mode environments only) .... 277DataFabric Manager server access to Open Systems SnapVault agents (7-Mode
environments only) ............................................................................................ 277SAN management ..................................................................................... 278
Discovery of SAN hosts by the DataFabric Manager server (7-Modeenvironments only) ............................................................................................ 278
SAN management using the DataFabric Manager server ....................................... 279
Table of Contents | 15

Prerequisites for SAN management with the DataFabric Manager server . 279List of tasks performed for SAN management ............................................ 280List of user interface locations to perform SAN management tasks ........... 281
Reports for monitoring SANs ................................................................................. 282Location of SAN reports ............................................................................. 282The DataFabric Manager server managed SAN data in spreadsheet
format .................................................................................................... 283Where to find information for specific SAN components .......................... 283Where to view LUN details of SAN components ....................................... 283Tasks performed from the LUN Details page for a SAN host .................... 283Information about FC target on a SAN host ............................................... 284Information about the FC switch on a SAN host ........................................ 285Access to the FC Switch Details page ......................................................... 285Information about FC Switch on a SAN host ............................................. 285Tasks performed from the FC Switch Details page for a SAN host ........... 285Information about DataFabric Manager Host Agent software on a SAN
host (7-Mode environments only) ......................................................... 286Accessing the HBA Port Details page for a SAN host ............................... 286Details about the HBA Port Details page .................................................... 287List of SAN management tasks ................................................................... 287LUN management ....................................................................................... 287Initiator group management ........................................................................ 289FC switch management ............................................................................... 289
DataFabric Manager server options ........................................................................ 289DataFabric Manager server options for SAN management .................................... 289
Where to configure monitoring intervals for SAN components ................. 291Deleting and undeleting SAN components ................................................. 291Reasons for deleting and undeleting SAN components .............................. 291Process of deleting SAN components ......................................................... 291Process of undeleting SAN components ..................................................... 292
How SAN components are grouped ........................................................................ 292Restriction of SAN management access ..................................................... 292Access control on groups of SAN components ........................................... 292
Copyright information ............................................................................. 293Trademark information ........................................................................... 294Index ........................................................................................................... 297
16 | OnCommand Unified Manager Operations Manager Administration Guide

Preface
Supported featuresIBM System Storage N series storage systems are driven by NetApp Data ONTAP software. Somefeatures described in the product software documentation are neither offered nor supported by IBM.Please contact your local IBM representative or reseller for further details.
Information about supported features can also be found on the N series support website (accessed andnavigated as described in Websites on page 17).
WebsitesIBM maintains pages on the World Wide Web where you can get the latest technical information anddownload device drivers and updates. The following web pages provide N series information:
• A listing of currently available N series products and features can be found at the following webpage:www.ibm.com/storage/nas/
• The IBM System Storage N series support website requires users to register in order to obtainaccess to N series support content on the web. To understand how the N series support webcontent is organized and navigated, and to access the N series support website, refer to thefollowing publicly accessible web page:www.ibm.com/storage/support/nseries/This web page also provides links to AutoSupport information as well as other important N seriesproduct resources.
• IBM System Storage N series products attach to a variety of servers and operating systems. Todetermine the latest supported attachments, go to the IBM N series interoperability matrix at thefollowing web page:www.ibm.com/systems/storage/network/interophome.html
• For the latest N series hardware product documentation, including planning, installation andsetup, and hardware monitoring, service and diagnostics, see the IBM N series InformationCenter at the following web page:publib.boulder.ibm.com/infocenter/nasinfo/nseries/index.jsp
Getting information, help, and serviceIf you need help, service, or technical assistance or just want more information about IBM products,you will find a wide variety of sources available from IBM to assist you. This section contains
17
information about where to go for additional information about IBM and IBM products, what to do ifyou experience a problem with your IBM N series product, and whom to call for service, if it isnecessary.
Before you callBefore you call, make sure you have taken these steps to try to solve the problem yourself:
• Check all cables to make sure they are connected.• Check the power switches to make sure the system is turned on.• Use the troubleshooting information in your system documentation and use the diagnostic tools
that come with your system.• Refer to the N series support website (accessed and navigated as described in Websites on page
17) for information on known problems and limitations.
Using the documentationThe latest versions of N series software documentation, including Data ONTAP and other softwareproducts, are available on the N series support website (accessed and navigated as described in Websites on page 17).
Current N series hardware product documentation is shipped with your hardware product in printeddocuments or as PDF files on a documentation CD. For the latest N series hardware productdocumentation PDFs, go to the N series support website.
Hardware documentation, including planning, installation and setup, and hardware monitoring,service, and diagnostics, is also provided in an IBM N series Information Center at the following webpage:
publib.boulder.ibm.com/infocenter/nasinfo/nseries/index.jsp
Hardware service and supportYou can receive hardware service through IBM Integrated Technology Services. Visit the followingweb page for support telephone numbers:
www.ibm.com/planetwide/
Firmware updatesIBM N series product firmware is embedded in Data ONTAP. As with all devices, ensure that yourun the latest level of firmware. Any firmware updates are posted to the N series support website(accessed and navigated as described in Websites on page 17).
18 | OnCommand Unified Manager Operations Manager Administration Guide

Note: If you do not see new firmware updates on the N series support website, you are running thelatest level of firmware.
Verify that the latest level of firmware is installed on your machine before contacting IBM fortechnical support.
How to send your commentsYour feedback helps us to provide the most accurate and high-quality information. If you havecomments or suggestions for improving this document, please send them by email to [email protected].
Be sure to include the following:
• Exact publication title• Publication form number (for example, GC26-1234-02)• Page, table, or illustration numbers• A detailed description of any information that should be changed
Preface | 19
Introduction to Operations ManagerOperations Manager is a Web-based UI of the DataFabric Manager server.
You can use Operations Manager for the following day-to-day activities on storage systems:
• Discover storage systems• Monitor the device or the object health, the capacity utilization, and the performance
characteristics of a storage system• View or export reports• Configure alerts and thresholds for event managements• Group devices, vFiler units, host agents, volumes, qtrees, and LUNs• Run Data ONTAP CLI commands simultaneously on multiple systems• Configure role-based access control (RBAC)• Manage host users, user groups, domain users, local users, and host roles
Note: DataFabric Manager server 3.8 and later supports not only IPv4, but also IPv6.
What DataFabric Manager server doesThe DataFabric Manager server provides infrastructure services such as discovery, monitoring, role-based access control (RBAC), auditing, and logging for products in the Storage and Data suites.
You can script commands using the command-line interface (CLI) of the DataFabric Manager serversoftware that runs on a separate server. The software does not run on the storage systems.
What a license key isTo use the DataFabric Manager server, you must enable the OnCommand Core Package license byusing the license key. The license key is a character string that is supplied by IBM.
If you are installing the software for the first time, you enter the license key during installation. Youcan enter the license key in the Options window under Licensed Features. You must enableadditional licenses to use other features, such as disaster recovery and backup.
Access to Operations ManagerYou can access Operations Manager and the CLI from the IP address or Domain Name System(DNS) name of the DataFabric Manager server.
After successfully installing the DataFabric Manager server software, the DataFabric Manager serverstarts discovering, monitoring, collecting, and saving information about objects in its database.
20 | OnCommand Unified Manager Operations Manager Administration Guide
Objects are entities such as storage systems; vFiler units, disks, aggregates, volumes, and qtrees onthese storage systems; LUNs; and user quotas.
If the server is on Windows, Operations Manager is launched automatically and a welcome pageappears.
You can use one of the following URLs to access Operations Manager:
• http://server_ip_address:8080/dfm• http://server_dnsname:8080
Depending on your DNS setup, you might have to use the fully qualified name in this URL; forexample, you should use tampa.florida.com instead of tampa.
Information to customize in the DataFabric Manager serverYou can use the DataFabric Manager server to configure storage system IP addresses or names,administrator access control, and alarms, set up SNMP communities and administrator accounts andcreate groups.
DataFabric Manager server 3.8 and later supports IPv6 along with IPv4. However, the followingDataFabric Manager server features lack IPv6 support:
• LUN management• Snapshot-based backups (because SnapDrive for Windows and SnapDrive for UNIX do not
support IPv6 addressing)• Disaster recovery• High Availability (HA) over Veritas Cluster Servers (VCS)• "hosts.equiv" file based authentication• APIs over HTTPS do not work for storage systems managed using IPv6 addresses, when the
option httpd.admin.access is set to a value other than legacy.• Discovery of storage systems and host agents that exist on remote network• Protocols such as RSH and SSH do not support IPv6 link local address to connect to storage
systems and host agents.
Note: Link local address works with SNMP and ICMP only.
Administrator accounts on the DataFabric Manager serverYou can use Operations Manager to set up administrator accounts on the DataFabric Manager server.You can grant capabilities such as read, write, delete, backup, restore, distribution, and full control toadministrators.
The DataFabric Manager server software provides the following two different administratoraccounts:
• Administrator—grants full access for the administrator who installed the software
Introduction to Operations Manager | 21

• Everyone—allows users to have read-only access without logging in
Related concepts
How roles relate to administrators on page 69
Authentication methods on the management serverThe management server uses the information available in the native operating system forauthentication. The server does not maintain its own database of the administrator names and thepasswords.
You can also configure the management server to use Lightweight Directory Access Protocol(LDAP). If you configure LDAP, then the server uses it as the preferred method of authentication.
Despite the authentication method used, the server maintains its own database of user names andpasswords for local users. (A local user might or might not be an administrator). For local users, theserver does not use the native operating system for authentication; it performs authentication itself.
Authentication with native operating systemYou do not need to configure any options to enable the DataFabric Manager server to use the nativeoperating system for authentication.
Based on the native operating system, the DataFabric Manager server application supports thefollowing authentication methods:
• For Windows: local and domain authentication• For UNIX: local password files, and NIS or NIS+
Note: Ensure that the administrator name you are adding matches the user name specified in thenative operating system.
Authentication with LDAPYou can enable LDAP authentication on the management server and configure the managementserver to communicate with your LDAP servers to retrieve information about LDAP users.
The management server provides predefined templates for the most common LDAP server types.These templates provide predefined LDAP settings that make the management server compatiblewith your LDAP server.
The following LDAP servers are compatible with the management server:
• Microsoft Active Directory• OpenLDAP• IBM Lotus LDAP• Netscape LDAP Server
22 | OnCommand Unified Manager Operations Manager Administration Guide

Understanding information relevant to 7-Modeand clustered environments
Because OnCommand Unified Manager supports both clustered Data ONTAP and 7-Modeenvironments, it is important to identify the information that is relevant to you.
The following labeling guidelines can help you to better understand the content that is provided inthe OnCommand Unified Manager documentation:
• (7-Mode environments only)Topic titles or information within a topic include this label when the topic or information isapplicable to 7-Mode environments only. For example, the title Adding storage systems (7-Modeenvironments only) indicates that this task is relevant for 7-Mode environments only.
• (clustered environments only)Topic titles or information within a topic include this label when the topic or information isapplicable to the clustered environment only. For example, the title Adding clusters (clusteredenvironments only) indicates that this task is relevant for the clustered environment only.
• No mode labels in titlesTopics that apply to both 7-Mode and clustered environments do not include any labels in thetitle. For example, the topic Creating alarms for events provides information that is relevant toboth 7-Mode and clustered environments.
• No mode labels in topic informationInformation within a topic that applies to both 7-Mode and clustered environments does notinclude any labels.
The documentation includes the following topics to help you navigate to the specific information thatyou want:
• Each section in the Help includes two topics that provide links to information in that section ofthe Help, which is relevant to each mode.
• Each product manual includes two topics that provide links to information throughout the manual,which is relevant to each mode.
23

7-Mode: List of tasks and informationOnCommand Unified Manager supports both 7-Mode and clustered environments; therefore, it isimportant to identify the information that relates specifically to your 7-Mode environment.
The following list provides links to all tasks and information related to Operations Manageradministration in a 7-Mode environment:
Operations Manager
• Introduction to Operations Manager on page 20• What DataFabric Manager server does on page 20• What a license key is on page 20• Access to Operations Manager on page 20• Information to customize in the DataFabric Manager server on page 21• Administrator accounts on the DataFabric Manager server on page 21• Authentication methods on the DataFabric Manager server on page 22• Authentication with native operating system on page 22• Authentication with LDAP on page 22
Discovery
• What the discovery process is on page 49• Discovery by the DataFabric Manager server on page 49• What SNMP is on page 49• When to enable SNMP on page 49• SNMP versions to discover and monitor storage systems on page 50• What the Preferred SNMP Version option is on page 51• SNMP version setup on page 51• How DataFabric Manager chooses network credentials for discovery on page 51• Discovery process using SNMPv1 or SNMPv3 on page 52• Monitoring process using SNMPv1 on page 52• Monitoring process using SNMPv3 on page 53• Setting SNMPv1 or SNMPv3 as the preferred version on page 53• Setting SNMPv1 as the only SNMP version on page 53• Setting SNMPv1 or SNMPv3 to monitor a storage system on page 54• Modifying the network credentials and SNMP settings on page 54• Deleting the SNMP settings for the network on page 55• Addition of a storage system from an undiscovered network on page 55• Diagnosis of SNMP connectivity on page 55• What host discovery is on page 56
24 | OnCommand Unified Manager Operations Manager Administration Guide

• Ping methods in host discovery on page 56• What host-initiated discovery is on page 56• Discovery of vFiler units on page 57• Discovery of storage systems on page 57• Discovery of storage systems and networks on page 58• Methods of adding storage systems and networks on page 59• Guidelines for editing discovery options on page 59• Tasks performed for the gateway SAN-attached storage management on page 63• Limitations of the gateway SAN-attached storage management in Operations Manager on page
63• Tasks performed from the Storage Controller Details page for the gateway on page 64• Viewing configuration details of storage arrays connected to the gateway on page 64
Role-based access control (RBAC)
• Role-based access control in the DataFabric Manager server on page 65• What role-based access control does on page 65• Configuring vFiler unit access control on page 65• Logging in to the DataFabric Manager server on page 66• What default administrator accounts are on page 66• List of predefined roles in the DataFabric Manager server on page 67• Active Directory user group accounts on page 68• Adding administrative users on page 68• How roles relate to administrators on page 69• What predefined global roles are on page 69• What inheritance roles are on page 71• What capabilities are on page 72• Role precedence and inheritance on page 72• Creating roles on page 72• Modifying roles on page 72• What an RBAC resource is on page 73• Granting restricted access to RBAC resources on page 73• Access restriction on Windows Administrators group users on page 74• Access check for application administrators on page 75• How reports are viewed for administrators and roles on page 75• What a global and group access control is on page 75• Management of administrator access on page 76• Prerequisites for managing administrator access on page 76• Limitations in managing administrator access on page 77• Summary of the global group on page 77• Viewing a specific summary page on page 77
7-Mode: List of tasks and information | 25

• Viewing users on the host on page 77• Who local users are on page 77• Viewing local users on the host on page 78• Viewing local user settings on the host on page 78• Adding local users to the host on page 79• Editing local user settings on the host on page 80• Users with Execute capability on page 80• Pushing passwords to a local user on page 80• Deleting local users from the host on page 81• Pushing local users to hosts on page 82• Monitoring changes in local user configuration on page 82• Editing passwords on page 82• What domain users are on page 83• Viewing domain users on the host on page 83• Adding domain users to the host on page 83• Viewing domain user settings on the host on page 83• Editing domain user settings on the host on page 84• Removing domain users from all the user groups on page 84• Pushing domain users to hosts on page 84• Monitoring changes in domain user configuration on page 85• What User groups are on page 85• Viewing user groups on the host on page 85• Adding user groups to a host on page 85• Viewing the user group settings on a host on page 86• Editing user group settings on a host on page 86• Deleting user groups from a host on page 87• Pushing user groups to hosts on page 87• Monitoring changes in user group configuration on page 87• What roles are on page 87• Viewing roles on the host on page 87• Adding roles to a host or user on page 88• Viewing role settings on the host on page 88• Editing role settings on the host on page 89• Deleting roles from the host on page 89• Pushing roles to the hosts on page 89• Monitoring changes in role configuration on page 90• What jobs display on page 90• Pushing jobs on page 90• Deleting push jobs on page 90
26 | OnCommand Unified Manager Operations Manager Administration Guide

Groups and objects
• What groups and objects are on page 91• What group types are on page 91• What homogeneous groups are on page 91• What mixed-type groups are on page 92• What a Global group is on page 92• What hierarchical groups are on page 93• Creating groups on page 93• Creating groups from a report on page 94• What configuration resource groups are on page 94• Guidelines for creating groups on page 95• Guidelines for creating configuration resource groups on page 95• Guidelines for adding vFiler units to the appliance resource group on page 96• Editing group membership on page 96• What group threshold settings are on page 97• What group reports are on page 97• What summary reports are on page 97• What subgroup reports are on page 98
Storage monitoring and reporting
• Storage monitoring and reporting on page 101• The DataFabric Manager server monitoring process on page 101• Viewing utilization of resources on page 104• Viewing the utilization of physical resources on page 105• Links to FilerView on page 105• Query intervals on page 105• Guidelines for changing monitoring intervals on page 106• What SNMP trap listener is on page 106• What SNMP trap events are on page 106• How SNMP trap reports are viewed on page 107• When SNMP traps cannot be received on page 107• SNMP trap listener configuration requirements on page 107• How SNMP trap listener is stopped on page 108• Configuration of SNMP trap global options on page 108• Information about the DataFabric Manager server MIB on page 108• What events are on page 109• Viewing events on page 109• Managing events on page 109• Operations on local configuration change events on page 109• List of events and severity types on page 110
7-Mode: List of tasks and information | 27

• Alarm configurations on page 134• Guidelines for configuring alarms on page 134• Creating alarms on page 134• Testing alarms on page 135• Comments in alarm notifications on page 136• Example of alarm notification in e-mail format on page 136• Example of alarm notification in script format on page 137• Example of alarm notification in trap format on page 137• Response to alarms on page 137• Deleting alarms on page 138• Working with user alerts on page 138• What user alerts are on page 138• Differences between alarms and user alerts on page 138• User alerts configurations on page 139• E-mail addresses for alerts on page 139• Domains in user quota alerts on page 140• What the mailmap file is on page 140• Guidelines for editing the mailmap file on page 141• How the contents of the user alert are viewed on page 141• How the contents of the e-mail alert are changed on page 141• What the mailformat file is on page 141• Guidelines for editing the mailformat file on page 142• Introduction to DataFabric Manager server reports on page 143• Introduction to report options on page 143• Introduction to report catalogs on page 144• Reports you can create in Operations Manager on page 144• What performance reports are on page 148• Configuring custom reports on page 149• Deleting custom reports on page 150• Putting data into spreadsheet format on page 150• What scheduling report generation is on page 150• What Report Archival Directory is on page 151• Additional capabilities for categories of reports on page 151• What Report Schedules reports are on page 151• Scheduling a report using the All submenu on page 151• Scheduling a report using the Schedule submenu on page 152• Methods to schedule a report on page 152• Editing a report schedule on page 152• Deleting a report schedule on page 153• Enabling a report schedule on page 153
28 | OnCommand Unified Manager Operations Manager Administration Guide

• Disabling a report schedule on page 153• Running a report schedule on page 153• Retrieving the list of enabled report schedules on page 154• Retrieving the list of disabled report schedules on page 154• Listing all the run results of a report schedule on page 154• What Schedules reports are on page 154• Listing all the schedules on page 154• Adding a new schedule on page 155• Editing a schedule on page 155• Deleting a schedule on page 155• What Saved reports are on page 156• Listing the report outputs on page 156• Listing the successful report outputs on page 156• Listing the failed report outputs on page 156• Viewing the output of report outputs from the status column on page 157• Viewing the output of report outputs from the Output ID column on page 157• Viewing the output details of a particular report output on page 157• Data export in the DataFabric Manager server on page 158• How to access DataFabric Manager server data on page 158• Where to find the database schema for the views on page 159• Data types for export on page 159• Files and formats for storing exported data on page 160• Format for exported DataFabric Manager data on page 160• Format for exported Performance Advisor data on page 161• Format for last updated timestamp on page 161
Security configurations
• Security configurations on page 163• Types of certificates in the DataFabric Manager server on page 163• Self-signed certificates in the DataFabric Manager server on page 163• Trusted Certificate Authority (CA)-signed certificates in the DataFabric Manager server on page
163• Creating self-signed certificates in DataFabric Manager on page 164• Obtaining a trusted CA-signed certificate on page 164• Enabling HTTPS on page 165• Secure communications with the DataFabric Manager server on page 165• How clients communicate with the DataFabric Manager server on page 165• SecureAdmin for secure connection with the DataFabric Manager server clients on page 166• Requirements for security options on page 166• Guidelines to configure security options in Operations Manager on page 166
7-Mode: List of tasks and information | 29

• Managed host options on page 167• Where to find managed host options on page 167• Guidelines for changing managed host options on page 167• Comparison between global and storage system-specific managed host options on page 168• Limitations in managed host options on page 168• Changing password for storage systems in the DataFabric Manager server on page 169• Changing passwords on multiple storage systems on page 169• Issue with modification of passwords for storage systems on page 170• Using hosts.equiv to control authentication in the DataFabric Manager server on page 170• Editing HTTP and monitor services to run as different user on page 172
User quotas
• User quotas on page 173• Why you use quotas on page 173• Overview of the quota process on page 173• User quota management using Operations Manager on page 173• Prerequisites for managing user quotas using Operations Manager on page 174• Where to find user quota reports in Operations Manager on page 174• Monitor interval for user quotas in Operations Manager on page 175• Modification of user quotas in Operations Manager on page 175• Prerequisites to edit user quotas in Operations Manager on page 175• Editing user quotas using Operations Manager on page 176• Configuring user settings using Operations Manager on page 176• What user quota thresholds are on page 176• What the DataFabric Manager server user thresholds are on page 177• User quota thresholds on page 177• Ways to configure user quota thresholds in Operations Manager on page 177• Precedence of user quota thresholds in the DataFabric Manager server on page 177
Management of LUNs, FCP Targets, and SAN hosts
• Management of LUNs, Windows and UNIX hosts, and FCP targets on page 179• Management of SAN components on page 179• SAN and Host Agent software on page 180• List of tasks you can perform using Host Agent software on page 180• List of tasks performed to monitor targets and initiators on page 180• Prerequisites to manage targets and initiators on page 181• Prerequisites to manage SAN hosts on page 181• Reports for monitoring LUNs, FCP targets, and SAN hosts on page 182• Information available on the LUN Details page on page 183• Tasks performed on the LUN Details page on page 184
30 | OnCommand Unified Manager Operations Manager Administration Guide

• Information about the FCP Target Details page on page 184• Information about the Host Agent Details page on page 185• Tasks you can perform from the Host Agent Details page on page 185• How storage systems, SAN hosts, and LUNs are grouped on page 186• Granting access to storage systems, SAN hosts, and LUNs on page 186• Introduction to deleting and undeleting SAN components on page 187• Deleting a SAN component on page 187• How a deleted SAN component delete is restored on page 187• Where to configure monitoring intervals for SAN components on page 187
File system management
• File system management on page 189• Access to storage-related reports on page 189• Storage capacity thresholds in Operations Manager on page 189• Modification of storage capacity thresholds settings on page 189• Changing storage capacity threshold settings for global group on page 190• Changing storage capacity threshold settings for an individual group on page 190• Changing storage capacity threshold settings for a specific aggregate, volume, or qtree on page
190• Management of aggregate capacity on page 191• Volume space guarantees and aggregate overcommitment on page 191• Available space on an aggregate on page 191• Considerations before modifying aggregate capacity thresholds on page 192• Aggregate capacity thresholds and their events on page 192• Management of volume capacity on page 196• Volume capacity thresholds and events on page 196• Normal events for a volume on page 201• Modification of the thresholds on page 201• Management of qtree capacity on page 201• Volume Snapshot copy thresholds and events on page 201• Qtree capacity thresholds and events on page 203• How Operations Manager monitors volumes and qtrees on a vFiler unit on page 204• How Operations Manager monitors qtree quotas on page 205• Where to find vFiler storage resource details on page 205• What clone volumes are on page 205• Identification of clones and clone parents on page 206• Why Snapshot copies are monitored on page 206• Snapshot copy monitoring requirements on page 206• Detection of Snapshot copy schedule conflicts on page 206• Dependencies of a Snapshot copy on page 207
7-Mode: List of tasks and information | 31

• Thresholds on Snapshot copies on page 207• Storage chargeback reports on page 207• When is data collected for storage chargeback reports on page 208• Determine the current month’s and the last month’s values for storage chargeback report on page
208• Chargeback reports in various formats on page 208• The chargeback report options on page 209• Specifying storage chargeback options at the global or group level on page 210• The storage chargeback increment on page 210• Currency display format for storage chargeback on page 210• Specification of the annual charge rate for storage chargeback on page 211• Specification of the Day of the Month for Billing for storage chargeback on page 211• Formatted charge rate for storage chargeback on page 212• What happens when storage objects are deleted on page 212• Reports of deleted storage objects on page 212• Undeleting a storage object for monitoring on page 213
Storage system management
• Storage system management on page 214• Management tasks you can perform from Operations Manager on page 214• Operations Manager components for managing your storage system on page 214• Storage system groups on page 215• Custom comment fields in Operations Manager on page 215• Consolidated data and reports for storage systems and vFiler units on page 216• Tasks performed by using the storage systems and vFiler unit report pages on page 216• Where to find information about a specific storage system on page 217• Tasks performed from a Details page of Operations Manager on page 217• Editable options for storage system or vFiler unit settings on page 217• What the storage controller tools list is on page 218• What the Diagnose Connectivity tool does on page 219• The Refresh Monitoring Samples tool on page 219• The Run a Command tool on page 219• The Run Telnet tool on page 220• Console connection through Telnet on page 220• Managing HA pairs using the DataFabric Manager server on page 221• Viewing the status of an HA pair by using cluster console on page 221• What the takeover tool does on page 221• What the giveback tool does on page 222• DataFabric Manager server CLI to configure storage systems on page 223• Methods for remote configuration of storage systems on page 223
32 | OnCommand Unified Manager Operations Manager Administration Guide
• Prerequisites for running remote CLI commands from Operations Manager on page 223• Running commands on a specific storage system on page 224• Running commands on a group of storage systems from Operations Manager on page 224• Storage system management using FilerView on page 226• What FilerView is on page 226• Configuring storage systems by using FilerView on page 226• Introduction to MultiStore and vFiler units on page 227• Monitoring of vFiler units with the DataFabric Manager server on page 227• Prerequisites for monitoring vFiler units on page 227• vFiler unit management tasks on page 228
Configuration management of storage systems
• Configuration of storage systems on page 230• Management of storage system configuration files on page 230• Prerequisites to applying configuration files to storage systems and vFiler units on page 230• List of access roles to manage storage system configuration files on page 231• List of tasks for configuration management on page 231• What configuration files are on page 232• What a configuration plug-in is on page 232• Comparison of configurations on page 232• Verification of a successful configuration push on page 232• Configuring the DataFabric Manager server to monitor configuration changes on page 232• What a configuration resource group is on page 233• List of tasks for managing configuration groups on page 233• Guidelines for creating configuration groups on page 234• Creating configuration resource groups on page 234• Parent configuration resource groups on page 235• Parent group guidelines on page 235• When to assign parent groups on page 235• Properties of configuration files acquired from a parent on page 235• Configuring multiple storage systems or vFiler units on page 236
Maintenance and management
• Maintenance and management on page 237• Accessing the CLI on page 237• Where to find information about the DataFabric Manager server commands on page 237• Audit logging on page 238• Events audited in DataFabric Manager on page 238• Global options for audit log files and their values on page 239• Format of events in an audit log file on page 239
7-Mode: List of tasks and information | 33

• Permissions for accessing the audit log file on page 241• What remote platform management interface is on page 241• RLM card monitoring in the DataFabric Manager server on page 241• Prerequisites for using the remote platform management interface on page 242• Scripts overview on page 242• Commands that can be used as part of the script on page 242• Package of the script content on page 243• What script plug-ins are on page 243• What the script plug-in directory is on page 243• What backup scripts do on page 244• Overview of the DataFabric Manager database backup process on page 244• When to back up data on page 244• Where to back up data on page 245• Recommendations for disaster recovery on page 245• Backup storage and sizing on page 245• Limitation of Snapshot-based backups on page 245• Access requirements for backup operations on page 246• Changing the directory path for database backups on page 246• Starting database backup from Operations Manager on page 246• Scheduling database backups from Operations Manager on page 247• Specifying the backup retention count on page 247• Disabling database backup schedules on page 248• Listing database backups on page 248• Deleting database backups from Operations Manager on page 248• Displaying diagnostic information from Operations Manager on page 248• Exportability of a backup to a new location on page 249• What the restore process is on page 249• Restoring the database from the archive-based backup on page 249• Restoring the database from the Snapshot copy-based backup on page 250• Restoration of the database on different systems on page 250• Disaster recovery configurations on page 251• Disaster recovery using the Management Console data protection capability on page 251• Limitation of disaster recovery support on page 251• Prerequisites for disaster recovery support on page 251• Setting up the DataFabric Manager server on page 252• Recovering the DataFabric Manager server services on page 253• Recovering the DataFabric Manager server services using the dfm datastore mirror connect
command on page 254• Failing back DataFabric Manager server services on page 255• Disaster recovery using SnapDrive on page 256
34 | OnCommand Unified Manager Operations Manager Administration Guide

Troubleshooting
• Troubleshooting in Operations Manager on page 257• AutoSupport in the DataFabric Manager server on page 257• Reasons for using AutoSupport on page 257• Types of AutoSupport messages in the DataFabric Manager server on page 257• Protection of private data by using AutoSupport on page 258• Configuring AutoSupport on page 258• DataFabric Manager server logs on page 259• Access to logs on page 259• Accessing the logs through the DataFabric Manager server CLI on page 259• Apache and Sybase log rotation in DataFabric Manager server on page 260• Common DataFabric Manager server problems on page 260• Communication issues between the DataFabric Manager server and routers on page 260• E-mail alerts not working in the DataFabric Manager server on page 260• How discovery issues are resolved on page 260• Use of the Diagnose Connectivity tool for a managed storage system on page 261• Use of the Diagnose Connectivity tool for an unmanaged storage system on page 261• Where to find the Diagnose Connectivity tool in Operations Manager on page 261• Reasons why the DataFabric Manager server might not discover your network on page 262• Troubleshooting network discovery issues on page 262• Troubleshooting appliance discovery issues with Operations Manager on page 263• How configuration push errors are resolved on page 263• Issues related to SAN events on page 264• Offline LUNs on page 264• Snapshot copy of LUN not possible on page 264• High traffic in HBA Port on page 264• Custom reports do not display any data on page 265• Import and export of configuration files on page 266• How inconsistent configuration states are fixed on page 266• Data ONTAP issues impacting protection on vFiler units on page 266
Report fields and performance counters
• Report fields and performance counters on page 268• Report fields and performance counters for filer catalogs on page 268• Report fields and performance counters for vFiler catalogs on page 270• Report fields and performance counters for volume catalogs on page 271• Report fields and performance counters for qtree catalogs on page 273• Report fields and performance counters for LUN catalogs on page 274• Report fields and performance counters for aggregate catalogs on page 274• Report fields and performance counters for disk catalogs on page 275
7-Mode: List of tasks and information | 35

Protocols and port numbers
• Protocols and port numbers used by the DataFabric Manager server on page 276• DataFabric Manager server communication on page 276• DataFabric Manager server access to storage systems on page 276• DataFabric Manager server access to host agents on page 277• DataFabric Manager server access to Open Systems SnapVault agents on page 277
SAN management
• SAN management on page 278• Discovery of SAN hosts by the DataFabric Manager server on page 278• SAN management using the DataFabric Manager server on page 279• Prerequisites for SAN management with the DataFabric Manager server on page 279• List of tasks performed for SAN management on page 280• List of user interface locations to perform SAN management tasks on page 281• Reports for monitoring SANs on page 282• Location of SAN reports on page 282• DataFabric Manager server managed SAN data in spreadsheet format on page 283• Where to find information for specific SAN components on page 283• Where to view LUN details of SAN components on page 283• Tasks performed from the LUN Details page for a SAN host on page 283• Information about FC target on a SAN host on page 284• Information about the FC switch on a SAN host on page 285• Access to the FC Switch Details page on page 285• Information about FC Switch on a SAN host on page 285• Tasks performed from the FC Switch Details page for a SAN host on page 285• Information about Host Agent software on a SAN host on page 286• Accessing the HBA Port Details page access for a SAN host on page 286• Details about the HBA Port Details page on page 287• List of SAN management tasks on page 287• LUN management on page 287• Initiator group management on page 289• FC switch management on page 289• DataFabric Manager server options on page 289• DataFabric Manager options for SAN management on page 289• Where to configure monitoring intervals for SAN components on page 291• Deleting and undeleting SAN components on page 291• Reasons for deleting and undeleting SAN components on page 291• Process of deleting SAN components on page 291• Process of undeleting SAN components on page 292• How SAN components are grouped on page 292
36 | OnCommand Unified Manager Operations Manager Administration Guide

• Restriction of SAN management access on page 292• Access control on groups of SAN components on page 292
7-Mode: List of tasks and information | 37

Clustered environment: List of tasks andinformation
Because Unified Manager supports both 7-Mode and clustered environments, it is important toidentify the information that relates specifically to your clustered environment.
The following list provides links to all tasks and information related to Operations Manageradministration in clustered environments:
Operations Manager
• Introduction to Operations Manager on page 20• What DataFabric Manager server does on page 20• What a license key is on page 20• Access to Operations Manager on page 20• Information to customize in the DataFabric Manager server on page 21• Administrator accounts on the DataFabric Manager server on page 21• Authentication methods on the DataFabric Manager server on page 22• Authentication with native operating system on page 22• Authentication with LDAP on page 22
Discovery
• What the discovery process is on page 49• Discovery by the DataFabric Manager server on page 49• What SNMP is on page 49• When to enable SNMP on page 49• SNMP versions to discover and monitor storage systems on page 50• What the Preferred SNMP Version option is on page 51• SNMP version setup on page 51• How DataFabric Manager chooses network credentials for discovery on page 51• Discovery process using SNMPv1 or SNMPv3 on page 52• Monitoring process using SNMPv1 on page 52• Monitoring process using SNMPv3 on page 53• Setting SNMPv1 or SNMPv3 as the preferred version on page 53• Setting SNMPv1 as the only SNMP version on page 53• Setting SNMPv1 or SNMPv3 to monitor a storage system on page 54• Modifying the network credentials and SNMP settings on page 54• Deleting the SNMP settings for the network on page 55• Addition of a storage system from an undiscovered network on page 55
38 | OnCommand Unified Manager Operations Manager Administration Guide

• Diagnosis of SNMP connectivity on page 55• What host discovery is on page 56• Ping methods in host discovery on page 56• What host-initiated discovery is on page 56• Discovery of storage systems on page 57• Discovery of storage systems and networks on page 57• Methods of adding storage systems and networks on page 59• Guidelines for editing discovery options on page 59• Discovery of a cluster by Operations Manager on page 61• Adding clusters on page 62• Cluster monitoring tasks using Operations Manager on page 62• Unsupported tasks for cluster monitoring in Operations Manager on page 62
Role-based access control (RBAC)
• Role-based access control in the DataFabric Manager server on page 65• What role-based access control does on page 65• Logging in to the DataFabric Manager server on page 66• What default administrator accounts are on page 66• List of predefined roles in the DataFabric Manager server on page 67• Active Directory user group accounts on page 68• Adding administrative users on page 68• How roles relate to administrators on page 69• What predefined global roles are on page 69• What inheritance roles are on page 71• What capabilities are on page 72• Role precedence and inheritance on page 72• Creating roles on page 72• Modifying roles on page 72• What an RBAC resource is on page 73• Granting restricted access to RBAC resources on page 73• Access restriction on Windows Administrators group users on page 74• Access check for application administrators on page 75• How reports are viewed for administrators and roles on page 75• What a global and group access control is on page 75• Management of administrator access on page 76• Prerequisites for managing administrator access on page 76• Limitations in managing administrator access on page 77• Controlled access to cluster management on page 77
Clustered environment: List of tasks and information | 39

Groups and objects
• What groups and objects are on page 91• What group types are on page 91• What homogeneous groups are on page 91• What mixed-type groups are on page 92• What a Global group is on page 92• What hierarchical groups are on page 93• Creating groups on page 93• Creating groups from a report on page 94• What configuration resource groups are on page 94• Guidelines for creating groups on page 95• Guidelines for creating configuration resource groups on page 95• Editing group membership on page 96• What group threshold settings are on page 97• What group reports are on page 97• What summary reports are on page 97• What subgroup reports are on page 98• What cluster-related objects are on page 98• Creating a group of cluster objects on page 100
Storage monitoring and reporting
• Storage monitoring and reporting on page 101• The DataFabric Manager server monitoring process on page 101• Cluster monitoring with Operations Manager on page 103• What the cluster-management LIF is on page 103• Information available on the Cluster Details page on page 103• Tasks performed from the Cluster Details page on page 104• Viewing utilization of resources on page 104• Viewing the utilization of logical resources on page 104• Viewing the utilization of physical resources on page 105• Query intervals on page 105• Guidelines for changing monitoring intervals on page 106• What SNMP trap listener is on page 106• What SNMP trap events are on page 106• How SNMP trap reports are viewed on page 107• When SNMP traps cannot be received on page 107• SNMP trap listener configuration requirements on page 107• How SNMP trap listener is stopped on page 108• Configuration of SNMP trap global options on page 108• Information about the DataFabric Manager server MIB on page 108
40 | OnCommand Unified Manager Operations Manager Administration Guide
• What events are on page 109• Viewing events on page 109• Managing events on page 109• Operations on local configuration change events on page 109• List of events and severity types on page 110• Alarm configurations on page 134• Guidelines for configuring alarms on page 134• Creating alarms on page 134• Testing alarms on page 135• Comments in alarm notifications on page 136• Example of alarm notification in e-mail format on page 136• Example of alarm notification in script format on page 137• Example of alarm notification in trap format on page 137• Response to alarms on page 137• Deleting alarms on page 138• Working with user alerts on page 138• What user alerts are on page 138• Differences between alarms and user alerts on page 138• User alerts configurations on page 139• E-mail addresses for alerts on page 139• Domains in user quota alerts on page 140• What the mailmap file is on page 140• Guidelines for editing the mailmap file on page 141• How the contents of the user alert are viewed on page 141• How the contents of the e-mail alert are changed on page 141• What the mailformat file is on page 141• Guidelines for editing the mailformat file on page 142• Introduction to DataFabric Manager server reports on page 143• Introduction to report options on page 143• Introduction to report catalogs on page 144• Reports you can create in Operations Manager on page 144• Configuring custom reports on page 149• Deleting custom reports on page 150• Putting data into spreadsheet format on page 150• What scheduling report generation is on page 150• What Report Archival Directory is on page 151• Additional capabilities for categories of reports on page 151• What Report Schedules reports are on page 151• Scheduling a report using the All submenu on page 151• Scheduling a report using the Schedule submenu on page 152
Clustered environment: List of tasks and information | 41

• Methods to schedule a report on page 152• Editing a report schedule on page 152• Deleting a report schedule on page 153• Enabling a report schedule on page 153• Disabling a report schedule on page 153• Running a report schedule on page 153• Retrieving the list of enabled report schedules on page 154• Retrieving the list of disabled report schedules on page 154• Listing all the run results of a report schedule on page 154• What Schedules reports are on page 154• Listing all the schedules on page 154• Adding a new schedule on page 155• Editing a schedule on page 155• Deleting a schedule on page 155• What Saved reports are on page 156• Listing the report outputs on page 156• Listing the successful report outputs on page 156• Listing the failed report outputs on page 156• Viewing the output of report outputs from the status column on page 157• Viewing the output of report outputs from the Output ID column on page 157• Viewing the output details of a particular report output on page 157• Data export in the DataFabric Manager server on page 158• How to access DataFabric Manager server data on page 158• Where to find the database schema for the views on page 159• Two types of data for export on page 159• Files and formats for storing exported data on page 160• Format for exported DataFabric Manager data on page 160• Format for last updated timestamp on page 161
Security configurations
• Security configurations on page 163• Types of certificates in the DataFabric Manager server on page 163• Self-signed certificates in the DataFabric Manager server on page 163• Trusted Certificate Authority (CA)-signed certificates in the DataFabric Manager server on page
163• Creating self-signed certificates in DataFabric Manager on page 164• Obtaining a trusted CA-signed certificate on page 164• Enabling HTTPS on page 165• Secure communications with the DataFabric Manager server on page 165• How clients communicate with the DataFabric Manager server on page 165
42 | OnCommand Unified Manager Operations Manager Administration Guide

• SecureAdmin for secure connection with the DataFabric Manager server clients on page 166• Requirements for security options on page 166• Guidelines to configure security options in Operations Manager on page 166• Managed host options on page 167• Where to find managed host options on page 167• Guidelines for changing managed host options on page 167• Comparison between global and storage system-specific managed host options on page 168• Limitations in managed host options on page 168• Changing password for storage systems in the DataFabric Manager server on page 169• Changing passwords on multiple storage systems on page 169• Issue with modification of passwords for storage systems on page 170• Editing HTTP and monitor services to run as different user on page 172
User quotas
• User quotas on page 173• Why you use quotas on page 173• Overview of the quota process on page 173• User quota management using Operations Manager on page 173• Prerequisites for managing user quotas using Operations Manager on page 174• Where to find user quota reports in Operations Manager on page 174• Monitor interval for user quotas in Operations Manager on page 175• Modification of user quotas in Operations Manager on page 175• Prerequisites to edit user quotas in Operations Manager on page 175• Editing user quotas using Operations Manager on page 176• Configuring user settings using Operations Manager on page 176• What user quota thresholds are on page 176• What the DataFabric Manager server user thresholds are on page 177• User quota thresholds on page 177• Ways to configure user quota thresholds in Operations Manager on page 177• Precedence of user quota thresholds in the DataFabric Manager server on page 177
Management of LUNs, FCP Targets, and SAN hosts
• Management of LUNs, Windows and UNIX hosts, and FCP targets on page 179• Management of SAN components on page 179• List of tasks performed to monitor targets and initiators on page 180• Prerequisites to manage targets and initiators on page 181• Prerequisites to manage SAN hosts on page 181• Reports for monitoring LUNs, FCP targets, and SAN hosts on page 182• Information available on the LUN Details page on page 183• Tasks performed on the LUN Details page on page 184
Clustered environment: List of tasks and information | 43

• Information about the FCP Target Details page on page 184• How storage systems, SAN hosts, and LUNs are grouped on page 186• Granting access to storage systems, SAN hosts, and LUNs on page 186• Introduction to deleting and undeleting SAN components on page 187• Deleting a SAN component on page 187• How a deleted SAN component delete is restored on page 187• Where to configure monitoring intervals for SAN components on page 187
File system management
• File system management on page 189• Access to storage-related reports on page 189• Storage capacity thresholds in Operations Manager on page 189• Modification of storage capacity thresholds settings on page 189• Changing storage capacity threshold settings for global group on page 190• Changing storage capacity threshold settings for an individual group on page 190• Changing storage capacity threshold settings for a specific aggregate, volume, or qtree on page
190• Management of aggregate capacity on page 191• Volume space guarantees and aggregate overcommitment on page 191• Available space on an aggregate on page 191• Considerations before modifying aggregate capacity thresholds on page 192• Aggregate capacity thresholds and their events on page 192• Management of volume capacity on page 196• Volume capacity thresholds and events on page 196• Normal events for a volume on page 201• Modification of the thresholds on page 201• Management of qtree capacity on page 201• Volume Snapshot copy thresholds and events on page 201• Qtree capacity thresholds and events on page 203• How Operations Manager monitors qtree quotas on page 205• What clone volumes are on page 205• Identification of clones and clone parents on page 206• Why Snapshot copies are monitored on page 206• Snapshot copy monitoring requirements on page 206• Detection of Snapshot copy schedule conflicts on page 206• Dependencies of a Snapshot copy on page 207• Thresholds on Snapshot copies on page 207• Storage chargeback reports on page 207• When is data collected for storage chargeback reports on page 208
44 | OnCommand Unified Manager Operations Manager Administration Guide
• Determine the current month’s and the last month’s values for storage chargeback report on page208
• Chargeback reports in various formats on page 208• The chargeback report options on page 209• Specifying storage chargeback options at the global or group level on page 210• The storage chargeback increment on page 210• Currency display format for storage chargeback on page 210• Specification of the annual charge rate for storage chargeback on page 211• Specification of the Day of the Month for Billing for storage chargeback on page 211• Formatted charge rate for storage chargeback on page 212• What happens when storage objects are deleted on page 212• Reports of deleted storage objects on page 212• Undeleting a storage object for monitoring on page 213
Storage system management
• Storage system management on page 214• Management tasks you can perform from Operations Manager on page 214• Operations Manager components for managing your storage system on page 214• Storage system groups on page 215• Custom comment fields in Operations Manager on page 215• Where to find information about a specific storage system on page 217• Tasks performed from a Details page of Operations Manager on page 217• Editable options for storage system or vFiler unit settings on page 217• What the cluster tools list is on page 219• What the Diagnose Connectivity tool does on page 219• The Refresh Monitoring Samples tool on page 219• The Run a Command tool on page 219• The Run Telnet tool on page 220• Console connection through Telnet on page 220• DataFabric Manager server CLI to configure storage systems on page 223• Prerequisites for running remote CLI commands from Operations Manager on page 223• Running commands on a specific storage system on page 224• Running commands on a group of storage systems from Operations Manager on page 224• Remote configuration of a cluster on page 224• Running commands on a specific cluster on page 225• Running commands on a specific node of a cluster on page 225
Maintenance and management
• Maintenance and management on page 237• Accessing the CLI on page 237
Clustered environment: List of tasks and information | 45

• Where to find information about the DataFabric Manager server commands on page 237• Audit logging on page 238• Events audited in DataFabric Manager on page 238• Global options for audit log files and their values on page 239• Format of events in an audit log file on page 239• Permissions for accessing the audit log file on page 241• What remote platform management interface is on page 241• RLM card monitoring in the DataFabric Manager server on page 241• Prerequisites for using the remote platform management interface on page 242• Scripts overview on page 242• Commands that can be used as part of the script on page 242• Package of the script content on page 243• What script plug-ins are on page 243• What the script plug-in directory is on page 243• Overview of the DataFabric Manager database backup process on page 244• When to back up data on page 244• Where to back up data on page 245• Recommendations for disaster recovery on page 245• Backup storage and sizing on page 245• Limitation of Snapshot-based backups on page 245• Access requirements for backup operations on page 246• Changing the directory path for database backups on page 246• Starting database backup from Operations Manager on page 246• Scheduling database backups from Operations Manager on page 247• Specifying the backup retention count on page 247• Disabling database backup schedules on page 248• Listing database backups on page 248• Deleting database backups from Operations Manager on page 248• Displaying diagnostic information from Operations Manager on page 248• Exportability of a backup to a new location on page 249• What the restore process is on page 249• Restoring the database from the archive-based backup on page 249• Restoring the database from the Snapshot copy-based backup on page 250• Restoration of the database on different systems on page 250
Troubleshooting
• Troubleshooting in Operations Manager on page 257• AutoSupport in the DataFabric Manager server on page 257• Reasons for using AutoSupport on page 257• Types of AutoSupport messages in the DataFabric Manager server on page 257
46 | OnCommand Unified Manager Operations Manager Administration Guide

• Protection of private data by using AutoSupport on page 258• Configuring AutoSupport on page 258• DataFabric Manager server logs on page 259• Access to logs on page 259• Accessing the logs through the DataFabric Manager server CLI on page 259• Apache and Sybase log rotation in DataFabric Manager server on page 260• Common DataFabric Manager server problems on page 260• Communication issues between the DataFabric Manager server and routers on page 260• E-mail alerts not working in the DataFabric Manager server on page 260• How discovery issues are resolved on page 260• Use of the Diagnose Connectivity tool for a managed storage system on page 261• Use of the Diagnose Connectivity tool for an unmanaged storage system on page 261• Where to find the Diagnose Connectivity tool in Operations Manager on page 261• Reasons why the DataFabric Manager server might not discover your network on page 262• Troubleshooting network discovery issues on page 262• Troubleshooting appliance discovery issues with Operations Manager on page 263• How configuration push errors are resolved on page 263• Issues related to SAN events on page 264• Offline FC Switch Port or Offline HBA Port• Faulty FC Switch Port or HBA Port Error• Offline LUNs on page 264• Snapshot copy of LUN not possible on page 264• High traffic in HBA Port on page 264• Custom reports do not display any data on page 265• Import and export of configuration files on page 266• How inconsistent configuration states are fixed on page 266
Protocols and port numbers
• Protocols and port numbers used by the DataFabric Manager server on page 276• DataFabric Manager server communication on page 276• DataFabric Manager server access to storage systems on page 276
SAN management
• SAN management on page 278• SAN management using the DataFabric Manager server on page 279• Prerequisites for SAN management with the DataFabric Manager server on page 279• List of tasks performed for SAN management on page 280• List of user interface locations to perform SAN management tasks on page 281• Reports for monitoring SANs on page 282• Location of SAN reports on page 282
Clustered environment: List of tasks and information | 47

• DataFabric Manager server managed SAN data in spreadsheet format on page 283• Where to find information for specific SAN components on page 283• Where to view LUN details of SAN components on page 283• Tasks performed from the LUN Details page for a SAN host on page 283• Information about FC target on a SAN host on page 284• Information about the FC switch on a SAN host on page 285• Access to the FC Switch Details page on page 285• Information about FC Switch on a SAN host on page 285• Tasks performed from the FC Switch Details page for a SAN host on page 285• Accessing the HBA Port Details page access for a SAN host on page 286• Details about the HBA Port Details page on page 287• List of SAN management tasks on page 287• LUN management on page 287• Initiator group management on page 289• FC switch management on page 289• DataFabric Manager server options on page 289• DataFabric Manager options for SAN management on page 289• Where to configure monitoring intervals for SAN components on page 291• Deleting and undeleting SAN components on page 291• Reasons for deleting and undeleting SAN components on page 291• Process of deleting SAN components on page 291• Process of undeleting SAN components on page 292• How SAN components are grouped on page 292• Restriction of SAN management access on page 292• Access control on groups of SAN components on page 292
48 | OnCommand Unified Manager Operations Manager Administration Guide
What the discovery process isThe DataFabric Manager server discovers all the storage systems in your organization's network bydefault. You can add other networks to the discovery process or enable discovery on all the networks.Depending on your network setup, you can disable discovery entirely. You can disable auto-discovery if you do not want SNMP network walking.
Discovery by the DataFabric Manager serverThe DataFabric Manager server depends on Simple Network Management Protocol (SNMP) todiscover and periodically monitor storage systems.
If your storage systems are not SNMP-enabled, you must enable SNMP for the server can discoverthem. You can enable SNMP on storage systems by using either FilerView or the Data ONTAP CLI.
If the routers, switches, or storage systems use SNMP communities other than “public,” you mustspecify the appropriate communities on the Edit Network Credentials page.
The server has to locate and identify storage systems so that it can add them to its database. Theserver can monitor and manage only systems and networks that are in the database.
Automatic discovery is typically the primary process that the server uses to discover storage systemsand networks. In this process, the server and the systems (storage systems, vFiler units, and HostAgents) communicate automatically with each other.
Manual addition is secondary to the discovery process. You typically require it only for the storagesystems and the networks that you add after the server discovers the infrastructure.
What SNMP isSimple Network Management Protocol (SNMP) is an application-layer protocol that facilitates theexchange of management information between network devices.
SNMP is part of the Transmission Control Protocol/Internet Protocol (TCP/IP) protocol suite. SNMPenables network administrators to manage network performance; find and solve network problems;and plan for network growth.
When to enable SNMPYou must enable SNMP on your storage systems before you install the DataFabric Manager server, ifyou want the DataFabric Manager server to discover the storage systems immediately.
SNMP is normally enabled on storage systems. You can verify this with storage01> optionssnmp.enable.
49

If SNMP is not enabled on your storage system, enable it with Storage01> optionssnmp.enable on. SNMPv1 uses community strings for authentication. Storage systems normallyallow read-only access with the 'public' community.
You can also wait until after installing the software to enable SNMP on storage systems. However,this causes a delay in the server to discover the storage systems.
SNMP versions to discover and monitor storage systemsThe DataFabric Manager server uses the SNMP protocol versions to discover and monitor thestorage systems.
By default, the DataFabric Manager server uses SNMPv1, with public as the community string todiscover the storage systems. To use a specific configuration on a network, you must add thenetworks required.
SNMPv1 is a widely used simple request/response protocol. SNMPv3 is an interoperable standards-based protocol with security and remote configuration capabilities.
SNMPv3 provides user-based security with separate authentication and authorization. It is a methodto specify common credentials.
Note: SNMPv3 support is available only on storage systems running Data ONTAP 7.3 or later.
You can use SNMPv3 to discover and monitor storage systems if SNMPv1 is disabled.
Note: The user on the storage system whose credentials are specified in Operations Managershould have the login-snmp capability to be able to use SNMPv3.
The version specified in the Preferred SNMP Version option at the storage system level is used formonitoring the discovered storage system. If no version is specified at the storage system level, theneither the network setting or the global setting is used. However, you can modify the SNMP version,if required.
Note: If the monitoring fails using the specified SNMP version, then the other SNMP version isnot used for storage system monitoring.
Related concepts
Methods of adding storage systems and networks on page 59Guidelines for editing discovery options on page 59
Related tasks
Modifying the network credentials and SNMP settings on page 54
50 | OnCommand Unified Manager Operations Manager Administration Guide
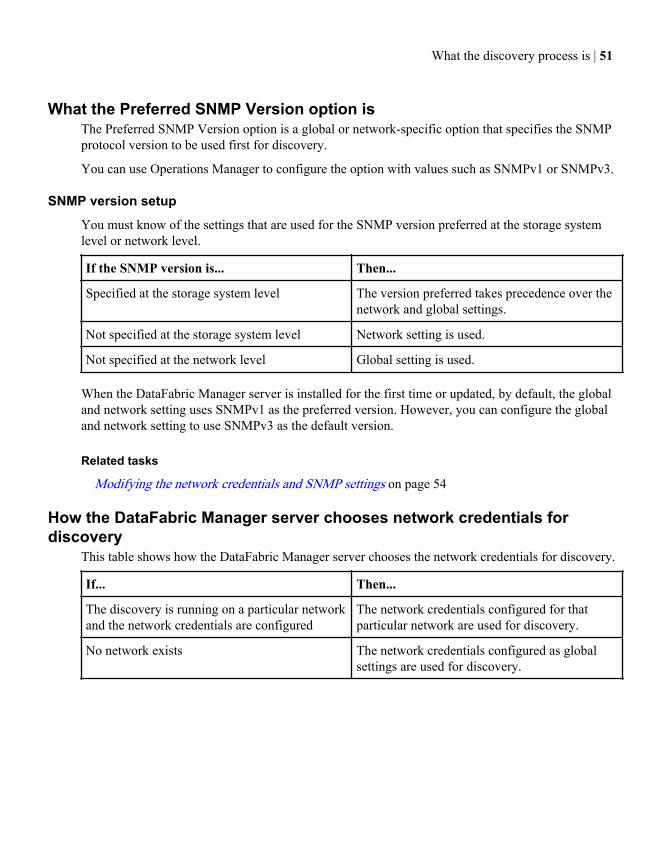
What the Preferred SNMP Version option isThe Preferred SNMP Version option is a global or network-specific option that specifies the SNMPprotocol version to be used first for discovery.
You can use Operations Manager to configure the option with values such as SNMPv1 or SNMPv3.
SNMP version setup
You must know of the settings that are used for the SNMP version preferred at the storage systemlevel or network level.
If the SNMP version is... Then...
Specified at the storage system level The version preferred takes precedence over thenetwork and global settings.
Not specified at the storage system level Network setting is used.
Not specified at the network level Global setting is used.
When the DataFabric Manager server is installed for the first time or updated, by default, the globaland network setting uses SNMPv1 as the preferred version. However, you can configure the globaland network setting to use SNMPv3 as the default version.
Related tasks
Modifying the network credentials and SNMP settings on page 54
How the DataFabric Manager server chooses network credentials fordiscovery
This table shows how the DataFabric Manager server chooses the network credentials for discovery.
If... Then...
The discovery is running on a particular networkand the network credentials are configured
The network credentials configured for thatparticular network are used for discovery.
No network exists The network credentials configured as globalsettings are used for discovery.
What the discovery process is | 51

Discovery process using SNMPv1 or SNMPv3This table describes the discovery process for a storage system by using SNMPv1 or SNMPv3.
If... Then...
The storage system is discovered using thepreferred SNMP version (let us say, SNMPv1)
The discovered storage system is added with thepreferred SNMP version as Global/NetworkDefault. This implies that the network or globalsettings are used for monitoring.
The storage system is not discovered usingSNMPv1
SNMPv3 is used for storage system discovery.
The discovery succeeds using SNMPv3 SNMPv3 is set as the preferred version formonitoring.
When all or most of the storage systems in a network are running only a particular SNMP version,then you are recommended to specify only that version as the preferred SNMP version for thenetwork. This speeds up the discovery of storage systems running only a particular SNMP version.
You can prevent using a particular version of SNMP from being used for discovery. For example, if aparticular version of SNMP is not in use in the network, then you can disable that SNMP version.This speeds up the discovery process.
Monitoring process using SNMPv1This table shows how storage systems are monitored using SNMPv1.
If... Then...
The Preferred SNMP Version option is set toSNMPv1, or the Preferred SNMP Versionoption is not set for the storage system, and theglobal or network setting is SNMPv1
The community string set at the network level isused for the SNMPv1 monitoring.
The community string is not specified at eitherglobal or network level
SNMPv1 is disabled and an event is generated toindicate the SNMP communication failure withthe storage system.
52 | OnCommand Unified Manager Operations Manager Administration Guide

Monitoring process using SNMPv3You should be aware of how storage systems are monitored using SNMPv3.
If... Then...
The Preferred SNMP Version option is set toSNMPv3, or the Preferred SNMP Versionoption is not set for the storage system, and theglobal or network setting is SNMPv3
The login and the password specified for thestorage system are used for SNMPv3monitoring.
The storage system credentials are not specified The login and the password specified at thenetwork level are used for SNMPv3 monitoring.
No credentials are provided at the network level The login and the password specified at theglobal level are used for SNMPv3 monitoring.
No credentials are provided at the global level An event is generated to indicate the SNMPcommunication failure with the storage system.
The DataFabric Manager server supports SNMPv3 communication through authentication protocols:MD5 and SHA. You can configure SNMPv3 settings with either of the authentication protocols fromthe Network Credentials page or from the CLI.
Setting SNMPv1 or SNMPv3 as the preferred version for storage systemdiscovery
You can set either SNMPv1 or SNMPv3 as the preferred version for discovering storage system on aspecific network.
Steps
1. Perform one of the following actions:
• Select the Network Credentials submenu from the Setup menu.• Select the Discovery submenu from the Setup menu and click the edit link corresponding to
the Network Credentials option.
2. Provide values for each of the parameters requested.
3. Click Add.
Setting SNMPv1 as the only SNMP versionYou can set SNMPv1 as the only SNMP version available to monitor all storage systems in anetwork.
Steps
1. Go to the Network Credentials page.
What the discovery process is | 53

2. Click the edit link corresponding to the Edit field for the SNMPv3 enabled network.
3. In the Edit Network Credentials section, modify the value of the Preferred SNMP Version optionto SNMPv1.
4. In the SNMPv3 Settings section, clear the Login and Password values.
5. Click Update.
6. If the storage system in the network has the Preferred SNMP Version option set to SNMPv3, then
a) Go to the Edit Appliance Settings page of the corresponding storage system.b) Modify the value of the Preferred SNMP Version option to Global/Network Default.
Setting SNMPv1 or SNMPv3 to monitor a storage systemYou can set SNMPv1 or SNMPv3 to monitor a storage system.
Steps
1. Click Control Center > Member Details > Physical Systems > Storage Systems, All.
A list of all the storage systems that are monitored by Operations Manager console is displayed.
2. Click the storage system for which you want to set the SNMP version.
3. From the Edit Storage Controller Settings page, click Edit Settings under Storage Controller inthe left pane.
4. Select the preferred SNMP version option from the drop-down menu.
5. Click Update.
Modifying the network credentials and SNMP settingsYou can modify the network credentials and SNMP settings by using Operations Manager.
Steps
1. Choose one of the following options:
• Click Setup > Network Credentials.• Click Setup > Discovery, and then click the edit link corresponding to the Network
Credentials option.
2. Click the edit link corresponding to the Edit field in the Network Credentials page.
3. Modify the values for the parameters as required.
4. Click Update.
54 | OnCommand Unified Manager Operations Manager Administration Guide

Deleting SNMP settings for the network using the Operations Managerconsole
If you do not use a network, you can delete the SNMP settings for the network by using theOperations Manager console.
Steps
1. Click Setup > Network Credentials.
The Network Credentials page displays the list of networks.
2. Select the check box corresponding to the Delete field for the required network.
Addition of a storage system from an undiscovered networkYou can add a single storage system to the DataFabric Manager server from an undiscoverednetwork on which only SNMPv3 is enabled.
You can add the storage system by running the dfm host add -N command, with the appropriatevalues for the following storage system credentials:
• hostLogin• hostPassword
In this case, the discovery is not enabled on the storage system’s network.
Diagnosis of SNMP connectivityYou can diagnose the SNMP connectivity with a host by running the Diagnose Connectivity toolfrom Operations Manager.
You can access the Diagnose Connectivity tool from the Storage Controller Tools list located at thelower left of Operations Manager.
Alternatively, you can run the dfm host diag hostname command to diagnose the DataFabricManager server's connectivity using SNMPv1 and SNMPv3 with a host. The credentials used fordiagnosing connectivity using rsh and ssh are the host credentials. However, if the host credentialsare unspecified, then the network or global credentials are used for SNMPv3.
Related concepts
Use of the Diagnose Connectivity tool for a managed storage system on page 261Use of the Diagnose Connectivity tool for an unmanaged storage system on page 261Where to find the Diagnose Connectivity tool in Operations Manager on page 261Reasons why the DataFabric Manager server might not discover your network on page 262
What the discovery process is | 55

What host discovery isThe DataFabric Manager server automatically discovers storage systems and Host Agents that are inthe same subnet as the server. When you install the DataFabric Manager server software, the HostDiscovery option is enabled by default.
The discovery of networks, when enabled, is integrated with the discovery of storage systems andHost Agents. The discovery occurs at the same time.
Note: The DataFabric Manager server 3.8 supports discovery of IPv6 networks and hosts.
Ping methods in host discoveryThe DataFabric Manager server uses SNMP queries for host discovery. You must enable SNMP onyour storage systems and the routers for the DataFabric Manager server to monitor and managesystems.
By default, SNMP is enabled on storage systems.
Ping methods might include ICMP echo, HTTP, NDMP, or ICMP echo and SNMP. The latter pingmethod does not use HTTP to ping a host. Therefore, if a storage system (behind a transparent HTTPcache) is down and the HTTP cache responds, the server does not mistake the storage system to berunning. The ICMP echo and SNMP ping method is the default for new installations.
Note: When you select ICMP echo and the SNMP ping method, the server uses ICMP echo first,and then SNMP, to determine if the storage system is running.
What host-initiated discovery isHost-initiated discovery is based on the DNS SRV record, where the DataFabric Manager serverdetails are maintained. Currently, host-initiated discovery is supported by DataFabric Manager HostAgent only.
Whenever a host initiates communication with the DataFabric Manager server, it does not identifythe host until its network (IPv6) address details are added. You can add the host IPv6 network to theDataFabric Manager server by using the dfm network add command. When it receives thiscommand, the host initiates a request to the DataFabric Manager server. After the DataFabricManager server identifies the network, the host is added to the DataFabric Manager server host list.
For information about modifying the DataFabric Manager server details for host-initiated discovery,see the DataFabric Manager Host Agent Installation and Administration Guide.
56 | OnCommand Unified Manager Operations Manager Administration Guide
Related information
The IBM N series support website: www.ibm.com/storage/support/nseries/
Discovery of vFiler units (7-Mode environments only)DataFabric Manager server monitors the hosting storage systems to discover vFiler units. You mustset authentication credentials for the hosting storage system to ensure that DataFabric Manager serverdiscovers the vFiler units.
The server monitors the hosting storage system once every hour to discover new vFiler units that youconfigured on the storage system. The server deletes from the database the vFiler units that youdestroyed on the storage system.
You can change the default monitoring interval from the Monitoring setup options, or by using thefollowing CLI command:
dfm option set vFilerMonInterval=1hour
You can disable the vFiler discovery from the Discovery setup options, or by using the dfm optionset discovervfilers=no CLI command.
When DataFabric Manager server discovers a vFiler unit, it does not add the network to which thevFiler unit belongs to its list of networks on which it runs host discovery. In addition, when youdelete a network, the server continues to monitor the vFiler units in that network.
Related tasks
Changing password for storage systems in the DataFabric Manager server on page 169Changing passwords on multiple storage systems on page 169
Discovery of storage systemsYou must be aware of the process that the DataFabric Manager server uses to discover storagesystems if the Host Discovery option is enabled and the Network Discovery option is disabled (thedefault value).
1. The DataFabric Manager server issues an SNMP GET request to all the storage systems on thelocal network. The purpose of the request is to determine the identity of the storage systems.The local network is the network to which the DataFabric Manager server is located.
What the discovery process is | 57

2. If... Then...
The SNMP GETrequest issuccessful
The DataFabric Manager server adds the discovered storage systems to itsdatabase and continues to step 3.If the storage system is a hosting storage system on which vFiler units areconfigured, the DataFabric Manager server also discovers those vFiler units.
Note: vFiler units are discovered only after you set the credentials for thehosting storage system.
3. The DataFabric Manager server repeats steps 1 through 2 until it has sent queries to all thenetworks in its database.The minimum interval for repeating the cycle is set by the Discovery Interval (the default is every15 minutes) and the Discovery Timeout (the default is 2 seconds). The actual interval depends onthe number of networks to scan and their size.
Note: The DataFabric Manager server repeats steps 1 and 2 to discover new storage systems. Theminimum interval for repeating the discovery process is set by the Discovery Interval option.
Discovery of storage systems and networksThis table describes the process that the DataFabric Manager server uses to discover storage systemsand networks if both the Host Discovery and Network Discovery options are enabled.
Stage Description
1. The DataFabric Manager server issues an SNMP GET request to all hosts on the localnetwork. The purpose of the request is to determine the system identity of the hosts.The local network is the network to which the DataFabric Manager server is attached.
2. If... Then...
The SNMP GET request is successful The DataFabric Manager server adds thediscovered storage systems to its database andcontinues to Stage 4.If the storage system is a hosting storagesystem on which vFiler units are configured,the DataFabric Manager server also discoversthose vFiler units.
Note: vFiler units will be discovered onlyafter you set the credentials for the hostingstorage system.
58 | OnCommand Unified Manager Operations Manager Administration Guide

Stage Description
3. The DataFabric Manager server issues another SNMP GET request to routers thatresponded to the first SNMP request. The purpose of the request is to gather informationabout other networks to which these routers might be attached.
4. When the DataFabric Manager server receives replies, if it finds networks that are notincluded in its database, it adds the new networks to its database.
5. The DataFabric Manager server selects another network from its database and issues anSNMP GET request to all hosts on that network.
6. The DataFabric Manager server repeats Stages 2 through 5 until it has sent SNMP queriesto all the networks in its database. By default, the minimum interval for repeating thenetwork discovery cycle is set at every 15 minutes.
Methods of adding storage systems and networksYou can apply a combination of methods to efficiently add storage systems and networks to theDataFabric Manager server.
• Keep the defaults for the discovery options of Host Discovery (Enabled), and Network Discovery(Disabled).
• Start the discovery process by manually adding one storage system from each network that hasstorage systems.When you add a storage system, its network is added, too. Then other storage systems on thenetwork are found automatically.
• After verifying that all of the storage systems have been added, you should disable host discoveryto save network resources.
• After attaching a new storage system to your network, you must add hosts by using eitherOperations Manager or through the command line with the dfm host add command.
• If you set up a new network of storage systems, add one storage system so that its network and allother storage systems on it are found.
Guidelines for editing discovery optionsBefore modifying the default values of the discovery options, you must decide which options youwant to change and how that affects discovery.
Intervaloption
You can increase or decrease the default time interval between storage systemsand network discovery attempts. After storage systems are discovered initially,you can determine the interval based on the number of networks and their size.Longer time intervals can lead to delays in discovery, but the discovery process isless likely to affect the network load.
The default interval value is 15 minutes.
What the discovery process is | 59

Timeoutoption
You can specify the time interval after which discovery is considered to havefailed.
Lengthening the interval avoids discovery queries on a local area network failingdue to the long response times of a storage system.
The default timeout value is 5 seconds.
Host discoveryoption
This option enables the discovery of storage systems, host agents and vFiler Unitsthrough SNMP.
You can change the default value if any of the following situations exist:
• All storage systems that you expected the DataFabric Manager server todiscover have been discovered and you do not want the DataFabric Managerserver to continue scanning for new storage systems.
• You want to manually add storage systems to the DataFabric Manager serverdatabase.Manually adding storage systems is faster than discovering storage systems inthe following cases:
• You want the DataFabric Manager server to manage a small number ofstorage systems.
• You want to add a single new storage system to the DataFabric Managerserver database.
Host agentdiscoveryoption
This option allows you to enable or disable discovery of host agents.
You can change the default value if you want to disable the discovery of LUNs orstorage area network (SAN) hosts and host agents.
Networkdiscovery
This option enables the discovery of networks, including cluster networks.
You can change the default value if you want the DataFabric Manager server toautomatically discover storage systems on your entire network.
Note: When the Network Discovery option is enabled, the list of networks onthe Networks to Discover page can expand considerably as the DataFabricManager server discovers additional networks attached to previously discoverednetworks.
NetworkDiscoveryLimit (inhops)
This option sets the boundary of network discovery as a maximum number ofhops (networks) from the DataFabric Manager server.
You can change the default value if you want to increase this limit if the storagesystems that you want the DataFabric Manager server to discover are connected tonetworks that are more than 15 hops (networks) away from the network to whichthe DataFabric Manager server is attached. The other method for discoveringthese storage systems is to add them manually.
60 | OnCommand Unified Manager Operations Manager Administration Guide

You can decrease the discovery limit if a smaller number of hops includes all thenetworks with storage systems that you want to discover. For example, you canreduce the limit to six hops if there are no storage systems that must be discoveredon networks beyond six hops. Reducing the limit prevents the DataFabricManager server from using cycles to probe networks that contain no storagesystems that you want to discover.
The default discovery limit value is 15 hops.
Networks todiscover
This option enables you to manually add or delete networks that the DataFabricManager server scans for new storage systems.
You can change the default value if you want to add a network to the DataFabricManager server that it cannot discover automatically or if you want to delete anetwork for which you no longer want storage systems to be discovered.
NetworkCredentials
This option enables you to specify, change, or delete an SNMP community thatthe DataFabric Manager server uses for a specific network or host.
You can change the default value if storage systems and routers that you want toinclude in the DataFabric Manager server do not use the default SNMPcommunity.
Discovery of a cluster by Operations Manager (clusteredenvironments only)
The DataFabric Manager server automatically discovers a cluster that is in the same network as theDataFabric Manager server host. If the cluster is in a different network, you can discover it byspecifying the appropriate SNMP version in the Preferred SNMP Version option in the NetworkCredentials page.
For a specified IP address and the SNMP version in the Preferred SNMP Version option, thefollowing objects are queried:
• Name of the system (sysName)• ID of the system object (sysObjectId)• Cluster ID (clusterIdentityUuid)
If the query fails, you can use another version of SNMP to send queries. When the query succeeds,Operations Manager identifies the cluster, based on the sysObjectId. For example, if the sysObjectIdis netappProducts.netappCluster, the cluster is added to the network.
Note: For both SNMPv1 and SNMPv3, Operations Manager uses per-network configurationsettings or the default network settings.
What the discovery process is | 61
Adding clusters (clustered environments only)By using Operations Manager, you can add a cluster by specifying the IP address of the given clustermanagement logical interface.
About this task
Operations Manager uses the default SNMP version to discover a cluster. If you want to change thedefault version, you can specify the appropriate SNMP version in the Preferred SNMP Versionoption in the Network Credentials page.
Steps
1. Click Control Center > Home > Member Details > Physical Systems.2. In the New storage system field, enter the host name or IP address of the cluster that you want to
add.3. Click Add.
Result
The cluster is added and displayed in the Clusters, All report.
Cluster monitoring tasks using Operations Manager(clustered environments only)
Using Operations Manager, you can perform various monitoring tasks on cluster nodes, includingmonitoring clusters and generating reports on the cluster and its objects.
You can perform the following tasks on a cluster by using Operations Manager:
• Discover a cluster, either automatically or manually.• Monitor the cluster.• Configure the cluster to receive alerts.• Generate various reports on the cluster and its components.• Run commands remotely.
Unsupported tasks for cluster monitoring in Operations Manager (clusteredenvironments only)
You cannot perform certain monitoring tasks related to a cluster due to lack of support for certainAPIs, SNMP objects, and interfaces in clustered Data ONTAP systems.
The following features are not supported in Operations Manager:
• Management of the cluster administrator user profile and password• Configuration management of clusters, controllers, and Vservers
62 | OnCommand Unified Manager Operations Manager Administration Guide

• Configuration of the HA checker script• Management of volume SnapMirror relationships, schedules, and jobs• Receiving SNMP traps from a cluster• SnapLock reports
Tasks performed for the gateway SAN-attached storagemanagement in Operations Manager (7-Mode environmentsonly)
Operations Manager enables you to discover storage arrays and storage array ports for the gatewaythrough certain APIs. For discovery and monitoring of storage arrays and storage array ports, youmust set the host login and password in the storage system.
You can perform the following tasks relating to SAN-attached storage of the gateway by usingOperations Manager:
• Monitor storage arrays and storage array ports that are connected to the gateway.• Monitor the storage load of array LUNs.• Generate various reports on the gateway SAN-attached storage using back-end storage.
For more information about the gateway SAN-attached storage management reports, see theOperations Manager Help.
Related tasks
Viewing configuration details of storage arrays connected to the gateway (7-Mode environmentsonly) on page 64
Limitations of the gateway SAN-attached storage management inOperations Manager (7-Mode environments only)
You cannot use Operations Manager to perform a high-level analysis of the average usage trend of astorage system's back-end storage, or the least used and most used array LUNs, aggregates, oradapters at a given point in time.
Operations Manager does not support the following features:
• Listing, adding, or deleting storage array and storage array port objects from the command-lineinterface
• Events for storage arrays and storage array ports• RBAC security for storage arrays and storage array ports• A Details page for storage arrays and storage array ports
What the discovery process is | 63
Tasks performed from the Storage Controller Details page for the gateway(7-Mode environments only)
You can view the list of storage arrays and the list of storage arrays ports connected to the gatewayfrom the Storage Controller Details page. You can access this page by clicking the name of thegateway in the appropriate Storage System report.
You can perform the following tasks from the Storage Controller Details page for the gateway:
• View the list of storage arrays connected to the gateway.You can view this list by clicking the number in the Arrays connected to This Storage Systemfield.
• View the list of storage array ports connected to the gateway.You can view this list by clicking the number in the Array Ports connected to This StorageSystem field.
Viewing configuration details of storage arrays connected to the gateway(7-Mode environments only)
You can view the configuration details of storage arrays connected to the gateway in the StorageArray Configuration report in Operations Manager.
Before you begin
Operations Manager must have discovered the storage arrays for which you want to view theconfiguration details.
Steps
1. Click Control Center > Home > Member Details > Physical Systems.
2. Select the Storage Array Configuration report from the Report drop-down menu.
Result
The Storage Array Configuration page is displayed, which provides the configuration details, such asthe name of the storage array, the name of the gateway, array LUN count, the adapter used, and thename of the switch.
64 | OnCommand Unified Manager Operations Manager Administration Guide

Role-based access control in the DataFabricManager server
The DataFabric Manager server uses role-based access control (RBAC) for user login and rolepermissions.
What role-based access control doesRole-based access control (RBAC) enables administrators to manage groups of users by definingroles. If you need to restrict access for specific functionality to selected administrators, you must setup administrator accounts for them. If you want to restrict the information that administrators canview and the operations they can perform, you must apply roles to the administrator accounts youcreate.
The management server uses role-based access control (RBAC) for user login and role permissions.If you have not changed the management server’s default settings for administrative user access, youdo not need to log in to view them.
When you initiate an operation that requires specific privileges, the management server prompts youto log in. For example, to create administrator accounts, you must log in with Administrator accountaccess.
Configuring vFiler unit access control (7-Modeenvironments only)
An administrator who does not have any roles on a global level, but has roles on a group thatcontains only vFiler units is considered a vFiler administrator. The vFiler administrator does not haveaccess to the hosting storage system information.
About this task
The following restrictions apply to vFiler units' administrators:
• If a vFiler unit has a volume assigned to it, the vFiler administrator cannot view details or reportsfor the aggregate that contains the volume.
• If a vFiler unit has a qtree assigned to it, the vFiler administrator cannot view details or reportsfor the volume that contains the qtree.
Note: The full name of a qtree contains a volume name (for example, 10.72.184.212:/hemzvol/hagar_root_backup_test) even though the vFiler unit does not contain the volume.
65

Steps
1. Create a group that contains vFiler units.
2. From the Edit Group Membership page, select vFiler units to add to the group.
3. From the Roles page, create a role for the vFiler administrator and assign it the followingdatabase operations: Delete, Read, and Write.
4. From the Edit Administrator Settings page, assign role to the vFiler administrator.
Logging in to the DataFabric Manager serverYou can log in to the DataFabric Manager server by entering the administrator name and passwordon the Operations Manager interface.
Steps
1. From the Control Center, select Log In.
2. Type your administrator name and password.
3. Click Log In.
What default administrator accounts areThe DataFabric Manager server uses administrator accounts to manage access control and maintainsecurity. When you install the DataFabric Manager server software, default administrator accountsare created: the “Administrator” and “Everyone” accounts. Administrator accounts have predefinedroles assigned to them.
Administratoraccount
The Administrator has superuser privileges and can perform any operation inthe DataFabric Manager server database and add other administrators. TheAdministrator account is given the same name as the name of the administratorwho installed the software. Therefore, if you install the DataFabric Managerserver on a Linux workstation, the administrator account is called root.
Everyoneaccount
After installing the DataFabric Manager server, you must log in as theAdministrator and set up the Everyone account to grant view permission on thisaccount. This is optional.
Note: Changes made will not be seen in the audit log.
66 | OnCommand Unified Manager Operations Manager Administration Guide

List of predefined roles in the DataFabric Manager serverYou must be aware of the roles assigned to different administrator accounts in the DataFabricManager server.
Administrator account Roles
Administrator • GlobalAlarm• GlobalBackup• GlobalConfigManagement• GlobalDataProtection• GlobalDataSet• GlobalDelete• GlobalEvent• GlobalExecute• GlobalFailover• GlobalFullControl• GlobalMirror• GlobalPerfManagement• GlobalProvisioning• GlobalQuota• GlobalRead• GlobalReport• GlobalResourceControl• GlobalRestore• GlobalSAN• GlobalSDConfig• GlobalSDDataProtection• GlobalSDDataProtectionAndRestore• GlobalSDFullControl• GlobalSDSnapshot• GlobalSDStorage• GlobalWrite
Everyone • No roles
Role-based access control in the DataFabric Manager server | 67

Active Directory user group accountsThe DataFabric Manager server recognizes two types of users namely Administrator and User,thereby allowing domain administrators the ability to define roles based on a company’sorganizational hierarchy.
To set up administrator accounts as a user group, use the following naming convention: <ADdomain>\group_dfmadmins.
In this example, all administrators who belong to group_dfmadmins can log in to the DataFabricManager server and inherit the roles specified for that group.
Adding administrative usersYou can create administrator accounts from the Operations Manager console. Administrator accountsare either an individual administrator or a group of administrators.
Before you begin
The DataFabric Manager server user must be a local operating system user, or a domain userreachable by LDAP.
Steps
1. Log in to the Administrator account.
2. In the Operations Manager console, click Setup > Administrative users.
3. Type the name for the administrative user or domain name for the group of administrators.
When you add the user, they must be available locally.
4. If you have already created a role that you want to assign to this user or group of users, select therole in the left column of the displayed table and use the arrow button to move the role to thecolumn on the right.Roles in the column on the right are assigned to the user that you are creating.
5. Type the email address for the administrator or administrator group.
6. Enter the pager number for the administrator or administrator group.
7. Click Add.
In Windows, when you add a user to the Administrators group, the user gets added as a localadmin user.
After you finish
If you have not created a role for the user you created, you must create a role.
68 | OnCommand Unified Manager Operations Manager Administration Guide
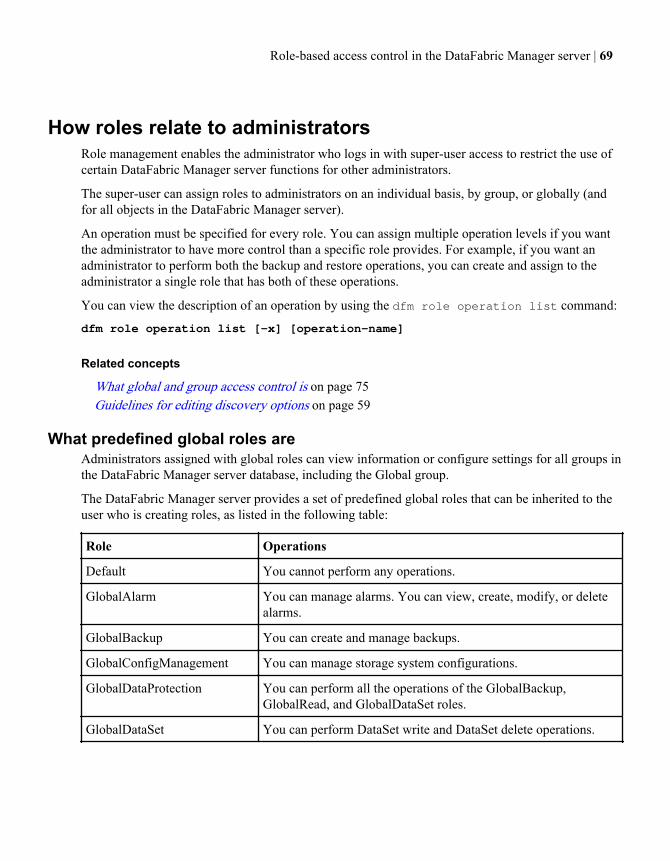
How roles relate to administratorsRole management enables the administrator who logs in with super-user access to restrict the use ofcertain DataFabric Manager server functions for other administrators.
The super-user can assign roles to administrators on an individual basis, by group, or globally (andfor all objects in the DataFabric Manager server).
An operation must be specified for every role. You can assign multiple operation levels if you wantthe administrator to have more control than a specific role provides. For example, if you want anadministrator to perform both the backup and restore operations, you can create and assign to theadministrator a single role that has both of these operations.
You can view the description of an operation by using the dfm role operation list command:
dfm role operation list [-x] [operation-name]
Related concepts
What global and group access control is on page 75Guidelines for editing discovery options on page 59
What predefined global roles areAdministrators assigned with global roles can view information or configure settings for all groups inthe DataFabric Manager server database, including the Global group.
The DataFabric Manager server provides a set of predefined global roles that can be inherited to theuser who is creating roles, as listed in the following table:
Role Operations
Default You cannot perform any operations.
GlobalAlarm You can manage alarms. You can view, create, modify, or deletealarms.
GlobalBackup You can create and manage backups.
GlobalConfigManagement You can manage storage system configurations.
GlobalDataProtection You can perform all the operations of the GlobalBackup,GlobalRead, and GlobalDataSet roles.
GlobalDataSet You can perform DataSet write and DataSet delete operations.
Role-based access control in the DataFabric Manager server | 69

Role Operations
GlobalDelete You can delete information in the DataFabric Manager serverdatabase, including groups and members of a group, monitoredobjects, primary and secondary storage systems, and backuprelationships, schedules, and retention policies.
GlobalEvent You can view and acknowledge events, and create and deletealarms.
GlobalExecute You can run commands on the storage system.
GlobalFailover You can manage disaster recovery for datasets.
GlobalFullControl You can view and perform any operation on any object in theDataFabric Manager server database and configure administratoraccounts.
You cannot apply this role to accounts with group access control.
GlobalMirror You can create, delete, and update replication or failover policies.
GlobalPerfManagement You can manage views (7-Mode environments only), eventthresholds, and alarms, and view performance information inPerformance Advisor.
GlobalProvisioning You can provision primary dataset nodes and attach resourcepools to secondary or tertiary dataset nodes. You also have all thecapabilities of the GlobalResourceControl, GlobalRead, andGlobalDataset roles for dataset nodes that are configured withprovisioning policies.
GlobalQuota You can view user quota reports and events.
GlobalRead You can view the DataFabric Manager server database, backupconfigurations, events and alerts, and replication or failoverpolicies.
GlobalReport You can manage custom reports and report schedules.
GlobalResourceControl You can add members to dataset nodes that are configured withprovisioning policies.
GlobalRestore You can perform restore operations from backups on secondaryvolumes.
GlobalSAN You can create, expand, and destroy LUNs.
GlobalSDConfig You can read, modify, and delete SnapDrive configuration.
GlobalSDDataProtection You can manage backups and datasets with SnapDrive.
70 | OnCommand Unified Manager Operations Manager Administration Guide

Role Operations
GlobalSDDataProtectionAndRestore
You can perform backup and restore operations with SnapDrive.
GlobalSDFullControl You can perform operations specific to GlobalSDConfig,GlobalSDSnapshot, and GlobalSDStorage roles.
GlobalSDSnapshot You can list the Snapshot copies and the objects inside them.
You can create, modify, and delete Snapshot copies.
You can create clones of volumes, LUNs, and qtrees.
You can restore volumes, LUNs, and qtrees from Snapshot copies.
GlobalSDStorage You can list, create, modify, and delete storage objects and theirattributes.
GlobalWrite You can view or write to the DataFabric Manager server database.
Note: Superusers are assigned the GlobalFullControl role in Operations Manager. For Linux, thesuperuser is the root user. For Windows, superusers belong to the administrators group.
What inheritance roles areAdministrators assigned with group roles can view or configure settings for the group to which theybelong.
When you view roles for an administrator, the settings are those explicitly set for the administrator atthe group level. For example, if administrators have the GlobalRead role, they implicitly have theRead role on all groups. Similarly, if administrators have the Read role on a parent group, theyimplicitly have the Read role on all the subgroups of that parent group.
Several other factors also affect the group role that is granted to an administrator:
• The capabilities granted to the administrator, "Everyone"• The administrator's membership in Active Directory (AD) user groups that have been added to
the DataFabric Manager server database
Group roles are named similarly to the global roles that are defined in the previous table.
Note: Roles are carried forward prior to DataFabric Manager server 3.3.
Role-based access control in the DataFabric Manager server | 71
What capabilities areWhen creating roles, you must assign capabilities, a combination of operations and resources, to therole. You can view capabilities or edit them by modifying the operations that are associated with theresource. Resources can be groups of monitored objects, such as storage system and hosts.
Role precedence and inheritanceIf an administrative user has both global and group roles on a group, the less restrictive (morepowerful) of the two roles apply.
For example, if a user is assigned GlobalRead role and GlobalWrite role on a group, that user canview all groups. However, the user can change settings or run commands only on the storage systemsof the specified group.
Role inheritance simplifies the task of assigning roles to administrators by letting you use definedroles. Specifying roles for a parent group implicitly grants those roles on its subgroups. You shouldgrant roles conservatively at higher levels of the group hierarchy and specify additional roles asneeded at the lower levels of the hierarchy.
Creating rolesYou can create roles from the Setup menu in Operations Manager.
Steps
1. Click Setup > Roles.
2. Click Add Capabilities, and from the Capabilities window, select a resource from the resourcetree.
3. Select the operations that you want to allow for the resource and click OK.
4. Optional: To copy capabilities from an existing role, select that role from the InheritCapabilities list and click >> to move the role to the list on the right.
5. Click Add Role.
Modifying rolesYou can edit the roles created by using the Setup menu in Operations Manager.
Steps
1. Click Setup > Roles.
2. Find the role in the list of roles and click edit.
Note: You cannot modify the global administrative roles.
3. From the Edit Role Settings page, modify the basic settings of the role.
4. Click Update.
72 | OnCommand Unified Manager Operations Manager Administration Guide
5. Modify the role inheritance by performing one of the following actions:
• To disinherit a role, select the role from the list on the right, and click “<<" to remove it.• To inherit a role, select the role from the Inherit Capabilities list and click “>>”.
6. Click Update.
What an RBAC resource isAn RBAC resource is an object on which an operation can be performed. In the DataFabric Managerserver RBAC system, these resources include Aggregates, Controllers, Clusters, Volumes, Virtualservers, LUNs, Protection policies, Provisioning policies, vFiler templates, Hosts, and DataFabricManager server Groups (except configuration groups).
A user with the Policy Write capability in the global scope can create schedules and throttles. A userwith the Policy Write capability on the policy can modify data protection policies. Similarly, a userwith the Policy Delete capability on a policy can delete that policy.
Note: On upgrading to DataFabric Manager server 3.6 or later, a user has the followingcapabilities:
• User with the Database Write capability in the global scope is assigned the Policy Writecapability.
• User with the Database Delete capability is assigned the Policy Delete capability.
Granting restricted access to RBAC resourcesYou can grant restricted access to objects or resource groups in the DataFabric Manager server.
Steps
1. Create a user defined role by using the following command:dfm role create role_name
Example
The following example shows you how to create a user role called EventRole using the CLI:
dfm role create EventRol
2. Add the following capabilities to the role created in Step 1:
• Read capability on Global resource for events• Write capability on Global resource for events
Example
The following example shows you how to add the capabilities:
dfm role add EventRole DFM.Event.Read Global
Role-based access control in the DataFabric Manager server | 73

dfm role add EventRole DFM.Event.Write Global
3. Assign the role created in Step 1 to user Everyone, using the following command:dfm user role add Everyone EventRole
Note: You can also use Operations Manager GUI to perform Steps 1 through 3.
4. Open Operations Manager. Read and acknowledge events without logging in.
5. Ensure the user Everyone does not have the capability DFM.Database.Write.
Note: A user with the capability DFM.Database.Write can delete all events.
Access restriction on Windows Administrators group usersThe DataFabric Manager server has the capability of restricting the access of Windows users who arepart of the Administrators group.
When a user with administrator privileges installs the DataFabric Manager server, all WindowsAdministrators group users have GlobalFullControl access even when they are not associated withthe DataFabric Manager server. The access for these Windows Administrators group users can berestricted using dfm global option enableAdministratorRoot.
The default value is yes where all the local administrators continue to have GlobalFullControl accessand can manage the data of the user who installs the DataFabric Manager server. If the option is setto no, the Windows Administrators group users fall under RBAC mechanism. In such a situation, theWindows Administrators group users need to be provided with sufficient RBAC privileges to accessthe DataFabric Manager server. However, they can still run the following commands:
• dfm plugin add
• dfm plugin delete
• dfm keystore rotatekey
• dfm service stop monitor
• dfm service start monitor
• dfm service list
• dfm datastore mirror setup
• dfm datastore mirror destroy
• dfm datastore mirror connect
• dfm autosupport send -e watal
• dfm autosupport view
• dfm backup create
• dfm backup restore
• dfm backup export
• dfm ssl server setup
• dfm service runas
The user who installs the DataFabric Manager server gets GlobalFullControl access. If dfm globaloption enableAdministratorRoot is set to no, then the user who installs the DataFabric
74 | OnCommand Unified Manager Operations Manager Administration Guide
Manager server can add the Windows Administrators group users as dfm users and assign RBACprivileges to them.
Access check for application administratorsThe DataFabric Manager server introduces a new capability requirement to perform access checkusing RBAC.
The Core AccessCheck capability enables application administrators to check the capabilities of anyarbitrary user. For example, if A wants to know the capability of B, A should have the capability tocheck B's capabilities.
When a user configures the client application, the Core AccessCheck capability has to be assigned toa role. Application administrators can check the access permissions of any user, only if they have thepermission to do so.
A client application user who is configured on the DataFabric Manager server with this role allowsthe client application to check the access of all users.
Note: After upgrading to the DataFabric Manager server 3.6 or later, a user with the DatabaseRead capability in the global scope is assigned the Core AccessCheck capability.
How reports are viewed for administrators and rolesYou can view reports for administrators and roles from the CLI.
The following commands are used to generate reports for administrators and roles from the CLI:
• dfm report role-admins—Lists all administrators and the roles they are assigned, sorted byadministrators.
• dfm report admin-roles—Lists all administrators and the roles they are assigned, sorted byrole.
For information about how to use the CLI, see the DataFabric Manager server man pages for dfmreport commands. The man pages specifically describe command organization and syntax.
What global and group access control isGlobal access control authorizes an administrator to view and perform actions on any group in theDataFabric Manager server database. Group access control authorizes the administrator to view andperform actions only on the objects of the groups you specify.
However, the administrator cannot add objects to or remove objects from the groups.
You can apply global or group access control to administrator accounts.
You cannot directly create group access administrator accounts. You must first create a globaladministrator account and then grant access to specific groups. If you want an administrator to haveaccess to specific groups only, create a global administrator account with no roles assigned.
Role-based access control in the DataFabric Manager server | 75

Management of administrator accessYou can manage administrator access on storage systems and vFiler units, to define and control theaccess to the resources, based on the role or job function of a user.
By managing administrator access on storage systems and vFiler units, you can complete thefollowing tasks:
• Manage and control access on storage systems and vFiler units from the DataFabric Managerserver.
• Monitor and manage user groups, local users, domain users and roles on storage systems andvFiler units.
• Create and modify identical local users, roles, and user groups on more than one storage systemor vFiler unit.
• Edit user groups, local users, domain users, and roles on storage systems and vFiler units.• Push user groups, local users, domain users, and roles from a storage system or vFiler unit to
another storage system or vFiler unit.• Modify passwords of local users on a storage system or vFiler unit.
Prerequisites for managing administrator access (7-Mode environmentsonly)
You must ensure that you meet the prerequisites for managing administrator access.
The prerequisites for managing administrator access on storage systems and vFiler units are asfollows:
• You must be using Data ONTAP 7.1 or later.• In the case of local users, you must have the minimum password age, maximum password age,
and status fields, and they are available in Data ONTAP 7.1 and later.• You must be able to reset passwords, and it is available only for storage systems running Data
ONTAP 7.1 and later.• To create or delete roles, user groups, or users on a host, you must have Core Control capability
on the host.• To modify roles, user groups, or users on a host, you must have Core Control and Database Read
capabilities on the host.• To list and view the details of roles, user groups, or users on a host, you must have Database Read
capability on the host.• To push roles, user groups, or users from host A to host B, you must have Database Read
capability on host A and Core Control capability on host B.
76 | OnCommand Unified Manager Operations Manager Administration Guide

Limitations in managing administrator accessRoles, user groups, and users without capabilities are not monitored, except for the user groupBackup Operators and the users belonging to this user group.
User access control for cluster management (clustered environments only)By using Operations Manager, you can create roles and assign capabilities to control user access toselected cluster objects. You can identify users who have the required capabilities to access selectedobjects within a cluster. Only these users are provided access to manage the cluster objects.
When you provide a user with roles and capabilities on an object, the same capabilities are applicableto all the child objects. For example, if you provide a user the Write option on a cluster, the sameWrite option is valid for the controllers, virtual servers, aggregates, and volumes contained in thatcluster.
Summary of the global group (7-Mode environments only)You can view summary that is specific to the global group, which contains storage systems andvFiler units, by selecting Host Users from the Management menu.
Viewing a specific summary page (7-Mode environments only)
You can view the summary page that is specific to a storage system or vFiler unit.
Steps
1. Click Control Center > Home > Member Details > Physical Systems.
2. Click the required storage system or controller link.
3. From the left pane, under Storage Controller Tools, click Host Users Summary.
Viewing users on the host (7-Mode environments only)
You can view the users on a host by using the Host Users report. The Host Users report displaysinformation about the existing users on the host.
Steps
1. From any page, select Management > Host Users.
2. Select Host Users, All from the Report drop-down list.
Who local users are (7-Mode environments only)Local users are the user roles created on storage systems and vFiler units.
Role-based access control in the DataFabric Manager server | 77
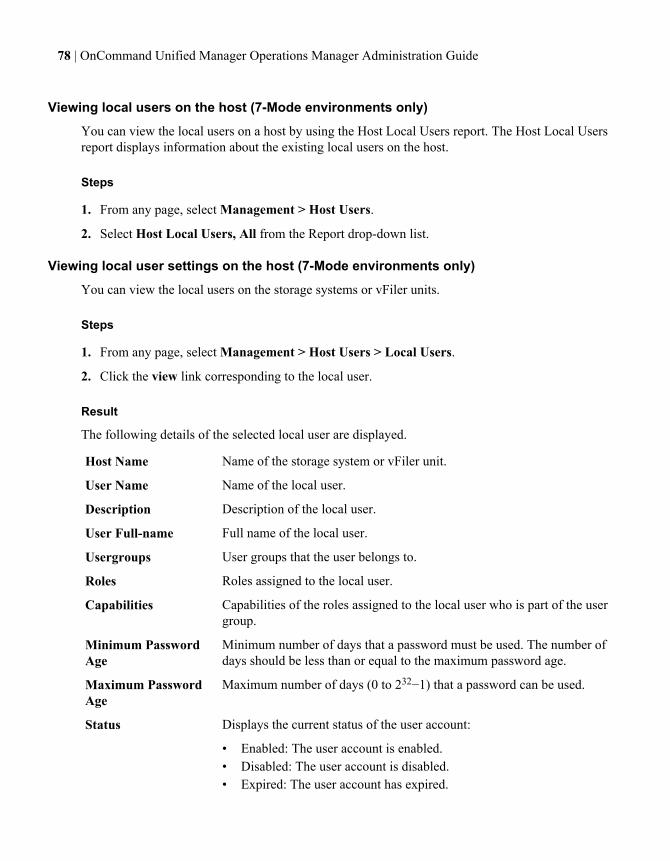
Viewing local users on the host (7-Mode environments only)
You can view the local users on a host by using the Host Local Users report. The Host Local Usersreport displays information about the existing local users on the host.
Steps
1. From any page, select Management > Host Users.
2. Select Host Local Users, All from the Report drop-down list.
Viewing local user settings on the host (7-Mode environments only)
You can view the local users on the storage systems or vFiler units.
Steps
1. From any page, select Management > Host Users > Local Users.
2. Click the view link corresponding to the local user.
Result
The following details of the selected local user are displayed.
Host Name Name of the storage system or vFiler unit.
User Name Name of the local user.
Description Description of the local user.
User Full-name Full name of the local user.
Usergroups User groups that the user belongs to.
Roles Roles assigned to the local user.
Capabilities Capabilities of the roles assigned to the local user who is part of the usergroup.
Minimum PasswordAge
Minimum number of days that a password must be used. The number ofdays should be less than or equal to the maximum password age.
Maximum PasswordAge
Maximum number of days (0 to 232−1) that a password can be used.
Status Displays the current status of the user account:
• Enabled: The user account is enabled.• Disabled: The user account is disabled.• Expired: The user account has expired.
78 | OnCommand Unified Manager Operations Manager Administration Guide

Note: Data ONTAP provides an option to set the maximum number of retries for the password,except for the root login. When the user fails to enter the correct password, after the maximumretries, the user account is disabled. The status of the user account is enabled only if theadministrator resets the password for the user.
The user account expires if the user fails to change the password within the maximum passwordage.
For more information about maximum retries, see the Data ONTAP System Administration Guidefor 7-Mode.
Related information
The IBM N series support website: www.ibm.com/storage/support/nseries
Adding local users to the host (7-Mode environments only)
You can add a local user to a storage system or vFiler unit.
Steps
1. From any page, select Management > Host Users > Local Users.
2. Specify the following parameters:
Host Name Name of the storage system or vFiler unit on which user iscreated.
User Name Name of the local user.
Password Password of the local user.
Confirm Password Confirm the password of the local user.
User Full Name (optional) Full name of the local user.
Description (optional) Description of the local user.
Minimum Password Age(optional)
Minimum number of days that a password must be used.
Maximum Password Age(optional)
Maximum number of days that a password must be used.
Usergroup Membership User groups you want the user to be a member of.
3. Select one or more user groups from the list.
4. Click Local User to add the user.
Role-based access control in the DataFabric Manager server | 79

Editing local user settings on the host (7-Mode environments only)
You can edit the local user settings on a storage system or vFiler unit.
Steps
1. From any page, select Management > Host Users > Local Users.
2. Click the user link in the Edit column corresponding to the local user.
3. Edit the following parameters:
User Full-name Full name of the local user.
Description Description of the local user.
Minimum Password Age (in days) Minimum number of days that a password must be used.
Maximum Password Age (in days) Maximum number of days that a password must be used.
Usergroup Membership User groups you want to be a member of.
Note: You cannot edit Host Name and User Name in the Edit Local User section.
4. Select one or more user groups from the list.
5. Click Update.
Users with Execute capability (7-Mode environments only)
The DataFabric Manager server users with Execute capability can reset the password of a local useron a storage system or vFiler unit by using the credentials that are stored in the database.
Users who do not have the Execute capability can modify the password by using the credentials thatare provided.
Pushing passwords to a local user (7-Mode environments only)
You can push an identical password to a local user on multiple storage systems or vFiler units.
Steps
1. From any page, select Management > Host Users > Local Users.
2. From the list of existing local users, click the password link in the Push column corresponding tothe local user.
80 | OnCommand Unified Manager Operations Manager Administration Guide
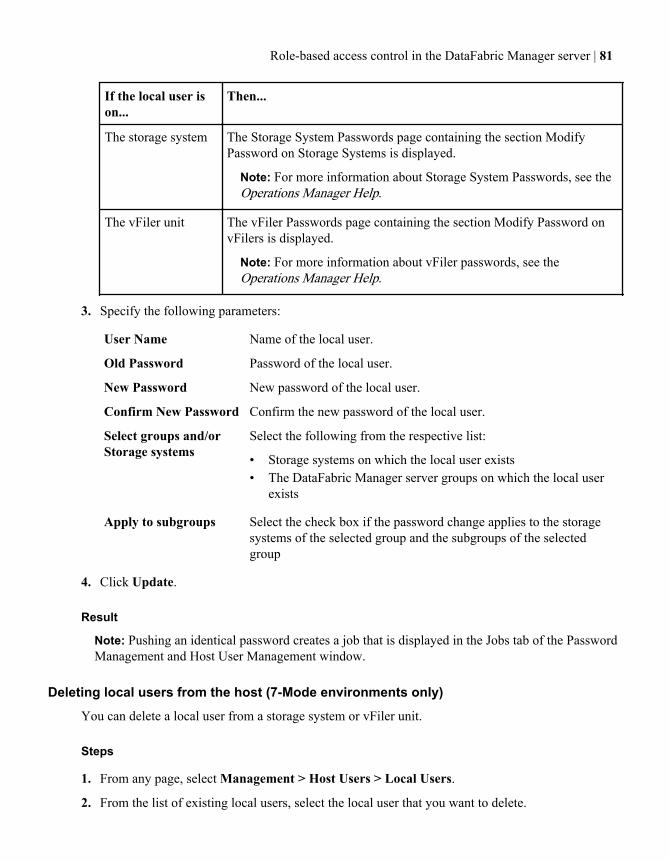
If the local user ison...
Then...
The storage system The Storage System Passwords page containing the section ModifyPassword on Storage Systems is displayed.
Note: For more information about Storage System Passwords, see theOperations Manager Help.
The vFiler unit The vFiler Passwords page containing the section Modify Password onvFilers is displayed.
Note: For more information about vFiler passwords, see theOperations Manager Help.
3. Specify the following parameters:
User Name Name of the local user.
Old Password Password of the local user.
New Password New password of the local user.
Confirm New Password Confirm the new password of the local user.
Select groups and/orStorage systems
Select the following from the respective list:
• Storage systems on which the local user exists• The DataFabric Manager server groups on which the local user
exists
Apply to subgroups Select the check box if the password change applies to the storagesystems of the selected group and the subgroups of the selectedgroup
4. Click Update.
Result
Note: Pushing an identical password creates a job that is displayed in the Jobs tab of the PasswordManagement and Host User Management window.
Deleting local users from the host (7-Mode environments only)
You can delete a local user from a storage system or vFiler unit.
Steps
1. From any page, select Management > Host Users > Local Users.
2. From the list of existing local users, select the local user that you want to delete.
Role-based access control in the DataFabric Manager server | 81

3. Click Delete Selected.
Pushing local users to hosts (7-Mode environments only)
You can push a local user to a group of storage systems or vFiler units.
Steps
1. From any page, select Management > Host Users > Local Users.
2. Select the DataFabric Manager server group or storage system on which you want to push thelocal user.
3. Select OK in the Resources dialog box.
4. Click Push.
Result
Note: Pushing local users to a host creates a job that is displayed in the Jobs tab of the Host UserManagement window.
Monitoring changes in the local user configuration (7-Mode environments only)
You can monitor changes in the local user configuration on a storage system or vFiler unit.
Steps
1. Click Setup > Alarms.
2. Create a new alarm for the Host User Modified event.
Editing passwords of local users (7-Mode environments only)
You can edit the password of a local user on a storage system or vFiler unit.
Steps
1. From any page, select Management > Host Users > Local Users.
2. Click the password link in the Edit column corresponding to the local user.
Note: You cannot edit the host name and user name in the Edit Password page.
3. Enter the old password.
4. Enter the new password.
5. Confirm the new password.
6. Click Update.
82 | OnCommand Unified Manager Operations Manager Administration Guide
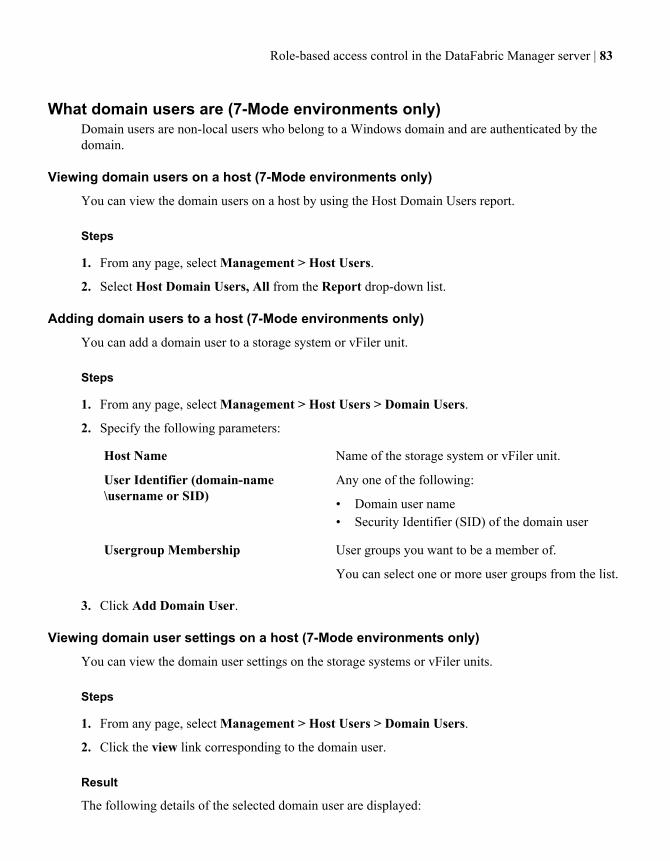
What domain users are (7-Mode environments only)Domain users are non-local users who belong to a Windows domain and are authenticated by thedomain.
Viewing domain users on a host (7-Mode environments only)
You can view the domain users on a host by using the Host Domain Users report.
Steps
1. From any page, select Management > Host Users.
2. Select Host Domain Users, All from the Report drop-down list.
Adding domain users to a host (7-Mode environments only)
You can add a domain user to a storage system or vFiler unit.
Steps
1. From any page, select Management > Host Users > Domain Users.
2. Specify the following parameters:
Host Name Name of the storage system or vFiler unit.
User Identifier (domain-name\username or SID)
Any one of the following:
• Domain user name• Security Identifier (SID) of the domain user
Usergroup Membership User groups you want to be a member of.
You can select one or more user groups from the list.
3. Click Add Domain User.
Viewing domain user settings on a host (7-Mode environments only)
You can view the domain user settings on the storage systems or vFiler units.
Steps
1. From any page, select Management > Host Users > Domain Users.
2. Click the view link corresponding to the domain user.
Result
The following details of the selected domain user are displayed:
Role-based access control in the DataFabric Manager server | 83
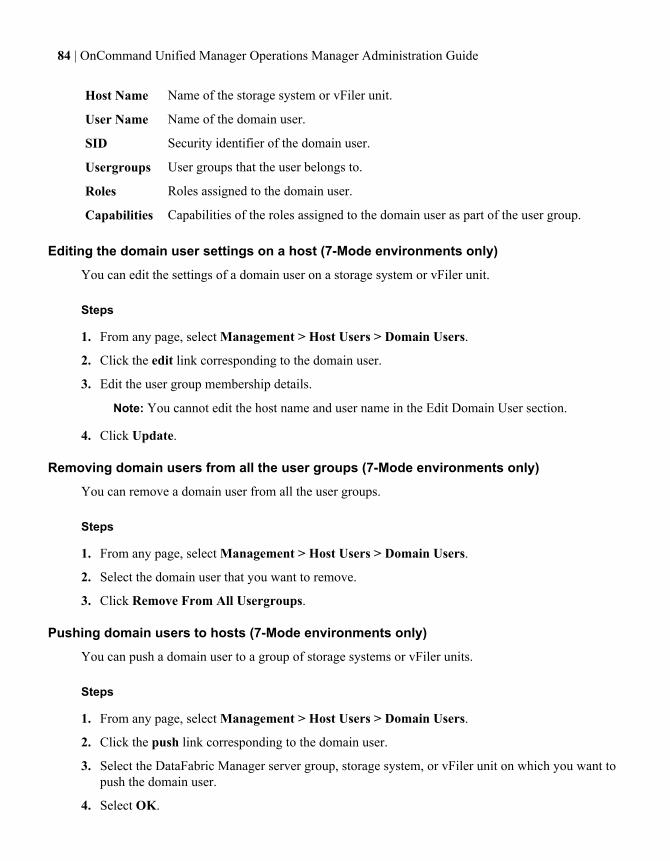
Host Name Name of the storage system or vFiler unit.
User Name Name of the domain user.
SID Security identifier of the domain user.
Usergroups User groups that the user belongs to.
Roles Roles assigned to the domain user.
Capabilities Capabilities of the roles assigned to the domain user as part of the user group.
Editing the domain user settings on a host (7-Mode environments only)
You can edit the settings of a domain user on a storage system or vFiler unit.
Steps
1. From any page, select Management > Host Users > Domain Users.
2. Click the edit link corresponding to the domain user.
3. Edit the user group membership details.
Note: You cannot edit the host name and user name in the Edit Domain User section.
4. Click Update.
Removing domain users from all the user groups (7-Mode environments only)
You can remove a domain user from all the user groups.
Steps
1. From any page, select Management > Host Users > Domain Users.
2. Select the domain user that you want to remove.
3. Click Remove From All Usergroups.
Pushing domain users to hosts (7-Mode environments only)
You can push a domain user to a group of storage systems or vFiler units.
Steps
1. From any page, select Management > Host Users > Domain Users.
2. Click the push link corresponding to the domain user.
3. Select the DataFabric Manager server group, storage system, or vFiler unit on which you want topush the domain user.
4. Select OK.
84 | OnCommand Unified Manager Operations Manager Administration Guide
5. Click Push.
Monitoring changes in the domain user configuration (7-Mode environments only)
You can monitor the changes in the domain user configuration on a storage system or vFiler unit.
Steps
1. Click Setup > Alarms.
2. Create an alarm for the Host Domain User Modified event.
What user groups are (7-Mode environments only)User groups are groups to which the users belong.
Viewing user groups on a host (7-Mode environments only)
You can view the user groups on a host by using the Host Usergroups report.
Steps
1. From any page, select Management > Host Users.
2. Select Host Usergroups, All from the Report drop-down list.
Adding user groups to a host (7-Mode environments only)
You can add a user group to a storage system or vFiler unit.
Steps
1. From any page, select Management > Host Users > Usergroups.
2. Specify the following parameters:
Host Name Name of the storage system or vFiler unit.
Usergroup Name Name of the user group.
Description Description of the user group.
Select Roles Capabilities of the roles.
You can select one or more roles.
3. Click Add Usergroup.
Role-based access control in the DataFabric Manager server | 85

Viewing the user group settings on a host (7-Mode environments only)
You can view the user group settings on storage systems or vFiler units.
Steps
1. From any page, select Management > Host Users > Usergroups.
2. Click the view link corresponding to the user group.
Result
The following details of the selected user group are displayed:
Host Name Name of the storage system or vFiler unit.
Usergroup Name Name of the user group.
Description Description of the user group.
Roles Roles assigned to the user group.
Capabilities Capabilities of the user group.
Editing the user group settings on a host (7-Mode environments only)
You can edit the user group settings on a storage system or vFiler unit.
Steps
1. From any page, select Management > Host Users > Usergroups.
2. Click the edit link corresponding to the user group that you want to edit.
3. Edit the following parameters:
Usergroup Name Name of the user group.
Description Description of the user group.
Select Roles Capabilities of the roles.
Note: You cannot edit the host name in the Edit Usergroup section.
4. Select one or more roles.
5. Click Update.
86 | OnCommand Unified Manager Operations Manager Administration Guide
Deleting user groups from a host (7-Mode environments only)
You can delete a user group from a storage system or vFiler unit.
Steps
1. From any page, select Management > Host Users > Usergroups.
2. Select the user group that you want to delete.
3. Click Delete Selected.
Pushing user groups to hosts (7-Mode environments only)
You can push identical user groups to a group of storage systems or vFiler units.
Steps
1. From any page, select Management > Host Users > Usergroups.
2. Click the push link of the user group that you want to push to other storage systems or vFilerunits.
3. Select the DataFabric Manager server group, storage system or vFiler unit to which you want topush the user group.
4. Select OK.
5. Click Push.
Monitoring changes in the user group configuration (7-Mode environments only)
You can monitor changes in the user group configuration on a storage system or vFiler unit.
Steps
1. Click Setup > Alarms.
2. Create an alarm for the Host Usergroup Modified event.
What roles are (7-Mode environments only)A role is a set of capabilities that can be assigned to a group. You can predefine a role, or you cancreate or modify a role.
Viewing roles on hosts (7-Mode environments only)
You can view the role settings on storage systems or vFiler units by using the Host Roles report.
Steps
1. From any page, click Management > Host Users.
Role-based access control in the DataFabric Manager server | 87
2. Select Host Roles, All from the Report drop-down list.
Adding roles to a host or user (7-Mode environments only)
You can add a role to a storage system, vFiler unit, or user.
Steps
1. From any page, select Management > Host Users > Roles.
2. Specify the following parameters:
Host Name Name of the storage system, vFiler unit, or user.
Role Name Name of the role.
Description Description of the role.
Capabilities Capabilities of the role.
3. Click the Add Capabilities link and select one or more capabilities that you want to add.
4. Click OK.
5. Click Add Role.
Viewing the role settings on a host (7-Mode environments only)
You can view the role settings on storage systems or vFiler units.
Steps
1. From any page, select Management > Host Users > Roles.
2. Click the view link corresponding to the host role.
Result
The following details of the selected host role are displayed:
Host Name Name of the storage system or vFiler unit.
Role Name Name of the role.
Description Description of the role.
Capabilities Capabilities of the role.
88 | OnCommand Unified Manager Operations Manager Administration Guide
Editing the role settings on a host (7-Mode environments only)
You can edit a role on a storage system or vFiler unit.
Steps
1. From any page, select Management > Host Users > Roles.
2. Click the edit link corresponding to the host role that you want to edit.
3. Edit the following parameters:
Description Description of the role.
Capabilities Capabilities of the role.
Click the Edit Capabilities link.
Note: You cannot edit the host name and role name in the Edit Role section.
4. Select one or more capabilities that you want to add.
5. Click Ok.
6. Click Update.
Deleting roles from a host (7-Mode environments only)
You can delete a role from a storage system or vFiler unit.
Steps
1. From any page, select Management > Host Users > Roles.
2. Select the host role that you want to delete.
3. Click Delete Selected.
Pushing roles to the hosts (7-Mode environments only)
You can push identical roles to a group of storage systems or vFiler units.
Steps
1. From any page, select Management > Host Users > Roles.
2. Click the push link of the host role that you want to push to other storage systems or vFiler units.
3. Select the DataFabric Manager server group or storage system to which you want to push therole.
4. Select OK.
Role-based access control in the DataFabric Manager server | 89

5. Click Push.
Monitoring changes in the role configuration (7-Mode environments only)
You can monitor the changes in the role configuration on a storage system or vFiler unit.
Steps
1. Click Setup > Alarms.
2. Create an alarm for the Host Role Modified event.
What jobs display (7-Mode environments only)Jobs display the status of the push jobs.
Viewing push jobs (7-Mode environments only)
You can view the status of the push jobs.
Step
1. Click Management > Host Users > Jobs.
Deleting push jobs (7-Mode environments only)
You can delete a push job.
Steps
1. Select the push job that you want to delete.
2. Click Delete.
90 | OnCommand Unified Manager Operations Manager Administration Guide

What groups and objects areA group is a collection of the DataFabric Manager server objects. Storage system elements that aremonitored by the DataFabric Manager server, such as storage systems, aggregates, file systems(volumes and qtrees), and logical unit numbers (LUNs), are referred to as objects.
You can group objects based on characteristics such as the operating system of a storage system(Data ONTAP version), the storage systems at a location, or all the file systems that belong to aspecific project or group in your organization.
You can add the following list of DataFabric Manager server objects to a resource group:
• Host (can include storage systems, Host Agents, virtual servers (clustered environments only),and vFiler units (7-Mode environments only))
• Volume• Qtree• Configuration• LUN path• Aggregate• Disk• Dataset (7-Mode environments only)• Resource pool (7-Mode environments only)
You should consider the following information when creating groups:
• You can group similar or different objects in a group.• An object can be a member of any number of groups.• You can group a subset of group members to create a new group.• You cannot create a group of groups.• You can create any number of groups.• You can copy a group or move a group in a group hierarchy.
What group types areThe DataFabric Manager server automatically determines the type of a group based on the objects itcontains. If you place your cursor over an icon, to the left of a group name, on the left side ofOperations Manager main window, you can quickly find out the type of objects the group contains.
What homogeneous groups areYou can group objects into sets of objects with common characteristics. For example, they might berunning the same operating system or belong to a specific project or group in your organization.
You can create the following types of groups:
91

• Appliance resource group ( )—contains storage systems, vFiler units, and host agents
• Aggregate resource group ( )—contains aggregates only
• File system resource group ( )—contains volumes and qtrees
• LUN resource group ( )—contains LUNs only
• Configuration resource group ( )—contains storage systems associated with one or moreconfiguration files
• Dataset—is the data that is stored in a collection of primary storage containers, including all thecopies of the data in those containers
• Resource pool—is a collection of storage objects from which other storage containers areallocated
Note: For more information about datasets and resource pools, see the OnCommand UnifiedManager Guide to Common Provisioning and Data Protection Workflows for 7-Mode.
Related information
The IBM N series support website: www.ibm.com/storage/support/nseries
What mixed-type groups areYou can add objects of different types to the same group. Grouping objects from differenthomogeneous groups also constitutes a mixed-type group. For example, a mixed-type group can havea group of vFiler units and volumes. You can also group objects based on their geographical location,or by the client, they support.
Configuration resource groups can contain only storage systems, vFiler units, and configurations.Once created, you cannot add any objects to the configuration resource group in the DataFabricManager server. The elements of a configuration resource group cannot be a part of any otherhomogeneous group. The DataFabric Manager server prevents you from adding other object types toconfiguration resource groups. If a group already contains objects other hosts, you cannot add aconfiguration file to the group.
What a Global group isAll objects monitored by DataFabric Manager server belong to the global group. By default, a groupcalled global exists in the DataFabric Manager server database. All subgroups created also belong tothe global group.
You cannot delete or rename the global group. When you delete an object, the DataFabric Managerserver stops monitoring and reporting data for that object. Data collection and reporting is notresumed until the object is added back (recovered) to the database.
92 | OnCommand Unified Manager Operations Manager Administration Guide

What hierarchical groups areIn addition to creating groups of objects, you can create subgroups within groups to establish ahierarchy of groups.
Hierarchical groups help you manage administrative privileges, because privileges granted to aparent group are implicitly granted to all its subgroups. Besides, following are the benefits of havinghierarchical groups:
• You can determine the capacity of the group and the chargeback options.• You can keep a record of trending, that is, the data growth rate of the group.• You can select arguments for reports to be generated.
Creating groupsYou can create a new group from the Edit Groups page. You can group objects based on storagesystems at a location, or all file systems that belong to a specific project or group in yourorganization.
Before you begin
To create a group, you must be logged in as an administrator with a role having Database Writecapability on the parent group. To create a group directly under the Global group, the administratormust have a role with Database Write capability on the Global group.
Steps
1. From the Control Center, click the Edit Groups.
2. In the Group Name field, type the name of the group you want to create.
3. From the list of groups, select the parent group for the group you are creating.
You might need to expand the list to display the parent group you want.
4. Click Add.
Result
The new group is created. The Current Groups list in the left-pane area is updated with the newgroup. You might need to expand the Current Groups list to display the new group.
What groups and objects are | 93
Creating groups from a reportYou can create a new group from a report in Operations Manager.
Steps
1. From the Control Center, click the Member Details tab.
2. Click one of the following tabs: Aggregate, File Systems, or LUN.
3. To the left of the list of objects in the main window, select the check boxes for the objects thatyou want to add to the group.
4. At the bottom left of the main window, click Add to New Group.
5. In the Group Name field, type the name of the group you want to create.
6. From the list of groups, select the parent group for the group you are creating.
You might have to expand the list to display the parent group that you want.
7. Click Add.
Result
The Current Groups list in the left-pane area is updated and displays the new group. You might haveto expand the Current Groups list to display the new group.
What configuration resource groups areA configuration resource group is a group of storage systems that share a set of commonconfiguration settings. A configuration resource group allows you to designate groups of managedstorage systems that can be remotely configured to share the same configuration settings.
A configuration resource group must contain some number of storage systems and have one or morefiles containing the desired configuration settings. These configuration settings are listed in filescalled configuration files. Configuration files exist independently of groups, and can be sharedbetween groups. You can use Operations Manager to create configuration files and to specify theconfiguration settings that you want to include in them.
With Operations Manager, you can create and manage configuration files that contain configurationsettings you want to apply to a storage system and vFiler unit or groups of storage systems and vFilerunits. By using the storage system configuration management feature, you can pull configurationsettings from one storage system and vFiler unit and push the same or a partial set of settings to otherstorage systems or groups of storage systems and vFiler units. While pushing the configurationssettings, you must ensure that storage system and vFiler unit configuration conforms to theconfiguration pushed to it from Operations Manager.
When you create configuration resource groups, consider the following:
94 | OnCommand Unified Manager Operations Manager Administration Guide

• Storage systems running on different operating system versions can be grouped in the sameconfiguration resource group.
• A storage system can belong to only one configuration resource group.• A configuration resource group must have one or more configuration files associated with it.
Otherwise, storage systems cannot be configured remotely.• For configuration management, appropriate plug-ins must be associated.• You cannot run any reports for a configuration resource group.
Besides specifying configuration settings by associating individual configuration files with a groupof storage systems, you can also specify another configuration resource group from which to acquireconfiguration settings. Such a group is known as a parent group. For example, a previously createdconfiguration resource group might already have most or all, of the settings you require.
Guidelines for creating groupsBefore creating a group, you should figure out how you want to configure the group, what thepurpose of the group is, and how the groups affect your environment. For example, if you create toomany groups, your environment could slow down.
You should consider the following guidelines:
• You can group similar or mix-types objects in a group.• An object can be a member of any number of groups.• You can group a subset of group members to create a new group.• You can copy to a group or move to a group in a group hierarchy.
However, a parent group cannot be moved to its child group.
Guidelines for creating configuration resource groupsYou must use a set of guidelines when you create Configuration Resource groups.
Use the following guidelines when you create Configuration Resource groups:
• You can include storage systems, and vFiler units, with different model types and softwareversions.
• Storage system, and vFiler unit, can be a member of only one configuration resource group, butcan still be a member of multiple groups for monitoring purposes.
• You cannot create a group of Configuration Resource groups.• To apply settings to a Configuration Resource group, you must associate one or more
configuration files with the group.
What groups and objects are | 95

Guidelines for adding vFiler units to the appliance resourcegroup (7-Mode environments only)
You must consider a set of guidelines before adding vFiler units to a resource group.
• You can add vFiler units as members to an Appliance Resource group.The hosting storage system and the storage resources (qtrees, volumes, and LUNs) assigned to thevFiler unit are also added as indirect members. When you remove a vFiler unit from a group, itsrelated hosting storage system and storage resources are also removed.
• If you add a hosting storage system that is configured with vFiler units to a group, the vFiler unitsare also added as indirect members.When you remove a hosting storage system from a group, its vFiler units are also removed.
• If you add a storage resource assigned to a vFiler unit to a group, the vFiler unit is also added asan indirect member.you remove the storage resources from a group, the vFiler unit is also removed.
Note: Indirect members are considered for determining the group status.
Editing group membershipIn Operations Manager, you can add members to a group.
Steps
1. Go to the Groups area on the left side of Operations Manager and expand the list as needed todisplay the group to which you want to add members.
2. Click the name of the group to which you want to add members.
3. From the Current Group menu at the lower left of Operations Manager, click EditMembership.
4. Select the object from the Choose from All Available list and click >> to move the object to thelist at the right.
Operations Manager adds the selection to the group and updates the membership list displayed onthe right side of the Edit Group Membership area.
96 | OnCommand Unified Manager Operations Manager Administration Guide

What group threshold settings areGroup thresholds determine at what point you want the DataFabric Manager server to generateevents regarding capacity problems with object groups. You can create an alarm for a group to sendnotification to designated recipients whenever a storage event occurs.
The thresholds you can change depend on the type of objects in a group. For example, you canchange Appliance CPU Too Busy Threshold for only an Appliance Resource group. You can changeVolume Full Threshold and Volume Nearly Full Threshold for only a File System Resource Group.
For a list of thresholds you can change for an object type, see the chapter where that type of object isthe main topic of discussion in this guide.
Note: When you apply threshold changes to a group, the new threshold values are associated withthe objects in the group. These new threshold values are not associated with the group. That is, ifyou add another object to a group, after applying a threshold change, the threshold value of thenew object is not changed. The threshold value of the new object does not change if it is differentfrom the current group. Additionally, if you apply threshold changes to an object that belongs tomultiple groups, the threshold value is changed for this object across all groups.
For information about how to change the thresholds for a group of objects, see the OperationsManager Help.
What group reports areGrouping objects enables you to view consolidated data reports, events, and status of objects.
For example, you can view the total storage capacity used, or events generated by all manufacturingstorage systems, by creating a group of the storage systems, and using the Summary tab ofOperations Manager.
What summary reports areSummary reports are available for all groups, including the Global group.
• Status• Group members• Storage capacity used and available• Events• Storage chargeback information• Monitored devices• Physical space• Storage system operating systems
What groups and objects are | 97

• Storage system disks• Capacity graphs
Note: You can view additional reports that focus on the objects in a group by clicking the name ofthe group and then clicking the appropriate Operations Manager tab.
What subgroup reports areIf you run a report on a group with subgroups, the data displayed includes data on applicable objectsin the subgroups. You do not see data about other object types in the parent group or the subgroups.
If you display the Aggregate Capacity Graph report on a parent group containing aggregates, you seedata about the aggregates in the parent group. You can also see data about the aggregates in itssubgroups.
If you run a report on a mixed-type object group, Operations Manager runs the report on groupmembers of the applicable type. For example, qtrees for the Qtree Growth report. OperationsManager combines the results, and then eliminates duplicates, if any.
What cluster-related objects are (clustered environmentsonly)
Operations Manager enables you to include cluster-related objects, such as nodes and Vservers, in agroup. This enables you to easily monitor cluster-related objects that belong to a particular group.
Note: This document discusses features that are associated with Data ONTAP 8.x Cluster-Mode,which is currently not offered by IBM.
The cluster-related objects are as follows:
Vserver A single file-system namespace. A Vserver has separate network access andprovides the same flexibility and control as a dedicated node. Each Vserver hasits own user domain and security domain. It can span multiple physical nodes.
A Vserver has a root volume that constitutes the top level of the namespacehierarchy; additional volumes are mounted to the root volume to extend thenamespace. A Vserver is associated with one or more logical interfaces (LIFs)through which clients access the data on the storage server. Clients can accessthe Vserver from any node in the cluster, but only through the logical interfacesthat are associated with the Vserver.
Namespace Every Vserver has a namespace associated with it. All the volumes associatedwith a Vserver are accessed under the server's namespace. A namespace providesa context for the interpretation of the junctions that link together a collection ofvolumes.
98 | OnCommand Unified Manager Operations Manager Administration Guide
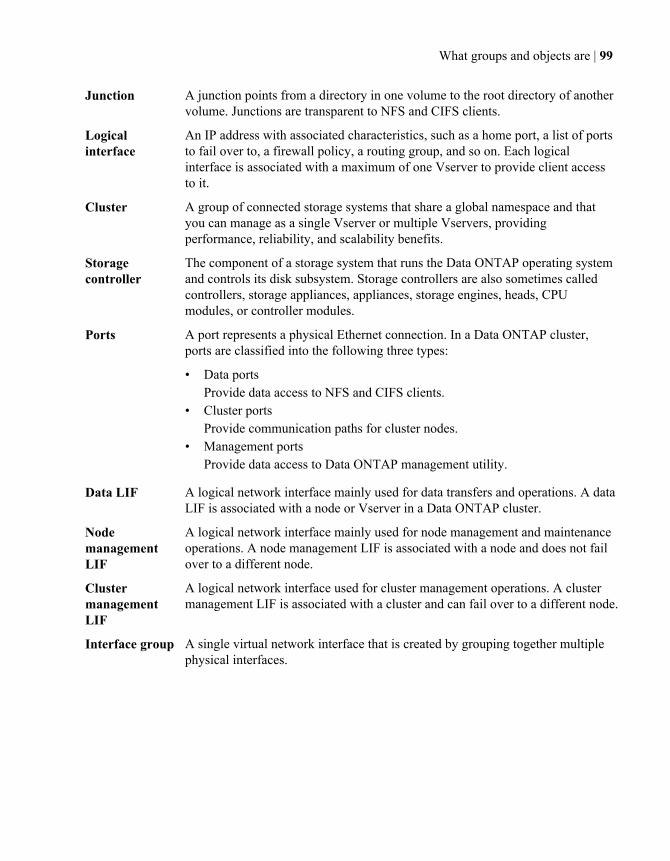
Junction A junction points from a directory in one volume to the root directory of anothervolume. Junctions are transparent to NFS and CIFS clients.
Logicalinterface
An IP address with associated characteristics, such as a home port, a list of portsto fail over to, a firewall policy, a routing group, and so on. Each logicalinterface is associated with a maximum of one Vserver to provide client accessto it.
Cluster A group of connected storage systems that share a global namespace and thatyou can manage as a single Vserver or multiple Vservers, providingperformance, reliability, and scalability benefits.
Storagecontroller
The component of a storage system that runs the Data ONTAP operating systemand controls its disk subsystem. Storage controllers are also sometimes calledcontrollers, storage appliances, appliances, storage engines, heads, CPUmodules, or controller modules.
Ports A port represents a physical Ethernet connection. In a Data ONTAP cluster,ports are classified into the following three types:
• Data portsProvide data access to NFS and CIFS clients.
• Cluster portsProvide communication paths for cluster nodes.
• Management portsProvide data access to Data ONTAP management utility.
Data LIF A logical network interface mainly used for data transfers and operations. A dataLIF is associated with a node or Vserver in a Data ONTAP cluster.
NodemanagementLIF
A logical network interface mainly used for node management and maintenanceoperations. A node management LIF is associated with a node and does not failover to a different node.
ClustermanagementLIF
A logical network interface used for cluster management operations. A clustermanagement LIF is associated with a cluster and can fail over to a different node.
Interface group A single virtual network interface that is created by grouping together multiplephysical interfaces.
What groups and objects are | 99

Creating a group of cluster objects (clustered environments only)By using Operations Manager, you can create a group of cluster objects for easier administration andaccess control. You can add objects such as clusters, controllers, aggregates, volumes, and virtualservers to a group.
Steps
1. Click Control Center > Home > Member Details > Physical Systems > Report.
Example
The navigational path to create a group of virtual servers is Control Center > Home > MemberDetails > Virtual Systems > Report > Virtual Servers, All.
2. Depending on the cluster objects you want to group, select the appropriate report from the Reportdrop-down list.
3. In the resulting report, select the cluster objects you want to include in a group.
4. Click Add To New Group.
5. In the Group Name field, enter a name for the group.
6. Select an appropriate parent for your new group.
7. Click Add.
100 | OnCommand Unified Manager Operations Manager Administration Guide

Storage monitoring and reportingMonitoring and reporting functions in the DataFabric Manager server depend on event generation.You must configure the settings in Operations Manager to customize monitoring and to specify howand when you want to receive event notifications.
Operations Manager allows you to generate summary and detailed reports. Depending on which tabyou select, Operations Manager returns the appropriate graph or selection of reports (for example,reports about storage systems, volumes, and disks).
The DataFabric Manager server monitoring processThe DataFabric Manager server discovers the storage systems supported on your network. TheDataFabric Manager server periodically monitors data that it collects from the discovered storagesystems, such as CPU usage, interface statistics, free disk space, qtree usage, and chassisenvironmental. The DataFabric Manager server generates events when it discovers a storage system,when the status is abnormal, or when a predefined threshold is breached. If configured to do so, theDataFabric Manager server sends a notification to a recipient when an event triggers an alarm.
The following flow chart illustrates the DataFabric Manager server monitoring process.
101
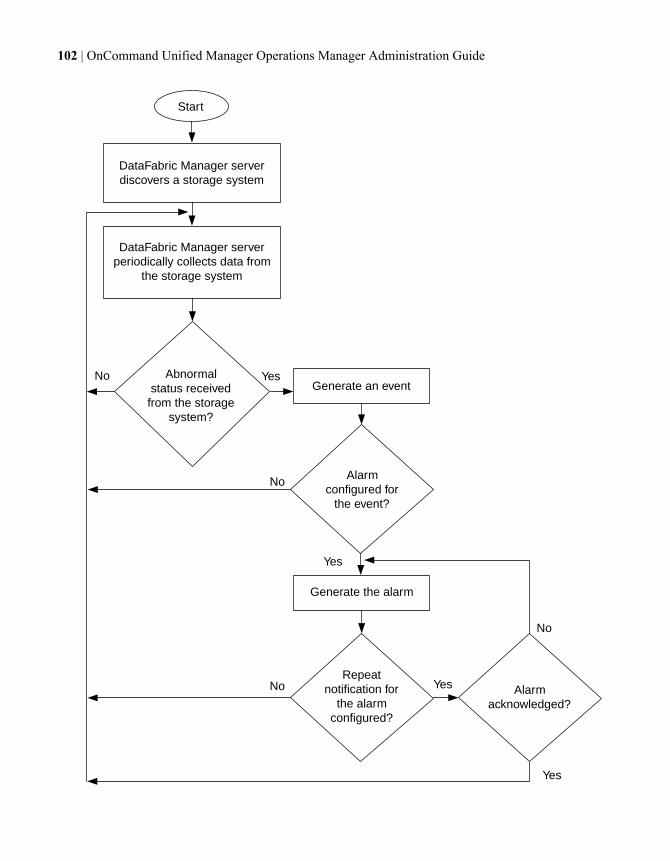
Start
DataFabric Manager server discovers a storage system
DataFabric Manager server periodically collects data from
the storage system
Abnormal status received from the storage
system?
Generate an event
Generate the alarm
Alarm configured for
the event?
Repeat notification for
the alarm configured?
Alarm acknowledged?
No
No
No
No
Yes
Yes
Yes
Yes
102 | OnCommand Unified Manager Operations Manager Administration Guide

Cluster monitoring with Operations Manager (clusteredenvironments only)
You can use Operations Manager to discover and monitor storage systems in cluster environmentsand generate reports. Operations Manager uses SNMP or XML APIs for cluster monitoring.
What the cluster-management LIF is (clustered environments only)The cluster-management LIF is a virtual network interface that enables you to perform clustermanagement operations. This LIF is associated with a cluster and can be failed over to a differentnode.
The cluster-management LIF is associated with a cluster management server to provide a detailedview of the cluster. Operations Manager monitors clusters by using the appropriate SNMP version orAPIs. You can gather information about the cluster resources, controller resources, and Vserverresources from the cluster-management LIF.
Information available on the Cluster Details page (clustered environmentsonly)
The Cluster Details page for a cluster provides information, such as the cluster hierarchy, status ofthe cluster, number of logical interfaces, and ports. You can access the Clusters Details page byclicking the cluster name from any of the cluster reports.
The Cluster Details page displays the following cluster-related information:
• Status of the cluster• Serial number• Uptime• Primary IP address• Number of controllers• Number of Vservers• Number of ports• Number of logical interfaces• Contact and location• Current events that have the cluster as the source• Storage capacity• Groups to which the cluster belongs• List of the most recent polling sample date and the polling interval of all the events monitored for
the cluster• Graphs that display the following information:
• Volume capacity used• Volume capacity used versus total capacity
Storage monitoring and reporting | 103

• Aggregate capacity used• Aggregate capacity used versus total capacity• Aggregate space, usage versus committed• CPU usage (in percentage)• NFS Operations/sec• NFS and CIFS Operations/second• CIFS Operations/second• Network Traffic/second• Logical Interface Traffic/second
Tasks performed from the Cluster Details page (clustered environments only)
You can perform various cluster management tasks from the Cluster Details page, such as viewingthe resource utilization and gathering information about cluster objects. You can access the ClustersDetails page by clicking the cluster name from any of the cluster reports.
You can perform the following tasks from the Cluster Details page:
• Exploring the physical view of the systemYou can gather information about cluster objects through reports. For example, by clicking thenumber corresponding to the Controllers link, you can view the details of those controllers fromthe Controllers, All report.
• Viewing the total utilization of physical resourcesYou can view the total utilization of physical resources, including CPU usage, network traffic atthe cluster level, and volume capacity used. You can also view, as graphs, the information aboutthe corresponding resources.
• Browsing the cluster and its objectsYou can browse through the cluster and its objects from the "Cluster Hierarchy" section in theCluster Details page. You can also browse to the corresponding report of a particular object. Forexample, you can expand the cluster, view the list of Vservers, and then click a specific Vserverto view its details on the corresponding Virtual Server Details page.
Viewing the utilization of resourcesYou can view the graphical representation of the utilization of various physical and logical resourcesfrom the Details page in Operations Manager.
Viewing the utilization of logical resources (clustered environments only)
By using Operations Manager, you can view, in graphs, the utilization of your logical resources, suchas Vservers, logical interface traffic to the Vserver, and volumes. You can also configure alarms tosend notification whenever the utilization exceeds preset thresholds.
Steps
1. Click Control Center > Home > Member Details > Virtual Systems > Report > VirtualServers, All.
104 | OnCommand Unified Manager Operations Manager Administration Guide
2. Click the name of the Vserver for which you want to view the utilization of logical resources.
3. In the Virtual Server Details page, select the appropriate graph from the drop-down menu.
You can view the utilization graph on a daily, weekly, monthly, quarterly, or yearly basis. Forexample, to view the Vserver's volume capacity used for one year, you can select VolumeCapacity Used and click 1y.
Viewing the utilization of physical resources
By using Operations Manager, you can view the graphical representation of the utilization of yourphysical resources such as CPU, network traffic to the controller, and so on.
Steps
1. Click Control Center > Home > Member Details > Physical Systems > Report > Controllers,All.
2. Click the name of the controller for which you want to view the utilization of physical resources.
3. In the Storage Controller Details page, select the appropriate graph from the drop-down menu.You can view the utilization graph on a daily, weekly, monthly, quarterly, or yearly basis. Forexample, to view the controller’s CPU usage for a period of one year, you can select CPU Usage(%) and click 1y.
Links to FilerView (7-Mode environments only)In DataFabric Manager server 2.3 and later, UI pages that display information about some
DataFabric Manager server objects contain links to FilerView (indicated by the icon ). FilerViewis a Web-based UI for managing storage systems.
When you click the icon , you are connected to the FilerView location where you can viewinformation about and make changes to the object whose icon you clicked. Depending on your setup,you might have to authenticate the storage system whose FilerView you are connecting to, by usingone of the administrator user accounts on the storage system.
Note: Links to FilerView are not available for systems running Data ONTAP 8.1 or later operatingin 7-Mode.
Query intervalsThe DataFabric Manager server uses periodic SNMP queries to collect data from the storage systemsit discovers. The data is reported by the DataFabric Manager server in the form of tabular andgraphical reports and event generation.
The time interval at which an SNMP query is sent depends on the data being collected. For example,although the DataFabric Manager server pings each storage system every minute to ensure that the
Storage monitoring and reporting | 105

storage system is reachable, the amount of free space on the disks of a storage system is collectedevery 30 minutes.
Guidelines for changing monitoring intervalsThe SNMP query time intervals are specified by the global monitoring option that is located in theMonitoring Options section of the Options page. Although you should generally keep the defaultvalues, you might need to change some of the options to suit your environment. All the monitoringoption values apply to all storage systems in all groups.
If you decrease the monitoring intervals, you receive more real-time data. However, the DataFabricManager server queries the storage systems more frequently, thereby increasing the network trafficand the load on the DataFabric Manager server and the storage systems responding to the queries.
If you increase the monitoring interval, the network traffic and the storage system load are reduced.However, the reported data might not reflect the current status or condition of a storage system.
DataFabric Manager server 3.1 and later includes an SNMP trap listener that improves the speed ofevent generation.
Related concepts
What SNMP trap listener is on page 106
What SNMP trap listener isIn addition to periodically sending out SNMP queries, DataFabric Manager server 3.1 and laterinclude an SNMP trap listener as part of the server service. Event generation and alerting is fasterthan with SNMP queries because the proper monitoring mechanism is started immediately after theSNMP trap is received. In addition, monitoring is performed asynchronously, instead of waiting forthe monitoring interval.
The SNMP trap listener listens for SNMP traps from monitored storage systems, if they have beenmanually configured to send traps to the DataFabric Manager server (over UDP port 162).
Note: The SNMP trap listener can receive SNMP traps only from storage systems that aresupported on the DataFabric Manager server. Traps from other sources are dropped.
What SNMP trap events areWhen the SNMP trap listener receives an SNMP trap, the DataFabric Manager server issues anInformation event, but does not change the status of the host.
Instead, the corresponding monitor associated with the trap generates the proper event and continuesto monitor the host to report status changes. The name associated with the SNMP trap Informationevent indicates the severity of the trap: for example, Error Trap. The trap severities are deduced fromthe last digit of the trap ID, as specified in the custom MIB. The SNMP traps received by the SNMPtrap listener are specified in the custom MIB. For a complete list of traps and associated trap IDs, seethe Data ONTAP Network Management Guide for 7-Mode.
106 | OnCommand Unified Manager Operations Manager Administration Guide
The following list describes the SNMP trap Information event types:
• Emergency Trap Received• Alert Trap Received• Critical Trap Received• Error Trap Received• Warning Trap Received 106 SNMP traps• Notification Trap Received• Information Trap Received
If the severity of a trap is unknown, the DataFabric Manager server drops the trap.
Related concepts
Information about the DataFabric Manager server MIB on page 108
Related information
The IBM N series support website: www.ibm.com/storage/support/nseries
How SNMP trap reports are viewedYou can use the Events tab to view reports about the SNMP traps that are received by the DataFabricManager server.
The Events tab enables you to view a listing of all current SNMP traps or to sort them by severity.Each view provides information about each SNMP trap, for example, the name of the trap, theseverity, and the condition that led to the error.
When SNMP traps cannot be receivedThe DataFabric Manager server cannot receive SNMP traps, if any of the following conditions exist:
• A system has not been configured to send traps to the DataFabric Manager server.• The host is not a supported storage system.• DataFabric Manager server version is before 3.1.
Additionally, the DataFabric Manager server cannot receive Debug traps.
SNMP trap listener configuration requirementsA set of configuration requirements must be met to enable reception of SNMP traps from managedstorage systems.
On the DataFabric Manager server: No configuration is needed to start the SNMP trap listener on theDataFabric Manager server (the trap listener is automatically started after installation). The SNMPtrap global options are also configured with default settings, although you might want to modifythese settings.
Storage monitoring and reporting | 107
On managed storage systems: You must manually add the DataFabric Manager server as a trapdestination on all supported systems to be monitored. The traps must be sent to the DataFabricManager server over UDP port 162.
Note: If another trap listener is listening on port 162, the startup of the built-in trap listener failswith an error and the Warning event is displayed in the Events page.
How SNMP trap listener is stoppedThe SNMP trap listener is enabled by default. If you want to start or stop the SNMP trap listener, usethe snmpTrapListenerEnabled CLI option.
Configuration of SNMP trap global optionsYou can configure the SNMP trap global options by accessing the SNMP Trap Listeneroptions and the Event and Alert options on the Options page.
Configuration of the SNMP trap global options is not necessary at start-up. However, you might wantto modify the global default settings.
The following global default settings can be modified:
• Enable SNMP trap listenerUse this option to enable or disable the SNMP trap listener.
• SNMP Trap Listener PortUse this option to specify the UDP port on which the SNMP Manager Trap Listener receivestraps. Supported storage systems can send SNMP traps only over UDP port 162.
• SNMP Maximum Traps Received per window and SNMP Trap Window SizeUse these two options to limit the number of SNMP traps that can be received by the trap listenerwithin a specified period.
Information about the DataFabric Manager server MIBThe SNMP traps generated for the DataFabric Manager server events are specified in the DataFabricManager server MIB.
The MIB at the following locations provides a complete list of the DataFabric Manager server SNMPtraps and associated trap IDs:
• For Windows: installation_directory\dfm\misc• For UNIX: installation_directory/misc
The DataFabric Manager server can send only the traps that are available in the MIB.
Note: The DataFabric Manager server can send information to an SNMP trap host only when analarm for which the trap host is specified is generated. The DataFabric Manager server cannotserve as an SNMP agent; that is, you cannot query the DataFabric Manager server for informationfrom an SNMP traphost.
108 | OnCommand Unified Manager Operations Manager Administration Guide
What events areEvents are generated automatically when a predefined condition occurs or when an object crosses athreshold. These events enable you to take action to prevent issues that can lead to poor performanceand system unavailability. Events include an impact area, severity, and impact level.
Events are categorized by the type of impact area they encompass. Impact areas include availability,capacity, configuration, or protection. Events are also assigned a severity type and impact level thatassist you in determining if immediate action is required.
You can configure alarms to send notification automatically when specific events or events of aspecific severity occur.
Events are automatically logged and retained for a default of 180 days.
Event types are predetermined. You can manage event notification, but you cannot add or deleteevent types. However, you can modify the event severity by using the command-line interface.
Viewing eventsYou can view a list of all events and view detailed information about any event.
Step
1. Click Emergency, Critical, Error, Warning on the Operations Manager main window to viewreports of the respective event severity type.
Managing eventsIf the DataFabric Manager server is not configured to trigger an alarm when an event is generated,you cannot find out about the event. However, to identify the event, you can check the events log onthe DataFabric Manager server.
Steps
1. From an Events view, select the check box for the event that you want to acknowledge. You canselect multiple events.
2. Click Acknowledge Selected to acknowledge the event that caused the alarm.
3. Find out the cause of the event and take corrective action.
4. Delete the event.
Operations on local configuration change eventsAfter receiving the event, you have the choice of acknowledging, fixing, or deleting the event.
If you click Fix, a new window that shows the differences between the local configuration and thegroup settings is displayed.
Storage monitoring and reporting | 109
From this window, you can accept, or, reject the local configuration changes made on the storagesystem. If you reject the configuration changes, the DataFabric Manager server undoes all the localchanges. If you accept the configuration changes, the configuration settings listed are not modifiedduring subsequent configuration pushes.
List of events and severity typesYou should be aware of all the events generated by the N series Management Console data protectionand provisioning capabilities and Operations Manager and the associated event severity types.
You can use the links in the following table to move directly to the events for that object. Events arelisted in alphabetical order by object type.
Note: Performance Advisor uses only the Normal and Error events.
110 | OnCommand Unified Manager Operations Manager Administration Guide
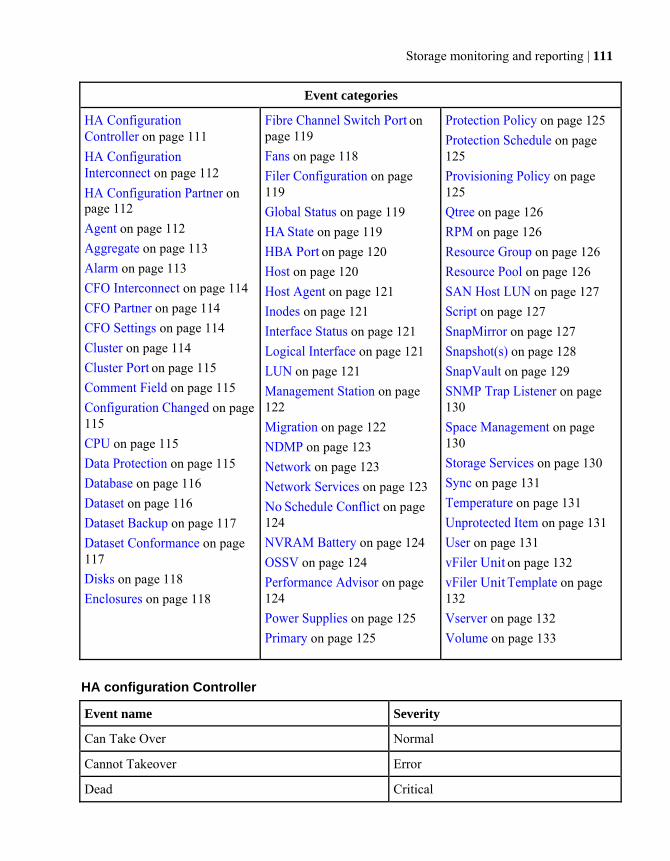
Storage monitoring and reporting | 111
Event categories HA Configuration Controller on page 111 HA Configuration Interconnect on page 112 HA Configuration Partner on page 112 Agent on page 112 Aggregate on page 113 Alarm on page 113 CFO Interconnect on page 114 CFO Partner on page 114 CFO Settings on page 114 Cluster on page 114 Cluster Port on page 115 Comment Field on page 115 Configuration Changed on page115 CPU on page 115 Data Protection on page 115 Database on page 116 Dataset on page 116 Dataset Backup on page 117 Dataset Conformance on page 117 Disks on page 118 Enclosures on page 118
Fibre Channel Switch Port on page 119 Fans on page 118 Filer Configuration on page 119 Global Status on page 119 HA State on page 119 HBA Port on page 120 Host on page 120 Host Agent on page 121 Inodes on page 121 Interface Status on page 121 Logical Interface on page 121 LUN on page 121 Management Station on page 122 Migration on page 122 NDMP on page 123 Network on page 123 Network Services on page 123 No Schedule Conflict on page 124 NVRAM Battery on page 124 OSSV on page 124 Performance Advisor on page 124 Power Supplies on page 125 Primary on page 125
Protection Policy on page 125 Protection Schedule on page 125 Provisioning Policy on page 125 Qtree on page 126 RPM on page 126 Resource Group on page 126 Resource Pool on page 126 SAN Host LUN on page 127 Script on page 127 SnapMirror on page 127 Snapshot(s) on page 128 SnapVault on page 129 SNMP Trap Listener on page 130 Space Management on page 130 Storage Services on page 130 Sync on page 131 Temperature on page 131 Unprotected Item on page 131 User on page 131 vFiler Unit on page 132 vFiler Unit Template on page 132 Vserver on page 132 Volume on page 133
HA configuration Controller
Event name Severity Can Take Over Normal Cannot Takeover Error Dead Critical

Event name Severity
Takeover Warning
HA configuration Interconnect
Event name Severity
Down Error
Not Present Warning
Partial Failure Error
Up Normal
HA configuration Partner
Event name Severity
Dead Warning
May Be Down Warning
OK Normal
HA configuration Settings
Event name Severity
Disabled Normal
Enabled Normal
Not Configured Normal
Takeover Disabled Normal
This Controller Dead Warning
Agent
Event name Severity
Down Error
Login Failed Warning
Login OK Normal
Up Normal
112 | OnCommand Unified Manager Operations Manager Administration Guide

Aggregate
Event name Severity
64-bit Upgrade Information
Almost Full Warning
Almost Overcommitted Warning
Deleted Information
Discovered Information
Failed Error
Full Error
Nearly Over Deduplicated Warning
Not Over Deduplicated Normal
Not Overcommitted Normal
Offline Error
Online Normal
Overcommitted Error
Over Deduplicated Error
Restricted Normal
Snapshot Reserve Almost Full Warning
Snapshot Reserve Full Warning
Snapshot Reserve OK Normal
Space Normal Normal
Alarm
Event name Severity
Created Information
Deleted Information
Modified Information
Test Information
Storage monitoring and reporting | 113

CFO Interconnect
Event name Severity
Down Error
Not Present Warning
Partial Failure Error
Up Normal
CFO Partner
Event name Severity
Dead Warning
May Be Down Warning
OK Normal
CFO Settings
Event name Severity
Disabled Normal
Enabled Normal
Not Configured Normal
Takeover Disabled Normal
This Node Dead Warning
Cluster
Event name Severity
Cluster Discovered Information
Cluster Reachable Normal
Cluster Not Reachable Critical
Cluster Renamed Information
Cluster Node Added Information
Cluster Node Removed Information
114 | OnCommand Unified Manager Operations Manager Administration Guide

Cluster Port
Event name Severity
Port Status Up Normal
Port Status Down Error
Port Status Undefined Normal
Port Status Unknown Normal
Port Role Changed Information
Comment Field
Event name Severity
Created Information
Modified Information
Destroyed Information
Configuration Changed
Event name Severity
Config Group Information
CPU
Event name Severity
Load Normal Normal
Too Busy Warning
Data Protection
Event name Severity
Job Started Information
Policy Created Information
Policy Modified Information
Schedule Created Information
Schedule Modified Information
Storage monitoring and reporting | 115

Database
Event name Severity
Backup Failed Error
Backup Succeeded Information
Restore Failed Error
Restore Succeeded Information
Dataset
Event name Severity
Backup Aborted Warning
Backup Completed Normal
Backup Deleted Information
Backup Failed Error
Backup Prematurely Deleted Warning
Created Information
Deleted Information
DR State Ready Information
DR State Failover Over Warning
DR State Failed Over Information
DR State Failover Error Error
DR Status Normal Information
DR Status Warning Warning
DR Status Error Error
Initializing Information
Job Failure Warning
Member Clone Snapshot Discovered Information
Member Clone Snapshot Status OK Information
Member Dedupe Operation Failed Error
Member Dedupe Operation Succeeded Normal
116 | OnCommand Unified Manager Operations Manager Administration Guide

Event name Severity
Member Destroyed Information
Member Destroy Operation Failed Information
Member Resized Information
Member Resize Operation Failed Information
Modified Information
Protected Normal
Protection Failed Error
Protection Lag Error Error
Protection Lag Warning Warning
Protection Suspended Warning
Protection Uninitialized Normal
Provisioning Failed Error
Provisioning OK Normal
Space Status: Normal Normal
Space Status: Warning Warning
Space Status: Error Error
Write Guarantee Check - Member Resize Required Warning
Write Guarantee Check - Member Size OK Normal
Dataset Backup
Event name Severity
Dataset Backup: Deleted Information
Dataset Backup: Prematurely Deleted Warning
Dataset Conformance
Event name Severity
Conformant Normal
Conforming Information
Storage monitoring and reporting | 117
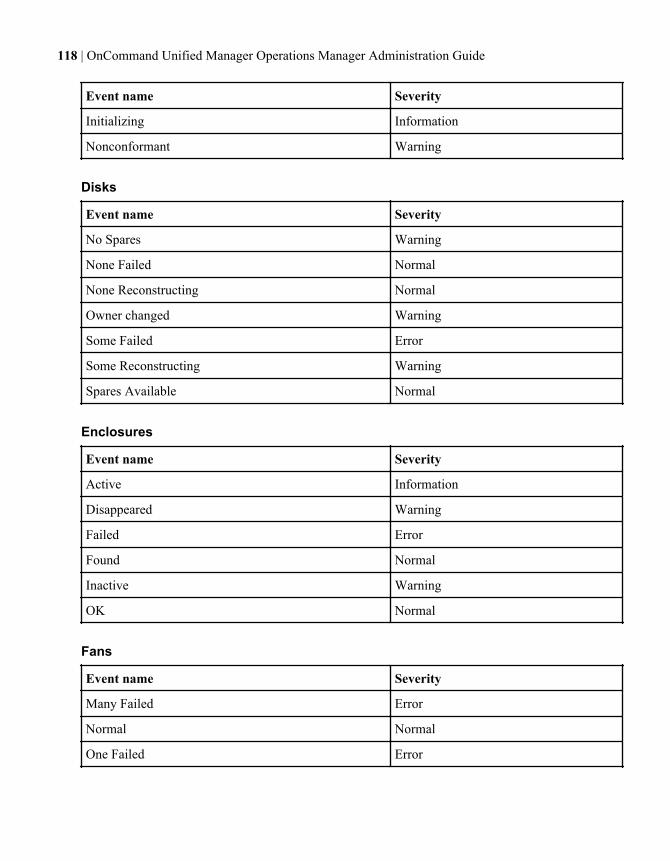
Event name Severity
Initializing Information
Nonconformant Warning
Disks
Event name Severity
No Spares Warning
None Failed Normal
None Reconstructing Normal
Owner changed Warning
Some Failed Error
Some Reconstructing Warning
Spares Available Normal
Enclosures
Event name Severity
Active Information
Disappeared Warning
Failed Error
Found Normal
Inactive Warning
OK Normal
Fans
Event name Severity
Many Failed Error
Normal Normal
One Failed Error
118 | OnCommand Unified Manager Operations Manager Administration Guide
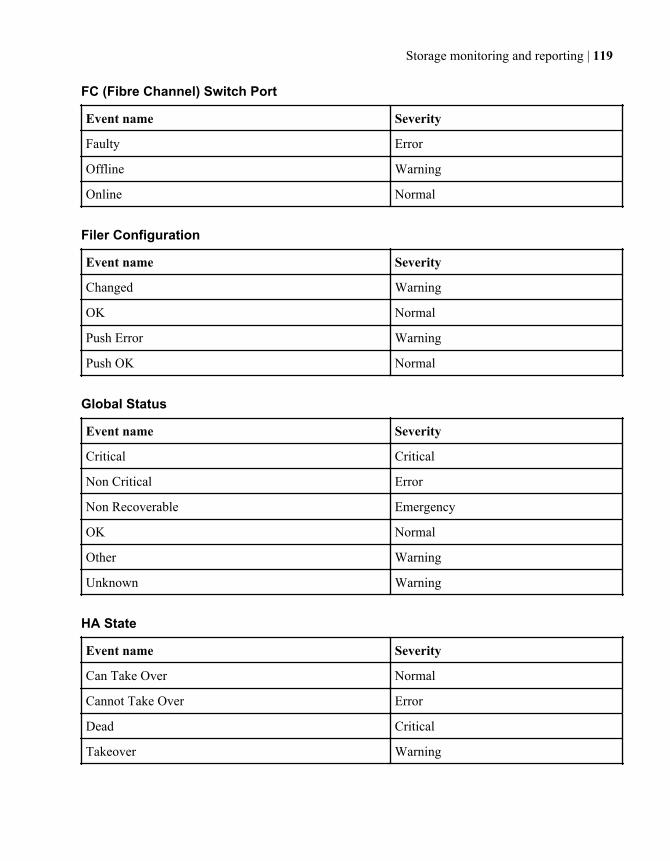
FC (Fibre Channel) Switch Port
Event name Severity
Faulty Error
Offline Warning
Online Normal
Filer Configuration
Event name Severity
Changed Warning
OK Normal
Push Error Warning
Push OK Normal
Global Status
Event name Severity
Critical Critical
Non Critical Error
Non Recoverable Emergency
OK Normal
Other Warning
Unknown Warning
HA State
Event name Severity
Can Take Over Normal
Cannot Take Over Error
Dead Critical
Takeover Warning
Storage monitoring and reporting | 119

HBA Port
Event name Severity
Offline Warning
Online Normal
Port Error Error
Traffic High Warning
Traffic OK Normal
Host
Event name Severity
Cluster Configuration Error Error
Cluster Configuration OK Normal
Cold Start Information
Deleted Information
Discovered Information
Down Critical
Identity Conflict Warning
Identity OK Normal
Login Failed Warning
Login OK Normal
Modified Information
Name Changed Information
SNMP Not Responding Warning
SNMP OK Normal
System ID Changed Information
Up Normal
120 | OnCommand Unified Manager Operations Manager Administration Guide

Host Agent
Event name Severity
Down Error
Up Normal
Host Agent: Login Failed Warning
Inodes
Event name Severity
Almost Full Warning
Full Error
Utilization Normal Normal
Interface Status
Event name Severity
Down Error
Testing Normal
Unknown Normal
Up Normal
Logical Interface
Event name Severity
Logical Interface Status Up Normal
Logical Interface Status Down Error
Logical Interface Status Unknown Normal
Logical Interface Migrated Warning
LUN
Event name Severity
Offline Warning
Online Normal
Storage monitoring and reporting | 121

Event name Severity
Snapshot Not Possible Warning
Snapshot Possible Normal
Management Station
Event name Severity
Enough Free Space Normal
File System File Size Limit Reached Error
License Expired Error
License Nearly Expired Warning
License Not Expired Normal
Load OK Normal
Load Too High Warning
Node Limit Nearly Reached Warning
Node Limit OK Normal
Node Limit Reached Error
Not Enough Free Space Error
Provisioning Manager Node Limit Nearly Reached Warning
Provisioning Manager Node Limit Ok Normal
Provisioning Manager Node Limit Reached Error
Protection Manager Node Limit Nearly Reached Warning
Protection Manager Node Limit Ok Normal
Protection Manager Node Limit Reached Error
Migration
Event name Severity
Dataset Not Migrating Normal
Dataset Migrating Normal
Dataset Migrated With Errors Warning
122 | OnCommand Unified Manager Operations Manager Administration Guide

Event name Severity
Dataset Migrated Normal
Dataset Migrate Failed Error
vFiler Unit Not Migrating Normal
vFiler Unit Migrating Normal
vFiler Unit Migrated With Errors Warning
vFiler Unit Migrated Normal
vFiler Unit Migrate Failed Error
NDMP
Event name Severity
Credentials Authentication Failed Warning
Credentials Authentication Succeeded Normal
Communication Initialization Failed Warning
Communication Initialization Succeeded Normal
Down Warning
Up Normal
Network
Event name Severity
OK Normal
Too Large Warning
Network Services
Event name Severity
CIFS Service - Up Normal
CIFS Service - Down Warning
NFS Service - Up Normal
NFS Service - Down Warning
Storage monitoring and reporting | 123

Event name Severity
iSCSI Service - Up Normal
iSCSI Service - Down Warning
FCP Service - Up Normal
FCP Service - Down Warning
No Schedule Conflict
Event name Severity
Between Snapshot and SnapMirror Schedules Normal
Between Snapshot and SnapVault Schedules Normal
NVRAM Battery
Event name Severity
Discharged Error
Fully Charged Normal
Low Warning
Missing Error
Normal Normal
Old Warning
Overcharged Warning
Replace Error
Unknown Status Warning
OSSV (Open Systems SnapVault)
Event name Severity
Host Discovered Information
Performance Advisor
Event name Severity
Enough Free Space Normal
124 | OnCommand Unified Manager Operations Manager Administration Guide
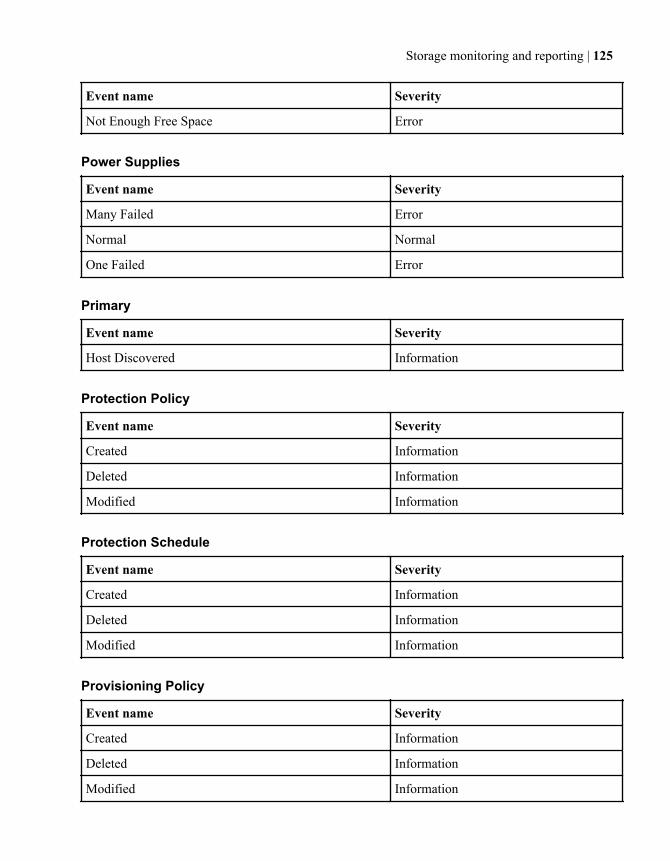
Event name Severity
Not Enough Free Space Error
Power Supplies
Event name Severity
Many Failed Error
Normal Normal
One Failed Error
Primary
Event name Severity
Host Discovered Information
Protection Policy
Event name Severity
Created Information
Deleted Information
Modified Information
Protection Schedule
Event name Severity
Created Information
Deleted Information
Modified Information
Provisioning Policy
Event name Severity
Created Information
Deleted Information
Modified Information
Storage monitoring and reporting | 125
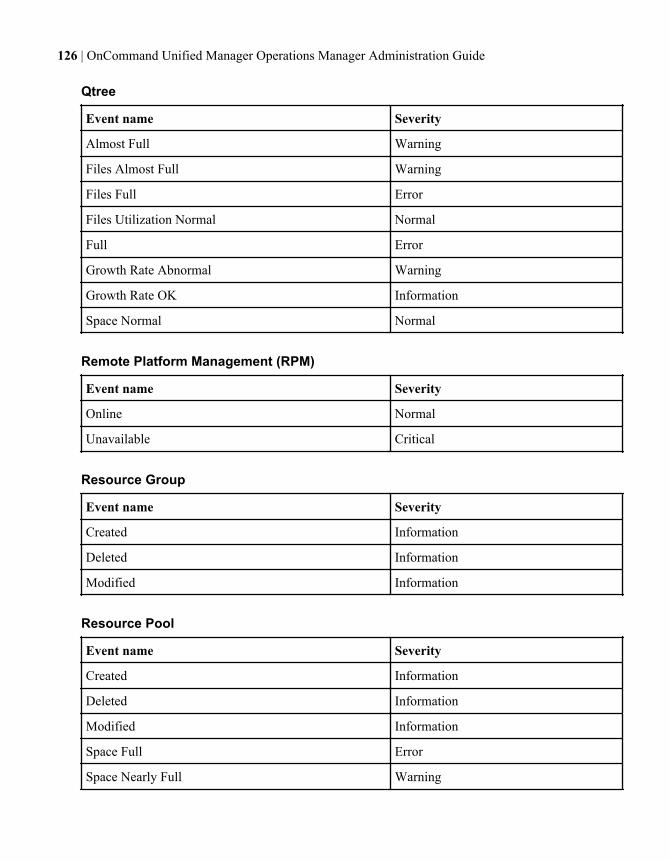
Qtree
Event name Severity
Almost Full Warning
Files Almost Full Warning
Files Full Error
Files Utilization Normal Normal
Full Error
Growth Rate Abnormal Warning
Growth Rate OK Information
Space Normal Normal
Remote Platform Management (RPM)
Event name Severity
Online Normal
Unavailable Critical
Resource Group
Event name Severity
Created Information
Deleted Information
Modified Information
Resource Pool
Event name Severity
Created Information
Deleted Information
Modified Information
Space Full Error
Space Nearly Full Warning
126 | OnCommand Unified Manager Operations Manager Administration Guide

Event name Severity
Space OK Normal
SAN Host LUN Mapping
Event name Severity
Changed Warning
Script
Event name Severity
Critical Event Critical
Emergency Event Emergency
Error Event Error
Information Event Information
Normal Event Normal
Warning Event Warning
SnapMirror
Event name Severity
Abort Completed Normal
Abort Failed Error
Break Completed Normal
Break Failed Error
Date OK Normal
Delete Aborted Warning
Delete Completed Information
Delete Failed Error
Deleted Information
Discovered Information
Initialize Aborted Warning
Storage monitoring and reporting | 127

Event name Severity
Initialize Completed Normal
Initialize Failed Error
Modified Information
Nearly Out of Date Warning
Not Scheduled Normal
Not Working Error
Off Normal
Out of Date Error
Possible Problem Warning
Quiesce Aborted Warning
Quiesce Completed Normal
Quiesce Failed Error
Resume Completed Normal
Resume Failed Error
Resync Aborted Warning
Resync Completed Normal
Resync Failed Error
Unknown State Warning
Update Aborted Warning
Update Completed Normal
Update Failed Error
Working Normal
Snapshot(s)
Event name Severity
Age Normal Normal
Age Too Old Warning
Count Normal Normal
128 | OnCommand Unified Manager Operations Manager Administration Guide
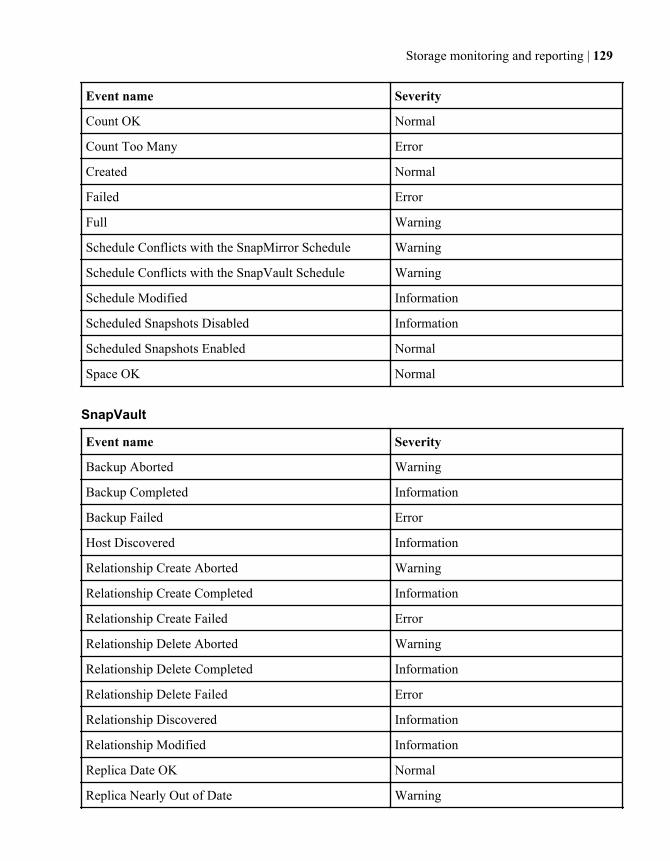
Event name Severity
Count OK Normal
Count Too Many Error
Created Normal
Failed Error
Full Warning
Schedule Conflicts with the SnapMirror Schedule Warning
Schedule Conflicts with the SnapVault Schedule Warning
Schedule Modified Information
Scheduled Snapshots Disabled Information
Scheduled Snapshots Enabled Normal
Space OK Normal
SnapVault
Event name Severity
Backup Aborted Warning
Backup Completed Information
Backup Failed Error
Host Discovered Information
Relationship Create Aborted Warning
Relationship Create Completed Information
Relationship Create Failed Error
Relationship Delete Aborted Warning
Relationship Delete Completed Information
Relationship Delete Failed Error
Relationship Discovered Information
Relationship Modified Information
Replica Date OK Normal
Replica Nearly Out of Date Warning
Storage monitoring and reporting | 129

Event name Severity
Replica Out of Date Error
Restore Aborted Warning
Restore Completed Normal
Restore Failed Error
SNMP Trap Listener
Event name Severity
Alert Trap Received Information
Critical Trap Received Information
Emergency Trap Received Information
Error Trap Received Information
Information Trap Received Information
Notification Trap Received Information
Warning Trap Received Information
Start Failed Warning
Start OK Information
Space Management
Event name Severity
Space Management Job Started Information
Space Management Job Succeeded Information
Space Management Job Failed Information
Storage Services
Event name Severity
Storage Service Created Information
Storage Service Modified Information
Storage Service Destroyed Information
130 | OnCommand Unified Manager Operations Manager Administration Guide
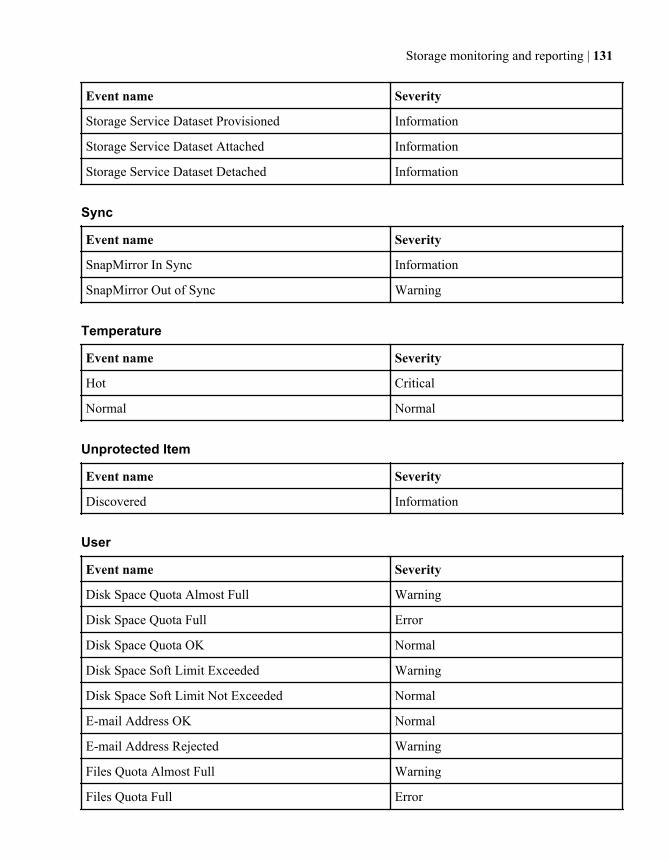
Event name Severity
Storage Service Dataset Provisioned Information
Storage Service Dataset Attached Information
Storage Service Dataset Detached Information
Sync
Event name Severity
SnapMirror In Sync Information
SnapMirror Out of Sync Warning
Temperature
Event name Severity
Hot Critical
Normal Normal
Unprotected Item
Event name Severity
Discovered Information
User
Event name Severity
Disk Space Quota Almost Full Warning
Disk Space Quota Full Error
Disk Space Quota OK Normal
Disk Space Soft Limit Exceeded Warning
Disk Space Soft Limit Not Exceeded Normal
E-mail Address OK Normal
E-mail Address Rejected Warning
Files Quota Almost Full Warning
Files Quota Full Error
Storage monitoring and reporting | 131
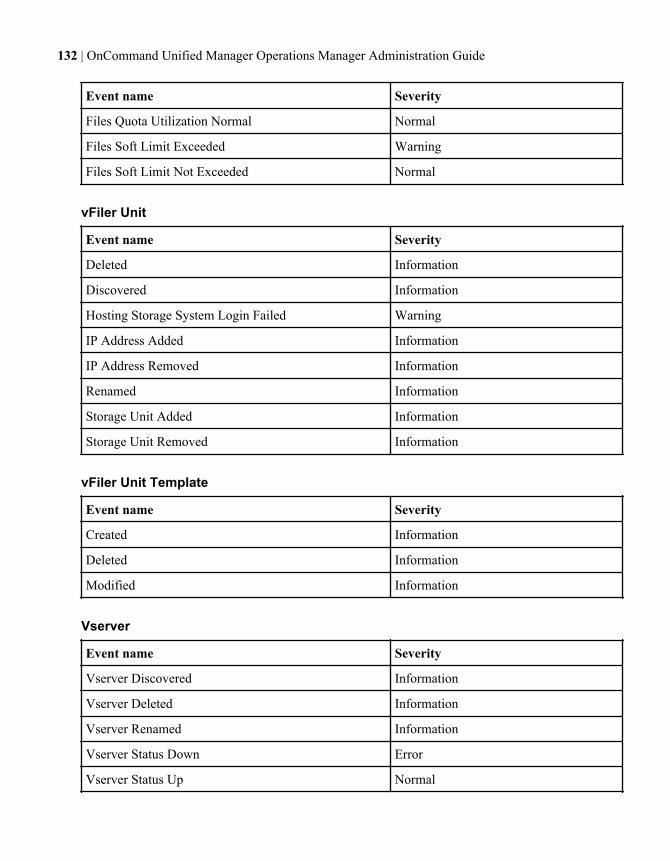
Event name Severity
Files Quota Utilization Normal Normal
Files Soft Limit Exceeded Warning
Files Soft Limit Not Exceeded Normal
vFiler Unit
Event name Severity
Deleted Information
Discovered Information
Hosting Storage System Login Failed Warning
IP Address Added Information
IP Address Removed Information
Renamed Information
Storage Unit Added Information
Storage Unit Removed Information
vFiler Unit Template
Event name Severity
Created Information
Deleted Information
Modified Information
Vserver
Event name Severity
Vserver Discovered Information
Vserver Deleted Information
Vserver Renamed Information
Vserver Status Down Error
Vserver Status Up Normal
132 | OnCommand Unified Manager Operations Manager Administration Guide
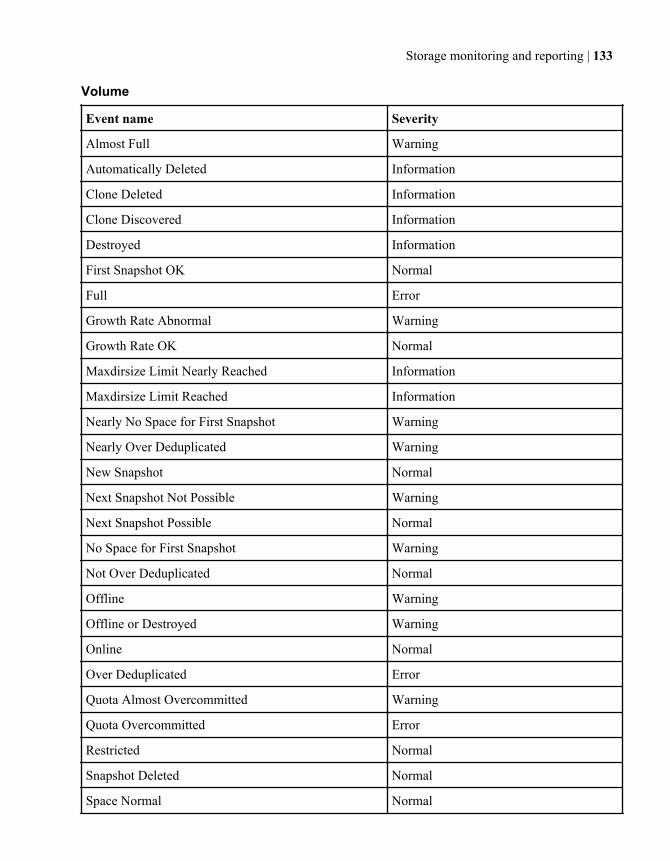
Volume
Event name Severity
Almost Full Warning
Automatically Deleted Information
Clone Deleted Information
Clone Discovered Information
Destroyed Information
First Snapshot OK Normal
Full Error
Growth Rate Abnormal Warning
Growth Rate OK Normal
Maxdirsize Limit Nearly Reached Information
Maxdirsize Limit Reached Information
Nearly No Space for First Snapshot Warning
Nearly Over Deduplicated Warning
New Snapshot Normal
Next Snapshot Not Possible Warning
Next Snapshot Possible Normal
No Space for First Snapshot Warning
Not Over Deduplicated Normal
Offline Warning
Offline or Destroyed Warning
Online Normal
Over Deduplicated Error
Quota Almost Overcommitted Warning
Quota Overcommitted Error
Restricted Normal
Snapshot Deleted Normal
Space Normal Normal
Storage monitoring and reporting | 133

Event name Severity
Space Reserve Depleted Error
Space Reserve Nearly Depleted Warning
Space Reserve OK Normal
Alarm configurationsThe DataFabric Manager server uses alarms to tell you when events occur. The DataFabric Managerserver sends the alarm notification to one or more specified recipients: an e-mail address, a pagernumber, an SNMP traphost, or a script that you write.
You are responsible for which events cause alarms, whether the alarm repeats until it isacknowledged, and how many recipients an alarm has. Not all events are severe enough to requirealarms, and not all alarms are important enough to require acknowledgment. Nevertheless, youshould configure the DataFabric Manager server to repeat notification until an event isacknowledged, to avoid multiple responses to the same event.
The DataFabric Manager server does not automatically send alarms for the events. You mustconfigure alarms for the events, you specify.
Guidelines for configuring alarmsWhen configuring alarms you must follow a set of guidelines.
• Alarms must be created for a group, either an individual group or the Global group.If you want to set an alarm for a specific object, you must first create a group with that object asthe only member. You can then configure an alarm for the newly created group.
• Alarms you create for a specific event are triggered when that event occurs.• Alarms you create for a type of event are triggered when any event of that severity level occurs.• Alarms can be configured based on events, event severity, or event class.
Related concepts
What events are on page 109
Creating alarmsYou can create alarms from the Alarms page in Operations Manager.
Steps
1. Click Control Center > Setup > Alarms.
2. From the Alarms page, select the group that you want Operations Manager to monitor.
You might need to expand the list to display the one you want to select.
134 | OnCommand Unified Manager Operations Manager Administration Guide

3. Specify what triggers the alarm: an event or the severity of event.
4. Specify the recipient of the alarm notification.
Note: If you want to specify more than one recipient or configure repeat notification, continueto Step 5.
5. Click Add to set the alarm. If you want to configure additional options, continue with Step 5.
6. Click Advanced Version.
7. Optionally, if you want to specify a class of events that should trigger this alarm, specify theevent class.
You can use normal expressions.
8. Optionally, specify the recipients of the alarm notification.
Formats include administrator names, e-mail addresses, pager addresses, or an IP address of thesystem to receive SNMP traps (or port number to send the SNMP trap to).
9. Optionally, specify the period that Operations Manager sends alarm notifications.
10. Optionally, select Yes to resend the alarm notification until the event is acknowledged or No tonotify the recipients only once.
11. Optionally, set the interval (in minutes) that Operations Manager waits before it tries to resend anotification.
12. Activate the alarm by selecting No in the Disable field.
13. Click Add.
Testing alarmsYou can test the alarms from the Alarms page in Operations Manager.
Steps
1. Click Control Center > Setup > Alarms.
2. Find the alarm you want to test and click Test.
3. Read the message about the test alarm that the DataFabric Manager server generates, from theTest Alarm page and then click Test.
Result
The DataFabric Manager server generates an alarm and sends a notification to the recipient.
Storage monitoring and reporting | 135

Comments in alarm notificationsBy using the DataFabric Manager server, you can add details to alarm notifications, such as assetnumber, department code, location name, and support contact.
When you define a custom comment field, the DataFabric Manager server sends this information inthe alarm notification to help you respond to the alarm.
Custom alarm notifications are sent by e-mail message or SNMP traps; you can also access them byexecuting scripts. Custom alarm notifications cannot be sent to pagers.
Example of alarm notification in e-mail formatYou can configure alarms to send notifications in the form of e-mail messages.
This example shows alarm notification sent in the e-mail format:
From: [email protected] [mailto:[email protected]]Sent: Wednesday, July 14, 2010 3:20 PMTo: xyzSubject: dfm: Normal event on deux-186-72:/os_f_ds_370_backup_118 (Volume Online)
A Normal event at 14 Jul 15:27 EDT on Volume os_f_ds_370_backup_118 on Active/Active Controller deux-186-72.lab.eng.btc.company.in:Volume Online.Volume online
Click below to see the source of this event.http://lnx186-79.lab.eng.btc.company.in:8080/
REMINDER: This alert will be repeated every 30 minutes, until the event is acknowledged.
*** Event details follow.***
General Information-------------------DataFabric Manager Serial Number: 1-50-000001 Alarm Identifier: 4
Event Fields-------------Event Identifier: 4081Event Name: Volume OnlineEvent Description: Availability of the file system Event Severity: Normal Event Timestamp: 14 Jul 15:27
Source of Event---------------Source Identifier: 3044Source Name: deux-186-72:/os_f_ds_370_backup_118
136 | OnCommand Unified Manager Operations Manager Administration Guide

Source Type: VolumeName of the host: deux-186-72.lab.eng.btc.company.in Type of the host: Active/Active Controller Host identifier: 93
Event Arguments---------------volName: deux-186-72:/os_f_ds_370_backup_118
Example of alarm notification in script formatVarious event fields are passed to the script as environment variables. Characters other than [a-z][A-Z][0-9] are replaced with “_” (underscore).
This example shows environment variables passed to the sample script:
DFM_ALARM_ID="21"DFM_EVENT_ID="312"DFM_EVENT_NAME_GUI="Management Station: Node Limit Ok"DFM_Source_ID="10.72.1.1/24"
Example of alarm notification in trap formatA new SNMP variable is added to all existing traps. The value of this variable is a string, whichcontains the name and values of all the defined comment fields. If this string is not empty, it isappended to the trap.
The format of this string is as follows:
Source: IP address of the sourceTimestamp: 7 hours 25 minutes 12 secondsEnterprise: .1.3.6.1.4.1.789.3SNMP Version: 1Specific: 11041Generic: enterpriseSpecificVariable buildings:Name: .1.3.6.1.4.1.789.3.1.0Value: (octetString)1-50-000001
Response to alarmsWhen you receive an alarm, you should acknowledge the event and resolve the condition thattriggered the alarm.
In addition, if the repeat notification feature is enabled and the alarm condition persists, you continueto receive notifications.
Storage monitoring and reporting | 137

Deleting alarmsYou can delete alarms from the Alarms page in Operations Manager.
Steps
1. Click Control Center > Setup > Alarms.
2. From the Alarms page, select the alarm for deletion.
3. Click Delete Selected.
Working with user alertsThe DataFabric Manager server can send an alert to you whenever it detects a condition or problem,in your systems that requires attention. You can configure the mail server so that the DataFabricManager server can send alerts to specified recipients when an event occurs.
What user alerts areBy default, the DataFabric Manager server sends out user alerts (e-mail messages) to all users whoexceed their quota limits.
Whenever a user event related to disk or file quotas occurs, the DataFabric Manager server sends analert to the user who caused the event. The alert is in the form of an e-mail message that includesinformation about the file system (volume or qtree) on which the user exceeded the threshold for aquota.
You can disable the alerts for all users or for the users who have quotas.
Differences between alarms and user alertsThe DataFabric Manager server uses alarms to tell you when events occur. By default, theDataFabric Manager server sends out alerts to all users who exceed their quota limits.
Alarms User alerts
Alarms must be configured for events before theDataFabric Manager server can send outnotification to the specified recipients.
The DataFabric Manager server generates useralerts by default.
Alarms can be sent to one or more of thefollowing recipients:
• An email address• A pager address• An SNMP traphost• A script that you write
User alerts are sent to the user who exceeds theuser quota thresholds. User alerts are only in theform of an email message.
138 | OnCommand Unified Manager Operations Manager Administration Guide

Alarms User alerts
Alarms can be sent to only users listed asadministrators on the Administrators page ofOperations Manager.
User alerts are sent to any user with user quotainformation in the DataFabric Manager serverdatabase.
Alarms can be configured for any events withseverity of Information or higher.
User alerts are sent only when the following userquota events occur:
• User Disk Space Quota Almost Full• User Disk Space Quota Full• User Files Quota Almost Full• User Files Quota Full
User alerts configurationsTo receive user alerts, you must enable the User Quota Alerts option, configure e-mailaddresses, and the e-mail domain. Optionally, you can configure the mailmap file.
If you want to enable or disable alerts to all users in the DataFabric Manager server database, use theEnable User Quota Alerts option in the Users section on the Options page.
You can enable, or disable alerts to only the users who have quotas configured on a specific filesystem, or a group of file systems. Use the Enable User Quota Alerts option on the EditVolume Settings or Edit Qtree Settings page of that volume or qtree.
How you specify email addresses for alertsYou can specify an email address on DataFabric Manager server to receive alerts. The email addressthat is used to send alerts depends on the DataFabric Manager server configuration.
The following list provides the different ways to specify an email address:
• Using the dfm quota user commandFor more information about the dfm quota user command, see the DataFabric Manager serverman pages.
• Using the mailmap fileIf you have to specify email addresses of many users, using the Edit User Settings page for eachuser might not be convenient. Therefore, the DataFabric Manager server provides a mailmap filethat enables you to specify many email addresses in one operation.
The following list details what occurs if you do not specify an email address:
• When you do not specify the email address, the default email domain is configured and appendedto the user name by the DataFabric Manager server.The resulting email address is used to send the alert.
Storage monitoring and reporting | 139
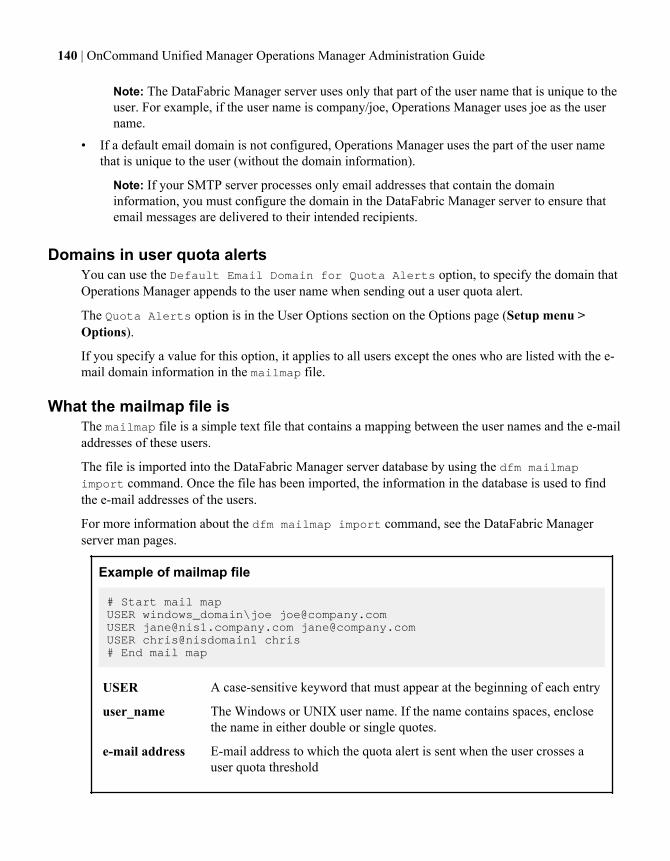
Note: The DataFabric Manager server uses only that part of the user name that is unique to theuser. For example, if the user name is company/joe, Operations Manager uses joe as the username.
• If a default email domain is not configured, Operations Manager uses the part of the user namethat is unique to the user (without the domain information).
Note: If your SMTP server processes only email addresses that contain the domaininformation, you must configure the domain in the DataFabric Manager server to ensure thatemail messages are delivered to their intended recipients.
Domains in user quota alertsYou can use the Default Email Domain for Quota Alerts option, to specify the domain thatOperations Manager appends to the user name when sending out a user quota alert.
The Quota Alerts option is in the User Options section on the Options page (Setup menu >Options).
If you specify a value for this option, it applies to all users except the ones who are listed with the e-mail domain information in the mailmap file.
What the mailmap file isThe mailmap file is a simple text file that contains a mapping between the user names and the e-mailaddresses of these users.
The file is imported into the DataFabric Manager server database by using the dfm mailmapimport command. Once the file has been imported, the information in the database is used to findthe e-mail addresses of the users.
For more information about the dfm mailmap import command, see the DataFabric Managerserver man pages.
Example of mailmap file
# Start mail mapUSER windows_domain\joe [email protected] [email protected] [email protected] chris@nisdomain1 chris# End mail map
USER A case-sensitive keyword that must appear at the beginning of each entry
user_name The Windows or UNIX user name. If the name contains spaces, enclosethe name in either double or single quotes.
e-mail address E-mail address to which the quota alert is sent when the user crosses auser quota threshold
140 | OnCommand Unified Manager Operations Manager Administration Guide

Guidelines for editing the mailmap fileYou should follow a set of guidelines for editing the mailmap file.
• When specifying a user name for a UNIX user, you must specify the full NIS domain after theuser name. For example, for UNIX user joe in NIS domain nisdomain1, specify joe@nisdomain1as the user name.
• The specified NIS domain must match the one configured on the storage system. If no domaininformation is configured on the storage system, you must also leave the domain in the mailmapfile empty.
• Use one or more spaces or tabs to separate the fields in the file.• Use the “#” character in the beginning of a line that is a comment.• If blank lines exist in the file, they are ignored.
How the contents of the user alert are viewedYou can obtain the content of the current e-mail alert that the DataFabric Manager server sends byentering the following command at DataFabric Manager server console: dfm quota mailformatexport { path | - }. Path is the location of the file containing e-mail alerts.
How the contents of the e-mail alert are changedYou can change the contents of the current e-mail alert by modifying the alerts in the mailformat file.
After you have changed the contents of the e-mail alert, you can import the modified file in to theDataFabric Manager server database by using the dfm quota mailformat import command.
For more information about the dfm quota mailformat command, see the DataFabric Managerserver man pages.
What the mailformat file isThe mailformat file is a simple text file that enables you to customize the contents of the e-mailalert that is sent to the users.
This file must contain entries in the following format:
mail-headers <empty line> body
mail-headers The SMTP headers to be sent in the DATA section of the SMTP message
body Body of the e-mail
Any words that begin with DFM_ are treated as the DataFabric Manager server variables and arereplaced by their values. The following table lists the valid variables.
Storage monitoring and reporting | 141

Variable Variable is replaced with...
DFM_EVENT_NAME Name of the event
DFM_QUOTA_FILE_SYSTEM_NAME Name of the file system (volume or qtree) that caused thequota event
DFM_QUOTA_FILE_SYSTEM_TYPE Type of file system (volume or qtree)
DFM_QUOTA_PERCENT_USED Percentage of quota used
DFM_QUOTA_USED Amount of disk space or number of files used
DFM_QUOTA_LIMIT Total disk space or files quota
DFM_QUOTA_TYPE Type of quota (disk space or files), depending on whether thedisk space or files quota threshold was exceeded
DFM_LINK_EVENT Hyperlink to the event
DFM_QUOTA_USER_NAME Name of the user exceeding the quota threshold
Example of the mailformat file
From: IT AdministratorSubject: URGENT: Your DFM_QUOTA_TYPE quota onDFM_QUOTA_FILE_SYSTEM_NAMEYou (as user "DFM_QUOTA_USER_NAME") have used upDFM_QUOTA_PERCENT_USED (DFM_QUOTA_USED out of DFM_QUOTA_LIMIT) ofavailable DFM_QUOTA_TYPE quota on DFM_QUOTA_FILE_SYSTEM_NAME.Please delete files that you no longer need.Event (For IT Use only): DFM_LINK_EVENT-- IT Administrator
Guidelines for editing the mailformat fileYou should follow a set of guidelines for editing the mailformat file.
• Ensure that the mailformat file conforms to SMTP protocol.• Specify an empty line between the header and the body of the e-mail message.• Use any of the headers recognized by the SMTP servers, such as “content type: text/html” to send
an e-mail message with HTML formatted body.
142 | OnCommand Unified Manager Operations Manager Administration Guide
Introduction to DataFabric Manager server reportsThe DataFabric Manager server provides standard reports that you can view from the command-lineinterface (CLI) or Operations Manager.
You can run reports and create custom reports from the CLI. The DataFabric Manager server alsoprovides reports in Operations Manager interface, which enables you to perform the followingoperations:
• View a report.• Save a report in Excel format.• Print a report.• Create a report.• Delete a custom report.
You cannot delete a standard report.• Use a custom report as a template to create another custom report.
By using DataFabric Manager server 3.6 or later, you can search all the reports from Reports menu> All. All the reports are divided under the following categories:
• Recently Viewed• Favorites• Custom Reports• Logical Objects• Physical Objects• Monitoring• Performance (7-Mode environments only)• Backup• Disaster Recovery• Data Protection Transfer• Miscellaneous
For more information about these categories, see Operations Manager Help.
Note: (7-Mode environments only) The report category Performance contains the performancecharacteristics of objects. You can view the complete reports under their respective reportcategories.
Introduction to report optionsThe DataFabric Manager server provides standard reports that you can view from the CLI orOperations Manager.
The dfm report command specifies the report catalog object that you can modify to create thecustom report. The custom report object has the following attributes that you can set:
Storage monitoring and reporting | 143

• A short name (for CLI output)• A long name (for GUI output)• Field description• The fields to display• The report catalog it was created from
The custom report also has methods that let you create, delete, and view your custom reports. Youcan configure the report options in Operations Manager with respect to Name, Display tab, Catalogs,and Fields.
Introduction to report catalogsThe DataFabric Manager server provides report catalogs that you use to customize reports. You canset basic report properties from the CLI or Operations Manager.
Following are the basic report properties:
• A short report name (for CLI output)• Long report name (for Operations Manager output)• Field description• The fields to display• The report catalog it was created from
Every report that is generated by the DataFabric Manager server, including those you customize, isbased on the catalogs.
For more information about how to use the CLI to configure and run reports, use the dfm reporthelp command. The command specifically describes how to list a report catalog and its fields andcommand organization and syntax.
Custom reports you can create in Operations ManagerYou can use Operations Manager to create different types of reports, including reports on aggregates,array LUNs, datasets, controllers, clusters, datasets, events, ports, quotas, and backup, mirror, andother schedules.
Aggregates The aggregate report displays information about the space utilization, capacity,performance characteristics (7-Mode environments only), and availability of thevolumes on your aggregates. By default, you can view aggregate reports fromControl Center > Home > Member Details > Aggregates > Report.
Array LUNs The array LUNs report displays information about the LUN residing on third-party storage arrays that are attached to the gateway, including information suchas the model, vendor, serial number of the LUN, and size. By default, you canview array LUNs reports from Control Center > Home > Member Details >Physical Systems > Report.
AggregateArray LUNs
The aggregate array LUNs report displays information about array LUNscontained on the aggregates of the gateway, including information such as the
144 | OnCommand Unified Manager Operations Manager Administration Guide

model, vendor, serial number of the LUN, and size. By default, you can viewaggregate array LUNs reports from Control Center > Home > Member Details> Aggregates > Report.
Backup (7-Mode environments only) The backup report displays information about thedata transfer during a backup.
Clusters (clustered environments only) The clusters report displays information about theclusters, such as the status, serial number of the cluster, number of Vservers andcontrollers associated with the cluster. You can view the reports from ControlCenter > Home > Member Details > Physical Systems > Report.
Controllers The controllers report displays information about the cluster to which thecontroller belongs, including the model and serial number of the controller, andthe system ID of the cluster. You can view the report from Control Center >Home > Member Details > Physical Systems > Report.
Dataset (7-Mode environments only) The dataset report displays information about theresource, protection, and the conformance status of the dataset. This report alsodisplays information about the policy with which the dataset is associated.
Disks The disks report displays information about the disks in your storage system,such as the model, vendor, and size. You can view the performancecharacteristics (7-Mode environments only) and sort these reports by broken orspare disks, as well as by size. By default, you can view disks reports along withthe controller reports in the Member Details tab.
Events The events report displays information about the event severity, user quotas, andSNMP traps. The information about all the events, including deleted,unacknowledged, and acknowledged events, in the DataFabric Manager serverdatabase are available in these reports. By default, you can view event reports inthe Group Status tab.
FC Link The FC link report displays information about the logical and physical links ofyour FC switches and fabric interfaces. By default, you can view FC link reportsalong with the SAN reports in the Member Details tab.
FC Switch The FC switch report displays FC switches that are deleted, that include usercomments, or are not operating. By default, you can view FC switch reportsalong with the SAN reports in the Member Details tab.
FCP Target The FCP target report displays information about the status, port state, andtopology of the target. The FCP target also reports the name of the FC switch,the port to which the target connects and the HBA ports that the target canaccess. By default, you can view FCP target reports in the Control Center >Home > Member Details > LUNs tab.
File System The file system report displays information about all the file systems, and youcan filter them into reports by volumes, Snapshot copies, space reservations,
Storage monitoring and reporting | 145
qtrees, and chargeback information. By default, you can view file system reportsin the Control Center > Home > Member Details > File systems tab.
GroupSummary
The group summary report displays the status, and the used and available storagespace for your groups. The FCP target report includes storage chargeback reportsthat are grouped by usage and allocation. By default, you can view group reportsin the Group Status tab.
Host Users (7-Mode environments only) The host users report shows you information aboutthe existing users on the host. By default, you can view host users reports fromManagement > Host Users > Report.
Host LocalUsers
(7-Mode environments only) The host local users report displays informationabout the existing local users on the host. By default, you can view the host localusers reports from Management > Host Local Users > Report.
Host DomainUsers
(7-Mode environments only) The host domain users report displays informationabout the existing domain users on the host. By default, you can view the hostdomain users reports from Management > Host Domain Users > Report.
HostUsergroups
(7-Mode environments only) The host usergroups report displays informationabout the existing user groups on the host. By default, you can view the hostusergroups reports from Management > Host Usergroups > Report.
Host Roles (7-Mode environments only) The host roles report displays information about theexisting roles on the host. By default, you can view the host roles reports fromManagement > Host Roles > Report.
InterfaceGroups
The interface groups report displays information about all the defined clusterinterface groups, ports, controllers, and active state of the group. You can viewthe interface groups report from Control Center > Home > Member Details >Physical Systems > Report.
LogicalInterfaces
The logical interfaces report displays information about the server, the currentport that the logical interface uses, the status of the logical interface, the networkaddress and mask, the type of role, and whether the interface is at the home port.You can view the logical interfaces report from Control Center > Home >Member Details > Physical Systems > Report.
LUN The LUN report displays information and statistics about the LUNs and LUNinitiator groups on the storage system, along with the performance characteristics(7-Mode environments only). By default, you can view LUN reports in theMember Details tab.
History,PerformanceReport
The performance events history report displays all the Performance Advisorevents. By default, you can view the performance events history reports fromGroup Status > Events > Report.
Mirror The mirror report displays information about data transfer in a mirroredrelationship.
146 | OnCommand Unified Manager Operations Manager Administration Guide

PerformanceEvents
The performance events report displays all the current Performance Advisorevents. By default, you can view the performance events reports from ControlCenter > Home > Group Status > Events > Report.
Ports The ports report displays information about the controllers that are connected,the type of role of the port, the status of the port, and sizes of data moving in andout of the port. You can view the ports report from Control Center > Home >Member Details > Physical Systems > Report.
Quotas The quota report displays information about user quotas that you can use forchargeback reports. By default, you can view quota reports along with the groupsummary reports in the Group Status tab.
Report Outputs The report outputs report displays information about the report outputs that aregenerated by the report schedules. By default, you can view report outputsreports from Reports > Schedule > Saved Reports.
ReportSchedules
The report schedules report displays information about the existing reportschedules. By default, you can view report schedules reports from Reports >Schedule > Report Schedules.
A report schedule is an association between a schedule and a report for the reportgeneration to happen at that particular time.
Resource Pools The resource pools report displays information about the storage capacity that isavailable and the capacity that is used by all the aggregates in the resource pool.This report also displays the time zone and the status of the resource pool.
SAN Host (7-Mode environments only) The SAN host report displays information aboutSAN hosts, including FCP traffic and LUN information, and the type and statusof the SAN host. By default, you can view SAN host reports in the MemberDetails tab.
Schedules The schedules report displays information about the existing schedules and thenames of the report schedules that are using a particular schedule. By default,you can view schedules reports from Reports > Schedule > Schedules. TheSchedules tab displays all the schedules. Schedules are separate entities that canbe associated with reports.
Scripts The scripts report displays information about the script jobs and script schedules.By default, you can view the scripts reports in the Member Details tab.
Spare ArrayLUNs
The spare array LUNs report displays information about spare array LUNs of thegateway, such as the model, vendor, serial number of the LUN, and size. Bydefault, you can view the spare array LUNs reports from Control Center >Home > Member Details > Physical Systems > Report.
storage systems The storage systems report displays information about the capacity andoperations of your storage systems, performance characteristics (7-Modeenvironments only), and the releases and protocols running on them. By default,
Storage monitoring and reporting | 147

you can view storage systems reports in the Control Center > Home > MemberDetails > Physical Systems tab.
User Quotas The User Quotas report displays information about the disk space usage and userquota thresholds collected from the monitored storage systems.
vFiler (7-Mode environments only) The vFiler report displays the status, availableprotocols, storage usage, and performance characteristics (7-Mode environmentsonly) of vFiler units that you are monitoring with the DataFabric Managerserver. By default, you can view the vFiler reports in the Member Details tab.
Virtual Servers (clustered environments only) The Virtual Servers report displays informationabout the associated cluster, the root volume on which the virtual server resides,name of the service switch, NIS domain, and the status of the virtual server. Youcan view the Virtual Servers report from Control Center > Home > MemberDetails > Virtual Systems > Report.
Volume The Volume report displays all the volumes with the following details, for thecurrent month or for the past month:
• Name• Capacity• Available space• Snapshot capacity• Growth rates• Expendability• Chargeback by usage or allocation• Performance characteristics (7-Mode environments only)
By default, you can view the volume reports along with the file system reports inthe Member Details tab.
What performance reports do (7-Mode environments only)Performance reports in Operations Manager provide information about the performancecharacteristics of an object.
You can perform the following operations with performance reports:
• You can view the performance characteristics of an object for the periods last, one day, one week,one month, three months, and one year.
• You can view the performance counters related to various fields in catalogs.• You can use data consolidation, which is a statistical method to analyze data.
Data consolidation is available only if you select the Performance option. You can view theaverage, minimum, maximum, or median value for the performance metrics over a period. Thisfield is set to Average by default.
148 | OnCommand Unified Manager Operations Manager Administration Guide

Related concepts
Report fields and performance counters (7-Mode environments only) on page 268
Configuring custom reportsYou can configure custom reports in Operations Manager to customize the report to suit your needs.For example, you can configure a custom report with a relevant name, a comment to help youremember the use of this report, and select relevant fields for you report.
Steps
1. Select Custom from the Reports menu.
2. Enter a (short) name for the report, depending on how you want it displayed in the command-lineinterface (CLI).
3. Enter a (long) name for the report, depending on how you want it displayed in OperationsManager.
4. Add comments to the report description.
5. Select the catalog from which the available report fields are based.
6. Select where you want the DataFabric Manager server to display this report in OperationsManager.
7. Select the related catalog from which you want to choose fields.
You might have to expand the list to display the catalog you want to select.
8. In the Choose From Available Fields section, choose the fields you want to view:
• To view fields related to the usage and configuration metrics of the object, click Usage.• (7-Mode environments only) To view fields related to performance metrics of the object, click
Performance.
9. Select a field from Choose From Available Fields.
10. Enter a name for the field, depending on how you want it displayed on the report.
Make your field name abbreviated and as clear as possible. You must be able to view a fieldname in the reports and determine which field the information relates to.
11. Specify the format of the field.
If you choose to not format the field, the default format displayed is used.
12. Click Add to move the field to the Reported Fields list.
13. Repeat Steps 8 to 12 for each field that you want to include in the report.
14. Click Move Up or Move Down to reorder the fields.
15. (7-Mode environments only) If you selected Performance, select the required data consolidationmethod from the list.
Storage monitoring and reporting | 149

16. Click Create.
17. To view this report, locate this report in the list at the lower part of the page and click the Displaytab name.
18. Locate the report from the Report drop-down list.
Deleting custom reportsYou can delete a custom report you no longer need, in Operations Manager.
Steps
1. Select Custom from the Reports menu.
2. Find the report from the list of configured reports and select the report you want to delete.
3. Click Delete.
Putting data into spreadsheet formatYou can put data from any of the about LUNs, SAN hosts, and FCP targets reports into spreadsheetformat.
Before you begin
Reports about LUNs, SAN hosts, and FCP targets must be available on the LUNs page of MemberDetails tab.
Steps
1. Click Member Details on the LUNs page to view the reports.
2. You can view the data in report in a spreadsheet format, by clicking on the spreadsheet icon onthe right side of the Report drop-down list.
Result
You can use the data in the spreadsheet to create your own charts and graphs or to analyze the datastatistically.
What scheduling report generation isOperations Manager allows you to schedule the generation of reports.
The report can include the following statistics:
• Volume capacity used• CPU usage• Storage system capacity• Storage system up time
150 | OnCommand Unified Manager Operations Manager Administration Guide

What Report Archival Directory is
Report Archival Directory is a repository where all the reports are archived.
You can modify the location of the destination directory by using the following CLI command: dfmoptions set reportsArchiveDir=<destination dir>.
When you modify the Report Archival Directory location, the DataFabric Manager server checkswhether the directory is writable to archive the reports.
In the case of a Windows operating system, if the directory exists on the network, then thedestination directory must be a UNC path. Besides, to save the reports, the scheduler service mustrun with an account that has write permissions on the directory. The server service must run with anaccount that has read and delete permissions on the directory to view and delete report output,respectively. The permissions for a service can be configured using Windows Service ConfigurationManager.
Note: You require the Database Write capability on the Global group to modify the ReportArchival Directory option.
Additional capabilities for categories of reports
You require report-specific read capability on the object apart from the Database Read capability.
The capabilities that you require for the categories of reports are as follows:
Report category Capabilities
Event Reports Event Read capability
Policy Reports Policy Read capability
Mirror Reports (7-Mode environments only) Mirror Read capability
What Report Schedules reports are
The Report Schedules report shows you information about the existing report schedules. A reportschedule is an association between a report and a schedule for the report to be generated at aparticular time.
By default, Report Schedules reports display in Reports > Schedule > Report Schedules.
Scheduling a report using the All submenu
You can schedule a report using the All submenu from the Reports menu in Operations Manager.
Steps
1. From any page, click Reports > All to display the Report Categories page.
By default, the Recently Viewed category appears.
Storage monitoring and reporting | 151
2. Select a report of your choice.
3. Click Show to display the selected report.
4. Click the Schedule This Report icon, , located in the upper right corner of the page.
5. In the Reports - Add a Schedule page, specify the report schedule parameters.
For details about the report schedule parameters, see the Operations Manager Help.
6. Click Add.
Scheduling a report using the Schedule submenu
You can schedule a report using the Schedule submenu from the Reports menu.
Steps
1. From any page, click Reports > Schedule to display all the report schedules.
2. Click Add New Report Schedule.
3. In the Reports - Add a Schedule page, specify the report schedule parameters.
For details about the report schedule parameters, see the Operations Manager Help.
4. Click Add.
Methods to schedule a reportYou can schedule a report in two possible methods from the Reports menu.
Following are the two methods with which you can schedule a report:
• Using the Schedule submenu from the Reports menu• Using the All submenu from the Reports menu
Editing a report schedule
You can edit a report schedule using the Schedule submenu from the Reports menu.
Steps
1. From any page, click Reports > Schedule to display all the report schedules.
2. Click the report schedule that you want to edit.
Alternatively, click Saved Reports to list all the report outputs, and then click Report Schedulesentry, that you want to edit.
3. In the Reports - Edit a Schedule page, edit the report schedule parameters.
4. Click Update.
152 | OnCommand Unified Manager Operations Manager Administration Guide

Deleting a report schedule
You can delete a report schedule using the Schedule submenu from the Reports menu.
Steps
1. From any page, click Reports > Schedule to display all the report schedules.
2. Select the report schedule that you want to delete.
3. Click Delete Selected.
Enabling a report schedule
You can enable a report schedule using the Schedule submenu from the Reports menu.
Steps
1. From any page, click Reports > Schedule to display all the report schedules.
2. Select the report schedule that you want to enable.
3. Click Enable Selected.
Disabling a report schedule
You can disable a report schedule using the Schedule submenu from the Reports menu.
Steps
1. From any page, click Reports > Schedule to display all the report schedules.
2. Select the report schedule that you want to disable.
3. Click Disable Selected.
Running a report schedule
You can run a report schedule using the Schedule submenu from the Reports menu.
Steps
1. From any page, click Reports > Schedule to display all the report schedules.
2. Select the report schedule that you want to run.
3. Click Run Selected.
Storage monitoring and reporting | 153

Retrieving the list of enabled report schedules
You can retrieve the list of enabled report schedules using the Schedule submenu from the Reportsmenu.
Steps
1. From any page, click Reports > Schedule to display all the report schedules.
2. Select the Report Schedules, Enabled entry from the Report drop-down list.
Retrieving the list of disabled report schedules
You can retrieve the list of disabled report schedules using the Schedule submenu from the Reportsmenu.
Steps
1. From any page, click Reports > Schedule to display all the report schedules.
2. Select the Report Schedules, Disabled entry from the Report drop-down list.
Listing all the run results of a report schedule
You can list all the run results of a report schedule using the Schedule submenu from the Reportsmenu.
Steps
1. From any page, click Reports > Schedule to display all the report schedules.
2. Click Last Result Value of a report schedule to display the run result for that particular reportschedule.
What Schedules reports areThe Schedules report shows you information about the existing schedules and the names of the reportschedules that are using a particular schedule.
By default, Schedules reports display in Reports > Schedule > Schedules. The Schedules tabdisplays all the schedules.
Schedules are separate entities that can be associated with reports.
Listing all the schedules
You can list all the schedules using the Schedule submenu from the Reports menu.
Steps
1. From any page, click Reports > Schedule to display all the report schedules.
154 | OnCommand Unified Manager Operations Manager Administration Guide

2. Click Schedules.
Adding a new schedule
You can add a new schedule using the Schedule submenu from the Reports menu.
Steps
1. From any page, click Reports > Schedule to display all the report schedules.
2. Click the Schedules tab.
3. Click Add New Schedule.
4. In the Schedules - Add a Schedule page, specify the schedule parameters.
For details about the schedule parameters, see the Operations Manager Help.
5. Click Add.
Editing a schedule
You can edit a schedule using the Schedule submenu from the Reports menu.
Steps
1. From any page, click Reports > Schedule to display all the report schedules.
2. Click Schedules.
3. Click the schedule you want to edit.
4. In the Schedules - Edit a Schedule page, edit the schedule parameters.
5. Click Update.
Deleting a schedule
You can delete a schedule using the Schedule submenu from the Reports menu.
Steps
1. From any page, click Reports > Schedule to display all the report schedules.
2. Click Schedules.
3. Select the schedule that you want to delete.
Note: If the schedule is used by a report schedule, then the schedule cannot be selected fordeletion.
4. Click Delete Selected.
Storage monitoring and reporting | 155

What Saved reports areThe Saved reports display information about report outputs such as Status, Run Time, and thecorresponding report schedule, which generated the report output.
By default, Saved reports display in Reports > Schedule > Saved Reports. The Saved Reports tabdisplays the list of all the report outputs that are generated by the report schedules.
Listing the report outputs
You can list the report outputs that are generated by all the report schedules using the Schedulesubmenu from the Reports menu.
Steps
1. From any page, click Reports > Schedule to display all the report schedules.
2. Click Saved Reports to display the list of report outputs.
Listing the successful report outputs
You can list the successful report outputs generated by all the report schedules using the Schedulesubmenu from the Reports menu.
Steps
1. From any page, click Reports > Schedule to display all the report schedules.
2. Click Saved Reports.
3. Select the Report Outputs, Successful entry from the Report drop-down list.
Listing the failed report outputs
You can list the failed report outputs that are generated by all the report schedules using the Schedulesubmenu from the Reports menu.
Steps
1. From any page, click Reports > Schedule to display all the report schedules.
2. Click Saved Reports.
3. Select the Report Outputs, Failed entry from the Report drop-down list.
156 | OnCommand Unified Manager Operations Manager Administration Guide

Viewing the output of report outputs from the status column
There are two possible methods to view the output of a particular Report Output that is generated bya report schedule.
About this task
You can also view the output of a Report Output from the Output ID column in Operations Manager.
Steps
1. From any page, select Schedule from the Reports menu.
2. Click Saved Reports.
3. Click the link under the Status column corresponding to the report output.
Viewing the output of report outputs from the Output ID column
There are two possible methods to view the output of a particular Report Output, which is generatedby a report schedule.
Steps
1. From any page, select Schedule from the Reports menu.
2. Click Saved Reports.
3. Click the Output ID column entry of the Report Output.
4. Click the Output link to view the output.
Viewing the output details of a particular report output
You can view the output details of a particular report output, which is generated by a report schedulein Operations Manager.
Steps
1. From any page, select Schedule from the Reports menu.
2. Click Saved Reports.
3. Click the Output ID entry of the report output.
Storage monitoring and reporting | 157

Data export in the DataFabric Manager serverBy using third-party tools, you can create customized reports from the data you export from theDataFabric Manager server and Performance Advisor.
Operations Manager reports are detailed reports about storage system configuration and utilization.You can create customized reports to perform the following tasks:
• Forecast future capacity and bandwidth utilization requirements• Present capacity and bandwidth utilization statistics• Generate performance graphs• Present monthly service level agreement (SLA) reports
Data export provides the following benefits:
• Saves effort in collecting up-to-date report data from different sources• Provides database access to the historical data that is collected by the DataFabric Manager server• Provides database access to the information that is provided by the custom report catalogs in the
DataFabric Manager server• Provides and validates the following interfaces to the exposed DataFabric Manager server views:
• Open Database Connectivity (ODBC)• Java Database Connectivity (JDBC)
• Enables you to export the Performance Advisor and DataFabric Manager server data to text files,which eases the loading of data to user-specific database
• Allows you to schedule the export• Allows you to specify the list of the counters to be exported• Allows you to consolidate the sample values of the data export• Allows you to customize the rate at which the performance counter data is exported (7-Mode
environments only)
How to access DataFabric Manager server dataBy using third-party tools, you can create customized reports from the data you export from theDataFabric Manager server. By default, you cannot access the DataFabric Manager server views. Toaccess the views that are defined within the embedded database of the DataFabric Manager server,you must first create a database user and then enable database access to this user.
You can access the DataFabric Manager server data through views, which are dynamic virtual tablescollated from data in the database. These views are defined and exposed within the embeddeddatabase of the DataFabric Manager server.
Note: A database user is user-created and authenticated by the database server. Database users arenot related to the DataFabric Manager server users.
158 | OnCommand Unified Manager Operations Manager Administration Guide

Before you can create and give access to a database user, you must have the CoreControl capability.The CoreControl capability enables you to perform the following operations:
• Create a database user• Delete a database user• Enable database access to a database user• Disable database access to a database user
Disable the database access denies the read permission on the DataFabric Manager server viewsfor the user account.
• Change the password for the database user
All of these operations can be performed only through the command-line interface (CLI). For moreinformation about the CLI commands, see the DataFabric Manager server manual (man) pages.
You can use a third-party reporting tool to connect to the DataFabric Manager server database foraccessing views. Following are the connection parameters:
• Database name: monitordb• User name: <database user name>• Password: <database user password>• Port: 2638• dobroad: none• Links: tcpip
Note: To make an Open Database Connectivity (ODBC) connection to a remote database on theDataFabric Manager server, you should clear the Shared memory check box, and select theTCP/IP check box in the Network tab of the ODBC Data Source Administrator dialog box.
Note: The .jar files required for iAnywhere and jConnect JDBC drivers are copied as part of theDataFabric Manager server installation. The new jar files are saved in the following directorypath: .../install/misc/dbconn.
Where to find the database schema for the viewsYou can find the schema for the database views in the Operations Manager Help. Based on thedatabase schema presented, you can choose the objects and the metrics you want to present.
Data types for exportYou can export two types of data: the DataFabric Manager server data and Performance Advisordata.
• DataFabric Manager server dataThe exporting of DataFabric Manager server data is controlled at the global level through thedfmDataExportEnabled option. By default, the value of the dfmDataExportEnabledglobal option is No.
• Performance Advisor data (7-Mode environments only)
Storage monitoring and reporting | 159

The exporting of Performance Advisor data is controlled at the global level and at the host levelthrough the perfDataExportEnabled option. By default, the value of theperfDataExportEnabled option is No.By default, in the first Performance Advisor data export that is performed, the counter data for thepast seven days is exported. The sampling rate for the counter data export is customizable at theglobal level. By default, one sample is exported every 15 minutes.You can consolidate the sample values of the data export only if the sampling interval is greaterthan the interval with which the counter data is collected. By default, the average method is usedto consolidate the sample values. For more information about the samples and counters, see theOnCommand Unified Manager Performance Advisor Administration Guide.
You can export the data, either on-demand or on-schedule, to text files by using the command-lineinterface (CLI). For more information about the CLI commands, see the DataFabric Manager servermanual (man) pages. You must have the CoreControl capability to schedule the data export.
Note: Database views are created within the DataFabric Manager server embedded database. Thismight increase the load on the database server if there are many accesses from the third-party toolsto the exposed views.
Related information
The IBM N series support website: www.ibm.com/storage/support/nseries
Files and formats for storing exported dataThe exported DataFabric Manager server and Performance Advisor data is stored in theexport_<timestamp> directory located under the top-level directory specified by thedataExportDir global option. By default, the value of the dataExportDir global option is<DFM-install-dir>/dataExport.
Format for exported the DataFabric Manager server dataThe exported DataFabric Manager server data is stored in files that are named after the views.
For example, you can store all the iGroup information in the iGroupView file, in the followingformat:
File name: iGroupViewContents:<iGroupId> <hostId> <type> <OSType>... ... ... ...... ... ... ...
The fields in each line of the file correspond to the columns in iGroupView.
160 | OnCommand Unified Manager Operations Manager Administration Guide
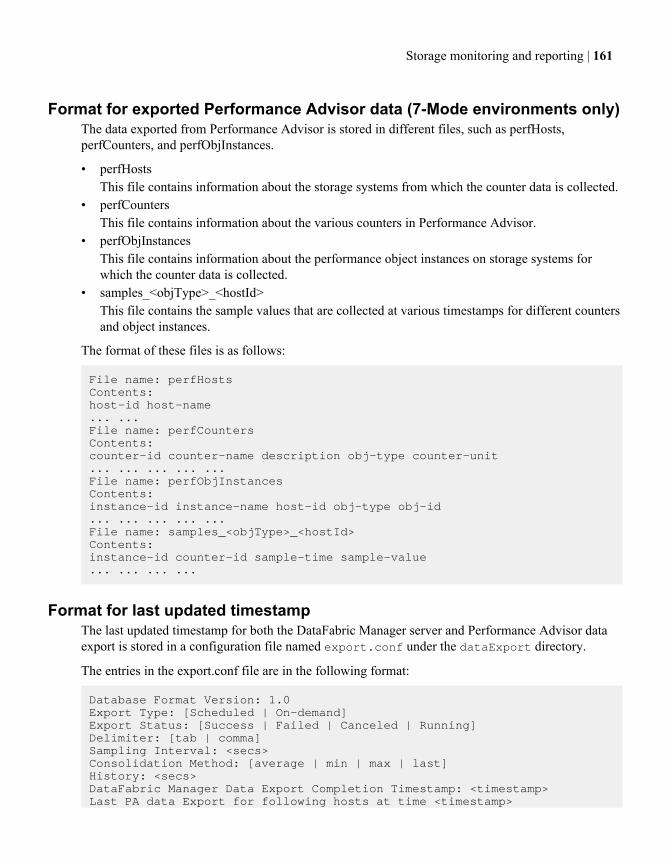
Format for exported Performance Advisor data (7-Mode environments only)The data exported from Performance Advisor is stored in different files, such as perfHosts,perfCounters, and perfObjInstances.
• perfHostsThis file contains information about the storage systems from which the counter data is collected.
• perfCountersThis file contains information about the various counters in Performance Advisor.
• perfObjInstancesThis file contains information about the performance object instances on storage systems forwhich the counter data is collected.
• samples_<objType>_<hostId>This file contains the sample values that are collected at various timestamps for different countersand object instances.
The format of these files is as follows:
File name: perfHostsContents:host-id host-name... ...File name: perfCountersContents:counter-id counter-name description obj-type counter-unit... ... ... ... ...File name: perfObjInstancesContents:instance-id instance-name host-id obj-type obj-id... ... ... ... ...File name: samples_<objType>_<hostId>Contents:instance-id counter-id sample-time sample-value... ... ... ...
Format for last updated timestampThe last updated timestamp for both the DataFabric Manager server and Performance Advisor dataexport is stored in a configuration file named export.conf under the dataExport directory.
The entries in the export.conf file are in the following format:
Database Format Version: 1.0Export Type: [Scheduled | On-demand]Export Status: [Success | Failed | Canceled | Running]Delimiter: [tab | comma]Sampling Interval: <secs>Consolidation Method: [average | min | max | last]History: <secs>DataFabric Manager Data Export Completion Timestamp: <timestamp>Last PA data Export for following hosts at time <timestamp>
Storage monitoring and reporting | 161

------<host-name>-----------<host-name>-----
162 | OnCommand Unified Manager Operations Manager Administration Guide

Security configurationsYou can configure Secure Sockets Layer (SSL) in the DataFabric Manager server to monitor andmanage storage systems over a secure connection by using Operations Manager.
Types of certificates in the DataFabric Manager serverThe DataFabric Manager server uses the signed certificates for secure communication. Signedcertificates provide your browser with a way to verify the identity of the storage system.
The DataFabric Manager server uses the following types of signed certificates:
• Self-signed certificates• Trusted Certificate Authority (CA)-signed certificates
Self-signed certificates in the DataFabric Manager serverYou can generate self-signed certificates by using the DataFabric Manager server. You can set up theDataFabric Manager server as a Certificate Authority (CA), and generate self-signed certificates.
By issuing self-signed certificates, you can avoid the expense and delay of obtaining a certificatefrom an external trusted CA. Self-signed certificates are not signed by a mutually trusted authorityfor secure Web services.
When the DataFabric Manager server sends a self-signed certificate to a client browser, the browserhas no way of verifying the identity of the DataFabric Manager server. As a result, the client browserdisplays a warning indicating to accept the certificate. After the browser accepts the certificate, theDataFabric Manager server is allowed to permanently import the certificate.
If you decide to issue self-signed certificates, you must safeguard access to, and communicationswith, the DataFabric Manager server and the file system that contains its Secure Socket Layer (SSL)-related private files.
Trusted Certificate Authority (CA)-signed certificates in the DataFabricManager server
You can generate trusted CA-signed certificates using the DataFabric Manager server. When theDataFabric Manager server sends a trusted CA-signed certificate to the client browser, the browserverifies the identity of the server.
You should obtain a trusted CA-signed certificate by generating a Certificate Signing Request (CSR)in the DataFabric Manager server, and then submitting that request to a trusted authority for secureWeb services. The DataFabric Manager server accepts certificates from Thawte, Verisign, and RSA.
163

Creating self-signed certificates in the DataFabric Manager serverYou can generate self-signed certificate from the command-line interface (CLI) of the DataFabricManager server. You can set up the DataFabric Manager server as a Certificate Authority (CA), andgenerate self-signed certificates.
Steps
1. Log into the DataFabric Manager server as the DataFabric Manager server administrator.
2. From the command-line interface, enter the following command:
dfm ssl server setup
3. Enter the following information when prompted:
• Key Size• Certificate Duration• Country Name• State or Province• Locality Name• Organization Name• Organizational Unit Name• Common Name• Email Address
Result
The DataFabric Manager server SSL server is now initialized with a self-signed certificate and theprivate key, server.key file is placed in the following DataFabric Manager server directory: c:\Program Files\IBM\DataFabric Manager\DFM\conf\.
Obtaining a trusted CA-signed certificateYou can obtain a certificate from a trusted Certificate Authority (CA) by running commands from theDataFabric Manager server command-line interface (CLI).
Steps
1. Enter the following command:
dfm ssl server req -o filename
The DataFabric Manager server creates a certificate signing request (CSR) file.
2. Submit the CSR to a CA for signing.
3. Import the signed certificate by entering the following command:
dfm ssl server import cert_filename
164 | OnCommand Unified Manager Operations Manager Administration Guide
cert_filename is the certificate filename.
You can view the DataFabric Manager server private key and certificate files by running thecommand, dfm ssl server show.
Enabling HTTPSYou can use the httpsEnabled option by using the DataFabric Manager server CLI for theDataFabric Manager server to provide HTTPS services.
Before you begin
Ensure that you have set up the SSL server by using the dfm ssl server setup command.
Steps
1. Enter the following command:dfm option set httpsEnabled=Yes
2. Change the HTTPS port by entering the following command:dfm option set httpsPort=port_number
The default HTTPS port is 8443.
3. Stop the Web server by using the following command:dfm service stop http
4. Start the Web server by using the command:dfm service start http
This restarts the service using the trusted Certificate Authority (CA) certificate.
Secure communications with the DataFabric Manager serverSecure communications require a secure connection at both ends of each communications link. In theDataFabric Manager server, the two ends of a communication link consist of a secure server andsecure managed host.
Clients, including browsers and managed storage systems, must use a secure connection to connect tothe DataFabric Manager server. The DataFabric Manager server, in turn, uses a secure connection toconnect to a storage system.
How clients communicate with the DataFabric Manager serverThe DataFabric Manager server and the clients use a set of protocols such as HTTPS and SecureShell (SSH) to communicate with each other.
The system on which the DataFabric Manager server is installed, the clients use the followingcombination of protocols running over SSL:
Security configurations | 165

• Browsers use HTTPS to connect to a secure the DataFabric Manager server.• The DataFabric Manager server connects to managed hosts by using SSH for operational
purposes.• The DataFabric Manager server connects to managed storage systems by using HTTPS for
monitoring purposes.
SecureAdmin for secure connection with the DataFabric Manager serverclients
To enable secure connection, you must have SecureAdmin installed on your storage systems.
SecureAdmin is an add-on software module that enables authenticated, command-basedadministrative sessions between an administrative user and storage systems over an intranet or theInternet.
This combination of SSL and SecureAdmin allows you to securely monitor and manage your storagesystems in the DataFabric Manager server.
Requirements for security optionsThe security options in the DataFabric Manager server have the following requirements:
• If you disable HTTP and enable HTTPS, all browsers must connect to the DataFabric Managerserver through HTTPS.
• If you want to enable secure connections from any browser, you must enable HTTPS transport onthe DataFabric Manager server.
• You cannot disable both HTTP and HTTPS transports. The DataFabric Manager server does notallow that configuration.To completely disable access to Operations Manager, stop the HTTP service at the CLI using thefollowing command: dfm service stop http.
• You must select the default port for each transport type you have enabled. The ports must bedifferent from each other.
Guidelines to configure security options in Operations ManagerYou should configure security options in Operations Manager using secure protocol.
When configuring the DataFabric Manager server for SSL, you are responsible for safeguardingaccess to and communications with the DataFabric Manager server and the file system that containsthe SSL-related private files. The DataFabric Manager server should not be accessed by not secureprotocols, such as Telnet and RSH. Instead, use a secure, private network, or a secure protocol, suchas SSH, to connect to the DataFabric Manager server.
166 | OnCommand Unified Manager Operations Manager Administration Guide

Managed host optionsYou can configure the managed host options to ensure secure communication between theDataFabric Manager server and storage systems.
You can select conventional (HTTP) or secure (HTTPS) administration transport for APIcommunication and conventional (RSH) or secure (SSH) login protocol for login connection.
Where to find managed host optionsYou can set managed host options by using both GUI and command-line interface.
The locations of managed host options are described in the following table.
Option type GUI Command-line interface
Global Options page (Setup > Options dfm option list (to view)dfm option set (to set)
Appliance-specific Edit Storage Controller Settingspage (Controllers > controllername > Storage Controller Tools> Edit Settings
dfm host get (to view)dfm host set (to set)
Guidelines for changing managed host optionsYou can change managed host options, such as the login protocol, transport protocol, port, andhosts.equiv option.
Login Protocol This option enables you to set login protocols (RSH or SSH) that theDataFabric Manager server uses when connecting to the managed hosts.
• Login connections.• HA pair operations• The dfm run command for running commands on the storage system
Change the default value if you want a secure connection for active/activeconfiguration operations, running commands on the storage system.
AdministrationTransport
This option enables you to select a conventional (HTTP) or secure (HTTPS)connection to monitor and manage storage systems through APIs (XML).
Change the default value if you want a secure connection for monitoring andmanagement.
AdministrationPort
This option enables you to configure the administration port which, along withadministration transport, monitors and manages storage systems.
Security configurations | 167
If you do not configure the port option at the storage system level, the defaultvalue for the corresponding protocol is used.
Note: If the value of the administration port is manually entered, when thevalue of the administration transport is changed for a host, you must ensurethat you manually change the value of the administration port.
hosts.equivoption
This option enables users to authenticate storage systems when the user nameand password are not provided.
You must change the default value if you have selected the global defaultoption and if you do not want to set authentication for a specific storagesystem.
Note: If you do not set the transport and port options for a storage system, then the DataFabricManager server uses SNMP to get storage system-specific transport and port options forcommunication. If SNMP fails, then the DataFabric Manager server uses the options set at theglobal level.
Comparison between global and storage system-specific managed hostoptions
You can set managed host options globally, for all storage systems, or individually, for specificstorage systems.
If you set storage system-specific options, the DataFabric Manager server retains information aboutthe security settings for each managed storage system. It references this information when decidingwhether to use one of the following options to connect to the storage system:
• HTTP or HTTPS• RSH or SSH• Login password• hosts.equiv authentication
If a global setting conflicts with a storage system-specific setting, the storage system-specific settingtakes precedence.
Note: You must use storage system-specific managed host options if you plan to use SecureAdminon some storage systems and not on others.
Limitations in managed host optionsYou can enable managed host options, but you must accept the following known limitations.
• The DataFabric Manager server cannot connect to storage systems without SecureAdmininstalled or to older storage systems that do not support SecureAdmin.
• On storage systems, SecureAdmin is not mutually exclusive with HTTP access.
168 | OnCommand Unified Manager Operations Manager Administration Guide

Transport behavior is configurable on the storage system with the httpd.admin.access option.The http.admin.ssl.enable option enables HTTPS access. For more information, see thedocumentation for your storage system.
• If you have storage systems running SecureAdmin 2.1.2R1 or earlier, HTTPS options do notwork with self-signed certificates. You can work around this problem by using a trusted CA-signed certificate.
• If the hosts.equiv option and login are set, then the hosts.equiv option takes precedence.
Changing password for storage systems in the DataFabricManager server
You can change the password for an individual storage system on the Edit Storage ControllerSettings page using Operations Manager.
Steps
1. Go to the Storage Controller Details page for the storage system or hosting storage system (ofthe vFiler unit) and choose Edit Settings from the Storage Controller Tools (at the lower left ofOperations Manager).
The Edit Storage Controller Settings page is displayed.
2. In the Login field, enter a user name that the DataFabric Manager server uses to authenticate thestorage system or the vFiler unit.
3. In the Password field, enter a password that the DataFabric Manager server uses to authenticatethe storage system or the vFiler unit.
4. Click Update.
Changing passwords on multiple storage systemsThe DataFabric Manager server enables you to set passwords on all storage systems when you usethe same authentication credentials on each system.
About this task
You should select the Global group to set the same passwords on all the systems at once.
Steps
1. Log in to Operations Manager.
2. Depending on the type of object for which you want to manage the passwords, select one of thefollowing:
Security configurations | 169
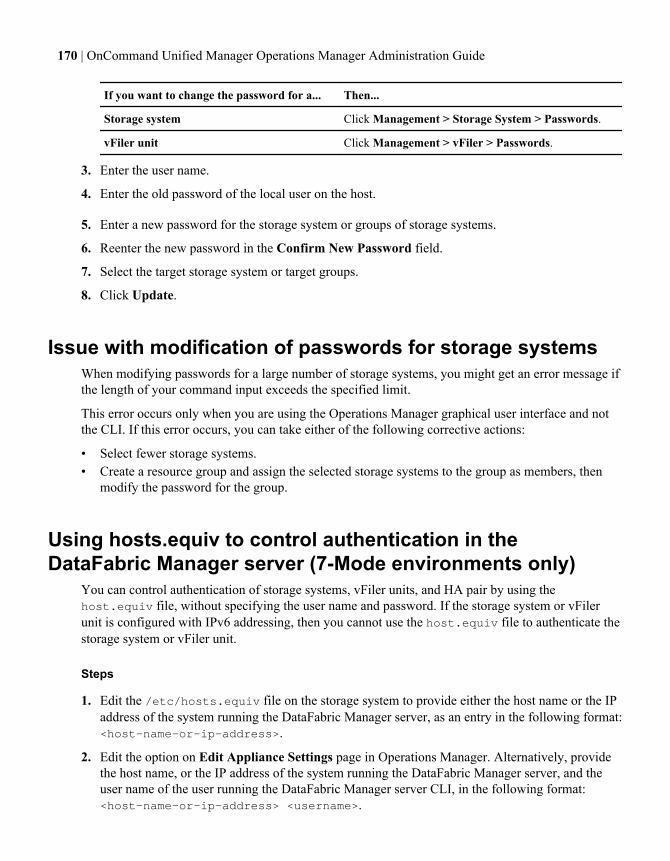
If you want to change the password for a... Then...
Storage system Click Management > Storage System > Passwords.
vFiler unit Click Management > vFiler > Passwords.
3. Enter the user name.
4. Enter the old password of the local user on the host.
5. Enter a new password for the storage system or groups of storage systems.
6. Reenter the new password in the Confirm New Password field.
7. Select the target storage system or target groups.
8. Click Update.
Issue with modification of passwords for storage systemsWhen modifying passwords for a large number of storage systems, you might get an error message ifthe length of your command input exceeds the specified limit.
This error occurs only when you are using the Operations Manager graphical user interface and notthe CLI. If this error occurs, you can take either of the following corrective actions:
• Select fewer storage systems.• Create a resource group and assign the selected storage systems to the group as members, then
modify the password for the group.
Using hosts.equiv to control authentication in theDataFabric Manager server (7-Mode environments only)
You can control authentication of storage systems, vFiler units, and HA pair by using thehost.equiv file, without specifying the user name and password. If the storage system or vFilerunit is configured with IPv6 addressing, then you cannot use the host.equiv file to authenticate thestorage system or vFiler unit.
Steps
1. Edit the /etc/hosts.equiv file on the storage system to provide either the host name or the IPaddress of the system running the DataFabric Manager server, as an entry in the following format:<host-name-or-ip-address>.
2. Edit the option on Edit Appliance Settings page in Operations Manager. Alternatively, providethe host name, or the IP address of the system running the DataFabric Manager server, and theuser name of the user running the DataFabric Manager server CLI, in the following format:<host-name-or-ip-address> <username>.
170 | OnCommand Unified Manager Operations Manager Administration Guide

3. Depending on the operating system, perform the appropriate action:
If theoperatingsystem is...
Then...
Linux Provide the host name or the IP address of the system running the DataFabric Managerserver, and the user name of the user running the HTTP service, in the following format:<host-name-or-ip-address> <username>.
By default, the HTTP service runs as nobody user on Linux.
Windows Provide the host name, or the IP address of the system running the DataFabric Managerserver, and the user name of the user running the HTTP, server, scheduler, and monitorservices, in the following format: <host-name-or-ip-address> <username>.
By default, the HTTP, server, scheduler, and monitor services run as LocalSystemuser on Windows.
If the DataFabric Manager server is running on a host named DFM_HOST, and USER1 isrunning the dfm commands, then by default, on a Linux operating system, you have to providethe following entries:
DFM_HOST
DFM_HOST USER1
DFM_HOST nobody
On Windows operating system, you have to provide the following entries:
DFM_HOST
DFM_HOST USER1
DFM_HOST SYSTEM
For more information about configuring the /etc/hosts.equiv file, see the Data ONTAPStorage Management Guide for 7-Mode.
Related information
The IBM N series support website: www.ibm.com/storage/support/nseries
Security configurations | 171

Editing HTTP and monitor services to run as different userYou can configure HTTP and monitor services using Operations Manager.
Step
1.Operating system Command
Linux dfm service runas -u <user-name> http
Windows dfm service runas -u <user-name> -p <password> [http] [monitor]
Note: For security reasons the <user-name> cannot be “root” on Linux. On Windows hosts,<user-name> should belong to the administrator group.
172 | OnCommand Unified Manager Operations Manager Administration Guide

User quotasYou can use user quotas to limit the amount of disk space or the number of files that a user can use.Quotas provide a way to restrict or track the disk space, and number of files used by a user, group, orqtree. Quotas are applied to a specific volume or qtree.
Why you use quotasYou can use quotas to limit resource usage, to provide notification when resource usage reachesspecific levels, or to track resource usage.
You specify a quota for the following reasons:
• To limit the amount of disk space or the number of files that can be used by a user or group, orthat can be contained by a qtree
• To track the amount of disk space or the number of files used by a user, group, or qtree, withoutimposing a limit
• To warn users when their disk usage or file usage is high
Overview of the quota processQuotas can be soft or hard. Soft quotas cause Data ONTAP to send a notification when specifiedthresholds are exceeded, and hard quotas prevent a write operation from succeeding when specifiedthresholds are exceeded.
When Data ONTAP receives a request to write to a volume, it checks to see whether quotas areactivated for that volume. If so, Data ONTAP determines whether any quota for that volume (and, ifthe write is to a qtree, for that qtree) would be exceeded by performing the write operation. If anyhard quota is exceeded, the write operation fails, and a quota notification is sent. If any soft quota isexceeded, the write operation succeeds, and a quota notification is sent.
User quota management using Operations ManagerYou can view user quota summary reports, chargeback reports, user details, quota events, and so on.
You can perform the following user quota management tasks by using Operations Manager:
• View summary reports (across all storage systems) and per-quota reports with data, about filesand disk space that is used by users, hard and soft quota limits, and the projected time when usersexceed their quota limit
• View graphs of total growth and per-quota growth of each user• View details about a user
173
• Obtain chargeback reports for users• Edit user quotas when you edit user quotas through Operations Manager, the /etc/quotas file
is updated on the storage system on which the quota is located.• Configure and edit user quota thresholds for individual users, volumes, and qtrees. When you
configure a user quota threshold for a volume or qtree, the settings apply to all user quotas on thatvolume or qtree.
• Notify users when they exceed the user quota thresholds configured in the DataFabric Managerserver
• Configure the monitoring interval for user quota monitoring• View and respond to user quota events• Configure alarms to notify administrators of the user quota events
Related concepts
Where to find user quota reports in Operations Manager on page 174Monitor interval for user quotas in Operations Manager on page 175What user quota thresholds are on page 176
Prerequisites for managing user quotas using Operations ManagerTo monitor and manage user quotas by using Operations Manager, you must ensure that your storagesystem meets certain prerequisites.
• Following are the prerequisites to monitor and edit user quotas assigned to vFiler units:
• You should enable RSH or SSH access to the storage system and configure login andpassword credentials that are used to authenticate the DataFabric Manager server.
• You must use the DataFabric Manager server to configure the root login name and root passwordof a storage system on which you want to monitor and manage user quotas.
• You must configure and enable quotas for each volume for which you want to view the userquotas.
• You must log in to Operations Manager as an administrator with quota privilege to view userquota reports and events so that you can configure user quotas for volumes and qtrees.
• Directives, such as QUOTA_TARGET_DOMAIN and QUOTA_PERFORM_USER_MAPPING,must not be present in the /etc/quotas file on the storage system.
• The /etc/quotas file on the storage system must not contain any errors.
Where to find user quota reports in Operations ManagerYou can view user quota reports in Operations Manager at Control Center > Home > Quotas >Report.
174 | OnCommand Unified Manager Operations Manager Administration Guide

Monitor interval for user quotas in Operations ManagerYou can use Operations Manager to view the monitoring interval at which the DataFabric Managerserver is monitoring a user quota on a storage system.
The User Quota Monitoring Interval option on the Options page (Setup > Options >Monitoring) determines how frequently the DataFabric Manager server collects the user quotainformation from the monitored storage systems. By default, the user quota information is collectedonce every day; however, you can change this monitoring interval.
Note: The process of collecting the user quota information from storage systems is resourceintensive. When you decrease the User Quota Monitoring Interval option to a low value, theDataFabric Manager server collects the information more frequently. However, decreasing theUser Quota Monitoring Interval might negatively affect the performance of the storage systemsand the DataFabric Manager server.
Modification of user quotas in Operations ManagerYou can edit disk space threshold, disk space hard limit, disk space soft limit, and so on for a userquota in Operations Manager.
When you edit the options for a user quota, the /etc/quotas file on the storage system where thequota exists is appropriately updated.
• Disk space threshold• Disk space hard limit• Disk space soft limit• Files hard limit• Files soft limit
For more information about these fields, see the Operations Manager Help.
Prerequisites to edit user quotas in Operations ManagerIf you want to edit user quota in Operations Manager, ensure that your storage system meets theprerequisites.
• You must configure the root login name and root password in the DataFabric Manager server forthe storage system on which you want to monitor and manage user quotas.
• You must configure and enable quotas for each volume for which you want to view the userquotas.
• Operations Manager conducts vFiler quota editing by using the jobs. If a vFiler quota editing jobfails, verify the quota file on the hosting storage system.In addition, to protect the quota file against damage or loss, before starting a job, the DataFabricManager server creates a backup file named DFM (timestamp).bak. If the job fails, you canrecover data by renaming the backup quota file.
User quotas | 175
Editing user quotas using Operations ManagerYou can edit user quotas by using the Edit Quota Settings page in Operations Manager to increase ordecrease the limits associated with them.
Before you begin
You must have ensured that the storage system meets the prerequisites.
Steps
1. Click Control Center > Home > Group Status > Quotas > Report > User Quotas, All.
2. Click any quota-related fields for the required quota and modify the values.
Configuring user settings using Operations ManagerYou can configure user settings, such as the email address of users and quota alerts, and set userquota threshold using Operations Manager.
Steps
1. Click Control Center > Home > Group Status > Quotas > Report > User Quotas, All.
2. Click the Edit Settings link in the lower left corner.
3. Edit settings such as email address of the user, quota alerts and user quota alerts for full thresholdand nearly full threshold, resource tag, and so on.
You can leave the email address field blank if you want the DataFabric Manager server to use thedefault email address of the user.
4. Click Update.
What user quota thresholds areUser quota thresholds are the values that the DataFabric Manager server uses to evaluate whether thespace consumption by a user is nearing, or has reached the limit that is set by the user’s quota.
If these thresholds are crossed, the DataFabric Manager server generates user quota events.
By default, the DataFabric Manager server sends user alerts in the form of e-mail messages to theusers who cause user quota events. Additionally, you can configure alarms that notify the specifiedrecipients (DataFabric Manager server administrators, a pager address, or an SNMP trap host) of userquota events.
The DataFabric Manager server can also send a user alert when users exceed their soft quota limit;however, no thresholds are defined in the DataFabric Manager server for the soft quotas. The
176 | OnCommand Unified Manager Operations Manager Administration Guide

DataFabric Manager server uses the soft quota limits set in the /etc/quotas file of a storagesystem to determine whether a user has crossed the soft quota.
What the DataFabric Manager server user thresholds areThe DataFabric Manager server user quota thresholds are a percentage of the Data ONTAP hardlimits (files and disk space) configured in the /etc/quotas file of a storage system.
The user quota threshold makes the user stay within the hard limit for the user quota. Therefore, theuser quota thresholds are crossed even before users exceed their hard limits for user quotas.
User quota thresholdsYou can set a user quota threshold to all the user quotas present in a volume or a qtree.
When you configure a user quota threshold for a volume or qtree, the settings apply to all user quotason that volume or qtree.
The DataFabric Manager server uses the user quota thresholds to monitor the hard and soft quotalimits configured in the /etc/quotas file of each storage system.
Ways to configure user quota thresholds in Operations ManagerYou can configure user quota thresholds by applying the thresholds to all quotas of a specific user oron a specific file system or on a group of file systems using Operations Manager.
• Apply user quota thresholds to all quotas of a specific user• Apply user quota thresholds to all quotas on a specific file system (volume or qtree) or a group of
file systemsYou can apply thresholds using the Edit Quota Settings links on the lower left pane of theDetails page for a specific volume or qtree. You can access the Volume Details page by clickingon a volume name at Control Center > Home > Member Details > File Systems > Report >Volumes, All. Similarly, for the Qtree Details page, clicking on the qtree name at ControlCenter > Home > Member Details > File Systems > Report > Qtrees, AllTo apply settings to a group of file systems, select the group name from the Apply Settings To liston the quota settings page.
• Apply user quota thresholds to all quotas on all users on all file systems: that is, all user quotas inthe DataFabric Manager server databaseYou can apply thresholds at Setup > Options > Edit Options: Default Thresholds.
Precedence of user quota thresholds in the DataFabric Manager serverThe DataFabric Manager server prioritizes user quota threshold based on a specific user, a specificvolume or a qtree, and, all users in the DataFabric Manager server.
The following list specifies the order in which user quota thresholds are applied:
1. User quota thresholds specified for a specific user
2. File systems (volumes and qtrees) user quota thresholds specified for a specific volume or qtree
User quotas | 177

3. Global user quota thresholds specified for all users in the DataFabric Manager server database
178 | OnCommand Unified Manager Operations Manager Administration Guide

Management of LUNs, Windows and UNIX hosts,and FCP targets
You can use Operations Manager to monitor and manage LUNs, Windows and UNIX hosts, and FCPtargets in your SANs. SANs on the DataFabric Manager server are storage networks that are installedin compliance with the specified SAN setup guidelines.
Note: IBM has announced the end of availability for the SAN license for the DataFabric Managerserver. Existing customers can continue to license the SAN option with the DataFabric Managerserver. DataFabric Manager server customers should check with their IBM sales representativeabout other IBM N series SAN management solutions.
For more information about setting up a SAN, see the Data ONTAP SAN Administration Guide for7-Mode.
Related information
The IBM N series support website: www.ibm.com/storage/support/nseries
Management of SAN componentsTo monitor and manage LUNs, FCP targets, and SAN hosts, the DataFabric Manager server mustfirst discover them.
The DataFabric Manager server uses SNMP to discover storage systems, but SAN hosts must alreadyhave the DataFabric Manager Host Agent software installed and configured on them before theDataFabric Manager server can discover them.
After SAN components have been discovered, the DataFabric Manager server starts collectingpertinent data—for example, which LUNs exist on which storage systems. Data is collectedperiodically and reported through various Operations Manager reports. (The frequency of datacollection depends on the values that are assigned to the DataFabric Manager server monitoringintervals.)
The DataFabric Manager server monitors LUNs, FCP targets, and SAN hosts for a number ofpredefined conditions and thresholds. For example, when the state of an HBA port changes to onlineor offline or when the traffic on an HBA port exceeds a specified threshold. If a predefined conditionis met or a threshold is exceeded, the DataFabric Manager server generates and logs an event in itsdatabase. These events can be viewed through the details page of the affected object. Additionally,you can configure the DataFabric Manager server to send notification about such events (also knownas alarms) to an e-mail address. You can also configure the DataFabric Manager server to sendnotifications to a pager, an SNMP trap host, or a script you write.
In addition to monitoring LUNs, FCP targets, and SAN hosts, you can use the DataFabric Managerserver to manage these components. For example, you can create, delete, or expand a LUN.
179

SAN and DataFabric Manager Host Agent software (7-Modeenvironments only)
The DataFabric Manager server can automatically discover SAN hosts; however, it does not useSNMP to poll for new hosts.
DataFabric Manager Host Agent software discovers, monitors, and manages SANs on SAN hosts.You must install the DataFabric Manager Host Agent software on each SAN host that you want tomonitor and manage with the DataFabric Manager server.
Note: To modify the global host agent monitoring interval for SAN hosts, you must change theSAN Host Monitoring Interval (Setup > Options > Monitoring).
List of tasks you can perform using DataFabric ManagerHost Agent software (7-Mode environments only)
After you install DataFabric Manager Host Agent software on a client host along with the DataFabricManager server, you can perform various management tasks, such as monitoring system informationfor SAN hosts, and creating and managing LUNs.
You can perform the following tasks:
• Monitor basic system information for SAN hosts and related devices.• Perform management functions, such as creating, modifying, or expanding a LUN.• View detailed LUN information.
Related information
The IBM N series support website: www.ibm.com/storage/support/nseries
List of tasks performed to monitor targets and initiatorsYou can use Operations Manager to perform management tasks such as view reports; monitor,manage, and group LUNs; and respond to LUN and SAN host events.
Following is a list of tasks you can perform to monitor targets and initiators:
• View reports that provide information about LUNs, FCP targets, and SAN hosts.• View details about a specific LUN, FCP target on a storage system, or SAN host.• Group LUNs, storage systems in a SAN, or SAN hosts for efficient monitoring and management.• Change the monitoring intervals for LUNs, and SAN hosts.• View and respond to LUN and SAN host events.
180 | OnCommand Unified Manager Operations Manager Administration Guide
• Configure the DataFabric Manager server to generate alarms to notify recipients of LUN andSAN host events.
Related concepts
Reports for monitoring LUNs, FCP targets, and SAN hosts on page 182Information available on the LUN Details page on page 183Tasks performed from the LUN Details page on page 184Information about the FCP Target Details page on page 184Information provided in the Host Agent Details page (7-Mode environments only) on page 185Tasks you can perform from the Host Agent Details page (7-Mode environments only) on page185
Prerequisites to manage targets and initiatorsOperations Manager does not report any data for your targets and initiators if you have not completedthe specified hardware and software requirements for your SAN setup.
For more information about the supported hardware platforms, see the N series interoperabilitymatrix website (accessed and navigated as described in Websites on page 17). For moreinformation about specific software requirements, see the OnCommand Unified Manager Installationand Setup Guide.
Related information
The IBM N series support website: www.ibm.com/storage/support/nseries
Prerequisites to manage SAN hostsYou must ensure that a proper network connection and software is installed on SAN hosts before youmanage SAN hosts with the DataFabric Manager server.
• All SAN hosts to be managed by the DataFabric Manager server must be connected to a TCP/IPnetwork either known to or discoverable by the DataFabric Manager server.The SAN hosts must be connected to the network through an Ethernet port and must each have avalid IP address.
• Each SAN host must have the DataFabric Manager Host Agent software installed on it.The DataFabric Manager Host Agent software is required for discovering, monitoring, andmanaging SAN hosts. For more information about the DataFabric Manager Host Agent software,see the DataFabric Manager Host Agent Installation and Administration Guide.
• For LUN management using the DataFabric Manager server, Windows SAN hosts must have thecorrect version of SnapDrive software installed.For information about which SnapDrive version you received, see the DataFabric Manager serversoftware CD.
Note: LUN management on UNIX SAN hosts using the DataFabric Manager server is notavailable. LUNs inherit access control settings from the storage system, volume, and qtree they are
Management of LUNs, Windows and UNIX hosts, and FCP targets | 181

contained in. Therefore, to perform LUN operations on storage systems, you must haveappropriate privileges set up on those storage systems.
Related information
The IBM N series support website: www.ibm.com/storage/support/nseries
Reports for monitoring LUNs, FCP targets, and SAN hostsReports about LUNs, SAN hosts, and FCP targets that the DataFabric Manager server monitors, areavailable on the LUNs page of Member Details tab.
You can view reports by selecting from the Report drop-down list. If you want to view a report abouta specific group, click the group name in the left pane of Operations Manager. You can view thefollowing reports from the LUNs page:
• FCP Targets• SAN Hosts, Comments• SAN Hosts, All• SAN Hosts, FCP• SAN Hosts, iSCSI• SAN Hosts, Deleted• SAN Hosts Traffic, FCP• SAN Host Cluster Groups• SAN Host LUNs, All• SAN Hosts LUNs, iSCSI• SAN Hosts LUNs, FCP• LUNs, All• LUNs, Comments• LUNs, Deleted• LUNs, Unmapped• LUN Statistics• LUN Initiator Groups• Initiator Groups
For more information about descriptions of each report field, see the Operations Manager Help.
182 | OnCommand Unified Manager Operations Manager Administration Guide

Information available on the LUN Details pageThe LUN Details page for a LUN consists of information such as status of the LUN, the LUN'sstorage system and so on.
You can access the Details page for a LUN by clicking the LUN path displayed in any of the reports.Following are the information about the LUN Details page:
• Status of the LUN• Storage system on which the LUN exists• Volume or qtree on which the LUN exists• Initiator groups to which the LUN is mapped
You can access all LUN paths that are mapped to an initiator group by clicking the name of theinitiator group.
Note: If a LUN is mapped to more than one initiator group, when you click an initiator group, thedisplayed page lists all the LUN paths that are mapped to the initiator group. Additionally, thereport contains all other LUN mappings (LUN paths to initiator groups) that exist for those LUNpaths.
• Size of the LUN• Serial number of the LUN• Description of the LUN• Events associated with the LUN• Groups to which the LUN belong• Number of LUNs configured on the storage system on which the LUN exists and a link to a
report displaying those LUNs• Number of SAN hosts mapped to the LUN and a link to the report displaying those hosts• Number of HBA ports that can access this LUN and a link to the report displaying those LUNs• Time of the last sample collected and the configured polling interval for the LUN• Graphs that display the following information:
• LUN bytes per second—Displays the rate of bytes (bytes per second) read from and written toa LUN over time
• LUN operations per second—Displays the rate of total protocol operations (operations persecond) performed on the LUN over time
Related concepts
Reports for monitoring LUNs, FCP targets, and SAN hosts on page 182
Management of LUNs, Windows and UNIX hosts, and FCP targets | 183

Tasks performed from the LUN Details pageBy using the LUN Path Tools links on the LUN Details page, you can perform various managementtasks.
Following are the tasks you can perform on the LUN Details page:
Expand this LUN Launches a wizard that helps you expand the LUN
Destroy this LUN Launches a wizard that helps you destroy the LUN
Refresh MonitoringSamples
Obtains current monitoring samples from the storage system on whichthis LUN exists
Run a Command Runs a Data ONTAP command on the storage system on which thisLUN exists
Note: To manage a shared LUN on MSCS, perform the operation on the active controller.Otherwise, the operation fails.
You must have appropriate authentication to run commands on the storage system from theDataFabric Manager server.
Information about the FCP Target Details pageThe FCP Target Details page contains information such as name of the storage system, operationalstatus of the target, adapter speed, and so on.
You can access the FCP Target Details page for a target by clicking its port number in the FCPTargets report (LUNs > View, FCP Targets). The FCP Target Details page contains the followinginformation:
• Name of the storage system on which target is installed• Operational status of the target• Adapter hardware and firmware versions• Adapter speed• FC topology of the target:
• Fabric• Point-To-Point• Loop• Unknown
• Node name (WWNN) and port name (WWPN) of the target• Number of other FCP targets on the storage system on which the target is installed (link to report)• Time of the last sample collected and the configured polling interval for the FCP target
184 | OnCommand Unified Manager Operations Manager Administration Guide
Information provided in the Host Agent Details page (7-Mode environments only)
The Host Agent Details page contains information such as the status of a SAN host, events thatoccurred on a SAN host, and devices related to a SAN host.
You can access the details page for a DataFabric Manager Host Agent by clicking its name in any ofthe SAN Host reports. The details page for a Host Agent on a SAN host contains the followinginformation:
• Status of the SAN host and the time since the host has been running• The operating system and the DataFabric Manager Host Agent version, and the protocols and
features running on the SAN host• The MSCS configuration information about the SAN host, if any, such as the cluster name,
cluster partner, and cluster groups to which the SAN host belongs• The events that occurred on the SAN host• The devices related to the SAN host, such as the storage systems accessible from the SAN host• Graphs that provide information such as the HBA port traffic per second or the HBA port frames
for different time intervals
For more information about the SAN Host reports, see the Operations Manager Help.
Tasks you can perform from the Host Agent Details page (7-Modeenvironments only)
The Host Tools list on the Host Agent Details page enables you to perform various tasks, such asediting settings, creating a LUN, and refreshing monitoring samples.
Edit Settings Displays the Edit Host Agent Settings page, where you can configure thelogin, password, administration transport, and port information for the SANhost, and the user name and password for CIFS access in OperationsManager.
The login and password information is used to authenticate the DataFabricManager server to the DataFabric Manager Host Agent software running onthe SAN host. You should specify a value on this page only if you want tochange the global setting.
Create a LUN Takes you to the LUN creation page, which enables you to create a LUN.
DiagnoseConnectivity
Automates troubleshooting of connectivity issues.
RefreshMonitoringSamples
Obtains current monitoring samples from the SAN host.
Management of LUNs, Windows and UNIX hosts, and FCP targets | 185
Manage HostAgent
Enables you to edit settings for the Host Agent. You can edit details such asmonitoring and management of API passwords, and the HTTP and HTTPSports. This enables remote upgrading and specifies a filewalk log path.
Related concepts
Where to configure monitoring intervals for SAN components on page 187
How storage systems, SAN hosts, and LUNs are groupedYou can group LUNs, storage systems, or SAN hosts for easier management and to apply accesscontrol.
When you create a group of storage systems or SAN hosts, the type of the created group is“Appliance resource group.” When you create a group of LUNs, the created group is “LUN resourcegroup.”
Note: You cannot group HBA ports or FCP targets.
Related tasks
Creating groups on page 93
Granting access to storage systems, SAN hosts, and LUNsYou can allow an administrator access for managing all your SAN hosts and LUNs. The GlobalSANrole allows an administrator to create, expand, and destroy LUNs.
Before you begin
The GlobalSan role must be enabled for LUN management.
Step
1. To allow administrator access, go to the Administrator page and select Setup menu >Administrative users.
Option Description
To create a newadministrator
In the Administrators page, complete the Add a NewAdministrator option, and then select GlobalSAN from the Roleslist.
To grant access to anexisting administrator
In the Administrator page, from the List of administrators, click the Editcolumn of the administrator to be granted access, and then selectGlobalSAN from the Roles list.
186 | OnCommand Unified Manager Operations Manager Administration Guide
Introduction to deleting and undeleting SAN componentsYou can stop monitoring a SAN component (a LUN, a storage system, or a SAN host) with theDataFabric Manager server by deleting it from the Global group.
When you delete a SAN component from the Global group, the DataFabric Manager server stopscollecting and reporting data about it. Data collection and reporting is not resumed until thecomponent is again added by performing the undelete operation.
You cannot stop monitoring a specific FCP target or an HBA port, unless you first stop monitoringthe storage system (for the FCP target) or the SAN host (for the HBA port) on which the target or theport exists.
Note: When you delete a SAN component from any group except Global, the component isdeleted only from that group. The DataFabric Manager server does not stop collecting andreporting data about it. You must delete the SAN component from the Global group for theDataFabric Manager server to stop monitoring it altogether.
Deleting a SAN componentYou can delete a SAN component from any of the reports related to that component.
Steps
1. Select the component you want to delete by clicking the check boxes in the left-most column of areport.
2. Click the Delete Selected button at the bottom of each report to delete the selected component.
How a deleted SAN component delete is restoredYou can restore a deleted object, by selecting it and then clicking the Undelete button from theDeleted report.
All deleted objects are listed in their respective Deleted reports. For example, all deleted LUNs arelisted in the LUNs Deleted report.
Where to configure monitoring intervals for SANcomponents
You can configure the global options on the Options page (Setup menu > Options) in OperationsManager.
To configure local options (for a specific object), you must be on the Edit Settings page of thatspecific object (Details page > Tools list: Edit Settings). For example, to access the LUNs Details
Management of LUNs, Windows and UNIX hosts, and FCP targets | 187

page, click Member Details > LUNs > Report drop-down list: LUNS, All > LUN Path > LUNPath Tools: Edit Settings.
Related concepts
Where to find information about a specific storage system on page 217
188 | OnCommand Unified Manager Operations Manager Administration Guide

File system managementYou can manage storage on storage system by using the data displayed by Operations Managerstorage reports and the options you use to generate storage-related events and alarms.
Access to storage-related reportsYou can view storage-related reports about storage objects that the DataFabric Manager servermonitors.
The storage reports present information about a selected aspect of the storage object, such aschargeback, space availability, and status.
Note: The status specifies the current status of the selected storage object.
You can find storage-related reports on the tabs accessible from the Member Details tab: PhysicalSystems, Virtual Systems, File Systems, Aggregates, and LUNs tabs. Each tab has a Report drop-down list from which you can select the report you want to display.
For information about specific storage-related reports, see the Operations Manager Help.
Storage capacity thresholds in Operations ManagerStorage capacity threshold is the point at which the DataFabric Manager server generates events toreport capacity problem.
Storage capacity thresholds determine at what point you want the DataFabric Manager server togenerate events about capacity problems. You can configure alarms to send notification whenever astorage event occurs.
When the DataFabric Manager server is installed, the storage capacity thresholds for all aggregates,volumes, and qtrees are set to default values. You can change the settings as needed for an object, agroup of objects, or the Global group.
Modification of storage capacity thresholds settingsYou can change the storage capacity threshold settings globally, for a specific group, or for a specificaggregate, volume, or qtree. If you edit capacity threshold settings, the edited thresholds override theglobal thresholds.
Note: Changing storage capacity threshold settings for the Global group changes the defaultstorage capacity settings for all groups and individual storage objects.
189

Changing storage capacity threshold settings for global groupPerform the following steps to change the storage capacity threshold settings for global group.
Steps
1. Select Setup > Options.
2. Click Default Thresholds in the left pane.
3. Edit the Default settings as needed.
4. Click Update.
Changing storage capacity threshold settings for an individual groupPerform the following steps to change the storage capacity threshold settings for an individual group.
Steps
1. Select Control Center > Home > Member Details.
2. Click Aggregates, to change aggregate options or, File Systems to change volume or qtreeoptions.
3. Click the name of an aggregate, volume, or qtree.
4. Click Edit Settings under the Tools section in the left pane.
5. Edit the settings as needed.
6. Select the name of the group from Apply Settings to drop-down list.
7. Click Update.
8. Approve the change by clicking OK on the verification page.
Changing storage capacity threshold settings for a specific aggregate,volume, or qtree
Perform the following steps to change the storage capacity threshold settings for specific aggregate,volume, or qtree.
Steps
1. Click Aggregates to change Aggregate options or File Systems to change volume or qtreeoptions.
2. Click the name of an aggregate, volume, or qtree.
3. Click Edit Settings under the Tools section in the left pane.
4. Edit the desired settings.
190 | OnCommand Unified Manager Operations Manager Administration Guide

Note: To revert to the default settings, leave the fields empty.
5. Click Update and then click OK.
Management of aggregate capacityYou can manage aggregate capacity by gathering aggregate information and aggregateovercommitment information, by tracking aggregate space utilization, and by determining aggregatecapacity threshold.
Volume space guarantees and aggregate overcommitmentYou can use aggregate overcommitment to advertise more available space than the available space.
When managing storage resources, it is important to understand the role of aggregateovercommitment in space availability. To use aggregate overcommitment, you must create flexiblevolumes with a space guarantee of none or file so that the aggregate size does not limit the volumesize. Each volume can be larger than its containing aggregate. You can use the storage space that theaggregate provides, as required, by creating LUNs, or adding data to volumes.
By using aggregate overcommitment, the storage system can advertise more available storage thanactually exists in the aggregate. With aggregate overcommitment, you can provide greater amountsof storage that you know would be used immediately. Alternatively, if you have several volumes thatsometimes need to grow temporarily, the volumes can dynamically share the available space witheach other.
Note: If you have overcommitted your aggregate, you must monitor its available space carefullyand add storage as required to avoid write errors due to insufficient space.
For details about volume space reservations and aggregate overcommitment, see the Data ONTAPStorage Management Guide for 7-Mode.
Related information
The IBM N series support website: www.ibm.com/storage/support/nseries
Available space on an aggregateWith Operations Manager, you can determine the available space on an aggregate.
To help you determine the space availability on an aggregate, Operations Manager displays threevalues on the Aggregate Details page for each aggregate:
Aggregate size Total size of the aggregate.
Capacity used The total amount of disk space in use by volumes present in the aggregate.
File system management | 191

Total committedcapacity
The total amount of committed disk space to volumes present in theaggregate. The total committed capacity can be larger than the total capacityby using aggregate overcommitment.
Considerations before modifying aggregate capacity thresholdsYou must note the aggregate overcommitment point before changing aggregate capacity threshold.
Ensure that you take care of the following points when deciding whether to modify the aggregatecapacity threshold:
Use of aggregateovercommitmentstrategy
If you use the aggregate overcommitment strategy, you would want toincrease the Aggregate Overcommitted threshold to more than 100. Todetermine how far beyond 100 to set the threshold, you must decide atwhat point the aggregate is too overcommitted. Ensure that you note thedifference between your storage commitments and actual storage usage.Also, review the capacity graphs of historical data to get a sense of howthe amount of storage used changes over time.
Set the Aggregate Fulland Aggregate NearlyFull thresholds
Set the Aggregate Full and Aggregate Nearly Full thresholds so that youhave time to take corrective action if storage usage approaches capacity.Because the aggregate is overcommitted, you might want to set theAggregate Full and Aggregate Nearly Full thresholds to values lowerthan the default. Lowering the thresholds generate an event well beforecompletely filling the storage. Early notification gives you more time totake corrective action, such as installing more storage, before the storagespace is full and write errors occur.
Non-usage of aggregateovercommitment
If you do not use aggregate overcommitment as a storage-managementstrategy, you must leave the Aggregate Overcommitted and NearlyOvercommitted threshold values unchanged from their default.
Set the AggregateNearly Full threshold
If an aggregate is routinely more than 80 percent full, set the AggregateNearly Full threshold to a value higher than the default.
Note: If you edit capacity thresholds for a particular aggregate, the edited thresholds override theglobal thresholds. You can edit thresholds for a particular aggregate, from the Aggregate Detailspage.
Aggregate capacity thresholds and their eventsYou can configure capacity thresholds for aggregates and events for these thresholds from themanagement server. You can set alarms to monitor the capacity and committed space of anaggregate. You can also perform corrective actions based on the event generated.
You can configure alarms to send notification when an event related to the capacity of an aggregateoccurs. For the Aggregate Full threshold, you can also configure an alarm to send notification onlywhen the condition persists over a specified time.
192 | OnCommand Unified Manager Operations Manager Administration Guide

By default, if you have configured an alarm to alert you to an event, the management server issuesthe alarm only once per event. You can configure the alarm to repeat until you receive anacknowledgment.
Note: If you want to set an alarm for a specific aggregate, you must create a group with thataggregate as the only member.
You can set the following aggregate capacity thresholds:
Aggregate Full(%)
Description: Specifies the percentage at which an aggregate is full.
Note: You can reduce the number of Aggregate Full Threshold eventsgenerated by setting an Aggregate Full Threshold Interval. This causes themanagement server to generate an Aggregate Full event only if thecondition persists for the specified time.
Default value: 90 percent
Event generated: Aggregate Full
Event severity: Error
Corrective Action: Perform one or more of the following actions:
• To free disk space, request your users to delete files that are no longerrequired from the volumes contained in the aggregate that generated theevent.
• Add one or more disks to the aggregate that generated the event.
Note: After you add a disk to an aggregate, you cannot remove itwithout first destroying all flexible volumes in the aggregate to whichthe disk belongs. You must destroy the aggregate after all the flexiblevolumes are removed from the aggregate.
• Temporarily reduce the Snapshot reserve.By default, the reserve is 20 percent of disk space. If the reserve is not inuse, reducing the reserve can free disk space, giving you more time to adda disk.There is no way to prevent Snapshot copies from consuming disk spacegreater than the amount reserved for them. Therefore, it is important tomaintain a large enough reserve for Snapshot copies so that the active filesystem always has space available to create new files or modify existingones. For more information about Snapshot reserve, see the Data ONTAPData Protection Online Backup and Recovery Guide for 7-Mode.
Aggregate NearlyFull (%)
Description: Specifies the percentage at which an aggregate is nearly full.
Default value: 80 percent
The value for this threshold must be lower than the value for Aggregate FullThreshold for the management server to generate meaningful events.
File system management | 193

Event generated: Aggregate Almost Full
Event severity: Warning
Corrective action: Perform one or more of the actions mentioned in theAggregate Full section.
AggregateOvercommitted(%)
Description: Specifies the percentage at which an aggregate isovercommitted.
Default value: 100 percent
Event generated: Aggregate Overcommitted
Event severity: Error
Corrective action: Perform one or more of the following actions:
• Create new free blocks in the aggregate by adding one or more disks tothe aggregate that generated the event.
Note: You must add disks with caution. After you add a disk to anaggregate, you cannot remove it without first destroying all flexiblevolumes in the aggregate to which the disk belongs. You must destroythe aggregate after all the flexible volumes are destroyed.
• Temporarily free some already occupied blocks in the aggregate by takingunused flexible volumes offline.
Note: When you take a flexible volume offline, it returns any space ituses to the aggregate. However, when you bring the flexible volumeonline, it requires the space again.
• Permanently free some already occupied blocks in the aggregate bydeleting unnecessary files.
Aggregate NearlyOvercommitted(%)
Description: Specifies the percentage at which an aggregate is nearlyovercommitted.
Default value: 95 percent
The value for this threshold must be lower than the value for Aggregate FullThreshold for the management server to generate meaningful events.
Event generated: Aggregate Almost Overcommitted
Event severity: Warning
Corrective action: Perform one or more of the actions provided in theAggregate Overcommitted section.
194 | OnCommand Unified Manager Operations Manager Administration Guide
AggregateSnapshot ReserveNearly FullThreshold (%)
Description: Specifies the percentage of the Snapshot copy reserve on anaggregate that you can use before the system generates the AggregateSnapshots Nearly Full event.
Default value: 80 percent
Event generated: Aggregate Snapshot Reserve Almost Full
Event severity: Warning
Corrective action: None
There is no way to prevent Snapshot copies from consuming disk spacegreater than the amount reserved for them. If you disable the aggregateSnapshot autodelete option, it is important to maintain a large enoughreserve.
See the Operations Manager Help for instructions on how to identify theSnapshot copies you can delete. For more information about the Snapshotreserve, see the Data ONTAP Data Protection Online Backup and RecoveryGuide for 7-Mode.
AggregateSnapshot ReserveFull Threshold(%)
Description: Specifies the percentage of the Snapshot copy reserve on anaggregate that you can use before the system generates the AggregateSnapshots Full event.
Default value: 90 percent
Event generated: Aggregate Snapshot Reserve Full
Event severity: Warning
Corrective action: None
There is no way to prevent Snapshot copies from consuming disk spacegreater than the amount reserved for them.
Note: A newly created traditional volume is tightly coupled with its containing aggregate so thatthe capacity of the aggregate determines the capacity of the new traditional volume. Therefore,you should synchronize the capacity thresholds of traditional volumes with the thresholds of theircontaining aggregates.
Related tasks
Creating alarms on page 134
Related information
The IBM N series support website: www.ibm.com/storage/support/nseries
File system management | 195
Management of volume capacityYou can manage volume capacity by gathering volume information, by determining volume capacitythreshold and events, by modifying volume capacity threshold, by setting volume Snapshot copythresholds and events.
Volume capacity thresholds and eventsThe DataFabric Manager server features thresholds to help you monitor the capacity of flexible andtraditional volumes. You can configure alarms to send notification whenever an event related to thecapacity of a volume occurs. You can also take corrective actions based on the event generated. Forthe Volume Full threshold, you can configure an alarm to send notification only when the conditionpersists over a specified period.
By default, if you have configured an alarm to alert you to an event, the DataFabric Manager serverissues the alarm only once per event. You can configure the alarm to repeat until it is acknowledged.
Note: If you want to set an alarm for a specific volume, you must create a group with that volumeas the only member.
You can set the following threshold values:
Volume FullThreshold (%)
Description: Specifies the percentage at which a volume is considered full.
Note: To reduce the number of Volume Full Threshold eventsgenerated, you can set the Volume Full Threshold Interval to a non-zerovalue. By default, the Volume Full threshold Interval is set to zero.Volume Full Threshold Interval specifies the time during which thecondition must persist before the event is triggered. Therefore, if thecondition persists for the specified time, the DataFabric Manager servergenerates a Volume Full event.
• If the threshold interval is 0 seconds or a value less than the volumemonitoring interval, the DataFabric Manager server generates theVolume Full events.
• If the threshold interval is greater than the volume monitoringinterval, the DataFabric Manager server waits for the specifiedthreshold interval, which includes two or more monitoring intervals,and generates a Volume Full event only if the condition persistedthroughout the threshold interval.
For example, if the monitoring cycle time is 60 seconds and thethreshold interval is 90 seconds, the threshold event is generated only ifthe condition persists for two monitoring intervals.
Default value: 90
Event generated: Volume Full
196 | OnCommand Unified Manager Operations Manager Administration Guide

Event severity: Error
Corrective action
Perform one or more of the following actions:
• Ask your users to delete files that are no longer needed, to free diskspace.
• For flexible volumes containing enough aggregate space, you canincrease the volume size.
• For traditional volumes containing aggregates with limited space, youcan increase the size of the volume by adding one or more disks to theaggregate.
Note: Add disks with caution. After you add a disk to an aggregate,you cannot remove it without destroying the volume and itsaggregate.
• For traditional volumes, temporarily reduce the Snapshot copy reserve.By default, the reserve is 20 percent of the disk space. If the reserve isnot in use, reduce the reserve free disk space, giving you more time toadd a disk. There is no way to prevent Snapshot copies fromconsuming disk space greater than the amount reserved for them.Therefore, it is important to maintain a large enough reserve forSnapshot copies. By maintaining the reserve for Snapshot copies, theactive file system always has space available to create new files ormodify existing ones. For more information about the Snapshot copyreserve, see the Data ONTAP Data Protection Online Backup andRecovery Guide for 7-Mode.
Volume Nearly FullThreshold (%)
Description: Specifies the percentage at which a volume is considerednearly full.
Default value: 80. The value for this threshold must be lower than thevalue for the Volume Full Threshold in order for the DataFabric Managerserver to generate meaningful events.
Event generated: Volume Almost Full
Event severity: Warning
Corrective action
Perform one or more of the actions mentioned in Volume Full.
Volume SpaceReserve NearlyDepleted Threshold(%)
Description: Specifies the percentage at which a volume is considered tohave consumed most of its reserved blocks. This option applies to volumeswith LUNs, Snapshot copies, no free blocks, and a fractional overwritereserve of less than 100%. A volume that crosses this threshold is gettingclose to having write failures.
File system management | 197

Default value: 80
Event generated: Volume Space Reservation Nearly Depleted
Event severity: Warning
Volume SpaceReserve DepletedThreshold (%)
Description: Specifies the percentage at which a volume is considered tohave consumed all its reserved blocks. This option applies to volumes withLUNs, Snapshot copies, no free blocks, and a fractional overwrite reserveof less than 100%. A volume that has crossed this threshold is gettingdangerously close to having write failures.
Default value: 90
Event generated: Volume Space Reservation Depleted
Event severity: Error
When the status of a volume returns to normal after one of the precedingevents, events with severity 'Normal' are generated. Normal events do notgenerate alarms or appear in default event lists, which display events ofwarning or worse severity.
Volume QuotaOvercommittedThreshold (%)
Description: Specifies the percentage at which a volume is considered tohave consumed the whole of the overcommitted space for that volume.
Default value: 100
Event generated: Volume Quota Overcommitted
Event severity: Error
Corrective action
Perform one or more of the following actions:
• Create new free blocks by increasing the size of the volume thatgenerated the event.
• Permanently free some of the occupied blocks in the volume bydeleting unnecessary files.
Volume QuotaNearlyOvercommittedThreshold (%)
Description: Specifies the percentage at which a volume is considered tohave consumed most of the overcommitted space for that volume.
Default Value: 95
Event generated: Volume Quota Almost Overcommitted
Event Severity: Warning
Corrective action
198 | OnCommand Unified Manager Operations Manager Administration Guide

Perform one or more of the actions mentioned in Volume QuotaOvercommitted.
Volume GrowthEvent MinimumChange (%)
Description: Specifies the minimum change in volume size (as apercentage of total volume size) that is acceptable. If the change in volumesize is more than the specified value, and the growth is abnormal inrelation to the volume-growth history, the DataFabric Manager servergenerates a Volume Growth Abnormal event.
Default value: 1
Event generated: Volume Growth Abnormal
Volume SnapReserve FullThreshold (%)
Description: Specifies the value (percentage) at which the space that isreserved for taking volume Snapshot copies is considered full.
Default value: 90
Event generated: Volume Snap Reserve Full
Event severity: Error
Corrective action: None
There is no way to prevent Snapshot copies from consuming disk spacegreater than the amount reserved for them. If you disable the volumeSnapshot autodelete option, it is important to maintain a largeenough reserve. Disabling would ensure Snapshot copies that there isalways space available to create new files or modify present ones. Forinstructions on how to identify Snapshot copies you can delete, see theOperations Manager Help.
User Quota FullThreshold (%)
Description: Specifies the value (percentage) at which a user is consideredto have consumed all the allocated space (disk space or files used) asspecified by the user quota. The user quota includes hard limit inthe /etc/quotas file. If this limit is exceeded, the DataFabric Managerserver generates a User Disk Space Quota Full event or a User Files QuotaFull event.
Default value: 90
Event generated: User Quota Full
User Quota NearlyFull Threshold (%)
Description: Specifies the value (percentage) at which a user is consideredto have consumed most of the allocated space (disk space or files used) asspecified by the user quota. The user quota includes hard limit inthe /etc/quotas file. If this limit is exceeded, the DataFabric Managerserver generates a User Disk Space Quota Almost Full event or a UserFiles Quota Almost Full event.
File system management | 199

Default value: 80
Event generated: User Quota Almost Full
Volume No FirstSnapshotThreshold (%)
Description: Specifies the value (percentage) at which a volume isconsidered to have consumed all the free space for its space reservation.This is the space that the volume needs when the first Snapshot copy iscreated.
This option applies to volumes that contain space-reserved files, noSnapshot copies, a fraction of Snapshot copies overwrite reserve set togreater than 0, and where the sum of the space reservations for all LUNsin the volume is greater than the free space available to the volume.
Default value: 90
Event generated: Volume No First Snapshot
Volume Nearly NoFirst SnapshotThreshold (%)
Description: Specifies the value (percentage) at which a volume isconsidered to have consumed most of the free space for its spacereservation. This is the space that the volume needs when the firstSnapshot copy is created.
This option applies to volumes that contain space-reserved files, noSnapshot copies, a fractional overwrite reserve set to greater than 0, andwhere the sum of the space reservations for all LUNs in the volume isgreater than the free space available to the volume.
Default value: 80
Event generated: Volume Almost No first Snapshot
Note: When a traditional volume is created, it is tightly coupled with its containing aggregate sothat its capacity is determined by the capacity of the aggregate. For this reason, you shouldsynchronize the capacity thresholds of traditional volumes with the thresholds of their containingaggregates.
Related concepts
Volume Snapshot copy thresholds and events on page 201
Related tasks
Creating alarms on page 134
Related information
The IBM N series support website: www.ibm.com/storage/support/nseries
200 | OnCommand Unified Manager Operations Manager Administration Guide
Normal events for a volumeNormal events do not generate alarms or appear in default event lists, which display events ofWarning or worst severity.
To view normal events for a volume, do either of the following:
• Display the Volume Details page for the volume.• Click the Events tab; then go to the Report drop-down list and select the History report.
Modification of the thresholdsYou can set the thresholds to a value, higher or a lower, than the default.
You might want to set the thresholds to a value higher than the default if storage space is routinelymore than 80 percent full. Leaving the Nearly Full Threshold at the default value might generateevents that notify you that storage space is nearly full more often than you want.
You might want to set the thresholds to a value lower than the default. Lowering the thresholdensures that the DataFabric Manager server generates the event well before completely filling thestorage. An early notification gives you more time to take corrective action before the storage spaceis full.
Management of qtree capacityYou can manage qtree capacity by gathering qtree information, tracking qtree capacity utilization,and determining qtree capacity threshold and events.
Volume Snapshot copy thresholds and eventsYou can set alarms whenever a Snapshot copy is taken on a flexible or a traditional volume.
The DataFabric Manager server features thresholds to help you monitor Snapshot copy usage forflexible and traditional volumes. You can configure alarms to send notification whenever a volumeSnapshot copy event occurs.
By default, if you have configured an alarm to alert you to an event, the DataFabric Manager serverissues the alarm only once per event. You can configure the alarm to repeat until it is acknowledged.
Note: If you want to set an alarm on a specific volume, you must create a group with that volumeas the only member.
You can set the following volume Snapshot thresholds:
Volume SnapReserve FullThreshold (%)
Description: Specifies the percentage at which the space that is reserved fortaking volume Snapshot copies is considered full.
Default value: 90
Event generated: Snapshot Full
File system management | 201
Event severity: Warning
Corrective action:
1. Access the Volume Snapshot copy details report.
2. Select the Snapshot copies.
3. Click Compute Reclaimable.
Volume NearlyNo FirstSnapshotThreshold (%)
Description: Specifies the percentage at which a volume is considered to haveconsumed most of the free space for its space reservation. This is the space thatthe volume needs when the first Snapshot copy is created. This option applies tovolumes that contain space-reserved files, no Snapshot copies, a fractionaloverwrite reserve set to greater than 0, and where the sum of the spacereservations for all LUNs in the volume is greater than the free space available tothe volume.
Default value: 80 percent
Event generated: Nearly No Space for First Snapshot
Event severity: Warning
Volume NoFirst SnapshotThreshold (%)
Description: Specifies the percentage at which a volume is considered to haveconsumed all the free space for its space reservation. This is the space that thevolume needs when the first Snapshot copy is created. This option applies tovolumes that contain space-reserved files, no Snapshot copies, a fractionaloverwrite reserve set to greater than 0, and where the sum of the spacereservations for all LUNs in the volume is greater than the free space available tothe volume.
Default value: 90 percent
Event generated: No Space for First Snapshot
Event severity: Warning
VolumeSnapshotCountThreshold
Description: Specifies the number of Snapshot copies, which, if exceeded, isconsidered too many for the volume. A volume is allowed up to 255 Snapshotcopies.
Default value: 250
Event generated: Too Many Snapshots
Event severity: Error
Volume TooOld SnapshotThreshold
Description: Specifies the age of a Snapshot copy, which, if exceeded, isconsidered too old for the volume. The Snapshot copy age can be specified inseconds, minutes, hours, days, or weeks.
202 | OnCommand Unified Manager Operations Manager Administration Guide
Default value: 52 weeks
Event generated: Too Old Snapshot copies
Event severity: Warning
Related concepts
Volume capacity thresholds and events on page 196
Related references
Guidelines for configuring alarms on page 134
Qtree capacity thresholds and eventsOperations Manager enables you to monitor qtree capacity and set alarms. You can also takecorrective actions based on the event generated.
The DataFabric Manager server provides thresholds to help you monitor the capacity of qtrees.Quotas must be enabled on the storage systems. You can configure alarms to send notificationwhenever an event related to the capacity of a qtree occurs.
By default, if you have configured an alarm to alert you to an event, the DataFabric Manager serverissues the alarm only once per event. You can configure the alarm to continue to alert you withevents until it is acknowledged. For the Qtree Full threshold, you can also configure an alarm to sendnotification only when the condition persists over a specified period.
Note: If you want to set an alarm for a specific qtree, you must create a group with that qtree as theonly member.
You can set the following qtree capacity thresholds:
Qtree Full(%)
Description: Specifies the percentage at which a qtree is considered full.
Note: To reduce the number of Qtree Full Threshold events generated, you canset the Qtree Full Threshold Interval to a non-zero value. By default, the QtreeFull threshold Interval is set to zero. The Qtree Full Threshold Interval specifiesthe time during which the condition must persist before the event is generated. Ifthe condition persists for the specified amount of time, the DataFabric Managerserver generates a Qtree Full event.
• If the threshold interval is 0 seconds or a value less than the volumemonitoring interval, the DataFabric Manager server generates Qtree Fullevents.
• If the threshold interval is greater than the volume monitoring interval, theDataFabric Manager server waits for the specified threshold interval, whichincludes two or more monitoring intervals, and generates a Qtree Full eventonly if the condition persists throughout the threshold interval.
File system management | 203

For example, if the monitoring cycle time is 60 seconds and the thresholdinterval is 90 seconds, the threshold event is generated only if the conditionpersists for two monitoring intervals.
Default value: 90 percent
Event generated: Qtree Full
Event severity: Error
Corrective action
Perform one or more of the following actions:
• Request users to delete files that are no longer required, to free disk space.• Increase the hard disk space quota for the qtree.
Qtree NearlyFullThreshold(%)
Description: Specifies the percentage at which a qtree is considered nearly full.
Default value: 80 percent
Event severity: Warning
Corrective action
Perform one or more of the following actions:
• Request users to delete files that are no longer required, to free disk space.• Increase the hard disk space quota for the qtree.
Related tasks
Creating alarms on page 134
Related information
The IBM N series support website: www.ibm.com/storage/support/nseries
How Operations Manager monitors volumes and qtrees on avFiler unit (7-Mode environments only)
You can use Operations Manager to monitor volumes and qtrees in a vFiler unit.
During initial discovery, the DataFabric Manager server uses SNMP to discover the volumes andqtrees as a hosting storage system’s objects. After it discovers a configured vFiler unit on the hostingstorage system, the DataFabric Manager server assigns the resource objects to the vFiler unit.
The DataFabric Manager server maintains information in its database about the volumes and qtreesthat are removed or destroyed from a vFiler unit. As the volumes and qtrees are reassigned to other
204 | OnCommand Unified Manager Operations Manager Administration Guide
vFiler units, the DataFabric Manager server uses the stored information to update resourceownership.
How Operations Manager monitors qtree quotasYou can monitor qtree quotas by using Operations Manager. As the DataFabric Manager servermonitors hosting storage systems for vFiler unit storage resources, it also provides information aboutqtree quotas.
Where to find vFiler storage resource details (7-Mode environments only)With Operations Manager, you can view the volumes and qtrees in a vFiler unit in the vFiler Detailspage.
The vFiler Details page (Member Details > vFilers) provides you with a link to the volumes andqtrees assigned to a vFiler unit.
The Volume Details and Qtree Details pages provide you with details about the volumes and qtreesthat are assigned to a vFiler unit.
What clone volumes areClone volumes are fully functional volumes that always exist in the same aggregate as their parentvolumes.
Data ONTAP enables you to create writable copy of a volume, known as volume clone.
A clone is a point-in-time, writable copy of the parent volume. Changes made to the parent volumeafter the clone is created are not reflected in the clone. Clone volumes can themselves be cloned.
Clone volumes and their parent volumes share the same disk space for any data common to the cloneand parent. This means that creating a clone is instantaneous and requires no additional disk space(until changes are made to the clone or parent). If you later decide you want to sever the connectionbetween the parent and the clone, you can split the clone. This removes all restrictions on the parentvolume and enables the space guarantee on the clone. For general information about clone volumesand clone parents, see the Data ONTAP Storage Management Guide for 7-Mode.
The DataFabric Manager server helps you manage clone hierarchies by making it easier to viewclone relationships between volumes. By using Operations Manager, you can view clone volume andthe parent volume information.
Related information
The IBM N series support website: www.ibm.com/storage/support/nseries
File system management | 205
Identification of clones and clone parentsBy using Operations Manager, you can view details of clones and their parents.
You can display the Volumes, Clone List report by selecting Member Details > File Systems >Report drop-down list. Cloned volumes have an entry in the Clone Parent column of the report,indicating the name of the parent. Volumes that have clone children have the names of thosechildren, which are included in the Clones column. Each clone name links to the Volume Detailspage for the clone child.
Alternatively, the Volume Details page for a clone child includes the name of the clone parent, whichis a link to the Volume Details page for the parent volumes.
If a volume is a clone parent, the Related Storage section of its Volume Details page includes a linkto a list of its direct clone children.
Why Snapshot copies are monitoredSnapshot copy monitoring and space management help you monitor and generate reports onSnapshot copies. You can determine how they influence your space management strategy.
By using the DataFabric Manager Server, you can determine the following information aboutSnapshot copies:
• How much aggregate and volume space is used for Snapshot copies?• Is there adequate space for the first Snapshot copy?• Which Snapshot copies can be deleted?• Which volumes have high Snapshot copy growth rates?• Which volumes have Snapshot copy reserves that are nearing capacity?
See the Operations Manager Help for instructions.
Snapshot copy monitoring requirementsTo use the Snapshot copy monitoring features, the DataFabric Manager server requires a valid loginname and password for each system being monitored.
Detection of Snapshot copy schedule conflictsBy using Operations Manager, you can monitor conflicts between the Snapshot copy schedule andSnapMirror and SnapVault schedules.
When Snapshot copies are scheduled for a volume, the DataFabric Manager server monitors forconflicts between the Snapshot copy schedule and SnapMirror and SnapVault schedules on the samevolume. Conflicts can cause scheduled Snapshot copies to fail. The Aggregate Details and VolumeDetails pages both feature a Protection area that indicates whether scheduled Snapshot copies andSnapMirror are enabled.
206 | OnCommand Unified Manager Operations Manager Administration Guide

The DataFabric Manager server generates a schedule conflict event if a volume is configured withboth Snapshot copy and SnapVault copy schedules. An event is also generated if a Snapshot copy isscheduled at the same time as a SnapMirror transfer. The DataFabric Manager server generates theseevents only if the SnapVault or SnapMirror relationships are monitored on the volume.
Dependencies of a Snapshot copyYou can view the dependencies of a Snapshot copy, whether you can delete a Snapshot copy, and thesteps to delete it using Operations Manager.
The Snapshots area of the Volume Details page displays information about, up to 10 of the mostrecent Snapshot copies for the volume. This includes the last time the Snapshot copies that wereaccessed and their dependencies, if any. This information helps you determine whether you candelete a Snapshot copy or, if the Snapshot copy has dependencies, what steps you need to take todelete the Snapshot copy.
To generate a page that lists dependent storage components for a Snapshot copy, and the steps youwould need to take to delete the copy, click the hyperlinked text in the Dependency column for thatSnapshot copy. The link is not available when the dependency is due to SnapMirror or SnapVault orto a FlexClone volume, that is offline.
Thresholds on Snapshot copies
You can set a threshold of a maximum number of Snapshot copies to determine when to delete aSnapshot copies.
You can avoid the problem of Snapshot failures due to inadequate space. The thresholds that addressthe number and the age of volume Snapshot copies let you know when you must delete Snapshotcopies. You must set the Volume Snapshot Count threshold to define the maximum number ofSnapshot copies for a volume.
You must set the Volume Snapshot Too Old threshold to indicate the maximum allowable age forSnapshot copies of the volume. The DataFabric Manager server generates events when it exceeds thethresholds.
What storage chargeback reports areYou can create storage chargeback reports through Operations Manager to collect information aboutthe amount of space used or allocated in specific storage objects (storage systems, volumes, qtrees)or a group of storage objects. Chargeback reports are useful if your organization bills otherorganizations, groups, or users in your company for the storage services they use.
The storage chargeback feature of the DataFabric Manager server provides billing reports for theamount of space used or allocated in specific storage objects, or a group of storage objects. Thestorage objects include storage systems, volumes, qtrees, or users. The billing reports containinformation such as the average use, length of billing cycle, rate per GB of space used, and chargesbased on the rate and use.
File system management | 207

You can specify the day when the billing cycle starts, the rate, and the format for currency in thereport. These reports can be generated in different formats, such as Perl, .txt, comma-separatedvalues (.csv), Excel (.xls), and .xml files.
Storage chargeback reports provide an efficient way to track the space used and space that isallocated for generating bills based on your specifications.
When is data collected for storage chargeback reportsYou can collect data for chargeback reports for a specific period.
The data reported by the chargeback feature on a specific day is based on the last data sample that iscollected before midnight GMT of the previous night. For example, if the last data sample beforemidnight on April 17 was collected at 11:45 p.m. GMT, the chargeback reports viewed on April 18display details about average use, charges, and other data based on the sample collected on April 17at 11:45 p.m.
Determine the current month’s and the last month’s values for storagechargeback report
You can calculate the current and previous month's chargeback report.
When you select a Chargeback, This Month or Last Month view, the data displayed pertains to thecurrent or the last billing cycles, respectively. The Day of the Month for Billing option determineswhen the current month begins and the last month ends, as described in the following example.
Company A’s DataFabric Manager server system is configured for the billing cycle to start on thefifth day of every month. If Chris (an administrator at Company A) views the Chargeback, thisMonth report on April 3, the report displays data for the period of March 5 through midnight (GMT)of April 2. If Chris views the Chargeback, Last Month report on April 3, the report displays data forthe period of February 5 through March 4.
All chargeback reports contain Period Begin and Period End information that indicates when thebilling cycle begins and ends for the displayed report.
Chargeback reports in various formatsYou can generate chargeback report in various formats by running the dfm report view -Fformat _report-name command.
The DataFabric Manager server does not integrate with any specific billing program. However, thechargeback report provides data in a spreadsheet form that you can use for other billing applications.The data is accessible through the spreadsheet icon on the right side of the Report drop-down list.
You can also generate chargeback data in other formats, such as Perl, .txt, comma-separated values(.csv), Excel (.xls), and .xml by using the dfm report command. For example, to generate thechargeback reports in Perl format so that other billing applications can use the chargeback data, youshould use the dfm report view -F perl report_name command.
In this command, report_name is one of the following:
208 | OnCommand Unified Manager Operations Manager Administration Guide

• groups-chargeback-this-month• groups-chargeback-last-month• groups-chargeback-allocation-this-month• groups-chargeback-allocation-last-month• volumes-chargeback-this-month• volumes-chargeback-last-month• volumes-chargeback-allocation-this-month• volumes-chargeback-allocation-last-month• qtrees-chargeback-this-month• qtrees-chargeback-last-month• qtrees-chargeback-allocation-this-month• qtrees-chargeback-allocation-last-month• clusters-chargeback-this-month (clustered environments only)• clusters-chargeback-last-month (clustered environments only)• clusters-chargeback-allocation-this-month (clustered environments only)• clusters-chargeback-allocation-last-month (clustered environments only)• vservers-chargeback-this-month (clustered environments only)• vservers-chargeback-last-month (clustered environments only)• vservers-chargeback-allocation-this-month (clustered environments only)• vservers-chargeback-allocation-last-month (clustered environments only)• filers-chargeback-this-month (7-Mode environments only)• filers-chargeback-last-month (7-Mode environments only)• filers-chargeback-allocation-this-month (7-Mode environments only)• filers-chargeback-allocation-last-month (7-Mode environments only)
For more information about using the dfm report command, see the DataFabric Manager serverman pages.
The chargeback report optionsThe chargeback report options enable you to specify the chargeback increment, the currency format,the chargeback rate, and the day when the billing cycle starts.
You can specify storage chargeback option at a global or a group level. The global level can bechargeback increment, the currency format, the chargeback rate, or specify an annual charge rate forobjects in a specific group.
In addition to these global settings, you can specify an annual charge rate (per GB) for objects in aspecific group. The annual charge rate specified for a group overrides the setting specified at theglobal level.
File system management | 209

Specifying storage chargeback options at the global or group levelBy using Operations Manager, you can set chargeback options at a global or group level.
Step
1. Following are steps to set chargeback options:To apply changes to... Go to...
All objects that the DataFabricManager server manages
The Options page (Setup > Options link); then select Chargeback inthe Edit Options section.
Objects in a specific group The Edit Group Settings page (click Edit Groups in the left pane);then click the Edit column for the group for which you want to specifyan annual charge rate.
The storage chargeback incrementThe storage chargeback increment indicates how the charge rate is calculated.
You can specify storage chargeback increment using Operations Manager. You can specify thissetting only at the global level. By default, the chargeback increment is Daily. The following valuescan be specified for this option:
Daily Charges are variable; they are adjusted based on the number of days in the billing period.The DataFabric Manager server calculates the charges as follows: Annual Rate / 365 *number of days in the billing period.
Monthly Charges are fixed; there is a flat rate for each billing period regardless of the number ofdays in the period. The DataFabric Manager server calculates the charges as follows:Annual Rate/12.
Currency display format for storage chargebackYou can specify currency formats to display in Operations Manager.
The Currency Format setting indicates the format to use for displaying currency amounts inOperations Manager.
By default, the format is $ #,###.##, where # indicates a digit. If you need to specify any otherformat, use the following guidelines:
• You must specify four # characters before the decimal point.A decimal point separates the integer part of a number from its fractional part. For example, inthe number 5.67, the period (.) is the decimal point.The symbol used as a decimal point depends on the type of currency. For example, a period (.) isused for US dollars and a comma (,) is used for Danish Kroner
• Although a decimal separator is optional in the currency format, if you use it, you must specify atleast one # character after the decimal separator. For example, $ #,###.# and JD #,###.###.
• You can optionally specify a thousands-separator.
210 | OnCommand Unified Manager Operations Manager Administration Guide

A thousands-separator separates digits in numbers into groups of three. For example, the comma(,) is the thousands-separator in the number 567,890,123. The symbol used as a thousands-separator depends on the type of currency. For example, a comma (,) is used for US dollars and aperiod (.) is used for Danish Kroner.
• You can use any currency symbol, such as EUR or ¥, to suit your needs.If the currency symbol you want to use is not part of the standard ASCII character set, use thecode specified by the HTML Coded Character Set. For example, use ¥ for the Yen (¥) symbol.
• You can specify only one currency format per the DataFabric Manager server.For example, if you specify $ #, ###.## as your currency format for a specific installation, thisformat is used for all chargeback reports generated by that installation.
Specification of the annual charge rate for storage chargebackYou can set annual charge rate for storage chargeback at a global level or a specific group.
The Annual Charge Rate (per GB) setting indicates the amount to charge for storage space used perGB per year. You can specify this setting at the global level, in addition to specific groups.
By default, no rate is specified. You must specify a value for this option for the DataFabric Managerserver to generate meaningful chargeback reports.
Specify this value in the x.y format, where x is the integer part of the number and y is the fractionalpart. For example, to specify an annual charge rate of $150.55, enter 150.55.
Note: You must use a period (.) to indicate the fractional part of the number in the Annual ChargeRate box. Even if you are specifying a currency format that uses a comma (,) as the decimalseparator. For example, to specify 150,55 Danish Kroner, enter 150.55.
Specification of the Day of the Month for Billing for storage chargebackYou can specify the day of the month from which the billing cycle begins.
The Day of the Month for Billing setting indicates the day of the month on which the billing cyclebegins.
By default, this value is set to 1. The following values can be specified for this option:
1 through 28 These values specify the day of the month. For example, if you specify 15, itindicates the fifteenth day of the month.
-27 through 0 These values specify the number of days before the last day of the month.Therefore, 0 specifies the last day of the month.
For example, if you want to bill on the fifth day before the month ends everymonth, specify -4.
File system management | 211

Formatted charge rate for storage chargebackYou can view the annual charge rate for storage chargeback in the specified format. For example, ifthe currency format is $ #,###.## and the annual charge rate is 150.55, the Formatted Charge Rateoption displays $150.55.
The Formatted Charge Rate setting displays the annual charge rate value in the currency format. Thevalue is automatically generated and displayed based on the currency format and the annual chargerate you specify. You cannot set or change this option.
What happens when storage objects are deletedIn Operations Manager, you can stop monitoring a storage object (aggregate, volume, or qtree) bydeleting it from the global group. When you delete an object, the DataFabric Manager server stopscollecting and reporting data about it. Data collection and reporting is resumed only when the objectis added back to the OnCommand console database.
Note: When you delete a storage object from any group other than the global group, the object isdeleted only from that group; the DataFabric Manager server continues to collect and report dataabout it. You must delete the object from the global group if you want the DataFabric Managerserver to stop monitoring it.
Reports of deleted storage objectsYou can view a list of all the storage objects that are deleted from the DataFabric Manager serverdatabase various reports.
Following are the reports of deleted storage objects:
• Storage Systems, Deleted• File Systems, Deleted• Volumes, Deleted• Qtrees, Deleted• Aggregates, Deleted• SAN Hosts, Deleted• LUNs, Deleted• Vservers, Deleted (clustered environments only)• vFilers, Deleted (7-Mode environments only)
You can access these reports from the Report drop-down list on the Member Details tab for eachstorage object (Storage Systems, vFiler units, File Systems, Aggregates, SANs, and LUNs).
212 | OnCommand Unified Manager Operations Manager Administration Guide

Undeleting a storage object for monitoringYou can undelete a storage object using Operations Manager.
Steps
1. Select the check box next to each object you want to return to the database.
2. Click Undelete.
File system management | 213

Storage system managementYou can use Operations Manager to view the status of and report of groups, view configurationstatus, view and respond to events, configure alarms, and so on.
Management tasks you can perform from OperationsManager
You can use Operations Manager to manage your storage systems, including creating groups,viewing information about systems, events and quotas, and configuring alarms.
After the DataFabric Manager server is installed, it begins the process of discovering, monitoring,and gathering data about your supported storage systems. However, before you use the data tosimplify your network administration tasks, you have to understand the different ways you can useOperations Manager to manage your storage systems.
You can use Operations Manager to perform the following tasks:
• Create groups.• View the status of and obtain reports and information for a group of systems.• View information about individual systems.• Access the console of a storage system.• View and respond to events.• Configure alarms to send you notification if the DataFabric Manager server logs a specific type of
event or severity of event.• Edit the configuration settings of a storage system.• Enter values in custom comment fields.• View user, qtree, and group quotas.• Edit user quotas.• View the HA pair status and perform takeover and giveback operations if the storage system is an
active/active controller. (7-Mode environments only)• Link to FilerView for a selected storage system or vFiler unit. (7-Mode environments only)
Operations Manager components for managing yourstorage system
By using Operations Manager you can create or modify groups, view information about vFiler units,configure alarms, and so on.
You can perform the following tasks by using Operations Manager to manage your storage systems:
214 | OnCommand Unified Manager Operations Manager Administration Guide

• Create new groups or modify, move, copy, or delete existing groups—Control Center > Home >Edit Groups.
• View information about all or a group of storage systems and access details of specific storagesystems—Control Center > Member Details > Physical Systems.
• View information about vFiler units that are configured on hosting storage systems and accessdetails of specific vFiler units —Control Center > Member Details > Virtual Systems.
• View and respond to system events—Control Center > Group Status > Events.• Configure alarms for generated events, manage the DataFabric Manager server administrators,
establish roles to manage the DataFabric Manager server access, and configure custom reports—Control Center > Setup > Alarms.
• Modify passwords for one or multiple storage systems, manage storage system configurations,and manage all scripts installed on the DataFabric Manager server—Control Center >Management.
• Compare storage system configurations and configuration files against a template and modify Rglobal options—Control Center > Management.
• Configure host users and roles—Control Center > Management > Host Users.
Storage system groupsUsing Operations Manager you can create and manage groups of storage systems.
Operations Manager is designed around the concept of groups. When a group is selected in the leftpane of the Operations Manager main window, the pages change to display information relating tothat group.
To display information about all your storage systems, select the Global group in the Groups pane onthe left side of Operations Manager. The Global group is the default group containing the superset ofall storage systems.
To display information about a specific group of systems, select the desired group name in theGroups pane on the left side of Operations Manager.
To manage your storage systems effectively, you should organize them into smaller groups so thatyou can view information only about objects in which you are interested. You can group your storagesystems to meet your business needs, for example, by geographic location, operating system version,and storage system platform.
Custom comment fields in Operations ManagerYou can create custom comment fields and associate them with specific storage systems, SAN hosts,FC switches, aggregates, volumes, qtrees, LUNs, groups, and quota users.
You can use the custom comment fields for any purpose. One example would be to associate adepartment code with a quota user, for use in chargeback for business accounting. You can use the
Storage system management | 215

Search function in Operations Manager to display every object that contains specific data in a customcomment field.
Using custom comment fields in Operations Manager has three aspects: creating the field, insertingdata to create specific comments, and viewing comments.
Creating the comment field: You create the custom comment field using Setup menu > Options >Custom Comment Fields.
Inserting data: You insert data into the custom comment field in the Edit Settings page for the objectyou want to associate with the comment. For example, to associate a comment with a qtree, use theEdit Qtree Settings page for that qtree.
Viewing comments: You view custom comment data for multiple objects in the Comments report forthe type of object, for example, the Qtrees Comments report.
You can also view the comments for a single object in its Details page—for example, the QtreeDetails page for a specific qtree.
For detailed instructions on creating custom comment fields, see the Operations Manager Help forthe Options page.
Consolidated data and reports for storage systems andvFiler units (7-Mode environments only)
By using Operations Manager, you can view storage system and vFiler unit reports. You can viewglobal and group information and view individual system data in detail from the Member Detailsreport pages.
You can view storage system related information from Control Center > Member Details >Physical Systems > Report list.
You can view vFiler unit related information from Control Center > Member Details > VirtualSystems > Report list.
Tasks performed by using the storage system and vFiler unit report pages(7-Mode environments only)
You can view system data for all groups, generate spreadsheet reports, get information about storagesystems, and open FilerView.
Similar to the other Operations Manager Control Center tab pages, the Appliances and vFiler reportsenable you to view various details in one place. You can perform the following tasks:
• View system data for all or a group of monitored systems• Generate spreadsheet reports• Obtain detailed information about a specific storage system• Open FilerView
216 | OnCommand Unified Manager Operations Manager Administration Guide
Where to find information about a specific storage systemBy using Operations Manager, you can view information about a specific storage system or a vFilerunit, and view or modify configurations of a storage system or a vFiler unit.
You can view the details by clicking the storage system or vFiler unit name on the OperationsManager reports.
The DataFabric Manager server regularly refreshes monitoring data for the entire group within whicha storage system or vFiler unit resides, or you can click Refresh Group Monitors to manually refreshthe data.
Tasks performed from a Details page of Operations ManagerYou can view and modify storage system or vFiler unit configurations, view and check active/activeconfigurations, view events related to the storage system or vFiler unit, and so on.
You can perform the following storage system management tasks from the Details page:
• View specific storage system or vFiler unit details.• Edit the storage system or vFiler unit configuration using FilerView.• View the HA pair status and perform takeover and giveback operations by using the cluster
console (on active/active controllers only).• Access the vFiler units that are hosted on a storage system.• Check active/active controller configurations.• Edit the storage system configuration using FilerView.• Edit Remote LAN Module (RLM) port settings for the storage system.• View events related to the storage system or vFiler unit.• View graphing information specific to each type of storage system.
Editable options for storage system or vFiler unit settingsYou can specify or change the storage system or vFiler unit settings by using Operations Manager.
You can use the Edit Storage Controller Settings page to specify or change storage system or vFilerunit settings. You can set global values for many settings by using the Options page. You do not haveto modify storage system level or vFiler unit level settings unless they differ from your global values.
You can use the Edit Storage Controller Settings page to modify the following information:
IP address This field specifies the IP address of the storage system that the DataFabricManager server monitors.
You might want to change the storage system IP address if you want to use adifferent interface for administrative traffic.
Storage system management | 217
Login andpassword
You should configure a login and password if you want to use OperationsManager to run a command on a system. Operations Manager uses thisinformation to authenticate itself to the storage system on which the commandis run. Configuration of login and password is mandatory.
Authentication You can also set up authentication by using the /etc/hosts.equiv file onthe storage system. For information about configuring the /etc/hosts.equiv file, see the Data ONTAP Storage Management Guide for 7-Mode.
Threshold values The threshold values indicate the level of activity that must be reached on thestorage system before an event is triggered. By using these options, you can setspecific storage system or group thresholds. For example, the Appliance CPUToo Busy threshold indicates the highest level of activity that the CPU canreach before a CPU Too Busy event is triggered. Threshold values specified onthis page supersede any global values specified on the Options page.
Thresholdintervals
The threshold interval is the period of time during which a specific thresholdcondition must persist before an event is triggered. For example, if themonitoring cycle time is 60 seconds and the threshold interval is 90 seconds,the event is generated only if the condition persists for two monitoringintervals. You can configure threshold intervals only for specific thresholds, aslisted on the Options page.
Related information
The IBM N series support website: www.ibm.com/storage/support/nseries
What the storage controller tools list is (7-Mode environments only)You can view the storage system or controller details by using storage controller tools in OperationsManager.
You can use storage controller tools to set up parameters that are required to communicate with astorage system or a controller. You can perform the following tasks using storage controller tools:
• Modify settings such as the primary IP address, remote platform management IP address, andlogin and password.
• Diagnose the network connectivity of the storage system or the controller.• Refresh the monitoring samples collected by Operations Manager.• Run a command on the storage system or the controller.• Connect to the device console.• Gather information about the host (storage system or controller) users.
You can access storage controller tools from the Details page for the storage system or hostingstorage system (of a vFiler unit), or controller. The tools menu is located in the lower left pane ofOperations Manager.
218 | OnCommand Unified Manager Operations Manager Administration Guide

What the cluster tools list is (clustered environments only)You can view and modify the cluster or cluster controller details by using cluster tools in OperationsManager.
You can use cluster tools to set up parameters that are required to communicate with a cluster. Youcan perform the following tasks using cluster tools:
• Modify settings such as the primary IP address, monitoring options, and management optionssuch as login and password.
• Diagnose the network connectivity of the cluster.• Refresh the monitoring samples collected by Operations Manager.• Run a command on the cluster.
You can access cluster tools from the Cluster Details page for the cluster. The tools menu is locatedon the lower left display of Operations Manager.
What the Diagnose Connectivity tool doesBy using the Diagnose Connectivity tool, you can perform connectivity tests and review testoutcome.
The Diagnose Connectivity tool queries the DataFabric Manager server database about a selectedstorage system, runs connectivity tests, and displays information and test outcomes. The sequence ofsteps depends on whether the storage system is managed or unmanaged. A managed storage systemis one that is in the DataFabric Manager server database. An unmanaged storage system is one that isnot in the DataFabric Manager server database.
The Refresh Monitoring Samples toolYou can view updated storage system details using Refresh Monitoring Samples in OperationsManager.
You can specify the frequency at which Operations Manager collects information by using thesystem information-monitoring interval.
The Run a Command toolBy using the Run a Command tool in Operations Manager, you can run commands on storagesystems.
The Run a Command tool provides you with an interface to do the following:
• Run Data ONTAP commands on storage systems.• Run any Remote LAN Module (RLM) command on the RLM card that is installed on a storage
system.
Prerequisite
The DataFabric Manager server uses the following connection protocols for communication:
Storage system management | 219
• Remote Shell (RSH) connection for running a command on a storage systemTo establish an RSH connection and run a command on a storage system, the DataFabricManager server must authenticate itself to the storage system. Therefore, you must enable RSHaccess to the storage system and configure login and password credentials that are used toauthenticate Data ONTAP.
• Secure Socket Shell (SSH) connection for running a command on an RLM card, if the installedcard provides a CLI.
Restrictions
The following restrictions exist:
• There are several Data ONTAP run commands that are available on storage systems, but arerestricted in the DataFabric Manager server. For a list of restricted commands, see the OperationsManager Help.
• You cannot run a command on the Global group.
Related concepts
Methods for remote configuration of storage systems (7-Mode environments only) on page 223DataFabric Manager server CLI to configure storage systems on page 223Prerequisites for running remote CLI commands from Operations Manager on page 223What the remote platform management interface is on page 241
Related tasks
Running commands on a specific storage system on page 224Running commands on a group of storage systems from Operations Manager on page 224
The Run Telnet toolYou can connect to the storage system using the Run Telnet tool in Operations Manager.
Console connection through TelnetBy using Operations Manager, you can connect the storage system console.
Use the Connect to Device Console tool to connect to the storage system console. The storage systemmust be connected to a terminal server for the DataFabric Manager server to connect to the storagesystem console.
Note: Before initiating the console connection, you must set the Console Terminal Server Addressin the Edit Settings page for the storage system.
220 | OnCommand Unified Manager Operations Manager Administration Guide

Managing HA pairs using the DataFabric Manager server (7-Mode environments only)
You can monitor and manage HA pairs from the cluster console of Operations Manager.
The cluster console enables you to view the status of an HA pair (controller and its partner) andperform takeover and giveback operations between the controllers.
For detailed information about HA pairs, see the Data ONTAP High Availability and MetroClusterConfiguration Guide for 7-Mode.
Related information
The IBM N series support website: www.ibm.com/storage/support/nseries
Viewing the status of an HA pair by using cluster console (7-Modeenvironments only)
An authentication method must be set up for the DataFabric Manager server to authenticate thecontroller on which takeover and giveback operations should be performed. Login and passwordmust be set for the storage system. You can access the cluster console from Operations Manager toview the status of an HA pair.
Steps
1. Click Control Center > Home > Member Details > Physical Systems.
2. From the Report drop-down list, select Active/Active Controllers, All.
3. Click the controller for which you want to view the status of the HA pair.
4. Click View Cluster Console under Storage Controller Tools.
What the takeover tool does (7-Mode environments only)You can use the takeover tool from the tools list to initiate a manual takeover of the controller’spartner. The takeover tool is available in the tools list only when the controller whose tools list youare viewing can take over its partner.
When you select Takeover, the Takeover page is displayed. The Takeover page enables you to selectthe type of takeover you want the controller to perform. You can select from one of the followingoptions:
Take OverNormally
This option is the equivalent of running the cf takeover command in whichthe controller takes over its partner in a normal manner. The controller allows
Storage system management | 221

its partner to shut down its services before taking over. This option is used bydefault.
Take OverImmediately
This option is the equivalent of running the cf takeover -f command inwhich the controller takes over its partner without allowing the partner togracefully shut down its services.
Force a Takeover This option is the equivalent of running the cf forcetakeover -fcommand in which the controller takes over its partner even in cases whentakeover of the partner is normally not allowed. Such a takeover might causedata loss.
Takeover After aDisaster
This option is for MetroCluster configurations only and is the equivalent ofrunning the cf forcetakeover -f -d command. You can use this optionif the partner cannot be recovered.
Note: The Force a Takeover and Takeover After a Disaster options are also available when theinterconnect between the controller and its partner is down. It enables you to manually take overthe partner.
After you select an option, the Status option on the Cluster Console page displays the status of thetakeover operation. After the takeover operation is complete, the Cluster Console page displays theupdated controller-icon colors. The Cluster Console page also displays the status of each controller.The tools list of each controller is updated appropriately to indicate the HA pair operation eachcontroller can perform.
What the giveback tool does (7-Mode environments only)You can use the giveback tool to initiate a giveback operation from a controller that has taken overits partner. The giveback tool is available in the tools list only when the controller whose tools listyou are viewing can perform a giveback operation to its partner.
After you select Giveback for the controller, the Giveback page is displayed. You can select one ofthe following giveback options:
Give BackNormally
This option is the equivalent of the cf giveback command in which thecontroller performs a graceful shutdown of the services and cancels CIFSoperations. The controller also shuts down long-running jobs that are runningon the controller on behalf of the taken over controller.
Give BackImmediately
This option is the equivalent of the cf giveback -f command in which thecontroller does not gracefully shut down the services of the taken overcontroller.
After you have selected an option, the Status option on the Cluster Console page displays the statusof the giveback operation. After the giveback operation is complete, the Cluster Console pagedisplays the updated controller-icon colors. The Cluster Console page also displays the status of eachcontroller. The tools list of each controller is updated to indicate the HA pair operation eachcontroller can perform.
222 | OnCommand Unified Manager Operations Manager Administration Guide

DataFabric Manager server CLI to configure storage systemsThe DataFabric Manager server enables you to run storage system commands such as sysconfig,version, and install, on a specific storage system or a group of storage systems.
You can run all commands, except for a few administrator commands. For a list of unsupportedcommands, see the Operations Manager Help.
Methods for remote configuration of storage systems (7-Mode environments only)
The DataFabric Manager server provides three methods that you can use to remotely configure astorage system: accessing the storage system, accessing FilerView, and using the multiple storagesystem remote configuration feature.
When you monitor your storage system, you might have to alter the configuration settings on one ormore storage systems. The DataFabric Manager server provides three methods that you can use toremotely configure your storage systems:
• Accessing the storage system CLI• Accessing FilerView• Using the DataFabric Manager server multiple storage system remote configuration feature
You can remotely configure the following DataFabric Manager server features:
• Host users management• User quota management• Password management• Roles management
Prerequisites for running remote CLI commands from Operations ManagerYour storage systems must meet certain prerequisites to run remote CLI from Operations Manager
The command operation uses rsh or ssh to run a command on storage systems. Therefore, you musthave enabled rsh access to your storage system to run CLI commands from the DataFabric Managerserver. By default, rsh access to a storage system is enabled.
For more information about enabling rsh on your storage system, see the Data ONTAP SystemAdministration Guide for 7-Mode.
Note: The command operation uses only ssh to run remote CLI commands on clusters.
Related information
The IBM N series support website: www.ibm.com/storage/support/nseries
Storage system management | 223

Running commands on a specific storage systemYou can run a command for a specific storage system using Operations Manager.
Steps
1. Click Control Center > Home > Member Details > Physical Systems
2. Select Storage Systems, All report.
3. Click the storage system to go to the Storage Controller Details page for the storage system orhosting storage system (of a vFiler unit) that you want to run a command on.
4. Click Run a Command under Storage Controller Tools.
5. Enter the command in the Appliance Command box.
6. Click Run.
Running commands on a group of storage systems from OperationsManager
By using Operations Manager, you can run a command on a group of storage systems.
Steps
1. In the left pane of the Operations Manager window, select the group that you want to run acommand on.
The Group Summary page is displayed.
2. Select Run a Command from the Storage Controller Tools menu.
The Run Command page is displayed.
3. Enter the command in the Appliance Command box.
4. Click Run.
Remote configuration of a cluster (clustered environmentsonly)
You can remotely configure a cluster by using the DataFabric Manager server. As part of monitoringyour clusters, you might have to run commands to alter the configuration settings on one or morenodes in the cluster.
In Operations Manager, you can configure the credentials for the cluster by using either of thefollowing methods:
• Accessing the CLI
224 | OnCommand Unified Manager Operations Manager Administration Guide

• Accessing the Edit Storage Controller Settings or Edit Cluster Settings page (Details > Tools List> Edit Settings) from Operations Manager
Running commands on a specific cluster (clustered environments only)You can run commands on a specific cluster by using Operations Manager. However, you cannotexecute RLM commands on clusters.
Before you begin
The user name and password must be set at the cluster level from the Edit Cluster Settings page orusing the corresponding commands from the command-line interface (CLI).
Steps
1. Click Control Center > Home > Member Details > Physical Systems > Report > Clusters,All.
2. Click the specific cluster to go to the Cluster Details page.
3. Click the Run a Command link under Cluster Tools.
4. In the Run Command page, enter the command in the Appliance Command box.
5. Click Run.
Running commands on a specific node of a cluster (clusteredenvironments only)
You can run only RLM commands for a specific node of a cluster by using Operations Manager. TheDataFabric Manager server uses the Remote Platform Management IP Address (address of the RLMcard) for running these RLM commands.
Before you begin
The credentials for the cluster and its node must be set.
Note: You must set the user name to naroot and set a password at the node level of the clusterfrom the Edit Storage Controller Settings page or using the corresponding CLI.
You can use the dfm run cmd -t command with the timeout set to a value (for example, 10minutes) on the CLI of the DataFabric Manager server, to execute run command jobs that are timeconsuming and result in large outputs (for example, >1500 lines).
Steps
1. Click Control Center > Home > Member Details > Physical Systems > Report > Clusters,All.
2. Click the cluster to go to the Cluster Details page.
3. In the Cluster Details page, click the number corresponding to Controllers.
Storage system management | 225

4. In the "Controllers, All" report, click the name of the controller.
5. In the Storage Controller Details page, click the Run a Command link under StorageController Tools.
The Run Command page is displayed.
6. In the Run Command page, enter the command in the Remote Platform ManagementCommand box.
7. Click Run.
Storage system management using FilerView (7-Modeenvironments only)
With Operations Manager, you can connect to a storage system by using FilerView.
In addition to providing access to the storage system, Operations Manager enables you to log in tothe FilerView management UI of the storage system. When you launch FilerView, OperationsManager opens a new window. By using FilerView, you can edit the configuration settings of astorage system.
Note: You cannot remotely configure more than one storage system using this method.
What FilerView is (7-Mode environments only)Operations Manager enables you to view information about storage systems and vFiler units from aWeb-based UI called FilerView.
Pages displaying information about storage systems and vFiler units provide access to the Web-basedUI, FilerView. You can access FilerView by clicking the icon next to the storage system or vFilerunit name in the details pages for events, storage systems, vFiler units, aggregates, LUNs, qtrees, andvolumes.
To access FilerView for a specific storage system or vFiler unit, you can click the storage systemicon next to the storage system or vFiler unit name in the respective details page.
Configuring storage systems by using FilerView (7-Mode environmentsonly)
You can configure a storage system by using FilerView.
Steps
1. On the Storage Controller Details page, click the FilerView icon.
2. When prompted, provide your user name and the password.
3. Edit the settings.
226 | OnCommand Unified Manager Operations Manager Administration Guide

Introduction to MultiStore and vFiler units (7-Modeenvironments only)
MultiStore is a software feature that enables you to partition the storage and network resources of asingle storage system so that it appears as multiple storage units on the network.
Each storage unit created as a result of the logical partitioning of the hosting storage system’snetwork and storage resources is called a vFiler unit. A vFiler unit, using the resources assigned,delivers storage system services to its clients the same way a storage system does.
You can create multiple vFiler units by using MultiStore.
The storage resource assigned to a vFiler unit can be one or more qtrees or volumes. The networkresource assigned can be one or more base IP addresses or IP aliases associated with networkinterfaces.
A vFiler unit can participate in a distinct IP address space called the IPspace. IP addresses defined foran IPspace are meaningful only within that space. A distinct routing system is maintained for eachIPspace; no cross-IPspace traffic is routed.
For information about configuring and using vFiler units in your storage network, see the DataONTAP MultiStore Management Guide for 7-Mode.
Related information
The IBM N series support website: www.ibm.com/storage/support/nseries
Monitoring of vFiler units with the DataFabric Manager server (7-Modeenvironments only)
You can monitor vFiler units by using Operations Manager.
The DataFabric Manager server provides storage service providers (SSPs) the same managementinterface for monitoring vFiler units and hosting storage systems. Hosting storage systems arephysical storage systems on which a vFiler unit is configured.
Prerequisites for monitoring vFiler units (7-Mode environments only)Before you enable monitoring of vFiler units, you must ensure that the hosting storage system isrunning a supported Data ONTAP release and it is part of the same routable network as theDataFabric Manager server. NDMP discovery must also be enabled.
You must meet the following requirements before monitoring vFiler units:
• Supported Data ONTAP releaseThe MultiStore monitoring feature supports hosting storage systems running Data ONTAP 7.1 orlater.
Storage system management | 227
Note: To run a command on a vFiler unit using a Secure Socket Shell (SSH) connection, youmust ensure that the hosting storage system is running Data ONTAP 7.2 or later.
• Network connectivityTo monitor a vFiler unit, the DataFabric Manager server and the hosting storage system must bepart of the same routable network that is not separated by firewalls.
• Hosting storage system discovery and monitoringYou must first discover and monitor the hosting storage system before discovering andmonitoring the vFiler units.
• NDMP discoveryThe DataFabric Manager server uses NDMP as the discovery method to manage SnapVault andSnapMirror relationships between vFiler units. To use NDMP discovery, you must first enableSNMP and HTTPS discovery.
• Monitoring the default vFiler unitWhen you enable your core license, which includes MultiStore, Data ONTAP automaticallycreates a default vFiler unit on the hosting storage system unit called vfiler0. Operations Managerdoes not provide vfiler0 details.
• Monitoring backup relationshipsFor hosting storage systems that are backing up data to a secondary system, you must ensure thatthe secondary system is added to the vFiler group. The DataFabric Manager server collects detailsabout vFiler unit backup relationships from the hosting storage system. You can then view thebackup relationships if the secondary storage system is assigned to the vFiler group, even thoughthe primary system is not assigned to the same group.
• Monitoring SnapMirror relationshipsFor hosting storage systems that are mirroring data to a secondary system, you must ensure thatthe secondary system is added to the vFiler group. The DataFabric Manager server collects detailsabout vFiler unit SnapMirror relationships from the hosting storage system. The DataFabricManager server displays the relationships if the destination vFiler unit is assigned to the vFilergroup, even though the source vFiler unit is not assigned to the same group.
vFiler unit management tasks (7-Mode environments only)You can perform management tasks on a vFiler unit by using the DataFabric Manager server.
• Discover vFiler units on a hosting storage system.• Group vFiler units for consolidated reporting.• Monitor the health and general status of vFiler units.• Obtain vFiler network and storage resource details.• Obtain vFiler performance and usage reports.• Control vFiler administrative access.• Monitor and manage SnapVault relationships.• Monitor and manage SnapMirror relationships.• Manage user quota.• Manage host administration.• Manage your configuration.
228 | OnCommand Unified Manager Operations Manager Administration Guide
• Run commands on vFiler units.You can run a command on a vFiler unit as a root user with privileges set to hosting storagesystems or only the vFiler units. By default, if you run a command on a vFiler unit, the settings ofthe hosting storage system is used for vFiler communication. However, if you want to use thevFiler unit settings for vFiler communication, you must create a role in the DataFabric Managerserver with privileges assigned to only the vFiler unit and run the command.
Storage system management | 229
Configuration of storage systems (7-Modeenvironments only)
You can remotely configure multiple storage systems by using Operations Manager.
By creating configuration resource groups and applying configuration settings to them,administrators can remotely configure multiple storage systems from the server on which theDataFabric Manager server is installed. Administrators can also manage CIFS data throughconfiguration management.
Management of storage system configuration files (7-Modeenvironments only)
You might prefer to centrally manage your storage system and vFiler configuration /etc files andregistry options. Operations Manager enables you to create and manage configuration files thatcontain the configuration settings you want to apply to a storage system and vFiler unit or groups ofstorage systems and vFiler units.
By using storage system configuration management, you can pull configuration settings from astorage system and vFiler unit. You can then push all of the configuration settings or some of theconfiguration settings to other storage systems, or groups of storage systems and vFiler units.
You can also ensure that the storage system and vFiler configuration conforms with the configurationthat is pushed to it from Operations Manager.
Prerequisites to applying configuration files to storage systems and vFilerunits (7-Mode environments only)
You must meet a set of requirements before applying configuration files to a group of storagesystems and vFiler units.
You must meet the following requirements:
• Ensure that you are assigned the Global Write and Global Delete access roles to add or delete aconfiguration file from a group.
• Set the login and password for the storage system or vFiler unit before you set up configurationgroups.
• Obtain a Data ONTAP plug-in for each version of the configuration file that you use in theDataFabric Manager server.You must have write privileges for a group to push configurations to it. You can download theplug-ins from the N series support website (accessed and navigated as described in Websites onpage 17).
230 | OnCommand Unified Manager Operations Manager Administration Guide

List of access roles to manage storage system configuration files (7-Modeenvironments only)
You require specific access roles to perform management tasks with the storage system configurationfiles.
Task Access role
Creating configuration files Global Write
Deleting configuration files Global Delete
Editing configuration files Global Write
Exporting configuration files Global Read
Importing configuration files Global Write
Upgrading or reverting configuration file versions Global Write
List of tasks for configuration management (7-Mode environments only)You can perform a set of configuration management tasks by using the storage system configurationmanagement feature.
You can perform the following tasks:
• Pull a configuration file from a storage system or a vFiler unit• View the contents of each configuration file.• Edit the configuration file settings (registry options and /etc files).• Copy or rename configuration files.• Edit a configuration file to create a partial configuration file.• Compare configuration files with a standard template.• View the list of existing configuration files.• Upgrade or revert file versions.• Delete a configuration file.• Import and export configuration files.• Remove an existing configuration file from a group’s configuration list.• Change the order of files in the configuration list.• Specify configuration overrides for a storage system or a vFiler unit assigned to a group.• Exclude configuration settings from being pushed to a storage system or a vFiler unit.• View Groups configuration summary for a Data ONTAP version.• Push configuration files to a storage system or a group of storage systems, or to vFiler units or a
group of vFiler units.• Delete push configuration jobs.• View the status of push configuration jobs.
Configuration of storage systems (7-Mode environments only) | 231

Related concepts
What a configuration resource group is (7-Mode environments only) on page 233
What configuration files are (7-Mode environments only)A configuration file is a set of configuration settings that storage systems in one or more groups canshare.
Configuration files exist independently of groups and can be shared among groups. You can useOperations Manager to pull a configuration file from storage systems and save it.
What a configuration plug-in is (7-Mode environments only)A configuration plug-in is an add-on library in a zip file that is required for the DataFabric Managerserver to manage Data ONTAP. Configuration plug-ins enable you to upgrade or revert aconfiguration file that is stored in the DataFabric Manager server database to a different version.
For each Data ONTAP version, a Data ONTAP plug-in is provided.
Comparison of configurations (7-Mode environments only)Operations Manager enables you to compare your configuration file settings with those of a templateconfiguration. You can view the configuration comparison results in a report format, and use thisreport to identify the configuration settings that do not conform to those of the standard template.
You can also compare storage systems, vFiler units or groups of storage systems, vFiler units with aconfiguration file, and create jobs to obtain the comparison results. You can use Operations Managerto access the comparison job results.
Verification of a successful configuration push (7-Mode environments only)After you have initiated a configuration push, you can review the status of the push operation foreach storage system or vFiler unit to which you pushed a configuration.
When you push a configuration to a storage system or vFiler unit, the DataFabric Manager serverlogs the push operation on the storage system, or vFiler unit. The DataFabric Manager server logsthis operation as a message that contains information about the DataFabric Manager server station,and the administrator who started the push job.
Configuring the DataFabric Manager server to monitor configurationchanges (7-Mode environments only)
You can monitor configuration changes made to the storage systems by using the DataFabricManager server.
Before you begin
The credentials for the storage system that you want to monitor must be set.
232 | OnCommand Unified Manager Operations Manager Administration Guide

Steps
1. Pull the configuration setting from the storage system and save that as a new configuration file.
2. Modify the configuration file and push it to the storage system.
When changes are made to the configuration settings, the DataFabric Manager server generates aSystem Configuration: Changed Locally event after the periodic configuration conformancemonitor is run (unless the user triggers host discovery).
3. After the event is generated, select Fix in the Event details page to view the differences in theconfiguration setting.
4. Select Accept to save the new changes in the configuration file, or click Reject to retain theprevious settings.
Result
The DataFabric Manager server starts monitoring the configuration changes in the storage system.
What a configuration resource group is (7-Modeenvironments only)
A configuration resource group is a group of storage systems that share a set of commonconfiguration settings. You can designate groups of managed storage systems that can be remotelyconfigured to share the same configuration settings.
A configuration resource group must contain a certain number of storage systems and have one ormore files containing the required configuration settings. These configuration settings are listed infiles called configuration files.
List of tasks for managing configuration groups (7-Mode environmentsonly)
After you have added configuration files to a group, you can manage your configuration groups byperforming a set of tasks, including removing an existing configuration file from a group's list,changing the order of files, specifying configuration overrides, and viewing Groups configurationsummary.
You can perform the following tasks:
• Remove an existing configuration file from a group’s configuration list.• Change the order of files in the configuration list.• Specify configuration overrides for a storage system or a vFiler unit assigned to a group.
Note: The DataFabric Manager server attempts to contact the storage system or vFiler unit fivetimes (default) to complete the configuration push job. You cannot reconfigure the number ofretries from Operations Manager, but you can use the dfm config push -R command tospecify a new retry limit.
Configuration of storage systems (7-Mode environments only) | 233
• Exclude configuration settings from being pushed to a storage system or a vFiler unit.• View Groups configuration summary for any version of Data ONTAP.• Push configuration files to a storage system or a group of storage systems, or to vFiler units or a
group of vFiler units.• Delete push configuration jobs.• View the status of a push configuration job.
Guidelines for creating configuration groups (7-Mode environments only)Before you create configuration groups, you must consider the versions of operating systems andData ONTAP, and storage systems belonging to configuration resource groups.
• You can group storage systems running different operating system versions in the sameconfiguration resource group.
• A storage system can belong to only one configuration resource group, but it can belong to othernon-configuration resource groups.
• A storage system that is a member of a configuration resource group can belong to one or moregroups.
Creating configuration resource groups (7-Mode environments only)You can create configuration resource groups by creating an empty group and populating the groupwith storage systems.
Steps
1. Create an empty group.
2. From the Groups pane, select the group you want to edit.
3. From the Current Group pane, select Edit Membership.
4. Populate the group from the available members.
5. From the Current Group pane, select Edit Storage System Configuration to add one or moreconfiguration files to the group.
Result
After the configuration files are associated with the group, the following icon is attached to the groupname so that you can identify the group as a configuration resource group:
234 | OnCommand Unified Manager Operations Manager Administration Guide
Parent configuration resource groups (7-Mode environments only)You can specify a parent configuration resource group from which you can acquire configurationsettings.
Assigning a parent group enables you to quickly set the majority of the configuration settings of astorage system. You can then add any other configuration files that you might require to meet yourdeployment requirements. When you assign a parent group, only the parent group’s configurationfiles are inherited, not the storage systems in the parent group.
Parent group guidelines (7-Mode environments only)
You should be aware of some guidelines about the inheritance from the parent files and the parenthierarchy before you assign a parent group.
• When you assign a parent, only the parent group's configuration files are inherited.The storage systems in the member group are not inherited.
• Parent groups can include parents of their own.The configuration settings of all parents are added to the beginning of the child’s configurationsettings. There is no limit to the potential length of these parent chains.
Note: You must review the settings in a parent group so that they do not have unintendedconsequences on your storage systems.
When to assign parent groups (7-Mode environments only)
You should assign a parent group if you want to control all or most of the configuration settings of astorage system from Operations Manager.
Remember that when you assign a parent group, you inherit all configuration settings in the parentgroup. Therefore, you should carefully scan a parent’s configuration for any unnecessary settingsbefore assigning a parent group.
You might not want to assign a parent group if you want to use only a few of a parent group’ssettings. For example, if an existing group contains most of the access control list (ACL) rules yourequire, you cannot assign the group as a parent. You also cannot add more ACL rules in anotherconfiguration file.
Properties of configuration files acquired from a parent (7-Mode environments only)
You must be aware of the properties of configuration files that are acquired from parent groups. Forexample, the configuration files are initially read-only.
When you include configuration files from another group, consider the following information:
• A configuration resource group can include configuration files from only one parent group.• Configuration files acquired from parent groups are always read first.
You cannot change the order in which the acquired files are read unless you re-order theconfiguration files from within the parent group.
Configuration of storage systems (7-Mode environments only) | 235

Configuring multiple storage systems or vFiler units (7-Mode environments only)
To configure storage systems or vFiler units, you must have enabled SNMP on the storage systemsand the DataFabric Manager server must have discovered them.
Steps
1. Pull a configuration file from a storage system or a vFiler unit.
2. Click Management > Storage System or vFiler > Configuration Files > Edit ConfigurationFile.
3. Edit the file settings.
4. Click Compare Configuration Files to compare your storage system or vFiler configuration filewith a standard template configuration.
5. Create a configuration resource group by adding a configuration file.
6. If necessary, click Edit Storage System Configuration or Edit vFiler Configuration > EditConfiguration Pushed for Appliance to specify configuration overrides for a specific storagesystem or vFiler unit, or exclude configuration settings from being pushed to the storage systemor vFiler units.
7. Click Edit Storage System Configuration or Edit vFiler Configuration and push theconfiguration file or files to the storage system or to the group.
8. Verify that the configuration changes are updated by reviewing the status of the push jobs.
236 | OnCommand Unified Manager Operations Manager Administration Guide

Maintenance and managementYou can configure and maintain the DataFabric Manager server through the CLI.
Accessing the DataFabric Manager server through the CLIYou can access the command-line interface (CLI) through Telnet or the console of the system onwhich the DataFabric Manager server is installed.
Step
1. Access the CLI on local or remote systems by performing the following action:
If you want to accessthe CLI on a...
Then...
Local Windowssystem
Use the command prompt window of the Windows system by clicking Start >Run.
Local Linux system Use any shell prompt on your system.
Remote Windows orLinux system
a. Start a Telnet connection from the remote host to the DataFabric Managerserver that you want to access by entering the following command:
telnet hostname
hostname is the host name or IP address of the system running theDataFabric Manager server.When connected to a terminal server, you should use the host name or IPaddress, and the port number of the terminal server, to access the console ofthe workstation:
telnet {term server}: port_number
b. Authenticate using your user name and password.
Where to find information about the DataFabric Managerserver commands
You can find information about the DataFabric Manager server commands either by accessing thehelp or by using the dfm help command.
• You can access the man pages through the table of contents of the Operations Manager Help.On a Linux system, you can access the man pages by running the source/opt/IBMdfm/bin/vars.sh command, and then the man dfm command.
• You can use the dfm help command, which has the following syntax: dfm help command.
237
Audit loggingAudit logging is the process of logging every activity performed by the DataFabric Manager serverfor a later review. The DataFabric Manager server logs all the activities in the audit log file.
System administrators view the audit log file for following reasons:
• Determine the recently changed configurations to understand why a problem is occurring.• Determine when a specified change in the configuration of the system was made.• Determine who made the specified change in the configuration of the system and ask them why
the change was made.• Identify attempts to subvert the security of the system.
The audit log file resides in the default log directory of the DataFabric Manager server.
Events audited in the DataFabric Manager serverThe DataFabric Manager server logs events and each of these events are recorded.
The events that can be audited in the DataFabric Manager server and the information that is recordedabout each event are described here:
Authenticationevents
The DataFabric Manager server logs each authentication action thatsucceeded or failed. The user name associated with the authentication attemptis also recorded.
Authorizationevents
The DataFabric Manager server logs each authorization failure and the username associated with it.
Commandexecution
The DataFabric Manager server logs the execution of each command. Thecomplete command line (including options and arguments) is recorded in theaudit log file. The DataFabric Manager server also logs the name of theuser who executed the command; the failure status of the command, if any;and the type of request: Web or CLI.
API calls The DataFabric Manager server logs the invocation of any API by using theDataFabric Manager server service. The complete details of the API call andthe authenticated user's name, on whose behalf, the API was invoked, arerecorded in the audit log file.
Scheduled actions When the scheduler starts a job by invoking a CLI, the DataFabric Managerserver logs the scheduled action and the user affiliated with it in the auditlog file.
In addition, a timestamp is recorded for each event. In the case of APIs, the IP address of theappliance from which the requests are received is logged. In the case of CLI requests, the IP addressis always that of the DataFabric Manager server.
238 | OnCommand Unified Manager Operations Manager Administration Guide

Global options for audit log files and their valuesA global option auditLogForever is used to keep the audit log files forever. The valid values forthis option are yes and no and the default value is noauditLogEnabled.
Note: When you set the auditLogForever global option to yes, the number of audit log files(each 3 MB in size) can grow excessively. You have to ensure that you have enough space on theDataFabric Manager server to keep the audit log files forever.
For audit logging, the dfm option list command requires global read capability, and the dfmoption set command requires global write capability.
You must have Core Control Capability to modify auditLogEnable and auditLogForeverglobal options. License features required: The dfm option set command requires an OperationsManager license.
Format of events in an audit log fileThe format of events in the audit log file is as follows: <timestamp> [<application-name>:<priority>]:<username>:<protocol> <label>:[ip-address]:<intent>:<message>.
Example of events in the audit log file:
Apr 11 00:04:19 [dfm:NOTIC]:root:LOG:action:::Added new
administrator "testu1":
Apr 20 11:57:27 [dfm:NOTIC]:root:API:in:[10.72.1.2]:Listing database
Apr 23 14:56:40 [dfm:NOTIC]:root:WEB:in:[ABCD:EF01:2345:6789:ABCD:EF01:2345:6789]:dfmreport view
backups:
<ss><dfm-backup-directory>opt
<dfm-backup-directory><dfm-backup-verify-settings>
The <application-name> value denotes the application invoking the audit log facility. For example, itcan be dfm/dfbm/dfdrm if a CLI or Operations Manager request is being audit logged from thedfm/dfbm/dfdrm executable.
In the case of APIs, <application-name> is the actual name of the application that called the API (forexample, dfm and sdu). If the API was called by an external application other than the DataFabricManager server and it does not pass the name of the application in the API input parameters, thefield :: is not printed in the log message.
The message priority field <priority> can have one of the following values:
• EMERG: unusable system• ALERT: action required• CRIT: critical conditions
Maintenance and management | 239

• ERROR: error conditions• WARN: warning conditions• NOTIC: normal, but significant condition• INFO: informational messages• DEBUG: debug-level messages
The <username> field logs names of the users who invoked the CLIs and APIs.
The <protocol> field describes the source of the event being logged. The protocol label can have oneof the following values:
• API: In the case of an API invocation• CMD: In the case of CLI commands• LOG: When an event is explicitly logged by the system• WEB: In the case of an Operations Manager request
The <label> field describes the type of the event being logged. The message label can have one ofthe following values:
• IN: for input• OUT: for output (for example, in the case of API calls)• ERR: for error (for example, in the case of log in failures)• ACTION: for actions initiated by the user
The <ip-address> value for APIs is the IP address of the system from which the API is invoked. Inthe case of the CLI, it is the IP address of the DataFabric Manager server. For requests comingthrough Operations Manager, it is the IP address of the workstation on which Operations Manager isinstalled.
The <intent> field describes the following information:
• If the protocol is API, it conveys the intention of the API.• If the protocol is CMD, it is the actual command used.• If the protocol is WEB, it is the URL of the Web page.• If audit-log API is called, this field remains blank.
The <message> field content depends on the value of <protocol>, as follows:
• If <protocol> is API, the XML input to the API is logged, excluding the <IBM> element.• If <protocol> is CMD, it contains output or an error message.• If <protocol> is WEB, it is empty.
Following is an example:
July 04 22:11:59 [dfm:NOTIC]:IBM\tom:CMD:in:127.0.0.1:dfm host
password set -p ****** jameel:Started job:2
July 06 13:27:15 [dfm:NOTIC]:IBM\tom:WEB:in:127.0.0.1:dfm user
login username = tom password=******:Logged in as<B>IBM\tom
240 | OnCommand Unified Manager Operations Manager Administration Guide
<\B><BR>
July 06 14:42:55[dfm:NOTIC]:IBM\tom:API:in:127.0.0.1:Add a role
to a user:<rbac-admin-role-add> <role-name-or-id>4</role-name-orid>
<admin-name-or-id>TOM-XP\dfmuser</admin-name-or-id></rbacadmin-
role-add>
Permissions for accessing the audit log fileWindows and UNIX users have separate permissions for accessing the audit log file.
The following users have both read and write permissions:
• Linux: -rw - - “root” users on Linux• Windows users in the Administrators group
What the remote platform management interface isThe remote platform management interface enables you to remotely perform the routine systemmaintenance tasks such as resetting a system with backup firmware.
Following maintenance tasks can be performed using the interface on the DataFabric Managerserver:
• Control system power, such as powering on or off the storage system• Reset system firmware• View system and event logs• Obtain system sensor status
You can use the Run a Command tool in Operations Manager or use the dfm run cmd -r commandon the CLI of the DataFabric Manager server to execute the remote platform managementcommands.
By using the interface, you can access the Remote LAN Module (RLM) cards on the N5000 series;N6000 series; and N7000 series storage systems.
RLM card monitoring in the DataFabric Manager serverThe DataFabric Manager server monitors the RLM card installed on your storage system and obtainsits status by issuing an ICMP ECHO request. When the card responds to the request, OperationsManager displays the card status as Online in the Appliance Details page.
By default, the DataFabric Manager server pings the card every 15 minutes. You can change thismonitoring interval using the Operations Manager Tools menu.
Maintenance and management | 241

Prerequisites for using the remote platform management interfaceBefore performing remote maintenance, by using the remote platform management interface, youmust configure the RLM card IP address on the storage system.
After you have configured the card’s IP address, you must set the following parameters in EditAppliance Settings for the destination storage system:
Remote Platform Management IPaddress
This is the IP address of the RLM card on the storage system.
Appliance login This is the login user name.
Appliance password This is the login password.
For procedures to configure an RLM card IP address, see the Operations Manager Help.
Scripts overviewThe installation, management, and execution of your scripts are supported by the DataFabricManager server.
You begin creating a script by writing the script. You can use any scripting language, but keep inmind that your choice impacts your network administrators. The network administrator needs toinstall the interpreter you require on the system where the DataFabric Manager server is installed. Itis recommended that you use a scripting language such as Perl. Perl is typically installed with theoperating system on Linux and Windows workstations.
Note: If the interpreter is installed after the DataFabric Manager server is installed, restart theDataFabric Manager services by using the following commands:
• dfm service stop• dfm service start
The dfm report –F Perl command in the DataFabric Manager server generates reports for directinclusion in Perl scripts. You can import information from the DataFabric Manager server reportsinto a Perl script. For more information, see the dfm report command man page.
See the Operations Manager Help for task procedures and option descriptions.
Commands that can be used as part of the scriptBecause the DataFabric Manager server can execute scripts, you can use commands that are availableas part of the DataFabric Manager server CLI to execute your script.
Your script can perform the following tasks:
• Use the dfm run command to execute commands on storage systems for which credentials arespecified on the DataFabric Manager server.
242 | OnCommand Unified Manager Operations Manager Administration Guide

• Use the dfm report command to import information from Operations Manager reports into aPerl script.
• Use the dfm event generate command to enable your scripts to generate events.
Package of the script contentAfter you have written your script, you have to package it as a .zip file.
The .zip file must contain the script, any data files that are required by the script, and a file calledpackage.xml.
For more information about package.xml and the XML schema information, see the OperationsManager Help.
What script plug-ins areBy using the script plug-in framework, you can perform several tasks in Operations Manager.
Scripts are installed using a .zip file that must contain the script, any data files that are needed by thescript, and a file named package.xml.
The package.xml file contains information about the script, and might optionally containdefinitions of new event types that your script generates.
After you have your .zip file ready, you can install it on the DataFabric Manager server to verify thatyour packaging functions correctly. After you verify the functionality, you can use, or distribute thescript.
You can perform the following tasks using the script plug-in framework:
• Manage the scripts you add to the DataFabric Manager server• Create and manage script jobs• Create and manage schedules for the script jobs you have created• Define new event classes during script installation or generate these events during script
execution
For more information about creating scripts and the contents of the script .zip file, see the OperationsManager Help.
What the script plug-in directory isBy default, scripts are installed in the script-plugins subdirectory of the installation directory.
You can change the location of this directory by using the scriptDir option of the dfm optioncommand. The option value must conform to the following requirements:
• The value must be an absolute Linux or Windows path.• The value must include an existing directory on the DataFabric Manager server.
Maintenance and management | 243

What backup scripts do (7-Mode environments only)The prebackup and postbackup scripts help in bringing the databases into the hot backup modebefore a backup is performed.
The DataFabric Manager server provides the capability to run prebackup and postbackup scripts onspecific primary directories, before and after data is backed up from those directories.
Note: The timeout value for backup scripts is 3600 seconds. This value cannot be modified.For more information about setting up such scripts to run on primary directories, see the DataFabricManager server backup man pages.
Overview of the DataFabric Manager server databasebackup process
You can back up the DataFabric Manager server database, script plug-ins, and performance datawithout stopping any of the DataFabric Manager server services. However, data collection andviewing the modifications of Performance Advisor are suspended during the backup process (7-Mode environments only).
Two types of backups are available:
• ArchiveThis process backs up your critical data in compressed form as a .zip file. The DataFabricManager server data is automatically converted to an archive format and the DataFabric Managerserver stores the backup in a local or remote directory. You can move an archive-based backup toa different system and restore it. This backup process is time-consuming.
• SnapshotThis process uses the Snapshot technology to back up the database. You can quicken the backupprocess through this approach. But you cannot transfer a Snapshot backup to a different systemand restore it.
When to back up dataYou must back up your data regularly before any upgrade operation, and before any maintenance onthe system host on the DataFabric Manager server or an operating system upgrade.
You are requested to backup as part of the installation wizard steps during an upgrade.
You can backup data before:
• Upgrading DataFabric Manager server (or during the upgrade, as one of the installation wizardsteps)
• Any maintenance on the system host on the DataFabric Manager server or Operating Systemupgrade
244 | OnCommand Unified Manager Operations Manager Administration Guide

Where to back up dataBy default, the DataFabric Manager server creates the archive backups in two directories.
DataFabric Manager server creates archives in the following directories:
• /opt/IBMdfm/data on a UNIX system• C:\Program Files\IBM\DataFabric Manager\DFM\data on a Windows system
You can also specify a different target directory. The backup file has an added file name extensionof .db, .gz, .zip, or .ndb, depending on the version of the DataFabric Manager server that you arerunning.
Note: The current version of the DataFabric Manager server uses .ndb format.
The Snapshot-based backups are volume Snapshot copies. Therefore, unlike in the archive backups,you do not have to specify a target directory in the Snapshot based backups.
Recommendations for disaster recoveryIf you are using the archive-based backups, set the database backup location to a remote location.You can access the backup even if the DataFabric Manager server is not accessible.Similar to archive-based backups, integration support of DataFabric Manager server with SnapVaultor SnapMirror is available for Snapshot-based backups.
Backup storage and sizingWhen you perform an archived backup, the DataFabric Manager server calculates the amount of diskspace required to complete the backup successfully. You can view the backup information in theDatabase Backup Schedule Confirmation page.
In the case of Snapshot-based backups, the DataFabric Manager server does not calculate the amountof disk space required. Therefore, it is a good practice to provide enough disk space to hold thebackups.
Limitations of Snapshot-based backupsTo configure the DataFabric Manager server database for Snapshot-based backups on Windows andLinux, you must install the appropriate versions of the SnapDrive software.
SnapDrive restrictions on Windows
To configure the DataFabric Manager server database for Snapshot-based backups on Windows, youmust install SnapDrive 4.1 for Windows or later.
SnapDrive restrictions on Linux
To configure the DataFabric Manager server database for Snapshot-based backups on Linux, youmust install SnapDrive 2.2.1 for UNIX or later. For information about supported versions, see the
Maintenance and management | 245

SnapDrive for UNIX Compatibility Matrix page on the N series support website (accessed andnavigated as described in Websites on page 17).
Access requirements for backup operationsYou must log in to the DataFabric Manager server with CoreControl capability in the Global scope toperform various backup operations.
You can perform the following backup operations:
• Create• Delete• Start• Abort• Set schedule• Enable schedule• Export• Diagnose
To list the backups on a directory, and to get the status and schedules of backups, log in toOperations Manager with the GlobalRead role.
Changing the directory path for database backupsYou can use Operations Manager to change the directory path for database backups if you want toback up to a different location.
Steps
1. Click Setup > Options.
2. Click Database Backup under Edit Options.
3. In the Archive Backup Destination Directory field, change the directory path if you want toback up to a different location.
4. Click Update.
Starting database backup from Operations ManagerYou can manually start a database backup from Operations Manager.
Steps
1. Select Setup > Database Backup.
2. Select Backup Type.
You can choose between the archive-based and Snapshot-based backups.
3. Click Back Up Now.
246 | OnCommand Unified Manager Operations Manager Administration Guide
The Database Backup Confirmation page is displayed if the Backup Type is Archive.
4. Click Run Backup.
After you finish
Note: To stop a backup that is in progress, click Abort Backup.
Scheduling database backups from Operations ManagerYou can schedule a database backup to occur at a specific time on a recurring basis.
Before you begin
You must be authorized to perform all the steps of this task; your RBAC administrator can confirmyour authorization in advance.
About this task
While scheduling database backup in the archive format, hourly backups and multiple backups in aday are not feasible, because backups in the archive format take time.
Steps
1. Click Setup > Database Backup.
2. Select Backup Type.
You can select either archive-based backup or Snapshot-based backup.
3. Select Enable Schedule to activate the schedule.
4. Select the frequency to run the backup and enter the time to run it.
Entries are based on hourly, less frequent than hourly, daily, and weekly schedules.
5. Click Update Schedule.
6. Verify that the settings are correct, and then click Update Data.
Specifying the backup retention countYou can specify the number of backups the DataFabric Manager server needs to retain.
Steps
1. Select Setup > Options.
2. Click Database Backup.
3. In the Database Backup Retention Count field, enter the count.
4. Click Update.
Maintenance and management | 247

Disabling database backup schedulesYou can temporarily disable the DataFabric Manager server database backup schedule.
Steps
1. Select Setup > Database Backup.
2. To disable the schedule, ensure that Enable Schedule check box is not selected.
3. Click Update Schedule.
Listing database backupsYou can view information about the DataFabric Manager server database backups.
Steps
1. Select Setup > Database Backup.
2. Click List Database Backups.
Deleting database backups from Operations ManagerYou can delete the DataFabric Manager server database backup using Operations Manager.
Steps
1. Select Setup > Database Backup.
2. Click List Database Backups.
3. Select Delete Selected.
Displaying diagnostic information from Operations ManagerThe DataFabric Manager server might fail to detect the DataFabric Manager server setup on a LUN.You can investigate such backup-related issues using diagnostic information.
Steps
1. Click Setup > Database Backup.
2. Click Update Schedule.
Update schedule after you schedule a database backup.
3. Click Diagnose.
248 | OnCommand Unified Manager Operations Manager Administration Guide

Exportability of a backup to a new locationYou can export a Snapshot-based backup to a different location by using the dfm backup exportbackup_name command. You can overwrite an existing backup at a new location by using the dfmbackup export -f backup_name command.
To export the backup file to a new path, you should use the dfm backup export backup_name[target_filepath] command. If target_filepath is not specified, the archive-based backupis created by default in the directory specified in the Archive Backup Destination Directory fieldusing Operations Manager.
What the restore process isYou can restore the DataFabric Manager server database backups only through the CLI. You canrestore all data by using the dfm backup restore command.
If the restore operation fails, the DataFabric Manager server attempts to restore the database to itsearlier state, and all temporary files that were created are deleted. If this attempt also fails, the CLIprompts you with a set of instructions to restore the original database.
Note: Do not run any dfm command during a DataFabric Manager server restore or upgradeoperation. If some commands are run, they can interfere with the restore or upgrade operation bylocking database tables and causing the operation to fail.
Restoring the database from the archive-based backupYou can restore the DataFabric Manager server database on the same system. You can specify theabsolute path for the backup file by using the dfm backup restore command.
Steps
1. Copy the backup file to the databaseBackupDir directory.
2. Type the following command at the command line:
dfm backup restore backup_name
backup_name is the name of the file to which you saved your DataFabric Manager serverdatabase.
The following message is displayed when the restore process is successful: Completedrestore
Maintenance and management | 249
Restoring the database from the Snapshot copy-based backupYou can restore the DataFabric Manager server database on the same system.
Steps
1. Type the following command at the command line to display the names of the backup copies ofthe database:
dfm backup list
2. Type the following command at the command line:
dfm backup restore backup_name
backup_name is the name of the backup copy in the database.
Result
The following message is displayed when the restore process is completed successfully: Completedrestore.
Restoration of the database on different systemsTo restore the DataFabric Manager server database and other configuration from the archive-basedbackup on to another server, create a backup file (dfm backup create). Copy that backup file ontothe new system, and then restore the backup on that system (dfm backup restore).
You can restore the database from a Snapshot-based backup on to another server. One way is toexport the Snapshot-based backup in the archive format (dfm backup export), copy that backupfile onto the new system, then restore the backup on that system (dfm backup restore).
Another way to restore the database from a Snapshot-based backup is to connect to the Snapshotcopy using the SnapDrive commands, and run the dfm datastore setup-n<target_dir_LUN> command.
However, after you restore a database from one DataFabric Manager server to another, the localadministrator account might be different on the new server. This restore operation would result in thelocal administrator account losing access to the restored DataFabric Manager server database. If thishappens, you need to perform the following tasks:
• Log in to the new system as a user with GlobalFullControl.• Add the local account administrator of the new system back into the DataFabric Manager server
with GlobalFullControl capabilities.
Note: If there are no GlobalFullControl users that can access the new system, contact technicalsupport for assistance. This can usually be avoided by ensuring that a domain user (who haspermission to log in to both systems) exists in the DataFabric Manager server withGlobalFullControl role before migrating the database.
250 | OnCommand Unified Manager Operations Manager Administration Guide
Disaster recovery configurations (7-Mode environmentsonly)
You can configure the DataFabric Manager server for disaster recovery by using the N seriesManagement Console data protection capability and SnapDrive.
Note: Disaster recovery does not support IPv6 addressing.
Disaster recovery support enables you to recover the DataFabric Manager server services quickly onanother site. Disaster recovery support prevents any data loss due to disasters that might result in atotal site failure.
A disaster recovery plan typically involves deploying remote failover architecture. This remotefailover architecture allows a secondary data center to take over critical operations when there is adisaster in the primary data center.
Disaster recovery using the N series Management Console data protectioncapability (7-Mode environments only)
If you have the N series Management Console data protection capability license, then you can use theN series Management Console data protection capability to configure the DataFabric Manager serverfor disaster recovery.
Snapshot-based backups are made at the primary site according to the backup schedule. By using theN series Management Console data protection capability and SnapMirror technology, the Snapshot-based backups are registered with the N series Management Console data protection capability.These Snapshot-based backups are then mirrored to the secondary site according to the N seriesManagement Console data protection capability Mirror policy.
If a catastrophic failure of the primary site occurs, the DataFabric Manager server services should bestarted on the secondary site using mirrored data by running the dfm datastore mirrorconnect command.
Limitation of disaster recovery support (7-Mode environments only)
You must use SnapDrive to configure the DataFabric Manager server on Linux for disaster recovery.
Related information
Technical Report 3655: Disaster Recovery Support for DataFabric Manager Data Using SnapDrive
Prerequisites for disaster recovery support (7-Mode environments only)
You must ensure that you meet the prerequisites for disaster recovery support for the DataFabricManager server data.
• You must be a Windows domain administrator.
Maintenance and management | 251
• You must have the N series Management Console data protection capability license.• You must be using SnapDrive for Windows 6.0 or later.
The DataFabric Manager server is dependent on SnapDrive for Windows to provide disasterrecovery support.
• You must be using the same version of Data ONTAP on both the source and destination storagesystems.To ensure that you have the required the Data ONTAP version for SnapDrive, see the N seriesinteroperability matrix website (accessed and navigated as described in Websites on page 17).
• You must have a SnapMirror license for both the source and destination storage systems.• You must configure Snapshot-based backup for the DataFabric Manager server.
To grant root access to the Windows domain account that is used by the SnapDrive service, youmust configure the source and destination storage systems. You can configure the storage systemsby setting the wafl.map_nt_admin_priv_to_root option to On from the command-lineinterface.
• You should have a dedicated flexible volume for the DataFabric Manager server data, becausevolume SnapMirror is used for mirroring the data.
• The DataFabric Manager server data must be stored in a LUN.• The source and destination storage systems must be managed by the N series Management
Console data protection capability.• The Windows domain account that is used by the SnapDrive service must be a member of the
local built-in group or local administrators group on both the source and destination storagesystems.
• The Windows domain account that is used to administer SnapDrive must have full access to theWindows domain to which both the source and destination storage systems belong.
Related information
IBM N series interoperability matrix: www.ibm.com/systems/storage/network/interophome.html
Setting up the DataFabric Manager server for disaster recovery
You must perform a set of tasks to set up the DataFabric Manager server for disaster recovery.
Steps
1. Install or upgrade the DataFabric Manager server on the primary site by performing the followingsteps:
a) Install the DataFabric Manager server.b) Install SnapDrive for Windows and configure it with the N series Management Console data
protection capability.c) Create an FC-based or iSCSI-based LUN on the storage system using SnapDrive.d) Run the dfm datastore setup command to migrate the data to a directory in the FC-based
or iSCSI-based LUN.
2. Configure a schedule for Snapshot-based backup.
252 | OnCommand Unified Manager Operations Manager Administration Guide

3. Run the dfm datastore mirror setup command to create the application dataset.
4. Configure the DataFabric Manager server for disaster recovery using the N series ManagementConsole data protection capability features by performing the following steps:
a) Create a volume on the destination storage system having the same size and spaceconfiguration as the primary volume.
If you have either the N series Management Console data protection capability DisasterRecovery license or the N series Management Console provisioning capability license,secondary volume provisioning can take advantage of the policies provided by that license. Ifyou do not have either of these licenses, then you must provision the secondary volumemanually.
b) Assign the provisioned secondary volume to the application dataset.
For more information about how to use the N series Management Console data protectioncapability to assign resources to a dataset, see the Management Console Help.
c) Assign a schedule to the application dataset.
For more information about how to use the N series Management Console data protectioncapability to assign schedules to a dataset, see the Management Console Help.
d) Ensure that there are no conformance issues.
5. Run the dfm backup diag command and note the SnapMirror location information from thecommand output.
You require this information when you use the dfm datastore mirror connect commandduring the process of recovering the DataFabric Manager server.
6. Install the DataFabric Manager server on the secondary site.
7. Run the dfm service disable command on the secondary site to disable all the DataFabricManager server services.
The DataFabric Manager server services must be enabled only during disaster recovery, whichyou can do by using the dfm datastore mirror connect command.
Related tasks
Scheduling database backups from Operations Manager on page 247
Recovering the DataFabric Manager server services
You can recover the DataFabric Manager server services on the secondary site if a disaster occurs atthe primary site.
Steps
1. Connect to the LUN using the Microsoft Management Console (MMC) Connect Disk wizard onthe secondary storage system by completing the following steps:
a) Expand the Storage option in the left pane of the MMC.
Maintenance and management | 253

b) if you are managing multiple instances of SnapDrive, double-click the SnapDrive List.Otherwise, double-click SnapDrive.
c) Double-click the name of the SnapDrive host you want to manage.d) Right-click Disks.e) Select the Connect Disk option and follow the instructions on the Connect Disk wizard.
For more information about connecting virtual disks, see the SnapDrive for WindowsInstallation and Administration Guide.
2. Run the dfm service enable command to enable the services.
3. Run the dfm datastore setup-n command to configure the DataFabric Manager server touse the mirrored data.
4. Run the dfm service start command to start the DataFabric Manager server services.
5. Using the N series Management Console data protection capability UI, change the dataset createdfor the DataFabric Manager server data from the current mode to suspended mode.
6. Run the dfm options set command to reset the localHostName global option on thesecondary site, if the primary site is clustered using MSCS.
7. Run the dfm service disable command to disable the services on the primary site.
If the primary site is clustered using MSCS, offline the services before disabling them.
Related information
The IBM N series support website: www.ibm.com/storage/support/nseries
Recovering the DataFabric Manager server services using the dfm datastore mirrorconnect command
You can use the dfm datastore mirror connect to recover the DataFabric Manager serverservices on the secondary site if a disaster occurs at the primary site.
Steps
1. Run the dfm datastore mirror connect command on the DataFabric Manager server at thesecondary site to start the DataFabric Manager server services using mirrored data.
The dfm datastore mirror connect command performs the following operations:
• Breaks the mirror relationship between the source and destination DataFabric Manager server.• Connects to the mirrored volume or LUN using SnapDrive for Windows.• Enables the services using the dfm service enable command.• Configures the DataFabric Manager server to use the data from the mirrored location.• Starts the DataFabric Manager server services.• Puts the dataset created for the DataFabric Manager server data in suspended mode.
254 | OnCommand Unified Manager Operations Manager Administration Guide

2. Run the dfm options set command to reset the localHostName global option on thesecondary site, if the primary site is clustered using MSCS.
3. Run the dfm service disable command to disable the services on the primary site.
If the primary site is clustered using MSCS, offline the services before disabling them.
Failing back DataFabric Manager server services
You must complete a set of tasks to fail back the DataFabric Manager server services to the primarysite.
Steps
1. Ensure that the DataFabric Manager server data at the source storage system is synchronized withthe data in the destination storage system by completing the following steps:a) Run the dfdrm mirror list command to find the relationships between the source and
destination storage systems.b) Run the dfdrm mirror resync -r command to resynchronize the mirror relationships.
This command reverses the mirror direction and starts the updates.c) If the SnapMirror relationship is removed during the process of recovering the DataFabric
Manager server services, run the snapmirror resync command to resynchronize the dataat the storage system level.
d) If the primary storage system is destroyed during a disaster, run the dfdrm mirrorinitialize command to create a relationship from the secondary storage system to the newprimary storage system.
2. Run the dfm service disable command to stop and disable the services at the secondary site.
3. To start the DataFabric Manager server services using the mirrored data on the primary site, usethe dfm datastore mirror connect command.
Alternatively, perform the following steps:
• Run the dfm datastore mirror connect command at the CLI.• Alternatively, perform the following procedure:
a) Connect to the LUN using the MMC Connect Disk wizard on the primary storage system.b) Run the dfm service enable command to enable the services.c) Run the dfm datastore setup -n command to configure the DataFabric Manager server
to use the mirrored data on the LUN.d) Run the dfm service start command to start the DataFabric Manager server services.
Note: The dfm datastore mirror connect command does not support shared storage.Therefore, the command should not be used if the primary system is set up for cluster usingMSCS.
4. Run the dfdrm mirror resync -r command to resynchronize the mirror relationships so thatthey are no longer reversed.
Maintenance and management | 255
5. If the SnapMirror relationship is removed during the failback process, run the snapmirrorresync command to resynchronize the data at the storage system level.
6. Run the dfm host discover command to discover the reversed relationships on the primarysite, if they are not discovered already.
7. Run the dfdrm mirror list command to ensure that these relationships are discovered.
8. Run the dfm datastore mirror destroy command to destroy the application dataset createdfor the DataFabric Manager server data.
9. Run the dfm datastore mirror setup command to create a new application dataset for theDataFabric Manager server data.
10. Using the N series Management Console data protection capability UI, import the SnapMirrorrelationship already established for the DataFabric Manager server data to the new applicationdataset.
For more information about how to use the N series Management Console data protectioncapability to import SnapMirror relationships, see the Management Console Help.
Disaster recovery using SnapDrive (7-Mode environments only)If you do not have the N series Management Console data protection capability license, then you canuse SnapDrive to configure the DataFabric Manager server for disaster recovery.
For more information, you can view the technical report, Disaster Recovery Support for DataFabricManager Data Using SnapDrive.
Related information
Technical Report 3655: Disaster Recovery Support for DataFabric Manager Data Using SnapDrive
256 | OnCommand Unified Manager Operations Manager Administration Guide

Troubleshooting in Operations ManagerLearn about the common issues with the DataFabric Manager server, how to troubleshoot thoseproblems, and how to get technical assistance from your service provider.
You can contact technical support, if you cannot troubleshoot or resolve those problems.
AutoSupport in the DataFabric Manager serverYou can use the AutoSupport feature of the DataFabric Manager server to send messages to technicalsupport.
When you install or upgrade to DataFabric Manager server 3.3 or later, the scheduler serviceautomatically enables AutoSupport after the first 24 hours of operation, if you have not disabled thefeature. The DataFabric Manager server then starts to monitor the system’s operations and logs amessage that AutoSupport was enabled.
AutoSupport sends messages to technical support over secure HTTPS (by default), HTTP, or SMTP.
Note: AutoSupport in the DataFabric Manager server does not support IPv6 addressing.
Reasons for using AutoSupportWith the help of the AutoSupport feature in the DataFabric Manager server, you can detect potentialproblems and get quick help.
The AutoSupport feature sends messages to the technical support for the following reasons:
• Scripts have been programmed to automatically look for particular data in AutoSupport weeklyreports that might indicate a potential problem.
• Technical support helps you to solve problems that AutoSupport detects.A range of support might be provided, including automated parts replacement, e-mail contact, andcontact by a technical support engineer, depending on the type of problem. For example, if amessage is received that a disk failure occurred on your system, a replacement disk isautomatically sent to you.
Types of AutoSupport messages in the DataFabric Manager serverAutoSupport tracks events and sends messages.
AutoSupport generates the following types of messages:
Event message A message that AutoSupport sends to recipients when an event tracked byAutoSupport occurs. The message contains information to help you diagnose andtroubleshoot the problem.
257

Weekly report A weekly report is a general status message that AutoSupport sends automaticallyeach week to recipients you have identified.
Note: If you are using a DataFabric Manager server demonstration license, the DataFabricManager server does not send AutoSupport messages.
Protection of private data by using AutoSupportYou can ensure that private data, such as IP addresses and user names, are not included in theAutoSupport message.
Complete AutoSupport messages are required for normal technical support. Minimal AutoSupportmessages omit sections and values that might be considered sensitive information, but greatly affectthe level of support you can receive.
If you do not want to include private data, such as IP addresses, host names, and user names, set theAutosupport Content global option to minimal.
Configuring AutoSupportYou can configure AutoSupport by using Operations Manager to monitor the health of storagesystems.
Steps
1. Click Setup > Options > AutoSupport.
2. From the AutoSupport Settings page, identify the administrator to be designated as the sender ofthe notification.
3. Specify the type of AutoSupport content that the messages should contain.
Note: If you change the setting from "complete" to "minimal," any complete AutoSupportmessage that is not sent is cleared from the outbound message spool and notification of this isdisplayed on the console.
4. Select Yes to enable the inclusion of logs with the AutoSupport notification.
5. Specify the type of delivery (HTTP, HTTPS, or SMTP) for AutoSupport notification to technicalsupport.
6. Enter the number of times the system should resend the AutoSupport notification, if previousattempts have failed.
7. Enter the time the system should wait before resending a failed AutoSupport notification.
8. (7-Mode environments only) Select Include to include the Performance Advisor AutoSupportdata along with the DataFabric Manager server AutoSupport data.
9. Select Include to include the N series Management Console provisioning capability AutoSupportdata along with the DataFabric Manager server AutoSupport data.
10. Click Update.
258 | OnCommand Unified Manager Operations Manager Administration Guide

DataFabric Manager server logsThe DataFabric Manager server creates logs, which you can use to troubleshoot issues such asstorage system discovery not working, CLI commands failing for unexpected reasons, and events notgenerating as expected.
Access to the DataFabric Manager server logsYou can access the DataFabric Manager server logs through Operations Manager or through the CLI.
You can access the DataFabric Manager server logs through the Diagnostics page. To access thispage, you must use the following URL:
http://mgmt_station:8080/dfm/diag
mgmt_station is the name or IP address of the workstation on which the DataFabric Managerserver is installed.
You must scroll down to the Logs section to find the available DataFabric Manager server logs.
You can also access the DataFabric Manager server logs through the CLI by using differentdirectories, depending on whether you are using a Windows or a UNIX workstation:
• On a Windows workstation, you must enter installation_directory\dfm\log.• On a UNIX workstation, you must enter installation_directory/log.
Accessing the logs through the DataFabric Manager server CLIYou can access the DataFabric Manager server logs using the CLI.
On a Windows workstation, you can find the DataFabric Manager server logs in the followingdirectory: installation_directory\dfm\log.
On a UNIX workstation, you can find the DataFabric Manager server logs in the following directory:installation_directory/log.
Troubleshooting in Operations Manager | 259

Apache and Sybase log rotation in the DataFabric Manager serverThe DataFabric Manager server automatically rotates Apache and Sybase logs. Apache log files arerotated when they are 3,000 KB or larger. Sybase logs are rotated when they are 10,000 KB or larger.
Common DataFabric Manager server problemsYou can resolve some of the common problems that you might encounter when using the DataFabricManager server.
Communication issues between the DataFabric Manager server and routersCommunication between the DataFabric Manager server and routers fails due to problems such as amismatch of SNMP community strings, SNMP disabled on the router, and so on.
The DataFabric Manager server relies on routers to discover networks other than the network towhich it is attached. If the DataFabric Manager server fails to communicate with a router, it cannotdiscover other networks attached to that router. These are some typical reasons DataFabric Managerserver fails to communicate with routers:
• The SNMP community strings do not match.• SNMP is disabled on the router.• The router is beyond the maximum number of hops set in the Network Discovery Limit option.
E-mail alerts not working in the DataFabric Manager serverIf e-mail alerts do not work, you can verify the e-mail address in the log file.
If an alarm does not send an e-mail to the expected e-mail address, use the log files generated by theDataFabric Manager server to help troubleshoot the problem.
• Look in alert.log to see if the DataFabric Manager server attempted to send an e-mail to thataddress.
• Look in dfmeventd.log to see if errors were reported.
Related concepts
DataFabric Manager server logs on page 259
How discovery issues are resolvedYou can use Diagnose Connectivity tool to troubleshoot discovery problems.
The DataFabric Manager server provides a Diagnose Connectivity tool that automates frequentlyused steps of the troubleshooting process for connectivity issues. Use this tool when you want totroubleshoot discovery problems.
260 | OnCommand Unified Manager Operations Manager Administration Guide

This tool queries the DataFabric Manager server database about a selected storage system, runsconnectivity tests, and displays information and test outcomes. The sequence of steps depends onwhether the selected storage system is managed or unmanaged. A managed storage system is one thatis in the DataFabric Manager server database. An unmanaged storage system is one that is not in theDataFabric Manager server database.
Use of the Diagnose Connectivity tool for a managed storage systemYou can collect information about your managed storage system by using the Diagnose Connectivitytool.
The Diagnose Connectivity tool queries the database and displays a summary of information aboutthe storage system:
• The name, DataFabric Manager server object ID, model, system ID, and OS version• Whether the storage system is up, according to the DataFabric Manager server• Results of the SNMP, ping, SSH, RLM, XML, RSH, and HTTP port tests.
Use of the Diagnose Connectivity tool for an unmanaged storage systemThe Diagnose Connectivity tool runs the following tests:
• Determines if the storage system IP address falls within the range of networks discovered by theDataFabric Manager server
• Sends an SNMP GET request to determine if the DataFabric Manager server can use SNMP tocommunicate with the storage system
• If it is a supported storage system, shows sysName, sysObjectID, and productID• Uses the ping utility to contact the IP address of the storage system and tests for connectivity• If it is a supported storage system, it tests the following:
• The RSH connection that uses the user name and password stored in the DataFabric Managerserver for the storage system
• The HTTP port
Note: For unmanaged storage systems, you must run the Diagnose Connectivity tool from thecommand line.
Where to find the Diagnose Connectivity tool in Operations ManagerYou can use the Diagnose Connectivity tool for both managed storage systems, and clusters.
You can find the Diagnose Connectivity tool under Storage Controller Tools or Cluster Tools list inthe left pane on a Details page. The Diagnose Connectivity tool is available only for managed storagesystems. To diagnose connectivity on unmanaged storage systems, use one of the following methods:
• From the CLI, you should run the dfm host diag command.• From Operations Manager, try to add the storage system. If the operation fails, an error message
is displayed with a link labeled Click here to troubleshoot. You must click this link to run theDiagnose Connectivity tool.
Troubleshooting in Operations Manager | 261

Reasons why the DataFabric Manager server might not discover yournetwork
The DataFabric Manager server might not discover your network if it fails to communicate with therouter.
The DataFabric Manager server might not discover your network for the following reasons:
• The SNMP community string set in the DataFabric Manager server does not match thecommunity string required by the router, switch, and storage system.
• The DataFabric Manager server fails to communicate with a router, and it cannot discover othernetworks that are attached to that router.
• You changed the IP address of the router for the network.
Troubleshooting network discovery issuesYou can troubleshoot network discovery issues, such as the DataFabric Manager server notdiscovering specific networks, using Operations Manager.
Steps
1. Ensure that the Network Discovery Enabled option on the Options page is set to Yes.
2. Ensure that the router is within the maximum number of hops set in the Network DiscoveryLimit option.
3. From the command line, run the Diagnose Connectivity tool against the IP address of the routerof the network to determine if the DataFabric Manager server can communicate with the routerthrough SNMP.
If you changed the IP address for the router, you must change the primary IP address stored in theDataFabric Manager server on the Edit Settings page. You can also modify the primary IPaddress by entering the following CLI command:
dfm host set host-id hostPrimaryAddress=ip-address
4. Determine whether an SNMP community string other than the default (public) is required for thenetwork device to which the undiscovered network is attached.
To set an SNMP community string in the DataFabric Manager server, click the Options link (inthe Banner area), find Discovery Options, and then click the edit link beside NetworkCredentials. On the Network Credentials page, click the edit link at the right of the SNMPCommunity whose string you want to set.
5. If Steps 1 through 3 are not successful, add the network manually by using the Networks ToDiscover option on the Options page under Discovery Options.
262 | OnCommand Unified Manager Operations Manager Administration Guide

Troubleshooting appliance discovery issues withOperations Manager
If the DataFabric Manager server does not discover a storage system, you can troubleshoot usingOperations Manager.
Steps
1. Ensure that the Host Discovery Enabled option on the Options page is set to Enabled.
2. Click the edit link of the Networks to Discover option to check whether the network towhich this appliance is attached has been discovered.
If the network to which this storage system is attached has not been discovered, follow thetroubleshooting guidelines.
3. Determine whether an SNMP community string other than the default (public) is required for thenetwork device to which the undiscovered network is attached.
To set an SNMP community string in the DataFabric Manager server, perform the followingsteps:
a) Click the Options link (in the Banner area).b) Find discovery Options.c) Click the edit link beside Network Credentials.d) On the Network Credentials page, click the edit link at the right of the SNMP Community
whose string you want to set.
4. If Steps 1 through 3 are not successful, add the network manually by using the Networks toDiscover option on the Options page under Discovery Options.
How configuration push errors are resolvedYou can troubleshoot configuration push errors by analyzing logs created by the DataFabric Managerserver.
The DataFabric Manager server logs the reason for the failure in the job's report, if one or more pushjobs fail. You can access the job report by clicking the job ID in the Job ID column of the Status ofConfiguration Jobs option.
The following failure conditions are documented by the DataFabric Manager server:
• An attempt to push a configuration for a particular group was disallowed because the groupalready had a pending configuration push job. To fix the error, you must cancel the pending joband then re-push the new job.
• The storage system was offline. When a storage system is offline, the DataFabric Manager servercontinues to try to contact the storage system until you manually cancel the push.
Troubleshooting in Operations Manager | 263

• The DataFabric Manager server could not authenticate to the system. You can correct thisproblem by setting the correct login and password.
• The storage system downloaded the configuration, but did not update its configuration because itfound the configuration to be invalid.
Issues related to SAN eventsYou can use Operations Manager to troubleshoot SAN events by resolving issues related to FCswitch port, HBA port, and LUNs.
Offline LUNsA LUN can be offline if it is taken over by an administrator or there is a conflict between the serialnumbers of two LUNs.
Causes:
A LUN goes offline typically in one of two situations:
• An administrator, to perform maintenance or to apply changes to the LUN, such as to modify itssize might have changed the status.
• The LUN has a serial number that conflicts with that of another LUN.
Corrective action:
• If an administrator did not change the LUN status, bring the LUN online from the storage systemconsole.
• Check for a conflicting serial number and resolve the issue.
Snapshot copy of LUN not possibleIf you cannot take a Snapshot copy of a LUN, you can expand the size of the volume.
Cause:
A Snapshot copy for the volume that contains the LUN cannot be taken because the amount of freespace on this volume is less than the used and reserved space.
Corrective action:
Expand the size of the volume.
High traffic in HBA PortHigh traffic in HBA Port occurs if the DataFabric Manager server threshold HBA Port Too Busyexceeds the permitted value.
Cause:
The DataFabric Manager server threshold HBA Port Too Busy has been exceeded.
Corrective action:
264 | OnCommand Unified Manager Operations Manager Administration Guide
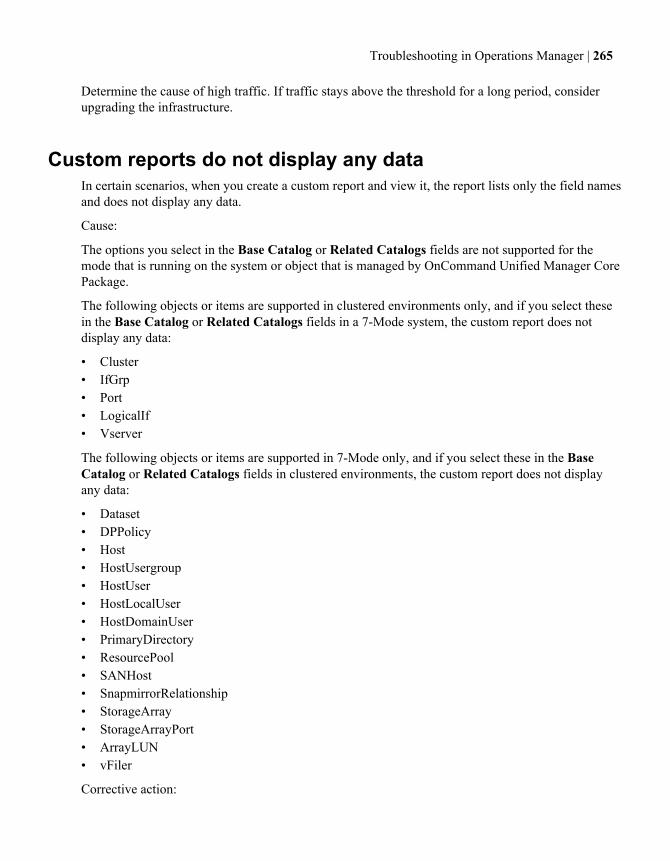
Determine the cause of high traffic. If traffic stays above the threshold for a long period, considerupgrading the infrastructure.
Custom reports do not display any dataIn certain scenarios, when you create a custom report and view it, the report lists only the field namesand does not display any data.
Cause:
The options you select in the Base Catalog or Related Catalogs fields are not supported for themode that is running on the system or object that is managed by OnCommand Unified Manager CorePackage.
The following objects or items are supported in clustered environments only, and if you select thesein the Base Catalog or Related Catalogs fields in a 7-Mode system, the custom report does notdisplay any data:
• Cluster• IfGrp• Port• LogicalIf• Vserver
The following objects or items are supported in 7-Mode only, and if you select these in the BaseCatalog or Related Catalogs fields in clustered environments, the custom report does not displayany data:
• Dataset• DPPolicy• Host• HostUsergroup• HostUser• HostLocalUser• HostDomainUser• PrimaryDirectory• ResourcePool• SANHost• SnapmirrorRelationship• StorageArray• StorageArrayPort• ArrayLUN• vFiler
Corrective action:
Troubleshooting in Operations Manager | 265

Do not select objects or items for the Base Catalog and Related Catalogs fields that are notsupported for the mode of the object or item you are currently managing.
Import and export of configuration filesYou can export your configuration files for archiving to the DataFabric Manager server or to yourlocal computer. If you want to restore the configuration files, you can import the archivedconfiguration files.
The DataFabric Manager server enables you to save all your configuration files as a text file. Thishelps you to revert to a working set of configuration files, if you need to undo future configurationchanges. After creating the file, you should archive it in a different location for safekeeping. You canuse the Export Configuration Files option on the Configurations page to save your configuration filesto the DataFabric Manager server, or to your local computer.
If you need to restore the configuration files, you can import the archived file that you previouslyexported. You can also edit the configuration file with a text editor, to make any required changes,and then import it.
How inconsistent configuration states are fixedTo fix an inconsistent configuration state, re-push the configuration files to the required storagesystems.
The DataFabric Manager server routinely monitors the storage systems in a configuration resourcegroup to determine if their settings are inconsistent with the group’s configuration files. To fix theinconsistent configuration state, re-push the configuration files to any storage systems that requireupdating.
Configuration modification events can also help you maintain configuration consistency by alertingyou to configuration changes.
Related concepts
Management of storage system configuration files (7-Mode environments only) on page 230
Data ONTAP issues impacting protection on vFiler units (7-Mode environments only)
You might encounter issues when creating SnapMirror and SnapVault relationships using vFilerunits in Data ONTAP 7.2 and later.
Data ONTAP versions earlier than 7.2 do not support SnapMirror and SnapVault commands onvFiler units. To create SnapMirror and SnapVault relationships, you must use the hosting storage
266 | OnCommand Unified Manager Operations Manager Administration Guide

system. The DataFabric Manager server uses the hosting storage system to create SnapMirror andSnapVault relationships.
For Data ONTAP 7.2 and later, SnapMirror and SnapVault relationships can be created using vFilerunits. However, the DataFabric Manager server uses the hosting storage system to create, monitor,and manage these relationships. As a result, you might encounter the following issues:
• Issue:If the snapvault.access and snapmirror.access options on the source storage systemallow access only to the destination vFiler unit, relationship creation, scheduled backups, on-demand backups, SnapMirror updates, and SnapMirror resynchronization from the DataFabricManager server fails. The DataFabric Manager server displays the following error message:Request denied by the source storage system. Check access permissions on
the source.
Workaround:To allow access to the destination hosting storage system, set the snapmirror.access andsnapvault.access options on the source system.
• Issue:If the ndmpd.preferred_interfaces option is not set on the source hosting storage system,the backups from the DataFabric Manager server might not use the correct network interface.Workaround:Set the ndmpd.preferred_interfaces option on the source hosting storage system.
• Issue:The backups and SnapMirror updates from the DataFabric Manager server fail with the errormessage: Source unknown. This issue occurs when both of the following conditions occur:
• A relationship between two vFiler units is imported into the DataFabric Manager server byautodiscovery or added manually.
• The destination hosting storage system is not able to contact the IP address of the sourcevFiler unit.
Workaround:Ensure that the host name or IP address of the source system that is used to create relationshipscan be reached from the destination hosting storage system.
Troubleshooting in Operations Manager | 267

Report fields and performance counters (7-Modeenvironments only)
Report fields and performance counters for filer catalogs (7-Mode environments only)
The DataFabric Manager server creates reports for filer catalogs.
The following table lists and describes the fields in the filer catalog and lists the performancecounters:
Field Name/description Performance counter
Filer.TotalOpsperSec Storage System Total Ops/Sec system:total_ops
Filer.CIFSOps Storage System CIFS Ops/Sec system:cifs_ops
Filer.NFSOps Storage System NFS Ops/Sec system:nfs_ops
Filer.HTTPOps Storage System HTTP Ops/Sec system:http_ops
Filer.iSCSIOps Storage System iSCSI Ops/Sec system:iscsi_ops
Filer.FCPOps Storage System FCP Ops/Sec system:fcp_ops
Filer.NFSv3ReadOps Storage System NFSv3 ReadOps/Sec
nfsv3:nfsv3_read_ops
Filer.NFSv3WriteOps Storage System NFSv3 WriteOps/Sec
nfsv3:nfsv3_write_ops
Filer.NFSv4ReadOps Storage System NFSv4 ReadOps/Sec
nfsv4:nfsv4_read_ops
Filer.NFSv4WriteOps Storage System NFSv4 WriteOps/Sec
nfsv4:nfsv4_write_ops
Filer.NFSv3Avglatency Storage System NFSv3 AvgLatency (millisec)
nfsv3:nfsv3_avg_op _latency
Filer.NFS4Avglatency Storage System NFSv4 AvgLatency (millisec)
nfsv4:nfsv4_avg_op _latency
Filer.CPUBusy Storage System CPU Busy (%) system:cpu_busy
Filer.iSCSIReadOps Storage System iSCSI ReadOps/Sec
iscsi:iscsi_read_ops
268 | OnCommand Unified Manager Operations Manager Administration Guide

Field Name/description Performance counter
Filer.iSCSIWriteOps Storage System iSCSI WriteOperations
iscsi:iscsi_write_ops
Filer.CIFSLatency Storage System CIFS Latency(millisec)
cifs:cifs_latency
Filer.NFSReadLatency Storage System NFS ReadLatency (millisec)
nfsv3:nfsv3_read _latency
Filer.NFSWriteLatency Storage System NFS WriteLatency (millisec)
nfsv3:nfsv3_write _latency
Filer.iSCSIRead Latency Storage System iSCSI ReadLatency (millisec)
iscsi:iscsi_read_latency
Filer.iSCSIWrite Latency Storage System iSCSI WriteLatency (millisec)
iscsi:iscsi_write _latency
Filer.FCPReadLatency Storage System FCP ReadLatency (millisec)
fcp:fcp_read_latency
Filer.FCPWriteLatency Storage System FCP WriteLatency (millisec)
fcp:fcp_write_latency
Filer.NASThroughput Storage System NASThroughput (KB/Sec)
system:nas_throughput
Filer.SANThroughput Storage System SANThroughput (KB/Sec)
system:san_throughput
Filer.DiskThroughput Storage System DiskThroughput (KB/Sec)
system:disk_ throughput
Filer.NetThroughput Storage System NetworkThroughput (MB/Sec)
system:load_total _mbps
Filer.LoadInbound Mbps Storage System Total DataReceived (MB/Sec)
system:load_inbound_ mbps
Filer.LoadOutbound Mbps Storage System Total Data Sent(MB/Sec)
system:load_outbound_ mbps
Filer.NetDataSent Storage System Network DataSent (KB/Sec)
system:net_data_sent
Filer.NetDataRecv Storage System Network DataReceive (KB/Sec)
system:net_data_recv
Filer.LoadReadBytes Ratio Storage System Ratio of diskdata read and load outbound
system:load_read_bytes _ratio
Report fields and performance counters (7-Mode environments only) | 269

Field Name/description Performance counter
Filer.LoadWriteBytes Ratio Storage System Ratio of diskdata write and load inbound
system:load_write_byte s_ratio
Filer.DiskDataRead Storage System Disk Data Read(KB/Sec)
system:disk_data_read
Filer.DiskDataWritten Storage System Disk DataWritten (KB/Sec)
system:disk_data_ written
Filer.FCPWriteData Storage System FCP WriteData (B/Sec)
fcp:fcp_write_data
Filer.FCPReadData Storage System FCP Read Data(B/Sec)
fcp:fcp_read_data
Filer.iSCSIWriteData Storage System iSCSI WriteData (B/Sec)
iscsi:iscsi_write_data
Filer.iSCSIReadData Storage System iSCSI ReadData (B/Sec)
iscsi:iscsi_read_data
Filer.ProcessorBusy Storage System Processor Busy(%)
system:avg_processor_ busy
Filer.NFSLatency Storage System NFS Latency(millisec)
nfsv3:nfsv3_avg_op _latency
Filer.PerfViolation Count Storage System Perf ThresholdViolation Count
Not applicable
Filer.PerfViolation Period Storage System Perf ThresholdViolation Period (Sec)
Not applicable
Report fields and performance counters for vFiler catalogs(7-Mode environments only)
The DataFabric Manager server creates reports for vFiler catalogs.
The following table lists and describes the fields of the vFiler catalog and lists the performancecounters:
Field Name/description Performance counter
vFiler.TotalOps vFiler Total Ops/Sec vfiler:vfiler_total_ops
vFiler.ReadOps vFiler Read Ops/Sec vfiler:vfiler_read_ops
vFiler.WriteOps vFiler Write Ops/Sec vfiler:vfiler_write_ops
270 | OnCommand Unified Manager Operations Manager Administration Guide

Field Name/description Performance counter
vFiler.MiscOps vFiler Miscellaneous Ops/Sec vfiler:vfiler_misc_ops
vFiler.NetThroughput vFiler Network Throughput(KB/Sec)
vfiler:vfiler_nw_ throughput
vFiler.ReadBytes vFiler Number of Bytes Read(KB/Sec)
vfiler:vfiler_read_bytes
vFiler.WriteBytes vFiler Number of Bytes Write(KB/Sec)
vfiler:vfiler_write_ bytes
vFiler.NetDataRecv vFiler Network Data Received(KB/Sec)
vfiler:vfiler_net_data_ recv
vFiler.NetDataSent vFiler Network Data Sent (KB/Sec)
vfiler:vfiler_net_data_ sent
vFiler.DataTransferred vFiler Total Data Transferred(KB/Sec)
vfiler:vfiler_data_ transferred
vFiler.PerfViolation Count vFiler Perf Threshold ViolationCount
Not applicable
vFiler.PerfViolation Period vFiler Perf Threshold ViolationPeriod (Sec)
Not applicable
Report fields and performance counters for volume catalogs(7-Mode environments only)
The DataFabric Manager server creates reports for volume catalogs.
The following table lists and describes the fields of the volume catalog and lists the performancecounters:
Field Name/description Performance counter
Volume.TotalOps Volume Total Ops/Sec volume:total_ops
Volume.CIFSOps Volume CIFS Ops/Sec volume:cifs_ops
Volume.NFSOps Volume NFS Ops/Sec volume:nfs_ops
Volume.SANOps Volume SAN Ops/Sec volume:total_san_ops
Volume.SANReadOps Volume SAN Read Ops/Sec volume:san_read_ops
Volume.SANWriteOps Volume SAN Write Ops/Sec volume:san_write_ops
Report fields and performance counters (7-Mode environments only) | 271

Field Name/description Performance counter
Volume.SANOtherOps Volume SAN Other Ops/Sec volume:san_other_ops
Volume.ReadOps Volume Read Ops/Sec volume:read_ops
Volume.WriteOps Volume Write Ops/Sec volume:write_ops
Volume.OtherOps Volume Other Ops/Sec volume:other_ops
Volume.NFSReadOps Volume NFS Read Ops/Sec volume:nfs_read_ops
Volume.NFSWriteOps Volume NFS Write Ops/Sec volume:nfs_write_ops
Volume.NFSOtherOps Volume NFS Other Ops/Sec volume:nfs_other_ops
Volume.CIFSReadOps Volume CIFS Read Ops/Sec volume:cifs_read_ops
Volume.CIFSWriteOps Volume CIFS Write Ops/Sec volume:cifs_write_ops
Volume.CIFSOtherOps Volume CIFS Other Ops/Sec volume:cifs_other_ops
Volume.FlexCache ReadOps Volume FlexCache ReadOps/Sec
volume:flexcache_read _ops
Volume.FlexCache WriteOps Volume FlexCache WriteOps/Sec
volume:flexcache_ write_ops
Volume.FlexCache OtherOps Volume FlexCache OtherOps/Sec
volume:flexcache_ other_ops
Volume.Latency Volume Latency (millisec) volume:avg_latency
Volume.CIFSLatency Volume CIFS Latency(millisec)
volume:cifs_latency
Volume.NFSLatency Volume NFS Latency (millisec) volume:nfs_latency
Volume.SANLatency Volume SAN Latency(millisec)
volume:san_latency
Volume.ReadLatency Volume Read Latency(millisec)
volume:read_latency
Volume.WriteLatency Volume Write Latency(millisec)
volume:write_latency
Volume.OtherLatency Volume Other Latency(millisec)
volume:other_latency
Volume.CIFSRead Latency Volume CIFS Read Latency(millisec)
volume:cifs_read_ latency
272 | OnCommand Unified Manager Operations Manager Administration Guide

Field Name/description Performance counter
Volume.CIFSWrite Latency Volume CIFS Write Latency(millisec)
volume:cifs_write_ latency
Volume.CIFSOther Latency Volume CIFS Other Latency volume:cifs_other_ latency
Volume.SANRead Latency Volume SAN Read Latency(millisec)
volume:san_read_ latency
Volume.SANWrite Latency Volume SAN Write Latency(millisec)
volume:san_write_ latency
Volume.SANOther Latency Volume SAN Other Latency(millisec)
volume:san_other_ latency
Volume.NFSRead Latency Volume NFS Read Latency(millisec)
volume:nfs_read_ latency
Volume.NFSWrite Latency Volume NFS Write Latency volume:nfs_write_ latency
Volume.NFSOther Latency Volume NFS Other Latency(millisec)
volume:nfs_other_ latency
Volume.Data Throughput Volume Throughput (KB/Sec) volume:throughput
Volume.PerfViolation Count Volume Perf ThresholdViolation Count
Not applicable
Volume.PerfViolation Period Volume Perf ThresholdViolation Period (Sec)
Not applicable
Report fields and performance counters for qtree catalogs(7-Mode environments only)
The DataFabric Manager server creates reports for qtree catalogs.
The following table lists and describes the fields of the qtree catalog and lists the performancecounters:
Field Name/description Performance counter
Qtree.CIFSOps Qtree CIFS Ops/Sec qtree:cifs_ops
Qtree.NFSOps Qtree NFS Ops/Sec qtree:nfs_ops
Qtree.InternalOps Qtree Internal Ops/Sec qtree:internal_ops
Qtree.PerfViolation Count Qtree Perf Threshold ViolationCount
Not applicable
Report fields and performance counters (7-Mode environments only) | 273
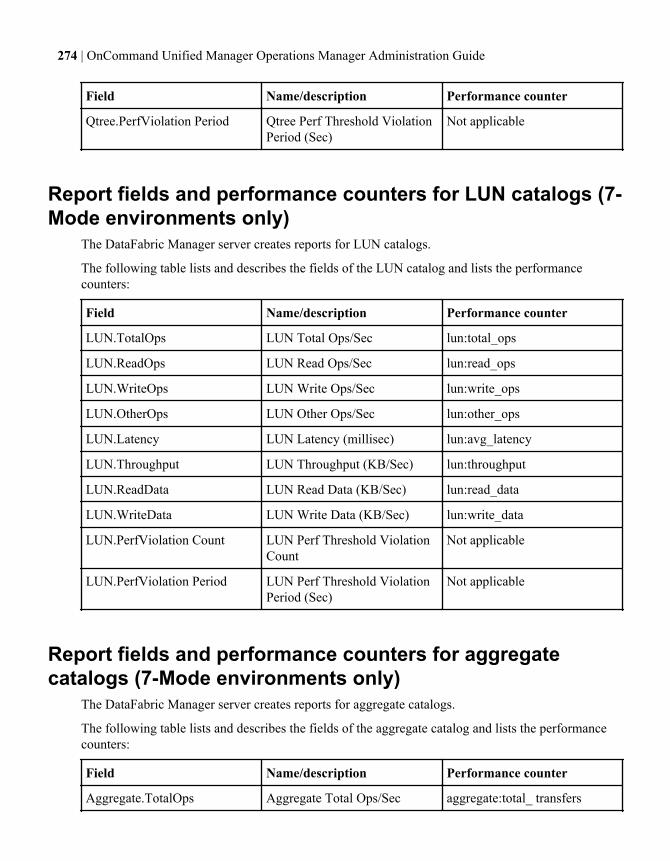
Field Name/description Performance counter
Qtree.PerfViolation Period Qtree Perf Threshold ViolationPeriod (Sec)
Not applicable
Report fields and performance counters for LUN catalogs (7-Mode environments only)
The DataFabric Manager server creates reports for LUN catalogs.
The following table lists and describes the fields of the LUN catalog and lists the performancecounters:
Field Name/description Performance counter
LUN.TotalOps LUN Total Ops/Sec lun:total_ops
LUN.ReadOps LUN Read Ops/Sec lun:read_ops
LUN.WriteOps LUN Write Ops/Sec lun:write_ops
LUN.OtherOps LUN Other Ops/Sec lun:other_ops
LUN.Latency LUN Latency (millisec) lun:avg_latency
LUN.Throughput LUN Throughput (KB/Sec) lun:throughput
LUN.ReadData LUN Read Data (KB/Sec) lun:read_data
LUN.WriteData LUN Write Data (KB/Sec) lun:write_data
LUN.PerfViolation Count LUN Perf Threshold ViolationCount
Not applicable
LUN.PerfViolation Period LUN Perf Threshold ViolationPeriod (Sec)
Not applicable
Report fields and performance counters for aggregatecatalogs (7-Mode environments only)
The DataFabric Manager server creates reports for aggregate catalogs.
The following table lists and describes the fields of the aggregate catalog and lists the performancecounters:
Field Name/description Performance counter
Aggregate.TotalOps Aggregate Total Ops/Sec aggregate:total_ transfers
274 | OnCommand Unified Manager Operations Manager Administration Guide
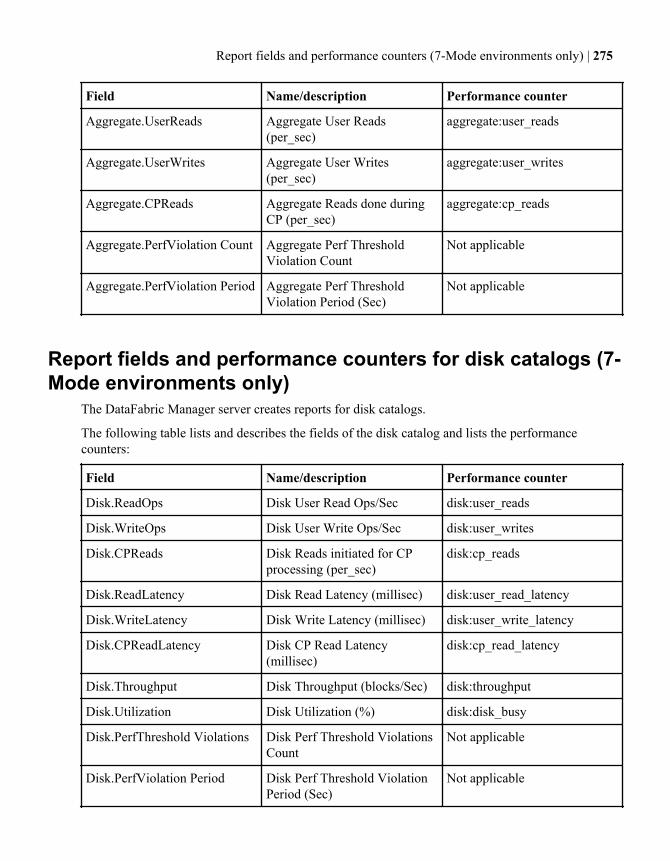
Field Name/description Performance counter
Aggregate.UserReads Aggregate User Reads(per_sec)
aggregate:user_reads
Aggregate.UserWrites Aggregate User Writes(per_sec)
aggregate:user_writes
Aggregate.CPReads Aggregate Reads done duringCP (per_sec)
aggregate:cp_reads
Aggregate.PerfViolation Count Aggregate Perf ThresholdViolation Count
Not applicable
Aggregate.PerfViolation Period Aggregate Perf ThresholdViolation Period (Sec)
Not applicable
Report fields and performance counters for disk catalogs (7-Mode environments only)
The DataFabric Manager server creates reports for disk catalogs.
The following table lists and describes the fields of the disk catalog and lists the performancecounters:
Field Name/description Performance counter
Disk.ReadOps Disk User Read Ops/Sec disk:user_reads
Disk.WriteOps Disk User Write Ops/Sec disk:user_writes
Disk.CPReads Disk Reads initiated for CPprocessing (per_sec)
disk:cp_reads
Disk.ReadLatency Disk Read Latency (millisec) disk:user_read_latency
Disk.WriteLatency Disk Write Latency (millisec) disk:user_write_latency
Disk.CPReadLatency Disk CP Read Latency(millisec)
disk:cp_read_latency
Disk.Throughput Disk Throughput (blocks/Sec) disk:throughput
Disk.Utilization Disk Utilization (%) disk:disk_busy
Disk.PerfThreshold Violations Disk Perf Threshold ViolationsCount
Not applicable
Disk.PerfViolation Period Disk Perf Threshold ViolationPeriod (Sec)
Not applicable
Report fields and performance counters (7-Mode environments only) | 275

Protocols and port numbers used by theDataFabric Manager server
The DataFabric Manager server uses various networking protocols and port numbers to communicatewith storage systems, host agents (7-Mode environments only), and Open Systems SnapVault agents(7-Mode environments only).
DataFabric Manager server communicationYou might have to enable both HTTP and HTTPS transports if multiple administrators are accessingthe workstation from different locations. Firewalls, non-trusted environments, or other circumstancesmight require a combination of HTTP and HTTPS transports.
Note: Reconfiguring these options through Operations Manager results in a message instructingyou to restart the HTTP service from the CLI. You should use the dfm service start httpcommand to restart the HTTP service.
DataFabric Manager server access to storage systemsThe DataFabric Manager server uses a set of protocols and port numbers to access the storagesystems.
Protocol UDP port TCP port
HTTP N/A 80
HTTPS N/A 443
RSH N/A 514
SSH N/A 22
Telnet N/A 23
SNMP 161 N/A
276 | OnCommand Unified Manager Operations Manager Administration Guide
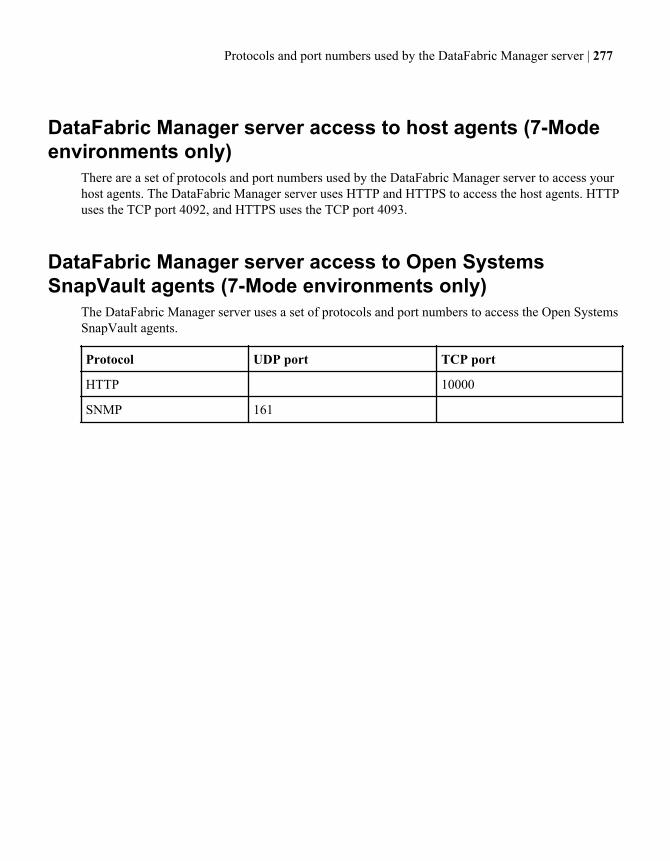
DataFabric Manager server access to host agents (7-Modeenvironments only)
There are a set of protocols and port numbers used by the DataFabric Manager server to access yourhost agents. The DataFabric Manager server uses HTTP and HTTPS to access the host agents. HTTPuses the TCP port 4092, and HTTPS uses the TCP port 4093.
DataFabric Manager server access to Open SystemsSnapVault agents (7-Mode environments only)
The DataFabric Manager server uses a set of protocols and port numbers to access the Open SystemsSnapVault agents.
Protocol UDP port TCP port
HTTP 10000
SNMP 161
Protocols and port numbers used by the DataFabric Manager server | 277

SAN managementYou can use the DataFabric Manager server to monitor and manage components—such as logicalunit numbers (LUNs), Fibre Channel (FC) switches, and Windows and UNIX SAN hosts—of yourstorage area networks (SANs).
The SANs are storage networks that have been installed in compliance with the "SAN setupguidelines" by IBM. For information about setting up a SAN, see the Data ONTAP SANAdministration Guide for 7-Mode.
Note: DataFabric Manager server customers should check with their sales representative regardingother SAN management solutions.
Related information
The IBM N series support website: www.ibm.com/storage/support/nseries
Discovery of SAN hosts by the DataFabric Manager server(7-Mode environments only)
The DataFabric Manager server discovers SAN hosts with the DataFabric Manager Host Agentsoftware installed on each SAN host.
The DataFabric Manager server can automatically discover SAN hosts; however, it does not useSNMP to poll for new SAN hosts. Instead, the DataFabric Manager Host Agent software discovers,monitors, and manages SANs on SAN hosts. You must install the DataFabric Manager Host Agentsoftware on each SAN host that you want to monitor and manage with the DataFabric Managerserver.
The DataFabric Manager server communicates with the DataFabric Manager Host Agent softwareusing HTTP or HTTPS. If both the DataFabric Manager server and the DataFabric Manager HostAgent software are configured to use HTTP, port 4092 is used for communication; however, ifHTTPS is configured on both, port 4093 is used.
You can specify the protocol to use for communication in the DataFabric Manager server and whenyou install the DataFabric Manager Host Agent software on your SAN host. By default, both theDataFabric Manager Host Agent and the DataFabric Manager server are configured to use HTTP.
Note: If you choose to use HTTPS for communication between the DataFabric Manager serverand a SAN host, you must ensure that both the DataFabric Manager server and the DataFabricManager Host Agent software on the SAN host are configured to use HTTPS. If the Host Agent isconfigured to use HTTP and the DataFabric Manager server is configured to use HTTPS,communication between the SAN host and the DataFabric Manager server does not occur.Conversely, if the DataFabric Manager Host Agent software is configured to use HTTPS and the
278 | OnCommand Unified Manager Operations Manager Administration Guide

DataFabric Manager server is configured to use HTTP, communication between the two occurs,but HTTP is used for communication.
For more information about the DataFabric Manager Host Agent software, see the DataFabricManager Host Agent Installation and Administration Guide.
Related information
The IBM N series support website: www.ibm.com/storage/support/nseries
SAN management using the DataFabric Manager serverBy using the DataFabric Manager server, you can perform tasks such as viewing reports about LUNs,targets, and HBA ports. You can also group LUNs, storage systems in a SAN, FC switches, or SANhosts, and so on.
Prerequisites for SAN management with the DataFabric Manager serverDifferent prerequisites apply for SAN management with the DataFabric Manager server.
For the DataFabric Manager server
You must have the SAN Management license key installed on your DataFabric Manager server.
All SAN monitoring and management features, including LUN and FC switch monitoring, areavailable only if you have the SAN management license key installed.
If you do not have this license, you should contact your sales representative for information aboutpurchasing the license.
For IBM N series storage systems (targets)
The DataFabric Manager server does not report any data for your SAN if you do not have it set upaccording to the guidelines specified by IBM.
SAN deployments are supported on specific hardware platforms running Data ONTAP. Forinformation about the supported hardware platforms, see the Data ONTAP SAN AdministrationGuide for 7-Mode.
For FC switches
• To enable discovery of FC switches, the following settings must be enabled:
• discoverEnabled (available from the CLI only)• Host Discovery (Setup > Options > Edit Options: Discovery)• SAN Device Discovery (Setup > Options > Edit Options: Discovery)
SAN management | 279
• The DataFabric Manager server can discover and monitor only FC switches, specifically BrocadeSilkworm switches, configured in a SAN setup as specified in the SAN Configuration Guide(called Fibre Channel and iSCSI Configuration Guide in Data ONTAP 8.1 and earlier).
Note: For a list of supported Brocade switches, see the SAN Configuration Guide (called FibreChannel and iSCSI Configuration Guide in Data ONTAP 8.1 and earlier) at the N seriessupport website (accessed and navigated as described in Websites on page 17).
• All FC switches to be managed by the DataFabric Manager server must be connected to a TCP/IPnetwork either known to or discoverable by the DataFabric Manager server.The FC switches must be connected to the network through an Ethernet port and must have avalid IP address.
For SAN hosts (initiators)
• All SAN hosts to be managed by the DataFabric Manager server must be connected to a TCP/IPnetwork either known to or discoverable by the DataFabric Manager server.The SAN hosts must be connected to the network through an Ethernet port and must each have avalid IP address.
• Each SAN host must have the DataFabric Manager Host Agent software installed on it.The DataFabric Manager Host Agent software is required for discovering, monitoring, andmanaging SAN hosts. For more information about the Host Agent software, see the DataFabricManager Host Agent Installation and Administration Guide.
• The Windows SAN hosts must have the correct version of the SnapDrive software installed on it,for LUN management by using the DataFabric Manager server.To identify which SnapDrive version you must have installed, see the DataFabric Manager serversoftware download pages at www.ibm.com/storage/support/nseries/.
Note: LUN management on UNIX SAN hosts by using the DataFabric Manager server is notcurrently available.
Related information
The IBM N series support website: www.ibm.com/storage/support/nseries
List of tasks performed for SAN managementYou can perform different tasks for SAN management by using the DataFabric Manager server.
• View reports that provide information about all LUNs, targets, FC switches, SAN hosts, andHBA ports in a SAN.
• View details about a specific LUN, a target on a storage system, an FC switch, a SAN host, andan HBA port.
• Perform management functions such as configuring an FC switch, and creating, modifying, orexpanding a LUN.
280 | OnCommand Unified Manager Operations Manager Administration Guide
• Group LUNs, storage systems in a SAN, FC switches, or SAN hosts for efficient monitoring andmanagement.
• Change the monitoring intervals for LUNs, FC switches, and SAN hosts.• View SAN events and logs containing information related to LUN management and respond to
SAN events.• Configure the DataFabric Manager server to generate alarms to notify recipients of the SAN
events.
List of user interface locations to perform SAN management tasksYou can perform SAN management tasks in the Operations Manager Control Center UI.
UI locations to perform SAN management tasks:
SANs tab (ControlCenter > Home >Member Details)
To view reports about all or a group of SAN components (LUNs, FCtargets on a storage system, FC switches, and SAN hosts). You also usethis tab to perform the following tasks:
• Access the details about a specific SAN component.• Perform LUN and FC switch management functions.• Create groups of LUNs, FC switches, and SAN hosts.• Configure settings for SAN hosts such as the administration port, on
which the DataFabric Manager server should poll the SAN host. Youcan also configure the type of protocol (HTTP or HTTPS) theDataFabric Manager server should use to communicate with SANhosts.
Options link (Setup >Options)
To enable and disable the discovery of SAN components and change themonitoring intervals for FC switches, LUNs, and SAN hosts in theDataFabric Manager server database
Events tab (ControlCenter > Home >Group Status >Events)
To view and respond to SAN events
Alarms link (ControlCenter > Home >Group Status >Alarms)
To configure alarms for SAN events
SAN management | 281
Reports for monitoring SANsYou can view various reports about the SAN components that the DataFabric Manager servermanages, from the SANs tab.
Location of SAN reportsReports about the SAN components that the DataFabric Manager server manages are available on theSANs tab. You can view reports by selecting reports in the Report drop-down list. If you want toview a report about a specific group, you specify the group by clicking the group name in the leftpane of the DataFabric Manager server window.
You can view the following reports from the SANs page:
• LUNs, Comments• Fibre Channel Switches, All• Fibre Channel Switches, Deleted• Fibre Channel Switches, Comments• Fibre Channel Switches, Compact• Fibre Channel Switches, Down• Fibre Channel Switch Environmentals• Fibre Channel Switch Locations• Fibre Channel Switch Firmware• Fibre Channel Switches, Up• Fibre Channel Switches, Uptime• Fibre Channel Switch Ports• Fibre Channel Links, Physical• Fibre Channel Links, Logical• FCP Targets• HBA Ports, All• HBA Ports, FCP• HBA Ports, iSCSI• SAN Hosts, Comments• SAN Hosts, All• SAN Hosts, FCP• SAN Hosts, iSCSI• SAN Hosts, Deleted• SAN Hosts Traffic, FCP• SAN Host Cluster Groups• SAN Host LUNs, All• SAN Host LUNs, iSCSI SAN Host LUNs, FCP• LUNs, All
282 | OnCommand Unified Manager Operations Manager Administration Guide
• LUNs, Comments• LUNs, Deleted• LUNs, Unmapped• LUN Statistics• LUN Initiator Groups• Initiator Groups
The DataFabric Manager server managed SAN data in spreadsheet formatYou can put data from reports for SAN components that the DataFabric Manager server managesinto a spreadsheet format.
When you view a report, you can bring up the data in spreadsheet format by clicking the spreadsheeticon on the right side of the Report drop-down list.
You can use the data in the spreadsheet to create your own charts and graphs or to analyze the datastatistically.
Where to find information for specific SAN componentsYou can view information about SAN components from the Details page of a SAN component.
The Details page of a SAN component provides information specific to that component. Forexample, the FC Switch Details page provides the following details:
• Firmware version• Uptime• Status of each port on the switch
The LUN Details page provides the following details:
• The status and size of a LUN• Events associated with the LUN• All groups to which the LUN belongs
In addition, you can obtain graphs of information about the SAN components, access themanagement tools for these components, and view events associated with these components.
Where to view LUN details of SAN componentsYou can view LUN details of SAN components using the DataFabric Manager server.
You can access the LUN Details page for a LUN by clicking the path of the LUN in any of thereports.
Tasks performed from the LUN Details page for a SAN hostFrom the LUN Details page, you can diagnose connectivity, expand a LUN, destroy LUN, editsettings, and so on.
The Tools list on the LUN Details page enables you to select the following tasks:
SAN management | 283
• Diagnose Connectivity• Expand this LUN—Launches a wizard that helps you to expand the LUN.• Destroy this LUN—Launches a wizard that helps you to destroy the LUN.• Edit Settings• Refresh Monitoring Samples—Obtains current monitoring samples from the storage system on
which this LUN exists• FilerView—Launches FilerView, the Web-based UI of the storage system on which the LUN
exists.• Manage LUNs with FilerView—Launches FilerView and displays a page where you can manage
the LUN.• Run a Command—Runs a Data ONTAP command on the storage system on which this LUN
exists.
Note: You must setup the appropriate authentication to run commands on the storage system.
Information about FC target on a SAN hostYou can view FCP target details of a SAN host from the FCP Target Details page.
The FCP Target Details page contains the following information:
• Name of the FC switch and the port to which the target connects• Status of the target• Name of the storage system on which target is installed• Port state of the target. Port state can be one of the following:
• Startup• Uninitialized• Initializing Firmware• Link Not Connected• Waiting For Link Up• Online• Link Disconnected• Resetting• Offline• Offline By User System• Unknown
• Specifics about the target such as hardware version, firmware version, and speed of the target• FC topology of the target. Topology can be one of the following:
• Fabric• Point-To-Point• Loop• Unknown
• WWNN and WWPN of the target
284 | OnCommand Unified Manager Operations Manager Administration Guide

• Other FCP targets on the storage system on which the target is installed• Time of the last sample collected and the configured polling interval for the FCP target
Information about the FC switch on a SAN hostYou can view FCP switch details of a SAN host and the status of the switch. You also view eventsassociated with the switch, and the number of devices connected with the switch.
Access to the FC Switch Details pageYou can access FC Switch Details page from SAN monitoring reports.
You can access the FC Switch Details page for a switch by clicking the name of the switch in any ofthe reports for SAN monitoring.
Information about FC Switch on a SAN hostYou can view FC Switch details of a SAN host from the FC Switch Details page.
• Status of the switch• Firmware version installed on the switch• The length of time that the switch has been up since the last reboot• Contact information for the switch such as the administrator name and location of the switch• Events associated with the FC switch• FC switch port status-- A graphical layout of the switch ports, with the color of the switch port
that indicates the status of the port:
• Green—indicates that the port is online and working normally.• Yellow—indicates that the port is connected to a GBIC, but is not synchronized (No Sync).• Red—indicates that the port is offline or not working normally.• Black—indicates that there is no GBIC connected.
• Number of devices connected to the switch and a link to a report that lists those devices• The DataFabric Manager server groups to which the FC switch belongs• Time when the last data sample was collected and the configured polling interval for the switch• Graph of FC traffic per second on the switch.
You can view the traffic over a period of one day, one week, one month, one quarter (threemonths), or one year.
Tasks performed from the FC Switch Details page for a SAN hostYou can edit the FC Switch settings, refresh monitoring samples, run FabricSwitch, and run Telnetusing the FC Switch Details page.
You can use the Tools list on the FC Switch Details page to select the tasks to perform for the switchwhose Details page you are on. The tasks are as follows:
• Edit Settings—Displays the Edit FC Switch Settings page where you configure the login andpassword information in the DataFabric Manager server for the switch. The DataFabric Manager
SAN management | 285
server requires the login and password information to connect to a switch using the Telnetprogram.
• Refresh Monitoring Samples—Obtains current monitoring samples from the FC switch.• Invoke FabricWatch—Connects you to FabricWatch, the Web-based UI, of the Brocade switch.
You might want to connect to FabricWatch to manage and configure the switch.• Run Telnet—Connect to the CLI of the switch using the Telnet program.
The DataFabric Manager server requires the login and password information to connect to aswitch using the Telnet program.
Information about DataFabric Manager Host Agent software on a SAN host(7-Mode environments only)
You can view the SAN host status, version details of the operating system and DataFabric ManagerHost Agent, number of HBAs, and so on in the Host Agent Details page.
The Details page for a SAN host contains the following information:
• Status of the SAN host and the time since the host has been up• The operating system and DataFabric Manager Host Agent software version running on the SAN
host• The SAN protocols available on the host• The MSCS configuration information about the SAN host, if any, such as the cluster name,
cluster partner, and cluster groups to which the SAN host belongs• The events that occurred on this SAN host• The number of HBAs and HBA ports on the SAN host• The devices related to the SAN host, such as the FC switches connected to it and the storage
systems accessible from it• The number of LUNs mapped to the SAN host and a link to the list of those LUNs• The number of initiator groups that contain the SAN host and a link to the list of those initiator
groups• Time when the last sample was collected and the configured polling interval for the SAN host• Graphs that provide information about the HBA port traffic per second or the HBA port frames
per second over a period of one day, one week, one month, one quarter (three months), or oneyear
Accessing the HBA Port Details page for a SAN hostYou can access the HBA Port Details page for a SAN host from the SAN host reports.
Steps
1. Click Member Details > SANs > Report drop-down > HBA Ports, All.
2. Click the name of the HBA port.
The HBA Port Details page is displayed.
286 | OnCommand Unified Manager Operations Manager Administration Guide

Details about the HBA Port Details pageYou can use the HBA Port Details page to view the status of HBA port, view the HBA protocol,view events that occurred in the HBA port, and so on.
The Details page for an HBA port contains the following information:
• Status and state of the HBA port• Name of the SAN host on which the HBA is installed• The protocol available on the HBA• Specifics about the HBA such as the name, serial number, model, hardware version, driver
version, and firmware version• WWNN of the HBA and WWPN of the HBA port• FC switch port to which the HBA port connects• The events that occurred on this HBA port• The number of HBA ports on the HBA and a link to the list of those ports• The number of HBA ports on the SAN host on which the HBA port exists and a link to the list of
those ports• The number of storage systems accessible to the HBA port and a link to the list of those storage
systems• The number of LUNs mapped to the HBA port and a link to the list of those LUNs• The number of initiator groups that contain the HBA port and a link to the list of those initiator
groups• Time of the last sample collected and the configured polling interval for the HBA port• Graphs of information such as the HBA port traffic per second or the HBA port frames per
second over a period of one day, one week, one month, one quarter (three months), or one year
List of SAN management tasksYou can perform various SAN management tasks by using the DataFabric Manager server.
• For LUNs: Create, expand, and destroy LUNs; map a LUN to or unmap a LUN from initiatorgroups.
• For initiator groups: Create or delete initiator groups.• For FC switches: Configure and view the current configuration of a switch.
LUN managementYou can manage a LUN in two ways by using the DataFabric Manager server.
• Use the LUN management options available in the DataFabric Manager server:
• The Host Agent Details page provides a Create a LUN option in the Tools list to createLUNs.When you select the Create a LUN option, a wizard is launched that takes you through theprocess of creating a LUN.
SAN management | 287
• The LUN Details page provides the two LUN management options in the Tools list: Expandthis LUN and Destroy this LUN.These LUN management options launch wizards specific to their function. The wizards takeyou through the process of expanding or destroying a LUN.
By using a wizard available in the Tools list on the Host Agent Details page and LUN Detailspage, you can create, expand, and destroy a LUN. Before you run the wizard, ensure thefollowing:
• The SAN host management options are appropriately set on the Options page or the Edit HostAgent Settings page.
• To manage a shared LUN on an MSCS, perform the operation on the active node of thecluster. Otherwise, the operation fails.
• Connect to FilerView.The LUN Details page provides a Manage LUNs with FilerView option in the Tools list, asshown in the previous example.This option enables you to access FilerView, the Web-based UI of your storage system. You canperform the following LUN management functions from FilerView:
• Add or delete a LUN• Modify configuration settings such as the size or status of a LUN• Map a LUN to or unmap a LUN from initiator groups• Create or delete initiator groups
The Tools list on the LUN Details page displays two options for FilerView. The InvokeFilerView option connects you to the main window of the UI of your storage system and theManage LUNs with FilerView option connects you directly to the Manage LUNs window.LUNs inherit access control settings from the storage system, volume, and qtree they arecontained in. Therefore, to perform LUN operations on storage systems, you must haveappropriate privileges set up on those storage systems.
288 | OnCommand Unified Manager Operations Manager Administration Guide
Initiator group managementYou can manage initiator groups by connecting to FilerView, the Web-based management interface,of your storage system. The LUN Details page provides a Manage LUNs with FilerView option inthe Tools list. This option enables you to connect to FilerView.
FC switch managementThe FC Switch Details page provides the Invoke FabricWatch option in the Tools list. You canuse this option to connect to FabricWatch, the Web-based management tool for the BrocadeSilkWorm switches.
DataFabric Manager server optionsThe DataFabric Manager server uses the values of options in its database to determine whether toautomatically discover new objects or not. The DataFabric Manager server determines howfrequently to monitor objects, and what threshold value to use to generate an event.
Note: The DataFabric Manager server object is an entity that is monitored or managed by theDataFabric Manager server. Examples of the DataFabric Manager server objects are storagesystems, LUNs, FC switches, and user quotas.
When the DataFabric Manager server is installed, these options are assigned default values; however,you can change these values. The options can be changed globally—to apply to all objects in theDataFabric Manager server database, or locally—to apply to a specific object or a group of objects inthe DataFabric Manager server database. Some options can be set globally, but not locally.
When both global and local options are specified for an object, the local options override the globaloptions.
DataFabric Manager server options for SAN managementThere are two DataFabric Manager server options for SAN management, namely, Global-only optionand Global and local options.
Global-only options
• SAN Device DiscoveryThis option specifies whether to enable or disable the automatic discovery of SAN components(LUNs, FC switches, SAN hosts).By default, this option is enabled.
• LUN monitoring interval, Fibre Channel monitoring interval, and SAN Host monitoring intervalThe monitoring intervals determine how frequently the DataFabric Manager server collectsinformation about an object.The default monitoring intervals are as follows:
SAN management | 289

• For LUNs: 30 minutes• For Fibre Channel: 5 minutes• For SAN Host: 5 minutes
Global and local options
• Host Agent LoginThis option specifies the user name that is used to authenticate to the DataFabric Manager HostAgent software, for SAN monitoring and management.By default, SAN monitoring is enabled; therefore, the user name guest is used.If you want to enable SAN management in addition to monitoring, you must select the user nameadmin.
• Host Agent Monitoring PasswordThis option specifies the password that is used for the user name guest to authenticate to the HostAgent software for SAN monitoring.By default, public is used as the password; however, you can change it. If you change thepassword in the DataFabric Manager server, you must ensure that you change the password to thesame value in the Host Agent software running on the SAN hosts. Otherwise, the DataFabricManager server cannot communicate with the SAN host.
• Host Agent Management PasswordThis option specifies the password that is used for the user name admin to authenticate to theDataFabric Manager Host Agent software for SAN monitoring and management.There is no default value for the management password. Therefore, you must specify a value forthis option before you can use the LUN management features through the DataFabric Managerserver. The password you specify for this option must match the password specified in the HostAgent software running on the SAN hosts. Otherwise, the DataFabric Manager server cannotcommunicate with the SAN host.
• Host Agent Administration TransportThis option specifies the protocol, HTTP or HTTPS, used to connect to the DataFabric ManagerHost Agent software.By default, this option is set to HTTP.
• Host Agent Administration PortThis option specifies the port that is used to connect to the DataFabric Manager Host Agentsoftware.By default, 4092 is used for HTTP and 4093 for HTTPS.
• HBA Port Too Busy ThresholdThis threshold specifies the value, as a percentage, at which an HBA port has such a large amountof incoming and outgoing traffic that its optimal performance is hindered.If this threshold is crossed, the DataFabric Manager server generates an HBA Port Traffic Highevent. By default, this threshold is set to 90 for all HBA ports.
290 | OnCommand Unified Manager Operations Manager Administration Guide
Where to configure monitoring intervals for SAN componentsYou can configure the global options on the Options page.
To configure options locally (for a specific object), you must be on the Edit Settings page of thatspecific object (Details page > Tools list > Edit Settings).
Deleting and undeleting SAN componentsYou can stop monitoring a SAN component (a LUN, an FC switch, a storage system, or a SAN host)with the DataFabric Manager server by deleting it from the Global group.
When you delete a SAN component, the DataFabric Manager server stops collecting and reportingdata about it. Data collection and reporting is not resumed until the component is added back (usingthe Undelete button) to the database.
You cannot stop monitoring a specific FC target or an HBA port unless you stop monitoring thestorage system or the SAN host on which the target or the port exists.
Note: When you delete a SAN component from any group except Global, the component isdeleted only from that group; the DataFabric Manager server does not stop collecting andreporting data about it. You must delete the SAN component from the Global group for theDataFabric Manager server to stop monitoring it.
Reasons for deleting and undeleting SAN componentsYou might want to delete a SAN component if you want to stop monitoring the SAN componenteither temporarily or permanently. You might want to undelete a SAN component if you want toresume the monitoring of the component that you previously deleted.
Temporarily stop monitoring SAN component
You might want to delete a SAN component if you want to perform maintenance on thecomponent and do not want the DataFabric Manager server to generate events and alarms (ifconfigured) during the maintenance process.
Permanently stop monitoring the SAN component
You might want to delete a component if it exists on a non-mission critical network and doesnot need to be monitored, but it has been discovered by the DataFabric Manager server. Anon-mission critical network could be a laboratory network.
Process of deleting SAN componentsYou can delete a SAN component from any of the reports related to that component.
First, you select the components you want to delete in the left-most column of a report. Then, youclick Delete at the bottom of each report to delete the selected components.
SAN management | 291
Process of undeleting SAN componentsAll deleted objects are listed in their respective Deleted reports. You can delete a SAN componentfrom these reports.
All deleted FC switches are listed in the FC Switches, Deleted report. All deleted LUNs are listed inthe LUNs, Deleted report. All deleted SAN hosts are listed in the SAN hosts, Deleted report.
You can undelete an object by selecting it from its Deleted report and clicking Undelete at thebottom of the report.
How SAN components are groupedYou can group SAN components—LUNs, storage systems, SAN hosts, or FC switches—to managethem easily and to apply access control.
Storage systems, SAN hosts, and FC switches are considered storage systems for the purpose ofcreating groups. Therefore, when you create a group of storage systems, SAN hosts, or FC switches,the type of the created group is “Appliance resource group.” In addition, you can add storagesystems, SAN hosts, and FC switches to an Appliance resource group.
However, a group containing LUNs cannot contain any other objects—storage systems, SAN hosts,or FC switches. Therefore, when you create a group of LUNs, the created group is “LUN resourcegroup.”
Note: You cannot group HBA ports or FCP targets.
Restriction of SAN management accessYou can allow an administrator to manage your SAN hosts and devices, by selecting the GlobalSANrole on the Administrators page (Setup menu > Administrative Users). The GlobalSAN role allowsan administrator to create, expand, and destroy LUNs. This role can be global or per-group.
Access control on groups of SAN componentsJust as with other DataFabric Manager server groups, you can apply access control on groups of SANcomponents to restrict the scope of tasks an administrator can perform.
You can apply access control to a group (group-based access control) by assigning a role to anadministrator account for that group. The role defines the administrator’s authority to view andperform operations on the components in that group.
Note: By default, the DataFabric Manager server is configured to provide global Read accessacross all groups, including Global, to user Everyone.
292 | OnCommand Unified Manager Operations Manager Administration Guide
Copyright and trademark information
Copyright ©1994 - 2013 NetApp, Inc. All rights reserved. Printed in the U.S.A.
Portions copyright © 2013 IBM Corporation. All rights reserved.
US Government Users Restricted Rights - Use, duplication or disclosurerestricted by GSA ADP Schedule Contract with IBM Corp.
No part of this document covered by copyright may be reproduced in anyform or by any means— graphic, electronic, or mechanical, includingphotocopying, recording, taping, or storage in an electronic retrievalsystem—without prior written permission of the copyright owner.
References in this documentation to IBM products, programs, or services donot imply that IBM intends to make these available in all countries in whichIBM operates. Any reference to an IBM product, program, or service is notintended to state or imply that only IBM’s product, program, or service maybe used. Any functionally equivalent product, program, or service that doesnot infringe any of IBM’s or NetApp’s intellectual property rights may beused instead of the IBM or NetApp product, program, or service. Evaluationand verification of operation in conjunction with other products, except thoseexpressly designated by IBM and NetApp, are the user’s responsibility.
No part of this document covered by copyright may be reproduced in anyform or by any means— graphic, electronic, or mechanical, includingphotocopying, recording, taping, or storage in an electronic retrievalsystem—without prior written permission of the copyright owner.
Software derived from copyrighted NetApp material is subject to thefollowing license and disclaimer:
THIS SOFTWARE IS PROVIDED BY NETAPP "AS IS" AND WITHOUT ANYEXPRESS OR IMPLIED WARRANTIES, INCLUDING, BUT NOT LIMITEDTO, THE IMPLIED WARRANTIES OF MERCHANTABILITY AND FITNESSFOR A PARTICULAR PURPOSE, WHICH ARE HEREBY DISCLAIMED. INNO EVENT SHALL NETAPP BE LIABLE FOR ANY DIRECT, INDIRECT,INCIDENTAL, SPECIAL, EXEMPLARY, OR CONSEQUENTIAL DAMAGES(INCLUDING, BUT NOT LIMITED TO, PROCUREMENT OF SUBSTITUTEGOODS OR SERVICES; LOSS OF USE, DATA, OR PROFITS; OR BUSINESSINTERRUPTION) HOWEVER CAUSED AND ON ANY THEORY OFLIABILITY, WHETHER IN CONTRACT, STRICT LIABILITY, OR TORT
© Copyright IBM Corp. 2013 293
(INCLUDING NEGLIGENCE OR OTHERWISE) ARISING IN ANY WAY OUTOF THE USE OF THIS SOFTWARE, EVEN IF ADVISED OF THEPOSSIBILITY OF SUCH DAMAGE.
NetApp reserves the right to change any products described herein at anytime, and without notice. NetApp assumes no responsibility or liability arisingfrom the use of products described herein, except as expressly agreed to inwriting by NetApp. The use or purchase of this product does not convey alicense under any patent rights, trademark rights, or any other intellectualproperty rights of NetApp.
The product described in this manual may be protected by one or more U.S.A.patents, foreign patents, or pending applications.
RESTRICTED RIGHTS LEGEND: Use, duplication, or disclosure by thegovernment is subject to restrictions as set forth in subparagraph (c)(1)(ii) ofthe Rights in Technical Data and Computer Software clause at DFARS252.277-7103 (October 1988) and FAR 52-227-19 (June 1987).
Trademark information
IBM, the IBM logo, and ibm.com are trademarks or registered trademarks ofInternational Business Machines Corporation in the United States, othercountries, or both. A complete and current list of other IBM trademarks isavailable on the Web at http://www.ibm.com/legal/copytrade.shtml
Linux is a registered trademark of Linus Torvalds in the United States, othercountries, or both.
Microsoft, Windows, Windows NT, and the Windows logo are trademarks ofMicrosoft Corporation in the United States, other countries, or both.
UNIX is a registered trademark of The Open Group in the United States andother countries.
NetApp, the NetApp logo, Network Appliance, the Network Appliance logo,Akorri, ApplianceWatch, ASUP, AutoSupport, BalancePoint, BalancePointPredictor, Bycast, Campaign Express, ComplianceClock, Cryptainer,CryptoShred, Data ONTAP, DataFabric, DataFort, Decru, Decru DataFort,DenseStak, Engenio, Engenio logo, E-Stack, FAServer, FastStak, FilerView,FlexCache, FlexClone, FlexPod, FlexScale, FlexShare, FlexSuite, FlexVol,FPolicy, GetSuccessful, gFiler, Go further, faster, Imagine Virtually Anything,Lifetime Key Management, LockVault, Manage ONTAP, MetroCluster,MultiStore, NearStore, NetCache, NOW (NetApp on the Web), Onaro,OnCommand, ONTAPI, OpenKey, PerformanceStak, RAID-DP, ReplicatorX,SANscreen, SANshare, SANtricity, SecureAdmin, SecureShare, Select, Service
294 IBM System Storage N series: OnCommand Unified Manager Operations Manager Administration Guide For
Use with Core Package 5.2

Builder, Shadow Tape, Simplicity, Simulate ONTAP, SnapCopy, SnapDirector,SnapDrive, SnapFilter, SnapLock, SnapManager, SnapMigrator, SnapMirror,SnapMover, SnapProtect, SnapRestore, Snapshot, SnapSuite, SnapValidator,SnapVault, StorageGRID, StoreVault, the StoreVault logo, SyncMirror, TechOnTap, The evolution of storage, Topio, vFiler, VFM, Virtual File Manager,VPolicy, WAFL, Web Filer, and XBB are trademarks or registered trademarksof NetApp, Inc. in the United States, other countries, or both.
All other brands or products are trademarks or registered trademarks of theirrespective holders and should be treated as such.
NetApp, Inc. is a licensee of the CompactFlash and CF Logo trademarks.
NetApp, Inc. NetCache is certified RealSystem compatible.
Notices
This information was developed for products and services offered in theU.S.A.
IBM may not offer the products, services, or features discussed in thisdocument in other countries. Consult your local IBM representative forinformation on the products and services currently available in your area. Anyreference to an IBM product, program, or service is not intended to state orimply that only that IBM product, program, or service may be used. Anyfunctionally equivalent product, program, or service that does not infringe onany IBM intellectual property right may be used instead. However, it is theuser’s responsibility to evaluate and verify the operation of any non-IBMproduct, program, or service.
IBM may have patents or pending patent applications covering subject matterdescribed in this document. The furnishing of this document does not giveyou any license to these patents. You can send license inquiries, in writing to:
IBM Director of LicensingIBM CorporationNorth Castle DriveArmonk, N.Y. 10504-1785U.S.A.
For additional information, visit the web at:http://www.ibm.com/ibm/licensing/contact/
The following paragraph does not apply to the United Kingdom or any othercountry where such provisions are inconsistent with local law:
Copyright and trademark information 295
INTERNATIONAL BUSINESS MACHINES CORPORATION PROVIDESTHIS PUBLICATION “AS IS” WITHOUT WARRANTY OF ANY KIND,EITHER EXPRESS OR IMPLIED, INCLUDING, BUT NOT LIMITED TO,THE IMPLIED WARRANTIES OF NON-INFRINGEMENT,MERCHANTABILITY OR FITNESS FOR A PARTICULAR PURPOSE. Somestates do not allow disclaimer of express or implied warranties in certaintransactions, therefore, this statement may not apply to you.
This information could include technical inaccuracies or typographical errors.Changes are periodically made to the information herein; these changes willbe incorporated in new editions of the publication. IBM may makeimprovements and/or changes in the product(s) and/or the program(s)described in this publication at any time without notice.
Any references in this information to non-IBM web sites are provided forconvenience only and do not in any manner serve as an endorsement of thoseweb sites. The materials at those web sites are not part of the materials forthis IBM product and use of those web sites is at your own risk.
IBM may use or distribute any of the information you supply in any way itbelieves appropriate without incurring any obligation to you.
Any performance data contained herein was determined in a controlledenvironment. Therefore, the results obtained in other operating environmentsmay vary significantly. Some measurements may have been made ondevelopment-level systems and there is no guarantee that these measurementswill be the same on generally available systems. Furthermore, somemeasurement may have been estimated through extrapolation. Actual resultsmay vary. Users of this document should verify the applicable data for theirspecific environment.
Information concerning non-IBM products was obtained from the suppliers ofthose products, their published announcements or other publicly availablesources. IBM has not tested those products and cannot confirm the accuracyof performance, compatibility or any other claims related to non-IBMproducts. Questions on the capabilities of non-IBM products should beaddressed to the suppliers of those products.
If you are viewing this information in softcopy, the photographs and colorillustrations may not appear.
296 IBM System Storage N series: OnCommand Unified Manager Operations Manager Administration Guide For
Use with Core Package 5.2
Index
7-Mode environmentsidentifying information 23Operations Manager topic list 24
Aaccess check
for application administrators 75access check, for application administrator 65access control
configuring for VFiler units 65on groups of SAN components 292precedence of, global and group 72
access rolesfor managing configuration files 231
accessingDataFabric Manager server through the CLI 237
Active Directoryuser group accounts 68
active/active configurationmanaging with DataFabric Manager server 221
addingclusters 62
administrative usersadding 68
administrator accessmanaging 76requirements for managing 76
administratorscreating accounts 75default accounts 66everyone account 66types of access controls 75
Aggregate Details page 191, 192aggregate full threshold 192Aggregate Nearly Full threshold 192aggregate nearly overcommitted threshold 192aggregate overcommitted threshold 192Aggregate Overcommitted threshold 192aggregates
capacity graphs 192historical data 192name format 192relation to traditional volume 196
aggregates space availability 191
alarm notificationcustomize 136
alarmsacknowledging 137alerts and alarms, differences 138configuration guidelines 134creating 134e-mail messages 138, 141SNMP traps as 106testing 135trap format example 137
alertsSee user alerts 139using the mailmap file 139
annual charge rate, storage chargeback reports 211Appliance Details page
tasks 217appliances
console, connecting 220grouping 215
archive-based backuprestoring from file 249
archived reportsReport Archival Directory 151
audit log fileaccess permissions 241
authenticationLDAP 22methods 22supported servers 22
AutoSupportconfiguring 258
Bbacking up
access requirements 246deleting from Web-based user interface 248disabling schedules 248displaying information about 248starting from Web-based user interface 246storage and sizing 245
backupdirectory location 245exporting to another location 249scheduling database 247
297 | OnCommand Unified Manager Operations Manager Administration Guide

backup scriptsscripts
prebackup and postbackup 244what they do 244
backup typesarchive backup 244Snapshot backup 244
billing cycle, storage chargeback reports 211
CCA-signed certificate 163capacity thresholds 201catalogs
See reports 144Certificate Authority (CA)-signed 163Certificate Signing Request 163certificate types 163certificates
CA-signed 164definition of CA-signed 163obtaining 164role of, in secure connections 163self-signed, generating 164self-signed, security precautions for 163
certificates in DataFabric Manager server 163chargeback reports
defined 207formats 208
CLI 237Clone List report 206clone volumes
Clone List report 206identifying 206parents, relation to 205
cluster detailscluster reports 103information available 103
cluster managementbrowse cluster components 104Cluster Details page 104cluster hierarchy information about cluster objects
CPU usage 104cluster objects
user access 77network traffic 104tasks you can perform 104user access control 77view physical system 104view utilization of physical resources 104
volume capacity used 104cluster monitoring 103cluster objects
grouping 100cluster tools
use of 219cluster-management LIF
defined 103cluster-related objects 98clustered environment
Operations Manager topic list 38clustered environments
identifying information 23clusters
adding 62automatic discovery 61defined 98remote configuration 224running commands 225running commands in a node 225supported monitoring tasks 62unsupported monitoring tasks 62
commandsrunning them on a cluster 225
configurationfor disaster recovery 251
configuration detailsstorage arrays 64
configuration file propertiesacquired from parent groups 235
configuration filesaccess roles for managing 231comparison with template configuration 232described 232manage 230prerequisites for storage systems and vFiler units230verification of push operation 232
configuration groupsguidelines
for creating configuration groups 234guidelines for creating 234tasks to manage 233
configuration managementlist of tasks for 231of storage systems and vFiler units 230
configuration plug-insdefined 232
configuration report 64configuration resource group
Index | 298

what it is 233configuration resource groups
assigning a parent group 235creating 234
configuringAutoSupport 258configuring storage systems from FilerView 226custom reports 149multiple storage systems 236
connect storage systemRun Telnet tool 220
consolidated dataof storage systems and vFiler units 216
creatingconfiguration resource groups 234groups from a report 94
CSR 163currency format, storage chargeback reports 210custom comment fields
alarm notification by e-mail 136script format 137
custom reportsdisplay issue 265
Ddata export
types of 159data protection capability
for disaster recovery 251database
restoring from the Snapshot copy based backup 250database backup
archive backup 244overview 244restoring 249scheduling 247Snapshot backup 244types of 244
DataFabric Managerlogging in to 66restoring backup file 249
DataFabric Manager Host Agent softwarecapabilities 179
DataFabric Manager serveraccess to host agents 277access to Open Systems SnapVault agents 277accessing through the CLI 237communication through HTTP and HTTPS 276controlling authentication through hosts.equiv 170
discovery by 49failing back the services 255groups 91information about commands 237monitoring configuration changes 232objects 91ports and protocols used 276protocols and port numbers 276, 277recovering the services 253restoring through the CLI 249setting up for disaster recovery 252
DataFabric Manager server optionsglobal and local options 289objects 289
Day of the Month for Billing option 211default role 69deleted objects
what happens when they are deleted 212deleting
SAN components 187SNMP settings 55
determine disk space 173directory path for archive backups
changing 246disaster recovery
configuration 251requirement for Linux 251requirements 251setting up the DataFabric Manager server 252using N series Management Console 251using SnapDrive 256
discoveryby the DataFabric Manager server 49DataFabric Manager Host Agent software 179of clusters 61of SAN hosts 278of storage systems 57SAN host 179storage arrays 63
discovery ofstorage array ports 63
discovery optionsguidelines for editing 59
Disk space hard limit option 175Disk space soft limit option 175documentation
identifying mode information 23domain users
adding to a host 83defined 83
299 | OnCommand Unified Manager Operations Manager Administration Guide

deleting from user groups 84editing the settings of 84pushing, to hosts 84viewing settings of 83viewing, on a host 83
Eediting
discovery options guidelines 59email addresses
for user alerts, specifying 139events
aggregate almost full 192aggregate almost overcommitted 192aggregate full 192aggregate overcommitted 192clearing configuration events 109definition of 109list of, and severity types 110list of, complete 110managing 109qtree full 203qtree nearly full 203user, notification of 138viewing 109volume almost full 196
Everyone, administrator account 66exported data
files and formats of 160
FFC switch
managing 289FCP Target Details page 184FCP targets 184FCP topology 184file formats
for exported data 161FilerView
links to 105what it is 226
filescontaining exported data 161
Files hard limit option 175Files soft limit option 175
GGateway SAN-attached storage management 63giveback tool
what it does 222global access control
applying to administrator accounts 75description of 75precedence over group access control 69
global and local optionsHost Agent Administration Transport 289SAN management 289
global groupsummary of 77
global groups 92global privileges
creating accounts 75global roles 69Global-only options
LUN monitoring interval 289managing SAN 289SAN device discovery 289
graphsLUNs 183SAN hosts 185
groupadding members 96
group access controlapplying 75description 75precedence over global access control 69
group access privilegesaccounts 75
group membership 96groups
changing thresholds 97cluster objects, creating 100creating, from a report 94defining roles 65definition of 91global 92guidelines for creating 95homogeneous 91managing 65reports (views) about 97
guidelinescreating groups 95editing discovery options 59for assigning parent groups 235for changing managed host options 167
Index | 300

HHA configuration
viewing the status 221hierarchical groups 93homogeneous groups
types you can create 91Host Agent
tasks you can perform 180Host Agent Details page
tasks you can perform 185host discovery 56host-initiated discovery
defined 56hosts.equiv file 170hot backup mode
by using backup scripts 244HTTPS
enabling 165requirements for 166
Iinitiator group
connecting to FilerView 289managing 289viewing LUNs mapped to 183
interface groupsdefined 98
Jjobs
deleting 90viewing the status of 90what they display 90
junctionsdefined 98
LLIFs
cluster management LIF, defined 98data LIF, defined 98node management LIF, defined 98
limitationsmanaged host options 168
local usersadding 79, 82defined 77
deleting 81editing passwords 82pushing 82pushing passwords 80viewing 78viewing settings 78
logical interfaces (LIFs)See LIFs
logical resourceslogical interface traffic 104utilization 104
logical storagemonitoring
qtree quotas 205monitoring qtree capacity threshold and events 203monitoring volume capacity threshold and events196
logsaccess to 259
LUNconnecting to FilerView 287managing 287
LUN Details page 183, 184LUNs
deleting and undeleting 187destroying 184expanding 184graphs 183initiator groups mapped to 183reports in spreadsheet form 150status of 183stop monitoring 187
Mmailformat file 141mailmap file
to specify email addresses 139managed host options
guidelines for changing 167overview 167
Managed host optionslimitations 168
methodsauthentication 22
modification of passwordsissue 170
monitoringclusters through Operations Manager 103flow chart of process 101
301 | OnCommand Unified Manager Operations Manager Administration Guide

of clusters 62process 101query intervals 105unsupported tasks for clusters 62using SNMPv3 53
monitoring optionsguidelines for changing 106location to change 106
MultiStoreintroduction to 227
Nnamespaces
defined 98NetApp Host Agent
SAN hosts 180network credentials
modifying 54network discovery
reasons for failure 262nodes
running commands 225
Oobjects
definition of 91Open Systems SnapVault agents
protocols and ports used for accessing 277Operations Manager
7-Mode topic list 24access to 20clustered environment topic list 38deleting a backup from 248list of management tasks 214starting a backup from 246
optionsDisk space hard limit 175Disk space soft limit 175Files hard limit 175Files soft limit 175for SAN management 289
order of applying privileges 72overcommitment strategy 192Overview 76
Pparent groups
guidelines to assigning 235when to assign 235
passwordsediting, of local users 82
performance reportstask you can perform with 148
Permanently stop monitoring 291physical resources
controller 105CPU 105network traffic 105utilization 105
physical storageaggregate capacity thresholds and events 192
portsused by the DataFabric Manager server 276
ports and protocolsused by the DataFabric Manager server 276
predefined roleslist of 67
prerequisitesediting user quotas 175for managing user quotas 174to applying configuration files 230
primary rolesGlobalBackup 69GlobalDataProtection 69GlobalDataSet 69GlobalDelete role 69GlobalDistribution role 69GlobalEvent role 69GlobalFullControl role 69GlobalMirror role 69GlobalPerfManag 69GlobalQuota role 69GlobalRead role 69GlobalRestore role 69GlobalWrite role 69
protection issueson vFiler units 266
protocolsused by the DataFabric Manager server 276
Qqtrees
monitoring 204quotas
editing, user 176how they work 173
Index | 302

why you use 173
RRBAC
access 73for application administrators 74how roles relate to administrators 69what RBAC does 65
RBAC resource 73remote configuration
clusters 224of storage systems 230storage systems, methods of 223
remote platform managementRLM card management 241system requirements 241
Remote Platform Managementconfiguring RLM card IP address 242
report categoriesadditional capabilities 151
report generationscheduling 150
report outputslist 156
report scheduledeleting 153disabling 153editing 152listing results 154retrieving 154running 153
Report Schedules reportexisting report schedules 151
reportsaggregate 144aggregate array LUNs 144aggregate catalog fields and performance counters274array LUNs 144catalogs 144clusters 144configuring 149controller 144controllers 144creating groups from 94customizing options 143dataset 144deleting custom 150disk catalog fields and performance counters 275
disks 144events 144FC link 144FC switch 144FCP target 144file system 144filer catalog fields and performance counters 268group summary 144groups 97History performance reports 144Host domain users 144Host local users 144Host roles 144Host usergroups 144Host users 144interface groups 144logical interfaces 144LUN 144LUN catalog fields and performance counters 274of deleted storage objects 212performance events 144ports 144putting data in spreadsheets 150qtree catalog fields and performance counters 273quota 174Quotas 144Report outputs 144Report schedules 144resource pools 144SAN hosts 144schedules 144scripts 144spare array LUNs 144storage chargeback 207storage systems 144storage systems and vFiler units 216subgroups 98tasks performed from 216types of 143user quotas 144vFiler 144vFiler catalog fields and performance counters 270volume 144volume catalog fields and performance counters 271Vservers 144
requirementsfor disaster recovery 251for managing administrator access 76for managing SAN hosts 181for managing targets and initiators 181
303 | OnCommand Unified Manager Operations Manager Administration Guide

for managing user quotas 174resource groups
global 92resource utilization 104restoring
DataFabric Manager database 249the database from the Snapshot copy based backup250the DataFabric Manager database 249
role-based access controlwhat it does 65
rolesadding to a host or user 88creating 72defined 87deleting from a host 89editing the settings of 89global 69global predefined 69group 71list of predefined 67modifying 72order applying 72pushing to hosts 89viewing settings for 88viewing, on hosts 87
run commands on storage systemsRun a Command tool 219
running commandsin a node of a cluster 225
running commands on storage systems 224
SSAN components
access control 292configuring monitoring intervals 291deleting and undeleting 291deleting process 291grouping 292reasons, deleting, and undeleting 291undeleting process 292
SAN hostdetails 286
SAN hostsadministration transport 185discovery by DataFabric Manager server 278editing settings for 185host agents 185port for communication 185
requirements for managing 181SAN management
FC switches 279Global and local options 289Global-only options 289GlobalSAN role 292license key 279list of tasks 287prerequisites 279SAN hosts, initiators 279tasks performed 280tasks performed, UI locations 281
SAN reports 282saved reports
list of failed report outputs 156list of successful report outputs 156Viewing the output details of a particular reportoutput 157viewing the output of a particular report 157
Saved reportsViewing the output of a particular report output 157
schedule reportdefined 154methods 152
schedulesadding 155deleting 155editing 155list 154
scheduling report 151, 152scripts
overview 242secure connections
components of 165enabling HTTPS for 165global options versus appliance options 168protocols used for 165requirements for, on workstation 166
Secure Shell 163Secure Sockets Layer 165self-signed certificates 163server
accessing through the console 237server authentication
through hosts.equiv 170settings
editable options for systems 217severity types
list of events and 110Snapshot copies
Index | 304

monitoring of 206Snapshot copy
monitoring requirements 206Snapshot-based backups
limitations 245SNMP
setting v1 or v3 as the preferred version 53traps 106–108
SNMP connectivitydiagnosis 55
SNMP settingsdeleting 55modifying 54
SNMPv3monitoring process using 53
spreadsheetsLUN reports, putting into 150
SSH 165SSL 165stop monitoring a LUN 187storage array ports
connected to the gateway, list of 64discovery 63
storage arraysconnected to the gateway, list of 64discovery 63
storage arrays of the gatewayconfiguration details 64
storage chargeback reportsdefined 207
storage controller toolsuse of 218
storage controllersdefined 98
storage objectsreports of deleted objects 212result of deleting 212
storage systemsaccessing through FilerView 226changing passwords on multiple systems 169configuration management 230configuring from FilerView 226configuring multiple 236discovery of 57remote configuration 230remote configuration methods 223requirement for running remote commands 223
storage-related report 189subgroup reports
what they are 98
summary pageviewing 77
Summary reports 97Symbols
/etc/quotas file 175quotas file 173
Ttakeover tool
what it does 221targets, See FCP Targets 184Temporarily stop monitoring 291The Gateway SAN-attached storage management
limitations 63thresholds
aggregate full 192aggregate full interval 192aggregate nearly full 192aggregate nearly overcommitted 192aggregate overcommitted 192changing group 97description of 176editing 189global and group levels 189overriding global settings 192precedence of 177user quota 176ways and locations to apply 177
traditional volumesSee volumes
Trusted CA-signed certificates 163
Uundeleting (restoring)
objects 213SAN components 187
user accesscluster management 77
user accounts 66user alert
e-mail message 138mailformat file 141
user alertsalarms and alerts, differences 138contents of e-mail message 141Default Email Domain for Quota Alerts option 140defined 138
user capabilities 72
305 | OnCommand Unified Manager Operations Manager Administration Guide

user groupsadding 85defined 85deleting 87deleting domain users from 84editing the settings 86pushing to hosts 87viewing the settings 86viewing, on a host 85
user quotaabout editing 175mailformat file 141mailmap file 140
User Quota Monitoring Interval option 175user quota thresholds
hard quota limit 177monitor 177settings 177soft quota limit 177
user quotasalarms and alerts, differences 138alert See user alert 138editing 176, 227
user settingsconfiguring 176
usersadding, administrative 68viewing 77with Execute capability 80
using Operations Manager 103utilization
logical resources 104
VvFiler administrators
configuring 65vFiler unit
management tasks 228vFiler units
access control, administrators 65adding to Resource groups 96configuration management 230discovery 57introduction to 227monitoring of 227monitoring volumes and qtrees in 204protection issues 266requirements for editing quotas 174resource details page 205
vFilersdiscovery 57
view storage system detailsRefresh Monitoring Samples tool 219
volume capacity thresholdsmodify 201
volume full threshold 196volume nearly full threshold 196Volume Nearly No First Snapshot Threshold 201Volume Snap Reserve Full Threshold 201Volume Snapshot Count Threshold 201Volume Snapshot No First Count Threshold 201volume thresholds
Snapshot copy, events 201Volume Too Old Snapshot Threshold 201volumes
monitoring 204Vserver 98Vservers
defined 98
Wwhen to back up data 244
Index | 306


����
NA 210-06255_A0, Printed in USA
GA32-1015-02


![Mission Manager[1]](https://static.fdokumen.com/doc/165x107/6313fe215cba183dbf075a68/mission-manager1.jpg)

