OnCommand Insight 7.1 Configuration and Administration Guide
194
OnCommand ® Insight 7.1 Configuration and Administration Guide NetApp, Inc. 495 East Java Drive Sunnyvale, CA 94089 U.S. Telephone: +1 (408) 822-6000 Fax: +1 (408) 822-4501 Support telephone: +1 (888) 463-8277 Web: www.netapp.com Feedback: [email protected] Part number: 215-09529_A0 April 2015
-
Upload
khangminh22 -
Category
Documents
-
view
2 -
download
0
Transcript of OnCommand Insight 7.1 Configuration and Administration Guide

OnCommand® Insight 7.1
Configuration and Administration Guide
NetApp, Inc.495 East Java DriveSunnyvale, CA 94089U.S.
Telephone: +1 (408) 822-6000Fax: +1 (408) 822-4501Support telephone: +1 (888) 463-8277Web: www.netapp.comFeedback: [email protected]
Part number: 215-09529_A0April 2015


Contents
OnCommand Insight overview ................................................................... 8Insight architecture ...................................................................................................... 8
Insight Data Warehouse architecture ............................................................. 10
Firewall-friendly architecture ........................................................................ 10
Insight for administrators, managers, and planners ................................................... 11
Finding answers to your Insight questions ................................................................ 12
Accessing Help directly ................................................................................ 12
Locating product information on the NetApp site ........................................ 13
Navigating Insight ..................................................................................................... 13
Navigation of Insight web UI ........................................................................ 14
Insight accessibility features ......................................................................... 15
Content of the Insight toolbar ........................................................................ 15
What the Assets Dashboard enables you to do ............................................. 17
Asset pages .................................................................................................... 18
What the Violations Dashboard enables you to do ....................................... 21
What custom dashboards enable you to do ................................................... 22
What the Storage Manager Dashboard enables you to do ............................ 24
Setting up Insight ........................................................................................ 28Opening Insight ......................................................................................................... 28
Installing your Insight licenses .................................................................................. 30
Updating expired licenses ............................................................................. 31
OnCommand Insight licenses ........................................................................ 31
Setting up and managing user accounts .................................................................... 32
Insight user roles ........................................................................................... 33
Configuring user definitions using LDAP ..................................................... 34
Changing user passwords .............................................................................. 36
Editing a user definition ................................................................................ 37
Deleting a user account ................................................................................. 37
Setting up weekly backups for your Insight database ............................................... 38
Configuring your email ............................................................................................. 39
Email configuration prerequisites ................................................................. 39
Configuring your email for Insight ............................................................... 39
Table of Contents | 3

Configuring SNMP notifications ............................................................................... 40
Enabling the syslog facility ....................................................................................... 41
Insight syslog contents .................................................................................. 42
Configuring your ASUP processing .......................................................................... 42
Creating custom dashboards ...................................................................................... 44
Deleting a custom dashboard ........................................................................ 48
Changing Storage Manager Dashboard settings ....................................................... 48
Managing performance policies ................................................................................ 51
Creating performance policies ...................................................................... 51
Performance policy evaluation precedence ................................................... 54
Editing performance policies ........................................................................ 55
Deleting performance policies ...................................................................... 56
Insight data source management .............................................................. 57Setting up your data sources in Insight ..................................................................... 57
Data source support information ................................................................... 58
Adding data sources ...................................................................................... 58
Cloning a data source .................................................................................... 61
Testing the data source configuration ............................................................ 62
Vendor-specific data source reference ....................................................................... 62
3PAR InServ Firmware 2.2.2+ (SSH) data source ........................................ 63
Brocade EFCM (9.5, 9.6, 9.7) data sources .................................................. 65
Brocade FC Switch Firmware (SSH) data source ......................................... 66
Brocade Sphereon/Intrepid Switch (SNMP) data source .............................. 69
Cisco FC Switch Firmware (SNMP) data source .......................................... 71
Dell Compellent Storage Center data source ................................................ 76
EMC Atmos (HTTP) data source .................................................................. 77
EMC Celerra data source .............................................................................. 78
EMC CLARiiON (NaviCLI) data source ...................................................... 80
EMC Data Domain data source ..................................................................... 82
EMC ECC StorageScope data sources .......................................................... 84
EMC Isilon data source ................................................................................. 85
EMC Solutions Enabler (CLI) with SMI-S Performance data source .......... 86
EMC VNX (SSH) data source ...................................................................... 89
EMC VPLEX data source ............................................................................. 91
Fujitsu Eternus data source ........................................................................... 93
HDS HiCommand Device Manager data source ........................................... 94
4 | Configuration and Administration Guide

HDS HiCommand Device Manager Lite data source ................................... 97
HP CommandView AE data source .............................................................. 98
HP CommandView AE Lite data source ....................................................... 99
HP EVA Storage (SSSU) data source .......................................................... 100
IBM DS (CLI) data source .......................................................................... 103
IBM PowerVM data source configuration and commands ......................... 105
IBM SVC (SSH) data source ...................................................................... 107
IBM Tivoli Monitoring data source ............................................................. 109
IBM TotalStorage DS4000 data source ....................................................... 110
IBM XIV (CLI) data source ........................................................................ 111
Microsoft Hyper-V (WMI) data source ....................................................... 113
NetApp Clustered Data ONTAP data source .............................................. 116
NetApp Clustered Data ONTAP 8.1.x for Unified Manager data source ... 116
NetApp Data ONTAP operating in 7-Mode data source ............................. 117
NetApp E-Series data source ....................................................................... 121
NetApp Host and VM File Systems data source ......................................... 122
QLogic FC Switch (SNMP) data source ..................................................... 126
Violin Memory 6000 Series Flash Memory Array (HTTP) data source ..... 127
VMware vSphere (Web Services) data source ............................................ 128
Changing data source credentials ............................................................................ 130
Changes causing data collection problems .............................................................. 131
Examining one data source in detail ....................................................................... 132
Researching a failed data source ............................................................................. 133
Controlling data source polling ............................................................................... 134
Editing data source information .............................................................................. 135
Editing information for multiple data sources ......................................................... 136
Data source patches ................................................................................................. 138
Installing a patch on one type of data source .............................................. 138
Managing patches ........................................................................................ 139
Committing a data source patch .................................................................. 140
Rolling back a data source patch ................................................................. 141
Maintaining Insight .................................................................................. 142Managing Insight ..................................................................................................... 142
Monitoring Insight system health ............................................................................ 143
Monitoring the violations in your network ............................................................. 144
Fibre Channel environment monitoring .................................................................. 145
Table of Contents | 5

Port metrics ................................................................................................. 146
Acquisition unit status ............................................................................................. 149
Restoring the Insight database ................................................................................. 150
Deleting a data source from OCI ............................................................................. 151
Updating expired licenses ....................................................................................... 152
Licenses no longer compliant ...................................................................... 152
Replacing licenses for older Insight versions .............................................. 152
Preparing a special troubleshooting report .............................................................. 153
Manually backing up the OCI database ...................................................... 153
Bundling logs for Support ........................................................................... 153
Sending information to NetApp Support .................................................... 154
Advanced Insight configuration tools ..................................................................... 154
Restarting the OnCommand Insight Server ................................................ 156
Configuring the number of hours to ignore dynamic data .......................... 156
Generating logs for Customer Support ........................................................ 158
Displaying system information ................................................................... 159
Listing installed OnCommand Insight components .................................... 159
Calculating the number of database objects ................................................ 159
Moving MySQL data using the migrate option .......................................... 160
Forcing annotation updates ......................................................................... 161
Configuring Client settings ......................................................................... 161
Checking a tier upgrade ............................................................................... 162
Checking the status of server resources ...................................................... 163
Scrubbing data for transfer to support ......................................................... 163
Finding ghost data sources .......................................................................... 166
Enabling automatic disk model updates ...................................................... 167
Specialized administration toolkit ............................................................... 169
Upgrading Insight ..................................................................................... 173Upgrading Insight Server software .......................................................................... 173
Upgrading versions prior to Insight 6.4 ...................................................... 173
Upgrading a 32-bit system to the required 64-bit server ............................. 174
Upgrading Insight to a version later than 7.1 .............................................. 174
Upgrading the Data Warehouse (DWH) .................................................................. 175
Backing up the Data Warehouse database ................................................... 175
Upgrading DWH and custom reports created prior to Insight 6.4 .............. 176
Uninstalling Data Warehouse and Reporting .............................................. 182
6 | Configuration and Administration Guide

Copyright information ............................................................................. 184Trademark information ........................................................................... 185How to send comments about documentation and receive update
notification ............................................................................................ 186Index ........................................................................................................... 187
Table of Contents | 7

OnCommand Insight overview
OnCommand Insight (OCI) is designed to simplify operational management of complex privatecloud and virtual IT environments. OCI is a single solution to enable cross-domain, multi-vendorresource management and analysis across networks, storage, and servers in physical and virtualenvironments.
OCI provides a "single pane of glass" for reporting on storage costs and provides the transparencyneeded to make decisions about performance and efficiency.
This release includes these key enhancements:
• Usability – New web-based user interface (UI) enables better visualization of the IT infrastructurerelationships and provides simpler and easier installation, upgrade process, and productadministration.
• Scalability – Scale across multiple data centers.
• Flexibility – New dashboard and improved asset search and navigation enable quickertroubleshooting.
• Interoperability – Most comprehensive multi-vendor support in the industry, including enhancedNetApp Clustered Data ONTAP and E-series configuration and performance monitoring.
Insight architectureOnCommand Insight enables you to administer your product easily, using a streamlined systemarchitecture that includes the Insight Server, a collection engine, web-based and Java UIs, and datawarehousing.
The major components of the Insight architecture are shown in this diagram and described after it:
8 | Configuration and Administration Guide

OnCommand Insight Server
The OnCommand Insight Server is the “brain” of the application. It includes main data repositoryand analysis components. The server is continuously building an end-to-end topology of theenvironment, analyzing it, and generating alerts when an incident or violation is detected.
Acquisition
The Insight collection engine is built of one or more acquisition units. Each acquisition unit is aservice running in the network that accesses (through modules called data sources) and collects datafrom different devices in the data center. Information collected by the acquisition units is then sent tothe server (in an XML, JSON, or native Java format) for analysis.
The collection engine is designed to be highly modular and easily patched.
Web UI
The HTML5 web-based user interface (UI) for Insight enables you to set up your monitoringenvironment and data sources. You then use the web UI Asset Dashboard and asset pages to identifyand research potential problems.
Java UI
This is the OnCommand Insight user interface (UI) or Client. You can use the Java UI to researchproblems in your environment by setting thresholds and defining policies, annotations, and businessentities.
OnCommand Insight overview | 9

Data Warehouse (DWH)
Consolidates and prepares data for reporting across multiple installations of Insight. This includeshistory, trending, and presenting the data in different ways to enable long-term planning of the datacenter's infrastructure.
IBM Cognos
This software is a reporting engine that provides a user interface for creating enterprise-level reports.
Insight Data Warehouse architecture
In a large environment, the OnCommand Insight Data Warehouse (DWH) consolidates data acrossdifferent installations and hence different Insight data centers.
As shown in this diagram, the architecture enables users to view their entire environment andgenerate meaningful reports through a “single pane of glass” interface:
Firewall-friendly architecture
The OnCommand Insight (OCI) architecture enables you to easily create firewalls around the productso that your assets are more secure.
As shown in the diagram, the architecture has these firewall features:
• All OCI clients use HTTPS to communicate with the server.
• The acquisition units enable only outgoing HTTPS connections; no ports are opened on theacquisition unit processes.
10 | Configuration and Administration Guide

Insight for administrators, managers, and plannersOnCommand Insight (OCI) supplies vital information for storage administrators, managers, andstorage architects to do their troubleshooting and analysis.
Experienced storage administrators use OnCommand Insight along with their network storageknowledge to accomplish these typical tasks:
• Manage the SAN and NAS environment.
• Work with network engineers on network concerns.
• Evaluate, test, and integrate new storage technologies into the environment.
• Troubleshoot performance issues, alerts, policy breaches, violations, and vulnerabilities.
Managers and network planners use OnCommand Insight to perform these business tasks:
• Develop project budgets and timelines.
• Evaluate and revise project plans to meet changing project demands.
• Manage project planning and expenses.
• Purchase hardware and software.
• Provide business reports for capacity management, charge back billing, right sizing, and servicelevel agreements.
OnCommand Insight overview | 11

Finding answers to your Insight questionsInsight provides you with product documentation as online Help and PDF guides. The web UI Helpincludes all of the Insight installation and upgrade instructions and information about the new webUI.
About this task
The Insight documentation is available from the Help menu.
Steps
1. To display the documentation within the web UI, open Insight in your browser.
2. On the toolbar, click the question mark and select either of these options from the menu:
• Help topics
Insight documentation including installation and configuration
• Java UI Help
Instructions for using the Insight Client
After you finish
You can also examine all of the OnCommand Insight documentation as PDF guides in the productlibrary on the NetApp Support Site: mysupport.netapp.com/documentation/productsatoz/index.html.
Accessing Help directly
If you want to search the Insight Help without opening the software, you can run both WebHelpversions in your browser from their server locations.
Before you begin
OnCommand Insight 7.x must be installed.
Steps
1. Open your browser.
2. Enter the URL for your OCI server with the Help directory using these formats for thecorresponding Insight versions:
• Web UI Help: https://<oci_server_name>/documentation/oci_webhelp/index
• Java UI Help: https://<oci_server_name>/legacy/help/webhelp/index.html
12 | Configuration and Administration Guide

3. Use the Search function or Index to locate the information you want.
Locating product information on the NetApp site
The NetApp Support Site maintains full documentation sets in different formats. Videos showing youhow to perform tasks in Insight are available on the Community site.
About this task
You need to have a NetApp Customer Support login name and password to access the Support andCommunity sites.
Steps
1. To examine all Insight product documentation, navigate to the product libraries on the NetAppCustomer Support site.
Note: The Product Library site is mysupport.netapp.com/documentation/productsatoz/index.html.
a. Select OnCommand Insight.
b. Locate the Release number you installed in the list of Insight releases.
c. Select the documents and formats you want.
2. To run demonstration videos, open the Insight Community site.
Note: The Insight Community site is https://communities.netapp.com/community/products_and_solutions/storage_management_software/oncommand-insight.
a. Select the Content tab.
b. Select the Videos tab.
Navigating InsightInsight uses a search facility, hot spots, links, and interactive icons to locate information and open itstools and dialog boxes. When conducting your network research, you use standard browsertechniques to navigate through the data.
Steps
1. Open Insight in your browser.
2. On the Assets Dashboard, move your pointer over items to display additional information.
OnCommand Insight overview | 13

3. On the Assets Dashboard, click hot spots in the IOPs heat maps and the Top 10 utilized pools toopen the asset pages summarizing the current state of the selected resource.
4. On the Insight toolbar, locate specific network elements using the Search assets box.
5. On the toolbar, note any circled number on the Admin symbol.
6. To examine the items of possible concern, click Admin.
7. Click the buttons in the Admin panel to examine tables of items.
8. Click linked text in a table to examine the details associated with a specific item.
9. To return to previously displayed pages, use one of these techniques:
• Click the browser back arrow.
• Right-click and hold the back arrow to display a list of the pages and select the page you want.
Video: Insight browser features
To see a short demonstration of the browser navigation features, click here and open the video.
Navigation of Insight web UI
Insight runs in a browser and employs many standard browser navigation features. For example, youcan use the browser Back arrow to return to the previously displayed page, and click blue text todisplay linked information.
The toolbar remains at the top of all pages and provides access to the Insight tools. Insight displays asolid red circle beside any items in tables that need to be examined for possible problems. The totalof all possible issues in the Admin area is shown on the Admin icon on the toolbar.
You can use the Search Assets box to locate an object in your environment and display its asset page,which shows the current status and contains links to additional information.
The first items listed in the Data Sources table are the ones Insight has identified as possibly causingserious issues. You can use filter to sort the table to show only the items you want. The operationsthat can be performed on a table are shown in the Actions menu in the upper-right corner. If youposition your pointer over an item in a table, the operations you can perform on that item appear asclickable icons to the right.
You can use the browser Back arrow to return to the previous page or right-click on the Back arrowto display a list of all previous pages so that you can select a specific page.
14 | Configuration and Administration Guide

Insight accessibility features
Insight provides accessibility features in the web UI to help people with disabilities to use thesoftware. User hearing or speech is not required to operate this product.
Insight employs many standard web page accessibility features including these techniques:
• The application provides a well-defined visual focus. Focus is provided programmatically toassistive technology.
• When the mouse pointer moves over the web UI, displayed text describes page elements that isalso accessible to screen readers.
• Information is always conveyed in text as well as color, and never exclusively in color.
• Insight runs in standard browsers so that users can set up their displays for special visualrequirements such as displaying text in an extra large font.
• Data tables are designed to support screen readers.
• Rows and columns in data tables are all labeled with headers.
• Images in the product documentation include text (as Alt text) for screen readers.
Content of the Insight toolbar
You use the Insight toolbar to navigate through the web user interface. All Insight pages have thesame toolbar across the top to provide access to the Search and other tools.
The name of the monitored environment displays on the left side of the toolbar, as shown in theexample below. The toolbar remains at the top of all pages and provides access to these Insight tools:
• The Dashboards menu contains these options:
◦ Assets Dashboard displays the Assets Dashboard.
◦ Violations Dashboard displays the Violations Dashboard.
OnCommand Insight overview | 15

◦ Dashboard Name displays the dashboard names chosen by administrator users who createcustom dashboards: for example, “VM Dashboard”.
◦ Create Dashboard is only available to administrator users to create custom dashboards.
• The Manage menu contains the Performance Policies option, which lets you view all of thepredefined performance policies and create new performance polices for the following resources:datastore, disk, hypervisor, internal volume, port, storage, storage node, storage pool, VMDK,virtual machine, and volume.
• Search assets box locates network objects and links to asset pages for those objects.
• Help menu contains these options:
◦ Help topics includes getting started, installation, and configuration information for Insight7.1.
◦ Data source support matrix opens the detailed matrix for this version of Insight.
◦ Check for updates indicates whether a new Insight version is available.
◦ Support opens the NetApp Support page.
◦ Java UI Help describes the original OCI Client features you might need to use with the newInsight 7.1 features.
◦ About lists Insight version and build numbers with copyright information.
• Launch Java UI icon opens the original OCI Client.
You need to use the Java UI to define annotations, business entities, policies, and thresholds.
• Launch Reporting Portal opens the OnCommand Insight Reporting Portal.
• Admin icon opens the web UI configuration and troubleshooting tools.
If there is a circled number on this icon, the number is the total of all items that require yourattention. Check the buttons in the Admin group to see how these items are divided among theoptions.
• Logged in as <user role> icon displays the role of the person logged in and provides theLogout option.
16 | Configuration and Administration Guide

What the Assets Dashboard enables you to do
The Asset Dashboard serves as a home base, displaying a summary of your network at all times andenabling you to locate and address problems before you get a call reporting an issue.
Pie charts show the asset distribution for capacity by vendor and tier and switch port. You can moveyour pointer over the charts to display more details. Facts about your environment lists informationpertaining to the capacity, efficiency, FC resources, and virtual infrastructure areas of yourenvironment.
Heat maps
In the lower-right corner of the display are the Storage IOPS and Virtual Machine IOPS heat maps.In these maps, any resource name in large print has a high number of IOPs being driven into thatstorage or VM. You can click any resource name in the heat maps to display the asset pagesummarizing the current state of that resource.
OnCommand Insight overview | 17

Top ten utilized storage pools
If you click a tall bar in the Top 10 utilized pools chart, you can examine that resource. In theexample, the mouse pointer shows the name of the storage pool with the highest utilization in thechart.
Asset pages
Asset pages provide performance troubleshooting data for the hosts and present summaryinformation about the base resource (such as a virtual machine or a volume) and the resources that ituses, with links to additional information. You can scroll to the bottom of an asset page to examinetables of associated resources and violations.
The following example shows some of the types of information available on a Hypervisor asset page.Any message with a solid red circle next to it requires immediate attention.
18 | Configuration and Administration Guide

Asset page types
The type of information shown on asset pages depends on the type of base resource represented.Insight provides asset pages for these resource types:
• Virtual Machine
• Volume
• Internal Volume
• Physical Host
• Storage Pool
• Storage
• Datastore
• Hypervisor
• Application
• Node
• Disk
• VMDK
• Port
• Switch
• Fabric
Displaying asset page details
You can display more details using your mouse pointer and selecting linked or active items on assetpages. Clicking a linked resource name displays summaries of information for that resource.
Show time icons
You can click any of the time icons to change the segment of data displayed:
• 3 hours
• 24 hours
• 3 days
• 7 days
• Custom
OnCommand Insight overview | 19

Topology
This area shows the device and its connections. Positioning your mouse pointer over itemsin the topology map displays additional information.
Performance charts
You can select the check boxes above the charts to determine the types of data displayedin the charts. The types of data vary, depending on the type of the base resource. You canmove your pointer over the graphs to display more details for any point on the graph andselect different time icons to display different segments of the data.
Resources
Resources shows the base resource you selected in the Asset page. Also shown, whenapplicable, are any resources related to the base resource in the following categories: Topcorrelated, Top contributors, Bullies or Victims, and Additional resources. You canalso use the following options, when available, to supply additional information:
• Selecting the check box before the resource name adds the data from that resource tothe charts.
Each resource is displayed in a different color in the charts.
• Clicking the linked letter "T" beside the check box enables you to select whether toinclude the Total, Read only, or Write only data in the performance charts.
Total is the default.
• Clicking a linked resource name opens a page of summary data for it.
• Clicking the linked percentage beside a resource name opens a box comparing the typeof correlation that resource has with the base resource.
• Clicking the trash can icon next to the resource removes it from the Additionalresources list.
Top correlated
Top correlated shows the resources that have a high correlation on one or moreperformance metrics with the base resource.
Top contributors
Top contributor shows the resources that contribute to the main resource, which is shownin Resources.
Bullies/Victims
Bullies shows the assets that take away system resources from other assets sharing thesame resources, such as hosts, networks, and storage. Victims shows the assets that aredepleted of system resources due to other assets. If this issue occurs, you see either Bulliesor Victims.
Additional resources
20 | Configuration and Administration Guide

If Top correlated does not contain a resource you need in the performance charts, you canuse the Search assets box to locate it and then select the displayed resource to add it to theperformance data and create a list of additional resources.
Associated resources and violations
Scroll below the performance charts to examine linked lists of all associated resources andviolations of any preset thresholds. For example, a Virtual Machine asset page lists all ofthe VMDKs in the virtual machine and any threshold violations.
What the Violations Dashboard enables you to do
The Violations Dashboard displays a summary of all the violations in your network and enables youto locate and address issues before you get a call reporting a crisis.
The dashboard comprises three widgets that contain information about the violations in the network,based on different criteria:
Violations By Policies
Violations By Policies shows the distribution of violations by the policy name.
OnCommand Insight overview | 21

Violations History
The Violations History table shows the latest 1000 violations by metric type over time.
Violations Table
The Violations Table shows a maximum of 1000 violations that occurred during a specified timeperiod (1 hour, 3 hours, 24 hours, 3 days, or 7 days). The table lists the violation ID, the time atwhich the violation occurred, the duration of the violation, a description (for example, the storagepool and the storage pool volume that generated the violation and the performance policy thresholdviolated), the severity, and the name of the performance policy that contains the threshold thattriggered the violation.
Related tasks
Monitoring the violations in your network on page 144
What custom dashboards enable you to do
If you have administrative privileges, you can create custom dashboards, populated by you with onlythe data of most interest to you and your organization.
A custom dashboard can comprise any of the widgets from Widget Library. For example, thefollowing custom dashboard for virtual machines (VM) can benefit those who monitor and maintainthe VM infrastructure. It enables them to quickly see their site's VMs and VM performanceinformation so they can easily identify issues.
22 | Configuration and Administration Guide
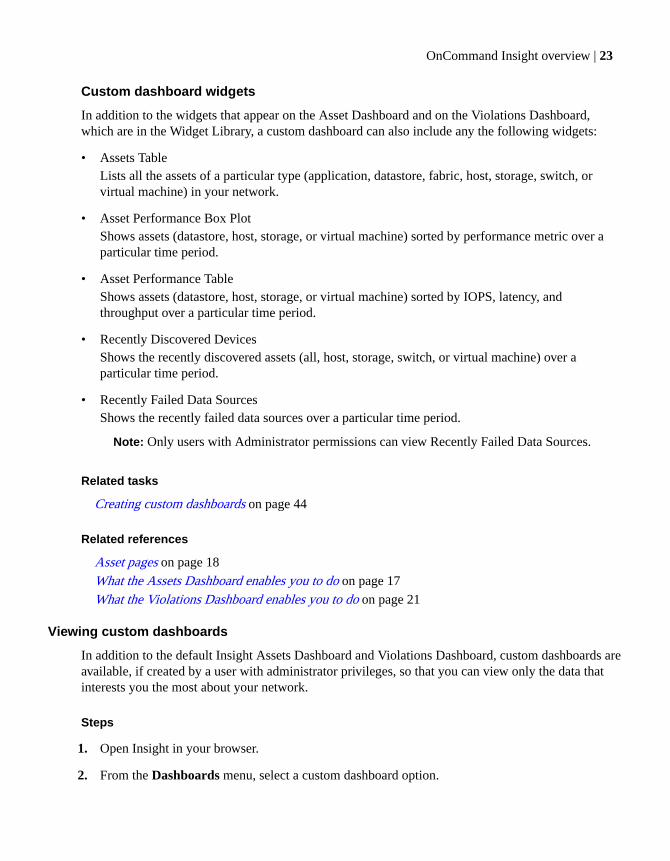
Custom dashboard widgets
In addition to the widgets that appear on the Asset Dashboard and on the Violations Dashboard,which are in the Widget Library, a custom dashboard can also include any the following widgets:
• Assets Table
Lists all the assets of a particular type (application, datastore, fabric, host, storage, switch, orvirtual machine) in your network.
• Asset Performance Box Plot
Shows assets (datastore, host, storage, or virtual machine) sorted by performance metric over aparticular time period.
• Asset Performance Table
Shows assets (datastore, host, storage, or virtual machine) sorted by IOPS, latency, andthroughput over a particular time period.
• Recently Discovered Devices
Shows the recently discovered assets (all, host, storage, switch, or virtual machine) over aparticular time period.
• Recently Failed Data Sources
Shows the recently failed data sources over a particular time period.
Note: Only users with Administrator permissions can view Recently Failed Data Sources.
Related tasks
Creating custom dashboards on page 44
Related references
Asset pages on page 18
What the Assets Dashboard enables you to do on page 17
What the Violations Dashboard enables you to do on page 21
Viewing custom dashboards
In addition to the default Insight Assets Dashboard and Violations Dashboard, custom dashboards areavailable, if created by a user with administrator privileges, so that you can view only the data thatinterests you the most about your network.
Steps
1. Open Insight in your browser.
2. From the Dashboards menu, select a custom dashboard option.
OnCommand Insight overview | 23

If available, custom dashboards options appear on the Dashboards menu below the AssetsDashboard and Violations Dashboard options.
3. Depending on the widgets in the dashboard, you can change how the data displays by doing thefollowing:
• You can click the icon in the upper right-hand corner to display the data in full screen
mode, and click again to minimize the data.
Note: When some table widgets are displayed, they initially show only three columns;
however, when you click , additional columns (up to seven) are displayed.
• You can move your pointer over charts to display more details.
• You can click on a legend label in the Violations History chart to remove the data associatedwith the legend from the chart. Click on the legend to display the data again.
• You can use filter to sort a table to show only the items you want.
• You can change the sort order of the columns in a table to either ascending (up arrow) ordescending (down arrow) by clicking the arrow in the column header.
• You can click a page number to browse through data by page if there is more data than fits ona single page.
• You can click a linked resource name to display its asset page.
• You can display violations for a particular time period (1h, 3h, 24h, 3d, and7d), with Insightshowing a maximum number of 1000 violations for the selected time period.
Related tasks
Creating custom dashboards on page 44
What the Storage Manager Dashboard enables you to do
You can use the Storage Manager dashboard, which you can navigate to by clicking the LaunchReporting Portal icon in the Insight toolbar, for the daily management of your storage services. Itprovides you with a centralized visualization that enables you to compare and contrast resource usageover time against acceptable ranges and previous days of activity. Showing only the key performancemetrics for your storage services, you can make decisions about how to grow and maintain your datacenters.
The dashboard comprises seven components that contain contextual information on certain aspects ofyour storage environment. You can drill-down on aspects of your storage services to perform an in-depth of analysis of a section that interests you most.
24 | Configuration and Administration Guide

Summary
This shows used versus usable storage capacity, the total switch ports versus the number of switchports connected, and the total connected switch port utilization versus the total bandwidth, and howeach of these trend over time. You can view actual utilization compared against the low, mid, andhigh ranges, which enables you to compare and contrast usage between Insight projections and yourdesired actuals, based on a target. For capacity and switch ports, you can configure this target. Theforecast is based on an extrapolation of the current growth rate and the date you set. When forecastedused capacity, which is based on future usage projection date, exceeds the target, an alert (solid redcircle) appears next to Capacity.
Storage Tiers Capacity
This shows tier capacity used versus the capacity allocated to the tier, which indicates how usedcapacity increases or decreases over a 12-month period and how many months are left to fullcapacity. Capacity usage is shown with values provided for actual usage, the usage forecast byInsight, and a target for capacity, which you can configure. When forecasted used capacity, which isbased on future usage projection date, exceeds the target capacity, an alert (solid red circle) appearsnext to a tier.
OnCommand Insight overview | 25

You can click any tier to display the Storage Pools Capacity and Performance Details report, whichshows free versus used capacities, number of days to full, and performance (IOPS and ResponseTime) details for all the pools in the selected tier. Additionally, you can click any storage or storagepool name in this report to display the asset page summarizing the current state of that resource.
Daily Storage Traffic
This shows how the environment is performing compared normal when there is any large growth,changes, or potential issues in the previous six months; it also shows average traffic versus traffic forthe previous seven days, and for yesterday. You can visualize any abnormalities in the way theinfrastructure is performing, because it gives information that highlights both cyclical (previous sevendays) and seasonal variations (previous six months).
You can click the title (Daily Storage Traffic) to display the Storage Traffic Details report, whichshows the heat map of the hourly storage traffic for the previous day for each storage system. Clickany storage name in this report to display the asset page summarizing the current state of thatresource.
Data Centers Time to Full
This shows all the data centers versus all of the tiers and how much capacity remains in each datacenter for each tier of storage based on Insight forecasted growth rates. Tier capacity level is shownin blue; the darker the color, the less time the tier at the location has left before it is full.
You can click a section of a tier to display theStorage Pools Days to Full Details report, which showstotal capacity, free capacity, and number of days to full for all the pools in the selected tier and thedata center. Click any storage or storage pool name in this report to display the asset pagesummarizing the current state of that resource.
Top 10 Applications
This shows the top 10 applications, based on used capacity. Regardless of how the tier organizes thedata, this area displays the current used capacity and share of the infrastructure. You can visualize therange of user experience for the previous seven days to see if consumers experience acceptable (or,more importantly, unacceptable) response times.
This area also shows trending, which indicates if the applications meet their performance servicelevel objectives (SLO). You can view the previous week's minimum response time, the first quartile,the third quartile, and the maximum response time, with a median shown against an acceptable SLO,which you can configure. When the median response time for any application is out of the acceptableSLO range, an alert (solid red circle) appears next to the application. You can click an application todisplay the asset page summarizing the current state of that resource.
Storage Tiers Daily Performance
This shows a summary of the tier's performance for response time and IOPS for the previous sevendays. This performance is compared against a SLO, which you can configure, enabling you to see ifthere is opportunity to consolidate tiers, realign workloads delivered from those tiers, or identify
26 | Configuration and Administration Guide

issues with particular tiers. When median response time or median IOPS is out of the acceptable SLOrange, an alert (solid red circle) appears next to a tier.
You can click a tier name to display the Storage Pools Capacity and Performance Details report,which shows free versus used capacities, number of days to full, and performance (IOPS andresponse time) details for all the pools in the selected tier. Click any storage or storage pool in thisreport to display the asset page summarizing the current state of that resource.
Orphaned Capacity
This shows the total orphaned capacity and orphaned capacity by tier, comparing it againstacceptable ranges for total usable capacity and showing the actual capacity that is orphaned.Orphaned capacity is defined by configuration and by performance. Storage orphaned byconfiguration describes a situation in which there is storage allocated to a host; however, theconfiguration has not been performed properly and the host cannot access the storage. Orphaned byperformance is when the storage is correctly configured to be accessed by a host; however, there hasbeen no storage traffic.
The horizontal stacked bar shows the acceptable ranges. The darker the gray, the more unacceptablethe situation is. The actual situation is shown with the narrow bronze bar that shows the actualcapacity that is orphaned.
You can click a tier to display the Orphaned Storage Details report, which shows all the volumesidentified as orphaned by configuration and performance for the selected tier. Click any storage,storage pool, or volume in this report to display the asset page summarizing the current state of thatresource.
Related tasks
Changing Storage Manager Dashboard settings on page 48
OnCommand Insight overview | 27

Setting up Insight
To setup Insight, you need to enter the Insight licenses, set up your data sources, define users andnotifications, enable backups, and perform any required advanced configuration steps.
After the OnCommand Insight system is installed, the administrator needs to perform these setuptasks:
• Install your Insight licenses.
• Set up your data sources in Insight.
• Set up user accounts.
• Configure your email.
• Define your SNMP notifications.
• Enable automatic weekly backups of your Insight database.
• Perform any advanced configuration steps required, including defining annotations andthresholds.
Related concepts
Licenses no longer compliant on page 152
Upgrading Insight on page 173
Related tasks
Updating expired licenses on page 31
Opening InsightAfter you install Insight, you must install your licenses and then set up Insight to monitor yourenvironment. To do this, you can use a web browser to open Insight from the Insight server or fromanother location.
Steps
1. Do one of the following:
• If you are opening Insight from the Insight server, enter the following:
https://localhost:<Insight_Server_port>
• If you are opening Insight from any location, enter the following URL:
28 | Configuration and Administration Guide

https://<Insight_Server_hostname>:<Insight_Server_port>
The port number is either 443 or another port as configured when the Insight server wasinstalled. The port number defaults to 443 if you do not specify it in the URL.
The OnCommand Insight dialog box displays.
2. Do one of the following:
a. If you have the Perform license, enter your user name and password and click OK.
The following table lists the default user name and password. Best Practice: Change thesedefaults as soon as possible after installation.
Data Value
Default user name admin
Default password admin123
b. If you do not have the Perform license and your user account does not have Administrator
permissions, click to access the Java UI.
Result
When you first open Insight (the web UI) after installation, you must install the licenses to use theproduct. If the licenses have been installed, the data source setup page opens.
Related tasks
Updating expired licenses on page 31
Setting up Insight | 29

Upgrading Insight Server software on page 173
Installing your Insight licensesAfter you receive the license file containing the Insight license keys from NetApp, you can use thesetup features to install all of your licenses at the same time.
About this task
Insight license keys are stored in a .txt or .lcn file.
Steps
1. Open the license file in a text editor and copy the text.
2. Open Insight in your browser.
3. Click the Admin icon on the toolbar.
4. Click Setup.
5. Click the Licenses tab.
6. Click Update License.
7. Copy the license key text into the License text box.
8. Select the Update (most common) operation.
9. Click Save.
After you finish
After installing the licenses, you can perform these configuration tasks:
• Configure data sources.
• Create OnCommand Insight user accounts.
See the Insight Help or the OnCommand Insight Configuration and Administration Guide forinstructions.
30 | Configuration and Administration Guide

Updating expired licenses
If one or more of your Insight licenses expired, you can update the licenses quickly using the sameprocedure as you did to install the licenses originally.
Steps
1. In a text editor, such as Notepad, open the new license file you received from NetApp Supportand copy the license key text to your Windows Clipboard.
2. Open OnCommand Insight in your browser.
3. Click the Admin icon on the toolbar.
4. Click Setup.
5. Click the Licenses tab.
6. Click Update License.
7. Copy the license key text into the License text box.
8. Select the Update (most common) operation.
This operation adds your new licenses to any currently active Insight licenses.
9. Click Save.
OnCommand Insight licenses
OnCommand Insight OCI operates with licenses that enable specific features on the Insight Server.
Discover
Basic Insight license that supports Inventory.
Assure
Supports Inventory and Assurance policy and violation functionality.
Perform
Supports Inventory and Performance and policy management.
Plan
Supports the Inventory and Planning functions.
Licenses are based on the following product characteristics:
• By terabyte of managed capacity
• By time (or perpetual)
Setting up Insight | 31

• By product (Assure, Perform, and Plan), which can be purchased separately.
License keys are a set of unique strings that are generated for each customer. Obtain them from yourOnCommand Insight representative.
Your installed licenses control the options available in the OCI software:
License Assurance menu Planning menu
Perform only • Changes
• Switch Port PerformanceAlerts
• Port Balance Violations
• Disk Utilization Violations
Does not appear
Plan only • Reservation Violations • Requests
• Pending Tasks
Setting up and managing user accountsUser accounts, user authentication, and user authorization can be defined and managed in either oftwo ways: in Microsoft Active Directory (Version 2 or 3) LDAP (Lightweight Directory AccessProtocol) server, or in an internal OnCommand Insight user database. Having a different user accountfor each person provides a way of controlling the access rights, individual preferences, andaccountability. Use an account that has Administrator privileges for this operation.
Before you begin
You must have completed the following tasks:
• Install your OnCommand Insight licenses.
• Allocate a unique user name for each user.
• Determine what passwords to use.
• Assign the correct user roles.
Steps
1. Open Insight in your browser.
2. Click the Admin icon on the toolbar.
32 | Configuration and Administration Guide

3. Click Setup.
4. Select the Users tab.
5. To create a new user, click the Actions button and select Add user.
You enter the Name, Password, Email address, and select one of the user Roles asAdministrator, User, or Guest.
6. To change a user's information, select the user from the list and click the Edit user accountsymbol to the right of the user description.
7. To remove a user from the OnCommand Insight system, select the user from the list and clickDelete user account to the right of the user description.
Result
When a user logs in to OnCommand Insight, the server first attempts to authenticate through LDAP,if LDAP is enabled. If OnCommand Insight cannot locate the user on the LDAP server, it searches inlocal Insight database.
Insight user roles
Each user account is assigned one of the three possible permission levels.
• Guest permits you to log into Insight and to view the various pages. If your user account isdefined to the OnCommand Insight local user database (and not through LDAP), you can alsomodify your own password. This account type does not allow you to perform actions such asidentifying generic devices and defining the policies in the Java UI.
• User permits all guest-level privileges, as well as access to Insight operations such as definingpolicy and identifying generic devices. The User account type does not allow you to perform datasource operations, nor to add or edit any user accounts other than your own.
• Administrator permissions vary depending on whether you use LDAP:
◦ If you authenticate and authorize users through LDAP, this level of permission allows youmanage data sources.
◦ If you use only the local database to manage users, this level of permission allows youperform any operation, including adding new users and managing data sources.
Best Practice: Limit the number of users with Administrator permissions by creating most accountsfor users or guests.
Setting up Insight | 33

Configuring user definitions using LDAP
To configure OnCommand Insight (OCI) for user authentication and authorization from an LDAPserver, you must be defined in the LDAP server as the OnCommand Insight server administrator.
About this task
This procedure assumes that you are using Microsoft Active Directory Version 2 or 3 LDAP(Lightweight Directory Access Protocol).
LDAP users display along with the locally defined users in the Users list.
Steps
1. On the toolbar, click the Admin icon.
2. Click Setup.
3. Click the Users tab.
4. Scroll to the bottom of the page to display the LDAP setup, as shown here.
5. Click Enable LDAP to allow the LDAP user authentication and authorization.
6. Enter the credentials for a user authorized for directory lookup queries in these fields:
• LDAP servers (To import the Insight certificate for this field, click Certificates.)
• User name
• Password (To confirm this password on the LDAP server, click Validate.)
34 | Configuration and Administration Guide

Note: The IP address or DNS name to identify the LDAP server, typically is entered in thisformat:
ldap:// <ldap-server-address>:port
or use the default port:
ldap://<ldap-server-address>
7. If you want to define this LDAP user more precisely, click Show more and enter information forany of these attributes.
The default settings are valid for the Active Directory.
Admins group
Value of the Role Attribute that identifies the user as having Administrator privileges(defaults to sanscreen.admin).
Users group
Value of the Role Attribute that identifies the user as having User privileges (defaults tosanscreen.users).
Guests group
Value of the Role Attribute that identifies the user as having Guest privileges (defaults tosanscreen.guests).
Server admins group
Value of the Role Attribute that identifies the user as having Server Administratorprivileges (defaults to sanscreen.server.admin).
Timeout
Length of time to wait for a response from the LDAP server before timing out, inmilliseconds (defaults to 2,000, which is adequate in all cases and should not bemodified).
Domain
LDAP node where OnCommand Insight should start looking for the LDAP user (typicallythe top-level domain for the organization). For example:
DC=<enterprise>,DC=com
User principal name attribute
Attribute that identifies each user in the LDAP server (defaults to userPrincipalName,which is globally unique). OnCommand Insight attempts to match the contents of thisattribute with the username that has been supplied.
Setting up Insight | 35

Role attribute
LDAP attribute that identifies the user role (defaults to memberOf).
Mail attribute
LDAP attribute that identifies the user email address (defaults to mail). This is useful ifyou want to subscribe to the OnCommand Insight reports available from OnCommandInsight. OnCommand Insight picks up the user email address the first time each user logsin and does not look for it after that.
Note: If the email address changes on the LDAP server, make sure to change itmanually in OnCommand Insight.
Distinguished name attribute
LDAP attribute that identifies the user distinguished name (defaults todistinguishedName).
8. Click Save.
Changing user passwords
A user with administrator privileges can change the password for any OnCommand Insight useraccount defined on the local server.
Before you begin
The following items must have been completed:
• Notifications to anyone who logs into the user account you are modifying.
• New password to be used after this change.
About this task
When using this method, you cannot change the password for a user who is validated through LDAP.
Steps
1. Log in with administrator privileges.
2. Click the Admin icon on the toolbar.
3. Click Setup.
4. Click the Users tab.
5. Locate the row that displays the user account you want to modify.
6. To the right of the user information, click Edit user account.
7. Enter the new Password and then enter it again in the verification field.
36 | Configuration and Administration Guide

8. Click Save.
Editing a user definition
A user with administrator privileges can edit a user account to change the email address or roles forOnCommand Insight or DWH and reporting functions.
Before you begin
Determine the type of user account (OnCommand Insight, DWH or a combination) that needs to bechanged.
About this task
For LDAP users, you can only modify the email address using this method.
Steps
1. Log in with administrator privileges.
2. Click the Admin icon on the toolbar.
3. Click Setup.
4. Click the Users tab.
5. Locate the row that displays the user account you want to modify.
6. To the right of the user information, click the Edit user account icon.
7. Make the necessary changes.
8. Click Save.
Deleting a user account
Any user with Administrator privileges can delete a user account, either when it is no longer used(for a local user definition) or to force OnCommand Insight to rediscover the user information thenext time the user logs in (for an LDAP user).
Steps
1. Log into OnCommand Insight with Administrator privileges.
2. Click the Admin icon on the toolbar.
3. Click Setup.
4. Click the Users tab.
Setting up Insight | 37

5. Locate the row that displays the user account you want to delete.
6. To the right of the user information, click the Delete user account "x" icon.
7. Click Save.
Setting up weekly backups for your Insight databaseYou might want to set up automatic weekly backups for your Insight database to protect your data.These automatic backups overwrite the files in the specified backup directory.
About this task
Best practice: When you are setting up the weekly backup of the OCI database, you need to store thebackups on a different server than Insight is using, in case that server fails. Do not store any manualbackups in the weekly backup directory because each weekly backup overwrites the files in thedirectory.
Steps
1. On the Insight toolbar, click the Admin icon.
2. Click Setup.
3. Click the Backup/ASUP tab.
4. Select Enable weekly backup as shown in this example.
5. Enter the path to the Backup location on a different server that is accessible from the Insightserver.
6. Select the Cleanup option to keep either the last two or the last five backups.
7. Click Save.
38 | Configuration and Administration Guide
Related tasks
Restoring the Insight database on page 150
Backing up the Data Warehouse database on page 175
Configuring your emailYou need to configure OnCommand Insight to enable it access your email system.
The OnCommand Insight Server uses your email to deliver reports to which you subscribe, andtransports support information for troubleshooting to NetApp technical support.
Email configuration prerequisites
Before you can configure OnCommand Insight to access your email system, you need to discover thehost name or IP address to identify the (SMTP or Exchange) mail server and allocate an emailaccount for OnCommand Insight reports.
Ask your email administrator to create an email account for OnCommand Insight. You will need thefollowing information:
• The host name or IP address to identify the (SMTP or Exchange) mail server used by yourorganization. You can find this information through the application you use to read your email. InMicrosoft Outlook, for example, you can find the name of the server by viewing your accountconfiguration: Tools - E-mail accounts - View or change existing email account.
• Name of email account through which OnCommand Insight will send regular reports. Theaccount must be a valid email address in your organization. (Most mail systems will not sendmessages unless they are sent from a valid user.) If the email server requires a user name andpassword in order to send mail, obtain this information from your system administrator.
Configuring your email for Insight
If your users want to receive Insight reports in their email accounts, you need to configure your emailserver for this feature.
Steps
1. On the Insight toolbar, click the Admin icon.
2. Click Setup.
3. Click the Notifications tab.
4. In the Email section of the page, enter the following information for your email:
Server
Setting up Insight | 39

SMTP server in your organization, identified using either a hostname or an IP address(nnn.nnn.nnn.nnn format). If you specify a hostname, make sure the name can be resolvedthrough DNS.
User
Sender email account to be identified as the sender on all OnCommand Insight reports.This account must be a valid email account within your organization.
Password
Password to access the email server, required only if your SMTP server is protected by apassword. This is the same password you use to log into the application that lets you readyour email. Enter it a second time for verification.
Email Address
Recipient email address.
Signature Text
Email signature of the sender
5. Click Save & Test.
Configuring SNMP notificationsOnCommand Insight supports SNMP notifications for changes and violations. For example, SNMPnotifications are sent when data source thresholds are exceeded.
Before you begin
The following must have been completed:
• Identifying the IP address of the server that consolidates traps for each type of event. You mayhave to consult with your system administrator to obtain this information.
• Identifying the port number through which the designated machine obtains SNMP traps, for eachtype of event. (The default port for SNMP traps is 162.)
• Compiling the MIB at your site. The proprietary MIB comes with the installation software tosupport OnCommand Insight traps. The NetApp MIB is compatible with all standard SNMPmanagement software.
Steps
1. On the Insight toolbar, click the Admin icon.
2. Click Setup.
3. Click the Notifications tab.
40 | Configuration and Administration Guide
4. Scroll down to the SNMP section of the page.
5. Click Actions and select Add trap source.
6. In the Add SNMP trap recipients dialog box, enter these values:
IP
The IP address to which OnCommand Insight sends SNMP trap messages.
Port
The port number to which OnCommand Insight sends SNMP trap messages.
Community String
Enter "public" for SNMP trap messages.
7. Click Save.
Enabling the syslog facilityYou can identify a location for the log of the OnCommand Insight violations and performance alertsand activate the logging.
Before you begin
You need to know:
• IP address of the server to store the system log
• Facility level that corresponds to the type of program that is logging the message, such asLOCAL1 or USER
About this task
The syslog includes the following types of information:
• Violation changes
• Performance alerts
The following units are used:
• Utilization metrics: percentage
• Traffic metrics: MB
• Traffic rate: MB/s
Steps
1. On the Insight toolbar, click the Admin icon.
Setting up Insight | 41

2. Click the Notifications tab and scroll down to the Syslog section of the page.
3. Check the Syslog Enabled box.
4. In the Server field, enter the log server IP address.
5. In the Facility field, select the facility level corresponding to the type of program that is loggingthe message.
6. Click Save.
Insight syslog contents
You can enable a syslog on a server to collect Insight violation and performance alert messages thatinclude utilization and traffic data.
Message types
The Insight syslog lists three types of messages:
• SAN path violations
• General violations
• Performance alerts
Data provided
Violation descriptions include the elements involved, time of the event, and relative severity orpriority of the violation.
Performance alerts include these data:
• Utilization percentages
• Traffic types
• Traffic rate measured in MB
Configuring your ASUP processingAll NetApp products are equipped with automated capabilities to provide the best possible supportfor our customers. This automated support (ASUP) periodically sends predefined, specific,
42 | Configuration and Administration Guide

information to Customer Support. You control what information is forwarded to NetApp, and howoften it is sent. No data is forwarded unless you first configure OnCommand Insight to do so.
About this task
The information is forwarded to NetApp using FTP, HTTP, HTTPS, or email depending on yourconfiguration selections. The forwarded data contains minimal sensitive information. For example,the files do not contain clear text passwords. Instead, the backup includes the hashed representationof user passwords and is encrypted for device passwords. The default values on the Backup/ASUPpage are the values provided during your Insight installation.
Steps
1. Click the Admin icon on the toolbar.
2. Click Setup.
3. Click the Backup/ASUP tab.
4. In the ASUP section, select Enable ASUP to activate facility.
5. You might want to change your corporate information in these fields:
• Company name
• Site name
6. Select your preferences for these options:
• What to send: Logs, Inventory data, Performance data
• How to send: HTTP, HTTPS, FTP, email
7. At this point, if you want to test the ASUP configuration, click Test Connection and click Save ifyour connection test was successful.
If you need more detailed information for your ASUP, enter any information you require in theshaded fields on this page.
8. Enter the size and split file limits:
• Size limit: for email ASUP data transmission, enter the maximum data size to be sent.
• Split Files if bigger than: for email ASUP data transmission, indicate the cutoff point for filesize. The default split file size is 1 MB.
9. If you selected the HTTP or HTTPS protocol for ASUP data transmission to connect to theInternet, you also need to enable the proxy and define it. If you selected FTP or emailtransmission, you can skip to Test Connection.
Setting up Insight | 43

• Enable Proxy: select for the HTTP or HTTPS ASUP data transmissions.
• Proxy Host: identify the proxy server used to connect to the Internet.
• Proxy Port: identify the proxy port for the ASUP data transmission.
• Proxy User: specify the credentials to use for ASUP data transmission.
• Proxy Password: specify the credentials to use for ASUP data transmission.
10. Click Test Connection to be certain the connection you specified works.
11. Click Save.
Creating custom dashboardsIn addition to using the default Assets Dashboard and Violations Dashboard, you can create customdashboards that contain only the specific data that you want to see for your network. After you createa custom dashboard, you can view it by selecting it from the Dashboards menu.
Before you begin
You must use an account that has Administrator privileges.
About this task
It is possible to have the following scenarios when two users with administrator privileges(Administrator A and Administrator B) are creating and modifying dashboards simultaneously:
• If Administrator A creates a new dashboard, it immediately appears as an option on AdministratorA's Dashboard menu; however, the new dashboard does not appear as an option onAdministrator B's Dashboard menu until an action occurs that causes a refresh of the Dashboardmenu.
• When Administrator A and Administrator B both try to save changes to the same dashboard at thesame time, one receives a message saying that the changes were not made because of the conflict.If you receive this message, you should reload the page and make your changes again.
Steps
1. Open Insight in your browser.
2. From the Dashboards menu, select Create Dashboard.
The New Dashboard page displays.
44 | Configuration and Administration Guide

“New Dashboard” is the default name for the dashboard.
3. From the Customize menu, select Rename Dashboard, type a name, and then click OK.
4. Use one of these methods to begin to add widgets to the dashboard:
• Click the Add a new widget link.
• From the Customize menu, select Add Widget.
Either method opens the Widget Library dialog box, which lists all the available widgets. Bydefault, it displays all the widgets.
Setting up Insight | 45

5. To filter the widgets in the dialog box by type, click Admin, Performance, or Assets.
6. To add a widget to the dashboard, click Add Widgets under any widget.
7. To add additional widgets to the dashboard, select Add Widgets from the Customize menu, clickAdd Widget, and repeat this action until you are satisfied with the contents of the dashboard.
You can add the same widget multiple times. After you add three widgets, a new row is created inthe dashboard. There is no limit to the number of widgets that the dashboard can contain.
8. To modify the settings of a widget:
a. Click in the upper-right corner of the widget.
The Widget Settings dialog box lists the settings that you can change for the widget, as shownin this example for the Asset Performance Table:
46 | Configuration and Administration Guide

b. Make the changes you want, and click Save.
9. To delete a widget from the dashboard:
a. Click in the upper-right corner of the widget.
b. In the confirmation message, click OK.
10. To change the order in which the widgets are placed on the dashboard:
a. From the Customize menu, select Arrange Widgets.
b. In the Arrange Widgets dialog box, click the up arrow or down arrow next to a particularwidget to change its order in the dashboard and then click Save.
Related references
What custom dashboards enable you to do on page 22
Setting up Insight | 47

Deleting a custom dashboard
You can delete a custom dashboard when it is no longer needed.
Before you begin
You must use an account that has Administrator privileges.
Steps
1. Log in to OnCommand Insight.
2. From the Dashboards menu, select the custom dashboard that you want to delete.
3. From the Customize menu, select Delete Dashboard.
4. In the confirmation message, click OK.
The dashboard is deleted, and the default dashboard, the Assets Dashboard, displays.
Changing Storage Manager Dashboard settingsYou can configure target values for capacity based on future usage projection dates and ranges forservice level objectives (SLO) for some of the Storage Manager Dashboard components. Forexample, you can configure the Summary to show the target and forecast for the end of the financialyear so that you can track how you are growing capacity compared with the forecast; this enables youto adjust trajectories and budget allocation.
Steps
1. Open Insight in your browser.
2. On the Insight toolbar, click to open the Reporting Portal.
3. In the login window, enter your user name and password and click Login.
The Storage Manager Dashboard displays in the Insight Reporting window.
4. In the Public Folder list, click the Set properties icon to the far right of the Storage ManagerReport folder.
48 | Configuration and Administration Guide

5. Click the Report tab.
6. Click Edit.
The Storage Manager Dashboard Settingspage displays:
7. For Summary, you can do the following:
Setting up Insight | 49

• In Enter Target for Capacity in PB, enter a target for capacity in petabytes and then select adate from the Select future usage projection date list to specify the projected time period inwhich capacity should not exceed the target.
In the example page shown above, an alert (solid red circle) appears next to Capacity intheSummarysection of the Storage Manager Dashboard when storage capacity exceeds 1petabyte before January 1, 2015.
• In Enter Target for FC Switch Ports in %, enter a target percentage for the number ofswitch ports connected, which Insight compares against the total number of switch ports.
8. For Storage Tiers Capacity, enter a target percentage in Enter Target for Capacity in % forstorage tier capacity.
Insight uses the date in the Select future usage projection date list as the projected time periodin which storage tier capacity should not exceed the target.
In the example page shown above, an alert (solid red circle) appears next to the storage tier in theStorage Tiers Capacity section of the Storage Manager Dashboard when the used capacity of astorage tier exceeds 80% of the usable capacity before January 1, 2015.
9. For Top 10 Applications, enter a value in SLO Start and in SLO End to create a range foracceptable response times.
In the example page shown above, an alert (solid red circle) appears next to the application in theTop 10 Applications section of the Storage Manager Dashboard when the median response time isgreater than 100 milliseconds
10. For Storage Tiers Daily Performance, you can do the following:
• Enter a value in SLO Start and in SLO End to create a range for acceptable response times.
• Enter a value in SLO Start and in SLO End to create a range for acceptable input/outputoperations per second (IOPS).
In the example page shown above, an alert (solid red circle) appears next to the storage tier intheStorage Tiers Daily Performance section of the Storage Manager Dashboard when the medianresponse time of a storage tier is greater than 500 milliseconds or the median IOPS is greater than2000 seconds.
11. Click Finish.
12. To make the changes take effect immediately:
a. Go to the Public Folders list in the Reporting Portal.
b. Click the Storage Manager Dashboard folder.
c. Click the Run with options icon to the far right of the Storage Manager Report folder.
d. Click Save the report.
50 | Configuration and Administration Guide

e. Click Run.
Alternatively, you can wait until the Extract, Transform, and Load (ETL) process runs, which alsoapplies any changes.
Managing performance policiesOnCommand Insight enables you to create performance policies to monitor your network for variousthresholds and to raise alerts when those thresholds are crossed. Using performance policies, you candetect a violation of a threshold immediately, identify the implication, and analyze the impact androot cause of the problem in a manner that enables rapid and effective correction.
A performance policy enables you to set thresholds on any objects (datastore, disk, hypervisor,internal volume, port, storage, storage node, storage pool, VMDK, virtual machine, and volume) withreported performance counters (for example, total IOPS). When a violation of a threshold occurs,Insight detects and reports it in the associated asset page, by displaying a red solid circle; by emailalert, if configured; and in the Violations Dashboard or any custom dashboard that reports violations.
Creating performance policies
You create performance policies to set thresholds that trigger alerts to notify you about issues relatedto the resources in your network. For example, you can create a performance policy to alert you whentotal utilization for storage pools is greater than 60%.
About this task
By default, Insight provides two latency policies, Tier 1 and Tier 2, for internal volume and volumeobjects, which you can modify or delete if they are not applicable to your environment.
Steps
1. Open Insight in your browser.
2. From the Manage menu, select Performance Policies.
The Performance Policies page displays:
Setting up Insight | 51

Policies are organized by object and are evaluated in the order in which they appear in the list forthat object.
3. Click Add new policy.
The Add Policy dialog box displays:
52 | Configuration and Administration Guide

4. In the Name box, enter a name for the policy.
You must use a name that is different from any of the other policy names for the object. Forexample, you cannot have two policies named “Latency” for an internal volume; however, youcan have a “Latency” policy for an internal volume and another one for a different volume. Thebest practice is to always use a unique name for any policy regardless of the object type.
5. In the Apply to objects of type list, select the type of object to which the policy applies.
6. In the With annotation list, select an annotation type, if applicable, and enter a value for theannotation in the Value box to have the policy apply only to objects that have this particularannotation set.
7. If you selected Port as the object type, select which the port is connected to in the Connected tolist.
8. In the Apply after a window of list, select when an alert is raised to indicate a violation when thethreshold is crossed.
The First occurrence option triggers an alert when a violation of a threshold occurs on the firstsample of data. All other options trigger an alert when if the threshold is crossed once and iscontinuously crossed for at least the specified amount of time.
9. In the With violation severity list, select the severity for the violation, depending on howimportant the violation is to the data center environment.
Setting up Insight | 53

10. From the Create alert if lists, select a performance counter and an operator, and then enter avalue to create a threshold.
11. Click Add threshold to add more thresholds.
12. To remove a threshold, click the trash can icon.
13. Check the Stop processing further policies if alert is generated box if you want the policy tostop processing when an alert occurs.
Example
For example, if you have four policies for datastores and the second policy is configured to stopprocessing when an alert occurs, the third and fourth policies are not processed while a violationof the second policy is active.
14. Click Save.
The Performance Policies page displays, and the performance policy appears in the list of policiesfor the object type.
Performance policy evaluation precedence
The Performance Policies page groups policies by object type and Insight evaluates the policies in theorder in which they appear in the object's performance policy list. You can change the order in whichInsight evaluates policies in order to show the information that is most important to you in yournetwork.
Insight evaluates all policies that are applicable to an object sequentially when performance datasamples are taken into the system for that object; however, depending on annotations, not all policiesapply to one group of objects. For example, suppose that internal volume has the following policies:
• Policy 1 (the Insight-supplied default policy)
• Policy 2 (with an annotation of “Service Level = Silver” with the Stop processing furtherpolicies if alert is generated option
• Policy 3 (with an annotation of“Service Level = Gold”)
• Policy 4
For an internal volume tier with a Gold annotation, Insight evaluates Policy 1, ignores Policy 2, andthen evaluates Policy 3 and Policy 4. For an unannotated tier, Insight evaluates by the order of thepolicies; thus, Insight evaluates only Policy 1 and Policy 4. For an internal volume tier with a Silverannotation, Insight evaluates Policy 1 and Policy 2; however, if an alert is triggered when the policy'sthreshold is crossed once and is continuously crossed for the window of time specified in the policy,then Insight no longer evaluates the other policies in the list while it evaluates the current counters forthe object. When Insight captures the next set of performance samples for the object, it again beginsto evaluate the performance policies for the object by filter and then order.
54 | Configuration and Administration Guide

Changing the precedence of a performance policy
By default, Insight evaluates an object's policies sequentially. You can configure the order in whichInsight evaluates performance policies. For example, if you have a policy configured to stopprocessing when a violation occurs for Gold Tier storage, you can place that policy first in the listand avoid seeing more generic violations for the same storage asset.
Steps
1. Open Insight in your browser.
2. From the Manage menu, select Performance Policies.
The Performance Policies page displays.
3. Hover your cursor over a policy name in an object type's performance policy list.
The precedence arrows appear to the right of the policy.
4. To move a policy up in the list, click the up arrow; to move a policy down in the list, click thedown arrow.
By default, new policies are added sequentially to an object's list of policies.
Editing performance policies
You can edit existing and default performance policies to change how Insight monitors the conditionsof interest to you in your network. For example, you might want to change a policy's threshold.
Steps
1. Open Insight in your browser.
2. From the Manage menu, select Performance Policies.
The Performance Policies page displays.
3. Hover your cursor over a policy name in an object's performance policy list.
4. Click .
The Edit Policy dialog box displays.
5. Make the required changes.
If you change any option other than the policy name, Insight deletes all existing violations for thatpolicy.
6. Click Save.
Setting up Insight | 55

Deleting performance policies
You can delete a performance policy if you feel that it is no longer applicable to monitoring theobjects in your network.
Steps
1. Open Insight in your browser.
2. From the Manage menu, select Performance Policies.
The Performance Policies page displays.
3. Hover your cursor over the name of a policy in an object's performance policy list.
4. Click .
A message appears, asking if you want to delete the policy.
5. Click OK.
56 | Configuration and Administration Guide

Insight data source management
Data sources are the most critical component when maintaining a OnCommand Insight environment.Because they are the primary source of information for Insight, it is imperative that data sources bemaintained in a running state.
You can monitor the data sources in your network and select a data source to check the events relatedto the status, and any changes that might have caused problems.
In addition to examining the individual data source, you can perform these operations:
• Cloning a data source to create many similar data sources in Insight
• Edit the data source information
• Change credentials
• Control polling
• Delete the data source
• Install data source patches
• Prepare an error report for NetApp Customer Support
Related concepts
Data source patches on page 138
Changes causing data collection problems on page 131
Setting up your data sources in InsightData sources are the most critical component when trying to maintain a Insight environment. Datasources discover network information that is used for analysis and validation. You need to configureyour data sources within Insight so that they can be monitored within your network.
For each data source, the specific requirements to define that data source depend on the vendor andmodel of the corresponding devices. Before adding the data sources, you need network addresses,account information, and passwords for all devices and possibly these additional details:
• Switches
• Device management stations
• Storage systems that have IP connectivity
• Storage management stations
57

• Host servers running management software for storage devices that do not have IP connectivity
For more information about your data source definitions, see the "Vendor-specific data sourcereference" information in this section.
Related concepts
Insight data source management on page 57
Related tasks
Cloning a data source on page 61
Related references
Vendor-specific data source reference on page 62
Data source support information
As part of your installation and configuration planning, you should ensure that the devices in yourenvironment can be monitored by Insight. To do so, check the Interoperability Matrix Tool (IMT) andthe data source support matrix for details about operating systems, specific devices, and protocols.Some data sources might not be available on all operating systems.
To see the operating systems that Insight supports, refer to mysupport.netapp.com/matrix andcompare your environment with details in the IMT.
After installation, you can access a data source matrix from the Insight web UI by using the Helpicon on the toolbar and then the Data source support matrix option.
Adding data sources
You can add data sources quickly.
Steps
1. Open Insight in your browser.
2. If the Data sources table is not displayed, click the Admin icon on the toolbar to open it.
3. Click the Actions button and select the Add data source option.
4. Enter your network Name for the new data source, as shown in this example.
5. In the Add data source dialog box, select the Vendor and Model of the data source from the pull-down lists.
Example
58 | Configuration and Administration Guide

6. Select any What to collect additional options. These selections change the available fields in theConfiguration and Advanced configuration sections.
In this example, these options are Inventory and Array Performance. Inventory is always selectedand cannot be changed. Other possible data collection options are Switch Performance, VMPerformance, and Replication (for data synchronization).
7. Click the Configuration link and enter the basic setup information required for the data sourcewith your selected data collection type.
If this is all of the information needed for the data source, you might click the Test link at thispoint.
8. If this type of data source usually requires more detailed information to set it up in your network,click the Advanced configuration link to enter additional information. If you do not have theinformation required for the advanced configuration, see the "Vendor-specific data sourcereference" information for that data source.
9. Click the Test link to be certain the data source is properly configured.
10. Click Save.
Related concepts
Data source support information on page 58
Related tasks
Cloning a data source on page 61
Insight data source management | 59

Related references
Vendor-specific data source reference on page 62
Testing the data source configuration on page 62
Importing data sources from a spreadsheet
You can import multiple data sources into OnCommand Insight from a spreadsheet. This might behelpful if you already maintain your discovery devices in a spreadsheet. This process adds new datasources, but cannot be used to update existing data sources.
About this task
OnCommand Insight includes a spreadsheet to help you create data sources. This spreadsheet has thefollowing attributes:
• The spreadsheet can be used with Microsoft Excel 2003 or later.
• Each tab holds one data source type, for example, Brocade SSH/CLI.
• Each row represents an instance of a new data source to be created.
The spreadsheet includes a macro that creates a new data source in OnCommand Insight.
Steps
1. Locate the spreadsheet in the <install_directory>/SANscreen/acq/bin/acqcli/SiteSurvey_DataSourceImporter_w_Macro.zip.
2. In the spreadsheet, enter data source information in the cells with color.
3. Delete empty rows.
4. From the spreadsheet, run the CreateDataSources macro to create the data sources.
5. When prompted for credentials, enter the OnCommand Insight Server administration user nameand password.
The results are logged in the acquisition log.
6. A prompt asks if the machine currently running the macro has OnCommand Insight installed.
Select one of the following:
• No: Select "No" if a batch file will be created that must be run on the OnCommand Insightmachine. Run this batch file from the install directory.
• Yes: Select "Yes" if OnCommand Insight is already installed and no additional steps arerequired to generate the data source information.
7. To verify the addition of the data sources, open Insight in your browser.
60 | Configuration and Administration Guide
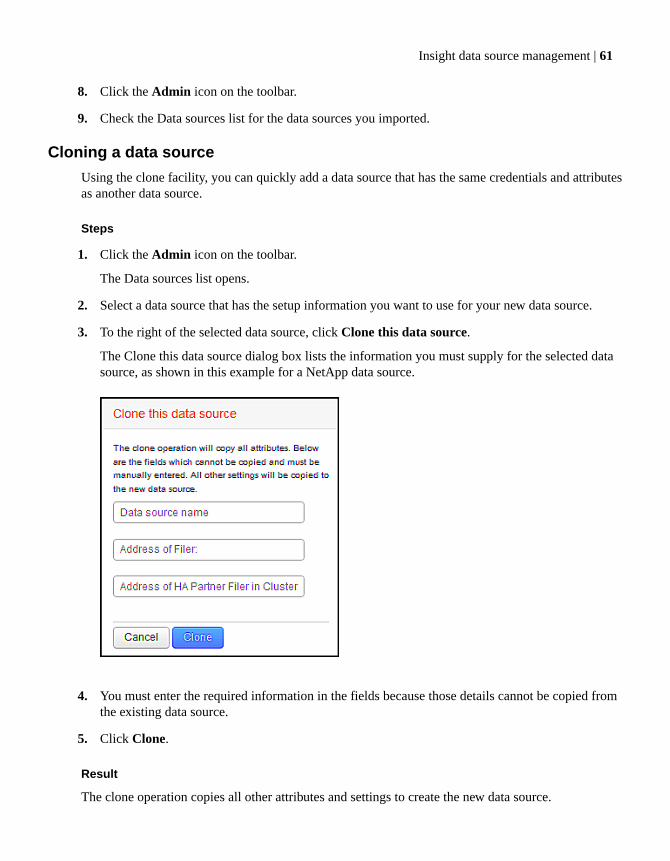
8. Click the Admin icon on the toolbar.
9. Check the Data sources list for the data sources you imported.
Cloning a data source
Using the clone facility, you can quickly add a data source that has the same credentials and attributesas another data source.
Steps
1. Click the Admin icon on the toolbar.
The Data sources list opens.
2. Select a data source that has the setup information you want to use for your new data source.
3. To the right of the selected data source, click Clone this data source.
The Clone this data source dialog box lists the information you must supply for the selected datasource, as shown in this example for a NetApp data source.
4. You must enter the required information in the fields because those details cannot be copied fromthe existing data source.
5. Click Clone.
Result
The clone operation copies all other attributes and settings to create the new data source.
Insight data source management | 61

Related concepts
Data source support information on page 58
Related references
Vendor-specific data source reference on page 62
Testing the data source configuration
When you are adding a data source, you can verify the correctness of configuration to communicatewith the device before saving or updating that data source.
When you click Test in the data source wizard, Insight tests the important inventory and performanceconfiguration details for the specific data source. The test produces one of these results:
• PASSED: the data source is configured correctly for Insight.
• WARNING: the testing was incomplete, probably due to timing out during processing oracquisition not running.
• FAILED: the data source, as configured, cannot communicate with the specified device.
Related tasks
Adding data sources on page 58
Editing data source information on page 135
Vendor-specific data source referenceThe configuration details vary depending on the vendor and model of the data source being added.
If a vendor's data source requires advanced Insight configuration instructions, such as specialrequirements and specific commands, that information is included in this section.
Related concepts
Data source support information on page 58
Related tasks
Adding data sources on page 58
Cloning a data source on page 61
62 | Configuration and Administration Guide

3PAR InServ Firmware 2.2.2+ (SSH) data source
OnCommand Insight uses the 3PAR InServ Firmware 2.2.2+ (SSH) data source to discover inventoryHP 3PAR StoreServ storage arrays.
Configuration
Field Description
Cluster IP(s) IP address of the storage.
User Name Name used to log in to the 3PAR device.
Password Password used to log in to the 3PAR device.
SMI-S Host IP IP address of the SMI-S Provider Host.
SMI-S User Name Username Name used to log in to the SMI-S Provider Host.
SMI-S Password Password used to log in to the SMI-S Provider Host.
Requirements
• Read-only user name and password to the InServ Server
• Validated access by using telnet to port 22
Note: No third-party software is required.
Advanced configuration
Field Description
Inventory PollInterval (min)
Interval, in minutes, at which the data source should poll the device forinventory information
Exclude Devices A comma-separated list of device IP addresses that should not be polled
SSH Process WaitTimeout (sec)
The time in seconds waiting for the command to finish. If not completedwhen timeout expires, the run fails.
Number of SSHRetries
Maximum number of retry attempts for a given command
SSH Banner WaitTimeout (sec)
Timeout for obtaining the first prompt after connection to the device
SMI-S Port Port number of the SMI-S Provider Host
Protocol The protocol used to connect to SMI-S provider
Insight data source management | 63

Field Description
SMI-S Namespace Interoperability namespace that the SMI-S provider is configured to use
Performance PollInterval (sec)
Interval, in seconds, at which the data source should poll the device forperformance information
Number of SMI-SConnection Retries
Maximum number of retry attempts for a given command
Commands
• showsys -csvtable
• showversion -a
• showlicense
• showport -csvtable
• showport -par -csvtable
• showld -csvtable
• showld -d -csvtable
• showpd -i -csvtable
• showpd -csvtable
• showvv -r -csvtable
• showld -d -csvtable
• showvv -csvtable
• showvlun -a -csvtable
• showhost -d -csvtable
• showcpg -r -csvtable
• showrcopy -csvtable
64 | Configuration and Administration Guide

Brocade EFCM (9.5, 9.6, 9.7) data sources
For configuration, this data source requires the network address for the Enterprise FabricConnectivity Manager (EFCM) server.
Configuration
Field Description
EFC server Network address for the Enterprise FabricConnectivity (EFC) server, specified as an IP(nnn.nnn.nnn.nnn format), or as a hostname thatcan be resolved through DNS.
User Name Name used to log into the switch.
Password Password used to log into the McData device.
Advanced configuration
Field Description
Inventory Poll Interval (min) Interval, in minutes, at which the data source should poll theEFC. The default is 15.
Fabric Name Fabric name to be reported by this data source (blank to reportthe fabric WWN).
Communication Port The default is -1.
Enable Trapping Check box used to trigger acquisition upon receiving an SNMPtrap from the device. If you mark this box, you must alsoactivate SNMP notifications.
Minimum Time Between Traps(sec)
Minimum elapsed time between acquisition attempts triggeredby traps, in seconds. The default is 15.
Inactive Zonesets List of inactive zone sets on which to perform acquisition (inaddition to performing acquisition on the active zone sets).Separate multiple zone sets using a comma.
NIC to Use Applicable when the data source reports to a RemoteAcquisition Unit that has two or more network cards: one usedto acquire information about SAN devices, and the other usedto connect with the Insight server. Indication of which networkinterface to use on the RAU when reporting on SAN devices.
Exclude Devices Comma-separated list of devices that will not be discovered bythis data source.
Insight data source management | 65

Field Description
Use the EFCM switch nicknameas the Insight switch name
A check box that defaults to checked (true).
Performance Poll Interval (sec) For Switch Performance, the recommended setting and defaultfor the poll interval is 300 seconds.
Requirements
The following items are required:
• An IP address of the EFCM server.
• Read-only username and password for EFCM.
• Access validation: Access to the switch by Telnet from the Insight server, using the read-onlyusername and password over port 51512.
Note: No third-party software is required.
Brocade FC Switch Firmware (SSH) data source
The Brocade FC Switch Firmware (SSH) data source supports Brocade or rebranded devices runningFactored Operating System (FOS) firmware 4.2 and later. Devices in both FC switch and AccessGateway modes are supported.
Configuration
Field Description
Switch IP Network address for the device, specified as an IP(nnn.nnn.nnn.nnn format) or as a host name that can beresolved through DNS.
User Name Name used to log in to the Brocade device. The default isadmin.
Password Password used to log in to the device.
SNMP Version For Switch Performance, the default is V2.
SNMP Community: For Switch Performance, SNMP read-only community stringused to access the device.
SNMP User Name For Switch Performance, the SNMP version protocol username. This applies only to SNMP V3.
SNMP Password For Switch Performance, the SNMP version protocolpassword. This applies only to SNMP V3.
66 | Configuration and Administration Guide

Advanced configuration
Field Description
Fabric Name Fabric name to be reported by this data source (blank to reportthe fabric WWN).
Exclude Devices Comma-separated list of Brocade devices, identified by IPaddress, that are not discovered by this data source.
Inventory Poll Interval (min) Interval, in minutes, at which the data source should poll thedevice. The default is 15.
Timeout (sec) The period of time that the data source pauses before itdeclares that the connection has failed (timed out). The defaultis 30.
Banner Wait Timeout (sec) Timeout for obtaining the first prompt after connection to thedevice.
Admin Domains Active Select to indicate that you implement Admin Domains.
Retrieve MPR Data Select to acquire routing data for your multiprotocol router(MPR).
Enable Trapping Check box used to trigger acquisition upon receiving an SNMPtrap from the device. If you select this box, you must alsoactivate SNMP notifications.
Minimum Time Between Traps(sec)
Minimum elapsed time between acquisition attempts triggeredby traps, in seconds.
Discover all switches in thefabric
Check box used to trigger identification of all of the switcheson this fabric.
Choose Favoring HBA vs. ZoneAliases
Determines which alias is chosen if multiple aliases exist forthe same WWN.
Performance Poll Interval (sec) For Switch Performance, the recommended setting and defaultfor the poll interval is 300 seconds.
SNMP Auth Protocol For Switch Performance, encryption type for SNMP V3configurations. The default is MD5.
SNMP Privacy Protocol For Switch Performance, selections include NONE, AES,DES, or TRIPLEDES for SNMP V3.
SNMP Privacy Password For Switch Performance, provide a password for SNMP V3encryption usage.
SNMP Retries For Switch Performance, the maximum number of retryattempts for a given SNMP command.
Insight data source management | 67

Field Description
SNMP Timeout (ms) For Switch Performance, the timeout setting for connecting tothe device using SNMP.
Requirements
• There must be IP connectivity to all switches in the fabric.
If you select the Discover all switches in the fabric check box, OCI identifies all the switches inthe fabric; however, it needs IP connectivity to these additional switches to discover them.
• The same account is needed globally across all switches in the fabric.
You can use PuTTY (open source terminal emulator) to confirm access.
• If the Perform license is installed, ports 161 and 162 must be open to all switches in the fabric forSNMP performance polling.
Note: No third-party software is required.
Commands
• ag - -modeshow
• agshow
• alishow
• fabricshow
• fosconfig - -show
• ipaddrshow
• lscfg - -show
• nbrstateshow
• nsshow -t
• portshow
• sfpshow
• snmpConfig - -show accessControl
• snmpConfig - -show mibCapability
• snmpConfig - -show snmpv3
68 | Configuration and Administration Guide

• switchshow
• switchstatusshow
• trunkshow
• version
• wwn -sn
Brocade Sphereon/Intrepid Switch (SNMP) data source
For configuration, this data source requires an IP address for every switch, and an SNMP read-onlycommunity string to access the device.
Configuration
Field Description
Sphereon Switch Network address for the switch, specified as an IP(nnn.nnn.nnn.nnn format) or as a host name that can beresolved through DNS.
SNMP Version V2 is the default.
SNMP Community Specifies the SNMP read-only community string used toaccess the device.
User Name Specifies the SMIS user name used to log in to the switch.Used only for V3.
Password Specifies the SMIS password used to log in to the switch. Usedonly for V3.
Requirements
• The IP address of every switch
• Read-only community string if using SNMP V1 or SNMP V2
• HTTP access to the switch to obtain zoning information
• Access validation
Run the snmpwalk utility to the switch (see <install_path>\bin\).
Note: No third-party software is required.
Insight data source management | 69

Advanced configuration
Field Description
Inventory Poll Interval (min) Specifies the interval, in minutes, at which the data sourceshould poll the device. The default is 15.
SNMP Auth Protocol Specifies the encryption type for SNMP V3. The default isMD5.
SNMP Privacy Protocol Selections include NONE, AES, DES, or TRIPLEDES forSNMP V3.
SNMP Privacy Password Provide a password for SNMP V3 encryption usage.
SNMP Number of Retries Specifies the maximum number of retry attempts for a givenSNMP command.
SNMP Timeout (ms) Specifies the timeout for connecting to the device using SNMP.
Fabric Name Specifies the fabric name to be reported by this data source(blank to report the fabric WWN).
Enable Trapping Use this check box to trigger acquisition upon receiving anSNMP trap from the device. If you select this box, you mustalso activate SNMP notifications.
Minimum Time Between Ttraps(seconds)
Specifies the minimum elapsed time between acquisitionattempts triggered by traps, in seconds.
Performance Poll Interval (sec) For Switch Performance, the recommended setting and defaultfor the poll interval is 300 seconds.
SNMP MIBs
• EF-6000-MIB
• EOSN-FCPING-MIB
• EOSN-FCTRACEROUTE-MIB
• EOSN-MIB
• EOSN-PARTITIONING-MIB
• EOSN-REG
• EOSN-SECURITY-MIB
• EOSN-TC
• EOSN-TRAP-MIB
70 | Configuration and Administration Guide

• FCFABRIC-ELEMENT-MIB
• FCMGMT-MIB
• FIBRE-CHANNEL-FE-MIB
• FIBRE-CHANNEL-MGMT-MIB
• IANAifType-MIB
• IF-MIB
• INET-ADDRESS-MIB
• RFC1155-SMI
• RFC1213-MIB
• RFC1215-MIB
• SNMP-COMMUNITY-MIB
• SNMP-FRAMEWORK-MIB
• SNMP-NOTIFICATION-MIB
• SNMP-TARGET-MIB
• SNMP-USER-BASED-SM-MIB
• SNMPv2-CONF
• SNMPv2-MIB
• SNMPv2-SMI
• SNMPv2-TC
• SNMP-VIEW-BASED-ACM-MIB
• TRANSPORT-ADDRESS-MIB
Cisco FC Switch Firmware (SNMP) data source
The Cisco FC Switch Firmware 2.0+ (SNMP) data source is applicable to all Cisco MDS FibreChannel switches and also to a variety of Cisco Nexus FCoE switches on which the FC service is
Insight data source management | 71

enabled. Additionally, you can discover many models of Cisco devices running in NPV mode withthis data source.
Configuration
Field Description
Cisco Switch IP Network address for the switch, specified as an IP(nnn.nnn.nnn.nnn format) or as a host name that can beresolved through DNS.
SNMP Version V2 is the default. V2 or later is required for performance;performance fails if it is configured with SNMP V1. V3 issupported since 6.0.
SNMP Community SNMP read-only community string used to access the device.Community strings are not applicable for SNMP V3configurations.
User Name Name used to log in to the switch. Used for SNMP V3configurations only.
Password Password used to log in to the switch. Used for SNMP V3configurations only.
Requirements
The following items are required:
• An IP address of one switch in the fabric or individual switches
• Chassis discovery, to enable fabric discovery
• If using SNMP V2, read-only community string
• Access validation using the snmpwalk utility to the switch (see <install_path>\bin\)
Note: No third-party software is required.
Advanced configuration
Field Description
Inventory Poll Interval (min) Interval, in minutes, at which the data sourceshould poll the device. The default is 40.
SNMP Auth Protocol Encryption type for SNMP V3 configurations.The default is MD5.
72 | Configuration and Administration Guide

Field Description
SNMP Privacy Protocol Selections include NONE, AES, DES, andTRIPLEDES for SNMP V3.
SNMP Privacy Password Provide a password for SNMP V3 encryptionusage.
SNMP Retries Maximum number of retry attempts for a givenSNMP command.
SNMP Timeout (ms) Timeout for connecting to the device usingSNMP.
Enable Trapping Check box used to trigger acquisition uponreceiving an SNMP trap from the device. If youmark this box, you must also activate SNMPnotifications.
Minimum Time Between Traps (sec) Minimum elapsed time between acquisitionattempts triggered by traps, in seconds. 10 is thedefault.
Discover All Fabric Switches If this check box is selected, the data sourceattempts to discover not only the switchconfigured in the data source, but also all otherCisco switches in the VSANs and fabrics ofwhich this switch is a member.
Exclude Devices This is a comma-separated list of devices,identified by switch IP address, that this datasource will not discover. It supports wildcardsand CIDR addresses (for example, 10.20.* and192.168.1.0/24).
Include Devices This is a comma-separated list of devices,identified by switch IP address, that this datasource will discover. It supports wildcards andCIDR addresses (for example, 10.20.* and192.168.1.0/24).
Check Device Type If set, the data source accepts only those devicesthat explicitly advertise themselves as Ciscodevices.
Insight data source management | 73

Field Description
Primary Alias Type Select the first preference for resolution of thealias from these options:
Device Alias
This is a user-friendly name for aport WWN (pWWN) that can beused in all configurationcommands, as required. Allswitches in the Cisco MDS 9000Family support DistributedDevice Alias Services (devicealiases).
None
Do not report any alias
Port Description
A description to help identify theport in a list of ports
Zone Alias (all)
A user-friendly name for a portthat can be used only for zoningconfiguration
Zone Alias (only active)
A user-friendly name for a portthat can be used only for theactive configuration. This is thedefault.
Secondary Alias Type Provide a second preference for resolution ofthe alias using the same options as the PrimaryAlias Type.
Tertiary Alias Type Provide a third preference for resolution of thealias using the same options as the PrimaryAlias Type.
Enable SANTap Proxy Mode Support Select this check box if your Cisco switch isusing SANTap in proxy mode. If you are usingEMC RecoverPoint, then you are probablyusing SANTap.
74 | Configuration and Administration Guide

Field Description
Performance Poll Interval (sec) For Switch Performance, the recommendedsetting and default for the poll interval is 300seconds.
SNMP MIBs
• CISCO-CDP-MIB
• CISCO-DM-MIB
• CISCO-DYNAMIC-PORT-VSAN-MIB
• CISCO-ENTITY-DISPLAY-MIB
• CISCO-FC-DEVICE-ALIAS-MIB
• CISCO-FC-FE-MIB
• CISCO-FCS-MIB
• CISCO-FDMI-MIB
• CISCO-IVR-MIB
• CISCO-LICENSE-MGR-MIB
• CISCO-NS-MIB
• CISCO-PSM-MIB
• CISCO-SMI
• CISCO-ST-TC
• CISCO-TC
• CISCO-VSAN-MIB
• CISCO-VTP-MIB
• CISCO-ZS-MIB
• ENTITY-MIB
• IANAifType-MIB
• IF-MIB
• INET-ADDRESS-MIB
• SNMP-FRAMEWORK-MIB
Insight data source management | 75

• SNMPv2-CONF
• SNMPv2-MIB
• SNMPv2-SMI
• SNMPv2-TC
Dell Compellent Storage Center data source
This data source collects network information for analysis and validation from Dell CompellentStorage Center storage arrays. To add the data source, you need to use specific configurationinstructions and commands and understand data source requirements and usage recommendations.
Configuration
Field Description
Address of Enterprise Manager The IP address of the server on the Dell Compellent StorageCenter
Port The port number of the Dell Compellent Storage Center
User Name The user name to log in to the Dell Compellent Storage Center
Password The password to log in to the Dell Compellent Storage Center
General requirements
You need administrator credentials for the Dell Compellent Storage Center.
Advanced configuration
Field Description
Poll Interval (min) Poll interval in minutes
Performance PollInterval (up to 3600seconds)
Poll interval in seconds
Commands
This data source uses Dell's Java API.
76 | Configuration and Administration Guide

EMC Atmos (HTTP) data source
This data source supports the EMC cloud offering, which includes a single pool of storage.
Implementation considerations
The EMC Atmos data source provides support to the EMC cloud offering, which includes a singlepool of storage. This data source is implemented in the following ways:
• Atmos data appears only in the Reporting Storage and Storage Pool Capacity data model and theChargeback data model.
• Atmos has a physical hierarchy and a logical hierarchy that impact what you see in reports.
• Atmos resource management group (RMG) capacity is tracked in Insight reporting as storage rawcapacity.
• Atmos data is not grouped by and not reported on by tier.
• Atmos data can be reported on by an Atmos service level.
Atmos logical hierarchy and OnCommand Insight business entity divisions
Insight reports on Atmos logical hierarchy in its business entities as follows:
Business entity levels Atmos logical hierarchy division
Tenant Tenant
Line of business (LOB) Subtenant
Business Unit n/a
Project n/a
Note: Business entities are created and maintained in the Java UI.
Configuration
Field Description
Address of Atmos Network address for the Atmos node that is currently runningthe EMC Capacity Reporting Tool. Specified as an IP(nnn.nnn.nnn.nnn format) or as a host name that can beresolved through DNS.
User Name Name used for authentication into the EMC CapacityReporting Tool API. The default is admin.
Insight data source management | 77

Field Description
Password Password used for authentication into the EMC CapacityReporting Tool API.
Requirements
User name and password are not needed for EMC Capacity Reporting Tool authentication; however,they are needed for the reporting API.
• EMC Capacity Reporting Tool must be installed.
• An IP address of the Atmos node that is currently running the EMC Capacity Reporting Toolmust be available.
• Access can be verified using telnet to the user-defined port.
Advanced configuration
Configuration
Field Description
Port Port used internally by the PC, where the Insight DataWarehouse (DWH) is running, to serve as an access point tothe database.
HTTPS Enabled Select to use the HTTPS protocol and connect through port443.
Inventory Poll Interval (min) Interval, in minutes, at which the data source should poll thedevice. The recommended setting and default is 20 minutes.
EMC Celerra data source
The Celerra data source collects inventory information from Celerra storage. For configuration, thisdata source requires the IP address of the storage processors and a read-only user name andpassword.
Configuration
Field Description
Address of Celerra IP address of storage processors
User Name Name used to log in to the Celerra device
Password Password used to log in to the Celerra device
78 | Configuration and Administration Guide

Requirements
• The IP address of the storage processor
• Read-only user name and password
• SSH access via PuTTY
Advanced configuration
Field Description
Inventory Poll Interval (minutes) Interval, in minutes, at which the data source should poll thedevice
The default is 20.
SSH Process Wait Timeout (sec) The time, in seconds, to wait for the command to finish
If not completed when the timeout expires, the SSH Clientdisconnects.
Number of Retries Maximum number of retry attempts for a given Celerracommand
SSH Banner Wait Timeout (sec) Length of time to wait for a connection to a host before timingout
Commands
The following commands are invoked:
• fs_dedupe -info -all
• nas_disk -info id=<disk id>"
• nas_disk -list
• nas_fs -info -size -all
• nas_pool -info -all
• nas_pool -size -all
• nas_quotas -list -tree -fs <file system name>"
• nas_quotas -report -tree -fs <file system name
• nas_storage -list
• nas_storage -info <storageName>
• nas_version -l
Insight data source management | 79

• nas_volume -info -size -all
• nas_xml -info:ALL -level:3
• /nas/sbin/t2tty -c <> "fcp topology"
EMC CLARiiON (NaviCLI) data source
Before configuring this data source, make sure that the EMC Navisphere CLI is installed on thetarget device and on the Insight server. The Navisphere CLI version must match the firmware versionon the controller. For performance data collection, statistics logging must be turned on.
NaviSphere Command Line Interface syntax
naviseccli.exe -h <IP address> -user <user> -password <password> -scope<scope,use 0 for global scope> -port <use 443 by default> command
Configuration
Field Description
CLARiiON storage Network address for the storage device, specified as an IP(nnn.nnn.nnn.nnn format), or as a hostname that can beresolved through DNS.
User Name Name used to log into the CLARiiON storage device.
Password Password used to log into the CLARiiON storage device.
CLI Path to navicli.exe path ornaviseccli.exe path
Full path to the executable.
Requirements
• An IP address of each CLARiiON storage processor
• Read-only Navisphere username and password to the CLARiiON arrays
• Access validation: Run NaviCLI from the Insight server to each array using the above usernameand password.
• NaviCLI version should correspond with the newest FLARE code on your array
• 3rd party software installed on Insight server/RAU: navicli
80 | Configuration and Administration Guide

Advanced configuration
Field Description
Inventory Poll Interval (min) Interval, in minutes, at which the data source should poll thedevice. The default is 40.
Use Secure Client (naviseccli) Provides a secure management facility for activating therequired CLARiiON array replication support functionality.
Scope The secure client scope. This is an enumeration with thefollowing values: Global, Local, LDAP. The default is Global.
CLARiiON CLI Port The port on the CLARiiON used for NaviCLI connections.
Inventory External ProcessTimeout (sec)
Maximum time allowed for inventory commands to complete.
Performance Poll Interval (sec) For Array Performance, sets the Perform poll interval. Therecommended setting is 300.
Retry Count to Retrieve ArchiveFile
For Array Performance, the maximum number of retryattempts to retrieve an archive file.
Performance External processtimeout (sec)
For Array Performance, the maximum time allowed forperformance commands to complete.
Performance requirement
• Statistics logging must be turned on.
NaviSec CLI commands
The following commands are invoked:
• naviseccli.exe –help
• naviseccli.exe -h {ip} -User {user} -Password {password} -Scope 0 -port {port} getall
• naviseccli.exe -h {ip} -User {user} -Password {password} -Scope 0 -port {port} metalun -list
• naviseccli.exe -h {ip} -User {user} -Password {password} -Scope 0 -port {port} mirror sync -list
• naviseccli.exe -h {ip} -User {user} -Password {password} -Scope 0 -port {port} mirror async –list
• naviseccli.exe -h {ip} -User {user} -Password {password} -Scope 0 -port {port} storagepool -list
• naviseccli.exe -h {ip} -User {user} -Password {password} -Scope 0 -port {port} thinlun –list
Insight data source management | 81

• naviseccli.exe -h {ip} -User {user} -Password {password} -Scope 0 -port {port} storagegroup -list -gname {storage group name} (This can be run multiple times with different storage groupnames.)
NaviCLI (Classic) commands
• navicli.exe –help
• navicli.exe -h {ip} getall
• C:\Program Files\sanscreen\java\bin\java.exe –jar C:\Program Files\EMC\Navisphere CLI\navicli.jar –user {user} -password {password} -port {port} –address {ip} metalun -list
• navicli.exe -h {ip} mirror sync -list
• navicli.exe -h {ip} mirror async –list
• navicli.exe -h {ip} storagepool -list
• navicli.exe -h {ip} thinlun -list
• navicli.exe -h {ip} storagegroup -list -gname {storage group name} (This can be run multipletimes with different storage group names.)
Performance commands
The following commands are run for acquiring performance data:
• naviseccli.exe -h {ip} -User {user} -Password {password} -Scope 0 -port {port} getall
• naviseccli.exe -h {ip} -User {user} -Password {password} -Scope 0 -port {port} getDisk
• naviseccli.exe -h {ip} -User {user} -Password {password} -Scope 0 -port {port} metalun -list
• naviseccli.exe -h {ip} -User {user} -Password {password} -Scope 0 -port {port} thinlun -list
EMC Data Domain data source
This data source collects storage and configuration information from EMC Data Domaindeduplication storage systems. To add the data source, you must use specific configurationinstructions and commands and be aware of data source requirements and usage recommendations.
Configuration
Field Description
IP address The IP address of the Data Domain storage array
User name The user name you use to log in to the Data Domain storagearray
82 | Configuration and Administration Guide

Field Description
Password The password you use to log in to the Data Domain storagearray
General requirements
• Read-only user name and password to the Data Domain storage
• Validated access by using telnet to port 22
Note: No non-NetApp software is required.
Advanced configuration
Field Description
Inventory PollInterval (min)
Interval, in minutes, at which the data source should poll the device forinventory information
SSH Process WaitTimeout (sec)
The time, in seconds, to wait for the command to finish. If not completedwhen the timeout expires, the SSH Client disconnects.
SSH Port TCP port for SSH connections
Commands
• cifs show clients
• disk show hardware
• disk show state
• enclosure show all
• filesys show compression summary
• filesys show space
• mtree list
• net show all
• nfs show clients
• quota show all
• storage show summary
• storage show tier active
Insight data source management | 83

• storage show tier archive
• system show all
• system show ports
• system show serialno
• system show version
EMC ECC StorageScope data sources
This EMC device has three types of data sources: 5.x, 6.0, and 6.1.
Configuration
Field Description
ECC server Network address for the Enterprise Control Center (ECC) server, specified as anIP (nnn.nnn.nnn.nnn format), or as a hostname that can be resolved through DNS.
User Name Name used to log into the ECC.
Password Password used to log into the ECC.
Advanced configuration
Field Description
ECC Port Number of the ECC server port through which the data sourceacquires information. 1521=default. NOTE: If you are using version6.1 of the ECC, the default port is now 1575.
Inventory Poll Interval(min)
Interval, in minutes, at which the data source should poll the device.The default is 30.
Protocol to Connect toDatabase
TCP is cleartext communication and TCPS is encryptedcommunication.
Query File SystemInformation
Select to retrieve details for WWN Aliases and File Systems.
84 | Configuration and Administration Guide

EMC Isilon data source
The Isilon SSH data source collects inventory and performance from EMC Isilon scale-out NASstorage.
Configuration
Field Description
IP address IP address of the Isilon cluster
User name User name you use to log in to the Isilon cluster
Password Password you use to log in to the Isilon cluster
General requirements
• Root permissions to the Isilon storage
• Validated access by using telnet to port 22
Note: No non-NetApp software is required.
Advanced configuration
Field Description
Inventory PollInterval (min)
Interval, in minutes, at which the data source should poll the device forinventory information
Performance PollInterval (sec)
For Array Performance, Interval, in seconds, at which the data sourceshould poll the device for performance information
SSH Process WaitTimeout
Time, in seconds, to wait for the command to finish
If not completed when the timeout expires, the SSH Client disconnects.
SSH Port TCP port for SSH connections
Commands
• isi devices -d {device id}
• isi license status
• isi nfs exports list -v
• isi quota quotas list --verbose --format=csv
• isi smb share list -v
Insight data source management | 85

• isi snapshot list
• isi snapshot settings view
• isi snapshot snapshots list --verbose --format=table
• isi status -n
• isi status -q
• isi version osrelease
• python -c "exec(\"import isi.app.lib.cluster as cluster;chassis =
cluster.Cluster().device({node id}).chassis();print chassis[0][4]\")"
• python -c "exec(\"import isi.app.lib.cluster as cluster;device =
cluster.Cluster().device({node id});print device.ipaddresses()\")"
• python -c "import isi.config.arrcfg as arrcfg; print
arrcfg.config_load().guid;"
EMC Solutions Enabler (CLI) with SMI-S Performance data source
OnCommand Insight discovers Symmetrix storage arrays by using Solutions Enabler symclicommands in conjunction with an existing Solutions Enabler server in your environment. Theexisting Solutions Enabler server has connectivity to the Symmetrix storage array through access togatekeeper volumes. Administrator permissions are required to access this device.
Prerequisites
Before configuring this data source, you should ensure that the OnCommand Insight server has TCPconnectivity to port 2707 on the existing Solutions Enabler server. OnCommand Insight discovers allthe Symmetrix arrays that are "Local" to this server, as seen in "symcfg list" output from that server.
• On acquiring the OnCommand Insight host:
◦ The EMC Solutions Enabler (CLI) with SMI-S provider application must be installed and theversion must match or be earlier than the version running on the Solutions Enabler Server.
◦ A properly configured {installdir}\EMC\SYMAPI\config\netcnfg file is required.This file defines service names for Solutions Enabler servers, as well as the access method(SECURE / NOSECURE /ANY).
• If you require read/write latency at the storage node level, the SMI-S Provider must communicatewith a running instance of the UNISPHERE for VMAX application.
Note: If SMI-S user authentication is not enabled, the default values in the OnCommand Insightdata source are ignored.
86 | Configuration and Administration Guide

Having symauth enabled on Symmetrix arrays might inhibit the ability of OnCommand Insight todiscover them. OnCommand Insight Acquisition runs as the SYSTEM user on the OnCommandInsight / Remote Acquisition Unit server that is communicating with the Solutions Enabler server. Ifhostname\SYSTEM does not have symauth privileges, OnCommand Insight fails to discover.
Note: See Knowledge Base article 2015297 on the NetApp Support Site at mysupport.netapp.com.
Configuration
The EMC Solutions Enabler Symmetrix CLI data source includes support for device configurationfor thin provisioning and Symmetrix Remote Data Facility (SRDF).
Definitions are supplied for Fibre Channel and Switch Performance packages.
Field Description
Service Name Name of the Solution Enabler server as described in the localnetcnfg file (Solutions Enabler install).
Full path to CLI Full path to the SYMCLI commands. The default is C:\Program Files\EMC\SYMCLI\bin.
Requirements
• An IP address of the Solutions Enabler (SE) Server
• Administrator permissions
• Read-only user name and password to the SE software
• Solutions Enabler Server 6.5X requirements:
◦ SMI-S provider 3.3.1 for SMIS-S V1.2 installed
◦ After install, run \Program Files\EMC\SYMCLI\bin>stordaemon start storsrvd
• Access validation: Verify that the SMI-S provider is running: telnet <se_server> 5988
• The UNISPHERE for VMAX application is running and collecting statistic for the SymmetrixVMAX storage arrays that are managed by the SMI-S Provider installation
Note: No third-party software is required.
Advanced configuration
Field Description
Inventory Poll Interval (min) Interval, in minutes, at which the data source should poll thedevice. The default is 40 minutes.
Insight data source management | 87

Field Description
Inventory Exclude Devices Comma-separated list of devices, identified by serial number,that are not discovered by this data source. For this datasource, an example would be Sym-000187461207.
Connection Caching Type of remote connection to the Solutions Enabler. Could beLOCAL, REMOTE_CACHED, or REMOTE:
• LOCAL means that the OnCommand Insight Acquisitionservice is running on the Solutions Enabler server, whichhas Fibre Channel connectivity to the Symmetrix arraysyou seek to discover, and has access to Gatekeepervolumes. This might be seen in some Remote AcquisitionUnit (RAU) configurations.
• REMOTE_CACHED is the default and should be used inmost cases. This uses the NETCNFG file settings toconnect using IP to the Solutions Enabler server, whichmust have Fibre Channel connectivity to the Symmetrixarrays you seek to discover, and has access to Gatekeepervolumes.
• Sometimes REMOTE_CACHED options make CLIcommands fail. In these cases, the REMOTE option shouldbe used. Keep in mind that it will slow down theacquisition process (possibly to hours or even days inextreme cases). The NETCNFG file settings are still usedfor an IP connection to the Solutions Enabler server thathas Fibre Channel connectivity to the Symmetrix arraysbeing discovered.
Note: This setting does not change OnCommand Insightbehavior with respect to the arrays listed as REMOTE by the"symcfg list" output. OnCommand Insight gathers data onlyon devices shown as LOCAL by this command.
CLI Timeout (sec) The default is 7200.
SMI-S Host IP For Array Performance, host name or IP address of the EMCSMI-S provider host.
SMI-S Port For Array Performance, the SMI-S port. The default is 5988.
Protocol For Array Performance, HTTP (if unsecured access) or HTTPS(if secured access).
SMI-S Namespace For Array Performance, SMI-S namespace used to query thedata.
88 | Configuration and Administration Guide

Field Description
SMI-S User Name For Array Performance, name used for authentication by theSMI-S host for performance data.
SMI-S Password For Array Performance, password used for authentication bythe SMI-S host for performance data.
Performance Polling Interval(sec)
For Array Performance, the recommended setting and defaultfor the poll interval is 1000 seconds.
Performance Filter Type For Array Performance, set to exclude or include foracquisition by selecting the filter type as "exclude" or"include." The default is exclude.
Performance Filter Device List For Array Performance, the comma-separated list of SolutionsEnabler IP addresses to be included or excluded, dependingupon the filter type selected. For this data source, an examplewould be Sym-000187461207.
RPO Polling Interval (sec) For Replication, the interval, in seconds, at which the datasource should poll the device. The default is 300.
EMC VNX (SSH) data source
For configuration, this data source requires the IP address of the Control Station and a read-onlyusername and password.
Configuration
Field Description
VNX IP Celerra IP address
VNX User Name Name used to log into the VNX device.
VNX Password Password used to log into the VNX device.
Requirements
• An IP address of the Control Station
• Read-only username and password.
• Access validation: Verify SSH access via PuTTY.
Insight data source management | 89

Advanced configuration
Field Description
Inventory Poll Interval (min) Interval, in minutes, at which the data source should poll thedevice. The default is 40.
VNX SSH Process Wait Timeout(sec)
Timeout for obtaining the first prompt once connected to thedevice.
The default is 600.
Celerra Command RetryAttempts
Maximum number of retry attempts for a given Celerracommand.
CLARiiON External ProcessTimeout for Inventory (sec)
Maximum time allowed for CLARiiON commands tocomplete.
Performance Poll Interval (sec) For Array Performance, the interval, in seconds, at which thedata source should poll the device.
CLARiiON External ProcessTimeout for Performance (sec)
For Array Performance, the maximum time allowed forCLARiiON commands to complete.
Commands
This data source runs the same commands as the EMC Celerra and EMC CLARiiON.
• /nas/opt/Navisphere/bin/navicli -h {ip} getall
• /nas/opt/Navisphere/bin/navicli -h {ip} metalun -list
• /nas/opt/Navisphere/bin/navicli -h {ip} mirror async –list
• /nas/opt/Navisphere/bin/navicli -h {ip} mirror sync -list
• /nas/opt/Navisphere/bin/navicli -h {ip} storagegroup -list -gname <storageGroupName>
• /nas/opt/Navisphere/bin/navicli -h {ip} storagepool -list
• /nas/opt/Navisphere/bin/navicli -h {ip} thinlun -list
• /nas/opt/Navisphere/bin/navicli -help
• /nas/sbin/t2tty -c <dataMoverId> "fcp topology"
• cat /etc/hosts
• fs_dedupe -info -all
• nas_disk -info id=<disk id>
• nas_disk -list
90 | Configuration and Administration Guide

• nas_fs -info -size -all
• nas_pool -info -all
• nas_pool -size -all
• nas_quotas -list -tree -fs <file system name>
• nas_quotas -report -tree -fs <file system name>
• nas_storage -info <storageName>
• nas_storage -list
• nas_version -l
• nas_volume -info -size -all
• nas_xml -info:ALL -level:3
EMC VPLEX data source
For configuration, this data source requires an IP address of the VPLEX server and a read-onlyusername and password to the VPLEX server.
Configuration
Field Description
IP address of VPLEXManagement Console
Host name or IP address of the VPLEX.
User Name Name used for authentication.
Password Password used for authentication.
Requirements
• An IP address of the VPLEX server
• Read-only username and password to the VPLEX server
• Validate access: Verify by using telnet to port 443. For a port other than the default port, withany browser use HTTPS://<ip>:<port>
Note: No third-party software is required.
Insight data source management | 91

Advanced configuration
Field Description
Communication Port The default is 443.
Inventory Poll Interval (min) Interval, in minutes, at which the data source should poll thedevice. Recommended and default setting is 20 minutes.
Connection timeout (sec) Time in seconds waiting for command to finish. If notcompleted when timeout expires, the run fails. The default is60 seconds.
Number of Retries Number of times a request is going to be sent after aconnection timeout.
Commands
• ls -laf /clusters/*
• ls -laf /clusters/*
• ls -laf /devices/*
• ls -laf /engines/engine-*/directors/director-*
• ls -laf /distributed-storage/distributed-devices/*
• ls -laf /engines/engine-*
• ls -laf /clusters/*/storage-elements/extents/*
• ls -laf /clusters/*/exports/initiator-ports/*
• ls -laf /engines/engine-*/directors/director-*/hardware/ports/*
• ls -laf /clusters/*/storage-elements/storage-arrays/*
• ls -laf /clusters/*/exports/storage-views/*
• ls -laf /clusters/*/storage-elements/storage-volumes/*
• ls -laf /clusters/*/virtual-volumes
• version -a --verbose
92 | Configuration and Administration Guide

Fujitsu Eternus data source
For configuration, this data source requires the IP address of the storage. It cannot be commadelimited.
Configuration
Field Description
IP Address of Eternus Storage IP address of the storage
User Name The administration-level name used to log in to the Fujitsudevice
Password Password used to log in to the device
Requirements
• An IP address of the storage, which cannot be comma delimited
• Administration-level user name and password
• Access validation by using SSH to the configured IP and logging in
• Ensure that the page scroll is disabled.
Advanced configuration
Field Description
Inventory Poll Interval (min) Interval, in minutes, at which the data source should poll thefoundation package.
SSH Process Wait Timeout (sec) Time, in seconds, to wait for the command to finish. If notcompleted when the timeout expires, the SSH Clientdisconnects.
Commands
• show affinity-groups
• show affinity-groups -ag-number {affinity group id}
• show disks -disks all
• show enclosure-status
• show fru-ce -type {controller module name}
Insight data source management | 93

• show hardware-information
• show host-affinity -ag-number {affinity group id}
• show host-groups -all
• show mapping
• show network
• show port-groups -all
• show raid-groups
• show raid-groups -rg-number {raid group id}
• show snap-data-volume
• show thin-pro-pools
• show thin-pro-pools -pool-number {thin provisioning pool id}
• show volumes -mode expansion
• show volumes -type tpv
HDS HiCommand Device Manager data source
The HDS data source supports the HiCommand Device Manager server. OnCommand Insightcommunicates with the HiCommand Device Manager server using the standard HiCommand API.This data source requires the IP address of the HiCommand Device Manager server and a read-onlyusername and password for the HiCommand Device Manager software with peer privileges.
Configuration
Field Description
HiCommand Server Network address for the HiCommand Device Managerserver, specified as an IP (nnn.nnn.nnn.nnn format), or asa host name that can be resolved through DNS.
User Name Name used to log in to the HiCommand.
Password Password used to log into the HiCommand.
Devices - USP, USP V, VSP/R600Storages
Adds a Data Source Property Group information.
WMS/SMS/AMS Storages Click Add to enter Data Source Property Groupinformation.
94 | Configuration and Administration Guide

Note: In HDS USP, USP V, VSP, any disk can belong to more than one array group.
Requirements
• IP address of the HiCommand Device Manager server
• Read-only user name and password for the HiCommand Device Manager software and peerprivileges
• Validate access:
◦ Log in to the HiCommand Device Manager software using peer user name and password.
◦ Verify access to the HiCommand Device Manager API: telnet <HiCommandDevice_Manager_server_ip> 2001
Note: No third-party software is required.
Advanced configuration
Field Description
HiCommand Server Port 2001
Number of the HiCommand server port through which the datasource acquires information.
Inventory Poll Interval (min) Interval, in minutes, at which the data source should poll thedevice. The default is 40 minutes.
Choose 'Exclude' or 'Include' tospecify a list
Comma-separated list of devices, identified by device ID, thatare not discovered by this data source. For this data source, anexample would be ARRAY.HDS9570V.65010524.
Exclude or Include Devices Lists the devices to include or exclude depending on yourprevious selection.
Query Host Manager Provides host information on aliases from HiCommand.
HTTP Timeout (sec) The timeout values are used for the connect and readprocesses. A value of 0 indicates that there is no timeout. Thedefault value is 0.
Performance Polling Interval(sec)
For Array Performance, the recommended setting and defaultfor the poll interval is 300 seconds.
Report External Volumes For Array Performance, this is checked to enable performancedata to appear for backend LUNs on performance-relatedviews in the client, if the Hitachi Universal Storage PlatformVirtualization layer (USP V) is used.
Insight data source management | 95

Commands
• <get target = "StorageArray">
• <get target = "StorageArray">
Components include logical unit, path, WWN, WWN group, host information, path, volumeconnection, port controller, array group, port, LUN group, and replication information.
• <get target = "Host">
Performance requirements
• HDS USP, USP V, and VSP performance
◦ Performance Monitor must be licensed.
◦ Monitoring switch must be enabled.
◦ The Export Tool (Export.exe) must be copied to the OnCommand Insight Server.
◦ The Export Tool version must match the microcode version of the target array.
• HDS AMS performance
◦ Performance Monitor needs to be licensed.
◦ The Storage Navigator Modular 2 (SNM2) CLI utility needs to be installed on theOnCommand Insight Server.
◦ You must register all AMS, WMS, SMS storage arrays whose performance needs to beacquired by OnCommand Insight by using the following command:
auunitaddauto.exe -ip <IP address of Controller0> IP address ofController1>
◦ You must ensure that all the arrays that you registered are listed in the output of thiscommand: auunitref.exe.
96 | Configuration and Administration Guide

HDS HiCommand Device Manager Lite data source
The HDS data source supports the HiCommand Device Manager server. OnCommand Insightcommunicates with the HiCommand Device Manager server using the standard HiCommand API.
Configuration
Field Description
HiCommand Server Network address for the HiCommand DeviceManager server, specified as an IP (nnn.nnn.nnn.nnnformat), or as a host name that can be resolvedthrough DNS.
User Name Name used to log in to the HiCommand API.
Password Password used to log in to the HiCommand API.
Devices - USP, USP V, VSP/R600Storages
Adds the Data Source Property Group information.
WMS/SMS/AMS Storages Adds the Data Source Property Group information.
Advanced configuration
Field Description
HiCommand Server Port Number of the HiCommand server port through which the datasource acquires information.
Inventory Poll Interval (min) Interval, in minutes, at which the data source should poll thedevice.
Choose 'Exclude' or 'Include' tospecify a list
Comma-separated list of devices, identified by device ID, thatare not discovered by this data source. For this data source, anexample would be ARRAY.HDS9570V.65010524.
Exclude or Include Devices Lists the devices to include or exclude, depending on yourprevious selection.
Query Host Manager Provides host information about aliases from HiCommand.
HTTP Timeout (sec) The default timeout is 0 seconds.
Performance Polling Interval(sec)
For Array Performance, the recommended setting and defaultfor the poll interval is 300 seconds.
Insight data source management | 97

HP CommandView AE data source
This data source supports the HiCommand Device Manager server. OnCommand Insightcommunicates with the HiCommand Device Manager server using the standard HiCommand API.The HP CommandView AE is also referred to as HDS HiCommand.
Configuration
Field Description
HiCommand Server Network address for the HiCommand Device Manager server,specified as an IP (nnn.nnn.nnn.nnn format), or as a host namethat can be resolved through DNS.
User Name Name used to log in to the HiCommand Device Managerserver.
Password Password used to log in to the HiCommand Device Managerserver.
Devices - USP, USP V, VSP/R600 Storages
For Array Performance, click Add to enter Data SourceProperty Group information.
SNM2 Devices -WMS/SMS/AMS Storages
For Array Performance, click Add to enter Data SourceProperty Group information.
Requirements
• IP address of the Command View (AE) server
• Read-only user name and password to the CVAE software
• Access validation:
◦ Log in to the CVAE software using a read-only user name and password.
◦ Verify access to the CVAE API by entering telnet <cvae_server_ip> 2001
Note: No third-party software needs to be installed.
Advanced configuration
Field Description
HiCommand Server Port 2001
Number of the HiCommand server port through which the datasource acquires information.
98 | Configuration and Administration Guide

Field Description
Inventory Poll Interval (min) Interval, in minutes, at which the data source should poll thedevice.
Exclude Devices Comma-separated list of devices, identified by device ID, thatis not discovered by this data source. For this data source, anexample would be ARRAY.HDS9570V.65010524.
Query Host Manager Provides host information about aliases from HiCommand.
HTTP Timeout The default value is 0, which indicates that there is no timeout.
Performance Polling Interval(sec)
For Array Performance, the recommended setting and defaultfor the poll interval is 300 seconds.
Report External Volumes For Array Performance, check this to enable performance datato appear for backend LUNs on performance-related views inthe client, if Hitachi Universal Storage Platform Virtualizationlayer (USP V) is used.
HP CommandView AE Lite data source
The HP CommandView AE Lite data source supports the HP CommandView AE Lite edition, theCLI, and the SMI-S only version of the HP CommandView AE.
Configuration
Field Description
HiCommand Server Network address for the HiCommand Device Manager server,specified as an IP (nnn.nnn.nnn.nnn format), or as a host namethat can be resolved through DNS.
HiCommand Device Managerport
2001
Number of the HiCommand server port through which the datasource acquires information.
User Name Name used to log in to the HiCommand.
Password Password used to log in to the HiCommand.
Devices - USP, USP V, VSP/R600 Storages
For Array Performance, click Add to enter Data SourceProperty Group information.
SNM2 Devices -WMS/SMS/AMS Storages
For Array Performance, click Add to enter Data SourceProperty Group information.
Insight data source management | 99

Requirements
• IP address of the Command View (AE) server
• This is a version of the device manager with only the CLI licensed.
• Read-only user name and password to the CVAE software
• Access validation: Log in to CVAE software using read-only user name and password.
Note: No third-party software needs to be installed.
Advanced configuration
Query Host Manager Description
HiCommand Server Port 2001
Number of the HiCommand server port through which the datasource acquires information.
Inventory Poll Interval (min) Interval, in minutes, at which the data source should poll thedevice. The default is 40 minutes.
Exclude Devices Comma-separated list of devices, identified by device ID, thatare not discovered by this data source. For this data source, anexample would be ARRAY.HDS9570V.65010524.
Query Host Manager Provides host information about aliases from HiCommand.
HTTP Timeout (sec) The default value is 0, which indicates that there is no timeout.
Performance Polling Interval(sec)
For Array Performance, the recommended setting and defaultfor the poll interval is 300 seconds.
HP EVA Storage (SSSU) data source
For configuration, this data source requires the IP address of the Command View (CV) server and aread-only username and password to the CV software. The user must be defined in the CV software.
Configuration
Field Description
CommandView Server Name of the Command View (CV) manager.
User Name Name used to log into the Command View manager. The namemust be defined in Command View.
Password Password used to log into the Command View.
100 | Configuration and Administration Guide

Field Description
Performance User Name For Array Performance, the name used to log into theCommand View manager. The name must be defined inCommand View.
Performance Password For Array Performance, the password used to log into theCommand View.
Requirements
• IP address of the CV server
• Read-only username and password to the CV software. The user must be defined in the CVsoftware.
• Third-party software installed on the OnCommand Insight Server/RAU: sssu.exe. Thesssu.exe version should correspond to the CV version.
• Access validation: Run sssu.exe commands using username and password.
Advanced configuration
Field Description
Inventory Poll Interval (min) Interval, in minutes, at which the data source should poll thedevice.
CLI Home Full pathname to the CLI home directory where sssu.exe islocated.
To validate access, run sssu.exe.
Inventory Exclude Devices Comma-separated list of devices, identified by device ID, thatwill not be discovered by this data source for inventory.
Performance Poll Interval (sec) For Array Performance, the interval, in minutes, at which thedata source should poll the device for performance data.
Performance CLI Home For Array Performance, full pathname to the CLI homedirectory where sssu.exe is located. To validate access, runsssu.exe.
Command Timeout (sec) For Array Performance, the period of time that data sourcewaits for the command to execute before it declares thatcommand execution has failed (timed out). The command is aCLI source issues to the NSP administrating server (console).The command that the data default is 600 seconds.
Insight data source management | 101

Field Description
Performance Exclude Devices For Array Performance, comma-separated list of devices,identified by device ID, that will not be discovered by this datasource.
Commands
• LS CONTROLLER FULL XML
• LS DISK FULL XML
• LS DR_GROUP FULL XML
• LS HOST FULL XML
• LS SYSTEM FULL XML
• LS VDISK FULL XML
• SHOW VDISK FULL
Performance requirements
The HP StorageWorks Command View EVA software suite must be installed on the OnCommandInsight Server, or install a Remote Acquisition Unit (RAU) on the EVA server.
1. Install HP StorageWorks Command View EVA Software Suite on the OnCommand InsightServer, or install a Remote Acquisition Unit on the Command View EVA server.
2. Locate the evaperf.exe command. For example, c:\Program Files\Hewlett-Packard\EVA Performance Monitor\
3. Using the IP of the Command View server, perform these steps:
a. Run this command where 860 is the default port
Evaperf.exe server <Command View Server IP> 860 <username>
b. Enter the Command View server password at the password prompt.This should return a command line prompt and nothing else.
4. Verify the setup by running evaperf.exe ls.You should see a list of arrays or controllers managed by the Command View server. Each lineshows a controller on an EVA array.
Performance commands
• Evaperf.exe all -csv -nfn -KB -cont <sampleDuration> -dur
<sampleDuration>
102 | Configuration and Administration Guide

IBM DS (CLI) data source
The IBM DS CLI data source supports DS6xxx and DS8xxx devices only. DS3xxx, DS4xxx, andDS5xxx devices are supported by the NetApp E-Series data source. You should refer to the Insightdata source support matrix for supported models and firmware versions.
Configuration
Field Description
DS storage Network address for the DS device, specified as an IP(nnn.nnn.nnn.nnn format), or as a hostname that can beresolved through DNS.
User Name Name used to log into the DS.
Password Password used to log into the DS.
Executable dscli.exe Path Full path to the dscli utility.
Requirements
• IP address of each DS array
• Storage Display Name is optional and cosmetic only
• Read-only username and password on each DS array
• Third-party software installed on the Insight server: IBM dscli
• Access validation: Run dscli commands using the username and password
Advanced configuration
Field Description
Inventory Poll Interval (min) Interval, in minutes, at which the data source should poll thedevice. The default is 40.
Storage Display Name User-specified alias used as the storage name.
Inventory Exclude Devices Comma-separated list of devices, identified by serial number,that will not be discovered by this data source.
Performance Poll Interval (sec) For Array Performance, the recommended setting and defaultfor the poll interval is 300 seconds.
Performance Filter Type For Array Performance, can be either excluded or included foracquisition by selecting the filter type as "exclude" or"include."
Insight data source management | 103

Field Description
Performance Filter Device List For Array Performance, the comma-separated list of SolutionsEnabler IP addresses to be included or excluded, dependingupon the filter type selected.
Commands
• dscli.exe -hmc <ip address> -user <user> -passwd <password> lsarray -v
off -hdr off -fmt xml -dev IBM.XXX
• dscli.exe -hmc <ip address> -user <user> -passwd <password> lsddm -l -v
off -hdr off -fmt xml IBM.XXX
• dscli.exe -hmc <ip address> -user <user> -passwd <password> lsfbvol -v
off -hdr off -fmt xml -dev IBM.XXX
• dscli.exe -hmc <ip address> -user <user> -passwd <password>
lshostconnect -v off -hdr off -fmt xml -dev IBM.XXX
• dscli.exe -hmc <ip address> -user <user> -passwd <password> lsioport -v
off -hdr off -fmt xml -dev IBM.XXX
• dscli.exe -hmc <ip address> -user <user> -passwd <password> lsrank -v
off -hdr off -fmt xml -dev IBM.XXX
• dscli.exe -hmc <ip address> -user <user> -passwd <password> lssi -v off
-hdr off -fmt xml
• dscli.exe -hmc <ip address> -user <user> -passwd <password> lsvolgrp -v
off -hdr off -fmt xml -dev IBM.XXX
• dscli.exe -hmc <ip address> -user <user> -passwd <password> -script
Performance commands
• dscli.exe -hmc <ip address> -user <user> -passwd <password> -script
"diskdata"
• dscli.exe -hmc <ip address> -user <user> -passwd <password> -script
"RankPerfScript.txt"
• dscli.exe -hmc <ip address> -user <user> -passwd <password> -script
"VolPerfScript.txt"
• dscli.exe -hmc <ip address> -user <user> -passwd <password> -script
"volumedata.txt"
104 | Configuration and Administration Guide

IBM PowerVM data source configuration and commands
The IBM PowerVM (SSH) data source collects information about virtual partitions running on IBMPOWER hardware instances managed by a hardware management console (HMC). Forconfiguration, this data source requires the user name, to log in to the HMC through SSH, and theview-level permission on HMC configurations.
Configuration
Field Description
Hardware Management Console(HMC) Address
Network IP address for the management port of HMC, or ahost name that can be resolved through DNS
HMC User The user name to use to log in to the HMC through SSH
The configured user must have view-level permission on allmanagement system and logical partition security domains.The user must also have view permission on HMCconfigurations and the ability to collect VPD information forthe HMC console security grouping. Finally, the user musthave Virtual IO Server Command access under the LogicalPartition security grouping.
Password Password of the HMC user
Requirements
• User name and password that provide access to HMC through SSH
• User View permission on all management systems and logical partition security domains
The user must also have View permission on HMC configurations and the ability to collect VPDinformation for the HMC console security grouping. The user must also be allowed Virtual IOServer Command access under the Logical Partition security grouping. It is a best practice to startfrom a role of an operator and then remove all roles. Read-only users on the HMC do not haveprivileges to run proxied commands on AIX hosts.
Advanced configuration
Field Description
Inventory Poll Interval (min) Interval, in minutes, at which the data source should poll theHMC; defaults to 20 minutes
SSH Port TCP port for SSH connections
SSH Process Wait Timeout (sec) Timeout for any one SSH command, in seconds
Insight data source management | 105

Field Description
Number of Retries Number of times an SSH request is going to be sent after atimeout
Exclude Devices List of managed POWER hardware systems to skip whenretrieving data, specified as either the full system ID or assystem display name strings
Multiple values should be comma separated.
Commands
Some commands are run multiple times and with different values, depending on the values returnedfrom previous commands.
• lshmc -V -F --header
• lssyscfg -r sys -F --header
• lshwres -r mem -m {managed system id} --level sys -F --header
• lshwres -r proc -m {managed system id} --level sys -F --header
• lshwres -r io --rsubtype slot -m {managed system id} -F --header
• lspartition -dlpar | grep Partition
• lssyscfg -r lpar -m {managed system id} -F --header
• lshwres -r mem --level lpar -m {managed system id} -F --header
• lshwres -r proc --level lpar -m {managed system id} -F --header
• viosvrcmd -m {managed system id} --id {virtual IO server id} -c
"ioslevel"
• viosvrcmd -m {managed system id} --id {virtual IO server id} -c "lsmap -
all"
• viosvrcmd -m {managed system id} --id {virtual IO server id} -c "lsdev -
dev fcs* -vpd"
• viosvrcmd -m {managed system id} --id {virtual IO server id} -c "lsdev"
•
• viosvrcmd -m {managed system id} --id {virtual IO server id} -c "lsdev -
dev {physical volume name} -vpd"
• viosvrcmd -m {managed system id} --id {virtual IO server id} -c "lsvg"
106 | Configuration and Administration Guide

• viosvrcmd -m {managed system id} --id {virtual IO server id} -c "lsvg
{volume group name} -fmt ,"
• viosvrcmd -m {managed system id} --id {virtual IO server id} -c "lsvg -
lv {volume group name} -fmt ,"
• viosvrcmd -m {managed system id} --id {virtual IO server id} -c "lsdev -
dev {physical volume id} -attr"
• viosvrcmd -m {managed system id} --id {virtual IO server id} -c "lsdev -
vpd"
• viosvrcmd -m {managed system id} --id {virtual IO server id} -c "lspv -
size -fmt ,"
IBM SVC (SSH) data source
The IBM SVC data source collects inventory and performance data using SSH. It supports a varietyof devices that run the SVC operating system. The list of supported devices includes models such asthe SVC, the v7000, the v5000, and the v3700. Refer to the Insight data source support matrix forsupported models and firmware versions.
Configuration
Field Description
Cluster/s IP Network address for the cluster/s, specified as an IP(nnn.nnn.nnn.nnn format), or as a hostname that can beresolved through DNS
User Name Name used to SSH into the device
Performance User Name The name used to log in (for array performance)
Requirements
• IP address of each SVC cluster
• Public and private key pair that you either generate withInsight or reuse a keypair already in useon your SVC
If you are reusing an existing keypair, you must convert them from Putty format to OpenSSHformat.
• Public key installed on the SVC cluster
• Private key needs to be identified in the data source
• Access validation: Open ssh session to the SVC cluster using the private key
Insight data source management | 107

Note: No third-party software needs to be installed.
Advanced configuration
Field Description
Inventory Poll Interval (min) Interval, in minutes, at which the data source should poll thedevice. The default is 40.
Exclude Devices Comma-separated list of devices, identified by serial number,that will not be discovered by this data source.
Full Path to Private Key The best practice is to store private key outside of the ..\sanscreen path to avoid losing the key during an upgrade.
SSH Process Wait Timeout (sec) Time in seconds waiting for command to finish. If notcompleted when timeout expires, the run fails. The default is10.
Performance Poll Interval (sec) For Array Performance, the recommended setting and defaultfor the poll interval is 300 seconds.
Performance Exclude Devices For Array Performance, comma-separated list of devices,identified by device ID, that will not supply performance data.
Performance Full Path to PrivateKey
For Array Performance, the full path to the SSH key.
Performance SSH Process WaitTimeout (sec)
For Array Performance, the maximum time allowed forcommands to complete.
To clean up dumped stats files For Array Performance, remove dump files copied to theprimary node during performance collection.
Commands
• svcconfig backup -quiet
• svcinfo lsportfc -nohdr -delim :
• Retrieves /tmp/svc.config.backup.xml via SCP
Performance requirements
• SVC Console, which is mandatory for any SVC cluster and required for the SVC discoveryfoundation package.
• Administrative access level required only for copying performance data files from cluster nodesto the config node
108 | Configuration and Administration Guide

Note: Because this access level is not required for the SVC foundation discovery package, theSVC foundation user might not work successfully.
• A private and public SSH key must be generated for this user, and the private key stored so that itis accessible from the Acquisition unit. If the SVC foundation user has the proper permissions,then the same user and key works. The same SSH key can be used for inventory and performancedata.
• Enable data collection by connecting to the SVC cluster by SSH and running: svctaskstartstats -interval 1
Note:
Alternatively, enable data collection using the SVC management user interface.
IBM Tivoli Monitoring data source
This data source is used solely for File System Utilization. It communicates directly with the TivoliMonitoring Database, also known as the Tivoli Monitoring Data Warehouse. Oracle and DB2databases are supported.
Oracle error message
If the specified SID results in the error message containing "ORA-12154" on attempting to connect,double-check your Oracle DB network service configuration. If the access configuration specifies afully qualified hostname (for example, "NAMES.DEFAULT_DOMAIN"), try inserting the fullyqualified service name in the SID field. A simple example would be that the connection to SIDtestdb is failing and your Oracle configuration specifies a domain of company.com. Thefollowing string can be used instead of the base SID to try and connect: testdb.company.com.
Configuration
Field Description
Tivoli Monitoring Database IP IP address of server.
User Name User name for login.
Password Password for login.
Advanced configuration
Field Description
Tivoli Monitoring Database Port 50001 should be configured for DB2.
DB2 Database Name The default is QTIVOLI.
Insight data source management | 109

Field Description
Inventory Poll Interval (min) Interval, in minutes, at which the data source should poll thedevice. The default is 60.
Database Driver to Use For DB2 environments, set it to DB2.
Protocol Used to Connect to theDatabase
TCP=default (TCPS is the secure option and depends on thedatabase configuration.)
Database Schema The name of the database schema to use in queries.
IBM TotalStorage DS4000 data source
This data source collects inventory and performance information. There are two possibleconfigurations (firmware 6.x and 7.x+), and they both have the same values. The API collects thevolume data statistics.
Configuration
Field Description
Comma Separated List of ArraySANtricity Controller IPs
Network address for the management controller of each arrayfrom which this data source will acquire information, specifiedas an IP (nnn.nnn.nnn.nnn format), or as a hostname that canbe resolved through DNS. Separate multiple network addressesusing a semicolon.
Requirements
• IP address of each DS5 or FAStT array
• Access validation: Ping the IP address of both controllers on each array.
Note: No third-party software needs to be installed.
Advanced configuration
Field Description
Inventory Poll Interval (min) Interval, in minutes, at which the data source should poll thedevice for performance data. The default is 30.
Performance Poll Interval (up to3600 seconds)
For Array Performance, the recommended setting and defaultfor the poll interval is 300 seconds.
110 | Configuration and Administration Guide

IBM XIV (CLI) data source
IBM XIV data source inventory is performed by using the XIV CLI. XIV performance isaccomplished by making SMI-S calls to the XIV array, which runs a SMI-S provider on port 5989.
Configuration
Field Description
IP Address IP address for the storage system
User Name Name used to log in to the storage system
Password Password used to log in to the storage system
Full path to XIV CLI directory The default is C:\Program Files\GUI10.
Requirements
• Port requirement: TCP port 5989
• IP address of the XIV management interface
• Read-only user name and password
• Third-party software installed on the Insight server or RAU: XIV CLI
• Access validation: Log in to the XIV user interface from the Insight server using the user nameand password.
Advanced configuration
Field Description
Inventory Poll Interval (min) Interval, in minutes, at which the data source should poll thedevice. The default is 40 minutes.
CLI Process Wait Timeout (ms) The default is 7200000 milliseconds.
SMI-S Host IP For Array Performance, the host name or IP address of theSMI-S provider host.
SMI-S Port For Array Performance, the SMI-S port. The default is 5989.
SMI-S Protocol For Array Performance, HTTP (if unsecured access) or HTTPS(if secured access).
SMI-S Namespace For Array Performance, the SMI-S namespace used to querythe data.
Insight data source management | 111

Field Description
Username For Array Performance, the name used for authentication bythe SMI-S host for performance data.
Password For Array Performance, the password used for authenticationby the SMI-S host for performance data.
Performance Poll Interval (sec) For Array Performance, the recommended setting and defaultfor the poll interval is 600 seconds.
Number of SMI-S ConnectionRetries
For Array Performance, the maximum number of connectionretry attempts.
Commands
Insight invokes the following commands.
• xcli -x -m <IP Address> -u <user> -p <password> config_get
• xcli -x -m <IP Address> -u <user> -p <password> disk_list
• xcli -x -m <IP Address> -u <user> -p <password> fc_port_list
• xcli -x -m <IP Address> -u <user> -p <password> fc_connectivity_list
• xcli -x -m <IP Address> -u <user> -p <password> host_list
• xcli -x -m <IP Address> -u <user> -p <password> ipinterface_list
• xcli -x -m <IP Address> -u <user> -p <password> mapping_list host =
<hostname>
• xcli -x -m <IP Address> -u <user> -p <password> pool_list
• xcli -x -m <IP Address> -u <user> -p <password> system_capacity_list
• xcli -x -m <IP Address> -u <user> -p <password> version_get
• xcli -x -m <IP Address> -u <user> -p <password> vol_list
• xcli -x -m<IP Address> -u <user> -p <password> host_connectivity_list
• xcli -x -m <IP Address> -u <user> -p <password> pool_list
112 | Configuration and Administration Guide

Microsoft Hyper-V (WMI) data source
For configuration, this data source requires the IP address or the resolvable DNS name for thephysical host (Hypervisor).
Configuration
Field Description
Physical Host IP Address The IP address or the resolvable DNS name for the physicalhost (Hypervisor)
User Name The administrator name used to log in to the server
Password The administrator password used to log in to the server.
NT Domain The NT domain for which the physical host (Hypervisor) isconfigured.
Requirements
• Administrative level user account
• WMI command, which is the default installed by Windows
Advanced configuration
Field Description
Inventory Poll Interval (min) Interval, in minutes, at which the data source should poll thedevice. The default is 20.
Connection Timeout (ms) The time, in milliseconds, to wait for a WMI command tocomplete. The default is 60000.
Commands
All commands are run with the following additional arguments: /user:"user" /password:"password" /node:"IP".
Cluster-level commands
• wmic /namespace:\\root\mscluster /authlevel:pktprivacy path
MSCluster_Cluster get Name,QuorumPath,SharedVolumesRoot /format:csv
• wmic /namespace:\\root\mscluster /authlevel:pktprivacy path
MSCluster_ClusterToNode get Antecedent,Dependent
Insight data source management | 113

• wmic /namespace:\\root\mscluster /authlevel:pktprivacy path
MSCluster_Node get Name,State
• wmic /namespace:\\root\mscluster /authlevel:pktprivacy path
MSCluster_ClusterToClusterSharedVolume get GroupComponent,PartComponent
• wmic /namespace:\\root\mscluster /authlevel:pktprivacy path
MSCluster_ClusterToQuorumResource get GroupComponent,PartComponent
• wmic /namespace:\\root\mscluster /authlevel:pktprivacy path
MSCluster_ResourceToDisk get GroupComponent,PartComponent
• wmic /namespace:\\root\mscluster /authlevel:pktprivacy path
MSCluster_DiskToDiskPartition get GroupComponent,PartComponent
• wmic /namespace:\\root\mscluster /authlevel:pktprivacy path
MSCluster_ClusterSharedVolumeToPartition get
GroupComponent,PartComponent
• wmic /namespace:\\root\mscluster /authlevel:pktprivacy path
MSCluster_ClusterSharedVolume get FaultState,Name,VolumeName
• wmic /namespace:\\root\mscluster /authlevel:pktprivacy path
MSCluster_Disk get
ID,Name,ScsiBus,ScsiLUN,ScsiPort,ScsiTargetID,Signature
•
Physical host-level commands
• wmic /namespace:\\root\cimv2 path Win32_ComputerSystem get
DNSHostName,Domain,Manufacturer,Model,NumberOfLogicalProcessors,SystemTy
pe,TotalPhysicalMemory
• wmic /namespace:\\root\cimv2 path Win32_OperatingSystem get
BuildNumber,Caption,OSArchitecture,ServicePackMajorVersion,ServicePackMi
norVersion,Version
• wmic /namespace:\\root\cimv2 path Win32_Processor get MaxClockSpeed
• wmic /namespace:\\root\cimv2 path Win32_SystemEnclosure get SerialNumber
• wmic /namespace:\\root\cimv2 path Win32_NetworkAdapterConfiguration get
IPAddress,IPEnabled
• wmic /namespace:\\root\cimv2 path Win32_NetworkAdapter get
NetConnectionStatus,PhysicalAdapter,Speed
• wmic /user:<user> /password:<password> /node:<IP>/namespace:\\root\wmi
path MSFC_FCAdapterHBAAttributes get
114 | Configuration and Administration Guide

Active,DriverName,DriverVersion,FirmwareVersion,HardwareVersion,HBAStatu
s,InstanceName,Manufacturer,Model,ModelDescription,NodeWWN,NodeSymbolicN
ame,NumberOfPorts,OptionROMVersion,SerialNumber,VendorSpecificID
• wmic /namespace:\\root\cimv2 path Win32_DiskDrive where
InterfaceType='SCSI' get
DeviceID,Manufacturer,Model,Name,Partitions,PNPDeviceID,SCSIBus,SCSILogi
calUnit,SCSIPort,SCSITargetId,SerialNumber,Signature,Size,Status
• wmic /namespace:\\root\wmi path MSiSCSI_HBAInformation get
InstanceName,UniqueAdapterId
• wmic /namespace:\\root\wmi path MSiSCSIInitiator_SessionClass get
Devices,InitiatorName,SessionId,TargetName
• wmic /namespace:\\root\cimv2 path Win32_LogicalDiskToPartition get
Antecedent,Dependent
• wmic /namespace:\\root\wmi path MSFC_FibrePortHBAAttributes get
Active,Attributes,HBAStatus,InstanceName
• wmic /namespace:\\root\cimv2 path Win32_DiskDriveToDiskPartition get
Antecedent,Dependent
• wmic /namespace:\\root\cimv2 path Win32_Volume get
Capacity,DeviceID,DriveLetter,DriveType,FreeSpace,Label,Name
• wmic /namespace:\\root\cimv2 path StdRegProv call GetBinaryValue
hDefKey="&H80000002" sSubKeyName="SYSTEM\MountedDevices" sValueName="\??
\Volume{d71db670-8c30-11e2-b1c9-806e6f6e6963}"
Virtual machine-level commands
• wmic /namespace:\\root\virtualization path
Msvm_VirtualSystemSettingDataComponent get GroupComponent,PartComponent
• wmic /namespace:\\root\virtualization path
Msvm_ResourceAllocationSettingData where (ResourceSubType='Microsoft
Virtual Hard Disk' and Parent != null or ResourceSubType='Microsoft
Physical Disk Drive' and Parent != null) get
Connection,HostResource,Parent,ResourceSubType
• wmic /namespace:\\root\virtualization path Msvm_ImageManagementService
where name='vhdsvc' call GetVirtualHardDiskInfo 'C:\ClusterStorage
\Volume1\ds2-client4\ds2-client1.vhd'
Insight data source management | 115

NetApp Clustered Data ONTAP data source
This data source should be used for storage systems using Clustered Data ONTAP, and requires anadministrator account used for read-only API calls.
Configuration
Field Description
NetApp Management IP IP address of a cluster management LIF.
User Name Name used to log into the cluster.
Password Password used to log into the NetApp cluster.
Requirements
• Administrator account used for read-only API calls
• Target IP is the cluster management LIF
• FCP license and mapped/masked volumes required for Insight discovery
• CIFS and/or NFS license and CIFS shares or NFS exports required for Insight NAS discovery
• Access validation: Telnet or SSH to the cluster management LIF from the Insight server using theusername and password.
Note: Third-party software is not required.
Advanced configuration
Field Description
Connection Type The default is HTTP.
Communication Port 80 for HTTP or 443 for HTTPS. The default is 80.
Inventory Poll Interval (min) Interval, in minutes, at which the data source should poll thedevice.
Performance Poll Interval (sec) For Array Performance, the recommended setting and defaultfor the poll interval is 900 seconds.
NetApp Clustered Data ONTAP 8.1.x for Unified Manager data source
This data source collects clustered Data ONTAP 8.1.x data from the Unified Manager (UM) 6.0+database. Using this data source, Insight discovers all clusters configured and populated in UM. For
116 | Configuration and Administration Guide
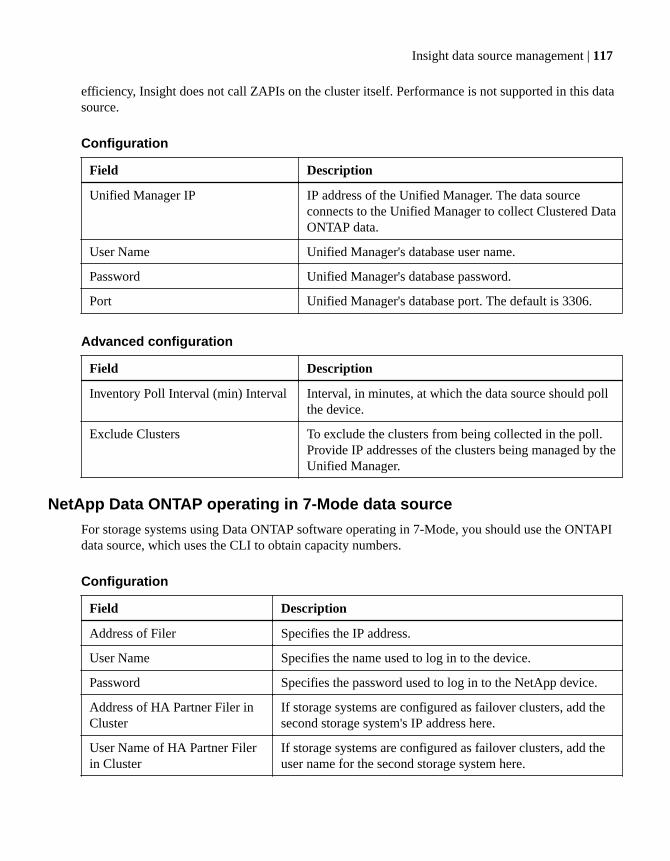
efficiency, Insight does not call ZAPIs on the cluster itself. Performance is not supported in this datasource.
Configuration
Field Description
Unified Manager IP IP address of the Unified Manager. The data sourceconnects to the Unified Manager to collect Clustered DataONTAP data.
User Name Unified Manager's database user name.
Password Unified Manager's database password.
Port Unified Manager's database port. The default is 3306.
Advanced configuration
Field Description
Inventory Poll Interval (min) Interval Interval, in minutes, at which the data source should pollthe device.
Exclude Clusters To exclude the clusters from being collected in the poll.Provide IP addresses of the clusters being managed by theUnified Manager.
NetApp Data ONTAP operating in 7-Mode data source
For storage systems using Data ONTAP software operating in 7-Mode, you should use the ONTAPIdata source, which uses the CLI to obtain capacity numbers.
Configuration
Field Description
Address of Filer Specifies the IP address.
User Name Specifies the name used to log in to the device.
Password Specifies the password used to log in to the NetApp device.
Address of HA Partner Filer inCluster
If storage systems are configured as failover clusters, add thesecond storage system's IP address here.
User Name of HA Partner Filerin Cluster
If storage systems are configured as failover clusters, add theuser name for the second storage system here.
Insight data source management | 117

Field Description
Password of HA Partner Filer inCluster
If storage systems are configured as failover clusters, add thesecond storage system password here.
Requirements
• IP address of the FAS storage controller and partner
• User name and password for the controller and the partner
• FCP license and mapped or masked volumes required for OnCommand Insight discovery
• CIFS or NFS licenses and CIFS shares or NFS exports required for OnCommand Insight NASdiscovery
• Access validation
Use telnet to access the FAS controller from the OnCommand Insight Server using the user nameand password.
Note: Third-party software is not required.
Advanced configuration
Field Description
Inventory Poll Interval (min) Specifies the interval, in minutes, at which the data sourceshould poll the device.
Connection Type The default is HTTP.
Connection Port The default is 80.
Performance Poll Interval (sec) For Array Performance, the recommended setting and defaultfor the poll interval is 300.
Storage systems connection requirements
As an alternative to using the default administrative user for this data source, you can configure auser with administrative rights directly on the NetApp storage systems so that this data source canacquire data from NetApp storage systems.
Connecting to NetApp storage systems requires that the user, who is specified when acquiring themain pfiler (on which the storage system exist), meet the following conditions:
• The user must be on vfiler0 (root filer/pfiler).
Storage systems are acquired when acquiring the main pfiler.
• The following commands define the user role capabilities:
118 | Configuration and Administration Guide

◦ "api-*": Use this to allow OnCommand Insight to execute all NetApp storage API commands.This command is required to use the ZAPI.
◦ "login-http-admin": Use this to allow OnCommand Insight to connect to the NetApp storagevia HTTP. This command is required to use the ZAPI.
◦ "security-api-vfiler": Use this to allow OnCommand Insight to execute NetApp storage APIcommands to retrieve vFiler unit information.
◦ "cli-options": For "options" command and used for partner IP and enabled licenses.
◦ " cli-lun": Access these command for managing LUNs. Displays the status (LUN path, size,online/offline state, and shared state) of the given LUN or class of LUNs.
◦ "cli-df": For "df -s", "df -r", "df -A -r" commands and used to display free space.
◦ "cli-ifconfig": For "ifconfig -a" command and used for getting filer IP address.
◦ "cli-rdfile": For "rdfile /etc/netgroup" command and used for getting netgroups.
◦ "cli-date": For "date" command and used to get full date for getting Snapshot copies.
◦ "cli-snap": For "snap list" command and used for getting Snapshot copies.
If cli-date or cli-snap permissions are not provided, acquisition can finish, but Snapshot copies arenot reported.
To acquire a 7-Mode data source successfully and generate no warnings on the storage system, youshould use one of the following command strings to define your user roles. The second string listedhere is a streamlined version of the first:
login-http-admin,api-*,security-api-vfile,cli-rdfile,cli-options,cli-df,cli-lun,cli-ifconfig,cli-date,cli-snap,or login-http-admin,api-*,security-api-vfile,cli-*
OnCommand Insight executes the following calls made by the NetApp data source:
• aggr-list-info
• aggr-space-list-info - Get aggregate capacity details
• cifs-share-list-iter-end
• cifs-share-list-iter-next
• cifs-share-list-iter-start
• cifs-status
• cli-df
Insight data source management | 119

• cli-ifconfig - Get IP configuration (when net-ifconfig-get not supported)
• cli-lun
• cli-options
• disk-list-info
• fcp-adapter-list-info
• fcp-service-status
• iscsi-initiator-auth-list-info
• iscsi-initiator-get-default-auth
• iscsi-node-get-name
• iscsi-portal-list-info
• iscsi-service-status
• iscsi-session-list-info
• iscsi-tpgroup-list-info
• license-list-info
• lun-list-info
• lun-map-list-info
• net-ifconfig-get - Get IP configuration
• nfs-exportfs-list-rules
• nfs-exportfs-list-rules-2 - NFS exports for later version 7-mode
• nfs-status
• perf-object-counter-list-info
• perf-object-get-instances-iter-end
• perf-object-get-instances-iter-next
• perf-object-get-instances-iter-start
• perf-object-list-info
• portset-list-info
• rdfile
120 | Configuration and Administration Guide

• qtree-list
• quota-report
• security-api-vfiler
• snapmirror-get-status - Get storage synchronization data
• snapmirror-list-connections
• snapmirror-list-destinations
• snapshot-reserve-list-info
• storage-adapter-get-adapter-list - Discover back end and initiator FC ports
• system-cli
• system-get-info
• system-get-ontapi-version
• system-get-vendor-info
• system-get-version
• volume-list-info
NetApp E-Series data source
This data source collects inventory and performance information. There are two possibleconfigurations (firmware 6.x and firmware 7.x+), and they both have the same values.
Configuration
Field Description
Comma-separated list of ArraySANtricity Controller IPs
Network address for the management controller of each arrayfrom which this data source acquires information, specified asan IP (nnn.nnn.nnn.nnn format) or as a host name that can beresolved through DNS. Separate multiple network addressesusing a comma.
Advanced configuration
Field Description
Inventory Poll Interval (min) The default is 30.
Performance Poll Interval (up to3600 seconds)
For Array Performance, the default is 300.
Insight data source management | 121

Requirements
• The IP address of each controller on the array
• Access validation by pinging the IP address of both controllers on the array
Note: No third-party software is required.
NetApp Host and VM File Systems data source
You can use the NetApp Host and VM File Systems data source to retrieve file system details andstorage resource mappings for all Microsoft Windows host and VM (virtual machine) file systemsand for all supported Linux VMs (those that are virtually mapped only) existing in the Insight serverthat are annotated with the configured Compute Resource Group (CRG).
Configuration
Field Description
User Name Operating system user with appropriate rights to retrieve filesystem data
For Windows operating system users, this must include thedomain prefix.
Password Password for the operating system user
Compute Resource Group Annotation value used to flag host and virtual machines forwhich for the data source discovers file systems
A blank value indicates that the data source discovers filesystems for all hosts and virtual machines not currentlyannotated with any Compute Resource Group.
General requirements
• This feature must be purchased separately.
You can contact your Insight representative for assistance.
• You should check the Insight support matrix to verify that your host or virtual machine operatingsystem is supported.
To verify that links from file systems to storage resources are created, check that the relevantstorage or virtualization vendor type and version report the volume or virtual disk identificationdata required.
Note: No non-NetApp software is required.
122 | Configuration and Administration Guide

Microsoft Windows requirements
• This data source uses Window Management Instrumentation (WMI) data structures to retrievedata.
This service must be operational and available remotely. In particular, port 135 must be accessibleand must be opened if behind a firewall.
• Windows domain users must have the appropriate permissions to access WMI structures.
• Administrator permissions are required.
Linux requirements
• This data source uses a Secure Shell (SSH) connection to execute commands on Linux VMs.
The SSH service must be operational and available remotely. In particular, port 22 must beaccessible and must be opened if behind a firewall.
• SSH users must have sudo permissions to execute read-only commands on Linux VMs.
You must use the same password to log in to SSH and to answer any sudo password challenge.
Advanced configuration
Field Description
Inventory pollinterval (min)
Interval, in minutes, at which the data source should poll the device.
Microsoft Windows commands
• root\cimv2 SELECT * FROM Win32_BIOS
• root\cimv2 SELECT * FROM Win32_ComputerSystem
• root\cimv2 SELECT * FROM Win32_OperatingSystem
• root\cimv2 SELECT * FROM Win32_NetworkAdapter WHERE AdapterTypeId=0
• root\cimv2 SELECT * FROM Win32_DiskDrive
• root\cimv2 SELECT * FROM Win32_DiskDriveToDiskPartition
• root\cimv2 SELECT * FROM Win32_LogicalDiskToPartition
• root\cimv2 SELECT * FROM Win32_LogicalDisk
• root\cimv2 SELECT * FROM Win32_Volume
• root\default StdRegProv:\HKEY_LOCAL_MACHINE\SYSTEM\MountedDevices
Insight data source management | 123

• root\default StdRegProv:\HKEY_LOCAL_MACHINE\HARDWARE\DEVICEMAP\Scsi\Scsi
Port <port_number>\Scsi Bus <bus_number>\Target Id <target_id>\Logical
Unit Id <logical_id>
The last command runs for each discovered block device, as in the following example:
root\default StdRegProv:\HKEY_LOCAL_MACHINE\HARDWARE\DEVICEMAP\Scsi\Scsi
Port 2\Scsi Bus 0\Target Id 0\Logical Unit Id 0
root\default StdRegProv:\HKEY_LOCAL_MACHINE\HARDWARE\DEVICEMAP\Scsi\Scsi
Port 2\Scsi Bus 0\Target Id 0\Logical Unit Id 1
Linux commands
• /bin/hostname
• /bin/domainname
• /bin/dnsdomainname
• /bin/uname -m
• /bin/cat /etc/os-release
• /bin/cat /sys/devices/virtual/dmi/id/product_name
• /bin/cat /sys/devices/virtual/dmi/id/chassis_vendor
• /bin/cat /sys/devices/virtual/dmi/id/sys_vendor
• /bin/cat /proc/cpuinfo
• /bin/cat /proc/meminfo
• /sbin/ifconfig -a
• /usr/bin/sudo /sbin/mii-tool <interface_name>
This command runs for each interface.
• /bin/df -T -BK
• /bin/ls -l /sys/class/scsi_device
• /bin/cat /proc/swaps
• /bin/cat /proc/mdstat
• /bin/cat /proc/partitions
• /bin/ls -l /dev/mapper
124 | Configuration and Administration Guide

• /bin/ls -l /dev/block
• /bin/ls -l /sys/block
• /bin/ls -l /dev/disk/by-id
• /bin/ls -l /dev/disk/by-uuid
• /bin/ls -l /dev/disk/by-path
• /bin/ls -l /dev/disk/by-label
• /usr/bin/sudo /sbin/pvdisplay -v
• /usr/bin/sudo /sbin/vgdisplay -v
• /usr/bin/sudo /sbin/lvdisplay -v
• /sbin/udevadm info --query=property --name=sda # for each SCSI device
This command is run for each SCSI device.
• /bin/cat /sys/devices/pci0000:00/0000:00:07.1/host1/target1:0:0/1:0:0:0/
vendor
• /bin/cat /sys/devices/pci0000:00/0000:00:07.1/host1/target1:0:0/1:0:0:0/
model
This command is run for each SCSI device.
Usage recommendations
• You should annotate a group of hosts and virtual machines that have common operating systemcredentials using the same Compute Resource Group annotation.
Each group has an instance of this data source discovering file system details from those hostsand virtual machines.
• If you have an instance of this data source for which the success rate is low (for example, OCI isdiscovering file system details for only 50 of 1000 hosts and virtual machines in a group), youshould move the hosts and virtual machines for which discovery is successful into a separateCompute Resource Group.
Insight data source management | 125

QLogic FC Switch (SNMP) data source
For configuration, this data source requires the network address for the FC Switch device, specifiedas an IP address, and an SNMP read-only community string used to access the device.
Configuration
Field Description
SANSurfer Switch Network address for the FC Switch (SANsurfer) device,specified as an IP (nnn.nnn.nnn.nnn format), or as a hostnamethat can be resolved through DNS.
SNMP version The default is V2.
SNMP community SNMP read-only community string used to access the device.
User Name SNMP name used to log into the switch. Applies when usingSNMP V3.
Password SNMP password used to log into the switch. Applies whenusing SNMP V3.
Advanced configuration
Field Description
Inventory Poll Interval (min) Interval, in minutes, at which the data source should poll thedevice.
SNMP Auth Protocol Encryption type. The default is MD5.
SNMP Retries Maximum number of retry attempts for a given command.
SNMP Timeout (ms) Timeout for connecting to the device using SNMP.
Enable Trapping Check box used to trigger acquisition upon receiving an SNMPtrap from the device. If you mark this box, you must alsoactivate SNMP notifications.
Minimum Time Between Traps(sec)
Minimum elapsed time between acquisition attempts triggeredby traps, in seconds.
Fabric Name Fabric name to be reported by this data source (blank to reportthe fabric WWN).
Performance Poll Interval (sec) For Switch Performance, the recommended setting and defaultfor the poll interval is 300 seconds.
126 | Configuration and Administration Guide

Violin Memory 6000 Series Flash Memory Array (HTTP) data source
This data source collects network information for analysis and validation from Violin 6000 seriesflash memory arrays. To add the data source, you must use specific configuration instructions andcommands and understand data source requirements and usage recommendations.
Configuration
Field Description
IP address or FQDN of ViolinMemory Array Master Gateway
IP address or FQDN of the Violin Memory Array MasterGateway
User Name User name you use to log in to the Violin Memory ArrayMaster Gateway
Password Password you use to log in to the Violin Memory Array MasterGateway
General requirements
• You need a read-only user name and password to the storage.
• Validate access with a web browser using the storage IP address.
Note: No non-NetApp software is required.
Advanced configuration
Field Description
Communication Port The communication port on the storage
HTTPS Enabled Whether or not HTTPS is enabled on the storage
Inventory PollInterval (min)
Interval, in minutes, at which the data source should poll the device forinventory information
Connection timeout(sec)
Number of seconds Insight should wait before it stops trying to connect tothe storage
Performance PollInterval (sec)
Interval, in seconds, at which the data source should poll the device forperformance information
Commands
• POST http://{ip address}:{port}/admin/launch?
script=rh&template=login&action=login HTTP/1.1
Insight data source management | 127

• GET http://{ip address}:{port}/xtree/system/smbios/
system_serial_number/*** HTTP/1.1
• GET http://{ip address}:{port}/xtree/system/model/*** HTTP/1.1
• GET http://{ip address}:{port}/xtree/system/motd/*** HTTP/1.1
• GET http://{ip address}:{port}/xtree/system/num_cpus/*** HTTP/1.1
• GET http://{ip address}:{port}/xtree/system/uptime/*** HTTP/1.1
• GET http://{ip address}:{port}/xtree/system/version/composite/***
HTTP/1.1
• GET http://{ip address}:{port}/xtree/system/version/release/*** HTTP/1.1
• GET http://{ip address}:{port}/xtree/cluster/*** HTTP/1.1
• GET http://{ip address}:{port}/xtree/vshare/state/local/container/***
HTTP/1.1
• GET http://{ip address}:{port}/xtree/media/state/array/*** HTTP/1.1
• GET http://{ip address}:{port}/xtree/vshare/config/igroup/*** HTTP/1.1
• GET http://{ip address}:{port}/xtree/vshare/config/export/container/***
HTTP/1.1
• GET http://{ip address}:{port}/xtree/vshare/state/global/*** HTTP/1.1
VMware vSphere (Web Services) data source
This data source collects ESX Hosts information and requires read-only privileges on all objectswithin the Virtual Center.
Configuration
Field Description
Virtual Center Address Network address for the Virtual Center or vSphere server,specified as an IP (nnn.nnn.nnn.nnn format) address or as ahost name that can be resolved through DNS.
User Name Name used to log in to the VMware server. You need anaccount with read-only privileges within Virtual Center orvSphere.
Password Password used to log in to the VMware server.
128 | Configuration and Administration Guide

Requirements
• Read-only privileges on all objects within Virtual Center.
• SDK access on the Virtual Center server
• Access validation: Log in to Virtual Center Client using your user name and password. Verify thatthe SDK is enabled by entering
telnet <vc_ip> 443
.
Note: Third-party software is not required.
Advanced configuration
Field Description
Inventory Poll Interval (min) Interval, in minutes, at which the data source should poll thedevice. Defaults to 20 minutes for VM Inventory.
Connection Timeout (ms) The timeout default is 60,000 milliseconds.
Exclude VMs by A comma-separated list of ESX host or data center IPaddresses that should not be polled. This is optional.
Exclusion list (CommaSeparated, or SemicolonSeparated if Comma Is Used inthe Value)
Comma-separated list of devices, identified by a generic deviceID, that are not discovered by this data source.
Number of Retries for Requeststo vCenter
Maximum number of retry attempts for a given command.
Communication Port The possible communication ports are http-80 and https-443.
The default is 443.
Performance Poll Interval (sec) For VM Performance, the recommended setting and default forthe poll interval is 300 seconds.
Commands
This data source uses the VMware Infrastructure (VI) SDK 2.5.0.
Insight data source management | 129

Changing data source credentialsIf multiple data sources of the same type are sharing a username and password, you can change thepassword for all devices in the group at the same time.
Steps
1. On the Insight toolbar, click the Admin icon.
The Data sources list opens.
2. Click the Actions button and select the Change credentials option.
3. In the Credentials Management dialog box, select one of the data source groups from the list.
The Edit icon, a pen on a sheet of paper, becomes active to the right.
4. Click Edit.
5. Enter the new password and confirm it.
130 | Configuration and Administration Guide

Changes causing data collection problemsIf you are experiencing data collection problems in OnCommand Insight (OCI), changes in yourenvironment are a likely cause. As a general maintenance rule, any changes in your environmentusually need to be accommodated in OCI.
Use this checklist to identify changes to your network that might be causing problems:
• Have you changed any passwords? Were those passwords changed in Insight?
• Did you remove a device from your network? You must also remove the device fromOnCommand Insight to prevent it from being rediscovered and reintroduced.
• Did you upgrade your infrastructure software (such as HP CommandView EVA or EMCSolutions Enabler)? If so, you might have introduced version mismatches because Insight datasources might be using CLI client tools from your vendors to speak to the server tools. Ensurethat the appropriate versions of the client tools are installed on the acquisition unit. If data sourcefailures persist, you need to contact NetApp Customer Support to request assistance and possiblya data source patch.
• Are all of your OnCommand Insight acquisition units using the same OnCommand Insightversion? If the Remote Acquisition Units and local acquisition unit are running differentOnCommand Insight versions, install the same version on all units to correct the data collectionproblem. If you need to install a new version of OCI on all of the acquisition units, go to theNetApp Customer Support site and download the correct version.
• Have you changed any domain names or added a new domain? You must reconfigure the AutoResolution (AR) methods in the Java UI.
Related concepts
Data source patches on page 138
Related tasks
Deleting a data source from OCI on page 151
Upgrading Insight Server software on page 173
Insight data source management | 131

Examining one data source in detailIf you see that a data source has failed or slowed, you might want to examine a detailed summary ofinformation for that data source to determine the cause of the problem. Data sources with conditionsrequiring your attention are marked with a solid red circle.
Steps
1. On the Insight toolbar, click the Admin icon.
The Data sources list opens. Any listed data sources with potential problems are marked with asolid red circle. The most serious problems are at the top of the list.
2. Select the data source that is causing concern.
3. Click the data source name link.
4. On the data source summary page, check the information in any of these sections:
• Event timeline
Lists events tied to the current status shown in the Data sources list. Events in this summaryare displayed per device. Errors are shown in red. You can position your mouse pointer ontimeline items to display additional information.
• Devices reported by this data source
Lists the types of devices, their IP addresses, and links to more detailed information for eachdevice.
• Changes reported by this data source (last 3 weeks)
Lists any devices that were added or removed or had a change to the configuration.
5. After examining the data source information, you might want to perform one of these operationsusing the buttons at the top of the page:
• Edit the description of the data source to correct the problem.
• Poll again forces polling to reveal if the problem was persistent or intermittent.
• Postpone data source polling for 1, 3, or 5 days to give you time to research the problem andstop the warning messages.
• Install a patch on the data source to correct the problem.
• Prepare an Error report for technical support.
• Delete the data source from your Insight monitoring environment.
132 | Configuration and Administration Guide

Researching a failed data sourceIf a data source has the "Inventory failed !" or "Performance failed !" message and a High orMedium Impact, you need to research this problem using the data source summary page with itslinked information.
Steps
1. Click the linked Name of the data source to open the Summary page.
This example shows a wide variety of information that might be provided for a failed data source.
2. Check the Comments area to read any notes left by another engineer who might also beinvestigating this failure.
3. Note any performance messages.
4. If there is a patch being applied to this data source, click link to check the patch page to see ifthat has caused the problem.
Insight data source management | 133

5. Move your mouse pointer over the segments of the Event timeline graph to display additionalinformation.
6. Select an error message for a Device and displayed below the Event timeline and click the Errordetails icon that displays to the right of the message.
The Error details include the text of the error message, most likely causes, information in use, andsuggestions of what can be tried to correct the problem.
7. In the Devices reported by this data source area, you might filter the list to display only devices ofinterest, and you can click the linked Name of a device to display the asset page for that device.
8. To return to previously displayed pages, use one of these techniques:
• Click the browser back arrow.
• Right-click the back arrow to display a list of the pages and select the page you want.
9. To display detailed information about other resources, click other linked names.
10. When you return to the data source summary page, check the Changes area at the bottom of thepage to see if recent changes caused the problem.
Related concepts
Changes causing data collection problems on page 131
Data source patches on page 138
Data source support information on page 58
Related tasks
Examining one data source in detail on page 132
Controlling data source pollingAfter making a change to a data source, you might want it to poll immediately to check yourchanges, or you might want to postpone the data collection on a data source for one, three, or fivedays while you work on a problem.
Steps
1. Click Admin on the toolbar.
The Data sources list opens.
2. Select the data source on which you want to control the polling.
3. Click the data source name link.
134 | Configuration and Administration Guide

4. On the data source summary page, check the information and click one of these two pollingoptions:
• Poll again to force the data source to collect data immediately.
• Postpone and select the length of the polling delay from 1, 3, or 5 days.
After you finish
If you postponed the data collection on a data source and want to restart collection, click Resume onthe summary page.
Editing data source informationYou can quickly edit data source setup information.
Steps
1. Click Admin on the toolbar.
The Data sources list opens.
2. Locate the data source that you want to edit.
3. Use one of these methods to begin the changes:
• Click Edit data source to the right of the selected data source.
• Click the linked name of the selected data source and click Edit.
Either method opens the Edit data source dialog box.
Insight data source management | 135

4. Select the required changes.
5. Click Save.
Editing information for multiple data sourcesYou can edit most of the information for multiple data sources of the same vendor and model at onetime. For example, if these data sources share a user name and password, you can change thepassword in one place and thereby update the password for all the selected data sources.
About this task
Options that you cannot edit for the selected data sources appear dimmed or are not displayed in theEdit data source dialog box. Additionally, when an option displays a value of Mixed, it indicates thatthe value for the option varies between the selected data sources. For example, if the Timeout (sec)option for two selected data sources is Mixed, one data source could have a timeout value of 60 andthe other could have a value of 90; therefore, if you change this value to 120 and save the changes tothe data sources, the timeout setting for both data sources becomes 120.
Steps
1. Click Admin on the toolbar.
136 | Configuration and Administration Guide

The Data Sources list opens.
2. Click the Actions button and select the Bulk edit option.
The Bulk Edit Multiple Data Sources dialog box displays:
3. Select the vendor of the data sources from the Vendor list.
If there is only one model for the vendor you selected, the dialog box lists all the data sourcesavailable.
4. Select the model of the data sources from the Model list.
The dialog box lists all the data sources that match the vendor and model that you selected.
5. Select the location of the acquisition unit for the data sources from the Acquisition Unit list.
6. Click Next.
The Edit data source dialog box displays.
7. Change any of the Settings options.
8. Click the Configuration link to change any of the basic options for the data sources.
9. Click the Advanced Configuration link to change any of the advanced options for the datasources.
10. Click Save.
Insight data source management | 137

Data source patchesFor each data source type in your network, you can upload data source patches. You can also install,test, and manage the patching process. However, only one patch can be active for a data source typeat a time.
For each patch, you can perform these tasks:
• Check the before and after comparison of each data source receiving the patch.
• Write comments to explain decisions or summarize research.
• Make changes to a data source that is not responding well to the patch.
• Approve the patch to be committed to your Insight server.
• Roll back a patch that is not operating as you intended.
• Replace a failing patch with a different one.
Installing a patch on one type of data source
After uploading a data source patch, you can install it on all of the data sources of the same type.
Before you begin
You must have uploaded a patch file that you want to install on one type of data source.
Steps
1. Click the Admin icon on the toolbar.
2. Click Patches.
3. From the Actions button, select Apply patch.
4. In the Apply data source patch dialog box, click Browse to locate the uploaded patch file.
5. Check the Patch name, Description, and Impacted data source types.
6. If the selected patch is correct, click Apply Patch.
All data sources of the same type are updated with this patch.
138 | Configuration and Administration Guide

Managing patches
You can review the current status of all of the data source patches being applied to your network. Ifyou want to perform an action on a patch, you can click the linked name in the Patches currentlyunder review table.
Before you begin
You must have already uploaded and be installing at least one patch.
Steps
1. On the Insight toolbar, click the Admin icon.
2. Click Patches.
If no patches are being installed, the table of Patches currently under review is empty.
3. In Patches currently under review, check the status, as shown in this example, of the datasource patches currently being applied.
4. To examine the details associated with a specific patch, click the linked name of the patch.
5. For the selected patch, you might click any of these options to perform the next action on thepatch:
• Approve patch commits the patch to the data sources.
• Rollback removes the patch.
• Replace patch enables you to select a different patch for those data sources.
Insight data source management | 139

Committing a data source patch
You use the information in the Patches summary to decide if the patch is performing as expected andthen commit the patch to your network.
Before you begin
You have installed a patch and need to decide if the patch is successful and should be approved.
Steps
1. On the Insight toolbar, click the Admin icon.
2. Click Patches.
If no patches are being installed, the Patches currently under review is empty.
3. In Patches currently under review, check the status of the data source patches currently beingapplied.
4. To examine the details associated with a specific patch, click the linked name of the patch.
5. In the Patches summary information, shown in this example, check the Recommendation andComments to assess the progress on the patch.
6. Check the Data sources affected table to see the status of each affected data source before andafter the patch.
If you are concerned that there is a problem with one of the data sources being patched, click thelinked Name in the Data sources affected table.
140 | Configuration and Administration Guide

7. If you conclude that the patch should be applied to that type of data source, click Approve.
The data sources are changed and the patch is removed from Patches currently under review.
Rolling back a data source patch
If a data source patch is not working in the manner you expected, you can roll it back. Rolling back apatch deletes it, and restores the previous version as it was before this patch was applied.
Steps
1. On the Insight toolbar, click the Admin icon.
2. Click Patches.
3. In Patches currently under review, click the linked name of the patch that appears to beunsuccessful.
4. On the Patches page for the data source, examine this information:
• Summary describes when the patch was applied, the affected data sources, and commentsabout the patch from you or other members of your team.
• Affected data sources lists all of the data sources being patched and includes a comparison ofthe before and after patching status.
5. To display the details for a data source that is not successfully processing the patch, click thelinked Name.
a. Check the summary information.
b. Check the Event timeline to see any configuration or performance data that might beaffecting this data source.
6. If you conclude that the patch is not going to be successful, click the browser back arrow to returnto the Patches summary page.
7. Click Roll back to remove that patch.
If you know of a different patch that is more likely to be successful, click Replace patch andupload the new patch.
Insight data source management | 141

Maintaining Insight
Whether you are new to Insight and have a new system to set up, or your system has been operatingfor some time, you must take steps to maintain smooth operation of Insight and your network. Thekey maintenance concept is that changes in your network usually need to be accommodated inInsight.
These are the most common maintenance tasks:
• Maintaining Insight backups
• Updating expired Insight licenses
• Coordinating data source patches
• Updating the Insight version on all acquisition units
• Deleting removed data sources from Insight
Related concepts
Data source patches on page 138
Managing InsightInsight monitors your environment, enabling you to research potential problems before a crisis isreported. The Assets Dashboard provides summary pie charts, heat maps for IOPs, and an interactivechart of the top 10 utilized storage pools. In the Admin area, potential problems are marked with asolid red circle in the web UI. The number on the Admin icon is the total of all the potentialproblems found in the Admin area.
Steps
1. Open the Insight Assets Dashboard and move your mouse pointer over the pie charts to examinethe asset distribution in these three charts:
• Capacity by Vendor
• Capacity by Tier
• Switch Ports
2. In the lower right corner of the Assets Dashboard, click any large print resource name in the IOPheat maps to display the asset page summarizing the current state of that resource.
3. Click a tall bar in the Top 10 utilized pools chart to examine that resource.
142 | Configuration and Administration Guide

4. On the toolbar, click Admin .
5. Find administration buttons with similar circled numbers and examine the details displayed inthose areas.
If the Admin icon has a circled number, as shown in Step 4, the number indicates the number ofpossible problems detected.
6. Click Data Sources to examine a list of all monitored data sources.
Examine any data source with a Last Status column containing a message with a solid red circleand with an Impact listed as High or Medium. These are at the top of the table. The problemswith those data sources affect a significant portion of your network and need to be addressed.
7. Click Acquisition Units to note the status for each IP address running Insight and to restart anacquisition unit, if necessary
8. Click Health to see high-level instance monitoring of the Insight servers.
Monitoring Insight system healthTo check the current status of your Insight system, open the Health summary page in the Adminselections. The summary lists the current status of all of your Insight servers and the acquisitionunits.
Maintaining Insight | 143

Monitoring the violations in your networkWhen Insight generates violations due to the thresholds set in performance policies, you can viewthem using the Violations Dashboard. The dashboard lists all the violations that occur in yournetwork and enables you to locate and address issues.
Steps
1. Open Insight in your browser.
2. On the Insight toolbar, click Dashboards and select Violations Dashboard.
The Violations Dashboard displays.
3. You can use the Violations By Policies pie chart in the following ways:
• You can position your cursor over any slice of a chart to display the percentage of the totalviolations that occurred for a particular policy or metric.
• You can click a slice of a chart to “explode” it, which enables you to emphasize and studymore carefully that slice by moving it away from the rest of the chart.
• You can click the icon in the upper-right corner to display the pie chart in full screen
mode, and click again to minimize the pie chart.
A pie chart can contain a maximum of five slices; thus, if you have six policies that generateviolations, Insight combines the fifth and sixth slices into an “Others” slice. Insight assigns themost violations to the first slice, the second most violations to the second slice, and so on.
4. You can use the Violations History chart in the following ways:
• You can position your cursor over the chart to display the total number of violations thatoccurred at a particular time and the number that occurred out of the total for each specifiedmetric.
• You can click a legend label to remove the data associated with the legend from the chart.
Click on the legend to display the data again.
• You can click the icon in the upper-right corner to display the chart in full screen mode,
and click again to minimize the pie chart.
5. You can use theViolations Table in the following ways:
• You can click the icon in the upper-right corner to display the table in full screen mode,
and click again to minimize the pie chart.
144 | Configuration and Administration Guide

If your window size is too small, then the Violations Table displays only three columns;
however, when you click , additional columns (up to seven) display.
• You can display violations for a particular time period (1h, 3h, 24h, 3d, and 7d), with Insightshowing a maximum number of 1000 violations for the selected time period.
• You can use thefilter box to show only the violations you want.
• You can change the sort order of the columns in a table to either ascending (up arrow) ordescending (down arrow) by clicking the arrow in the column header; to return to the defaultsort order, click any other column header.
By default, the table displays the violations in descending order.
• You can click a violation in the ID column to display the asset page for the duration of theviolation.
• You can click the resource links (for example, storage pool and storage volume) in theDescription column to display the asset pages associated with those resources.
• You can click the performance policy link in the Policy column to display the Edit Policydialog box.
You might want to adjust the thresholds for a policy if you feel it generates too few or toomany violations.
• You can click a page number to browse through data by page if there is more data than fits ona single page.
• You can click to dismiss the violation.
Related tasks
Editing performance policies on page 55
Related references
What the Violations Dashboard enables you to do on page 21
Fibre Channel environment monitoringUsing Insight's Fibre Channel asset pages, you can monitor the performance and inventory of thefabrics in your environment and be aware of any changes that might cause issues.
Fibre Channel asset pages
Insight's asset pages present summary information about the resource, its topology (the device and itsconnections), performance charts, and tables of associated resources. You can use the fabric, switch,and port asset pages to monitor your fibre channel environment. Particularly helpful when
Maintaining Insight | 145

troubleshooting a fibre channel issue is the performance chart for each port asset, which shows thetraffic for the selected top contributor port. Additionally, you can also show buffer-to-buffer creditmetrics and port errors in this chart, with Insight displaying a separate performance chart for eachmetric.
Performance policies for port metrics
Insight enables you to create performance policies to monitor your network for various thresholdsand to raise alerts when those thresholds are crossed. You can create performance polices for portsbased on available port metrics. When a violation of a threshold occurs, Insight detects and reports itin the associated asset page by displaying a red solid circle; by email alert, if configured; and in theViolations Dashboard or any custom dashboard that reports violations.
Related tasks
Creating performance policies on page 51
Related references
What the Assets Dashboard enables you to do on page 17
Asset pages on page 18
Port metrics on page 146
Port metrics
Asset page performance charts display port metrics when the asset is associated with a port or when aport is added as a resource. Port metrics are useful when monitoring and troubleshooting your FibreChannel environment, providing BB credit metrics and the type of port error (for example, linkfailures and Class 3 discards).
The following table lists the port metrics available in Insight and the Brocade and Cisco countersfrom which they are derived:
Insight Port Metrics Brocade SNMP Counter Cisco SNMP Counter
BB credit 0 -Tx
Tx BB credittransitions tozero
connUnitPortStatCountBBCreditZero
The count oftransitions in toand out of BBcredit zero state.The other sideis not providingany credit.
fcHCIfBBCreditTransistionFromZero
Increments ifthe transmitbuffertobuffercredit is zero.
146 | Configuration and Administration Guide

Insight Port Metrics Brocade SNMP Counter Cisco SNMP Counter
BB credit 0 - Rx
Rx BB credittransitions tozero
connUnitPortStatCountInputBuffersFull
The count ofoccurrenceswhen all inputbuffers of a portwere full andoutbound BBcredittransitioned tozero. There isno credit toprovide to otherside.
fcHCIfBBCreditTransistionToZero
Increments ifthe receivebuffertobuffercredit is zero.
BB credit zero duration- Tx
Time inmillisecondsduring whichTx BB creditwas zero duringthe sampleinterval
connUnitPortStatCountBBCreditZero
An increment ofthis countermeans that theframes couldnot be sent tothe attacheddevice for 2.5µs because ofzero Tx BBcredit.
fcIfTxWtAvgBBCreditTransitionToZero
Increments ifthe creditavailable is zerofor 100 ms.
Timeout discard frames- Tx
Discarded Txframes causedby timeout
swConnUnitC3DiscardDueToTXTimeout
Number ofClass 3 transmitframesdiscarded due totimeout
fcIfTimeOutDiscards
Framesdiscardedbecause atimeoutoccurred withinthe switch
CRC errors
CRC errorcount
fcIfInvalidCrcs
The number ofinvalid CRCsdetected by theFC-Port
connUnitPortStatCountInvalidCRC
The number offrames receivedwith invalidCRC
Maintaining Insight | 147

Insight Port Metrics Brocade SNMP Counter Cisco SNMP Counter
Link resets - Tx
Tx Link Resetcount
connUnitPortStatCountTxLinkResets
Count of linkresets. This isthe number LRstransmitted.
fcIfLinkResetOuts
The number oflink resetprotocol errorsissued by theFCPort to theattached FCPort
Link resets - Rx
Rx Link Resetcount
connUnitPortStatCountRxLinkResets
Count of linkresets. This isthe number ofLRs received.
fcIfLinkResetIns
The number oflink resetprotocol errorsreceived fromthe attached FC-port
Link failures
Link failurecount
connUnitPortStatCountLinkFailures
Count of linkfailures. Thiscount is part ofthe LESB.
fcIfLinkFailures
The number oflink failuresdetected by theFCPort
Traffic - Tx
Tx data rate inMB/s
connUnitPortStatCountTxElements
The number ofbytes that havebeentransmitted bythis port
fcIfC3OutOctets ,fcIfCfOutOctets
The number ofClass 3 frameoctets, includingthe framedelimiters,transmitted bythis port
Traffic - Rx
Rx data rate inMB/s
connUnitPortStatCountRxElements
The number ofoctets or bytesthat have beenreceived by thisport
fcIfC3InOctets ,fcIfCfInOctets
The number ofClass 3 frameoctets, includingthe framedelimiters,received by thisport
148 | Configuration and Administration Guide

Insight Port Metrics Brocade SNMP Counter Cisco SNMP Counter
Frame rate - Tx
Tx frame rate infps
connUnitPortStatCountTxObjects
The number offrames, packets,I/O instances,and so ontransmitted bythis port
fcIfC3OutFrames,fcIfCfOutFrames
The number offrames, packets,I/O instances,and so ontransmitted bythis port
Frame rate - Rx
Rx frame rate infps
connUnitPortStatCountRxObjects
The number offrames, packets,I/O instances,and so onreceived by thisport
fcIfC3InFrames,fcIfCfInFrames
The number offrames, packets,I/O instances,and so onreceived by thisport
Frame size average - Tx
Avg Tx framesize in B
traffic.txRate * 2²º /traffic.txFrameRate
The ratio oftransmittedtraffic totransmittedframe rate
traffic.txRate * 2²º /traffic.txFrameRate
The ratio oftransmittedtraffic totransmittedframe rate
Frame size average - Rx
Avg Rx framesize in B
traffic.rxRate * 2²º /traffic.rxFrameRate
The ratio ofreceived trafficto receivedframe rate
traffic.rxRate * 2²º /traffic.rxFrameRate
The ratio ofreceived trafficto receivedframe rate
Related tasks
Creating performance policies on page 51
Acquisition unit statusThe status of the Insight acquisition units connected to your server is displayed in the Admin >Acquisition Units table. If a unit in the list has a solid red circle in the description, that unit has a
Maintaining Insight | 149

serious problem that you must investigate. You can select an entry in this table and restart thatacquisition unit.
The Acquisition Units table displays this information for each unit:
• Name
• IP
• Status is the operating status of the acquisition unit.
• Last reported displays last time a data source connected to the acquisition unit reported.
If you position your pointer over one of the units in the table, you can click the square icon to restartthat unit.
Restoring the Insight databaseTo restore your Insight database from a verified backup file, use the Troubleshooting options. Thisoperation completely replaces your current OnCommand Insight data.
Before you begin
Best practice: Before restoring your OnCommand Insight database, use the manual backup processto create a copy of the current database. Check the backup file you plan to restore be certain that itwas a successful backup containing the files you want to restore.
Steps
1. On the Insight toolbar, click the Admin icon.
2. Click Troubleshooting.
150 | Configuration and Administration Guide

3. In the Restore a database section, select the backup file you want to restore from the SelectBackup menu.
4. Click Restore.
Deleting a data source from OCIIf you have removed a data source from your environment, you must also delete it from theOnCommand Insight (OCI) monitoring environment.
Steps
1. On the Insight toolbar, click the Admin icon.
The Data sources list opens.
2. Select the data source that you want to delete.
3. Click the linked data source name.
4. Check the information for the selected data source on the summary page to be certain it is the oneyou want to delete.
5. Click Delete.
6. Click OK to confirm the operation.
Maintaining Insight | 151

Updating expired licensesIf one or more of your Insight licenses expired, you can update the licenses quickly using the sameprocedure as you did to install the licenses originally.
Steps
1. In a text editor, such as Notepad, open the new license file you received from NetApp Supportand copy the license key text to your Windows Clipboard.
2. Open OnCommand Insight in your browser.
3. Click the Admin icon on the toolbar.
4. Click Setup.
5. Click the Licenses tab.
6. Click Update License.
7. Copy the license key text into the License text box.
8. Select the Update (most common) operation.
This operation adds your new licenses to any currently active Insight licenses.
9. Click Save.
Licenses no longer compliant
If you notice the "Not Compliant" message on your Insight Licenses page, Insight is managing moreterabytes than your company licensed.
The "Not Compliant" message means your company paid for fewer terabytes than Insight is currentlymanaging. The difference between the managed terabytes and the licensed number of terabytes isshown beside the non-compliance message.
The operation of your Insight system is not affected, but you should contact your NetApprepresentative to increase your license coverage and update the appropriate license.
Replacing licenses for older Insight versions
If you have purchased a new Insight version that is not backward compatible with your older versionof the product, you must replace the older licenses with the new licenses.
When you are installing the new licenses, you must select the Replace operation before you save thelicense key text.
152 | Configuration and Administration Guide

Preparing a special troubleshooting reportInsight sends information to NetApp Customer Support automatically through the ASUP system youset up after installing the software. However, you might want to create a troubleshooting report andopen a case with the Support team for a specific problem.
You can use tools in Insight to perform a manual Insight backup, bundle the logs, and send thatinformation to NetApp Customer Support.
Manually backing up the OCI database
If you have enabled the weekly backups for the OnCommand Insight (OCI) database, you areautomatically generating backups you can use to restore the database. If you need to create a backupbefore a restore or to send to NetApp Support, you can create a backup zip file manually.
Steps
1. On the Insight toolbar, click the Admin icon.
2. Click Troubleshooting.
3. In the Send / Collect data section, click Backup.
4. Click Save File.
5. Click OK.
Bundling logs for Support
When troubleshooting a problem with Insight software, you can quickly generate a zip file (using the"gz" format) of the logs and acquisition recordings to send to NetApp Customer Support.
Steps
1. On the Insight toolbar, click Admin.
2. Click Troubleshooting.
3. In the Send / Collect data section, click Bundle logs.
4. Click Save File.
5. Click OK.
Maintaining Insight | 153

Sending information to NetApp Support
The NetApp automated support (ASUP) facility sends troubleshooting information directly to theNetApp Customer Support team. You can force a special report to be sent.
Steps
1. On the Insight toolbar, click Admin.
2. Click Setup.
3. Click the Backup/ASUP tab.
4. In the Send/Collect data area, click Send ASUP now to submit your logs, recordings, and backupto NetApp Support.
Advanced Insight configuration toolsIn order to complete your Insight configuration, you need to use the advanced configuration tools.These tools run in the browser and are opened from the Admin > Troubleshooting page.
To open the advanced configuration tools in the browser, click the OnCommand Insight Portal linkat the bottom of this page.
154 | Configuration and Administration Guide

On the next page in the Advanced menu, click the Troubleshooting option to display these tools:
• Restart OnCommand Insight Server
• Acquisition
• Logs
• System Information
• Installed Software Packages
• Calculate Scale
• Migrate MySQL Data
• Force Update of Annotations for DWH
• Force Update of Annotations for DWH (include deleted objects)
• Configure Client Settings
• Check Tier Upgrade
• Server Resources Status
• Scrub Utilities
• Find Ghost Data Sources
Maintaining Insight | 155

In addition to these tools, available to all administrators, the chief administrator should enable theautomatic disk model updates.
Restarting the OnCommand Insight Server
When you restart the OnCommand Insight Server, refresh the page and log into the OnCommandInsight Portal again.
About this task
Note: Both of these options should only be used upon request by NetApp Customer Support.There is no confirmation prior to restart.
Steps
1. In the web UI, click the Admin icon and select Troubleshooting.
2. At the bottom of the page in the Other tasks area, click the OnCommand Insight Portal link.
3. On the next page in the Advanced menu, click the Troubleshooting link.
4. Click the Restart OnCommand Insight Server.
Configuring the number of hours to ignore dynamic data
You can configure the number of hours during which OnCommand Insight ignores updating dynamicdata, such as used capacity. If the default of six hours is used and no configuration changes occur,reports will not be updated with dynamic data until after the default number of hours. This optionimproves performance because this option defers updates when only the dynamic data changes.
About this task
If a value is set for this option, OnCommand Insight will update dynamic data based on the followingrules:
• If no configuration changes occur but capacity data changes, data will not be updated.
• Dynamic data (other than configuration changes) will be updated only after the timeout specifiedin this option.
• If configuration changes occur, configuration and dynamic data is updated.
Dynamic data impacted by this option includes the following:
• Capacity violation data
• File Systems Allocated Capacity and Used Capacity
• Hypervisor
156 | Configuration and Administration Guide

◦ Virtual Disk Used Capacity
◦ Virtual Machine Used Capacity
• Internal Volume
◦ Data Allocated Capacity
◦ Data Used Capacity
◦ Deduplication Savings
◦ Last Known Access Time
◦ Last Snapshot Time
◦ Other Used Capacity
◦ Snapshot Count
◦ Snapshot Used Capacity
◦ Total Used Capacity
• iSCSI Session Initiator IPs, Target Session ID, and Initiator Session ID
• Qtree Quota Used Capacity
• Quota Used Files and Used Capacity
• Storage Efficiency Technology, Gain/Loss, and Potential Gain/Loss
• Storage Pool
◦ Data Used Capacity
◦ Deduplication Savings
◦ Other Used Capacity
◦ Snapshot Used Capacity
◦ Total Used Capacity
• Volume
◦ Deduplication Savings
◦ Last Known Access Time
◦ Used Capacity
Maintaining Insight | 157

Steps
1. In the web UI, click the Admin icon and select Troubleshooting.
2. At the bottom of the page in the Other tasks area, click the OnCommand Insight Portal link.
3. On the next page in the Advanced menu, click the Troubleshooting link.
4. Select the Ignore dynamic attribute changes for x hours option and enter the number of hoursthat OnCommand Insight should ignore dynamic data.
5. Click Save Settings.
6. (Optional) To restart the acquisition unit, click the Restart Acquisition Unit link.
Restating the local acquisition unit reloads all of the OnCommand Insight data source views. Thischange is applied during the next poll, so you do not have to restart the Acquisition Unit.
Generating logs for Customer Support
If requested by Customer Support, generate a server, acquisition, or remote log for troubleshootingpurposes.
About this task
If NetApp Customer Support requests, use this option to generate the logs.
Steps
1. In the web UI, click the Admin icon and select Troubleshooting.
2. At the bottom of the page in the Other tasks area, click OnCommand Insight Portal.
3. On the next page in the Advanced menu, click the Troubleshooting link.
4. Click Logs and select:
• Server - Server log files in {Home}\SANscreen\jboss\server\onaro\log
• Acq - Acquisition log files in {Home} \SANscreen\acq\log
• Remote - Remote logs from Remote Acquisition, OnCommand Insight Client, and DataWarehouse
158 | Configuration and Administration Guide

Displaying system information
You can display the Microsoft Windows IP configuration information about the system on whichOnCommand Insight server is deployed.
Steps
1. In the web UI, click the Admin icon and select Troubleshooting.
2. At the bottom of the page in the Other tasks area, click the OnCommand Insight Portal link.
3. On the next page in the Advanced menu, click the Troubleshooting link.
4. Select System Information.
The Windows IP configuration includes information such as the host name, DNS, IP address,subnet mask, OS information, memory, boot device, and connection name.
Listing installed OnCommand Insight components
You can display a list of the installed OnCommand Insight components including, among others,inventory, capacity, dimensions, and the Data Warehouse views. Customer Support might ask you forthis information, or you might want to see what software versions were installed and when they wereinstalled.
Steps
1. In the web UI, click the Admin icon and select Troubleshooting.
2. At the bottom of the page in the Other tasks area, click the OnCommand Insight Portal link.
3. On the next page in the Advanced menu, click the Troubleshooting link.
4. Click Installed Software Packages.
OnCommand Insight lists the package names with the software version numbers and installationdate and time of each.
Calculating the number of database objects
To determine the number of objects in the OnCommand Insight database, use the Calculate Scalefeature.
Steps
1. In the web UI, click Admin and select Troubleshooting.
2. At the bottom of the page in the Other tasks area, click the OnCommand Insight Portal link.
Maintaining Insight | 159

3. On the next page in the Advanced menu, click the Troubleshooting link.
4. Click Calculate Scale.
The system displays the number of discovered objects in the database.
Moving MySQL data using the migrate option
You can use migrate MySQL data directory to a different directory. You can retain the current datadirectory. You can use the migrate option on the Troubleshooting menu or you can use the commandline. This procedure describes how to use the Troubleshooting > Migrate MySQL data option.
About this task
If you retain the current data directory, it will be kept as a backup and renamed.
Steps
1. In the web UI, click Admin and select Troubleshooting.
2. At the bottom of the page in the Other tasks area, click the OnCommand Insight Portal link.
3. On the next page in the Advanced menu, click the Troubleshooting link.
4. Select Migrate MySQL Data.
5. Enter the path to which you want to migrate the data.
6. To retain the existing data directory, check Keep existing data directory.
7. Click Migrate the data to selected directory.
Moving MySQL data using the command line
You can use migrate MySQL data directory to a different directory. You can retain the current datadirectory. You can use the migrate option on the Troubleshooting menu or alternatively, you can usethe command line. This procedure describes how to use the command line.
About this task
If you retain the current data directory, it will be kept as a backup and renamed.
You can use the Migrate MySQL Data utility or you can use a java -jarmysqldatamigrator.jar option in the OnCommand Insight path of \bin\mysqldatamigratorwhere the following parameters should be used:
• Mandatory parameters-path
The new data path to which the data folder will be copied.
160 | Configuration and Administration Guide

• Optional parameters-myCnf <my .cnf file>
The path for the .cnf file. The default is <install path>\mysql\my.cnf. Usethis flag only if a non-default MySQL is used.
-doBackup
If this flag is set, the current data folder will be renamed but not deleted.
Step
1. Access the command line tool here: <installation path> \bin\mysqldatamigrator\mysqldatamigrator.jar
Example usage
java -jar mysqldatamigrator.jar -path "C:\<new path>" -doBackup
Forcing annotation updates
If you have changed the annotations and want to use them in reports immediately, use one of theforce annotation options.
Steps
1. In the web UI, click Admin and select Troubleshooting.
2. At the bottom of the page in the Other tasks area, click the OnCommand Insight Portal link.
3. On the next page in the Advanced menu, click the Troubleshooting link.
4. Select one of these options:
• Force Update of Annotations for DWH to force the update of annotations in data warehouseto be used for reports.
• Force Update of Annotations for DWH (including deleted objects) to force an annotationsupdate (including deleted objects) in the data warehouse to be used for reports.
Configuring Client settings
You can configure options for the OnCommand Insight Java UI Client on the server.
Steps
1. In the web UI, click the Admin icon and select Troubleshooting.
Maintaining Insight | 161

2. At the bottom of the page in the Other tasks area, click the OnCommand Insight Portal link.
3. In the Advanced menu on the next page, click the Troubleshooting link.
4. Click Configure Client Settings.
5. Enter the following information:
• Initial Heap Size is the size of the heap that is created when the VM (Virtual Machine) isstarted to run the client. This number is used to construct the -Xms<size> parameter tojava. Decreasing this number means Java takes up less memory when it starts up. (However,it is then more likely that Java will need to reallocate the heap when it exceeds this number,which is an expensive operation, so you do not want to make this number too small.)
• Max Heap Size is the largest that Java will allow the heap to grow in the VM that is runningthe client. This number is used to construct the -Xmx<size> parameter to java.
• Log Level controls the amount of detail that is generated in the client logs. There are twopossible values:
◦ INFO - generates a "normal" amount of information.
◦ DEBUG - generates more detailed information to the client log to help with debugging.
6. Click Save Settings.
7. Restart the client.
Note: If the client generates a "java.lang.OutOfMemoryError: Java heap space" error, you canincrease the max heap size setting to see whether that fixes the problem.
Checking a tier upgrade
After upgrading from OnCommand Insight version 6.0 to a newer version, select the Check TierUpgrade option to list any volume which presently had a different tier value than the tier value it hasin the new version. The newer Insight versions improve the way tiers are calculated by using diskattributes instead of volume attributes. This change increases accuracy and reduces confusion whenthe volume is part of a storage pool with mixed disks.
About this task
Tier rule configuration no longer presents a disk attribute that is a combination of all the diskattributes of a storage pool, and tiers are calculated for a volume using the lowest performing diskattribute. This change might produce different values if your rules were setup to use the old volumedata.
Steps
1. In the web UI, click the Admin icon and select Troubleshooting.
162 | Configuration and Administration Guide

2. At the bottom of the page in the Other tasks area, click the OnCommand Insight Portal link.
3. On the next page in the Advanced menu, click the Troubleshooting link.
4. Click Check Tier Upgrade.
5. Locate the differences and decide if you need to adjust the tier rule.
Checking the status of server resources
This option displays the OnCommand Insight Server's information including server memory, diskspace, OS, and CPU and OnCommand Insight database information including innoDB data size andthe disk free space where the database resides.
Steps
1. In the web UI, click the Admin icon and select Troubleshooting.
2. At the bottom of the page in the Other tasks area, click the OnCommand Insight Portal link.
3. On the next page in the Advanced menu, click the Troubleshooting link.
4. Click Server Resources Status.
For advanced OnCommand Insight users: The administrator can run some SQL tests to checkthe database and server's response time from the button at the end of the information summary.This option displays a warning if server resource is low.
Scrubbing data for transfer to support
Customers who have secure environments need to communicate with NetApp Customer Service totroubleshoot problems that arise without compromising their database information. The OnCommandInsight Scrub utilities allow you set up a comprehensive dictionary of keywords and patterns so thatyou can "cleanse" sensitive data and send scrubbed files to Customer Support.
Steps
1. In the web UI, click Admin and select Troubleshooting.
2. At the bottom of the page in the Other tasks area, click the OnCommand Insight Portal link.
3. On the next page in the Advanced menu, click the Troubleshooting link.
4. Click Scrub Utilities.
There are three scrub utilities: Dictionary Admin, Scrub, and Lookup Dictionary.
5. Select the Dictionary Admin option.
6. Expand Custom keywords. Click Add to get the dialog box for entering new keywords (note thatmultiple entries must be line-separated
Maintaining Insight | 163

7. Enter a keyword and click OK. The keyword is added to the dictionary.
8. Expand Patterns (regexp). Click Add to get the dialog box for entering a new pattern.
9. Enter a Name and a Pattern in the fields and click OK. The information has been added to thedictionary.
Note: Patterns must be encompassed by round parentheses to identify a regular expressioncapturing group.
10. In the Database block, click Build to initiate compilation of the dictionary to the dictionary allwords identified as sensitive from the OnCommand Insight database.
On completion, you see a prompt informing you the revised dictionary is available. The Databasedescription includes a line indicating how many keywords are in the dictionary. Check yourkeywords in the dictionary for accuracy. If you find problems and want to rebuild the dictionary,click Reset on the Database block to remove all keywords collected from the OnCommandInsight database from the dictionary. As the prompt advises, all other keywords will not bedeleted. Return to the Scrub utilities and enter your Custom Keywords again.
11. Select Scrub > Scrub log / XML files again.
12. Browse to locate the log file and click Scrub.
You can run and scrub signed MySQL queries.
Note: The Scrub Utility will not accept an unsigned query. Queries can be signed only byNetApp personnel.
While restrictions exist, the customer can scrub the query multiple times and send it in again toNetApp Customer Service if fine-tuning of the query is necessary.
Scrub dictionary administration
The scrub utility allows you to change and enhance the dictionary manually with words and patternsthat were not picked up automatically by the system. The dictionary itself is never sent to NetAppand is entirely under your control. NetApp Customer Support can address the problems withoutneeding to view sensitive data, so the keywords and patterns they receive do not interfere with theirdiagnostics.
To facilitate this interaction and to enable efficient troubleshooting:
• Every troubleshooting session must use the same dictionary. Failure to do so skews the data andprevents successful troubleshooting.
• A lookup dictionary displays the confirmed entries for keywords and patterns. The scrubbingprocess allows both you and the engineer to adjust and edit the scrubbed files until all possiblepatterns and keywords have been identified and entered into the dictionary. This ensures futureexchanges will be expedited because the Lookup tables will be accurate, thorough and consistent.
164 | Configuration and Administration Guide

• The dictionary remains valid and consistent unless and until you decide to clean (reset) thedictionary itself and build it again from scratch.
Lookup dictionary output
The Lookup dictionary is the output of the scrub utility that allows you to map back from thescrubbed fields to the real fields (for example, the name of a switch) in the original file.
The lookup utility displays the real values of what was scrubbed in the dictionary file.
Note: This is to be used only by the customer. This information is not available anywhere outsidethe customer's environment.
Information can be displayed by:
• Code assigned to a keyword.
• Keywords associated with a specific code
Therefore, you can perform a search using the {num} or by the entry that {num} replaced.
Troubleshooting with a scrubbed file
A customer in a secure environment has an unexpected slowdown occur in one of the OnCommandInsight applications. It is not a local problem. The customer contacts NetApp Customer Support.Both Customer Support and an engineer can use the Scrub Utilities to achieve a successful outcome.The process sequence for addressing the problem would resemble the steps shown below.
At the customer site
1. Customer Support requests a log file from the customer. ( Types of data that may apply if youneed to send NetApp include XML files, log files (for all components) and results oftroubleshooting queries on the OnCommand Insight and the data warehouse database.
2. The customer has built a dictionary in the Scrub Utilities already (by clicking Build in the"Dictionary Admin" page). Typically the dictionary contains IP addresses, WWNs, VMs.)
3. The customer scrubs the file and checks its outcome. If there are keywords or patterns omitted,the customer edits the dictionary (using the "Dictionary Admin" and scrubs the log file again untilit is correct. (These changes are made manually.)
At NetApp
1. NetApp Customer Support forwards the customer's scrubbed log file to an engineer.
2. The NetApp Customer Support representatives only see the results of the scrub. The engineer canidentify and troubleshoot the problem without needing to know what the scrubbed materialrepresents. Only the customer has access to the Lookup dictionary. Only the customer has thedatabase!
Maintaining Insight | 165

3. If the engineer needs information about the scrubbed data, it can be discussed even by phone in asecure manner.
For example, if the engineer needs to know whether a device is a virtualizer, he can ask the customerthis question and cite the code he sees in the log file for the address or name of the device. It could be"{123…}." When he gives the code to the customer, the customer can check using the "Lookupdictionary" by entering the code and receiving the real identity of the device. The customer is able totell the support engineer that the device is or is not a virtualizer without ever needing to identify it toNetApp.
Searching in the lookup dictionary
If someone at the customer site wants to know the real identity of something references in thescrubbed file, the lookup dictionary contains this information.
Steps
1. Log in as an administrator.
2. In the Main Menu, click the Troubleshooting link.
3. Click Scrub Utilities.
4. Select the Lookup dictionary option.
5. Enter a code or keyword in the field.
6. Click Lookup.
If you enter an incorrect format for the code, an error message displays. It could prompt you tocheck the server logs or correct the format of the scrubbed value.
Finding ghost data sources
If you have removed a device but the device data remains, you can locate any ghost data sources sothat you can remove them.
Steps
1. In the web UI, click Admin and select Troubleshooting.
2. At the bottom of the page in the Other tasks area, click the OnCommand Insight Portal link.
3. On the next page in the Advanced menu, click the Troubleshooting link.
4. Click the Find Ghost Datasources link.
OnCommand Insight produces a list of originators with their device information.
166 | Configuration and Administration Guide

Enabling automatic disk model updates
By default, OnCommand Insight reads and automatically updates the internal disk model, typicallyon a daily basis. The automatic disk model update increases the number of data acquisition successesand prevents unknown disk models in the Insight data.
Before you begin
Ensure you have access to Insight as a superuser.
About this task
The Insight server retrieves disk model information from multiple vendors from the ASUP serverdata and the local custom disk models, builds one disk model, and makes it available to all InsightAcquisition Units (AUs).
Although you no longer need to restart the server in order for data model changes to take place, youcan optionally restart the server to have the local disk model changes take effect before the nextscheduled update.
Steps
1. To access the chief administrator's tools page in Insight, enter the following in your browser:
http://<server>/legacy/tools/all.do
2. From this Tools page, select Parameters.
3. From the Parameters page, in the Disk Model Lease Hours parameter, enter an update pollinginterval in hours:
• 1 or greater: "24" is selected by default. Enter how many hours should elapse beforeOnCommand Insight automatically updates the disk model.
• -1: Select this to prevent OnCommand Insight from automatically updating the disk model.The disk model installed with the product and any custom data model updates you created areused instead.
Note: Do not enter "0" because that causes excessive polling.
Adding a missing disk model
If acquisition fails due to a missing disk model, administrators can add the missing disk model to thenew_disk_models.txt file and run acquisition again.
Before you begin
Carefully research the information needed to describe this data source because inaccurateinformation in the new_disk_models.txt file produces incorrect system data.
Maintaining Insight | 167

About this task
Because OnCommand Insight usually reads the internal disk model daily, the new data modelinformation is updated automatically. Although you no longer need to restart the server in order forchanges to take place, you can optionally restart the server to have the changes take effect before thenext update.
Steps
1. To add the missing disk model information, open Windows Notepad or another text editor.
2. Open the new_disk_models.txt file. This file is located in your Insight installation athttp://<server>/legacy/tools/all.do.
3. Be sure to back up this file to prevent it from being overwritten during an upgrade.
4. Add the required information for the new data source.
5. Save the file in the deploy\datasources.war directory on your server.
Locating required information for new disk model
To locate the disk model information, identify the vendor and run an Internet search on the vendorand model number.
Steps
1. Vendor specifications do not always provide all of the necessary information based on the fullmodel number. It is often useful to search for different parts of the model number string on thevendor's site to locate all of the information.
2. You need the disk vendor name, full model number, disk size and speed, and the interface type inorder to define the new disk model in OnCommand Insight.
The following example shows the information used to define a Seagate disk:
ST3500320NS,Seagate,ST3500320NS,7200,500,SATA,,,1500,http://h20000.www2.hp.com/bizsupport/TechSupport/Document.jsp?lang=en&cc=us&objectID=c00305257&prodTypeId=15351&prodSeriesId=397642
Content of the new_disk_models.txt file
The new_disk_models.txt file has required and optional fields. The fields are comma separated, so donot use commas within the fields.
Using a text editor, add the following information in this order:
1. key: use the model number (required)
168 | Configuration and Administration Guide

2. vendor: name (required)
3. model number: full number (enter the same value as in "key")
4. rpm of the disk: for example 10000 or 15000 (required)
5. size: capacity in GB (required)
6. interface type: ATA, SATA, FC, SCSI, SAS, or FATA (required)
7. seek time: in ms (optional)
8. potential transfer rate: in MB/sec (optional)
9. interface transfer rate: the rate to and from the host in MB/sec (optional).
10. Additional useful information, such as a link to the vendor's specification page for the model(used only for Insight Perform) (optional).
Specialized administration toolkit
The Admin Tools menu provides specialized and infrequently-used options such as calculating RPOand customizing the Java UI Client Help menu.
The Admin Tools include these specialized options:
• Show OnCommand Insight logs
• Browse the SAN and list the devices in the SAN
• Calculate RPO
• Run the server
• Trigger a VM NAS job
• Customize the options in the Client Help menu
Opening the Admin Tools
To access the administrators' specialized maintenance toolkit, open the Admin Tools menu.
Steps
1. To use the Insight Admin Tools, open your browser and enter this URL customized for yourenvironment:
http://<server_host>:<server_port>/legacy/admin/all.do
2. Log in as an administrator. The Admin Tools menu opens.
Maintaining Insight | 169

Showing Insight logs
To research problems, you might analyze the contents of the OnCommand Insight logs. These logscontain errors and warnings and include information about the length of time that some actions took,which might also be helpful in troubleshooting.
Steps
1. To use the Insight Admin Tools, open your browser and enter this URL customized for yourenvironment:
http://<server_host>:<server_port>/legacy/admin/all.do
2. Select Show Logs.
Note: This feature has the same function as the Troubleshooting > Logs option.
3. Select the server, acquisition, or remote log that you want to analyze.
The last 100 lines from the selected log are displayed.
Browsing the SAN to locate devices
To locate a device or port in your environment based on its WWN, you can use the SANbrowseoption.
Steps
1. To use the Insight Admin Tools, open your browser and enter this URL customized for yourenvironment:
http://<server_host>:<server_port>/legacy/admin/all.do
2. In the Admin Tools menu, select SANbrowse.
3. In the Search box, enter the WWN of the device or port you want to locate. Click Search.
OnCommand Insight returns a report containing links to additional information, as shown in thisexample.
170 | Configuration and Administration Guide

4. Click any of the links to see additional information related to a selected item. In this example, thefirst link in the search results was selected to produce this report with more links.
Calculating the Recovery Point Objective (RPO)
For users with the OnCommand Insight Replication license, you can calculate the Recovery PointObjective (RPO) time that would be used as the system recovery starting point. This is helpful ifthere is an outage and the system and data need to be restored.
Steps
1. To use the Insight Admin Tools, open your browser and enter this URL customized for yourenvironment:
http://<server_host>:<server_port>/legacy/admin/all.do
2. In the Admin Tools menu, select Calculate RPO.
After the RPO is recalculated, a "successfully calculated" message displays above the AdminTools menu options.
Maintaining Insight | 171

Running a paths and violations query
If you are concerned about a recent change in the environment, you can use the Run server option toreport changes in the paths and any new violations.
Steps
1. To use the Insight Admin Tools, open your browser and enter this URL customized for yourenvironment:
http://<server_host>:<server_port>/legacy/admin/all.do
2. In the Admin Tools menu, select Run server.
The results of this query list the changes found.
Triggering VM NAS jobs
To correlate the NFS share export IP address with the VM ESX IP address, you can use the TriggerVM NAS Job option in the Admin Tools. The NFS export IP relates to the NetApp data source, andthe VM ESX IP relates to the Virtual Center data source.
Steps
1. To use the Insight Admin Tools, open your browser and enter this URL customized for yourenvironment:
http://<server_host>:<server_port>/legacy/admin/all.do
2. In the Admin Tools menu, select Trigger VM NAS Job.
A report listing the results displays.
172 | Configuration and Administration Guide

Upgrading Insight
Insight automatically checks for server updates when you log in. However, if you are upgrading froma version prior to 6.4, you need to perform some manual steps in the upgrade process. The DataWarehouse (DWH) needs to be upgraded separately.
Important: Do not store any automatic or manual backups in Insight installation directories becausethe entire installation folder is overwritten during the upgrade process. If you have stored backup filesin any of those directories, you must move your backups to a different location before you performany upgrade or uninstall process.
Related tasks
Upgrading a 32-bit system to the required 64-bit server on page 174
Upgrading the Data Warehouse (DWH) on page 175
Upgrading Insight Server softwareOnCommand Insight automatically checks for Insight Server updates when you log in, but you canalso check for software version updates manually.
Steps
1. On the Insight toolbar, click the Help icon.
2. Select Check for updates.
If your OnCommand Insight version is the most current, the "Version is up to date" messagedisplays. Click OK.
3. If a newer update is detected, click the download here link in the message box.
4. In the Download page, click download.
5. Complete the upgrade.
Upgrading versions prior to Insight 6.4
Automatic backups were included in the 6.4 OnCommand Insight release. Therefore, you must use amanual process to upgrade any version prior to 6.4 to the newest version.
Before you begin
Check the installation prerequisites for your new Insight version and make any upgrades yournetwork requires.
173

Steps
1. To upgrade a prior-to-6.4 version to the newest Insight version, back up your OnCommandInsight database.
2. Uninstall your version of Insight.
3. Install the new version of the software.
4. Restore your database backup.
Upgrading a 32-bit system to the required 64-bit server
Since the release of Insight 6.4, only 64-bit servers are supported. If you want to upgrade an Insightversion prior to 6.4 on a 32-bit server to the newest version, you must upgrade your server.
Steps
1. Back up your Insight database.
2. Upgrade your server operating system to 64-bit.
3. Install your new Insight version.
4. Restore your Insight database on the 64-bit server.
Upgrading Insight to a version later than 7.1
You can upgrade Insight to a version later than 7.1 (for example, 7.1.x).
About this task
You must perform this procedure on both the Insight server and Data Warehouse components.
Steps
1. Log in to the server where you want to install Insight.
2. Back up your current Insight installation on your server.
Refer to the OnCommand Insight Configuration and Administration Guide for information abouthow to back up the OCI database.
3. Download the installation file from the NetApp Support Site.
4. Double-click the .MSI file that you downloaded to start the installation wizard.
5. Accept the license agreement and follow the prompts.
174 | Configuration and Administration Guide

Upgrading the Data Warehouse (DWH)When you are upgrading your OnCommand Insight reports in the Data Warehouse (DWH), you needto perform several backup, install, and restore steps.
Steps
1. Backup your Data Warehouse (DWH).
2. For Insight versions prior to 6.4, backup your custom reports and reporting artifacts.
3. Uninstall your DWH.
4. Restart your DWH VM server.
5. Install the new DWH on the DWH VM server.
6. Restore your backup of the DWH and the custom reports, if required.
Backing up the Data Warehouse database
You can back up the Data Warehouse (DWH) database to a file and later restore it using the DataWarehouse portal. It allows you to migrate to a different Data Warehouse machine or upgrade to anew Data Warehouse version.
About this task
The Cognos backup includes the following information:
• LDAP configuration
• Data sources
• Import and export tasks that imported or exported reports
• Reporting security roles, groups, and namespaces
• User accounts
• Any modified Reporting Connection reports
Note: If you want to modify a predesigned report, you should save the predesigned report witha different name first and modify the copied version so that you do not lose your modifiedversion when you upgrade or restore the system.
• Custom reports, regardless of where they are stored, even in the My folders directory.
Upgrading Insight | 175

Note: You should save custom reports in one of the folders designed specifically for use withOnCommand Insight, such as Custom Reports or Custom Dashboards.
The following items are not backed up:
• Cognos system configuration parameters, such as SMTP server settings
• Cognos custom memory settings
In any backup initiated manually, Cognos creates a zip file that contains these files:
• A daily backup zip file, which contains Cognos report definitions (starting with the 6.3 version).
• A reports backup zip file, which contains all the reports in Cognos including those in the MyFolders directory (starting with the 6.4 version).
• A Data Warehouse database backup file.
In addition to a manual backup that you can perform at any time, Data Warehouse creates a dailybackup (automatically generated each day to a file called DailyBackup.zip) that includes the reportdefinitions. The daily backup includes the top folders and packages shipped with the product. TheMy Folders directory and any directories that you create outside the product's top folders are notincluded in the Cognos backup.
Steps
1. To access the Data Warehouse portal, open a browser and enter the URL for the OnCommandInsight Data Warehouse:
http://<host-name>/dwh
2. From the Advanced section of the Data Warehouse Main Menu, select Backup/Restore.
3. Select All Datamarts Including Performance Datamart.
4. Click Backup.
This operation can take awhile (possibly 30 minutes or more).
Data Warehouse creates a backup file and displays its name.
5. Right-click on the backup file and save it to a location you want.
Recommendation: You might not want to change the file name; however, you should store the fileoutside the Data Warehouse installation path.
Upgrading DWH and custom reports created prior to Insight 6.4
If you are upgrading your DWH version, any custom reports that you created might require specialattention during the upgrade process depending on the types of reports you created and the Insight
176 | Configuration and Administration Guide

version you were using at the time. If you created your reports in an Insight 6.4 version or newer,your reports are backed up with all of the Insight reports and require no special upgrade handling.
Before you begin
Determine if your custom reports were created prior to the 6.4 or 6.3 release.
Steps
1. Back up your report artifacts. See "Backing up custom reports and report artifacts."
2. Install the new DWH version.
3. Restore your report artifacts.
4. Upgrade pre-upgrade reports with embedded SQL. See "Upgrading customized reports withembedded SQL."
5. Stop and restart Insight reporting.
Related tasks
Backing up custom reports and report artifacts on page 177
Upgrading customized reports with embedded SQL on page 179
Backing up custom reports and report artifacts
If you are working in an Insight version prior to 6.4, you created custom reports, and you want toupgrade to the newest Insight version, you need to back up your reports and report artifacts before theupgrade installation and restore them after the upgrade installation. You should also pay attention tothe folders that you are using to store report artifacts.
About this task
Best Practice: If you made changes to the predesigned reports, create your own copies of thosereports in a separate folder. That way, when you update the predesigned artifacts, you will notoverwrite your changes.
Two folders exist under each package:
• CustomerDashboards – Use this to store your dashboards.
• CustomerReports – Use this to store your reports.
If you have reports in the My Folders area, you should copy them to the CustomerReports folders sothat they are not lost.
Upgrading Insight | 177

Restoring and upgrading reports for versions prior to 6.3
If you are upgrading an Insight version prior to 6.3, you must manually restore your reportingartifacts.
Before you begin
Follow the instructions in the "Upgrading the Data Warehouse (DWH)" and "Backing up customreports and reporting artifacts" topics.
Steps
1. To restore Reporting artifacts from releases prior to version 6.3, copy the Export Backup.zip fileyou created and stored in your <install>\cognos\c10_64\deployment directory.
2. Open a browser and go to http://<server>:<port>/reporting for the server and port you used duringinstallation.
3. Log in and click Home.
4. On the Home portal page, a Launch link appears in the toolbar in the header. Click Launch >Reporting Administration.
5. Click the Configuration tab.
Due to changes in the data model, the reports in the old packages may not run and need to beupgraded.
6. Click Content Administration.
7. Click the New Import button.
8. Make sure that archive you copied to the deployment directory (for example, backup6.0.zip) isselected, and click Next.
9. If you entered a password to protect the archive, enter the password and click OK.
10. Change the name Export... to Import Backup and click Next.
11. Click on the pencil icon next to each package name and enter a new target name if necessary. Forexample, add a _original suffix to the existing name. Then click OK.
12. After you rename the target package names for all packages, select all blue folders and click Nextto continue.
13. Accept all default values.
14. Click Finish. Click Run the import program.
15. Check the View for the details of this import after closing this check box. Click OK.
178 | Configuration and Administration Guide

16. To check the status of the import program, click the Refresh link in the top right of the page untilthe Status text indicates that the job is complete.
17. Click Close.
Result
Two sets of packages appear in the Public Folders tab. For example, one with a 7.0 suffix (for thenewer version) and one with a _original (or whatever you entered during the backup/restoreprocedure) suffix which contains your old reports. Due to changes in the data model, the reports inthe old packages may not run and need to be upgraded. Your portal tabs now point to the currentversion of the portal pages.
Upgrading customized reports with embedded SQL
If you are upgrading from a version of Insight prior to 6.4 and you have customized reports withembedded SQL, you need to perform the upgrade manually using this procedure.
About this task
You must follow these steps in order to make the necessary changes.
Steps
1. Open the customized report in Report Studio.
2. Move the pointer over the "Query Explorer" icon in the center of the editor.
3. Click Queries.
"Queries" opens. If any of the Query Subjects have SQL nodes, convert those reports to supportthe upgraded reporting software version.
4. To copy the existing SQL, follow these steps and refer to the illustration below:
a. Click the SQL node.
b. In the Properties pane, note the "Name" of the SQL node. "Report SQL" is the Name in thisexample.
c. Note the "Data Source" in the Properties. In the example, the Data Source is "dwh_Inventory."
d. Double-click the SQL node to open a dialog box showing the SQL and copy the entire SQLstatement to the clipboard. Click Cancel.
Upgrading Insight | 179

12
In this illustration:
• #1 = Take note of the Name.
• #2 = Take note of the Data Source value.
5. With the SQL node selected, press Delete to remove the node from the report.
6. To create a new SQL node for this report, drag and drop "SQL" from the Insertable Objects paneto the right of the Query Subject, in this example "Report Query." Be sure to release the mousebutton when the "I" beam is to the right of the Query Subject. Your new SQL node shouldresemble this example.
7. Click the new SQL node.
8. In the Properties pane, enter the name you noted in step 4b in the "Name" property.
9. Enter the data source value you noted in step 4c in the Data Source property.
10. Double-click on the SQL node and paste the SQL syntax you copied to the clipboard in step 4d.
Important: If the SQL syntax contains a trailing semi-colon, remove it.
180 | Configuration and Administration Guide

11. Click OK.
12. Double-click the Query Subject next to the SQL node. See the illustration in step 14.
13. Double-click each Data Item.
14. Edit the Data Item Expression to remove any table prefixes or leading periods in the expression.
1 2
3
In this illustration:
• #1 = Double-click each Data Item here and edit the expression as described in #3.
• #2 = If there are any filters here, double-click them and remove the table prefixes or leadingperiods.
• #3 = Remove any table prefixes or leading periods for any column references in theexpression. (There could be more than one.) In this example, the "Host Name" expression[Report SQL].[host.host_name] was changed to [Report SQL].[host_name].
Important: If the expression did not contain a table name but did have a leading period, removethe leading period. For example, if the expression was [Report SQL].[.host_name], changeit to [Report SQL].[host_name].
15. Double-click each filter.
16. Remove table prefixes or leading periods from the filters.
17. Repeat the above steps for each SQL node in the Queries view.
18. When you complete the changes for all of the SQL nodes, run each changed report to verify it. Ifthere is an error, you receive an exception message indicating a non-existent column or syntaxerror in your SQL.
19. When each report runs without errors, save it for use with your upgraded version of Insight.
Upgrading Insight | 181

Restoring Reporting portal tab names from older versions
If you are upgrading a version of Insight prior to 6.4, you must perform a manual procedure to restoreyour original Reporting portal tabs.
About this task
Versions prior to 6.4 used different portal tab names. If you do not want to use the new tab names,follow this procedure to replace the upgraded portal tab names with the names you were using in theolder version.
Steps
1. Open the Reporting portal.
2. Open My Preferences on the toolbar on the right.
3. Click Portal Tabs.
4. Click the check boxes next to the existing portal tabs that you want to replace.
5. Click the Remove link to remove the selected portal tabs.
6. Click the Add… link.
7. Click on the links on the left beginning with Public Folders until you arrive at the portal pagesyou want to add, for example, Public Folders > Inventory > Dashboards.
8. Select the dashboards that you want to add.
9. Click the green right arrow in the middle of the page to add those portal tabs to the right side.Click OK.
10. Repeat Steps 6–9 and navigate to the Dashboards folder of the other packages to add theirdashboards as well.
11. Click OK to add the portal tabs to your user interface.
Uninstalling Data Warehouse and Reporting
You can uninstall Data Warehouse and Reporting if needed or if you are upgrading.
Before you begin
If you made changes to reports you want to keep, it is critical that you create a backup before youuninstall OnCommand Insight.
182 | Configuration and Administration Guide

About this task
Uninstalling the OnCommand Insight Data Warehouse and Reporting permanently deletes allpreviously collected data and will remove all reports, including any newly created or edited reports.
Steps
1. Back up the current version of the OnCommand Insight Data Warehouse (DWH) database.
2. Close all of the OnCommand Insight windows.
3. Open the Add or Remove Programs feature from the Control Panel. Select the OnCommandInsight application for removal.
4. Click Remove.
Upgrading Insight | 183

Copyright information
Copyright © 1994–2015 NetApp, Inc. All rights reserved. Printed in the U.S.
No part of this document covered by copyright may be reproduced in any form or by any means—graphic, electronic, or mechanical, including photocopying, recording, taping, or storage in anelectronic retrieval system—without prior written permission of the copyright owner.
Software derived from copyrighted NetApp material is subject to the following license anddisclaimer:
THIS SOFTWARE IS PROVIDED BY NETAPP "AS IS" AND WITHOUT ANY EXPRESS ORIMPLIED WARRANTIES, INCLUDING, BUT NOT LIMITED TO, THE IMPLIEDWARRANTIES OF MERCHANTABILITY AND FITNESS FOR A PARTICULAR PURPOSE,WHICH ARE HEREBY DISCLAIMED. IN NO EVENT SHALL NETAPP BE LIABLE FOR ANYDIRECT, INDIRECT, INCIDENTAL, SPECIAL, EXEMPLARY, OR CONSEQUENTIALDAMAGES (INCLUDING, BUT NOT LIMITED TO, PROCUREMENT OF SUBSTITUTEGOODS OR SERVICES; LOSS OF USE, DATA, OR PROFITS; OR BUSINESS INTERRUPTION)HOWEVER CAUSED AND ON ANY THEORY OF LIABILITY, WHETHER IN CONTRACT,STRICT LIABILITY, OR TORT (INCLUDING NEGLIGENCE OR OTHERWISE) ARISING INANY WAY OUT OF THE USE OF THIS SOFTWARE, EVEN IF ADVISED OF THEPOSSIBILITY OF SUCH DAMAGE.
NetApp reserves the right to change any products described herein at any time, and without notice.NetApp assumes no responsibility or liability arising from the use of products described herein,except as expressly agreed to in writing by NetApp. The use or purchase of this product does notconvey a license under any patent rights, trademark rights, or any other intellectual property rights ofNetApp.
The product described in this manual may be protected by one or more U.S. patents, foreign patents,or pending applications.
RESTRICTED RIGHTS LEGEND: Use, duplication, or disclosure by the government is subject torestrictions as set forth in subparagraph (c)(1)(ii) of the Rights in Technical Data and ComputerSoftware clause at DFARS 252.277-7103 (October 1988) and FAR 52-227-19 (June 1987).
184 | Configuration and Administration Guide

Trademark information
NetApp, the NetApp logo, Go Further, Faster, ASUP, AutoSupport, Campaign Express, CloudONTAP, clustered Data ONTAP, Customer Fitness, Data ONTAP, DataMotion, Fitness, Flash Accel,Flash Cache, Flash Pool, FlashRay, FlexArray, FlexCache, FlexClone, FlexPod, FlexScale,FlexShare, FlexVol, FPolicy, GetSuccessful, LockVault, Manage ONTAP, Mars, MetroCluster,MultiStore, NetApp Insight, OnCommand, ONTAP, ONTAPI, RAID DP, SANtricity, SecureShare,Simplicity, Simulate ONTAP, Snap Creator, SnapCopy, SnapDrive, SnapIntegrator, SnapLock,SnapManager, SnapMirror, SnapMover, SnapProtect, SnapRestore, Snapshot, SnapValidator,SnapVault, StorageGRID, Tech OnTap, Unbound Cloud, and WAFL are trademarks or registeredtrademarks of NetApp, Inc., in the United States, and/or other countries. A current list of NetApptrademarks is available on the web at http://www.netapp.com/us/legal/netapptmlist.aspx.
Cisco and the Cisco logo are trademarks of Cisco in the U.S. and other countries. All other brands orproducts are trademarks or registered trademarks of their respective holders and should be treated assuch.
185

How to send comments about documentation andreceive update notification
You can help us to improve the quality of our documentation by sending us your feedback. You canreceive automatic notification when production-level (GA/FCS) documentation is initially released orimportant changes are made to existing production-level documents.
If you have suggestions for improving this document, send us your comments by email to [email protected]. To help us direct your comments to the correct division, include in thesubject line the product name, version, and operating system.
If you want to be notified automatically when production-level documentation is released orimportant changes are made to existing production-level documents, follow Twitter account@NetAppDoc.
You can also contact us in the following ways:
• NetApp, Inc., 495 East Java Drive, Sunnyvale, CA 94089 U.S.
• Telephone: +1 (408) 822-6000
• Fax: +1 (408) 822-4501
• Support telephone: +1 (888) 463-8277
186 | Configuration and Administration Guide

Index
64-bit serverupgrading 174
A
Access GatewayBrocade data source support for 66
accessibilityfeatures in web UI 15
accessingViolations Dashboard 144
acquisitionadd disk to correct failure 167enabling automatic disk model update 167recordings for Support 153restarting units 149, 156units 8
administratorschanging user passwords 36experience level 11permissions 33specialized tools 169super user 167
annotationsdefine in Java UI 15updating changes for reports 161
architecturedata warehouse 10firewalls 10Insight 8
asset pagesfeatures 18navigation from Assets Dashboard 13opening from heat maps 17, 142
Assets Dashboardfeatures 17hot spots 13monitoring system 142
ASUPconfiguring 42process 154retrieving disk model information 167
authenticationLDAP 33user 32
B
backupsbefore upgrading 173DWH before upgrading 175manual 153OnCommand Insight 38report artifacts 177restoring 150
best practicesbackup directories 38changing default passwords 28limited number of administrators 33restoring OCI database 150saving custom reports 177
BrocadeEnterprise Fabric Connectivity Manager (EFCM)data source 65FC Switch Firmware (SSH) data source 66Sphereon/Intrepid Switch (SNMP) 69
browsersInsight navigation 13, 14opening Insight 28
C
changing settingsStorage Manager Dashboard 48
CiscoFC Switch Firmware data source 71
CLARiiONdata source 80
cloningdata sources 61
cloud supportEMC data source 77
clustered Data ONTAPdata source 116data source for Unified Manager 116
Cognosbackups 175software for reporting 8
commands3PAR 637-Mode environments 117Brocade FC Switch Firmware 66
Index | 187

Cisco 71EMC Celerra 78EMC Navisphere 80EMC VNX 89EMC VPLEX 91HDS HiCommand Device Manager 94HP EVA 100Hyper-V (WMI) 113IBM DS 103IBM SVC 107IBM XIV 111Solutions Enabler 86
commentshow to send feedback about documentation 186
committingdata source patches 140
configurationadvanced 161advanced tools 154changes 132setting thresholds 15testing data sources 62
configuringASUP 42data sources 58email 39Insight 28Java UI Client 161performance policy evaluation precedence 55SNMP notifications 40syslog 41users in LDAP 34
creatingcustom dashboards 22performance policies 51
custom dashboardfeatures 22
custom dashboardscreating 22deleting 48setting up 44viewing 23
Customer Supportconfiguring information sent to 42generate logs for 158product documentation 13scrubbed file example 165scrubbing report for 163sending data to 154
D
Daily Storage TrafficStorage Manager dashboard 24
Dashboard, Violationsaccessing 144
dashboardssetting up custom 44viewing custom 23
Data Centers Time to FullStorage Manager Dashboard 24
data collectionoptions 58problems 131
data sourcesadding 58approving patches 140changing passwords for a group 130cloning to add 61deleting 151editing multiple setup information 136editing setup information 135examining detailed summaries 132finding serious problems 142importing 60installing a patch 138locating ghost data 166managing 57managing patches 139NetApp 172patching groups 138permissions to change 33polling 134researching failures 133rolling back patches 141setting up 57support matrix 58testing configurations 62vendor-specific configuration information 62
data sources, supported3PAR InServ Firmware (SSH) 63Brocade EFCM 65Brocade FC Switch Firmware (SSH) 66Brocade Sphereon/Intrepid Switch (SNMP) 69Cisco FC Switch Firmware (SNMP) 71Dell Compellent Storage Center 76EMC Atmos 77EMC Celerra SSH 78EMC CLARiiON (NaviCLI) 80EMC Data Domain 82
188 | Configuration and Administration Guide

EMC ECC StorageScope 84EMC Isilon 85EMC Solutions Enabler (CLI) with SMI-SPerformance 86EMC VNX (SSH) 89EMC VPLEX 91Fujitsu Eternus 93HDS (HiCommand Device Manager Lite 97HDS (HiCommand Device Manager) 94HP (CommandView) 98HP (EVA) 100HP CommandView Lite 99IBM DS (CLI) 103IBM PowerVM 105IBM SVC (SSH) 107IBM Tivoli Monitoring 109IBM TotalStorage DS4000 110IBM XIV (CLI) 111in 7-Mode environments 117Microsoft Hyper-V 113NetApp clustered Data ONTAP 116NetApp E-Series 121NetApp Host and VM File Systems 122QLogic FC Switch (SNMP) 126Violin Memory 127VMware vSphere 128
Data Warehousearchitecture 10
Data Warehouse (DWH)uninstalling to upgrade 182upgrading 175
databasesautomatic weekly backups 38backing up Data Warehouse 175OnCommand Insight 150SQL 160
deletingcustom dashboards 48data sources 151performance policies 56users 32
Dell Compellent Storage CenterInsilon (SSH) data source 76
devicesdata source setup 57deleting inactive 131
disk modelslocating vendor information 168text file format 168
disks
add missing 167disabling automatic update to model 167
documentationhow to receive automatic notification of changes to186how to send feedback about 186locating on Support site 13online 12opening help 15
DWHSee Data Warehouse
E
editingdata source setups 135multiple data source setups 136performance policies 55user accounts 37
emailchanging user 37configuring for receiving reports 39prerequisites 39to deliver reports 39
EMCAtmos data source 77Celerra data source 78CLARiiON data source 80ECC StorageScope data source 84Isilon SSH data source 85Solutions Enabler with SMI-S Performance 86VNX (SSH) data source 89VPLEX data source 91
EMC Data Domaindata source 82
error messagesdata source 133non-compliant licenses 152on asset pages 18
evaluation precedenceperformance policies 54
eventsdata source 132
exclamation markmeaning of in user interface 132
F
feedbackhow to send comments about documentation 186
Index | 189

Fibre Channelmonitoring 145, 146port metrics 146
filesbackup 153disk models 167license 30restoring OCI database 150
filteringdata in tables 14
firewallsarchitecture 10
FujitsuEternus data source 93
H
HDSdata sources 94, 98
heat mapsshowing high IOPs 17, 142
Helpaccess directly 12locating 12opening 15
hostsESX 128
HPdata sources 98EVA data source 100
HTTPprotocol for ASUP 42
Hypervisordata source 113sample asset page 18
I
IBMdata sources 103, 105, 107, 109–111
importingdata sources 60
informationhow to send feedback about improvingdocumentation 186
Insightarchitecture 8automatic server updates 173backups 38component list 159
data source patches 138data source setup requirements 57data source testing 62documentation 12health 143license types 31licenses 31, 152licenses, installing 30list of common maintenance tasks 142logging in 28maintenance 131navigation 13, 14number of database objects 159overview 8product information 13server requirement 174status 142toolbar 15upgrading 173upgrading older versions 173
Insight 7.1upgrading to a later version 174
installationchecking for updates 173obtaining information from the InteroperabilityMatrix Tool 58
installinglicenses 30
IOPsheat maps 17
IP addressescorrelating export 172
iSCSIIBM data source support 111
J
Java UIaccess Help directly 12Help 12launch 15setting business entities 77uses 8
L
LDAPauthentication 33rediscover user 37users 34, 37
190 | Configuration and Administration Guide

licensesinstalling 30not compliant 152replacing older versions 152types 31updating expired 31, 152
locatingresources 14
logscreating a zip file for Support 153generate for Customer Support 158OnCommand Insight 170syslog 42
M
maintenancepreventing problems 131specialized tools 169
maintenance taskslist of most common 142
managingperformance policies 51
Microsoftdata source 113
modifyingdata source setup 135multiple data source setups 136
monitoringdata sources 57Fibre Channel 145, 146storage 24violations 144
movingMySQL data 160MySQL data with command line 160
MySQLmigrating data 160
N
navigatingInsight 13, 14
NetAppdata sources 116, 117, 122
NetApp Customer Supportbundling logs for troubleshooting 153Insight documentation 13open page from toolbar 15preparing troubleshooting report 153
sending data to 154NetApp E-Series
data sources 121NetApp Host and VM File Systems
data source 122network
system information 159network maintenance
list of most common tasks 142
O
OnCommand Insight (OCI)Client 8data sources 57documentation 13Help 12overview 8setup tasks 28upgrading the report database 175user skills required 11
openingInsight 28
Orphaned CapacityStorage Manager Dashboard 24
P
passwordschanging for data source groups 130changing user 36coordinating changes 131encrypted for ASUP 42LDAP 34new users 32
patchesapproving 140data source, managing 139groups of data sources 138installing data source 138rolling back 141upgrading infrastructure 131
performancealerts in syslog 41data shown on asset pages 18
performance analysisskills required 11
performance policiesconfiguring evaluation precedence 55creating 51
Index | 191

deleting 56editing 55evaluation precedence 54managing 51
planningyour data source support 58
pollingdata sources 134
port metricsFibre Channel 146
portslocating 170
R
red circlemeaning of in the user interface 142
removingdata sources 151Data Warehouse 182Reporting 182user account 37
replicationcalculate Recovery Point Objective 171
reportingAtmos data 77
Reporting portalrestoring tabs 182
reportsconfiguring email for 39custom 176folders for custom 177upgrading prior to 6.3 178upgrading the data warehouse (DWH) 175
resourcescompared on asset pages 18
restartingacquisition units 149Insight servers 156polling 134
restoringbackups 150Reporting portal tabs 182
resumepolling 134
roles7-Mode environments 117super user 167users 32, 33
S
scalingdetermine number of database objects 159
searchingassets 13–15
securityfirewall architecture 10user roles 33
serversautomatic Insight updates 173backup 38EMC VPLEX 91Insight 8Insight health 143Insight requirement 174LDAP 34proxy for ASUP 42restarting OnCommand Insight 156
setting hours to ignore data updatesconfiguration 15, 62, 132, 154, 156, 161
setting upcustom dashboards 44Insight 28licenses 30
settings, Storage Manager Dashboardchanging 48
SNMPconfiguring notifications 40Qlogic data source 126
solid red circlein tables 14meaning 149
SQLembedded in customized reports 179
storagehigh IOPs 17monitoring 24
storage capacity summaryStorage Manager Dashboard 24
Storage Manager Dashboardchanging settings 48features 24
storage poolsshowing top 10 utilized 17
Storage Tiers Capacity CapacityStorage Manager Dashboard 24
Storage Tiers Daily PerformanceStorage Manager Dashboard 24
suggestions
192 | Configuration and Administration Guide

how to send feedback about documentation 186syslog
configuring 41contents 42
T
tablesdata displayed in 14
terabyteslicensed 152
testingadded data sources 58data source configurations 62
thresholdsdefine in Java UI 15
tierschecking changes after upgrading 162
Tivolidata source 109
toolbardescription 15
Top 10 ApplicationsStorage Manager Dashboard 24
topologyon asset pages 18
troubleshootingdata collection problems 131database backup 153finding changes in paths 172locating a device or port 170locating ghost data 166logs 170preparing a special report 153restoring OnCommand Insight 150sending report to Support 154server resources status 163tools 154zipping logs for Support 153
twitterhow to receive automatic notification ofdocumentation changes 186
U
Unified Manager (UM)data source support 116
uninstallingData Warehouse 182Reporting 182
upgradingautomatic updates 173backing up the DWH database prior to 175check tiers after 162custom reports 176customized reports with SQL 179data warehouse (DWH) 175from 32-bit to 64-bit 174from OCI 6.4 173Insight servers automatically 173prior to 6.3 reports 178to a later version than 7.1 174
usersauthenticated from LDAP 34changing passwords 36defining 32deleting 37editing accounts 37experience level 11roles 33
V
vendorsfinding disk model information 168supported data sources 62
vFiler unitconnection requirements 117
videosnavigating Insight 13on Community site 13
viewingcustom dashboards 23
violationsby policy 21changes in syslog 41in syslog 42last 1000 by metric type 21last 1000 over time 21monitoring 144on asset pages 18on custom dashboards 22SNMP notifications of 40
Violations Dashboardaccessing 144features 21
Violin Memorydata source 127
virtual machinehigh IOPs 17
Index | 193

VMdata sources 105, 113, 128
W
web UIaccess data source support matrix 58access Help directly 12
accessibility 15advanced cinfiguration tools 154documentation 12navigation 14toolbar 15uses 8
WWNlocating a device or port using 170
194 | Configuration and Administration Guide