OnCommand® Insight 7.0 - Product Documentation
46
OnCommand ® Insight 7.0 OnCommand Insight Getting Started Guide NetApp, Inc. 495 East Java Drive Sunnyvale, CA 94089 U.S. Telephone: +1 (408) 822-6000 Fax: +1 (408) 822-4501 Support telephone: +1 (888) 463-8277 Web: www.netapp.com Feedback: [email protected] Part number: 215-08249_A0 April 2014
-
Upload
khangminh22 -
Category
Documents
-
view
0 -
download
0
Transcript of OnCommand® Insight 7.0 - Product Documentation

OnCommand® Insight 7.0
OnCommand Insight Getting Started Guide
NetApp, Inc.495 East Java DriveSunnyvale, CA 94089U.S.
Telephone: +1 (408) 822-6000Fax: +1 (408) 822-4501Support telephone: +1 (888) 463-8277Web: www.netapp.comFeedback: [email protected]
Part number: 215-08249_A0April 2014


Contents
OnCommand Insight overview ................................................................... 5Insight architecture ...................................................................................................... 5
Insight Data Warehouse architecture .............................................................. 7
Firewall-friendly architecture .......................................................................... 7
Insight for administrators, managers, and planners ..................................................... 8
Finding answers to your Insight questions .................................................................. 9
Accessing Help directly .................................................................................. 9
Locating product information on the NetApp site ........................................ 10
Navigating Insight ..................................................................................................... 10
Insight web UI tour ....................................................................................... 11
Insight accessibility features ......................................................................... 12
Insight toolbar ............................................................................................... 12
Assets Dashboard .......................................................................................... 13
Asset pages .................................................................................................... 14
After installing Insight ............................................................................... 17Opening Insight ......................................................................................................... 17
Insight browser support ................................................................................. 18
Installing your Insight licenses .................................................................................. 18
Defining your monitoring environment .................................................................... 19
Data source support information ................................................................... 19
Adding data sources ...................................................................................... 20
Insight data source management .............................................................. 22Cloning a data source ................................................................................................ 22
Changing data source credentials .............................................................................. 23
Examining one data source in detail ......................................................................... 24
Researching a failed data source ............................................................................... 25
Changes causing data collection problems ................................................................ 27
Data source patches ................................................................................................... 28
Deleting a data source from OCI ............................................................................... 28
Managing Insight ........................................................................................ 29Monitoring Insight system health .............................................................................. 30
Acquisition unit status ................................................................................... 30
Table of Contents | 3

Updating expired licenses ......................................................................................... 31
Restoring the Insight database ................................................................................... 31
Upgrading Insight Server software ........................................................................... 32
Monitoring your environment ................................................................... 33Searching your environment for specific assets ........................................................ 33
Balancing network resources .................................................................................... 35
Examining network performance .............................................................................. 36
Analyzing slow PC performance ................................................................... 36
Analyzing correlated resources ..................................................................... 38
Copyright information ............................................................................... 40Trademark information ............................................................................. 41How to send your comments ...................................................................... 42Index ............................................................................................................. 43
4 | OnCommand Insight Getting Started Guide

OnCommand Insight overview
OnCommand Insight (OCI) is designed to simplify operational management of complex privatecloud and virtual IT environments. OCI is a single solution to enable cross-domain, multi-vendorresource management and analysis across networks, storage, and servers in physical and virtualenvironments.
OCI provides a "single pane of glass" for reporting on storage costs and provides the transparencyneeded to make decisions about performance and efficiency.
This release includes these key enhancements:
• Usability – New web-based user interface (UI) enables better visualization of the IT infrastructurerelationships and provides simpler and easier installation, upgrade process, and productadministration.
• Scalability – Scale across multiple data centers.• Flexibility – New dashboard and improved asset search and navigation enable quicker
troubleshooting.• Interoperability – Most comprehensive multi-vendor support in the industry, including enhanced
NetApp Clustered Data ONTAP and E-series configuration and performance monitoring.
Insight architectureWith the release of 7.0, OnCommand Insight provides simplified product administration using astreamlined system architecture.
The major components of the Insight architecture are shown in this diagram and described below.
5

OnCommand Insight Server
The OnCommand Insight Server is the "brain" of the application. It includes main data repository andanalysis components. The server is continuously building an end-to-end topology of the environment,analyzing it, and generating alerts when an incident or violation is detected.
Acquisition
The Insight collection engine is built of one or more Acquisition Units. Each acquisition unit is aservice running in the network that accesses (through modules called "data sources") and collectsdata from different devices in the data center. Information collected by the acquisition units is thenbeing sent to the server (in an XML, JSON or native Java format) for analysis.
The collection engine is designed to be highly modular and easily patched.
Web UI
This is the new HTML5 web-based user interface (UI) for Insight. You use the web UI to setup yourmonitoring environment and data sources. You then use the web UI Asset Dashboard and asset pagesto identify and research potential problems.
Java UI
This is the original OnCommand Insight user interface (UI) or Client. Currently, customers use theJava UI to set thresholds and define policies, annotations, and business entities. As in previousInsight releases, you can use the Client to research problems in your environment. Upcomingreleases will migrate all of the Insight use cases to the new web UI.
6 | OnCommand Insight Getting Started Guide

Data Warehouse (DWH)
Consolidates and prepares data for reporting across multiple installations of Insight. This includeshistory, trending and slicing and dicing the data in different ways to enable long-term planning of thedata center's infrastructure.
IBM Cognos
This software is a reporting engine that provides a user interface for creating enterprise-level reports.
Insight Data Warehouse architecture
In a large environment, the OnCommand Insight Data Warehouse (DWH) consolidates data acrossdifferent installations and hence different Insight data centers.
As shown in this diagram, the architecture enables users to view their entire environment andgenerate meaningful reports through a "single pane of glass" interface.
Firewall-friendly architecture
The OnCommand Insight (OCI) architecture accommodates easy creation of firewalls around theproduct.
As shown in the diagram, the architecture has these firewall features:
• All OCI clients use HTTPS to communicate with the server.• The acquisition units make sure that only outgoing HTTPS connections are established. No ports
are opened on the acquisition unit processes.
OnCommand Insight overview | 7

Insight for administrators, managers, and plannersOnCommand Insight (OCI) supplies vital information for storage administrators, managers, andstorage architects to do their troubleshooting and analysis.
Experienced storage administrators use OnCommand Insight along with their network storageknowledge to accomplish these typical tasks:
• Manage the SAN and NAS environment.• Work with network engineers on network concerns.• Evaluate, test, and integrate new storage technologies into the environment.• Troubleshoot performance issues, alerts, policy breaches, violations, and vulnerabilities.
Managers and network planners use OnCommand Insight to perform these business tasks:
• Develop project budgets and timelines.• Evaluate and revise project plans to meet changing project demands.• Manage project planning and expenses.• Purchase hardware and software.• Provide business reports for capacity management, charge back billing, right sizing, and service
level agreements.
8 | OnCommand Insight Getting Started Guide

Finding answers to your Insight questionsInsight provides product documentation as online Help and PDF guides. The web UI Help includesall of the Insight installation and upgrade instructions and information about the new web UI.
About this task
The Insight documentation is available from the Help menu.
Steps
1. To display the documentation within the web UI, open Insight in your browser.
2. On the toolbar, click the question mark and select either of these options from the menu:
• Help topics: Insight 7.0 documentation including installation and configuration.• Java UI Help: Instructions for using the original Insight Client to perform tasks such as
setting thresholds and defining annotations.
After you finish
You can also examine all of the OnCommand Insight documentation as PDF guides in the productLibrary on the NetApp Support Site.
Note: The Product Library site is support.netapp.com/documentation/productsatoz/index.html.
Accessing Help directly
If you want to search the Insight Help without opening the software, you can run both WebHelpversions in your browser from their server locations.
Before you begin
OnCommand Insight 7.x must be installed.
Steps
1. Open your browser.
2. Enter the URL for your OCI server with the Help directory using these formats for thecorresponding Insight versions:
• Web UI Help: https://<oci_server_name>/documentation/oci_webhelp/index• Java UI Help: https://<oci_server_name>/legacy/help/webhelp/index.html
3. Use the Search function or Index to locate the information you want.
OnCommand Insight overview | 9

Locating product information on the NetApp site
The NetApp Support Site maintains full documentation sets in different formats. Videos showing youhow to perform tasks in Insight are available on the Community site.
About this task
You need to have a NetApp Customer Support login name and password to access the Support andCommunity sites.
Steps
1. To examine all Insight product documentation, navigate to the product libraries on the NetAppCustomer Support site.
Note: The Product Library site is support.netapp.com/documentation/productsatoz/index.html.
a) Select OnCommand Insight.b) Locate the Release number you installed in the list of Insight releases.c) Select the documents and formats you want.
2. To run demonstration videos, open the Insight Community site.
Note: The Insight Community site is https://communities.netapp.com/community/products_and_solutions/storage_management_software/oncommand-insight.
a) Select the Content tab.b) Select the Videos tab.
Navigating InsightInsight employs a search facility, hot spots, links, and interactive icons to locate information andopen its tools and dialog boxes. When conducting your network research, you use standard browsertechniques to navigate through the data.
Steps
1. Open Insight in your browser.
2. On the Assets Dashboard, move your pointer over items to display additional information.
3. On the Assets Dashboard, click hot spots in the IOPs heat maps and the Top 10 utilized pools toopen the asset pages summarizing the current state of the selected resource.
4. On the Insight toolbar, locate specific network elements using the Search assets box.
5. On the toolbar, note any circled number on the Admin symbol.
6. To examine the items of possible concern, click Admin.
10 | OnCommand Insight Getting Started Guide

7. Click the buttons in the Admin panel to examine tables of items.
8. Click linked text in a table to examine the details associated with a specific item.
9. To return to previously displayed pages, use one of these techniques:
• Click the browser back arrow.• Right-click and hold the back arrow to display a list of the pages and select the page you want.
Video: Insight browser features
Note: To see a short demonstration of the browser navigation features, click here and openthe video.
Related tasks
Searching your environment for specific assets on page 33
Examining one data source in detail on page 24
Related references
Assets Dashboard on page 13
Asset pages on page 14
Insight web UI tour
Insight runs in a browser and employs many standard browser navigation features. For example, youcan use the browser Back arrow to return to the previously displayed page, and click text in blue todisplay linked information.
The toolbar remains at the top of all pages and provides access to the Insight tools. Insight displaysan exclamation mark beside any items in tables that need to be examined for possible problems. Thetotal of all possible problems in the Admin area is shown on the Admin icon on the toolbar.
You can use the Search Assets box to locate an object in your environment and display its asset pageshowing the current status with links to additional information.
The first items listed in the Data Sources table are the ones Insight has identified as possibly causingserious problems. You can use filter to sort the table to show only the items you want. Theoperations that can be performed on a table are shown in the Actions menu in the upper right corner.If you position your pointer over an item in a table, the operations you can perform on that itemappear as clickable icons to the right.
Use the browser Back arrow to return to the previous page or right-click and hold the pointer on theBack arrow to display a list of all previous pages so you can select to a specific page.
OnCommand Insight overview | 11

Insight accessibility features
Insight provides accessibility features in the web UI to help people with disabilities to use thesoftware. User hearing or speech is not required to operate this product.
Insight employs many standard web page accessibility features including these techniques:
• The application provides a well-defined visual focus. Focus is provided programmatically toassistive technology.
• When the mouse pointer moves over the web UI, displayed text describes page elements that isalso accessible to screen readers.
• Information is always conveyed in text as well as color, and never exclusively in color.• Insight runs in standard browsers so that users can set up their displays for special visual
requirements such as displaying text in an extra large font.• Data tables are designed to support screen readers.• Rows and columns in data tables are all labeled with headers.• Images in the product documentation include text (as Alt text) for screen readers.
Insight toolbar
All Insight pages have the same toolbar across the top to provide access to the Search and other tools.
The name of the monitored environment displays on the left side of the toolbar, as shown in theexample below. The toolbar remains at the top of all pages and provides access to these Insight tools:
• Search assets box locates network objects and links to asset pages for those objects.
• Help menu contains these options:
• Help topics includes getting started, installation, and configuration information for Insight7.0.
• Data source support matrix opens the detailed matrix for this version of Insight.• Check for updates indicates whether a new Insight version is available.• Support opens the NetApp Support page.• Java UI Help describes the original OCI Client features you might need to use with the new
Insight 7.0 features.• About lists Insight version and build numbers with copyright information.
12 | OnCommand Insight Getting Started Guide

• Admin icon opens the web UI configuration and troubleshooting tools. If there is a circlednumber on this icon, the number is the total of all items that require your attention. Check thebuttons in the Admin group to see how these items are divided among the options.
• Launch Java UI icon opens the original OCI Client. You need to use the Java UI to defineannotations, business entities, policies, and thresholds.
• Logged in as <user role> icon displays the role of the person logged in and provides theLogout option.
Assets Dashboard
The Asset Dashboard serves as a home base displaying a summary of your network at all times, andenabling you to locate and address problems before you get a call reporting a crisis.
Pie charts show the asset distribution for capacity by vendor and tier and switch port. Move yourpointer over the charts to display more details. Facts about your environment are listed in theEfficiency, FC data, Virtual infrastructure area.
OnCommand Insight overview | 13

Heat maps
In the lower right corner are the Storage IOPS and Virtual Machine IOPS heat maps. In thesemaps, any resource name in large print has a high amount of IOPs being driven into that storage orVM. Click any resource name in the heat maps to display the asset page summarizing the currentstate of that resource.
Top ten utilized storage pools
Click a tall bar in the Top 10 utilized pools chart to examine that resource. In the example, themouse pointer shows the name of the storage pool with the highest utilization in the chart.
Asset pages
Asset pages provide performance troubleshooting data for the hosts, and present summaryinformation for the base resource and the resources that it uses, with links to additional information.Scroll to the bottom of an asset page to examine tables of associated resources and violations.
This example shows some of the types of information available on a Hypervisor asset page. Anymessage displayed in red with an exclamation mark requires immediate attention.
14 | OnCommand Insight Getting Started Guide

Asset page types
The type of information shown on asset pages depends on the type of base resource represented.Insight provides asset pages for these resource types:
• Virtual Machine• Volume• Internal Volume• Physical Host• Storage Pool• Storage• Datastore• Hypervisor• Application• Node
Displaying asset page details
You can display more details using your mouse pointer and selecting linked or active items on assetpages. Click a linked resource name to display summaries of information for that resource.
Note: Use the browser back arrow to return to previously displayed pages.
Show time icons Click any of the time icons to change the segment of data displayed:
• 3 hours• 24 hours• 3 days• 7 days• All data
Topology This area shows the device and its connections. Position your mouse pointerover items in the topology map to display additional information.
Performancecharts
Select the check boxes above the charts to determine the types of data displayedin the charts. The types of data vary depending on the type of the base resource.Move your pointer over the graphs to display more details for any point on thegraph. Select different time icons to display different segments of the data.
Top correlatedresources
The Top correlated resources list shows the resources that have a highcorrelation on one or more performance metrics with the base resource. Use thecheck boxes and links in this list to supply the following additional information:
• Select the check box before the resource name to add the data from thatresource to the charts. Each resource is displayed in a different color in thecharts.
OnCommand Insight overview | 15

• Click the linked letter "T" beside the check box and select whether to includethe Total, Read only, or Write only data in the performance charts. Total isthe default.
• Click a linked resource name to open a page of summary data for it.• Click the linked percentage beside a resource name to open a box comparing
the type of correlation that resource has with the base resource.• Additional resources: If the correlated resources list does not contain a
resource you need in the performance charts, you can use the Search assetsbox to locate it and add it to the performance data.
Associatedresources andviolations
Scroll below the performance charts to examine linked lists of all associatedresources and violations of any pre-set thresholds. For example, a VirtualMachine asset page lists all of the VMDKs in the virtual machine and anythreshold violations.
Related tasks
Searching your environment for specific assets on page 33
Analyzing slow PC performance on page 36
Related references
Assets Dashboard on page 13
16 | OnCommand Insight Getting Started Guide

After installing Insight
After you install OnCommand Insight (OCI), you need to install your licenses and then setup Insightto monitor your environment, usually beginning with the data sources.
The OnCommand Insight configuration information is available in the Help and in the OnCommandInsight Configuration and Administration Guide on the NetApp Support Site.
Opening InsightUse a web browser to open Insight from the Insight server or from another location.
Steps
1. Do one of the following:
• If you are opening Insight from the Insight server, enter:
https://localhost
• If you are opening Insight from any location, enter the following URL:
https://<Insight_Server_hostname>:<Insight_Server_port>
The port number is either 443 or another port as configured when the Insight server wasinstalled. It defaults to 443 if you do not specify it in the URL.
2. In the Login window, enter your user name and password and click OK.
The following table lists the default user name and password. Best Practice: Change thesedefaults as soon as possible after installation.
Data Value
Default user name admin
Default password admin123
Result
When you first open Insight after installation, you need to install the licenses to use the product. Ifthe licenses have been entered, the data source setup page opens first.
17
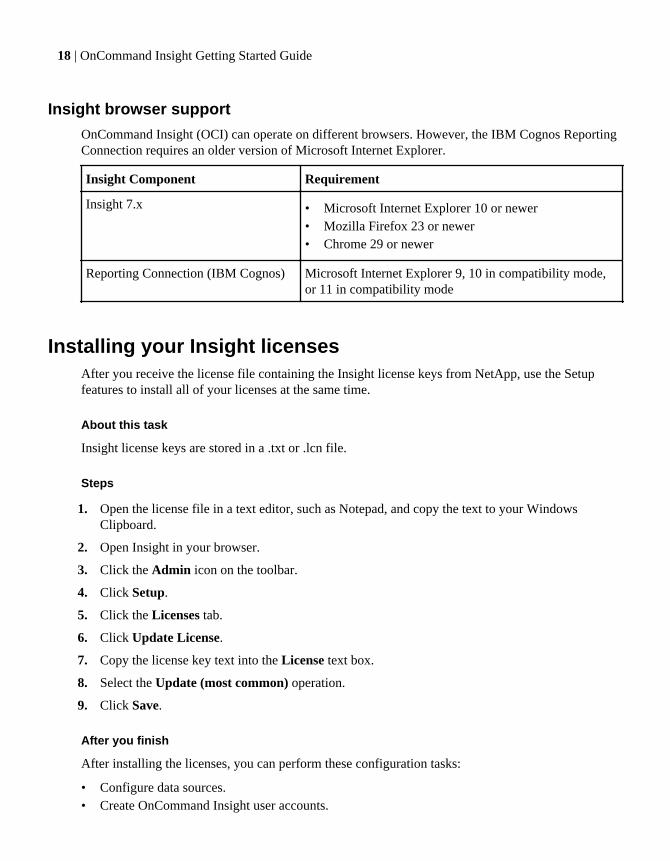
Insight browser support
OnCommand Insight (OCI) can operate on different browsers. However, the IBM Cognos ReportingConnection requires an older version of Microsoft Internet Explorer.
Insight Component Requirement
Insight 7.x • Microsoft Internet Explorer 10 or newer• Mozilla Firefox 23 or newer• Chrome 29 or newer
Reporting Connection (IBM Cognos) Microsoft Internet Explorer 9, 10 in compatibility mode,or 11 in compatibility mode
Installing your Insight licensesAfter you receive the license file containing the Insight license keys from NetApp, use the Setupfeatures to install all of your licenses at the same time.
About this task
Insight license keys are stored in a .txt or .lcn file.
Steps
1. Open the license file in a text editor, such as Notepad, and copy the text to your WindowsClipboard.
2. Open Insight in your browser.
3. Click the Admin icon on the toolbar.
4. Click Setup.
5. Click the Licenses tab.
6. Click Update License.
7. Copy the license key text into the License text box.
8. Select the Update (most common) operation.
9. Click Save.
After you finish
After installing the licenses, you can perform these configuration tasks:
• Configure data sources.• Create OnCommand Insight user accounts.
18 | OnCommand Insight Getting Started Guide

See the Insight Help or the OnCommand Insight Configuration and Administration Guide forinstructions to perform these tasks.
Defining your monitoring environmentAfter installing OnCommand Insight, you also need to apply your licenses, configure data sources,and define the user accounts. You might also want to define the backup process.
Steps
1. Open OnCommand Insight in your browser.
2. If this is the first time you have opened the software, the Setup area opens to allow you to enteryour licenses.
3. After the licenses are entered, click the Admin icon on the toolbar.
If you have previously configured OnCommand Insight, the circled number on this icon indicatesthe number of problems detected.
4. If you are setting up a newly installed OnCommand Insight system, you need to use these optionsto configure your system:
• Data Sources• Setup for user accounts and email and SNMP notifications
After you finish
These tasks are described in the Help and in the OnCommand Insight Configuration andAdministration Guide.
Related concepts
Insight data source management on page 22
Related tasks
Accessing Help directly on page 9
Data source support information
As part of your installation and configuration planning, you should check to be certain that thedevices in your environment can be monitored by Insight. To do so, check the OnCommand Insightinteroperability matrix and data source support matrix for details about operating systems, specificdevices, and protocols.
To see the operating systems that Insight supports, refer to support.netapp.com/matrix. Compare yourenvironment with details in the Interoperability matrix.
After installing Insight | 19

After installation, you can access a detailed data source matrix from the Insight web UI. Click theHelp icon on the toolbar and select Data source support matrix.
Adding data sources
You can add data sources quickly.
Steps
1. Open Insight in your browser.
2. If the Data sources table is not displayed, click the Admin icon on the toolbar to open it.
3. Click the Actions button and select the Add data source option.
4. Enter your network Name for the new data source, as shown in this example.
5. In the Add data source dialog box, select the Vendor and Model of the data source from the pull-down lists.
Example
6. Select any What to collect additional options. These selections change the available fields in theConfiguration and Advanced configuration sections.
In this example, these options are Inventory and Array Performance. Inventory is always selectedand cannot be changed. Other possible data collection options are Switch Performance, VMPerformance, and Replication (for data synchronization).
20 | OnCommand Insight Getting Started Guide

7. Click the Configuration link and enter the basic setup information required for the data sourcewith your selected data collection type.
If this is all of the information needed for the data source, you might click the Test link at thispoint.
8. If this type of data source usually requires more detailed information to set it up in your network,click the Advanced configuration link to enter additional information. If you do not have theinformation required for the advanced configuration, see the "Vendor-specific data sourcereference" information for that data source.
9. Click the Test link to be certain the data source is properly configured.
10. Click Save.
After installing Insight | 21
Insight data source management
Data sources are the most critical component when maintaining a OnCommand Insight environment.Because they are the primary source of information for Insight, it is imperative that data sources bemaintained in a running state.
You can monitor the data sources in your network and select a data source to check the events relatedto the status, and any changes that might have caused problems.
In addition to examining the individual data source, you can perform these operations:
• Cloning a data source to create many similar data sources in Insight• Edit the data source information• Change credentials• Control polling• Delete the data source• Install data source patches• Prepare an error report for NetApp Customer Support
Cloning a data sourceUsing the clone facility, you can quickly add a data source that has the same credentials andattributes as another data source.
Steps
1. Click the Admin icon on the toolbar.
The Data sources list opens.
2. Select a data source that has the setup information you want to use for your new data source.
3. To the right of the selected data source, click Clone this data source.
The Clone this data source dialog box lists the information you must supply for the selected datasource, as shown in this example for a NetApp data source.
22 | OnCommand Insight Getting Started Guide

4. You must enter the required information in the fields because those details cannot be copied fromthe existing data source.
5. Click Clone.
Result
The clone operation copies all other attributes and settings to create the new data source.
Changing data source credentialsIf multiple data sources of the same type are sharing a username and password, you can change thepassword for all devices in the group at the same time.
Steps
1. On the Insight toolbar, click the Admin icon.
The Data sources list opens.
2. Click the Actions button and select the Change credentials option.
3. In the Credentials Management dialog box, select one of the data source groups from the list.
The Edit icon, a pen on a sheet of paper, becomes active to the right.
Insight data source management | 23

4. Click Edit.
5. Enter the new password and confirm it.
Examining one data source in detailIf you see that a data source has failed or slowed, you might want to examine a detailed summary ofinformation for that data source to determine the cause of the problem. Data sources with conditionsrequiring your attention are marked with a exclamation mark.
Steps
1. On the Insight toolbar, click the Admin icon.
The Data sources list opens. Any potential problems are marked with an exclamation mark in thelist. The most serious problems are at the top of the list.
2. Select the data source that is causing concern.
3. Click the data source name link.
4. On the data source summary page, check the information in any of these sections provided foryour data source:
24 | OnCommand Insight Getting Started Guide
• Event timeline lists events tied to the current status shown in the Data sources list. Events inthis summary are displayed per device. Errors are shown in red. Position your mouse pointeron timeline items to display additional information.
• Devices reported by this data source lists the types of devices, their IP addresses, and linksto more detailed information for each device.
• Changes reported by this data source (last 3 weeks) lists any devices that were added orremoved or had a change to the configuration.
5. After examining the data source information, you might want to perform one of these operationsusing the buttons at the top of the page:
• Edit the description of the data source to correct the problem.• Poll again forces polling to reveal if the problem was persistent or intermittent.• Postpone data source polling for 1, 3, or 5 days to give you time to research the problem and
stop the warning messages.• Install a patch on the data source to correct the problem.• Prepares an Error report to NetApp Customer Support.• Delete the data source from your Insight monitoring environment.
Researching a failed data sourceIf a data source has the "Inventory failed !" or "Performance failed !" message and a High orMedium Impact, you need to research this problem using the data source summary page with itslinked information.
Steps
1. Click the linked Name of the data source to open the Summary page.
This example shows a wide variety of information that might be provided for a failed data source.
Insight data source management | 25

2. Check the Comments area to read any notes left by another engineer who might also beinvestigating this failure.
3. Note any performance messages.
4. If there is a patch being applied to this data source, click link to check the patch page to see ifthat has caused the problem.
5. Move your mouse pointer over the segments of the Event timeline graph to display additionalinformation.
6. Select an error message for a Device and displayed below the Event timeline and click the Errordetails icon that displays to the right of the message.
The Error details include the text of the error message, most likely causes, information in use, andsuggestions of what can be tried to correct the problem.
7. In the Devices reported by this data source area, you might filter the list to display only devices ofinterest, and you can click the linked Name of a device to display the asset page for that device.
8. To return to previously displayed pages, use one of these techniques:
• Click the browser back arrow.• Right-click the back arrow to display a list of the pages and select the page you want.
9. To display detailed information about other resources, click other linked names.
26 | OnCommand Insight Getting Started Guide

10. When you return to the data source summary page, check the Changes area at the bottom of thepage to see if recent changes caused the problem.
Related tasks
Searching your environment for specific assets on page 33
Related references
Asset pages on page 14
Changes causing data collection problemsIf you are experiencing data collection problems in OnCommand Insight (OCI), changes in yourenvironment are a likely cause. As a general maintenance rule, any changes in your environmentusually need to be accommodated in OCI.
Use this checklist to identify changes to your network that might be causing problems:
• Have you changed any passwords? Were those passwords changed in Insight?• Did you remove a device from your network? You must also remove the device from
OnCommand Insight to prevent it from being rediscovered and reintroduced.• Did you upgrade your infrastructure software (such as HP CommandView EVA or EMC
Solutions Enabler)? If so, you might have introduced version mismatches because Insight datasources might be using CLI client tools from your vendors to speak to the server tools. Ensurethat the appropriate versions of the client tools are installed on the acquisition unit. If data sourcefailures persist, you need to contact NetApp Customer Support to request assistance and possiblya data source patch.
• Are all of your OnCommand Insight acquisition units using the same OnCommand Insightversion? If the Remote Acquisition Units and local acquisition unit are running differentOnCommand Insight versions, install the same version on all units to correct the data collectionproblem. If you need to install a new version of OCI on all of the acquisition units, go to theNetApp Customer Support site and download the correct version.
• Have you changed any domain names or added a new domain? You must reconfigure the AutoResolution (AR) methods in the Java UI.
Related concepts
Data source patches on page 28
Related tasks
Restoring the Insight database on page 31
Deleting a data source from OCI on page 28
Insight data source management | 27

Data source patchesFor each data source type in your network, you can upload data source patches. You can also install,test, and manage the patching process. However, only one patch can be active for a data source typeat a time.
For each patch, you can perform these tasks:
• Check the before and after comparison of each data source receiving the patch.• Write comments to explain decisions or summarize research.• Make changes to a data source that is not responding well to the patch.• Approve the patch to be committed to your Insight server.• Roll back a patch that is not operating as you intended.• Replace a failing patch with a different one.
Deleting a data source from OCIIf you have removed a data source from your environment, you must also delete it from theOnCommand Insight (OCI) monitoring environment.
Steps
1. On the Insight toolbar, click the Admin icon.
The Data sources list opens.
2. Select the data source that you want to delete.
3. Click the linked data source name.
4. Check the information for the selected data source on the summary page to be certain it is the oneyou want to delete.
5. Click Delete.
6. Click OK to confirm the operation.
28 | OnCommand Insight Getting Started Guide

Managing Insight
Insight monitors your environment, enabling you to research potential problems before a crisis isreported. The Assets Dashboard provides summary pie charts, heat maps for IOPs, and an interactivechart of the top ten utilized storage pools. In the Admin area, potential problems are marked with anexclamation mark in the web UI. The number on the Admin icon is the total of all the potentialproblems found in the Admin area.
Steps
1. Open the Insight Assets Dashboard and move your mouse pointer over the pie charts to examinethe asset distribution in these three charts:
• Capacity by Vendor• Capacity by Tier• Switch Ports
2. In the lower right corner of the Assets Dashboard, click any large print resource name in the IOPheat maps to display the asset page summarizing the current state of that resource.
3. Click a tall bar in the Top 10 utilized pools chart to examine that resource.
4. On the toolbar, click Admin .
5. If the Admin icon has a circled number, as in the example, the number indicates the number ofpossible problems detected. Check administration buttons with similar circled numbers andexamine the details displayed in those areas.
6. Click Data Sources to examine a list of all monitored data sources. Examine any data sourcewith a Last Status column containing a message with an exclamation mark and with an Impactlisted as High or Medium. These are at the top of the table. The problems with those data sourcesaffect a significant portion of your network and need to be addressed.
7. Click Acquisition Units to note the status for each IP address running Insight and restart anacquisition unit.
8. Click Health to see high-level instance monitoring of the Insight servers.
Related tasks
Searching your environment for specific assets on page 33
Examining one data source in detail on page 24
Related references
Assets Dashboard on page 13
Asset pages on page 14
29

Monitoring Insight system healthTo check the current status of your Insight system, open the Health summary page in the Adminselections. The summary lists the current status of all of your Insight servers and the acquisitionunits.
Acquisition unit status
The status of the Insight acquisition units connected to your server is displayed in the Admin >Acquisition Units table. If a unit in the list has an exclamation mark in the description, that unit hasa serious problem that needs to be investigated. You can select an entry in this table and restart thatacquisition unit.
The Acquisition Units table displays this information for each unit:
• Name• IP• Status is the operating status of the acquisition unit.• Last reported displays last time a data source connected to the acquisition unit reported.
If you position your pointer over one of the units in the table, you can click the square icon to restartthat unit.
30 | OnCommand Insight Getting Started Guide

Updating expired licensesIf one or more of your Insight licenses expired, you can update the licenses quickly using the sameprocedure as you did to install the licenses originally.
Steps
1. In a text editor, such as Notepad, open the new license file you received from NetApp Supportand copy the license key text to your Windows Clipboard.
2. Open OnCommand Insight in your browser.
3. Click the Admin icon on the toolbar.
4. Click Setup.
5. Click the Licenses tab.
6. Click Update License.
7. Copy the license key text into the License text box.
8. Select the Update (most common) operation.
This operation adds your new licenses to any currently active Insight licenses.
9. Click Save.
Restoring the Insight databaseTo restore your Insight database from a verified backup file, use the Troubleshooting options. Thisoperation completely replaces your current OnCommand Insight data.
Before you begin
Best practice: Before restoring your OnCommand Insight database, use the manual backup processto create a copy of the current database. Check the backup file you plan to restore be certain that itwas a successful backup containing the files you want to restore.
Steps
1. On the Insight toolbar, click the Admin icon.
2. Click Troubleshooting.
Managing Insight | 31

3. In the Restore a database section, select the backup file you want to restore from the SelectBackup menu.
4. Click Restore.
Upgrading Insight Server softwareOnCommand Insight automatically checks for Insight Server updates when you log in, but you canalso check for software version updates manually.
Steps
1. On the Insight toolbar, click the Help icon.
2. Select Check for updates.
If your OnCommand Insight version is the most current, the "Version is up to date" messagedisplays. Click OK.
3. If a newer update is detected, click the download here link in the message box.
4. In the Download page, click download.
5. Complete the upgrade.
32 | OnCommand Insight Getting Started Guide

Monitoring your environment
Insight helps you to prevent problems in your environment and troubleshoot potential problemsquickly.
Related concepts
Insight web UI tour on page 11
Related references
Assets Dashboard on page 13
Searching your environment for specific assetsYou can locate information for specific assets using the search facility. For example, if a system usercontacts the storage administrator with a complaint about a particular server, the administrator canenter the server name into the search and display an asset page summarizing the status and supplyingadditional linked information.
Steps
1. Open Insight in your browser.
2. On the toolbar in the Search assets box, enter the name of a resource or a portion of the name, asshown in this example.
Example
33
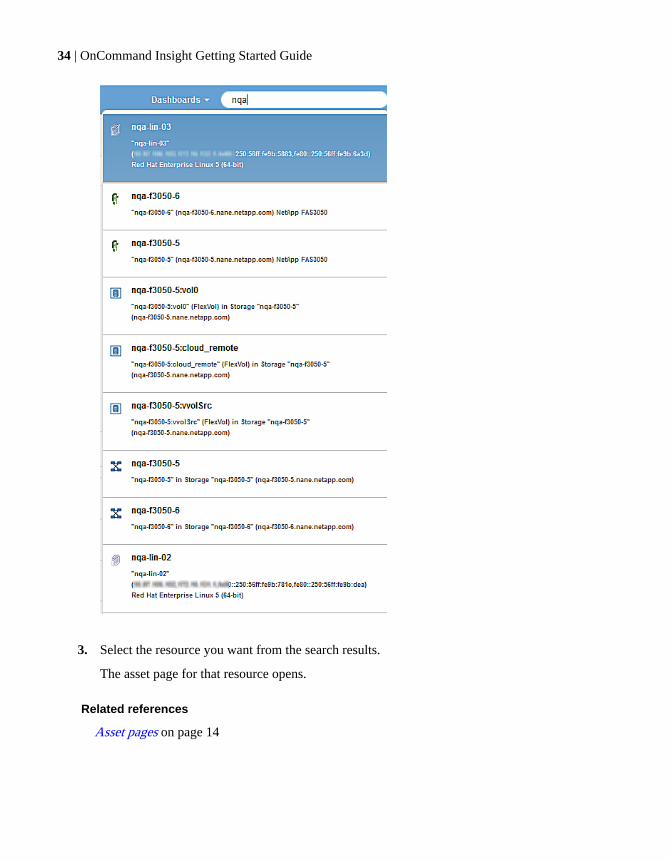
3. Select the resource you want from the search results.
The asset page for that resource opens.
Related references
Asset pages on page 14
34 | OnCommand Insight Getting Started Guide

Balancing network resourcesTo resolve balancing issues, use the asset pages to find the problems and identify high capacityvolumes that are underused.
Steps
1. Open the Assets Dashboard in your browser.
2. In the Virtual Machines IOPs heat map, you notice the name of a VM in very large print thatoften reports problems.
3. Click the VM name to display the asset page.
4. Check for error messages in the summary.
5. Check the performance charts and particularly the top correlated resources to locate any volumesthat might be in contention.
6. Add volumes to the performance chart to compare the patterns of activity and display more assetpages for other resources involved in the problem.
7. Scroll to the bottom of asset page to see lists of all of the resources associated with the VM.
In this example, this Virtual Machine asset page shows that it is running well, but at the bottom ofthe page, one VMDK is at 99% capacity and probably causing the IOPs problem.
Monitoring your environment | 35

8. To resolve the balancing problem, identify a resource that is under-utilized to receive the loadfrom an over-utilized resource or remove a less demanding application from the heavily usedresource.
Examining network performanceYou can examine your storage environment performance and identify under-utilized and over-utilized resources and identify risks before they turn into problems.
Insight helps you to resolve or prevent performance and availability problems that are revealedthrough the collected storage data.
You can use Insight to perform these performance management tasks:
• Monitor performance across your environment• Identify resources influencing the performance of other devices
Analyzing slow PC performance
If you receive calls from network users complaining that their computers are running slowly, youneed to analyze host performance and identify the affected resources.
Before you begin
In this example, the caller gave the host name.
Steps
1. Open Insight in your browser.
2. Enter the host name in the Search assets box and click the host name in the search results.
The asset page for the resource opens.
3. On the asset page for the host, examine the performance charts in the center of the page. Youmight want to show different types of data in addition to the Latency and IOPS that are usuallypre-selected. Click the check boxes for other types of data, such as Throughput, Memory, CPU,or IP Throughput depending on the device type.
In this example, the resource has high latency over several days.
36 | OnCommand Insight Getting Started Guide

4. To display a description of a point on a chart, position the mouse pointer over the point, as shownin this example.
5. You might also want to change the time range with the selection at the top of the page to be 3hours up to 7 days or All of the available data.
6. Examine the list of Top correlated resources to see if there are other resources with the samepattern of activity as the base resource.
The first resource in the list is always the base resource.
a) Click a linked percentage beside a correlated resource to see if the correlated activity patternis for IOPs or CPU for the base resource and another resource.
b) Click the check box for a correlated resource to add its data to the performance charts.c) Click the linked name of the correlated resource to display its asset page.
7. For a VM, as in this example, locate the storage pool in the Top correlated resources and clickthe storage pool name.
Related tasks
Examining one data source in detail on page 24
Monitoring your environment | 37

Related references
Asset pages on page 14
Analyzing correlated resources
When you are researching performance problems and you open the asset page for a device, youshould use the Top correlated resources list to refine data displayed in the performance charts. Aresource with a high percentage indicates that resource has similar activity to the base resource.
About this task
You are investigating a performance problem and opened the asset page for a device.
Steps
1. In the Top correlated resources list, the first resource is the base resource. The correlatedresources in the list are ranked by percentage of correlated activity to the first device. Click thelinked percentage of correlation to see the details. In this example, the 91% correlation is in CPU,so both the base resource and this correlated resource have equally high CPU usage.
2. To add a correlated resource to the performance charts, select the check box in the Topcorrelated resources list for the resource you want to add. By default each resource provides theTotal data available, but you can select only Read or only Write data from the menu on the checkbox.
Each resource in the charts has a different color so that you can compare the performancemeasurements for each resource. Only the appropriate type of data is plotted for the selected
38 | OnCommand Insight Getting Started Guide

measurement metrics. For example, CPU data does not include Read or Write metrics, so onlyTotal data is available.
3. Click the linked name of the correlated resource to display its asset page.
4. If you do not see a resource listed in the Top correlated resources that you believe should beconsidered in the analysis, you can use the Search assets box to find that resource.
Monitoring your environment | 39
Copyright information
Copyright © 1994–2014 NetApp, Inc. All rights reserved. Printed in the U.S.
No part of this document covered by copyright may be reproduced in any form or by any means—graphic, electronic, or mechanical, including photocopying, recording, taping, or storage in anelectronic retrieval system—without prior written permission of the copyright owner.
Software derived from copyrighted NetApp material is subject to the following license anddisclaimer:
THIS SOFTWARE IS PROVIDED BY NETAPP "AS IS" AND WITHOUT ANY EXPRESS ORIMPLIED WARRANTIES, INCLUDING, BUT NOT LIMITED TO, THE IMPLIEDWARRANTIES OF MERCHANTABILITY AND FITNESS FOR A PARTICULAR PURPOSE,WHICH ARE HEREBY DISCLAIMED. IN NO EVENT SHALL NETAPP BE LIABLE FOR ANYDIRECT, INDIRECT, INCIDENTAL, SPECIAL, EXEMPLARY, OR CONSEQUENTIALDAMAGES (INCLUDING, BUT NOT LIMITED TO, PROCUREMENT OF SUBSTITUTEGOODS OR SERVICES; LOSS OF USE, DATA, OR PROFITS; OR BUSINESSINTERRUPTION) HOWEVER CAUSED AND ON ANY THEORY OF LIABILITY, WHETHERIN CONTRACT, STRICT LIABILITY, OR TORT (INCLUDING NEGLIGENCE OROTHERWISE) ARISING IN ANY WAY OUT OF THE USE OF THIS SOFTWARE, EVEN IFADVISED OF THE POSSIBILITY OF SUCH DAMAGE.
NetApp reserves the right to change any products described herein at any time, and without notice.NetApp assumes no responsibility or liability arising from the use of products described herein,except as expressly agreed to in writing by NetApp. The use or purchase of this product does notconvey a license under any patent rights, trademark rights, or any other intellectual property rights ofNetApp.
The product described in this manual may be protected by one or more U.S. patents, foreign patents,or pending applications.
RESTRICTED RIGHTS LEGEND: Use, duplication, or disclosure by the government is subject torestrictions as set forth in subparagraph (c)(1)(ii) of the Rights in Technical Data and ComputerSoftware clause at DFARS 252.277-7103 (October 1988) and FAR 52-227-19 (June 1987).
40 | OnCommand Insight Getting Started Guide

Trademark information
NetApp, the NetApp logo, Network Appliance, the Network Appliance logo, Akorri,ApplianceWatch, ASUP, AutoSupport, BalancePoint, BalancePoint Predictor, Bycast, CampaignExpress, ComplianceClock, Customer Fitness, Cryptainer, CryptoShred, CyberSnap, Data CenterFitness, Data ONTAP, DataFabric, DataFort, Decru, Decru DataFort, DenseStak, Engenio, Engeniologo, E-Stack, ExpressPod, FAServer, FastStak, FilerView, Fitness, Flash Accel, Flash Cache, FlashPool, FlashRay, FlexCache, FlexClone, FlexPod, FlexScale, FlexShare, FlexSuite, FlexVol, FPolicy,GetSuccessful, gFiler, Go further, faster, Imagine Virtually Anything, Lifetime Key Management,LockVault, Manage ONTAP, Mars, MetroCluster, MultiStore, NearStore, NetCache, NOW (NetAppon the Web), Onaro, OnCommand, ONTAPI, OpenKey, PerformanceStak, RAID-DP, ReplicatorX,SANscreen, SANshare, SANtricity, SecureAdmin, SecureShare, Select, Service Builder, ShadowTape, Simplicity, Simulate ONTAP, SnapCopy, Snap Creator, SnapDirector, SnapDrive, SnapFilter,SnapIntegrator, SnapLock, SnapManager, SnapMigrator, SnapMirror, SnapMover, SnapProtect,SnapRestore, Snapshot, SnapSuite, SnapValidator, SnapVault, StorageGRID, StoreVault, theStoreVault logo, SyncMirror, Tech OnTap, The evolution of storage, Topio, VelocityStak, vFiler,VFM, Virtual File Manager, VPolicy, WAFL, Web Filer, and XBB are trademarks or registeredtrademarks of NetApp, Inc. in the United States, other countries, or both.
IBM, the IBM logo, and ibm.com are trademarks or registered trademarks of International BusinessMachines Corporation in the United States, other countries, or both. A complete and current list ofother IBM trademarks is available on the web at www.ibm.com/legal/copytrade.shtml.
Apple is a registered trademark and QuickTime is a trademark of Apple, Inc. in the United Statesand/or other countries. Microsoft is a registered trademark and Windows Media is a trademark ofMicrosoft Corporation in the United States and/or other countries. RealAudio, RealNetworks,RealPlayer, RealSystem, RealText, and RealVideo are registered trademarks and RealMedia,RealProxy, and SureStream are trademarks of RealNetworks, Inc. in the United States and/or othercountries.
All other brands or products are trademarks or registered trademarks of their respective holders andshould be treated as such.
NetApp, Inc. is a licensee of the CompactFlash and CF Logo trademarks.
NetApp, Inc. NetCache is certified RealSystem compatible.
41

How to send your comments
You can help us to improve the quality of our documentation by sending us your feedback.
Your feedback is important in helping us to provide the most accurate and high-quality information.If you have suggestions for improving this document, send us your comments by email to [email protected]. To help us direct your comments to the correct division, include in thesubject line the product name, version, and operating system.
You can also contact us in the following ways:
• NetApp, Inc., 495 East Java Drive, Sunnyvale, CA 94089 U.S.• Telephone: +1 (408) 822-6000• Fax: +1 (408) 822-4501• Support telephone: +1 (888) 463-8277
42 | OnCommand Insight Getting Started Guide

Index
A
accessibilityfeatures in web UI 12
acquisitionrestarting units 30units 5
administratorsexperience level 8
annotationsdefine in Java UI 12
architecturedata warehouse 7firewalls 7Insight 5
asset pagescorrelated resources 38features 14navigation from Assets Dashboard 10opening from heat maps 13, 29opening from search results 33performance analysis 36
Assets Dashboardfeatures 13heat maps 35hot spots 10monitoring system 29
B
backupsrestoring 31
balancingnetwork resources 35
best practiceschanging default passwords 17restoring OCI database 31
browsersInsight navigation 10, 11opening Insight 17supported 18
C
capacityVMDKs 35
cloningdata sources 22
Cognosbrowser requirement 18software for reporting 5
configurationchanges 24setting thresholds 12
configuringdata sources 20Insight 17
Customer Supportproduct documentation 10
D
data collectionoptions 20problems 27
data sourcesadding 20changing passwords for a group 23cloning to add 22deleting 28examining detailed summaries 24finding serious problems 29managing 22patching groups 28researching failures 25setup 19support matrix 19
Data Warehouse (DWH)architecture 7
databasesOnCommand Insight 31
deletingdata sources 28
devicesdeleting inactive 27examining performance 36
documentationlocating on Support site 10online 9opening help 12
Index | 43

E
error messagesdata source 25on asset pages 14
eventsdata source 24
exclamation markin tables 11meaning 24, 29, 30
F
fileslicense 18restoring OCI database 31
filteringdata in tables 11
firewallsarchitecture 7
H
heat mapsshowing high IOPs 13, 29
Helpaccess directly 9locating 9opening 12
Hypervisorsample asset page 14
I
Insightarchitecture 5automatic server updates 32data source patches 28documentation 9health 30licenses 18, 31logging in 17maintenance 27navigation 10, 11overview 5product information 10setup 19status 29toolbar 12
installation
checking for updates 32interoperability matrix 19
installinglicenses 18
IOPsheat map 35heat maps 13
J
Java UIaccess Help directly 9Help 9launch 12uses 5
L
licensesinstalling 18updating expired 31
locatingresources 11
M
maintenancepreventing problems 27
monitoringdata sources 22defining environment 19
N
navigatingInsight 10, 11
NetApp Customer SupportInsight documentation 10open page from toolbar 12
networkbalancing resources 35performance 36
O
OnCommand Insight (OCI)after installation 17Client 5data sources 22
44 | OnCommand Insight Getting Started Guide

documentation 10Help 9overview 5supported browsers 18user skills required 8
openingInsight 17
P
passwordschanging for data source groups 23coordinating changes 27
patchesgroups of data sources 28upgrading infrastructure 27
performanceanalyzing slow client computers 36correlated resources 38data shown on asset pages 14examining network 36monitoring 33
performance analysisskills required 8
performance chartscorrelated resources 38zooming in 36
planningyour data source support 19
R
removingdata sources 28
requirementsbrowsers 18
resourcescompared on asset pages 14searching for 33top correlated 36, 38
restartingacquisition units 30
restoringbackups 31
S
searchingassets 10–12correlated resources 38
environment assets 33for host 36
securityfirewall architecture 7
serversautomatic Insight updates 32Insight 5Insight health 30
setting upInsight 17licenses 18
storagehigh IOPs 13
storage poolsshowing top 10 utilized 13
T
tablesdata displayed in 11
testingadded data sources 20
thresholdsdefine in Java UI 12
toolbardescription 12
topologyon asset pages 14
troubleshootingdata collection problems 27locating your environment resources 33restoring OnCommand Insight 31your environment 33
U
upgradingautomatic updates 32
usersexperience level 8
V
videosnavigating Insight 10on Community site 10
violationson asset pages 14
virtual machinehigh IOPs 13
Index | 45

VMDKresources list 35
W
web UIaccess data source support matrix 19
access Help directly 9accessibility 12documentation 9toolbar 12tour 11uses 5
46 | OnCommand Insight Getting Started Guide