Hydrog eolog y of Stro mboli volcano, Aeolian Islands (Italy) from the inter pretation o f...
17
Geophys. J. Int. (2011) doi: 10.1111/j.1365-246X.2011.05112.x GJI Mineral physics, rheology, heat flow and volcanology Hydrogeology of Stromboli volcano, Aeolian Islands (Italy) from the interpretation of resistivity tomograms, self-potential, soil temperature and soil CO 2 concentration measurements A. Revil, 1,2 A. Finizola, 3 T. Ricci, 4 E. Delcher, 3 A. Peltier, 5 S. Barde-Cabusson, 6 G. Avard, 7 T. Bailly, 8 L. Bennati, 9 S. Byrdina, 2 J. Colonge, 8 F. Di Gangi, 10 G. Douillet, 11 M. Lupi, 12 J. Letort 8 and E. Tsang Hin Sun 8 1 Colorado School of Mines, Department of Geophysics, Golden, CO 80401, USA. E-mail: [email protected] 2 ISTerre, CNRS, UMR 5559, Universit´ e de Savoie, Equipe Volcan, Le Bourget du Lac, France 3 Laboratoire G´ eoSciences R´ eunion, Universit´ e de la R´ eunion, Institut de Physique du Globe de Paris, Sorbonne Paris-Cit´ e, CNRS UMR 7154, 15 rue Ren´ e Cassin, 97715 Saint-Denis cedex 9, La R´ eunion, Indian Ocean, France 4 Istituto Nazionale di Geofisica e Vulcanologia, Roma, Italy 5 Institut de Physique du Globe de Paris et Universit´ e Paris Diderot, Sorbonne Paris-Cit´ e, CNRS UMR 7154, Paris, France 6 Institute of Earth Sciences Jaume Almera, Consejo Superior de Investigaciones Cient´ ıficas, Spain 7 Observatorio Vulcanol´ ogico y Sismol ´ ogico de Costa Rica, Costa Rica 8 Ecole et Observatoire des Sciences de la Terre, Universit´ e de Strasbourg, France 9 Earth and Atmospheric Sciences Department, Purdue University, West Lafayette, IN, USA 10 Istituto Nazionale di Geofisica e Vulcanologia, Palermo, Italy 11 Ludwig Maximilians Universitaet, Munich, Germany 12 University of Bonn, Steinmann Institute, Geodynamics / Geophysics, Germany Accepted 2011 June 11. Received 2011 June 9; in original form 2011 February 9 SUMMARY To gain a better insight of the hydrogeology and the location of the main tectonic faults of Stromboli volcano in Italy, we collected electrical resistivity measurements, soil CO 2 concentrations, temperature and self-potential measurements along two profiles. These two profiles started at the village of Ginostra in the southwest part of the island. The first profile (4.8 km in length) ended up at the village of Scari in the north east part of the volcano and the second one (3.5 km in length) at Forgia Vecchia beach, in the eastern part of the island. These data were used to provide insights regarding the position of shallow aquifers and the extension of the hydrothermal system. This large-scale study is complemented by two high-resolution studies, one at the Pizzo area (near the active vents) and one at Rina Grande where flank collapse areas can be observed. The Pizzo corresponds to one of the main degassing structure of the hydrothermal system. The main degassing area is localized along a higher permeability area corresponding to the head of the gliding plane of the Rina Grande sector collapse. We found that the self-potential data reveal the position of an aquifer above the villages of Scari and San Vincenzo. We provide an estimate of the depth of this aquifer from these data. The lateral extension of the hydrothermal system (resistivity ∼15–60 ohm m) is broader than anticipated extending in the direction of the villages of Scari and San Vincenzo (in agreement with temperature data recorded in shallow wells). The lateral extension of the hydrothermal system reaches the lower third of the Rina Grande sector collapse area in the eastern part of the island. The hydrothermal body in this area is blocked by an old collapse boundary. This position of the hydrothermal body is consistent with low values of the magnetization (<2.5 A m −1 ) from previously published work. The presence of the hydrothermal body below Rina Grande raises questions about the mechanical stability of this flank of the edifice. Keywords: Tomography; Electrical properties; Hydrogeophysics; Volcano monitoring. 1 INTRODUCTION The localization of hydrothermal systems and aquifers in active volcanoes is a fundamental step in assessing several geological hazards like phreatic explosions, phreato-magmatic eruptions, and flank collapses (Petrinovic & Pi˜ nol 2006; Lorenz & Kurszlaukis 2007; Weinstein 2007). Phreatic explosions are bursts of confined pockets of steam and gas with no direct involvement of magma, C 2011 The Authors 1 Geophysical Journal International C 2011 RAS Geophysical Journal International
-
Upload
univ-reunion -
Category
Documents
-
view
0 -
download
0
Transcript of Hydrog eolog y of Stro mboli volcano, Aeolian Islands (Italy) from the inter pretation o f...
Geophys. J. Int. (2011) doi: 10.1111/j.1365-246X.2011.05112.x
GJI
Min
eral
phys
ics,
rheo
logy
,he
atflow
and
volc
anol
ogy
Hydrogeology of Stromboli volcano, Aeolian Islands (Italy)from the interpretation of resistivity tomograms, self-potential,soil temperature and soil CO2 concentration measurements
A. Revil,1,2 A. Finizola,3 T. Ricci,4 E. Delcher,3 A. Peltier,5 S. Barde-Cabusson,6
G. Avard,7 T. Bailly,8 L. Bennati,9 S. Byrdina,2 J. Colonge,8 F. Di Gangi,10 G. Douillet,11
M. Lupi,12 J. Letort8 and E. Tsang Hin Sun8
1Colorado School of Mines, Department of Geophysics, Golden, CO 80401, USA. E-mail: [email protected], CNRS, UMR 5559, Universite de Savoie, Equipe Volcan, Le Bourget du Lac, France3Laboratoire GeoSciences Reunion, Universite de la Reunion, Institut de Physique du Globe de Paris, Sorbonne Paris-Cite, CNRS UMR 7154, 15 rue ReneCassin, 97715 Saint-Denis cedex 9, La Reunion, Indian Ocean, France4Istituto Nazionale di Geofisica e Vulcanologia, Roma, Italy5Institut de Physique du Globe de Paris et Universite Paris Diderot, Sorbonne Paris-Cite, CNRS UMR 7154, Paris, France6Institute of Earth Sciences Jaume Almera, Consejo Superior de Investigaciones Cientıficas, Spain7Observatorio Vulcanologico y Sismologico de Costa Rica, Costa Rica8Ecole et Observatoire des Sciences de la Terre, Universite de Strasbourg, France9Earth and Atmospheric Sciences Department, Purdue University, West Lafayette, IN, USA10Istituto Nazionale di Geofisica e Vulcanologia, Palermo, Italy11Ludwig Maximilians Universitaet, Munich, Germany12University of Bonn, Steinmann Institute, Geodynamics / Geophysics, Germany
Accepted 2011 June 11. Received 2011 June 9; in original form 2011 February 9
S U M M A R YTo gain a better insight of the hydrogeology and the location of the main tectonic faultsof Stromboli volcano in Italy, we collected electrical resistivity measurements, soil CO2
concentrations, temperature and self-potential measurements along two profiles. These twoprofiles started at the village of Ginostra in the southwest part of the island. The first profile(4.8 km in length) ended up at the village of Scari in the north east part of the volcano and thesecond one (3.5 km in length) at Forgia Vecchia beach, in the eastern part of the island. Thesedata were used to provide insights regarding the position of shallow aquifers and the extensionof the hydrothermal system. This large-scale study is complemented by two high-resolutionstudies, one at the Pizzo area (near the active vents) and one at Rina Grande where flankcollapse areas can be observed. The Pizzo corresponds to one of the main degassing structureof the hydrothermal system. The main degassing area is localized along a higher permeabilityarea corresponding to the head of the gliding plane of the Rina Grande sector collapse. Wefound that the self-potential data reveal the position of an aquifer above the villages of Scariand San Vincenzo. We provide an estimate of the depth of this aquifer from these data. Thelateral extension of the hydrothermal system (resistivity ∼15–60 ohm m) is broader thananticipated extending in the direction of the villages of Scari and San Vincenzo (in agreementwith temperature data recorded in shallow wells). The lateral extension of the hydrothermalsystem reaches the lower third of the Rina Grande sector collapse area in the eastern partof the island. The hydrothermal body in this area is blocked by an old collapse boundary.This position of the hydrothermal body is consistent with low values of the magnetization(<2.5 A m−1) from previously published work. The presence of the hydrothermal body belowRina Grande raises questions about the mechanical stability of this flank of the edifice.
Keywords: Tomography; Electrical properties; Hydrogeophysics; Volcano monitoring.
1 I N T RO D U C T I O N
The localization of hydrothermal systems and aquifers in activevolcanoes is a fundamental step in assessing several geological
hazards like phreatic explosions, phreato-magmatic eruptions, andflank collapses (Petrinovic & Pinol 2006; Lorenz & Kurszlaukis2007; Weinstein 2007). Phreatic explosions are bursts of confinedpockets of steam and gas with no direct involvement of magma,
C© 2011 The Authors 1Geophysical Journal International C© 2011 RAS
Geophysical Journal International

2 A. Revil et al.
apart from the source of the steam and of the involvement or not ofjuvenile fluids (Barberi et al. 1993). Phreatomagmatic eruptions canoccur when water encounters a magmatic body (Barberi et al. 1992).Hydrothermal systems can also produce, by long-lived alteration,mechanically weakened rocks and be responsible for the collapseof the flanks of volcanic edifices (Lopez & Williams 1993; Aizawaet al. 2009). In the case of volcanic islands, such giant landslidescan in turn generate tsunamis. Stromboli is a prime example (Tintiet al. 1999, 2000, 2003, 2006, 2008; Tibaldi 2001; Bonaccorsoet al. 2003; Apuani et al. 2005; Romagnoli et al. 2009a, b). Thelocalization of aquifers is also important because water is a scarceresource in some volcanic areas and the supply of fresh water isincreasingly becoming a problem as the population and tourismincrease (Cruz & Franca 2006).
In hydrogeology, the presence of aquifers is usually detected bydrilling. An estimate of hydraulic conductivity can be obtained bypumping or slug tests and hydraulic tomography (Carrera et al.2005; Cardiff et al. 2009). However, drilling a set of boreholes involcanic formations can be very expensive and a difficult task dueto steep topography and the mechanical resistance of some volcanicrocks. Geophysical methods represent a non-intrusive approach tohandling this problem. Traditionally, electromagnetic methods (es-pecially the audiomagnetotelluric and time-domain electromagneticmethods) have been used to look for aquifers in active volcanoes(e.g. Fitterman et al. 1988; Krivochieva & Chouteau 2003; Aizawaet al. 2005; Aizawa et al. 2009). This is because electrical resistivityis sensitive to the water content of rocks. Unfortunately electricalresistivity is also known to be affected by the presence of clays andzeolites through their cation exchange capacity (Waxman & Smits1968; Revil et al. 2002; Coppo et al. 2008). Salinity of the porewater and temperature are two other parameters influencing the re-sistivity of porous rocks (Waxman & Smits 1968; Revil et al. 1998;Revil 1999). Therefore, electromagnetic methods cannot be usedas stand-alone methods to determine the presence of aquifers andthe extension of the hydrothermal system in volcanic areas. Alsoelectromagnetic methods have a limited spatial resolution, at leastwith the number of data currently obtained over volcanic areas andexisting algorithms.
In this paper, we show that the combination of self-potentialdata, large scale DC-resistivity tomography, and measurements ofsoil temperature and soil CO2 concentrations and fluxes can beused to assess the extent of the hydrothermal system and the pres-ence of aquifers at the scale of a volcanic edifice. The resistivitymeasurements were performed using an unusually long resistivitycable (16 wires, 2.5 km in length). Such a cable offers a strongadvantage regarding the acquisition time with respect to classicalacquisition measurements using two cables for dipole–dipole mea-surements with a generator and a voltmeter. Stromboli, an activevolcanic located in the Aeolian Archipelago in Italy, is a suitablenatural laboratory to test these methods because of the accessibilityof the volcano, its strong volcanic activity, and the relatively smalldimensions of its emerged part. We present new field results todetermine the extent of the hydrothermal system and the presenceof aquifers at the scale of this island using the combination of themethods mentioned above.
2 T E C T O N I C S E T T I N G A N DH I S T O R I C A L V O L C A N I C A C T I V I T Y
Stromboli is a stratovolcano corresponding to the northernmost is-land of the Aeolian volcanic arc in the Southern Tyrrhenian sea
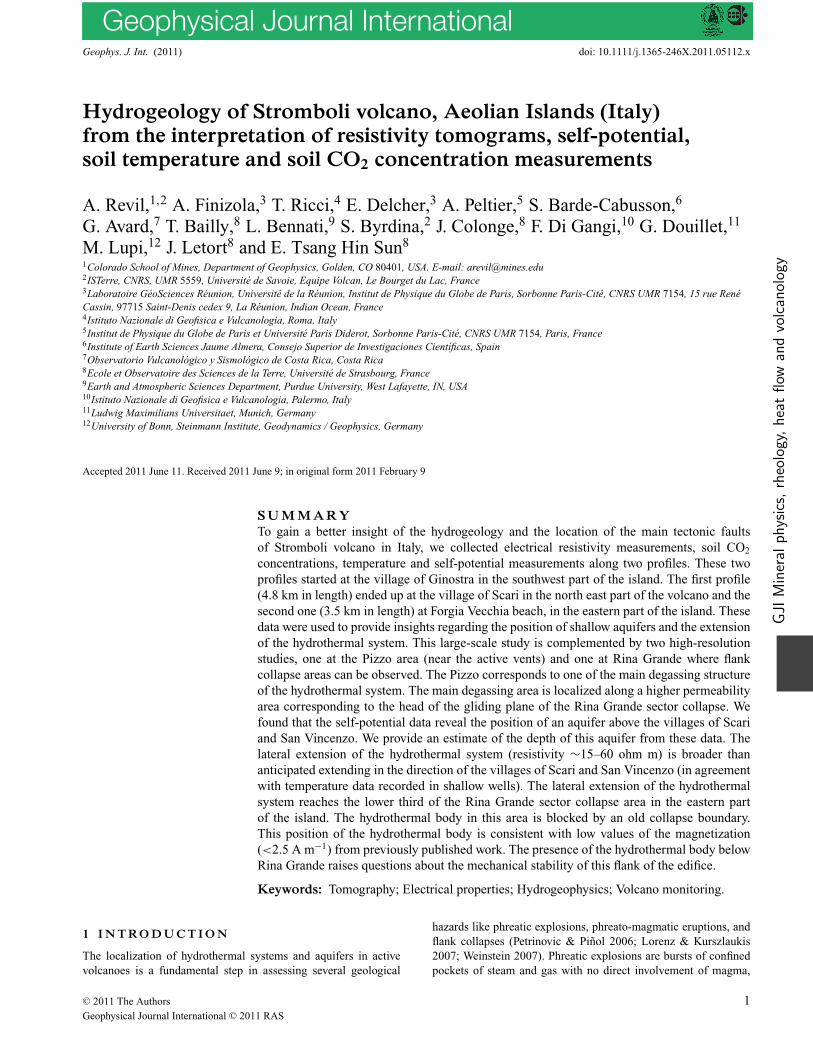
Figure 1. Geographical location of Stromboli Island. (a) The inset showsthe position of the Aeolian Archipelago in the Tyrrhenian Sea. (b) Close-upof the northern coast of Sicily showing the seven main islands (Alicudi,Filicudi, Salina, Lipari, Panarea, Stromboli and Vulcano) of the Aeolianarchipelago. (c) Picture of Stromboli island (by A. Finizola, taken in 1999)showing the Sciara del Fuoco collapse structure.
(Fig. 1). It rises from a depth of 2000 m below sea level (b.s.l.)to an elevation of 924 m a.s.l. (metres above sea level) (see Segre1968; Romagnoli et al. 2009a, b). It is one of the four active vol-canic islands (with Vulcano, Lipari and Panarea) of the Aeolianarchipelago, whose existence is related to the subduction of theAfrican plate under the Eurasian plate (Barberi et al. 1974). Geo-logical surveys (Rosi 1980; Francalanci 1987; Keller et al. 1993)showed that the subaerial part of the volcanic cone was built upduring the last 100 ka. The formation of the emerged part of theedifice can be divided into seven discrete eruptive phases separatedby erosional deposits and / or by collapses of calderas and flanks(Pasquare et al. 1993). Defining these phases will be important tointerpreting the geophysical data.
The first phase corresponds to PaleoStromboli I between ∼85and 64 ka ago. At the end of PaleoStromboli I, a large caldera de-pression formed at the top of the volcano. The boundary of thiscaldera is denoted as PST I in Fig. 2. The second phase corre-sponds to PaleoStromboli II ended with an erosional phase. Thethird phase corresponds to PaleoStromboli III during which a largesummit caldera developed ∼34 ka ago (see PST III in Fig. 2). Thefourth phase is related with Scari units ending with strong phreato-magmatic events and the formation of the large Scari caldera ∼26ka ago (Nappi et al. 1999; Gillot & Keller 1993). These two de-pressions PST III and Scari calderas were filled with lava flows oflower Vancori units which represent the fifth phase ended ∼ 13 kaago (Gillot 1984). The formation of NeoStromboli crater occurredabout 13 ka ago and constitutes the beginning of the sixth phase(Hornig-Kjarsgaard et al. 1993). Neo-Stromboli period is charac-terized by a large amount of lava flows, especially to the northwestof the edifice. Four onshore parasitic centers can be identified for theNeo-Stromboli period including (i) Timpone del Fuoco (North of
C© 2011 The Authors, GJI
Geophysical Journal International C© 2011 RAS
Hydrogeology of Stromboli volcano 3
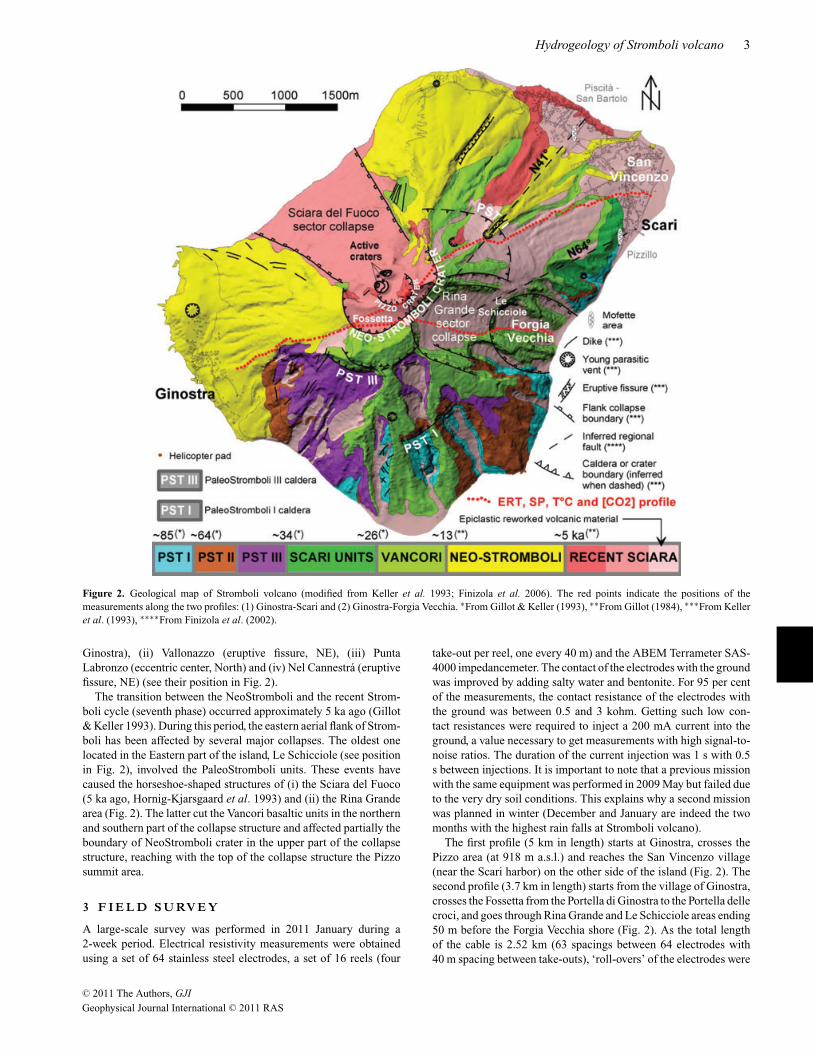
Figure 2. Geological map of Stromboli volcano (modified from Keller et al. 1993; Finizola et al. 2006). The red points indicate the positions of themeasurements along the two profiles: (1) Ginostra-Scari and (2) Ginostra-Forgia Vecchia. ∗From Gillot & Keller (1993), ∗∗From Gillot (1984), ∗∗∗From Kelleret al. (1993), ∗∗∗∗From Finizola et al. (2002).
Ginostra), (ii) Vallonazzo (eruptive fissure, NE), (iii) PuntaLabronzo (eccentric center, North) and (iv) Nel Cannestra (eruptivefissure, NE) (see their position in Fig. 2).
The transition between the NeoStromboli and the recent Strom-boli cycle (seventh phase) occurred approximately 5 ka ago (Gillot& Keller 1993). During this period, the eastern aerial flank of Strom-boli has been affected by several major collapses. The oldest onelocated in the Eastern part of the island, Le Schicciole (see positionin Fig. 2), involved the PaleoStromboli units. These events havecaused the horseshoe-shaped structures of (i) the Sciara del Fuoco(5 ka ago, Hornig-Kjarsgaard et al. 1993) and (ii) the Rina Grandearea (Fig. 2). The latter cut the Vancori basaltic units in the northernand southern part of the collapse structure and affected partially theboundary of NeoStromboli crater in the upper part of the collapsestructure, reaching with the top of the collapse structure the Pizzosummit area.
3 F I E L D S U RV E Y
A large-scale survey was performed in 2011 January during a2-week period. Electrical resistivity measurements were obtainedusing a set of 64 stainless steel electrodes, a set of 16 reels (four
take-out per reel, one every 40 m) and the ABEM Terrameter SAS-4000 impedancemeter. The contact of the electrodes with the groundwas improved by adding salty water and bentonite. For 95 per centof the measurements, the contact resistance of the electrodes withthe ground was between 0.5 and 3 kohm. Getting such low con-tact resistances were required to inject a 200 mA current into theground, a value necessary to get measurements with high signal-to-noise ratios. The duration of the current injection was 1 s with 0.5s between injections. It is important to note that a previous missionwith the same equipment was performed in 2009 May but failed dueto the very dry soil conditions. This explains why a second missionwas planned in winter (December and January are indeed the twomonths with the highest rain falls at Stromboli volcano).
The first profile (5 km in length) starts at Ginostra, crosses thePizzo area (at 918 m a.s.l.) and reaches the San Vincenzo village(near the Scari harbor) on the other side of the island (Fig. 2). Thesecond profile (3.7 km in length) starts from the village of Ginostra,crosses the Fossetta from the Portella di Ginostra to the Portella dellecroci, and goes through Rina Grande and Le Schicciole areas ending50 m before the Forgia Vecchia shore (Fig. 2). As the total lengthof the cable is 2.52 km (63 spacings between 64 electrodes with40 m spacing between take-outs), ‘roll-overs’ of the electrodes were
C© 2011 The Authors, GJI
Geophysical Journal International C© 2011 RAS
4 A. Revil et al.
required to realize the desired profile lengths. Profile 1 consisted oftwo roll-along of eight reels and Profile 2 consisted of one roll-alongof seven reels. The use of such a very long resistivity cable is notusual (see Gelis et al. 2010 for a discussion).
Acquisitions were performed with the Wenner array because ofits good signal-to-noise ratio. We tried the Wenner–Schlumbergerarray as well and the dipole-dipole array but the results were lesssatisfactory than with the Wenner array and a lower signal-to-noiseratio with these arrays were requiring a higher and prohibitive num-ber of stacks in the field (acquisition time >10 hr). This would haveimplied a longer duration for the acquisition despite the multichan-nel capability of the ABEM Terrameter SAS-4000 resistivimeter.Topographic information was included in the apparent resistivitydata files. The topography was obtained from a Digital ElevationMap (DEM, Marsella et al. 2009) with a precision of 0.5 m in el-evation and the X and Y coordinates were determined in the fieldusing a Garmin GPS with a precision of 3 m.
In addition to 2-D DC-resistivity tomography, we acquired self-potential, soil CO2 concentration and temperature measurements.These measurements were obtained with a spacing of 20 m alongthe two profiles.
Self-potential measurements were performed using a pair ofnon-polarizing Cu/CuSO4 electrodes. The difference of electricalpotential between the reference electrode (arbitrarily placed at thebeginning of the profiles in Ginostra) and the moving electrode wasmeasured with a high-impedance voltmeter with a sensitivity of 0.1mV and a cable of 300 m. The impedance of the ground was alwaysat least 300 times below the internal impedance of the voltmeter(∼60 Mohm, so <200 kohm), an important point in assessing thevalidity of the measurements. At each station, a small hole (∼10 cmdeep) was dug to improve the electrical contact between the elec-trode and the ground. The choice of the reference position for thewhole profile is arbitrary but taken near the sea in the present case.The sea is indeed considered to be a good electrical equipotentialbecause of the high conductivity of the sea water (see Corwin &Hoover 1979).
In the field, it is possible to measure the concentration of CO2 inthe soil or its flux from the soil. Etiope et al. (1999) demonstratedthat a linear relationship exists between ground concentrations andflux concentration values for concentrations in the range 0.1 to ∼12 per cent. For higher values, up to 100 per cent (like at Strom-boli), the correlation is however expected to be poor. On Strombolivolcano, the good correlation between CO2 concentration and CO2
flux were shown along the entire island (see Finizola et al. 2006)or in the summit (Fossa) area by the comparison between the CO2
anomalies evidenced through the flux measurement by Carapezza& Federico 2000, and the soil concentration technique by Finizolaet al. 2003). Along the two profiles, we decided to measure only theCO2 concentrations. To get reliable data of CO2 concentrations, thesoil gas was first sampled through a copper tube (2 mm in diameter).This copper tube was first inserted in the soil to a depth of 0.5 m.The gas was analysed directly in the field by infrared spectrometry(Edinburgh Instruments, model GasCheck). The analytical uncer-tainty was 5 per cent of the concentration value.
Temperature measurements at 30 cm depth were performed withthermal probes and a digital thermometer (Comark, model KM221).Readings were taken to a tenth of degree. Each temperature mea-surement was taken using the following procedure: (1) a small holewas dug to a depth of 30 ± 1 cm with a steel rod, 2 cm in diameter.(2) Then, we inserted a thermal probe into the hole at the depth of30 ± 1 cm by means of a wooden stick. (3) We compacted the soilaround the position of the probe. (4) Finally, a temperature read-
ing was taken after 10–15 min. This time was required in order toachieve thermal equilibrium.
In addition to the data acquired in 2011 January along the two pro-files crossing the island, we also used in this work the self-potential,soil temperature, CO2 concentration and CO2 flux measurementsperformed in 2006 May in the summit area of Pizzo. These datawere collected along eight parallel linear profiles, with spacing be-tween the measurement points along each profile of 2.5 m anddistance between the profiles of 20 m. Only the CO2 flux of thisdata set were already published before (Carapezza et al. 2009).
4 I N V E R S I O N O F T H E R E S I S T I V I T YDATA
For each acquisition, the data were inverted by means of the com-mercial package RES2DINV (Loke & Barker 1996) using a finite el-ement grid for the forward modelling of the voltage response to cur-rent injection. RES2DINV is based on a finite element (non-linear)forward operator used to compute the predicted electrostatic poten-tial distribution dp for a given resistivity model m : dp = K (m). Anestimated model can be retrieved from the data using the inverseoperator K −1 : me = K −1(d0) where me is the estimated resistivitymodel based on the observed electrostatic potential distribution d0.RES2DINV is based on a Gauss–Newton approach with a L2 normdata misfit function. For each acquired measurement, we performstacking to get a standard deviation better than 5 per cent with amaximum of 10 stacks (the duration of a typical acquisition was 3hr). Data quality is therefore included in the inversion process.
Resistivity tomograms are shown in Figs 3 and 4 at iteration #5for which a good convergence has been reached. Indeed, the rmserror is 16 per cent for the profile Ginostra-Scari and 15 per cent forthe profile Ginostra-Forgia Vecchia. The high rms values are due tothe noise in the acquired data but as long as this noise is randomlydistributed, the inversion is very robust to this noise (see discussionand numerical tests in Revil et al. 2008). The colour code used forthe resistivity tomograms is the standard code used in DC-resistivitytomography (blue for low resistivities and red for high resistivities).
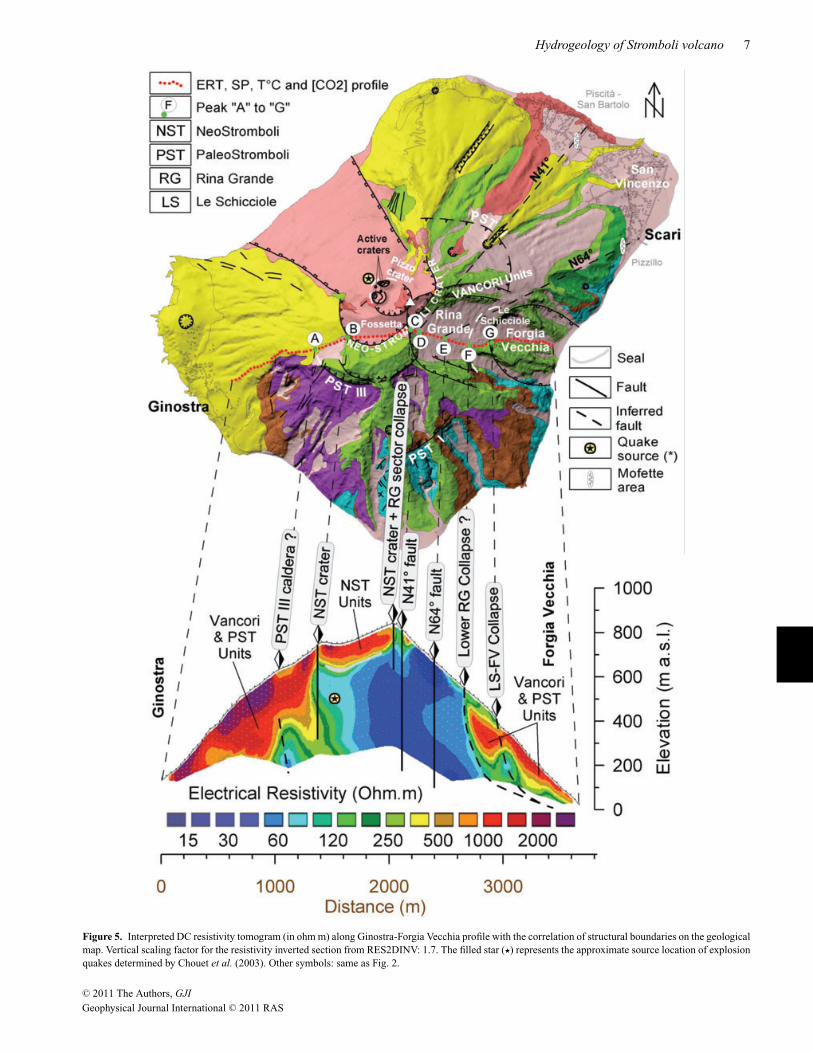
The inverted resistivities typically range from 15 to 2000–3000ohm m. At Stromboli, a resistivity of 15 ohm m is typical of thehydrothermal system (Revil et al. 2004b; Finizola et al. 2006) andvalues in the range 2000–3000 ohm m correspond to basaltic lavaflows (especially those associated with the Vancori or older Unitsdiscussed in Section 2 and shown in Fig. 2). The interpretation ofthese tomograms is provided in Figs 5 and 6. Overinterpretation ofresistivity tomograms is easy. To reduce the occurrence of pitfalls,the interpretation of these tomograms has been performed carefullyusing the geological map and the other available CO2, self-potential,and temperature measurements. Interpretation of these data is dis-cussed in detail in the next section.
5 I N T E R P R E TAT I O N O F T H E P RO F I L E S
5.1 Profile Ginostra-Scari and Pizzo area
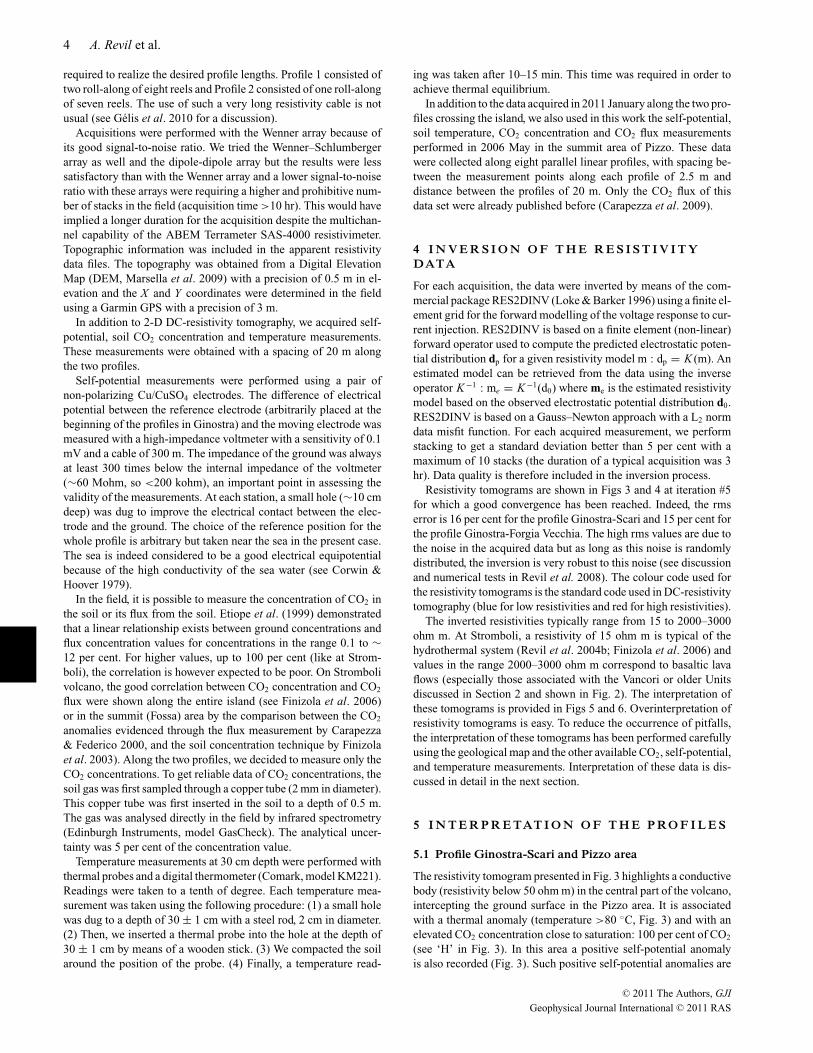
The resistivity tomogram presented in Fig. 3 highlights a conductivebody (resistivity below 50 ohm m) in the central part of the volcano,intercepting the ground surface in the Pizzo area. It is associatedwith a thermal anomaly (temperature >80 ◦C, Fig. 3) and with anelevated CO2 concentration close to saturation: 100 per cent of CO2
(see ‘H’ in Fig. 3). In this area a positive self-potential anomalyis also recorded (Fig. 3). Such positive self-potential anomalies are
C© 2011 The Authors, GJI
Geophysical Journal International C© 2011 RAS
Hydrogeology of Stromboli volcano 5
Figure 3. Temperature (◦C), self-potential (in mV), soil CO2 concentration (in ppm) measurements and DC resistivity tomogram from RES2DINV (in ohm m)along the profile Ginostra-Scari. Resistivity tomogram: vertical scaling factor 1.7, rms error 16 per cent at iteration 5 using a Gauss–Newton algorithm. Notethe asymmetry in both the self-potential profile and resistivity tomogram between the SW and NE sections; the extension of the hydrothermal system is welldelimited to the SW and opened to the NE. The positive self-potential anomalies at ∼2200 m along the profile are associated with a CO2 degassing structureand temperature anomaly. Note the two scales used for the temperature data in order to show the significant fluctuations (in the range 5–20 ◦C) outside the areacharacterized by the highest temperatures. A to L represents tectonic boundaries discussed in the main text.
C© 2011 The Authors, GJI
Geophysical Journal International C© 2011 RAS
6 A. Revil et al.
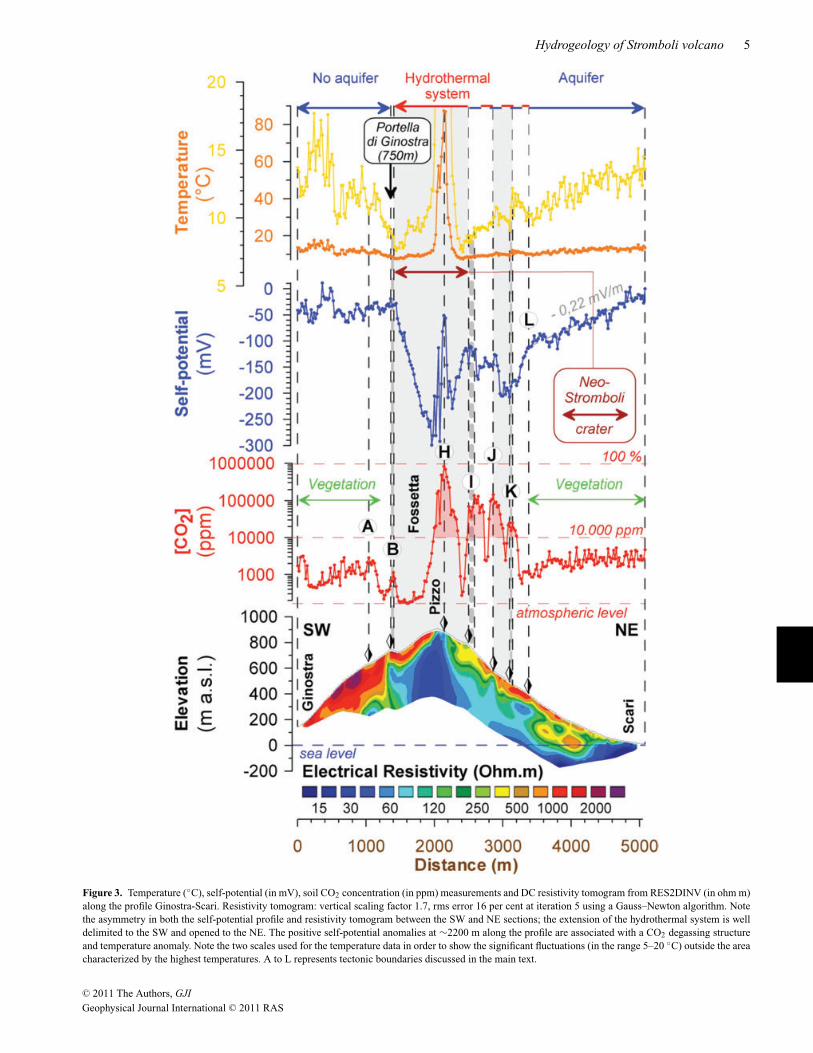
Figure 4. Temperature (◦C), self-potential (in mV), soil CO2 concentration (in ppm) measurements and DC resistivity tomogram from RES2DINV (in ohmm) along the profile Ginostra-Forgia Vecchia. Vertical scaling factor for the resistivity inverted section 1.7. RMS error 15 per cent at iteration 5 using aGauss–Newton algorithm. Note the asymmetry in both the self-potential profile and resistivity tomogram between the SW and E sections. Note that the positiveself-potential anomalies are associated with CO2 degassing structures. A to G represents tectonic boundaries discussed in the main text.
C© 2011 The Authors, GJI
Geophysical Journal International C© 2011 RAS
Hydrogeology of Stromboli volcano 7
Figure 5. Interpreted DC resistivity tomogram (in ohm m) along Ginostra-Forgia Vecchia profile with the correlation of structural boundaries on the geologicalmap. Vertical scaling factor for the resistivity inverted section from RES2DINV: 1.7. The filled star (�) represents the approximate source location of explosionquakes determined by Chouet et al. (2003). Other symbols: same as Fig. 2.
C© 2011 The Authors, GJI
Geophysical Journal International C© 2011 RAS

8 A. Revil et al.
Figure 6. Position of the measurement stations for the survey of temperature, CO2 soil concentration and self-potential measurements in the Pizzo area wheresome hydrothermal deposits are observed. The measurements are performed along eight profiles. The spacing between the measurement points along eachprofile is 2.5 m. The distance between the profiles is 20 m. Orthophoto and Digital Elevation Model (DEM) are courtesy of M. Marsella (Marsella et al. 2009).
usually associated with the upward flow of thermal fluids (Corwin &Hoover 1979; Richards et al. 2010) and possibly two-phase (liquidwater and steam) flow (Byrdina et al. 2009).
A high-resolution survey (temperature, CO2 concentration, CO2
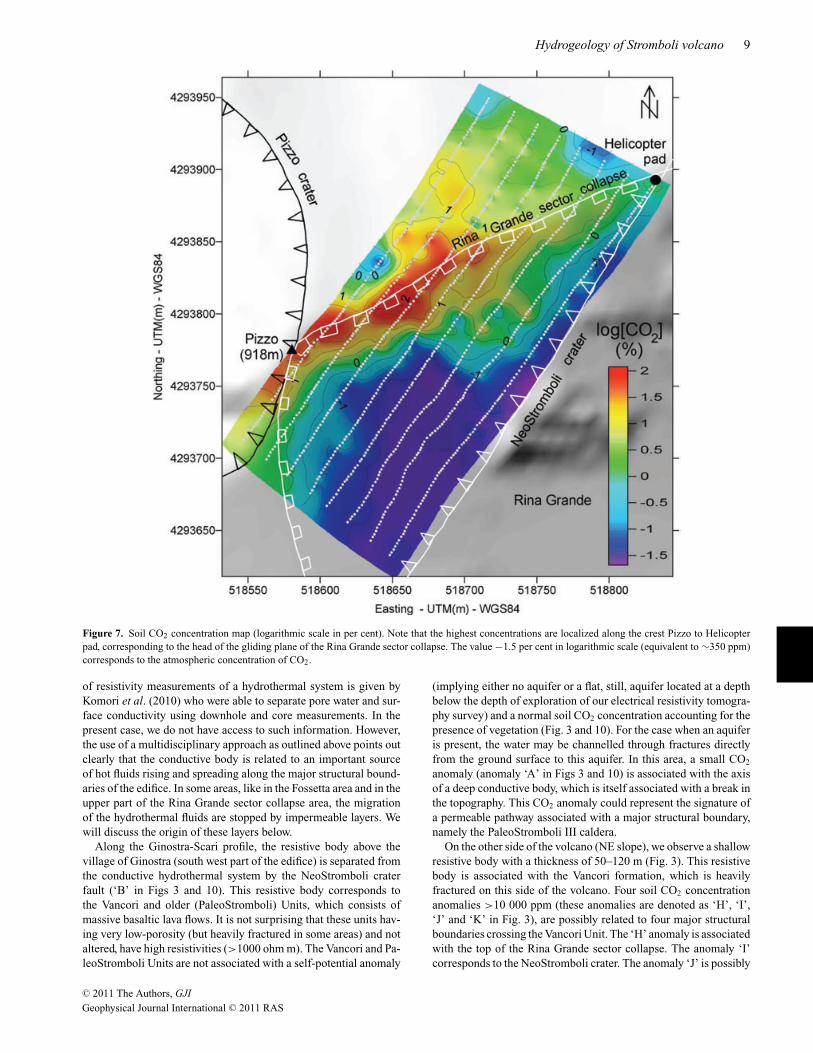
flux and self-potential measurements) of the Pizzo area is shown inFigs 6–9. Our data set shows that degassing and temperature anoma-lies are confined along a higher permeability pathway with an archedshape, localized between ‘Pizzo’ and ‘helicopter pad’, in the conti-nuity of the northern structural boundary of the Rina Grande sectorcollapse (Figs 2, 6–9). Moreover, despite the fact that temperaturemeasurements implies cold areas on both sides of the Rina Grandestructural boundary (Fig. 8), the CO2 degassing display a clear dif-ference between both sides of this structural boundary. Carapezzaet al. (2009) defined in this area five CO2 flux populations based onprobability plot technique (Sinclair 1974; see Fig. 9a). Inside thecollapse structure of Rina Grande, the population corresponding tothe lowest CO2 flux (<6 g m−2 d) is located in the same area ofthe CO2 concentration below atmospheric level (350 ppm, so be-low −1.5 in logarithmic scale, see dark blue colour area in Fig. 7).This means that some seals exist at depth. These seals may be in-fluenced by the gliding plane of Rina Grande sector collapse. This
importance of the Rina Grande sector collapse in driving hot hy-drothermal fluids toward the summit part of the volcano is shown inthe high-resolution survey (Figs 6–8). Note that the Ginostra-Scariprofile does not cross the Rina Grande structural boundary but justbrush against the head of this collapse structure. It is interestingto note that along the Ginostra-Scari profile, the maximum peak ofCO2 concentration (see position ‘H’ in Fig. 3) is not located on thePizzo crater boundary but clearly 40 m in the East direction alongthe boundary of Rina Grande sector collapse (see position ‘H’ inFig. 9). These characteristics regarding the location of the degassinganomalies imply that Rina Grande has a strong influence in bothsealing and driving the magmatic and hydrothermal fluids towardthe summit area (Pizzo area).
Considering the Ginostra-Scari profile, we interpret the centralconductive body shown in Fig. 3 as the main hydrothermal systemof the volcanic edifice. The low resistivity of the volcanic rocks canbe due to the alteration of these materials (resulting in clay mineralsand some zeolites with high surface conductivities, see Waxman &Smits 1968; Revil & Glover 1998; Revil & Leroy 2001), temper-ature, salinity, porosities or a combination of these factors (Revil1999; Revil et al. 2002). A very good example of the interpretation
C© 2011 The Authors, GJI
Geophysical Journal International C© 2011 RAS
Hydrogeology of Stromboli volcano 9
Figure 7. Soil CO2 concentration map (logarithmic scale in per cent). Note that the highest concentrations are localized along the crest Pizzo to Helicopterpad, corresponding to the head of the gliding plane of the Rina Grande sector collapse. The value −1.5 per cent in logarithmic scale (equivalent to ∼350 ppm)corresponds to the atmospheric concentration of CO2.
of resistivity measurements of a hydrothermal system is given byKomori et al. (2010) who were able to separate pore water and sur-face conductivity using downhole and core measurements. In thepresent case, we do not have access to such information. However,the use of a multidisciplinary approach as outlined above points outclearly that the conductive body is related to an important sourceof hot fluids rising and spreading along the major structural bound-aries of the edifice. In some areas, like in the Fossetta area and in theupper part of the Rina Grande sector collapse area, the migrationof the hydrothermal fluids are stopped by impermeable layers. Wewill discuss the origin of these layers below.
Along the Ginostra-Scari profile, the resistive body above thevillage of Ginostra (south west part of the edifice) is separated fromthe conductive hydrothermal system by the NeoStromboli craterfault (‘B’ in Figs 3 and 10). This resistive body corresponds tothe Vancori and older (PaleoStromboli) Units, which consists ofmassive basaltic lava flows. It is not surprising that these units hav-ing very low-porosity (but heavily fractured in some areas) and notaltered, have high resistivities (>1000 ohm m). The Vancori and Pa-leoStromboli Units are not associated with a self-potential anomaly
(implying either no aquifer or a flat, still, aquifer located at a depthbelow the depth of exploration of our electrical resistivity tomogra-phy survey) and a normal soil CO2 concentration accounting for thepresence of vegetation (Fig. 3 and 10). For the case when an aquiferis present, the water may be channelled through fractures directlyfrom the ground surface to this aquifer. In this area, a small CO2
anomaly (anomaly ‘A’ in Figs 3 and 10) is associated with the axisof a deep conductive body, which is itself associated with a break inthe topography. This CO2 anomaly could represent the signature ofa permeable pathway associated with a major structural boundary,namely the PaleoStromboli III caldera.
On the other side of the volcano (NE slope), we observe a shallowresistive body with a thickness of 50–120 m (Fig. 3). This resistivebody is associated with the Vancori formation, which is heavilyfractured on this side of the volcano. Four soil CO2 concentrationanomalies >10 000 ppm (these anomalies are denoted as ‘H’, ‘I’,‘J’ and ‘K’ in Fig. 3), are possibly related to four major structuralboundaries crossing the Vancori Unit. The ‘H’ anomaly is associatedwith the top of the Rina Grande sector collapse. The anomaly ‘I’corresponds to the NeoStromboli crater. The anomaly ‘J’ is possibly
C© 2011 The Authors, GJI
Geophysical Journal International C© 2011 RAS
10 A. Revil et al.
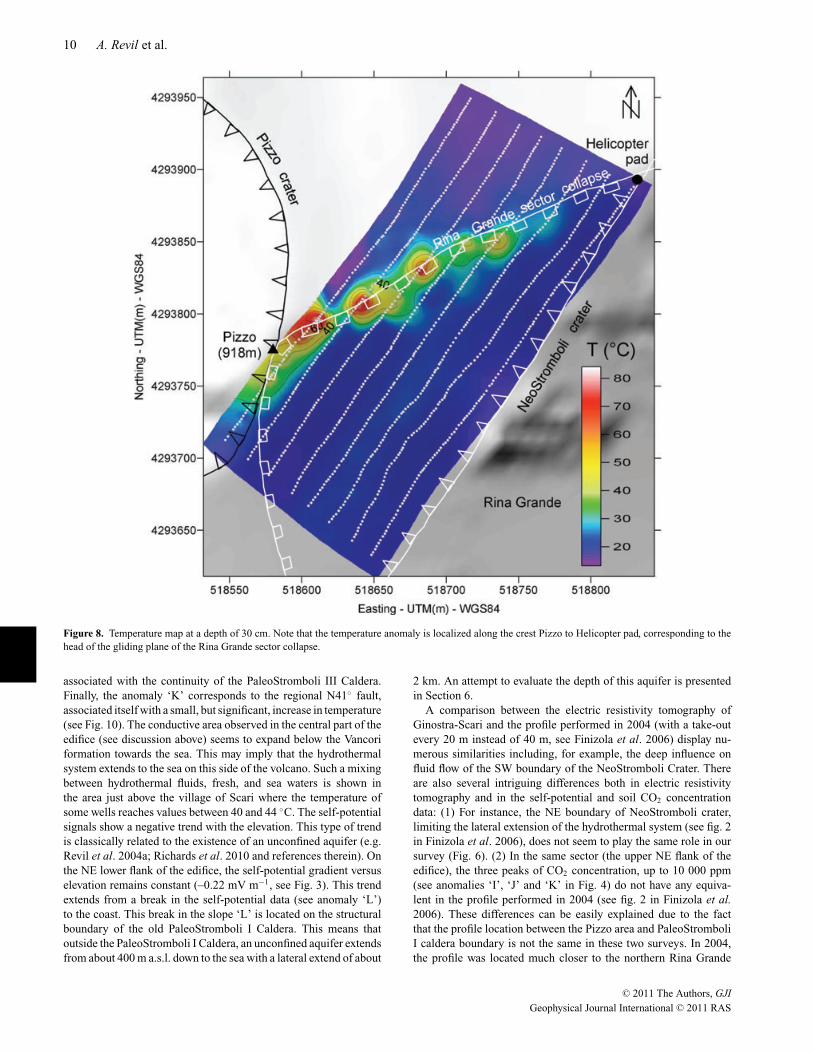
Figure 8. Temperature map at a depth of 30 cm. Note that the temperature anomaly is localized along the crest Pizzo to Helicopter pad, corresponding to thehead of the gliding plane of the Rina Grande sector collapse.
associated with the continuity of the PaleoStromboli III Caldera.Finally, the anomaly ‘K’ corresponds to the regional N41◦ fault,associated itself with a small, but significant, increase in temperature(see Fig. 10). The conductive area observed in the central part of theedifice (see discussion above) seems to expand below the Vancoriformation towards the sea. This may imply that the hydrothermalsystem extends to the sea on this side of the volcano. Such a mixingbetween hydrothermal fluids, fresh, and sea waters is shown inthe area just above the village of Scari where the temperature ofsome wells reaches values between 40 and 44 ◦C. The self-potentialsignals show a negative trend with the elevation. This type of trendis classically related to the existence of an unconfined aquifer (e.g.Revil et al. 2004a; Richards et al. 2010 and references therein). Onthe NE lower flank of the edifice, the self-potential gradient versuselevation remains constant (–0.22 mV m−1, see Fig. 3). This trendextends from a break in the self-potential data (see anomaly ‘L’)to the coast. This break in the slope ‘L’ is located on the structuralboundary of the old PaleoStromboli I Caldera. This means thatoutside the PaleoStromboli I Caldera, an unconfined aquifer extendsfrom about 400 m a.s.l. down to the sea with a lateral extend of about
2 km. An attempt to evaluate the depth of this aquifer is presentedin Section 6.
A comparison between the electric resistivity tomography ofGinostra-Scari and the profile performed in 2004 (with a take-outevery 20 m instead of 40 m, see Finizola et al. 2006) display nu-merous similarities including, for example, the deep influence onfluid flow of the SW boundary of the NeoStromboli Crater. Thereare also several intriguing differences both in electric resistivitytomography and in the self-potential and soil CO2 concentrationdata: (1) For instance, the NE boundary of NeoStromboli crater,limiting the lateral extension of the hydrothermal system (see fig. 2in Finizola et al. 2006), does not seem to play the same role in oursurvey (Fig. 6). (2) In the same sector (the upper NE flank of theedifice), the three peaks of CO2 concentration, up to 10 000 ppm(see anomalies ‘I’, ‘J’ and ‘K’ in Fig. 4) do not have any equiva-lent in the profile performed in 2004 (see fig. 2 in Finizola et al.2006). These differences can be easily explained due to the factthat the profile location between the Pizzo area and PaleoStromboliI caldera boundary is not the same in these two surveys. In 2004,the profile was located much closer to the northern Rina Grande
C© 2011 The Authors, GJI
Geophysical Journal International C© 2011 RAS
Hydrogeology of Stromboli volcano 11
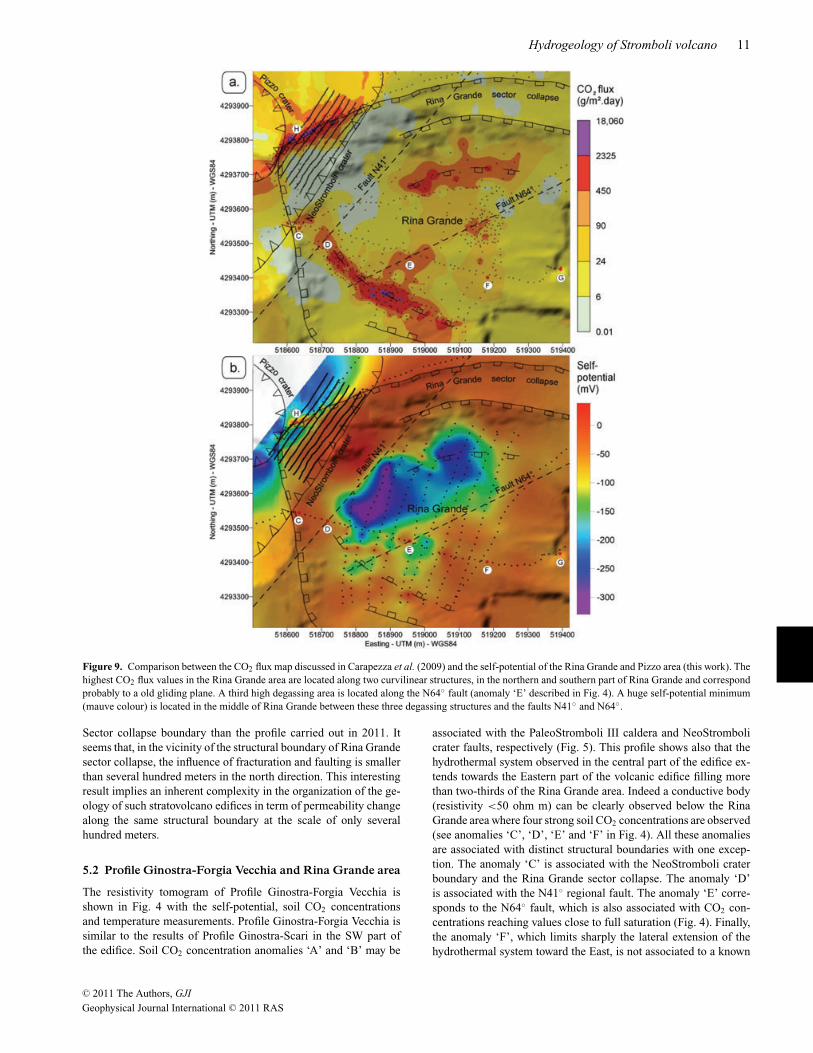
Figure 9. Comparison between the CO2 flux map discussed in Carapezza et al. (2009) and the self-potential of the Rina Grande and Pizzo area (this work). Thehighest CO2 flux values in the Rina Grande area are located along two curvilinear structures, in the northern and southern part of Rina Grande and correspondprobably to a old gliding plane. A third high degassing area is located along the N64◦ fault (anomaly ‘E’ described in Fig. 4). A huge self-potential minimum(mauve colour) is located in the middle of Rina Grande between these three degassing structures and the faults N41◦ and N64◦.
Sector collapse boundary than the profile carried out in 2011. Itseems that, in the vicinity of the structural boundary of Rina Grandesector collapse, the influence of fracturation and faulting is smallerthan several hundred meters in the north direction. This interestingresult implies an inherent complexity in the organization of the ge-ology of such stratovolcano edifices in term of permeability changealong the same structural boundary at the scale of only severalhundred meters.
5.2 Profile Ginostra-Forgia Vecchia and Rina Grande area
The resistivity tomogram of Profile Ginostra-Forgia Vecchia isshown in Fig. 4 with the self-potential, soil CO2 concentrationsand temperature measurements. Profile Ginostra-Forgia Vecchia issimilar to the results of Profile Ginostra-Scari in the SW part ofthe edifice. Soil CO2 concentration anomalies ‘A’ and ‘B’ may be
associated with the PaleoStromboli III caldera and NeoStrombolicrater faults, respectively (Fig. 5). This profile shows also that thehydrothermal system observed in the central part of the edifice ex-tends towards the Eastern part of the volcanic edifice filling morethan two-thirds of the Rina Grande area. Indeed a conductive body(resistivity <50 ohm m) can be clearly observed below the RinaGrande area where four strong soil CO2 concentrations are observed(see anomalies ‘C’, ‘D’, ‘E’ and ‘F’ in Fig. 4). All these anomaliesare associated with distinct structural boundaries with one excep-tion. The anomaly ‘C’ is associated with the NeoStromboli craterboundary and the Rina Grande sector collapse. The anomaly ‘D’is associated with the N41◦ regional fault. The anomaly ‘E’ corre-sponds to the N64◦ fault, which is also associated with CO2 con-centrations reaching values close to full saturation (Fig. 4). Finally,the anomaly ‘F’, which limits sharply the lateral extension of thehydrothermal system toward the East, is not associated to a known
C© 2011 The Authors, GJI
Geophysical Journal International C© 2011 RAS
12 A. Revil et al.
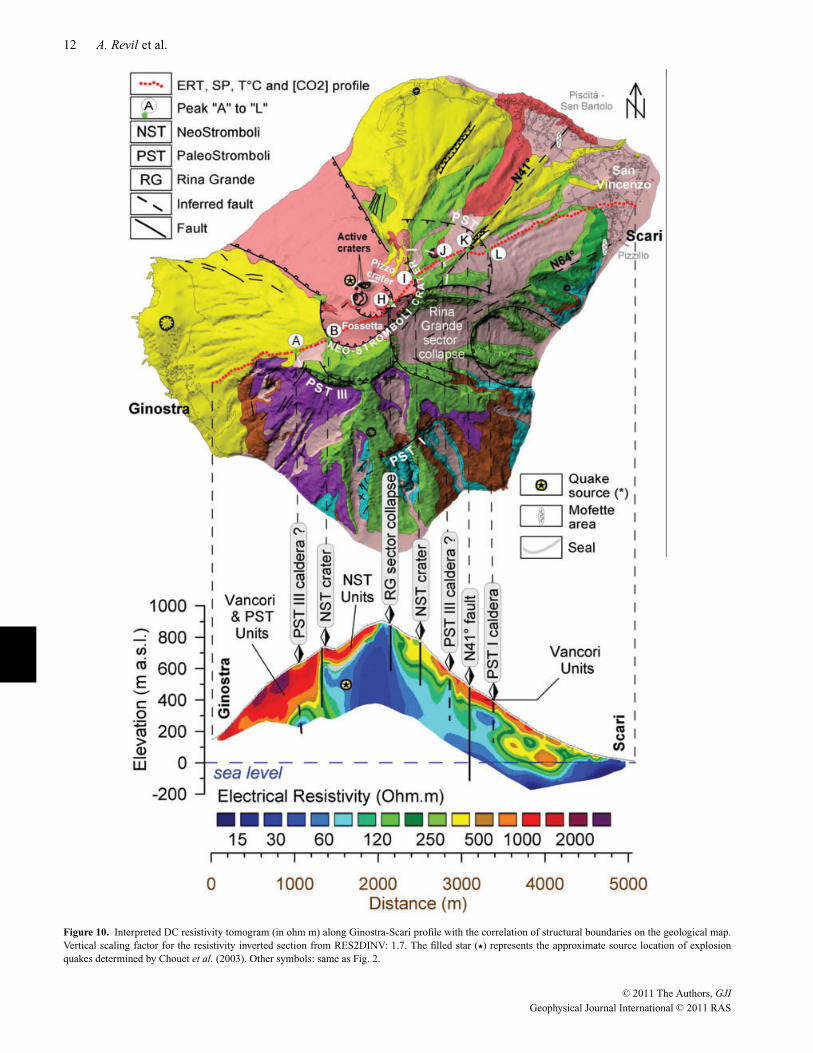
Figure 10. Interpreted DC resistivity tomogram (in ohm m) along Ginostra-Scari profile with the correlation of structural boundaries on the geological map.Vertical scaling factor for the resistivity inverted section from RES2DINV: 1.7. The filled star (�) represents the approximate source location of explosionquakes determined by Chouet et al. (2003). Other symbols: same as Fig. 2.
C© 2011 The Authors, GJI
Geophysical Journal International C© 2011 RAS
Hydrogeology of Stromboli volcano 13
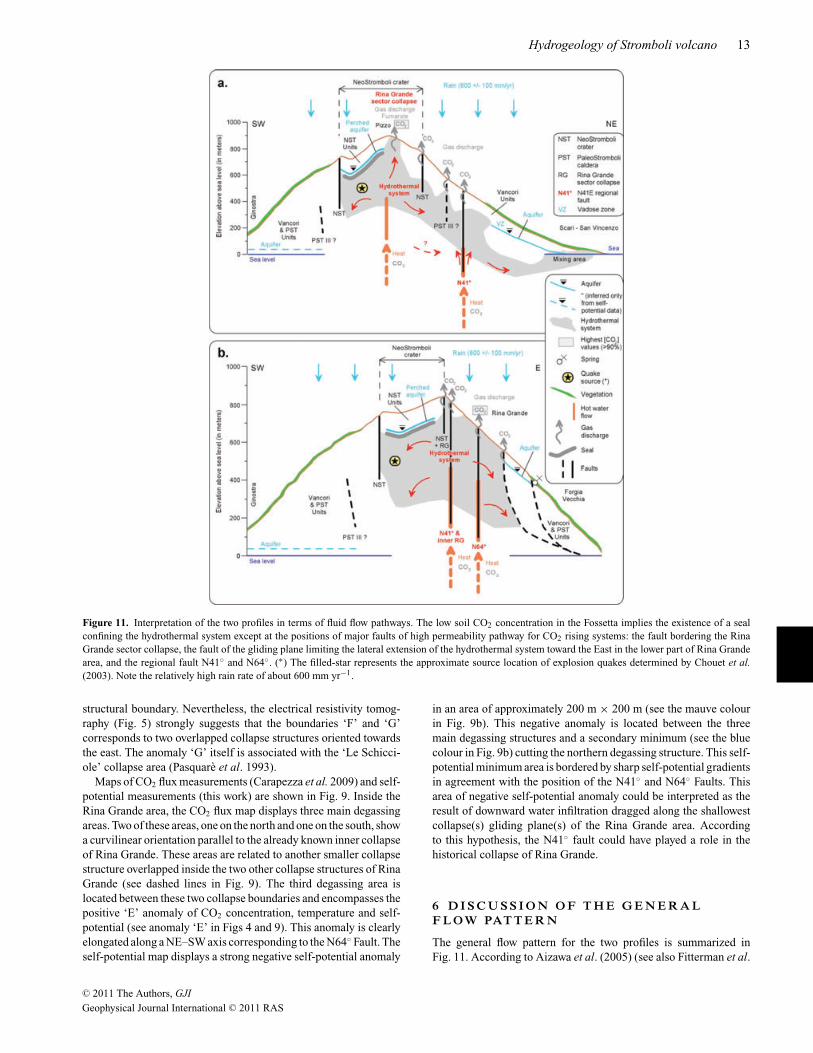
Figure 11. Interpretation of the two profiles in terms of fluid flow pathways. The low soil CO2 concentration in the Fossetta implies the existence of a sealconfining the hydrothermal system except at the positions of major faults of high permeability pathway for CO2 rising systems: the fault bordering the RinaGrande sector collapse, the fault of the gliding plane limiting the lateral extension of the hydrothermal system toward the East in the lower part of Rina Grandearea, and the regional fault N41◦ and N64◦. (∗) The filled-star represents the approximate source location of explosion quakes determined by Chouet et al.(2003). Note the relatively high rain rate of about 600 mm yr−1.
structural boundary. Nevertheless, the electrical resistivity tomog-raphy (Fig. 5) strongly suggests that the boundaries ‘F’ and ‘G’corresponds to two overlapped collapse structures oriented towardsthe east. The anomaly ‘G’ itself is associated with the ‘Le Schicci-ole’ collapse area (Pasquare et al. 1993).
Maps of CO2 flux measurements (Carapezza et al. 2009) and self-potential measurements (this work) are shown in Fig. 9. Inside theRina Grande area, the CO2 flux map displays three main degassingareas. Two of these areas, one on the north and one on the south, showa curvilinear orientation parallel to the already known inner collapseof Rina Grande. These areas are related to another smaller collapsestructure overlapped inside the two other collapse structures of RinaGrande (see dashed lines in Fig. 9). The third degassing area islocated between these two collapse boundaries and encompasses thepositive ‘E’ anomaly of CO2 concentration, temperature and self-potential (see anomaly ‘E’ in Figs 4 and 9). This anomaly is clearlyelongated along a NE–SW axis corresponding to the N64◦ Fault. Theself-potential map displays a strong negative self-potential anomaly
in an area of approximately 200 m × 200 m (see the mauve colourin Fig. 9b). This negative anomaly is located between the threemain degassing structures and a secondary minimum (see the bluecolour in Fig. 9b) cutting the northern degassing structure. This self-potential minimum area is bordered by sharp self-potential gradientsin agreement with the position of the N41◦ and N64◦ Faults. Thisarea of negative self-potential anomaly could be interpreted as theresult of downward water infiltration dragged along the shallowestcollapse(s) gliding plane(s) of the Rina Grande area. Accordingto this hypothesis, the N41◦ fault could have played a role in thehistorical collapse of Rina Grande.
6 D I S C U S S I O N O F T H E G E N E R A LF L OW PAT T E R N
The general flow pattern for the two profiles is summarized inFig. 11. According to Aizawa et al. (2005) (see also Fitterman et al.
C© 2011 The Authors, GJI
Geophysical Journal International C© 2011 RAS
14 A. Revil et al.
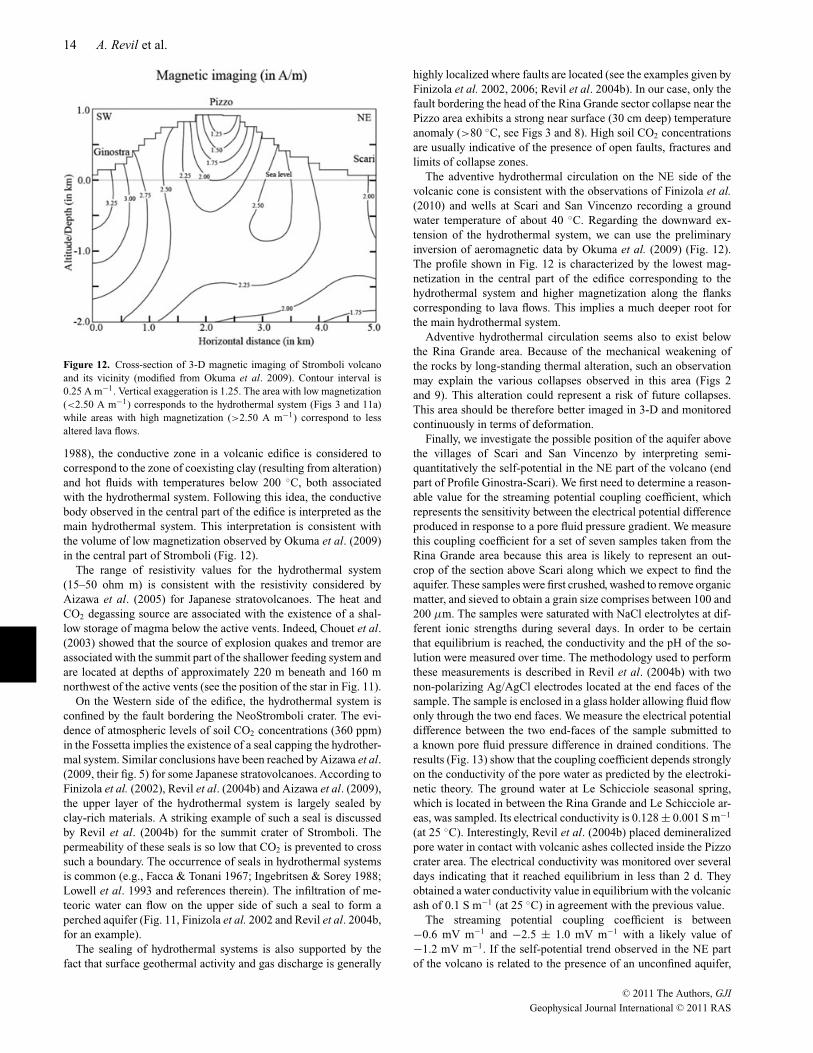
Figure 12. Cross-section of 3-D magnetic imaging of Stromboli volcanoand its vicinity (modified from Okuma et al. 2009). Contour interval is0.25 A m−1. Vertical exaggeration is 1.25. The area with low magnetization(<2.50 A m−1) corresponds to the hydrothermal system (Figs 3 and 11a)while areas with high magnetization (>2.50 A m−1) correspond to lessaltered lava flows.
1988), the conductive zone in a volcanic edifice is considered tocorrespond to the zone of coexisting clay (resulting from alteration)and hot fluids with temperatures below 200 ◦C, both associatedwith the hydrothermal system. Following this idea, the conductivebody observed in the central part of the edifice is interpreted as themain hydrothermal system. This interpretation is consistent withthe volume of low magnetization observed by Okuma et al. (2009)in the central part of Stromboli (Fig. 12).
The range of resistivity values for the hydrothermal system(15–50 ohm m) is consistent with the resistivity considered byAizawa et al. (2005) for Japanese stratovolcanoes. The heat andCO2 degassing source are associated with the existence of a shal-low storage of magma below the active vents. Indeed, Chouet et al.(2003) showed that the source of explosion quakes and tremor areassociated with the summit part of the shallower feeding system andare located at depths of approximately 220 m beneath and 160 mnorthwest of the active vents (see the position of the star in Fig. 11).
On the Western side of the edifice, the hydrothermal system isconfined by the fault bordering the NeoStromboli crater. The evi-dence of atmospheric levels of soil CO2 concentrations (360 ppm)in the Fossetta implies the existence of a seal capping the hydrother-mal system. Similar conclusions have been reached by Aizawa et al.(2009, their fig. 5) for some Japanese stratovolcanoes. According toFinizola et al. (2002), Revil et al. (2004b) and Aizawa et al. (2009),the upper layer of the hydrothermal system is largely sealed byclay-rich materials. A striking example of such a seal is discussedby Revil et al. (2004b) for the summit crater of Stromboli. Thepermeability of these seals is so low that CO2 is prevented to crosssuch a boundary. The occurrence of seals in hydrothermal systemsis common (e.g., Facca & Tonani 1967; Ingebritsen & Sorey 1988;Lowell et al. 1993 and references therein). The infiltration of me-teoric water can flow on the upper side of such a seal to form aperched aquifer (Fig. 11, Finizola et al. 2002 and Revil et al. 2004b,for an example).
The sealing of hydrothermal systems is also supported by thefact that surface geothermal activity and gas discharge is generally
highly localized where faults are located (see the examples given byFinizola et al. 2002, 2006; Revil et al. 2004b). In our case, only thefault bordering the head of the Rina Grande sector collapse near thePizzo area exhibits a strong near surface (30 cm deep) temperatureanomaly (>80 ◦C, see Figs 3 and 8). High soil CO2 concentrationsare usually indicative of the presence of open faults, fractures andlimits of collapse zones.
The adventive hydrothermal circulation on the NE side of thevolcanic cone is consistent with the observations of Finizola et al.(2010) and wells at Scari and San Vincenzo recording a groundwater temperature of about 40 ◦C. Regarding the downward ex-tension of the hydrothermal system, we can use the preliminaryinversion of aeromagnetic data by Okuma et al. (2009) (Fig. 12).The profile shown in Fig. 12 is characterized by the lowest mag-netization in the central part of the edifice corresponding to thehydrothermal system and higher magnetization along the flankscorresponding to lava flows. This implies a much deeper root forthe main hydrothermal system.
Adventive hydrothermal circulation seems also to exist belowthe Rina Grande area. Because of the mechanical weakening ofthe rocks by long-standing thermal alteration, such an observationmay explain the various collapses observed in this area (Figs 2and 9). This alteration could represent a risk of future collapses.This area should be therefore better imaged in 3-D and monitoredcontinuously in terms of deformation.
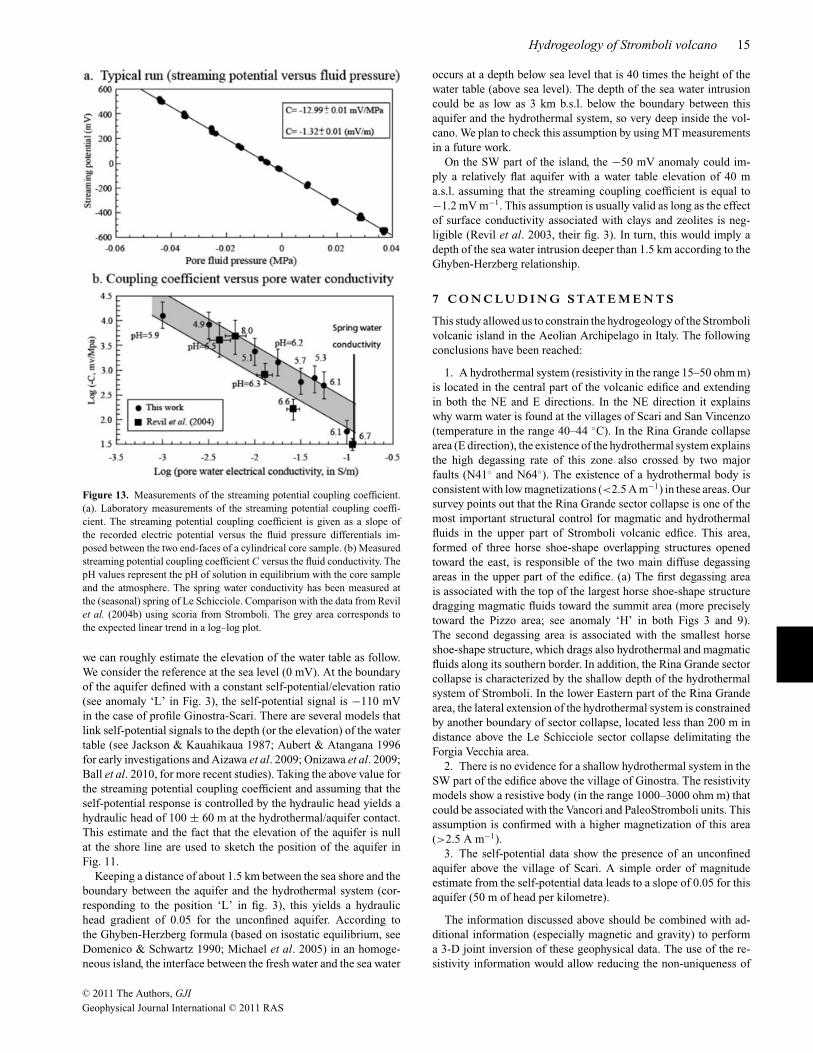
Finally, we investigate the possible position of the aquifer abovethe villages of Scari and San Vincenzo by interpreting semi-quantitatively the self-potential in the NE part of the volcano (endpart of Profile Ginostra-Scari). We first need to determine a reason-able value for the streaming potential coupling coefficient, whichrepresents the sensitivity between the electrical potential differenceproduced in response to a pore fluid pressure gradient. We measurethis coupling coefficient for a set of seven samples taken from theRina Grande area because this area is likely to represent an out-crop of the section above Scari along which we expect to find theaquifer. These samples were first crushed, washed to remove organicmatter, and sieved to obtain a grain size comprises between 100 and200 μm. The samples were saturated with NaCl electrolytes at dif-ferent ionic strengths during several days. In order to be certainthat equilibrium is reached, the conductivity and the pH of the so-lution were measured over time. The methodology used to performthese measurements is described in Revil et al. (2004b) with twonon-polarizing Ag/AgCl electrodes located at the end faces of thesample. The sample is enclosed in a glass holder allowing fluid flowonly through the two end faces. We measure the electrical potentialdifference between the two end-faces of the sample submitted toa known pore fluid pressure difference in drained conditions. Theresults (Fig. 13) show that the coupling coefficient depends stronglyon the conductivity of the pore water as predicted by the electroki-netic theory. The ground water at Le Schicciole seasonal spring,which is located in between the Rina Grande and Le Schicciole ar-eas, was sampled. Its electrical conductivity is 0.128 ± 0.001 S m−1
(at 25 ◦C). Interestingly, Revil et al. (2004b) placed demineralizedpore water in contact with volcanic ashes collected inside the Pizzocrater area. The electrical conductivity was monitored over severaldays indicating that it reached equilibrium in less than 2 d. Theyobtained a water conductivity value in equilibrium with the volcanicash of 0.1 S m−1 (at 25 ◦C) in agreement with the previous value.
The streaming potential coupling coefficient is between−0.6 mV m−1 and −2.5 ± 1.0 mV m−1 with a likely value of−1.2 mV m−1. If the self-potential trend observed in the NE partof the volcano is related to the presence of an unconfined aquifer,
C© 2011 The Authors, GJI
Geophysical Journal International C© 2011 RAS
Hydrogeology of Stromboli volcano 15
Figure 13. Measurements of the streaming potential coupling coefficient.(a). Laboratory measurements of the streaming potential coupling coeffi-cient. The streaming potential coupling coefficient is given as a slope ofthe recorded electric potential versus the fluid pressure differentials im-posed between the two end-faces of a cylindrical core sample. (b) Measuredstreaming potential coupling coefficient C versus the fluid conductivity. ThepH values represent the pH of solution in equilibrium with the core sampleand the atmosphere. The spring water conductivity has been measured atthe (seasonal) spring of Le Schicciole. Comparison with the data from Revilet al. (2004b) using scoria from Stromboli. The grey area corresponds tothe expected linear trend in a log–log plot.
we can roughly estimate the elevation of the water table as follow.We consider the reference at the sea level (0 mV). At the boundaryof the aquifer defined with a constant self-potential/elevation ratio(see anomaly ‘L’ in Fig. 3), the self-potential signal is −110 mVin the case of profile Ginostra-Scari. There are several models thatlink self-potential signals to the depth (or the elevation) of the watertable (see Jackson & Kauahikaua 1987; Aubert & Atangana 1996for early investigations and Aizawa et al. 2009; Onizawa et al. 2009;Ball et al. 2010, for more recent studies). Taking the above value forthe streaming potential coupling coefficient and assuming that theself-potential response is controlled by the hydraulic head yields ahydraulic head of 100 ± 60 m at the hydrothermal/aquifer contact.This estimate and the fact that the elevation of the aquifer is nullat the shore line are used to sketch the position of the aquifer inFig. 11.
Keeping a distance of about 1.5 km between the sea shore and theboundary between the aquifer and the hydrothermal system (cor-responding to the position ‘L’ in fig. 3), this yields a hydraulichead gradient of 0.05 for the unconfined aquifer. According tothe Ghyben-Herzberg formula (based on isostatic equilibrium, seeDomenico & Schwartz 1990; Michael et al. 2005) in an homoge-neous island, the interface between the fresh water and the sea water
occurs at a depth below sea level that is 40 times the height of thewater table (above sea level). The depth of the sea water intrusioncould be as low as 3 km b.s.l. below the boundary between thisaquifer and the hydrothermal system, so very deep inside the vol-cano. We plan to check this assumption by using MT measurementsin a future work.
On the SW part of the island, the −50 mV anomaly could im-ply a relatively flat aquifer with a water table elevation of 40 ma.s.l. assuming that the streaming coupling coefficient is equal to−1.2 mV m−1. This assumption is usually valid as long as the effectof surface conductivity associated with clays and zeolites is neg-ligible (Revil et al. 2003, their fig. 3). In turn, this would imply adepth of the sea water intrusion deeper than 1.5 km according to theGhyben-Herzberg relationship.
7 C O N C LU D I N G S TAT E M E N T S
This study allowed us to constrain the hydrogeology of the Strombolivolcanic island in the Aeolian Archipelago in Italy. The followingconclusions have been reached:
1. A hydrothermal system (resistivity in the range 15–50 ohm m)is located in the central part of the volcanic edifice and extendingin both the NE and E directions. In the NE direction it explainswhy warm water is found at the villages of Scari and San Vincenzo(temperature in the range 40–44 ◦C). In the Rina Grande collapsearea (E direction), the existence of the hydrothermal system explainsthe high degassing rate of this zone also crossed by two majorfaults (N41◦ and N64◦). The existence of a hydrothermal body isconsistent with low magnetizations (<2.5 A m−1) in these areas. Oursurvey points out that the Rina Grande sector collapse is one of themost important structural control for magmatic and hydrothermalfluids in the upper part of Stromboli volcanic edfice. This area,formed of three horse shoe-shape overlapping structures openedtoward the east, is responsible of the two main diffuse degassingareas in the upper part of the edifice. (a) The first degassing areais associated with the top of the largest horse shoe-shape structuredragging magmatic fluids toward the summit area (more preciselytoward the Pizzo area; see anomaly ‘H’ in both Figs 3 and 9).The second degassing area is associated with the smallest horseshoe-shape structure, which drags also hydrothermal and magmaticfluids along its southern border. In addition, the Rina Grande sectorcollapse is characterized by the shallow depth of the hydrothermalsystem of Stromboli. In the lower Eastern part of the Rina Grandearea, the lateral extension of the hydrothermal system is constrainedby another boundary of sector collapse, located less than 200 m indistance above the Le Schicciole sector collapse delimitating theForgia Vecchia area.
2. There is no evidence for a shallow hydrothermal system in theSW part of the edifice above the village of Ginostra. The resistivitymodels show a resistive body (in the range 1000–3000 ohm m) thatcould be associated with the Vancori and PaleoStromboli units. Thisassumption is confirmed with a higher magnetization of this area(>2.5 A m−1).
3. The self-potential data show the presence of an unconfinedaquifer above the village of Scari. A simple order of magnitudeestimate from the self-potential data leads to a slope of 0.05 for thisaquifer (50 m of head per kilometre).
The information discussed above should be combined with ad-ditional information (especially magnetic and gravity) to performa 3-D joint inversion of these geophysical data. The use of the re-sistivity information would allow reducing the non-uniqueness of
C© 2011 The Authors, GJI
Geophysical Journal International C© 2011 RAS
16 A. Revil et al.
the inverse problem in inverting the magnetic data alone. 3-D re-sistivity tomography of Vulcano has been performed recently byRevil et al. (2010). Such type of work could be performed at Strom-boli as well. Numerical models simulating volcanic hydrothermalsystems (see Ingebritsen et al. 2010) require accurate and detailedgeophysical investigations. We envision that our study can be thebasis for such a work integrating geological, geophysical, and hy-drogeological information in an accurate numerical investigation ofthe hydrothermal system of Stromboli. Such modelling could beuseful to monitor this volcano.
A C K N OW L E D G M E N T S
The INSU-CNRS, the Laboratoire GeoSciences Reunion-IPGP, theIstituto Nazionale di Geofisica e Vulcanologia (INGV) and the DOE(Energy Efficiency and Renewable Energy, Geothermal Technolo-gies Program, award DE-FG36–08GO018195) are thanked for fund-ing. We thank the personnel of the National Civil Protection andMario Zaia (Zaza) for their continuous support during the fieldsurvey. This is the IPGP contribution number 3148. We thank Jean-Francois Lenat for the use of the resistivity equipment (co-funded bythe Laboratoire GeoSciences Reunion of Reunion Island, the Lab-oratoire Magmas et Volcans of Clermont-Ferrand, and the INSU-CNRS), Gladys Le Masson, Casi Lock, Xavier Rassion, BarbaraSuski, Agnes Crespy and Nicole Wolyniec for their help duringthe 2011 January field campaign for the two geoelectrical pro-files crossing the island. Emilie Roulleau and Julie Morin are alsothanks for their help in 2006 May for the fieldwork performed inthe summit area of Pizzo. AF thanks Laurent Michon for fruitfuldiscussions. We thank the Editor, Joachim Wassermann, TheodoreH. Asch and one anonymous referee for the constructive reviews ofour manuscript.
R E F E R E N C E S
Aizawa, K. et al. 2005. Hydrothermal system beneath Mt. Fuji volcanoinferred from magnetotellurics and electric self-potential, Earth planet.Sci. Lett., 235, 343–355, doi:10.1016/j.epsl.2005.03.023.
Aizawa, K., Ogawa, Y. & Ishido, T., 2009. Groundwater flow and hydrother-mal systems within volcanic edifices: delineation by electric self-potentialand magnetotellurics, J. geophys. Res., 114, B01208, doi:10.1029/2008JB005910.
Apuani T., Corazzato C., Cancelli A. & Tibaldi A., 2005. Stability of acollapsing volcano (Stromboli, Italy): limit equilibrium analysis and nu-merical modeling, J. Volc. Geotherm. Res., 144, 191–210, doi:10.1016/j.jvolgeores.2004.11.028.
Aubert, M. & Yene Atangana, Q., 1996. Self-potential method in hydroge-ological exploration of volcanic areas, Ground Water, 34(6), 1010–1016.
Ball L., Ge, S., Caine, J.S., Revil, A. & Jardani, A., 2010. Constrainingfault-zone hydrogeology through integrated hydrological and geoelec-trical analysis, Hydrogeol. J., 1057–1067, 18, doi:10.1007/s10040–010-0587-z.
Barberi, F., Civetta, L., Gasparini, P., Innocenti, F., Scandone, R. & Villari,L., 1974. Evolution of a section of the Africa-Europe plate boundary;paleomagnetic and volcanological evidence from Sicily, Earth planet.Sci. Lett., 22(2), 123–132.
Barberi, F., Bertagnini, A., Landi, P. & Principe, C., 1992. A review onphreatic eruptions and their precursors, J. Volc. Geotherm. Res., 52,231–246, doi:10.1016/0377–0273(92)90046-G.
Barberi, F., Rosi, M. & Sodi, A., 1993. Volcanic hazard assessment atStromboli based on review of historical data, Acta Vulcanol., 3, 173–187.
Bonaccorso, A., Calvari, S., Garfı, G., Lodato, L. & Patane, D., 2003. Dy-namics of the December 2002 flank failure and tsunami at Stromboli
volcano inferred by volcanological and geophysical observations, Geo-phys. Res. Lett., 30(18), 1941, doi:10.1029/2003GL017702.
Byrdina, S. et al. 2009. Dipolar self-potential anomaly associated with car-bon dioxide and radon flux at Syabru-Bensi hot springs in central Nepal,J. geophys. Res., 114, B10101, doi:10.1029/2008JB006154.
Carapezza, M.L. & Federico C., 2000. The contribution of fluid geochem-istry to the volcano monitoring of Stromboli, J. Volc. Geotherm. Res., 95,227–245.
Carapezza, M.L., Ricci, T., Ranaldi, M. & Tarchini, L., 2009. Active de-gassing structures of Stromboli and variations in diffuse CO2 outputrelated to the volcanic activity, J. Volc. Geotherm. Res., 182, 231–245.
Cardiff, M., Barrash, W., Kitanidis, P.K., Malama, B., Revil, A., Straface, S.& Rizzo, E., 2009. A potential-based inversion of unconfined steady-statehydraulic tomography, Ground Water, 47(2), 259–270.
Carrera, J., Alcolea, A., Medina, A., Hidalgo, J. & Slooten, L.J., 2005.Inverse problem in hydrogeology, Hydrogeol. J., 13(1),206–222.
Chouet, B. et al., 2003. Source mechanisms of explosions at StromboliVolcano, Italy, determined from moment–tensor inversions of very-long-period data. J. geophys. Res., 108(B1), 2019. doi:10.1029/2002JB001919.
Coppo, N. et al., 2008. Multiple caldera collapses inferred from the shal-low electrical resistivity signature of the Las Canadas caldera, Tenerife,Canary Islands, J. Volc. Geotherm. Res, 170(3–4), 153–166.
Corwin, R.F. & Hoover, D.B., 1979. The Self-Potential method in geothermalexploration, Geophysics, 44, 226–245.
Cruz, J.V. & Franca, Z., 2006. Hydrogeochemistry of thermal and mineralwater springs of the Azores archipelago (Portugal), J. Volc. Geoth. Res.,151 (4), 382–398.
Domenico, P.A. & Schwartz, F.W., 1990. Physical and Chemical Hydroge-ology, 2nd edn, John Wiley and Sons, New York, NY, 824pp.
Etiope, G., Beneduce, P., Calcara, M., Favali, P., Frugoni, F., Schiattarella,M. & Smriglio, G., 1999. Structural pattern and CO2-CH4 degassing ofUstica island, Southern Tyrrhenian basin, J. Volc. Geotherm. Res., 88,291–304.
Facca, G. & Tonani F., 1967. The self-sealing geothermal field, Bull. Vol-canol., 30, 271–273, doi:10.1007/BF02597674.
Finizola, A., Sortino, S., Lenat, J.-F. & Valenza, M., 2002. Fluid circulationat Stromboli volcano (Aeolian Islands, Italy) from self-potential and CO2
surveys, J. Volc. Geotherm. Res., 116, 1–18.Finizola, A., Sortino, S., Lenat, J.-F., Aubert, M., Ripepe, M. & Valenza,
M., 2003. The summit hydrothermal system of Stromboli. New in-sights from self-potential, temperature, CO2 and fumarolic fluid measure-ments. Structural and monitoring implications, Bull. Volcanol., 65, 486–504.
Finizola, A. et al., 2006. Hydrogeological insights at Stromboli volcano(Italy) from geoelectrical, temperature, and CO2 soil degassing investi-gations, Geophys. Res. Lett., 33, L17304, doi:10.1029/2006GL026842.
Finizola, A. et al., 2010. Adventive hydrothermal circulation on Strombolivolcano (Aeolian Islands, Italy) revealed by geophysical and geochemicalapproaches: Implications for general fluid flow models on volcanoes, J.Volc. Geotherm. Res., 196, 111–119.
Fitterman, D.V., Stanley W.D. & Bisdorf, R.J., 1988. Electrical structure ofNewberry volcano, Oregon, J. geophys. Res., 93, 10 119–10 134.
Francalanci, L., 1987. Evoluzione vulcanologica e magmatologica dell’isoladi Stromboli (Isole Eolie) : Relazioni tra magmatismo calc-alcalino eshoshonitico, Tesi di Dottorato, PhD thesis. Dipartimento di Scienze dellaTerra, Firenze.
Gelis, C., Revil, A., Cushing, M.E., Jougnot, D., Lemeille, F., Cabrera,J., De Hoyos, A. & Rocher, M., 2010. Potential of electrical resistivitytomography to detect fault zones in limestone and argillaceous formationsin the experimental site of Tournemire, France, Pure appl. Geophys.,167(11), 1405–1418, doi:10.1007/s00024–010-0097-x.
Gillot, P.Y., 1984. Datation par la methode du potassium argon des rochesvolcaniques recentes (pleistocenes et holocenes). Contribution a l’etudechronostratigraphique et magmatologique des provinces volcaniques deCampanie, des ıles eoliennes, de Pantelleria (Italie du Sud) et de laReunion (Ocean Indien), PhD thesis, Paris.
Gillot, P.Y. & Keller, J., 1993. Radiochronological dating of Stromboli, ActaVulcanol., 3, 69–77.
C© 2011 The Authors, GJI
Geophysical Journal International C© 2011 RAS
Hydrogeology of Stromboli volcano 17
Hornig-Kjarsgaard, I., Keller, J., Koberski, U., Stadlbauer, E., Francalanci,L. & Lenhart, R., 1993. Geology, stratigraphy and volcanological evo-lution of the island of Stromboli, Aeolian arc, Italy., Acta Vulcanol., 3,21–68.
Ingebritsen, S. E. & Sorey, M. L., 1988. Vapor-dominated zones withinhydrothermal systems: Evolution and natural state, J. geophys. Res., 93,13,635– 13,655, doi:10.1029/JB093iB11p13635.
Ingebritsen, S. E., Geiger, S., Hurwitz, S. & Driesner, T., 2010. Numer-ical simulation of magmatic hydrothermal systems, Rev. Geophys., 48,RG1002, doi:10.1029/2009RG000287.
Jackson, D.B. & Kauahikaua, J., 1987. Regional SP anomalies at Kilauea,Volcanism in Hawaii. USGS Prof. paper 1350, ch. 40, pp. 947–959.
Keller, J., Hornig-Kjarsgaard, I., Koberski, U., Stadlbauer, E. & Lenhart, R.,1993. Geological map of the island of Stromboli, Acta Vulcanol., 3.
Krivochieva, S. & Chouteau, M., 2003. Integrating TDEM and MT methodsfor characterizing and delineation of the Santa Catarina aquifer (ChalcoSub-basin, Mexico), J. appl. Geophys., 52(1), 23–43.
Komori, K., Kagiyama, T., Hoshizumi H, Takakura, S. & Mimura, M.,2010. Vertical mapping of hydrothermal fluids and alteration from bulkconductivity: simple interpretation on the USDP-1 site, Unzen Volcano,SW Japan, J. Volc. Geotherm. Res., 198, 339–347.
Loke, M.H., & Barker, R.D., 1996. Practical techniques for 3D resistivitysurveys and data inversion, Geophys. Prospect., 44, pp. 499–523.
Lopez, D. L. & Williams, S. N., 1993. Catastrophic volcanic col-lapse: Relation to hydrothermal processes, Science, 260, 1794–1796,doi:10.1126/science.260.5115.1794.
Lorenz, V. & Kurszlaukis, S., 2007. Root zone processes in the phreatomag-matic pipe emplacement model and consequences for the evolution ofmaar-diatreme volcanoes, J. Volc. Geotherm. Res., 159(1–3), 4–32.
Lowell, R.P., Cappellen, P.V. & Germanovich, L.N., 1993. Silica precipitationin fractures and the evolution of permeability in hydrothermal upflowzones, Science, 260, 192–194, doi:10.1126/science.260.5105.192.
Marsella, M., Proietti, C., Sonnessa, A., Coltelli, M., Tommasi, P. &Bernardo, E., 2009. The evolution of the Sciara del Fuoco sub-aerial slope during the 2007 Stromboli eruption: relation betweendeformation processes and effusive activity. J. Volc. Geotherm. Res,doi:10.1016/j.jvolgeores.2009.02.002.
Michael H.A., Mulligan A.E., & Harvey C.F., 2005. Seasonal oscillationsin water exchange between aquifers and the coastal ocean, Nature, 436,1145–1148, doi:10.1038/nature03935.
Nappi, G., Capaccioni B., Biagiotti F., & Vaselli O., 1999. Upper pyroclasticsequence of the Scari formation: A paroxistic eruption from Strombolivolcano (Aeolian Island, Italy), Acta Vulcanol., 11, 259–264.
Okuma, S., Stotter, C., Supper, R., Nakatsuka, T., Furukawa, R. & Motschka,K., 2009. Aeromagnetic constraints on the subsurface structure of Strom-boli Volcano, Aeolian Islands, Italy, Tectonophysics, 478, 19–33.
Onizawa, S., Matsushima, N., Ishido, T., Hase, H., Takakura, S. & Nishi, Y.,2009. Self-potential distribution on active volcano controlled by three-dimensional resistivity structure in Izu-Oshima, Japan, Geophys. J. Int.,178, 1164–1181, doi:10.1111/j.1365–246X.2009.04203.x
Pasquare, G., Francalanci, L., Garduno, V.H. & Tibaldi, A., 1993. Structureand geologic evolution of the Stromboli volcano, Aeolian Islands, Italy,Acta Vulcanol., 3, 79–89.
Petrinovic, I.A. & Pinol, F.C., 2006. Phreatomagmatic and phreatic eruptionsin locally extensive settings of Southern Central Andes: the TocomarColcanic Center (24◦10′S–66◦34′W), Argentina, J. Volc. Geotherm. Res.,158(1–2), 37–50.
Revil A., 1999. Ionic diffusivity, electrical conductivity, membrane andthermoelectric potentials in colloids and granular porous media: a unifiedmodel, J. Coll. Interface Sci., 212, 503–522.
Revil, A. & Glover, P.W.J., 1998. Nature of surface electrical conductivity innatural sands, sandstones, and clays, Geophys. Res. Lett., 25(5), 691–694.
Revil, A. & Leroy, P., 2001. Hydroelectric coupling in a clayey material,Geophys. Res. Lett., 28(8), 1643–1646.
Revil, A., Hermitte, D., Spangenberg, E. & Cocheme, J.J., 2002. Electricalproperties of zeolitized volcaniclastic materials, J. geophys. Res., 107(B8),2168, doi: 10.1029/2001JB000599.
Revil, A., Naudet, V., Nouzaret, J., & Pessel, M., 2003. Principlesof electrography applied to self-potential electrokinetic sources andhydrogeological applications, Water Resour. Res., 39(5), 1114, doi:10.1029/2001WR000916.
Revil, A., Naudet, V. & Meunier J. D., 2004a. The hydroelectric problemof porous rocks: Inversion of the water table from self-potential data,Geophys. J. Int., 159, 435–444.
Revil A., Finizola A., Sortino F. & Ripepe M., 2004b. Geophysical inves-tigations at Stromboli volcano, Italy. Implications for ground water flowand paroxysmal activity, Geophys. J. Int., 157, 426–440.
Revil, A. et al., 2008. Inner structure of La Fossa di Vulcano (VulcanoIsland, southern Tyrrhenian Sea, Italy) revealed by high resolution electricresistivity tomography coupled with self-potential, temperature, and soilCO2 diffuse degassing measurements, J. geophys. Res., 113, B07207,doi:10.1029/2007JB005394.
Revil, A., Johnson, T. C. & Finizola, A., 2010. Three-dimensional resistivitytomography of Vulcan’s forge, Vulcano Island, southern Italy, Geophys.Res. Lett., 37, L15308, doi:10.1029/2010GL043983.
Richards, K., Revil, A., Henderson, F., Batzle, M. & Haas, A., 2010. Patternof shallow ground water flow at Mount Princeton Hot Springs, Colorado,using geoelectrical methods, J. Volc. Geotherm. Res., 198, 217–232.
Romagnoli, C., Casalbore, D., Chiocci, F.L. & Bosman, A., 2009a. Offshoreevidence of large-scale lateral collapses on the eastern flank of Stromboli,Italy, due to structurally-controlled, bilateral flank instability, Mar. Geol.,262, 1–13, doi:10.1016/j.margeo.2009.02.004.
Romagnoli, C., Kokelaar, P., Casalbore, D. & Chiocci, F.L., 2009b. Lateralcollapses and active sedimentary processes on the northwestern flank ofStromboli volcano, Italy, Mar. Geol., 265, 101–119.
Rosi, M., 1980. The Island of Stromboli, Rend. Soc. It. Miner. Petrol., 36,345–368.
Segre, A.G., 1968. Notizie sulla morfologia submarina di Stromboli, Strom-boli, 11, 45–49.
Sinclair, A.J., 1974. Selection of threshold values in geochemical data usingprobability graphs, J. Geochem. Explor., 3, 129–149.
Tibaldi, A., 2001. Multiple sector collapses at Stromboli volcano, Italy: howthey work, Bull. Vulcanol., 63, 112–125.
Tinti, S., Bortolucci, E. & Romagnoli, C., 1999. Modeling a possibleHolocenic landslide-induced tsunami at Stromboli volcano. Italy, Phys.Chem. Earth, 24(5), 423–429.
Tinti, S., Bortolucci, E. & Romagnoli, C., 2000. Computer simulations oftsunamis due to sector collapse at Stromboli. Italy, J. Volc. Geotherm.Res., 96, 103–128.
Tinti, S., Pagnoni, G., Zaniboni, F. & Bortolucci, E., 2003. Tsunami gener-ation in Stromboli island and impact on the south-east Tyrrhenian coasts,Nat. Hazards Earth Syst. Sci., 3, 299–309.
Tinti, S., Maramai, A.,·Armigliato, A., Grazian,i L., Manucci, A., Pagnoni,G. & Zaniboni, F. 2006. Observations of physical effects from tsunamis ofDecember 30, 2002 at Stromboli volcano, southern Italy, Bull. Volcanol.,68, 450–461, doi:10.1007/s00445–005-0021-x.
Tinti, S., Zaniboni, F., Pagnoni, G. & Manucci A., 2008. Stromboli Island(Italy): Scenarios of Tsunamis Generated by Submarine Landslides, Pureappl. geophys., 165, 2143–2167, doi:10.1007/s00024–008-0420-y.
Waxman, M.H. & Smits, L.J.M., 1968. Electrical conductivities in oil bear-ing shaly sands, Soc. Pet. Eng. J., 8, 107–122.
Weinstein, Y., 2007. A transition from strombolian to phreatomagnatic ac-tivity induced by a lava flow damming water in a valley, J. Volc. Geotherm.Res, 159(1–3), 267–284.
C© 2011 The Authors, GJI
Geophysical Journal International C© 2011 RAS