Hydrochemical assessment of the Hutton and Precipice ...
49
Hydrochemical assessment of the Hutton and Precipice sandstones in the northern Surat Basin Matthias Raiber and Axel Suckow June 2017 LAND & WATER
-
Upload
khangminh22 -
Category
Documents
-
view
2 -
download
0
Transcript of Hydrochemical assessment of the Hutton and Precipice ...

Hydrochemical assessment of the Hutton and Precipice sandstones in the northern Surat Basin
Matthias Raiber and Axel Suckow
June 2017
LAND & WATER
Report Title: Hydrochemical assessment of the Hutton and Precipice sandstones in the northern
Surat Basin
ISBN (print): 978-1-4863-0869-9
ISBN (online): 978-1-4863-0870-5
The Gas Industry Social and Environmental Research Alliance (GISERA) undertakes publicly -
reported research that addresses the socio-economic and environmental impacts of Australia's
natural gas industries.
GISERA was co-founded by CSIRO and Australia Pacific LNG in July 2011. For further information
visit gisera.org.au.
Citation
Raiber, M. and Suckow, A. (2017) Hydrochemical assessment of the Hutton and Precipice
sandstones in the northern Surat Basin. CSIRO, Australia
Copyright
© Commonwealth Scientific and Industrial Research Organisation 2017. To the extent permitted
by law, all rights are reserved and no part of this publication covered by copyright may be
reproduced or copied in any form or by any means except with the written permission of CSIRO.
Important disclaimer
CSIRO advises that the information contained in this publication comprises general statements
based on scientific research. The reader is advised and needs to be aware that such information
may be incomplete or unable to be used in any specific situation. No reliance or actions must
therefore be made on that information without seeking prior expert professional, scientific and
technical advice. To the extent permitted by law, CSIRO (including its employees and consultants)
excludes all liability to any person for any consequences, including but not limite d to all losses,
damages, costs, expenses and any other compensation, arising directly or indirectly from using this
publication (in part or in whole) and any information or material contained in it.
CSIRO is committed to providing web accessible content wherever possible. If you are having
difficulties with accessing this document please contact [email protected].

Hydrochemical assessment of the Hutton and Precipice sandstones in the northern Surat Basin | i

ii | Hydrochemical assessment of the Hutton and Precipice sandstones in the northern Surat Basin
Contents
Acknowledgments .................................................................................................................... v
Executive summary ................................................................................................................. vi
1 Introduction ................................................................................................................. 1
1.1 Aims of this report .................................................................................................. 3
2 Methodology ................................................................................................................ 7
2.1 Aquifer assignments ................................................................................................ 7
2.2. Groundwater chemistry data ................................................................................ 10
2.3 Multi-variate statistical analysis ............................................................................. 10
3 Results and discussions ............................................................................................... 12
3.1 Hydrochemical variability within the Dawson River catchment (all aquifers) ........... 12
3.2 Hydrochemical variability within the Precipice Sandstone ...................................... 16
3.3 Hydrochemical variability within the Hutton Sandstone ......................................... 21
3.4 Hydrochemical evolution and implications for recharge processes ......................... 28
3.5 Limitations and future steps .................................................................................. 32
4 Conclusions ................................................................................................................ 34
5 References ................................................................................................................. 36
Hydrochemical assessment of the Hutton and Precipice sandstones in the northern Surat Basin | iii
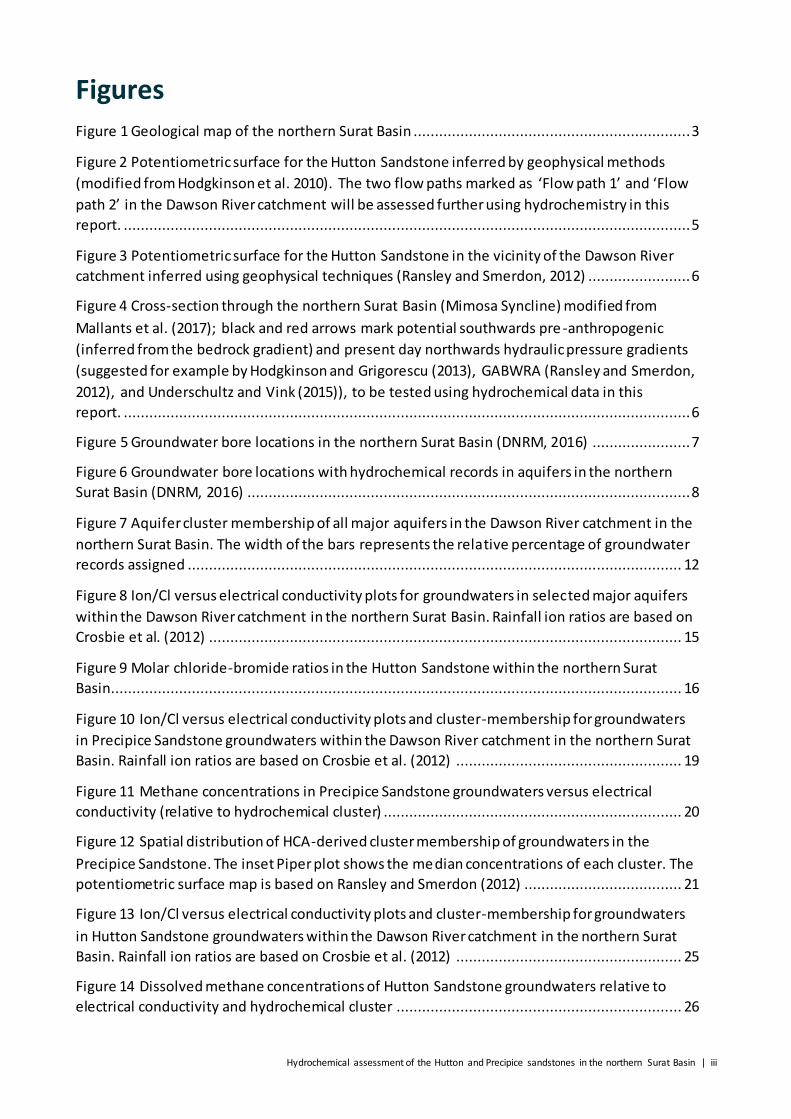
Figures Figure 1 Geological map of the northern Surat Basin ................................................................. 3
Figure 2 Potentiometric surface for the Hutton Sandstone inferred by geophysical methods
(modified from Hodgkinson et al. 2010). The two flow paths marked as ‘Flow path 1’ and ‘Flow
path 2’ in the Dawson River catchment will be assessed further using hydrochemistry in this
report. ..................................................................................................................................... 5
Figure 3 Potentiometric surface for the Hutton Sandstone in the vicinity of the Dawson River
catchment inferred using geophysical techniques (Ransley and Smerdon, 2012) ........................ 6
Figure 4 Cross-section through the northern Surat Basin (Mimosa Syncline) modified from
Mallants et al. (2017); black and red arrows mark potential southwards pre-anthropogenic
(inferred from the bedrock gradient) and present day northwards hydraulic pressure gradients
(suggested for example by Hodgkinson and Grigorescu (2013), GABWRA (Ransley and Smerdon,
2012), and Underschultz and Vink (2015)), to be tested using hydrochemical data in this
report. ..................................................................................................................................... 6
Figure 5 Groundwater bore locations in the northern Surat Basin (DNRM, 2016) ....................... 7
Figure 6 Groundwater bore locations with hydrochemical records in aquifers in the northern
Surat Basin (DNRM, 2016) ........................................................................................................ 8
Figure 7 Aquifer cluster membership of all major aquifers in the Dawson River catchment in the
northern Surat Basin. The width of the bars represents the relative percentage of groundwater
records assigned .................................................................................................................... 12
Figure 8 Ion/Cl versus electrical conductivity plots for groundwaters in selected major aquifers
within the Dawson River catchment in the northern Surat Basin. Rainfall ion ratios are based on
Crosbie et al. (2012) ............................................................................................................... 15
Figure 9 Molar chloride-bromide ratios in the Hutton Sandstone within the northern Surat
Basin...................................................................................................................................... 16
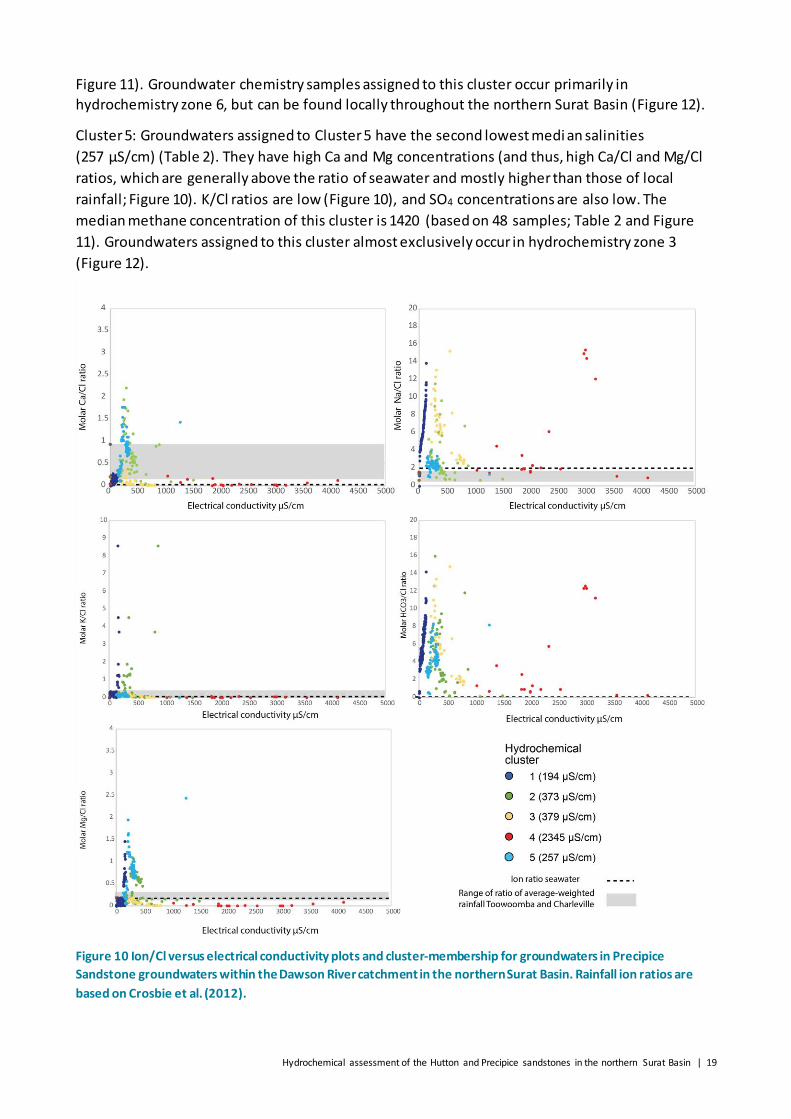
Figure 10 Ion/Cl versus electrical conductivity plots and cluster-membership for groundwaters
in Precipice Sandstone groundwaters within the Dawson River catchment in the northern Surat
Basin. Rainfall ion ratios are based on Crosbie et al. (2012) ..................................................... 19
Figure 11 Methane concentrations in Precipice Sandstone groundwaters versus electrical
conductivity (relative to hydrochemical cluster) ...................................................................... 20
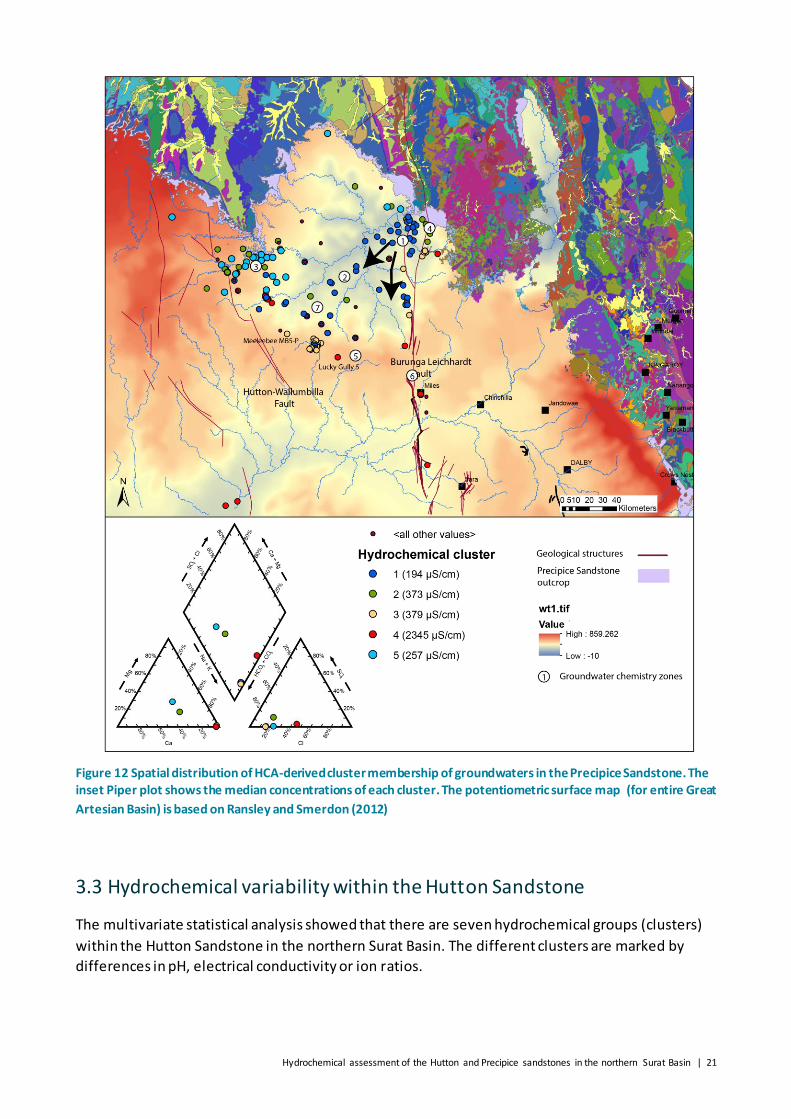
Figure 12 Spatial distribution of HCA-derived cluster membership of groundwaters in the
Precipice Sandstone. The inset Piper plot shows the median concentrations of each cluster. The
potentiometric surface map is based on Ransley and Smerdon (2012) ..................................... 21
Figure 13 Ion/Cl versus electrical conductivity plots and cluster-membership for groundwaters
in Hutton Sandstone groundwaters within the Dawson River catchment in the northern Surat
Basin. Rainfall ion ratios are based on Crosbie et al. (2012) ..................................................... 25
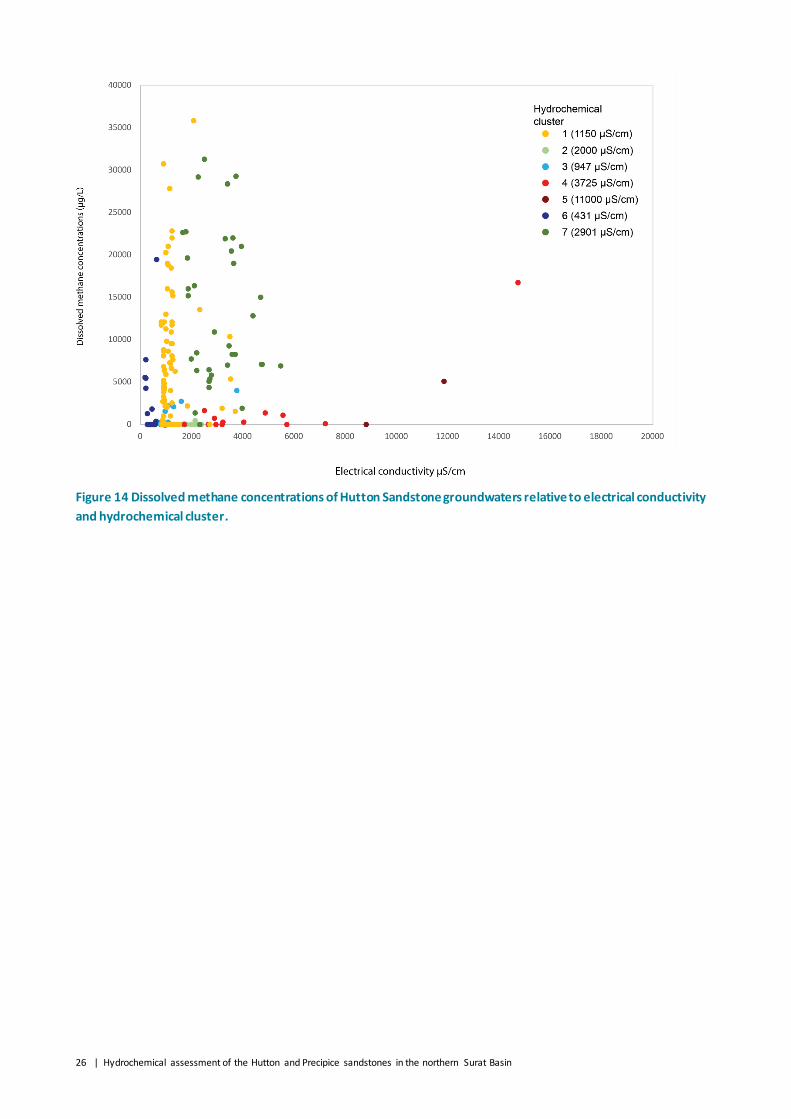
Figure 14 Dissolved methane concentrations of Hutton Sandstone groundwaters relative to
electrical conductivity and hydrochemical cluster ................................................................... 26
iv | Hydrochemical assessment of the Hutton and Precipice sandstones in the northern Surat Basin
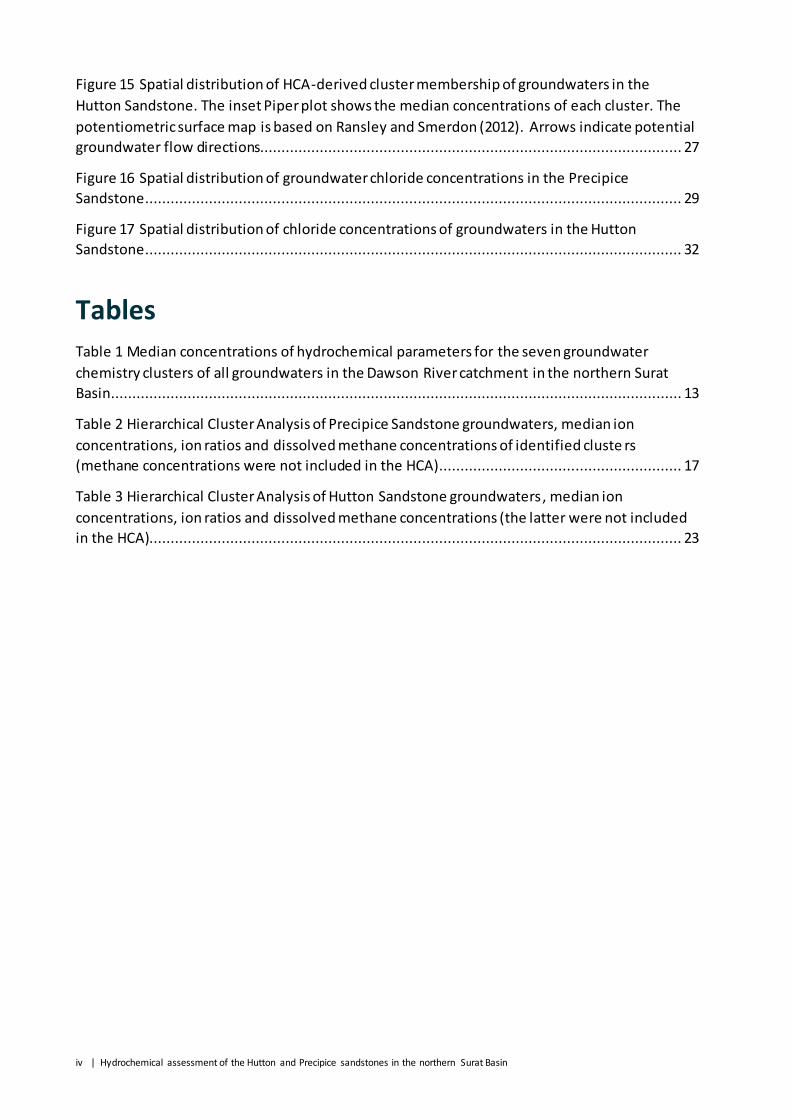
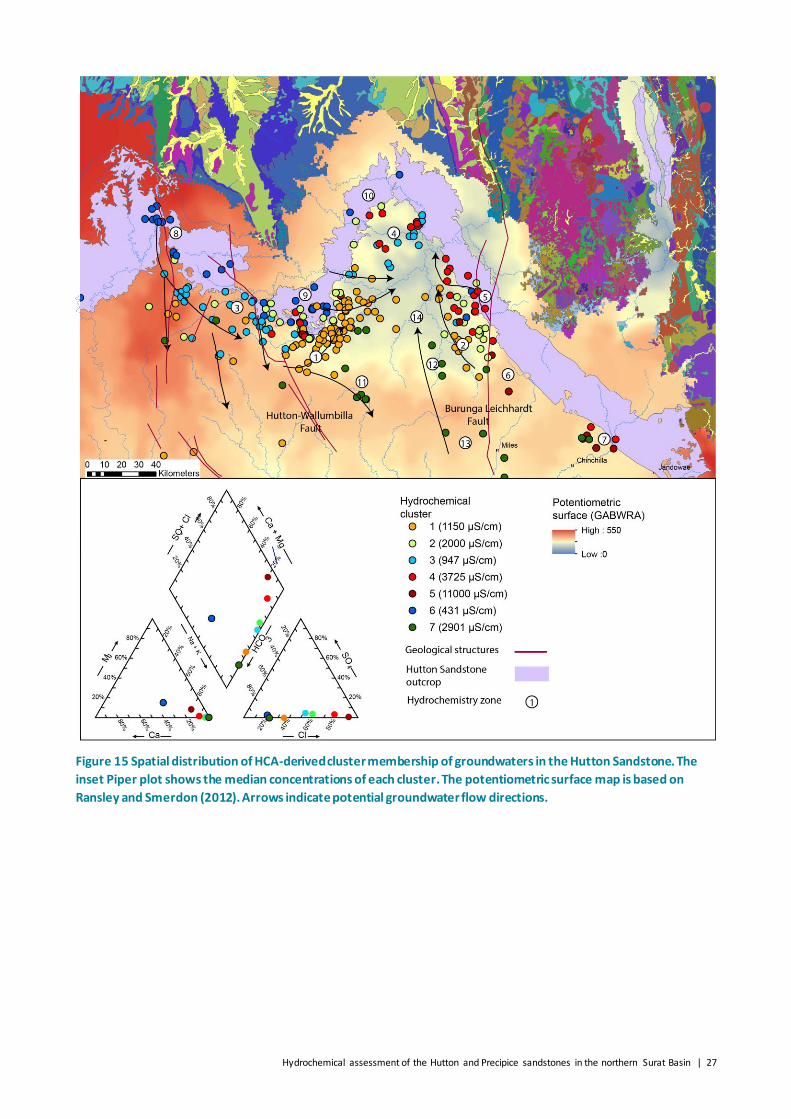
Figure 15 Spatial distribution of HCA-derived cluster membership of groundwaters in the
Hutton Sandstone. The inset Piper plot shows the median concentrations of each cluster. The
potentiometric surface map is based on Ransley and Smerdon (2012). Arrows indicate potential
groundwater flow directions................................................................................................... 27
Figure 16 Spatial distribution of groundwater chloride concentrations in the Precipice
Sandstone .............................................................................................................................. 29
Figure 17 Spatial distribution of chloride concentrations of groundwaters in the Hutton
Sandstone .............................................................................................................................. 32
Tables Table 1 Median concentrations of hydrochemical parameters for the seven groundwater
chemistry clusters of all groundwaters in the Dawson River catchment in the northern Surat
Basin...................................................................................................................................... 13
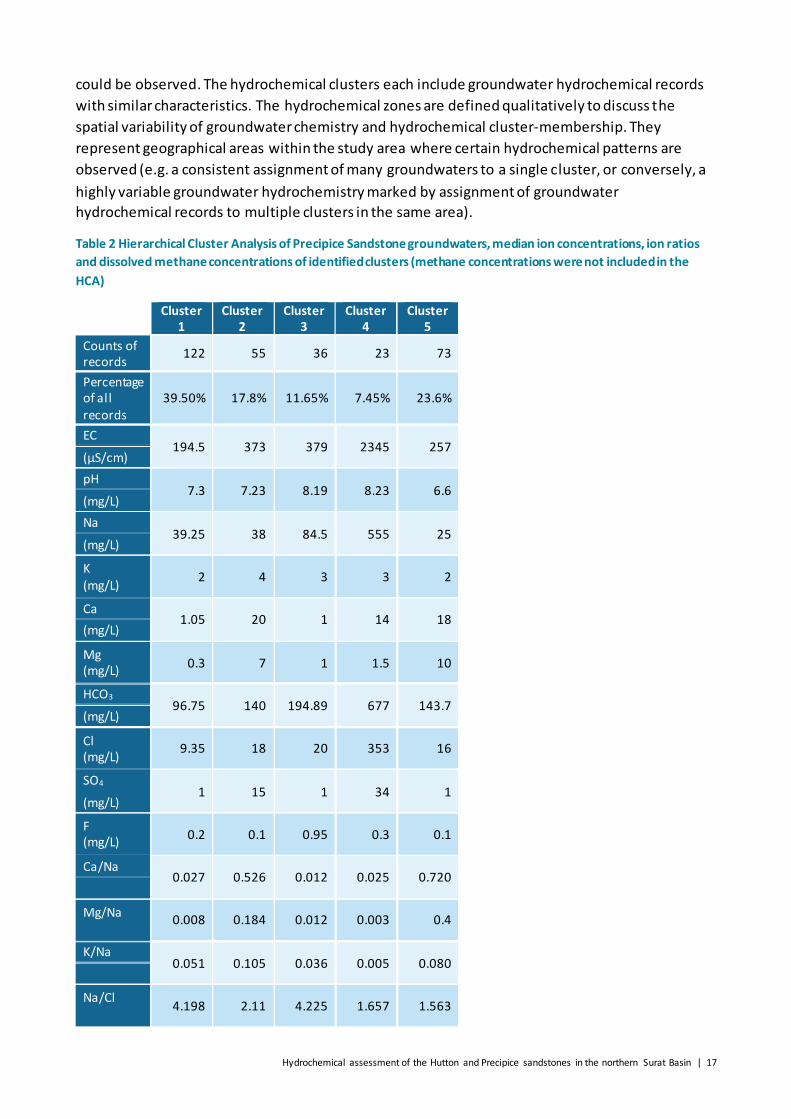
Table 2 Hierarchical Cluster Analysis of Precipice Sandstone groundwaters, median ion
concentrations, ion ratios and dissolved methane concentrations of identified cluste rs
(methane concentrations were not included in the HCA)......................................................... 17
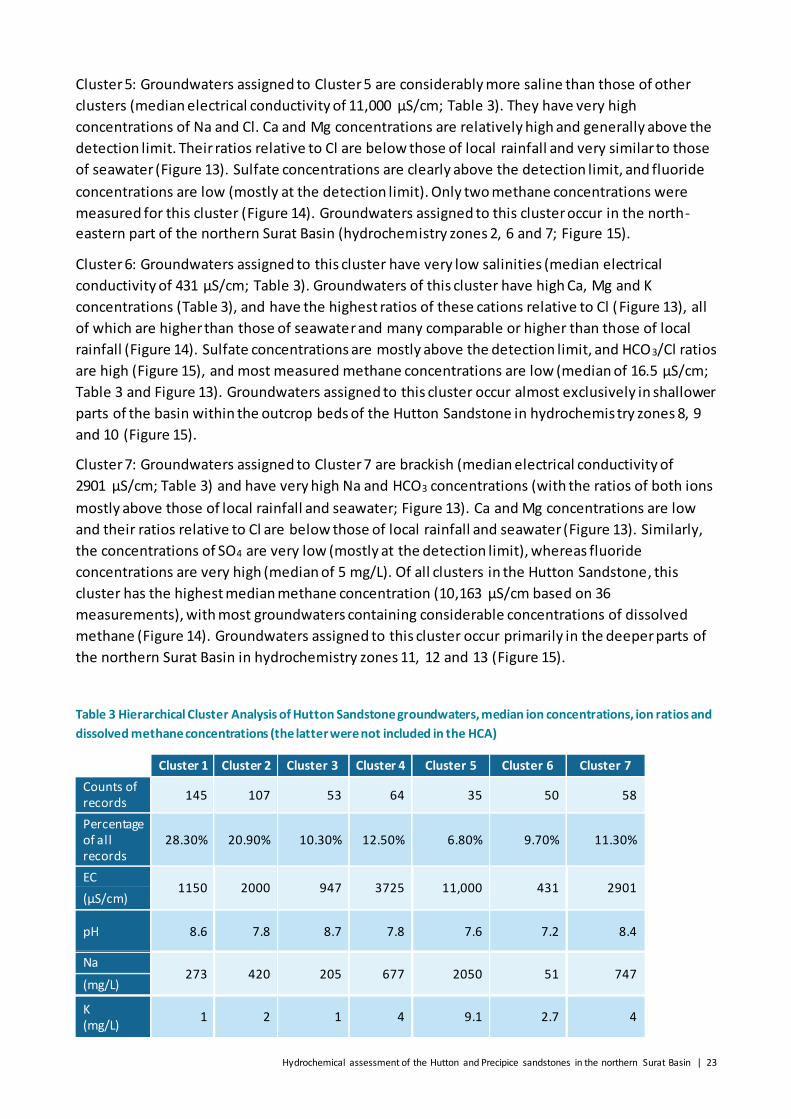
Table 3 Hierarchical Cluster Analysis of Hutton Sandstone groundwaters, median ion
concentrations, ion ratios and dissolved methane concentrations (the latter were not included
in the HCA)............................................................................................................................. 23

Hydrochemical assessment of the Hutton and Precipice sandstones in the northern Surat Basin | v
Acknowledgments
This report was funded by the Gas Industry Social and Environmental Research Alliance (GISERA).
GISERA is a collaborative vehicle established to undertake publicly‐reported independent research
addressing the socio‐economic and environmental impacts of Australia’s natural gas industries.
The governance structure for GISERA is designed to provide for and protect research
independence and transparency of funded research. See www.gisera.org.au for more information
about GISERA’s governance structure, funded projects, and research findings.
The authors would like to thank the Queensland Office of Groundwater Impact Assessment for
providing the Surat Basin 3D geological model for use in this project. Furthermore, provision of
hydrochemical data from coal seam gas operators (Santos, Origin Energy and QGC) is greatly
acknowledged.
The authors would also like to thank Dirk Mallants and Mat Gilfedder for their very useful internal
review comments.
vi | Hydrochemical assessment of the Hutton and Precipice sandstones in the northern Surat Basin
Executive summary
This report forms a component of the GISERA project ‘Constraining groundwater flow rates in the
Surat Basin through environmental tracer and hydrochemical data’. Although the conceptual
understanding of groundwater flow processes in the Surat Basin, Queensland, has improved
substantially over the last few years, there continue to be critical knowledge gaps that need to be
addressed to be confident that impacts on the groundwater balance from coal seam gas (CSG)
extraction are negligible. Especially in the northern part of the Surat Basin, there is an on-going
discussion about recharge processes and rates as well as groundwater flow directions within key
agricultural aquifers such as the Hutton Sandstone and the Precipice Sandstone and whether these
could be affected by CSG extraction.
In this component of the GISERA project, hydrochemical data were compiled and then used to
assess regional scale recharge processes, hydrochemical evolution along groundwater flow paths
and the influence of faulting on groundwater flow and hydrochemistry. Following extensive data
quality control checks, a multi-variate statistical analysis was conducted. This statistical
assessment was complemented by comparing the ratios of major ions relative to chloride. This
approach allowed the identification of major hydrochemical processes affecting the
hydrochemical evolution of groundwater along deep regional scale flow paths.
For the Precipice Sandstone, the assessment demonstrated that there is some hydrochemical
variability, although the overall differences between hydrochemical clusters are relatively minor.
This is likely due to a relatively homogeneous lithological composition of this aquifer.
Hydrochemistry also confirmed that one of the major regional faults in the Surat Basin, the
Burunga Leichhardt fault, may form a pathway that connects the Precipice Sandstone to the more
shallow overlying aquifers.
Compared to the Precipice Sandstone, the Hutton Sandstone displayed a much higher
hydrochemical variability, with salinities ranging from very fresh to sal ine, and a wide range of ion
ratios. The spatial assessment of the hydrochemical clusters showed that a northerly flow
component within the Hutton Sandstone is possible, as previously suggested by other studies
based on potentiometric surfaces. Furthermore, the assessment also showed that localized
recharge occurs within the western outcrop areas of the Hutton Sandstone, where groundwater is
very fresh (electrical conductivity less than approximately 500 µS/cm) and shows hydrochemical
attributes associated with recharge waters.
Overall, the study demonstrated the value of baseline hydrochemistry data to test existing
hydrogeological conceptualizations and where robust evidence is available to improve such
conceptualizations to better inform the potential impacts from CSG depressurization on adjacent
aquifers. The study identified key knowledge gaps, including geographic areas where additional
hydrochemical data collection could help to improve the understanding of hydrodynamics in the
northern Surat Basin.

Hydrochemical assessment of the Hutton and Precipice sandstones in the northern Surat Basin | vii
The hydrochemical assessment presented in this report wi ll inform other tasks within this GISERA
project, and form the basis for further testing of the conceptual hydrogeological understanding of
these key aquifers in the northern Surat Basin.


Hydrochemical assessment of the Hutton and Precipice sandstones in the northern Surat Basin | 1
1 Introduction
Conceptual understanding of groundwater recharge mechanisms, recharge rates and flow
directions in the northern Surat Basin has evolved over the last two decades as more groundwater
and stratigraphic data became available from groundwater resource investigations and coal seam
gas exploration and associated groundwater monitoring programmes (e.g. Office of Groundwater
Impact Assessment, 2016). However, there is a recognition that additional work is required to
close some of the remaining knowledge gaps. A particular area within the northern part of the
Surat Basin where knowledge gaps were identified is the Dawson River catchment, which partly
overlies a major geological structural feature known as the Mimosa Syncline (Figure 1). Key
aquifers of the Surat Basin such as the Hutton Sandstone and the Precipice Sandstone sustain
agricultural developments and town water supplies in the northern Surat Basin (e.g. Welsh et al.,
2014; Office of Groundwater Impact Assessment, 2016). They outcrop in the northern part of this
area and dip towards the south, where they are confined underneath younger stratigraphic
formations (Figure 1).
The Early Jurassic Precipice Sandstone is the oldest unit of the Surat Basin. It comprises thick -
bedded, coarse, quartzose sandstone (Whitehouse, 1952; 1955), and it is conformably overlain by
the Evergreen Formation. It is absent in some areas where the Evergreen Formation
unconformably sits on pre-Jurassic units (Cook et al., 2013).
The Hutton Sandstone overlies the Evergreen Formation and underlies the Walloon Coal
Measures. It comprises quartzose to sublabile sandstones with rare interbedded siltstone and
coarser beds (Cook et al., 2013), and was deposited in a braided fluvial system where sandstone
units represent stacked channel sands (e.g. Moore et al., 1986; John and Almond, 1987; Gray et
al., 2002). Green (1997) divided the Hutton Sandstone into ‘upper’ and ‘lower’ members based on
the ‘lower’ containing relatively more siltstone.
Within the Dawson River catchment in the northern Surat Basin, an area where significant coal
seam gas exploration and development has occurred during the last years, there is uncertainty
surrounding groundwater flow directions in parts of the Hutton Sandstone and within the
Precipice Sandstone. Understanding of groundwater flow directions is important because it
provides indication of the nature of interactions between surface water and groundwater,
between shallow and deep aquifers, and it is part of the evidence base to interpret the role of
geological faults on regional groundwater flow. Based on drill stem test pressure data of
petroleum wells and water level measurements from groundwater bores, Hodgkinson and
Grigorescu (2012) indicated that there is potential for a significant northerly flow component from
Chinchilla and from the south-west (Injune, Figure 1) towards Taroom (Figure 2). Hodgkinson et al.
(2010) found similar results for the Evergreen Formation and Precipice Sandstone. Similar to the
northwards groundwater flow direction proposed by Hodkinson and Grigorescu (2012), Ransley
and Smerdon (2012) and Ransley et al. (2015) suggested that there is groundwater loss to river
baseflow from GAB aquifer outcrop areas where the Dawson River is deeply incised into the
Hutton and Precipice sandstones (Figure 3). They estimated approximately 8623 ML/year of
groundwater flow loss from the GAB intake beds (mainly Hutton Sandstone) to the Dawson River,
2 | Hydrochemical assessment of the Hutton and Precipice sandstones in the northern Surat Basin
and suggested that this could account for some of the northward flow directions proposed by
Hodgkinson and Grigorescu (2012). Similar patterns were also suggested by the Office of
Groundwater Impact Assessment (Office of Groundwater Impact Assessment, 2016) ; this work
indicated that there is topographically driven groundwater flow towards the north and north-east
in the Hutton and Precipice sandstones north of the Great Dividing Range, and that recharge
around the northern margin may not contribute significantly to the deeper parts of the Great
Artesian Basin. This was further indicated by Underschultz and Vink (2015) for the Hutton
Sandstone based on potentiometric surfaces and a multivariate statistical assessment of
groundwater chemistry.
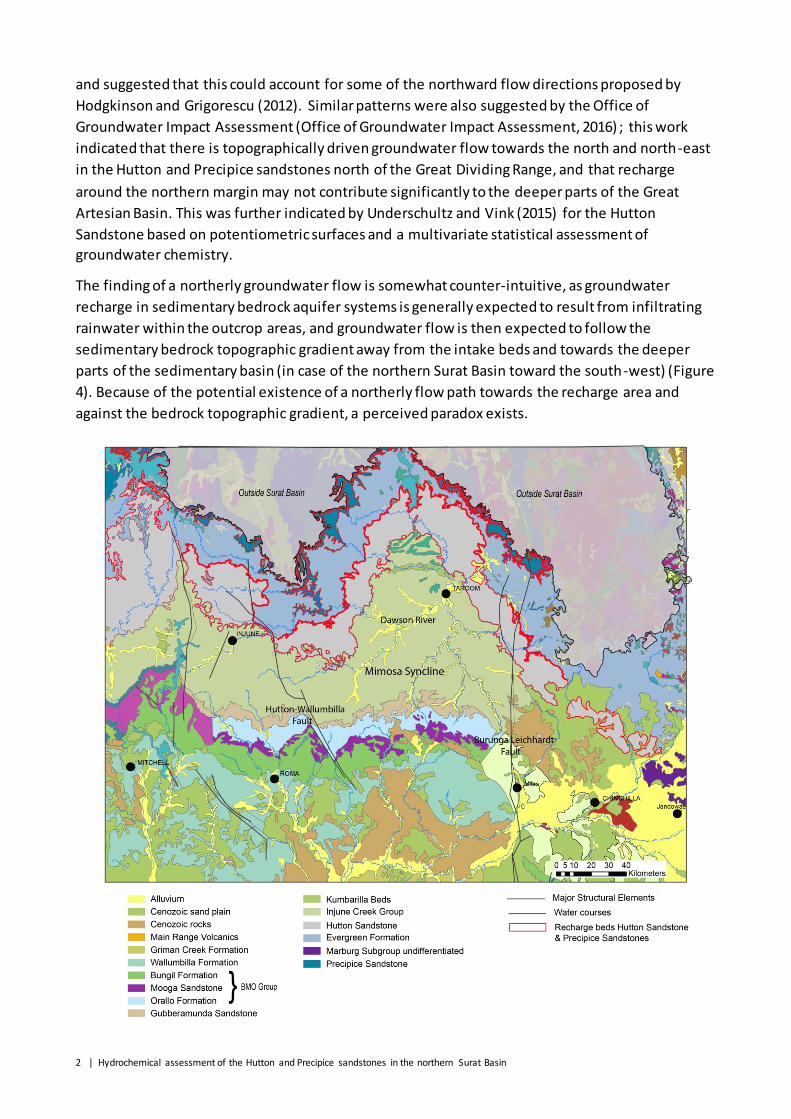
The finding of a northerly groundwater flow is somewhat counter-intuitive, as groundwater
recharge in sedimentary bedrock aquifer systems is generally expected to result from infiltrating
rainwater within the outcrop areas, and groundwater flow is then expected to follow the
sedimentary bedrock topographic gradient away from the intake beds and towards the deeper
parts of the sedimentary basin (in case of the northern Surat Basin toward the south-west) (Figure
4). Because of the potential existence of a northerly flow path towards the recharge area and
against the bedrock topographic gradient, a perceived paradox exists.
Hydrochemical assessment of the Hutton and Precipice sandstones in the northern Surat Basin | 3
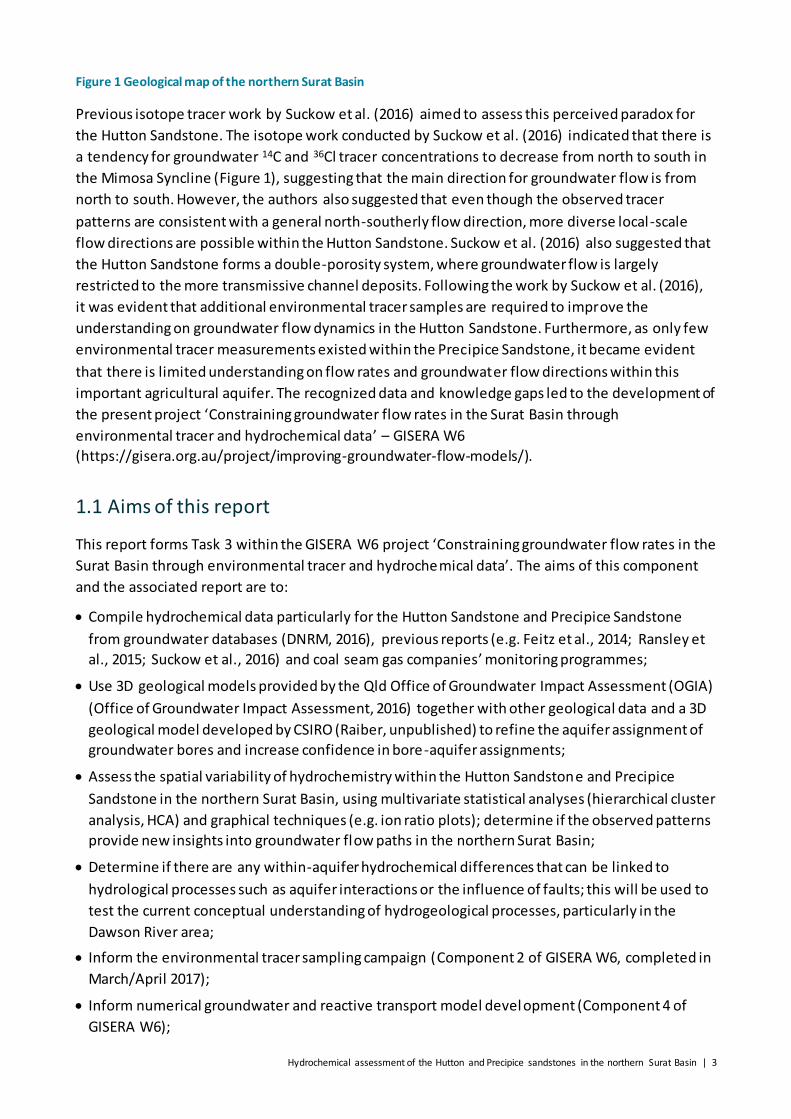
Figure 1 Geological map of the northern Surat Basin
Previous isotope tracer work by Suckow et al. (2016) aimed to assess this perceived paradox for
the Hutton Sandstone. The isotope work conducted by Suckow et al. (2016) indicated that there is
a tendency for groundwater 14C and 36Cl tracer concentrations to decrease from north to south in
the Mimosa Syncline (Figure 1), suggesting that the main direction for groundwater flow is from
north to south. However, the authors also suggested that even though the observed tracer
patterns are consistent with a general north-southerly flow direction, more diverse local-scale
flow directions are possible within the Hutton Sandstone. Suckow et al. (2016) also suggested that
the Hutton Sandstone forms a double-porosity system, where groundwater flow is largely
restricted to the more transmissive channel deposits. Following the work by Suckow et al. (2016),
it was evident that additional environmental tracer samples are required to improve the
understanding on groundwater flow dynamics in the Hutton Sandstone. Furthermore, as only few
environmental tracer measurements existed within the Precipice Sandstone, it became evident
that there is limited understanding on flow rates and groundwater flow directions within this
important agricultural aquifer. The recognized data and knowledge gaps led to the development of
the present project ‘Constraining groundwater flow rates in the Surat Basin through
environmental tracer and hydrochemical data’ – GISERA W6
(https://gisera.org.au/project/improving-groundwater-flow-models/).
1.1 Aims of this report
This report forms Task 3 within the GISERA W6 project ‘Constraining groundwater flow rates in the
Surat Basin through environmental tracer and hydrochemical data’. The aims of this component
and the associated report are to:
Compile hydrochemical data particularly for the Hutton Sandstone and Precipice Sandstone
from groundwater databases (DNRM, 2016), previous reports (e.g. Feitz et al., 2014; Ransley et
al., 2015; Suckow et al., 2016) and coal seam gas companies’ monitoring programmes;
Use 3D geological models provided by the Qld Office of Groundwater Impact Assessment (OGIA)
(Office of Groundwater Impact Assessment, 2016) together with other geological data and a 3D
geological model developed by CSIRO (Raiber, unpublished) to refine the aquifer assignment of
groundwater bores and increase confidence in bore-aquifer assignments;
Assess the spatial variability of hydrochemistry within the Hutton Sandstone and Precipice
Sandstone in the northern Surat Basin, using multivariate statistical analyses (hierarchical cluster
analysis, HCA) and graphical techniques (e.g. ion ratio plots); determine if the observed patterns
provide new insights into groundwater flow paths in the northern Surat Basin;
Determine if there are any within-aquifer hydrochemical differences that can be linked to
hydrological processes such as aquifer interactions or the influence of faults; this will be used to
test the current conceptual understanding of hydrogeological processes, particularly in the
Dawson River area;
Inform the environmental tracer sampling campaign (Component 2 of GISERA W6, completed in
March/April 2017);
Inform numerical groundwater and reactive transport model development (Component 4 of
GISERA W6);
4 | Hydrochemical assessment of the Hutton and Precipice sandstones in the northern Surat Basin
Identify key knowledge gaps that can inform future data collection and sampling campaigns.
In this task of the GISERA W6, hydrochemical data are used as an independent line of evidence to
test the current conceptual understanding of regional groundwater flow and recharge patterns in
the Hutton Sandstone and Precipice Sandstone in the northern Surat Basin. The key for this
project is the reliable knowledge of the source aquifer from which the sample was collected. Only
with this knowledge hydrochemical data can be used to assess intra and inter-aquifer flow
patterns and hydrochemical processes from the recharge area to the deeper parts of the Surat
Basin. The aquifer membership of bores in the current version of the QLD groundwater database
(DNRM, 2016) is sometimes incorrect, ambiguous or unknown, and the screened intervals of bores
sometimes source water from different aquifers than stated in the database . Therefore, perceived
within-aquifer changes of hydrochemistry might indeed represent differences between different
aquifers, potentially leading to misinterpretations. To avoid such issues and resulting
misconceptions, an existing 3D geological model of the aquifer boundaries (formation tops)
developed and provided by the Queensland Office of Groundwater Impact Assessment (Office of
Groundwater Impact Assessment, 2016) was used to verify that only water chemistry records are
included in the assessment of spatial patterns where the aquifer membership can be determined
with a high level of confidence. For the identification of hydrochemical changes along inferred
flow-paths based on hydraulic heads, multivariate statistical techniques were applied and major
ion ratios were assessed. This aimed to identify hydrochemical characteristic fingerprints within
the Hutton Sandstone and Precipice Sandstone aquifers along inferred flow paths and to
understand the controlling factors (e.g. hydrochemical processes or inter-aquifer mixing) of spatial
variability. However, it is important to note that these groundwater head measurements used to
derive flow paths represent post-agricultural development flow conditions. Furthermore,
hydraulic pressures in sedimentary bedrock aquifers are likely to respond substantially faster to
anthropogenic stresses than hydrochemistry or tracers, which particularly in deeper parts of
sedimentary bedrock aquifers are expected to take hundreds or thousands of years before the
hydraulic changes significantly influence the hydrochemical or isotopic signature (Zuber et al.
2011).
Task 3 is linked closely and iteratively with Task 2 (‘Collection and analysis of age tracer data’) of
this project. For example, the initial hydrochemical assessment conducted as part of Task 3 helped
to decide on the optimal environmental tracer sampling locations, and the hydrochemical data
collected as part of the environmental tracer sampling campaign fed back into the assessment of
hydrochemical processes in the northern Surat Basin. The refined conceptual models and quality -
checked hydrochemical data then inform Task 4 (‘Integrated age tracer/reactive transport model ’).

Hydrochemical assessment of the Hutton and Precipice sandstones in the northern Surat Basin | 5
Figure 2 Potentiometric surface for the Hutton Sandstone inferred by geophysical methods (modified from Hodgkinson et al. 2010). The two hypothesized flow paths marked as ‘Flow path 1’ and ‘Flow path 2’ in the Dawson
River catchment will be assessed further using hydrochemistry in this report.

6 | Hydrochemical assessment of the Hutton and Precipice sandstones in the northern Surat Basin
Figure 3 Potentiometric surface for the Hutton Sandstone in the vicinity of the Dawson River catchment (Ransley
and Smerdon, 2012)
Figure 4 Cross-section through the northern Surat Basin (Mimosa Syncline) modified from Mallants et al. (2017); black and red arrows mark potential southwards pre-anthropogenic (inferred from the bedrock gradient) and
present day northwards hydraulic pressure gradients (suggested for example by Hodgkinson and Grigorescu (2013), GABWRA (Ransley and Smerdon, 2012), and Underschultz and Vink (2015)), to be tested using hydrochemical data
in this report. The classification as ‘aquifer’ or ‘aquitard’ is a generalisation only, as there are considerable within-
formation differences.
Hydrochemical assessment of the Hutton and Precipice sandstones in the northern Surat Basin | 7
2 Methodology
2.1 Aquifer assignments
Lithological and stratigraphic data, bore construction details and historical water level and water
chemistry records were compiled from the Queensland Department of Natural Resources and
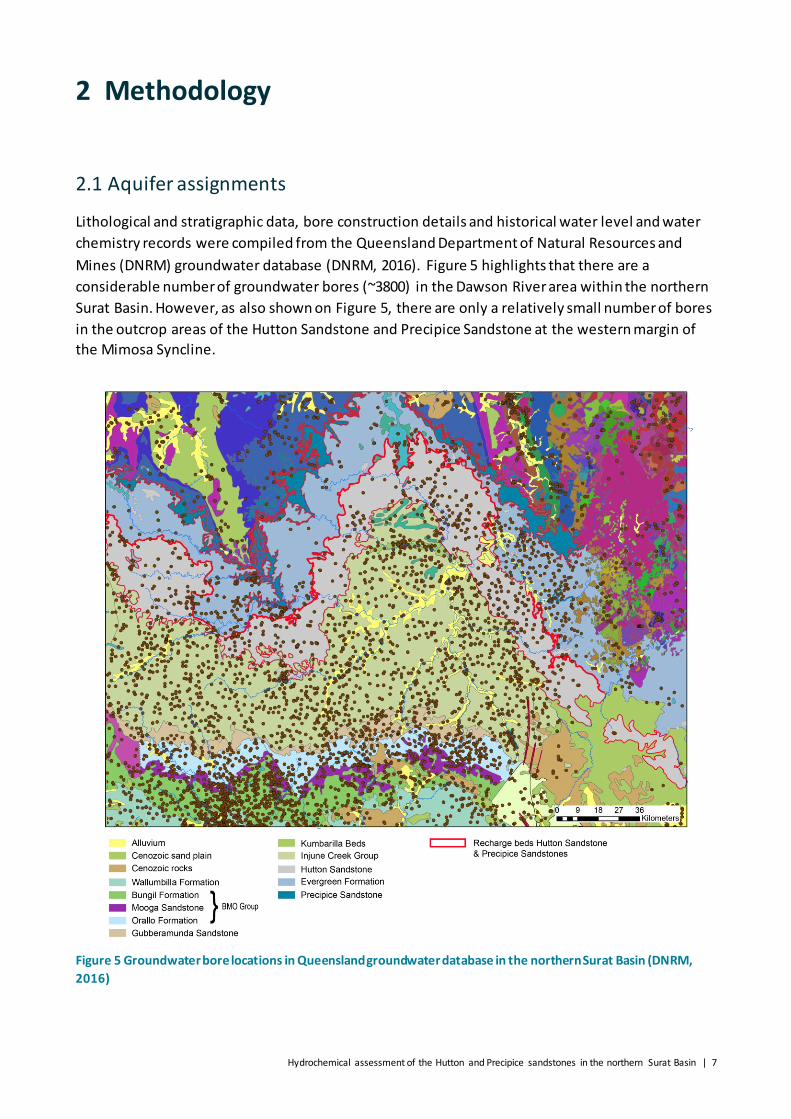
Mines (DNRM) groundwater database (DNRM, 2016). Figure 5 highlights that there are a
considerable number of groundwater bores (~3800) in the Dawson River area within the northern
Surat Basin. However, as also shown on Figure 5, there are only a relatively small number of bores
in the outcrop areas of the Hutton Sandstone and Precipice Sandstone at the western margin of
the Mimosa Syncline.
Figure 5 Groundwater bore locations in Queensland groundwater database in the northern Surat Basin (DNRM,
2016)
8 | Hydrochemical assessment of the Hutton and Precipice sandstones in the northern Surat Basin
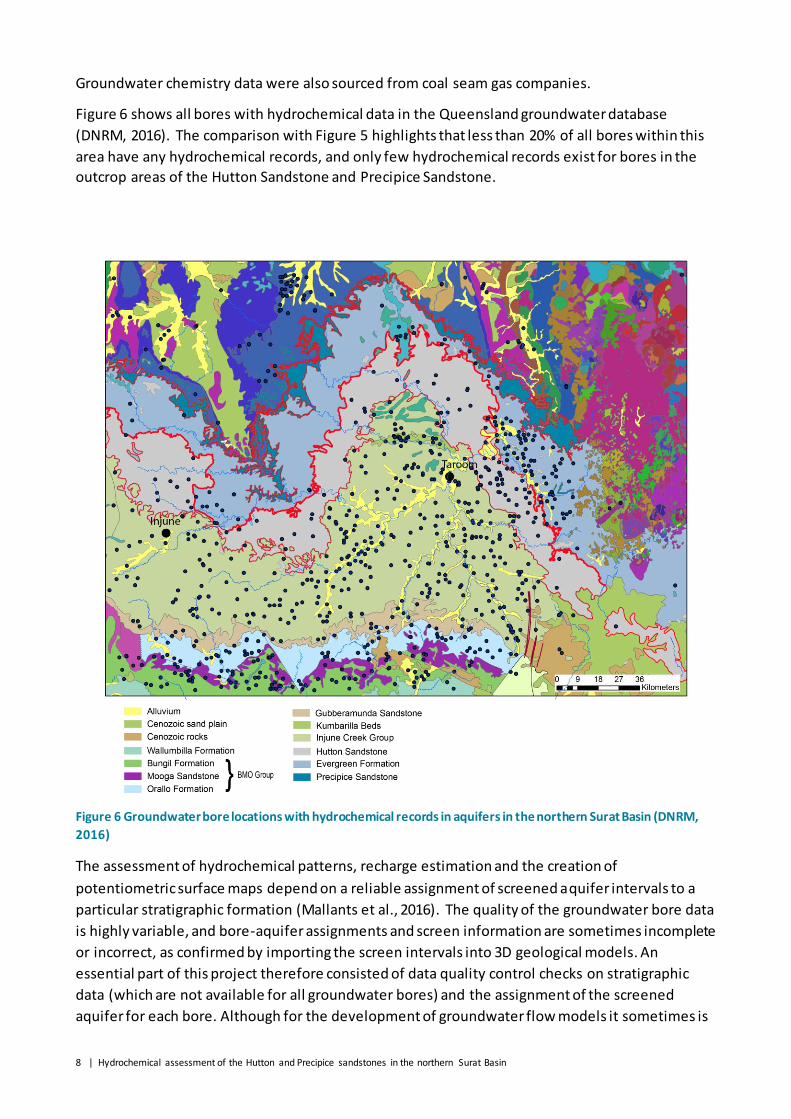
Groundwater chemistry data were also sourced from coal seam gas companies.
Figure 6 shows all bores with hydrochemical data in the Queensland groundwater database
(DNRM, 2016). The comparison with Figure 5 highlights that less than 20% of all bores within this
area have any hydrochemical records, and only few hydrochemical records exist for bores in the
outcrop areas of the Hutton Sandstone and Precipice Sandstone.
Figure 6 Groundwater bore locations with hydrochemical records in aquifers in the northern Surat Basin (DNRM,
2016)
The assessment of hydrochemical patterns, recharge estimation and the creation of
potentiometric surface maps depend on a reliable assignment of screened aquifer intervals to a
particular stratigraphic formation (Mallants et al., 2016). The quality of the groundwater bore data
is highly variable, and bore-aquifer assignments and screen information are sometimes incomplete
or incorrect, as confirmed by importing the screen intervals into 3D geological models. An
essential part of this project therefore consisted of data quality control checks on stratigraphic
data (which are not available for all groundwater bores) and the assignment of the screened
aquifer for each bore. Although for the development of groundwater flow models it sometimes is

Hydrochemical assessment of the Hutton and Precipice sandstones in the northern Surat Basin | 9
a common practice to assign a bore to multiple aquifers or take a ‘best guess’ on the screened
formation where no bore construction details exists (e.g. assume that the bore is screened only in
the formation in which it terminates), this is not possible for a water chemistry or isotope baseline
assessment.
There are many challenges associated with the task of assigning bores to aquifers, particularly as
many of the groundwater bores in the Surat Basin were constructed decades ago and as bore
construction details are missing or are incomplete (Mallants et al., 2016). One of the key
challenges is that the stratigraphy along the bore depth profile is unknown for many bores in the
DNRM groundwater database (DNRM, 2016). Furthermore, where stratigraphic data exist, these
are often incorrect or exist only for part of the bore depth profile. The depth of bores is also
unknown for a substantial number of bores, as are the top and/or bottom of the screened interval.
The ‘aquifer table’ within the DNRM groundwater database only lists the aquifer at slightly more
than 50% of the bores for which hydrochemical data exists, and these groundwater database bore
assignments are sometimes incorrect or incomplete, as confirmed by the comparison with the 3D
geological models. Where the depth of the screened interval (e.g. hypothetical example bore 1 in
Figure 4) or the bore depth are unknown, hydrochemical data or environmental tracers cannot be
included in the hydrochemical or tracer assessment as it is not possible to assign an aquifer with
high confidence.
To verify the data from the DNRM groundwater database, two 3D geological models from the
Office of Groundwater Impact Assessment (OGIA) (Office of Groundwater Impact Assessment,
2016) and CSIRO (Raiber, unpublished) were used, allowing to independently confirm the
formation at the screened interval. For this purpose, the screened intervals were imported into
the 3D geological models using Gocad/SKUA software™ (Paradigm Geophysical Pty Ltd), and the
models were then queried to identify the formation where the bores are screened. The use of the
3D geological model helped considerably to improve the confidence in aquifer assignments.
Where this procedure indicated that a bore is only screened in one aquifer (e.g. hypothetical
example bore 2 in Figure 4), the hydrochemical data were included in the hydrochemical
assessment. However, the assessment also confirmed that many bores are screened across
different formations (e.g. hypothetical example bore 3 in Figure 4), and data from these bores can
also not be used for the hydrochemical assessment as it cannot be determined from which aquifer
the water is sourced. Furthermore, as for all models, the 3D geological models are subject to
uncertainties resulting for example from interpolation of widely-spaced data (e.g. Raiber et al.,
2012). In areas where many bores with reliable stratigraphic data exist (e.g. in areas where
exploration for coal seam gas has occurred), the uncertainty of the aquifer assignments based on
the 3D geological models is considered low. In contrast, in other areas such as for example close to
the outcrop beds of the Hutton Sandstone, Evergreen Formation and Precipice Sandstone in the
northern part of the Mimosa Syncline, there are only few exploration bores and only a small
number of groundwater bores with stratigraphic data; the uncertainty of bore-aquifer
assessments is therefore higher in these areas. This indicates a considerable knowledge gap and
should be addressed in future studies, e.g. by using geophysical wireline logging instruments to
ascertain the screened formation of bores in these areas.
10 | Hydrochemical assessment of the Hutton and Precipice sandstones in the northern Surat Basin
2.2. Groundwater chemistry data
Groundwater chemistry data from the Queensland DNRM groundwater database (DNRM, 2016)
for the period 1976 to May 2016 were included in the hydrochemical assessment. Prior to 1976,
potassium, a major ion, was often not measured. Data for the hydrochemical assessment were
compiled from multiple sources:
DNRM groundwater database and DNRM groundwater chemistry baseline survey
GISERA W4 sampling (Suckow et al., 2016)
GISERA W6 sampling (this study)
Geoscience Australia (Geoscience Australia 2014; Ransley et al., 2015)
Geoscience Australia (Feitz et al. 2014)
Coal Seam Gas company monitoring data (QGC, Santos and Origin Energy)
OGIA groundwater – surface water sampling campaign (OGIA 2017)
2.3 Multi-variate statistical analysis
Hierarchical Cluster Analysis (HCA) is a multivariate statistical technique commonly adopted in
groundwater hydrochemical studies to identify patterns within a dataset to enhance the
understanding of physical and chemical processes that underpin groundwater evolution (e.g.
Stetzenbach et al., 1999; Güler et al., 2002; Menció and Mas-Pla, 2008; Daughney et al., 2010;
Raiber et al., 2012). Many variables should ideally be used in an HCA to enable an accurate
depiction of groundwater chemistry and the processes that control it. In this study, ten variables
were selected, namely, pH, Ca, Mg, Na, K, HCO3, Cl, F, SO4 and electrical conductivity. Prior to the
multi-variate statistical analysis, data quality control checks were performed on all hydrochemical
records. Sampling records where charge balances were outside ± 10% or where the aquifer at the
screened interval was unknown were excluded from further analysis. A charge balance cut -off of
±10% was used instead of the commonly used ±5% to ensure that only sites where severe charge
imbalances occur are excluded, as suggested by Guggenmos et al. (2011) and Güler et al. (2002).
Such severe charge balance imbalances can arise for example from incorrect data entries or
missing values for major ions. Values below detection limit were replaced with the detection limit,
as previously described and explained in other studies elsewhere (e.g. Farnham et al. (2002) and
Raiber et al. (2012)). Although dissolved methane concentrations were not included in the HCA,
they were used for the interpretation on the hydrochemical evolution within the Hutton
Sandstone and Precipice Sandstone.
With the exception of pH, all variables were log-transformed to ensure that they conform to a
normal distribution before the multivariate statistical analysis was conducted. The HCA presented
in this work was carried out using the StatGraphics Centurion software (Manugistics Inc., USA).
Two linkage rules were adopted, following the methodology described by Daughney et al. ( 2010)
and Raiber et al. (2012): (1) the nearest neighbour rule for identifying sites with significantly
different hydrochemical signatures to recognize outliers that are placed as residuals in a separate
group; and, (2) the Ward’s rule for generating distinct clusters based on an analysis of variance
used to group all non-residuals into separate clusters. Similarities across all variables were
assessed using the square of the Euclidean distance (E). The transformed input data along with

Hydrochemical assessment of the Hutton and Precipice sandstones in the northern Surat Basin | 11
linkage rules and the similarity measure are considered as the most appropriate techniques for
classifying hydrochemical data (Güler et al., 2002; Daughney et al., 2010; Raiber et al., 2012). The
outcome of this process is a dendrogram (Cloutier et al., 2008).
As it involves an element of judgment when determining the suitable number of clusters that are
representative of a sample population, HCA is considered a semi-objective technique. In this study,
the dendrogram was visually inspected, and then the centroid concentrations (represented by the
median) for different input variables and clusters at different separation thresholds were
compared (Cloutier et al., 2008; Raiber et al., 2012). The median was preferred as a better
indicator of central tendency compared to the mean as it is less sensitive to extreme values (Helsel
and Hirsch, 2002).

12 | Hydrochemical assessment of the Hutton and Precipice sandstones in the northern Surat Basin
3 Results and discussions
3.1 Hydrochemical variability within the Dawson River catchment (all aquifers)
A multivariate statistical analysis of the hydrochemical data was conducted on hydrochemical data
from all aquifers within the Dawson River catchment to assess the variability within each aquifer
and determine if there are similarities or characteristic differences between different aquifers. A
cross-tabulation was conducted to determine if there is a statistical relationship between aquifer
membership and the HCA-derived cluster (Figure 7). A hypothesis test was conducted to
determine whether to reject the hypothesis that the ‘aquifer membership’ and ‘cluster
membership’ classifications are independent. This test showed that the P-value is less than 0.05,
and the hypothesis that the observed value of ‘aquifer membership’ for a case is independent
from its value for ‘cluster membership’ can therefore be rejected at the 95% confidence level. In
other words, statistically ‘aquifer membership’ and cluster membership are mutually dependent.
Figure 7 Aquifer cluster membership of all major aquifers in the Dawson River catchment in the northern Surat Basin. The width of the bars represents the relative percentage of groundwater records assigned. The height is
proportional to the number of existing hydrochemical records for each formation (e.g. a large number exists for the
Hutton Sandstone, whereas only a small number of records are available for the Springbok Sandstone).
The multivariate statistical analysis of the hydrochemistry of all groundwaters within the Dawson
River catchment in the Surat Basin showed that hydrochemical records of all aquifers are assigned
to multiple clusters, indicating that hydrochemical variability occurs within all aquifers (Table 1).
The HCA and cross-tabulation also show that the hydrochemistry of the Precipice Sandstone and
Hutton Sandstone are very distinct, as most of the Hutton Sandstone groundwaters are assigned
to clusters 1 and 5, whereas most Precipice Sandstone groundwaters are assigned to clusters 3
and 4. As previously suggested by Mallants et al. (2016), groundwater chemistry within the
Walloon Coal Measures and the Hutton Sandstone appears to be similar in the northern Surat
Basin (although the dataset used in this study does not include hydrochemical records from the

Hydrochemical assessment of the Hutton and Precipice sandstones in the northern Surat Basin | 13
Walloon Coal Measures production waters and therefore represents the shallower parts of the
aquifer).
Table 1 Median concentrations of hydrochemical parameters for the seven groundwater chemistry clusters of all
groundwaters in the Dawson River catchment in the northern Surat Basin
Cluster
1 Cluster
2 Cluster
3 Cluster
4 Cluster
5 Cluster
6 Cluster
7
Counts of records
197 70 169 180 206 57 26
Percentage of all records
21.80% 7.70% 18.70% 19.90% 22.80% 6.30% 2.90%
EC (µS/cm)
1100 3445 204 319 2221 9651 1077
pH 8.58 8.35 7.3 6.89 8.07 7.55 7.5
(mg/L)
Na (mg/L)
249 833 45 31 464 1668 229
K 1 4.85 2 3 2 8.7 1
(mg/L)
Ca (mg/L)
2 4 1 19 19.2 208 3.5
Mg 1 1 0.4 9.85 2 57 1
(mg/L)
HCO3 (mg/L)
327 1342 110 146 431 504 352
Cl 130 560.5 9.5 20 461 3226 131
(mg/L)
SO4 (mg/L)
2 1.6 1 3 35.42 20 11
F (mg/L)
0.7 3.95 0.3 0.1 0.17 0.1 0.2
Ca/Na
0.008 0.005 0.022 0.613 0.041 0.125 0.015
Mg/Na 0.004 0.001 0.009 0.318 0.004 0.034 0.004
K/Na 0.004 0.006 0.044 0.097 0.004 0.005 0.004
Na/Cl 1.915 1.486 4.737 1.55 1.008 0.517 1.748
HCO3/Cl 2.515 2.394 11.663 7.308 0.936 0.156 2.687
SO4/Cl 0.015 0.003 0.105 0.155 0.077 0.006 0.084
F/Cl 0.00540 0.00700 0.03160 0.00500 0.00040 0.00003 0.00150

14 | Hydrochemical assessment of the Hutton and Precipice sandstones in the northern Surat Basin
The ion ratio plots (Figure 8) confirm that there are significant overlaps in ion/chloride ratios
between different aquifers. The comparison of ion-chloride ratios relative to the ratios of seawater
(Drever, 1997) and the average-weighted ratios of rainfall at the two closest rainfall stations
(Charleville and Toowoomba (Crosbie et al., 2012)) shows that there are significant changes with
increasing salinity. Generally, the freshest groundwaters within all aquifers are characterised by
high ratios of major cations relative to chloride (Figure 8), and the excess ions relative to local
precipitation are likely supplied by the dissolution of primary silicate minerals or ion exchange
within the rocks. Ion/Cl ratios (e.g. K/Cl, Ca/Cl and Mg/Cl) rapidly decrease at approximately 1000–
2000 µS/cm to values close to or below those in local rainfall and the ratio of seawater. This either
suggests an increase in chloride or that some of the weathering-derived ions are removed from
solution rapidly, e.g. via adsorption on clay mineral surfaces. For Na/Cl and HCO3/Cl, the ratios also
decrease with increasing salinity, although at slightly higher salinities than for the other major
ions. Furthermore, there is likely to be calcite and dolomite precipitation, as indicated by
saturation indices in some groundwater in exceedance of where calcite and dolomite precipitation
typically occurs. This suggests that calcite and dolomite precipitation has removed some Ca, Mg
and HCO3 from the groundwater. As a result, groundwater become more Na-Cl dominated. In
studies elsewhere in Australia, it was also suggested that the removal of cations can be facilitated
by preferential uptake of ions by vegetation in the recharge area (Edwards and Webb, 2009).

Hydrochemical assessment of the Hutton and Precipice sandstones in the northern Surat Basin | 15
Figure 8 Ion/Cl versus electrical conductivity plots for groundwater in selected major aquifers within the Dawson
River catchment in the northern Surat Basin. Rainfall ion ratios are based on Crosbie et al. (2012).
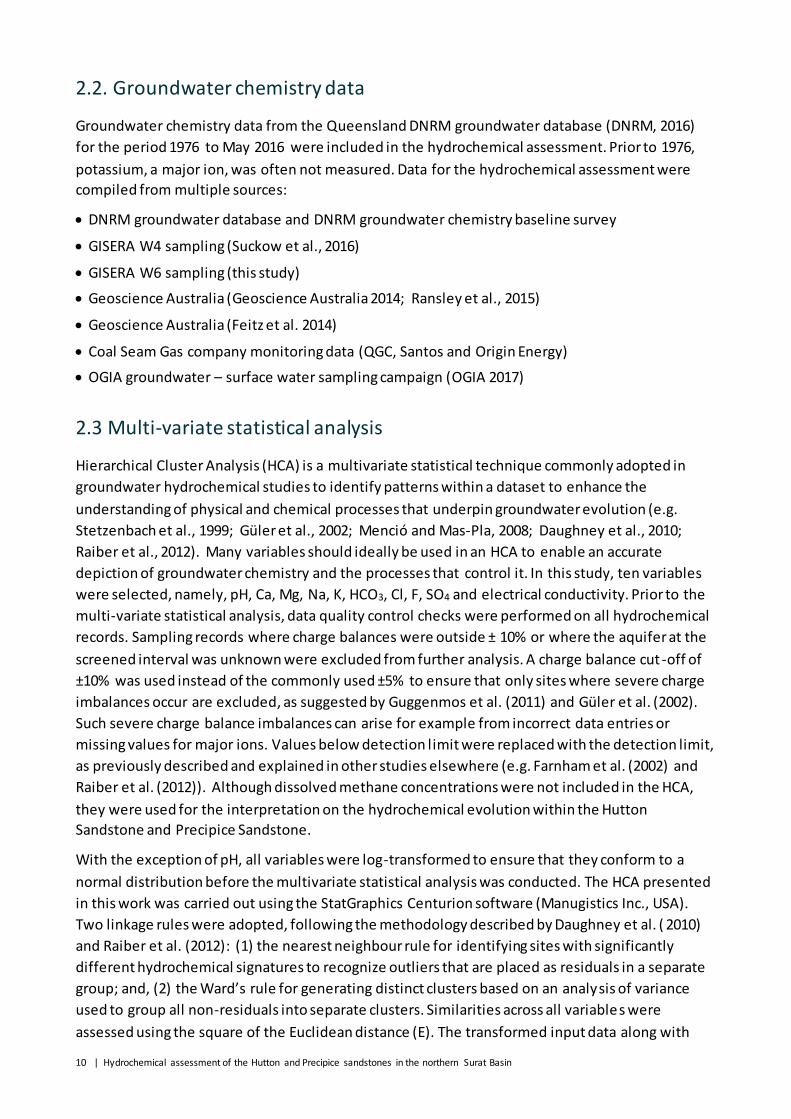
Relationships between Cl and Br can provide valuable insights into the source of salinity in
groundwater (e.g. Cartwright et al., 2004). Within the hydrochemical dataset of the northern Surat
Basin, 210 measurements of groundwater bromide concentrations are available (for all aquifers);
the molar Cl/Br ratios of these groundwaters range from ~170 to ~1800 at all except two sites,
with these two outliers having higher ratios (approximately 2300 and 4100, respectively). As
shown in Figure 9, the Cl/Br ratios of most groundwaters are above the ratio of seawater of 650
(Davis et al., 1998, 2001), and there are no systematic variations with salinity. Rainfall Br
concentrations in Brisbane, Toowoomba and Charleville were generally below detection limit
(0.05 mg/L; Crosbie et al., 2012), and groundwater Cl/Br ratios could therefore not be compared
with local rainfall Cl/Br ratio. However, Cartwright et al. (2004) suggested that coastal rainfall
commonly has a similar Cl/Br ratio as seawater, whereas inland rainfall, particularly in arid or
semi-arid climates, has lower Cl/Br ratios due to the preferential removal of NaCl in early rainfall
16 | Hydrochemical assessment of the Hutton and Precipice sandstones in the northern Surat Basin
near coastal areas. This was also confirmed by Davis et al. (1998, 2001), who showed that fresh
groundwater in the USA is characterised by decreasing Cl/Br ratios from 400 near the coast to
<150 in the continental interior. The measured Cl/Br ratios in the groundwaters of the northern
Surat Basin are considerably less than what would be expected of brines or from the dissolution of
halite (10,000–100,000) (Cartwright et al., 2004), confirming a meteoric (or cyclic) rainfall source
of dissolved salts. The slightly elevated Cl/Br ratios relative to the oceanic ratio may suggest that
there is an additional minor contribution from windblown dust, as observed in other areas of
Australia. However, 87Sr/86Sr ratios (Feitz et al., 2014; Raiber & Suckow, unpublished data) confirm
that this possible contribution is likely to be very minor, as the 87Sr/86Sr ratios would otherwise be
much higher than those observed, due to the higher 87Sr/86Sr ratios in central Australia where
most windblown dust originates.
Specific hydrochemical processes that control these observed patterns are discussed in detail in
Sections 3.2 and 3.3 for the Precipice Sandstone and Hutton Sandstone, respectively.
Figure 9 Molar chloride-bromide ratios versus electrical conductivity in all aquifers within the northern Surat Basin.
3.2 Hydrochemical variability within the Precipice Sandstone
To further refine the understanding of hydrochemical variability and their controls within the
Precipice Sandstone, a key agricultural aquifer within the northern Surat Basin, a HCA was
conducted on all hydrochemical records of bores screened within this uni t. The salinity of
groundwaters within the Precipice Sandstone in the northern Surat Basin ranges from very fresh
(<300 µS/cm) to brackish (~5000 µS/cm) (Table 2). The HCA revealed five clusters within the
dataset (Table 2), all marked by differences in pH, electrical conductivity or relative ion ratios.
They will be discussed in the following text for different ‘hydrochemical zones’ where differences
Hydrochemical assessment of the Hutton and Precipice sandstones in the northern Surat Basin | 17
could be observed. The hydrochemical clusters each include groundwater hydrochemical records
with similar characteristics. The hydrochemical zones are defined qualitatively to discuss the
spatial variability of groundwater chemistry and hydrochemical cluster-membership. They
represent geographical areas within the study area where certain hydrochemical patterns are
observed (e.g. a consistent assignment of many groundwaters to a single cluster, or conversely, a
highly variable groundwater hydrochemistry marked by assignment of groundwater
hydrochemical records to multiple clusters in the same area).
Table 2 Hierarchical Cluster Analysis of Precipice Sandstone groundwaters, median ion concentrations, ion ratios
and dissolved methane concentrations of identified clusters (methane concentrations were not included in the
HCA)
Cluster
1 Cluster
2 Cluster
3 Cluster
4 Cluster
5
Counts of records
122 55 36 23 73
Percentage of all records
39.50% 17.8% 11.65% 7.45% 23.6%
EC 194.5 373 379 2345 257
(µS/cm)
pH 7.3 7.23 8.19 8.23 6.6
(mg/L)
Na 39.25 38 84.5 555 25
(mg/L)
K (mg/L)
2 4 3 3 2
Ca 1.05 20 1 14 18
(mg/L)
Mg (mg/L)
0.3 7 1 1.5 10
HCO3 96.75 140 194.89 677 143.7
(mg/L)
Cl (mg/L)
9.35 18 20 353 16
SO4 1 15 1 34 1
(mg/L)
F (mg/L)
0.2 0.1 0.95 0.3 0.1
Ca/Na 0.027 0.526 0.012 0.025 0.720
Mg/Na
0.008 0.184 0.012 0.003 0.4
K/Na 0.051 0.105 0.036 0.005 0.080
Na/Cl
4.198 2.11 4.225 1.657 1.563
18 | Hydrochemical assessment of the Hutton and Precipice sandstones in the northern Surat Basin
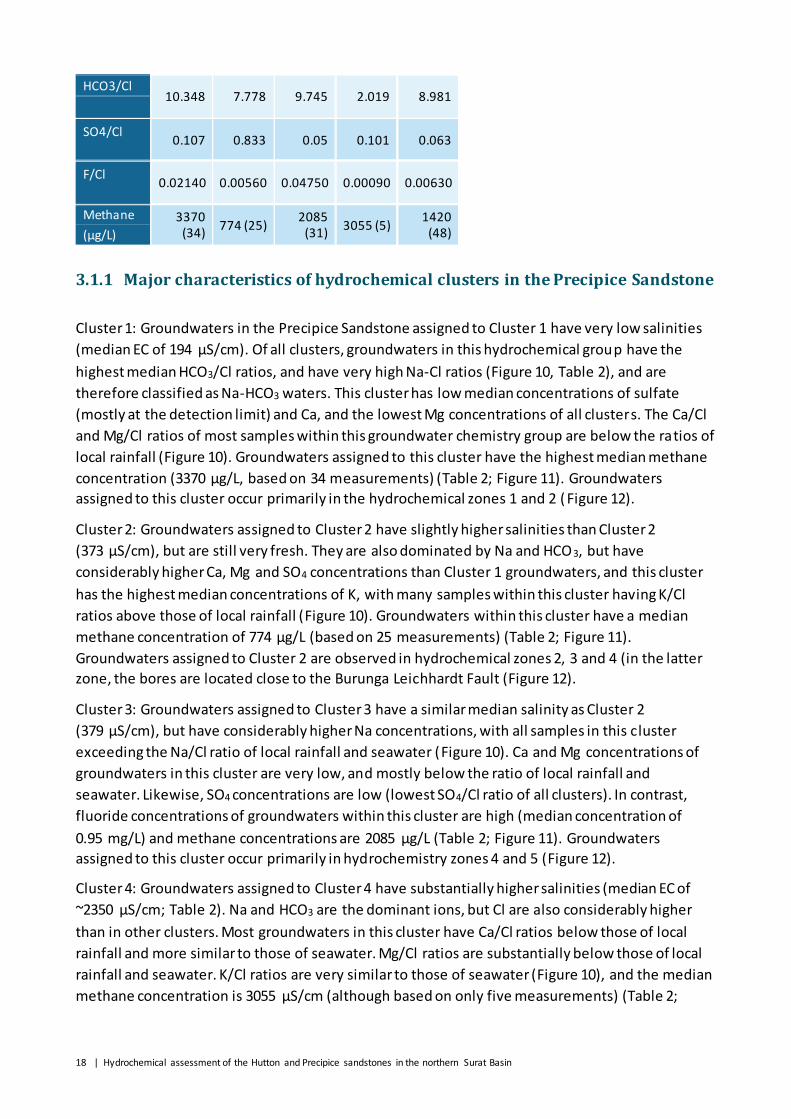
HCO3/Cl 10.348 7.778 9.745 2.019 8.981
SO4/Cl
0.107 0.833 0.05 0.101 0.063
F/Cl
0.02140 0.00560 0.04750 0.00090 0.00630
Methane 3370 (34)
774 (25) 2085
(31) 3055 (5)
1420 (48) (µg/L)
3.1.1 Major characteristics of hydrochemical clusters in the Precipice Sandstone
Cluster 1: Groundwaters in the Precipice Sandstone assigned to Cluster 1 have very low salinities
(median EC of 194 µS/cm). Of all clusters, groundwaters in this hydrochemical group have the
highest median HCO3/Cl ratios, and have very high Na-Cl ratios (Figure 10, Table 2), and are
therefore classified as Na-HCO3 waters. This cluster has low median concentrations of sulfate
(mostly at the detection limit) and Ca, and the lowest Mg concentrations of all clusters. The Ca/Cl
and Mg/Cl ratios of most samples within this groundwater chemistry group are below the ratios of
local rainfall (Figure 10). Groundwaters assigned to this cluster have the highest median methane
concentration (3370 µg/L, based on 34 measurements) (Table 2; Figure 11). Groundwaters
assigned to this cluster occur primarily in the hydrochemical zones 1 and 2 ( Figure 12).
Cluster 2: Groundwaters assigned to Cluster 2 have slightly higher salinities than Cluster 2
(373 µS/cm), but are still very fresh. They are also dominated by Na and HCO3, but have
considerably higher Ca, Mg and SO4 concentrations than Cluster 1 groundwaters, and this cluster
has the highest median concentrations of K, with many samples within this cluster having K/Cl
ratios above those of local rainfall (Figure 10). Groundwaters within this cluster have a median
methane concentration of 774 µg/L (based on 25 measurements) (Table 2; Figure 11).
Groundwaters assigned to Cluster 2 are observed in hydrochemical zones 2, 3 and 4 (in the latter
zone, the bores are located close to the Burunga Leichhardt Fault (Figure 12).
Cluster 3: Groundwaters assigned to Cluster 3 have a similar median salinity as Cluster 2
(379 µS/cm), but have considerably higher Na concentrations, with all samples in this cluster
exceeding the Na/Cl ratio of local rainfall and seawater (Figure 10). Ca and Mg concentrations of
groundwaters in this cluster are very low, and mostly below the ratio of local rainfall and
seawater. Likewise, SO4 concentrations are low (lowest SO4/Cl ratio of all clusters). In contrast,
fluoride concentrations of groundwaters within this cluster are high (median concentration of
0.95 mg/L) and methane concentrations are 2085 µg/L (Table 2; Figure 11). Groundwaters
assigned to this cluster occur primarily in hydrochemistry zones 4 and 5 (Figure 12).
Cluster 4: Groundwaters assigned to Cluster 4 have substantially higher salinities (median EC of
~2350 µS/cm; Table 2). Na and HCO3 are the dominant ions, but Cl are also considerably higher
than in other clusters. Most groundwaters in this cluster have Ca/Cl ratios below those of local
rainfall and more similar to those of seawater. Mg/Cl ratios are substantially below those of local
rainfall and seawater. K/Cl ratios are very similar to those of seawater (Figure 10), and the median
methane concentration is 3055 µS/cm (although based on only five measurements) (Table 2;
Hydrochemical assessment of the Hutton and Precipice sandstones in the northern Surat Basin | 19
Figure 11). Groundwater chemistry samples assigned to this cluster occur primarily in
hydrochemistry zone 6, but can be found locally throughout the northern Surat Basin (Figure 12).
Cluster 5: Groundwaters assigned to Cluster 5 have the second lowest medi an salinities
(257 µS/cm) (Table 2). They have high Ca and Mg concentrations (and thus, high Ca/Cl and Mg/Cl
ratios, which are generally above the ratio of seawater and mostly higher than those of local
rainfall; Figure 10). K/Cl ratios are low (Figure 10), and SO4 concentrations are also low. The
median methane concentration of this cluster is 1420 (based on 48 samples; Table 2 and Figure
11). Groundwaters assigned to this cluster almost exclusively occur in hydrochemistry zone 3
(Figure 12).
Figure 10 Ion/Cl versus electrical conductivity plots and cluster-membership for groundwaters in Precipice
Sandstone groundwaters within the Dawson River catchment in the northern Surat Basin. Rainfall ion ratios are
based on Crosbie et al. (2012).
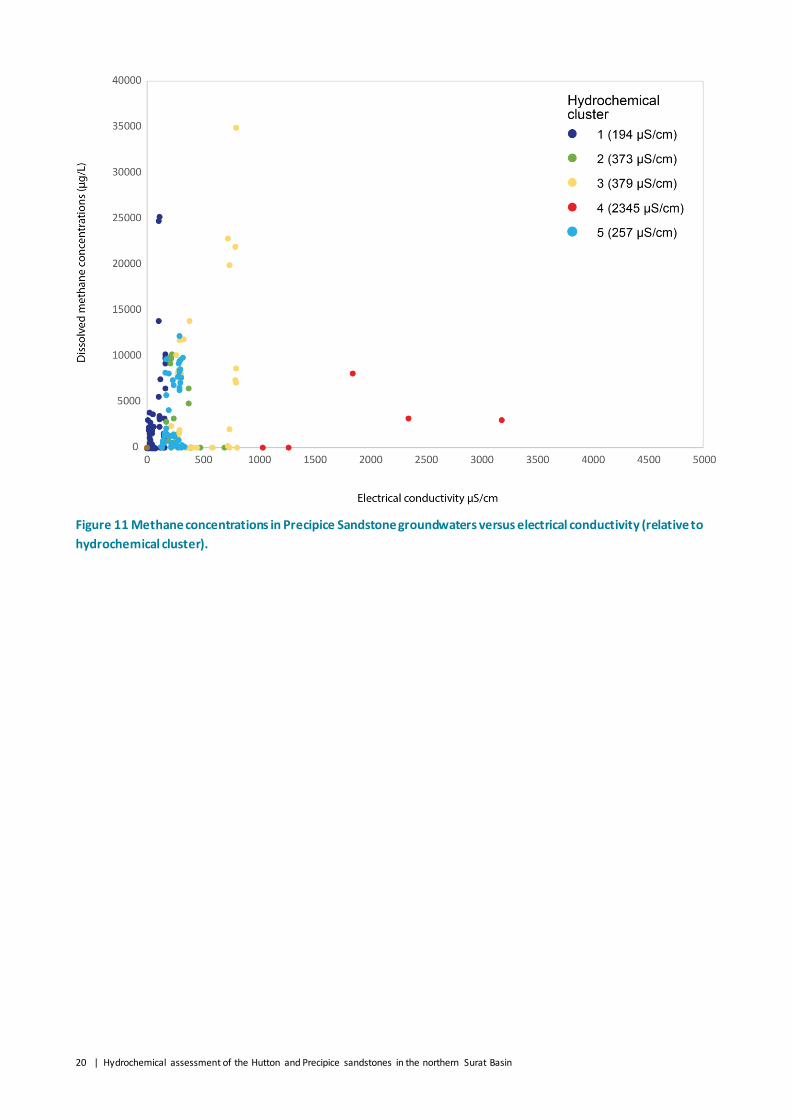
20 | Hydrochemical assessment of the Hutton and Precipice sandstones in the northern Surat Basin
Figure 11 Methane concentrations in Precipice Sandstone groundwaters versus electrical conductivity (relative to
hydrochemical cluster).
Hydrochemical assessment of the Hutton and Precipice sandstones in the northern Surat Basin | 21
Figure 12 Spatial distribution of HCA-derived cluster membership of groundwaters in the Precipice Sandstone. The inset Piper plot shows the median concentrations of each cluster. The potentiometric surface map (for entire Great
Artesian Basin) is based on Ransley and Smerdon (2012)
3.3 Hydrochemical variability within the Hutton Sandstone
The multivariate statistical analysis showed that there are seven hydrochemical groups (clusters)
within the Hutton Sandstone in the northern Surat Basin. The different clusters are marked by
differences in pH, electrical conductivity or ion ratios.

22 | Hydrochemical assessment of the Hutton and Precipice sandstones in the northern Surat Basin
3.3.1 Major characteristics of hydrochemical clusters in the Hutton Sandstone
The major characteristics of each cluster are described below and the spatial context will then be
discussed in the following text for different ‘hydrochemical zones’ (defined in Section 3.2) where
differences could be observed. In comparison to the Precipice Sandstone, the hydrochemistry of
the Hutton Sandstone in the northern Surat Basin is much more variable, with median electrical
conductivities of the seven clusters ranging from 431 µS/cm to 11,000 µS/cm (Table 3), indicating
that the lithological composition of the Hutton Sandstone is much more variable than that of the
Precipice Sandstone.
Cluster 1: Groundwaters assigned to Cluster 1 have a median electrical conductivity of
1150 µS/cm. This cluster has low median Ca, Mg and K concentrations, with most groundwaters
assigned to this cluster showing molar ion/Cl ratios for these parameters below those of local
rainfall and close to or below those of seawater (Figure 13) and low SO4 concentration (mostly at
or close to the detection limit). In contrast, Na and HCO3 versus Cl ratios are high and mostly
above the ratios of local rainfall and seawater (Figure 13). Fluoride concentrations are high
(median of 0.8 mg/L), and this cluster has the second highest median methane concentrations of
all clusters (6160 µg/L; Table 3 and Figure 14). Groundwaters assigned to this cluster primarily
occur in hydrochemistry zones 1 and 2 (Figure 15).
Cluster 2: Groundwaters assigned to Cluster 2 are brackish (electrical conductivity of 2000 µS/cm).
These groundwaters are dominated by Na, HCO3 and Cl. They have Ca/Cl concentrations similar to
local rainfall and mostly above the ratio of seawater, but low Mg (mostly below the Mg/Cl ratio of
local rainfall and similar to those of seawater) (Figure 13). Sulfate concentrations are clearly above
the detection limit, and this cluster has low methane concentrations (median of 11 µg/L, based on
25 samples; Table 3, Figure 14). Groundwaters assigned to this cluster occur close to, but mostly
outside, the outcrops of the Hutton Sandstone (Figure 15).
Cluster 3: Groundwaters assigned to Cluster 3 have low electrical conductivities (median of
947 µS/cm), and are dominated by Na, HCO3 and Cl. Groundwaters within this cluster are
characterised by low median Ca, Mg and K concentrations (with ion/Cl ratios below those of local
rainfall and similar or below those of seawater, Figure 13). Sulfate concentrations are moderate
and fluoride concentrations are low (Table 3). Methane concentrations are low (median methane
concentration of 17.5 µg/L based on 30 samples; Table 3 and Figure 14). Groundwaters assigned
to this cluster primarily occur in hydrochemistry zones 3 and 4 in the north-western and central
northern part of the northern Surat Basin (Figure 15).
Cluster 4: Groundwaters assigned to this cluster are brackish (median electrical conductivity of
3725 µS/cm) and dominated by Na and Cl. Ca concentrations are clearly measurable, but the ratios
of Ca/Cl are lower than those of local rainfall, and similar to those of seawater (Figure 13). Mg
concentrations are also mostly above detection limit, but the Mg/Cl ratios are low and generally
below those of local rainfall. Na/Cl ratios are lower than those of seawater and very similar to the
range of local rainfall (Figure 13). HCO3/Cl ratios are low, and methane concentrations are also
relatively low (median of 302 µS/cm; Figure 14 and Table 3). Groundwaters assigned to this cluster
occur primarily in hydrochemistry zones 4, 5 and 6 in relatively close proximity to the outcrops of
the Hutton Sandstone (Figure 15).
Hydrochemical assessment of the Hutton and Precipice sandstones in the northern Surat Basin | 23
Cluster 5: Groundwaters assigned to Cluster 5 are considerably more saline than those of other
clusters (median electrical conductivity of 11,000 µS/cm; Table 3). They have very high
concentrations of Na and Cl. Ca and Mg concentrations are relatively high and generally above the
detection limit. Their ratios relative to Cl are below those of local rainfall and very similar to those
of seawater (Figure 13). Sulfate concentrations are clearly above the detection limit, and fluoride
concentrations are low (mostly at the detection limit). Only two methane concentrations were
measured for this cluster (Figure 14). Groundwaters assigned to this cluster occur in the north-
eastern part of the northern Surat Basin (hydrochemistry zones 2, 6 and 7; Figure 15).
Cluster 6: Groundwaters assigned to this cluster have very low salinities (median electrical
conductivity of 431 µS/cm; Table 3). Groundwaters of this cluster have high Ca, Mg and K
concentrations (Table 3), and have the highest ratios of these cations relative to Cl (Figure 13), all
of which are higher than those of seawater and many comparable or higher than those of local
rainfall (Figure 14). Sulfate concentrations are mostly above the detection limit, and HCO3/Cl ratios
are high (Figure 15), and most measured methane concentrations are low (median of 16.5 µS/cm;
Table 3 and Figure 13). Groundwaters assigned to this cluster occur almost exclusively in shallower
parts of the basin within the outcrop beds of the Hutton Sandstone in hydrochemistry zones 8, 9
and 10 (Figure 15).
Cluster 7: Groundwaters assigned to Cluster 7 are brackish (median electrical conductivity of
2901 µS/cm; Table 3) and have very high Na and HCO3 concentrations (with the ratios of both ions
mostly above those of local rainfall and seawater; Figure 13). Ca and Mg concentrations are low
and their ratios relative to Cl are below those of local rainfall and seawater (Figure 13). Similarly,
the concentrations of SO4 are very low (mostly at the detection limit), whereas fluoride
concentrations are very high (median of 5 mg/L). Of all clusters in the Hutton Sandstone, this
cluster has the highest median methane concentration (10,163 µS/cm based on 36
measurements), with most groundwaters containing considerable concentrations of dissolved
methane (Figure 14). Groundwaters assigned to this cluster occur primarily in the deeper parts of
the northern Surat Basin in hydrochemistry zones 11, 12 and 13 (Figure 15).
Table 3 Hierarchical Cluster Analysis of Hutton Sandstone groundwaters, median ion concentrations, ion ratios and
dissolved methane concentrations (the latter were not included in the HCA)
Cluster 1 Cluster 2 Cluster 3 Cluster 4 Cluster 5 Cluster 6 Cluster 7
Counts of records
145 107 53 64 35 50 58
Percentage of all records
28.30% 20.90% 10.30% 12.50% 6.80% 9.70% 11.30%
EC 1150 2000 947 3725 11,000 431 2901
(µS/cm)
pH 8.6 7.8 8.7 7.8 7.6 7.2 8.4
Na 273 420 205 677 2050 51 747
(mg/L)
K (mg/L)
1 2 1 4 9.1 2.7 4

24 | Hydrochemical assessment of the Hutton and Precipice sandstones in the northern Surat Basin
Ca 2.2 13.1 3 50.15 262 29.1 3
(mg/L)
Mg (mg/L)
1 1.15 1 7.4 115 8.1 1
HCO3 427 448 229 396 546 196 1169
(mg/L)
Cl (mg/L)
135 401 159 949 3860 28.6 199
SO4 1 34.6 20 56 46 6.2 1
(mg/L)
F (mg/L)
0.8 0.2 0.1 0.15 0.1 0.2 5
Ca/Na 0.008 0.031 0.015 0.074 0.128 0.571 0.004
Mg/Na
0.0036 0.0035 0.0048 0.011 0.056 0.159 0.001
K/Na 0.004 0.004 0.004 0.006 0.004 0.050 0.005
Na/Cl
2.022 1.047 1.289 0.713 0.531 1.786 3.756
HCO3/Cl 3.163 1.117 1.443 0.417 0.142 6.894 5.874
SO4/Cl
0.007 0.086 0.126 0.059 0.012 0.216 0.005
F/Cl 0.00593 0.00050 0.00063 0.00016 0.00003 0.00701 0.02513
Methane (µg/L)
6160 11 17.5 302 2590 16.5 10,163

Hydrochemical assessment of the Hutton and Precipice sandstones in the northern Surat Basin | 25
Figure 13 Ion/Cl versus electrical conductivity plots and cluster-membership for groundwaters in Hutton Sandstone groundwaters within the Dawson River catchment in the northern Surat Basin. Rainfall ion ratios are based on
Crosbie et al. (2012).
26 | Hydrochemical assessment of the Hutton and Precipice sandstones in the northern Surat Basin
Figure 14 Dissolved methane concentrations of Hutton Sandstone groundwaters relative to electrical conductivity
and hydrochemical cluster.
Hydrochemical assessment of the Hutton and Precipice sandstones in the northern Surat Basin | 27
Figure 15 Spatial distribution of HCA-derived cluster membership of groundwaters in the Hutton Sandstone. The
inset Piper plot shows the median concentrations of each cluster. The potentiometric surface map is based on
Ransley and Smerdon (2012). Arrows indicate potential groundwater flow directions.
28 | Hydrochemical assessment of the Hutton and Precipice sandstones in the northern Surat Basin
3.4 Hydrochemical evolution and implications for recharge processes
3.4.1 Precipice Sandstone
Groundwater chemistry data can be used to assess the hydrochemical evolution of groundwaters.
The major characteristics of the five groundwater chemistry clusters described for the Precipice
Sandstone show that there are multiple processes that influence the hydrochemical evolution of
these groundwaters.
At low salinities, many of the groundwaters have ion/Cl ratios higher than those of seawater or
local rainfall (Figure 10), attributed to silicate dissolution or ion exchange. However, with
increasing salinities, these ion/Cl ratios commonly fall below those of seawater or local rainfall
(Figure 10), suggesting that the weathering-derived ions are removed from solution by adsorption
on clay mineral surfaces. Most of the hydrochemical clusters identified for the Precipice Sandstone
have similar electrical conductivities but somewhat different ions/Cl ratios. Many of the
characteristics observed for the Precipice Sandstone groundwaters are also commonly described
for groundwaters that have interacted with coal seams, including the low SO4, Mg, Ca
concentrations and high Na and HCO3 concentrations (e.g. Van Voast, 2003; Mallants et al., 2016).
However, despite some similar hydrochemical characteristics, the Precipice Sandstone differs from
overlying hydrostratigraphic units through its much lower electrical conductivities than adjacent
aquifers, and somewhat similar hydrochemical characteristics do not mean that there is any
hydraulic connection with coal seams, as many of these characteristics are not unique to coal
seams but can form independently in other aquifers with proceeding hydrochemical evolution
through processes such as methanogenesis. Although elevated methane concentrations are often
primarily associated with groundwaters interacting with coal seams (e.g. Papendick et al., 2011),
methane was also observed in many groundwaters within the Precipice Sandstone , and Ransley et
al. (2015) suggested that most groundwaters in the Great Artesian Basin outside the recharge area
contain some methane. Furthermore, the Precipice Sandstone is also recognised as the major
commercial conventional petroleum reservoir in the Surat Basin, with oil and gas primarily trapped
by geological structures, and sealed by the mudstones of the overlying Evergreen Formation
(Randall 2013; Office of Groundwater Impact Assessment, 2016a). Previous work suggested that
the methane in the Precipice Sandstone is of thermogenic origin (Feitz et al., 2014), whereas
methane in the Walloon Coal Measures was described as a mixture of biogenic and thermogenic
methane (Ransley et al., 2015).
The increase in HCO3 is also commonly attributed as a control of precipitation of calcite (CaCO3)
and dolomite (CaMg(CO3)2), which can lead to a reduction of the concentrations of Ca and Mg
(Van Voast, 2003).
Hydrochemical assessment of the Hutton and Precipice sandstones in the northern Surat Basin | 29
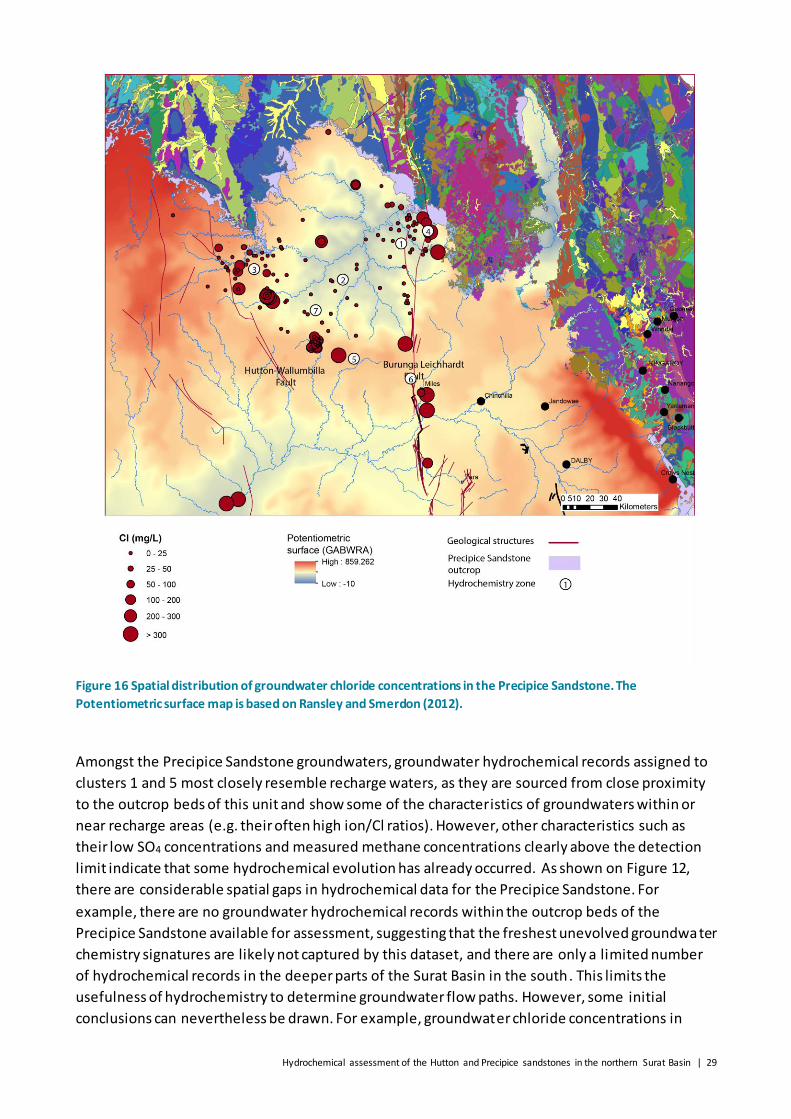
Figure 16 Spatial distribution of groundwater chloride concentrations in the Precipice Sandstone. The
Potentiometric surface map is based on Ransley and Smerdon (2012).
Amongst the Precipice Sandstone groundwaters, groundwater hydrochemical records assigned to
clusters 1 and 5 most closely resemble recharge waters, as they are sourced from close proximity
to the outcrop beds of this unit and show some of the characteristics of groundwaters within or
near recharge areas (e.g. their often high ion/Cl ratios). However, other characteristics such as
their low SO4 concentrations and measured methane concentrations clearly above the detection
limit indicate that some hydrochemical evolution has already occurred. As shown on Figure 12,
there are considerable spatial gaps in hydrochemical data for the Precipice Sandstone. For
example, there are no groundwater hydrochemical records within the outcrop beds of the
Precipice Sandstone available for assessment, suggesting that the freshest unevolved groundwater
chemistry signatures are likely not captured by this dataset, and there are only a limited number
of hydrochemical records in the deeper parts of the Surat Basin in the south. This limits the
usefulness of hydrochemistry to determine groundwater flow paths. However, some initial
conclusions can nevertheless be drawn. For example, groundwater chloride concentrations in
30 | Hydrochemical assessment of the Hutton and Precipice sandstones in the northern Surat Basin
hydrochemistry zone 2 (mostly Cluster 1) tend to be slightly lower than those in hydrochemistry
zone 1 (although groundwaters in both zones have low Cl concentrations, as shown in Figure 16).
Many of the groundwaters in hydrochemistry zone 3 also are assigned to Cluster 1 and have
similarly low Cl concentrations, suggesting that a significant component of groundwater in
hydrochemistry zone 3 may be recharged in zone 2. The presence of groundwaters assigned to
Cluster 4 (Figure 12) and the elevated Cl concentrations (Figure 16) indicate that the Burunga
Leichhardt Fault may form a pathway for interactions between the Precipice Sandstone and
overlying units. This could be further tested through the collection of additional groundwater
chemistry samples and analysis for environmental tracers.
3.4.2 Hutton Sandstone
Similar to the Precipice Sandstone, many different hydrochemical processes can be observed
within the Hutton Sandstone based on the HCA and the groundwater ion/Cl ratios relative to local
rainfall, allowing to infer how groundwater evolution progresses in the northern Su rat Basin. In
contrast to the Precipice Sandstone, Hutton Sandstone groundwaters show a much wider
spectrum of hydrochemical evolution. In contrast to the Precipice Sandstone, hydrochemical
records from within the outcrop area are available for the Hutton Sandstone (Cluster 6
groundwaters in hydrochemical zones 8, 9 and 10; Figure 15). Groundwaters assigned to this
cluster show the characteristics of ‘recharge waters’ such as their elevated ion/Cl ratios (compared
to local rainfall and seawater ratios). Furthermore, unlike groundwaters within the Precipice
Sandstone groundwater chemistry clusters 1 and 5, this Hutton Sandstone groundwater chemistry
cluster lacks any signs of progressing groundwater evolution such as low SO4 concentrations, and
most (but not all) groundwaters have methane concentration close to the detection/reporting
limit. This suggest that these groundwaters indeed represent the start of flow paths , and that
recharge rates to the Hutton Sandstone ae high in this area.
Interestingly, although many groundwaters in hydrochemical zone 5 occur within or near the
recharge area, many of these groundwaters are assigned to Cluster 4, which contains
groundwaters with high Cl concentrations (Figure 17) and ion/Cl ratios indicating that these
groundwaters are considerably more evolved, as previously also observed by Underschultz and
Vink (2015). This indicates that recharge rates here are low, possibly reflecting a different
lithological composition of the Hutton Sandstone in this area compared to the Hutton Sandstone
at the western flanks of the Mimosa Syncline. As for the Precipice Sandstone, there are also
groundwater samples that contain considerable amounts of dissolved methane within the Hutton
Sandstone, and in particular samples assigned to clusters 1 and 7 (Figure 14). Groundwaters
assigned to these cluster also show many of the attributes commonly associated with coal seam
gas groundwaters previously described in this report, and previously described for the Walloon
Coal Measures in this area (Mallants et al., 2016).
The relative good spatial distribution of groundwater chemistry records within the Hutton
Sandstone in the northern Surat Basin allows to draw some conclusion of possible , likely or
unlikely groundwater flow paths. As indicated, groundwater recharge occurs in hydrochemical
zones 8, 9 and 10, and groundwater then for example flows towards hydrochemical zones 1 and 3
(Figure 15 and Figure 17). A northerly groundwater flow direction similar to flow path 1 (Figure 2)
can also not be ruled out based on the hydrochemistry. It is likely that there is a considerable
Hydrochemical assessment of the Hutton and Precipice sandstones in the northern Surat Basin | 31
degree of mixing in hydrochemistry zone 1, including a flow contribution from hydrochemical
zones 3 and 9.
Based on the hydrochemistry, a northerly groundwater flow direction similar to flow path 2 within
the Hutton Sandstone from hydrochemical zone 12 towards zone 13 and 14 is possible, although
there is overall a poor data point density in this central area of the Mimosa Syncline (Figure 15 and
Figure 17). In contrast, a significant groundwater flow component from hydrochemical zone 2
towards hydrochemical zone 12 is unlikely based on the hydrochemical data, as this would require
a down-gradient decrease of the chloride concentration (Figure 17), which is unlikely given the
commonly assumed conservative nature of Cl (e.g. Appello and Postma, 2006). Furthermore, if this
was the case, then a considerable increase of the Cl concentrations between hydrochemical zones
13 to 14 would be expected.
In the northern part of the Mimosa Syncline (hydrochemistry zone 4; Figure 15), the
hydrochemistry shows no distinct pattern, and fresh and brackish groundwaters are interspersed.
This could indicate several things: it could for example mean that recharge from hydrochemistry
zone 10 and the eastern outcrop beds to this deeper part is relatively minor. This could indicate
that much of the infiltrating groundwater discharges rapidly into the Dawson River and its
tributaries rather than contributing towards deep recharge as suggested by other authors based
on the present-day potentiometric surface map (e.g. Ransley et al., 2015; Office of Groundwater
Impact Assessment, 2016). Another possible explanation is that there are various recharge sources
and complex mixing patterns; the presence of relatively saline and evolved groundwaters despite
the proximity to the recharge area could also mean that groundwater flow is localised and possibly
stagnant in some areas within the aquifer.
Unlike for the Precipice Sandstone, there is no indication from the hydrochemistry that the
Burunga Leichhardt Fault acts as a preferential pathway for aquifer interactions. However, it is
important to note that there are only few bores with hydrochemical records located along this
fault in the southern part near Miles (Figure 17).
Overall, the hydrochemical assessment of the Hutton Sandstone suggest that groundwater
recharge and flow patterns in the northern Surat Basin are complex. The observed patterns are
consistent with present-day potentiometric surface maps (see Section 1). However, based on the
available data, a southern flow component can also not be excluded in some areas.

32 | Hydrochemical assessment of the Hutton and Precipice sandstones in the northern Surat Basin
Figure 17 Spatial distribution of chloride concentrations of groundwaters in the Hutton Sandstone. The
potentiometric surface map is based on Ransley and Smerdon (2012).
3.5 Limitations and future steps
The spatial representations of the groundwater chemistry records within the Precipice Sandstone
and Hutton Sandstone highlights that there are not enough groundwater chemistry data within or
near the aquifer outcrop areas and not enough bores with hydrochemical data in the deeper parts
of the Surat Basin. To assess the hydrochemical evolution in sedimentary basins, the
hydrochemical changes occurring from the outcrop beds (and inferred recharge areas) to the
deeper parts of the sedimentary basin should be evaluated. The lack of hydrochemical records in
outcrops and deeper parts of the northern Surat Basin means that these endmembers are not
well-characterised in this part of the Surat Basin.
Where possible and where bores exist, future work should therefore focus particularly on the
outcrop areas and on the central part of the Mimosa syncline (as already partly followed by the
sampling campaign in this project). Furthermore, there are limited surface water chemistry data
available to allow characterising the potential interactions between the aquifers of the northern
Surat Basin and the Dawson River or its tributaries. Current efforts by the OGIA (e.g. OGIA, 2017)

Hydrochemical assessment of the Hutton and Precipice sandstones in the northern Surat Basin | 33
will help to improve the understanding on aquifer-surface water interactions in this area.
Furthermore, the groundwater hydrochemistry data presented in this report could be integrate d
with spring hydrochemistry data to further improve the conceptual hydrogeological model of the
Dawson River catchment.
The formation of methane in these aquifers or migration of methane into these aquifers can be
assessed in more detail using methodologies as presented by Mallants et al. (2016) and where
available, stable isotopes (δ2H and δ13C) of methane.
The similarities in hydrochemistry between the Hutton Sandstone and the Walloon Coal Measures
observed in this study (Figure 7) and by Mallants et al. (2016) can also be further investigated. In
these two studies, CSG production water hydrochemical records for the Walloon Coal Measures
were not included, and the hydrochemical records for the Walloon Coal Measures therefore
represent the shallower parts of the aquifer. Although these aquifers share an interface,
similarities in hydrochemistry do not mean that there is any interaction between these aquifers, as
hydrochemistry can evolve independently in different aquifers for example due to similar recharge
processes or a similar lithological composition. To determine if there is any possible interaction,
the similarities or differences of hydrochemistry in these two aquifers should be evaluated
spatially; this could be further supplemented through the application of other environmental
tracers to isotopically ‘fingerprint’ the groundwater in each aquifer (e.g. 87Sr/86Sr or the stable
isotopes (δ2H and δ13C) of methane).
The hydrochemical approach applied in this project should also be extended to the e astern part of
the Surat Basin; this would allow to further test/refine the whole-of-basin hydrodynamics and help
to identify major data and knowledge gaps.
The influence of faults as potential pathways linking deeper and shallower formation could be
further explored through the collection of samples for environmental tracers at multi -level
monitoring sites. Although samples were already collected for the Hutton Sandstone and Precipice
Sandstone by Suckow et al. (2016) and in this project, this could be extended to other aquifers at
selected sites.
The bore aquifer assignment continues to be a considerable limitation for the hydrochemical
assessments particularly near the recharge areas, where bores are widely spaced and where only
few exploration bores exist. This issue could be addressed in future studies, e.g. by using
geophysical wireline logging instruments to ascertain the screened formation of bores in these
areas.
In the next step of this GISERA project, the data and knowledge from this report will be used to
inform Task 4 of the project ‘Constraining groundwater flow rates in the Surat Basin through
environmental tracer and hydrochemical data’. This will involve reactive transport modelling and
inverse geochemical modelling to quantitatively test di fferent hypotheses on groundwater flow
processes in the northern Surat Basin.
34 | Hydrochemical assessment of the Hutton and Precipice sandstones in the northern Surat Basin
4 Conclusions
Hydrochemical data were used to assess the hydrochemical evolution and groundwater dynamics
within the Dawson River catchment in the northern Surat Basin. The aim was to determine if there
is a northerly groundwater flow component as suggested previously based on potentiometric
surface developments.
The focus of this assessment were two key aquifers, the Hutton Sandstone and Precipice
Sandstone, which are both extensively used for agricultural purposes and (in case of the Precipice
Sandstone) as town water supplies. Prior to the hydrochemical assessment, extensive checks on
the hydrostratigraphic unit at the screened interval were conducted to ensure that only
hydrochemical records from bores where the screened aquifer is known were included in the
assessment.
Following the data quality control checks, multivariate statistical techniques were used to identify
patterns within the hydrochemical datasets. Median concentrations of the identified clusters were
compared and the ratios of major ions relative to chloride in groundwater were compared with
those in local rainfall to assess how groundwater evolution progresses within these aquifers. The
hydrochemistry within the Precipice Sandstone is much more uniform than within the Hutton
Sandstone. It also demonstrated that multiple processes influence the hydrochemical evolution of
groundwater in these aquifers. Fresh groundwaters are primarily influence d by ion exchange and
silicate dissolution, whereas more hydrochemically evolved groundwaters show signs of calcite
and dolomite precipitation, sulfate reduction and methanogenesis. As indicated in previous
studies, methane is present in both major aquifers investigated in this study. Whether this is
produced in situ within these aquifers or has migrated from deeper formations could form part of
future investigations.
The spatial assessment of the hydrochemistry allowed to draw several conclusions on
groundwater flow paths, recharge processes and the influence of faults as pathways for aquifer
connectivity. For example, several recharge areas within the Hutton and Precipice sandstone
aquifers were identified. Some of the flow paths previously proposed based on potentiometric
surface could not be excluded based on the hydrochemical evidence, whereas others were
characterised as less likely. Elevated groundwater salinities within the Precipi ce Sandstone near
the Burunga Leichhardt Fault that are considerably higher than in most other areas within this
aquifer suggest that this fault may form a pathway that links this aquifer to over- or underlying
units.
The assessment of hydrochemistry highlighted the value of baseline hydrochemical data. The
project also highlighted the lack of hydrochemical data within the recharge areas and within the
deeper parts of the Hutton Sandstone and particularly within the Precipice Sandstone in the
northern Surat Basin as key knowledge gaps; further efforts to close these knowledge gaps could
facilitate further improvement of the conceptual understanding of groundwater flow and
hydrochemical evolution within these formations.

Hydrochemical assessment of the Hutton and Precipice sandstones in the northern Surat Basin | 35
The hydrochemical assessment conducted in this component of the project wi ll inform the next
steps of this GISERA project, namely the reactive transport and inverse geochemical modelling.
36 | Hydrochemical assessment of the Hutton and Precipice sandstones in the northern Surat Basin
5 References
Appelo CAJ and Postma D (2006). Geochemistry, Groundwater and Pollution. Rotterdam
Cartwright I, Weaver TR, Fulton S, Nichol C, Reid M and Cheng X (2004) Hydrogeochemical and
isotopic constraints on the origins of dryland salinity, Murray Basin, Victoria, Australia.
Applied Geochemistry 19(8), 1233–1254. doi: 10.1016/j.apgeochem.2003.12.006
Cloutier V, Lefebvre R, Therrien R and Savard MM (2008) Multivariate statistical analysis of
geochemical data as indicative of the hydrogeochemical evolution of groundwater in a
sedimentary rock aquifer system. Journal of Hydrology 353, 294–313. doi:
10.1016/j.jhydrol.2008.02.015
Cook AG, Bryan SE and Draper JJ (2013) Post-orogenic Mesozoic basins and magmatism. In: Jell PA
(ed) Geology of Queensland. pp 515–576.
Crosbie RS, Morrow D, Cresswell RG, Leaney FW, Lamontagne S and Lefournour M (2012) New
insights into the chemical and isotopic composition of rainfall across Australia. CSIRO Water
for a Healthy Country Flagship, Australia.
Daughney CJ, Morgenstern U, van der Raaij R and Reeves RR (2010) Discriminant analysis for
estimation of groundwater age from hydrochemistry and well construction: appli cation to
New Zealand aquifers. Hydrogeology Journal 18(2), 417–428. doi:10.1007/s10040-009-0479-
2
Davis SN, Whittemore DO, and Fabryka-Martin J (1998) Uses of chloride/bromide ratios in studies
of potable water. Ground Water 36, 338–351. doi: 10.1111/j.1745-6584.1998.tb01099.x
Davis SN, Cecil L, Zreda M and Moysey S (2001) Chlorine-36, bromide, and the origin of spring
water. Chemical Geology 179, 3–16. doi: 10.1016/S0009-2541(01)00312-6
DNRM (2016) Department of Natural Resources and Mines groundwater database.
Drever JI (1997) The Geochemistry of Natural Waters. Surface and Groundwater Environments.
Prentice-Hall, Englewood Cliffs, NJ.
Edwards M and Webb J (2009) The importance of unsaturated zone biogeochemical processes in
determining groundwater composition, southeastern Australia, Hydrogeology Journal 17(6),
1359–1374. doi: 10.1007/s10040-009-0449-8
Farnham IM, Singh AS, Stetzenbach KJ and Johannesson KH (2002) Treatment of nondetects in
multivariate analysis of groundwater geochemistry data. Chemometrics and Intelligent
Laboratory Systems 60, 265–281. doi: 10.1016/S0169-7439(01)00201-5
Feitz A, Ransley T, Hodgkinson J, Preda M, Dunsmore R, McKillop J, Spulak R, Dixon O, Kuske T and
Draper J (2014) GA-GSQ Hydrochemistry dataset (2009-2011). GEOCAT No. 78549,
Geoscience Australia, Canberra.
Geoscience Australia (2013) Great Artesian Basin groundwater recharge estimates. Bioregional
Assessment Source Dataset. Viewed 29 February 2016,

Hydrochemical assessment of the Hutton and Precipice sandstones in the northern Surat Basin | 37
http://data.bioregionalassessments.gov.au/dataset/fb93be54-4101-4130-9138-
215bec4bdad0
Geoscience Australia (2014) Groundwater Hydrochemical Characterisation of the Surat Region and
Laura Basin —Queensland. Geoscience Australia, National Collaborative Framework
Hydrochemical Characterisation Project - Surat Basin Hydrochemistry Spreadsheets.
Bioregional Assessment Source Dataset. Viewed 02 May 2016,
http://data.bioregionalassessments.gov.au/dataset/8e5cade2-c95a-45ec-9e6e-
39b136d2b6d6
Gray ARG, McKillop M and McKellar JL (2002) Eromanga Basin stratigraphy. In: Draper JJ (ed)
Geology of the Cooper and Eromanga basins, Queensland. Queensland Minerals and Energy
Review Series, Queensland Department of Natural Resources and Mines, Brisbane, pp 30–
56.
Green PM (1997) Cooper–Eromanga basins project progress report. Queensland Government
Mining Journal 98, 39–44.
Güler C, Thyne GD, McCray JE and Turner KA (2002) Evaluation of graphical and multivariate
statistical methods for classification of water chemistry data. Hydrogeology Journal 10(4),
455–474. doi:10.1007/s10040-002-0196-6
Guggenmos MR, Daughney CJ, Jackson BM and Morgenstern U (2011) Regional -scale identification
of groundwater-surface water interaction using hydrochemistry and multivariate statistical
methods, Wairarapa Valley, New Zealand. Hydrology and Earth System Sciences 15, 3383–
3398. doi:10.5194/hess-15-3383-2011.
Helsel DR and Hirsch RM (2002) Statistical methods in water resources. Techniques of Water-
Resources Investigations of the United States Geological Survey. Book 4, Hydrologic Analysis
and Interpretation, 524 pp.
Hodgkinson J and Grigorescu M (2013) Background research for selection of potential geostorage
targets—case studies from the Surat Basin, Queensland. Australian Journal of Earth Sciences
60(1), 71-89. doi:10.1080/08120099.2012.662913
Hodgkinson J, Hortle A and McKillop M (2010) The application of hydrodynamic analysis in the
assessment of regional aquifers for carbon geostorage: preliminary results for the Surat
Basin, Queensland. The APPEA Journal 50(1), 1‐18. doi: 10.1071/AJ09027
John BH and Almond CS (1987) Lithostratigraphy of the lower Eromanga Basin sequence in south
west Queensland. The APPEA Journal 27(1), 196–214. doi: 10.1071/AJ86017
Kellett JR, Ransley TR, Coram J, Jaycock J, Barclay DF, McMahon GA, Foster LM and Hillier JR (2003)
Groundwater recharge in the Great Artesian Basin Intake beds, Queensland. Final Report for
NHT Project 982713 Sustainable Groundwater use in the GAB Intake Beds, Natural Resources
and Mines, Queensland.
Mallants D, Raiber M and Davis P (2016) Decision Support System for Investigating Gas in Water
Bores and Links to Coal Seam Gas Development. Report prepared by CSIRO for the
Queensland Department of Natural Resources and Mines. PDF available from
http://bit.ly/2qV5deA
38 | Hydrochemical assessment of the Hutton and Precipice sandstones in the northern Surat Basin
Mallants D, Apte S, Kear J, Janardhanan S, Gonzalez D, Williams M, Chen Z, Kookana R, Taylor A,
Raiber M, Bruce J and Prommer H (2017) Deeper groundwater hazard screening research:
National assessment of chemicals associated with coal seam gas extraction in Australia.
CSIRO, Canberra.
Menció A and Mas-Pla J (2008) Assessment by multivariate analysis of groundwater–surface water
interactions in urbanized Mediterranean streams. Journal of Hydrology 352, 355–366. doi:
10.1016/j.jhydrol.2008.01.014
Moore PS, Pitt GM and Dettmann ME (1986) The Early Cretaceous Coorikiana Sandstone and
Toolebuc Formation: their recognition and stratigraphic relationship in the south-western
Eromanga Basin. Geological Society of Australia Special Publication 12, 97–114.
Office of Groundwater Impact Assessment (2016) Underground Water Impact Report for the Surat
Cumulative Management Area. Department of Natural Resources and Mines Office of
Groundwater Impact Assessment, 270 pages.
Office of Groundwater Impact Assessment (2017) Identification of gaining streams in the Surat
Cumulative Management Area. Department of Natural Resources and Mines Office of
Groundwater Impact Assessment, 48 pages.
Papendick SL, Downs KR, Vo KD, Hamilton SK, Dawson GKW, Golding SD and Gilcrease PC (2011)
Biogenic methane potential for Surat Basin, Queensland coal seams. International Journal of
Coal Geology 88, 123–134. doi:10.1016/j.coal.2011.09.005
Pearce BR, Hansen J and Jackson J (2006) Hydrogeological investigation of the Dawson River sub -
catchment, Central Queensland, Australia. Queensland Department of Natural Resources,
Mines and Water, Brisbane, 296 p.
Raiber, M., White, P.A., Daughney, C.J., Tschritter, C., Davidson, P. and Bainbridge, S.E. (2012).
Three-dimensional geological modelling and multivariate statistical analysis of water
chemistry data to analyse and visualise aquifer structure and groundwater composition in
the Wairau Plain, Marlborough District, New Zealand. Journal of Hydrology, 436-437, p 13-
34.
Randall R (2013). Mineral and Energy Resources – Petroleum in: Geology of Queensland, ed. Jell
PS, Geological Survey of Queensland, Brisbane, pp. 739-749.
Ransley TR and Smerdon BD (eds) (2012) Hydrostratigraphy, hydrogeology and system
conceptualisation of the Great Artesian Basin. A technical report to the Australian
Government from the CSIRO Great Artesian Basin Water Resource Assessment. CSIRO Water
for a Healthy Country Flagship, Canberra. doi: 10.4225/08/584c457b1676f
Ransley TR, Somerville PD, Tan KP, Feitz AJ, Cook S, Yates G, Schoning G, Caruana L, Sundaram B
and Wallace LJ (2015) Groundwater hydrochemical characterisation of the Surat Region and
Laura Basin - Queensland. Record 2015/05. Geoscience Australia, Canberra.
doi:10.11636/Record.2015.005
Stetzenbach KJ, Farnham IM, Hodge VF and Johannesson KH (1999) Using multivariate statistical
analysis of groundwater major cation and trace element concentrations to evaluate
groundwater flow in a regional aquifer. Hydrological Processes 13, 2655–2673.
doi:10.1002/(SICI)1099-1085(19991215)13:17<2655::AID-HYP840>3.0.CO;2-4
Hydrochemical assessment of the Hutton and Precipice sandstones in the northern Surat Basin | 39
Suckow, A., Taylor, A., Davies, P. and Leaney, F. (2016). Geochemical Baseline Monitoring, final
report, CSIRO Australia.
Underschultz J and Vink S (2015) Emerging Complexity of the Great Artesian Basin Aquifer Systems
in the Surat. International Conference and Exhibition, Melbourne, Australia 13-16 September
2015: pp. 46-46. doi: 10.1190/ice2015-2205979
Van Voast WA (2003) Geochemical signature of formation waters associated with coalbed
methane. AAPG Bulletin 87(4), 667–676.
Welsh W, Herron N, Rohead-O’Brien H, Ransley T, Aryal S, Mitchell P, Buckerfield S and Marshall S
(2014) Context statement for the Maranoa-Balonne-Condamine subregion. Product 1.1 for
the Maranoa-Balonne-Condamine from the Northern Inland Catchments Bioregional
Assessment. Department of the Environment, Bureau of Meteorology, CSIRO and
Geoscience Australia, Australia.
Whitehouse FW (1952) The Mesozoic environments of Queensland. Report of the Australian and
New Zealand Association for the Advancement of Science 29, 83–106.
Whitehouse FW (1955) The geology of the Queensland portion of the Great Australian Artesian
Basin. Appendix G. In: Artesian water supplies in Queensland, Department of the Co-
ordinator General of Public Works, Queensland Parliamentary Papers, no. A.56–1955, pp. 1–
20.
Zuber, A., K. Różański, J. Kania, and R. Purtschert (2011), On some methodological problems in the
use of environmental tracers to estimate hydrogeologic parameters and to calibrate flow
and transport models, Hydrogeology Journal, 19(1), 53-69.