Health Impact Assessment:
306
ÉCOLE DOCTORALE Abbé-Grégoire Laboratoire Interdisciplinaire de Recherche en Sciences de l’Action FACULDADE DE MEDICINA DA UNIVERSIDADE DE LISBOA Instituto de Medicina Preventiva & Saúde Pública e Instituto de Saúde Ambiental THÈSE présentée par : Leonor BACELAR-NICOLAU soutenue le : 19 décembre 2017 pour obtenir le grade de : Docteur du Conservatoire National des Arts et Métiers Discipline : Sciences de Gestion / Spécialité : Économie de la Santé Doutor pela Universidade de Lisboa Disciplina: Ciências e Tecnologias da Saúde / Especialidade : Organização e Gestão em Saúde Health Impact Assessment: Quantifying and Modeling to Better Decide THÈSE dirigée par : SAPORTA Gilbert Professeur Emérite, Conservatoire National des Arts et Métiers PEREIRA MIGUEL José Professeur Emérite, Faculdade de Medicina da Universidade de Lisboa JURY : BLIEBERNICHT DUCLA Président du Jury, Professeur, Vice-Président du Conseil SOARES José Luís Scientifique de Faculdade de Medicina da Universidade de Lisboa RIBEIRO Ruy Professeur, Faculdade de Medicina da Universidade de Lisboa DAB William Professeur, Conservatoire National des Arts et Métiers COSTA PEREIRA Altamiro Professeur, Faculdade de Medicina da Universidade do Porto VAZ CARNEIRO António Professeur, Faculdade de Medicina da Universidade de Lisboa TORGAL DIAS GARCIA Professeur, Faculdade de Ciências Médicas da Universidade Jorge Manuel Nova de Lisboa (NOVA Medical School)
-
Upload
khangminh22 -
Category
Documents
-
view
1 -
download
0
Transcript of Health Impact Assessment:

ÉCOLE DOCTORALE Abbé-Grégoire
Laboratoire Interdisciplinaire de Recherche en Sciences de l’Action
FACULDADE DE MEDICINA DA UNIVERSIDADE DE LISBOA Instituto de Medicina Preventiva & Saúde Pública e Instituto de Saúde Ambiental
THÈSE présentée par :
Leonor BACELAR-NICOLAU soutenue le : 19 décembre 2017
pour obtenir le grade de :
Docteur du Conservatoire National des Arts et Métiers Discipline : Sciences de Gestion / Spécialité : Économie de la Santé
Doutor pela Universidade de Lisboa Disciplina: Ciências e Tecnologias da Saúde / Especialidade : Organização e Gestão em Saúde
Health Impact Assessment: Quantifying and Modeling to Better Decide
THÈSE dirigée par : SAPORTA Gilbert Professeur Emérite, Conservatoire National des Arts et Métiers PEREIRA MIGUEL José Professeur Emérite, Faculdade de Medicina da Universidade de
Lisboa JURY :
BLIEBERNICHT DUCLA Président du Jury, Professeur, Vice-Président du Conseil SOARES José Luís Scientifique de Faculdade de Medicina da Universidade de Lisboa RIBEIRO Ruy Professeur, Faculdade de Medicina da Universidade de Lisboa DAB William Professeur, Conservatoire National des Arts et Métiers COSTA PEREIRA Altamiro Professeur, Faculdade de Medicina da Universidade do Porto VAZ CARNEIRO António Professeur, Faculdade de Medicina da Universidade de Lisboa TORGAL DIAS GARCIA Professeur, Faculdade de Ciências Médicas da Universidade Jorge Manuel Nova de Lisboa (NOVA Medical School)

Page ii/xlix Leonor Bacelar Nicolau PhD Thesis

Leonor Bacelar Nicolau PhD Thesis Page iii/xlix
Universidade de Lisboa Faculdade de Medicina de Lisboa
Conservatoire National des Arts et Métiers
Avaliação de Impacte na Saúde: Quantificar e Modelizar para Melhor Decidir
Évaluation d'Impact sur la Santé: Quantifier et Modéliser pour Mieux Décider
Health Impact Assessment: Quantifying and Modeling to Better Decide
Leonor Bacelar Valente da Costa Nicolau
Orientadores / Encadrants/ Thesis Supervisors Prof. Doutor José Pereira Miguel
Prof. Doutor Gilbert Saporta
Tese especialmente elaborada para obtenção do grau de Doutor em Ciências e Tecnologias da Saúde com Especialidade em Organização e Gestão em Saúde pela Universidade de Lisboa
Thèse élaborée pour l’obtention du grade de Docteur en Sciences de Gestion, Spécialité en Économie de la Santé au Conservatoire des Arts et Métiers
Thesis prepared to obtain the degree of PhD in Sciences and Health Technologies, Specialty in Health Management from Universidade de Lisboa and
Management Sciences, Specialty in Health Economics from Conservatoire National des Arts et Métiers
Júri / Jury /Jury : Presidente/Président/President : Doutor José Luís Bliebernicht Ducla Soares, Professor Catedrático em regime de tenure e Vice-Presidente do Conselho Científico da Faculdade de Medicina da Universidade de Lisboa Vogais/Membres/Members : Doutor William Dab, Professeur titulaire de la chaire d’Hygiène et Sécurité ; responsable des enseignements de sécurité sanitaire du Conservatoire National des Arts et Métiers ; Directeur de l’École Sciences industrielles et technologies de l’information – SITI, Paris, França ; Doutor Gilbert Marc Vital Saporta, Professeur Émérite de Statistique Appliquée du Conservatoire National des Arts et Métiers, Paris, França ; (co-Orientador) Doutor Altamiro Manuel Rodrigues da Costa Pereira, Professor Catedrático da Faculdade de Medicina da Universidade do Porto; Doutor Jorge Manuel Torgal Dias Garcia, Professor Catedrático da Faculdade de Ciências Médicas da Universidade Nova de Lisboa; Doutor António Cândido Vaz Carneiro, Professor Associado com Agregação da Faculdade de Medicina da Universidade de Lisboa; Doutor Ruy Miguel Sousa Soeiro de Figueiredo Ribeiro, Professor Associado com Agregação da Faculdade de Medicina da Universidade de Lisboa.
Partially funded by FCT, QREN, COMPETE (HMSP-ICT/0013/2011) through the CUTEHeart Project
2017

Page iv/xlix Leonor Bacelar Nicolau PhD Thesis

Leonor Bacelar Nicolau PhD Thesis Page v/xlix
As opiniões expressas nesta publicação são
da exclusiva responsabilidade da sua autora.
Les opinions exprimées dans cette publication
sont la responsabilité exclusive de l’auteur.
The opinions expressed in this publication are
the sole responsibility of its author.

Page vi/xlix Leonor Bacelar Nicolau PhD Thesis

Leonor Bacelar Nicolau PhD Thesis Page vii/xlix
À minha Família
À ma Famille
To my Family
“Life is a travelling to the edge of knowledge, then a leap taken.”
D. H. Lawrence
“Sound policies rest on good information.” Frederick Mosteller
“I find your lack of faith disturbing” Darth Vader

Page viii/xlix Leonor Bacelar Nicolau PhD Thesis
Foreword and acknowledgements
Family legend says my first PhD jury was faced decades ago inside my mother’s belly in
Paris. It also tells us that I was genetically conditioned to follow a professional life where
multivariate data analysis would inevitably be present, both from my mother’s and my
father’s side. Reality makes it obvious that I would be glad only to be half as brilliant as
both my parents are regarding multivariate data analysis. However, one of the most
important things I have definitively managed to learn from them was their love and drive
to make multivariate statistics and data analysis related methods understandable and
useful for all, to make it practical, data-focused, multidisciplinary: a truly visionary way of
looking at something that is nowadays called data science.
Through my parents I also had the wonderful opportunity of simultaneously falling in love
with travelling and meeting some of the greatest statistical brains from our time. Being a
teenager and accompanying them to scientific conferences, I would take advantage of
them actually spending their time at the venue and use all their vouchers for the social
programmes (usually very rich in every meeting at the time). Languages skills from the
Lycée français Charles Lepierre at Lisbon were, from then on, a very useful tool. Meeting
all these researchers, including Gilbert Saporta, both in a professional but casual
environment, listening to their discussions, interacting and participating in some of the
less scientific conversations was a privilege that I then took for granted, only truly valued
later in my life, but that I now truly cherish.
An economics “brain wash” at Nova Business School and brilliant teachers such as Pedro
Pita Barros and José António Pinheiro confirmed me the power of numbers and statistics
and their application to reality: macro and microeconomics settings joined marketing,
opportunity costs and sustainability concerns, everything always measurable in terms of
money-value, ROI, utilities, willingness-to-pay and risk expectations.
The following professional experiences at INE and Metris (now GfK-Metris) gave me the
privilege of understanding how to collect data and transform information into knowledge
both in public and private statistical environments. Further experience in the private

Leonor Bacelar Nicolau PhD Thesis Page ix/xlix
sector, in my own firm, increased my certainty that data and statistics are most useful to
non-statisticians, the more one is able to reach them and show them the added value of
understandable, visual statistical results.
In an era of Big Data, of secondary data more and more integrated with primary data,
being able to apply reliable and accurate multivariate statistical methods to ever and
faster growing amounts of data, generating useful and easy to understand results is of the
utmost importance. The challenge is even bigger when one tries to explain all this
complexity to non-statisticians and aims to convince them of its usefulness to their
everyday professional practice.
Disseminating the practical use of these methodologies within medical education settings
is thus vital to guaranty an easier understanding of their value, encourage further
research, increase its use in every-day life. Training and teaching statistics and economics
to health professionals that so often have engraved an aversion to numbers into their
minds and attitude is indeed a constant personal challenge. Since I began my work at FM
UL, more than 13 years ago, few things though are more rewarding then one succeeding
and suddenly watching understanding and interest illuminating students’ eyes, of finding
old students, sometimes years later, acknowledging the usefulness of one’s classes and
taught contents and case studies.
Despite all these clues and professional tracks traveled, my PhD pathway only became
clear though when José Pereira Miguel made me see the beauty of public health, health
promotion, equity and health policies and interventions as ways to contribute to the
wellbeing of many in one go and throughout time in the long run. All these past
experiences of multivariate data analysis, economics evaluation, private and public
practice, academic and real-world environments seemed to come together when I tried
to accomplish this PhD and contribute to further quantification in Health Impact
Assessment of public health interventions. It only seemed natural to involve Gilbert
Saporta, one of the few statisticians that I know that most successfully incarnates sound
multivariate statistics, interdisciplinarity, applicability both academic and in real-world, an
unselfish fondness to disseminate knowledge and a data science drive.
Every PhD work is just a beginning, a pathway that lead us forward into other paths,
where one has a chance to improve on its research, to expand it to heights one wishes to

Page x/xlix Leonor Bacelar Nicolau PhD Thesis
be valuable, useful not just for us but to others we may touch and influence with our
positive energy. It may seem rather lonely sometimes, but a PhD work is never one
person’s travel but a team work, feeding on others knowledge, experiences and support.
I thus would like to thank…
… my dear Family for all their love, patience, support and for being who they are and
making me who I am: both loves of my life André and Topê, my beloved, admired and
cherished parents and sister, Helena, Fernando and Paula, and those loved ones who are
always with us in spirit,
… my Mentor José Pereira Miguel, who offered me challenges, wisdom, a role model and
trust and contributed so much to increase my sense of perfectionism, pride in the search
for professionalism and thirst for knowledge,
… my invaluable Councilor Gilbert Saporta, who trusted my skills, guided me often too
patiently for my own good and illuminated my path with his precious and powerful
insights,
… my Friend and Colleague Teresa Rodrigues who gave me strength, energies and advise
in times of trouble and need,
… my Colleagues, and now Friends, from the CUTEHeart Project who offered me advice,
knowledge, experience and support from all the way across rivers and oceans, most often
far away in miles but close to my heart, Mariana Lobo, Claudia Nisa and Altamiro Costa
Pereira from Porto, Armando Teixeira Pinto from Sydney, Elisabete Fernandes nearest
from Lisbon, Vanessa Azzone and Sharon-Lise Normand from Boston,
… my Colleagues Antónia Ferreira for her priceless and relentless help through the
administrative pitfalls over the years and Sofia Amador and André Silva for their ever-
available support in finding the unfindable through the infinite labyrinth of bibliographical
references,
… all Colleagues, Co-workers, Family and Friends, who helped and supported me
throughout this sometimes seemingly never-ending story, always believing that I would
reach safe port in a near future.

Leonor Bacelar Nicolau PhD Thesis Page xi/xlix
Table of Contents
Figure Index .................................................................................................................................................. xiv Table Index ................................................................................................................................................... xvi Abbreviations............................................................................................................................................... xvii Graphical Abstract, Summary, Keywords .................................................................................................... xviii Resumo Gráfico, Resumo, Palavras-chave ................................................................................................. xxii Résumé Graphique, Résumé, Mots-clés ...................................................................................................... xxvi Résumé Substantiel en Français .................................................................................................................. xxxi Chapter 1 – Introduction and Main Research Aims ................................................................................ 1 1. Introduction ............................................................................................................................ 2 1.1. Health and Determinants of Health ............................................................................................ 2 1.2. Social health determinants and health inequality and inequity ................................................. 4 1.3. Health Impact Assessment - definition ....................................................................................... 5 1.4. HIA of policies from the health sector versus other sectors ....................................................... 8 1.5. Timings of HIA: prospective, concurrent or retrospective ......................................................... 10 1.6. Quantification ............................................................................................................................ 11 1.7. Integration with other methodological approaches .................................................................. 12 1.8. Reaching out to decision makers ............................................................................................... 14 1.9. Practice in Portugal and in other countries ................................................................................ 15 1.10. What this research adds ........................................................................................................... 16 2. Research Aims ........................................................................................................................... 18 2.1. Main Aim ................................................................................................................................. 18 2.2. General Goals ............................................................................................................................. 18 2.3. Stages and Chapters ................................................................................................................... 19 References ....................................................................................................................................... 20
Chapter 2 – Exploring and Profiling through the State of the Art .......................................................... 25 Abstract ............................................................................................................................................ 26 1. Introduction ............................................................................................................................... 28 2. Data and Methodologies ............................................................................................................. 29 2.1. HIA Guides Dataset ................................................................................................................... 29 2.2. HIA Papers Dataset ................................................................................................................... 30 3. Results ........................................................................................................................................ 33 3.1. Summarizing systematic reviews in a more “visual” way ......................................................... 33 3.2. Going even further in automatizing and visualizing systematic reviews’ information ............. 37 3.2.1. Text mining analysis on the Titles of papers ................................................................. 38 3.2.2. Text mining analysis on the Keywords of papers .......................................................... 40 4. Discussion ................................................................................................................................... 44 4.1. Automation towards effectiveness ........................................................................................... 44 4.2. Even further automation towards effectiveness ...................................................................... 45 4.3. Linking quantification to monetary costs ................................................................................. 46 4.4. Limitations and Future Activities .............................................................................................. 47 5. Conclusions ................................................................................................................................. 47 References ....................................................................................................................................... 48

Page xii/xlix Leonor Bacelar Nicolau PhD Thesis
Chapter 3 – Contribution of Hierarchical Cluster Analysis to the Health Impact Assessment Screening Step ................................................................................................................................. 51 SubChapter 3.1 – Screening Hospital Reform Policies for Health Impact Assessment: easier decision making through cluster analysis ......................................................... 51 Abstract ................................................................................................................................. 52 1. Introduction ................................................................................................................................ 54 2. Materials and methods ............................................................................................................... 56 2.1. Data ....................................................................................................................................... 56 2.2. Statistical Methodologies ...................................................................................................... 57 3. Results ................................................................................................................................. 58 3.1. Exploring the 76 policies total sample ................................................................................... 58 3.2. Selecting a 7 Clusters Partition .............................................................................................. 59 3.3. Analyzing the quality of the 7 clusters partition .................................................................... 60 3.4. Using Complementary Methods: Principal Components Analysis and Multiple Correspondence Analysis ........................................................................................ 61 4. Discussion ................................................................................................................................. 63 4.1. Ranking Clusters to Prioritize Policies .................................................................................... 63 4.2. Clusters, Policies and Action Areas ........................................................................................ 66 4.3. Swift Response to changes in priority criteria ....................................................................... 68 4.4. Limitations and future paths of research ............................................................................... 69 5. Conclusions ................................................................................................................................. 70 References ................................................................................................................................. 71
SubChapter 3.2 – Screening National Health Programs for Health Impact Assessment: targeting policies with cluster analysis ....................................................................... 73 Abstract ................................................................................................................................. 74 1. Introduction ................................................................................................................................ 75 2. Materials and methods ............................................................................................................... 76 2.1. Data ....................................................................................................................................... 76 2.2. Relevance Criteria ..................................................................................................................... 79 2.3. Statistical Methodologies ......................................................................................................... 80 3. Results ................................................................................................................................. 81 3.1. Rationale ................................................................................................................................... 81 3.2. Choosing the adequate partition of clusters for each group of variables .................................. 82 3.3. Profiling clusters for each group of variables ............................................................................. 84 3.4. Choosing the most adequate NP ................................................................................................ 90 4. Discussion ................................................................................................................................. 95 4.1. Two-steps hierarchical cluster analysis approaches: usefulness .............................................. 95 4.2. The importance of the Cerebro-cardiocardiovascular Diseases National Program.................. 95 4.3. Limitations and future paths of research ................................................................................. 97 5. Conclusions ................................................................................................................................. 98 References ................................................................................................................................. 99

Leonor Bacelar Nicolau PhD Thesis Page xiii/xlix
Chapter 4 – Picturing Inequities for Health Impact Assessment: Linked Electronic Records, Mortality and Regional Disparities in Portugal ..................................................................... 101 General information on the paper ................................................................................................... 102 Abstract ........................................................................................................................................... 103 Introduction ................................................................................................................................... 104 Context ............................................................................................................................................. 104 Aims .............................................................................................................................................. 106 Strategy ............................................................................................................................................ 106 Materials and methods ................................................................................................................... 108 Data .............................................................................................................................................. 108 Statistical Methodologies ................................................................................................................. 109 Results ........................................................................................................................................ 110 Associating regions to health indicator registration ........................................................................ 110 Associating health indicator registration and mortality by region ................................................... 113 Discussion ....................................................................................................................................... 119 Implications of Electronic Health Records policies applied unevenly throughout the regions ........ 119 Links between Electronic Health Records and quality of healthcare ............................................... 121 Electronic Health Records for disease prevention, health promotion and sustainability ................ 122 Electronic Health Records and Acute Myocardial Infarction ........................................................... 123 Challenges of Big Data and complexity in methods but simplicity in visualization .......................... 124 Conceptual Path associating Policy and Health allowing for Equity ................................................ 125 HIA and the Future of Health Reforms ............................................................................................. 127 Limitations and future paths for research ....................................................................................... 128 Conclusions ..................................................................................................................................... 130 References ...................................................................................................................................... 131
Chapter 5 – Discussion, Conclusions and Future Perspectives .............................................................. 135 1. Discussion .................................................................................................................................. 136 1.1. Adding Value to HIA steps ....................................................................................................... 136 1.2. Tackling Big Data ...................................................................................................................... 137 1.3. Dealing with Equity .................................................................................................................. 141 1.4. Reaching Out to Decision-Makers ........................................................................................... 143 2. Conclusions and Future Perspectives ......................................................................................... 146 References ...................................................................................................................................... 147
Appendices Appendix 1: Authorization Data from ACSS/SPMS............................................................................ A3 Appendix 2: Summary of Databases and Statistical Methodologies Used ......................................... A9 Appendix 3: Supplementary Material of Chapter 2 ......................................................................... A31 Appendix 4: Supplementary Material of Chapter 3.1 ...................................................................... A47 Appendix 5: Supplementary Material of Chapter 3.2 ...................................................................... A55 Appendix 6: Supplementary Material of Chapter 4 ......................................................................... A81 Appendix 7: Main Scientific Publications published by the author, relevant to this research ......... A101

Page xiv/xlix Leonor Bacelar Nicolau PhD Thesis
Figure Index
Chapter 1 – Introduction and Main Research Aims
Figure 1. Social health determinants model ...................................................................................... 3 Figure 2. WHO HIA Definition ............................................................................................................. 5 Figure 3. “Impact”, “Impacte” and “Impacto” definition and translation ......................................... 7 Figure 4. Selected comments from the HIA of health policies discussion on the HIA Group of LinkedIn website ................................................................................ 9 Figure 5. Portuguese-English Translation of “Avaliar” ....................................................................... 11
Chapter 2 – Exploring and Profiling through the State of the Art
Figure 1. HCA Dendrogram of 45 HIA guidelines .............................................................................. 35 Figure 2. Factorial Plan 1-2 of 45 HIA guidelines .............................................................................. 36 Figure 3. Factorial Plan 1-2 of 45 HIA guidelines - zoom ................................................................... 36 Figure 4. Factorial Plan 1-2 of lexical vocabulary of 247 papers from 2012-2014, based on papers’ titles ........................................................................................................ 39 Figure 5. HCA Dendrogram of lexical vocabulary of 247 papers from 2012-2014, based on papers’ titles ........................................................................................................ 40 Figure 6. Factorial Plan 1-2 of lexical vocabulary of 170 papers from 2012-2014, based on papers’ keywords ................................................................................................ 41 Figure 7. HCA Dendrogram of lexical vocabulary of 170 papers from 2012-2014, based on papers’ keywords ................................................................................................ 43
Chapter 3 – Contribution of Hierarchical Cluster Analysis to the Health Impact Assessment Screening Step SubChapter 3.1 – Screening Hospital Reform Policies for Health Impact Assessment: easier decision making through cluster analysis
Figure 1. Hierarchical Cluster Analysis Dendrogram (Squared Euclidean Distance and Ward Linkage Criterion) with 7 clusters partition identified .............................................. 59 Figure 2. Scatterplots of Potential Impact by Implementation Costs and by Ease of Implementation with cluster identification ....................................................... 60 Figure 3. Factorial Plan on policies of a PCA 2 Components Extraction and cluster identification ... 62 Figure 4. Factorial Plan of a MCA 2 Components Extraction with cluster identification ................... 63 Figure 5. Clusters prioritized according to different decision-makers priority criteria ..................... 69
SubChapter 3.2 – Screening National Health Programs for Health Impact Assessment: targeting policies with cluster analysis
Figure 1. Areas and associated number and types of variables in the National Program Evaluation Survey ............................................................................ 77 Figure 2. Dendrograms of hierarchical cluster analysis for each variable group with selected partition and PNDCV identification .............................................................. 83 Figure 3. Multiple correspondence analysis (MCA) Factorial Plans for each group of binary variable categories and for cases identified by National Program short name and by associated cluster.................................................................................................... 87 Figure 4. Principal components analysis (PCA) Factorial Plans for each group of quantitative variables and for cases identified by National Program short name and by associated cluster.................................................................................................... 88

Leonor Bacelar Nicolau PhD Thesis Page xv/xlix
Chapter 4 – Picturing Inequities for Health Impact Assessment: Linked Electronic Records, Mortality and Regional Disparities in Portugal
Figure 1. Association between registration of each health indicator and health regions of residence - adjusted OR ................................................................................................. 111 Figure 2. Principal Components Analysis Factorial Plans 1-2 based on Registered Indicators and Regions OR ................................................................................................................. 112 Figure 3. Association between mortality and registration of each health indicator stratified by health region of residence - adjusted OR .......................................................................... 115 Figure 4. Multiple Correspondence Analysis Factorial Plan 1-2 ....................................................... 118 Figure 5. Putting concept into practice ............................................................................................ 126

Page xvi/xlix Leonor Bacelar Nicolau PhD Thesis
Table Index
Chapter 1 – Introduction and Main Research Aims
Table 1. HIA Steps, their aims and methods used ............................................................................... 6
Chapter 2 – Exploring and Profiling through the State of the Art Table 1. Features characterizing sample of 45 HIA guidelines ........................................................ 30 Table 2. Process of building the lexical vocabulary .......................................................................... 32 Table 3. Aspects to link with the created lexical vocabulary ............................................................ 37
Chapter 3 – Contribution of Hierarchical Cluster Analysis to the Health Impact Assessment Screening Step SubChapter 3.1 – Screening Hospital Reform Policies for Health Impact Assessment: easier decision making through cluster analysis
Table 1. Descriptive Analysis (N=76) ................................................................................................ 58
SubChapter 3.2 – Screening National Health Programs for Health Impact Assessment: targeting policies with cluster analysis
Table 1. 30 National Health Programs (NPs) analyzed ........................................................................ 78 Table 2. Link between each variable group and respective priority criterion, as well as importance rank .................................................................................................... 80 Table 3. Fisher Exact Tests results with p<0.05 (2-sided), for binary variables of G1, G3, G4, G5 by selected cluster partitions and results summary of crosstabs analysis ... 89 Table 4. Kruskal-Wallis tests and associated multiple comparisons tests results with p<0.05 (2-sided), for quantitative variables of G7, G8, G9 by selected cluster partitions .... 90 Table 5. Color ranking priorities for HIA of clusters for each variable group and respective priority criterion ................................................................................................... 92 Table 6. National Programs ranked by priority criterion according to color ranking priorities for HIA of clusters for each variable group of previous table ................................................ 93 Table 7. Summary profile of the cluster including the PNDCV for each variable group and to the respective priority criterion ........................................................................................ 94
Leonor Bacelar Nicolau PhD Thesis Page xvii/xlix
Abbreviations
ACSS - Administração Central do Sistema de Saúde (Institution from the Portuguese Ministry of Health) AIS - Avaliação de Impacte na Saúde AMI - Acute Myocardial Infarction BMI - Body Mass Index CA - Correspondence Analysis CEA - Cost Effectiveness Analysis CI95% - 95% Confidence Intervals CVD - Cardiovascular Disease DGS - Direção-Geral da Saúde EqIA - Equality Impact Assessment EIA - Environmental Impact Assessment EIS - Évaluation d’Impact sur la Santé EFHIA - Equity Focused Health Impact Assessment EHR - Electronic Health Records EU - European Union HCA - Hierarchical Cluster Analysis HIA - Health Impact Assessment HRIA - Human Rights Impact Assessment HSIA - Health Systems Impact Assessment HTA - Health Technology Assessment IA - Impact Assessment IAIA - International Association for Impact Assessment IIA - Integrated Impact Assessment INSA - Instituto Nacional de Saúde Dr. Ricardo Jorge (Institution from the Portuguese Ministry of Health) LVT - Lisboa e Vale do Tejo (health region in Portugal) MCA - Multiple Correspondence Analysis
MHIA - Mental Health Impact Assessment NHS - National Health Service NPs - National Health Programs OECD - Organisation for Economic Co-operation and Development OR - Odds Ratio PC - Primary Care PCA - Principal Components Analysis PIA - Poverty Impact Assessment PNCDT - NP against Drugs and Addictions PNDCV - Programa Nacional de Doenças Cerebro-cardiovasculares / Cerebro-cardiocardiovascular Disease National Program PNPCDO - NP for Oncological Disease Prevention and Control PNRPLA - NP for Reducing Alcohol Related Problems ROAMEF - Rationale, Objectives, Appraisal, Monitoring, Evaluation cycle SEA - Strategic Environmental Assessment SOM - Supplemental Online Material (Chapter 4) SPMS - Serviços Partilhados do Ministério da Saúde (Institution from the Portuguese Ministry of Health) SS - Sustainability Statement UK - United Kingdom USA - United States of America USF - Unidade de Saúde Familiar (recent primary healthcare units in the Portuguese NHS) WHO - World Health Organization

Page xviii/xlix Leonor Bacelar Nicolau PhD Thesis
Graphical Abstract

Leonor Bacelar Nicolau PhD Thesis Page xix/xlix
Abstract
Context Health Impact Assessment (HIA) is a combination of procedures, methods and tools by which a policy may be judged as to its potential effects and its distribution on a population’s health, with thus a particularly strong concern regarding equity issues. It is at its core a decision-making support tool, having as main output recommendations to help decision-makers assure that the policies they implement minimize negative effects on health and equity and maximize positive ones. Throughout the various HIA steps, it is still generally and very often a qualitative approach, very seldom using multivariate statistical methodologies.
Main Aim To show the usefulness of applying quantified multivariate statistical methodologies to enrich HIA practice, while making the decision-making process easier, in terms of issuing understandable outputs even for non-statisticians, but still in a deeply evidence based context.
Exploring and Profiling through the State of the Art HIA is born out of two distinct areas of knowledge: environmental assessment and public health. Two questions arise: Are consensus guidelines possible? Are quantitative methods applied throughout both areas?
Profiling the 45 HIA guides studied by Herbert (2012) with hierarchical cluster analysis shows a consensus universal guide would be plausible and 9 candidates are pinpointed to potentially serve as its foundation.
The titles of 247 HIA Journal Papers listed in the Health Impact Assessment Section of the HIA Gateway Bibliography associated to Public Health England from 2012 to 2014, and additionally the available keywords for 170 of these papers, were studied with multivariate text analysis, regarding profiles of year, being published in a more environmental or public health journal and using quantitative methods. It is shown that results based on titles and on keywords are coherent, that 2014 tends to be less related with environmental journals, that HIA in environmental fields is more quantitative (especially in what concerns related risk assessments) and in public health is more qualitative and mainly related to social health determinants and equity concerns.
It is thus pertinent and an added value to current knowledge to encourage the use of quantified, multivariate statistical methods (such as cluster analysis or multivariate text analysis) when assessing health impacts of public policies and related equity issues with HIA.

Page xx/xlix Leonor Bacelar Nicolau PhD Thesis
Contributing with Hierarchical Cluster Analysis to the Health Impact Assessment Screening Step The screening step of HIA helps us here to choose the area and focus of our research. Hierarchical Cluster Analysis is used as a basic methodology to contribute for improving the HIA screening step, regarding two situations.
A total of 76 Health Reform Policies in Portugal was rated by a panel of 7 international renowned public health experts from Nova University in 2011 on a 10-point scale (1-Very low to 10-Very high) regarding Potential Impact, Ease of implementation and Implementation costs. Cluster analysis allowed us to make scenario analysis regarding all possible cluster priorities and to pinpoint a group of policies with high potential impact and low implementation costs, focusing policies linked to management issues setting a legal background and operational benchmarks improving the link between hospital and primary care services.
A total of 30 National Health Programs from the National Health Plan 2004-2010 were described by datasets of variables in 7 domains. Each domain is ranked according to a previously determined set of criteria for being a potential priority for HIA. Hierarchical cluster analyses results and complementary multivariate methodologies enabled us then to rank each cluster in each partition, within each domain and then taking into account all 7 domains. The policies related to the Cerebro-cardiovascular Program are thus chosen as first priority to apply HIA to, according to various criteria of regional span, concerns of health gains, health systems needs and effectiveness gains, being high-priority for National Health Plans, among others.
These analyses lead us to the choice of the empirical setup used throughout the study of equity below, namely regarding cardiovascular disease and policies concerning hospital-primary care links.
Picturing Inequities for Health Impact Assessment
A conceptual quantitative path of analysis to study the association between a public policy and health impacts while taking equity into account is proposed, showing how one may put it into practice. Data includes 3.776 adults admitted in hospitals for acute myocardial infarction during the second semester of 2012, followed regularly in primary care during 2013, always within the National Health Service in Portugal. The policy whose impact is be assessed in a HIA context is the registry of information regarding indicators Blood Pressure, Cholesterol, Triglycerides, Waist Circumference and Body Mass Index. The health impact of interest is the mortality status at the end of the period of study (December 31 2013). The equity aspect under analysis concerns regional differences in Portugal, since not assuring an even application of the policy throughout all the 5 health regions of residence (Norte, Centro, LVT, Alentejo and Algarve) may increase regional health inequities. Crude and adjusted OR (for sex, age, sex*age, 4 severity hospital admission indicators) are calculated with Logistic Regressions, complemented by exploratory multivariate data analysis such as Principal Components and Multiple Correspondence Analysis.

Leonor Bacelar Nicolau PhD Thesis Page xxi/xlix
Firstly, differences are found among regions regarding the registration of health indicators under study. This assures the relevancy of studying the association between the mortality outcome and the registration of health indicators stratified by region. Distinct mortality-registration associations are then found among regions in their association patterns regarding mortality and the registration of the health indicators under study. This hints that the registration of health indicators linking information from Hospital and Primary healthcare, throughout the different regions, may contribute for better health outcomes. The pursuit of delivering research results in a very visually comprehensible approach, given the elected multivariate methodologies used, intends to facilitate decision makers’ understanding of outcomes reached.
Discussion, Conclusions and Future Perspectives
Applying data mining and data science methodologies means that even if multivariate statistical methods used are complex, graphical outputs may simplify the understanding of results by decision makers.
The future of healthcare reforms shifts the center of evaluation of health systems from providers to people’s individual needs and preferences, by reducing health inequities in access and health outcomes, adapting health systems to new health technologies, using big data linking information from providers to social and economic health determinants. New or innovative statistical and assessment methodologies are needed to set this transformation into motion.
Quantified multivariate HIA thus represents a valuable tool to assure health impacts of public policies are indeed measured taking into consideration health determinants and equity and bringing citizens to the center of the decision-making process.
Keywords
Health Impact Assessment; Equity; Multivariate Data Analysis; Modeling; Decision-Making

Page xxii/xlix Leonor Bacelar Nicolau PhD Thesis
Resumo Gráfico

Leonor Bacelar Nicolau PhD Thesis Page xxiii/xlix
Resumo
Contexto A Avaliação de Impacte na Saúde (AIS) é uma combinação de procedimentos, métodos e instrumentos, pelos quais uma política, programa ou projeto, do sector público ou privado, pode ser julgado(a) em termos dos seus potenciais efeitos na saúde da população, bem como quanto à distribuição desses efeitos na mesma população, tendo assim uma forte preocupação relativa a equidade. É na sua base construído como um instrumento de apoio à tomada de decisão, tendo como principais outputs recomendações para os decisores assegurarem que as politicas implementadas minimizam efeitos na saúde e na equidade negativos e maximizam positivos. Ao longo das suas diversas fases, a AIS é geralmente e muito frequentemente uma abordagem qualitativa, sendo rara a aplicação de metodologias estatísticas multivariadas.
Objetivo Principal Mostrar a utilidade de aplicar metodologias estatísticas quantitativas e multivariadas para enriquecer a prática da AIS, tornando o processo de tomada de decisão mais fácil, no sentido de auxiliar a compreensão dos resultados por profissionais não-estatísticos, mas sempre num contexto aprofundadamente baseado na evidência.
Identificando e Explorando Perfis no Estado da Arte A AIS nasceu de duas áreas distintas do conhecimento: avaliação ambiental e saúde pública. Duas questões surgem ao explorar o estado-da-arte: será possível a criação de um guia universal? Serão as metodologias quantitativas aplicadas de forma corrente em ambas as áreas?
A construção de perfis com classificação hierárquica dos 45 guias de AIS inicialmente estudados por Herbert (2012) mostra que um guia universal seria possível e são identificados 9 candidatos potenciais a servir como base.
Os títulos de 247 artigos científicos listados pela Health Impact Assessment Section da HIA Gateway Bibliography associada à Public Health England de 2012 a 2014, bem como as palavras-chave disponíveis em 170 desses artigos, são estudados com análise textual multivariada, tendo em conta perfis de ano, ser publicado numa publicação ambiental ou numa de saúde pública e usar métodos quantitativos. Os resultados baseados nos títulos e nas palavras-chave revelam-se coerentes, mostrando que o ano 2014 tende a estar mais associado a publicações ambientais, que as AIS em áreas ambientais são mais frequentemente quantitativas (essencialmente no que respeita a avaliação de risco) e que as AIS em áreas de saúde pública são mais qualitativas e sobretudo relacionadas com determinantes sociais de saúde e preocupações de equidade.
Torna-se assim pertinente e representa um valor acrescentado para o estado do conhecimento atual, encorajar a aplicação de métodos quantitativos de estatística multivariada (como

Page xxiv/xlix Leonor Bacelar Nicolau PhD Thesis
classificação hierárquica ou análise textual multivariada) ao avaliar com AIS o impacte na saúde e na equidade em saúde de políticas em saúde pública.
Contribuindo com Classificação Hierárquica para a fase de Rastreio em AIS
A fase de rastreio (screening) em AIS ajuda-nos aqui a selecionar a área de enfoque da nossa investigação. A classificação hierárquica é usada como metodologia de base para contribuir a melhorar a fase de rastreio da AIS em duas situações distintas.
Um total de 76 políticas de reforma hospitalar da saúde em Portugal foram previamente classificadas por um painel de 7 especialistas de renome na área de saúde pública da Universidade Nova de Lisboa, considerando uma escala de 10 pontos (1-Muito baixo a 10-Muito elevado) relativa a Impacte Potencial, Facilidade de Implementação e Custos de Implementação. A classificação hierárquica permitiu-nos agrupar as políticas em classes distintas, realizar uma análise de cenários considerando todas as possíveis priorizações de classes e eleger um grupo específico de políticas como potenciais prioridades para AIS. Esse grupo engloba políticas com elevado impacte e menores custos de implementação, incluindo medidas associadas a gestão e à criação de modelos de benchmarking legais e operacionais quanto à ligação entre prestação de serviços de cuidados de saúde primários e hospitalares.
Um total de 30 Programas Nacionais de Saúde enquadrados no Plano Nacional de Saúde 2004-2010 foram descritos por variáveis, agrupadas em 7 domínios. Cada domínio é ordenado de acordo com um conjunto de critérios previamente determinados de acordo com o constituir uma prioridade potencial para AIS. Os resultados da classificação hierárquica e metodologias complementares aplicados em cada domínio permitem-nos então ordenar cada classe de programas de acordo com o potencial esperado para ser prioridade para AIS e, em seguida, ter em conta a ordenação dos domínios. As políticas associadas ao Programa Nacional para as Doenças Cerebro-Cardiovasculares surgem como prioritárias para AIS, de acordo com os diversos critérios de abrangência regional, preocupações com ganhos em saúde, necessidades de sistemas de saúde e ganhos de efetividade, ser um programa prioritário a nível do Plano Nacional de Saúde, entre outros.
Esta análise leva-nos a escolher como contexto de aplicação do estudo da equidade em AIS abaixo a área das doenças cérebro-cardiovasculares, quanto a políticas ligando os cuidados de saúde primários aos hospitalares.
Visualizando Iniquidades para Avaliação de Impacte na Saúde
Propomos um caminho conceptual de análise da associação entre uma política pública e o impacte na saúde tendo em conta preocupações de equidade, mostrando como pode ser posto em prática. Os dados contemplam 3.776 adultos internados em hospitais com um diagnóstico de enfarte agudo do miocárdio durante o segundo semestre de 2012 e seguidos regularmente nos cuidados de saúde primários durante 2013, sempre no Serviço Nacional de Saúde em Portugal. A política avaliada num contexto de AIS é o registo de informação relativo aos indicadores Pressão arterial, Colesterol, Triglicéridos, Perímetro abdominal e Índice de Massa Corporal. O impacte na saúde de interesse é a mortalidade até ao final do período de estudo (31 de Dezembro de 2013). O aspeto de equidade focado respeita às disparidades
Leonor Bacelar Nicolau PhD Thesis Page xxv/xlix
regionais em Portugal, visto que não aplicar a política de forma adequada nas 5 regiões de residência (Norte, Centro, LVT, Alentejo e Algarve) pode aumentar iniquidades de saúde regional. São estimados OR brutos e ajustados (para sexo, idade, sua interação, 4 indicadores de severidade do internamento) por Regressão Logística, complementada por métodos de análise de dados multivariada exploratória como Análise em Componentes Principais e Análise de Correspondências Múltiplas.
Numa primeira fase, as diferenças encontradas entre regiões quanto ao registo dos indicadores de saúde estudados realçam a relevância de analisar a associação entre a mortalidade e o registo, estratificada por região. Em seguida, a análise revela padrões de associações de mortalidade-registo distintos entre regiões, indiciando que o registo de diferentes indicadores aliando informação hospitalar à de cuidados de saúde primários pode contribuir para melhores outcomes de saúde ao longo das diversas regiões. A apresentação gráfica dos resultados gerados pelas metodologias multivariadas aplicadas pode potenciar a compreensão da abordagem, facilitando o entendimento dos resultados pelos decisores.
Discussão, Conclusões e Perspetivas Futuras
A aplicação de métodos estatísticos mais usuais em data mining e data science implica que mesmo metodologias mais complexas podem gerar resultados gráficos que simplifiquem a compreensão e potenciem a sua adesão à utilização de AIS.
O futuro das reformas dos sistemas de saúde desloca o centro da avaliação dos serviços de saúde dos prestadores para os cidadãos e para as suas necessidades e preferências, reduzindo as iniquidades no acesso à saúde e a ganhos em saúde, adaptando os sistemas de saúde a novas tecnologias, tirando partido de big data que associa desde informação dos prestadores a dados sociais e económicos de determinantes de saúde. Torna-se necessário desenvolver e aplicar metodologias estatísticas e de avaliação novas ou inovadoras que ponham em movimento esta transformação.
A AIS que aplique métodos quantificados multivariados representa assim uma ferramenta valiosa para assegurar que o impacte em saúde de políticas públicas é medido tendo em consideração determinantes de saúde e equidade, trazendo os cidadãos para o centro do processo de tomada de decisão.
Palavras-chave
Avaliação de Impacte na Saúde; Equidade; Análise de Dados Multivariada; Modelização; Tomada de decisão

Page xxvi/xlix Leonor Bacelar Nicolau PhD Thesis
Résumé Graphique

Leonor Bacelar Nicolau PhD Thesis Page xxvii/xlix
Résumé
Contexte L’Évaluation d’Impact sur la Santé (EIS) est une combination de procédures, méthodes et outils, grâce auxquels une politique, un programme ou un projet, du secteur public ou privé, peut être jugé quant à ses effets potentiels sur la santé de la population, bien quant à la distribution de ses effets dans cette population, ayant ainsi une forte préoccupation d’équité. L’EIS est construite comme un instrument de support à la décision, ayant comme principaux outputs des recommandations pour aider les décideurs à assurer que les politiques implémentées minimisent les effets sur la santé négatifs et maximisent les positifs. Au long de ses diverses étapes, l’EIS est généralement et très fréquemment une approche qualitative, l’application de méthodologies statistiques multivariées étant rare.
Objectif Principal Montrer l’utilité d’appliquer des méthodologies quantitatives et multivariées pour enrichir la pratique de EIS, rendant la prise de décision plus facile, au sens d’assister la compréhension des résultats par des professionnels non-statisticiens, maintenant toujours un contexte profondément basé sur l’évidence.
Identifiant et Explorant des Profils d’État de l’Art L’EIS est issue de deux domaines distincts : l’évaluation environnementale et la santé publique. Deux questions surgissent en explorant l’état de l’art : est-ce possible de créer un guide universel? Est-ce que les méthodologies quantitatives sont appliquées couramment dans les deux domaines?
La construction de profils par classification hiérarchique de 45 guides de EIS étudiés initialement par Herbert (2012) montre qu’un guide universel serait possible et 9 candidats potentiels sont identifiés à servir comme base.
Les titres de 247 articles scientifiques listés par Health Impact Assessment Section de HIA Gateway Bibliography associée à Public Health England entre 2012 et 2014, bien que les mots-clés disponibles en 170 de ces articles, sont étudiés avec de l’analyse textuelle multivariée, tenant en compte des profils d’année, être publiés dans un journal environnemental ou de santé publique et employer des méthodes quantitatives. Les résultats basés sur les titres et sur les mots-clés s’avèrent cohérents, montrant que l’année 2014 semble plus associée à des publications environnementales, que les EIS en domaines environnementaux sont plus fréquemment quantitatives (essentiellement concernant des évaluations de risques) et que les EIS en domaines de santé publique sont plus souvent qualitatives et surtout associées aux déterminants sociaux de santé et à des soucis d’équité.
Il devient ainsi pertinent et représente une valeur ajoutée pour l’état actuel du savoir d’encourager l’application de méthodes quantitatives de statistique multivariée (comme la

Page xxviii/xlix Leonor Bacelar Nicolau PhD Thesis
classification hiérarchique ou l’analyse textuelle multivariée) en évaluant par EIS l’impact sur la santé et l’équité de politiques en santé publique.
Contribuant avec la Classification Hiérarchique pour l’étape de dépistage en EIS
L’étape de dépistage (screening) en EIS nous aide à sélectionner le domaine d’application de notre recherche. La classification hiérarchique est utilisée comme méthodologie de base pour contribuer à améliorer l’étape de dépistage en EIS en deux situations différentes.
Un total de 76 politiques de réforme hospitalière sanitaire au Portugal a été auparavant classifié par un comité d’experts renommés au domaine de santé publique de Universidade Nova de Lisboa, considérant une échelle de 10 points (1-Très faible à 10-Très élevé) quant à Impact Potentiel, Facilité d’Implémentation et Coûts d’Implémentation. La classification hiérarchique nous permet alors de grouper les politiques en classes distinctes, de réaliser une analyse de scénarios considérant toutes les possibilités d’établissement de priorités pour les différentes classes et de choisir un groupe spécifique de politiques comme potentiels candidats à l’application de EIS. Le groupe élu comporte des politiques à impact élevé et plus faibles coûts d’implémentation, incluant des mesures associées à la gestion et à la création de modèles de benchmarking légaux et opérationnels quant aux liens entre soins primaires et hospitaliers.
Un total de 30 Programmes Nationaux de Santé, encadrés par le Plan National de Santé 2004-2010 ont été décrits par des variables groupées en 7 domaines. Chaque domaine est ordonné suivant un ensemble de critères déterminés au préalable, selon le fait de constituer une priorité potentielle pour EIS. Les résultats de la classification hiérarchique et de méthodologies complémentaires appliquées en chaque domaine séparément nos permettent alors de ranger chaque classe de programmes selon son potentiel attendu pour être une priorité pour EIS et, ensuite, de tenir en compte l’ordre des domaines. Les politiques associées au Programme National pour les Maladies Cerebro-Cardiovasculaires surgissent comme prioritaires pour EIS, selon les divers critères de couverture régionale, préoccupations au sujet de gains de santé, besoins des systèmes de santé et gains d'efficacité, être un programme prioritaire au niveau du Plan National de Santé, entre autres.
Cette analyse nous conduit à choisir comme contexte d’application de l’étude de l’équité en EIS qui se suit le domaine des maladies cerebro-cardiovasculaires, en ce qui concerne des politiques connectant les soins primaires aux hospitaliers.
Visualisant les Iniquités en Évaluation d’Impact sur la Santé
Nous proposons un chemin conceptuel d’analyse de l’association entre une politique publique et son impact sur la santé tenant en compte les soucis d’équité et montrant comment cela peut être mis en pratique. Les données contemplent 3.776 adultes hospitalisés avec diagnostic de l'infarctus aigu du myocarde chez des hôpitaux du Service National de Santé au Portugal pendant le deuxième semestre de 2012 et suivis régulièrement au réseau de soins primaires de santé pendant l’année de 2013. La politique évaluée dans un contexte d’EIS est l’enregistrement d’information des indicateurs de Pression artérielle, Cholestérol, Triglycérides, Circonférence abdominale et Indice de masse corporelle. L’impact sur la santé

Leonor Bacelar Nicolau PhD Thesis Page xxix/xlix
d’intérêt est la mortalité jusqu’á la fin de la période d’étude (31 Décembre 2013). L’aspect d’équité étudié respecte aux disparités régionales au Portugal, puisque ne pas appliquer la politique de forme adéquate aux 5 régions de résidence (Norte, Centro, LVT, Alentejo et Algarve) peut augmenter les iniquités de santé régionales. Les OR bruts et ajustés (par sexe, âge, son interaction, 4 indicateurs de sévérité d’hospitalisation) sont estimés par Régression Logistique, complémentée par des méthodes d’analyse de données multivariés exploratoire comme l’Analyse en Composantes Principales ou Analyse des Correspondances Multiples.
Dans une première phase, les différences rencontrées entre régions quant à l’enregistrement de l’information sur les indicateurs de santé étudiés, soulignant la pertinence d’analyser l’association entre mortalité et enregistrement, stratifiée par région.
Ensuite, l’analyse révèle des patterns d’associations mortalité-enregistrement distincts entre régions, indiquant que l’enregistrement de différents indicateurs liant l’information hospitalière à celle des soins primaires peut contribuer pour de meilleurs outcomes de santé au long des plusieures régions. La représentation graphique des résultats gérés par les méthodologies multivariées appliquées peut potentialiser le discernement de l’approche, facilitant la compréhension des résultats par les décideurs.
Discussion, Conclusions et Perspectives Futures
L’application de méthodes statistiques plus souvent employés en data mining et data science implique que même des méthodologies plus complexes peuvent gérer des résultats graphiques qui simplifient la compréhension et potentialiser son adhésion à l’utilisation de EIS.
Le futur des reformes des systèmes de santé déplace le centre de l’évaluation des services de santé des fournisseurs aux citoyens, ses besoins et préférences, réduisant les iniquités d’accès à la santé et aux gains de santé, adaptant les systèmes de santé à de nouvelles technologies, exploitant les big data qui associent l’information des fournisseurs de soins à des données sociales et économiques de déterminants de santé. Il devient nécessaire de développer et d’appliquer des méthodologies statistiques et d’évaluation nouvelles ou innovantes qui mettent en marche cette transformation.
L’EIS qui applique des méthodes quantifiées multivariées représente ainsi un outil précieux pour assurer que l’impact sur la santé de politiques publiques est mesuré en tenant en considération déterminants de santé et équité, amenant les citoyens au centre des procédures de prise de décision.
Mots-clés
Évaluation d’Impact sur la Santé; Equité; Analyse de Données Multivariée; Modélisation; Prise de décision
Page xxx/xlix Leonor Bacelar Nicolau PhD Thesis
Résumé Substantiel en Français
Les figures présentées ici suivent la forme générale, la séquence et numération présentées au texte principal.
1. Introduction et Objectif Principal
1.1. Introduction
La santé est définie par l’Organisation Mondiale de la Santé (OMS) comme « un état de
bien-être complet physique, mental et social, et ne consiste pas seulement en une
absence de maladie ou d'infirmité », mais aussi comme « l’étendue qu’un individu ou
groupe est capable, d’une part, de réaliser ses aspirations et satisfaire ses besoins et,
d’autre part, de modifier ou faire face à son environnement ».
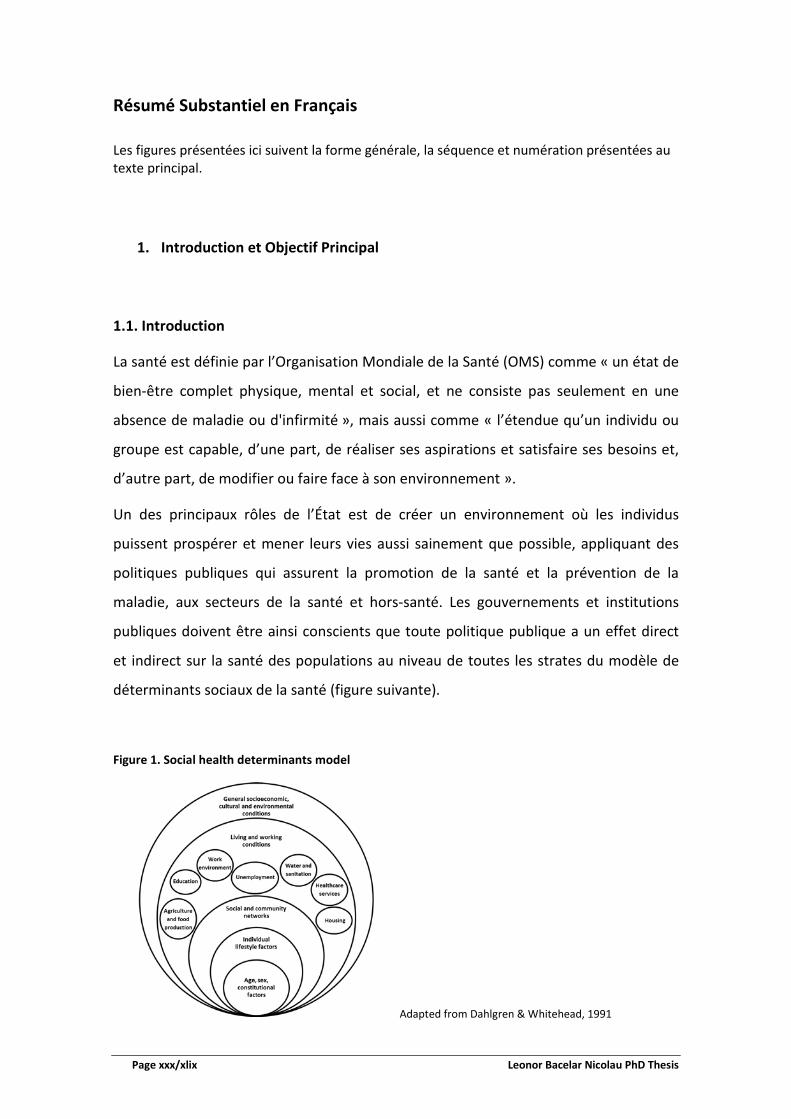
Un des principaux rôles de l’État est de créer un environnement où les individus
puissent prospérer et mener leurs vies aussi sainement que possible, appliquant des
politiques publiques qui assurent la promotion de la santé et la prévention de la
maladie, aux secteurs de la santé et hors-santé. Les gouvernements et institutions
publiques doivent être ainsi conscients que toute politique publique a un effet direct
et indirect sur la santé des populations au niveau de toutes les strates du modèle de
déterminants sociaux de la santé (figure suivante).
Figure 1. Social health determinants model
Adapted from Dahlgren & Whitehead, 1991

Leonor Bacelar Nicolau PhD Thesis Page xxxi/xlix
L’Évaluation d’Impact sur la Santé (EIS) est une combination de procédures, méthodes
et outils, grâce auxquels une politique, un programme ou un projet, du secteur public
ou privé, peut être jugé quant à ses effets potentiels sur la santé de la population, bien
quant à la distribution de ses effets dans cette population, ayant ainsi une forte
préoccupation d’équité. L’EIS est construite comme un instrument de support à la
décision, ayant comme principaux outputs des recommandations pour aider les
décideurs à assurer que les politiques implémentées minimisent les effets sur la santé
négatifs et maximisent les positifs. Au Portugal, comme en France, les efforts des
derniers 10-20 ans pour encourager le développement de l’EIS n’ont pas généraliser
son utilisation. Au long de ses diverses étapes (voir tableau suivant), l’EIS reste
généralement et très fréquemment une approche qualitative, l’application de
méthodologies statistiques multivariées étant rare.
Table 1. HIA Steps, their aims and methods used
HIA Steps General Aims Methods Used
Screening While medical screening helps select individuals suffering from a particular disease, HIA screening helps chose relevant policies or projects for which to conduct HIA.
Literature, documentation and database searches, interview process to potential stakeholders or experts
Scoping Planning the HIA includes defining the underlying terms of reference, identifying potential stakeholders and enhancing their engagement in the HIA process, establishing a steering group.
Project management approaches, communication, networking and negotiation skills
Appraisal
Conducting the assessment includes policy analysis, profiling of communities, qualitative and quantitative data collection, impact analysis, establishing priority impacts, recommendations developing and process evaluation.
Risk and outcomes analyses, public health, survey, statistical and participatory approaches
Reporting to
Decision-Makers
The main HIA outputs are recommendations to support decision-making on how to deal with the assessed project or policy, to be presented in reports, workshop or seminars.
Writing, presentation, communication and results dissemination skills
Monitoring and Evaluation
Monitoring the real impact of the project or policy implementation if essential to evaluate the process of conducting the HIA, its impact on the decision-making process and outcome assessment changes in health and health determinants after implementation.
Epidemiology, statistical, survey, information management approaches
Adapted from Scott-Samuel, Birley & Ardern 14 and O’Mullane & Guliš

Page xxxii/xlix Leonor Bacelar Nicolau PhD Thesis
1.2. Objectif Principal
L’objectif principal de cette recherche est de montrer l’utilité d’appliquer des
méthodologies quantitatives et multivariées pour enrichir la pratique de EIS, rendant la
prise de décision plus facile, au sens d’assister la compréhension des résultats par des
professionnels non-statisticiens, maintenant toujours un contexte profondément basé
sur l’évidence.
1.3. Research Path - Chemin de Recherche
La figure suivante identifie les contributions de notre recherche, et des divers chapitres
concernant les résultats, aux diverses étapes de l’EIS, les flèches noires identifiant les
liaisons directes au niveau de la thèse et les grises les applications potentielles des
méthodologies appliquées.
La figure suivante résume le plan suivit par la thèse, présentant aussi une anticipation
prévue des résultats.

Leonor Bacelar Nicolau PhD Thesis Page xxxiii/xlix
2. Identifiant et Explorant des Profils d’État de l’Art
L’EIS est issue de deux domaines distincts : l’évaluation environnementale et la santé
publique. Deux questions surgissent en explorant l’état de l’art :
• Est-ce possible de créer un guide universel ?
• Est-ce que les méthodologies quantitatives sont appliquées couramment dans
les deux domaines ?
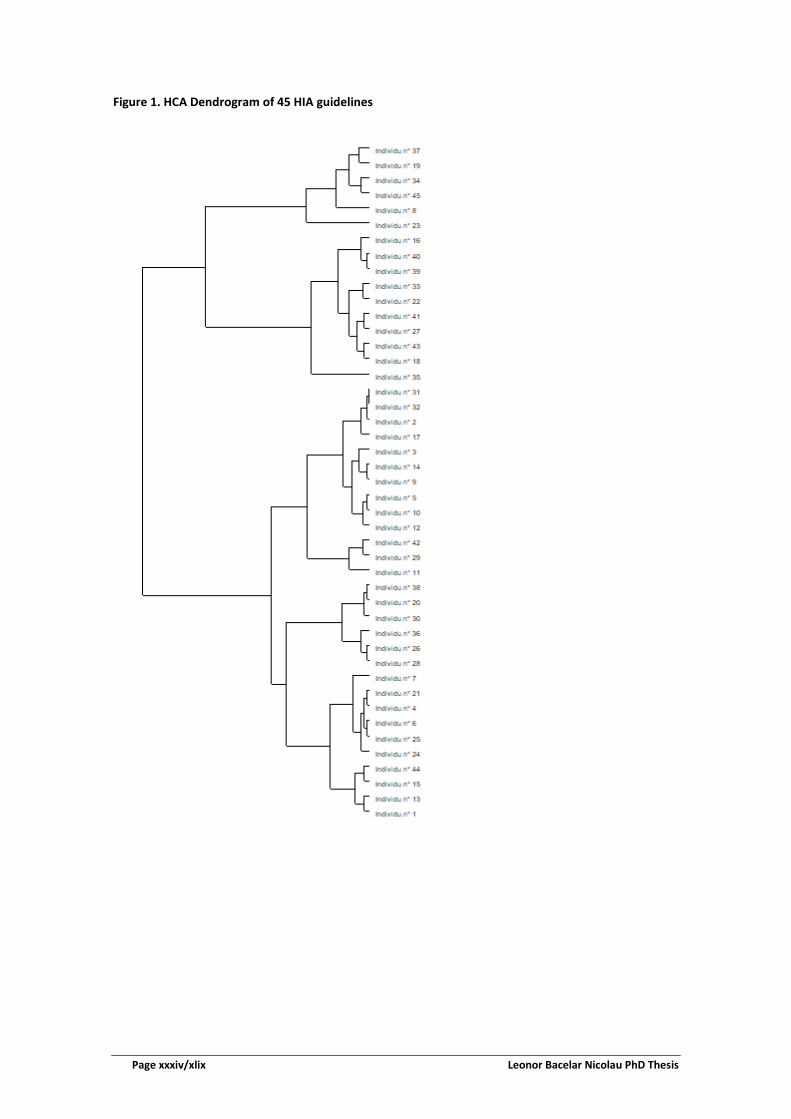
Dans une première phase, 45 guides de EIS étudiés initialement par Herbert (2012)
sont analysés et un total de 5 profils/classes est identifié par classification hiérarchique
– Figure 1. Cette étude est complémentée par une analyse des correspondances
multiples – Figure 2. Les résultats montrent qu’un guide universel serait possible et 9
candidats potentiels sont identifiés à servir comme base, concernant la classe 2, à
savoir :
• The Merseyside guidelines for health impact assessment (Scott-Samuel et al./International HIA Consortium)
• A training manual for HIA (University of Birmingham, Department of Public Health and Epidemiology)
• More than a statement of the crushingly obvious: a critical guide to HIA (Kemm/ West Midlands Public Health Observatory)
• HIA intersectoral health policy: theory and application (Penris and den Broeder/Netherlands National Institute for Public Health and the Environment)
• Equity focused HIA framework (Mahoney et al./Australasian Collaboration for Health Equity Impact Assessment)
• HIA: a guide for service providers (Public Health Services, Queensland Health) • A guide to HIA (Public Health Commission) • HIA quick guide (NACCHOi) • UCLA HIA training manual (Agyekum et.al./UCLAj)
Page xxxiv/xlix Leonor Bacelar Nicolau PhD Thesis
Figure 1. HCA Dendrogram of 45 HIA guidelines

Leonor Bacelar Nicolau PhD Thesis Page xxxv/xlix
Figure 2. Factorial Plan 1-2 of 45 HIA guidelines
Dans une deuxième phase, les titres de 247 articles scientifiques listés par Health
Impact Assessment Section de HIA Gateway Bibliography associée à Public Health
England entre 2012 et 2014, bien que les mots-clés disponibles en 170 de ces articles,
sont étudiés avec de l’analyse textuelle multivariée, tenant en compte des profils
d’année, être publiés dans un journal environnemental ou de santé publique et
employer des méthodes quantitatives. L’analyse comprend l’application de méthodes
de classification hiérarchique et d’analyse des correspondances, dont la figure 4
suivante est une illustration, permettant d’identifier graphiquement de façon facile les
caractéristiques principales qui différencient les typologies.
Les résultats basés sur les titres et sur les mots-clés s’avèrent cohérents, montrant
que :
• l’année 2014 semble plus associée à des publications environnementales ;
• les EIS en domaines environnementaux sont plus fréquemment quantitatives
(essentiellement concernant des évaluations de risques) ;
• les EIS en domaines de santé publique sont plus souvent qualitatives et surtout
associées aux déterminants sociaux de santé et à des soucis d’équité.

Page xxxvi/xlix Leonor Bacelar Nicolau PhD Thesis
Figure 4. Factorial Plan 1-2 of lexical vocabulary of 247 papers from 2012-2014, based on papers’ titles
Il devient ainsi pertinent et représente une valeur ajoutée pour l’état actuel du savoir
d’encourager l’application de méthodes quantitatives de statistique multivariée
(comme la classification hiérarchique ou l’analyse textuelle multivariée) en évaluant
par EIS l’impact sur la santé et l’équité de politiques en santé publique.
3. Contribuant avec la Classification Hiérarchique pour l’étape de dépistage en
EIS
L’étape de dépistage (screening) en EIS nous aide à sélectionner le domaine
d’application de notre recherche. La classification hiérarchique est utilisée comme
méthodologie de base pour contribuer à améliorer l’étape de dépistage en EIS en deux
situations différentes.
3.1 – Dépistage de Politiques de Réforme hospitalière sanitaire
Un total de 76 politiques de réforme hospitalière sanitaire au Portugal a été
auparavant classifié par un comité d’experts renommés au domaine de santé publique
de Universidade Nova de Lisboa, considérant une échelle de 10 points (1-Très faible à

Leonor Bacelar Nicolau PhD Thesis Page xxxvii/xlix
10-Très élevé) quant à Impact Potentiel, Facilité d’Implémentation et Coûts
d’Implémentation.
La classification hiérarchique nous permet alors de grouper les politiques en classes
distinctes (Figure 1) et ensuite de les caractériser (Figures 2 à 4).
Figure 1. Hierarchical Cluster Analysis Dendrogram (Squared Euclidean Distance and Ward Linkage Criterion) with 7 clusters partition identified
Figure 2. Scatterplots of Potential Impact by Implementation Costs and by Ease of Implementation with cluster identification

Page xxxviii/xlix Leonor Bacelar Nicolau PhD Thesis
Figure 3. Factorial Plan on policies of a PCA 2 Components Extraction and cluster identification
Figure 4. Factorial Plan of a MCA 2 Components Extraction with cluster identification
Une analyse de scénarios est utilisée, considérant toutes les possibilités
d’établissement de priorités pour les différentes classes et permet de choisir un
groupe spécifique de politiques comme potentiels candidats à l’application de EIS
(Figure 5).
C1
C2
C3
C4
C5
C6
C7
KMO = 0,402 BTS p=0.017 (χ2=10,246 df=3)

Leonor Bacelar Nicolau PhD Thesis Page xxxix/xlix
Figure 5. Clusters prioritized according to different decision-makers priority criteria
Le groupe élu se situe en première place dans tous les scénarios et comporte des
politiques à impact élevé et plus faibles coûts d’implémentation, incluant des mesures
associées à la gestion et à la création de modèles de benchmarking légaux et
opérationnels quant aux liens entre soins primaires et hospitaliers.
3.2 – Dépistage de Programmes Nationaux de Santé
Un total de 30 Programmes Nationaux de Santé, encadrés par le Plan National de
Santé 2004-2010 ont été décrits par des variables groupées en 7 domaines (Figure 1
suivante). Chaque domaine est ordonné suivant un ensemble de critères déterminés
au préalable, selon le fait de constituer une priorité potentielle pour EIS.
Figure 1. Areas and associated number and types of variables in the National Program Evaluation Survey
Page xl/xlix Leonor Bacelar Nicolau PhD Thesis
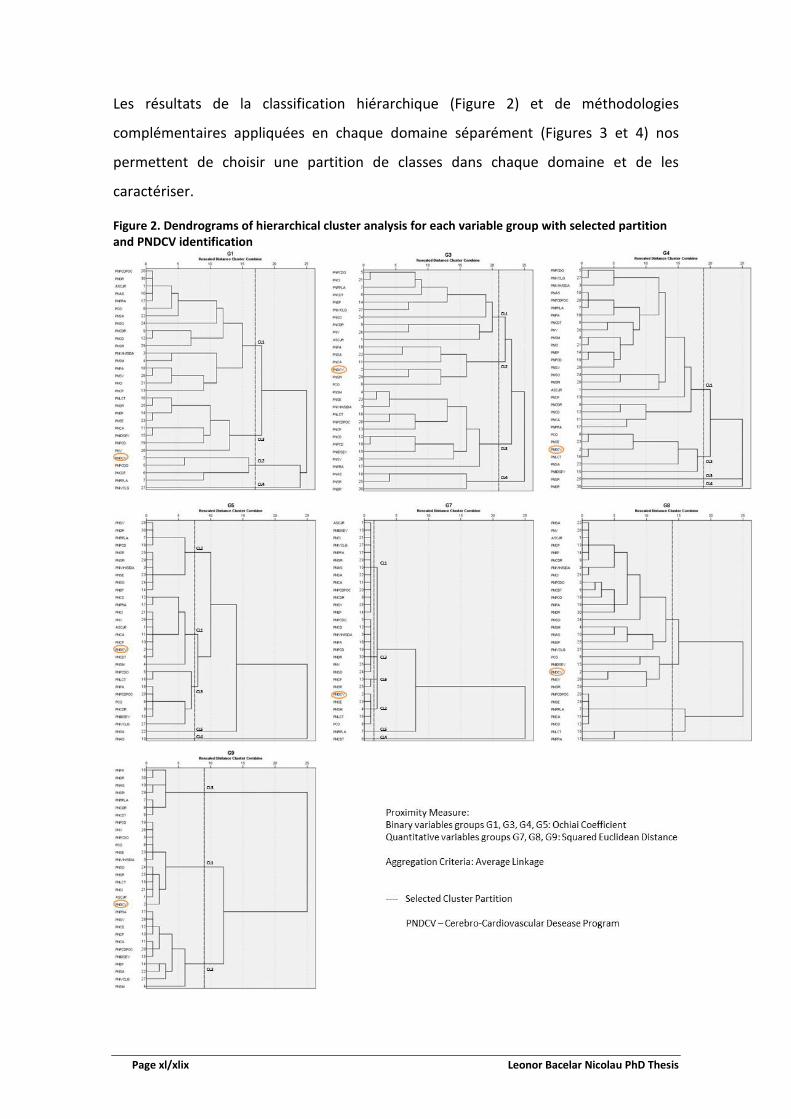
Les résultats de la classification hiérarchique (Figure 2) et de méthodologies
complémentaires appliquées en chaque domaine séparément (Figures 3 et 4) nos
permettent de choisir une partition de classes dans chaque domaine et de les
caractériser.
Figure 2. Dendrograms of hierarchical cluster analysis for each variable group with selected partition and PNDCV identification

Leonor Bacelar Nicolau PhD Thesis Page xli/xlix
Figure 3. Multiple correspondence analysis (MCA) Factorial Plans for each group of binary variable categories and for cases identified by National Program short name and by associated cluster

Page xlii/xlix Leonor Bacelar Nicolau PhD Thesis
Figure 4. Principal components analysis (PCA) Factorial Plans for each group of quantitative variables and for cases identified by National Program short name and by associated cluster

Leonor Bacelar Nicolau PhD Thesis Page xliii/xlix
Ensuite, chaque classe de programmes est rangée selon le potentiel attendu pour être
une priorité pour EIS et, ensuite, et tenant en compte l’ordre des domaines (Table 5 et
6).
Table 5. Color ranking priorities for HIA of clusters for each variable group and respective priority criterion
Groups of Variables ranked by importance for our research
Features for being a potential priority for HIA
Chosen partition
(number of clusters)
Cluster
1 2 3 4 5 6
G9 Range of regional implementation
Having a regional span as extended and in depth as possible 3 + +- -
G5 Link to health problems and gains
Showing a concern to monitor health gains, health systems needs and effectiveness gains
5 + +- +-
G1 Legal Context Being a high-priority NP according to the National Health Plans 2004-2010 and 2012-2016
4 +- + +-
G3 Products
Having a practice of generating a variety of different products to the health professionals, specific groups of the population and the population in general (guidelines, published information, online presence, events, etc)
4 + +- - -
G8 Characterization % of total specific aims/projects achieved
Considering the monitorization and evaluation of the way the aims are being achieved, including resources allocation
4 + +- - -
G4 Management Listing its planning documents, general aims and linking them to specific aims and/or projects’ aims
4 + +-
G7 General aims, specific aims and associated projects
Presenting an adequate number of aims and projects 6 - +- + -
bold Cluster including PNDCV
+ High priority
+ - Medium priority
- Low priority
Not adequate for comparison: one National Health Program cluster
Non-existent: the chosen partition includes a lower number of clusters
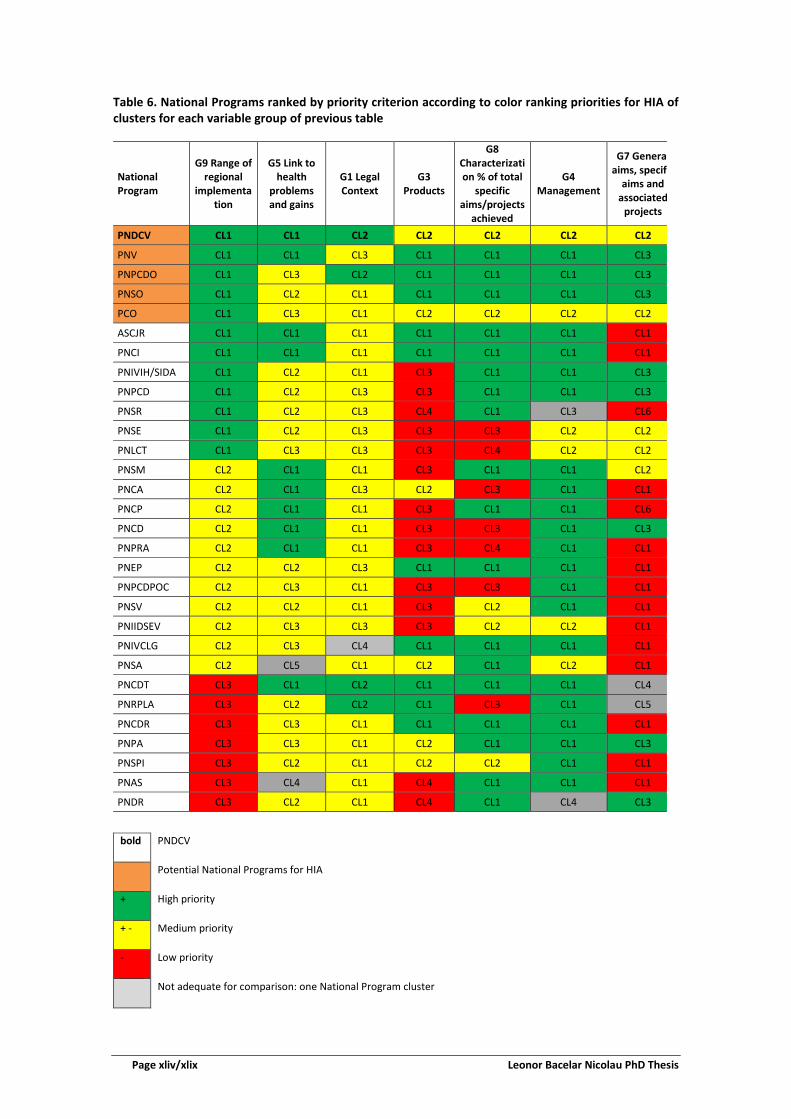
Page xliv/xlix Leonor Bacelar Nicolau PhD Thesis
Table 6. National Programs ranked by priority criterion according to color ranking priorities for HIA of clusters for each variable group of previous table
National Program
G9 Range of regional
implementation
G5 Link to health
problems and gains
G1 Legal Context
G3 Products
G8 Characterization % of total
specific aims/projects
achieved
G4 Management
G7 Genera aims, specif
aims and associated
projects
PNDCV CL1 CL1 CL2 CL2 CL2 CL2 CL2
PNV CL1 CL1 CL3 CL1 CL1 CL1 CL3
PNPCDO CL1 CL3 CL2 CL1 CL1 CL1 CL3
PNSO CL1 CL2 CL1 CL1 CL1 CL1 CL3
PCO CL1 CL3 CL1 CL2 CL2 CL2 CL2
ASCJR CL1 CL1 CL1 CL1 CL1 CL1 CL1
PNCI CL1 CL1 CL1 CL1 CL1 CL1 CL1
PNIVIH/SIDA CL1 CL2 CL1 CL3 CL1 CL1 CL3
PNPCD CL1 CL2 CL3 CL3 CL1 CL1 CL3
PNSR CL1 CL2 CL3 CL4 CL1 CL3 CL6
PNSE CL1 CL2 CL3 CL3 CL3 CL2 CL2
PNLCT CL1 CL3 CL3 CL3 CL4 CL2 CL2
PNSM CL2 CL1 CL1 CL3 CL1 CL1 CL2
PNCA CL2 CL1 CL3 CL2 CL3 CL1 CL1
PNCP CL2 CL1 CL1 CL3 CL1 CL1 CL6
PNCD CL2 CL1 CL1 CL3 CL3 CL1 CL3
PNPRA CL2 CL1 CL1 CL3 CL4 CL1 CL1
PNEP CL2 CL2 CL3 CL1 CL1 CL1 CL1
PNPCDPOC CL2 CL3 CL1 CL3 CL3 CL1 CL1
PNSV CL2 CL2 CL1 CL3 CL2 CL1 CL1
PNIIDSEV CL2 CL3 CL3 CL3 CL2 CL2 CL1
PNIVCLG CL2 CL3 CL4 CL1 CL1 CL1 CL1
PNSA CL2 CL5 CL1 CL2 CL1 CL2 CL1
PNCDT CL3 CL1 CL2 CL1 CL1 CL1 CL4
PNRPLA CL3 CL2 CL2 CL1 CL3 CL1 CL5
PNCDR CL3 CL3 CL1 CL1 CL1 CL1 CL1
PNPA CL3 CL3 CL1 CL2 CL1 CL1 CL3
PNSPI CL3 CL2 CL1 CL2 CL2 CL1 CL1
PNAS CL3 CL4 CL1 CL4 CL1 CL1 CL1
PNDR CL3 CL2 CL1 CL4 CL1 CL4 CL3
bold PNDCV
Potential National Programs for HIA
+ High priority
+ - Medium priority
- Low priority
Not adequate for comparison: one National Program cluster

Leonor Bacelar Nicolau PhD Thesis Page xlv/xlix
Les politiques associées au Programme National pour les Maladies Cerebro-
Cardiovasculaires surgissent ainsi comme prioritaires pour EIS, selon les divers critères
de couverture régionale, préoccupations au sujet de gains de santé, besoins des
systèmes de santé et gains d'efficacité, être un programme prioritaire au niveau du
Plan National de Santé, entre autres.
L’analyse du chapitre 3 nous conduit à choisir comme contexte d’application de l’étude
de l’équité en EIS qui se suit le domaine des maladies cérébro-cardiovasculaires, en ce
qui concerne des politiques connectant les soins primaires aux hospitaliers.
4. Visualisant les Iniquités en Évaluation d’Impact sur la Santé : Donnés
Électroniques Liées, Mortalité et Disparités Régionales au Portugal
Nous proposons un chemin conceptuel d’analyse de l’association entre une politique
publique et son impact sur la santé tenant en compte les soucis d’équité et montrant
comment cela peut être mis en pratique. Les données contemplent 3.776 adultes
hospitalisés avec diagnostic de l'infarctus aigu du myocarde chez des hôpitaux du
Service National de Santé au Portugal pendant le deuxième semestre de 2012 et suivis
régulièrement au réseau de soins primaires de santé pendant l’année de 2013. La
politique évaluée dans un contexte d’EIS est l’enregistrement d’information des
indicateurs de Pression artérielle, Cholestérol, Triglycérides, Circonférence abdominale
et Indice de masse corporelle. L’impact sur la santé d’intérêt est la mortalité jusqu’á la
fin de la période d’étude (31 Décembre 2013). L’aspect d’équité étudié respecte aux
disparités régionales au Portugal, puisque ne pas appliquer la politique de forme
adéquate aux 5 régions de résidence (Norte, Centro, LVT, Alentejo et Algarve) peut
augmenter les iniquités de santé régionales. Les OR bruts et ajustés (par sexe, âge, son
interaction, 4 indicateurs de sévérité d’hospitalisation) sont estimés par Régression
Logistique, complémentée par des méthodes d’analyse de données multivariés

Page xlvi/xlix Leonor Bacelar Nicolau PhD Thesis
exploratoire comme l’Analyse en Composantes Principales ou Analyse des
Correspondances Multiples.
Dans une première phase, les différences rencontrées entre régions quant à
l’enregistrement de l’information sur les indicateurs de santé étudiés, soulignent la
pertinence d’analyser l’association entre mortalité et enregistrement, stratifiée par
région (Figures 1 et 2).
Figure 1. Association between registration of each health indicator and health regions of residence - adjusted OR
Figure 2. Principal Components Analysis Factorial Plans 1-2 based on Registered Indicators and Regions OR

Leonor Bacelar Nicolau PhD Thesis Page xlvii/xlix
Ensuite, l’analyse révèle des patterns d’associations mortalité-enregistrement distincts
entre régions, indiquant que l’enregistrement de différents indicateurs liant
l’information hospitalière à celle des soins primaires peut contribuer pour de meilleurs
outcomes de santé au long des diverses régions (Figure 3).
Figure 3. Association between mortality and registration of each health indicator stratified by health region of residence - adjusted OR
La représentation graphique des résultats gérés par les méthodologies multivariées
appliquées peut potentialiser le discernement de l’approche, facilitant la
compréhension des résultats par les décideurs (Figure 4).
Un chemin conceptuel d’analyse est proposé pour étudier l’association entre politique
et impact en santé tout en tenant en compte l’équité en santé, illustré par le case
study appliqué (Figure 5).

Page xlviii/xlix Leonor Bacelar Nicolau PhD Thesis
Figure 4. Multiple Correspondence Analysis Factorial Plan 1-2
Figure 5. Putting concept into practice

Leonor Bacelar Nicolau PhD Thesis Page xlix/xlix
5. Discussion, Conclusions et Perspectives Futures
L’application de méthodes statistiques plus souvent employées en data mining et data
science implique que même des méthodologies plus complexes peuvent gérer des
résultats graphiques qui simplifient la compréhension et potentialiser son adhésion à
l’utilisation de EIS.
Le futur des reformes des systèmes de santé déplace le centre de l’évaluation des
services de santé des fournisseurs aux citoyens, ses besoins et préférences, réduisant
les iniquités d’accès à la santé et aux gains de santé, adaptant les systèmes de santé à
de nouvelles technologies, exploitant les big data qui associent l’information des
fournisseurs de soins à des données sociales et économiques de déterminants de
santé.
Il devient nécessaire de développer et d’appliquer des méthodologies statistiques et
d’évaluation nouvelles ou innovantes qui mettent en marche cette transformation.
L’EIS qui applique des méthodes quantifiées multivariées représente ainsi un outil
précieux pour assurer que l’impact sur la santé de politiques publiques est mesuré en
tenant en considération déterminants de santé et équité, amenant les citoyens au
centre des procédures de prise de décision.

Leonor Bacelar Nicolau PhD Thesis Chapter 1 - Page 1/149
Chapter 1 – Introduction and Main Research Aims
CONTENTS
1. Introduction ............................................................................................................................ 2 1.1. Health and Determinants of Health ............................................................................................ 2 1.2. Social health determinants and health inequality and inequity ................................................. 4 1.3. Health Impact Assessment - definition ....................................................................................... 5 1.4. HIA of policies from the health sector versus other sectors ....................................................... 8 1.5. Timings of HIA: prospective, concurrent or retrospective ......................................................... 10 1.6. Quantification ............................................................................................................................ 11 1.7. Integration with other methodological approaches .................................................................. 12 1.8. Reaching out to decision makers ............................................................................................... 14 1.9. Practice in Portugal and in other countries ................................................................................ 15 1.10. What this research adds ........................................................................................................... 16 2. Research Aims ........................................................................................................................... 18 2.1. Main Aim ................................................................................................................................. 18 2.2. General Goals ............................................................................................................................. 18 2.3. Stages and Chapters ................................................................................................................... 19 References ....................................................................................................................................... 20

Chapter 1 - Introduction and Main Research Aims
Chapter 1 - Page 2/149 Leonor Bacelar Nicolau PhD Thesis
Chapter 1 – Introduction and Main Research Aims
“The beginning is always today.” Mary Shelley
“Space: the final frontier. These are the voyages of the starship Enterprise. Its five-year mission: to explore strange new worlds; to seek out new life and new civilizations; to boldly go where no man has gone before” - Captain James T. Kirk
“A journey is a person in itself; no two are alike. And all plans, safeguards, policing, and coercion are fruitless. We find that after years of struggle that we do not take a trip; a trip takes us.” John Steinbeck
A PhD research is a journey to add value to a particular body of knowledge. The trip we
take depends firstly on our aims, but also on the underlying values we choose to abide to.
We thus begin here by introducing the main principles that give context to our research,
what our study seeks to add to current knowledge and the aims we aspire to reach.
1. Introduction
1.1. Health and Determinants of Health
Health is defined by the World Health Organization (WHO) as “a state of complete
physical, mental and social well-being and not merely the absence of disease or infirmity” 1, but also as “the extent to which an individual or group is able, on the one hand, to
realize aspirations and satisfy needs, and, on the other, to change or cope with the
environment” 2. This holistic definition puts health at the epicenter of complex
interrelations between social, economic, political, cultural and environmental health
determinants.
There forward although health is primarily an individual responsibility, there may be limits
as to the ability of individuals by themselves to influence their own health, since there are
health determinants beyond their control. “The context of people’s lives determines their
health, and so blaming individuals for having poor health or crediting them for good
health is inappropriate. Individuals are unlikely to be able to directly control many of the
determinants of health.” 3.
One of the main roles of Governments entails providing citizens accurate and appropriate
information so they can protect themselves 4. But even when individuals have access to

Chapter 1 - Introduction and Main Research Aims
Leonor Bacelar Nicolau PhD Thesis Chapter 1 - Page 3/149
reliable information and are aware of all human and non-human activities affecting their
health, they are frequently unable to change the conditions affecting their health status
by their own will. Hence the Governments’ job also consists on helping to create an
environment that will enable individuals to thrive and lead their life as healthy as
possible. Policies and actions to influence health determinants become the essential base
for health promotion and disease prevention.
Thus, Governments also have to be conscious that all public policies from health and non-
health sectors will have a direct or indirect impact on peoples’ health at all layers of the
social determinants model of figure 1 5. Being able to assess the health impact of public
policies is thus crucial to try and minimize negative effects and maximize positive ones.
Figure 1. Social health determinants model
Adapted from Dahlgren & Whitehead, 1991 5

Chapter 1 - Introduction and Main Research Aims
Chapter 1 - Page 4/149 Leonor Bacelar Nicolau PhD Thesis
1.2. Social health determinants and health inequality and inequity
Evaluating the health impact of public policies on the whole of a population affected is
therefore crucial, but this impact must be also appraised throughout different groups of
this population, since these effects may not be uniform and may be damaging for health
equity.
The impact of policies on equity is made essentially through social determinants of
health. “Social determinants of health are the conditions in which people are born, grow,
live, work and age. These circumstances are shaped by the distribution of money, power
and resources at global, national and local levels. The social determinants of health are
mostly responsible for health inequities - the unfair and avoidable differences in health
status seen within and between countries” 3.
The WHO Commission on Social Determinants of Health warns about huge differences in
life expectancy between countries (80 years in Japan and Sweden, to 72 in Brazil, 63 in
India, less than 50 years in several African countries), but also in morbidity, even within
the same country, linked frequently to a social gradient effect 6. People in higher
socioeconomic groups are thus more likely to live longer and enjoy more years of good
health, than those in lower socioeconomic groups.
Nonetheless, other social determinants also contribute to equity concerns, such as
gender differences for instance, and are often specific to certain regions, sub-populations,
life styles. These specificities have to be taken into account when one sets out to assess
health impacts of public policies.
It is however important to make a distinction between what are considered health
inequalities and health inequities. Health inequalities may always occur and be natural
and non-harmful to people, just a matter of biological variations or free choice. Inequity
though may exist whenever inequalities are present that are unnecessary, unjust or unfair
and that could be avoided. Public policies should aim to decrease or at least not increase
inequities, but not necessarily have any impact on other inequalities (figure 2).

Chapter 1 - Introduction and Main Research Aims
Leonor Bacelar Nicolau PhD Thesis Chapter 1 - Page 5/149
Figure 2. WHO HIA Definition
1.3. Health Impact Assessment - definition
Health impact assessment (HIA) is according to WHO a “combination of procedures,
methods and tools by which a policy, programme or project may be judged as to its
potential effects on the health of a population, and the distribution of those effects
within the population” 7. The International Association for Impact Assessment (IAIA)
added that “HIA identifies appropriate action to manage those effects’ (i.e. the effects on
health and distribution of health)” 8.
Any project or policy (at international, national, regional or local levels), in any activity
sector, generates positive and/or negative impacts on the health of human populations 9,10. These impacts produce in turn consequences in other areas, ultimately affecting the
global economic and social prosperity. HIA methodologies help the decision-making
process, regarding going forward or not with a project or policy and in the way that it is
done 11,12.
in WHO HIA Glossary of terms:. http://www.who.int/hia/about/glos/en/index1.html

Chapter 1 - Introduction and Main Research Aims
Chapter 1 - Page 6/149 Leonor Bacelar Nicolau PhD Thesis
HIA thus aims to inform and improve the decision-making process in favor of health and
health equity, maximizing potential positive health impacts and minimizing potential
negative health impacts of a proposal 13.
The HIA methodology generally follows the steps below (table 1) and will be applied
partially or in its whole depending on the study 14.
Table 1. HIA Steps, their aims and methods used
HIA Steps General Aims Methods Used Screening While medical screening helps select individuals
suffering from a particular disease, HIA screening helps chose relevant policies or projects for which to conduct HIA.
Literature, documentation and database searches, interview process to potential stakeholders or experts
Scoping Planning the HIA includes defining the underlying terms of reference, identifying potential stakeholders and enhancing their engagement in the HIA process, establishing a steering group.
Project management approaches, communication, networking and negotiation skills
Appraisal
Conducting the assessment includes policy analysis, profiling of communities, qualitative and quantitative data collection, impact analysis, establishing priority impacts, recommendations developing and process evaluation.
Risk and outcomes analyses, public health, survey, statistical and participatory approaches
Reporting to Decision-Makers
The main HIA outputs are recommendations to support decision-making on how to deal with the assessed project or policy, to be presented in reports, workshop or seminars.
Writing, presentation, communication and results dissemination skills
Monitoring and Evaluation
Monitoring the real impact of the project or policy implementation if essential to evaluate the process of conducting the HIA, its impact on the decision-making process and outcome assessment changes in health and health determinants after implementation.
Epidemiology, statistical, survey, information management approaches
Adapted from Scott-Samuel, Birley & Ardern 14 and O’Mullane & Guliš 15
Regarding the right terminology to be used in Portugal and although our report here is
written in English, the discussion of what should be the correct translation of “Health
Impact Assessment” to Portuguese became pertinent throughout our research 16. In
English the word “impact” either means “the action of one object coming forcibly into
contact with another” or “a marked effect or influence” 17 as figure 3 shows. The
Portuguese language however has two words, “impacto” and “impacte” 18, frequently
used as synonyms, but that may reflect the two different “impact” meanings of the
English language. “Impacto” may be considered closer to the “action of one object
coming forcibly into contact with another” meaning, while “impacte” may be closer to the

Chapter 1 - Introduction and Main Research Aims
Leonor Bacelar Nicolau PhD Thesis Chapter 1 - Page 7/149
“marked effect or influence” meaning. Therefore, we will use as a more adequate
translation for “Health Impact Assessment” the Portuguese expression “Avaliação de
Impacte na Saúde” (AIS) 16,19.
Figure 3. “Impact”, “Impacte” and “Impacto” definition and translation

Chapter 1 - Introduction and Main Research Aims
Chapter 1 - Page 8/149 Leonor Bacelar Nicolau PhD Thesis
1.4. HIA of policies from the health sector versus other sectors
Although HIA frequently intends to access health impacts of policies external to the
health sector, it is also used increasingly to access health impacts of health policies,
especially concerning health services and infrastructures 13,20,21.
A discussion was started by us back in September 2012 on the Health Impact Assessment
Group of the social network LinkedIn to try and learn what HIA experts thought of using
this methodology to assess the impact of health policies 22.
During the following month, some very interesting replies from group members
confirmed our expectations and enlightened also us on some research issues to bear in
mind, as can be seen in the figure below.
It may consequently be concluded from the discussion that it is indeed possible to use HIA
for health policies, especially when health equity, health systems impacts or integrated
impacts are an issue. Nevertheless, one needs to be careful and account for unexpected,
as well as expected, effects of the policies, involving the HIA commissioners and Steering
Groups right at the early screening and scoping stages of the process.
The use of HIA on health sector proposals, in its general form or specific form of Equity
focused health impact assessment, has been acknowledge and justified by mainly
enhancing the advantages of fully integrating health equity concerns into the decision-
making process 23.

Chapter 1 - Introduction and Main Research Aims
Leonor Bacelar Nicolau PhD Thesis Chapter 1 - Page 9/149
Figure 4. Selected comments from the HIA of health policies discussion on the HIA Group of LinkedIn website

Chapter 1 - Introduction and Main Research Aims
Chapter 1 - Page 10/149 Leonor Bacelar Nicolau PhD Thesis
1.5. Timings of HIA: prospective, concurrent or retrospective
HIA can be defined as prospective, concurrent or retrospective, depending on its timing.
Ideally and at first glance, HIA should be carried out prospectively, before or while a
proposal is being developed, to maximize the potential of incorporating HIA
recommendations into the draft proposal. A concurrent HIA executed while the policy is
being implemented may however inform a review process to improve its health effects in
the future and may benefit from having already some additional available data. A
retrospective HIA may also be applied after a policy has already been implemented and
may be especially useful when a similar proposal is being developed or changes in the
previous policy are being considered 13.
Nevertheless it has been argued that if HIA concerns predicting health impacts, then HIA
is always ‘prospective’ and ‘retrospective HIAs’ should be referred as ‘evaluation’, while
‘concurrent HIAs’ are actually monitoring 21.
In the Portuguese language, the word “avaliação” refers to the action of “avaliar” that
means both to “evaluate” and to “assess” as may be seen in figure 6 18. During the
“Capacity building workshop on equity-focused HIA” in Lisbon on January 2013, organized
by WHO Regional Office for Europe and the Ministry of Health of Portugal, DGS and INSA,
facilitator Ben Cave noted this language issue could explain why Portuguese accepted so
naturally that HIA could be applied retrospectively, as well as prospectively or
concurrently, while many people from English speaking countries favored a prospective
timing.
Additionally, “a retrospective HIA differs from evaluation as it focuses on how health has
been affected which may not have been an explicit objective of the policy, programme or
project” 13.
Moreover, as quantification becomes increasingly important in HIA, the more relevant it
becomes to use HIA in a first apparently non-prospective scenario, that may then become
prospective, whenever changes in policies are wanted. Using data from the present and
the past enriches the process of estimating health effects and predicting the future 24-26.

Chapter 1 - Introduction and Main Research Aims
Leonor Bacelar Nicolau PhD Thesis Chapter 1 - Page 11/149
Figure 5. Portuguese-English Translation of “Avaliar”
1.6. Quantification
HIA is regularly being used in many countries such as the UK, the Netherlands, Australia,
New Zealand, Thailand, the USA and others, more often with a qualitative emphasis 21,27.
Quantifying health estimations within HIA was however very early in HIA history
identified as potentially more informative and influential with decision-makers 21,26,
complementing qualitative analyses to achieve more robust, evidence-based and whole
estimations of health impacts that would include the nature of these impacts, as well as
their direction, magnitude and distribution.
Nevertheless, it has been recognized that quantification within HIA is rarely done, since it
“is often hard or impossible” because of a lack of information regarding initial conditions,
effects of the proposal, and the theoretical framework linking conditions to health
outcomes 21.
Generally, two different approaches to HIA quantification have been followed, one based
on health economic evaluation and another on risk assessment 28. Quantified HIA based

Chapter 1 - Introduction and Main Research Aims
Chapter 1 - Page 12/149 Leonor Bacelar Nicolau PhD Thesis
on health economic evaluation relies on health technology assessment methods,
estimating indirect costs and health-related quality of life indicators 29 and dealing with
equity for instance by applying weights to account for inequalities when calculating
health gains or by estimating health benefits separately by relevant population sub-
groups 30. The HIA quantification based on risk assessment is grounded in environmental
and public health research experience of estimating risk exposure, frequently relying on
epidemiology modelling 21,28. Other HIA related quantification experiences include
profiling individuals, screening policies 31-33 and evaluating HIA effectiveness 23,24,34,35.
An assortment of computational tools for HIA quantification has been made available:
some more generic, others more specific to certain determinants or diseases; some more
related to environmental health risk assessments, others more in tune with public health
risk factor-outcome modelling; most not very user-friendly without support from the
original developers. Further tool development is no longer considered a priority, but
improvements are needed regarding two aspects: its application in various real-life
contexts and especially in “whether and how they estimate impacts on health
inequalities” 15,28,36.
The fact is that HIA still quite seldom uses multivariate statistical methods to estimate
health impacts while taking equity into account and providing easy to understand visual
outputs 15,26,37.
Among the difficulties, a major one is to find available and reliable data to model
interrelations, explicitly between health determinants, health impacts, policies and
related costs 24,28,36,38. Another barrier is that complex statistical methodologies used
frequently generate results difficult to understand by non-statisticians, including decision-
makers 28,37, who often do not have a deep technical and statistical background 39.
1.7. Integration with other methodological approaches
Although HIA as an assessment may be used on its own, it is quite regularly used as a
complement to other related methodologies and tools (such as environmental or
integrated assessments, or even economic evaluation) or giving emphasis to particular
areas within it 24. The HIA methodology itself finds parallels and overlaps with other
Chapter 1 - Introduction and Main Research Aims
Leonor Bacelar Nicolau PhD Thesis Chapter 1 - Page 13/149
impact assessments such as Environmental Impact Assessment (EIA), Sustainability
Statement (SS), Poverty Impact Assessment (PIA), Human Rights Impact Assessment
(HRIA), Equality Impact Assessment (EqIA), Mental Health Impact Assessment (MHIA),
Strategic Environmental Assessment (SEA) or Integrated Impact Assessment (IIA) 13,40.
We highlight the following assessments as particularly relevant for us to complement HIA:
• Equity Focused Health Impact Assessment (EFHIA) concentrates, even more than
HIA, on identifying any health inequities in particular groups or sub-populations
and generally on the search for equity when implementing a project or policy 20;
• Health Systems Impact Assessment (HSIA) is often applied in the context of
Integrated Impact Assessment, incorporating also economic, social and
environmental impacts 19,41,42;
• Economic evaluation like Cost Effectiveness Analysis (CEA) assesses positive and
negative health effects, when comparing the relative costs and outcomes of two
or more possible courses of action 43,44;
• Health Technology Assessment (HTA) has as main purpose to inform policy
decision-makers on the best limited funds allocation regarding health
interventions and technologies, taking into account related clinical, social,
economic, organizational and ethical issues 16.
Being able to pick out aspects of these complementary areas and use these in a
multivariate and integrated way may be useful to expand knowledge on interrelations
between health determinants, health impact and economic outcomes. It may also be
valuable to show how investing in health may offer a return in terms of economy,
prosperity and well-being for society. Investing in health has indeed direct and indirect
consequences through health systems in a country’s gross domestic product, affecting its
competitiveness via labor costs, labor market flexibility and resource allocation at
macroeconomic level 45. This is a particularly important area regarding the pressing need
to engage other sectors than health in HIA, since the return of a potential health
investment may be quantified regarding these other areas.

Chapter 1 - Introduction and Main Research Aims
Chapter 1 - Page 14/149 Leonor Bacelar Nicolau PhD Thesis
1.8. Reaching out to decision makers
The growing importance of HIA and associated methodologies in the present and in the
future is to be expected in the light of international documents such as the “Adelaide
Statement on Health in All Policies - moving towards a shared governance for health and
well-being” 46, the “Rio Political Declaration on Social Determinants of Health” 47 or the
Health 2020 European Policy Framework and Strategy for the 21st Century 48.
Among advantages of systematically adopting health impact assessment in decision
making, we highlight 13,24,25,37,49;
• Raising awareness among decision makers of interrelations between health and
physical, social and economic environments;
• Increasing awareness among decision makers and other stakeholders on how a
policy, program or project may affect health of a given population;
• Providing precise recommendations on how a policy, program or project could be
modified to maximize health gains and minimize health losses;
• Increasing the number and quality of informed and evidence based decision
making processes;
• Carrying out projects and policies with always present concerns of reaching
precise goals, of underlying planning, of analyzing health effects, before, during
and after its implementation.
• Helping, whenever possible, those affected by the policy, program or project to
participate in the proposal planning and creation, thus contributing to decision-
making, but also to a clearer and more transparent process;
• Linking, whenever possible, health impacts to specific costs of each project or
policy.
Hence, HIA has a very practical goal of informing and helping decision-makers reach a
decision of going further with a policy (or not) and in what way. This means that even if it
is used in a more quantified and multivariate way, it has to take into account that,
although statistical methodologies used may be complex, obtained outputs have to be
comprehensible, simple to visualize, interpret and lead to clear recommendations.

Chapter 1 - Introduction and Main Research Aims
Leonor Bacelar Nicolau PhD Thesis Chapter 1 - Page 15/149
1.9. Practice in Portugal and in other countries
Internationally, even if many HIAs are presently undertaken outside legislative or
regulatory requirements, most voluntary HIAs are conducted within the public sector 24.
Whenever HIA is supported by policy or regulation, two broad approaches are identified:
specific provisions are created for the use of HIA through laws, regulatory mandates or
supportive policies; health concerns are included within whole-of-government decision-
making processes, which may or may not include HIA.
Therefore, frequently the use of HIA is mandatory as part of EIAs or other impact
assessments, as for instance in Alaska or as stated in the USA’s National Environmental
Policy Act 50,51, but also compulsory through legislation for certain projects in specific
sectors and beyond a certain scale 52. However, in some countries using HIA comes from a
general requirement of government proposals being appraised for their health effects,
such as in The Netherlands 53, Canada 4 or Australia 54. In Europe, most European
Commission initiatives have to comply with official impact assessment guidelines,
including health and health systems impacts 55. A specific EU Health Systems Impact
Assessment webtool has even been developed, to be used as part of the European
Commission’s Impact Assessment, although it is not clear from the list of impact
assessment reports available online how often it is used 19,41,56.
In Portugal, the need of using HIA has been clearly stated since the National Health Plan
2004-2010 19. A few conferences and workshops have taken place such as the “European
meeting on Health and Health Systems Impact Assessment” (Lisbon, November 5-6 2007)
during the Portuguese Presidency of the European Union Council, the “I National
Workshop on Health Impact Assessment – concepts and practice” (Lisbon, November 20
2009) or the “Capacity building workshop on equity-focused Health Impact Assessment”
(Lisbon, January 28-30 2013), that encouraged for example an equity-focused HIA of
Changes on Portuguese Tobacco legislation 57,58. There also seems to be a wish to develop
HIA linked to health promotion in healthy cities 59, to environmental health 60, and to
contribute to policies assessment and quantification in HIA 31-33,61,62.

Chapter 1 - Introduction and Main Research Aims
Chapter 1 - Page 16/149 Leonor Bacelar Nicolau PhD Thesis
Nevertheless, despite all these efforts and activities, the widespread use of HIA doesn’t
seem to really take off in Portugal, the health sector still doesn’t get very much involved
with activities from other sectors, health impacts linked to equity concerns are still not a
current concern that translates into using HIA in everyday practice 16.
This situation is not very different from France, where the Institut national de prévention
et d’éducation pour la santé has been encouraging the use of HIA roughly through the
past 10 years 63, but where HIA is still considered a new practice, an emergent initiative,
easier to undertake at local level, rather than at national level, but with an increasing
strong concern regarding equity 64-66.
1.10. What this research adds
The holistic definition of health that guides this research, stated in section 1.1, puts health
as the focal point of multifaceted interdependencies with all health determinants. Hence,
this naturally leads to an aspiration to use multivariate statistical methodologies to
capture at least part of these complex interrelations.
The concern of taking into account not only the general health impact of policies on a
population but also the variability of the impact throughout that population and its link to
inequities (section 1.2) is at the heart of what HIA stands for (section 1.3). Multivariate
statistical methodologies studying the interconnections between health determinants
and health impacts, and simultaneously identifying potentially different risk groups of
individuals, seem to be fitting.
The impact of public policies within the health sector that may not be directly related to
clinical issues, but to the way health services are organized and managed should be taken
into account by HIA (section 1.4). However, the wish not to do a HIA per se, but to
propose statistical methodologies and procedures to improve the HIA process within
several of its steps, as well as to use real data to do so, sets this research in a non-
prospective context (section 1.5). The methodological proposals that arise from this
research however may be used in any kind of HIA timing.
Applying multivariate statistical methodologies to enrich the HIA process, also contributes
to set HIA onto the path of an increased quantification (section 1.6), that may also even

Chapter 1 - Introduction and Main Research Aims
Leonor Bacelar Nicolau PhD Thesis Chapter 1 - Page 17/149
be useful to other impact assessments and related areas (section 1.7). Inversely, it also
may bring features of those other assessments into HIA, such as evaluating impacts of
health systems policies and their effects on the health of a particular population of health
systems users, linking those to costs and economic evaluation.
Finally, the kind of multivariate statistical methodologies to be applied, however complex,
should take into consideration that the ultimate goal of HIA is to make life easier on
decision makers, and should thus generate comprehensible outputs: simple to visualize
and to interpret, leading to clear and useful recommendations (section 1.8). Hopefully our
research will add its contribution to a more extensive and current use of HIA, not only at a
Portuguese level but also expectantly at an international level (section 1.9).
The present research should bring value to the use of HIA and be helpful for decision-
makers, by making a contribution to:
• Show how to apply HIA in a multivariate context, to take into account complex
interrelations between social, economic, political, cultural and environmental
health determinants and thus contribute to build a solid base for health
promotion;
• Develop easy but reliable ways of identifying subgroups within the populations
whose health is more and less affected by policies to undertake, thus promoting
equity and controlling inequities;
• Show how the use of quantified data, already collected for other purposes from
different sources, may be invaluable to the HIA process, as an evidence-base for
screening policies and modelling health impacts while bearing in mind subgroups
of the population;
• Show how quantification and multivariate statistical methodologies lead to
evidence-based results easy to grasp by public health experts, epidemiologists and
decision-makers;
• Contribute, especially in Portugal, to incorporate further within the decision-
making process an evidence-based practice of planning, modelling, monitoring
and evaluating policies;
• Emphasize that HIA may evaluate policies outside the health sector, but also
policies within the health sector, especially whenever health promotion is an

Chapter 1 - Introduction and Main Research Aims
Chapter 1 - Page 18/149 Leonor Bacelar Nicolau PhD Thesis
issue, since it considers health determinants from very different natures, or
policies regarding the organization and management of health systems are at
stake;
• Remember that investing in health improves the general wellbeing of society, and
through HIA, by minimizing negative health impacts and maximizing positive
health impacts of policies within or outside the health sector, we are indirectly
investing in health and contributing to improve economy, prosperity and well-
being for the all of society.
2. Research Aims
2.1. Main Aim
The main aim of this research is to show the usefulness of applying quantified
multivariate statistical methodologies with helpful visualization approaches, to enrich the
HIA practice, while making the decision-making process easier, in terms of issuing
understandable outputs even for non-statisticians, in a deeply evidence based context.
2.2. General Goals
Our general goals are to:
• Identify throughout different HIA steps (screening, impact and outcome
evaluation), the potential added-value of applying certain multivariate statistical
methodologies and thus enrich the way HIA is presently done.
• Use complementary multivariate methodologies such as hierarchical cluster
analysis, multiple correspondence analysis and others in HIA in a Portuguese
context, applicable in the future to other situations at national and international
level, studying interrelations between health impact sources and its effects,
contributing to equity promotion.
Chapter 1 - Introduction and Main Research Aims
Leonor Bacelar Nicolau PhD Thesis Chapter 1 - Page 19/149
• Integrate in our research equity aspects, identifying subpopulations where health
impact magnitudes are different and more severe and show how this may be
taken into account in decision making for a particular policy.
• Show how results may be presented in a visual, graphical way, so that conclusions
may be understandable even for non-statisticians, although in a deeply evidence
based context.
2.3. Stages and Chapters
To achieve these goals, we will follow a path across the next different stages:
• Explore recent research on HIA to identify current and future possible paths to
follow (chapter 2);
• Show how using hierarchical cluster analysis may contribute to the HIA screening
step (chapter 3), as a way to:
o identify groups of policies more pertinent for decision makers as potential
candidates for the HIA process, which may be especially appropriate in
countries where HIA is non-mandatory, by prioritizing different policies
regarding the health systems Portuguese hospital reform to identify those
more relevant to apply HIA to;
o Screen through different national health programs to select the context
within which to apply HIA, electing the Cerebro-cardiovascular disease
national health program as the more appropriate according to a particular
set of criteria;
• Illustrate how the use of multivariate statistical analysis may make a valuable
contribution when conducting an HIA, especially (chapter 4):
o whenever regional or other equity issues are at stake,
o while integrating multi source health information (hospitals and primary
healthcare, pharmaceutical consumption and mortality),
o in the context of a particular National Health Program (Cerebro-
cardiovascular disease),

Chapter 1 - Introduction and Main Research Aims
Chapter 1 - Page 20/149 Leonor Bacelar Nicolau PhD Thesis
o when estimating health impacts of policies regarding the hospital reform
and its links to primary healthcare.
Each of these stages will be presented within its own chapter further on, with its specific
aims, methods, results, discussion and conclusions (chapters 2 to 4), as well as references
and appendices. A final chapter will discuss and integrate main findings regarding each
stage and conclude and issue recommendations on how to use applied quantified
multivariate statistical methodologies to enrich the HIA process (chapter 5). A methods
section that presents and summarizes the various statistical methods used may be
consulted in general appendices.
References
1. World Health Organization. Preamble to the Constitution of the World Health Organization as adopted by the International Health Conference, New York, 19-22 June, 1946; signed on 22 July 1946 by the representatives of 61 States (Official Records of the World Health Organization, no. 2, p. 100) and entered into force on 7 April 1948, 1948. 2. WHO Concepts and Principles of Health Promotion Working Group. Annex 1: A Discussion Document on the Concept and Principles of Health Promotion 9-13 July 1984. In: Organization WH, ed. Milestones in Health Promotion - Statements from Global Conferences: WHO; 2009. 3. World Health Organization. Health Impact Assessment - The Determinants of Health. 8/13/2015. http://www.who.int/hia/evidence/doh/en/ (accessed 8/13/2015). 4. Health Canada. Canadian Handbook on Health Impact Assessment - Volume 1: The Basics. In: Canada H, editor. Canada: Canadian Ministry of Health; 2004. 5. Dahlgren G, Whitehead M. Policies and strategies to promote social equity in health. Stockholm, 1991. 6. WHO CSDH. Closing the gap in a generation: health equity through action on the social determinants of health. Final Report of the Commission on Social Determinants of Health. Geneva, Switzerland: World Health Organization; 2008. 7. European Centre for Health Policy. Health Impact Assessment - main concepts and suggested approach. Gothenburg Consensus Paper. Göteborg, Sweden: ECHP World Health Organization Regional Office for Europe; 1999. 8. Quigley R, den Broeder L, Furo P, Bond A, Cave B, Bos R. Health Impact Assessment International Best Practice Principles. IAIA 2006; (Special Publication Nº5). 9. WHO Regional Office for Europe. Health 21: The health for all policies framework for the WHO European Region: World Health Organization; 1999. 10. Stahl T, Wismar M, Ollila E, Lahtinen E, Leppo K, editors. Health in All Policies - Prospects and Potentials: Ministry of Social Affairs, Finland ; European Observatory on Health Systems and Policies; 2006. 11. Project Group EPHIA, editor. European Policy Health Impact Assessment EPHIA: a Guide: Health and Consumer Protection DG of the European Commission; 2004. 12. Lehto J, Ritsatakis A. Health Impact Assessment as a tool for inter-sectoral health policy: a discussion paper for a seminar at Gothenburg, Sweden. Brussels, Belgium, 1999.

Chapter 1 - Introduction and Main Research Aims
Leonor Bacelar Nicolau PhD Thesis Chapter 1 - Page 21/149
13. Metcalfe O, Higgins C, Lavin T. Health Impact Assessment Guidance: Institute of Public Health in Ireland; 2009. 14. Scott-Samuel A, Birley M, Ardern K. The Merseyside Guidelines for Health Impact Assessment. 2nd ed: International Health Impact Assessment Consortium; 2001. 15. Fehr R, Viliani F, Nowacki J, Martuzzi M, editors. Health in Impact Assessments: Opportunities not to be missed. Copenhagen: WHO Regional Office for Europe; 2014. 16. Bacelar-Nicolau L, Heitor M, Pereira Miguel J. 7.3 Avaliação de Impacte na Saúde. In: Feijó A, Ferrão J, Monteiro S, Pinto Paixão J, eds. Metodologias de Avaliação de Políticas Públicas (in press). Lisboa: Imprensa da Universidade de Lisboa; 2017. 17. Oxford Dictionaries. Oxford Dictionaries definition of Impact. 11/16/2014. http://www.oxforddictionaries.com/definition/english/impact (accessed 11/16/2014). 18. Porto Editora. Dicionário da Lingua Portuguesa com acordo ortográfico [em linha]. 11/7/2014. http://www.infopedia.pt/dicionarios (accessed 11/7/2014). 19. Heitor MJ, Pereira Miguel J. Avaliação do Impacte de políticas de diferentes sectores na saúde e nos sistemas de saúde: um ponto de situação. Revista Portuguesa de Saúde Pública 2009; 27(1): 5-17. 20. Mahoney M, Simpson S, Harris E, Aldrich R, Stewart-Williams J. Equity-focused health impact assessment Framework: the Australasian Collaboration for Health Equity Impact Assessment (ACHEIA); 2004. 21. Kemm J, editor. Health Impact Assessment: Past Achievements, Current Understanding and Future Progress: Oxford University Press; 2013. 22. Bacelar-Nicolau L. Applying HIA to Projects and Policies in the Health Sector. 9/25/2012 2012. https://www.linkedin.com/groups?gid=2144549&trk=my_groups-b-grp-v (accessed 9/25/2012 2012). 23. Harris-Roxas B, Haigh F, Travaglia J, Kemp L. Evaluating the impact of equity focused health impact assessment on health service planning: three case studies. BMC Health Serv Res 2014; 14: 371. 24. Harris-Roxas B, Viliani F, Bond A, Cave B, Divall MJ, Furu P, Harris P, Soeberg M, Wernham A, Winkler M. Health impact assessment: the state of the art. Impact Assessment and Project Appraisal 2012; 30(1): 43-52. 25. Kemm J. The future challenges for HIA. Environmental Impact Assessment Review 2005; 25(7-8): 799-807. 26. Mindell J, Hansell A, Morrison D, Douglas M, Joffe M. What do we need for robust, quantitative health impact assessment? Journal of Public Health Medicine 2001; 23(3): 173-8. 27. World Health Organization. Examples of HIA. 8/13/2015. http://www.who.int/hia/examples/en/ (accessed 8/12/2015). 28. Fehr R, Hurley F, Mekel OC, Mackenbach JP. Quantitative health impact assessment: taking stock and moving forward. J Epidemiol Community Health 2012; 66(12): 1088-91. 29. Brodin H, Hodge S. A guide to Quantitative Methods in Health Impact Assessment. Stockholm, Sweden: STATENS FOLKHÄLSOINSTITUT, Östersund / Swedish National Institute of Public Health; 2008. 30. Glover D, Henderson J. Quantifying health impacts of governement policies, 2010. 31. Bacelar-Nicolau L, Pereira Miguel J, Saporta G. The Added Value of Multivariate Statistical Data Analysis in Policy HIA – A Quantitative Way of Profiling Subjects (Poster). HIA08 Health Impact Assessment and Sustainable Well-being - 9th Conference on Health Impact Assessment, 9-10 October 2008; 2008 10/9/2008; Liverpool, UK; 2008. 32. Bacelar-Nicolau L, Pereira Miguel J, Saporta G. Screening Policies for Health Impact Assessment: cluster analysis for easier decision making. European Journal of Public Health 2015; 25(suppl_3): 133-4. 33. Bacelar-Nicolau L, Pereira Miguel J, Saporta G. Screening Policies in Health Impact Assessment: easier decision making through cluster analysis. European Journal of Epidemiology

Chapter 1 - Introduction and Main Research Aims
Chapter 1 - Page 22/149 Leonor Bacelar Nicolau PhD Thesis
European Congress of Epidemiology Healthy Living 2015: Bols E.; Smits L.; Weijenberg M. (Eds.); 2015. p. 852-. 34. Haigh F, Harris E, Harris-Roxas B, Baum F, Dannenberg AL, Harris MF, Keleher H, Kemp L, Morgan R, Ng Chok H, Spickett J. What makes health impact assessments successful? Factors contributing to effectiveness in Australia and New Zealand. BMC Public Health 2015; 15(1009): 1009. 35. Veerman JL, Mackenbach JP, Barendregt JJ. Validity of predictions in health impact assessment. J Epidemiol Community Health 2007; 61(4): 362-6. 36. Fehr R, Mekel OCL, Hurley JF, Mackenbach JP. Health impact assessment - A survey on quantifying tools. Environmental Impact Assessment Review 2016; 57: 178-86. 37. Veerman JL, Barendregt JJ, Mackenbach JP. Quantitative health impact assessment: current practice and future directions. J Epidemiol Community Health 2005; 59(5): 361-70. 38. Kemm J. Comments on HIA forecast: cloudy with sunny spells. European Journal of Public Health 2008; 18(5): 438-9. 39. Veerman JL. Quantitative health impact assessment: an exploration of methods and validity; 2007. 40. Mills J. Local Development Framework: Health Impact assessment - Supplementary Planning Document, 2011. 41. Deltour A, Hedin A, Koho A, van Elk B, Lathinen E, Liaudanskiené R, Pereira Miguel J. Working Group on Health Impact Assessment and Health Systems: Towards Health Systems Impact Assessment, 2004. 42. Albuquerque JM, Pereira Miguel J. Health Systems Impact Assessment and the High Level Group on Health Services and Medical Care. EU Ministerial Conference "Health in All Policies: Achievements and Challenges"; 2007 12/18/2007; Rome, Italy; 2007. 43. Merkur S, Sassi F, McDaid D. Promoting health, preventing disease: is there an economic case?: WHO Regional Office for Europe and European Observatory on Health Systems and Policies; 2013. 44. WHO Regional Office for Europe and European Observatory on Health Systems and Policies. Health Systems, Health Wealth and Societal Well-being: Assessing the case for investing in health systems: WHO Regional Office for Europe and European Observatory on Health Systems and Policies; 2012. 45. Suhrcke M, Mckee M, Sauto-Arce R, Tsolova S, Mortensen J. The contribution of health to the economy in the European Union: Health&Consumer Protection Directorate-General - European Commission - European Communities; 2005. 46. Adelaide statement on health in all policies: moving towards a shared governance for health and well-being. Adelaide, Australia; 2010. 47. Rio Political Declaration on Social Determinants of Health. Rio de Janeiro, Brazil; 2011. 48. WHO Regional Office for Europe. Health 2020: A European Policy Framework and Strategy for the 21st Century: World Health Organization; 2013. 49. Kemm J, Parry J, Palmer S, editors. Health Impact Assessment: Concepts, Theory, Techniques, and Applications. Oxford: Oxford University Press; 2004. 50. Bhatia R, Wernham A. Integrating human health into environmental impact assessment: an unrealized opportunity for environmental health and justice. Environ Health Perspect 2008; 116(8): 991-1000. 51. Wernham A. Inupiat health and proposed Alaskan oil development: Results of the first integrated Health Impact Assessment/Environmental Impact Statement for proposed oil development on Alaska's North Slope. Ecohealth 2007; 4(4): 500-13. 52. Health Impact Assessment Coordinating Unit. Thailand's Rules and Procedures for the Health Impact Assessment of Public Policies. Thailand, 2010. 53. den Broeder L, Penris M, Put GV. Soft data, hard effects. Strategies for effective policy on health impact assessment--an example from the Netherlands. Bull World Health Organ 2003; 81(6): 404-7.

Chapter 1 - Introduction and Main Research Aims
Leonor Bacelar Nicolau PhD Thesis Chapter 1 - Page 23/149
54. Harris P, Harris-Roxas B, Harris E, Kemp L. Health Impact Assessment: A Practical Guide. Sydney: Centre for Health Equity Training, Research and Evaluation (CHETRE). Part of the UNSW Research Centre for Primary Health Care and Equity, UNSW.; 2007. 55. European Commission. European Comission's Health in all policies - Impact. 30/10/2017. https://ec.europa.eu/health/health_policies/impact_en (accessed 30/10/2017). 56. European Commission. European Commission's list of Final Impact Assessment reports. 10/01/2017. http://ec.europa.eu/smart-regulation/impact/ia_carried_out/cia_2016_en.htm (accessed 24/10/2017). 57. Direção de Serviços de Prevenção da Doença e Promoção da Saúde. Avaliação de Impacto da Lei do Tabaco com foco na equidade. Portugal, 2014. 58. Costa A, Cortes M, Sena C, Nunes E, Nogueira P, Shivaji T. Equity-focused health impact assessment of Portuguese tobacco control legislation. Health Promot Int 2016: 1-9. 59. Loureiro I, Miranda N, Pereira Miguel J. Promoção da saúde e desenvolvimento local em Portugal: reflectir para agir. Revista Portuguesa de Saúde Pública 2013; 31(1): 23-31. 60. Dias D, Tchepel O, Carvalho A, Miranda AI, Borrego C. Particulate matter and health risk under a changing climate: assessment for Portugal. ScientificWorldJournal 2012; 2012(Article ID 409546,): 409546. 61. Bacelar-Nicolau L, Barbosa P, Sakellarides C. Part II: Country profiles of health system responses to the crisis - Portugal. In: Maresso A, Mladovsky P, Thomson S, Sagan A, Karanikolos M, Richardson E, Cylus J, Evetovits T, Jowett M, Figueras J, Kluge H, eds. Economic crisis, health systems and health in Europe – Country experience: Maidenhead: Open University Press on behalf of the European Observatory on Health Systems and Policies and World Health Organization Regional Office for Europe; 2015: 460-5. 62. Bacelar-Nicolau L, Rodrigues T, Fernandes E, Lobo MF, Nisa C, Azzone V, Teixeira-Pinto A, Rocha-Gonçalves FN, Azevedo LF, Freitas A, Normand ST, Costa-Pereira A, Pereira Miguel J. Helping Decision-Makers Visualize Inequities In Health Impact Assessment: Linked Electronic Records, Mortality And Regional Disparities In Portugal. Value in Health: Elsevier; 2016. p. A623. 63. INPES. Évaluation en santé publique. 11/23/2015. http://www.inpes.sante.fr/evaluation/default.asp. 64. Valentini H, Saint-Pierre L. L'évaluation d'impact de la santé, une démarche structurée pour instaurer de la santé dans toutes les politiques. Santé Publique 2012; 24(2012/6): 479-82. 65. Lang T, Bidault E, Villeval M, Alias F, Gandouet B, Servat M, Theis I, Breton E, Haschar-Noe N, Grosclaude P. A health equity impact assessment umbrella program (AAPRISS) to tackle social inequalities in health: program description. Glob Health Promot 2016; 23(3): 54-62. 66. Villeval M, Bidault E, Lang T, pour le groupe A. Évaluation d'impact sur la santé et évaluation d'impact sur l'équité en santé : éventail de pratiques et questions de recherche. Glob Health Promot 2016; 23(3): 86-94.

Chapter 1 - Introduction and Main Research Aims
Chapter 1 - Page 24/149 Leonor Bacelar Nicolau PhD Thesis
Leonor Bacelar Nicolau PhD Thesis Chapter 2 - Page 25/149
Chapter 2 –Exploring and Profiling through the State of the Art
CONTENTS Abstract ............................................................................................................................................ 26 1. Introduction ............................................................................................................................... 28 2. Data and Methodologies ............................................................................................................. 29 2.1. HIA Guides Dataset ................................................................................................................... 29 2.2. HIA Papers Dataset ................................................................................................................... 30 3. Results ........................................................................................................................................ 33 3.1. Summarizing systematic reviews in a more “visual” way ......................................................... 33 3.2. Going even further in automatizing and visualizing systematic reviews’ information ............. 37 3.2.1. Text mining analysis on the Titles of papers ................................................................. 38 3.2.2. Text mining analysis on the Keywords of papers .......................................................... 40 4. Discussion ................................................................................................................................... 44 4.1. Automation towards effectiveness ........................................................................................... 44 4.2. Even further automation towards effectiveness ...................................................................... 45 4.3. Linking quantification to monetary costs ................................................................................. 46 4.4. Limitations and Future Activities .............................................................................................. 47 5. Conclusions ................................................................................................................................. 47 References ....................................................................................................................................... 48

Chapter 2 - Exploring and Profiling through the State-of-the-Art
Chapter 2 - Page 26/149 Leonor Bacelar Nicolau PhD Thesis
Chapter 2 –Exploring and Profiling through the State of the Art
“So you will see us continue to advance the state of the art or take information that we have in our response data bases and have that drive automation or an automated response by some of our products.” John W. Thompson
“Technology gives us power, but it does not and cannot tell us how to use that power. Thanks to technology, we can instantly communicate across the world, but it still doesn't help us know what to say.” Jonathan Sacks
“The first rule of any technology used in a business is that automation applied to an efficient operation will magnify the efficiency. The second is that automation applied to an inefficient operation will magnify the inefficiency.” Bill Gates
Chapter 1 introduced what HIA is about and the scope of our interest in it throughout our
research. Several very complete papers, books and guides regarding HIA state-of-the-art
have been published since its earlier applications 1-6. We went beyond these analyses to
add innovative useful ways of extracting knowledge when analyzing a bulk of potentially
interesting publications and we thus used multivariate data analysis to profile HIA guides
and HIA papers published during the period 2012-2014.
Abstract
Introduction: When needing to perceive the state-of-the-art about a particular body of
knowledge, one often systematically reviews existent bibliography, gathering relevant
publications on that specific subject and analyzing them in-depth or building a table of
characteristics each paper has or doesn’t have. This is typically a more qualitative
analysis. Our aim is to help this review process using multivariate quantitative methods
that allow for useful graphic representations.
Materials and Methods: Two datasets are considered. Firstly, a table characterizing 45
Health Impact Assessment (HIA) guides proposed by authors Hebert et al. of paper
“Health impact assessment: A comparison of 45 local, national and international
guidelines”. Multivariate Correspondence Analysis and Hierarchical Cluster Analysis were
applied to identify common and distinct features between guides and create similar guide

Chapter 2 - Exploring and Profiling through the State-of-the-Art
Leonor Bacelar Nicolau PhD Thesis Chapter 2 - Page 27/149
profiles. Secondly, profiles of 247 HIA papers from 2012 to 2014 included on the list of
HIA Bibliography published and updated regularly by the HIA Gateway associated to
Public Health England were built, taking titles of those papers on the one hand, and
keywords when available on the other hand. Text mining analysis was applied to obtain a
lexical contingency table, which was then related to only 3 characteristics registered by us
for each paper (publication year, whether the title of the journal where it was published
had the word “environment” and if it applied some quantification methods and results)
through hierarchical cluster analysis and correspondence analysis.
Results: Regarding the sample of HIA guides, findings confirmed main conclusions from
original authors that a universal HIA guide could be a reality, but identified most common
and differentiating features in a more immediate and graphic way, going even further to
select potential candidates to universal guides. Regarding the sample of HIA papers, three
different profiles arisen, but only one, more linked to environmental papers, was more
related to the use of quantification, showing the need to further adopt quantified
methodologies when assessing health impact of non-environmental public policies.
Highlights: Using multivariate data analysis to extract main patterns from a table
describing features of a group of publications may save time, potentially decreases
subjectivity biases regarding interpretation of results and summarizes in quite an easy
way to visualize common and distinctive characteristics.
Taking the automation process even further and applying text mining analysis methods,
based even on elementary string information such as paper titles or keywords, consists an
innovative useful way of extracting knowledge when analyzing a bulk of potentially
interesting publications, quite instantly allowing for the identification of main underlying
profiles.
The immediate visualization these methodologies allow may make knowledge acquisition
easier for non-statisticians, potentially helping fruitful dialogue among multidisciplinary
teams and namely between public health experts and decision-makers.

Chapter 2 - Exploring and Profiling through the State-of-the-Art
Chapter 2 - Page 28/149 Leonor Bacelar Nicolau PhD Thesis
1. Introduction
The expression state-of-the-art is defined as “the most recent stage in the development
of a product, incorporating the newest ideas and features” 7. Frequently, when one needs
to perceive the state-of-the-art about a particular body of knowledge, one does a
systematic review of existent bibliography, gathering a relevant group of publications on
that specific subject and analyzing those publications in-depth 8. That is typically a more
qualitative analysis. Often authors build a table of characteristics each paper has or does
not have 6 to help them systemize information and more easily identify differences and
similarities between various publications.
However, it would be helpful to make the process of getting and summarizing main points
of information within these papers easier, quicker and in a more automated way,
hopefully less permeable to subjectivity. One way would be to use a visualization
technique to help perceive, at a glance, the more relevant results, instead of (or as a
complement to) writing an extensive text analyzing and interpreting information. Hence
one could use quantitative methods that allow for graphic representation. With that
thought in mind we propose 2 different approaches.
First we take the table authors of paper “Health impact assessment: A comparison of 45
local, national and international guidelines” 6, published in online appendixes,
characterizing 45 HIA guides, and applied exploratory multivariate statistical analysis to
profile these publications. Our aim is to obtain results showing the main conclusions
authors found in a more immediate and graphic way to perceive.
Nevertheless, building a table describing a group of selected publications may yet take up
a considerable amount of time. Furthermore, characterizing publications on some of the
variables may sometimes be a quite subjective process, which may become a problem
especially when several different people are involved in the systematic classification and
registering process of information into table format 9.
Consequently, we propose a second approach now to make the process of characterizing
a group of papers more automatic, and hopefully speedier and simultaneously more

Chapter 2 - Exploring and Profiling through the State-of-the-Art
Leonor Bacelar Nicolau PhD Thesis Chapter 2 - Page 29/149
objective, by using text mining analysis methods 10,11. Our aim is to obtain profiles of 247
HIA papers from 2012 to 2014, taking titles of those papers, on the one hand, and
keywords when available, on the other hand, and relating them to only 3 characteristics
registered for each paper: publication year, whether the title of the journal where it was
published had the word “environment” (or closely related word such ‘environmental’ for
example) and if it applied some quantification in methods and results.
2. Data and Methodologies
2.1. HIA Guides Dataset
The first dataset used was based on the table of characteristics published by authors of
paper “Health impact assessment: A comparison of 45 local, national and international
guidelines” 6, describing 45 selected HIA guides, published from 1995 to 2011. Qualitative
characteristics were recoded into 26 nominal active variables and 2 additional
supplementary variables were included, from our own analysis of the sample, regarding
the region of origin and the kind of screening procedures presented within each HIA
Guide (table 1). Exploratory univariate statistical analysis was performed (see appendices
tables 4 to 9), to validate the adapted dataset and compare our results with those of the
original paper. Multivariate statistical methods were then applied, namely Multiple
Correspondence Analysis (MCA) and Hierarchical Cluster Analysis (HCA), to identify
common and distinct features between guides and create similar guide profiles 12-14. SPAD
software version 3.5 was used for this analysis 15.

Chapter 2 - Exploring and Profiling through the State-of-the-Art
Chapter 2 - Page 30/149 Leonor Bacelar Nicolau PhD Thesis
Table 1. Features characterizing sample of 45 HIA guidelines
Variables and their categories Active Variables
Focus of HIA Includes_List_Health_Determinants Focus All / Focus Policy / Focus Project List H Determin Y / List H Determin N Type of HIA Includes_Examples_CaseStudies_Resources Type All / Type Prospective / Type Retrospective Examples Y / Examples N Level Rapid Screening_Partial Level Rapid Y / Level Rapid N Screening Y / Screening Partial Level Intermediate Screening_Meetings Level Intermed Y / Level Intermed N Screening Meetings Y / Screening Meetings N Level Comprehensive Screening_ComprehensiveTools Level Comprehens Y / Level Comprehens N Screening Tools Y / Screening Tools N Level NoMultiple Scoping_Partial Level NoMultip Y / Level NoMultip N Scoping Y / Scoping Partial Discusses_Integration_with_other_IA Scoping_DiagramsLevel Integrat Other IA Y / Integrat Other IA N Scoping Diagrams Y / Scoping Diagrams N Mentions_Supportive_Policy_Authority Assessment_Partial Supportive Policy Y / Supportive Policy N Assessment Y / Assessment Partial Includes_Principles_or_Values Recommendations_Partial Principles Values Y / Principles Values N Recommendat Y / Recommendat Partial Considers_Equity_Inequalities_across_Population Reporting Equity Y / Equity N Reporting Y / Reporting Partial / Reporting N Encourages_Community_Engagement Reporting_Guidance Community Engag Y / Community Engag N Reporting Guidance Y / Reporting Guidance N Includes_Steering_Committee Evaluation_Monitoring
Steering Committe Y / Steering Committe N Evaluation Monitor Y / Evaluation Monitor Partial / Evaluation Monitor N
Recommends_Community_Profile Evaluation_Monitoring_TalkDecisionmakers Community Profile Y / Community Profile N Talk Decisionmak Y / Talk Decisionmak N Supplementary Variables Screening based on Region Screen Health Only Region International Screen Vague Other Region Europe Screen PoliticFinanc Region AustralAsia Screen Pre-screennin Region NorthAmerica Screen Not Available
2.2. HIA Papers Dataset
The second dataset was based on the list of HIA Bibliography published and updated
regularly by the HIA Gateway associated to Public Health England 16, last updated in
March 2014.

Chapter 2 - Exploring and Profiling through the State-of-the-Art
Leonor Bacelar Nicolau PhD Thesis Chapter 2 - Page 31/149
Inclusion criteria were: being a paper from the Health Impact Assessment Section of the
HIA Gateway Bibliography published in a scientific journal during 2012 to 2014 with
available abstract and/or complete text. Exclusion criteria were: being a book (4
references) or a conference abstract (17 references); being published on a different year
than 2012, 2013 or 2014 (erroneously catalogued in the HIA Gateway Bibliography – 4
references); not having available simultaneously an abstract nor complete text (1
reference); being duplicated in the original bibliography (5 pairs of references, usually
because dates of online publication preceded dates of paper publication).
A total of 29 references were thus eliminated from the initial 276 references, which
means 247 abstracts were analyzed: 136 references from 2012, 98 references from 2013
and 13 references from 2014. From these, 230 had the original papers also available
(93%). Note that only references until March 2014 were considered in the original HIA
Gateway document.
Text mining analysis methods were applied 10,11, regarding two string variables separately:
the title of the paper, obviously present for all 247 papers, and the list of keywords,
available for only 170 papers. For each string variable, a vocabulary of repeated words
and expressions or segments of words from the text data was automatically defined and
the frequency of appearance of words/segments was calculated. Only words and
segments with a total frequency of 10 or over were taken for analysis. Table 2 presents
the number of words and associated frequency for each step of the analysis.
A lexical contingency table was then automatically generated with these repeated words
and segments in rows and the groups defined by categories of selected nominal variables
in columns. The nominal variables crossed with word/segments were: Publication year
(2012, 2013 or 2014); Journal Title with or without “Environment”; Quantification of
methods and results (Quantification or No quantification) – appendixes tables 15 and 16.
These variables were created by going through the information usually available publicly
for all papers: titles, keywords and abstracts. Note that some journals without
“Environment” in the title may be also considered journals in a more environmental area
and journals in a more public health area may include so called environmental papers.
That is a limitation of this study that could confound the following multivariate results
and could be solved by a deeper analysis of the complete papers themselves. Yet it would
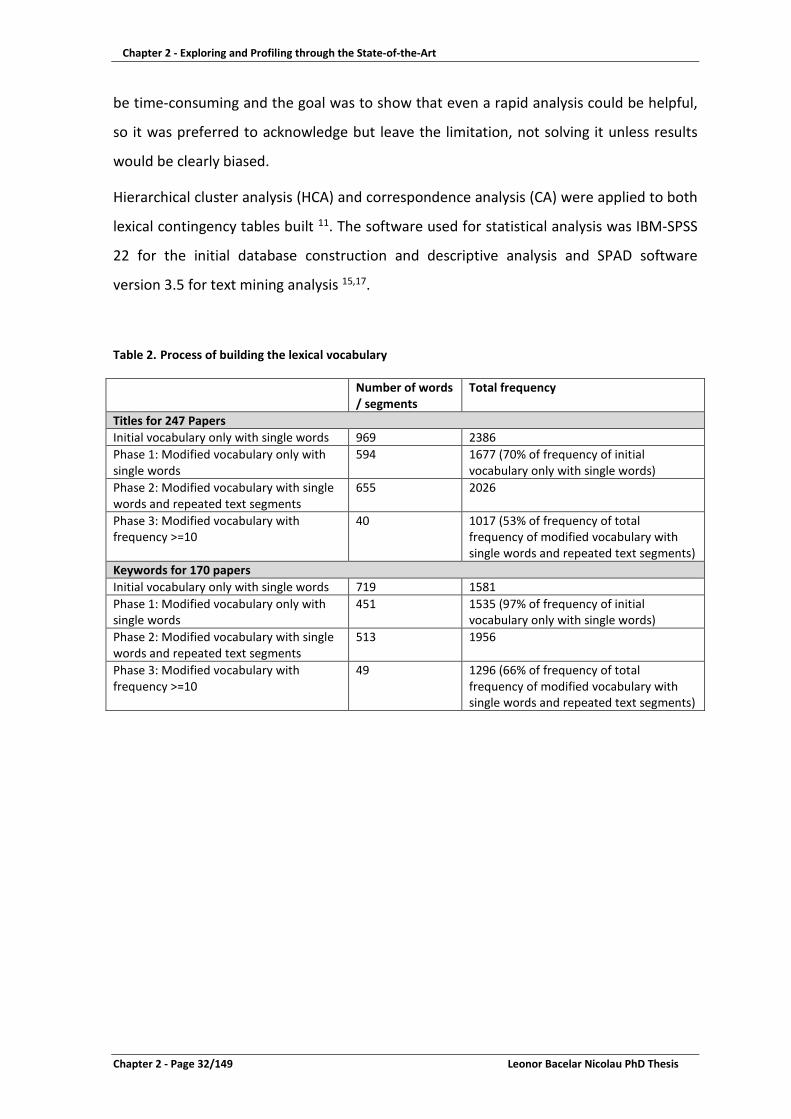
Chapter 2 - Exploring and Profiling through the State-of-the-Art
Chapter 2 - Page 32/149 Leonor Bacelar Nicolau PhD Thesis
be time-consuming and the goal was to show that even a rapid analysis could be helpful,
so it was preferred to acknowledge but leave the limitation, not solving it unless results
would be clearly biased.
Hierarchical cluster analysis (HCA) and correspondence analysis (CA) were applied to both
lexical contingency tables built 11. The software used for statistical analysis was IBM-SPSS
22 for the initial database construction and descriptive analysis and SPAD software
version 3.5 for text mining analysis 15,17.
Table 2. Process of building the lexical vocabulary
Number of words / segments
Total frequency
Titles for 247 Papers Initial vocabulary only with single words 969 2386 Phase 1: Modified vocabulary only with single words
594 1677 (70% of frequency of initial vocabulary only with single words)
Phase 2: Modified vocabulary with single words and repeated text segments
655 2026
Phase 3: Modified vocabulary with frequency >=10
40 1017 (53% of frequency of total frequency of modified vocabulary with single words and repeated text segments)
Keywords for 170 papers Initial vocabulary only with single words 719 1581 Phase 1: Modified vocabulary only with single words
451 1535 (97% of frequency of initial vocabulary only with single words)
Phase 2: Modified vocabulary with single words and repeated text segments
513 1956
Phase 3: Modified vocabulary with frequency >=10
49 1296 (66% of frequency of total frequency of modified vocabulary with single words and repeated text segments)

Chapter 2 - Exploring and Profiling through the State-of-the-Art
Leonor Bacelar Nicolau PhD Thesis Chapter 2 - Page 33/149
3. Results
3.1. Summarizing systematic reviews in a more “visual” way
The 45 HIA guides under study were issued between 1995 and 2011, about half of them
being published after 2004 (53%) and mostly coming from Europe (56%) 6. The authors
from the original paper aimed to identify “commonalities and differences within HIA
guides to discuss the plausibility of consensus guidelines and to inform guideline
development”. They did a detailed and extensive comparison of all guides’ features and
concluded that “a universal guide is possible and could become a crucial component to
growing the HIA discipline”. The alternative way here proposed to profile HIA guides with
multivariate statistical analysis, such as MCA and HCA, aims to answer these questions in
a more immediate way and show how one can even go further in this study, selecting
potential candidates as universal guides.
The MCA factors represent non-correlated dimensions of variability within data, ranked
by their importance to global variability within a dataset. Choosing the first 3 factors for
analysis means 32% of the initial variability will be studied, since factor 1, 2 and 3 explain,
respectively 13%, 10% and 9% of global variability. These low percentages associated with
main factors are, one the one hand, due to the MCA methodology itself that tends to
generate factors with percentages of explanation lower than other factorial methods,
such as principal component analysis or simple correspondence analysis. On the other
hand, it is also related to the guides being quite similar to each other, not generating clear
large dimensions that distinguish them.
A factorial plan embodies the variability associated with a pair of factors, one factor
represented on the horizontal axis of the plan and the other factor on the vertical axis:
features more similar throughout guides gather near the center or origin of the plan,
whereas features distinguishing guides position themselves further away from the center.
Taking the factorial plan 1-2, regarding the first 2 factors, similar features would be the
ones visible when zooming on the center of the plan (figure 3), whereas features
discriminating guides would be the ones farther from the center, towards right and left
regarding factor 1 and towards up and down concerning factor 2 (figure 2).

Chapter 2 - Exploring and Profiling through the State-of-the-Art
Chapter 2 - Page 34/149 Leonor Bacelar Nicolau PhD Thesis
The hierarchical cluster analysis dendrogram (figure 1) identifies partitions from 2 to 5
clusters of guides as candidates for analysis. To have more detailed guide profiles, a
partition of 5 clusters was selected. Each cluster is a group of guides with a similar profile.
Appendices table 11 identifies the guides belonging to each cluster.
Appendices Table 10 identifies features more and less common within each cluster:
• Cluster 1 groups 9 guides, that are all from Europe and mention policy authority,
but mostly have not a whole Assessment Step described, usually not including a
matrix or other tool for prioritizing impacts nor organizing information;
• Cluster 2 includes 9 guides that do not have particularly distinctive features from
the total sample;
• Cluster 3 groups 11 guides that tend not to include all 3 HIA usual focus areas
(policy, programs, projects), but integrate comprehensive scoping diagrams to
determine the adequate HIA level to conduct, provide guidance on what to
include or not when reporting results, adapting that report to the target audiences
and recommend talking to decision-makers so that the process may be evaluated
and its usefulness appraised;
• Cluster 4 comprises 10 guides that all discuss integration of HIA with other Impact
Assessments and debate the different levels of HIA, without giving importance to
a particular level (not focusing particularly rapid nor comprehensive HIA levels);
• Cluster 5 includes 6 guides that do not present whole descriptions of both the
screening and scoping steps, also tending to ignore the evaluation and monitor
HIA step.
The fact that both features and clusters of guides may generally be found near the center
of the various factorial plans means that guides are mostly very similar to each other.
The aim of the authors of the original paper to identify common and different features
would thus be quite simple too reach with MCA. It is very clear to identify both these
types of features from visual observation of the factorial plans.
Whenever one has a table of qualitative features (nominal variables) describing a sample
of publications, one may use MCA and HCA to check their overall resemblance and create

Chapter 2 - Exploring and Profiling through the State-of-the-Art
Leonor Bacelar Nicolau PhD Thesis Chapter 2 - Page 35/149
profiles, groups of similar publications, identifying their main common and distinctive
characteristics.
Figure 1. HCA Dendrogram of 45 HIA guidelines
Indiv idu n° 1
Indiv idu n° 13
Indiv idu n° 15
Indiv idu n° 44
Indiv idu n° 24
Indiv idu n° 25
Indiv idu n° 6
Indiv idu n° 4
Indiv idu n° 21
Indiv idu n° 7
Indiv idu n° 28
Indiv idu n° 26
Indiv idu n° 36
Indiv idu n° 30
Indiv idu n° 20
Indiv idu n° 38
Indiv idu n° 11
Indiv idu n° 29
Indiv idu n° 42
Indiv idu n° 12
Indiv idu n° 10
Indiv idu n° 5
Indiv idu n° 9
Indiv idu n° 14
Indiv idu n° 3
Indiv idu n° 17
Indiv idu n° 2
Indiv idu n° 32
Indiv idu n° 31
Indiv idu n° 35
Indiv idu n° 18
Indiv idu n° 43
Indiv idu n° 27
Indiv idu n° 41
Indiv idu n° 22
Indiv idu n° 33
Indiv idu n° 39
Indiv idu n° 40
Indiv idu n° 16
Indiv idu n° 23
Indiv idu n° 8
Indiv idu n° 45
Indiv idu n° 34
Indiv idu n° 19
Indiv idu n° 37

Chapter 2 - Exploring and Profiling through the State-of-the-Art
Chapter 2 - Page 36/149 Leonor Bacelar Nicolau PhD Thesis
Figure 2. Factorial Plan 1-2 of 45 HIA guidelines
Figure 3. Factorial Plan 1-2 of 45 HIA guidelines - zoom

Chapter 2 - Exploring and Profiling through the State-of-the-Art
Leonor Bacelar Nicolau PhD Thesis Chapter 2 - Page 37/149
3.2. Going even further in automatizing and visualizing systematic reviews’
information
Whenever one does not wish to build a table of publication characteristics similar to the
one used in section 3.1, one may profile HIA papers with text mining analysis methods
from any of the usual text available for each paper, including the title of the paper, the
mentioned keywords or the abstract itself. Here titles and then keywords were
considered to obtain word/segment profiles and then linked to 3 nominal variables:
Publication year (2012, 2013 or 2014); Journal Title with or without “Environment”;
Quantification of methods and results (Quantification or No quantification) – table 3.
The choice of these particular variables aimed to determine if text mining analysis using
paper titles would give different results from text mining analysis using paper keywords, if
different years would have distinct word profiles, if papers in journals having or not
“Environment” in the title could be more or less related to the use of quantification in
methods and results.
Table 3. Aspects to link with the created lexical vocabulary
Count % Publication Year 2012 136 55,1%
2013 98 39,7% 2014 13 5,3% Total 247 100,0%
Journal Title Journal Title with ‘Environment’ 75 30,4% Journal Title without ‘Environment’ 172 69,6% Total 247 100,0%
Quantification Quantification 136 55,1% No quantification 107 43,3% Undetermined 4 1,6% Total 247 100,0%

Chapter 2 - Exploring and Profiling through the State-of-the-Art
Chapter 2 - Page 38/149 Leonor Bacelar Nicolau PhD Thesis
3.2.1. Text mining analysis on the Titles of papers
The first factor of Correspondence Analysis (CA) explains almost half of the global
variability contained in the data (47%) – Figure 4. On the right side of the factorial plan
are words more associated to papers where quantification is present and that tend to
include “Environment” in the title of the journal where they are published. Inversely, on
the left side of the factorial plan are words more associated to papers where no
quantification is present and that tend not to include “Environment” in the title of the
journal where they are published.
The location of years 2012 and 2013 near the origin of the plan means that paper profiles
from both these years do not seem to be very different. The location of the year 2014
towards the upper left side indicates that the few papers published from this year present
in the HIA Gateway Bibliography tend not to include “environment” in the title of the
journal where they were published. In fact, only 3 out of the 14 papers available during
2014 were published in journals with “environment” in their titles. Therefore, the HIA
papers published in 2014 had a different profile than those published during 2012 and
2013, which may be explained by the small number of papers from that year present in
the sample, since they were published only during the first quarter of 2014.
More important than the different profile from 2014 papers is the fact that papers from
2012 and 2013 do not seem to be different regarding their year of publication. It is also
very interesting that two different profiles arise that associate the use of quantification
more to environmental journals than to non-environmental journals (public health,
epidemiology and spatial planning, for instance). This means there is a shortcoming of
using quantified methods and results in non-environmental publications.
Looking at the way words group when hierarchical cluster analysis (HCA) is applied, 3
main groups are identified (figure 5):
• Group 1 of words/segments includes expressions more clearly related to papers
with quantification and environment in the journal titles: Benefits, Effective,
Pollution, Risks, Air Pollution and Air;

Chapter 2 - Exploring and Profiling through the State-of-the-Art
Leonor Bacelar Nicolau PhD Thesis Chapter 2 - Page 39/149
• Group 2 of words/segments includes expressions more clearly related to papers
with no quantification and contains: climate change, local level, planning, space
planning, Health Impact Assessment, Public;
• Group 3 is more associated with papers not having “Environment” in the journal
title and integrates 2 subgroups of words/segments:
o Subgroup 3.1 with: Policies, Environment, Cases, Development, Children
and young People;
o Subgroup 3.2 with more words: North America, Built Environment, Active,
Food & Beverages, Program, System, Communities, Green spaces, Europe,
Asian & Australasian, Cities, Transportation.
Figure 4. Factorial Plan 1-2 of lexical vocabulary of 247 papers from 2012-2014, based on papers’ titles

Chapter 2 - Exploring and Profiling through the State-of-the-Art
Chapter 2 - Page 40/149 Leonor Bacelar Nicolau PhD Thesis
Figure 5. HCA Dendrogram of lexical vocabulary of 247 papers from 2012-2014, based on papers’ titles
3.2.2. Text mining analysis on the Keywords of papers
Although words are different when analyzing titles or keywords of papers, results of HCA
are not very unlike in terms of the importance of the first factor, regarding its weight in
total variability (50%), and of the way categories of year, quantification, environment in
the journal titles are scattered on the factorial plan (figure 6). Thus, on the right side of
the factorial plan are keywords more associated to papers where quantification is present
and that tend to include “Environment” in the title of the journal where they are
published. Inversely, on the left side of the factorial plan are keywords more associated to
papers where no quantification is present and that tend not to include “Environment” in
the title of the journal where they are published. Years 2012 and 2013 are again located
near the origin of the plan meaning that paper profiles from both these years may not be
very different. The location of year 2014 on the left side indicates that the few papers
Air Air Pollut ion Risk s Pollution Eff ect ive Ben ef its Hea lth Impact Assessment Imp act Ass ess ment Pub lic Hea lth Imp act Hea lth Impact Ass ess ment Spa ce plannin g p lanning Relate d loc al level Climat e Change Through Cha ng e Transpor tation Cities Asian Au straliasian Europe Gre en Spaces st udy UK Using Commun it ies Sys tem Program Foo d Beverages Act ive Built Environmen t Nor th Amer ica Children Youn g People d evelo pment Cases Environment Polic ie s

Chapter 2 - Exploring and Profiling through the State-of-the-Art
Leonor Bacelar Nicolau PhD Thesis Chapter 2 - Page 41/149
published from this year present in the HIA Gateway Bibliography tend not to include
“environment” in the title of the journal where they were published, neither have
quantification regarding methods and results.
Figure 6. Factorial Plan 1-2 of lexical vocabulary of 170 papers from 2012-2014, based on papers’ keywords
The way words group when applying HCA is somewhat different than when one considers
keywords instead of titles, although a partition of 3 groups is also chosen as more
adequate for analysis (figure 7):
• Group 1 of keywords is more related to papers with “environment” in the journal
titles but no quantification in methods and results and includes:
o Subgroup 1.1 with: Children, Policy, Public, Planning, Participation,
Disadvantaged;
o Subgroup 1.2 with: Mental Health, Green, Physical Activity, Equity, Studies
Analysis, Social, Health promotion, Built Physical Environment, Public Health,
Methods, Decision-making, Cities Urban, Health;

Chapter 2 - Exploring and Profiling through the State-of-the-Art
Chapter 2 - Page 42/149 Leonor Bacelar Nicolau PhD Thesis
• Group 2 is more related to papers without environment in the journal titles and
includes 2 subgroups of words/segments:
o Subgroup 2.1 with: Health Impact Assessment, Environmental Impact
Assessment, Assessment, Modeling;
o Subgroup 2.2 with: Community, Food Nutrition, Bicycling, Climate,
Development, Asia, Travel, Data, Road, Europe, Transportation, Spatial, Cost-
effectiveness, Vehicle, Activity;
• Group 3 is more related to papers with environment in the journal titles and also
with quantification regarding methods and results: Pollutants, Air Pollution,
Pollution, Traffic, Risk, Particulate.
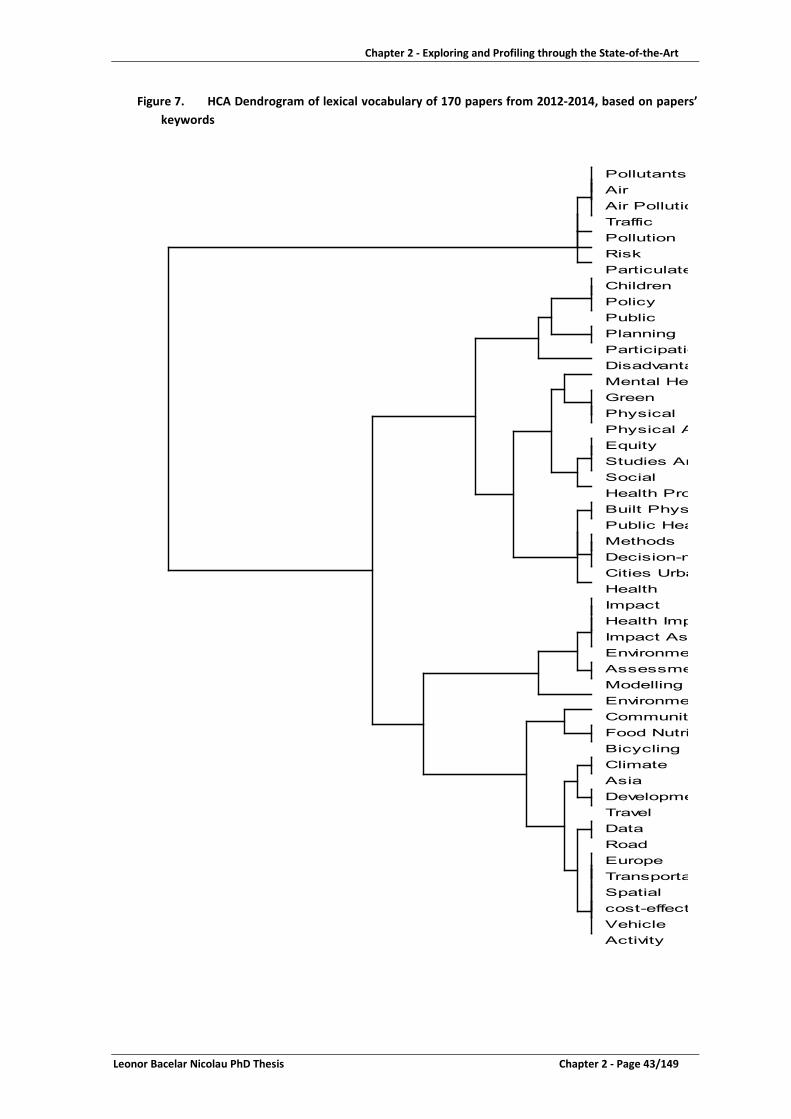
Chapter 2 - Exploring and Profiling through the State-of-the-Art
Leonor Bacelar Nicolau PhD Thesis Chapter 2 - Page 43/149
Figure 7. HCA Dendrogram of lexical vocabulary of 170 papers from 2012-2014, based on papers’ keywords
Activity Vehicle cost-effect Spatial Transporta Europe Road Data Travel Developme Asia Climate Bicycling Food Nutri Community Environme Modelling Assessme Environme Impact Ass Health Imp Impact Health Cities Urba Decision-m Methods Public Hea Built Phys Health Pro Social Studies An Equity Physical A Physical Green Mental Hea Disadvanta Participatio Planning Public Policy Children Particulate Risk Pollution Traffic Air Pollutio Air Pollutants

Chapter 2 - Exploring and Profiling through the State-of-the-Art
Chapter 2 - Page 44/149 Leonor Bacelar Nicolau PhD Thesis
4. Discussion
When one wishes to review literature and builds a table describing features of a group of
publications, it may be time consuming and hard to analyse each variable and its
association with the other variables by using univariate or bivariate statistical analysis.
Using exploratory multivariate data analysis methods such as hierarchical cluster analysis
and/or multiple correspondence analysis may be very helpful.
4.1. Automation towards effectiveness
Taking the table published by authors of paper “Health impact assessment: A comparison
of 45 local, national and international guidelines” 6, the use of these methodologies easily
gave a very visual and immediate answer to those authors’ goals of finding if a universal
HIA guide could be a reality and identifying common and different features in the sample
of 45 guides.
The fact that both features and clusters of guides were generally found near the center of
the various factorial plans means that guides are mostly very similar to each other. This
indicates that similarities among guides are more common than dissimilarities, opening
the way for the possibility of indeed creating a universal HIA guide. But by using these
multivariate methods, one may go beyond this and identify more clearly that guides of
Cluster 2 are the most similar to others within the whole sample and could represent the
base for a universal guide.
The original paper presented an exhaustive comparison of all the guides along all
considered features, making it sometimes hard to identify the really essential aspects that
distinguished those publications. Through MCA and HCA, one may easily identify the key
features that differentiate guides. Thus, one may quite effortlessly evaluate if
discriminating specificities regarding clusters 1, 3, 4 and 5 are worth integrating in a
possible universal guide or not. Therefore, guides of cluster 3 seem to be more “Client-
oriented”, wanting to answer to more practical needs and concerns of decision-makers
when planning the HIA in the scoping step, but also when delivering results and proposing
recommendations. Guides in cluster 4 show a particular attention to the usefulness of
integrating HIA with other impact assessments. Guides in cluster 1 present an interesting

Chapter 2 - Exploring and Profiling through the State-of-the-Art
Leonor Bacelar Nicolau PhD Thesis Chapter 2 - Page 45/149
feature regarding the political and legal framework of HIA and the eventual need to be
considered mandatory in certain cases. Finally guides in cluster 5 seem to be rather more
incomplete in their approach, so possibly not to be used as a base to a universal guide. It
is curious to acknowledge that these discriminating features from clusters 1, 3 and 4 find
an echo on the weaknesses and opportunities pointed out to HIA 2, being somehow
aspects to integrate an universal broad future HIA guide.
4.2. Even further automation towards effectiveness
Aiming at making the reviewing process even less “human-dependent”, not having to rely
on building a table of qualitative features describing a sample of publications, an even
more automated approach was adopted, using text mining analysis to profile a group of
published HIA papers based on titles and keywords. This represents a gain in processing
time and hopefully in the objectivity of the analysis process, especially if the alternative
involves several different people collecting and registering the information into a table
describing the reviewed publications.
Text profiles obtained based on titles are not very different from the ones found based on
keywords, although the sample is much larger in the first case (247 papers versus 170
papers). This means that titles embody the main aspects of the paper itself. It also may
mean that keywords tend to be rather redundant in a paper.
Regarding the year of publication, papers from 2012 and 2013 don’t present a very
different profile between them. Papers from 2014 appear to have a different profile from
those of previous years, but the sample is too small to indicate any kind of trend.
Three different profiles arise among papers, but only one of them is more linked to the
use of quantification. Papers more associated to the use of quantification in methods and
results are thus also more often published in journals with “environment” in the title and
tend to focus on air pollution risks, often regarding traffic and measuring particulate
concentrations. Inversely, a more “no-quantification” profile arises including papers
concerned with spatial and urban planning, often also regarding mental health and
physical activity issues. A third profile concerns “no-environment” in the journal title
papers and is more linked to the impact of policies, especially in developed countries

Chapter 2 - Exploring and Profiling through the State-of-the-Art
Chapter 2 - Page 46/149 Leonor Bacelar Nicolau PhD Thesis
taking again into account issues like built environment, green spaces, transportation and
physical activity, but also nutrition concerns, community involvement and children and
young people as focus.
Hence there tends to be a shortcoming of use of quantified methods and results in non-
environmental publications, especially when considering impacts of public health policies,
both at general and local levels. More environmental publications drink from the often
mandatory Environmental Impact Assessment tradition of quantifying impacts and may
be fueled by a higher availability of data on physical environmental factors (such as air,
water, noise pollutants) and their association to health effects 18. More public health
related publications still lack quantification as support to evaluation of health impacts.
Available data on health (such as hospital, primary healthcare) and social health
determinants (such as education, employment, healthy and non-healthy behaviors) is
growing frequently linked through national registries 19,20. However, integrating this
information into HIA is still seldom a reality.
4.3. Linking quantification to monetary costs
Additionally, although quantification is used, predicted related monetary costs are still
quite rarely found in all papers published during this period (only 13 papers had some
sort of quantified related monetary costs). This may be especially important when one
considers HIA as a potential advocacy tool 21-23, but also when one considers that it
primarily intends to help decision-makers reaching a decision whether to go forward or
not with a policy and in what terms. Always with budget constraints, political decisions
have increasingly to be based on cost effectiveness criteria and whenever possible direct
and indirect health costs should be part of the equation 2. A bridge between HIA and
other economic evaluation assessments, such as health technology assessments or cost-
effectiveness assessments, should be incentivized 24. It could thus be a way to
demonstrate further the effectiveness of HIA in changing decisions and implement
policies. Additionally it could contribute to the decision-makers concerns of guarantying
the existence of quantified and evidence based potential health impacts before investing
resources and acting according to HIA’s recommendations 2.

Chapter 2 - Exploring and Profiling through the State-of-the-Art
Leonor Bacelar Nicolau PhD Thesis Chapter 2 - Page 47/149
4.4. Limitations and Future Activities
No matter how much automation is brought to the publishing reviewing process, there is
(and should be) always an element of human interpretation and thus potential
subjectivity, for instance when choosing the related words/segments to aggregate into a
common theme.
Both proposed approaches to automate further the publishing reviewing process may be
complementary: depending on research aims, a table describing publications’ features
may be built and paper profiles created regarding text variables directly from that table,
not having to create a contingency table of words and segments.
By simplifying the publications analysis, there is always a loss of information, for instance
when only taking word/segments with frequencies over 10. Even if one tries and
aggregates more words/segments in common themes, which may also increase
subjectivity of the process, one may be creating over-simplification and interpretation
biases. However, by taking a more automated approach in an early step of analysis, one
may more easily identify differentiating aspects and focus a more detailed exploration
onto those most important aspects.
Future activities will involve trying to minimize these restrictions, so that possible biases
are controlled and limited.
5. Conclusions
Using multivariate data analysis such as MCA and HCA to extract main patterns from a
table describing features of a group of publications saves time, potentially decreases
subjectivity biases regarding interpretation of results and summarizes in quite an easy
way to grasp the main points of information contained in these documents.
Taking the automation process even further and applying text mining analysis methods,
based even on elementary string information such as paper titles or keywords, consists an
innovative useful way of extracting knowledge when analyzing a bulk of potentially

Chapter 2 - Exploring and Profiling through the State-of-the-Art
Chapter 2 - Page 48/149 Leonor Bacelar Nicolau PhD Thesis
interesting publications, quite instantly allowing for the visualization of the main
underlying profiles.
The immediate visualization these methodologies allow makes knowledge acquisition
easier for non-statisticians, potentially helping fruitful dialogue among multidisciplinary
teams and namely between public health experts and decision-makers.
References 1. Cole BL, Fielding JE. Health impact assessment: a tool to help policy makers understand health beyond health care. Annu Rev Public Health 2007; 28: 393-412. 2. Harris-Roxas B, Viliani F, Bond A, Cave B, Divall MJ, Furu P, Harris P, Soeberg M, Wernham A, Winkler M. Health impact assessment: the state of the art. Impact Assessment and Project Appraisal 2012; 30(1): 43-52. 3. Heitor MJ, Pereira Miguel J. Avaliação do Impacte de políticas de diferentes sectores na saúde e nos sistemas de saúde: um ponto de situação. Revista Portuguesa de Saúde Pública 2009; 27(1): 5-17. 4. Kemm J, Parry J, Palmer S, editors. Health Impact Assessment: Concepts, Theory, Techniques, and Applications. Oxford: Oxford University Press; 2004. 5. Metcalfe O, Higgins C, Lavin T. Health Impact Assessment Guidance: Institute of Public Health in Ireland; 2009. 6. Hebert KA, Wendel AM, Kennedy SK, Dannenberg AL. Health impact assessment: A comparison of 45 local, national, and international guidelines. Environmental Impact Assessment Review 2012; 34: 74-82. 7. Oxford Dictionaries. Oxford Dictionaries definition of State-of-the-art. http://www.oxforddictionaries.com/definition/english/state-of-the-art (accessed 11/16/2014). 8. Veerman JL, Barendregt JJ, Mackenbach JP. Quantitative health impact assessment: current practice and future directions. J Epidemiol Community Health 2005; 59(5): 361-70. 9. Burnard P, Gill P, Stewart K, Treasure E, Chadwick B. Analysing and presenting qualitative data. Br Dent J 2008; 204(8): 429-32. 10. Coheris Spad. Data Miner Guide - Text Mining: Coheris Spad; 2013. 11. Lebart L, Salem A. Statistique Textuelle: Dunod; 1994. 12. Hair JF, Black B, Babin B, Anderson RE, Tatham RL. Multivariate Data Analysis. 6th ed: Prentice Hall; 2006. 13. Lebart L, Piron M, Morineau A. Statistique Exploratoire Multidimentionnelle. 4ème ed. Paris: Dunod; 2006. 14. Saporta G. Probabilités, Analyse des Données et Statistique. 3e édition ed: Éditions Technip; 2011. 15. CISIA CERESTA. SPAD for Windows Version 3.5. Montreuil, France: CISIA CERESTA; 1998. 16. Gateway H. HIA, MWIA and SEA Bibliography 21. HIA Gateway, West Midlands Public Health Observatory; 2014. 17. IBM Corp. IBM SPSS Statistics for Windows, Version 22.0. Armonk, New York, USA: IBM Corp.; 2013. 18. Kemm J, editor. Health Impact Assessment: Past Achievements, Current Understanding and Future Progress: Oxford University Press; 2013. 19. Fehr R, Viliani F, Nowacki J, Martuzzi M, editors. Health in Impact Assessments: Opportunities not to be missed. Copenhagen: WHO Regional Office for Europe; 2014.

Chapter 2 - Exploring and Profiling through the State-of-the-Art
Leonor Bacelar Nicolau PhD Thesis Chapter 2 - Page 49/149
20. Capacity Building in Environment and Health (CBEH) Project, editor. Using impact assessment in environment and health: a framework. Copenhagen: WHO Regional Office for Europe; 2013. 21. Parker LA, Lumbreras B, Hernandez-Aguado I. Health information and advocacy for "Health in All Policies": a research agenda. J Epidemiol Community Health 2010; 64(2): 114-6. 22. Veerman JL, Bekker MP, Mackenbach JP. Health impact assessment and advocacy: a challenging combination. Soz Praventivmed 2006; 51(3): 151-2. 23. Smith K, Stewart E. Influencing policy--public health advocacy and health inequalities. J R Coll Physicians Edinb 2014; 44(4): 316-21. 24. Gottlieb LM, Fielding JE, Braveman PA. Health Impact Assessment: Necessary but Not Sufficient for Healthy Public Policy. Public Health Reports 2012; 127: 156-62.

Chapter 2 - Exploring and Profiling through the State-of-the-Art
Chapter 2 - Page 50/149 Leonor Bacelar Nicolau PhD Thesis
Leonor Bacelar Nicolau PhD Thesis Chapter 3 / Sub Chapter 3.1- Page 51/149
Chapter 3 – Contribution of Hierarchical Cluster Analysis to the Health Impact Assessment Screening Step
SubChapter 3.1 – Screening Hospital Reform Policies for Health Impact Assessment: easier decision making through cluster analysis
CONTENTS
Abstract ................................................................................................................................. 52 1. Introduction ................................................................................................................................ 54 2. Materials and methods ............................................................................................................... 56 2.1. Data ....................................................................................................................................... 56 2.2. Statistical Methodologies ...................................................................................................... 57 3. Results ................................................................................................................................. 58 3.1. Exploring the 76 policies total sample ................................................................................... 58 3.2. Selecting a 7 Clusters Partition .............................................................................................. 59 3.3. Analyzing the quality of the 7 clusters partition .................................................................... 60 3.4. Using Complementary Methods: Principal Components Analysis and Multiple Correspondence Analysis ........................................................................................ 61 4. Discussion ................................................................................................................................. 63 4.1. Ranking Clusters to Prioritize Policies .................................................................................... 63 4.2. Clusters, Policies and Action Areas ........................................................................................ 66 4.3. Swift Response to changes in priority criteria ....................................................................... 68 4.4. Limitations and future paths of research ............................................................................... 69 5. Conclusions ................................................................................................................................. 70 References ................................................................................................................................. 71

Chapter 3 - Contribution of Hierarchical Cluster Analysis to the Health Impact Assessment Screening Step Sub Chapter3.1 - Screening Hospital Reform Policies for HIA: easier decision making through cluster analysis
Chapter 3 / Sub Chapter 3.1- Page 52/149 Leonor Bacelar Nicolau PhD Thesis
Chapter 3 – Contribution of Hierarchical Cluster Analysis to the HIA
Screening Step
“What is freedom? Freedom is the right to choose: the right to create for oneself the alternatives of choice.” Archibald MacLeish
“An inner process stands in need of outward criteria.” Ludwig Wittgenstein
“It is our choices… that show what we truly are, far more than our abilities.” Albus Dumbledore / JK Rowling
The first step of HIA is usually the screening step, when policies are screened to identify
candidates worth selecting for HIA. This is generally a qualitative step. Our aim here is to
show how multivariate statistical methods such as cluster analysis may help this step, first
by analyzing 76 policies regarding the Portuguese hospital reform (subchapter 3.1) and
then by evaluating 21 National Health Programs (subchapter 3.2). The choices, criteria
and selections concerning both these subchapters will explain the area and policies
focused in Chapter 4.
SubChapter 3.1 – Screening Hospital Reform Policies for Health Impact Assessment: easier decision making through cluster analysis
Abstract
Background:
Health Impact Assessment (HIA) is a combination of procedures, methods and tools by
which a policy may be judged as to its potential effects and its distribution on a
population’s health. Screening policies to identify candidates for applying HIA is an
essential first step, generally qualitative. Our aim is to show how to use exploratory
multivariate statistical methods such as cluster analysis to screen through policies and
pinpoint priorities for HIA quickly and reliably.
Methods:
A panel of 7 public health experts from Nova University in 2011 rated 76 policies
proposed by a Technical Group planning the Portuguese hospital reform on a 10-point
scale (1-Very low to 10-Very high) regarding Potential Impact, Ease of implementation

Chapter 3 - Contribution of Hierarchical Cluster Analysis to the Health Impact Assessment Screening Step Sub Chapter3.1 - Screening Hospital Reform Policies for HIA: easier decision making through cluster analysis
Leonor Bacelar Nicolau PhD Thesis Chapter 3 / Sub Chapter 3.1- Page 53/149
and Implementation costs. Hierarchical cluster analysis is used to identify groups of
similar policies and prioritize those more pertinent of being considered for HIA.
Results:
We identify 7 groups of policies and find that Ease of implementation is not as relevant to
differentiate groups as Potential impact and Implementation costs: 3 groups present
higher mean levels of potential impact (with respectively higher, intermediate and lower
mean levels of implementation costs); 2 groups present intermediate mean levels of
potential impact (with higher and lower mean costs respectively); 2 groups present lower
mean levels of potential impact (with higher and lower mean costs respectively). Groups
of policies are then re-ranked through different priority criteria, but Group 1 leads all
possible scenarios pinpointing the most obvious candidates for HIA.
Conclusion:
Applying methods such as hierarchical cluster analysis as early as the screening step of
HIA may be very helpful towards obtaining evidence based, reliable, participatory, flexible
and more efficient ways of selecting policies for HIA.
Main Messages:
Although multivariate statistical methodologies may seem complex, decision-makers
obtain more evidence-based knowledge and in an easy way to grasp.
This methodology may be used in other forms of assessments and in different countries.
Multivariate statistical methodologies may look complex, but decision-makers grasp
easily this evidence-based knowledge.
Keywords:
Health Impact Assessment, screening policies, quantification, cluster analysis, decision-
making
Acknowledgments:
We are especially obliged to Pedro Pita Barros (Faculty of Economics, University Nova of
Lisbon), José Mendes Ribeiro (Fundação Francisco Manuel dos Santos), Sarah Simpson
(EQUIACT), Ruy Ribeiro and Teresa Rodrigues (Laboratory of Biomathematics of the
Faculty of Medicine, University of Lisbon) for their invaluable help in reviewing and giving

Chapter 3 - Contribution of Hierarchical Cluster Analysis to the Health Impact Assessment Screening Step Sub Chapter3.1 - Screening Hospital Reform Policies for HIA: easier decision making through cluster analysis
Chapter 3 / Sub Chapter 3.1- Page 54/149 Leonor Bacelar Nicolau PhD Thesis
useful suggestions to improve a draft paper to submit to international publications. We
also thank the University Nova of Lisbon group of public health experts Pedro Pita Barros,
Adalberto Campos Fernandes, José Fragata, Francisco Ramos, José Caldas de Almeida,
Gilles Dussault and Luis Lapão for generously making available the data that made our
research possible.
1. Introduction
Any project or policy (at international, national, regional or local levels), in any activity
sector, generates positive and/or negative impacts on the health of human populations 1,2, and hence may be the object of HIA. Nevertheless, limited resources and good sense
tell us that we should screen among possible candidates for HIA, prioritize and select the
most relevant ones. The focus here will thus be the first step of HIA, the screening step 3,
which is usually followed by five other steps: scoping, conducting the assessment,
reporting and recommendations, monitoring and impact and outcome evaluation. The
aim is to show how to use exploratory multivariate statistical methods such as cluster
analysis to screen through policies and pinpoint priorities for HIA quickly and reliably.
Herbert et al identified 45 HIA guidelines for review and content analysis, from various
origins and publication dates ranging from 1995 to 2011, and found a screening step in all
of them 4. In 43 of these HIA guidelines screening was described as a “selection process
for identifying which projects, policies, plans or programs need to undergo a HIA based on
the proposal's potential to impact people's health and add value to the decision-making
process”. The choice of undertaking an HIA would thus be based on criteria related to
health determinants and equity and on the value of incorporating them into the decision-
making process.
In reality, other non-health features already determine whether to go through with an
HIA or not, even when definitions of the screening step are more health-focused. In fact,
while revisiting the 45 guidelines reviewed by Herbert et al, one may see that only 12
documents focus screening essentially on health issues, determinants and impacts of the
project or proposal (27% of the 45 guidelines). The majority of the guidelines (31
documents corresponding to 69% of the 45 guidelines) consider other aspects such as

Chapter 3 - Contribution of Hierarchical Cluster Analysis to the Health Impact Assessment Screening Step Sub Chapter3.1 - Screening Hospital Reform Policies for HIA: easier decision making through cluster analysis
Leonor Bacelar Nicolau PhD Thesis Chapter 3 / Sub Chapter 3.1- Page 55/149
political and operational priorities: 10 mention such aspects to take into account without
detailing much, 19 include them in the screening tools (questions to be answered and
issues to rank) and 2 even propose a pre-screening step where opportunity concerns,
human and financial resources are assessed and contribute to the results of the screening
step 5,6ref. Frequently yet it is not clear how these non-health concerns, eventually more
subjective, are actually to be taken into consideration in the screening process. The
accountability of a decision of doing HIA or not based on these non-health concerns may
be assured whenever there is a clear record of how, whom and why the decision was
made. However, the potential subjectivity won’t necessarily be secured. Introducing
these aspects clearly and in a quantitative way could thus contribute to make the
screening process more transparent as far as non-health issues are concerned.
Moreover, especially in countries where HIA is insipient, and particularly in a context of
economic crisis where other priorities are more pressing, a HIA expert may have a
particular hard time convincing decision makers of the relevance of using these
methodologies. Using a screening method essentially based on health determinants and
equity issues may not be enough to persuade a decision maker of the value of investing
part of his budget in HIA. Since one of the best ways to convince decision makers to
undertake a HIA is really to do HIAs and show how useful and invaluable they may be to
the decision-making process, it would be useful to find a way to maximize the stakes of
taking decision makers on board to undertake a HIA project. Taking into account in the
screening step criteria that decision makers will perhaps understand better, more in tune
to their distresses and priorities, could contribute to a wider use of HIA.
In Portugal, a hospital care reform was proposed based on a report of the Technical
Group planning the Portuguese hospital reform, a 417 pages document issuing 76 policy
reform recommendations 7, aiming to reorganize the national hospital network through
an integrated and rational view on the health system. The screening step is hence
essential here to assure that the policies to be object of HIA are relevant in the health
experts’ point of view, but also in the policy makers’ point of view.

Chapter 3 - Contribution of Hierarchical Cluster Analysis to the Health Impact Assessment Screening Step Sub Chapter3.1 - Screening Hospital Reform Policies for HIA: easier decision making through cluster analysis
Chapter 3 / Sub Chapter 3.1- Page 56/149 Leonor Bacelar Nicolau PhD Thesis
The main aim of this research is to show how to use exploratory multivariate statistical
methods such as cluster analysis to screen through policies and pinpoint priorities for HIA
quickly and reliably.
Taking the results of ratings of these 76 policies by a panel of 7 public health experts from
the Nova University in Lisbon, in this research, multivariate statistical methods such as
cluster analysis were used at the screening stage of HIA to help filter out policies that may
not require HIA, identify those more relevant, and pinpoint possible candidates to be
considered for HIA.
Data and statistical methodologies used in the present research are first presented. Then,
in the results section, the total sample of 76 policies is explored and a clusters partition of
policies is selected. The quality of the partition is analyzed and other complementary
multivariate statistical methods are used to aid the interpretation of results. In the
discussion section, the clusters of policies are presented in more detail and a priority for
implementing HIA is proposed, as well as different scenarios according to different
possible decision-makers’ criteria.
The main figures and tables are included here, but several additional ones are referred to
and may be found in the appendices.
2. Materials and methods
2.1. Data
The report of the Technical Group planning the Portuguese hospital reform, a 417 pages
document issuing 76 recommendations or policies to be undertaken over the following 3
years, was made available for public discussion in November 2011 7. The complete set of
76 policies divided by 8 areas is listed in the appendices (Table 10).
A group of public health experts from the Nova University in Lisbon responded, issuing a
report in December 2011 8. This report included an analysis by a panel of 7 public health
experts from the Nova University in Lisbon: Pedro Pita Barros, Adalberto Campos

Chapter 3 - Contribution of Hierarchical Cluster Analysis to the Health Impact Assessment Screening Step Sub Chapter3.1 - Screening Hospital Reform Policies for HIA: easier decision making through cluster analysis
Leonor Bacelar Nicolau PhD Thesis Chapter 3 / Sub Chapter 3.1- Page 57/149
Fernandes, José Fragata, Francisco Ramos, José Caldas de Almeida, Gilles Dussault and
Luis Lapão. This panel rated each of the 76 policies proposed by the Technical Group
planning the Portuguese hospital reform on a 10-point scale (1-Very low to 10-Very high)
regarding 3 dimensions: Potential Impact (in terms of a “better health at lower costs”
goal), Ease of implementation/likelihood to be applied over the next 3 years, and
Implementation costs (including monetary, non-monetary and political costs).
In the present study, the 3 raw variables above (10-point likert scales) will be considered,
but also these 3 dimensions recoded into 3 categories ordinal variables (scale values low
1-3, intermediate 4 -7, high 8-10).
2.2. Statistical Methodologies
The software used for all statistical analysis was SPSS version 19.
Univariate exploratory analysis was performed regarding the 10-point scale variables
(mean, standard variation, median, percentiles 25 and 75, minimum and maximum) and
the recoded variables (frequency and percentage).
Hierarchical cluster analysis (with squared Euclidean distance and Ward’s aggregation
criteria 9 was used to identify groups of similar policies in terms of the 3 variables
considered and to prioritize those more pertinent of being considered in a HIA. A 7
clusters partition of similar policies was selected for further analysis. The number and
identification of policies were accessed for each cluster. Descriptive statistics were also
calculated for each cluster (mean, standard variation, median, percentiles 25 and 75, min
and max), and scatter diagrams were constructed to biplot the 3 analyzed variables in
terms of cluster identification.
The quality of the partition was accessed by applying non-hierarchical cluster analysis (k-
means) with random seeds and also using the cluster centroids as seeds, to compare the
clusters’ composition 9. Tables with counts, column percentages and adjusted residuals
were built and Fisher Exact Tests with Monte Carlo significance based on 10,000 sampled
tables were used. Kruskal-Wallis tests and associated multiple comparisons tests 10 were
additionally used to identify statistically significant differences among clusters, that is to

Chapter 3 - Contribution of Hierarchical Cluster Analysis to the Health Impact Assessment Screening Step Sub Chapter3.1 - Screening Hospital Reform Policies for HIA: easier decision making through cluster analysis
Chapter 3 / Sub Chapter 3.1- Page 58/149 Leonor Bacelar Nicolau PhD Thesis
identify which clusters were the most distinct between them, and concerning which
variables or dimensions.
Principal Component Analysis (PCA) and Multiple Correspondence Analysis (MCA) were
used as complementary multivariate methods 9. PCA was applied to the 10-point scale
variables to access the more important dimensions for cluster interpretation. The 2 first
components, responsible for 80% of the total variance, were selected for analysis. MCA,
applied to the recoded variables and using cluster identification as supplementary
variable, further complemented the analysis, by identifying the most relevant categories
to differentiate among clusters.
3. Results
3.1. Exploring the 76 policies total sample
When analyzing the total sample of 76 policies, the median classification given by the
panel of public health experts to Potential Impact (in terms of a “better health at lower
costs” goal) tends to be slightly higher than the ones assigned to both other dimensions
(median of 7 against values below 6) – Table 1. This is more evident when recoding
variables into 3 categories: 34% of policies present high values of Potential Impact
(against percentages below 8% for other variables) – Appendices Table 4. A considerable
number of policies proposed exhibits a low classification regarding Implementation costs
(including monetary, non-monetary and political costs) – a percentage of 25% of policies
against percentages below 4% for the other variables. The majority of policies show
intermediate classification levels for “Ease of implementation/likelihood to be applied
over the next 3 years” (90% of policies against percentages below 69% for other
variables). This dimension thus bears the lowest dispersion of the three, also visible when
considering the interquartile range (1.4 against values above 2.2 - Table 1).
Table 1. Descriptive Analysis (N=76)
Mean ± SD Median (IQR) Range Potential Impact (in terms of a “better health at lower costs” goal) 6,79 ± 1.66 7,00 (2,26) 2,40-10,00 Ease of implementation/likelihood to be applied over the next 3 years 5,83 ± 1.11 5,90 (1,40) 2,67-8,33 Implementation costs (including monetary, non-monetary and political costs) 4,77 ± 1.68 4,59 (2,43) 1,67-9.33 SD=Standard Deviation IQR=Interquartile Range (P75-P25) Range= Minimum - Maximum

Chapter 3 - Contribution of Hierarchical Cluster Analysis to the Health Impact Assessment Screening Step Sub Chapter3.1 - Screening Hospital Reform Policies for HIA: easier decision making through cluster analysis
Leonor Bacelar Nicolau PhD Thesis Chapter 3 / Sub Chapter 3.1- Page 59/149
3.2. Selecting a 7 Clusters Partition
A hierarchical cluster analysis was applied with squared Euclidean distance as proximity
measure and Ward linkage criterion. Partitions between 3 and 7 clusters were analyzed
and the 7-clusters partition was selected for a more detailed study, considering the
dendrogram (Figure 1) and the evolution of the proximity coefficients associated to each
partition (Appendices Table 2).
Figure 1. Hierarchical Cluster Analysis Dendrogram (Squared Euclidean Distance and Ward Linkage Criterion) with 7 clusters partition identified
The number of policies in each cluster varies between 4 and 17 policies – Appendices
Figure 6 and Table 3 and Table 4. Examining the scatter diagrams of policies, biploting
each pair of dimensions, it is quite clear that clusters are well differentiated when
considering Potential Impact (in terms of a “better health at lower costs” goal) versus
Implementation costs (including monetary, non-monetary and political costs) – Figure 2.
Clusters are not so well discerned when one considers Potential Impact (in terms of a
“better health at lower costs” goal) versus Ease of implementation / likelihood to be
applied over the next 3 years. The analysis of the distribution for each cluster over the
dimensions recoded into 3 categories (low, intermediate and high classification) is
coherent with these observations - Appendices Table 4.
In Figure 2 and Appendices Table 3 and Table 4, clusters 7, 3 and 1 present higher mean
levels of potential impact and respectively higher, intermediate and lower
implementation costs; clusters 2 and 6 show intermediate mean levels of potential
impact and respectively higher mean costs lower ones; clusters 5 and 4 display lower

Chapter 3 - Contribution of Hierarchical Cluster Analysis to the Health Impact Assessment Screening Step Sub Chapter3.1 - Screening Hospital Reform Policies for HIA: easier decision making through cluster analysis
Chapter 3 / Sub Chapter 3.1- Page 60/149 Leonor Bacelar Nicolau PhD Thesis
mean levels of potential impact and respectively, higher mean costs and with lower ones.
In what concerns the ease of implementation, clusters 1, 2 and 7 are associated with a
higher likelihood to be applied over the next 3 years, followed by clusters 4 and 6, and
finally clusters 3 and 5. Note that in the left biplot of Figure 2, clusters 1 and 6 partially
overlap, but are not superimposed in the right biplot, which means that both clusters are
quite distinct taking the 3 dimensions into consideration.
Figure 2. Scatterplots of Potential Impact by Implementation Costs and by Ease of Implementation with cluster identification
3.3. Analyzing the quality of the 7 clusters partition
The quality of the partition was first accessed by applying non-hierarchical cluster analysis
(k-means) to the raw data using random seeds and then by repeating the analysis using
the hierarchical cluster centroids as seeds, to compare the clusters’ compositions.
The first attempt to apply k-means using random seeds to generate a 7-clusters partition,
produced a cluster with only one policy, that was considered an outlier (policy “Create a
Medical Simulation National Centre”, with the lowest scale values for the 3 variables).
This analysis was thus repeated with only 75 policies.

Chapter 3 - Contribution of Hierarchical Cluster Analysis to the Health Impact Assessment Screening Step Sub Chapter3.1 - Screening Hospital Reform Policies for HIA: easier decision making through cluster analysis
Leonor Bacelar Nicolau PhD Thesis Chapter 3 / Sub Chapter 3.1- Page 61/149
As expected, applying a k-means algorithm using the hierarchical cluster centroids as
seeds generates a 7-clusters partition much more similar to the hierarchical cluster
solution, than when using a k-means with random seeds. Fisher Exact Tests with Monte
Carlo significance based on 10,000 sampled tables indicate the distribution of policies
throughout the 7 clusters are similar (p<0.005<5%) and adjusted residuals are the highest
where policies are classified in analogous clusters. There are however a few differences in
the partitions (Appendices Figure 7 and Table 5), essentially related to policies that can be
found in the intersections of clusters in Figure 3. Clusters 3 and 7 are the only ones
identical in the three classification procedures. Cluster 4 presents a higher
“misclassification” problem, featuring in both k-means clusters solutions, with several of
its policies being classified into cluster 6. Still clusters 4 and 6 are better discriminated by
“potential impact” in the hierarchical solution than both k-means solutions. Cluster 1
finds 2 of its policies classified into cluster 2, 1 into cluster 3 and 1 into cluster 4, when
using k-means with random seeds. However, only 1 policy of cluster 1 is classified into
cluster 4, when using k-means with the centroids’ hierarchical clusters as seeds for the k-
means algorithm.
Kruskal-Wallis tests and associated multiple comparisons tests were additionally used to
identify statistically significant differences among clusters, regarding each one of the 3
original variables and each one of the 3 cluster methods applied. The tests show quite
consistent results among the various methods applied, with special regard to potential
impact.
The 7 clusters hierarchical partition thus still seems the more adequate solution for
analysis.
3.4. Using Complementary Methods: Principal Components Analysis and Multiple
Correspondence Analysis
The Principal Components Analysis (PCA) results are coherent with the previous
hierarchical cluster results. The first component which explains 42% of total variance is
more related with Potential Impact (in terms of a “better health at lower costs” goal) and
Implementation costs (including monetary, non-monetary and political costs) –

Chapter 3 - Contribution of Hierarchical Cluster Analysis to the Health Impact Assessment Screening Step Sub Chapter3.1 - Screening Hospital Reform Policies for HIA: easier decision making through cluster analysis
Chapter 3 / Sub Chapter 3.1- Page 62/149 Leonor Bacelar Nicolau PhD Thesis
Appendices Table 8. The order followed by each cluster from the top quadrants of Figure
3 towards the bottom ones is related to the joint importance regarding these two
variables. Cluster 5 is the only cluster that is not coherent with these results, which may
be due to a higher dispersion in all the original variables - Appendices Table 3, and a
greater importance regarding the second component, more related with the Ease of
implementation/likelihood to be applied over the next 3 years - Appendices Table 8.
Figure 3. Factorial Plan on policies of a PCA 2 Components Extraction and cluster identification
The Multiple Correspondence Analysis (MCA) results help us further to explain the cluster
and PCA results. The magnitude of the categories tends to decrease as one goes from the
upper quadrants of the factorial plan (categories 1-3) to the lower quadrants (categories
8-10) – Figure 4. The lower the clusters are located in the figure, the higher their values
will tend to be, especially regarding Potential Impact (in terms of a “better health at lower
costs” goal) and Implementation costs (including monetary, non-monetary and political
costs). Hence, clusters in the upper part of the figure will tend to have lower potential
impact, lower implementation costs and lower ease of implementation over 3 years.
Clusters near the center of the figure will tend to have intermediate values in these
variables. Clusters in the lower part of the figure will be the more important ones in terms
of potential impact and of implementation costs. The higher values category (8-10) of
ease of implementation over 3 years is the only one to present a different behavior and is
C1
C2
C3
C4
C5
C6
C7
KMO = 0,402 BTS p=0.017 (χ2=10,246 df=3)

Chapter 3 - Contribution of Hierarchical Cluster Analysis to the Health Impact Assessment Screening Step Sub Chapter3.1 - Screening Hospital Reform Policies for HIA: easier decision making through cluster analysis
Leonor Bacelar Nicolau PhD Thesis Chapter 3 / Sub Chapter 3.1- Page 63/149
located towards the center left area of the figure. This may be due to the fact that a
higher likelihood of implementation may be owed to a policy being just easy to
implement or being hard to implement but so important that it is expected to be a
priority.
Figure 4. Factorial Plan of a MCA 2 Components Extraction with cluster identification
4. Discussion
4.1. Ranking Clusters to Prioritize Policies
Cluster analysis and other complementary multivariate methods such as PCA and MCA
were valuable to quickly identify a 7 clusters partition of policies and select the more
adequate variables to characterize those clusters.
Regarding the choice of dimensions, the more relevant dimensions to be considered for
the cluster description are the Potential Impact (in terms of a “better health at lower
costs” goal) and the Implementation costs (including monetary, non-monetary and

Chapter 3 - Contribution of Hierarchical Cluster Analysis to the Health Impact Assessment Screening Step Sub Chapter3.1 - Screening Hospital Reform Policies for HIA: easier decision making through cluster analysis
Chapter 3 / Sub Chapter 3.1- Page 64/149 Leonor Bacelar Nicolau PhD Thesis
political costs). The Ease of implementation / likelihood to be applied over the next 3
years is less useful to differentiate among distinct clusters.
Concerning the prioritization of policies, we begin by considering that the more important
clusters in terms of high levels of potential impact represent the ones with higher
potential priority to become the focus of a HIA. Then we consider clusters with lower
implementation costs. High potential impact is more linked with 3 clusters: cluster 1 with
lower levels of costs, but also clusters 3 and 7 with intermediate and high levels of costs,
respectively.
Cluster 1 groups policies connected to management issues setting a legal background and
operational benchmarks regarding: the link between hospital and primary care services
(drawing up the hospital referral network, referral criteria between Primary Care and
Hospital networks, operational protocols between Primary Care services and Hospital
services, eventually creating new healthcare units (USF)); the adjustment of hospital
resources and performance to demand (create an "Heavy" Equipment Charter for the
Hospital Sector, develop Multi-Year Program-Contracts, adjust appointment and surgery
contracting to the respective demand, increase the Ambulatory Surgery rates, revise the
legal framework for drug dispensing in hospital outpatient care, adjust hospital human
resources according to healthcare demand, promote mixed contracts with pay linked to
performance, create a Hospital Benchmarking and Strategic Framework for Performance
Indicators); change the hospital governance framework (change the hospital governance
model, assign management contracts, create intermediate management units).
Cluster 3 brings together mainly policies concerning strategic planning in health services
(building the Lisbon Oriental Hospital and resizing the Great Lisbon region hospital
network; creating and developing centers of excellency; strategic and operational
planning of hospital units) and quality and risk control in health services units
(implementing a system of evaluation and cost benefit analysis of medical devices;
improving quality and patients safety; reducing the nosocomial infection rate; carrying
out regular clinical audits; promoting clinical risk control).
Finally, all the policies grouped in cluster 7 regard information technology concerns such
as: the need to guaranty the reliability of information; the implementation of shared

Chapter 3 - Contribution of Hierarchical Cluster Analysis to the Health Impact Assessment Screening Step Sub Chapter3.1 - Screening Hospital Reform Policies for HIA: easier decision making through cluster analysis
Leonor Bacelar Nicolau PhD Thesis Chapter 3 / Sub Chapter 3.1- Page 65/149
software tools and applications for the complete hospital network; implementing an
integrated computer network; implementing the Electronic Health Registry.
The second group of most relevant clusters includes 2 clusters with intermediate mean
levels of potential impact: cluster 6 with lower mean costs and cluster 2 with higher ones.
Cluster 6 includes policies regarding hospital efficiency (share services among hospital
pharmacies, standardize pre-surgery protocols, create a National Program to review
adequacy of treatment in less differentiate care units following hospital admission,
rationalize auxiliary diagnostic and therapeutic means requests, promote health
professionals mobility, reduce the caesarean sections rate), healthcare integration to
improve patients’ access (promote the hospital specialties appointments in the Primary
Health Centers, meet the patients screened as “Not-urgent” outside the Emergency
Hospital Services, speed up patient referral to the Integrated Continuous Care Network),
improving governance (select Board of Directors members with transparency, evaluate
Board of Directors members performance, implement Code of Ethics in the EPE Hospitals)
and improve the quality of available information at different levels (develop Clinical Trials
in Portugal, make information on wait times easily available).
Cluster 2 contains policies related to improving communication and information delivery
within the hospital network (hospital network architecture, promote medical
appointments through new technologies in specific cases, develop therapeutic standards
targeting therapeutic priorities supported by IT (information technologies),
pharmaceuticals monitoring system – inpatient and outpatient hospital care, guaranty
faster and safer communications, implement a virtualization program in the hospital
network) and towards users and the general public (make health information available to
citizens, make information on the Health System more available. raise user awareness
about NHS costs of each clinical episode (proforma invoice), resume the Periodical User
Satisfaction Evaluation Program, optimize the Users registered for surgery management
system. It also presents management policies generally related with efficiency (convert all
hospitals into Public Institution privately managed), develop an even costing and
accounting system, share support services, further develop strategic partnerships with
the social sector) and quality concerns (link service provider funding to quality indicators,
promote the use of an uniform set of quality indicators).

Chapter 3 - Contribution of Hierarchical Cluster Analysis to the Health Impact Assessment Screening Step Sub Chapter3.1 - Screening Hospital Reform Policies for HIA: easier decision making through cluster analysis
Chapter 3 / Sub Chapter 3.1- Page 66/149 Leonor Bacelar Nicolau PhD Thesis
The third and last group of clusters includes 2 clusters with lower mean levels of potential
impact: cluster 4 with lower mean costs and cluster 5 with higher ones. These should be
the policies whose health impact is less likely to be important to assess.
Cluster 4 includes policies regarding improved hospital efficiency (redesign the
pharmaceutical and medical devices buying process, subject the pre-evaluation
agreements to contracted programs, implement an energy efficiency program, unify
hospital price tables, incorporate patients’ satisfaction level in the hospital performance
evaluation), improve governance (update the hospital classification regarding Board of
Directors members pay) and reinforcing the citizen’s role (implement effectively the
Informed Consent).
Finally, cluster 5 includes mainly policies regarding reinforcing the citizen’s role (monitor
comfort levels in hospital units, implement effectively citizen participation in hospital life,
implement the principle of freedom of choice of public healthcare providers for patients,
make information on clinical benchmark available), improve hospital efficiency (adopt
guidelines on the use of Medical Devices, implement a Medical Devices reuse Program,
improve billing process) and quality of Health Professionals (promote Health Professionals
recertification, create a Medical Simulation National Centre).
In short, considering as priority criteria to rank clusters dimensions Potential Impact (in
terms of a “better health at lower costs” goal), then Implementation costs (including
monetary, non-monetary and political costs) and lastly Ease of implementation /
likelihood to be applied over the next 3 years, clusters would be ranked from the most to
the least important to apply HIA as follows: clusters 1, 3, 7, 6, 2, 4, 5.
4.2. Clusters, Policies and Action Areas
In the initial report 7, the various proposed policies were divided into 8 strategic areas: A
more consistent hospital network; A more sustainable financing policy; Healthcare
integration to improve patients’ access; More efficient hospitals; Quality as cornerstone
of hospital reform; Information and technologies as investment and sustainability factor;
Improve governance; Reinforcement of citizen’s role.
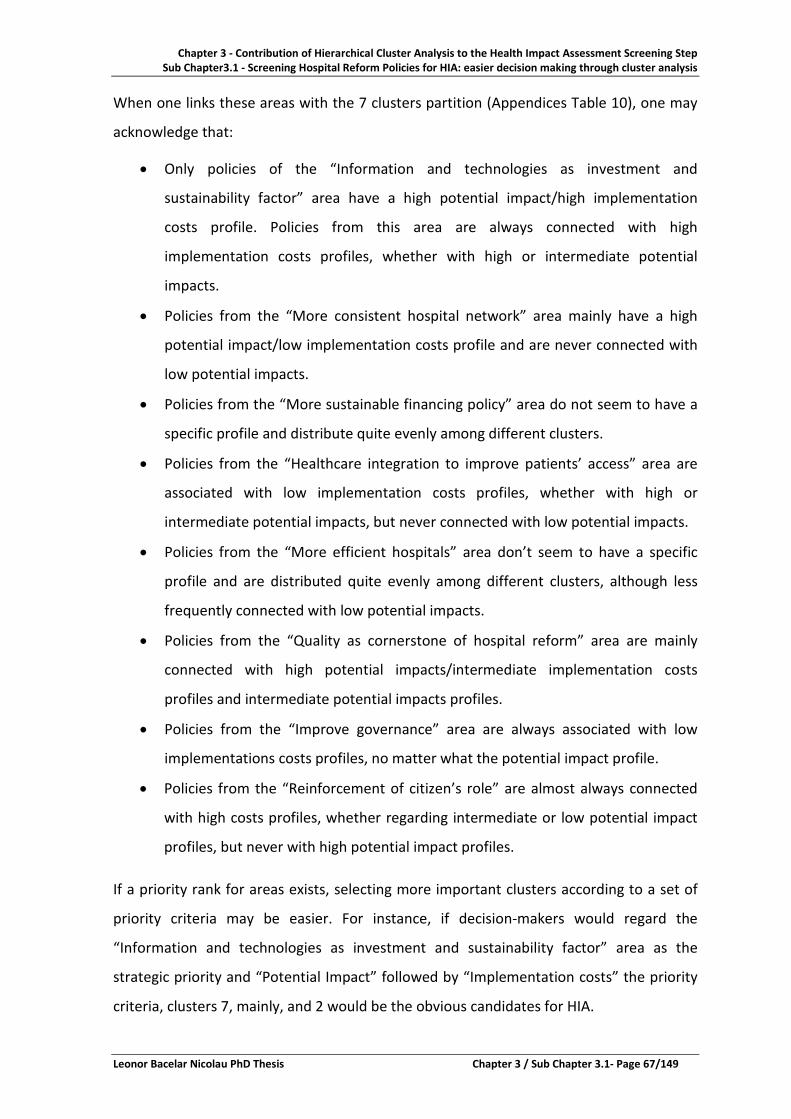
Chapter 3 - Contribution of Hierarchical Cluster Analysis to the Health Impact Assessment Screening Step Sub Chapter3.1 - Screening Hospital Reform Policies for HIA: easier decision making through cluster analysis
Leonor Bacelar Nicolau PhD Thesis Chapter 3 / Sub Chapter 3.1- Page 67/149
When one links these areas with the 7 clusters partition (Appendices Table 10), one may
acknowledge that:
• Only policies of the “Information and technologies as investment and
sustainability factor” area have a high potential impact/high implementation
costs profile. Policies from this area are always connected with high
implementation costs profiles, whether with high or intermediate potential
impacts.
• Policies from the “More consistent hospital network” area mainly have a high
potential impact/low implementation costs profile and are never connected with
low potential impacts.
• Policies from the “More sustainable financing policy” area do not seem to have a
specific profile and distribute quite evenly among different clusters.
• Policies from the “Healthcare integration to improve patients’ access” area are
associated with low implementation costs profiles, whether with high or
intermediate potential impacts, but never connected with low potential impacts.
• Policies from the “More efficient hospitals” area don’t seem to have a specific
profile and are distributed quite evenly among different clusters, although less
frequently connected with low potential impacts.
• Policies from the “Quality as cornerstone of hospital reform” area are mainly
connected with high potential impacts/intermediate implementation costs
profiles and intermediate potential impacts profiles.
• Policies from the “Improve governance” area are always associated with low
implementations costs profiles, no matter what the potential impact profile.
• Policies from the “Reinforcement of citizen’s role” are almost always connected
with high costs profiles, whether regarding intermediate or low potential impact
profiles, but never with high potential impact profiles.
If a priority rank for areas exists, selecting more important clusters according to a set of
priority criteria may be easier. For instance, if decision-makers would regard the
“Information and technologies as investment and sustainability factor” area as the
strategic priority and “Potential Impact” followed by “Implementation costs” the priority
criteria, clusters 7, mainly, and 2 would be the obvious candidates for HIA.

Chapter 3 - Contribution of Hierarchical Cluster Analysis to the Health Impact Assessment Screening Step Sub Chapter3.1 - Screening Hospital Reform Policies for HIA: easier decision making through cluster analysis
Chapter 3 / Sub Chapter 3.1- Page 68/149 Leonor Bacelar Nicolau PhD Thesis
Analyzing clusters in the context of strategic action health areas may thus also help
decision-makers screen through clusters as potential candidates to HIA.
4.3. Swift Response to changes in priority criteria
As seen previously, using multivariate statistical methods such as cluster analysis in the
screening step allows us to select as first candidates for HIA policies from cluster 1. But
this ranking of clusters is obtained considering as priority criteria, first to maximize the
Potential Impact (in terms of a “better health at lower costs” goal), then to minimize the
Implementation costs (including monetary, non-monetary and political costs) and at last
to maximize the Ease of implementation / likelihood.
However, the decision-makers’ priority criteria may be different, especially considering a
country such as Portugal, amid a structural economic crisis, monitored at the time by the
International Monetary Fund, the European Commission and the European Central Bank,
with an adjustment program with detailed target policies to be achieved at specific times
and precise associated indicators and quarterly reviews of its progress. With time and
costs constraints related to the situation at the time, the potential impact of policies may
not be the priority at all, but costs or even feasibility in 3 years. Figure 5 illustrates every
possible different scenario when priorities change, helping decision-makers to view what
solution is best according to their limitations and wishes. It is very interesting to see that,
no matter what priority criteria one may have, the first cluster in every solution is cluster
1, identifying it as the group of policies most likely to be targets for HIA.
The decision-making process may thus be helped and speeded up not only to find one
final more adequate solution, but also to allow choosing in an easy way among all
possible combinations of solutions. Although multivariate statistical methodologies may
be complex, its results are not very difficult to understand and thus decision-makers have
more information, reliably, and not necessarily in a more difficult way to grasp.
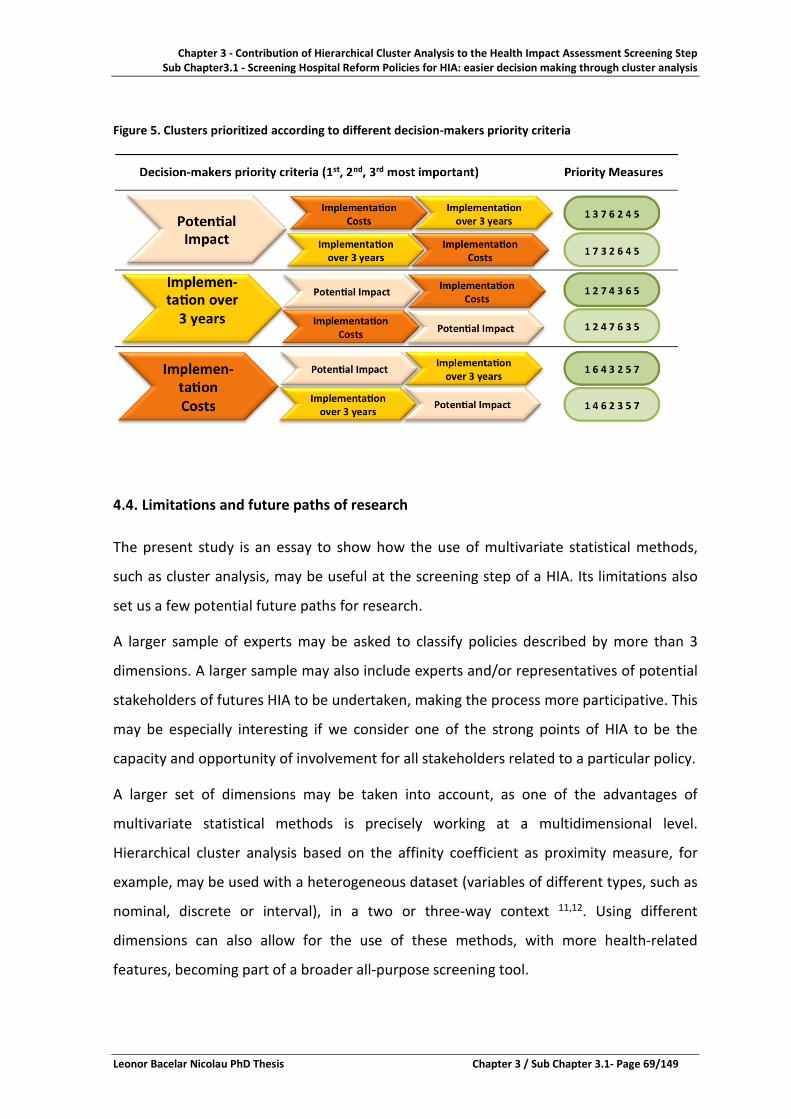
Chapter 3 - Contribution of Hierarchical Cluster Analysis to the Health Impact Assessment Screening Step Sub Chapter3.1 - Screening Hospital Reform Policies for HIA: easier decision making through cluster analysis
Leonor Bacelar Nicolau PhD Thesis Chapter 3 / Sub Chapter 3.1- Page 69/149
Figure 5. Clusters prioritized according to different decision-makers priority criteria
4.4. Limitations and future paths of research
The present study is an essay to show how the use of multivariate statistical methods,
such as cluster analysis, may be useful at the screening step of a HIA. Its limitations also
set us a few potential future paths for research.
A larger sample of experts may be asked to classify policies described by more than 3
dimensions. A larger sample may also include experts and/or representatives of potential
stakeholders of futures HIA to be undertaken, making the process more participative. This
may be especially interesting if we consider one of the strong points of HIA to be the
capacity and opportunity of involvement for all stakeholders related to a particular policy.
A larger set of dimensions may be taken into account, as one of the advantages of
multivariate statistical methods is precisely working at a multidimensional level.
Hierarchical cluster analysis based on the affinity coefficient as proximity measure, for
example, may be used with a heterogeneous dataset (variables of different types, such as
nominal, discrete or interval), in a two or three-way context 11,12. Using different
dimensions can also allow for the use of these methods, with more health-related
features, becoming part of a broader all-purpose screening tool.

Chapter 3 - Contribution of Hierarchical Cluster Analysis to the Health Impact Assessment Screening Step Sub Chapter3.1 - Screening Hospital Reform Policies for HIA: easier decision making through cluster analysis
Chapter 3 / Sub Chapter 3.1- Page 70/149 Leonor Bacelar Nicolau PhD Thesis
Using statistics at this stage of HIA means one needs quantified information, which
enriches the decision-making process making it more evidence-based, but also may make
it more efficient, in terms of lowering time related with the choice of undertaking HIA
and, in the future, even taking into account costs. This is increasingly relevant with the
rising importance of the HIA methodologies in the present and in the future, following
international documents such as Health 2020 13.
5. Conclusions
It is important that each step of HIA methodologies in the context of policies becomes
increasingly quantified and multivariate, but in a way clear for decision makers to
understand, and truly help the decision-making process.
This research helps to screen and prioritize policies quickly and reliably, using multivariate
statistical methods to depict a multivariate reality and enabling scenario analysis by easily
re-ranking clusters to distinct priority criteria and potential action areas. It may also
contribute to make the screening process more transparent regarding non-health
features. However, this methodology may easily be used for a more “traditional”
screening step, just by using different variables.
This methodology may be applied to other forms of impact assessments and in other
countries and may integrate stakeholders’ and the public’ opinions in the decision-making
process.
Applying multivariate statistical methods such as hierarchical cluster analysis as early as
the screening step in HIA may be very helpful towards obtaining evidence based, reliable,
participatory, flexible and more efficient ways of selecting policies that should be the
object of HIA.

Chapter 3 - Contribution of Hierarchical Cluster Analysis to the Health Impact Assessment Screening Step Sub Chapter3.1 - Screening Hospital Reform Policies for HIA: easier decision making through cluster analysis
Leonor Bacelar Nicolau PhD Thesis Chapter 3 / Sub Chapter 3.1- Page 71/149
References 1. WHO Regional Office for Europe. Health 21: The health for all policies framework for the WHO European Region: World Health Organization; 1999. 2. Stahl T, Wismar M, Ollila E, Lahtinen E, Leppo K, editors. Health in All Policies - Prospects and Potentials: Ministry of Social Affairs, Finland ; European Observatory on Health Systems and Policies; 2006. 3. Scott-Samuel A, Birley M, Ardern K. The Merseyside Guidelines for Health Impact Assessment. 2nd ed: International Health Impact Assessment Consortium; 2001. 4. Hebert KA, Wendel AM, Kennedy SK, Dannenberg AL. Health impact assessment: A comparison of 45 local, national, and international guidelines. Environmental Impact Assessment Review 2012; 34: 74-82. 5. Diallo T, editor. Guide d'introduction à l'Évaluation d'Impact sur la Santé en Suisse: Plateforme Suisse sur l'Évaluation d'Impact sur la Santé (Plateforme EIS); 2010. 6. Harris P, Harris-Roxas B, Harris E, Kemp L. Health Impact Assessment: A Practical Guide. Sydney: Centre for Health Equity Training, Research and Evaluation (CHETRE). Part of the UNSW Research Centre for Primary Health Care and Equity, UNSW.; 2007. 7. Mendes Ribeiro J, Barreto AXD, Varanda JAV, Penedo JMV, Caiado JCF, Nunes JM, Santos NS, Boto PAF, Ivo RS, Santos TAC. Relatório Final do Grupo Técnico para a Reforma Hospitalar - Os Cidadãos no centro do Sistema, os Profissionais no centro da mudança, 2011. 8. Pita-Barros P, Campos-Fernandes A, Ramos F, Dussault G, Caldas-Almeida J, Fragata J, Lapão L. "Os Cidadãos no centro do Sistema, os Profissionais no centro da mudança": Contributo para a discussão. Lisboa, Portugal, 2011. 9. Hair JF, Black B, Babin B, Anderson RE, Tatham RL. Multivariate Data Analysis. 6th ed: Prentice Hall; 2006. 10. Daniel WW. Biostatistics – A Foundation for Analysis in the Health Sciences. 9th ed: John Wiley&Sons; 2009. 11. Bacelar-Nicolau L. Caracterização dos Sistemas de Informação das Organizações com base no modelo de Nolan. Aplicação de modelos de classificação hierárquica aos organismos da Administração Pública: NOVA IMS Information Management School (formerly Institute of Statistics and Information Management ISEGI - Universidade Nova de Lisboa); 2002. 12. Bacelar-Nicolau H, Nicolau F, Sousa A, Bacelar-Nicolau L. Measuring Similarity of Complex and Heterogeneous Data in Clustering of Large Data Sets. Biocybernetics and Biomedical Engineering 2009; 29(2): 9-18. 13. WHO Regional Office for Europe. Health 2020: A European Policy Framework and Strategy for the 21st Century: World Health Organization; 2013.

Chapter 3 - Contribution of Hierarchical Cluster Analysis to the Health Impact Assessment Screening Step Sub Chapter3.1 - Screening Hospital Reform Policies for HIA: easier decision making through cluster analysis
Chapter 3 / Sub Chapter 3.1- Page 72/149 Leonor Bacelar Nicolau PhD Thesis

Leonor Bacelar Nicolau PhD Thesis Chapter 3 / Sub Chapter 3.2- Page 73/149
Chapter 3 – Contribution of Hierarchical Cluster Analysis to the Health Impact Assessment Screening Step
SubChapter 3.2 – Screening National Health Programs for Health Impact Assessment: targeting policies with cluster analysis
CONTENTS Abstract ................................................................................................................................. 74 1. Introduction ................................................................................................................................ 75 2. Materials and methods ............................................................................................................... 76 2.1. Data ....................................................................................................................................... 76 2.2. Relevance Criteria ..................................................................................................................... 79 2.3. Statistical Methodologies ......................................................................................................... 80 3. Results ................................................................................................................................. 81 3.1. Rationale ................................................................................................................................... 81 3.2. Choosing the adequate partition of clusters for each group of variables .................................. 82 3.3. Profiling clusters for each group of variables ............................................................................. 84 3.4. Choosing the most adequate NP ................................................................................................ 90 4. Discussion ................................................................................................................................. 95 4.1. Two-steps hierarchical cluster analysis approaches: usefulness .............................................. 95 4.2. The importance of the Cerebro-cardiocardiovascular Diseases National Program.................. 95 4.3. Limitations and future paths of research ................................................................................. 97 5. Conclusions ................................................................................................................................. 98 References ................................................................................................................................. 99

Chapter 3 - Contribution of Hierarchical Cluster Analysis to the Health Impact Assessment Screening Step Sub Chapter 3.2 - Screening National Health Programs for HIA: targeting policies with cluster analysis
Chapter 3 / Sub Chapter 3.2- Page 74/149 Leonor Bacelar Nicolau PhD Thesis
SubChapter 3.2 – Screening National Health Programs for Health Impact Assessment: targeting policies with cluster analysis
Abstract
Background: Health Impact Assessment (HIA) is a combination of procedures, methods
and tools by which a policy may be judged as to its potential effects and its distribution on
a population’s health. Screening policies to identify candidates for applying HIA is an
essential first step, generally qualitative. Our aim is to show how to use exploratory
multivariate statistical methods such as cluster analysis to screen through National Health
Programs (NPs) and pinpoint candidates for HIA.
Methods: Data consists on results of a two-part evaluation survey in 2012 regarding 31
NPs from the National Health Plan 2004-2010 (67 variables) - a characterization of NPs by
their coordinator regarding 8 different areas and information on regional dissemination
by Health Regions Administrations. Hierarchical cluster analysis was used for each area
separately, complemented by principal component or multiple correspondence analyses,
k-means cluster analyses and Kruskal-Wallis tests.
Results: Hierarchical Clusters Methods enable ranking clusters within each area and then
rank each NP, according to a previously set of criteria for being a potential priority for
HIA, from the highest to the lowest priority potential for HIA. The Cerebro-
cardiocardiovascular Diseases National Program (Programa Nacional de Doenças Cerebro-
cardiovasculares -PNDCV) is thus selected as the most adequate candidate for HIA.
Conclusion: Using multivariate statistical methods, such as cluster analysis, may be useful
at the screening step of a HIA to pinpoint candidates for assessment. The Cerebro-
cardiocardiovascular Diseases National Program best fulfills the established set of priority
criteria, being thus the most obvious candidate for HIA.
Keywords: Health Impact Assessment, screening policies, quantification, cluster analysis,
decision-making, national health programs, cardiovascular program.

Chapter 3 - Contribution of Hierarchical Cluster Analysis to the HIA Screening Step Sub Chapter 3.2 - Screening National Health Programs for HIA: targeting policies with cluster analysis
Leonor Bacelar Nicolau PhD Thesis Chapter 3 / Sub Chapter 3.2- Page 75/149
1. Introduction
National Health Programs are an instrument to address public health issues, examining
and mobilizing health system resources. In Portugal, National Health Programs are part of
the National Health Plan, created within the health sector to help to establish indicators,
goals, guidelines or notices of compliance in certain health-related areas 1,2. The
evaluation of health programs is essential to understand their impact and to strengthen
their effectiveness3. Health Impact Assessment (HIA) is a systematic approach which
allows examining and understanding the effect of a health program on health gains 4. HIA
is classically organized in sequential steps, the first of which is the screening step to
identify whether a specific health program, intervention or public policy is suitable for HIA
evaluation. Screening is generally a qualitative step and requires a clear enough definition
of significant health impact, a perspective of added value in the HIA process, the ability to
have or to create evidence to support the analysis and assessment feasibility 5-7.
The main aim of the present research is to show how to use exploratory multivariate
statistical methods such as cluster analysis to screen through National Health Programs
(NP) and pinpoint which NP or NPs are more suitable as priorities for HIA.
Classically, the screening of programs for HIA is conducted as a “selection process for
identifying which projects, policies, plans or programs need to undergo a HIA based on
the proposal's potential to impact people's health and add value to the decision-making
process” 6. Although HIA guides state screening is primarily based on criteria related to
health determinants and equity, most consider other aspects such as political and
operational priorities, especially when proposing screening tools 4. In HIA guides there is a
strong concern regarding assuring the accountability of a decision of doing HIA or not, but
frequently it is not so evident how these non-health aspects, eventually more subjective,
are actually to be taken into consideration in the screening process (chapter 2).
In the present research, authors propose a systematic and objective approach, based on
cross-sectional criteria and a two steps statistical procedure with hierarchical cluster
analysis.

Chapter 3 - Contribution of Hierarchical Cluster Analysis to the Health Impact Assessment Screening Step Sub Chapter 3.2 - Screening National Health Programs for HIA: targeting policies with cluster analysis
Chapter 3 / Sub Chapter 3.2- Page 76/149 Leonor Bacelar Nicolau PhD Thesis
Data, priority criteria and statistical methodologies used are presented in the next
section. In the results section, a two-steps statistical procedure is proposed, where 30
NPs are systematically and separately clustered through 7 distinct groups of variables
(corresponding to the 7 priority criteria features described in the materials and methods
section) and clusters and NPs candidates for HIA are ranked. The discussion section
reflects upon the usefulness of using these multivariate methodologies, the latent
limitations of the research and possible future paths to be undertaken.
Main figures and tables are included in this paper, but several additional ones are
referred to and may be found in the appendices.
2. Materials and methods
2.1. Data
Data used in this research consists on results of a two-part evaluation process regarding
31 National Health Programs (NPs) from the Portuguese National Health Plan 2004-2010 1-3. In the first part, program coordinators were asked to answer a questionnaire
characterizing the national program they were responsible for including: legal context;
financing; products such as planning documents, progress reports, published information
for the general population or health professionals, websites, among others; general and
specific aims, as well as related projects; monitoring process of indicators on health gains,
effectiveness, self-evaluation, etc. In the second part of the evaluation process, Health
Regions Administrations answered a questionnaire concerning the dissemination and
implementation of National Health Programs at a regional level, regarding: the existence
of a regional coordinator; active or implemented projects in 2011, annual progress
reports between 2009 and 2010; the existence of a regional evaluation program.

Chapter 3 - Contribution of Hierarchical Cluster Analysis to the HIA Screening Step Sub Chapter 3.2 - Screening National Health Programs for HIA: targeting policies with cluster analysis
Leonor Bacelar Nicolau PhD Thesis Chapter 3 / Sub Chapter 3.2- Page 77/149
A total of 75 variables were first considered, organized into 9 areas ensuing from the
format of the questionnaire applied in the survey (Figure 1).
Figure 1. Areas and associated number and types of variables in the National Program Evaluation Survey
The complete list of variables may be found in the Appendices Table 8. Group G2 was not
considered for analysis as apparently the questions were not understood the same way
throughout the sample, namely regarding the number of what was considered partial
time and full time human resources assigned to the NPs. Group G6 was also not taken
into account since it presented a high number of missing values and the health and
effectiveness gains issues were already broadly being considered in group G5. The
analysis was performed, therefore, using 64 variables (47 binary variables in 4 groups and
17 quantitative variables in 3 groups).
A total of 31 National Health Programs (NPs) was identified as active programs, but only
30 NPs were considered for analysis (Table 1), since the Oral Health NP (code 22)
presented a very high number of missing values.

Chapter 3 - Contribution of Hierarchical Cluster Analysis to the Health Impact Assessment Screening Step Sub Chapter 3.2 - Screening National Health Programs for HIA: targeting policies with cluster analysis
Chapter 3 / Sub Chapter 3.2- Page 78/149 Leonor Bacelar Nicolau PhD Thesis
Table 1. 30 National Health Programs (NPs) analyzed
Programa Nacional (PN) National Program (NP) 1 ASCJR Ação de Saúde para Crianças e Jovens em Risco Health Action for at Risk Children and Youth 2 PNDCV PN para as Doenças Cérebro-Cardiovasculares
(Coordenação Nacional de Doenças Cardiovasculares) NP for Cerebro-Cardiovascular Disease
3 PNIVIH/SIDA PN de Prevenção e Controlo da Infeção VIH/SIDA (Coordenação Nacional para a Infeção VIH/SIDA) NP for HIV/AIDS Infection
4 PNSM PN de Saúde Mental (Coordenação Nacional para a Saúde Mental) NP for Mental Health
5 PNPCDO PN de Prevenção e Controlo das Doenças Oncológicas (Coordenação Nacional para as Doenças Oncológicas)
NP for Oncological Disease Prevention and Control
6 PNCDT PN contra as Drogas e as Toxicodependências NP against Drugs and Addictions 7 PNRPLA PN para a Redução dos Problemas Ligados ao Álcool NP for Reducing Alcohol Related Problems 8 PCO Plataforma Contra a Obesidade (PN para a Promoção
da Alimentação Saudável) NP for Promoting Healthy Eating
9 PNCDR PN Contra as Doenças Reumáticas NP against Rheumatic Diseases 10 PNAS PN de Acreditação em Saúde NP for Certification in Health 11 PNCA PN de Controlo da Asma NP for Asthma Control 12 PNCD PN de Controlo da Dor NP for Pain Control 13 PNCP PN de Cuidados Paliativos NP for Palliative Care 14 PNEP PN de Erradicação da Poliomielite NP for Polio Eradication 15 PNIIDSEV PN de Intervenção Integrada sobre Determinantes da
Saúde Relacionados com os Estilos de Vida NP for Integrated Intervention on Health Determinants related to Life Styles
16 PNLCT PN de Luta Contra a Tuberculose NP against Tuberculosis 17 PNPRA PN de Prevenção das Resistências aos Antimicrobianos NP for Resistances to Antimicrobials
Prevention 18 PNPA PN de Prevenção de Acidentes NP for Accidents Prevention 19 PNPCD PN de Prevenção e Controlo da Diabetes (PN para a
Diabetes) NP for Diabetes
20 PNPCDPOC PN de Prevenção e Controlo da Doença Pulmonar Obstrutiva Crónica
NP for Chronic Obstructive Pulmonary Disease Prevention
21 PNCI PN de Prevenção e Controlo das Infeções Associadas aos Cuidados de Saúde
NP for Healthcare associated Infections Prevention and Control
23 PNSA PN de Saúde Ambiental NP for Environmental Health 24 PNSE PN de Saúde Escolar NP for School Health 25 PNSO PN de Saúde Ocupacional NP for Occupational Health 26 PNSR PN de Saúde Reprodutiva NP for Reproductive Health 27 PNV PN de Vacinação NP for Vaccination 28 PNIVCLG PN Integrado da Vigilância Clínica e Laboratorial da
Gripe National Integrated Program of Clinical and Laboratory Surveillance of Influenza
29 PNSV PN para a Saúde da Visão NP for Eyesight Health 30 PNSPI PN para a Saúde das Pessoas Idosas NP for Elderly Health 31 PNDR PN para Doenças Raras NP for Rare Diseases

Chapter 3 - Contribution of Hierarchical Cluster Analysis to the HIA Screening Step Sub Chapter 3.2 - Screening National Health Programs for HIA: targeting policies with cluster analysis
Leonor Bacelar Nicolau PhD Thesis Chapter 3 / Sub Chapter 3.2- Page 79/149
2.2. Relevance Criteria
A set of priority criteria was considered to determine how important each cluster could
be considered. These criteria were subjectively chosen by authors to illustrate how one
can introduce criteria into this methodological approach. Nevertheless, an alternative set
of criteria could easily be used.
Here, a NP is considered more relevant for analysis the more often it presents the
following features, by order of importance (from the more to the less important):
a) Having a regional span as extended and in depth as possible;
b) Showing a concern of monitoring health gains, health systems needs and
effectiveness gains;
c) Being a high-priority NP according to the National Health Plans 2004-2010 and
2012-2016;
d) Having been generating a variety of different products for health professionals,
specific population groups and general population (guidelines, published
information, online presence, events, etc);
e) Listing its planning documents, general aims and linking them to specific aims
and/or projects’ aims;
f) Presenting an adequate number of aims (being ambitious but realistic in its
ambitions), coherent with the number of specific aims for each general aim and
the number of projects for each aim;
g) Considering monitoring and evaluating the way aims are being achieved, including
resources allocation.
Each of these criteria is linked to one of the 7 groups of variables considered (table 2) and
is used to rank clusters and respective NPs (section 3.4).

Chapter 3 - Contribution of Hierarchical Cluster Analysis to the Health Impact Assessment Screening Step Sub Chapter 3.2 - Screening National Health Programs for HIA: targeting policies with cluster analysis
Chapter 3 / Sub Chapter 3.2- Page 80/149 Leonor Bacelar Nicolau PhD Thesis
Table 2. Link between each variable group and respective priority criterion, as well as importance rank
Features for being a potential priority for HIA Group of Variables Rank
a) Having a regional span as extended and in depth as possible G9 – Range of regional implementation 1 b) Showing a concern to monitor health gains, health systems needs and effectiveness gains
G5 – Link to health problems, health gains and effectiveness gains 2
c) Being a high-priority NP according to the National Health Plans 2004-2010 and 2012-2016
G1 – Legal Context 3
d) Having a practice of generating a variety of different products to the health professionals, specific groups of the population and the population in general (guidelines, published information, online presence, events, etc)
G3 – Generated Products (planning, informations, etc.) 4
e) Considering the monitorization and evaluation of the way the aims are being achieved, including resources allocation
G8 – Characterization of specific aims in terms of % of total specific aims/projects achieved
5
f) Listing its planning documents, general aims and linking them to specific aims and/or projects’ aims
G4 – Organization and management 6
g) Presenting an adequate number of aims and projects G7 – General aims, specific aims and associated projects 7
2.3. Statistical Methodologies
Univariate descriptive analysis was performed to generally characterize the set of NPs and
also with a data validation concern. These results will not be presented here, since the
multivariate proposed approach may summarize the main univariate findings and is also
the main focus of this research.
In this two-steps approach, hierarchical cluster analysis was applied to each group of
variables to classify NPs, using as proximity measure the Ochiai coefficient for groups of
binary variables and the squared Euclidean distance for groups of quantitative variables,
as well as the average linkage aggregation criterion for all variables.
For groups of quantitative variables k-means non-hierarchical clusters were used (based
on centroids from the hierarchical cluster analysis’ partition) to validate hierarchical
cluster analysis’ selected partitions 8,9.
Multiple correspondence analysis (MCA) and principal components analysis (PCA) were
applied respectively to binary and quantitative variables, as an aid in profiling the various
clusters of selected partitions. Crosstabs with column percentages and adjusted residuals,
as well as Fisher Exact Tests (with a significance level of 5%), were used to identify more
significant binary variables and relevant clusters. For quantitative variables, descriptive
statistics by cluster (mean, median, standard deviation, quartiles) and Kruskal-Wallis tests

Chapter 3 - Contribution of Hierarchical Cluster Analysis to the HIA Screening Step Sub Chapter 3.2 - Screening National Health Programs for HIA: targeting policies with cluster analysis
Leonor Bacelar Nicolau PhD Thesis Chapter 3 / Sub Chapter 3.2- Page 81/149
and associated multiple comparisons tests 10 were additionally employed to identify more
relevant differences among clusters, that is to identify which clusters were the most
distinct between them, and concerning which variables.
Since each group of variables corresponds to a priority criterion, for each group of
variables, the partition or clusters of NPs obtained may be ranked as to being more or less
evolved regarding to the associated criterion. The clusters of each partition are given a
color-coded priority level and each NP is then evaluated according to this color-coded
priority scheme. For each group of variables, color green is associated with the clusters
more evolved regarding the criterion linked to that group of variables, color yellow to an
intermediate level of evolvement and color red to a low level of evolvement. Clusters
with only one NP associated are identified in light grey and are analyzed individually. The
top NPs candidates for HIA are consequently easily identifiable, by being the ones
integrated more often in clusters linked to the color green.
The statistical analyses were performed with IBM-SPSS version 21 software. Whenever
necessary, a significance level of 5% was used, unless otherwise specified.
3. Results
In this section, results from our two-steps hierarchical cluster analysis approach are
presented, first introducing the rationale on which the approach is based, then following
the sequence of steps that culminate in the choice of the most adequate NP for HIA.
3.1. Rationale
The first of the two steps here proposed regards taking each one of the 7 groups of
variables under study and applying hierarchical cluster analysis to obtain a partition for
each group of variables. For each group of variables, a set of NPs clusters is obtained. The
partition of each group of variables will probably be different, which means that for each
group of variables a different number of clusters may be obtained, as well as in each
cluster a different set of NPs (subsection 3.2).

Chapter 3 - Contribution of Hierarchical Cluster Analysis to the Health Impact Assessment Screening Step Sub Chapter 3.2 - Screening National Health Programs for HIA: targeting policies with cluster analysis
Chapter 3 / Sub Chapter 3.2- Page 82/149 Leonor Bacelar Nicolau PhD Thesis
Taking each group of variables separately, and as each of these groups is associated with
a different priority criterion (subsection 2.2 and table 2), one may rank the clusters of NPs
according to their relevance for each priority criterion (subsection 3.3). NPs may thus be
color-coded regarding their ranking for each priority criterion.
The second step of this approach therefore consists on ranking the NPs within each group
by their relevance for each criterion and then ranking them by the importance of the
criteria used. A set of NPs candidates for HIA is thus quite easily obtained (subsection
3.4).
The following subsections give a more detailed description of the methodology
implemented.
3.2. Choosing the adequate partition of clusters for each group of variables
Hierarchical trees or dendrograms (Figure 2 and, for easier viewing, Appendices Figures 5
to 11), complemented with the study of agglomeration schedules, led us to select a
cluster partition of NPs for each group of variables. The number of clusters in each chosen
partition may be seen in the dendrograms, but likewise in table 5. Hence, a 3 clusters
partition was selected for analysis for group G9, 4 clusters’ partitions were chosen for
groups G1, G3, G4 and G8, a 5 and a 6 clusters’ partitions were taken respectively for
groups G5 and G7.
The dendrograms give us furthermore which NPs belong to which cluster. For instance,
for area G1 - Legal Context a partition of 4 clusters was selected, in which cluster 2 (CL2)
includes the following National Programs (NPs): NP for Cerebro-cardiovascular Diseases
(PNDCV), NP for Oncological Disease Prevention and Control (PNPCDO), NP against Drugs
and Addictions (PNCDT) and NP for Reducing Alcohol Related Problems (PNRPLA). The
alignment of NPs for each cluster may be consulted in table 6.

Chapter 3 - Contribution of Hierarchical Cluster Analysis to the HIA Screening Step Sub Chapter 3.2 - Screening National Health Programs for HIA: targeting policies with cluster analysis
Leonor Bacelar Nicolau PhD Thesis Chapter 3 / Sub Chapter 3.2- Page 83/149
Figure 2. Dendrograms of hierarchical cluster analysis for each variable group with selected partition and PNDCV identification

Chapter 3 - Contribution of Hierarchical Cluster Analysis to the Health Impact Assessment Screening Step Sub Chapter 3.2 - Screening National Health Programs for HIA: targeting policies with cluster analysis
Chapter 3 / Sub Chapter 3.2- Page 84/149 Leonor Bacelar Nicolau PhD Thesis
3.3. Profiling clusters for each group of variables
Once the number of clusters and respective alignment of NPs are determined, the profile
for each cluster of NPs was outlined. Multiple correspondence analysis (MCA) and
principal components analysis (PCA) were applied respectively to binary and quantitative
variables (Figures 3 and 4, as well as Appendices Figures 12 to 18, for easier viewing).
Additionally, we also used crosstabs with column percentages and adjusted residuals
(binary variables) or descriptive statistics (quantitative variables) by cluster, as well as
hypothesis testing (Fisher Exact and Kruskall-Wallis Tests, depending on variable types)
for each variable of each group of variables. Tables 3 and 4 present significant tests
results (p<0.05) for each variable and summary interpretation. More complete descriptive
and inferential results may be found in the appendices (Appendices Tables 9 to 17, 19 and
21).
Thus, regarding area G1 – Legal Context, cluster 2 NPs’ seem to differentiate themselves
from other programs, being relatively isolated in the right quadrants of the MCA and
more related to categories in the right quadrants of the joint plot of category points such
as: having been created through Law, Decree, Government or Republic’s Assembly Act
(category V8_L_DL_Resol_Y), before the National Health Plan 2014-2010
(V13_BeforePN_Y), being more often IDT’s responsibility (V7_IDT_Y) then DGS’s
(V3_DGS_N) and having received Social Games financing (V17_FinSocialGames_Y). These
categories, more important according to MCA, are precisely the more relevant found also
through descriptive analysis and hypothesis testing (Table 3). All the NPs from cluster 3
are the DGS’ responsibility and created before the National Health Plan 2004-2010.
In what concerns group G3, cluster 1 is unlike the other clusters by being the only one
with NPs that submit Evaluation Reports, where most NP’s present Project Reports and
have a website. All NPs from cluster 2 present Implementation Plans, most of them
include Training Documents and other information materials, but none has Activities
Reports and most do not present Project Reports. Cluster 3’s NPs have Activities Plans,
but most do not present Implementation Plans. Most NPs from cluster 4 don’t submit
Activities Plans, neither Project Reports. When analyzing the MCA factorial plans, there
seems to be a clockwise “evolution” of clusters beginning with cluster 1 in the lower left

Chapter 3 - Contribution of Hierarchical Cluster Analysis to the HIA Screening Step Sub Chapter 3.2 - Screening National Health Programs for HIA: targeting policies with cluster analysis
Leonor Bacelar Nicolau PhD Thesis Chapter 3 / Sub Chapter 3.2- Page 85/149
side quadrants, followed by clusters 2, 3 and 4, this one in the most right and lower
quadrants.
As regards to group G4, most NP’s from cluster 1 link its general aims directly to its
specific aims and describe the provided accountability process, while none of the NPs
from cluster 2 does either of these. The MCA factorial plan shows us the NPs from cluster
2 concentrated in the lower right quadrant, with the NPs from cluster 1 stretching
towards the upper left quadrant.
Concerning group G5, all NPs from cluster 1 use organizational and health systems
response aspects as justification for creating the NP and identify effectiveness gains when
defining its general aims. NPs from cluster 3 use organizational and health systems
response aspects as justification for creating the NP, but do not identify effectiveness
gains when defining its general aims. None of the NPs from cluster 2 use organizational
and health systems response aspects as justification for creating the NP and many do not
identify effectiveness gains when defining its general aims. The MCA factorial plan shows
us the NPs from cluster 1 concentrated in the upper quadrants, with the NPs from other
clusters occupying the lower quadrants.
In what regards group G7, cluster 3’s NPs present a higher median number of specific
goals and of projects associated to specific goals (initially expected as well as actually
implemented). Cluster 1 have the lowest median value of general and of specific goals
and Cluster 6 the lowest median value of projects associated to specific goals (initially
expected as well as actually implemented). The PCA factorial plan shows us an overall
concentration of NPs near the center of the plan, which means NPs aren’t very different
from each other in what relates to the variables of this group. There is however a
tendency for NPs of the same clusters to near each other. NPs from cluster 3 occupy the
right and lower quadrants, but NPs from cluster 1 concentrate in the left and lower
quadrant, with NPs from clusters 2 and 6 occupying the upper quadrants.
About group G8, cluster 1 presents the best performance with a median of 100% in 8
issues and of more than 80% in the 2 remaining aspects. Cluster 2 presents a median
value of 100% in 3 of the issues and 0% in only 2 aspects. It is followed by cluster 4
(median of 0% in 4 of the 9 issues analyzed as well as of 50% or less in 2 other issues).
Cluster 3 includes the NPs with the worst performance associated with all aspects of total

Chapter 3 - Contribution of Hierarchical Cluster Analysis to the Health Impact Assessment Screening Step Sub Chapter 3.2 - Screening National Health Programs for HIA: targeting policies with cluster analysis
Chapter 3 / Sub Chapter 3.2- Page 86/149 Leonor Bacelar Nicolau PhD Thesis
specific aims/projects achieved (median of 0% for all issues). The PCA factorial plan shows
us the NPs from cluster 1 occupying the right-side quadrants, NPs from cluster 3
concentrated in the far-left side and NPs from cluster 4 towards the upper left quadrant.
Component 1 thus tends to embody an axis of success in reaching distinct expectations
for specific objectives.
Finally concerning group G9, cluster 1 is different from other clusters presenting the
highest number of NPs present in all or almost all regions with a regional coordinator,
active projects in 2011, annual progress reports during 2009-2010 and a regional
evaluation of the NPs being done or scheduled. Cluster 3 includes NPs with the worst
regional implementation at all levels. The PCA factorial plan shows a progression from
right to left of NPs from cluster 1 (more to the right), to NPs from cluster 2 (center of the
factorial plan) and then to NPs from cluster 3 (to the left). Component 1 thus represents
an axis of regional dissemination of the NPs.

Chapter 3 - Contribution of Hierarchical Cluster Analysis to the HIA Screening Step Sub Chapter 3.2 - Screening National Health Programs for HIA: targeting policies with cluster analysis
Leonor Bacelar Nicolau PhD Thesis Chapter 3 / Sub Chapter 3.2- Page 87/149
Figure 3. Multiple correspondence analysis (MCA) Factorial Plans for each group of binary variable categories and for cases identified by National Program short name and by associated cluster

Chapter 3 - Contribution of Hierarchical Cluster Analysis to the Health Impact Assessment Screening Step Sub Chapter 3.2 - Screening National Health Programs for HIA: targeting policies with cluster analysis
Chapter 3 / Sub Chapter 3.2- Page 88/149 Leonor Bacelar Nicolau PhD Thesis
Figure 4. Principal components analysis (PCA) Factorial Plans for each group of quantitative variables and for cases identified by National Program short name and by associated cluster

Chapter 3 - Contribution of Hierarchical Cluster Analysis to the HIA Screening Step Sub Chapter 3.2 - Screening National Health Programs for HIA: targeting policies with cluster analysis
Leonor Bacelar Nicolau PhD Thesis Chapter 3 / Sub Chapter 3.2- Page 89/149
Table 3. Fisher Exact Tests results with p<0.05 (2-sided), for binary variables of G1, G3, G4, G5 by selected cluster partitions and results summary of crosstabs analysis
Variables Test Statistic
Exact Sig. (2-sided)
Main results complemented with crosstabs analysis (column % and adjusted residuals)
G1 - Legal Context General Health Directorate (DGS)’s responsibility
14,605 0.001 None of cluster 2’s NPs are DGS’s responsibility and all of cluster 3’s NPs are DGS’s responsibility.
Instituto de Drogas e Toxicodependência (IDT)’s responsibility
8,487 0.023 Cluster 2 is the only one that includes NPs of IDT responsibility.
Creation through Law, Decree, Government or Republic’s Assembly Act
13,850 0.001 All NPs from cluster 2 but only one NP from cluster 1 have been legally created this way.
Creation prior to National Health Plan 2004-2010
33,003 p<=0.001 Only NPs from cluster 1 didn’t exist prior to the National Health Plan 2004-2010.
Creation during National Health Plan 2004-2010
33,003 p<=0.001 Only NPs from cluster 1 have been created during the National Health Plan 2004-2010 period.
Financing through Social Games (Lottery, etc)
6,918 0.042 Most NPs from cluster 2 received Social Games financing.
G3 - Products
Activities Plans 14,199 0.001 All NPs from cluster 3 have Activities Plans, but most NPs from cluster 4 don’t.
Implementation Plans 13,540 0.001 All NPs from cluster 2 have Implementation Plans, but most NPs from cluster 3 don’t.
Activities Reports 10,075 0.011 Cluster 2 is the only cluster where none of the NPs has Activities Reports.
Evaluation Reports 18,744 p<=0.001 Cluster 1 is the only cluster with NPs that present Evaluation Reports
Project Reports 11,342 0.006 Only one NP from cluster 1 doesn’t present Project Reports, but most of cluster 2’s NPs and all of cluster 4’s NPs don’t.
Training Documents 9,977 0.009 Cluster 2 is the only cluster where most NPs include Training Documents.
Websites 7,975 0.034 Most NPs from cluster 1 have a website. Other information materials
15,856 p<=0.001 All NPs from cluster 2 present other information materials, while only one NP from cluster 1 does.
G4 - Management
Objectivos específicos associados aos objectivos gerais
15,222 p<=0.001 Most NPs from cluster 1 link its general aims directly to its specific aims, while none of cluster 2’s NPs does.
Descrição de processo de responsabilização / "accountability"
14,158 p<=0.001 Most NPs from cluster 1 describe the provided accountability process, while none of cluster 2’s NPs does.
G5 - Link to health problems and gains
OG caracterizados aspectos da organização/Sistema Saúde e outros
30,837 p<=0.001 All NPs from clusters 1 and 3, but none from cluster 2, use organizational and health systems response aspects as justification for creating the NP.
OG Identificados ganhos de efectividade
21,824 p<=0.001 All NPs from cluster 1, but none from cluster 2, identify effectiveness gains when defining its general aims.

Chapter 3 - Contribution of Hierarchical Cluster Analysis to the Health Impact Assessment Screening Step Sub Chapter 3.2 - Screening National Health Programs for HIA: targeting policies with cluster analysis
Chapter 3 / Sub Chapter 3.2- Page 90/149 Leonor Bacelar Nicolau PhD Thesis
Table 4. Kruskal-Wallis tests and associated multiple comparisons tests results with p<0.05 (2-sided), for quantitative variables of G7, G8, G9 by selected cluster partitions
3.4. Choosing the most adequate NP
The cluster’ profiles analyzed enable us to rank each cluster in each partition regarding
what is considered the essential criteria for being a potential priority for HIA (table 2).
Each criterion is associated to a different group of variables and the groups are ranked
according to the importance attributed to the different criteria (from the most important
corresponding to group G9 to be least important associated to group G7). Taking the
partition chosen for each group and the clusters’ profiles, it is possible then to rank these
clusters from the highest priority potential for HIA (color green) to the lowest (color red)
– table 5. For example, for group G9 corresponding to our main priority criterion for
applying HIA regarding regional implementation, cluster 1 is credited with the highest
Variables Test Statistic
Exact Sig. (2-sided)
Significant Multiple Comparisons Tests (5%)
G7 - General aims, specific aims and associated projects
Objetivos Gerais Nº 21,869 0.001 CL1-CL2 (p<0.012) CL1-CL6 (p<0.024)
Objetivos Específicos Nº 20.379 0.001 CL1-CL3 (p<0.002) OE Projetos próprios a cada objetivo específico Nº total previsto inicialmente
22.657 p<=0.001 CL2-CL3 (p<0.004)
G8 - Characterization % of total specific aims/projects achieved
OE Definidas necessidades saúde/população alvo/determinantes
19.171
p<=0.001 CL3-CL1 (p<0.000) CL3-CL2 (p<0.002)
OE Definidos ganhos esperados 11.536 0.009 CL3-CL1 (p<0.010)
OE Análise de ações propostas prevista 15.277 0.002 CL3-CL2 (p<0.006) OE Parcerias com instituições regionais/locais 19.340 p<=0.001 CL3-CL1 (p<0.001)
CL3-CL2 (p<0.014) OE Atribuição de recursos materiais 10.987 0.012 CL3-CL1 (p<0.022) OE Orçamentos e Relatórios de Execução 14.218 0.003 CL3-CL1 (p<0.005) OE Indicadores de operacionalização e concretização
16.222 0.001
CL3-CL1 (p<0.001) CL3-CL4 (p<0.029)
OE Avaliação através de metas 23.724 p<=0.001 CL3-CL1 (p<0.001) CL2-CL1 (p<0.002)
OE Análise de integração nos sistemas/serviços existentes
11.547
0.009 CL3-CL1 (p<0.010)
G9 - Range of regional implementation Tem Coordenador Regional? (nº regiões) 24.667 p<=0.001 CL3-CL1 (p<0.000)
CL2-CL1 (p<0.011) Está a ser implementado e tem projetos ativos em 2011? (nº regiões)
25.050 p<=0.001 CL3-CL1 (p<0.000) CL2-CL1 (p<0.006)
Tem Relatórios de Progresso Anual nos anos 2009-2010? (nº regiões)
25.321 p<=0.001 CL3-CL1 (p<0.000) CL2-CL1 (p<0.007)
Foi realizada ou está prevista uma Avaliação do Programa a nível regional? (nº regiões)
25.426 p<=0.001 CL3-CL1 (p<0.000) CL2-CL1 (p<0.007)

Chapter 3 - Contribution of Hierarchical Cluster Analysis to the HIA Screening Step Sub Chapter 3.2 - Screening National Health Programs for HIA: targeting policies with cluster analysis
Leonor Bacelar Nicolau PhD Thesis Chapter 3 / Sub Chapter 3.2- Page 91/149
priority potential for HIA (color green), cluster 2 with medium priority (color yellow) and
cluster 3 with low priority (color red).
Furthermore, it is then possible to identify the NPs included in each cluster and granting
each NP the color of the cluster it belongs to (table 6). Additionally, NPs may then be
ranked by the 9 priority criteria (columns of table 6). Hence, assigning a color code to this
ranking scheme in tables 5 and 6 helps us to easily identify the more and least advanced
clusters and subsequently NPs.
One of the most essential features to be a NP candidate for HIA in our research is having a
broad regional range, because of our equity concerns. That immediately limits our HIA
candidates to a list of 12 NPs (listed at top of table 6), all green coded in group G9. Since a
NP with a red code (low priority) in any of the areas is instantly rejected as a contender, a
shortlist of 5 NPs is obtained (orange highlight). The NP for Cerebro-Cardiovascular
Disease (PNDCV) is the only NP with a green code both in G1 Legal Context and G5 Link to
health problems and gains (associated to the second and third more important criteria)
and is thus indeed the adequate program to consider for an HIA with an equity focus and
health systems impact concern.
In Table 7 we summarize the analysis of profiles of clusters that include the PNDCV
throughout the groups of variables in our study. Groups of variables are ranked according
to the priority criteria stated in the introduction of this chapter and recapped in the
“Features for being a potential priority for HIA” column. The clusters that include PNDV
seem to agree well with the stated criteria, especially in what concerns the first two
priorities embodied in groups G9 and G5. Hence, clusters with the PNDV seem to be
better placed for selection that other clusters and within these groups the PNDV seems
indeed to be the more adequate for HIA selection than other NPs.

Chapter 3 - Contribution of Hierarchical Cluster Analysis to the Health Impact Assessment Screening Step Sub Chapter 3.2 - Screening National Health Programs for HIA: targeting policies with cluster analysis
Chapter 3 / Sub Chapter 3.2- Page 92/149 Leonor Bacelar Nicolau PhD Thesis
Table 5. Color ranking priorities for HIA of clusters for each variable group and respective priority criterion
Groups of Variables ranked by importance for our research
Features for being a potential priority for HIA
Chosen partition
(number of clusters)
Cluster
1 2 3 4 5 6
G9 Range of regional implementation
Having a regional span as extended and in depth as possible 3 + +- -
G5 Link to health problems and gains
Showing a concern to monitor health gains, health systems needs and effectiveness gains
5 + +- +-
G1 Legal Context Being a high-priority NP according to the National Health Plans 2004-2010 and 2012-2016
4 +- + +-
G3 Products
Having a practice of generating a variety of different products to the health professionals, specific groups of the population and the population in general (guidelines, published information, online presence, events, etc)
4 + +- - -
G8 Characterization % of total specific aims/projects achieved
Considering the monitorization and evaluation of the way the aims are being achieved, including resources allocation
4 + +- - -
G4 Management Listing its planning documents, general aims and linking them to specific aims and/or projects’ aims
4 + +-
G7 General aims, specific aims and associated projects
Presenting an adequate number of aims and projects 6 - +- + -
bold Cluster including PNDCV + High priority + - Medium priority - Low priority Not adequate for comparison: one National Health Program cluster Non-existent: the chosen partition includes a lower number of clusters

Chapter 3 - Contribution of Hierarchical Cluster Analysis to the HIA Screening Step Sub Chapter 3.2 - Screening National Health Programs for HIA: targeting policies with cluster analysis
Leonor Bacelar Nicolau PhD Thesis Chapter 3 / Sub Chapter 3.2- Page 93/149
Table 6. National Programs ranked by priority criterion according to color ranking priorities for HIA of clusters for each variable group of previous table
National Program
G9 Range of regional
implementation
G5 Link to health
problems and gains
G1 Legal Context
G3 Products
G8 Characterization % of total
specific aims/projects
achieved
G4 Management
G7 General aims, specific
aims and associated
projects
PNDCV CL1 CL1 CL2 CL2 CL2 CL2 CL2
PNV CL1 CL1 CL3 CL1 CL1 CL1 CL3
PNPCDO CL1 CL3 CL2 CL1 CL1 CL1 CL3
PNSO CL1 CL2 CL1 CL1 CL1 CL1 CL3
PCO CL1 CL3 CL1 CL2 CL2 CL2 CL2
ASCJR CL1 CL1 CL1 CL1 CL1 CL1 CL1
PNCI CL1 CL1 CL1 CL1 CL1 CL1 CL1
PNIVIH/SIDA CL1 CL2 CL1 CL3 CL1 CL1 CL3
PNPCD CL1 CL2 CL3 CL3 CL1 CL1 CL3
PNSR CL1 CL2 CL3 CL4 CL1 CL3 CL6
PNSE CL1 CL2 CL3 CL3 CL3 CL2 CL2
PNLCT CL1 CL3 CL3 CL3 CL4 CL2 CL2
PNSM CL2 CL1 CL1 CL3 CL1 CL1 CL2
PNCA CL2 CL1 CL3 CL2 CL3 CL1 CL1
PNCP CL2 CL1 CL1 CL3 CL1 CL1 CL6
PNCD CL2 CL1 CL1 CL3 CL3 CL1 CL3
PNPRA CL2 CL1 CL1 CL3 CL4 CL1 CL1
PNEP CL2 CL2 CL3 CL1 CL1 CL1 CL1
PNPCDPOC CL2 CL3 CL1 CL3 CL3 CL1 CL1
PNSV CL2 CL2 CL1 CL3 CL2 CL1 CL1
PNIIDSEV CL2 CL3 CL3 CL3 CL2 CL2 CL1
PNIVCLG CL2 CL3 CL4 CL1 CL1 CL1 CL1
PNSA CL2 CL5 CL1 CL2 CL1 CL2 CL1
PNCDT CL3 CL1 CL2 CL1 CL1 CL1 CL4
PNRPLA CL3 CL2 CL2 CL1 CL3 CL1 CL5
PNCDR CL3 CL3 CL1 CL1 CL1 CL1 CL1
PNPA CL3 CL3 CL1 CL2 CL1 CL1 CL3
PNSPI CL3 CL2 CL1 CL2 CL2 CL1 CL1
PNAS CL3 CL4 CL1 CL4 CL1 CL1 CL1
PNDR CL3 CL2 CL1 CL4 CL1 CL4 CL3
bold PNDCV Potential National Programs for HIA + High priority + - Medium priority - Low priority Not adequate for comparison: one National Program cluster
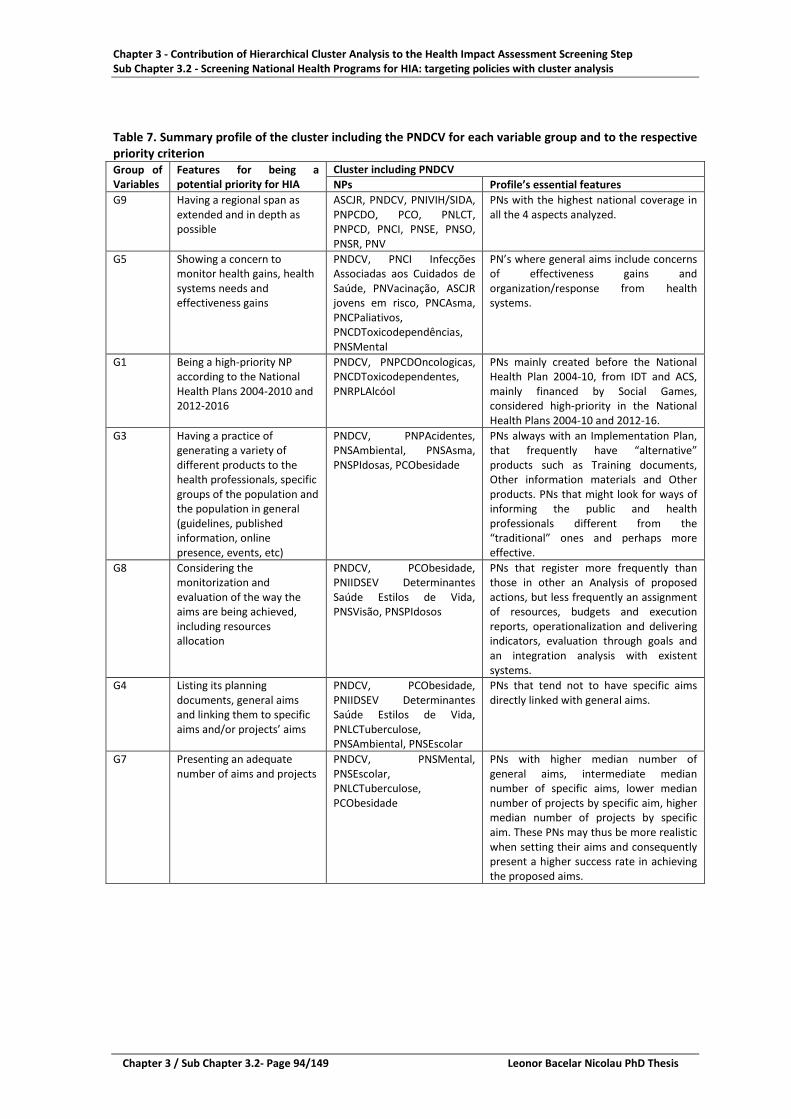
Chapter 3 - Contribution of Hierarchical Cluster Analysis to the Health Impact Assessment Screening Step Sub Chapter 3.2 - Screening National Health Programs for HIA: targeting policies with cluster analysis
Chapter 3 / Sub Chapter 3.2- Page 94/149 Leonor Bacelar Nicolau PhD Thesis
Table 7. Summary profile of the cluster including the PNDCV for each variable group and to the respective priority criterion Group of Variables
Features for being a potential priority for HIA
Cluster including PNDCV NPs Profile’s essential features
G9 Having a regional span as extended and in depth as possible
ASCJR, PNDCV, PNIVIH/SIDA, PNPCDO, PCO, PNLCT, PNPCD, PNCI, PNSE, PNSO, PNSR, PNV
PNs with the highest national coverage in all the 4 aspects analyzed.
G5 Showing a concern to monitor health gains, health systems needs and effectiveness gains
PNDCV, PNCI Infecções Associadas aos Cuidados de Saúde, PNVacinação, ASCJR jovens em risco, PNCAsma, PNCPaliativos, PNCDToxicodependências, PNSMental
PN’s where general aims include concerns of effectiveness gains and organization/response from health systems.
G1 Being a high-priority NP according to the National Health Plans 2004-2010 and 2012-2016
PNDCV, PNPCDOncologicas, PNCDToxicodependentes, PNRPLAlcóol
PNs mainly created before the National Health Plan 2004-10, from IDT and ACS, mainly financed by Social Games, considered high-priority in the National Health Plans 2004-10 and 2012-16.
G3 Having a practice of generating a variety of different products to the health professionals, specific groups of the population and the population in general (guidelines, published information, online presence, events, etc)
PNDCV, PNPAcidentes, PNSAmbiental, PNSAsma, PNSPIdosas, PCObesidade
PNs always with an Implementation Plan, that frequently have “alternative” products such as Training documents, Other information materials and Other products. PNs that might look for ways of informing the public and health professionals different from the “traditional” ones and perhaps more effective.
G8 Considering the monitorization and evaluation of the way the aims are being achieved, including resources allocation
PNDCV, PCObesidade, PNIIDSEV Determinantes Saúde Estilos de Vida, PNSVisão, PNSPIdosos
PNs that register more frequently than those in other an Analysis of proposed actions, but less frequently an assignment of resources, budgets and execution reports, operationalization and delivering indicators, evaluation through goals and an integration analysis with existent systems.
G4 Listing its planning documents, general aims and linking them to specific aims and/or projects’ aims
PNDCV, PCObesidade, PNIIDSEV Determinantes Saúde Estilos de Vida, PNLCTuberculose, PNSAmbiental, PNSEscolar
PNs that tend not to have specific aims directly linked with general aims.
G7 Presenting an adequate number of aims and projects
PNDCV, PNSMental, PNSEscolar, PNLCTuberculose, PCObesidade
PNs with higher median number of general aims, intermediate median number of specific aims, lower median number of projects by specific aim, higher median number of projects by specific aim. These PNs may thus be more realistic when setting their aims and consequently present a higher success rate in achieving the proposed aims.

Chapter 3 - Contribution of Hierarchical Cluster Analysis to the HIA Screening Step Sub Chapter 3.2 - Screening National Health Programs for HIA: targeting policies with cluster analysis
Leonor Bacelar Nicolau PhD Thesis Chapter 3 / Sub Chapter 3.2- Page 95/149
4. Discussion
4.1. Two-steps hierarchical cluster analysis approaches: usefulness
The use of multivariate statistical methods, such as cluster analysis, at the first stage of a
HIA helps filter out NPs that may not be suitable for HIA, identify those more relevant,
and pinpoint possible candidates to be considered for HIA. We propose here to apply
mainly hierarchical cluster analysis to generate swift and reliable results and help the
decision-making process during the screening step of HIA in selecting NPs whose health
impact should be assessed. PCA and MCA methodologies are used complementary to
characterize clusters obtained through hierarchical cluster analysis and ranked them
according to given priorities.
One advantage of these methodologies is to allow for the use of different types of
variables, both quantitative and qualitative, in the search for a single final solution.
This approach has also an advantage of being very visual, using helpful graphic displays
such as dendrograms and PCA and MCA factorial plans, but also facilitating the use of a
color coding scheme that enables an easier choice of NPs candidates for HIA. This may
especially valuable in a HIA context where assessments are made for a decision-making
process ultimately by non-statisticians.
4.2. The importance of the Cerebro-cardiocardiovascular Diseases National Program
Our general aim to screen NPs to pin point the more relevant ones for HIA indicated as a
primary target for HIA the Cerebro-cardiocardiovascular Diseases National Program
(Programa Nacional de Doenças Cerebro-cardiovasculares –PNDCV).
According to WHO Europe, Cardiovascular disease (CVD) causes more than half of all
deaths across the European Region, but 80% of premature heart disease and stroke is
preventable 11.

Chapter 3 - Contribution of Hierarchical Cluster Analysis to the Health Impact Assessment Screening Step Sub Chapter 3.2 - Screening National Health Programs for HIA: targeting policies with cluster analysis
Chapter 3 / Sub Chapter 3.2- Page 96/149 Leonor Bacelar Nicolau PhD Thesis
Eurostat cardiovascular diseases statistics from data extracted in October 2015 show that
cardiovascular diseases are the leading cause of death in the EU 12. In Portugal diseases of
the circulatory system in 2012 account for 30.4% of all deaths, a little below the 34.7%
share for the average EU-28, near rates from Spain (30.2%), below countries such as
Greece, Germany or Italy (respectively 42.6%, 40.2% and 37.5%), but higher than
countries such as UK, Netherlands or France (respectively 28.4%, 27.6% and 25.2%).
A reduction in the number of deaths associated with diseases of the circulatory system
across many EU Member States has been observed. The possible causes for these
changes include increased screening and new surgical procedures, new forms of
medication available (such as statins), as well as lifestyle changes (such as a reduction in
the number of smokers). This indicates that further improvement is still possible,
especially in a context of prevention and health promotion 13. Through HIA health impacts
of various policies and projects, especially in the context of the Cerebro-
cardiocardiovascular Diseases National Program, may help to select those with a higher
impact on health, but also more cost-effective, with a higher return in terms of health
value.
HIA thus may benefit from certain complementary features of Health Technologies
Assessment 14, for example, to quantify health benefits and improve cost effectiveness of
policies and projects. Being able to measure the return on health investment of public
policies and projects is increasingly becoming an important aspect for decision makers.
For instance, in 2013 a total of 11.1 million in-patients with diseases of the circulatory
system were discharged from hospitals across the EU. Diseases of the circulatory system
thus represent a substantial burden on healthcare systems and government budgets,
which is crucial especially in countries with public financed national health services.
Moreover, age, gender, regional and socio-economic differences, among other health
determinants that characterize those who suffer from these diseases, also emphasizes
important equity issues that concern so much HIA.
All these aspects thus make a case for the use of HIA regarding actions, projects and
policies concerning the Cerebro-cardiocardiovascular Diseases National Program. The
selection of this NP, through our multivariate statistical methodologies, in the screening
step of HIA, is hence backed up by evidence. Furthermore, this reality is patent both in

Chapter 3 - Contribution of Hierarchical Cluster Analysis to the HIA Screening Step Sub Chapter 3.2 - Screening National Health Programs for HIA: targeting policies with cluster analysis
Leonor Bacelar Nicolau PhD Thesis Chapter 3 / Sub Chapter 3.2- Page 97/149
Portugal and in other European countries where the burden of these chronicle diseases is
also high. This means these methodologies may also be used in other countries and
regions.
4.3. Limitations and future paths of research
Our study shows how the use of multivariate statistical methods, such as cluster analysis,
may be useful at the screening step of a HIA. Its limitations also set us a few potential
future paths for research.
In reality, the color-code scheme which was the basis of ranking clusters is obtained
considering a particular set of priority criteria within each variable group. However, if a
different priority rank for features to be a NP candidate for HIA exists, the color code may
easily be adapted.
Similarly, the ranking of NP’s according to the proposed color scheme is also based on a
particular set of priorities given to the variable groups. Nevertheless, for another
decision-makers’ priority criteria, it is easy to simulate a different scenario.
The decision-making process may thus be helped not only by finding one final, more
adequate solution, but also to allow for choosing among several possible solutions.
Although multivariate statistical methodologies may be complex, decision-makers may
thus have more information, reliably, and not necessarily in a more difficult way to grasp.
The inclusion of other variable groups, representing other areas of characteristics of NPs,
such as more refined health and effectiveness gains information for example, is also very
simple. One has only to apply hierarchical cluster analysis to the new set of variables and
give the new area a priority relatively to the already available featured groups. This
means there is no real technical limit as to the number of variables one may work with.
Still, one may wish to cluster NPs according to a single set of variables and not various
groups of variables like it was done here, or even using complex variables (distributions of
values associated to a variable and not a single value, for instance). Hierarchical cluster
analysis based on the affinity coefficient as proximity measure, for example, may be used
with a heterogeneous dataset (variables of different types, such as nominal, discrete or

Chapter 3 - Contribution of Hierarchical Cluster Analysis to the Health Impact Assessment Screening Step Sub Chapter 3.2 - Screening National Health Programs for HIA: targeting policies with cluster analysis
Chapter 3 / Sub Chapter 3.2- Page 98/149 Leonor Bacelar Nicolau PhD Thesis
interval), in a two or three-way context 15,16. This will also be a future path for our
research.
5. Conclusions
This research helped us screen and prioritize national programs, electing the Cerebro-
Cardiovascular Disease National Program as the foremost candidate for HIA.
It is important that each step of HIA methodologies in the context of policies becomes
increasingly quantified and multivariate, but in a way clear for decision makers to
understand. Generating graphic outputs that help even non-statisticians to grasp results
may truly help the decision-making process in becoming more evidence-based.
This research aids screening and prioritizing policies quickly and reliably, using
multivariate statistical methods to depict a multivariate reality, but enabling scenario
analysis by easily re-ranking clusters to distinct priority criteria and potential action areas.
These methodologies may also be applied to other forms of impact assessments and in
other countries.
Applying multivariate statistical methods such as hierarchical cluster analysis as early as
the screening step in HIA may be very helpful towards obtaining evidence based, reliable,
participatory, flexible and more efficient ways of selecting policies that should be the
object of HIA.

Chapter 3 - Contribution of Hierarchical Cluster Analysis to the HIA Screening Step Sub Chapter 3.2 - Screening National Health Programs for HIA: targeting policies with cluster analysis
Leonor Bacelar Nicolau PhD Thesis Chapter 3 / Sub Chapter 3.2- Page 99/149
References
1. Ministério da Saúde. National Health Plan 2012-2016, 2013. 2. Ministério da Saúde de Portugal. Plano Nacional de Saúde: Orientações Estratégicas para 2004-2010, 2004. 3. World Health Organization. WHO Evaluation of the National Health Plan of Portugal (2004-2010), 2010. 4. Kemm J, editor. Health Impact Assessment: Past Achievements, Current Understanding and Future Progress: Oxford University Press; 2013. 5. Metcalfe O, Higgins C, Lavin T. Health Impact Assessment Guidance: Institute of Public Health in Ireland; 2009. 6. Hebert KA, Wendel AM, Kennedy SK, Dannenberg AL. Health impact assessment: A comparison of 45 local, national, and international guidelines. Environmental Impact Assessment Review 2012; 34: 74-82. 7. UCLA Health Impact Assessment Project. HIA-CLIC website - Phases of HIA 1.Screening. http://www.hiaguide.org/methods-resources/methods/phases-hia-1-screening (accessed 4/27/2016). 8. Saporta G. Probabilités, Analyse des Données et Statistique. 3e édition ed: Éditions Technip; 2011. 9. Hair JF, Black B, Babin B, Anderson RE, Tatham RL. Multivariate Data Analysis. 6th ed: Prentice Hall; 2006. 10. Daniel WW. Biostatistics – A Foundation for Analysis in the Health Sciences. 9th ed: John Wiley&Sons; 2009. 11. WHO Regional Office for Europe. Cardiovascular diseases: Data and statistics. 2016. http://www.euro.who.int/en/health-topics/noncommunicable-diseases/cardiovascular-diseases/data-and-statistics (accessed 5/26/2016). 12. Eurostat. Cardiovascular diseases statistics. 10/1/2016. http://ec.europa.eu/eurostat/statistics-explained/index.php/Cardiovascular_diseases_statistics (accessed 6/25/2016). 13. Piepoli MF, Hoes AW, Agewall S, Albus C, Brotons C, Catapano AL, Cooney MT, Corra U, Cosyns B, Deaton C, Graham I, Hall MS, Hobbs FD, Lochen ML, Lollgen H, Marques-Vidal P, Perk J, Prescott E, Redon J, Richter DJ, Sattar N, Smulders Y, Tiberi M, van der Worp HB, van Dis I, Verschuren WM, Authors/Task Force M. 2016 European Guidelines on cardiovascular disease prevention in clinical practice: The Sixth Joint Task Force of the European Society of Cardiology and Other Societies on Cardiovascular Disease Prevention in Clinical Practice (constituted by representatives of 10 societies and by invited experts)Developed with the special contribution of the European Association for Cardiovascular Prevention & Rehabilitation (EACPR). Eur Heart J 2016; 37(29): 2315-81. 14. Lobo M, Fernandes E, Nisa C, Bacelar-Nicolau L. Main results and lessons to be learned from the CUTEheart project. 2nd CUTEheart Workshop on Health Technology Assessment in Cardiovascular Disease, in Congresso Português de Cardiologia; 4/23/2016; Vilamoura, Portugal; 2016. 15. Bacelar-Nicolau H, Nicolau F, Sousa A, Bacelar-Nicolau L. Measuring Similarity of Complex and Heterogeneous Data in Clustering of Large Data Sets. Biocybernetics and Biomedical Engineering 2009; 29(2): 9-18. 16. Bacelar-Nicolau L. Caracterização dos Sistemas de Informação das Organizações com base no modelo de Nolan. Aplicação de modelos de classificação hierárquica aos organismos da Administração Pública: NOVA IMS Information Management School (formerly Institute of Statistics and Information Management ISEGI - Universidade Nova de Lisboa); 2002.

Chapter 3 - Contribution of Hierarchical Cluster Analysis to the Health Impact Assessment Screening Step Sub Chapter 3.2 - Screening National Health Programs for HIA: targeting policies with cluster analysis
Chapter 3 / Sub Chapter 3.2- Page 100/149 Leonor Bacelar Nicolau PhD Thesis

Leonor Bacelar Nicolau PhD Thesis Chapter 4 - Page 101/149
Chapter 4 – Picturing Inequities for Health Impact Assessment: Linked Electronic Records, Mortality and Regional Disparities in Portugal *
CONTENTS General information on the paper ................................................................................................... 102 Abstract ........................................................................................................................................... 103 Introduction ................................................................................................................................... 104 Context ............................................................................................................................................. 104 Aims .............................................................................................................................................. 106 Strategy ............................................................................................................................................ 106 Materials and methods ................................................................................................................... 108 Data .............................................................................................................................................. 108 Statistical Methodologies ................................................................................................................. 109
Results ........................................................................................................................................ 110 Associating regions to health indicator registration ........................................................................ 110 Associating health indicator registration and mortality by region ................................................... 113
Discussion ....................................................................................................................................... 119 Implications of Electronic Health Records policies applied unevenly throughout the regions ........ 119 Links between Electronic Health Records and quality of healthcare ............................................... 121 Electronic Health Records for disease prevention, health promotion and sustainability ................ 122 Electronic Health Records and Acute Myocardial Infarction ........................................................... 123 Challenges of Big Data and complexity in methods but simplicity in visualization .......................... 124 Conceptual Path associating Policy and Health allowing for Equity ................................................ 125 HIA and the Future of Health Reforms ............................................................................................. 127 Limitations and future paths for research ....................................................................................... 128
Conclusions ..................................................................................................................................... 130
References ...................................................................................................................................... 131
* This chapter has been accepted for publication as: Bacelar-Nicolau L, Rodrigues T, Fernandes E, et al. Picturing Inequities for Health Impact Assessment: Linked Electronic Records, Mortality and Regional Disparities in Portugal. Impact Assessment and Project Appraisal 2017. [http://www.tandfonline.com/toc/tiap20/current] This chapter has thus different titles and references formats than other thesis chapters.
Chapter 4 – Picturing Inequities for HIA: Linked Electronic Records, Mortality and Regional Disparities in Portugal
Chapter 4 - Page 102/149 Leonor Bacelar Nicolau PhD Thesis
GENERAL INFORMATION ON THE PAPER TITLE: Picturing Inequities for Health Impact Assessment: Linked Electronic Records, Mortality and Regional Disparities in Portugal Keywords: Equity Quantification Decision-making Big Data Data Science Acute Myocardial Infarction Authors: First Author: Leonor Bacelar-Nicolau Co-Authors: Teresa Rodrigues, Faculty of Medicine, University of Lisbon, Portugal Elisabete Fernandes, Institute of Preventive Medicine and Public Health, Faculty of Medicine, University of Lisbon, Portugal Mariana Lobo, Center for Health Technology and Services Research (CINTESIS) & Faculty of Medicine, University of Porto, Portugal Cláudia Fernandes Nisa, Center for Health Technology and Services Research (CINTESIS) & Faculty of Medicine, University of Porto, Portugal Vanessa Azzone, Department of Health Care Policy, Harvard Medical School, USA Armando Teixeira-Pinto, School of Public Health, The University of Sydney, Australia; Altamiro Costa-Pereira, Center for Health Technology and Services Research (CINTESIS) & Faculty of Medicine, University of Porto, Portugal Sharon-Lise Teresa Normand, Department of Health Care Policy, Harvard Medical School, USA José Pereira Miguel, Institute of Preventive Medicine and Public Health & ISAMB – Institute of Environmental Health, Faculty of Medicine, University of Lisbon, Portugal Acknowledgements: Authors thank SPMS (Serviços Partilhados do Ministério da Saúde) and ACSS (Administração Central do Sistema de Saúde) for having made available the data used in our research and especially SPMS’ President Henrique Martins for his invaluable support. This work was partially supported by the CUTEHeart Project – Comparative Use of Technologies for Coronary Heart Disease, funded by FCT, QREN, COMPETE under Grant HMSP-ICT/0013/2011 (http://cuteheart.med.up.pt).

Chapter 4 – Picturing Inequities for HIA: Linked Electronic Records, Mortality and Regional Disparities in Portugal
Leonor Bacelar Nicolau PhD Thesis Chapter 4 - Page 103/149
ABSTRACT:
Health Impact Assessment (HIA) focuses on minimizing inequities when studying the
effects of a policy on the population’s health. Nevertheless, it is seldom simultaneously
quantified, multivariate and visually graphically comprehensible for non-statisticians.
This paper aims to address that gap, assessing a policy promoting the quality of Electronic
Health Records, linking hospital and primary healthcare data (Blood Pressure, Cholesterol,
Triglycerides, Waist Circumference, Body Mass Index) to mortality outcomes and regional
inequities. Acute Myocardial Infarction patients admitted in the hospital are then
followed regularly in Portuguese NHS Primary Care.
Regional disparities regarding recorded information are observed and different
association patterns with mortality identified, ranked and visualized through adjusted ORs
for sex, age and indicators of severity of hospital admission, complemented with
multivariate correspondence analysis.
A pathway to handling equity within quantitative HIA shows that complexity in data and
methods may generate simplicity and clarity through visual graphical aids. Tackling Big
Data with Data Science in HIA may even be at the center of future health reforms,
assessing impacts of health promotion and chronic disease policies.

Chapter 4 – Picturing Inequities for HIA: Linked Electronic Records, Mortality and Regional Disparities in Portugal
Chapter 4 - Page 104/149 Leonor Bacelar Nicolau PhD Thesis
Introduction
Context
Health Impact Assessment (HIA) was earlier defined as a “combination of procedures,
methods and tools by which a policy, program or project may be judged as to its potential
effects on the health of a population and the distribution of effects within the
population” (European Centre for Health Policy, 1999). The International Association for
Impact Assessment (IAIA) added that “HIA identifies appropriate action to manage those
effects’ (i.e. the effects on health and distribution of health)” (Quigley et al. 2006).
HIA thus identifies paths between a policy, program or project and positive and negative
externalities induced on health determinants (individual, social and environmental
factors, including institutional factors), estimating its unintended, often unexpected,
health outcomes. It is at its core a decision support tool, to inform and influence decision
makers into improving a proposal for health and equity, maximizing positive health
impacts and minimizing negative ones throughout a population (Kemm 2013; Quigley et
al. 2006).
HIA is regularly being used in many countries such as the UK, the Netherlands, Australia,
New Zealand, Thailand, the USA and others, more often with a qualitative emphasis
(Kemm 2013; World Health Organization 2015). Quantifying health estimations within HIA
was however very early in HIA history identified as potentially more informative and
influential with decision-makers (Kemm 2013; Mindell et al. 2001), complementing
qualitative analyses to achieve more robust, evidence-based and whole estimations of
health impacts that would include the nature of these impacts, as well as their direction,
magnitude and distribution.
Nevertheless, it has been recognized that quantification within HIA is rarely done, since it
“is often hard or impossible” because of a lack of information regarding initial conditions,
effects of the proposal, and the theoretical framework linking conditions to health
outcomes (Kemm 2013).
Generally, two different approaches to HIA quantification have been followed, one based
on health economic evaluation and another on risk assessment (Fehr et al. 2012).

Chapter 4 – Picturing Inequities for HIA: Linked Electronic Records, Mortality and Regional Disparities in Portugal
Leonor Bacelar Nicolau PhD Thesis Chapter 4 - Page 105/149
Quantified HIA based on health economic evaluation relies on health technology
assessment methods, estimating indirect costs and health-related quality of life indicators
(Brodin and Hodge 2008) and dealing with equity for instance by applying weights to
account for inequalities when calculating health gains or by estimating health benefits
separately by relevant population sub-groups (Glover and Henderson 2010). The HIA
quantification based on risk assessment is grounded in environmental and public health
research experience of estimating risk exposure, frequently relying on epidemiology
modelling (Fehr et al. 2012; Kemm 2013). Other HIA related quantification experiences
include profiling individuals, screening policies (Bacelar-Nicolau, Pereira Miguel, and
Saporta 2008; Bacelar-Nicolau, Pereira Miguel, and Saporta 2015a; Bacelar-Nicolau,
Pereira Miguel, and Saporta 2015b) and evaluating HIA effectiveness (Haigh et al. 2015;
Harris-Roxas et al. 2012; Harris-Roxas et al. 2014).
An assortment of computational tools for HIA quantification has been made available:
some more generic, others more specific to certain determinants or diseases; some more
related to environmental health risk assessments, others more in tune with public health
risk factor-outcome modelling; most not very user-friendly without support from the
original developers. Further tool development is no longer considered a priority, but
improvements are needed regarding two aspects: its application in various real-life
contexts and especially in “whether and how they estimate impacts on health
inequalities” (Fehr et al. 2012; Fehr et al. 2016).
The fact is that HIA still quite seldom uses multivariate statistical methods to estimate
health impacts while taking equity into account and providing easy to understand visual
outputs (Veerman, Barendregt, and Mackenbach 2005).
Among the difficulties, a major one is to find available and reliable data to model
interrelations, explicitly between health determinants, health impacts, policies and
related costs (Fehr et al. 2012; Fehr et al. 2016; Harris-Roxas et al. 2012). Another barrier
is that complex statistical methodologies used frequently generate results difficult to
understand by non-statisticians, including decision-makers (Fehr et al. 2012).
Our approach focuses precisely on how to overcome these difficulties and improve
quantified HIA by showing how one may take into account equity while applying

Chapter 4 – Picturing Inequities for HIA: Linked Electronic Records, Mortality and Regional Disparities in Portugal
Chapter 4 - Page 106/149 Leonor Bacelar Nicolau PhD Thesis
multivariate methodologies usually used in a data mining, big data context: complex but
with clear graphical representations of results.
We were given access to a database linking several data origins – data source SPMS/ACSS
(Serviços Partilhados do Ministério da Saúde/Administração Central do Sistema de Saúde)
– as a pilot project to investigate how enriching it could be to have information on
individual patients linking data from the Portuguese National Health Service regarding
hospital admissions data, primary care data, pharmaceutical drugs consumption and
prescription, as well as the mortality registry. As far as we know, it was the first time
researchers in Portugal were able to get this kind of data and various procedures had to
be taken to safeguard the anonymity of patients and their rights.
Aims
Our aims in this paper are:
1. To show how to identify and visualize regional disparities in a quantified way when
applying an Electronic Health Records policy targeted for HIA;
2. To study associations between mortality of Acute Myocardial Infarction patients
and an Electronic Health Records policy targeted for HIA, while identifying
potential regional inequities, in a multivariate yet simple way to visualize;
3. To propose a conceptual quantitative path of analysis for HIA to study associations
between equity, health impacts and policies, based on Data Science and Data
Mining methods applied in a Big Data context.
Strategy
To put our strategy into practice, we take:
• As sample, all adults admitted to hospitals for acute myocardial infarction (AMI)
during the second semester of 2012, followed regularly in primary care (PC)
during 2013, always within the National Health Service (NHS) in Portugal;
• As a policy targeted for HIA, an Electronic Health Records (EHR) program to
promote registration of information at PC level regarding the indicators Blood

Chapter 4 – Picturing Inequities for HIA: Linked Electronic Records, Mortality and Regional Disparities in Portugal
Leonor Bacelar Nicolau PhD Thesis Chapter 4 - Page 107/149
Pressure, Cholesterol, Triglycerides, Waist Circumference and Body Mass Index
(BMI);
• As health impact of interest, the mortality status at the end of the period of
study, running from after hospital admission during the 2nd semester of 2012 until
December 31 2013;
• As equity aspect under scrutiny, regional disparities in Portugal, since not assuring
an adequate application of the policy throughout all 5 health regions of residence
(Norte, Centro, LVT-Lisboa e Vale do Tejo, Alentejo and Algarve) may contribute
to regional health inequities.
To reach our first aim, we start by identifying associations between the EHR policy and
regions: regions are ranked according to the strength of their association with
information registered and then these associations are visualized graphically to ease
interpretation.
To attain our second aim, associations between information registration and mortality are
assessed within each region; regions are then ordered by the strength of these
associations, and these connections are finally visualized graphically to simplify
interpretation.
Lastly, to reach our third aim, inspired on the path followed in our case study regarding
goals above, a conceptual framework is proposed to analyze associations between
policies and health impacts while considering equity, in a quantified multivariate way,
when undertaking HIA.

Chapter 4 – Picturing Inequities for HIA: Linked Electronic Records, Mortality and Regional Disparities in Portugal
Chapter 4 - Page 108/149 Leonor Bacelar Nicolau PhD Thesis
Materials and methods
Data
Data consists of information on all adults (≥20 years old) admitted in Portuguese NHS
Hospitals with AMI diagnosis during the second semester of 2012 and followed in the NHS
PC network regularly during 2013 (over 2 quarters with appointments with a general
practitioner) – data source SPMS/ACSS (Serviços Partilhados do Ministério da
Saúde/Administração Central do Sistema de Saúde). Patients with no resuscitation or with
only comfort measures information or who were discharged against medical opinion were
excluded. A total of 3,776 cases were considered for analysis.
Variables for analysis included:
• Mortality outcome under study: being deceased or not at December 31 2013;
• Four indicators regarding having information registered or not: Blood Pressure,
Cholesterol, Triglycerides, Waist Circumference, Body Mass Index (BMI). BMI was
either existent in the database or was calculated whenever values for weight and
height were both available;
• Five health regions of residence: Norte, Centro, LVT, Alentejo and Algarve;
• Demographic variables: sex and age;
• Four hospital admission severity variables: having one or more hospital
readmissions during the second semester of 2012 also for AMI diagnosis, having
undertaken surgery during hospital admission, having mean admission duration
over 6 days, having 6 or more diagnosis associated with hospital admission.
Note that the inclusion criterion of being followed in the NHS PC network regularly during
2013, guarantying that each patient has at least 3 quarters with appointments with a
general practitioner, means assuring that each patient has had the same opportunity of
having information registered about their condition. Any patient within the study has
accordingly had appointments with a general practitioner, even if he or she has died
during the follow-up period of 2013.

Chapter 4 – Picturing Inequities for HIA: Linked Electronic Records, Mortality and Regional Disparities in Portugal
Leonor Bacelar Nicolau PhD Thesis Chapter 4 - Page 109/149
Statistical Methodologies
Statistical methodologies differ depending on the stage of the study undertaken. In the
first stage, associations between registering or not registering indicators (Blood Pressure,
Cholesterol, Triglycerides, Waist Circumference, BMI) and regions (Norte, Centro, LVT,
Alentejo and Algarve) were regarded, and in the second stage associations between
mortality and registering or not registering indicators stratified by region were
considered.
At each stage, a bivariate approach was first undertaken with contingency tables,
independence Chi-Square or Fisher exact tests (Daniel 2009), followed by a multivariate
approach based on logistic regression with Odds Ratios (Kleinbaum and Klein 2010), crude
and adjusted after controlling for sex, age and sex and age interaction. In the first stage
overall and adjusted OR were also calculated controlling for region. Results presented in
this paper mainly focus on models with Algarve as reference region, although models
with other regions as references were estimated to identify significant differences
between regions. In the second stage, logistic models were additionally adjusted for
hospital admission severity indicators and stratified by region.
Finally, multivariate exploratory data analysis methods were used, specifically principal
components analysis over the OR table (indicators versus regions – SOM Table 4) in the
first stage and multivariate correspondence analysis over the initial database (Hair et al.
2006; Saporta 2011).
Statistical analyses were generally conducted with IBM-SPSS version 22 software. A
significance level of 5% was used whenever statistical tests were applied.
Further detailed information on statistical analyses undertaken and results obtained may
be found in Supplemental Online Material (SOM).

Chapter 4 – Picturing Inequities for HIA: Linked Electronic Records, Mortality and Regional Disparities in Portugal
Chapter 4 - Page 110/149 Leonor Bacelar Nicolau PhD Thesis
Results
Associating regions to health indicator registration
In this first stage, with our first aim in mind, we start by studying associations between
regions and the registration or not of certain health indicators.
Bivariate analyses show that registering information on each indicator at PC level is not
uniform throughout all health regions of residence of patients under study (SOM Table 1
and Figure 6). Algarve, closely followed by LVT, is the region with the highest percentage
of no-registration for every indicator in the study. Norte, usually followed by Algarve, is
the region with the lowest percentage of no-registration for every indicator. Centro
usually appears between values of these 2 subgroups. Blood Pressure presents the
highest registration rates, and inversely Waist Circumference displays the highest no-
registration rates.
Adjusted logistic regression models show Norte with the strongest association with
registration for all health indicators and significantly different from all other regions,
excepting Alentejo for Blood Pressure and Triglycerides (Figure 1 and SOM Tables 2 and
3). Norte displays adjusted OR always above 2, being thus more than twice as likely to
have values registered than Algarve (the reference region, usually with worse registration
rates regarding the indicators under study). The minimum Norte OR of 2.7 for
Triglycerides is always higher to the maximum OR of all other regions for all other
indicators. Norte mostly differs from other regions regarding Waist Circumference
registration.
Alentejo and Centro usually follow Norte as the most associated with registration and are
only significantly different from each other for Blood Pressure, for which Alentejo draws
up to Norte. Alentejo is usually always a little more associated with registration than
Centro and is only overcome by Centro for Waist Circumference, although not enough to
be statistically significant. Alentejo records OR over 2 for all indicators but BMI, which

Chapter 4 – Picturing Inequities for HIA: Linked Electronic Records, Mortality and Regional Disparities in Portugal
Leonor Bacelar Nicolau PhD Thesis Chapter 4 - Page 111/149
displays a lower value, whereas Centro only presents an OR over 2 for Waist
Circumference.
LVT and Algarve are the regions less associated with registration, LVT presenting OR
always below 2 for all indicators. LVT is only significantly different from Algarve for Blood
Pressure, although with a small OR of 1.370 (Figure 1 and SOM Tables 2 and 3).
When comparing indicators over the various regions (Figure 1 and SOM Table 2), Waist
Circumference performs better in Norte and Centro, while other indicators do not
perform very differently over various regions. Nevertheless, Blood Pressure still tends to
present higher OR and BMI often appears with worse performance than other indicators,
namely in Centro and Alentejo.
Figure 1. Association between registration of each health indicator and health regions of residence - adjusted OR (1,2)
Within each region, patterns of registration for indicators may in reality not differ very
much, since 95% Confidence Intervals (CI95%) overlap (SOM Tables 2 and 3 and Figure 7).
Disparities become clearer when comparing CI95% for OR between regions. (SOM Figure
8). Thus CI95% related with every indicator for Norte and LVT never overlap, which means
Norte is clearly very different both from LVT and Algarve. LVT presents the smallest CI95%

Chapter 4 – Picturing Inequities for HIA: Linked Electronic Records, Mortality and Regional Disparities in Portugal
Chapter 4 - Page 112/149 Leonor Bacelar Nicolau PhD Thesis
range for all indicators, which may be associated with a more uniform practice of
registering information. Waist Circumference displays the highest CI95% range, which
may be related to its higher percentages of no registration of information (percentages of
no registration between 74% of Norte and more than 92% of LVT, against values always
below 56% for Norte and below 78% for other regions).
Adjusted OR results (SOM Table 4) are then taken as input data for Principal Components
Analysis which summarizes previous findings, again in a very visual way.
The first principal component responsible for almost all variability contained within data
(94%) represents a size effect axis of registration of information, with all indicator
variables placed in the far right of the factorial plan (Figure 2).
Figure 2. Principal Components Analysis Factorial Plans 1-2 based on Registered Indicators and
Regions OR
Regions towards the right in the factorial plan will then be associated with higher rates of
registered information regarding all these indicator variables. Inversely, regions towards

Chapter 4 – Picturing Inequities for HIA: Linked Electronic Records, Mortality and Regional Disparities in Portugal
Leonor Bacelar Nicolau PhD Thesis Chapter 4 - Page 113/149
the left in the factorial plan will be associated with lower rates of registered information
concerning the indicator variables. One may hence rank regions from the most effective
registering information, at the far right side of the factorial plan, to the least effective, at
the left end side. Sequentially, one visually ranks Norte (unmistakably detached towards
the right), Alentejo, Centro and then LVT and Algarve.
Stage 1 results clearly indicate there are indeed differences among regions concerning
patterns of registration of health indicators under study, confirming the relevancy of
proceeding with Stage 2.
Associating health indicator registration and mortality by region
Since a relevant association is found between recording information on health indicator
policy and the equity aspect under study in stage 1, now with our second research aim in
mind, we go onward to study associations between mortality and registration of the
various health indicators within each region.
When taking the sample as a whole, the initial bivariate approach identifies statistically
significant results associating outcome mortality as of December 31 2013 and having
information registered at PC level for each of the indicators - Blood Pressure, Cholesterol,
Triglycerides, Waist Circumference and BMI (SOM Tables 5 to 9). Deceased patients
always present higher rates of no information registered: 53% of deceased patients do
not have Blood Pressure recorded (versus 34% of patients alive at the end of follow-up),
84% BMI recorded (versus 63%), 91% Triglycerides recorded (versus 65%), 89%
Cholesterol recorded (versus 65%) and 92% Waist Circumference recorded (versus 83%).
Note that all patients studied, deceased or not, had several general practitioner
appointments within the follow-up period and so have had an opportunity of having
information recorded.
When considering each region separately, deceased patients also always present higher
rates of no information registered for all health indicators (SOM Tables 5 to 9). For some

Chapter 4 – Picturing Inequities for HIA: Linked Electronic Records, Mortality and Regional Disparities in Portugal
Chapter 4 - Page 114/149 Leonor Bacelar Nicolau PhD Thesis
regions and indicators, this pattern is not statistically significant since the observed
information is not enough to identify differences, even if they exist, essentially because of
small sample sizes for certain categories. In Norte, deceased patients always present a
statistically significant higher percentage of no registration for all health indicators. In
Centro and LVT the same happens, with the exception of Waist Circumference (SOM
Table 8). In Alentejo, deceased patients present significantly higher percentages of no
registration for Waist Circumference and BMI (SOM Tables 8 and 9, respectively). Finally,
in Algarve deceased patients present a significantly higher percentage of no registration
for Triglycerides (SOM Table 7).
When considering overall models without regional stratification, estimated OR with and
without adjustments for age, sex and severity indicators seem quite similar (SOM Tables
10 to 14). Hence, these adjustment variables do not appear very relevant when studying
overall associations between mortality and registration.
Additionally, all these OR obtained without regional stratification are statistically
significant and always above a 2.00 threshold. That means that globally patients without
registered information are at least twice as likely to be deceased than patients with
information registered.
The lowest values of OR are generally observed for Blood Pressure (between 2.149
regarding the setup adjusted for Sex, Age and Sex*Age to 2.417 concerning the setup
controlled for Sex, Age, Sex*Age, the 4 admission severity indicators and region – SOM
Table 10). The highest values of OR are generally observed for Triglycerides (between
4.926 regarding the setup adjusted for Sex, Age and Sex*Age to 5.905 concerning the
setup controlled only for Region – SOM Table 12). Limits of CI95% generally follow these
trends of OR, with a minimum of 1.376 of the CI95% (observed in the setup regarding
Waist Circumference controlled for Sex, Age and Sex*Age – SOM Table 13) and a
maximum of 9.062 (detected in the setup associated with Triglycerides controlled for
Region – SOM Table 12).

Chapter 4 – Picturing Inequities for HIA: Linked Electronic Records, Mortality and Regional Disparities in Portugal
Leonor Bacelar Nicolau PhD Thesis Chapter 4 - Page 115/149
Stratified setups, however, display quite a few differences between regions and
indicators, whether considering or not adjustments by age, sex, interaction age*sex and
hospital severity indicators (SOM Tables 10 to 14), showing the importance of controlling
for these aspects. Consequently, stratified adjusted setups will henceforth be the focus of
our analysis.
All computed associations between mortality and no registration for all indicators are
strong, the lowest OR being found for Blood Pressure in LVT and Alentejo (1.932 and
1.773, respectively) - (Figure 3). This means that, at its lowest, AMI patients with no Blood
Pressure registered in Alentejo are about 1.8 times more likely to be deceased than
patients with information registered.
Figure 3. Association between mortality and registration of each health indicator stratified by health region of residence - adjusted OR (1,2,3)

Chapter 4 – Picturing Inequities for HIA: Linked Electronic Records, Mortality and Regional Disparities in Portugal
Chapter 4 - Page 116/149 Leonor Bacelar Nicolau PhD Thesis
Norte sets off as having the highest OR for Cholesterol and Triglycerides (both above 13).
This means that patients without registered information for Cholesterol and Triglycerides
in Norte are about over 13 times more likely to be deceased than patients with
information registered. Norte also displays strong associations between mortality and no
registration for Blood Pressure and BMI (OR between 3 and 4).
Alentejo stands out concerning BMI, with an OR near 7, followed by Triglycerides and
Cholesterol with lower OR between 2 and 3.
Centro presents’ high OR values, especially regarding Triglycerides and Cholesterol (4.409
and 3.173, respectively), followed by BMI, Waist Circumference and Blood Pressure with
lower OR between 2 and 3.
The highest association between mortality and no registration in LVT concerns
Triglycerides (OR of 3.467). Most OR values in LVT are observed between 2.3 and 2.5,
concerning BMI, Cholesterol and Waist Circumference.
Algarve only displays information for BMI and Blood Pressure at quite high levels of
association (3.835 and 2.945, respectively).
As regards to the precision of the estimated OR, CI95% within each region always
overlaps (SOM Tables 10 to 14 and SOM Figures 9 and 10), but there are certainly
differences regarding regions, especially in what concerns the range of CI95%. Lack of
information, due essentially to small sample sizes, observed in certain regions and
indicators, does not always make possible computing reliable CI95% and in some cases
creates asymmetries regarding the higher limit of intervals. Therefore, only the lower
limit and its distance to the 1 threshold will be analyzed, especially in what concerns
Algarve for Blood pressure and BMI, Alentejo for BMI and Norte for Cholesterol and
Triglycerides. When comparing CI95% for OR within each indicator (SOM Figure 9), one
may observe that lower limits for Norte are more distant from value 1 than all other
regions for all indicators, with the exception of Waist circumference (lower limit of 1.076,
while all others for Norte are above 1.9). Algarve has a much wider CI95% than other
regions. For Cholesterol and Triglycerides it is Norte that stands out and for BMI Alentejo
and Algarve. When comparing CI95% for OR within each region (SOM Figure 10), Norte

Chapter 4 – Picturing Inequities for HIA: Linked Electronic Records, Mortality and Regional Disparities in Portugal
Leonor Bacelar Nicolau PhD Thesis Chapter 4 - Page 117/149
presents quite narrow intervals, apart from the ones already mentioned for Cholesterol
and Triglycerides. Alentejo presents a very wide CI95% for BMI, but quite narrow for the
other indicators. Centro and LVT are quite stable in the precision of CI95% for all
indicators, perhaps slightly wider for Triglycerides. Algarve has quite wide IC95% for Blood
pressure and BMI, the only indicators with available OR in this region.
Finally, Multiple Correspondence Analysis (MCA) is used complementarily to help
summarize findings, especially taking advantage of its rich visual graphical aids (Figure 4).
MCA identifies 2 main dimensions of variability within the data: a health indicator
registration dimension and a demographic/hospital admission characterization
dimension.
Dimension 1 represented on the horizontal axis of the factorial plan is a dimension of
indicator registration. Categories towards the right in the plan are more related to no
registration, while categories towards the left are more concerned with registration. In
the registration quadrants of the plan, one also finds Norte, while in the non-registration
quadrants, one finds Algarve and LVT. Alentejo and especially Centro position themselves
within a neutral area, near the origin.
Dimension 2 represented in the vertical axis of the factorial plan concerns characteristics
used as adjustment variables when calculating OR previously, namely Age, Sex and the 4
hospital admission severity indicators (having one or more hospital readmissions during
the second semester of 2012, having undertaken surgery during hospital admission,
having a mean admission duration over 6 days, having a hospital admission with 6 or
more diagnosis associated). In the upper quadrants, one often finds patients that are
female, older (more than 70 years old), longer admissions (more than 7 days), with no
surgery during admission, and with more than 5 diagnoses. In the lower quadrants, one
finds patients that are frequently male, younger (70 years or less), with 5 or fewer
diagnoses, have undertaken surgery, with readmissions, and with shorter admissions (7
days or less).
The deceased outcome is displayed in the right upper quadrant, thus associated, on the
one hand, with no registration of indicators and, on the other hand and understandably,
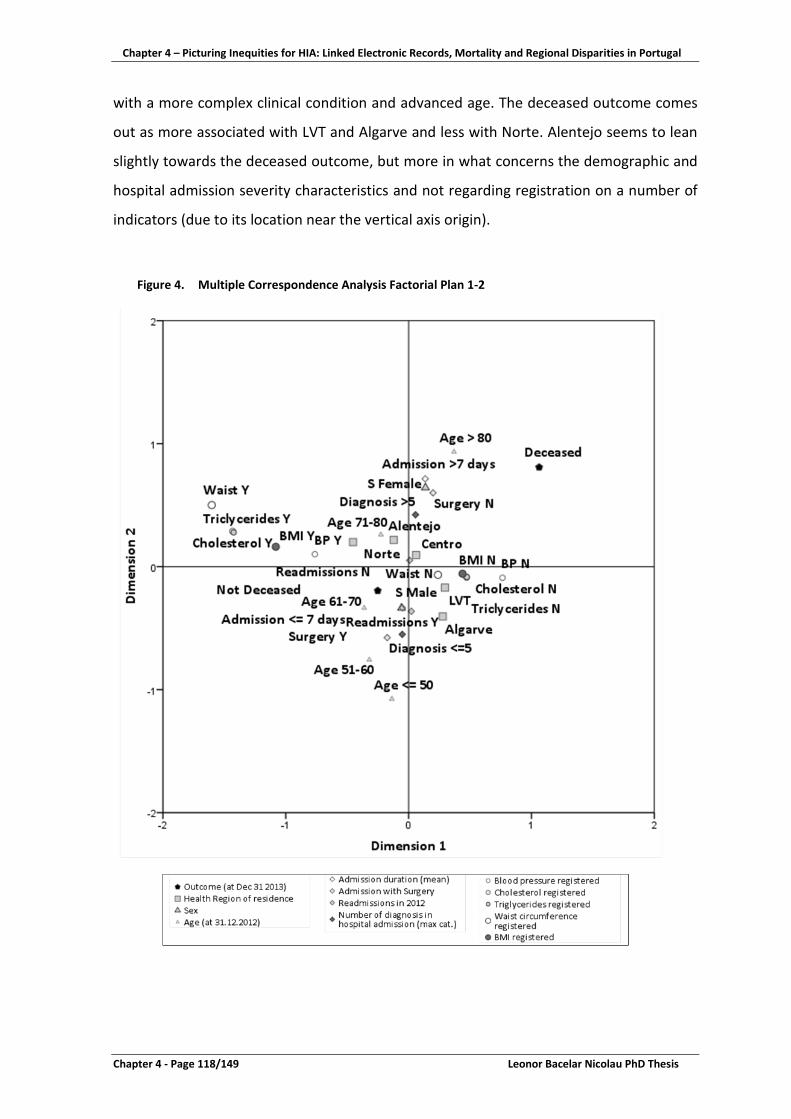
Chapter 4 – Picturing Inequities for HIA: Linked Electronic Records, Mortality and Regional Disparities in Portugal
Chapter 4 - Page 118/149 Leonor Bacelar Nicolau PhD Thesis
with a more complex clinical condition and advanced age. The deceased outcome comes
out as more associated with LVT and Algarve and less with Norte. Alentejo seems to lean
slightly towards the deceased outcome, but more in what concerns the demographic and
hospital admission severity characteristics and not regarding registration on a number of
indicators (due to its location near the vertical axis origin).
Figure 4. Multiple Correspondence Analysis Factorial Plan 1-2

Chapter 4 – Picturing Inequities for HIA: Linked Electronic Records, Mortality and Regional Disparities in Portugal
Leonor Bacelar Nicolau PhD Thesis Chapter 4 - Page 119/149
Consequently, there are indeed differences among regions in their association patterns
regarding mortality and registration of the health indicators under study. The
methodologies used lead us to different ways of visualizing information and grasping
diversity in results.
Discussion
We will discuss implications of an EHR policy being applied unevenly throughout regions
regarding data quality and the policy itself, links between EHR and quality of healthcare
and EHR relevance for disease prevention, health promotion and sustainability. We will
then debate on our research added value for HIA concerning AMI patients and
visualization methods understandable by non-statisticians in a Big Data context. Finally,
an HIA conceptual approach will be proposed to tackle equity, health impacts and policies
in a quantified way, which may contribute to putting HIA at the center of future
healthcare reforms.
Implications of Electronic Health Records policies applied unevenly throughout the
regions
Differences in health information registration between regions observed at stage 1 of
result section indicate an uneven regional application of EHR policies.
At PC level, there may exist various ways of recording patients’ clinical information, from
paper to alternative electronic platforms, depending on the institution. However, in
Portugal, specific information is regularly uploaded onto a platform to calculate health
contratualization indicators, in which performance of healthcare providers may be
evaluated. Contratualization indicator performance and evolution over time represent
much of the basis for contracts (re)negotiation, monitoring and evaluation between
Health Regions Administrations and PC providers of NHS (Departamento de Gestão e
Financiamento de Prestações de Saúde da ACSS 2013b; Departamento de Gestão e
Financiamento de Prestações de Saúde da ACSS 2014).

Chapter 4 – Picturing Inequities for HIA: Linked Electronic Records, Mortality and Regional Disparities in Portugal
Chapter 4 - Page 120/149 Leonor Bacelar Nicolau PhD Thesis
Indicators selected for our research - Blood Pressure, Cholesterol, Triglycerides, Waist
Circumference - are currently used to calculate some of these contractualization
indicators (Departamento de Gestão e Financiamento de Prestações de Saúde da ACSS
2013a; Departamento de Gestão e Financiamento de Prestações de Saúde da ACSS 2015).
For instance, the proportion of hypertensive patients with cardiovascular risk within 3
years, representing patients’ cardiovascular risk, is accessed through SCORE (Systematic
Coronary Risk Evaluation) methodology, according to the General Directorate of Health
guidelines under the National Health Plan of Cerebro-cardiovascular Disease
(Departamento da Qualidade na Saúde da Direção-Geral da Saúde 2013). European
Guidelines on Cardiovascular Disease Prevention include among parameters to access
SCORE cardiovascular level all health indicators under analysis here - blood pressure, BMI,
waist circumference, cholesterol level, triglycerides level (Perk et al. 2012; Piepoli et al.
2016).
These five chosen health indicators are essential to access cardiovascular risk and
represent a direct incentive to PC providers to assure information is recorded. One would
hence expect that this information on which healthcare providers depend to be financed
would display the highest registration performance amongst all recorded clinical
information. The missing information problem identified throughout our research
amongst these indicators may hence constitute an even worse issue regarding other kinds
of data, eventually also relevant to access patients’ health and monitoring.
Since a lack of records regarding patients with AMI diagnosis followed at PC seems first to
concern all regions, a stronger implementation of EHR policy guidelines may be needed
nationwide.
Additionally, since there are also regions where this lack of records is even more blatant,
like Algarve or LVT, EHR policy guidelines and the way they are put into practice may need
to be segmented and adapted to each region’s specificities.
But may regional disparities regarding EHR truly correspond to regional equity issues?
What is known regarding links between EHR and quality of healthcare?

Chapter 4 – Picturing Inequities for HIA: Linked Electronic Records, Mortality and Regional Disparities in Portugal
Leonor Bacelar Nicolau PhD Thesis Chapter 4 - Page 121/149
Links between Electronic Health Records and quality of healthcare
The existence of national electronic health records (EHR) at primary and hospital care
levels is often indicated as a benefit for PC practice and as a quality of care indicator
(Majeed, Car, and Sheikh 2008). Differences in health information registration between
regions may thus indicate disparities on the quality of care supplied, and hence regional
inequity issues to be improved upon.
Regional disparities regarding relevant associations between registration of various health
indicators and mortality outcome found in results section may be mitigated with an effort
to uniformly apply an EHR policy throughout hospital and primary care.
But although EHR are used as a quality of care indicator, this does not immediately imply
that EHR will directly contribute to a better healthcare provision. Both aspects may
indeed be correlated without having a direct cause-effect. Healthcare providers that have
efficiency management concerns and are more recent and technologically advanced may
have both EHR with more quality and better performance in supplying healthcare (Tanner
et al. 2015).
Nevertheless, the existence and analysis of EHR may also directly contribute to better
health at patient care level, helping clinicians collect and access information to improve
their service (Burke et al. 2015).
For instance, a patient with many records registered may not necessarily have a better
follow-up by PC healthcare, but many different records may imply many contacts with the
PC healthcare network. This may in turn increase opportunities to identify problems, thus
enhancing odds for “better health”, promoting health and preventing disease. A
consistent EHR policy throughout health regions may thus support an even
implementation of programs such as NHS Health Checks introduced in England in 2010 to
prevent heart disease, stroke, kidney disease and diabetes. It may also help evaluate
these programs regarding increasing cardiovascular risk factor detection, reducing
inequalities and monitoring trends of better detection of hypercholesterolaemia, and,
although to a lesser extent, obesity and hypertension (Forster et al. 2015).

Chapter 4 – Picturing Inequities for HIA: Linked Electronic Records, Mortality and Regional Disparities in Portugal
Chapter 4 - Page 122/149 Leonor Bacelar Nicolau PhD Thesis
Electronic Health Records for disease prevention, health promotion and sustainability
The existence of EHR that include or are linked to information on social health
determinants becomes especially pertinent when considering the WHO Health 2020
framework (WHO Regional Office for Europe 2013) to promote sustainable and equitable
improvements in health. Good health is no longer seen as an outcome of just one sector,
the health sector, but as “the product of effective policy across all parts of government
and collaborative efforts across all parts of society”. Good health is also acknowledged as
essential for the improvement of the lives of single individuals, families, communities,
ultimately as a benefit for all sectors and the whole of society.
Assuring quality of EHR is moreover essential to empowering patients and citizens and
thus improving health outcomes, health system performance and patient satisfaction by
promoting and facilitating freedom of choice of PC units for NHS users (Mendes Ribeiro
2009; Mendes Ribeiro et al. 2011; Mendes Ribeiro et al. 2015; OECD - Organisation for
Economic Co-operation and Development 2017).
Guarantying the quality of EHR and their link to information on the social determinants of
health in a context of HIA is furthermore essential to answering a core question for policy-
makers: to what extent do investments in preventive actions addressing social
determinants of health represent an efficient choice to help promote and protect the
health of the population?
Evidence base from controlled trials and well-designed observational studies
demonstrates the cost-effectiveness of a wide range of interventions concerning health
promotion and disease prevention that address risk factors to health: measures to reduce
“risks of smoking and alcohol consumption, increase physical activity, promote more
healthy diets, protect psychological and emotional well-being, reduce environmental
harms and make road environments safer” (Merkur, Sassi, and McDaid 2013). Quality
data aid the evaluation of policies and actions taken, identifying those that are more cost-
effective (such as taxes to influence individual choices of tobacco, alcohol and food
consumption) and the ones less so (like media campaigns). However, there is still little
data on the impact of interventions on health inequities, on appraising if a public health
intervention has a higher or lower effect on certain groups in society inadvertently

Chapter 4 – Picturing Inequities for HIA: Linked Electronic Records, Mortality and Regional Disparities in Portugal
Leonor Bacelar Nicolau PhD Thesis Chapter 4 - Page 123/149
widening avoidable health inequalities. Methodologies used in our research could help
deal with equity in this broader context.
Having data available, adopting and using EHR in a widespread manner and being able to
study bigger cohorts through time linking data from various sources is most important to
promoting equity, cost-effectiveness (Asaria et al. 2016; Asaria, Grasic, and Walker 2016;
Beresniak et al. 2016) and identifying determinants of where to act (Fehr et al. 2014),
improving clinical care, preventing disease and promoting health (Hansell and Aylin 2003;
Mendes Ribeiro et al. 2015; OECD - Organisation for Economic Co-operation and
Development 2017). This is especially pertinent considering the evolution of the burden
of chronic non-communicable disease such as cerebrocardiovascular disease.
Electronic Health Records and Acute Myocardial Infarction
Cardiovascular disease (CVD) remains a leading cause of morbidity and mortality in
Europe, causing over 1.9 million deaths in the European Union (EU), amounting to 40% of
all deaths in the EU. Overall CVD is estimated to cost the EU economy almost €196 billion
a year, 54% being due to health care costs, 24% to productivity losses and 22% to the
informal care of people with CVD (Nichols et al. 2012).
In spite of some improvements in outcomes in CVD rates in many countries in Europe
since the early 1980s, owing to preventive measures, especially regarding tobacco and
smoking legislation, inequalities between countries persevere and many risk factors have
even been accentuated, particularly obesity and diabetes mellitus (Piepoli et al. 2016).
The OECD estimates AMI-standardized death rates in 2012 for Portugal of 47.4 and 34.4
per 100,000 male and female inhabitants, respectively (OECD - Organisation for Economic
Co-operation and Development 2016). Values remain similar between 2013 and 2014
with 47.3 and 34.2 per 100,000 male and female inhabitants, respectively. However, this
represents a considerable decrease from 2008 rates of 59.8 and 43.0 per 100,000 male
and female inhabitants, respectively.
Information regarding AMI in Portugal indicates gender and age differences as well as
regional differences regarding hospital admissions - number of admissions, deaths in the
hospital, length of stay, etc. (Cruz Ferreira et al. 2016). However, no multivariate adjusted

Chapter 4 – Picturing Inequities for HIA: Linked Electronic Records, Mortality and Regional Disparities in Portugal
Chapter 4 - Page 124/149 Leonor Bacelar Nicolau PhD Thesis
methods were applied here, and published tables are quite numerically dense, which
impairs the perceiving of potential regional equities.
Our approach to use linked data at the patient level to generate multivariate results,
controlled for sex, age and severity hospital admission indicators constitutes an important
evidence-base for decision-makers to perceive regional disparities and associations to
mortality and EHR policies at PC level.
Observed different regional magnitudes of associations between AMI mortality and
registration of distinct indicators may be related to diverse patterns of relevance
regarding preventive and risk factors. To study reasons behind these disparities may
constitute significant clues for the HIA to undertake, identifying distinct relevant regional
lifestyles, other policies that interact with these, and so on. Being able to link additional
information at the patient level (clinical, on social health determinants and policies) may
thus be decisive towards increasing knowledge regarding equity issues for HIA. This
becomes even more relevant when addressing chronic non-communicable diseases for
which promotion and prevention policies are increasingly critical. Quality-linked
databases monitored regularly at the patient level are essential to designing,
implementing and monitoring health and equity effects of public policies. To assess
impacts of health promotion and chronic non-communicable disease prevention policies,
Big Data will have to be tackled within a quantified HIA framework.
Challenges of Big Data and complexity in methods but simplicity in visualization
EHR may improve health at a secondary level, especially when clinical data is linked with
additional information regarding health and social health determinants, allowing for
epidemiological and clinical research and health assessment of populations (Biro et al.
2016). Yet, this cannot be achieved without high-quality data and an adequate underlying
digital infrastructure (Barkhuysen et al. 2014; Lau et al. 2012; Majeed, Car, and Sheikh
2008).
The use of EHR, the higher capacity of storing and processing data and the need to assure
that actions and policies are sustainable, cost-effective, maximizing positive health
impacts, minimizing negative ones and equity oriented, all have led to growing amounts

Chapter 4 – Picturing Inequities for HIA: Linked Electronic Records, Mortality and Regional Disparities in Portugal
Leonor Bacelar Nicolau PhD Thesis Chapter 4 - Page 125/149
of data at our disposal, generated at an ever-increasing and faster rate. Big Data in a
health environment (that actually goes beyond the health sector per se, through social
health determinants and other sectors) is an unavoidable reality, as well as challenges of
tackling information and finding new ways (or rediscovering and adapting old ones) of
processing, analyzing and communicating reliable evidence-based knowledge
understandable by decision-makers. The new interdisciplinary field of Data Science has
emerged, feeding on statistics, data mining and predictive analytics and whose activity
ultimately culminates in data visualization (Donoho 2015).
Both complementary visualization approaches used in each of the result stages are based
on multivariate methodologies, more usual in a data mining context than in an HIA
epidemiological research. OR were first calculated to study adjusted associations between
registering or not registering indicators and the region of residence and then between
registering or not registering indicators and mortality while accounting for regional
equity. The use of factorial methods such as PCA and MCA complements this approach
again in a very visual manner.
The way these distinct methodologies complement themselves in the result analysis and
visualization represent an added value for understanding results, especially for non-
statisticians. Using complex and multivariate statistical methods but obtaining a clear and
quite simple way of grasping results allows for a swift but more evidence-based decision-
making process.
Conceptual Path associating Policy and Health allowing for Equity
Our third research aim was to propose a conceptual quantitative path of analysis to study
the association between policy and health impacts while taking equity into account.
Illustrated by the case study presented in the results section, the proposed path starts by
analyzing associations between the policy and the chosen equity issue (Figure 5 and SOM
Figure 11).
If no association is found between the policy and the equity aspect under study, then we
could go on analyzing the association between policy and the health event of interest

Chapter 4 – Picturing Inequities for HIA: Linked Electronic Records, Mortality and Regional Disparities in Portugal
Chapter 4 - Page 126/149 Leonor Bacelar Nicolau PhD Thesis
globally without great concerns regarding these equity issues in particular. We should yet
reflect on the usefulness of undertaking an HIA, which has at its core equity concerns.
Additionally, we should ponder on data selected and its quality since there could indeed
exist alternative or complementary information, which better embodies the spirit of the
policy, health outcomes and equity aspects under study.
If a relevant association between policy and the health event of interest is found, then the
association between policy and the health event of interest should be studied subject to
equity aspects.
Then, if an association between the policy and the health event of interest is identified
with differences among equity categories, then a contribution to HIA recommendations is
potentially valuable to maximize positive health impacts and minimize negative ones
while curtailing harmful inequities.
Figure 5. Putting concept into practice

Chapter 4 – Picturing Inequities for HIA: Linked Electronic Records, Mortality and Regional Disparities in Portugal
Leonor Bacelar Nicolau PhD Thesis Chapter 4 - Page 127/149
IAPA states that “HIA investigate the pathways of how the inter-related determinants
may be affected by a proposed policy” (Quigley et al. 2006). Following our recommended
pathway, quantifying HIA using the added-value of big data and data science visualization
tools may contribute to a more comprehensive way for decision-makers to understand
HIA results and even to a wider HIA practice.
HIA and the Future of Health Reforms
The “Next Generation of Health Reforms” Statement was approved by OECD
(Organization for Economic Co-operation and Development) health ministers on January
2017 (OECD - Organisation for Economic Co-operation and Development 2017). This new
vision for the future includes reducing health inequalities in access to care and health
outcomes, adapting health systems to new technologies and innovation and reorienting
health systems to become more people-centered. All these challenges may be
undertaken with a strong support from an HIA approach.
The equity-oriented HIA methodologies may contribute to tackling barriers to the health
literacy of the population, minimizing disparities in the ever-increasing access of patients
to growing amounts of information, empowering them in the decision about their
treatment.
Our HIA approach may also strongly contribute to evaluating and improving health
systems and their benchmarking performance, shifting their center from providers to
people’s individual needs and preferences, understanding the impact of policy reform by
moving from data only related to health activities, inputs and costs to information about
how people lead their lives (such as indicators of comfort and quality of life, ability to
function and live independently, social and economic determinants of health, as well as
environmental risk factors).
The OECD states the need to further invest in delivery models that focus on primary care
and its coordination with other services to assure health promotion and prevention of
disease. This also represents an opportunity for our HIA-quantified approach and its
practice of analyzing interrelations between policies, health determinants and outcomes.

Chapter 4 – Picturing Inequities for HIA: Linked Electronic Records, Mortality and Regional Disparities in Portugal
Chapter 4 - Page 128/149 Leonor Bacelar Nicolau PhD Thesis
Finally, the strong participatory experience from HIA may furthermore help “constructive
dialogue across governments, with industry, and with other key stakeholders including
patients, providers, payers and academics” (OECD - Organisation for Economic Co-
operation and Development 2017). The importance of guaranteeing that all stakeholders
participate in the decision-making process, especially communities affected by policies
under scrutiny, has been recognized to make the decision process more open, optimize
final decisions and improve the decision-making process itself (Kemm 2013).
The HIA approach is thus in an especially good position to contribute to health policy
future reforms and “to inform and influence decision making on proposals and plans, so
health protection and promotion are effectively integrated into them” (Quigley et al.
2006).
Limitations and future paths for research
Limitations in our research simultaneously represent future research opportunities. Some
limitations regard data used in our case study, which may be tackled and enrich future
research by:
• Taking a broader number of patients, for example, patients admitted during a
longer period of time for different diagnosis;
• Considering hospital readmissions during follow-up for other diagnoses and not
only for the ones of the first admission;
• Linking hospital data with more information such as PC data after but also before
hospital admission, prescribed medication, social health determinants, health
services characteristics and costs. This is coherent with WHO Health 2020 holistic
approach and also allows deepening complementarities between HIA and Health
Technology Assessment;
• Testing our pathway by analyzing other policies and public actions, within or
outside the health sector.
Another potential limitation regards the fact that our proposed pathway studies the
association between a public policy and its health impacts while taking into account an

Chapter 4 – Picturing Inequities for HIA: Linked Electronic Records, Mortality and Regional Disparities in Portugal
Leonor Bacelar Nicolau PhD Thesis Chapter 4 - Page 129/149
equity aspect and not the impact itself. The existence of an association may indeed not
infer a causal effect. A future challenge is to develop more complex models to link
longitudinally most relevant aspects in a patients’ life, effects of policies over health
impacts and equity in a big data context and ideally approximately in real time. Modeling
past and current data over time to better predict the health effects in the future may
additionally consider identifying population risk profiles, increasing awareness regarding
unexpected equity issues and supplying HIA recommendations differentiated by profiles.
This may contribute to the need to “review our own IA strategies, approaches and
practices and to adapt them to a changing environment, so that we are able to meet new
challenges” (Fischer 2017).
A more relevant limitation regards our goal to show how the use of the visualization
output strengths of these methodologies (such as OR graphic representations or MCA
factorial plans) may represent an added value for decision-makers, perhaps making it
easier for them to comprehend results, more so than other statistical methodologies’
outputs. Although summarizing results in a factorial plan may indeed be useful as a
representation of results obtained, and informally certain decision-makers may think it is
easier for their understanding of outcomes, only a deeper study would demonstrate the
higher effectiveness in apprehending conclusions. A survey to a sample of decision
makers from multiple sectors but with a strong emphasis on the health sector based on
specific tested instruments could contribute to this effect.
Lastly, our proposed pathway suffers potential limitations from being a quantitative HIA
approach: chiefly that not everything that should be taken into account in HIA is
quantifiable (Fehr et al. 2012; Fehr et al. 2016; Mindell et al. 2001). Qualitative HIA
approaches should generally complement quantitative ones. Nevertheless, some
qualitative aspects may now also increasingly be incorporated into quantified models,
with the help, for instance, of other data mining methodologies such as text mining
(Lebart and Salem 1994).
These methodologies here used, originating in Data Mining and Data Science fields, may
also be potentially powerful tools to use beyond HIA, to integrate health and equity into
other Impact Assessments (IA), such as Environmental Impact Assessment or Strategic

Chapter 4 – Picturing Inequities for HIA: Linked Electronic Records, Mortality and Regional Disparities in Portugal
Chapter 4 - Page 130/149 Leonor Bacelar Nicolau PhD Thesis
Environmental Assessment (Fehr et al. 2014) whenever Big Data from various sources and
natures are to be tackled and insights are to be generated from interrelations and
complex multivariate contexts.
Conclusions
When targeting for HIA and EHR policy at PC level regarding AMI patients, it is crucial to
assure an adequate application of guidelines throughout all health regions to minimize
regional health inequities. Lessons could be learned from regions with lower disparities so
that actions are to be taken in regions with worse performance.
Regional disparities in the application of an EHR policy targeted for HIA, but also for their
association with Mortality, may be identified and visualized in a comprehensible way for
non-statisticians. Evidence-based, quantified, multivariate knowledge in an HIA context
(or even other IA whenever health is an issue) may thus improve decision makers’
understanding of the importance of taking equity into consideration when assessing the
health impacts of policies they should take a stand on.
The proposed path of analysis to study the association between a public policy and
related health impacts while taking equity into account may be put into practice
whenever data are available regarding the most relevant variables in its particular
context. This means that this pathway may be helpful to put HIA at the center of future
health reforms, linking data focused on individuals’ hospital and primary healthcare usage
patterns but also healthy lifestyles and environmental information.
Chapter 4 – Picturing Inequities for HIA: Linked Electronic Records, Mortality and Regional Disparities in Portugal
Leonor Bacelar Nicolau PhD Thesis Chapter 4 - Page 131/149
References
Asaria, M., K. Grasic and S. Walker. 2016. "Using Linked Electronic Health Records to Estimate Healthcare Costs: Key Challenges and Opportunities." Pharmacoeconomics 34 (2): 155-160. Asaria, M., S. Walker, S. Palmer, C.P. Gale, A.D. Shah, K.R. Abrams, M. Crowther, A. Manca, A. Timmis, H. Hemingway and M. Sculpher. 2016. "Using electronic health records to predict costs and outcomes in stable coronary artery disease." Heart 102 (10): 755-762. Bacelar-Nicolau, L., J. Pereira Miguel and G. Saporta. 2008. "The Added Value of Multivariate Statistical Data Analysis in Policy HIA – A Quantitative Way of Profiling Subjects." In HIA08 Health Impact Assessment and Sustainable Well-being - 9th Conference on Health Impact Assessment, 9-10 October 2008, Liverpool, UK: Bacelar-Nicolau, L., J. Pereira Miguel and G. Saporta. 2015a. "Screening Policies for Health Impact Assessment: Cluster analysis for easier decision making." European Journal of Public Health 25 (Supplement 3): 133-134. Bacelar-Nicolau, L., J. Pereira Miguel and G. Saporta. 2015b. "Screening Policies in Health Impact Assessment: Easier decision making through cluster analysis." European Journal of Epidemiology 30 (2 (suppl.)): 852. Barkhuysen, P., W. de Grauw, R. Akkermans, J. Donkers, H. Schers and M. Biermans. 2014. "Is the quality of data in an electronic medical record sufficient for assessing the quality of primary care?" Journal of the American Medical Informatics Association 21 (4): 692-698. Beresniak, A., A. Schmidt, J. Proeve, E. Bolanos, N. Patel, N. Ammour, M. Sundgren, M. Ericson, T. Karakoyun, P. Coorevits, D. Kalra, M.G. De and D. Dupont. 2016. "Cost–benefit assessment of using electronic health records data for clinical research versus current practices: Contribution of the Electronic Health Records for Clinical Research (EHR4CR) European Project." Contemp.Clin.Trials 46: 85-91. Biro, S., T. Williamson, J.A. Legget, D. Barber, R. Morkem, K. Moore, P. Belanger, B. Mosley and I. Janssen. 2016. "Utility of linking primary care electronic medical records with Canadian census data to study the determinants of chronic disease: An example based on socioeconomic status and obesity." BMC Medical Informatics and Decision Making 16 (32). Brodin, H. and S. Hodge. 2008. A guide to Quantitative Methods in Health Impact Assessment Stockholm, Sweden: STATENS FOLKHÄLSOINSTITUT, Östersund / Swedish National Institute of Public Health. Burke, H.B., L.L. Sessums, A. Hoang, D.A. Becher, P. Fontelo, F. Liu, M. Stephens, L.N. Angaro, P.G. 'Malley, N.S. Baxi, C.W. Bunt, V.F. Capaldi, J.M. Chen, B.A. Cooper, D.A. Djuric, J.A. Hodge, S. Kane, C. Magee, Z.R. Makary, R.M. Mallory, T. Miller, A. Saperstein, J. Servey and R.W. Gimbel. 2015. "Electronic health records improve clinical note quality." Journal of the American Medical Informatics Association 22 (1): 199-205. Cruz Ferreira, R., R. César das Neves, P. Nogueira, C. Farinha, A.L. Oliveira, A. Soares, M.I. Alves, J. Martins, T. Mendana, M. Valente Rosa, C. Silva and L. Serra. 2016. Portugal - Doenças Cérebro-Cardiovasculares em números - 2015 Ministério da Saúde do Governo de Portugal. Daniel, W.W. 2009. Biostatistics – A Foundation for Analysis in the Health Sciences, 9th ed. John Wiley & Sons. Departamento da Qualidade na Saúde da Direção-Geral da Saúde. 2013. Norma DGS nº5/2013 actualizada a 21/01/2015. 5 ed. Departamento de Gestão e Financiamento de Prestações de Saúde da ACSS. 2013a. Bilhete de Identidade dos Indicadores de Monitorização dos Cuidados de Saúde Primários 2013 ACSS-Administração Central do Sistema de Saúde do Ministérios da Saúde de Portugal. Departamento de Gestão e Financiamento de Prestações de Saúde da ACSS. 2013b. Metodologia de Contratualização para os Cuidados de Saúde Primários no Ano de 2013 ACSS-Administração Central do Sistema de Saúde do Ministérios da Saúde de Portugal. Departamento de Gestão e Financiamento de Prestações de Saúde da ACSS. 2014. Metodologia de Contratualização para os Cuidados de Saúde Primários no Ano de 2015 ACSS-Administração Central do Sistema de Saúde do Ministérios da Saúde de Portugal. Departamento de Gestão e Financiamento de Prestações de Saúde da ACSS. 2015. Bilhete de Identidade dos Indicadores de Contratualização com as Unidades de Cuidados na Comunidade para o Ano de 2015 ACSS-Administração Central do Sistema de Saúde do Ministérios da Saúde de Portugal.

Chapter 4 – Picturing Inequities for HIA: Linked Electronic Records, Mortality and Regional Disparities in Portugal
Chapter 4 - Page 132/149 Leonor Bacelar Nicolau PhD Thesis
Donoho, D. 2015. "50 years of Data Science." In John W. Tukey 100th Birthday Celebration at Princeton University, pp. 1-41. Princeton, New Jersey, USA. European Centre for Health Policy. 1999. Health Impact Assessment – main concepts and suggested approach. Gothenburg Consensus Paper. Göteborg, Sweden: ECHP World Health Organization Regional Office for Europe. Fehr, R., F. Viliani, J. Nowacki and M. Martuzzi (Eds.). 2014. Health in Impact Assessments: Opportunities not to be missed. Copenhagen: WHO Regional Office for Europe. Fehr, R., F. Hurley, O.C. Mekel and J.P. Mackenbach. 2012. "Quantitative health impact assessment: Taking stock and moving forward." Journal of Epidemiology and Community Health 66 (12): 1088. Fehr, R., O.C.L. Mekel, J. Fintan Hurley and J.P. Mackenbach. 2016. "Health impact assessment – A survey on quantifying tools." Environmental Impact Assessment Review 57: 178-186. Fischer, T. 2017. "Foreword to the first issue of 2017." Impact Assessment and Project Appraisal 35 (1): 1. Forster, A.S., C. Burgess, H. Dodhia, F. Fuller, J. Miller, L. McDermott and M.C. Gulliford. 2015. "Do health checks improve risk factor detection in primary care? Matched cohort study using electronic health records." J.Public Health (Oxf). Glover, D. and J. Henderson. 2010. Quantifying health impacts of governement policies Department of Health of the UK Government. Haigh, F., E. Harris, B. Harris-Roxas, F. Baum, A.L. Dannenberg, M.F. Harris, H. Keleher, L. Kemp, R. Morgan, H.N. Chok and J. Spickett. 2015. "What makes health impact assessments successful? Factors contributing to effectiveness in Australia and New Zealand." Bmc Public Health 15 (1009): 1-12. Hair, J.F., B. Black, B. Babin, R.E. Anderson and R.L. Tatham. 2006. Multivariate Data Analysis, 6th ed. Prentice Hall. Hansell, A. and P. Aylin. 2003. "Use of health data in health impact assessment." Impact Assessment and Project Appraisal 21 (1): 57-64. Harris-Roxas, B., F. Haigh, J. Travaglia and L. Kemp. 2014. "Evaluating the impact of equity focused health impact assessment on health service planning: Three case studies." BMC.Health Serv.Res. 14: 371. Harris-Roxas, B., F. Viliani, A. Bond, B. Cave, M.J. Divall, P. Furu, P. Harris, M. Soeberg, A. Wernham and M. Winkler. 2012. "Health impact assessment: The state of the art." Impact Assessment and Project Appraisal 30 (1): 43-52. Kemm, J. (Ed.). 2013. Health Impact Assessment: Past Achievements, Current Understanding and Future Progress. Oxford University Press. Kleinbaum, D.G. and M. Klein. 2010. Logistic Regression - A Self-learning Text, Third Edition ed. Springer. Lau, F., M. Price, J. Boyd, C. Partridge, H. Bell and R. Raworth. 2012. "Impact of electronic medical record on physician practice in office settings: A systematic review." BMC Medical Informatics and Decision Making 12: 1-10. Lebart, L. and A. Salem. 1994. Statistique Textuelle Dunod. Majeed, A., J. Car and A. Sheikh. 2008. "Accuracy and completeness of electronic patient records in primary care." Family Practice 25 (4): 213-214. Mendes Ribeiro, J. 2009. Saúde - A Liberdade de Escolher Gradiva Publicações SA. Mendes Ribeiro, J., A.X.D. Barreto, J.A.V. Varanda, J.M.V. Penedo, J.C.F. Caiado, J.M. Nunes, N.S. Santos, P.A.F. Boto, R.S. Ivo and T.A.C. Santos. 2011. Relatório Final do Grupo Técnico para a Reforma Hospitalar - Os Cidadãos no centro do Sistema, os Profissionais no centro da mudança Ministério da Saúde do Governo de Portugal. Mendes Ribeiro, J., R. Silva, P. Caetano, J. Picoto, P. Nogueira, S. Sequeira, G. Ferreira, A. Ferreira and C. Nunes. 2015. Relatório Final do Grupo Técnico para a Informação no Sistema de Saúde: Iniciativa para a Informação Centrada no Utente do Sistema de Saúde. Lisboa: Ministério da Saúde do Governo de Portugal. Merkur, S., F. Sassi and D. McDaid. 2013. Promoting health, preventing disease: Is there an economic case? WHO Regional Office for Europe and European Observatory on Health Systems and Policies. Mindell, J., A. Hansell, D. Morrison, M. Douglas and M. Joffe. 2001. "What do we need for robust, quantitative health impact assessment?" Journal of Public Health Medicine 23 (3): 173-178. Nichols, M., N. Townsend, R. Luengo-Fernandez, J. Leal, A. Gray, P. Scarborough and M. Rayner. 2012. European Cardiovascular Disease Statistics 2012, European Heart Network ed. Brussels: European Society of Cardiology.

Chapter 4 – Picturing Inequities for HIA: Linked Electronic Records, Mortality and Regional Disparities in Portugal
Leonor Bacelar Nicolau PhD Thesis Chapter 4 - Page 133/149
OECD - Organisation for Economic Co-operation and Development. 2016. "Database access in the OECD website" [accessed on August 25, 2016]. OECD - Organisation for Economic Co-operation and Development. 2017. Ministerial Statement: The next generation of health reforms. Perk, J., G. De Backer, H. Gohlke, I. Graham, Z. Reiner, W.M.M. Verschuren, C. Albus, P. Benlian, G. Boysen, R. Cifkova, C. Deaton, S. Ebrahim, M. Fisher, G. Germano, R. Hobbs, A. Hoes, S. Karadeniz, A. Mezzani, E. Prescott, L. Ryden, M. Scherer, M. Syvanne, W.J.M.S. Reimer, C. Vrints, D. Wood, J.L. Zamorano and F. Zannad. 2012. "European Guidelines on cardiovascular disease prevention in clinical practice (version 2012): The Fifth Joint Task Force of the European Society of Cardiology and Other Societies on Cardiovascular Disease Prevention in Clinical Practice." European Heart Journal 33: 1635-1701. Piepoli, M.F., A. Hoes, S. Agewall, C. Albus, C. Brotons, A.L. Catapano, M. Cooney, U. Corra, B. Cosyns, C. Deaton, I. Graham, M.S. Hall, R. Hobbs, ML. Lochen, H. Lollgen, P. Marques-Vidal, J. Perk, E. Prescott, J. Redon, D.J. Richter, N. Sattar, Y. Smulders, M. Tiberi, H.B. Van der Worp, I. van Dis and W.M.M. Verschuren. 2016. "2016 European Guidelines on cardiovascular disease prevention in clinical practice: The Sixth Joint Task Force of the European Society of Cardiology and Other Societies on Cardiovascular Disease Prevention in Clinical Practice." European Heart Journal. Quigley, R. et al. 2006. Health Impact Assessment International Best Practice Principles. Fargo, USA, IAIA-International Association for Impact Assessment. Saporta, G. 2011. Probabilités, Analyse des Données et Statistique, 3e édition ed. Éditions Technip. Tanner, C., D. Gans, J. White, R. Nath and J. Pohl. 2015. "Electronic health records and patient safety: Co-occurrence of early EHR implementation with patient safety practices in primary care settings." Appl.Clin.Inform. 6 (1): 136-147. Veerman, J.L., J.J. Barendregt and J.P. Mackenbach. 2005. "Quantitative health impact assessment: Current practice and future directions." Journal of Epidemiology and Community Health 59 (5): 361-370. WHO Regional Office for Europe. 2013. Health 2020: A European Policy Framework and Strategy for the 21st Century World Health Organization. World Health Organization. 13-8-2015. "Examples of HIA" [accessed on August 12, 2015]. Available at: http://www.who.int/hia/examples/en/

Chapter 4 – Picturing Inequities for HIA: Linked Electronic Records, Mortality and Regional Disparities in Portugal
Chapter 4 - Page 134/149 Leonor Bacelar Nicolau PhD Thesis

Leonor Bacelar Nicolau PhD Thesis Chapter 5 - Page 135/149
Chapter 5 – Discussion, Conclusions and Future Perspectives
CONTENTS 1. Discussion .................................................................................................................................. 136 1.1. Adding Value to HIA steps ....................................................................................................... 136 1.2. Tackling Big Data ...................................................................................................................... 137 1.3. Dealing with Equity .................................................................................................................. 141 1.4. Reaching Out to Decision-Makers ........................................................................................... 143 2. Conclusions and Future Perspectives ......................................................................................... 146 References ...................................................................................................................................... 147

Chapter 5 – Discussion, Conclusions and Future Perspectives
Chapter 5 - Page 136/15 Leonor Bacelar Nicolau PhD Thesis
Chapter 5 – Discussion, Conclusions and Future Perspectives
“It is a capital mistake to theorize before one has data.” Sherlock Holmes/ Arthur Conan Doyle “Data allow your political judgments to be based on fact, to the extent that numbers describe realities.” Hans Rosling “Sit down before a fact as a little child, be prepared to give up every preconceived notion. Follow humbly wherever and to whatever abysses nature leads, or you shall learn nothing.” Thomas H. Huxley “In life, unlike chess, the game continues after checkmate.” Isaac Asimov
1. Discussion
1.1. Adding Value to HIA steps
The importance of quantification within HIA was recognized very early in HIA history 1,2.
The advantages identified include being potentially more informative and influential with
decision-makers, complementing qualitative analyses to achieve more robust, evidence-
based and whole estimations of health impacts and taking better into account than
qualitative HIA the magnitude of health impacts, while still considering its nature,
direction and distribution. Nevertheless, HIA is still regularly being used more often with a
qualitative emphasis 1.
More quantitative approaches have been essentially limited to the project appraisal steps
of HIA and more recently when evaluating HIA effectiveness 3-5. Our research shows how
it may be possible to include quantification throughout other HIA steps.
Profiling individuals 6 may thus be informative when characterizing populations targeted
for HIA. Profiling papers and guides (chapter 2) is useful to search bibliography both
during the initials screening and scoping steps of HIA, helping to set a base line context
where the policy will act upon and identifying main health impacts and target
subpopulations to study in more detail.
Clustering hospital reform policies and national programs enrich the screening step of HIA
(chapter 3 and 7,8), by helping to rank and prioritize potential policies and projects

Chapter 5 – Discussion, Conclusions and Future Perspectives
Leonor Bacelar Nicolau PhD Thesis Chapter 5 - Page 137/149
targeted for HIA. Our research shows also how this approach may be adapted to diverse
contexts and changing different priority criteria.
In what concerns the project appraisal step, quantified HIA are usually either based on
health economic evaluation 9,10 or risk assessment and epidemiology modelling 1,11.
Although nearer the later approach in Chapter 4, our research goes beyond it by applying
multivariate statistical methodologies more in line with data science and data mining
methodologies, that may also include in the future health economic evaluation features,
integrating both currently done HIA quantification approaches.
The main necessary improvements regarding quantitative HIA have recently been
identified regarding two aspects: its application in various real-life contexts and especially
in “whether and how they estimate impacts on health inequalities” 11,12. Our research
tackles both these limitations, contributing to the future evolution of the HIA field, as it
may also be seen in more detail in the following sub-sections: our approach in chapter 4
takes real data at national level and offers a path of analysis to deal with equity at the
project appraisal step.
1.2. Tackling Big Data
It has been recognized that one of the main reasons that quantification within HIA is
rarely done, is that it “is often hard or impossible” because of a lack of information
regarding initial conditions, effects of the proposal, and the theoretical framework linking
conditions to health outcomes” 1. A major difficulty is thus to find available and reliable
data to model interrelations, explicitly between health determinants, health impacts,
policies and related costs 4,11,12.
The situation becomes even more complex when dealing with growing amounts of data
of various sources and natures. As everyday life becomes increasingly digital and
“digitalisable” and technological progress make data storage capacity easily available,
huge amounts of structured and non-structured data are being collected 13-15. The term
“Big Data” usually refers to “very large amounts of data that are routinely or

Chapter 5 – Discussion, Conclusions and Future Perspectives
Chapter 5 - Page 138/15 Leonor Bacelar Nicolau PhD Thesis
automatically collected and stored”. It is often defined by 3 characteristics known as the 3
V’s - volume, velocity and variety - or by 5 characteristics, when adding veracity and value 16.
The editor’s comment of WHO’s Eurohealth 2017 Spring issue states that “there is a
growing awareness that harnessing “big data”, if done properly, could transform both the
quality of healthcare for patients and how health systems perform” 17. Linking databases
by sharing electronic health records and integrating other non-health care systems
information sources (geographic location, socio-economic status, lifestyle and social
networks) may support the transformation policy-makers, patients and providers need
towards a data driven and value-based health care 13. The United Nations Global Pulse
Program to “harness big data for development and humanitarian action” is also a clear
statement of “how data science and analytics can contribute to sustainable
development”, with projects from areas such as public health, climate and resilience,
economic well-being, but also data privacy and protection or real-time evaluation18.
The information used in Chapter 4 is precisely linked data at individual level from
different natures and sources, namely hospital and primary care, national registries of
pharmaceuticals and mortality. It consists of a pilot approach before scaling up to bigger
and even more complex databases, taking advantage of the innovative health information
management national approaches in Portugal 19.
Expected advantages from using this big data approach include 13:
• improving the quality of care:
o individualizing treatment plans,
o decreasing duplicate diagnostic tests,
o monitoring and benchmarking provider performance;
• increasing the healthcare systems efficiency towards value-based healthcare
systems:
o reducing waste from underuse of effective treatments, overuse of
ineffective treatments (for example, identifying the most cost-effective
treatments for each patient and hence improving patient outcomes in a
cost-effective way) and failure to coordinate, manage and execute care

Chapter 5 – Discussion, Conclusions and Future Perspectives
Leonor Bacelar Nicolau PhD Thesis Chapter 5 - Page 139/149
(for example, coordinating primary and hospital care levels towards an
effective disease management),
o fast-tracking the development of innovative and more effective health
technologies (for example, linked long-run real data on outcomes to assess
comparative effectiveness of new medicines, leading to more informed
decisions),
o creating efficiency gains in collecting and using data, analyzing available
secondary data rather than primary data (decreasing information
collection costs and research time).
• generating high quality research that guaranties evidence-based clinical practice
and decision-making procedures (linked data at national and even international
levels collected over time constitute a wealth of research possibilities, allowing
researchers to work on real data about populations rather than samples,
improving especially important knowledge regarding chronical non-
communicable diseases).
Acknowledged difficulties to use a big data integrated approach include 13,16:
• technical challenges such as different standards used in databases that may
prevent data from being comparable and compatible (for example a unique
patient identifier is not always available), the complexity of linking data from
different natures (many analytical tools are not appropriated to deal with this
integration) and data reliability (for example missing data and error or/and bias
deriving from human entry of manually fed electronic records);
• ethical challenges such as data privacy concerns (for example an opting-out option
may have to be available, distinguishing consent to use data in a service provision
context or in a research context) and data security issues;
• legal challenges such as diversity of legal framework between countries, even
within the European Union, and between diseases (for example mandatory
registries for infectious diseases, but requirements of explicit patient consent for
others), that may be mitigated by assuring good practice measures are taken into
account (for example establishing steering committees with patient
Chapter 5 – Discussion, Conclusions and Future Perspectives
Chapter 5 - Page 140/15 Leonor Bacelar Nicolau PhD Thesis
representatives, using trusted third parties for data linkages, creating clear rules
for requesting and granting data access, as well as tracking its use);
• governance challenges demonstrated in the disparities in speed at which different
countries are building big data governance frameworks to integrate technical,
legal, ethical and politic aspects (even the European personal data protection
regulation being updated may not keep up to the speed of continuous changes of
a big data environment 20.
These difficulties are still injuring the process of further using and taking advantage of big
data potential benefits 21. Nevertheless, there are international measures being taken
such as the recent OECD ministerial statement to assure that countries and all
stakeholders are taken on board to guaranty that big data really represents the future of
health systems 22.
The HIA field has thus every chance to benefit from the increased use of big data, linked
throughout health care and additional information sources related to social health
determinants, obtainable for whole populations but discriminable to sub-populations and
available over time.
Nevertheless, embracing big data also means an additional methodological challenge
regarding analytical statistical procedures, since conventional inductive statistical
methodologies are fairly limited for big data. The imminent revolution is not just the big
data scaling up, but the need to develop and use new approaches to mine data from
different sources and natures and extract knowledge and insights. A multi-disciplinary
perspective is being adopted and the new field of Data Science is emerging and growing 23,24. Data analysis is no longer focused on outcomes related to a particular, perhaps more
clinical, area of knowledge in what concerns predicting health impacts, but is present
across all of science and reality.
Our current research and proposed approaches focus precisely on how to overcome big
data difficulties in the point of view of statistical methodologies and thus contributes to
improve quantified HIA. The statistical methodologies used throughout chapters 2, 3 and
4 (such as text mining, cluster analysis, multiple correspondence analysis, for example)
are typically used in data mining and data science contexts. Moreover, they also solve

Chapter 5 – Discussion, Conclusions and Future Perspectives
Leonor Bacelar Nicolau PhD Thesis Chapter 5 - Page 141/149
other concerns important for the HIA field: dealing with equity and generating clear
graphical representations of results, as detailed in the following sections.
1.3. Dealing with Equity
Health equity has arisen more strongly as policy concern since the late 1980s 25 and
constitutes a core value of HIA since its beginnings. Any HIA aims to decrease inequities
and improve policy features, in order to identify and help population subgroups who may
be more fragile and less able on their own to diminish any avoidable negative health
impacts of a policy 1.
The pursuit of equity is even more relevant when addressing HIA on health sector policies
and often justifies how HIA may still add value to health sector initiatives as compared to
assessments in other sectors 5, since during planning and policy development there may
have been few opportunities to:
• survey health disparities within and between population subgroups;
• identify how certain policy features regarding its design and implementation may
increase health inequities widening the social gradient in health, by benefiting
higher income social subgroups more than they benefit lower income social
subgroups.
Nevertheless, many HIA still treat health impacts homogenously across target populations
and have difficulties to assess impacts taking equity into consideration for a variety of
reasons 25,26:
• Considering equity may add a layer of complexity to an already complex setup;
• Adequate available data and evidence are wanting;
• Guidance may be inadequate and clear definitions absent;
• Methods and tools are perceived as lacking;
• Practitioners are unwilling or unable to address fairness and social justice values.

Chapter 5 – Discussion, Conclusions and Future Perspectives
Chapter 5 - Page 142/15 Leonor Bacelar Nicolau PhD Thesis
Thus, more immediate and direct health impacts are primarily being considered but not
the root causes of inequities. Hence the importance of linking data sources, as discussed
in this chapter’s previous subsection 1.2.
A few methodological initiatives have been proposed to link social mechanisms, macro-
social and economic determinants of health, equity and relevant outcomes 27 and to
develop a set of equity metrics to guide HIA practice and evaluate its progress toward
equity 28. Nevertheless, the fact is that quantitative HIA still quite seldom uses
multivariate statistical methods to estimate health impacts while taking equity into
account 1,29. A need to “develop conceptual models describing the interrelationships of
the complex processes and values that promote or undermine health equity” is emergent 26 and especially important when considering a big data context.
Our research shows how to take advantage of already existent available information,
secondary data not primary data collected for the only purpose of applying it within a
specific HIA, and use it to add value to different HIA steps, always with a concern of
equity.
In Chapter 4 particularly we propose a conceptual quantitative path of analysis for HIA to
study associations between regional health equity, health impacts and policies, based on
linked data from different origins. Our choice of statistical methodologies also aimed at
dealing with equity: statistical stratification regarding logistic models based on the equity
aspect under scrutiny (region), factorial methods such as principal components and
multiple correspondence analyses that identify profiles grounded on variability. We thus
give a possible path to apply HIA in a real-life context to identify whether and how
impacts on health inequalities may be estimated, which has been identified as the current
HIA challenges to address 11,12.

Chapter 5 – Discussion, Conclusions and Future Perspectives
Leonor Bacelar Nicolau PhD Thesis Chapter 5 - Page 143/149
1.4. Reaching Out to Decision-Makers
Being in its essence a tool to inform the decision-making process, HIA has to be useful for
decision-makers and perceived as so by them. To guaranty its widespread use, one could
think it simple just making it mandatory, like Environmental Impact Assessment is in many
contexts. Nevertheless, as one can see from chapter 2 and the country origins from
published HIA papers and guidelines, HIA does not necessarily thrive in mandatory
settings and primarily is indeed extensively used outside legislative and regulatory
frameworks 1,4.
Making HIA mandatory may even be counter-productive by potentially degenerating into
a simple tick-box exercise while planning a policy and becoming a recipe to actually ignore
health altogether 1,2.
To assure that health is indeed considered in all policies and to establish HIA as an
everyday used methodology, decision-makers have to be convinced of the added-value of
HIA by 1,2,4,11,30:
• Considering policies and impacts that most concern decision-makers, although
not exclusively obviously;
• Applying more often quantified HIA, since:
o international recommendations have been consistent with the adoption of
the ROAMEF (Rationale, Objectives, Appraisal, Monitoring, Evaluation)
cycle, the importance of integrating regulatory impact assessment at early
stages of policy design and the need to evaluate performance and cost-
effectiveness of interventions,
o generally, policy makers seem more responsive to quantified impacts;
• Applying quantitative methods that generate clear results, understandable to all
decision-makers, seldom experts in HIA or statistical methodologies;
• Encourage a closer collaboration between policy-makers and HIA experts while
designing and implementing policies;

Chapter 5 – Discussion, Conclusions and Future Perspectives
Chapter 5 - Page 144/15 Leonor Bacelar Nicolau PhD Thesis
• Building capacity in decision-makers on health issues, namely public health and
particularly HIA, making them more aware of the importance of health
determinants;
• Building capacity also in future and present HIA experts on policy making
procedures regarding its design, implementation and evaluation, institutions and
organizations involved, to increase the usefulness of HIA being applied;
• Increase the use of evaluation of HIA, to demonstrate that estimation based on
sound evidence does inform the decision-making process.
While screening policies in chapter 3 different possible priority criteria were used that
may simultaneously answer decision makers concerns more adequately while taking
health into consideration in the process. Taking into consideration impacts, criteria and
policies that policy-makers might be more sensitive to, will make decision-makers more
easily open to the use of HIA use. It will always be an advantageous situation both in the
point of view of decision-makers and of health and equity concerns.
The quantitative approach proposed in chapter 4 aims to overcome the barrier of
complex statistical methodologies used in HIA frequently generating results difficult to
understand by non-statisticians, including decision-makers. Multivariate methodologies
(logistic regressions, ORs and factorial methods such as PCA and MCA) are used
complementary to present main results regarding health impacts and equity in a visual
manner, that may allow for a clearer, simpler and swifter way to grasp and understand
results, even for non-statisticians.
Training in health determinants and HIA is essential to create awareness, build capacity
within these areas and allow for productive interdisciplinary work and teams. The future
of universities and of Universidade de Lisboa in particular may be to find a way to
integrate health determinants, public health and a culture of evaluation in all its courses
available at all its institutions 31. Regarding Faculdade de Medicina, in the last decade,
while simultaneously the work on this thesis was evolving, HIA has indeed been
integrated at:

Chapter 5 – Discussion, Conclusions and Future Perspectives
Leonor Bacelar Nicolau PhD Thesis Chapter 5 - Page 145/149
• under graduate level within health economics disciplines of Mestrado Integrado
em Medicina (annually since 2008), Licenciatura em Ciências da Saúde (since
2009), Licenciatura em Ciências da Nutrição (expected for 2018);
• post graduate level within Special Topics of Mestrado em Epidemiologia (annually
since 2014) and Social Sciences Applied to Health of Mestrado em Comunicação
em Saúde (2 editions since 2007);
• research level within the CUTEHeart Project (an international project between
Faculdade de Medicina da Universidade de Lisboa and Universidade do Porto and
Harvard Medical School (2014-2016), a thesis orientation of Mestrado Integrado
em Medicina (2017) and various scientific publications, as may be consulted in
Leonor Bacelar Nicolau Curriculum Vitae, annexed to the present thesis.
Using quantification in HIA by applying multivariate methodologies in a big data context
that generate graphical output results understandable for non-statisticians, embracing
interdisciplinary work and building capacity related to HIA, health determinants and
public health is crucial to guaranty that decision-makers take the upmost of the potential
added-value of HIA.
Our approach is also in tune, and in a way anticipates, the recently proposed Action plan
to strengthen the use of evidence, information and research for policy-making in the
WHO European Region 32.This document covers the domains of health information, public
health research and knowledge translation within four action areas:
• “Strengthening national health information systems, harmonizing health
indicators and establishing an integrated health information system for the
European Region;
• Establishing and promoting national health research systems to support the
setting of public health priorities;
• Increasing country capacities for the development of evidence-informed policies
(knowledge translation);
• Mainstreaming the use of evidence, information and research in the
implementation of Health 2020 and other major regional policy frameworks.”

Chapter 5 – Discussion, Conclusions and Future Perspectives
Chapter 5 - Page 146/15 Leonor Bacelar Nicolau PhD Thesis
Each of these four action areas have indeed been approached within this thesis at some
point and our research may contribute already to some of the answers sought.
2. Conclusions and Future Perspectives
Our research has contributed to HIA practice demonstrating the potential added-value of
applying selected data mining and data science methodologies throughout several of HIA
steps.
By using complementary multivariate methods such as cluster analysis or multiple
correspondence analysis among others within HIA, it becomes possible to study
interrelations between health outcomes, determinants of health and relevant equity
issues in big data settings.
These methodologies also allow for presenting results with a strong graphical support
that may help non-statisticians, like most decision-makers are, to visualize and better
understand health impacts of policies within a deeply evidence-based context, promoting
HIA awareness.
Used complementary with HTA, quantitative HIA may also thus contribute to rethink a
health systems efficiency framework based on allocative efficiency 30, considering broader
health gains at global level and health equity gains throughout a population.
The “Next Generation of Health Reforms” 22 includes a vision of reducing health inequities
in access to care and health outcomes, by adapting health systems to new health
technologies, using big data linking health systems performance indicators from providers
to social and economic determinants of health from users, improving performance and
evaluation of health systems through benchmarking models that shift their center form
providers to people’s individual needs and preferences.
More qualitative oriented data mining methodologies such as text mining may soon also
be used to better link quantitative and qualitative aspects within HIA, assessing through
Chapter 5 – Discussion, Conclusions and Future Perspectives
Leonor Bacelar Nicolau PhD Thesis Chapter 5 - Page 147/149
quantitative methods the magnitude of health impacts globally and throughout sub-
population groups and exploring why certain health problems are viewed as more
relevant by local communities through more qualitative approaches that may even
include social media information.
Research paths are also already being followed regarding the use of classification
methodologies such as cluster analysis, regarding complex multivariate data sets, where
observations are no longer described by single values of a characteristic, but by
distributions of values within each feature 33-36. This may allow us to better identify
population subgroups prone to inequities and to be able to predict the risk group of new
individuals or, more interestingly, sets of individuals (regions, districts, neighborhoods,
etc.).
Our approach within HIA may thus strongly contribute to the needs of these future health
reforms, giving HIA the quantitative tools to better tackle these challenges, taking
advantage simultaneously of its more qualitative participatory nature to guaranty that all
stakeholders participate in the decision-making process, including targeted disadvantaged
communities involved.
References
1. Kemm J, editor. Health Impact Assessment: Past Achievements, Current Understanding and Future Progress: Oxford University Press; 2013. 2. Mindell J, Hansell A, Morrison D, Douglas M, Joffe M. What do we need for robust, quantitative health impact assessment? Journal of Public Health Medicine 2001; 23(3): 173-8. 3. Haigh F, Harris E, Harris-Roxas B, Baum F, Dannenberg AL, Harris MF, Keleher H, Kemp L, Morgan R, Ng Chok H, Spickett J. What makes health impact assessments successful? Factors contributing to effectiveness in Australia and New Zealand. BMC Public Health 2015; 15(1009): 1009. 4. Harris-Roxas B, Viliani F, Bond A, Cave B, Divall MJ, Furu P, Harris P, Soeberg M, Wernham A, Winkler M. Health impact assessment: the state of the art. Impact Assessment and Project Appraisal 2012; 30(1): 43-52. 5. Harris-Roxas B, Haigh F, Travaglia J, Kemp L. Evaluating the impact of equity focused health impact assessment on health service planning: three case studies. BMC Health Serv Res 2014; 14: 371. 6. Bacelar-Nicolau L, Pereira Miguel J, Saporta G. The Added Value of Multivariate Statistical Data Analysis in Policy HIA – A Quantitative Way of Profiling Subjects (Poster). HIA08 Health Impact Assessment and Sustainable Well-being - 9th Conference on Health Impact Assessment, 9-10 October 2008; 10/9/2008; Liverpool, UK; 2008.

Chapter 5 – Discussion, Conclusions and Future Perspectives
Chapter 5 - Page 148/15 Leonor Bacelar Nicolau PhD Thesis
7. Bacelar-Nicolau L, Pereira Miguel J, Saporta G. Screening Policies for Health Impact Assessment: cluster analysis for easier decision making. European Journal of Public Health 2015; 25(suppl_3): 133-4. 8. Bacelar-Nicolau L, Pereira Miguel J, Saporta G. Screening Policies in Health Impact Assessment: easier decision making through cluster analysis. European Journal of Epidemiology European Congress of Epidemiology Healthy Living 2015: Bols E.; Smits L.; Weijenberg M. (Eds.); 2015. p. 852-. 9. Brodin H, Hodge S. A guide to Quantitative Methods in Health Impact Assessment. Stockholm, Sweden: STATENS FOLKHÄLSOINSTITUT, Östersund / Swedish National Institute of Public Health; 2008. 10. Glover D, Henderson J. Quantifying health impacts of governement policies, 2010. 11. Fehr R, Hurley F, Mekel OC, Mackenbach JP. Quantitative health impact assessment: taking stock and moving forward. J Epidemiol Community Health 2012; 66(12): 1088-91. 12. Fehr R, Mekel OCL, Hurley JF, Mackenbach JP. Health impact assessment − A survey on quantifying tools. Environmental Impact Assessment Review 2016; 57: 178-86. 13. Salcher M. Connecting the Dots: Putting Big Data to Work for Health Systems. Eurohealth 2017; 23(1): 4. 14. Kluge H. Priorities for Strengthning People-Centred Health Systems. Eurohealth 2016; 22(2): 3. 15. Renner A-TB, J.; Ostermann, H. Big Data for Health Service Research: Balancing Potencials and Challenges. Eurohealth 2016; 22(3): 3. 16. Salas-Vega S, Haimann A, Mossialos E. Big Data and Health Care: Challenges and Opportunities for Coordinated Policy Development in the EU. Health Systems & Reform 2015; 1(4): 285-300. 17. Merkur SM, A. ; McDaid, D. Editor's Comment. Eurohealth 2017; 23(1): 1. 18. Nations U. United Nations Global Pulse . Harnessing big data for development and humanitarian action. 2016. http://unglobalpulse.org/programme-type/public-health (accessed 19/08/2017). 19. Lobo M, Fernandes E, Nisa C, Bacelar-Nicolau L. Main results and lessons to be learned from the CUTEheart project. 2nd CUTEheart Workshop on Health Technology Assessment in Cardiovascular Disease, in Congresso Português de Cardiologia; 4/23/2016; Vilamoura, Portugal; 2016. 20. European Parliament and Council of the European Union. Regulation (EU) 2016/679 of the European Parliament and of the Council of 27 April 2016 on the protection of natural persons with regard to the processing of personal data and on the free movement of such data, and repealing Directive 95/46/EC (General Data Protection Regulation). In: Union EPaCotE, editor. 2016/679. Official Journal of the European Union: European Union; 2016. p. 88. 21. Szócska MJ, S.; Smand, C.; Salimullah, T.; Reed, C.; Hanif, S. Big Data for Better Outcomes: Supporting Health Care Systems Transformation in Europe. Eurohealth 2017; 23(1): 3. 22. OECD. Ministerial Statement: The next generation of health reforms. 2017. 23. Donoho D. 50 years of Data Science. John W Tukey 100th Birthday Celebration at Princeton University; 2015 9/18/2015; Princeton, New Jersey, USA; 2015. p. 1-41. 24. Wu Z, Chin OB. From Big Data to Data Science: A Multi-disciplinary Perspective. Big Data Research 2014; 1: 1. 25. Harris-Roxas B, Harris E. Differing forms, differing purposes: A typology of health impact assessment. Environmental Impact Assessment Review 2011; 31(4): 396-403. 26. Povall SL, Haigh FA, Abrahams D, Scott-Samuel A. Health equity impact assessment. Health Promot Int 2014; 29(4): 621-33. 27. Shankardass K, Renahy E, Muntaner C, O'Campo P. Strengthening the implementation of Health in All Policies: a methodology for realist explanatory case studies. Health Policy Plan 2015; 30(4): 462-73.

Chapter 5 – Discussion, Conclusions and Future Perspectives
Leonor Bacelar Nicolau PhD Thesis Chapter 5 - Page 149/149
28. Heller J, Givens ML, Yuen TK, Gould S, Jandu MB, Bourcier E, Choi T. Advancing efforts to achieve health equity: equity metrics for health impact assessment practice. Int J Environ Res Public Health 2014; 11(11): 11054-64. 29. Veerman JL, Barendregt JJ, Mackenbach JP. Quantitative health impact assessment: current practice and future directions. J Epidemiol Community Health 2005; 59(5): 361-70. 30. Cylus JP, I. ; Smith, P.C., editor. Health System Efficiency: How to make measurement matter for policy and management: World Health Organization; 2016. 31. Pereira Miguel J. Homenagem da Universidade de Lisboa ao Professor Doutor José Pereira Miguel. 2ª Conferência “Saúde Pública@ULisboa”; 29/05/2017; Lisboa, Portugal: Universidade de Lisboa; 2017. 32. WHOEurope. Action plan to strengthen the use of evidence, information and research for policy-making in the WHO European Region. WHO Regional Committee for Europe 66th Session. Denmark, 2016. 33. Bacelar-Nicolau H, Costa Nicolau F, Sousa A, Bacelar-Nicolau L. Clustering of variables with a three-way approach for health sciences. TPM-Testing, Psychometrics, Methodology in Applied Psychology 2014; 21(4): 435-47. 34. Bacelar-Nicolau H, Nicolau F, Sousa A, Bacelar-Nicolau L. Measuring Similarity of Complex and Heterogeneous Data in Clustering of Large Data Sets. Biocybernetics and Biomedical Engineering 2009; 29(2): 9-18. 35. Bacelar-Nicolau H, Nicolau F, Sousa A, Bacelar-Nicolau L. Clustering Complex Heterogeneous Data Using a Probabilistic Approach. International Conference on Stochastic Modeling Techniques and Data Analysis - SMTDA2010; 6/8/2010; Chania, Crete, Greece; 2010. 36. Bacelar-Nicolau H, Nicolau F, Sousa A, Bacelar-Nicolau L. On cluster analysis of complex and heterogeneous data. In: C.H.Skiadas, editor. 3rd Stochastic Modeling Techniques and Data Analysis International Conference (SMTDA2014); 6/11/2014; Lisbon, Portugal; 2014. p. 99-108.

Appendices
Leonor Bacelar Nicolau PhD Thesis Appendices- Page A1/A105
Appendices Appendix 1: Authorization Data from ACSS/SPMS............................................................................ A3 Appendix 2: Summary of Databases and Statistical Methodologies Used ......................................... A9 1. Data ................................................................................................................................. A9 1.1. Chapter 2 .................................................................................................................................. A9 1.2. Chapter 3.1 .............................................................................................................................. A14 1.3. Chapter 3.2 .............................................................................................................................. A17 1.4. Chapter 4 ................................................................................................................................. A21 2. Main Statistical Methodologies .................................................................................................. A23 2.1. Chapter 2 ................................................................................................................................. A23 2.2. Chapter 3.1 .............................................................................................................................. A24 2.3. Chapter 3.2 .............................................................................................................................. A25 2.4. Chapter 4 ................................................................................................................................. A26 3. Statistical Software .................................................................................................................... A29 4. References ................................................................................................................................ A30 Appendix 3: Supplementary Material of Chapter 2 .............................................................................. A31 Appendix 4: Supplementary Material of Chapter 3.1 ........................................................................... A47 Appendix 5: Supplementary Material of Chapter 3.2 ........................................................................... A55 Appendix 6: Supplementary Material of Chapter 4 .............................................................................. A81 I. Statistical Methodologies .................................................................................................................. A82 Association between registering or not indicators and region of residence ......................................... A82 Association between Mortality and registering or not indicators, by region ........................................ A83 Statistical software and significance level used ..................................................................................... A83 II. Complementary Tables and Figures .................................................................................................. A84 Stage 1: Association between registering or not indicators and region of residence ........................... A84 Stage 2: Association between Mortality and registering or not indicators, by region .......................... A92 Conceptual Path Policy / Equity / Health Event of Interest .................................................................. A100 Appendix 7: Main Scientific Publications published by the author, relevant to this research ............... A101

Appendices
Appendices- Page A2/A107 Leonor Bacelar Nicolau PhD Thesis

Appendices
Leonor Bacelar Nicolau PhD Thesis Appendices- Page A3/A105
Appendix 1: Authorization Data from ACSS/SPMS

Appendices
Appendices- Page A4/A107 Leonor Bacelar Nicolau PhD Thesis

Appendices
Leonor Bacelar Nicolau PhD Thesis Appendices- Page A5/A105

Appendices
Appendices- Page A6/A107 Leonor Bacelar Nicolau PhD Thesis

Appendices
Leonor Bacelar Nicolau PhD Thesis Appendices- Page A7/A105

Appendices
Appendices- Page A8/A107 Leonor Bacelar Nicolau PhD Thesis

Appendices
Leonor Bacelar Nicolau PhD Thesis Appendices- Page A9/A105
Appendix 2: Summary of Databases and Statistical Methodologies Used
1. Data
Different databases were used throughout the course of our research presented within
the various thesis chapters, from chapter 2 to chapter 4. Here we list and identify them
briefly.
All through our research our purpose was to use secondary data sources whenever
possible, taking advantage of available databases and avoiding collecting primary
information. That obviously implied that strong and robust data validation and
management procedures had to be put in place to assure that data used had the
adequate quality, formats and evidence contents to serve our purposes.
1.1. Chapter 2
Two datasets were considered in chapter 2: an HIA guides dataset and an HIA papers
dataset.
The HIA guides dataset used was based on the table of characteristics published by
authors of paper “Health impact assessment: A comparison of 45 local, national and
international guidelines” (Hebert et al. 2012), describing 45 selected HIA guides,
published from 1995 to 2011. Qualitative characteristics were recoded into 26 nominal
active variables and 2 additional supplementary variables were included, from our own
analysis of the sample, regarding the region of origin and the kind of screening
procedures presented within each HIA Guide (table 1).
The HIA papers dataset was based on the list of HIA Bibliography published and updated
regularly by the HIA Gateway associated to Public Health England (HIA Gateway 2014),
last updated on March 2014.
Inclusion criteria were: being a paper from the Health Impact Assessment Section of the
HIA Gateway Bibliography published in a scientific journal during 2012 to 2014 with
available abstract and/or complete text. Exclusion criteria were: being a book (4
references) or a conference abstract (17 references); being published on a different year

Appendices
Appendices- Page A10/A107 Leonor Bacelar Nicolau PhD Thesis
than 2012, 2013 or 2014 (erroneously catalogued in the HIA Gateway Bibliography – 4
references); not having available simultaneously an abstract nor complete text (1
reference); being duplicated in the original bibliography (5 pairs of references, usually
because dates of online publication preceded dates of paper publication).
Table 1. Features characterizing sample of 45 HIA guidelines
Variables and their categories Active Variables
Focus of HIA Includes_List_Health_Determinants Focus All / Focus Policy / Focus Project List H Determin Y / List H Determin N Type of HIA Includes_Examples_CaseStudies_Resources Type All / Type Prospective / Type Retrospective Examples Y / Examples N Level Rapid Screening_Partial Level Rapid Y / Level Rapid N Screening Y / Screening Partial Level Intermediate Screening_Meetings Level Intermed Y / Level Intermed N Screening Meetings Y / Screening Meetings N Level Comprehensive Screening_ComprehensiveTools Level Comprehens Y / Level Comprehens N Screening Tools Y / Screening Tools N Level NoMultiple Scoping_Partial Level NoMultip Y / Level NoMultip N Scoping Y / Scoping Partial Discusses_Integration_with_other_IA Scoping_DiagramsLevel Integrat Other IA Y / Integrat Other IA N Scoping Diagrams Y / Scoping Diagrams N Mentions_Supportive_Policy_Authority Assessment_Partial Supportive Policy Y / Supportive Policy N Assessment Y / Assessment Partial Includes_Principles_or_Values Recommendations_Partial Principles Values Y / Principles Values N Recommendat Y / Recommendat Partial Considers_Equity_Inequalities_across_Population Reporting Equity Y / Equity N Reporting Y / Reporting Partial / Reporting N Encourages_Community_Engagement Reporting_Guidance Community Engag Y / Community Engag N Reporting Guidance Y / Reporting Guidance N Includes_Steering_Committee Evaluation_Monitoring
Steering Committe Y / Steering Committe N Evaluation Monitor Y / Evaluation Monitor Partial / Evaluation Monitor N
Recommends_Community_Profile Evaluation_Monitoring_TalkDecisionmakers Community Profile Y / Community Profile N Talk Decisionmak Y / Talk Decisionmak N Supplementary Variables Screening based on Region Screen Health Only Region International Screen Vague Other Region Europe Screen PoliticFinanc Region AustralAsia Screen Pre-screennin Region NorthAmerica Screen Not Available

Appendices
Leonor Bacelar Nicolau PhD Thesis Appendices- Page A11/A105
A total of 29 references were thus eliminated from the initial 276 references, which
means 247 abstracts were analyzed: 136 references from 2012, 98 references from 2013
and 13 references from 2014. From these, 230 had the original papers also available
(93%). Note that only references until March 2014 were considered in the original HIA
Gateway document.
Two string variables were analyzed separately: the title of the paper, obviously present
for all 247 papers, and the list of keywords, available for only 170 papers. For each string
variable, a vocabulary of repeated words and expressions or segments of words from the
text data was automatically defined and the frequency of appearance of words/segments
was calculated. Only words and segments with a total frequency of 10 or over were taken
for analysis. Table 2 presents the number of words and associated frequency for each
step of the analysis.
Table 2. Process of building the lexical vocabulary
Number of words / segments
Total frequency
Titles for 247 Papers Initial vocabulary only with single words 969 2386 Phase 1: Modified vocabulary only with single words
594 1677 (70% of frequency of initial vocabulary only with single words)
Phase 2: Modified vocabulary with single words and repeated text segments
655 2026
Phase 3: Modified vocabulary with frequency >=10
40 1017 (53% of frequency of total frequency of modified vocabulary with single words and repeated text segments)
Keywords for 170 papers Initial vocabulary only with single words 719 1581 Phase 1: Modified vocabulary only with single words
451 1535 (97% of frequency of initial vocabulary only with single words)
Phase 2: Modified vocabulary with single words and repeated text segments
513 1956
Phase 3: Modified vocabulary with frequency >=10
49 1296 (66% of frequency of total frequency of modified vocabulary with single words and repeated text segments)

Appendices
Appendices- Page A12/A107 Leonor Bacelar Nicolau PhD Thesis
Table 3. Lexical Contingency Table for Paper’s Titles by Publication Year, by Journal Title mentioning “Environment” and Use of Quantification Methods
2012 2013 2014 With Environment
Without Environment Quantification No
quantification
Air 12 5 0 13 4 16 1 North America 11 8 0 1 18 12 7 Asian Australiasian 14 16 0 11 19 23 7 Assessment 45 31 3 34 45 42 37 Benefits 10 0 0 5 5 9 1 Cases 6 5 2 2 11 8 5 Change 8 2 0 3 7 2 8 Children Young People 5 3 3 2 9 10 1 Cities 8 7 0 6 9 12 3 Communities 9 2 0 3 8 6 5 Environment 13 12 3 7 21 15 13 Europe 21 16 0 14 23 24 13 Green Spaces 4 7 1 6 6 9 3 Health 71 54 6 49 82 75 56 Impact 46 37 3 38 48 50 36 Policies 13 11 4 3 25 12 16 Pollution 10 7 0 12 5 15 2 Program 5 4 1 1 9 7 3 Public 10 6 1 5 12 11 6 Related 11 10 0 8 13 7 14 Risks 9 2 0 9 2 9 2 System 8 2 0 1 9 4 6 Through 7 3 0 4 6 1 9 Transportation 9 6 0 7 8 12 3 UK 7 9 1 5 12 10 7 Using 6 9 1 3 13 10 6 Active 6 6 0 2 10 6 6 Food Beverages 8 4 1 1 12 10 3 development 4 6 2 2 10 8 4 Effective 5 5 0 7 3 9 1 planning 3 8 1 6 6 3 9 study 5 11 1 4 13 13 4 Air Pollution 11 6 0 13 4 16 1 Built Environment 8 8 0 3 13 11 5 Climate Change 6 4 0 6 4 2 8 Health Impact 34 27 3 30 34 37 27 Health Impact Assessment 32 24 4 24 36 29 31 Impact Assessment 30 27 3 25 35 28 32 Space planning 4 7 0 9 2 5 6 local level 11 11 0 7 15 9 13

Appendices
Leonor Bacelar Nicolau PhD Thesis Appendices- Page A13/A105
A lexical contingency table was then automatically generated with these repeated words
and segments in rows and the groups defined by categories of selected nominal variables
in columns. The nominal variables crossed with word/segments were: Publication year
(2012, 2013 or 2014); Journal Title with or without “Environment”; Quantification of
methods and results (Quantification or No quantification) – tables 3 and 4. For example,
in Table 3, the word Air appears 12 times in 2012 paper titles, 5 times in 2013 paper titles
and 0 times in 2014 paper titles, 13 times in titles of papers from journals with
‘Environment’ on their titles and 4 times in titles of papers from journals without
‘Environment’ on their titles, 16 times in papers with a quantification nature and 1 time in
papers with no quantification nature.
Table 4. Lexical Contingency Table for Paper’s Keywords by Publication Year, by Journal Title mentioning “Environment” and Use of Quantification Methods
2012 2013 2014 With Environment
Without Environment Quantification No
quantification Activity 16 8 1 8 17 15 10 Air 16 13 0 20 9 26 3 Asia 8 3 0 6 5 5 6 Assessment 46 39 2 50 37 45 42 Pollutants 7 7 0 10 4 14 0 Bicycling 10 3 0 1 12 9 4 Children 4 7 2 2 11 7 6 Climate 11 4 0 9 6 7 8 Community 10 0 1 0 11 4 7 Decision-making 8 5 0 3 10 6 7 Development 10 1 0 7 4 7 4 Disadvantaged 4 3 3 2 8 8 2 Environmental 23 20 3 24 22 23 23 Equity 8 13 0 3 18 10 11 Europe 7 4 0 5 6 7 4 Food Nutrition 9 2 0 0 11 8 3 Green 3 7 1 4 7 9 2 Health 84 80 6 57 113 86 84 Impact 41 32 3 35 41 40 36 Modelling 4 6 0 5 5 5 5 Participation 5 4 1 5 5 2 8 Particulate 4 8 0 11 1 12 0 Physical 7 8 1 5 11 11 5 Planning 7 7 1 6 9 3 12 Policy 26 27 8 12 49 24 37 Pollution 13 13 0 15 11 21 5 Public 14 12 3 8 21 14 15

Appendices
Appendices- Page A14/A107 Leonor Bacelar Nicolau PhD Thesis
Risk 19 20 0 29 10 29 10 Road 8 2 0 4 6 7 3 Social 10 9 0 2 17 11 8 Spatial 7 3 0 3 7 6 4 Traffic 7 3 0 7 3 8 2 Transportation 19 8 0 10 17 16 11 Travel 9 1 0 4 6 5 5 Vehicle 7 3 0 3 7 7 3 Cities Urban 11 5 0 5 11 7 9 cost-effectiveness economic 6 4 0 3 7 7 3 Data 10 3 0 6 7 10 3 Methods 8 7 0 4 11 6 9 Studies Analysis 4 7 0 3 8 7 4 Air Pollution 16 13 0 20 9 25 4 Built Physical Environment 12 12 1 6 19 10 15 Environmental Impact Assessment 7 10 0 16 1 6 11
Health Promotion 2 12 0 2 12 8 6 Health Impact Assessment 67 57 5 61 68 66 63 Impact Assessment 35 29 2 32 34 31 35 Mental Health 1 10 0 2 9 11 0 Physical Activity 7 6 1 4 10 10 4 Public Health 7 6 1 2 12 6 8
These variables were created by going through the information usually available publically
for all papers: titles, keywords and abstracts. Note that some journals without
“Environment” in the title may be also considered journals in a more environmental area
and journals in a more public health area may include so called environmental papers.
That is a limitation of this study that could confound the following multivariate results
and could be solved by a deeper analysis of the complete papers themselves. Yet it would
be time-consuming and the goal was to show that even a rapid analysis could be helpful,
so it was preferred to acknowledge but leave the limitation, not solving it unless results
would be clearly biased.
1.2. Chapter 3.1
A dataset describing ratings from a panel of 7 public health experts from Nova University
in 2011 over 76 policies proposed by a Technical Group planning the Portuguese hospital
reform, on a 10-point scale (1-Very low to 10-Very high) regarding Potential Impact, Ease
of implementation and Implementation costs. Hierarchical cluster analysis and other

Appendices
Leonor Bacelar Nicolau PhD Thesis Appendices- Page A15/A105
complementary methods are used to identify groups of similar policies and prioritize
those more pertinent of being considered for HIA.
The report of the Technical Group planning the Portuguese hospital reform, a 417 pages
document issuing 76 recommendations or policies to be undertaken over the following 3
years, was made available for public discussion in November 2011 (Mendes Ribeiro et al.
2011). The complete set of 76 policies divided by 8 areas is listed in Table 5.
A group of public health experts from the Nova University in Lisbon responded, issuing a
report in December 2011 (Pita-Barros et al. 2011). This report included an analysis by a
panel of 7 public health experts from the Nova University in Lisbon: Pedro Pita Barros,
Adalberto Campos Fernandes, José Fragata, Francisco Ramos, José Caldas de Almeida,
Gilles Dussault and Luis Lapão. This panel rated each of the 76 policies proposed by the
Technical Group planning the Portuguese hospital reform on a 10-point scale (1-Very low
to 10-Very high) regarding 3 dimensions: Potential Impact (in terms of a “better health at
lower costs” goal), Ease of implementation/likelihood to be applied over the next 3 years,
and Implementation costs (including monetary, non-monetary and political costs).
In the present study the 3 raw variables above (10-point likert scales) will be considered,
but also these 3 dimensions recoded into 3 categories ordinal variables (scale values low
1-3, intermediate 4 -7, high 8-10).

Appendices
Appendices- Page A16/A107 Leonor Bacelar Nicolau PhD Thesis
Table 5. Proposed Policies by cluster profile of potential impact and implementation costs Area Policies 1. A more consistent hospital network
1. Draw up hospital referral network (Rede de Referenciação Hospitalar) 2. Hospital network architecture 3. "Heavy" Equipment Charter for Hospital Sector (Carta de Equipamentos “Pesados”) 4. Create the National Institute of Oncology 5. Build Oriental Lisbon Hospital and resize Great Lisbon region hospital network 6. Further develop Strategic Partnership with Social Sector 7. Create and develop Centers of Excellency 8. A new cooperation model between hospitals and Medical Schools
2. A more sustainable financing policy
1. Strategic and operational planning of hospital units 2. Hospital Benchmarking and Strategic Framework for Performance Indicators 3. Unify hospital price tables 4. Transform all hospitals into EPE (Entidade Pública Empresarial – Public Hospital with private management) 5. Draft Multi-Year Program-Contracts (Contratos Programa Plurianuais) - 3 years 6. Incorporate patients’ satisfaction level in hospital performance evaluation 7. Develop an uniform costing and accounting system 8. Improve billing process
3. Healthcare integration to improve patients’ access
1. Define referral criteria between Primary Healthcare and Hospital networks 2. Promote hospital specialties appointments in Primary Healthcare Units 3. Promote operational protocols between Primary Healthcare services (ACES - Agrupamentos de Centros de Saúde) and Hospital services 4. Promote medical appointments through new technologies in specific cases 5. Meet patients screened as “Not-urgent” outside Emergency Hospital Services 6. Speed up patient referral to the RNCCI (Rede Nacional de Cuidados Continuados Integrados – Integrated Continous Care Network) 7. Adjust appointments and surgeries contracting to respective demand
4. More efficient hospitals
1. Increase Ambulatory Surgery rates 10. Redesign pharmaceutical and medical devices buying process 11. Revise legal framework for drug dispensing in hospital outpatient care 12. Develop therapeutic standards targeting therapeutical priorities supported by IT (information technologies) 13. Subject pre-evaluation agreements to contracted programs 14. Pharmaceuticals monitoring system – inpatient and outpatient hospital care 15. Share services among hospital pharmacies 16. Implement system of evaluation and cost benefit analysis of medical devices 17. Adopt guidelines on the use of Medical Devices 18. Implement a Medical Devices reuse Program 19. Share support services 2. Standardize pre-surgery protocols 20. Implement an Energy Efficiency Program 3. Optimize SIGIC operation 4. Create a Use Review National Program 5. Rationalize MCDT (Auxiliary Diagnostic and Therapeutic Means) requests 6. Adjust hospital human resources to healthcare demand 7. Promote health professionals mobility 8. Promote mixed contracts with pay linked to performance 9. Assign new tasks to nursing staff

Appendices
Leonor Bacelar Nicolau PhD Thesis Appendices- Page A17/A105
Table 5. Proposed Policies by cluster profile of potential impact and implementation costs (Cont.)
5. Quality as cornerstone of hospital reform
1. Improve quality and patients safety 10. Develop Clinical Trials in Portugal 2. Reduce nosocomial infection rate 3. Promote Health Professionals recertification 4. Link service provider funding to quality indicators 5. Reduce caesarean sections rate 6. Promote use of uniform set of quality indicators 7. Create a Medical Simulation National Center 8 Carry out regular clinical audits 9. Promote clinical risk control
6. Information and technologies as investment and sustainability factor
1.Guaranty reliability of information
2. Implement shared software tools and applications throughout all the hospital network
3 Implement an integrated computer network
4. Guaranty faster and safer communications
5. Implement a virtualization program in the hospital network
6. Implement Electronic Health Registry (Registo de Saúde Electrónico)
7. Improve governance
1. Change hospital governance model
2. Update hospital classification regarding Board of Directors members’ pay 3. Select Board of Directors members with transparency
4. Assign management contracts
5. Create intermediate management units
6. Evaluate Board of Directors members performance
7. Code of Ethics in the EPE Hospitals
8. Reinfor-cement of citizen’s role
1. Make health information available to citizens
10. Monitor comfort levels in hospital units
2. Make information on the Health System more available
3. Make information on wait times easily available
4. Raise user awareness about NHS costs of each clinical episode (proforma invoice) 5. Implement effectively citizen participation in hospital life
6. Implement principle of freedom of choice of public healthcare providers for patients 7. Make information on clinical benchmark available
8. Implement effectively the Informed Consent
9. Resume the Periodical User Satisfaction Evaluation Program
1.3. Chapter 3.2
Data consists on results of a two-part evaluation survey in 2012 regarding 31 NPs from
the National Health Plan 2004-2010 (67 variables) - a characterization of NPs by their
coordinator regarding 8 different areas and information on regional dissemination by

Appendices
Appendices- Page A18/A107 Leonor Bacelar Nicolau PhD Thesis
Health Regions Administrations. Hierarchical cluster analysis was used for each area
separately, complemented by principal component or multiple correspondence analyses,
k-means cluster analyses and Kruskal-Wallis tests.
Data used in chapter 3.2 consists on results of a two-part evaluation process regarding 31
National Health Programs (NPs) from the Portuguese National Health Plan 2004-2010
(Ministério da Saúde 2013;Ministério da Saúde de Portugal 2004;World Health
Organization 2010). In the first part, program coordinators were asked to answer a
questionnaire characterizing the national program they were responsible for including:
legal context; financing; products such as planning documents, progress reports,
published information for the general population or health professionals, websites,
among others; general and specific aims, as well as related projects; monitoring process
of indicators on health gains, effectiveness, self-evaluation, etc. In the second part of the
evaluation process, Health Regions Administrations answered a questionnaire concerning
the dissemination and implementation of National Health Programs at a regional level,
regarding: the existence of a regional coordinator; active or implemented projects in
2011, annual progress reports between 2009 and 2010; the existence of a regional
evaluation program.
A total of 67 variables were first considered, organized into 9 areas ensuing from the
format of the questionnaire applied in the survey (Figure 1).
Figure 1. Areas and associated number and types of variables in the National Program Evaluation Survey

Appendices
Leonor Bacelar Nicolau PhD Thesis Appendices- Page A19/A105
Table 6. 30 National Health Programs (NPs) analyzed
Programa Nacional (PN) National Program (NP) 1 ASCJR Acção de Saúde para Crianças e Jovens em Risco Health Action for at Risk Children and Youth 2 PNDCV PN para as Doenças Cérebro-Cardiovasculares
(Coordenação Nacional de Doenças Cardiovasculares) NP for Cerebro-Cardiovascular Disease
3 PNIVIH/SIDA PN de Prevenção e Controlo da Infecção VIH/SIDA (Coordenação Nacional para a Infecção VIH/SIDA) NP for HIV/AIDS Infection
4 PNSM PN de Saúde Mental (Coordenação Nacional para a Saúde Mental) NP for Mental Health
5 PNPCDO PN de Prevenção e Controlo das Doenças Oncológicas (Coordenação Nacional para as Doenças Oncológicas)
NP for Oncological Disease Prevention and Control
6 PNCDT PN contra as Drogas e as Toxicodependências NP against Drugs and Addictions 7 PNRPLA PN para a Redução dos Problemas Ligados ao Álcool NP for Reducing Alcohol Related Problems 8 PCO Plataforma Contra a Obesidade (PN para a Promoção
da Alimentação Saudável) NP for Promoting Healthy Eating
9 PNCDR PN Contra as Doenças Reumáticas NP against Rheumatic Diseases 10 PNAS PN de Acreditação em Saúde NP for Certification in Health 11 PNCA PN de Controlo da Asma NP for Asthma Control 12 PNCD PN de Controlo da Dor NP for Pain Control 13 PNCP PN de Cuidados Paliativos NP for Palliative Care 14 PNEP PN de Erradicação da Poliomielite NP for Polio Eradication 15 PNIIDSEV PN de Intervenção Integrada sobre Determinantes da
Saúde Relacionados com os Estilos de Vida NP for Integrated Intervention on Health Determinants related to Life Styles
16 PNLCT PN de Luta Contra a Tuberculose NP against Tuberculosis 17 PNPRA PN de Prevenção das Resistências aos Antimicrobianos NP for Resistances to Antimicrobials
Prevention 18 PNPA PN de Prevenção de Acidentes NP for Accidents Prevention 19 PNPCD PN de Prevenção e Controlo da Diabetes (PN para a
Diabetes) NP for Diabetes
20 PNPCDPOC PN de Prevenção e Controlo da Doença Pulmonar Obstrutiva Crónica
NP for Chronic Obstructive Pulmonary Disease Prevention
21 PNCI PN de Prevenção e Controlo das Infecções Associadas aos Cuidados de Saúde
NP for Healthcare associated Infections Prevention and Control
23 PNSA PN de Saúde Ambiental NP for Environmental Health 24 PNSE PN de Saúde Escolar NP for School Health 25 PNSO PN de Saúde Ocupacional NP for Occupational Health 26 PNSR PN de Saúde Reprodutiva NP for Reproductive Health 27 PNV PN de Vacinação NP for Vaccination 28 PNIVCLG PN Integrado da Vigilância Clínica e Laboratorial da
Gripe National Integrated Program of Clinical and Laboratory Surveillance of Influenza
29 PNSV PN para a Saúde da Visão NP for Eyesight Health 30 PNSPI PN para a Saúde das Pessoas Idosas NP for Elderly Health 31 PNDR PN para Doenças Raras NP for Rare Diseases
The complete list of variables may be found in the Appendices Table 8. Group G2 was not
considered for analysis as apparently the questions were not understood the same way
throughout the sample, namely regarding the number of what was considered partial

Appendices
Appendices- Page A20/A107 Leonor Bacelar Nicolau PhD Thesis
time and full time human resources assigned to the NPs. Group G6 was also not taken
into account since it presented a high number of missing values and the health and
effectiveness gains issues were already broadly being considered in group G5. The
analysis was performed, therefore, using 64 variables (47 binary variables in 4 groups and
17 quantitative variables in 3 groups).
A total of 31 National Health Programs (NPs) was identified as active programs, but only
30 NPs were considered for analysis (Table 6), since the Oral Health NP (code 22)
presented a very high number of missing values.
A set of priority criteria was considered to determine how important each cluster could
be considered. These criteria were subjectively chosen by authors to illustrate how one
can introduce criteria into this methodological approach. Nevertheless an alternative set
of criteria could easily be used.
Here, a NP is considered more relevant for analysis the more often it presents the
following features, by order of importance (from the more to the less important):
a) Having a regional span as extended and in depth as possible;
b) Showing a concern of monitoring health gains, health systems needs and
effectiveness gains;
c) Being a high-priority NP according to the National Health Plans 2004-2010 and
2012-2016;
d) Having been generating a variety of different products for health professionals,
specific population groups and general population (guidelines, published
information, online presence, events, etc);
e) Listing its planning documents, general aims and linking them to specific aims
and/or projects’ aims;
f) Presenting an adequate number of aims (being ambitious but realistic in its
ambitions), coherent with the number of specific aims for each general aim and
the number of projects for each aim;
g) Considering monitoring and evaluating the way aims are being achieved, including
resources allocation.
Each of these criteria is linked to one of the 7 groups of variables considered (table 7) and
is used to rank clusters and respective NPs (section 3.4).

Appendices
Leonor Bacelar Nicolau PhD Thesis Appendices- Page A21/A105
Table 7. 30 Link between each variable group and respective priority criterion, as well as importance rank
Features for being a potential priority for HIA Group of Variables Rank
a) Having a regional span as extended and in depth as possible G9 – Range of regional implementation 1 b) Showing a concern to monitor health gains, health systems needs and effectiveness gains
G5 – Link to health problems, health gains and effectiveness gains 2
c) Being a high-priority NP according to the National Health Plans 2004-2010 and 2012-2016
G1 – Legal Context 3
d) Having a practice of generating a variety of different products to the health professionals, specific groups of the population and the population in general (guidelines, published information, online presence, events, etc)
G3 – Generated Products (planning, informations, etc.) 4
e) Considering the monitorization and evaluation of the way the aims are being achieved, including resources allocation
G8 – Characterization of specific aims in terms of % of total specific aims/projects achieved
5
f) Listing its planning documents, general aims and linking them to specific aims and/or projects’ aims
G4 – Organization and management 6
g) Presenting an adequate number of aims and projects G7 – General aims, specific aims and associated projects 7
1.4. Chapter 4
The database used had as source SPMS/ACSS (Serviços Partilhados do Ministério da
Saúde/Administração Central do Sistema de Saúde) and linked several data origins. It
regarded a pilot project to investigate how enriching it could be to have information on
individual patients linking data from the Portuguese National Health Service regarding
hospital admissions data, primary care data, pharmaceutical drugs consumption and
prescription, as well as the mortality registry. As far as we know, it was the first time
researchers in Portugal were able to get this kind of data and various procedures had to
be taken in order to safeguard the anonymity of patients and their rights.
The data consisted on a sample of all adults (≥20 years old) admitted in a Portuguese
National Health Service (NHS) Hospital with acute myocardial infarction diagnosis during
the second semester of 2012 and followed in the NHS primary care network regularly
during 2013 (over 2 quarters with appointments with a general practitioner) – data
source SPMS/ACSS (Serviços Partilhados do Ministério da Saúde/Administração Central
do Sistema de Saúde). Patients with no resuscitation / only comfort measures information
or discharged against medical opinion were excluded.
Variables for analysis included:

Appendices
Appendices- Page A22/A107 Leonor Bacelar Nicolau PhD Thesis
• The mortality outcome under study: being deceased or not at December 31 2013;
• 4 indicators regarding having information registered or not concerning Blood
Pressure, Cholesterol, Triglycerides, Waist Circumference, Body Mass Index (BMI).
BMI was either existent in the database or was calculated whenever the values for
weight and height were both available;
• The 5 health regions of residence Norte, Centro, LVT, Alentejo and Algarve;
• Demographic variables of sex and age;
• 4 hospital admission severity variables, namely: having one or more hospital
readmissions during the second semester of 2012, having undertaken surgery
during hospital admission, having a mean admission duration over 6 days, having a
hospital admission with 6 or more diagnosis associated.
Note that the inclusion criterion of being followed in the NHS primary care network
regularly during 2013, guarantying that each patient has at least 3 quarters with
appointments with a general practitioner, means to assure that each patient has had the
same opportunity of having information registered about their condition. Any patient
within the study has had accordingly appointments with a general practitioner, even if he
or she has died during the follow up period of 2013.

Appendices
Leonor Bacelar Nicolau PhD Thesis Appendices- Page A23/A105
2. Main Statistical Methodologies
A diversity of statistical methodologies was used throughout the various thesis chapters,
depending on our particular purpose for each of them. Table 8 presents the main
statistical methodologies used in each chapter. A brief presentation of the application of
these methods within each chapter follows. A significance level of 5% was used whenever
statistical tests were applied.
Table 8. Main Statistical Methodologies by Chapter
Chapter 2 Chapter 3 Chapter 4
Guides Papers 3.1 Hospital Reform Policies
3.2 National Programs
Univariate and Bivariate exploratory analysis X X X X X
Bivariate inferential analysis: hypothesis tests and CI 95% X X X
Text Mining X Hierarchical cluster analysis X X X X Non Hierarchical Cluster Analysis X X Principal Components Analysis X X X Correspondence Analysis X Multiple Correspondence Analysis X X X X Logistic Regression & ORs X
2.1. Chapter 2
In Chapter 2, two datasets were considered:
- a table characterizing 45 Health Impact Assessment (HIA) guides proposed by
authors Hebert et al. of paper “Health impact assessment: A comparison of 45
local, national and international guidelines”, to which Multivariate
Correspondence Analysis and Hierarchical Cluster Analysis were applied to identify
common and distinct features between guides and create similar guide profiles.
- A dataset of 247 HIA papers from 2012 to 2014 included on the list of HIA
Bibliography published and updated regularly by the HIA Gateway associated to
Public Health England was built, taking titles of those papers on the one hand, and
keywords when available on the other hand. Text mining analysis was applied to
obtain a lexical contingency table , which was then related to only 3 characteristics

Appendices
Appendices- Page A24/A107 Leonor Bacelar Nicolau PhD Thesis
registered by us for each paper (publication year, whether the title of the journal
where it was published had the word “environment” and if it applied some
quantification methods and results) through hierarchical cluster analysis and
correspondence analysis.
2.2. Chapter 3.1
In Chapter 3.1, a dataset describing ratings from a panel of 7 public health experts from
Nova University in 2011 over 76 policies proposed by a Technical Group planning the
Portuguese hospital reform, on a 10-point scale (1-Very low to 10-Very high) regarding
Potential Impact, Ease of implementation and Implementation costs. Hierarchical cluster
analysis and other complementary methods were used to identify groups of similar
policies and prioritize those more pertinent of being considered for HIA.
Univariate exploratory analysis was performed regarding the 10-point scale variables
(mean, standard variation, median, percentiles 25 and 75, minimum and maximum) and
the recoded variables (frequency and percentage).
Hierarchical cluster analysis (with squared Euclidean distance and Ward’s aggregation
criteria (Hair et al. 2006) was used to identify groups of similar policies in terms of the 3
variables considered and to prioritize those more pertinent of being considered in a HIA.
A 7 clusters partition of similar policies was selected for further analysis. The number and
identification of policies were accessed for each cluster. Descriptive statistics were also
calculated for each cluster (mean, standard variation, median, percentiles 25 and 75, min
and max), and scatter diagrams were constructed to biplot the 3 analyzed variables in
terms of cluster identification.
The quality of the partition was accessed by applying non-hierarchical cluster analysis (k-
means) with random seeds and also using the cluster centroids as seeds, to compare the
clusters’ composition (Hair, Black, Babin, Anderson, & Tatham 2006). Tables with counts,
column percentages and adjusted residuals were built and Fisher Exact Tests with Monte
Carlo significance based on 10,000 sampled tables were used. Kruskal-Wallis tests and
associated multiple comparisons tests (Daniel 2009) were additionally used to identify

Appendices
Leonor Bacelar Nicolau PhD Thesis Appendices- Page A25/A105
statistically significant differences among clusters, that is to identify which clusters were
the most distinct between them, and concerning which variables or dimensions.
Principal Component Analysis (PCA) and Multiple Correspondence Analysis (MCA) were
used as complementary multivariate methods (Hair, Black, Babin, Anderson, & Tatham
2006). PCA was applied to the 10-point scale variables to access the more important
dimensions for cluster interpretation. The 2 first components, responsible for 80% of the
total variance, were selected for analysis. MCA, applied to the recoded variables and
using cluster identification as supplementary variable, further complemented the
analysis, by identifying the most relevant categories to differentiate among clusters.
2.3. Chapter 3.2
In Chapter 3.2, data consists on results of a two-part evaluation survey in 2012 regarding
31 NPs from the National Health Plan 2004-2010 (67 variables) - a characterization of NPs
by their coordinator regarding 8 different areas and information on regional
dissemination by Health Regions Administrations.
An univariate descriptive analysis was performed to generally characterize the set of NPs
and also with a data validation concern. These results were not presented within the
thesis report, since the multivariate proposed approach summarizes main univariate
findings and is also the main focus of this research.
In this two-steps approach, hierarchical cluster analysis was applied to each group of
variables to classify NPs, using as proximity measure the Ochiai coefficient for groups of
binary variables and the squared Euclidean distance for groups of quantitative variables,
as well as the average linkage aggregation criterion for all variables.
For groups of quantitative variables k-means non-hierarchical clusters were used (based
on centroids from the hierarchical cluster analysis’ partition) to validate hierarchical
cluster analysis’ selected partitions (Hair, Black, Babin, Anderson, & Tatham 2006;Saporta
2011).
Multiple correspondence analysis (MCA) and principal components analysis (PCA) were
applied respectively to binary and quantitative variables, as an aid in profiling the various

Appendices
Appendices- Page A26/A107 Leonor Bacelar Nicolau PhD Thesis
clusters of selected partitions. Crosstabs with column percentages and adjusted residuals,
as well as Fisher Exact Tests (with a significance level of 5%), were used to identify more
significant binary variables and relevant clusters. For quantitative variables, descriptive
statistics by cluster (mean, median, standard deviation, quartiles) and Kruskal-Wallis tests
and associated multiple comparisons tests (Daniel 2009) were additionally employed to
identify more relevant differences among clusters, that is to identify which clusters were
the most distinct between them, and concerning which variables.
Since each group of variables corresponds to a priority criteria, for each group of
variables, the partition or clusters of NPs obtained may be ranked as to being more or less
evolved regarding to the associated criterion. The clusters of each partition are given a
color coded priority level and each NP is then evaluated according to this color coded
priority scheme. For each group of variables, color green is associated with the clusters
more evolved regarding the criterion linked to that group of variables, color yellow to an
intermediate level of evolvement and color red to a low level of evolvement. Clusters
with only one NP associated are identified in light grey and are analyzed individually. The
top NPs candidates for HIA are consequently easily identifiable, by being the ones
integrated more often in clusters linked to the color green.
2.4. Chapter 4
In Chapter 4, we started by analyzing the association between a policy and equity. If a
relevant association between policy and inequities was found, then the association
between the policy and the health event of interest should be studied subject to equity
aspects. If not, the study could ultimately carry on without great concerns regarding these
equity issues in particular.
We took all the adults admitted in hospitals for acute myocardial infarction during the
second semester of 2012, followed regularly in primary care during 2013, always within
the National Health Service in Portugal. The policy whose impact is to be assessed in a HIA
context is an Electronic Health Records (EHR) policy to promote a uniform registration of
information regarding indicators Blood Pressure, Cholesterol, Triglycerides, Waist
Circumference and Body Mass Index. The health impact of interest is the mortality status

Appendices
Leonor Bacelar Nicolau PhD Thesis Appendices- Page A27/A105
at the end of the period of study, running from after the hospital admission during the 2nd
semester of 2012 until December 31 2013. The equity aspect under analysis concerns
regional differences in Portugal, since not assuring a uniform application of the policy
throughout all the 5 health regions of residence (Norte, Centro, LVT, Alentejo and
Algarve) may increase regional health inequities.
Statistical methodologies differ depending on the stage of the study undertaken. In the
first stage an association between registering or not indicators and regions of residence
was regarded and in the second stage the association between mortality and registering
or not indicators by region was considered. In each stage, a bivariate approach was first
undertaken with contingency tables, independence chi-square or Fisher exact tests
(Daniel 2009), followed by a multivariate approach based on logistic regression with Odds
Ratios (Kleinbaum and Klein 2010), where crude results were calculated and then
adjusted results after controlling for sex, age and sex and age interaction, as well as
hospital admission severity indicators, and on multivariate exploratory data analysis such
as principal components analysis or multivariate correspondence analysis (Hair, Black,
Babin, Anderson, & Tatham 2006;Saporta 2011).
In the first stage, the association between each of the registered indicators (Blood
Pressure, Cholesterol, Triglycerides, Waist Circumference, BMI) and the region of
residence (Norte, Centro, LVT, Alentejo and Algarve) was analyzed initially with a bivariate
approach. Contingency tables were built for each health indicator by region of residence
with percentages of registration and no registration by region, adjusted residuals,
multiple comparisons, comparing proportions adjusted by Bonferroni whenever justified
and Independence Chi Square Tests. Regarding this approach, only percentages and
Independence Chi-Square Tests results are presented here.
Then, a multivariate statistical approach was undertaken in a crude way (with Algarve as
reference category whenever necessary) and then after controlling for Sex, Age and
Sex*Age. Crude Odds Ratios (OR) were calculated, as well as respective CI95% and
statistical significance, with Logistic Regressions using each Registered Indicator as
dependent variable and Region of residence as independent variable (with Algarve as
reference category). Adjusted OR were calculated, as well as respective CI95% and
statistical significance, with Logistic Regressions using each Registered Indicator as a

Appendices
Appendices- Page A28/A107 Leonor Bacelar Nicolau PhD Thesis
dependent variable, Region of residence as independent variable (with Algarve as
reference category), adjusted by Sex, Age and considering their interaction Sex*Age.
Adjustments by the 4 Admission Severity indicators weren’t considered since the small
sample size when compared with the number of categories created instability in the
estimated models. Algarve was chosen as reference category since it presented the
higher percentage of no registration for almost all indicators. Finally, Principal Component
Analysis (PCA) was applied on the OR from different indicators and regions to help
summarize the previous findings as an easier way to visualize results.
In the second stage, the association between not registering each of the indicators and
the mortality outcome was first assessed through 2x2 contingency tables for each
Registered Indicator by Outcome, with percentages of registration and no registration
within the overall sample and for each region, adjusted residuals and Fisher Exact Tests.
Only percentages and Fisher Exact Tests results are presented in this document.
Crude OR were calculated, as well as respective CI95% and statistical significance, initially
in an overall approach with Logistic Regressions using the Mortality Outcome as
dependent variable and each Registered Indicator as independent variable. Then adjusted
OR were calculated, as well as respective CI95% and statistical significance, with Logistic
Regressions using the Mortality Outcome as a dependent variable and each Registered
Indicator as independent variable, adjusted by Sex, Age and considering interaction
Sex*Age and afterwards also by the 4 Admission Severity indicators. Subsequently the
overall OR and both types of adjusted OR were calculated also controlling for region (with
Algarve as reference region). Finally, the overall OR and both types of adjusted OR were
stratified by region. Our focus for analysis was the OR obtained through the stratified
models, adjusted by Sex, Age, Sex*Age interaction and the 4 Admission Severity
indicators. Note that data from Algarve did not generate reliable solutions for indicators
Cholesterol, Triglycerides and Waist circumference and gave higher limits for the 95%CI
for OR regarding Blood Pressure and especially BMI. Data from Alentejo generated
reliable solutions only for Waist circumference and also gave us higher limits for the
95%CI for OR regarding BMI. Norte generated high OR and related limits of the 95%CI for
OR regarding Cholesterol and Triglycerides.

Appendices
Leonor Bacelar Nicolau PhD Thesis Appendices- Page A29/A105
All the logistic regression approaches were produced imposing the presence of all the
variables with the Enter method. Complementary variables were also additionally
selected through a Stepwise forward method to check the robustness of the choice
process of variables. The results of the models obtained through the Enter method are
the ones analyzed here.
Lastly Multiple Correspondence Analysis (MCA) was applied using all categorical variables
under study.
3. Statistical Software
Statistical analyses were generally conducted using the IBM-SPSS software (versions 19
through 22) and SPAD version 3.5.
Table 9. Statistical Software used by Chapter
Chapter 2 Chapter 3 Chapter 4
Guides Papers 3.1 Hospital
Reform Policies
3.2 National Programs
IBM SPSS version 19 X IBM SPSS version 21 X X IBM SPSS version 22 X X SPAD version 3.5 X X

Appendices
Appendices- Page A30/A107 Leonor Bacelar Nicolau PhD Thesis
4. References
DANIEL, W. W. (2009) Biostatistics – A Foundation for Analysis in the Health Sciences, 9th ed. John Wiley&Sons.
HAIR, J. F., BLACK, B., BABIN, B., ANDERSON, R. E. & TATHAM, R. L. (2006) Multivariate Data Analysis, 6th ed. Prentice Hall.
HEBERT, K. A., WENDEL, A. M., KENNEDY, S. K. & DANNENBERG, A. L. (2012) Health impact assessment: A comparison of 45 local, national and international guidelines. Environmental Impact Assessment Review, 34, 74-82.
HIA GATEWAY (2014) HIA, MWIA and SEA Bibliography 21. HIA Gateway, West Midlands Public Health Observatory.
KLEINBAUM, D. G. & KLEIN, M. (2010) Logistic Regression - A Self-learning Text, Third Edition ed. Springer.
MENDES RIBEIRO, J., BARRETO, A. X. D., VARANDA, J. A. V., PENEDO, J. M. V., CAIADO, J. C. F., NUNES, J. M., SANTOS, N. S., BOTO, P. A. F., IVO, R. S. & SANTOS, T. A. C. (2011) Relatório Final do Grupo Técnico para a Reforma Hospitalar - Os Cidadãos no centro do Sistema, os Profissionais no centro da mudança, Ministério da Saúde do Governo de Portugal.
MINISTÉRIO DA SAÚDE (2013) National Health Plan 2012-2016, Direção Geral de Saúde do Ministério de Saúde.
MINISTÉRIO DA SAÚDE DE PORTUGAL (2004) Plano Nacional de Saúde: Orientações Estratégicas para 2004-2010, Direção-Geral da Saúde do Ministério da Saúde.
PITA-BARROS, P., CAMPOS-FERNANDES, A., RAMOS, F., DUSSAULT, G., CALDAS-ALMEIDA, J., FRAGATA, J. & LAPÃO, L. (2011) "Os Cidadãos no centro do Sistema, os Profissionais no centro da mudança": Contributo para a discussão, Nova Saúde - Universidade Nova de Lisboa, Lisboa, Portugal.
SAPORTA, G. (2011) Probabilités, Analyse des Données et Statistique, 3e édition ed. Éditions Technip.
WORLD HEALTH ORGANIZATION (2010) WHO Evaluation of the National Health Plan of Portugal (2004-2010), World Health Organization Europe; Ministério da Saúde Portugal; Alto Comissariado da Saúde.

Appendices
Leonor Bacelar Nicolau PhD Thesis Appendices- Page A31/A105
Appendix 3: Supplementary Material of Chapter 2
Profiling HIA Guides with cluster analysis methods
Table 4. Year of Publication and Region, for the HIA Guides Sample
Freq % Year_Publication 1995 1 2.2%
2000 1 2.2% 2001 3 6.7% 2002 4 8.9% 2003 4 8.9% 2004 6 13.3% 2005 3 6.7% 2006 2 4.4% 2007 4 8.9% 2008 4 8.9% 2009 3 6.7% 2010 5 11.1% 2011 3 6.7% Unknown 2
Total 43 100,0% Region Region International 4 8,9%
Region Europe 25 55,6% Region AustralAsia 8 17,8% Region NorthAmerica 8 17,8% Total 45 100,0%

Appendices
Appendices- Page A32/A107 Leonor Bacelar Nicolau PhD Thesis
Table 5. Focus, Type, Levels, Integration discussion with other Impact Assessments and Mention of
Supportive Policy Authority, for the HIA Guides Sample
Freq % Focus of HIA Focus All 33 73,3%
Focus Policy 8 17,8% Focus Project 4 8,9% Total 45 100,0%
Type of HIA Type All 9 20,0% Type Prospective 34 75,6% Type Retrospective 2 4,4% Total 45 100,0%
Level Rapid Level Rapid Y 31 68,9% Level Rapid N 14 31,1% Total 45 100,0%
Level Intermediate Level Intermed Y 9 20,0% Level Intermed N 36 80,0% Total 45 100,0%
Level Comprehensive Level Comprehens Y 29 64,4% Level Comprehens N 16 35,6% Total 45 100,0%
Level NoMultiple Level NoMultip Y 9 20,0% Level NoMultip N 36 80,0% Total 45 100,0%
Discusses Integration with other IA
Integrat Other IA Y 29 64,4% Integrat Other IA N 16 35,6% Total 45 100,0%
Mentions Supportive Policy Authority
Supportive Policy Y 27 60,0% Supportive Policy N 18 40,0% Total 45 100,0%
Table 6. Principles and Values Inclusion, Equity Concerns Mention, Community Engagement
Encouragement and Steering Committee Inclusion, for the HIA Guides Sample
Freq % Includes Principles or Values Principles Values Y 30 66,7%
Principles Values N 15 33,3% Total 45 100,0%
Considers Equity Inequalities across Population
Equity Y 43 95,6% Equity N 2 4,4% Total 45 100,0%
Encourages Community Engagement
Community Engag Y 44 97,8% Community Engag N 1 2,2% Total 45 100,0%
Includes Steering Committee Steering Committe Y 40 88,9% Steering Committe N 5 11,1% Total 45 100,0%

Appendices
Leonor Bacelar Nicolau PhD Thesis Appendices- Page A33/A105
Table 7. Community Profile, List of Health Determinants and Examples or Case Studies Ressources
Inclusion, for the HIA Guides Sample
Freq % Recommends Community Profile Community Profile Y 34 75,6%
Community Profile N 11 24,4% Total 45 100,0%
Includes List Health Determinants List H Determin Y 40 88,9% List H Determin N 5 11,1% Total 45 100,0%
Includes Examples CaseStudies Resources
Examples Y 39 86,7% Examples N 6 13,3% Total 45 100,0%
Table 8. Screening and Scoping Features, for the HIA Guides Sample
Freq % Screening Partial Screening Y 38 84,4%
Screening Partial 7 15,6% Total 45 100,0%
Screening Meetings Screening Meetings Y 15 33,3% Screening Meetings N 30 66,7% Total 45 100,0%
Screening ComprehensiveTools Screening Tools Y 6 13,3% Screening Tools N 39 86,7% Total 45 100,0%
Screening based on Screen Health Only 12 26,7% Screen Vague Other 10 22,2% Screen PoliticFinanc 19 42,2% Screen Pre-screennin 2 4,4% Screen Not Available 2 4,4% Total 45 100,0% Scoping Partial Scoping Y 38 84,4%
Scoping Partial 7 15,6% Total 45 100,0%
Scoping DiagramsLevel Scoping Diagrams Y 7 15,6% Scoping Diagrams N 38 84,4% Total 45 100,0%
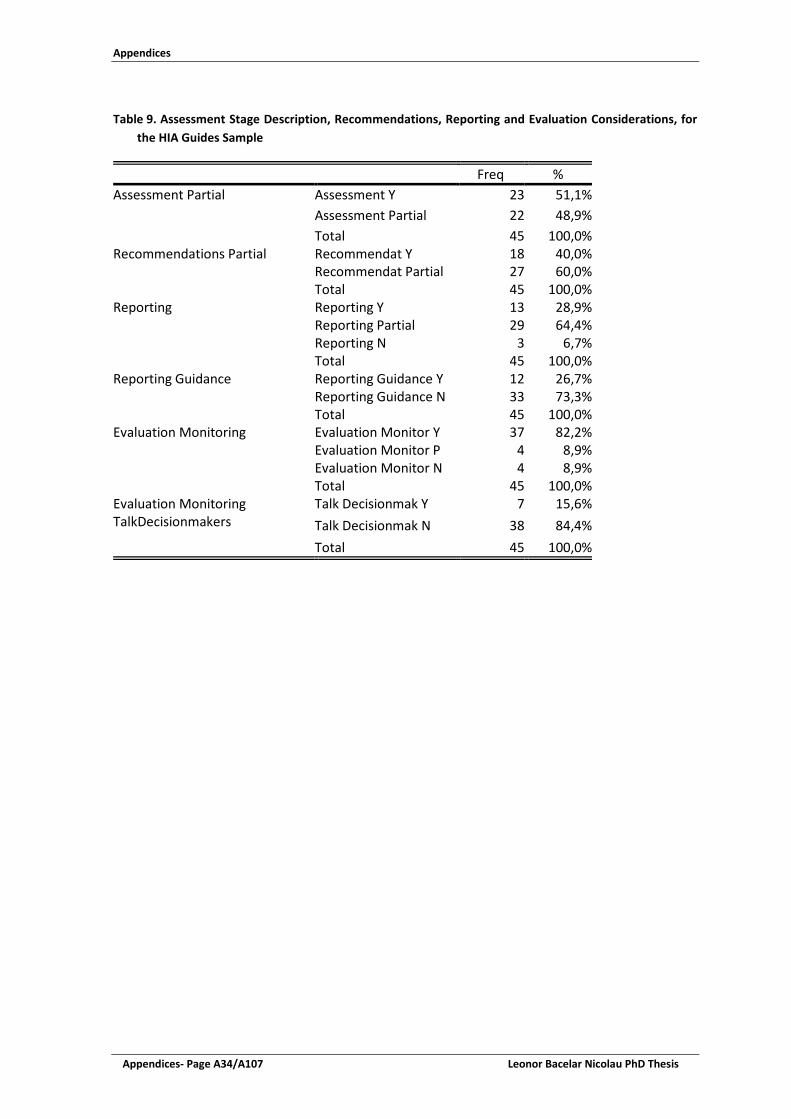
Appendices
Appendices- Page A34/A107 Leonor Bacelar Nicolau PhD Thesis
Table 9. Assessment Stage Description, Recommendations, Reporting and Evaluation Considerations, for
the HIA Guides Sample
Freq % Assessment Partial Assessment Y 23 51,1%
Assessment Partial 22 48,9% Total 45 100,0%
Recommendations Partial Recommendat Y 18 40,0% Recommendat Partial 27 60,0% Total 45 100,0%
Reporting Reporting Y 13 28,9% Reporting Partial 29 64,4% Reporting N 3 6,7% Total 45 100,0%
Reporting Guidance Reporting Guidance Y 12 26,7% Reporting Guidance N 33 73,3% Total 45 100,0%
Evaluation Monitoring Evaluation Monitor Y 37 82,2% Evaluation Monitor P 4 8,9% Evaluation Monitor N 4 8,9% Total 45 100,0%
Evaluation Monitoring TalkDecisionmakers
Talk Decisionmak Y 7 15,6% Talk Decisionmak N 38 84,4% Total 45 100,0%

Appendices
Leonor Bacelar Nicolau PhD Thesis Appendices- Page A35/A105
Figure 8. Factorial Plan 1-3 of Multiple Correspondence Analysis with Hierarchical Cluster Identification as supplementary variable, for the HIA Guides Sample
Figure 9. Zoom on Factorial Plan 1-3 of Multiple Correspondence Analysis with Hierarchical Cluster Identification as supplementary variable, for the HIA Guides Sample

Appendices
Appendices- Page A36/A107 Leonor Bacelar Nicolau PhD Thesis
Table 10. Most relevant features for each of the 5 hierarchical Clusters of HIA Guides (percentages within cluster, total sample and modality, as well as tests and significance levels
Variables / Features or Modalities
% of modality
within cluster
% of modality
within sample
% cluster within
modality
Test Value Sig.
CLUSTER 1 / 5 (9 guides: 20% of total sample) Type of HIA Type All 66.67 20.00 66.67 3.19 0.001
Region Region Europe 100.00 55.56 36.00 2.83 0.002 Mentions_Supportive_Policy_Authority Supportive Policy Y 100.00 60.00 33.33 2.56 0.005
Assessment_Partial Assessment Partial N 88.89 48.89 36.36 2.37 0.009
Assessment_Partial Assessment Y 11.11 51.11 4.35 -2.37 0.009 Mentions_Supportive_Policy_Authority
Supportive Policy N 0.00 40.00 0.00 -2.56 0.005
Type of HIA Type Prospective 22.22 75.56 5.88 -3.52 p<=0.001
CLUSTER 2 / 5 (9 guides: 20% of total sample) No significantly distinctive features
CLUSTER 3 / 5 (11 guides: 24% of total sample)
Scoping_DiagramsLevel Scoping Diagrams Y 63.64 15.56 100.00 4.34 p<=0.001
Reporting_Guidance Reporting Guidance Y 63.64 26.67 58.33 2.70 0.003
Evaluation_Monitoring_TalkDecisionmakers
Talk Decisionmak Y 45.45 15.56 71.43 2.51 0.006
Evaluation_Monitoring_TalkDecisionmakers
Talk Decisionmak N 54.55 84.44 15.79 -2.51 0.006
Focus of HIA Focus All 36.36 73.33 12.12 -2.70 0.003
Reporting_Guidance Reporting Guidance N 36.36 73.33 12.12 -2.70 0.003
Scoping_DiagramsLevel Scoping Diagrams N 36.36 84.44 10.53 -4.34 p<=0.001
CLUSTER 4 / 5 (10 guides: 22% of total sample) Level Rapid Level Rapid N 100.00 31.11 71.43 4.98 p<=0.001
Level NoMultiple Level NoMultip Y 80.00 20.00 88.89 4.63 p<=0.001
Level Comprehensive Level Comprehens N 90.00 35.56 56.25 3.70 p<=0.001
Discusses_Integration_with_other_IA Integrat Other IA Y 100.00 64.44 34.48 2.50 0.006
Discusses_Integration_with_other_IA
Integrat Other IA N 0.00 35.56 0.00 -2.50 0.006
Level Comprehensive Level Comprehens Y 10.00 64.44 3.45 -3.70 p<=0.001
Level NoMultiple Level NoMultip N 20.00 80.00 5.56 -4.63 p<=0.001 Level Rapid Level Rapid Y 0.00 68.89 0.00 -4.98 p<=0.001

Appendices
Leonor Bacelar Nicolau PhD Thesis Appendices- Page A37/A105
Table 10. (Continuation) Most relevant features for each of the 5 hierarchical Clusters of HIA Guides (percentages within cluster, total sample and modality, as well as tests and significance levels
Variables / Features or Modalities
% of modality
within cluster
% of modality
within sample
% cluster within
modality
Test Value Sig.
CLUSTER 5 / 5 (6 guides: 13% of total sample) Scoping_Partial Scoping Partial 100.00 15.56 85.71 4.78 p<=0.001
Screening_Partial Screening Partial 66.67 15.56 57.14 2.73 0.003
Evaluation_Monitoring Evaluation Monitor N 50.00 8.89 75.00 2.55 0.005
Screening_Partial Screening Y 33.33 84.44 5.26 -2.73 0.003 Scoping_Partial Scoping Y 0.00 84.44 0.00 -4.78 p<=0.001
Table 11. Identification of Guides within each cluster of the 5 clusters Partition
Title of Guide Author / Publisher CLUSTER 1 /5 HIAd as part of strategic environmental assessment
Breeze and Lock/WHOe Regional Office for Europe
Resource for HIA: Volume I Ison/ NHSg Executive London Introducing health impact assessment (HIA): Informing the decision-making process
Taylor and Blair-Stevens./ Health Development Agency, Department of Health
An easy guide to HIA for local authorities Egbutah and Churchill/Luton Borough Council, Luton HAZh Guidance note: health impact assessments Essex Planning Officers Association Healthy Urban Planning: Supplementary Planning Document
City of Stoke on Trent
A guide to HIA: focusing on social and environmental sustainability
Swedish National Institute of Public Health
HIA guidance Metcalfe et al./ Institute of Public Health in Ireland Introductory guide to the evaluation of impact on health in Switzerland
Diallo/ Swiss Platform on HIA and Health Promotion Switzerland
CLUSTER 2 /5 The Merseyside guidelines for health impact assessment
Scott-Samuel et al./ International HIA Consortium
A training manual for HIA University of Birmingham, Department of Public Health and Epidemiology
More than a statement of the crushingly obvious: a critical guide to HIA
Kemm/ West Midlands Public Health Observatory
HIA intersectoral health policy: theory and application
Penris and den Broeder/Netherlands National Institute for Public Health and the Environment
Equity focused HIA framework Mahoney et al./Australasian Collaboration for Health Equity Impact Assessment
HIA: a guide for service providers Public Health Services, Queensland Health A guide to HIA Public Health Commission HIA quick guide NACCHOi UCLA HIA training manual Agyekum et.al./UCLAj

Appendices
Appendices- Page A38/A107 Leonor Bacelar Nicolau PhD Thesis
Table 11. (Continuation) Identification of Guides within each cluster of the 5 clusters Partition
CLUSTER 3 /5 European policy HIA: a guide EPHIAf Project Group/ International HIA Consortium HIA toolkit for cities: Document 1 Vision to action
WHO Regional Office for Europe
Using HIA to make better decisions: a simple guide
West Midlands Directors of Public Health Group
Leeds impact assessment toolkit for public health practitioners
Dolman and Swift/ Leeds City Council
Rapid HIA a guide to research Harris/ New Deal for Communities Improving health and reducing inequalities: a practical guide to HIA
Welsh HIA Support Unit, Cardiff University
HIA: a practical guide Harris et al./ University of New South Wales, Australia A guide to HIA: a policy tool for New Zealand Public Health Advisory Committee, New Zealand Wha-nau- Ora HIA Ministry of Health, New Zealand Comprehensive health assessment toolbox (CHAT)
Peter Brett Associates
Introduction to HIA International Finance Corporation CLUSTER 4 /5 Local Development Framework: HIA South Cambridgeshire District Council Developing HIA in Wales Health Promotion Division, National Assembly for Wales HIA: a guide for local authorities Health Scotland HIA guidelines National Public Health Partnership, Commonwealth of
Australia Minimum elements and practice standards for HIA
North American HIA Practice Standards Working Group
Canadian handbook on HIA: volume 1: the basics
Federal/ Provincial/ Territorial Committee on Environmental and Occupational Health
HIA: a guide for practice Bhatia/ Human Impact Partners A guide for HIA Bhatia/ California Department of Health Thailand’s rules and procedures for the HIA of public policies
HIA Coordinating Unit/ National Health Commission Office Thailand
HIA: international best practice principles Quigley et al./ International Association for Impact Assessment
CLUSTER 5 /5 The Lincolnshire HIA process and tool Benson Human impact assessment as a tool of welfare management
Kauppinen and Nelimarkka/ National Research and Development Centre for Welfare and Health
Impact assessment of policies and services: guidelines and proforma
West Dunbartonshire Council
Community HIA tool Antigonish Town & County Community Health Board Rapid HIA toolkit Forsyth/University of Minnesota, Design for Health GEOk Health: methodology for integrated environment and health assessment a focus on Latin America and the Caribbean
Eduardo Schutz et al./ UNEPl/ PAHOm/WHO

Appendices
Leonor Bacelar Nicolau PhD Thesis Appendices- Page A39/A105
Profiling HIA papers with text mining analysis methods
General Description of HIA Papers Sample
Table 12. Origin of Author’s Affiliation, for the HIA Papers Sample
Count % Origin of Affiliations UK 77 31,7%
USA 65 26,7% Australia 26 10,7% The Netherlands 16 6,6% Canada 14 5,8% Spain 12 4,9% Italy 11 4,5%
France 11 4,5% Denmark 10 4,1% Ireland 9 3,7% Switzerland 8 3,3% Belgium 7 2,9% Germany 7 2,9%
Sweden 6 2,5% China 6 2,5% Norway 6 2,5% Finland 5 2,1% Israel 5 2,1% South Africa 5 2,1% New Zealand 4 1,6% Korea 4 1,6% Hungary 3 1,2% Brazil 3 1,2% India 3 1,2% Poland 3 1,2% Austria 3 1,2% Greece 3 1,2% Estonia 2 0,8% Iran 2 0,8% Portugal 2 0,8% Colombia 2 0,8% Japan 2 0,8% Slovenia 1 0,4% Fiji 1 0,4% Taiwan 1 0,4% Total 243 100,0%

Appendices
Appendices- Page A40/A107 Leonor Bacelar Nicolau PhD Thesis
Table 13. Country Focus of Analysis, for the HIA Papers Sample
Count % Country Focus UK 45 26,5%
USA 40 23,5% Europe 23 13,5% Australia 14 8,2% Spain 8 4,7% Canada 7 4,1% The Netherlands 7 4,1% Italy 6 3,5% Ireland 5 2,9% Israel 5 2,9% New Zealand 3 1,8% China 3 1,8% Hungary 2 1,2% Belgium 2 1,2% Iran 2 1,2% Denmark 2 1,2% Germany 2 1,2% Korea 2 1,2% India 2 1,2% France 2 1,2% Norway 2 1,2% Finland 2 1,2% Cameroon 1 0,6% Poland 1 0,6% Vanuatu 1 0,6% Taiwan 1 0,6% Total 170 100,0%
Table 14. Number of Authors, Affiliations and Countries within Affiliations, for the HIA Papers
Sample
Mean Standard Deviation Median Percentile 25 Percentile 75 Minimum Maximum N Number of authors 4,4 2,8 4,0 2 6 1 17 247 Number of affiliations 3,0 1,9 2,0 2 4 1 13 246 Number of countries in affiliations 1,5 ,9 1,0 1 2 1 6 247

Appendices
Leonor Bacelar Nicolau PhD Thesis Appendices- Page A41/A105
Text mining Analysis of the Titles of Papers Table 15. Lexical Contingency Table for Paper’s Titles by Publication Year, by Journal Title
mentioning “Environment” and Use of Quantification Methods
2012 2013 2014 With Environment
Without Environment Quantification No
quantification
Air 12 5 0 13 4 16 1 North America 11 8 0 1 18 12 7 Asian Australiasian 14 16 0 11 19 23 7 Assessment 45 31 3 34 45 42 37 Benefits 10 0 0 5 5 9 1 Cases 6 5 2 2 11 8 5 Change 8 2 0 3 7 2 8 Children Young People 5 3 3 2 9 10 1 Cities 8 7 0 6 9 12 3 Communities 9 2 0 3 8 6 5 Environment 13 12 3 7 21 15 13 Europe 21 16 0 14 23 24 13 Green Spaces 4 7 1 6 6 9 3 Health 71 54 6 49 82 75 56 Impact 46 37 3 38 48 50 36 Policies 13 11 4 3 25 12 16 Pollution 10 7 0 12 5 15 2 Program 5 4 1 1 9 7 3 Public 10 6 1 5 12 11 6 Related 11 10 0 8 13 7 14 Risks 9 2 0 9 2 9 2 System 8 2 0 1 9 4 6 Through 7 3 0 4 6 1 9 Transportation 9 6 0 7 8 12 3 UK 7 9 1 5 12 10 7 Using 6 9 1 3 13 10 6 Active 6 6 0 2 10 6 6 Food Beverages 8 4 1 1 12 10 3 development 4 6 2 2 10 8 4 Effective 5 5 0 7 3 9 1 planning 3 8 1 6 6 3 9 study 5 11 1 4 13 13 4 Air Pollution 11 6 0 13 4 16 1 Built Environment 8 8 0 3 13 11 5 Climate Change 6 4 0 6 4 2 8 Health Impact 34 27 3 30 34 37 27 Health Impact Assessment 32 24 4 24 36 29 31 Impact Assessment 30 27 3 25 35 28 32 Space planning 4 7 0 9 2 5 6 local level 11 11 0 7 15 9 13 Example: The word Air appears: 12 times in 2012 paper titles, 5 times in 2013 paper titles and 0 times in 2014 paper titles; 13 times in titles of papers from journals with ‘Environment’ on their titles and 4 times in titles of papers from journals without ‘Environment’ on their titles; 16 times in papers with a quantification nature and 1 time in papers with no quantification nature.

Appendices
Appendices- Page A42/A107 Leonor Bacelar Nicolau PhD Thesis
Figure 10. Factorial Plan 1-2 of lexical vocabulary of 247 papers from 2012-2014, based on paper’s titles – simplified view
Figure 11. Factorial Plan 1-2 of lexical vocabulary of 247 papers from 2012-2014, based on paper’s titles – zoom view

Appendices
Leonor Bacelar Nicolau PhD Thesis Appendices- Page A43/A105
Figure 12. Factorial Plan 1-3 of lexical vocabulary of 247 papers from 2012-2014, based on paper’s titles
Figure 13. Factorial Plan 1-3 of lexical vocabulary of 247 papers from 2012-2014, based on paper’s titles – zoom view

Appendices
Appendices- Page A44/A107 Leonor Bacelar Nicolau PhD Thesis
Text mining Analysis of Keywords
Table 16. Lexical Contingency Table for Paper’s Keywords by Publication Year, by Journal Title mentioning “Environment” and Use of Quantification Methods
2012 2013 2014 With Environment
Without Environment Quantification No
quantification Activity 16 8 1 8 17 15 10 Air 16 13 0 20 9 26 3 Asia 8 3 0 6 5 5 6 Assessment 46 39 2 50 37 45 42 Pollutants 7 7 0 10 4 14 0 Bicycling 10 3 0 1 12 9 4 Children 4 7 2 2 11 7 6 Climate 11 4 0 9 6 7 8 Community 10 0 1 0 11 4 7 Decision-making 8 5 0 3 10 6 7 Development 10 1 0 7 4 7 4 Disadvantaged 4 3 3 2 8 8 2 Environmental 23 20 3 24 22 23 23 Equity 8 13 0 3 18 10 11 Europe 7 4 0 5 6 7 4 Food Nutrition 9 2 0 0 11 8 3 Green 3 7 1 4 7 9 2 Health 84 80 6 57 113 86 84 Impact 41 32 3 35 41 40 36 Modelling 4 6 0 5 5 5 5 Participation 5 4 1 5 5 2 8 Particulate 4 8 0 11 1 12 0 Physical 7 8 1 5 11 11 5 Planning 7 7 1 6 9 3 12 Policy 26 27 8 12 49 24 37 Pollution 13 13 0 15 11 21 5 Public 14 12 3 8 21 14 15 Risk 19 20 0 29 10 29 10 Road 8 2 0 4 6 7 3 Social 10 9 0 2 17 11 8 Spatial 7 3 0 3 7 6 4 Traffic 7 3 0 7 3 8 2 Transportation 19 8 0 10 17 16 11 Travel 9 1 0 4 6 5 5 Vehicle 7 3 0 3 7 7 3 Cities Urban 11 5 0 5 11 7 9 cost-effectiveness economic 6 4 0 3 7 7 3 Data 10 3 0 6 7 10 3 Methods 8 7 0 4 11 6 9 Studies Analysis 4 7 0 3 8 7 4 Air Pollution 16 13 0 20 9 25 4 Built Physical Environment 12 12 1 6 19 10 15 Environmental Impact Assessment 7 10 0 16 1 6 11

Appendices
Leonor Bacelar Nicolau PhD Thesis Appendices- Page A45/A105
Health Promotion 2 12 0 2 12 8 6 Health Impact Assessment 67 57 5 61 68 66 63 Impact Assessment 35 29 2 32 34 31 35 Mental Health 1 10 0 2 9 11 0 Physical Activity 7 6 1 4 10 10 4 Public Health 7 6 1 2 12 6 8
Figure 14. Factorial Plan 1-2 of lexical vocabulary of 247 papers from 2012-2014, based on paper’s keywords – simplified view
Figure 15. Factorial Plan 1-2 of lexical vocabulary of 247 papers from 2012-2014, based on paper’s keywords – zoom view

Appendices
Appendices- Page A46/A107 Leonor Bacelar Nicolau PhD Thesis
Figure 16. Factorial Plan 1-3 of lexical vocabulary of 247 papers from 2012-2014, based on paper’s keywords
Figure 17. Factorial Plan 1-2 of lexical vocabulary of 247 papers from 2012-2014, based on paper’s keywords – zoom view
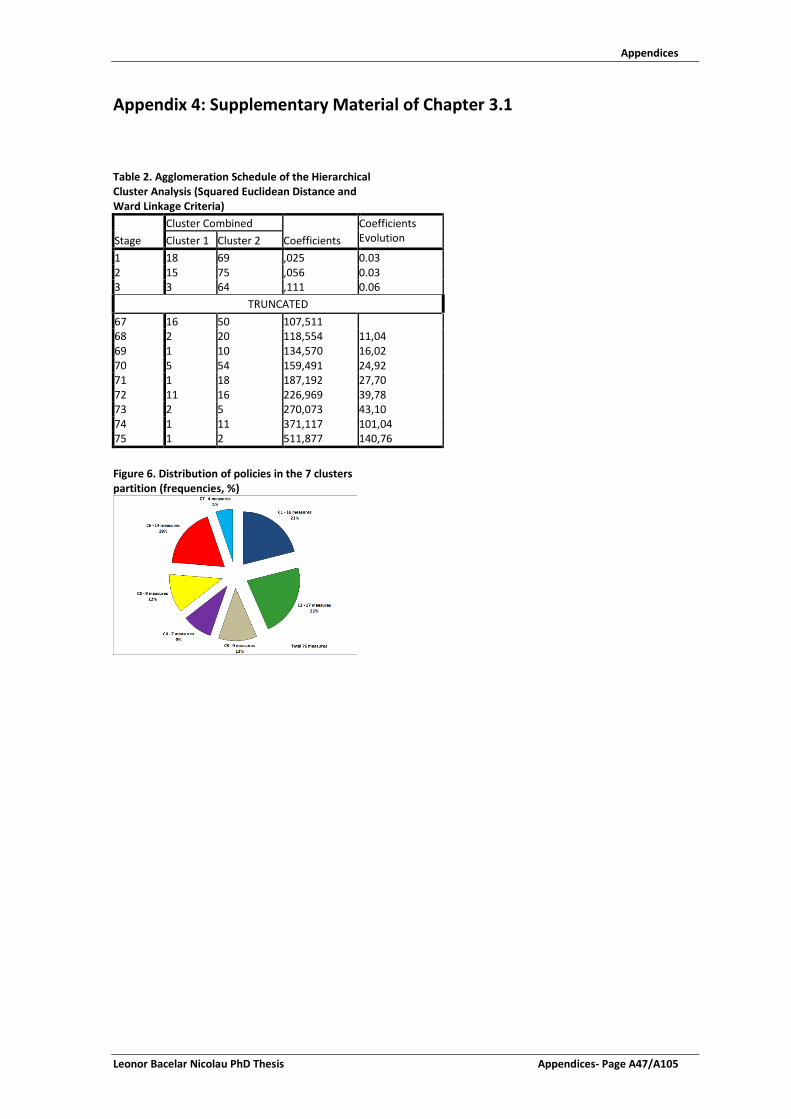
Appendices
Leonor Bacelar Nicolau PhD Thesis Appendices- Page A47/A105
Appendix 4: Supplementary Material of Chapter 3.1
Table 2. Agglomeration Schedule of the Hierarchical Cluster Analysis (Squared Euclidean Distance and Ward Linkage Criteria)
Stage Cluster Combined
Coefficients Coefficients Evolution Cluster 1 Cluster 2
1 18 69 ,025 0.03 2 15 75 ,056 0.03 3 3 64 ,111 0.06
TRUNCATED 67 16 50 107,511 68 2 20 118,554 11,04 69 1 10 134,570 16,02 70 5 54 159,491 24,92 71 1 18 187,192 27,70 72 11 16 226,969 39,78 73 2 5 270,073 43,10 74 1 11 371,117 101,04 75 1 2 511,877 140,76
Figure 6. Distribution of policies in the 7 clusters partition (frequencies, %)

Appendices
Appendices- Page A48/A107 Leonor Bacelar Nicolau PhD Thesis
Table 3. Descriptive Analysis by cluster
Mean Standard Deviation Median P25 P75 Min Max N
Potential Impact (in terms of a “better health at lower costs” goal) 7 clusters partition
1 7,58 1,08 7,5 6,8 8,4 5,00 9,33 16 2 6,87 ,85 7,0 6,4 7,3 5,00 8,00 17 3 8,87 ,77 9,0 8,2 9,3 7,67 10,00 9 4 4,17 ,94 4,0 3,3 5,0 3,00 5,33 7 5 4,72 1,00 5,0 4,5 5,3 2,40 5,67 9 6 6,53 ,64 6,2 6,0 7,0 5,80 7,60 14 7 8,83 ,64 9,0 8,3 9,3 8,00 9,33 4
Ease of implementation/likelihood to be applied over the next 3 years 7 clusters partition
1 6,98 ,76 7,0 6,5 7,5 5,67 8,33 16 2 6,24 ,66 6,3 5,7 6,3 5,50 8,00 17 3 4,91 ,63 5,0 4,7 5,2 4,00 6,00 9 4 5,63 1,24 5,7 4,3 6,7 4,00 7,50 7 5 4,60 1,10 5,0 4,0 5,3 2,67 6,00 9 6 5,38 ,63 5,7 4,7 6,0 4,33 6,00 14 7 6,33 ,54 6,3 6,0 6,7 5,67 7,00 4
Implementation costs (including monetary, non-monetary and political costs) 7 clusters partition
1 3,33 ,64 3,3 3,0 3,8 2,00 4,40 16 2 5,72 ,83 5,5 5,3 5,8 4,50 7,67 17 3 5,94 ,49 6,0 5,7 6,0 5,00 6,60 9 4 2,99 ,62 2,7 2,5 3,7 2,33 3,75 7 5 5,94 ,70 6,0 5,5 6,6 4,67 6,80 9 6 3,54 ,91 3,9 3,3 4,2 1,67 4,50 14 7 8,58 ,57 8,5 8,2 9,0 8,00 9,33 4

Appendices
Leonor Bacelar Nicolau PhD Thesis Appendices- Page A49/A107
Table 4. Descriptive Statistics by cluster according with Low, Intermediate or High Classification
Column % 7 clusters partition C1 n=16
C2 n=17
C3 n=9
C4 n=7
C5 n=9
C6 n=14
C7 n=4
Total N=76
Potential Impact (in terms of a “better health at lower costs” goal)
PI Low 1-3 ,0% ,0% ,0% 28,6% 11,1% ,0% ,0% 3,9% PI Intermediate 4-7 50,0% 76,5% ,0% 71,4% 88,9% 92,9% ,0% 61,8% PI High 8-10 50,0% 23,5% 100,0% ,0% ,0% 7,1% 100,0% 34,2%
Ease of implementation / likelihood to be applied over the next 3 years
EI Low 1-3 ,0% ,0% ,0% ,0% 22,2% ,0% ,0% 2,6% EI Intermediate 4-7 75,0% 94,1% 100,0% 85,7% 77,8% 100,0% 100,0% 89,5% EI High 8-10 25,0% 5,9% ,0% 14,3% ,0% ,0% ,0% 7,9%
Implementation costs (including monetary, non-monetary and political costs)
IC Low 1-3 62,5% ,0% ,0% 57,1% ,0% 35,7% ,0% 25,0% IC Intermediate 4-7 37,5% 94,1% 100,0% 42,9% 100,0% 64,3% ,0% 68,4% IC High 8-10 ,0% 5,9% ,0% ,0% ,0% ,0% 100,0% 6,6%
Figure 7. Differences between initial 7-clusters partition (hierarchical cluster analysis) and 7-clusters partition with non-hierarchical cluster analyses (k-means)

Appendices
Appendices- Page A50/A107 Leonor Bacelar Nicolau PhD Thesis
Table 5. 7 clusters partition of hierarchical cluster analysis) by 7 clusters partition of k-means analysis (75 policies) and 7 clusters partition of k-means analysis with hierarchical cluster centroids as seeds – Count Column % and Adjusted Residuals 7 clusters partition (hierarchical analysis) Total
C1 C2 C3 C4 C5 C6 C7
7 clusters partition (k-means analysis) 75 policies
CL1 Count 12 0 0 0 0 4 0 16 % Col 75,0% 0,0% 0,0% 0,0% 0,0% 28,6% 0,0% 21,3% Adjusted Residual 5,9 -2,4 -1,7 -1,4 -1,6 ,7 -1,1
CL2 Count 2 10 0 0 0 0 0 12 % Col 12,5% 58,8% 0,0% 0,0% 0,0% 0,0% 0,0% 16,0% Adjusted Residual -,4 5,5 -1,4 -1,2 -1,3 -1,8 -,9
CL3 Count 1 0 9 0 0 0 0 10 % Col 6,3% 0,0% 100,0% 0,0% 0,0% 0,0% 0,0% 13,3% Adjusted Residual -,9 -1,8 8,2 -1,1 -1,2 -1,6 -,8
CL4 Count 1 0 0 4 0 0 0 5 % Col 6,3% 0,0% 0,0% 57,1% 0,0% 0,0% 0,0% 6,7% Adjusted Residual -,1 -1,3 -,9 5,6 -,8 -1,1 -,5
CL5 Count 0 6 0 0 7 0 0 13 % Col 0,0% 35,3% 0,0% 0,0% 87,5% 0,0% 0,0% 17,3% Adjusted Residual -2,1 2,2 -1,5 -1,3 5,5 -1,9 -,9
CL6 Count 0 0 0 3 1 10 0 14 % Col 0,0% 0,0% 0,0% 42,9% 12,5% 71,4% 0,0% 18,7% Adjusted Residual -2,2 -2,2 -1,5 1,7 -,5 5,6 -1,0
CL7 Count 0 1 0 0 0 0 4 5 % Col 0,0% 5,9% 0,0% 0,0% 0,0% 0,0% 100,0% 6,7% Adjusted Residual -1,2 -,1 -,9 -,7 -,8 -1,1 7,7
Total Count 16 17 9 7 8 14 4 75 % Col 100,0% 100,0% 100,0% 100,0% 100,0% 100,0% 100,0% 100,0%
7 clusters partition (hierarchical analysis) Total C1 C2 C3 C4 C5 C6 C7
7 clusters partition (k-means analysis with hierarchical cluster centroids as seed)
CL1 Count 15 1 0 0 0 1 0 17 % Col 93,8% 5,9% 0,0% 0,0% 0,0% 7,1% 0,0% 22,4% Adjusted Residual 7,7 -1,9 -1,7 -1,5 -1,7 -1,5 -1,1
CL2 Count 0 15 0 0 0 0 0 15 % Col 0,0% 88,2% 0,0% 0,0% 0,0% 0,0% 0,0% 19,7% Adjusted Residual -2,2 8,1 -1,6 -1,4 -1,6 -2,1 -1,0
CL3 Count 0 1 9 0 0 0 0 10 % Col 0,0% 5,9% 100,0% 0,0% 0,0% 0,0% 0,0% 13,2% Adjusted Residual -1,8 -1,0 8,2 -1,1 -1,2 -1,6 -,8
CL4 Count 1 0 0 4 0 0 0 5 % Col 6,3% 0,0% 0,0% 57,1% 0,0% 0,0% 0,0% 6,6% Adjusted Residual -,1 -1,2 -,8 5,7 -,8 -1,1 -,5
CL5 Count 0 0 0 0 9 0 0 9 % Col 0,0% 0,0% 0,0% 0,0% 100,0% 0,0% 0,0% 11,8% Adjusted Residual -1,6 -1,7 -1,2 -1,0 8,7 -1,5 -,8
CL6 Count 0 0 0 3 0 13 0 16 % Col 0,0% 0,0% 0,0% 42,9% 0,0% 92,9% 0,0% 21,1% Adjusted Residual -2,3 -2,4 -1,6 1,5 -1,6 7,3 -1,1
CL7 Count 0 0 0 0 0 0 4 4 % Col 0,0% 0,0% 0,0% 0,0% 0,0% 0,0% 100,0% 5,3% Adjusted Residual -1,1 -1,1 -,8 -,7 -,8 -1,0 8,7
Total Count 16 17 9 7 9 14 4 76 % Col 100,0% 100,0% 100,0% 100,0% 100,0% 100,0% 100,0% 100,0%

Appendices
Leonor Bacelar Nicolau PhD Thesis Appendices- Page A51/A107
Table 6. Kruskal-Wallis tests of each original variable by cluster membership (hierarchical solution)
Rank of Potential Impact (in terms of a “better health at lower costs” goal)
Ease of implementation/likelihood to be applied over the next 3 years
Implementation costs (including monetary, non-monetary and political costs)
Kruskal Wallis Tests Chi-Square (df = 6) 55,070 42,407 60,353 Asymp. Sig. p<=0,001 * p<=0,001 * p<=0,001 * *. Significant at the 0.05 level. Table 7. Results Summary for PCA Total Variance Explained
KMO and Bartlett's Test
Component
Initial Eigenvalues
Total % of Variance Cumulative % Kaiser-Meyer-Olkin Measure of Sampling Adequacy ,402
1 1,252 41,746 41,746 Bartlett's Test of Sphericity
Approx. Chi- 10,246 2 1,137 37,909 79,654 Square df 3 3 ,610 20,346 100,000 Sig. ,017 Extraction Method: Principal Component Analysis. Table 8. Communalities and Component Matrix of PCA 2 Components Extraction Communalities Component Matrixa Initial Extraction 1 2 Potential Impact (in terms of a “better health at lower costs” goal) 1,000 ,800 ,622 ,643 Ease of implementation/likelihood to be applied over the next 3 years
1,000 ,828 -,346 ,842
Implementation costs (including monetary, non-monetary and political costs)
1,000 ,762 ,864 -,126
Table 9. Model Summary for MCA
Dimension Variance Accounted For Total (Eigenvalue) Inertia % of Variance
1 1,457 ,486 48,556 2 1,310 ,437 43,676 Total 2,767 ,922 Mean 1,383 ,461 46,116

Appendices
Appendices- Page A52/A107 Leonor Bacelar Nicolau PhD Thesis
Table 10. Proposed Policies by cluster profile of potential impact and implementation costs
Cluster profile
Potential Impact (H-High, I-Intermediate, L-Low) H I L
Implementation Costs (H-High, I-Intermediate, L-Low) H I L H L H L
Area Policies C7 C3 C1 C2 C6 C5 C4 1. A more consistent hospital network
1. Draw up hospital referral network (Rede de Referenciação Hospitalar) 2. Hospital network architecture
3. "Heavy" Equipment Charter for Hospital Sector (Carta de Equipamentos “Pesados”) 4. Create the National Institute of Oncology
5. Build Oriental Lisbon Hospital and resize Great Lisbon region hospital network 6. Further develop Strategic Partnership with Social Sector
7. Create and develop Centers of Excellency
8. A new cooperation model between hospitals and Medical Schools
2. A more sustainable financing policy
1. Strategic and operational planning of hospital units
2. Hospital Benchmarking and Strategic Framework for Performance Indicators 3. Unify hospital price tables
4. Transform all hospitals into EPE (Entidade Pública Empresarial – Public Hospital with private management) 5. Draft Multi-Year Program-Contracts (Contratos Programa Plurianuais) - 3 years 6. Incorporate patients’ satisfaction level in hospital performance evaluation
7. Develop an uniform costing and accounting system
8. Improve billing process
3. Healthcare integration to improve patients’ access
1. Define referral criteria between Primary Healthcare and Hospital networks 2. Promote hospital specialties appointments in Primary Healthcare Units
3. Promote operational protocols between Primary Healthcare services (ACES - Agrupamentos de Centros de Saúde) and Hospital services
4. Promote medical appointments through new technologies in specific cases 5. Meet patients screened as “Not-urgent” outside Emergency Hospital Services 6. Speed up patient referral to the RNCCI (Rede Nacional de Cuidados Continuados Integrados – Integrated Continous Care Network) 7. Adjust appointments and surgeries contracting to respective demand
4. More efficient hospitals
1. Increase Ambulatory Surgery rates
10. Redesign pharmaceutical and medical devices buying process 11. Revise legal framework for drug dispensing in hospital outpatient care 12. Develop therapeutic standards targeting therapeutical priorities supported by IT (information technologies) 13. Subject pre-evaluation agreements to contracted programs 14. Pharmaceuticals monitoring system – inpatient and outpatient hospital care 15. Share services among hospital pharmacies
16. Implement system of evaluation and cost benefit analysis of medical devices 17. Adopt guidelines on the use of Medical Devices
18. Implement a Medical Devices reuse Program

Appendices
Leonor Bacelar Nicolau PhD Thesis Appendices- Page A53/A107
19. Share support services
2. Standardize pre-surgery protocols
20. Implement an Energy Efficiency Program
3. Optimize SIGIC operation
4. Create a Use Review National Program
5. Rationalize MCDT (Auxiliary Diagnostic and Therapeutic Means) requests 6. Adjust hospital human resources to healthcare demand 7. Promote health professionals mobility
8. Promote mixed contracts with pay linked to performance
9. Assign new tasks to nursing staff
5. Quality as cornerstone of hospital reform
1. Improve quality and patients safety
10. Develop Clinical Trials in Portugal
2. Reduce nosocomial infection rate
3. Promote Health Professionals recertification
4. Link service provider funding to quality indicators
5. Reduce caesarean sections rate
6. Promote use of uniform set of quality indicators
7. Create a Medical Simulation National Center
8 Carry out regular clinical audits
9. Promote clinical risk control
6. Information and technologies as investment and sustainability factor
1.Guaranty reliability of information
2. Implement shared software tools and applications throughout all the hospital network 3 Implement an integrated computer network
4. Guaranty faster and safer communications
5. Implement a virtualization program in the hospital network
6. Implement Electronic Health Registry (Registo de Saúde Electrónico)
7. Improve governance
1. Change hospital governance model
2. Update hospital classification regarding Board of Directors members’ pay 3. Select Board of Directors members with transparency
4. Assign management contracts
5. Create intermediate management units
6. Evaluate Board of Directors members performance
7. Code of Ethics in the EPE Hospitals
8. Reinfor-cement of citizen’s role
1. Make health information available to citizens
10. Monitor comfort levels in hospital units
2. Make information on the Health System more available
3. Make information on wait times easily available
4. Raise user awareness about NHS costs of each clinical episode (proforma invoice) 5. Implement effectively citizen participation in hospital life
6. Implement principle of freedom of choice of public healthcare providers for patients 7. Make information on clinical benchmark available
8. Implement effectively the Informed Consent
9. Resume the Periodical User Satisfaction Evaluation Program

Appendices
Appendices- Page A54/A107 Leonor Bacelar Nicolau PhD Thesis

Appendices
Leonor Bacelar Nicolau PhD Thesis Appendices- Page A55/A107
Appendix 5: Supplementary Material of Chapter 3.2
Table 8. List of Variables Cod_id V1 Sigla
V2 Designação
G1_V10 Q Portaria
G1_V11 Q Despacho
G1_V12 Q Circular Normativa / Informativa
G1_V13 Q Criação antes PN
G1_V14 Q Criação durante PN
G1_V16 Q Orçamento de Estado
G1_V17 Q Jogos Sociais
G1_V18 Q Ambos
G1_V19 Q Sem financiamento específico
G1_V3 Q DGS
G1_V4 Q ACS
G1_V5 Q INSA
G1_V6 Q UMCCI
G1_V7 Q IDT
G1_V8 Q Lei, Decreto Lei, Resolução AR/CM
G1_V9 Q Decreto Regulamentar
G2_V24 Q Colaboradores sem indicação de horas
G2_V25 Q Colaboradores com indicação de horas
G2_V27 Q Comissão de acompanhamento ou Grupo de Trabalho Nº Entidades
G3_V31 Q DP Programa Planos Estratégicos
G3_V32 Q DP Programa Planos de Actividades
G3_V33 Q DP Projectos Planos de Implementação
G3_V35 Q DP Relatórios de Actividades
G3_V36 Q DP Relatórios de Avaliação
G3_V37 Q DP Relatórios de Projecto
G3_V39 Q OP Orientações técnicas Recomendações
G3_V40 Q OP Manuais de Boas Práticas
G3_V41 Q OP Documentos de Formação
G3_V42 Q OP Artigos Científicos
G3_V43 Q OP Apresentações em reuniões Científicas
G3_V44 Q OP Sites de Internet
G3_V45 Q OP Outros materiais informativos e divulgacao população
G3_V46 Q OP Outros
G4V30 Q Docs de Planeamento
G4V34 Q Docs de Avaliação
G4V38 Q Outras Publicações/Produtos Nº
G4V47 Q Missão Explicitada
G4V63 Q Argumentação justificada de forma sistemática
G4V69_1 Existência de Objectivos específicos associados aos objectivos gerais
G4V75_1 Identificação possível de cumprimento de objectivos propostos
G4V87 Q Cronograma associado a metas
G4V88 Q Análise de risco, barreiras e dificuldades de implementação
G4V89 Q Descrição de processo de responsabilização/"accountability"
G4V90 Q Descrição do processo de avaliação global do plano/programa
G5V49 Q OG caracterizados pbs saude que justifiquem criação do plano
G5V50 Q OG caracterizadosaspectos da organização/resposta do SS e outros que justifiquem criação do plano
G5V51 Q OG adequados aos pbs saude identificados
G5V52 Q OG Descrição dos processos de eleição e definição
G5V53 Q OG Identificados ganhos de saúde
G5V58 Q OG Identificados ganhos de efectividade
G7V48_N Objectivos Gerais Nº
G7V68_N Q Objectivos Específicos Nº
G7V69_N Q OE Projectos próprios a cada objectivo específico Nº total previsto inicialmente
G7V70_N Q OE Projectos próprios a cada objectivo específico Nº total implementado
G8V76_N Q OE Definidas necessidades saúde/população alvo/determinantes
G8V77_N Q OE Definidos ganhos esperados
G8V78_N Q OE Análise de acções propostas prevista
G8V79_N Q OE Parcerias com instituições regionais/locais
G8V80_N Q OE Atribuição de recursos materiais
G8V83_N Q OE Orçamentos e Relatórios de Execução
G8V84_N Q OE Indicadores de operacionalização e concretização
G8V85_N Q OE Avaliação através de metas
G8V86_N Q OE Análise de integração nos sistemas/serviços existentes
G9V111 Tem Coordenador Regional? (nº regiões)
G9V112 Está a ser implementado e tem projectos activos em 2011? (nº regiões)
G9V113 Tem Relatórios de Progresso Anual nos anos 2009-2010? (nº regiões)
G9_V114 Foi realizada ou está prevista uma Avaliação do Programa a nível regional? (nº regiões)

Appendices
Appendices- Page A56/A107 Leonor Bacelar Nicolau PhD Thesis
Figure 5. Hierarchical cluster analysis of NP’s, regarding variables from group G1 – Legal Context

Appendices
Leonor Bacelar Nicolau PhD Thesis Appendices- Page A57/A107
Table 9. Variables from group G1 – Legal Context crossed by 4 cluster partition of hierarchical cluster analysis of NP’s
regarding group G1
Partição de 4 clusters G1 1 2 3 4
Freq % Freq % Freq % Freq %
DGS 0 3 17,6% 4 100,0% 0 0,0% 1 100,0% 1 14 82,4% 0 0,0% 8 100,0% 0 0,0%
ACS 0 15 88,2% 2 50,0% 8 100,0% 1 100,0% 1 2 11,8% 2 50,0% 0 0,0% 0 0,0%
INSA 0 17 100,0% 4 100,0% 8 100,0% 0 0,0% 1 0 0,0% 0 0,0% 0 0,0% 1 100,0%
UMCCI 0 16 94,1% 4 100,0% 8 100,0% 1 100,0% 1 1 5,9% 0 0,0% 0 0,0% 0 0,0%
IDT 0 17 100,0% 2 50,0% 8 100,0% 1 100,0% 1 0 0,0% 2 50,0% 0 0,0% 0 0,0%
Lei, Decreto Lei, Resolução AR/CM
0 16 94,1% 0 0,0% 7 87,5% 1 100,0% 1 1 5,9% 4 100,0% 1 12,5% 0 0,0%
Decreto Regulamentar 0 16 94,1% 3 75,0% 8 100,0% 1 100,0% 1 1 5,9% 1 25,0% 0 0,0% 0 0,0%
Portaria 0 16 94,1% 4 100,0% 8 100,0% 1 100,0% 1 1 5,9% 0 0,0% 0 0,0% 0 0,0%
Despacho 0 2 11,8% 2 50,0% 1 12,5% 1 100,0% 1 15 88,2% 2 50,0% 7 87,5% 0 0,0%
Circular Normativa / Informativa 0 12 70,6% 3 75,0% 6 75,0% 1 100,0% 1 5 29,4% 1 25,0% 2 25,0% 0 0,0%
Criação antes PN 0 17 100,0% 0 0,0% 0 0,0% 0 0,0% 1 0 0,0% 4 100,0% 8 100,0% 1 100,0%
Criação durante PN 0 0 0,0% 4 100,0% 8 100,0% 1 100,0% 1 17 100,0% 0 0,0% 0 0,0% 0 0,0%
Orçamento de Estado 0 9 52,9% 4 100,0% 3 37,5% 0 0,0% 1 8 47,1% 0 0,0% 5 62,5% 1 100,0%
Jogos Sociais 0 15 88,2% 1 25,0% 7 87,5% 1 100,0% 1 2 11,8% 3 75,0% 1 12,5% 0 0,0%
Ambos 0 11 64,7% 3 75,0% 8 100,0% 1 100,0% 1 6 35,3% 1 25,0% 0 0,0% 0 0,0%
Sem financiamento específico 0 16 94,1% 4 100,0% 6 75,0% 1 100,0% 1 1 5,9% 0 0,0% 2 25,0% 0 0,0%

Appendices
Appendices- Page A58/A107 Leonor Bacelar Nicolau PhD Thesis
Table 10. Fisher Exact Tests for Group G1 variables crossed by selected 4 cluster partition
(1) Diferenças patentes entre a classe 2 em que nenhum PNs é da responsabilidade da DGS e a classe 3 em que todos os PNs o são. (2) Só a classe 4, a que está associado apenas 1 PN, é que apresenta valores de resíduos ajustados importantes, pelo que o teste não é adequado (3) A classe 2 distingue-se das restantes por ser a única que inclui PNs da responsabilidade do IDT (4) Todos os PNs da classe 2 foram criados por Lei, Decreto lei, Resolução AR/CM, mas apenas 1 PN da classe 1 o foi. (5) Apenas os PNs que compõem a classe 1 não existiam antes do Plano Nacional de Saúde 2004-2010. (6) Apenas os PNs que compõem a classe 1 foram criados durante a vigência do Plano Nacional de Saúde 2004-2010 (7) A esmagadora maioria dos PNs da classe 2 receberam financiamento dos Jogos Sociais.
Variáveis Valor da Estatística de teste
Sig. (teste bilateral)
Resultado para alfa de 5%
DGS 14,605 0.001 Significativo (1) ACS 5,091 0.174 Não significativo INSA 8,696 0.033 Significativo (2) UMCCI 3,030 1.000 Não significativo IDT 8,487 0.023 Significativo (3) Lei, Decreto lei, Resolução AR/CM
13,850 0.001 Significativo (4)
Decreto regulamentar 3,631 0.375 Não significativo Portaria 3,030 1.000 Não significativo Despacho 6,107 0.081 Não significativo Circular normativa/informativa 0,752 1.000 Não significativo Criação antes PN 33,003 p<=0.001 Significativo (5)
Criação durante PN 33,003 p<=0.001 Significativo (6) Orçamento de estado 5,103 0.139 Não significativo Jogos sociais 6,918 0.042 Significativo (7) Ambos 4,185 0.278 Não significativo Sem financiamento específico 3,099 0.297 Não significativo

Appendices
Leonor Bacelar Nicolau PhD Thesis Appendices- Page A59/A107
Figure 6. Hierarchical cluster analysis of NP’s, regarding variables from group G3– Generated Products (planning,
informations, etc.)
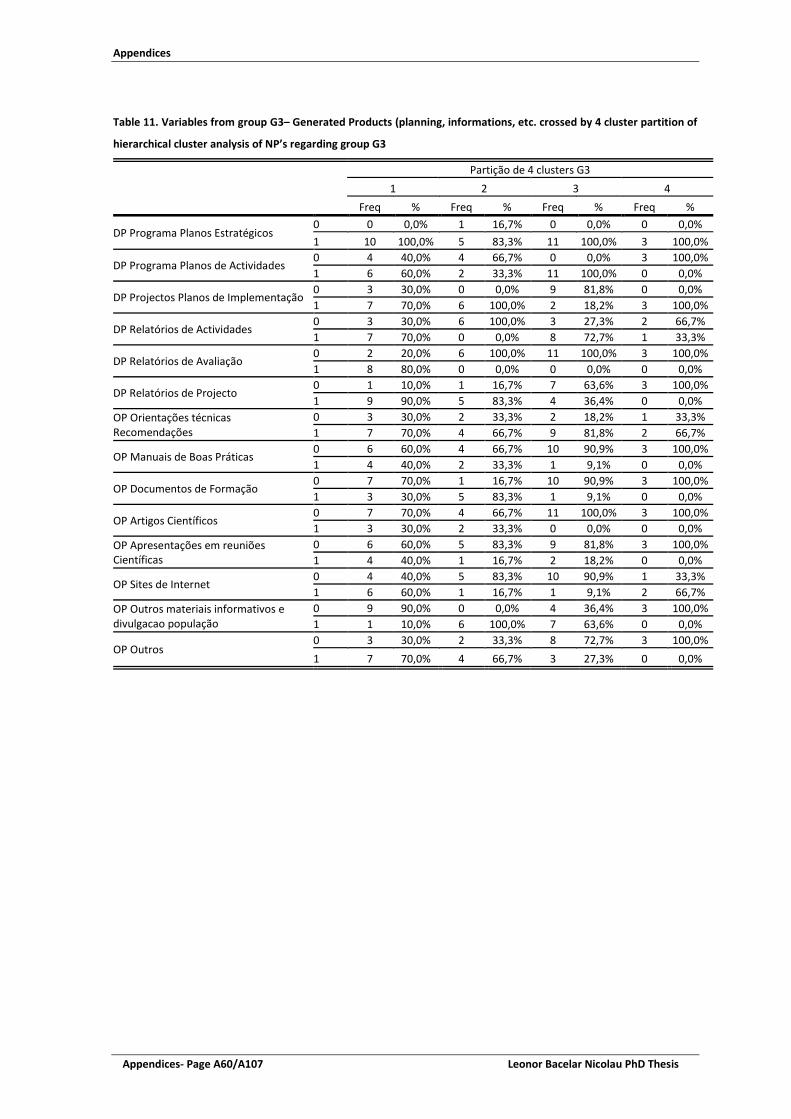
Appendices
Appendices- Page A60/A107 Leonor Bacelar Nicolau PhD Thesis
Table 11. Variables from group G3– Generated Products (planning, informations, etc. crossed by 4 cluster partition of
hierarchical cluster analysis of NP’s regarding group G3
Partição de 4 clusters G3 1 2 3 4
Freq % Freq % Freq % Freq %
DP Programa Planos Estratégicos 0 0 0,0% 1 16,7% 0 0,0% 0 0,0% 1 10 100,0% 5 83,3% 11 100,0% 3 100,0%
DP Programa Planos de Actividades 0 4 40,0% 4 66,7% 0 0,0% 3 100,0% 1 6 60,0% 2 33,3% 11 100,0% 0 0,0%
DP Projectos Planos de Implementação 0 3 30,0% 0 0,0% 9 81,8% 0 0,0% 1 7 70,0% 6 100,0% 2 18,2% 3 100,0%
DP Relatórios de Actividades 0 3 30,0% 6 100,0% 3 27,3% 2 66,7% 1 7 70,0% 0 0,0% 8 72,7% 1 33,3%
DP Relatórios de Avaliação 0 2 20,0% 6 100,0% 11 100,0% 3 100,0% 1 8 80,0% 0 0,0% 0 0,0% 0 0,0%
DP Relatórios de Projecto 0 1 10,0% 1 16,7% 7 63,6% 3 100,0% 1 9 90,0% 5 83,3% 4 36,4% 0 0,0%
OP Orientações técnicas Recomendações
0 3 30,0% 2 33,3% 2 18,2% 1 33,3% 1 7 70,0% 4 66,7% 9 81,8% 2 66,7%
OP Manuais de Boas Práticas 0 6 60,0% 4 66,7% 10 90,9% 3 100,0% 1 4 40,0% 2 33,3% 1 9,1% 0 0,0%
OP Documentos de Formação 0 7 70,0% 1 16,7% 10 90,9% 3 100,0% 1 3 30,0% 5 83,3% 1 9,1% 0 0,0%
OP Artigos Científicos 0 7 70,0% 4 66,7% 11 100,0% 3 100,0% 1 3 30,0% 2 33,3% 0 0,0% 0 0,0%
OP Apresentações em reuniões Científicas
0 6 60,0% 5 83,3% 9 81,8% 3 100,0% 1 4 40,0% 1 16,7% 2 18,2% 0 0,0%
OP Sites de Internet 0 4 40,0% 5 83,3% 10 90,9% 1 33,3% 1 6 60,0% 1 16,7% 1 9,1% 2 66,7%
OP Outros materiais informativos e divulgacao população
0 9 90,0% 0 0,0% 4 36,4% 3 100,0% 1 1 10,0% 6 100,0% 7 63,6% 0 0,0%
OP Outros 0 3 30,0% 2 33,3% 8 72,7% 3 100,0% 1 7 70,0% 4 66,7% 3 27,3% 0 0,0%

Appendices
Leonor Bacelar Nicolau PhD Thesis Appendices- Page A61/A107
Table 12. Fisher Exact Tests for Group G3 variables crossed by selected 4 cluster partition
(1) Todos os PNs da classe 3 têm Planos de actividade e nenhum dos PNs da classe 4 os têm. (2) Todos os PNs da classe 2 têm Planos de implementação e a esmagadora maioria dos PNs da classe 3 não os têm. (3) A classe 2 é a única em que nenhum dos PNs tem relatórios de actividades (4) Todos os PNs da classe 2 têm Planos de implementação e a esmagadora maioria dos PNs da classe 3 não os têm. (5) A classe 1 é a única com PN’s que apresentam relatórios de avaliação. (6) Só um dos PNs da classe 1 não apresenta relatórios de projecto, enquanto a maioria dos PNs da classe 2 e todos
os PNs da classe 4 não têm relatório de projecto. (7) A classe 2 é a única em que a maioria dos PNs apresenta documentos de formação. (8) A maioria dos PNs da classe 1 tem site de internet, enquanto na classe 5 apenas 1 site tem site. (9) Todos os PNs da classe 2 apresentam outros materiais informativos e de divulgação à população, enquanto só 1
PN da classe 1 é que o faz.
Variáveis Valor da Estatística de teste
Sig. (teste bilateral)
Resultado para alfa de 5%
DP Programa Planos Estratégicos 3,821 0.300 Não significativo DP Programa Planos de Actividades 14,199 0.001 Significativo (1) DP Projectos Planos de Implementação 13,540 0.001 Significativo (2) DP Relatórios de Actividades 10,075 0.011 Significativo (3) DP Relatórios de Avaliação 18,744 p<=0.001 Significativo (4) DP Relatórios de Projecto 11,342 0.006 Significativo (5) OP Orientações técnicas Recomendações 1,154 0.882 Não significativo OP Manuais de Boas Práticas 3,606 0.326 Não significativo OP Documentos de Formação 9,977 0.009 Significativo (6) OP Artigos Científicos 4,962 0.113 Não significativo OP Apresentações em reuniões Científicas 2,220 0.579 Não significativo
OP Sites de Internet 7,975 0.034 Significativo (7) OP Outros materiais informativos e divulgação população
15,856 p<=0.001 Significativo (8)
OP Outros 6,856 0.061 Não significativo

Appendices
Appendices- Page A62/A107 Leonor Bacelar Nicolau PhD Thesis
Figure 7. Hierarchical cluster analysis of NP’s, regarding variables from group G4 – Organization and management
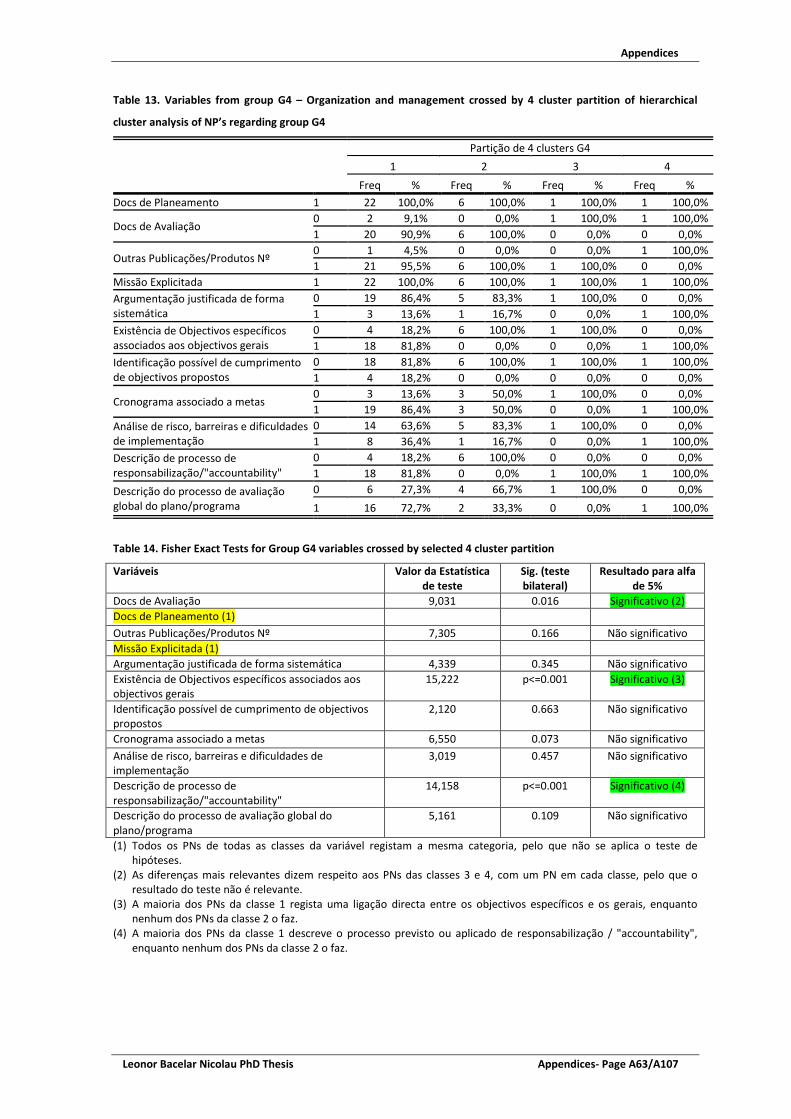
Appendices
Leonor Bacelar Nicolau PhD Thesis Appendices- Page A63/A107
Table 13. Variables from group G4 – Organization and management crossed by 4 cluster partition of hierarchical
cluster analysis of NP’s regarding group G4
Partição de 4 clusters G4 1 2 3 4
Freq % Freq % Freq % Freq % Docs de Planeamento 1 22 100,0% 6 100,0% 1 100,0% 1 100,0%
Docs de Avaliação 0 2 9,1% 0 0,0% 1 100,0% 1 100,0% 1 20 90,9% 6 100,0% 0 0,0% 0 0,0%
Outras Publicações/Produtos Nº 0 1 4,5% 0 0,0% 0 0,0% 1 100,0% 1 21 95,5% 6 100,0% 1 100,0% 0 0,0%
Missão Explicitada 1 22 100,0% 6 100,0% 1 100,0% 1 100,0% Argumentação justificada de forma sistemática
0 19 86,4% 5 83,3% 1 100,0% 0 0,0% 1 3 13,6% 1 16,7% 0 0,0% 1 100,0%
Existência de Objectivos específicos associados aos objectivos gerais
0 4 18,2% 6 100,0% 1 100,0% 0 0,0% 1 18 81,8% 0 0,0% 0 0,0% 1 100,0%
Identificação possível de cumprimento de objectivos propostos
0 18 81,8% 6 100,0% 1 100,0% 1 100,0% 1 4 18,2% 0 0,0% 0 0,0% 0 0,0%
Cronograma associado a metas 0 3 13,6% 3 50,0% 1 100,0% 0 0,0% 1 19 86,4% 3 50,0% 0 0,0% 1 100,0%
Análise de risco, barreiras e dificuldades de implementação
0 14 63,6% 5 83,3% 1 100,0% 0 0,0% 1 8 36,4% 1 16,7% 0 0,0% 1 100,0%
Descrição de processo de responsabilização/"accountability"
0 4 18,2% 6 100,0% 0 0,0% 0 0,0% 1 18 81,8% 0 0,0% 1 100,0% 1 100,0%
Descrição do processo de avaliação global do plano/programa
0 6 27,3% 4 66,7% 1 100,0% 0 0,0% 1 16 72,7% 2 33,3% 0 0,0% 1 100,0%
Table 14. Fisher Exact Tests for Group G4 variables crossed by selected 4 cluster partition
(1) Todos os PNs de todas as classes da variável registam a mesma categoria, pelo que não se aplica o teste de hipóteses.
(2) As diferenças mais relevantes dizem respeito aos PNs das classes 3 e 4, com um PN em cada classe, pelo que o resultado do teste não é relevante.
(3) A maioria dos PNs da classe 1 regista uma ligação directa entre os objectivos específicos e os gerais, enquanto nenhum dos PNs da classe 2 o faz.
(4) A maioria dos PNs da classe 1 descreve o processo previsto ou aplicado de responsabilização / "accountability", enquanto nenhum dos PNs da classe 2 o faz.
Variáveis Valor da Estatística de teste
Sig. (teste bilateral)
Resultado para alfa de 5%
Docs de Avaliação 9,031 0.016 Significativo (2) Docs de Planeamento (1) Outras Publicações/Produtos Nº 7,305 0.166 Não significativo Missão Explicitada (1) Argumentação justificada de forma sistemática 4,339 0.345 Não significativo Existência de Objectivos específicos associados aos objectivos gerais
15,222 p<=0.001 Significativo (3)
Identificação possível de cumprimento de objectivos propostos
2,120 0.663 Não significativo
Cronograma associado a metas 6,550 0.073 Não significativo Análise de risco, barreiras e dificuldades de implementação
3,019 0.457 Não significativo
Descrição de processo de responsabilização/"accountability"
14,158 p<=0.001 Significativo (4)
Descrição do processo de avaliação global do plano/programa
5,161 0.109 Não significativo

Appendices
Appendices- Page A64/A107 Leonor Bacelar Nicolau PhD Thesis
Figure 8. Hierarchical cluster analysis of NP’s, regarding variables from group G5 – Link to health problems, health
gains and effectiveness gains

Appendices
Leonor Bacelar Nicolau PhD Thesis Appendices- Page A65/A107
Table 15. Variables from group G5 – Link to health problems, health gains and effectiveness gains crossed by 4 cluster
partition of hierarchical cluster analysis of NP’s regarding group G5
Partição de 5 clusters G5 1 2 3 4 5
Freq % Freq % Freq % Freq % Freq % OG caracterizados pbs saude que justifiquem criação do plano 1 10 100,0% 10 100,0% 8 100,0% 1 100,0% 1 100,0%
OG caracterizados aspectos da organização/resposta do SS e outros que justifiquem criação do plano
0 0 0,0% 10 100,0% 0 0,0% 0 0,0% 1 100,0%
1 10 100,0% 0 0,0% 8 100,0% 1 100,0% 0 0,0%
OG adequados aos pbs saude identificados
0 0 0,0% 0 0,0% 0 0,0% 1 100,0% 0 0,0% 1 10 100,0% 10 100,0% 8 100,0% 0 0,0% 1 100,0%
OG Descrição dos processos de eleição e definição
0 2 20,0% 0 0,0% 2 25,0% 1 100,0% 0 0,0% 1 8 80,0% 10 100,0% 6 75,0% 0 0,0% 1 100,0%
OG Identificados ganhos de saúde 0 1 10,0% 0 0,0% 1 12,5% 1 100,0% 1 100,0% 1 9 90,0% 10 100,0% 7 87,5% 0 0,0% 0 0,0%
OG Identificados ganhos de efectividade
0 0 0,0% 4 40,0% 8 100,0% 1 100,0% 1 100,0% 1 10 100,0% 6 60,0% 0 0,0% 0 0,0% 0 0,0%
Table 16. Fisher Exact Tests for Group G5 variables crossed by selected 4 cluster partition
(1) Todos os PNs de todas as classes da variável registam a mesma categoria, pelo que não se aplica o teste de hipóteses.
(2) Todos os PNs das classes 1 e 3, mas nenhum PN da classe 2, apresentam uma caracterização de aspectos da organização/resposta do Sistema de Saúde como justificação de criação do PN.
(3) As diferenças mais relevantes dizem respeito aos PNs das classes 4 e 5, com um PN em cada classe, pelo que o resultado do teste não é relevante.
(4) Todos os PNs da classe 1, mas nenhum PN da classe 2, identificam ganhos de efectividade quando apresentam os seus objectivos gerais.
Variáveis Valor da Estatística de
teste
Sig. (teste bilateral)
Resultado para alfa de 5%
OG caracterizados pbs saude que justifiquem criação do plano (1)
OG caracterizados aspectos da organização/resposta do SS e outros que justifiquem criação do plano
30,837 p<=0.001 Significativo (2)
OG adequados aos pbs saude identificados 9,908 0.067 Não significativo
OG Descrição dos processos de eleição e definição 6,718 0.155 Não significativo
OG Identificados ganhos de saúde 9,670 0.017 Significativo (3)
OG Identificados ganhos de efectividade 21,824 p<=0.001 Significativo (4)
Argumentação justificada de forma sistemática 4,618 0.460 Não significativo

Appendices
Appendices- Page A66/A107 Leonor Bacelar Nicolau PhD Thesis
Figure 9. Hierarchical cluster analysis of NP’s, regarding variables from group G7 – General aims, specific aims and
associated projects

Appendices
Leonor Bacelar Nicolau PhD Thesis Appendices- Page A67/A107
Table 17. Variables from group G7 – General aims, specific aims and associated projects crossed by 6 cluster partition
of hierarchical cluster analysis of NP’s regarding group G7
Partição de 6 clusters G7 1 2 3 4 5 6
Objectivos Gerais Nº
Mean 1,9 5,0 2,9 6,0 7,0 8,0 Standard Deviation ,8 ,0 1,0 . . ,0
Median 2,0 5,0 3,0 6,0 7,0 8,0 Percentile 25 1 5 3 6 7 8 Percentile 75 2 5 4 6 7 8
Objectivos Específicos Nº
Mean 3,3 5,2 10,5 19,0 25,0 4,5 Standard Deviation 1,5 2,8 2,8 . . ,7
Median 3,0 4,0 10,5 19,0 25,0 4,5 Percentile 25 2 4 9 19 25 4 Percentile 75 4 5 12 19 25 5
OE Projectos próprios a cada objectivo específico Nº total previsto inicialmente
Mean 7,7 ,0 34,6 246,0 79,0 ,0 Standard Deviation 9,0 ,0 11,1 . . ,0
Median 4,0 ,0 35,0 246,0 79,0 ,0 Percentile 25 0 0 31 246 79 0 Percentile 75 19 0 43 246 79 0
OE Projectos próprios a cada objectivo específico Nº total implementado
Mean 4,2 9,0 10,4 228,0 ,0 1,5 Standard Deviation 5,4 8,9 15,8 . . 2,1
Median 3,0 10,0 1,0 228,0 ,0 1,5 Percentile 25 1 0 0 228 0 0 Percentile 75 4 15 20 228 0 3
Table 18. Hierarchical cluster analysis partition by k-means cluster partition
Variáveis Não standartizadas
Partição de 6 clusters G7 KMEANS 1 2 3 4 5 6
Count % Count % Count % Count % Count % Count %
Partição de 6 clusters G7
1 4 66,7% 2 40,0% 0 0,0% 0 0,0% 0 0,0% 7 63,6% 2 0 0,0% 3 60,0% 0 0,0% 0 0,0% 0 0,0% 2 18,2% 3 2 33,3% 0 0,0% 6 100,0% 0 0,0% 0 0,0% 0 0,0% 4 0 0,0% 0 0,0% 0 0,0% 1 100,0% 0 0,0% 0 0,0% 5 0 0,0% 0 0,0% 0 0,0% 0 0,0% 1 100,0% 0 0,0% 6 0 0,0% 0 0,0% 0 0,0% 0 0,0% 0 0,0% 2 18,2%
Variáveis Standartizadas
Partição de 6 clusters G7 KMEANS variaveis standartizadas 1 2 3 4 5 6
Count % Count % Count % Count % Count % Count %
Partição de 6 clusters G7
1 13 100,0% 0 0,0% 0 0,0% 0 0,0% 0 0,0% 0 0,0% 2 0 0,0% 5 100,0% 0 0,0% 0 0,0% 0 0,0% 0 0,0% 3 0 0,0% 0 0,0% 8 100,0% 0 0,0% 0 0,0% 0 0,0% 4 0 0,0% 0 0,0% 0 0,0% 1 100,0% 0 0,0% 0 0,0% 5 0 0,0% 0 0,0% 0 0,0% 0 0,0% 1 100,0% 0 0,0% 6 0 0,0% 0 0,0% 0 0,0% 0 0,0% 0 0,0% 2 100,0%
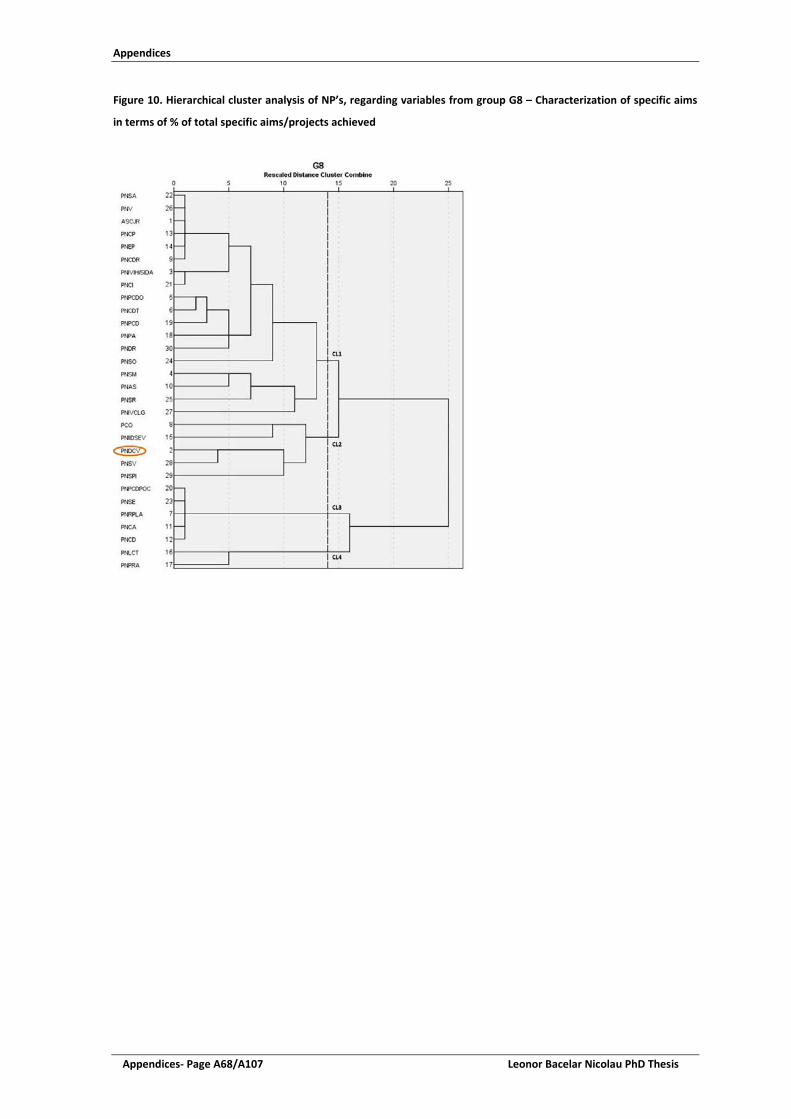
Appendices
Appendices- Page A68/A107 Leonor Bacelar Nicolau PhD Thesis
Figure 10. Hierarchical cluster analysis of NP’s, regarding variables from group G8 – Characterization of specific aims
in terms of % of total specific aims/projects achieved

Appendices
Leonor Bacelar Nicolau PhD Thesis Appendices- Page A69/A107
Table 19. Variables from group G8 – Characterization of specific aims in terms of % of total specific aims/projects
achieved crossed by 4 cluster partition of hierarchical cluster analysis of NP’s regarding group G8
Partição de 4 clusters G8 1 2 3 4
OE Definidas necessidades saúde/população alvo/determinantes
Mean 92,2 100,0 ,0 50,0 Standard Deviation 24,9 ,0 ,0 70,7 Median 100,0 100,0 ,0 50,0 Percentile 25 100 100 0 0 Percentile 75 100 100 0 100
OE Definidos ganhos esperados
Mean 76,7 72,0 ,0 100,0 Standard Deviation 40,7 43,8 ,0 ,0 Median 100,0 100,0 ,0 100,0 Percentile 25 75 60 0 100 Percentile 75 100 100 0 100
OE Análise de acções propostas prevista
Mean 77,8 32,0 ,0 ,0 Standard Deviation 36,4 46,0 ,0 ,0 Median 100,0 ,0 ,0 ,0 Percentile 25 63 0 0 0 Percentile 75 100 60 0 0
OE Parcerias com instituições regionais/locais
Mean 91,7 88,0 ,0 ,0 Standard Deviation 15,1 26,8 ,0 ,0 Median 100,0 100,0 ,0 ,0 Percentile 25 83 100 0 0 Percentile 75 100 100 0 0
OE Atribuição de recursos materiais
Mean 62,9 34,6 ,0 ,0 Standard Deviation 42,4 40,9 ,0 ,0 Median 83,5 33,0 ,0 ,0 Percentile 25 25 0 0 0 Percentile 75 100 40 0 0
OE Orçamentos e Relatórios de Execução
Mean 76,7 50,6 ,0 ,0 Standard Deviation 35,5 46,6 ,0 ,0 Median 100,0 33,0 ,0 ,0 Percentile 25 63 20 0 0 Percentile 75 100 100 0 0
OE Indicadores de operacionalização e concretização
Mean 92,2 50,6 ,0 100,0 Standard Deviation 14,5 46,6 ,0 ,0 Median 100,0 33,0 ,0 100,0 Percentile 25 91 20 0 100 Percentile 75 100 100 0 100
OE Avaliação através de metas
Mean 94,3 4,0 ,0 100,0 Standard Deviation 15,5 8,9 ,0 ,0 Median 100,0 ,0 ,0 100,0 Percentile 25 100 0 0 100 Percentile 75 100 0 0 100
OE Análise de integração nos sistemas/serviços existentes
Mean 64,2 25,2 ,0 12,5 Standard Deviation 45,3 25,5 ,0 17,7 Median 95,5 33,0 ,0 12,5 Percentile 25 1 0 0 0 Percentile 75 100 33 0 25

Appendices
Appendices- Page A70/A107 Leonor Bacelar Nicolau PhD Thesis
Table 20. Hierarchical cluster analysis partition by k-means cluster partition
Variáveis Não standartizadas
Partição de 4 clusters G8 KMEANS 1 2 3 4
Count % Count % Count % Count %
Partição de 4 clusters G8
1 18 100,0% 0 0,0% 0 0,0% 0 0,0% 2 0 0,0% 5 100,0% 0 0,0% 0 0,0% 3 0 0,0% 0 0,0% 5 100,0% 0 0,0% 4 0 0,0% 0 0,0% 0 0,0% 2 100,0%
Variáveis Standartizadas
Partição de 4 clusters G8 KMEANS variaveis standartizadas 1 2 3 4
Count % Count % Count % Count %
Partição de 4 clusters G8
1 18 100,0% 0 0,0% 0 0,0% 0 0,0% 2 0 0,0% 5 100,0% 0 0,0% 0 0,0% 3 0 0,0% 0 0,0% 5 100,0% 0 0,0% 4 0 0,0% 0 0,0% 0 0,0% 2 100,0%

Appendices
Leonor Bacelar Nicolau PhD Thesis Appendices- Page A71/A107
Figure 11. Hierarchical cluster analysis of NP’s, regarding variables from group G9 – Range of regional implementation

Appendices
Appendices- Page A72/A107 Leonor Bacelar Nicolau PhD Thesis
Table 21. Variables from group G9 – Range of regional implementation crossed by 3 cluster partition of hierarchical
cluster analysis of NP’s regarding group G9
Partição de 3 clusters G9 1 2 3
Freq % Freq % Freq %
Tem Coordenador Regional? (nº regiões)
0 0 0,0% 0 0,0% 3 42,9% 1 0 0,0% 0 0,0% 1 14,3% 2 0 0,0% 1 9,1% 3 42,9% 3 0 0,0% 6 54,5% 0 0,0% 4 1 8,3% 3 27,3% 0 0,0% 5 11 91,7% 1 9,1% 0 0,0%
Está a ser implementado e tem projectos activos em 2011? (nº regiões)
0 0 0,0% 0 0,0% 3 42,9% 1 0 0,0% 0 0,0% 2 28,6% 2 0 0,0% 4 36,4% 2 28,6% 3 0 0,0% 4 36,4% 0 0,0% 4 0 0,0% 2 18,2% 0 0,0% 5 12 100,0% 1 9,1% 0 0,0%
Tem Relatórios de Progresso Anual nos anos 2009-2010? (nº regiões)
0 0 0,0% 0 0,0% 7 100,0% 1 0 0,0% 3 27,3% 0 0,0% 2 0 0,0% 6 54,5% 0 0,0% 3 3 25,0% 2 18,2% 0 0,0% 4 4 33,3% 0 0,0% 0 0,0% 5 5 41,7% 0 0,0% 0 0,0%
Foi realizada ou está prevista uma Avaliação do Programa a nível regional? (nº regiões)
0 0 0,0% 0 0,0% 7 100,0% 1 0 0,0% 4 36,4% 0 0,0% 2 0 0,0% 5 45,5% 0 0,0% 3 3 25,0% 2 18,2% 0 0,0% 4 2 16,7% 0 0,0% 0 0,0% 5 7 58,3% 0 0,0% 0 0,0%
Table 22. Hierarchical cluster analysis partition by k-means cluster partition
Partição de 3 clusters G9 KMEANS 1 2 3
Count % Count % Count %
Partição de 3 clusters G9 1 12 100,0% 0 0,0% 0 0,0% 2 0 0,0% 11 100,0% 0 0,0% 3 0 0,0% 0 0,0% 7 100,0%

Appendices
Leonor Bacelar Nicolau PhD Thesis Appendices- Page A73/A107
Figure 12. Multiple correspondence analysis (MCA) Factorial Plans for group G1 – Legal Context: binary variable
categories and cases identified by National Program short name

Appendices
Appendices- Page A74/A107 Leonor Bacelar Nicolau PhD Thesis
Figure 13. Multiple correspondence analysis (MCA) Factorial Plans for group G3 – Generated Products (planning,
informations, etc.): binary variable categories and for cases identified by National Program short name

Appendices
Leonor Bacelar Nicolau PhD Thesis Appendices- Page A75/A107
Figure 14. Multiple correspondence analysis (MCA) Factorial Plans for group G4 – Organization and management:
binary variable categories and for cases identified by National Program short name

Appendices
Appendices- Page A76/A107 Leonor Bacelar Nicolau PhD Thesis
Figure 15. Multiple correspondence analysis (MCA) Factorial Plans for G5 – Link to health problems, health gains and
effectiveness gains: binary variable categories and for cases identified by National Program short name

Appendices
Leonor Bacelar Nicolau PhD Thesis Appendices- Page A77/A107
Figure 16. Principal components analysis (PCA) Factorial Plans for group of G7 – General aims, specific aims and
associated projects: quantitative variables and cases identified by National Program short name and by associated
cluster

Appendices
Appendices- Page A78/A107 Leonor Bacelar Nicolau PhD Thesis
Figure 17. Principal components analysis (PCA) Factorial Plans for group of G8 – Characterization of specific aims in
terms of % of total specific aims/projects achieved: quantitative variables and cases identified by National Program
short name and by associated cluster

Appendices
Leonor Bacelar Nicolau PhD Thesis Appendices- Page A79/A107
Figure 18. Principal components analysis (PCA) Factorial Plans for group of G9 – Range of regional implementation:
quantitative variables and cases identified by National Program short name and by associated cluster

Appendices
Appendices- Page A80/A107 Leonor Bacelar Nicolau PhD Thesis

Appendices
Leonor Bacelar Nicolau PhD Thesis Appendices- Page A81/A107
Appendix 6: Supplementary Material of Chapter 4
TITLE: Picturing Inequities for Health Impact Assessment: Linked Electronic Records, Mortality and Regional Disparities in Portugal
SUPPLEMENTAL ONLINE MATERIAL
Table of Contents
I. Statistical Methodologies ............................................................................................ 230
Association between registering or not indicators and region of residence ..................... 230
Association between Mortality and registering or not indicators, by region .................... 231
Statistical software and significance level used ................................................................. 231
II. Complementary Tables and Figures ............................................................................ 232
Stage 1: Association between registering or not indicators and region of residence ....... 232
Stage 2: Association between Mortality and registering or not indicators, by region ...... 240
Conceptual Path Policy / Equity / Health Event of Interest ............................................... 248
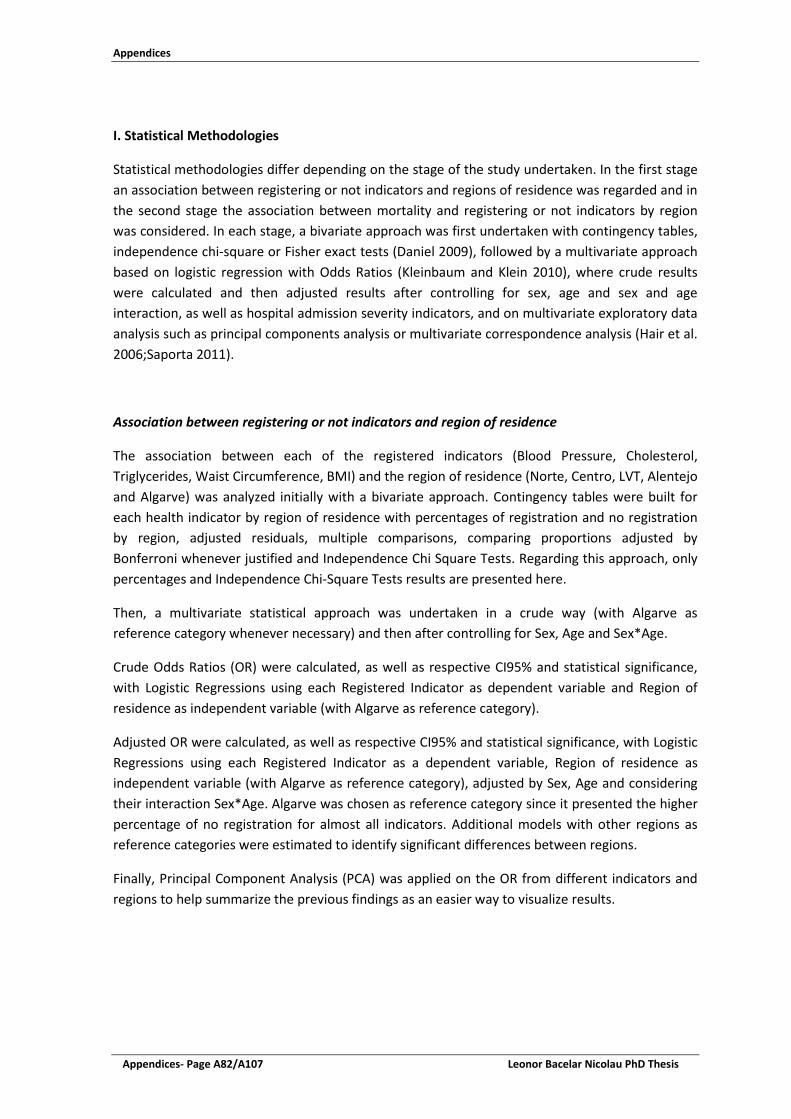
Appendices
Appendices- Page A82/A107 Leonor Bacelar Nicolau PhD Thesis
I. Statistical Methodologies
Statistical methodologies differ depending on the stage of the study undertaken. In the first stage an association between registering or not indicators and regions of residence was regarded and in the second stage the association between mortality and registering or not indicators by region was considered. In each stage, a bivariate approach was first undertaken with contingency tables, independence chi-square or Fisher exact tests (Daniel 2009), followed by a multivariate approach based on logistic regression with Odds Ratios (Kleinbaum and Klein 2010), where crude results were calculated and then adjusted results after controlling for sex, age and sex and age interaction, as well as hospital admission severity indicators, and on multivariate exploratory data analysis such as principal components analysis or multivariate correspondence analysis (Hair et al. 2006;Saporta 2011).
Association between registering or not indicators and region of residence
The association between each of the registered indicators (Blood Pressure, Cholesterol, Triglycerides, Waist Circumference, BMI) and the region of residence (Norte, Centro, LVT, Alentejo and Algarve) was analyzed initially with a bivariate approach. Contingency tables were built for each health indicator by region of residence with percentages of registration and no registration by region, adjusted residuals, multiple comparisons, comparing proportions adjusted by Bonferroni whenever justified and Independence Chi Square Tests. Regarding this approach, only percentages and Independence Chi-Square Tests results are presented here.
Then, a multivariate statistical approach was undertaken in a crude way (with Algarve as reference category whenever necessary) and then after controlling for Sex, Age and Sex*Age.
Crude Odds Ratios (OR) were calculated, as well as respective CI95% and statistical significance, with Logistic Regressions using each Registered Indicator as dependent variable and Region of residence as independent variable (with Algarve as reference category).
Adjusted OR were calculated, as well as respective CI95% and statistical significance, with Logistic Regressions using each Registered Indicator as a dependent variable, Region of residence as independent variable (with Algarve as reference category), adjusted by Sex, Age and considering their interaction Sex*Age. Algarve was chosen as reference category since it presented the higher percentage of no registration for almost all indicators. Additional models with other regions as reference categories were estimated to identify significant differences between regions.
Finally, Principal Component Analysis (PCA) was applied on the OR from different indicators and regions to help summarize the previous findings as an easier way to visualize results.

Appendices
Leonor Bacelar Nicolau PhD Thesis Appendices- Page A83/A107
Association between Mortality and registering or not indicators, by region
The association between not registering each of the indicators and the mortality outcome was first assessed through 2x2 contingency tables for each Registered Indicator by Outcome, with percentages of registration and no registration within the overall sample and for each region, adjusted residuals and Fisher Exact Tests. Only percentages and Fisher Exact Tests results are presented in this document.
Crude OR were calculated, as well as respective CI95% and statistical significance, initially in an overall approach with Logistic Regressions using the Mortality Outcome as dependent variable and each Registered Indicator as independent variable.
Then adjusted OR were calculated, as well as respective CI95% and statistical significance, with Logistic Regressions using the Mortality Outcome as a dependent variable and each Registered Indicator as independent variable, adjusted by Sex, Age and considering interaction Sex*Age and afterwards also by the 4 Admission Severity indicators.
Subsequently the overall OR and both types of adjusted OR were calculated also controlling for region (with Algarve as reference region).
Finally, the overall OR and both types of adjusted OR were stratified by region.
Our focus for analysis will be the OR obtained through the stratified models, adjusted by Sex, Age, Sex*Age interaction and the 4 Admission Severity indicators. Note that data from Algarve did not generate reliable solutions for indicators Cholesterol, Triglycerides and Waist circumference and gave higher limits for the 95%CI for OR regarding Blood Pressure and especially BMI. Data from Alentejo generated reliable solutions only for Waist circumference and also gave us higher limits for the 95%CI for OR regarding BMI. Norte generated high OR and related limits of the 95%CI for OR regarding Cholesterol and Triglycerides.
All the logistic regression approaches were produced imposing the presence of all the variables with the Enter method. Complementary variables were also additionally selected through a Stepwise forward method to check the robustness of the choice process of variables. The results of the models obtained through the Enter method are the ones analyzed here.
Lastly Multiple Correspondence Analysis (MCA) was applied using all categorical variables under study. Coordinates, relative and absolute contributions for all categories of variables regarding first 10 dimensions were analyzed.
Statistical software and significance level used
Statistical analyses were generally conducted using the IBM-SPSS version 22 software. A significance level of 5% was used whenever statistical tests were applied.

Appendices
Appendices- Page A84/A107 Leonor Bacelar Nicolau PhD Thesis
II. Complementary Tables and Figures
Stage 1: Association between registering or not indicators and region of residence
Figure 6. Registration of each health indicator by health region of residence – graphic visualization

Appendices
Leonor Bacelar Nicolau PhD Thesis Appendices- Page A85/A107
Table 10. Registration of health indicators by health region of residence - % and chi-square independence tests
Region of residence (n) Not registered Registered p-value (χ2) (1) Blood pressure registered
Norte (1153) 25.1% 74.9% Centro (816) 37.6% 62.4% p<0.001 (113.02) LVT (1326) 42.8% 57.2% Alentejo (285) 28.8% 71.2% Algarve (196) 51.0% 49.0% Cholesterol registered
Norte (1153) 55.3% 44.7% Centro (816) 65.6% 34.4% p<0.001 (149.255) LVT (1326) 77.3% 22.7% Alentejo (285) 63.2% 36.8% Algarve (196) 78.6% 21.4% Triglycerides registered
Norte (1153) 55.9% 44.1% Centro (816) 65.1% 34.9% p<0.001 (142.454) LVT (1326) 77.1% 22.9% Alentejo (285) 60.7% 39.3% Algarve (196) 77.6% 22.4% Waist circumference registered
Norte (1153) 73.6% 26.4% Centro (816) 81.4% 18.6% p<0.001 (167.024) LVT (1326) 92.2% 7.8% Alentejo (285) 84.6% 15.4% Algarve (196) 91.8% 8.2% Body Mass Index registered
Norte (1153) 52.1% 47.9% Centro (816) 68.0% 32.0% p<0.001 (15.053) LVT (1326) 70.4% 29.6% Alentejo (285) 66.3% 33.7% Algarve (196) 75.0% 25.0% (1) χ2 Independence tests

Appendices
Appendices- Page A86/A107 Leonor Bacelar Nicolau PhD Thesis
Table 11. Odds ratios for registration of each health indicator by health region of residence
Region of residence (n) Crude
OR CI 95% p-value Adjusted
OR (1) CI 95% p-value Blood pressure registered p<=0.001 p<=0.001 Norte (1153) 3.114 [2.284;4.246] p<=0.001 3.223 [2.356;4.409] p<=0.001 Centro (816) 1.727 [1.262;2.364] 0.001 1.682 [1.226;2.309] 0.001 LVT (1326) 1.394 [1.033;1.883] 0.030 1.370 [1.012;1.855] 0.042 Alentejo (285) 2.579 [1.764;3.77] p<=0.001 2.559 [1.746;3.751] p<=0.001 Algarve (196) (2) 1 1 Cholesterol registered p<=0.001 p<=0.001 Norte (1153) 2.960 [2.064;4.244] p<=0.001 2.948 [2.054;4.232] p<=0.001 Centro (816) 1.926 [1.33;2.789] 0.001 1.910 [1.317;2.769] 0.001 LVT (1326) 1.077 [0.748;1.55] 0.691 1.069 [0.742;1.541] 0.719 Alentejo (285) 2.139 [1.409;3.247] p<=0.001 2.155 [1.418;3.275] p<=0.001 Algarve (196) (2) 1 1 Triglycerides registered p<=0.001 p<=0.001 Norte (1153) 2.730 [1.914;3.894] p<=0.001 2.714 [1.901;3.876] p<=0.001 Centro (816) 1.854 [1.287;2.671] 0.001 1.840 [1.276;2.653] 0.001 LVT (1326) 1.023 [0.714;1.465] 0.900 1.016 [0.709;1.456] 0.932 Alentejo (285) 2.236 [1.482;3.374] p<=0.001 2.259 [1.495;3.411] p<=0.001 Algarve (196) (2) 1 1 Waist circumference registered p<=0.001 p<=0.001 Norte (1153) 4.028 [2.376;6.829] p<=0.001 4.098 [2.415;6.954] p<=0.001 Centro (816) 2.575 [1.5;4.423] 0.001 2.530 [1.472;4.348] 0.001 LVT (1326) 0.957 [0.553;1.658] 0.877 0.952 [0.549;1.649] 0.859 Alentejo (285) 2.054 [1.123;3.757] 0.019 2.041 [1.115;3.737] 0.021 Algarve (196) (2) 1 1 Body Mass Index registered p<=0.001 p<=0.001 Norte (1153) 2.755 [1.955;3.884] p<=0.001 2.783 [1.971;3.93] p<=0.001 Centro (816) 1.411 [0.989;2.012] 0.058 1.390 [0.973;1.986] 0.070 LVT (1326) 1.264 [0.896;1.783] 0.183 1.246 [0.882;1.76] 0.213 Alentejo (285) 1.524 [1.015;2.287] 0.042 1.530 [1.018;2.3] 0.041 Algarve (196) (2) 1 1 (1) After controlling for Sex, Age, Sex*Age (2) Algarve as Reference Category
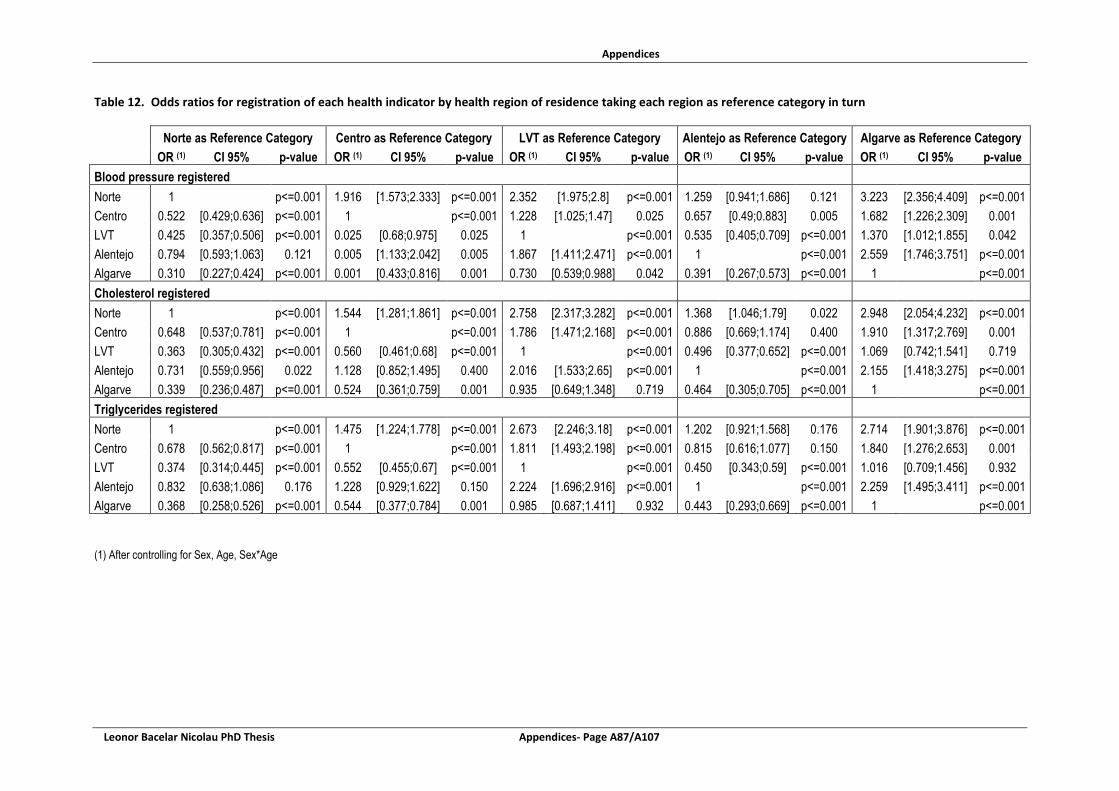
Appendices
Leonor Bacelar Nicolau PhD Thesis Appendices- Page A87/A107
Table 12. Odds ratios for registration of each health indicator by health region of residence taking each region as reference category in turn
Norte as Reference Category Centro as Reference Category LVT as Reference Category Alentejo as Reference Category Algarve as Reference Category OR (1) CI 95% p-value OR (1) CI 95% p-value OR (1) CI 95% p-value OR (1) CI 95% p-value OR (1) CI 95% p-value
Blood pressure registered Norte 1
p<=0.001 1.916 [1.573;2.333] p<=0.001 2.352 [1.975;2.8] p<=0.001 1.259 [0.941;1.686] 0.121 3.223 [2.356;4.409] p<=0.001
Centro 0.522 [0.429;0.636] p<=0.001 1
p<=0.001 1.228 [1.025;1.47] 0.025 0.657 [0.49;0.883] 0.005 1.682 [1.226;2.309] 0.001 LVT 0.425 [0.357;0.506] p<=0.001 0.025 [0.68;0.975] 0.025 1
p<=0.001 0.535 [0.405;0.709] p<=0.001 1.370 [1.012;1.855] 0.042
Alentejo 0.794 [0.593;1.063] 0.121 0.005 [1.133;2.042] 0.005 1.867 [1.411;2.471] p<=0.001 1
p<=0.001 2.559 [1.746;3.751] p<=0.001 Algarve 0.310 [0.227;0.424] p<=0.001 0.001 [0.433;0.816] 0.001 0.730 [0.539;0.988] 0.042 0.391 [0.267;0.573] p<=0.001 1 p<=0.001 Cholesterol registered Norte 1
p<=0.001 1.544 [1.281;1.861] p<=0.001 2.758 [2.317;3.282] p<=0.001 1.368 [1.046;1.79] 0.022 2.948 [2.054;4.232] p<=0.001
Centro 0.648 [0.537;0.781] p<=0.001 1
p<=0.001 1.786 [1.471;2.168] p<=0.001 0.886 [0.669;1.174] 0.400 1.910 [1.317;2.769] 0.001 LVT 0.363 [0.305;0.432] p<=0.001 0.560 [0.461;0.68] p<=0.001 1
p<=0.001 0.496 [0.377;0.652] p<=0.001 1.069 [0.742;1.541] 0.719
Alentejo 0.731 [0.559;0.956] 0.022 1.128 [0.852;1.495] 0.400 2.016 [1.533;2.65] p<=0.001 1
p<=0.001 2.155 [1.418;3.275] p<=0.001 Algarve 0.339 [0.236;0.487] p<=0.001 0.524 [0.361;0.759] 0.001 0.935 [0.649;1.348] 0.719 0.464 [0.305;0.705] p<=0.001 1 p<=0.001 Triglycerides registered Norte 1
p<=0.001 1.475 [1.224;1.778] p<=0.001 2.673 [2.246;3.18] p<=0.001 1.202 [0.921;1.568] 0.176 2.714 [1.901;3.876] p<=0.001
Centro 0.678 [0.562;0.817] p<=0.001 1
p<=0.001 1.811 [1.493;2.198] p<=0.001 0.815 [0.616;1.077] 0.150 1.840 [1.276;2.653] 0.001 LVT 0.374 [0.314;0.445] p<=0.001 0.552 [0.455;0.67] p<=0.001 1
p<=0.001 0.450 [0.343;0.59] p<=0.001 1.016 [0.709;1.456] 0.932
Alentejo 0.832 [0.638;1.086] 0.176 1.228 [0.929;1.622] 0.150 2.224 [1.696;2.916] p<=0.001 1
p<=0.001 2.259 [1.495;3.411] p<=0.001 Algarve 0.368 [0.258;0.526] p<=0.001 0.544 [0.377;0.784] 0.001 0.985 [0.687;1.411] 0.932 0.443 [0.293;0.669] p<=0.001 1 p<=0.001
(1) After controlling for Sex, Age, Sex*Age

Appendices
Appendices- Page A88/A107 Leonor Bacelar Nicolau PhD Thesis
Table 3. (Cont.) Odds ratios for registration of each health indicator by health region of residence taking each region as reference category in turn
Norte as Reference Category Centro as Reference Category LVT as Reference Category Alentejo as Reference Category Algarve as Reference Category OR (1) CI 95% p-value OR (1) CI 95% p-value OR (1) CI 95% p-value OR (1) CI 95% p-value OR (1) CI 95% p-value
Waist circumference registered Norte 1
p<=0.001 1.620 [1.298;2.022] p<=0.001 4.307 [3.387;5.477] p<=0.001 2.008 [1.416;2.846] p<=0.001 4.098 [2.415;6.954] p<=0.001
Centro 0.617 [0.495;0.771] p<=0.001 1
p<=0.001 2.659 [2.035;3.474] p<=0.001 1.239 [0.858;1.79] 0.252 2.530 [1.472;4.348] 0.001 LVT 0.232 [0.183;0.295] p<=0.001 0.376 [0.288;0.491] p<=0.001 1
p<=0.001 0.466 [0.319;0.681] p<=0.001 0.952 [0.549;1.649] 0.859
Alentejo 0.498 [0.351;0.706] p<=0.001 0.807 [0.559;1.165] 0.252 2.145 [1.468;3.135] p<=0.001 1
p<=0.001 2.041 [1.115;3.737] 0.021 Algarve 0.244 [0.144;0.414] p<=0.001 0.395 [0.23;0.679] 0.001 1.051 [0.607;1.821] 0.859 0.021 [0.268;0.897] 0.021 1 p<=0.001 BMI registered Norte 1
p<=0.001 2.002 [1.657;2.418] p<=0.001 2.234 [1.891;2.639] p<=0.001 1.819 [1.384;2.391] p<=0.001 2.783 [1.971;3.93] p<=0.001
Centro 0.500 [0.414;0.604] p<=0.001 1
p<=0.001 1.116 [0.924;1.349] 0.255 0.909 [0.682;1.211] 0.514 1.390 [0.973;1.986] 0.070 LVT 0.448 [0.379;0.529] p<=0.001 0.896 [0.741;1.083] 0.255 1
p<=0.001 0.814 [0.619;1.07] 0.141 1.246 [0.882;1.76] 0.213
Alentejo 0.550 [0.418;0.723] p<=0.001 1.100 [0.825;1.467] 0.514 1.228 [0.934;1.615] 0.141 1
p<=0.001 1.530 [1.018;2.3] 0.041 Algarve 0.359 [0.254;0.507] p<=0.001 0.719 [0.503;1.028] 0.070 0.803 [0.568;1.134] 0.213 0.654 [0.435;0.983] 0.041 1 p<=0.001
(1) After controlling for Sex, Age, Sex*Age

Appendices
Leonor Bacelar Nicolau PhD Thesis Appendices- Page 89/248
Figure 7. 95% Confidence Intervals of Adjusted OR for registration of each health indicator by health region of residence, visualized by health region of residence (1,2)
(1) After controlling for Sex, Age, Sex*Age (2) Algarve as Reference Category
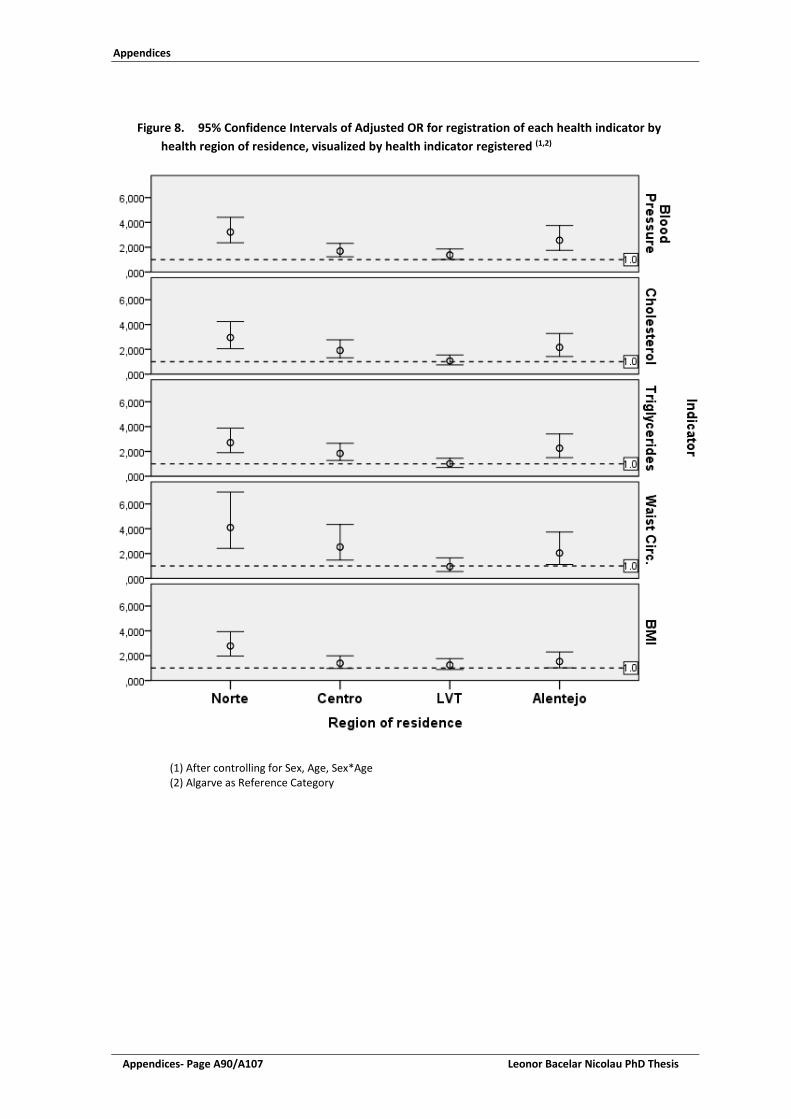
Appendices
Appendices- Page A90/A107 Leonor Bacelar Nicolau PhD Thesis
Figure 8. 95% Confidence Intervals of Adjusted OR for registration of each health indicator by
health region of residence, visualized by health indicator registered (1,2)
(1) After controlling for Sex, Age, Sex*Age (2) Algarve as Reference Category

Appendices
Leonor Bacelar Nicolau PhD Thesis Appendices- Page A91/A107
Table 13. Summary of Adjusted OR for Regions by Registered Indicators, used as input for PCA
Adjusted OR for Registered Indicator
Region of residence
Blood pressure Cholesterol Triglycerides
Waist circumference BMI
Norte 3.223 2.948 2.714 4.098 2.783 Centro 1.682 1.910 1.840 2.530 1.390 LVT 1.370 1.069 1.016 0.952 1.246 Alentejo 2.559 2.155 2.259 2.041 1.530 Algarve 1.000 1.000 1.000 1.000 1.000
Color Code OR adjusted
>= 2.000
[1.5 - 2.000[
[1.0 - 1.5[
<1.0

Appendices
Appendices- Page A92/A107 Leonor Bacelar Nicolau PhD Thesis
Stage 2: Association between Mortality and registering or not indicators, by region
Table 14. Outcome by Registration of Blood Pressure, overall and for each region - % and Fisher Exact Tests
Blood Pressure registered or not
Outcome (at Dec 31 2013) Not Deceased Deceased p-value *
Overall Sample n 3507 269 Not registered 34.3% 53.2% p<0.001 Registered 65.7% 46.8% By Region Norte n 1071 82 Not registered 23.3% 47.6% p<0.001 Registered 76.7% 52.4% Centro n 755 61 Not registered 36.2% 55.7% 0.004 Registered 63.8% 44.3% LVT n 1239 87 Not registered 41.6% 58.6% 0.002 Registered 58.4% 41.4% Alentejo n 259 26 Not registered 28.2% 34.6% 0.500 Registered 71.8% 65.4% Algarve n 183 13 Not registered 49.2% 76.9% 0.082 Registered 50.8% 23.1% * Fisher Exact Test
Table 15. Outcome by Registration of Cholesterol, overall and for each region - % and Fisher Exact Tests
Cholesterol registered or not
Outcome (at Dec 31 2013) Not Deceased Deceased p-value *
Overall Sample n 3507 269 Not registered 65.3% 89.6% p<0.001 Registered 34.7% 10.4% By Region Norte n 1071 82
Not registered 52.4% 93.9% p<0.001 Registered 47.6% 6.1% Centro n 755 61 Not registered 64.0% 85.2% 0.001 Registered 36.0% 14.8% LVT n 1239 87 Not registered 76.4% 90.8% 0.001 Registered 23.6% 9.2% Alentejo n 259 26 Not registered 61.8% 76.9% 0.141 Registered 38.2% 23.1% Algarve n 183 13 Not registered 77.0% 100.0% 0.075 Registered 23.0% 0.0%

Appendices
Leonor Bacelar Nicolau PhD Thesis Appendices- Page A93/A107
* Fisher Exact Test Table 16. Outcome by Registration of Triglycerides, overall and for each region - % and Fisher Exact Tests
Triglycerides registered or not
Outcome (at Dec 31 2013) Not Deceased Deceased p-value *
Overall Sample n 3507 269 Not registered 65.0% 91.1% p<0.001 Registered 35.0% 8.9% By Region Norte n 1071 82 Not registered 52.9% 93.9% p<0.001 Registered 47.1% 6.1% Centro n 755 61 Not registered 63.2% 88.5% p<0.001 Registered 36.8% 11.5% LVT n 1239 87 Not registered 76.0% 93.1% p<0.001 Registered 24.0% 6.9% Alentejo n 259 26 Not registered 59.1% 76.9% 0.093 Registered 40.9% 23.1% Algarve n 183 13 Not registered 76.0% 100.0% 0.043 Registered 24.0% 0.0% * Fisher Exact Test
Table 17. Outcome by Registration of Waist, overall and for each region - % and Fisher Exact Tests
Waist circumference registered or not
Outcome (at Dec 31 2013) Not Deceased Deceased p-value *
Overall Sample n 3507 269 Not registered 82.9% 91.8% p<0.001 Registered 17.1% 8.2% By Region Norte n 1071 82 Not registered 72.7% 85.4% 0.013 Registered 27.3% 14.6% Centro n 755 61 Not registered 80.8% 88.5% 0.171 Registered 19.2% 11.5% LVT n 1239 87 Not registered 91.8% 96.6% 0.147 Registered 8.2% 3.4% Alentejo n 259 26 Not registered 83.0% 100.0% 0.019 Registered 17.0% 0.0% Algarve n 183 13 Not registered 91.3% 100.0% 0.606 Registered 8.7% 0.0%

Appendices
Appendices- Page A94/A107 Leonor Bacelar Nicolau PhD Thesis
* Fisher Exact Test
Table 18. Outcome by Registration of BMI, overall and for each region - % and Fisher Exact Tests
BMI registered or not Outcome (at Dec 31 2013)
Not Deceased Deceased p-value * Overall Sample n 3507 269 Not registered 62.7% 84.0% p<0.001 Registered 37.3% 16.0% By Region Norte n 1071 82 Not registered 50.2% 76.8% p<0.001 Registered 49.8% 23.2% Centro n 755 61 Not registered 66.8% 83.6% 0.006 Registered 33.2% 16.4% LVT n 1239 87 Not registered 69.2% 87.4% p<0.001 Registered 30.8% 12.6% Alentejo n 259 26 Not registered 63.7% 92.3% 0.002 Registered 36.3% 7.7% Algarve n 183 13 Not registered 73.8% 92.3% 0.191 Registered 26.2% 7.7% * Fisher Exact Test

Appendices
Leonor Bacelar Nicolau PhD Thesis Appendices- Page A95/A107
Table 19. Odds ratios for Outcome by Registration of Blood Pressure - overall crude, adjusted and stratified by region
Outcome (deceased or not at Dec 31 2013) by
Blood Pressure registered or not
Blood Pressure registered or not after controlling for Sex, Age,
Sex*Age
Blood Pressure registered or not after controlling for Sex, Age, Sex*Age and for 4 Admission
Severity indicators OR CI 95% p-value OR CI 95% p-value OR CI 95% p-value
Overall Model 2.176 [1.696;2.793] p<0.001 2.149 [1.654;2.793] p<0.001 2.271 [1.738;2.966] p<0.001 Overall Model also adjusted by Region 2.277 [1.766;2.936] p<0.001 2.326 [1.778;3.044] p<0.001 2.417 [1.837;3.18] p<0.001 Stratifying by Region Norte 2.979 [1.888;4.699] p<0.001 3.157 [1.932;5.16] p<0.001 3.533 [2.121;5.884] p<0.001 Centro 2.223 [1.313;3.764] 0.003 2.151 [1.239;3.732] 0.006 2.227 [1.273;3.896] 0.005 LVT 1.985 [1.277;3.086] 0.002 1.932 [1.219;3.062] 0.005 1.932 [1.208;3.091] 0.006 Alentejo 1.349 [0.575;3.163] 0.491 1.686 [0.69;4.118] 0.252 1.773 [0.702;4.474] 0.225 Algarve 3.444 [0.918;12.924] 0.067 3.232 [0.716;14.599] 0.127 2.945 [0.637;13.625] 0.167
Table 20. Odds ratios for Outcome by Registration of Cholesterol - overall crude, adjusted and stratified by region
Outcome (deceased or not at Dec 31 2013) by
Cholesterol registered or not
Cholesterol registered or not after controlling for Sex, Age,
Sex*Age
Cholesterol registered or not after controlling for Sex, Age, Sex*Age
and for 4 Admission Severity indicators
OR CI 95% p-value OR CI 95% p-value OR CI 95% p-value
Overall Model 4.568 [3.07;6.798] p<0.001 4.062 [2.712;6.084] p<0.001 4.241 [2.822;6.375] p<0.001 Overall Model also adjusted by Region 4.881 [3.268;7.29] p<0.001 4.434 [2.946;6.672] p<0.001 4.582 [3.033;6.922] p<0.001 Stratifying by Region Norte 14.000 [5.622;34.866] p<0.001 12.576 [5.007;31.591] p<0.001 13.504 [5.339;34.157] p<0.001 Centro 3.254 [1.579;6.705] 0.001 3.004 [1.434;6.295] 0.004 3.173 [1.502;6.704] 0.002 LVT 3.059 [1.461;6.403] 0.003 2.513 [1.183;5.338] 0.016 2.471 [1.156;5.283] 0.020 Alentejo 2.062 [0.801;5.312] 0.134 2.205 [0.833;5.839] 0.112 2.175 [0.794;5.962] 0.131 Algarve - - - - - - - - -

Appendices
Appendices- Page A96/A107 Leonor Bacelar Nicolau PhD Thesis
Table 21. Odds ratios for Outcome by Registration of Triglycerides - overall crude, adjusted and stratified by region
Outcome (deceased or not at Dec 31 2013) by
Triglycerides registered or not
Triglycerides registered or not after controlling for Sex, Age,
Sex*Age
Triglycerides registered or not after controlling for Sex, Age, Sex*Age
and for 4 Admission Severity indicators
OR CI 95% p-value OR CI 95% p-value OR CI 95% p-value
Overall Model 5.507 [3.601;8.423] p<0.001 4.926 [3.201;7.579] p<0.001 5.128 [3.321;7.917] p<0.001 Overall Model also adjusted by Region 5.905 [3.848;9.062] p<0.001 5.391 [3.488;8.332] p<0.001 5.560 [3.584;8.625] p<0.001 Stratifying by Region Norte 13.689 [5.497;34.091] p<0.001 12.387 [4.93;31.123] p<0.001 13.277 [5.249;33.585] p<0.001 Centro 4.496 [2.018;10.017] p<0.001 4.216 [1.864;9.537] 0.001 4.409 [1.934;10.053] p<0.001 LVT 4.256 [1.839;9.854] 0.001 3.491 [1.489;8.181] 0.004 3.467 [1.47;8.18] 0.005 Alentejo 2.309 [0.897;5.944] 0.083 2.303 [0.871;6.093] 0.093 2.221 [0.809;6.1] 0.122 Algarve - - - - - - - - -
Table 22. Odds ratios for Outcome by Registration of Waist Circumference - overall crude, adjusted and stratified by region
Outcome (deceased or not at Dec 31 2013) by
Waist circumference registered or
not
Waist circumference registered or not
after controlling for Sex, Age, Sex*Age
Waist circumference registered or not after controlling for Sex, Age,
Sex*Age and for 4 Admission Severity indicators
OR CI 95% p-value OR CI 95% p-value OR CI 95% p-value
Overall Model 2.308 [1.479;3.601] p<0.001 2.167 [1.376;3.413] 0.001 2.315 [1.464;3.66] p<0.001 Overall Model also adjusted by Region 2.426 [1.546;3.805] p<0.001 2.359 [1.488;3.739] p<0.001 2.468 [1.551;3.926] p<0.001 Stratifying by Region Norte 2.187 [1.168;4.093] 0.014 2.072 [1.088;3.946] 0.027 2.067 [1.076;3.972] 0.029 Centro 1.834 [0.817;4.113] 0.141 1.965 [0.856;4.511] 0.111 2.327 [0.998;5.422] 0.050 LVT 2.485 [0.772;8.002] 0.127 2.280 [0.694;7.492] 0.174 2.313 [0.698;7.667] 0.170 Alentejo - - - - - - - - - Algarve - - - - - - - - -
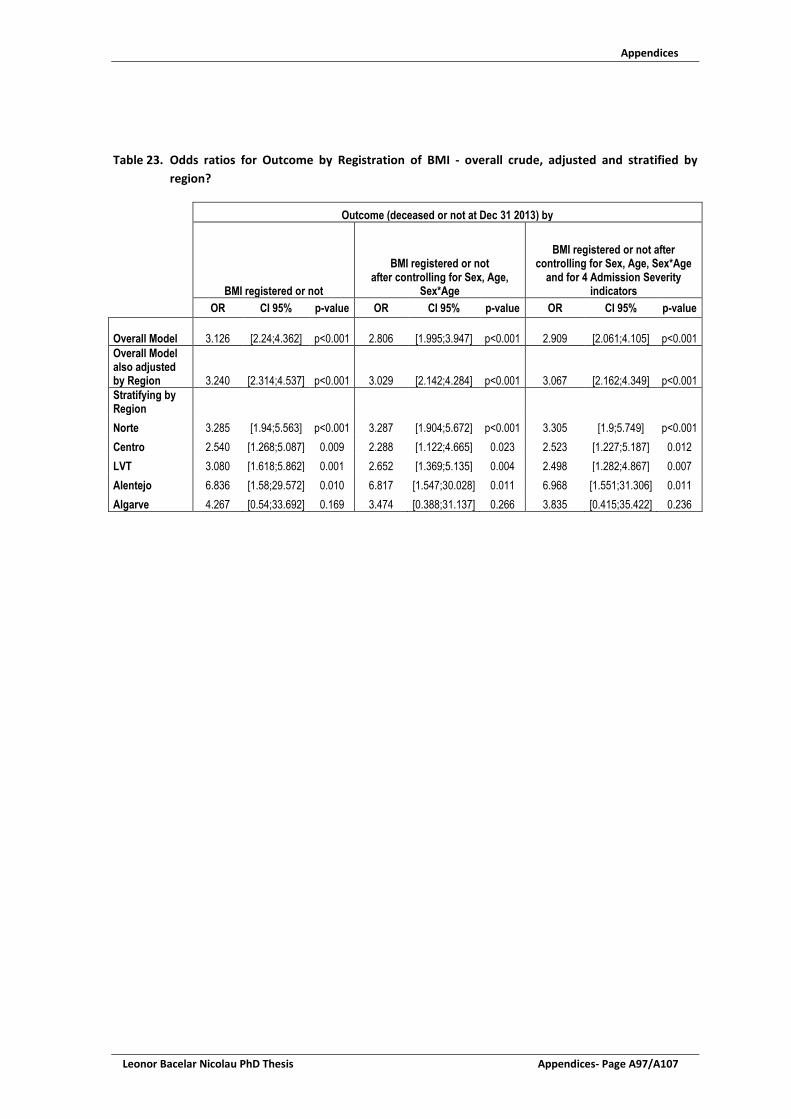
Appendices
Leonor Bacelar Nicolau PhD Thesis Appendices- Page A97/A107
Table 23. Odds ratios for Outcome by Registration of BMI - overall crude, adjusted and stratified by
region?
Outcome (deceased or not at Dec 31 2013) by
BMI registered or not
BMI registered or not after controlling for Sex, Age,
Sex*Age
BMI registered or not after controlling for Sex, Age, Sex*Age
and for 4 Admission Severity indicators
OR CI 95% p-value OR CI 95% p-value OR CI 95% p-value
Overall Model 3.126 [2.24;4.362] p<0.001 2.806 [1.995;3.947] p<0.001 2.909 [2.061;4.105] p<0.001 Overall Model also adjusted by Region 3.240 [2.314;4.537] p<0.001 3.029 [2.142;4.284] p<0.001 3.067 [2.162;4.349] p<0.001 Stratifying by Region Norte 3.285 [1.94;5.563] p<0.001 3.287 [1.904;5.672] p<0.001 3.305 [1.9;5.749] p<0.001 Centro 2.540 [1.268;5.087] 0.009 2.288 [1.122;4.665] 0.023 2.523 [1.227;5.187] 0.012 LVT 3.080 [1.618;5.862] 0.001 2.652 [1.369;5.135] 0.004 2.498 [1.282;4.867] 0.007 Alentejo 6.836 [1.58;29.572] 0.010 6.817 [1.547;30.028] 0.011 6.968 [1.551;31.306] 0.011 Algarve 4.267 [0.54;33.692] 0.169 3.474 [0.388;31.137] 0.266 3.835 [0.415;35.422] 0.236

Appendices
Appendices- Page A98/A107 Leonor Bacelar Nicolau PhD Thesis
Figure 9. 95% Confidence Intervals for Adjusted OR for mortality by registration of each health
indicator stratified by region, visualized by health indicator registered (1,2,3)
(1) After controlling for Sex, Age, Sex*Age and Hospital Admission Severity Indicators (2) Stratified Models by Region (3) Not Applicable for Waist Circumference in Alentejo and Algarve and for Triglycerides and Cholesterol in Algarve

Appendices
Leonor Bacelar Nicolau PhD Thesis Appendices- Page A99/A107
Figure 10. 95% Confidence Intervals for Adjusted Odds ratios for mortality by registration of each health indicator stratified by region, visualized by region (1,2,3)
(1) After controlling for Sex, Age, Sex*Age and Hospital Admission Severity Indicators (2) Stratified Models by Region (3) Not Applicable for Waist Circumference in Alentejo and Algarve and for Triglycerides and Cholesterol in Algarve

Appendices
Appendices- Page A100/A107 Leonor Bacelar Nicolau PhD Thesis
Table 24. Summary of Adjusted OR for Mortality by Registered Indicators, stratified by Region
Adjusted OR for Registered Indicator
Region of residence
Blood pressure Cholesterol Triglycerides Waist
circumference BMI Norte 3.533 13.504 13.277 2.067 3.305 Centro 2.227 3.173 4.409 2.327 2.523 LVT 1.932 2.471 3.467 2.313 2.498 Alentejo 1.773 2.175 2.221 6.968 Algarve 2.945 3.835
Color Code OR adjusted
>=4.000
[2.000 - 4.000[
[1.5 - 2.000[
[1.0 - 1.5[
<1.0
Conceptual Path Policy / Equity / Health Event of Interest
Figure 11. Conceptual Path Policy / Equity / Health Event of Interest

Appendices
Leonor Bacelar Nicolau PhD Thesis Appendices- Page A101/A107
Appendix 7: Main Scientific Publications published by the author and
activities, relevant to this research
MAIN PUBLICATIONS AS FIRST AUTHOR Paper published:
Bacelar-Nicolau, L., T. Rodrigues, E. Fernandes, M.F. Lobo, C. Nisa, V. Azzone, A. Teixeira-Pinto, Costa-Pereira, A., Normand, S.-L., Pereira Miguel, J. "Picturing Inequities for Health Impact Assessment: Linked Electronic Records, Mortality and Regional Disparities in Portugal." Impact Assessment and Project Appraisal; VOL.36, NO.1, 90-104; 2018. https: //doi.org/10.1080/14615517.2017.1364016 Book chapter accepted for publication:
2017 – Bacelar-Nicolau L., Heitor M.J., Pereira Miguel J., Guia de Metodologias de Avaliação de Políticas Públicas, 16. Avaliação de Impacte na Saúde. Eds. Feijó A, Ferrão J, Monteiro S, Pinto Paixão J, Lisboa: Imprensa da Universidade de Lisboa [in press]
Papers submitted or to be submitted for publication proximately:
Bacelar-Nicolau L, Lobo M, Nisa C, Fernandes E, Azzone V, Teixeira-Pinto A, Costa-Pereira A, Normand SL, Pereira Miguel J. Aiding systematic reviews with multivariate data analysis: profiling Health Impact Assessment guides and journal publications. Submitted to Environmental Impact Assessment Review, based on Chapter 2 PhD thesis findings – Dec 2017
Bacelar-Nicolau L, Lobo M, Nisa C, Fernandes E, Azzone V, Teixeira-Pinto A, Costa-Pereira A, Normand SL, Pereira Miguel J. Screening National Health Programs for Health Impact Assessment: setting health priorities with cluster analysis – target journal TBD, based on SubChapter 3.2 PhD thesis findings
Bacelar-Nicolau L, Lobo M, Nisa C, Fernandes E, Azzone V, Teixeira-Pinto A, Costa-Pereira A, Normand SL, Pereira Miguel J. Screening Policies in Health Impact Assessment: easier decision making through cluster analysis – target journal TBD, based on SubChapter 3.1 PhD thesis findings
Bacelar-Nicolau L, Alves I., Pereira Miguel J. WHO, OECD, Eurostat: please agree on mortality standardized rates? – Commentary to be submitted to BMJ Global Health

Appendices
Appendices- Page A102/A107 Leonor Bacelar Nicolau PhD Thesis
Abstracts published in International Peer-reviewed Scientific Journals:
2016 - Bacelar-Nicolau L, Rodrigues T, Fernandes E, Lobo MF, Nisa C, Azzone V, Teixeira-Pinto A, Rocha-Gonçalves FN, Azevedo LF, Freitas A, Normand S-LT, Costa-Pereira A, Pereira-Miguel J, “Helping Decision-Makers Visualize Inequities In Health Impact Assessment: Linked Electronic Records, Mortality And Regional Disparities In Portugal”, Value in Health. 2016. Vol. 19, Issue 7, PHS109 – DOI: http://dx.doi.org/10.1016/j.jval.2016.09.1591
2015 - Bacelar-Nicolau L, Pereira Miguel J, Saporta G, “Screening Policies for Health Impact Assessment: cluster analysis for easier decision making”, Eur J Public Health, Vol. 25 (suppl 3), 133-134 - DOI: http://dx.doi.org/10.1093/eurpub/ckv171.014
2015 - Bacelar-Nicolau L, Pereira-Miguel J, Saporta G, “Screening Policies in Health Impact Assessment: easier decision making through cluster analysis”, Eur J Epidemiol, Vol. 30, Issue 8 (suppl.), 852 – Abstract P238, Healthy Living: The European Congress of Epidemiology 2015, Maastricht, Netherlands, Bols E., Smits L., Weijenberg M. (Eds.) - DOI: 10.1007/s10654-015-0072-z http://link.springer.com/article/10.1007%2Fs10654-015-0072-z
Papers and Abstracts in Conferences and Congresses Proceedings
2016 - Bacelar-Nicolau L, Rodrigues T, Fernandes E, Lobo MF, Nisa C, Azzone V, Teixeira-Pinto A, Rocha-Gonçalves FN, Azevedo LF, Freitas A, Normand S-LT, Costa-Pereira A, Pereira-Miguel J, “Helping Decision-Makers Visualize Inequities In Health Impact Assessment: Linked Electronic Records, Mortality And Regional Disparities In Portugal”, Value in Health. 2016. Vol. 19, Issue 7, PHS109 – DOI: http://dx.doi.org/10.1016/j.jval.2016.09.1591
2015 - Bacelar-Nicolau L, Pereira Miguel J, Saporta G, “Screening Policies for Health Impact Assessment: cluster analysis for easier decision making”, Eur J Public Health, Vol. 25 (suppl 3), 133-134 - DOI: http://dx.doi.org/10.1093/eurpub/ckv171.014
2015 - Bacelar-Nicolau L, Pereira-Miguel J, Saporta G, “Screening Policies in Health Impact Assessment: easier decision making through cluster analysis”, Eur J Epidemiol, Vol. 30, Issue 8 (suppl.), 852 – Abstract P238, Healthy Living: The European Congress of Epidemiology 2015, Maastricht, Netherlands, Bols E., Smits L., Weijenberg M. (Eds.) - DOI: 10.1007/s10654-015-0072-z http://link.springer.com/article/10.1007%2Fs10654-015-0072-z
Oral Invited Presentations
2016 - Bacelar-Nicolau L, Rodrigues T, Fernandes E, Lobo MF, Nisa C, Azzone V, Teixeira-Pinto A, Rocha-Gonçalves FN, Azevedo LF, Freitas A, Normand S-LT, Costa-Pereira A, Pereira-Miguel J, “Helping Decision-Makers Visualize Inequities In Health Impact Assessment: Linked Electronic Records, Mortality And Regional Disparities In Portugal”, I Workshop do Capítulo ISPOR Portugal, 16 November 2016, Lisbon, Portugal
2016 – Bacelar-Nicolau L. Health Impact Assessment: Quantifying and Modeling to Better

Appendices
Leonor Bacelar Nicolau PhD Thesis Appendices- Page A103/A107
Decide, Conservatoire National des Arts et Métiers, July 1, 2016, Paris, France
Other Oral Presentations
2015 - Bacelar-Nicolau L, Pereira-Miguel J, Saporta G, “Screening Policies for Health Impact Assessment: cluster analysis for easier decision making”, European Public Health Conference, October 2015, Milan, Italy. [Oral Pitch Presentation]
2009 - Bacelar-Nicolau L, Craveiro I, Pereira Miguel J, Saporta G, “HIA of Social Welfare Payment for Inclusion Policy: Tools to Improve Health Gaps, Promote Equity” HIA09 On the Move- 10th Conference on Health Impact Assessment (Rotterdam, Holanda)
2009 - Bacelar-Nicolau L, Craveiro I, Pereira Miguel J, Saporta G, “Health Impact Assessment of a Social Welfare Payment for Inclusion Policy: A Tool to Improve Health Gaps and Promote Equity?” 2nd Joint European Public Health Conference 2009 (Lozd, Poland)
Poster Presentations
2016 - Bacelar-Nicolau L, Rodrigues T, Fernandes E, Lobo MF, Nisa C, Azzone V, Teixeira-Pinto A, Rocha-Gonçalves FN, Azevedo LF, Freitas A, Normand S-LT, Costa-Pereira A, Pereira-Miguel J, “Helping Decision-Makers Visualize Inequities In Health Impact Assessment: Linked Electronic Records, Mortality And Regional Disparities In Portugal”, ISPOR 19th Annual European Congress, October 29-November 2 2016, Vienna, Austria
2015 - Bacelar-Nicolau L, Pereira-Miguel J, Saporta G, Screening Policies in Health Impact Assessment: easier decision making through cluster analysis, European Congress of Epidemiology, June 25-27, 2015, Maastricht, The Netherlands
OTHER CO-AUTHORED PUBLICATIONS RELEVANT TO THIS RESEARCH, EITHER FOR THEME OR METHODOLOGIES USED BY THE AUTHOR
Book
2017 – Cooke A., Coggins T., Virgolino A., Carreiras J., Bacelar-Nicolau L., Heitor M.J. Mental Health and Wellbeing Impact Assessment: Final Report EEA grants Healthy Employment Project. The impact of a community-based intervention on the mental wellbeing of professionals working with unemployed individuals. Lisboa. [http://empregosaudavel.org/en/publicacoes/]

Appendices
Appendices- Page A104/A107 Leonor Bacelar Nicolau PhD Thesis
Book Chapter
2015 - Bacelar-Nicolau, L., Barbosa, P., Sakellarides, C., Economic crisis, health systems and health in Europe – Country experience, Part II: Country profiles of health system responses to the crisis - Portugal, Pages 460-465, Edit. Thomson S, Figueras J, Evetovits T, Jowett M, Mladovsky P, Maresso A, Cylus J, Karanikolos M and Kluge H, Maidenhead: Open University Press on behalf of the European Observatory on Health Systems and Policies and World Health Organization Regional Office for Europe. http://www.euro.who.int/en/about-us/partners/observatory/publications/studies/economic-crisis,-health-systems-and-health-in-europe-country-experience
Master Thesis Supervision
2017 - Dias, M., “Health Impact Assessment of the Sustainable Enlargement of ADSE/Avaliação de Impacte em Saúde sobre o Alargamento Sustentável da ADSE”, Master’s Thesis – Mestrado Integrado em Medicina, Faculdade de Medicina, Universidade de Lisboa, Lisboa, Portugal
Papers in peer-reviewed International Journals
2017 – Lobo MF, Azzone V, Azevedo LF, Melica B, Freitas A, Bacelar-Nicolau L, Rocha-Gonçalves FN, Nisa C, Teixeira-Pinto A, Pereira-Miguel J, Resnic FS, Costa-Pereira A, Normand SL, “A Comparison of In-Hospital Acute Myocardial Infarction Management Between Portugal and the United States: 2000 – 2010”, International Journal for Quality in Health Care, Vol.29, Issue 5, 669-678. [https://doi.org/10.1093/intqhc/mzx092]
2015 - Ouakinin S, Eusébio S, Torrado M, Silva H, Nabais I, Gonçalves G, Bacelar-Nicolau L, “Stress reactivity, distress and attachment in newly diagnosed breast cancer patients”, Health Psychology and Behavioral Medicine, Vol. 3, No.1, 424-438 - DOI: http://dx.doi.org/10.1080/21642850.2015.1121491 [http://www.tandfonline.com/doi/full/10.1080/21642850.2015.1121491]
2015 - Oliveira L, Gomes C, Bacelar-Nicolau L, Ferreira L, Ferreira R, “Environment in pediatric wards: sound, light and temperature”, Sleep Medicine, Vol. 16, Issue 9, 1041–1048 - DOI: http://dx.doi.org/10.1016/j.sleep.2015.03.015 [http://www.sleep-journal.com/article/S1389-9457(15)00707-8/abstract] - Award Jaime Salazar de Sousa 2015, attributed by ACSM-Associação das Crianças de Santa Maria and the Pediatric Department of the Centro Hospitalar Lisboa Norte/Hospital de Santa Maria for the 2015 most relevant paper published in an international journal
2014 - Bacelar-Nicolau, H., Costa Nicolau, F., Sousa, Á., Bacelar-Nicolau, L., “Clustering of variables with a three-way approach for health sciences”, TPM-Testing, Psychometrics, Methodology in Applied Psychology, Vol. 21, No. 4, December 2014 – 435-447 – Special Issue – doi: 10.4473/TPM21.4.5 – Cises. http://www.tpmap.org/2014-vol-21-no-4-december/

Appendices
Leonor Bacelar Nicolau PhD Thesis Appendices- Page A105/A107
Papers in Peer-reviewed National Journals with referees
2017 – Lobo MF, Azzone V, Resnic FS, Melica B, Teixeira-Pinto A, Azevedo LF, Freitas A, Nisa C, Bacelar-Nicolau L, Rocha-Gonçalves FN, Pereira-Miguel J, Costa-Pereira A, Normand SL, “The Atlantic Divide in Coronary Heart Disease: Epidemiology and patient care in US and Portugal”, Portuguese Journal of Cardiology/Revista Portuguesa de Cardiologia, Vol. 36(9), Pag. 583-593, Lisboa, Portugal http://dx.doi.org/10.1016/j.repc.2016.09.02
2010 – Bacelar-Nicolau, H., Sousa, A., Bacelar-Nicolau, L. & Marques, M.S., “Do univariado ao multivariado: A escala de elementos tangíveis, suas relações com outras escalas e mais além”, Revista Portuguesa de Filosofia, Vol. 1, Pág. 383-405, Lisboa, Portugal http://www.jstor.org/stable/41354798?seq=1#page_scan_tab_contents
Papers and Abstracts in Conferences and Congresses Proceedings
2016 - Nisa CF, Lobo MF, Resnic F, Freitas A, Azevedo LF, Azzone V, Bacelar-Nicolau L, Teixeira-Pinto A, Normand SL, Costa-Pereira A. “Treating coronary heart disease in diabetic patients: A systematic review of systematic reviews”, Rev Port Cardiol. 2016. 35 (Espec Congr): 60-61 - http://www.elsevier.pt/pt/revistas/revista-portuguesa-cardiologia-334/pdf/X0870255116527330/S300/
2015 - Lobo MF, Azzone V, Melica B, Bacelar-Nicolau L, Nisa C, Freitas A, Azevedo LF, Rocha-Gonçalves FN, Resnic FS, Teixeira-Pinto A, Pereira-Miguel J, Normand S-LT, Costa-Pereira A, “The Atlantic Divide In Coronary Heart Disease: Health Technologies Use in the US and Portugal”, Value in Health. 2015. Vol. 18, Issue 7, A402 - DOI: http://dx.doi.org/10.1016/j.jval.2015.09.930
2014 - Bacelar-Nicolau, H., Nicolau, F.C., Sousa, Á., & Bacelar-Nicolau, L., “On cluster analysis of complex and heterogeneous data”, Proceedings of the 3rd Stochastic Modeling Techniques and Data Analysis International Conference (SMTDA2014), C. H. Skiadas (Eds.), 2014 ISAST, 99-108. http://www.smtda.net/images/1_A-F_SMTDA2014_Proceedings_NEW.pdf
2010 - Bacelar-Nicolau, H.; Nicolau, F. C.; Sousa, A.; Bacelar-Nicolau, L.,. “Clustering Complex Heterogeneous Data Using a Probabilistic Approach”, Proc. of Stochastic Modeling Techniques and Data Analysis International Conference (SMTDA2010), Chania, Crete, Greece, 8-11 June 2010, 85-93. http://www.smtda.net/smtda2010proceedings.html
Oral Invited Presentations
2016 – Lobo, M., Fernandes, E., Nisa, C., Bacelar-Nicolau, L., “Main results and lessons to be learned from the CUTEheart project”, 2nd CUTEheart Workshop on Health Technology Assessment in Cardiovascular Disease, in Congresso Português de Cardiologia, 23 April 2016, Vilamoura, Portugal
Appendices
Appendices- Page A106/A107 Leonor Bacelar Nicolau PhD Thesis
2015 - Bacelar-Nicolau, L., “Economia da Saúde: como garantir um bom retorno no investimento em saúde”, X Simpósio de Liderança e Gestão de Saúde, 20 February 2015, Covilhã, Portugal
Other Oral Presentations
2016 – Fernandes E, Bacelar-Nicolau L, Lobo MF, Nisa C, Teixeira-Pinto A, Normand SL, Azzone A, Costa-Pereira A., Pereira Miguel J, “Comparison of statistical models for predicting 30-day readmission after acute myocardial infarction in Portugal”. I Workshop in Biostatistics, December 7-9 2016, Maringá, PR, Brazil.
2014 - Bacelar-Nicolau H, Nicolau F.C., Sousa Á., Bacelar-Nicolau L., “On cluster analysis of complex and heterogeneous data”, SMTDA2014 - 3rd Stochastic Modeling Techniques and Data Analysis International Conference, 11-14 June 2014, p.1. (Lisbon, Portugal)
Poster Presentations
2016 - Nisa C, Azevedo LF, Resnic FS, Lobo MF, Freitas A, Azzone A, Bacelar-Nicolau L, Teixeira-Pinto A, Normand SL, Costa-Pereira A. Treating coronary heart disease in diabetic Patients: A systematic review of systematic reviews, 2nd CUTEheart Workshop – Health Technologies Assessment / Portuguese Congress of Cardiology, April 2016, Vilamoura, Portugal
2015 - Lobo MF, Azzone V, Melica B, Bacelar-Nicolau L, Nisa C, Freitas A, Azevedo LF, Rocha-Gonçalves FN, Resnic FS, Teixeira-Pinto A, Pereira-Miguel J, Normand ST, Costa-Pereira A. The Atlantic Divide in Coronary Heart Disease: Health technologies use in the US and Portugal, ISPOR 18th Annual European Congress, November 2015, Milan, Italy
2008 - Bacelar-Nicolau L, Pereira Miguel J, Saporta G, “The Added Value of Multivariate Statistical Data Analysis in Policy HIA – A Quantitative Way of Profiling Subjects” HIA08 Health Impact Assessment and Sustainable Well-being- 9th Conference on Health Impact Assessment (Liverpool, UK)
OTHER ASSOCIATED RELEVANT RESEARCH ACTVITIES
Focal point for Faculdade de Medicina of Universidade de Lisboa regarding the CUTEHeart Project (Comparative use of technologies for coronary heart disease - HMSP-ICT/0013/2011), an international partnership between the Harvard Medical School and the Faculties of Medicine from the Universities of Lisboa and Porto in Portugal, funded by the Harvard Medical School – Portugal Program in Translational Research and Information, which included the organization of the first workshop “Health Services Research: From data to practice” on December 11 2014 and and 2nd Workshop on “Health Technology Assessment in Cardiovascular Disease”, in Congresso
Appendices
Leonor Bacelar Nicolau PhD Thesis Appendices- Page A107/A107
Português de Cardiologia on April 23 2016 [http://cuteheart.med.up.pt] (2014-2016)
Advisor for Mental Wellbeing Impact Assessment regarding the Healthy Employment Project (2015-2017): an international partnership including Portugal, Norway and Iceland, for the promotion of mental health and wellbeing of the unemployed active population and the professionals that give them support [http://www.empregosaudavel.org/en/]
WHO Country Expert para “Health policy responses to the financial crisis in Europe” (first study published in 2012, updated in 2014): http://www.euro.who.int/en/what-we-do/data-and-evidence/health-evidence-network-hen/publications/2012/health-policy-responses-to-the-financial-crisis-in-europe
High Commissioner for Health (Alto Comissariado da Saúde - ACS) Advisor (2011): Member of the National Health Plan 2011-2016 Group, Responsible for Evaluating the National Health Programs
WHO Temporary Adviser (2009): High-level Meeting: “Health in Times if Global Economic Crisis: Implications for the WHO European Region”, Oslo, 1-2Abril 2009

Leonor BACELAR-NICOLAU
Health Impact Assessment: Quantifying and Modeling to Better Decide
Résumé : L’Évaluation d’Impact sur la Santé (EIS) est un instrument de support à la décision, pour juger une politique quant aux effets potentiels sur la santé et leur distribution (équité). C’est encore souvent une approche qualitative. L’objectif principal est de montrer l’utilité de méthodologies statistiques quantitatives multivariées pour enrichir la pratique d’EIS, améliorant la compréhension des résultats par des professionnels non-statisticiens. Les futures réformes des systèmes de santé déplacent le centre d’évaluation des services de santé des fournisseurs aux citoyens (besoins, préférences, équité d’accès aux gains de santé), exploitant big data associant information de soins aux données sociales, économiques et de déterminants de santé. Des méthodologies statistiques et d’évaluation innovantes sont nécessaires à cette transformation. Les méthodes de data mining et data science, souvent complexes, peuvent gérer des résultats graphiques compréhensibles pour amplifier l’usage d’EIS, qui deviendrait ainsi un outil précieux d’évaluation de politiques publiques pour amener les citoyens au centre de la prise de décision. Mots-Clés : Évaluation d’Impact sur la Santé; Équité; Analyse de Données Multivariées; Modélisation; Prise de décision Abstract : Health Impact Assessment (HIA) is a decision-making support tool to judge a policy as to its potential effects and its distribution on a population’s health (equity). It’s still very often a qualitative approach. The main aim here is to show the usefulness of applying quantified multivariate statistical methodologies to enrich HIA practice, while making the decision-making process easier, by issuing understandable outputs even for non-statisticians. The future of healthcare reforms shifts the center of evaluation of health systems from providers to people’s individual needs and preferences, reducing health inequities in access and health outcomes, using big data linking information from providers to social and economic health determinants. Innovative statistical and assessment methodologies are needed to make this transformation. Data mining and data science methods, however complex, may lead to graphical outputs simple to understand by decision makers. HIA is thus a valuable tool to assure public policies are indeed evaluated while considering health determinants and equity and bringing citizens to the center of the decision-making process. Keywords: Health Impact Assessment; Equity; Multivariate Data Analysis; Modeling; Decision-Making Resumo: A Avaliação de Impacte na Saúde (AIS) é um instrumento de suporte à decisão para julgar política quanto aos seus efeitos potenciais e à sua distribuição na saúde de uma população (equidade). É geralmente ainda uma abordagem qualitativa. O principal objetivo é mostrar a utilidade das metodologias estatísticas quantitativas e multivariadas para enriquecer a prática de AIS, melhorando a compreensão dos resultados por profissionais não-estatísticos. As futuras reformas dos sistemas de saúde deslocam o centro da avaliação dos serviços de saúde dos prestadores para as necessidades e preferências dos cidadãos, reduzindo iniquidades no acesso à saúde e ganhos em saúde, usando big data que associam informação de prestadores a dados sociais e económicos de determinantes de saúde. São necessárias metodologias estatísticas e de avaliação inovadoras para esta transformação. Métodos de data mining e data science, mesmo complexos, podem gerar resultados gráficos compreensíveis para os decisores. A AIS é assim uma ferramenta valiosa para avaliar políticas públicas considerando determinantes de saúde, equidade e trazendo os cidadãos para o centro da tomada de decisão. Palavras-chave: Avaliação de Impacte na Saúde; Equidade; Análise de Dados Multivariada; Modelização; Tomada de decisão