
Noise Impact Assessment - Environment Agency
46
Noise Impact Assessment Application to Vary Bespoke Environmental Permit BJ9908 to a Scrap Metal Recycling Facility George Henry Road, Great Bridge, Tipton, West Midlands, DY4 7BS. Report Ref: 224/Enablelink 28 March 2021
-
Upload
khangminh22 -
Category
Documents
-
view
3 -
download
0
Transcript of Noise Impact Assessment - Environment Agency

Noise Impact Assessment
Application to Vary Bespoke Environmental Permit BJ9908 to a Scrap Metal Recycling Facility
George Henry Road, Great Bridge, Tipton, West Midlands, DY4 7BS.
Report Ref: 224/Enablelink
28 March 2021

Enablelink Limited George Henry Road, Great Bridge, Tipton, DY4 7BS
Acoustic Impact Assessment
Contents 1 Introduction .............................................................................................................................1
1.1 Statement of Qualifications .............................................................................................2 1.2 Site Description ..............................................................................................................2 1.3 Existing Acoustic Environment .......................................................................................3
2 Legislation and Guidance .......................................................................................................4 2.1 Environmental Permitting (England and Wales) Regulations 2016 (as amended) ............4
2.1.1 Horizontal Guidance for Noise Part 2 – Noise Assessment and Control (H3) ..........4 2.2 National Planning Policy Framework (NPPF) 2019 .........................................................5 2.3 Noise Policy Statement for England 2010 (NPSE) ..........................................................6 2.4 Local Planning policy......................................................................................................6
2.4.1 Black Country Core Strategy .................................................................................6 2.4.2 Sandwell MBC Local Development Scheme 2020 ..................................................6
2.5 Summary of Noise Policy ...............................................................................................7 2.6 Noise Impact ..................................................................................................................7
2.6.1 Land Use and Noise Impact ...................................................................................8 2.7 Standards ......................................................................................................................9
2.7.1 External Standards ................................................................................................9 2.7.2 Internal Standards ............................................................................................... 10
3 Assessment Strategy ............................................................................................................ 11 3.1 Methodology ................................................................................................................ 11
3.1.1 Background and residual data ............................................................................. 11 3.1.2 Source noise for plant and equipment (predicted) ................................................ 12
3.2 SoundPLAN Model ....................................................................................................... 12 3.2.1 Model Assumptions ............................................................................................. 12
3.3 Limitations & Uncertainty .............................................................................................. 14 3.4 Noise Mitigation Measures ........................................................................................... 15
3.4.1 Building Construction ........................................................................................... 15 3.4.2 External Area ...................................................................................................... 16
3.5 Acoustic Mitigation ....................................................................................................... 17
4 Results ................................................................................................................................... 18 4.1 Background and Residual sound levels ........................................................................ 18
4.1.1 Commentary on area Background level ............................................................... 19 4.2 Modelled Operational Noise (daytime) .......................................................................... 20
4.2.1 Summary Data (All operational plant)................................................................... 20 4.3 BS4142 Assessment .................................................................................................... 21
5 Conclusions .......................................................................................................................... 23 5.1 Mitigation measures ..................................................................................................... 24 5.2 Efficacy of (engineered) mitigation measures ............................................................... 25 5.3 Noise Management Plan .............................................................................................. 25
Appendix 1A Source sound levels ................................................................................................. 30 Source data ............................................................................................................................ 30
Appendix 1B Plant Layout .............................................................................................................. 33 Source Locations (external) ..................................................................................................... 33 Source Locations (internal) ...................................................................................................... 34
Appendix 2 Model outputs.............................................................................................................. 35 Modelled 1 hour – No Additional Mitigation .............................................................................. 35 Modelled 1 hour – with additional mitigation............................................................................. 36 Typical Modelled Lday with mitigation........................................................................................ 38
Appendix 3 Noise Mitigation Specifications .................................................................................. 39 Cladding Euroclad 51.3 ........................................................................................................... 39 ILG Panels .............................................................................................................................. 40 Barrier Technical Specification ................................................................................................ 40
Appendix 4 Photographs ................................................................................................................ 43

Enablelink Ltd George Henry Road, Great Bridge, Tipton, DY4 7BS
Acoustic Impact Assessment
This report has been prepared in good faith, with all reasonable skill, care and diligence, based on information provided or known available at the time of its preparation and within the scope of work agreement with the client.
We disclaim any responsibility to the client and others in respect of any matters outside the scope of the above.
The report is provided for the sole use of the named client and is confidential to them and their professional advisors unless otherwise stated in an accompanied ‘letter of reliance’ with an official Crestwood Environmental Limited letterhead. No responsibility is accepted
to others.
Crestwood Environmental Ltd. Science, Technology & Prototyping Centre
UoWSP Glaisher Drive
Wolverhampton WV10 9RU
Tel: 01902 229 563
Email: [email protected] Web: www.crestwoodenvironmental.co.uk
Version & Status
Date Produced
Changes Written / Updated by: Checked & Authorised by:
Draft v1.0 15.02.21
Original Tony Higgins BSc (Hons), MSc, PGDip, MIOA, CMCIEH.
Associate Director (Noise and Environmental Health)
Stephen Barnes BSc (Hons), MCIWM, CEnv, Director
Draft v1.1 07.03.21
Updated plans, revised barrier heights
Tony Higgins BSc (Hons), MSc, PGDip, MIOA, CMCIEH.
Associate Director (Noise and Environmental Health)
Stephen Barnes BSc (Hons), MCIWM, CEnv, Director
Draft v1.2 18.03.21
Plant layout changes, changes in barrier location
Tony Higgins BSc (Hons), MSc, PGDip, MIOA, CMCIEH.
Associate Director (Noise and Environmental Health)
Stephen Barnes BSc (Hons), MCIWM, CEnv, Director
Final 22.03.21
Final Tony Higgins BSc (Hons), MSc, PGDip, MIOA, CMCIEH.
Associate Director (Noise and Environmental Health)
Stephen Barnes BSc (Hons), MCIWM, CEnv, Director

Enablelink Limited George Henry Road, Great Bridge, Tipton, DY4 7BS
Acoustic Impact Assessment
P a g e | 1
1 Introduction
This report supports a planning application for the reuse of the site formerly occupied by Ervin Amsteel Limited at George Henry Road, Great Bridge, Tipton DY4 7BS and provides the basis, together with a proposed noise management plan, for compliance with environmental noise standards required to operate the site as a metal recycling facility. The site ceased the foundry use in 2020, and has a long history of heavy industry dating back to the 1900’s including foundry use for the last 100 years. The proposed reuse of the site occurs following a period of international uncertainty due to the COVID-19 Pandemic. All measured background sound levels are noted to be affected by reduced ambient noise levels due to lockdown restrictions and stay at home instructions. The “Joint Guidance on the Impact of COVID-19 on the Practicality and Reliability of Baseline Sound Level Surveying and the Provision of Sound & Noise Impact Assessments” issued by the Institute of Acoustics and the Association of Noise Consultants clearly identifies potential issues with use of background and residual noise data obtained during the COVID-19 crisis, it also notes that measured data should be reviewed and potential uncertainties minimised in assessing baseline characterisation of sound levels. Crestwood has contacted Sandwell Metropolitan Borough Council (SMBC) Environmental Health to establish if data for the pre-existing background with the former foundry operating is available. Two reports have helpfully been provided for noise surveys in the vicinity of the application site. These reports have been used to establish pre-COVID-19 background and residual noise levels. Crestwood has requested public register documents on noise from the former foundry operators but has yet to receive the documents. Measured data for the current background and residual noise levels were noted to be affected by COVID-19 impacts and are therefore not representative of the mixed industrial/residential sound levels typical for this area. The proposed size and location of the installation may cause adverse noise impacts to sensitive receptors. Hence the approach used has been to model the proposed activities and provide data in the form of predicted maximum and predicted average noise levels. This data can be compared directly to World Health Organisation and BS8233:2014 standards, and, in conjunction with the background noise data available, assessed against BS4142:2014. Crestwood has therefore:
a. Carried out a survey of the area to establish the suitability of carrying out baseline sound
level measurements
b. Prepared a schedule of activities, plant and equipment proposed for the new site,
including noise emission data for each significant element
c. Prepared a noise model for the items noted in (b) above, and established predicted
operational noise levels at sensitive receptor locations
d. Confirmed intended operational hours for items noted in (b) above
e. Compared predicted data World Health Organisation and BS8233:2014 guidelines values
f. Compared predicted data against pre-existing background and residual levels using a
BS4142:2014+A1 (2019) method
g. Identified and quantified the effects of specified mitigation needed to comply with
appropriate standards and demonstrate BAT
h. Provided context.
This report provides the predicted noise data based on measurements of plant and equipment currently
operated at the existing Enablelink site at Budden Road, Coseley or sound power data on new plant
supplied by the equipment manufacturers and the client. The proposed site operated a foundry

Enablelink Limited George Henry Road, Great Bridge, Tipton, DY4 7BS
Acoustic Impact Assessment
2 1 4 / E n a b l e l i n k P a g e | 2
process, with very similar activities to those proposed for many years, and is considered that those
foundry activities are part of the existing residual noise in the area.
1.1 Statement of Qualifications Tony Higgins has over 30 years of regulatory and consultancy experience dealing with noise and nuisance issues and holds a Post Graduate Diploma in Acoustics and Noise Control. He is a Member of the Institute of Acoustics and also an elected member of the IOA Measurement & Instrumentation Group. He has spoken at (and organised) many IOA training events considering the implementation of BS4142:2014 and the use of noise measurements in both planning and licensing appeals. Tony managed the Public Protection service at Telford and Wrekin Council, including the Licensing Service, noise and statutory nuisance service and the consultation responses to the planning service. Tony has also prepared and delivered training materials for the EMAQ training package advising local authorities on the implementation of BS4142:2014. Tony has significant experience carrying out and evaluating data in determination of acoustic impact for complaints, licensing and planning work, in formal and informal hearings as well as court.
1.2 Site Description The proposed Enablelink site is located off George Henry Road, Great Bridge on the eastern most part of the Harvills Hawthorne industrial estate. The site is 4.5km north east of Dudley, and 2.7km northwest of West Bromwich town centres. The site is approximately 250m from the Black Country New Road to the west. The eastern edge of the site sits at the base of a ridge (a sharp increase in height of over 10m high) that separates the site from the small green corridor (an infilled former canal) to the east. Further east are the closest sensitive residential receptors. Fig.1.2.1 Schematic site location and monitoring location.
Courtesy of Google Earth Image (2021).
Application Site
Sensitive receptors

Enablelink Limited George Henry Road, Great Bridge, Tipton, DY4 7BS
Acoustic Impact Assessment
2 1 4 / E n a b l e l i n k P a g e | 3
The site itself is basically flat, with a number of existing heavy duty industrial buildings made of brick, concrete and blockwork. The roofs of the primary buildings are steel clad construction with heavy linings comprising layers of dense rockwool and sheet steel.
1.3 Existing Acoustic Environment The site is located on an industrial estate with a mixture of light and heavy industrial and waste operations, storage and delivery, and commercial uses. The following sound sources were noted in the area but may have been significantly influenced by COVID-19 lockdown conditions.
General steady drone of road traffic on main roads Vehicle movements from surrounding local roads Vehicle parking/manoeuvring alarms, slamming doors, (site). Loading/Unloading activities (distant) Hum of fans from industrial sites (soft) Occasional crash/bang from adjacent sites (deliveries) Distant sound of shouting, behavioural noise – talking etc (staff) on adjacent sites Local ‘residential’ noise and activities Birdsong
The site was observed to be relatively quiet with most of the external areas protected by the site buildings from the off site noise. The receptor locations of Wolseley Road and Isaac Walton Place were both noted to have a similar acoustic character to that observed onsite. Additional residential style noise sources were also noted, barking dogs, pedestrians, deliveries, DIY noise etc.

Enablelink Limited George Henry Road, Great Bridge, Tipton, DY4 7BS
Acoustic Impact Assessment
2 1 4 / E n a b l e l i n k P a g e | 4
2 Legislation and Guidance
2.1 Environmental Permitting (England and Wales) Regulations 2016 (as amended)
The above legislation requires that operators of permitted installations conduct their activities to prevent, or where that is not possible, to reduce to a minimum, pollution arising from their operations. For the processing of scrap metals and handling of waste, noise is a potential significant pollutant. The legislation requires that all pollutants (including noise and vibration) meet the standards required and demonstrate Best Available Techniques (BAT). Assessment of the impacts of noise from a proposed installation requires assessment to predict the significance of the potential impacts. Additional guidance and reference to national standards for the monitoring and evaluation of noise are accepted as appropriate metric for assessing the significance of impacts. The relevant guidance is listed below.
2.1.1 Horizontal Guidance for Noise Part 2 – Noise Assessment and Control
(H3)
Agency Guidance note H3 provides advice on assessing the potential impact of noise from permitted installations. The guidance notes that:
Regulation of noise under IPPC will bring together several legislative regimes with different scope but similar purpose and, in the case of A1 installations, will require a co-ordinated approach between the Regulator and both the Planning functions and the Environmental Health or Environmental Protection Teams of local authorities. At an early stage, lead planning and environmental health/protection officers should be identified to ensure an effective liaison and consultation process.”
It is therefore appropriate to reference guidance used by planning authorities in determining planning applications and, where possible align compliance requirements to avoid confusion or conflict between similarly required regulatory outcomes. (It should also be noted that the applicant requires planning consent for the operation of the installation and that this report will form part of the planning application submission). H3 endorses the use of the following specific guidance and standards for the assessment of noise from permitted installations:
• Planning Policy Guidance PPG24 Planning and Noise (now superseded by the National Planning Policy Framework 2019 and the Planning Practice Guidance)
• British Standard 4142: 1997 - Method for rating industrial noise affecting mixed residential and industrial areas (updated in 2014 and 2019)
• British Standard 5228: Noise and vibration control on construction and open sites (now updated in 2014 with a technical addendum)
• British Standard 7445: 1991 – Description and measurement of environmental (now updated in 2003)
• World Health Organisation Guidelines for Community Noise 1999. It is expected that controls on noise emissions put in place under the environmental permit requirements should be consistent with those required under other regulatory regimes. It is therefore also appropriate to also consider planning policy when setting appropriate noise controls. It is normal for permitted installations to demonstrate compliance by preparing a Noise Management Plan (NMP). The NMP addresses physical, operational and management controls exercised by the operator of the installation to comply with Best Available Techniques (BAT).
Enablelink Limited George Henry Road, Great Bridge, Tipton, DY4 7BS
Acoustic Impact Assessment
2 1 4 / E n a b l e l i n k P a g e | 5
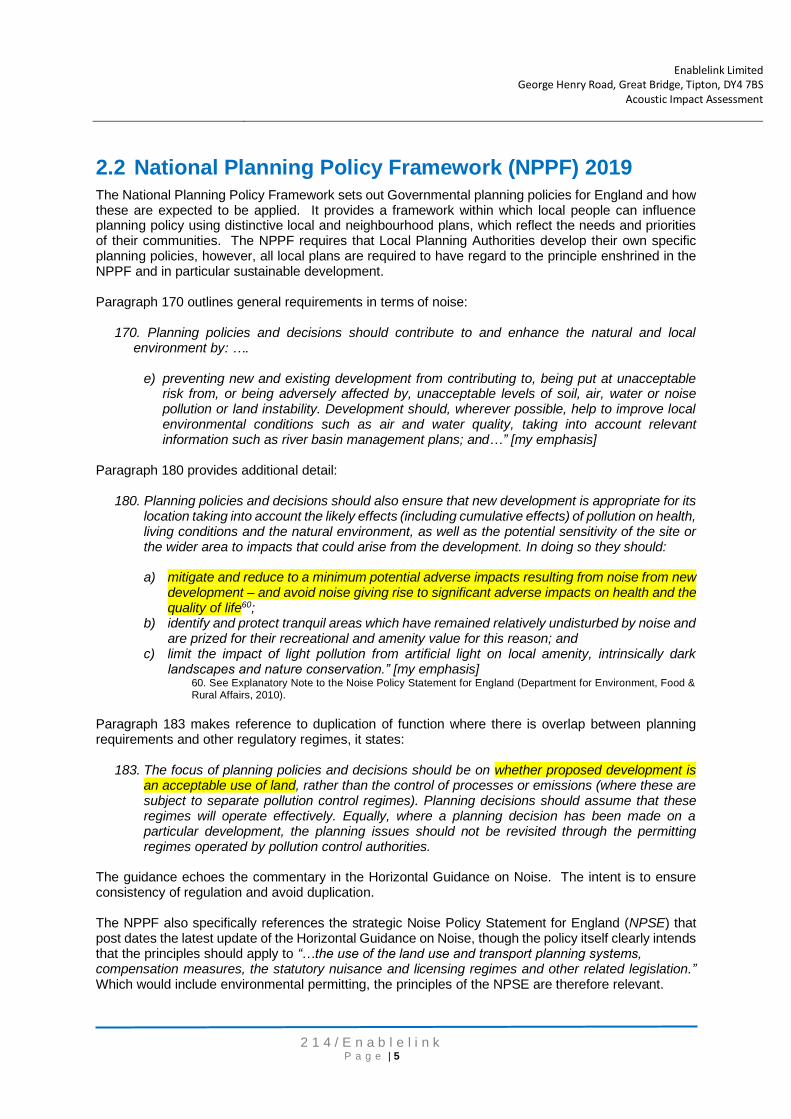
2.2 National Planning Policy Framework (NPPF) 2019 The National Planning Policy Framework sets out Governmental planning policies for England and how these are expected to be applied. It provides a framework within which local people can influence planning policy using distinctive local and neighbourhood plans, which reflect the needs and priorities of their communities. The NPPF requires that Local Planning Authorities develop their own specific planning policies, however, all local plans are required to have regard to the principle enshrined in the NPPF and in particular sustainable development. Paragraph 170 outlines general requirements in terms of noise:
170. Planning policies and decisions should contribute to and enhance the natural and local environment by: ….
e) preventing new and existing development from contributing to, being put at unacceptable
risk from, or being adversely affected by, unacceptable levels of soil, air, water or noise pollution or land instability. Development should, wherever possible, help to improve local environmental conditions such as air and water quality, taking into account relevant information such as river basin management plans; and…” [my emphasis]
Paragraph 180 provides additional detail:
180. Planning policies and decisions should also ensure that new development is appropriate for its
location taking into account the likely effects (including cumulative effects) of pollution on health, living conditions and the natural environment, as well as the potential sensitivity of the site or the wider area to impacts that could arise from the development. In doing so they should:
a) mitigate and reduce to a minimum potential adverse impacts resulting from noise from new
development – and avoid noise giving rise to significant adverse impacts on health and the quality of life60;
b) identify and protect tranquil areas which have remained relatively undisturbed by noise and are prized for their recreational and amenity value for this reason; and
c) limit the impact of light pollution from artificial light on local amenity, intrinsically dark landscapes and nature conservation.” [my emphasis]
60. See Explanatory Note to the Noise Policy Statement for England (Department for Environment, Food & Rural Affairs, 2010).
Paragraph 183 makes reference to duplication of function where there is overlap between planning requirements and other regulatory regimes, it states:
183. The focus of planning policies and decisions should be on whether proposed development is an acceptable use of land, rather than the control of processes or emissions (where these are subject to separate pollution control regimes). Planning decisions should assume that these regimes will operate effectively. Equally, where a planning decision has been made on a particular development, the planning issues should not be revisited through the permitting regimes operated by pollution control authorities.
The guidance echoes the commentary in the Horizontal Guidance on Noise. The intent is to ensure consistency of regulation and avoid duplication. The NPPF also specifically references the strategic Noise Policy Statement for England (NPSE) that post dates the latest update of the Horizontal Guidance on Noise, though the policy itself clearly intends that the principles should apply to “…the use of the land use and transport planning systems, compensation measures, the statutory nuisance and licensing regimes and other related legislation.” Which would include environmental permitting, the principles of the NPSE are therefore relevant.

Enablelink Limited George Henry Road, Great Bridge, Tipton, DY4 7BS
Acoustic Impact Assessment
2 1 4 / E n a b l e l i n k P a g e | 6
2.3 Noise Policy Statement for England 2010 (NPSE) The Noise Policy Statement vision is to ‘Promote good health and a good quality of life through the effective management of noise within the context of Government policy on sustainable development’. The NPSE refers to the World Health Organisation guidance and deals with noise in the context of health. Health is defined as ‘physical and mental well-being’ and is quoted in terms of standards with ‘observed’ health impacts. Additionally, quality of life is also mentioned which is a subjective measure and can be considered to promote amenity standards and in all cases equate to prevention of nuisance. The NPSE makes reference to two concepts documented by the WHO, namely:
• No Observed Effect Level (NOEL): the level below which no effect can be detected
• Lowest Observed Adverse Effect Level (LOAEL): the level above which adverse effects on health and quality of life can be detected.
And (by extrapolation from WHO criteria), a further level,
• Significant Observed Adverse Effect Level (SOAEL): the level above which significant adverse effects on health and quality of life occur.
There is no specific definition of how these levels are to be calculated, however it is noted that methodologies comparing results (either measured or calculated) to background and ambient levels are considered appropriate. Determining how these impacts are to be demonstrated will depend on the nature of the noise, acoustic properties of the noise, and the site-specific circumstance of design and construction of development locations in which the noise is present. In most cases the local council within whose area the application site exists will provide additional guidance on what is required to determine impact in accordance with local policy that will, by definition, have regard to local conditions and circumstances.
2.4 Local Planning policy
2.4.1 Black Country Core Strategy
The Black Country Core Strategy is a strategic plan prepared jointly by the four Black Country authorities to cover the Black Country area (Dudley, Sandwell, Walsall and Wolverhampton) for the period 2006-2026. Policy WM4 Locational Considerations for New Waste Management Facilities states:
“… All proposals should minimise adverse visual impacts, potential detrimental effects on the environment and human health, and localised impacts on neighbouring uses from noise, emissions, odours, vermin and litter. To minimise such impacts, wherever possible, waste management operations should be contained within a building or other physical enclosure. The design of new buildings, other structures, boundaries and landscaping should also make a positive contribution to the area (see ENV3).”
2.4.2 Sandwell MBC Local Development Scheme 2020
Sandwell MBC Local Development Scheme 2020 does not have specific policies in respect of noise and disturbance noise policies BE3 Amenity Carbon sources states: The Sandwell local planning policy does not provide additional detail on how these impacts are to be assessed or what standards are applicable to assess noise impact. Planning Practice Guidance (PPG) provides additional information on determining noise impact (see paragraph 2.6 below).
Enablelink Limited George Henry Road, Great Bridge, Tipton, DY4 7BS
Acoustic Impact Assessment
2 1 4 / E n a b l e l i n k P a g e | 7
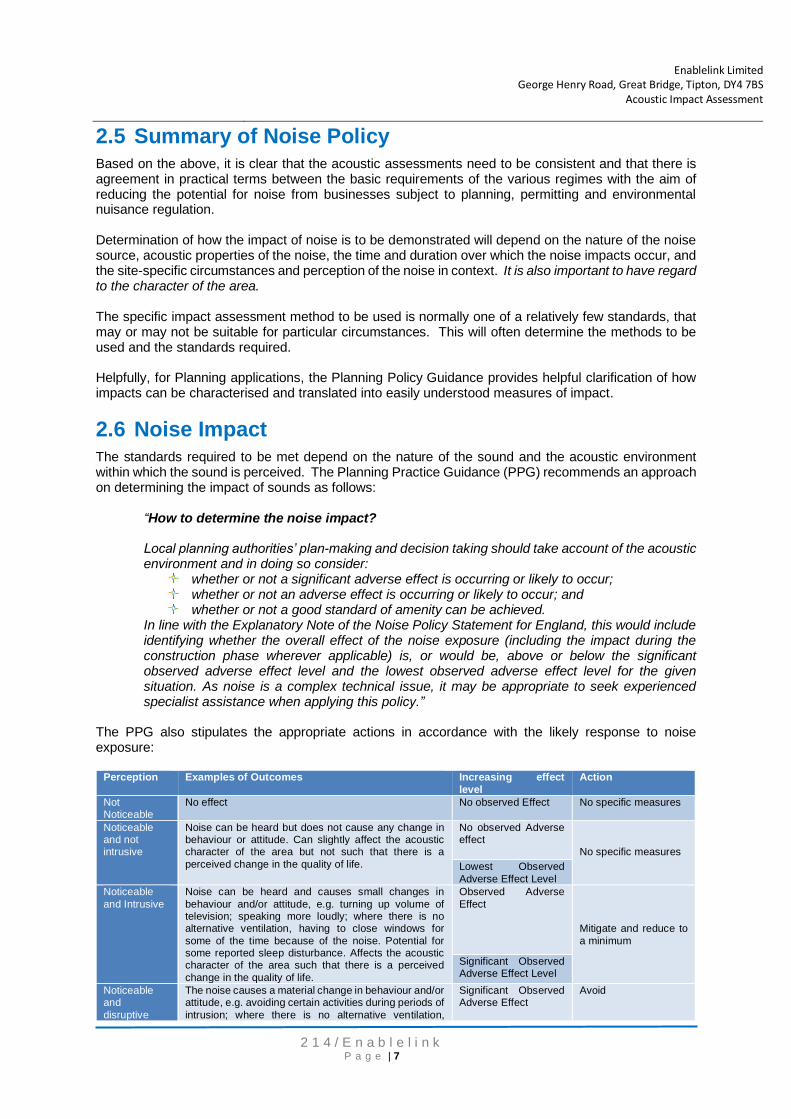
2.5 Summary of Noise Policy Based on the above, it is clear that the acoustic assessments need to be consistent and that there is agreement in practical terms between the basic requirements of the various regimes with the aim of reducing the potential for noise from businesses subject to planning, permitting and environmental nuisance regulation. Determination of how the impact of noise is to be demonstrated will depend on the nature of the noise source, acoustic properties of the noise, the time and duration over which the noise impacts occur, and the site-specific circumstances and perception of the noise in context. It is also important to have regard to the character of the area. The specific impact assessment method to be used is normally one of a relatively few standards, that may or may not be suitable for particular circumstances. This will often determine the methods to be used and the standards required. Helpfully, for Planning applications, the Planning Policy Guidance provides helpful clarification of how impacts can be characterised and translated into easily understood measures of impact.
2.6 Noise Impact The standards required to be met depend on the nature of the sound and the acoustic environment within which the sound is perceived. The Planning Practice Guidance (PPG) recommends an approach on determining the impact of sounds as follows:
“How to determine the noise impact? Local planning authorities’ plan-making and decision taking should take account of the acoustic environment and in doing so consider:
whether or not a significant adverse effect is occurring or likely to occur; whether or not an adverse effect is occurring or likely to occur; and whether or not a good standard of amenity can be achieved.
In line with the Explanatory Note of the Noise Policy Statement for England, this would include identifying whether the overall effect of the noise exposure (including the impact during the construction phase wherever applicable) is, or would be, above or below the significant observed adverse effect level and the lowest observed adverse effect level for the given situation. As noise is a complex technical issue, it may be appropriate to seek experienced specialist assistance when applying this policy.”
The PPG also stipulates the appropriate actions in accordance with the likely response to noise exposure:
Perception Examples of Outcomes Increasing effect
level
Action
Not Noticeable
No effect No observed Effect No specific measures
Noticeable and not intrusive
Noise can be heard but does not cause any change in behaviour or attitude. Can slightly affect the acoustic character of the area but not such that there is a
perceived change in the quality of life.
No observed Adverse effect
No specific measures
Lowest Observed
Adverse Effect Level
Noticeable
and Intrusive
Noise can be heard and causes small changes in
behaviour and/or attitude, e.g. turning up volume of television; speaking more loudly; where there is no alternative ventilation, having to close windows for
some of the time because of the noise. Potential for some reported sleep disturbance. Affects the acoustic character of the area such that there is a perceived
change in the quality of life.
Observed Adverse
Effect
Mitigate and reduce to
a minimum
Significant Observed Adverse Effect Level
Noticeable and
disruptive
The noise causes a material change in behaviour and/or attitude, e.g. avoiding certain activities during periods of
intrusion; where there is no alternative ventilation,
Significant Observed Adverse Effect
Avoid

Enablelink Limited George Henry Road, Great Bridge, Tipton, DY4 7BS
Acoustic Impact Assessment
2 1 4 / E n a b l e l i n k P a g e | 8
having to keep windows closed most of the time
because of the noise. Potential for sleep disturbance resulting in difficulty in getting to sleep, premature awakening and difficulty in getting back to sleep. Quality
of life diminished due to change in acoustic character of the area.
Noticeable
and very disruptive
Extensive and regular changes in behaviour and/or an
inability to mitigate effect of noise leading to psychological stress or physiological effects, e.g. regular sleep deprivation/awakening; loss of appetite,
significant, medically definable harm, e.g. auditory and non-auditory
Unacceptable
Adverse Effect
Prevent
Source: http://planningguidance.planningportal.gov.uk/blog/guidance/noise/noise-guidance/ The applicability of the above needs to reference the existing acoustic environment, that, for the purposes of the application site, needs to reflect the existing land use as a large foundry operation, and reflect the existing character of the area.
2.6.1 Land Use and Noise Impact
The determination of adverse impacts (nuisance) is based on the interference with the rights of individuals to use land, this is relevant for the current application as the impact assessment needs to consider the baseline character of the area that impact on the use of land. Case law provides some insight into the relevance of character of an area in respect of noise. In Coventry and others (Respondents) v Lawrence and another (Appellants) 2014 [UKSC 46] a number of key issues associated with the use of land were determined, of which prescriptive rights, and character of the area are key considerations when determining noise impact within large parts of the Black Country as an urban industrialised area.
2.6.1.1 Prescriptive rights
In order to establish a right by prescription, a person must show at least 20 years uninterrupted enjoyment as of right. The right must not be established by force, nor stealth, nor with the licence of the owner. These principles appear to extend to an easement of noise, Lord Neuberger commented:
“I conclude that, in the light of the relevant principles, practical considerations and judicial dicta, it is possible to obtain by prescription a right to commit what would otherwise be a nuisance by noise, or, to put it another way, to transmit sound waves over neighbouring land.” [Para 41]
Activities seeking prescriptive rights as a land use would need to show a continuous period of 20 years and therefore they could be said to have acquired a right through prescription. Clearly foundry operations and before that quarrying operations on the site have been carried out for many more than 20 years. It is key therefore that an established use of over 20 years may allow noise to exist, despite it causing a nuisance. In essence it is a ‘tolerable’ nuisance. That said, any noise emissions would need to be minimised and meet the basic requirement of BAT in respect of activities subject to Environmental Permitting. The former foundry operation has been operated for over 100 years. This principle may apply.
2.6.1.2 Character of the area
Consideration of what should be included in an assessment of the character of the locality, for the purpose of assessing whether activities constitute an adverse impact (nuisance) is another key aspect of determining the impact of noise.
Lord Neuberger found that it is open to defendant to rely on his activities as constituting part of the character of the locality, but only:

Enablelink Limited George Henry Road, Great Bridge, Tipton, DY4 7BS
Acoustic Impact Assessment
2 1 4 / E n a b l e l i n k P a g e | 9
“…to the extent that the defendant’s activities constitute a nuisance, it seems wrong that he should be able to have them taken account when assessing the character of the locality: he would be relying on his own wrong against the claimant.” [Para 73]
The effect of this is to notionally accept that the ambient level of noise in a locality, including any activities that may be noticeable or prominent, may be taken into account as being acceptable providing they are not a nuisance to the complainant in assessing the character of the locality. The assessment includes a consideration of all activities which do not give rise to an actionable nuisance or are otherwise unlawful. The former foundry use is not known to have been the subject of noise complaint, in respect of operations. The foundry carried out external metal and waste handling during its operation, and these activities are no different from those proposed by the applicant. Notwithstanding paragraph 2.6 and its effect on the interpretation, noise impact and the level of effect is normally determined by compliance with appropriate standards.
2.7 Standards Standards for determination of impact are normally based on absolute fixed levels or derived values based on comparisons. They are normally divided into standards set externally to sensitive developments or internally for particular rooms/activities. The particular standard(s) to be applied depends on the character of the noise to be assessed, the sensitives of the receptors and the intended use/design of the development.
2.7.1 External Standards
In order to determine the appropriate level of impact, the most appropriate metric for determination of that impact is required. The BS4142:2014 Method for rating and assessing industrial and commercial sound, provides a mechanism for evaluating the impact of a specified sound. The method requires that the level of the sound is averaged over set time periods and then corrections are applied in line with the prescribed acoustic features of the sound under evaluation. The resulting level is then compared against the background LA90 sound level for the area. The assessment level is then reviewed against the criteria specified within the standard to help determine impact. BS4142:2014 requires that any results are evaluated and placed into context so that the impact is properly characterised. A result of +10dB or more would indicate significant acoustic impact; A result of +5 or more would indicate the potential for an adverse impact. Both the above results provide an indication of impact that must be placed into context. Context is normally added by comparison of the absolute measured levels against other standards, e.g. WHO, and by subjectively assessing the potential impact and evaluating the result in light of existing ambient noise levels. Clearly the pre-existing character of the area is relevant to such assessments. It is normal for BS4142:2014 results to be used as indicators of required mitigation. Where mitigation cannot be carried out, it would be normal to demonstrate that noise exposure has been reduced to a minimum in line with best practice. The BS4142 standard may not be wholly applicable in this case. BS4142 relies on a screening method that assesses the difference between the subjectively adjusted sound source and the background level without that source being present. In the current COVID climate and because the former foundry operations ceased in 2020, typical background sound levels cannot be determined, hence the

Enablelink Limited George Henry Road, Great Bridge, Tipton, DY4 7BS
Acoustic Impact Assessment
2 1 4 / E n a b l e l i n k P a g e | 10
assessments carried out under BS4142 will be subject to high levels of uncertainty. A BS4142 assessment has been conducted, but the result is less certain than comparison to fixed standards. BS8233:2014 Guidance on sound insulation and noise reduction for buildings, also provides guidance on external noise levels, in particular for amenity areas such as gardens. External noise levels for most development are suggested to not exceed 50dB LAeq,T , and noisier urban environments should not exceed the guideline value of 55 dB LAeq,T. The World Health Organisation (WHO) Guidelines on Community Noise is a document which specifies a number of absolute sound levels which seek to prevent health impacts, including the avoidance of noise and disturbance. The key external noise level standards quoted in the document are:
Specific environment
Critical health effect(s) LAeq [dB] Time base [hours]
LAMax, fast [dB]
Outdoor living area
Serious annoyance, daytime and evening Moderate annoyance, daytime and evening
55
50
16
16
- -
Outside bedrooms
Sleep disturbance, window open (outdoor values)
45 8 60
Both BS8233:2014 and the WHO criteria for daytime operation are directly relevant to this installation and application.
2.7.2 Internal Standards
In addition to the above values, BS8233:2014 gives guidance for noise levels inside habitable rooms based on their sensitivity. Table 1 Indoor ambient noise levels for dwellings lists the acceptable sound levels inside properties:
Activity Location
07:00 to 23:00 hours
23:00 to 07:00
Resting Living Room 35 dBA LAeq,16hour
Dining Room Dining Room/Area 40 dBA LAeq,16hour
Sleeping (daytime resting)
Bedroom 35 dBA LAeq,16hour 30 dBA LAeq,8hour
BS8233:2014 offers additional guidance in the form of notes appended to the above table. In particular: NOTE 5: If relying on closed windows to meet the guide values, there needs to be an appropriate alternative ventilation that does not compromise the façade insulation or the resulting noise level. NOTE 7: Where development is considered necessary or desirable, despite external noise levels above WHO guidelines, the internal target levels may be relaxed by up to 5 dB and reasonable internal conditions still achieved.
The standard for long term LAEQ is consistent with the WHO guidelines on Community Noise standards.
Specific environment
Critical health effect(s) LAeq [dB] Time base [hours]
LAMax, fast [dB]
Dwelling, indoors Inside bedrooms
Speech intelligibility and moderate annoyance, daytime and evening Sleep disturbance, night-time
35
30
16
8
45
These standards are directly relevant to the proposed site as not to exceed target levels for daytime operation. As the installation is not proposing to work outside the hour 07.30am – 5.30pm, the night time noise standards do not apply.

Enablelink Limited George Henry Road, Great Bridge, Tipton, DY4 7BS
Acoustic Impact Assessment
2 1 4 / E n a b l e l i n k P a g e | 11
3 Assessment Strategy
3.1 Methodology As agreed with the SMBC EHO, prediction of impact is based on:
(i) Comparison of predicted incident noise levels with pre-existing standards and guideline levels stated in BS8233:2014, and WHO guidelines for daytime noise.
(ii) Comparison of predicted incident noise levels with pre-existing background sound levels (see paragraph 3.1.1 below) and use of BS4142:2014 + A1(2019)
(iii) Consideration of context of the incident noise at sensitive receptors. As noted in Horizontal Guidance for Noise Part 2 – Noise Assessment and Control (H3), paragraph 2.3.3 lists standards that may be relevant for prediction of impact, those relevant to this assessment are reproduced below:
The British Standards that may be relevant to measurement of noise from industrial activities include: o BS 4142:1997 Method for rating industrial noise affecting mixed residential and industrial areas o (Reference 4) o BS 7445:1991 Description and measurement of environmental noise Parts 1-3 (Reference 2) o BS 8233:1999 Sound insulation and noise reduction for buildings – Code of Practice (Reference o 10). Other documents, that may be useful are: o ISO 9613-2 1996 Attenuation of sound during propagation outdoors (Reference 6) o World Health Organisation Guidelines for Community Noise (1999) (Reference 14)
The two requirements are therefore very similar, both require comparison of incident noise levels expected from the proposed installation to fixed long term average noise level standards (BS8233:2014 and WHO Guidelines), and both advise of a BS4142 approach. A summary of the data sources for both background and residual is included below.
3.1.1 Background and residual data
Background and residual monitoring has not been conducted due to prevailing COVID-19 conditions preventing representative monitoring, it is also noted that the existing sound level in the area does not reflect the pre-existing background with foundry operations occurring. A comparison of proposed development against the existing background data is therefore likely to be limited in scope and subject to high levels of uncertainty. The SMBC EHO identified two acoustic reports for the nearby area, that may be helpful in establishing background and ambient noise levels for BS4142 assessment purposes. The two reports are identified below:
Ian Sharland Limited Ref: 4714 Installation of Battery Storage at Ocker Hill – approximately 400m Northeast of the application site) November 2020 (data obtained February 2020) The report provided 3 days of continuous measurement within the local area and included other industrial activities not connected with the former foundry. The data presented in that report is reproduced as Fig.4.1.1 below.
MLM Consulting Limited report Ref 500098/JF/R7, Eagle Recovery Transfer Hub – approximately 200m north of the application site) January 2011. The noise impact assessment for a waste recycling activity provided limited monitoring data for receptor locations on Bagnall Street that appears to be corroborated by the more recent Sharland report.
The data obtained from those reports is used as a baseline to compare against the level of noise predicted to be produced by the development. The prediction method is outlined below.
Enablelink Limited George Henry Road, Great Bridge, Tipton, DY4 7BS
Acoustic Impact Assessment
2 1 4 / E n a b l e l i n k P a g e | 12
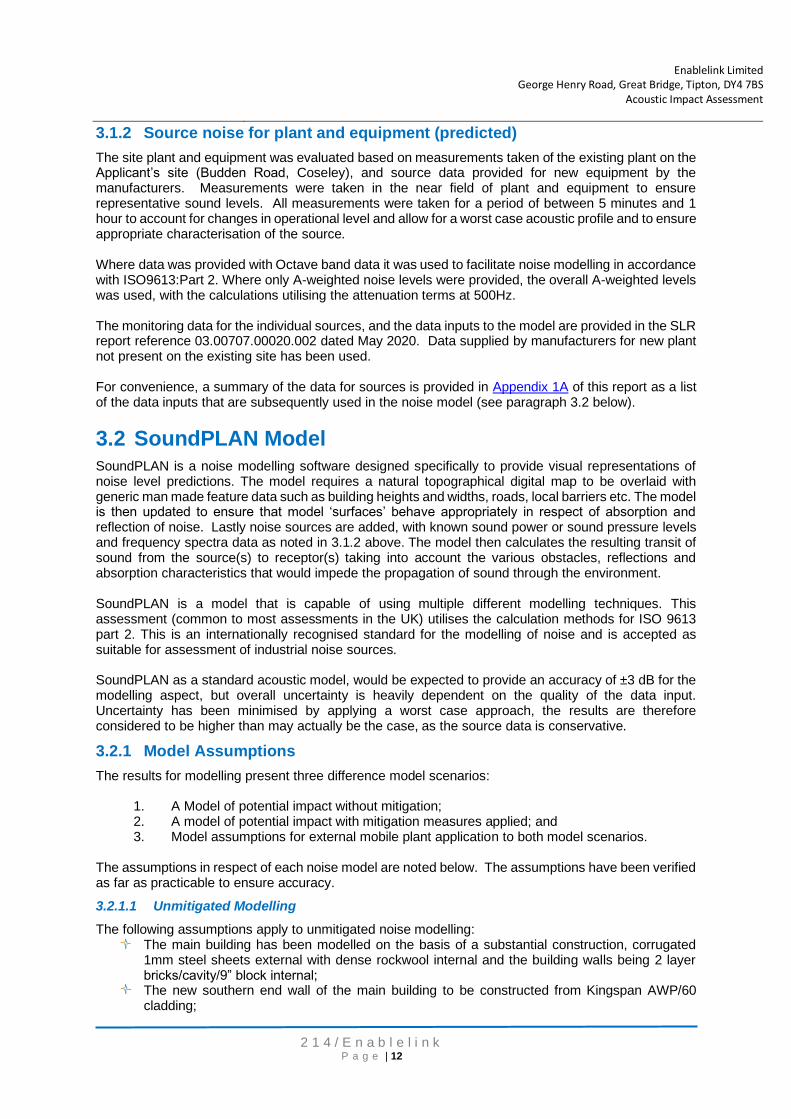
3.1.2 Source noise for plant and equipment (predicted)
The site plant and equipment was evaluated based on measurements taken of the existing plant on the Applicant’s site (Budden Road, Coseley), and source data provided for new equipment by the manufacturers. Measurements were taken in the near field of plant and equipment to ensure representative sound levels. All measurements were taken for a period of between 5 minutes and 1 hour to account for changes in operational level and allow for a worst case acoustic profile and to ensure appropriate characterisation of the source. Where data was provided with Octave band data it was used to facilitate noise modelling in accordance with ISO9613:Part 2. Where only A-weighted noise levels were provided, the overall A-weighted levels was used, with the calculations utilising the attenuation terms at 500Hz. The monitoring data for the individual sources, and the data inputs to the model are provided in the SLR report reference 03.00707.00020.002 dated May 2020. Data supplied by manufacturers for new plant not present on the existing site has been used. For convenience, a summary of the data for sources is provided in Appendix 1A of this report as a list of the data inputs that are subsequently used in the noise model (see paragraph 3.2 below).
3.2 SoundPLAN Model SoundPLAN is a noise modelling software designed specifically to provide visual representations of noise level predictions. The model requires a natural topographical digital map to be overlaid with generic man made feature data such as building heights and widths, roads, local barriers etc. The model is then updated to ensure that model ‘surfaces’ behave appropriately in respect of absorption and reflection of noise. Lastly noise sources are added, with known sound power or sound pressure levels and frequency spectra data as noted in 3.1.2 above. The model then calculates the resulting transit of sound from the source(s) to receptor(s) taking into account the various obstacles, reflections and absorption characteristics that would impede the propagation of sound through the environment. SoundPLAN is a model that is capable of using multiple different modelling techniques. This assessment (common to most assessments in the UK) utilises the calculation methods for ISO 9613 part 2. This is an internationally recognised standard for the modelling of noise and is accepted as suitable for assessment of industrial noise sources. SoundPLAN as a standard acoustic model, would be expected to provide an accuracy of ±3 dB for the modelling aspect, but overall uncertainty is heavily dependent on the quality of the data input. Uncertainty has been minimised by applying a worst case approach, the results are therefore considered to be higher than may actually be the case, as the source data is conservative.
3.2.1 Model Assumptions
The results for modelling present three difference model scenarios:
1. A Model of potential impact without mitigation; 2. A model of potential impact with mitigation measures applied; and 3. Model assumptions for external mobile plant application to both model scenarios.
The assumptions in respect of each noise model are noted below. The assumptions have been verified as far as practicable to ensure accuracy.
3.2.1.1 Unmitigated Modelling
The following assumptions apply to unmitigated noise modelling: The main building has been modelled on the basis of a substantial construction, corrugated
1mm steel sheets external with dense rockwool internal and the building walls being 2 layer bricks/cavity/9” block internal;
The new southern end wall of the main building to be constructed from Kingspan AWP/60 cladding;

Enablelink Limited George Henry Road, Great Bridge, Tipton, DY4 7BS
Acoustic Impact Assessment
2 1 4 / E n a b l e l i n k P a g e | 13
The new non ferrous building to be constructed from Kingspan AWP/60 cladding; Openings for conveyors and end walls to be left open, with no attenuation for these elements
assumed; External plant as assumed on the drawings supplied; Noise from HGV movements excluded, as no information provided and will be insignificant
compared to main operational noise; All plant operational for peak hours; Plant operational 80% between 07:30 – 17:30 hours for 16 hour calculations; No boundary mitigation; No mitigation for northern shear; Push walls as shown on drawing supplied for main input area, assumed 8m high; Source data for plant as provided by client; Octave band noise levels modelled where information available, for other sources overall A-
weighted level assumed. The unmitigated noise model is used to show the potential impact of the proposed activities based on use of the site without additional consideration of noise mitigation. It represents the baseline from which mitigation measures can be measured in terms of effectiveness and against which BAT can be evaluated.
3.2.1.2 Mitigated Modelling
The following assumptions were made for the rerun of the model based on the identified mitigation measures:
The main building has been modelled on the basis of a substantial construction, corrugated 1mm steel sheets external with dense rockwool internal and the building walls being 2 layer bricks/cavity/9” block internal;
The new southern end wall of the main building to be constructed from EuroClad Elite 51.3 cladding;
The new non ferrous building to be constructed from EuroClad Elite 51.3 cladding; Openings for conveyors and end walls to be covered, with a single figure 20dB(A) reduction in
noise levels assumed for breakout for these areas; External plant as assumed on the drawings supplied; Noise from HGV movements excluded, as no information provided and will be insignificant
compared to main operational noise; All plant operational for peak hours; Plant operational 80% between 07:30 – 17:30 hours for 16 hour calculations; Assumed 10 metre high retaining wall along site boundary (top height 140m AOD), with a
maintenance strip and noise barrier constructed on existing site boundary 4m high (top 144m AOD);
An 8 metre high push wall constructed along eastern side of northern shear; Push walls as shown on drawing supplied for main input area and shear, assumed 8m high; Source data for plant as provided by client; Octave band noise levels modelled where information available, for other sources overall A-
weighted level assumed. The mitigated noise model is used to show the benefits obtained from the proposed mitigation measures comparative to the unmitigated model. It is intended that it represents the effectiveness of those measures and BAT can be evaluated.
3.2.1.3 External Plant Assumed for Both Models
4 x Liebherr Cranes at the positions indicated on the plan; 1 x Liebherr 546 shovel working by the main shred stock pile; 1 x Shear; 1 x Pre-shredder.

Enablelink Limited George Henry Road, Great Bridge, Tipton, DY4 7BS
Acoustic Impact Assessment
2 1 4 / E n a b l e l i n k P a g e | 14
3.3 Limitations & Uncertainty Impact assessments have been prepared in accordance with source data obtained for ‘as installed’ plant and equipment at the existing Enablelink, Budden Road site, and drawn from manufacturer data for new plant. The calculations using SoundPLAN conform to ISO9613 that has an uncertainty reported as ±3dB uncertainty. ISO9613 assumes a downwind model output that will tend to over estimate actual noise transmission from source to receptor locations. The calculated levels are therefore based on worst case data. Estimates assume the continuous operation of all plant except where specifically noted, in reality some plant will idle or not operate. The ‘Uncertainty Budget’ has been derived using the methodology detailed in ‘Uncertainties in Noise Measurement’ produced by Kerry and Craven (Craven, N. J., Kerry, G. 2007. ‘Uncertainties in Noise Measurement’. University of Salford). This document requires an uncertainty budget to be calculated based on the following approach:
1. Define the half value (for example; 3 for ± 3 dB) of each source of uncertainty, 2. Apply a correction for the standard uncertainty for a rectangular distribution ( x / √3) for each
source of uncertainty, 3. Add together the values found in 2 for all uncertainties, 4. Take the square root to find the combined uncertainty’, 5. Multiply by 2 to calculate the expanded uncertainty to 95% confidence.
The paper advises that for a single sound level meter the uncertainty budget would be “like the ±0.7 dB tolerance of a type 1 sound level meter”. It also advises that “measuring under downwind conditions usually produce worst-case conditions at distance of several hundred metres”, therefore the ± 3 dB uncertainty advised in ISO 9613-2 has been used due to the short distances between measurement location and source. These calculations are repeated for each of the model parameters for the uncertainty budget:
Parameter Accuracy variance Comments
Measurement Uncertainty
Measurement of source. Instrumentation accuracy
±1dB 1/√3 = 0.57dB Minimised by use of calibrated traceable instrumentation
Use of windscreen ±0.19dB 0.2/√3 = 0.116dB Prevents local wind effects, all meters collecting data used wind screens
Measurement of sources Distance from source (estimate)
±0.5m (Worst case 50cm error over 10m)
20*log(9.5/10) = -0.45 20*log(10.5/10) = +0.42 Difference is 0.87dB 0.87//√3 = 0.6dB
Minimised by use of laser measurement devices
Background level uncertainty
±3 dB 3//√3 = 5.196 dB A background level of uncertainty may exist, assumed to be ±3 dB
Measurement uncertainty
Total variance = 1.3 or 6.5
√1.3 = 0.8 dB √6.5= 2.5 dB
The uncertainty in background due to measurement location alone
Modelling Uncertainty
Measurements sources to receptors (estimate)
±3m (closest receptor 65m)
20*log(62/65) = -0.41 20*log(68/65) = 0.39 Difference is 0.8dB 0.8//√3 = 0.55dB
Minimised by use of model based on accuracy of maps
Ground absorption Ground absorption effects are not calculated as the source and receptor are subject to significant height differential and barrier effects are dominant. Ground absorption is expected to be zero.

Enablelink Limited George Henry Road, Great Bridge, Tipton, DY4 7BS
Acoustic Impact Assessment
2 1 4 / E n a b l e l i n k P a g e | 15
Air absorption/ temperature
Temperature range considered -5oC to +20oC
Results for 9oC = 0.003639dB/m Results for -5oC = 0.006381dB/m Results for 20oC = 0.004978dB/m Variance is 0.002704dB/m Over 65m this is 0.18dB 0.18/√3 = 0.12dB
http://resource.npl.co.uk/acoustics/techguides/absorption/ used reference Assume 101.3kPa, variable temperature (worst absorption temperature for air) 70% relative humidity, no precipitation
Modelling Uncertainty
Worst case considered to be ±3dB
3/√3 = 1.73dB Stated model uncertainty due as paragraph 9 of ISO9613, Table 5
Modelling uncertainty
Total variance = 2.4
√2.4 = 1.5dB
TOTAL Total of uncertainty variance is 3.7 dB without background uncertainty 8.9dB with
√3.7dB = 1.9dB √8.9dB = 3dB
Total variance. NB: this figure has been incorporated into the model results to reflect a ‘typical’ worst case
Total uncertainty ±3.8 dB without background ±6dB with background
95% confidence for all uncertainties.
Results obtained from modelling can be up to 4 dB better or worse than predicted assuming the remote background data taken in 2020 before the first lockdown is representative, if the enhanced uncertainty assumes potential daytime level are ±100% of the value quoted (i.e. significant variation), then the uncertainty expands to 6 dB for the full assessment. The calculated levels produced by the model are shown to have low potential for uncertainty provided the assumptions made are correctly applied. However the predicted results are based on conservative estimates and worst case scenarios and it would be expected that the results presented are higher than the likely actual levels and therefore the predictions are considered worst case making it more likely that the actual observed values will be lower than expected.
3.4 Noise Mitigation Measures The modelled outputs for the site take into account topography and building effects. The model has been updated with the mitigation measures specified in paragraph 3.2.1.2 above. The mitigation measures are noted as follows but more detailed information on noise control and noise mitigation measures is provided in the Noise Management Plan. The detail below summarises the physical site controls and noise mitigation for the external areas as follows:
3.4.1 Building Construction
All process plant that can be enclosed has been installed within the acoustically treated main foundry building. That building fabric is a very substantial construction, corrugated 1mm steel sheets external with dense rockwool internal roof construction (Fig.3.4.1.1) and the building walls comprising 2 layer bricks/cavity/9” with block wall internals (Fig.3.4.1.2).

Enablelink Limited George Henry Road, Great Bridge, Tipton, DY4 7BS
Acoustic Impact Assessment
2 1 4 / E n a b l e l i n k P a g e | 16
Fig.3.4.1.1 roof construction Fig.3.4.1.2 wall construction
New construction or construction required to enclose buildings will feature the use of EuroClad Elite 51.3. All openings in buildings that allow conveyor access will be screened with high density polyurethane rubber strips. The technical specification for Euroclad 51.3 is provided in Appendix 3. The effects of the mitigation measures are shown in the source data table presented in Appendix 1A below. The location and specification of the mitigation measures are shown in the plans in Appendix 1B.
3.4.2 External Area
The mitigation measures for the site depend on the specific location of plant. All external plant has been selected to be suitable for the intended use. All externally operated plant is subject to routine maintenance, with any faults being repaired as soon as practicable. All operators are trained to use the plant and subject to general noise awareness training. The main additional control measures are the installation of local and perimeter acoustic barriers. The main barrier separating the site from the nearest sensitive receptor location is a large 10m barrier that runs alongside the existing landform (Fig.3.4.2.1). The barrier construction will be similar to that shown in Fig.3.4.2.2 but will probably be partly a retaining structure and partly a constructed barrier or a similar design to that shown below. The technical specifications for the barriers are provided in Appendix 3. The engineered construction for the 10m barrier will be submitted separately once the detailed structural data is available.

Enablelink Limited George Henry Road, Great Bridge, Tipton, DY4 7BS
Acoustic Impact Assessment
2 1 4 / E n a b l e l i n k P a g e | 17
Fig.3.4.2.1 Ridge line Fig.3.4.2.2 Ridge in context
Fig.3.4.2.3 Example Barrier (height 10m)
In addition, a further 4m high barrier (using the same barrier construction noted above), will be erected at the top of the ridge, and be visually of similar to the image shown in Fig.3.4.2.3 above.
3.5 Acoustic Mitigation The efficacy of the proposed mitigation measures, (barriers and building treatments identified in paragraph 3.4 above), are assessed by comparing the modelled incident noise levels at the receptor locations for mitigated and unmitigated noise respectively. The calculated improvement in mitigated levels is then provided as part of the results summary table in paragraph 4.1 below, the detailed modelling data is provided in Appendix 2. The efficacy of the mitigation measures is indicative of BAT and helps to demonstrate compliance subject to the installation of the identified measures. Clearly, any additional management controls or operational controls would further reduce predicted incident noise levels and these are considered in the Noise Management Plan (NMP) submitted as a separate document. The specific details of barriers are to be provided once a structural survey has been completed as there is likely to be a retaining wall element to the design.

Enablelink Limited George Henry Road, Great Bridge, Tipton, DY4 7BS
Acoustic Impact Assessment
2 1 4 / E n a b l e l i n k P a g e | 18
4 Results
The modelling results for the key plant noted below are summaries of the full datasets to be found in Appendix 1 and Appendix 2. The results are divided into (i) determination of pre-existing background and residual sound levels, (ii) modelled predictions for operational noise, (iii) a summary of the effectiveness of control measures, and (iv) a BS4142:2014 assessment. These are provided below.
4.1 Background and Residual sound levels As agreed with Sandwell Environmental Health and in line with current IOA/ANC guidelines to minimise uncertainty, acoustic reports submitted prior to the onset of lockdown restrictions have been used to estimate potential residual and background levels, however, it should be noted that there may be potential for increased uncertainty due location differences. Monitoring to determine current background levels will not be indicative of pre-existing background and ambient data due to COVID-19 and the lack of the foundry activities at the application site. The Background LA90 levels for daytime have been identified from the MLM UK report (2011) and the Ian Sharland report (2020) the monitoring locations for which are shown in the plan Fig.4.1 below. The data from those reports has been identified in Fig.4.1a and Fig.4.1b below. The monitoring points for those reports are considered representative for the area. Fig.4.1 Background Monitoring locations
Imagery ©2021 Google, Imagery ©2021 Bluesky, Getmapping plc, Infoterra Ltd & Bluesky, Maxar Technologies, The GeoInformation Group, Map data ©2021
MLM report (2011)
Sharland Report (2020)

Enablelink Limited George Henry Road, Great Bridge, Tipton, DY4 7BS
Acoustic Impact Assessment
2 1 4 / E n a b l e l i n k P a g e | 19
Fig.4.1a Extract from Sharland Report, Measured levels at Warwick Close
Note: The highlighted area has been added to the graph data and indicates 7.30am – 5.30pm intended operational hours for the application site. The measured data clearly shows average LAeq measured levels around 65 dB, and measured LA90 levels varying between 47 dB and 60 dB LA90. For assessment purposes the typical background sound level for the area has been assumed to be the lowest value recorded (47 dB LA901hour). Fig.4.1b Extract from MLM Report, Measured levels at Warwick Close
The monitoring data for this report is considered too brief to provide verifiable data, and has not been used within calculations, however the data is reasonably consistent with that in the Sharland report (2020).
4.1.1 Commentary on area Background level
The background level established in Fig. 4.1a and 4.1b above show the results for two different nearby areas. The assumed background level summarised in Table 4.1.1 below is an estimate based principally on the measurements taken in the Sharland report (as the lowest and therefore worst case level). The measurement location in that report is in a similar position to that of the closest receptors to the proposed application site, but road traffic noise is much closer to the measurement position. It is likely that the measurement location in the Sharland report is therefore more significantly affected by road traffic than Wolseley Road receptors, however, the underlying sound level will be similar as the statistical measure of the 90th percentile of noise in the area will include all the major noise sources in the area, including the distant road traffic and continuous industrial sources. It is therefore reasonable to utilise the lowest measured LA90 as typical of the area, but it may not be appropriate to use the measured average residual level as this will not be representatives of a location

Enablelink Limited George Henry Road, Great Bridge, Tipton, DY4 7BS
Acoustic Impact Assessment
2 1 4 / E n a b l e l i n k P a g e | 20
more distant from road traffic. No correction for residual noise is therefore applied in the BS4142 assessment below to preserve a worst case scenario. It is therefore concluded that the lowest background LA90 level for the area is a reasonable assumption and will be used for BS4142 assessment purposes. Table 4.1.1 Assumed Background level
Receptor Lowest Daytime Background LA90,1hour (dB)*
Typical Daytime Residual LAEQ,1hour (dB)*
Residential receptors Wolseley Road/Isaac Walton Place
47 65
*Data derived from fig.4.1a above. LAEQ measured level not used in calculations
4.2 Modelled Operational Noise (daytime) Operational noise levels have been modelled for daytime operations. A noise model plan has been produced using the data for the operational plant (see Appendix 1A) and the plans showing the location of the sources shown in Appendix 1B. The plant operates only during the day with proposed operational times of 07.30hrs – 17.30 Monday – Friday, 07.30hrs – 14.00hrs Saturdays and no time on Sundays or Bank Holidays. The modelled data provides details of three modelled scenarios:
• The maximum level (generated by all operating plant used simultaneously) and used to assume continuous worst case operation for 1 hour as part of the BS4142:2014 assessments.
• A typical level (generated by correcting data for typical estimated ‘on time’ of plant and equipment), used to help demonstrate likely range of BS4142:2014 assessments.
• WHO 16hour Lday which includes a reduction in predicted average to align with the required WHO daytime parameter.
• A determination of pre- and post- mitigation measures to demonstrate effectiveness of controls. Model outputs have been presented for:
1. Total installation noise impacts without additional mitigation measures (existing unmodified building, and existing topography effects).
2. Total installation noise impact with additional mitigation measures a. Internal plant operational contribution b. External Plant operational contribution.
The model results are shown in detail in Appendix 2, but data from the predicted sound levels for typical levels are summarised in paragraphs 4.2.1 below.
4.2.1 Summary Data (All operational plant)
Based on the model outputs as noted above, Table 4.2.1 summarises compliance with the identified standards. The modelled outputs clearly note that the impact of the site activities complies with WHO guideline values averaged over a day. The maximum 1 hour levels determined are used to predict short duration impacts using the BS4142 assessment method. Compliance with the WHO guideline levels indicates that the predicted noise levels will, at worst, create a moderate impact on residential receptors. Given that the activities are limited to day time and finish at 5.30pm it is unlikely that the impact will be worse than the previous 24 hour foundry use.

Enablelink Limited George Henry Road, Great Bridge, Tipton, DY4 7BS
Acoustic Impact Assessment
2 1 4 / E n a b l e l i n k P a g e | 21
Table 4.2.1 LAEQ and plant contribution data (mitigated)
Receptor Predicted levels Standards
Maximum LAeq,1hour
LAeq,16hour
(Lday) WHO Guidelines
(external) daytime BS8233:2014 (internal)
daytime
Lday 55 dB Lday 50 dB 35 dB ‘Good’ 40 dB ‘reasonable’
5 Isaac Walton Place 55 52 +2 dB +2 dB 141 Wolseley Road 55 51 +1 dB +1 dB 135 Wolseley Road 54 51 +1 dB +1 dB 125 Wolseley Road 54 51 +1 dB +1 dB 111 Wolseley Road 52 49
*15 dB reduction due to open window (based on WHO guidance) The above data, in conjunction with that presented in paragraph 4.1 above, has been used to predict impact using the BS4142 assessment below.
4.3 BS4142 Assessment The following assessment has been produced based on the data summarised in paragraphs 4.1 and 4.2 above. BS4142:2014 requires that the specific noise source is acoustically assessed for character as part of the procedure. The character is always assessed at the receptor location. The degree of perception of a sound is based on its overall loudness, frequency, duration, and distinctive features. Determining the character of the specific noise, where the assessment relies on prediction alone is difficult. However, a subjective assessment carried out at the existing Enablelink site on Budden Road, provides an indication of the character and distinctive features of the existing noise sources, in particular, the operation of shears, movement of metal, and the operation of the Leibherr cranes. The new fragmentising equipment (due to be installed inside the building at the proposed location), if perceptible, is likely to be perceived a soft rumble. The data presented below shows the potential impacts with unmitigated (no additiional barriers/controls) and mitigated results for the assessment. Note that the acoustic feature correction for no mitigation changes to clearly perceptible crashes and bangs, and clearly perceptible external plant operation. Table 4.4 BS4142 assessment (worst case)
Results Sound Level (dB)
Relevant BS4142 Clause
Comments
Modelled Specific Level (maximum)
(71)55 7.3.2 Assumes all plant is operational.
Residual Level - Not considered, representative residual levels not available. No corrections applicable.
Acoustic feature correction
(+10)+5 9.2 Estimation of impact for no mitigation is consider +6 dB, clearly audible crashes and bangs, and +4 dB clearly audible engine noise. Based on estimations of impact, observed noise is likely to be slightly audible impulsive noise +3 dB impulse correction (crashing of metal on metal), and possible tonal noise from operation

Enablelink Limited George Henry Road, Great Bridge, Tipton, DY4 7BS
Acoustic Impact Assessment
2 1 4 / E n a b l e l i n k P a g e | 22
of external plant, +2 dB tonal correction. High residual noise levels may mask daytime operation.
Rating level (81)60 9.2 Background sound level 47 8.1.1
8.1.3 8.3
The background level has been determined from other specified reports using measured data from the local area using the lowest measured level.
Excess of rating over background sound level
(+34)+13 11 Significant Adverse impact
Assessment (context) The site is a former foundry that operated 24 hours a day. The context of this assessment is therefore key to understanding the potential impact. The unmitigated level of noise from the installation of internal plant and operation of the external plant is predicted to create a maximum incident noise level of 71 dB at the worst affected receptor location and would clearly be unacceptable. The mitigated level of 55 dB represents a robust mitigation scheme, of additional works on the process building, and installation of barriers. The assessment indicates that metal recycling operations will have the potential to create a significant adverse impact for all operational times based on worst case. However, context is required to determine the nature of that impact. The activities are carried out only during the normal working week 7.30am – 5.30pm. These hours of operation are typical for heavy industry in this area. The former foundry use operated 24/7. The area has a history of heavy industry and the operation of the metal recycling centre is in keeping with this industrial style noise. The reduced hours represents a betterment compared to the former 24 hour use. The incident noise is predicted to be well below the WHO external guideline noise level for long term exposure to noise. It is likely that activities from the site will be audible during the day whilst residents are outside. Dull clangs and bangs, occasional diesel engines noise may be audible outside but only during the normal working day. Data from other nearby surveys shows very high ambient noise levels that may serve to mask those from the proposed installation. On balance, despite the exceedance of the BS4142 screening criteria, the assessment of metal recycling use for the site is considered acceptable. The measures taken to mitigate the noise are considered robust and represent the Best Available Techniques in reducing the impact on local residents.
Enablelink Limited George Henry Road, Great Bridge, Tipton, DY4 7BS
Acoustic Impact Assessment
2 1 4 / E n a b l e l i n k P a g e | 23
5 Conclusions
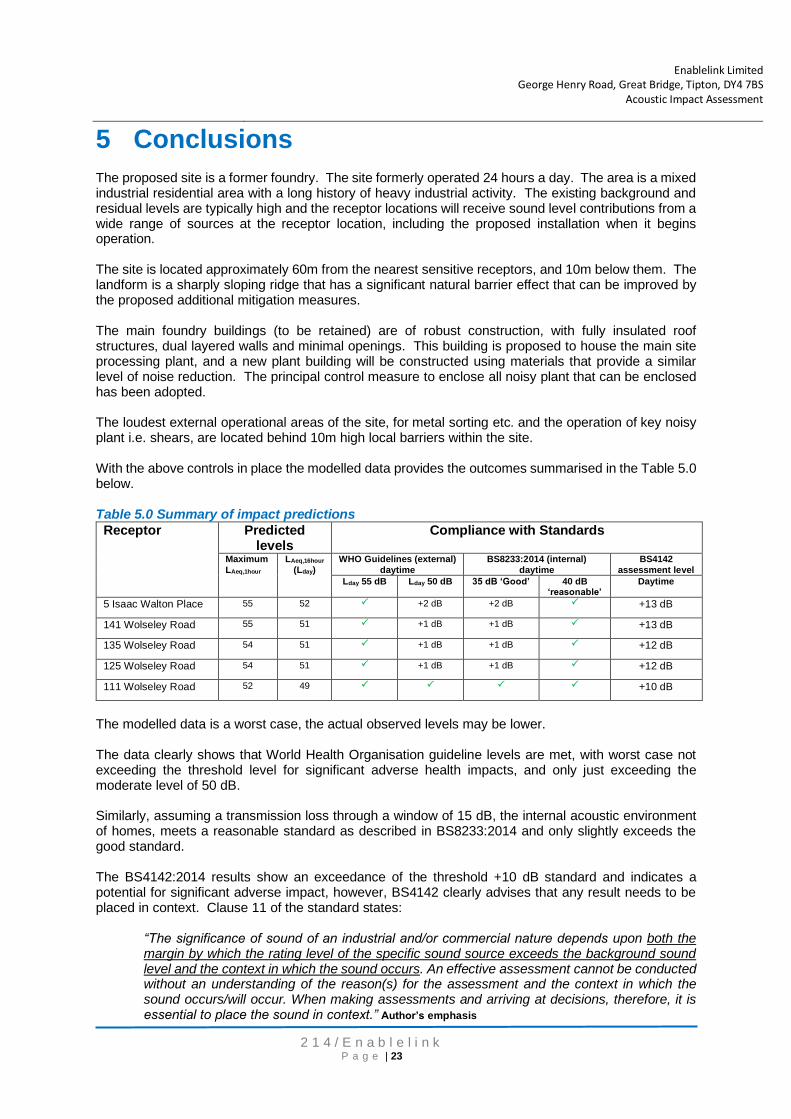
The proposed site is a former foundry. The site formerly operated 24 hours a day. The area is a mixed industrial residential area with a long history of heavy industrial activity. The existing background and residual levels are typically high and the receptor locations will receive sound level contributions from a wide range of sources at the receptor location, including the proposed installation when it begins operation. The site is located approximately 60m from the nearest sensitive receptors, and 10m below them. The landform is a sharply sloping ridge that has a significant natural barrier effect that can be improved by the proposed additional mitigation measures. The main foundry buildings (to be retained) are of robust construction, with fully insulated roof structures, dual layered walls and minimal openings. This building is proposed to house the main site processing plant, and a new plant building will be constructed using materials that provide a similar level of noise reduction. The principal control measure to enclose all noisy plant that can be enclosed has been adopted. The loudest external operational areas of the site, for metal sorting etc. and the operation of key noisy plant i.e. shears, are located behind 10m high local barriers within the site. With the above controls in place the modelled data provides the outcomes summarised in the Table 5.0 below. Table 5.0 Summary of impact predictions
Receptor Predicted levels
Compliance with Standards
Maximum LAeq,1hour
LAeq,16hour
(Lday) WHO Guidelines (external)
daytime BS8233:2014 (internal)
daytime BS4142
assessment level Lday 55 dB Lday 50 dB 35 dB ‘Good’ 40 dB
‘reasonable’ Daytime
5 Isaac Walton Place 55 52 +2 dB +2 dB +13 dB
141 Wolseley Road 55 51 +1 dB +1 dB +13 dB
135 Wolseley Road 54 51 +1 dB +1 dB +12 dB
125 Wolseley Road 54 51 +1 dB +1 dB +12 dB
111 Wolseley Road 52 49 +10 dB
The modelled data is a worst case, the actual observed levels may be lower. The data clearly shows that World Health Organisation guideline levels are met, with worst case not exceeding the threshold level for significant adverse health impacts, and only just exceeding the moderate level of 50 dB. Similarly, assuming a transmission loss through a window of 15 dB, the internal acoustic environment of homes, meets a reasonable standard as described in BS8233:2014 and only slightly exceeds the good standard. The BS4142:2014 results show an exceedance of the threshold +10 dB standard and indicates a potential for significant adverse impact, however, BS4142 clearly advises that any result needs to be placed in context. Clause 11 of the standard states:
“The significance of sound of an industrial and/or commercial nature depends upon both the margin by which the rating level of the specific sound source exceeds the background sound level and the context in which the sound occurs. An effective assessment cannot be conducted without an understanding of the reason(s) for the assessment and the context in which the sound occurs/will occur. When making assessments and arriving at decisions, therefore, it is essential to place the sound in context.” Author’s emphasis

Enablelink Limited George Henry Road, Great Bridge, Tipton, DY4 7BS
Acoustic Impact Assessment
2 1 4 / E n a b l e l i n k P a g e | 24
In the context of a busy industrial area with significant heavy industry and a long history of operating 24 hours a day, the proposed activity is considered to be a betterment of the use of the site (as hours will be reduced to day time operation only), moreover, the long term health related averages have been demonstrated to be compliant. In context, the predicted noise impact is considered acceptable. Noise from the site will be audible outside in garden areas, probably as muffled thumps and occasional clangs. Some distant reversing bleepers may be just noticeable. This would be consistent with pre-existing noise and, in planning terms, the outcome is considered to be ‘noticeable but not intrusive’ overall. The engineering measures identified, in conjunction with noise management of the site are anticipated to reduce the potential impact of noise to compliant levels. The requirement to comply with Best Available Techniques (BAT), provides ongoing guarantee of controls ensuring full compliance. In both cases noise emissions need to be demonstrably reduced to an absolute minimum. A summary of the mitigation measures is provided below.
5.1 Mitigation measures Mitigation measures for the proposed site have been considered and are summarised below. Reduction at source Key plant associated with the activity has been reviewed. The new site represents a significant investment. The shredder/fragmentiser plant necessary for rapid and cost effective processing of material, is the main noise source. The Metso Lindemann Shredding technologies are considered reputable, fit for purpose, process plant. The noise data provided for the shredder is therefore considered to be engineered and noise reduced to an acceptable industry standard. Reduction at source would include routine maintenance of all plant (whether internal or external) to ensure operation in accordance with supplier specifications (see Noise Management Plan). Enclosure All key plant associated with the Shredder/Fragmentiser is enclosed within the main process building. That building is already a heavy duty construction with insulated walls and roof. All additions of modifications to the building will be carried out using proprietary acoustic materials of known sound reduction performance. Any new construction or modifications to walls will use Euroclad 51.3 materials supplemented with ILG absorbent panelling (see Appendix 3), any repairs to the roof will replicate existing construction. As shown in Appendix 1B all operational plant that can be enclosed within the building has been enclosed. The only external plant remaining are conveyors, the pre-shredder (for safety reasons), the shear, and Liebherr cranes. Screening and Barriers Plant operating externally is listed as point sources in the model input data (Appendix 1A). Plant that cannot be enclosed, is operated behind barriers constructed as noted in Appendix 3. The construction of the barriers use materials with a high sound reduction capacity, principally concrete panels approximately 150mm thick. The design and height of the barriers within the site will be identical to those shown in Appendix 3. The design of barriers that enhance the natural barrier effect of the ridge are subject to structural survey and detailed specification. The modelled output assumes only that the barriers are effective and are robust enough to provide the required level of reduction. Absorptive ILG panels (see Appendix 3) will supplement the barrier design to prevent unwanted reflections. It should be noted that installation of the barriers at the site perimeter and enhancing the ridge barrier effect will reduce noise from ALL sources on the industrial estate, lowering the ambient noise level. This will potentially affect the character of noise perception in the area.

Enablelink Limited George Henry Road, Great Bridge, Tipton, DY4 7BS
Acoustic Impact Assessment
2 1 4 / E n a b l e l i n k P a g e | 25
5.2 Efficacy of (engineered) mitigation measures Based on the outputs shown in Appendix 2 for additional mitigated and unmitigated modelled outputs, the effectiveness of the mitigation measures in reducing transmitted sound can be assessed. The mitigated levels are then used to demonstrate compliance in the impact assessments noted below. Table 4.1 Summary Table of additional mitigation performance for key receptors
Receptor Predicted Level Before (dB)
Predicted Level After (dB)
Mitigation performance (dB)
5 Isaac Walton Place 67 55 12
141 Wolseley Road 62 55 7
135 Wolseley Road 70 54 16
125 Wolseley Road 70 54 16
111 Wolseley Road 71 52 19
The above data reflects a worst case with all plant operating continuously. Typical operation of plant is approximately 80% of the time. This results in a reduction of approximately 1 – 2 dB per location (see Typical 1 hour prediction).
5.3 Noise Management Plan Having considered the engineering and solutions to reducing noise impact, the operation of the site will be conducted in accordance with an operational plan. Part of that working plan will be the Noise and Vibration Management Plan (NMP). The NMP document is a live management plan that is updated periodically to reflect changes in operations, improvements in monitoring or control, and provides details on how noise is managed within the installation. Whilst the physical controls ensure that compliance can be achieved, the NMP ensures the noise emissions are minimised. A NMP for the proposed site is submitted as a separate document. The NMP is designed specifically to comply with controls required by site subject to environmental permitting but the requirements likewise will ensure demonstration of compliance with any imposed planning restrictions placed on the decision notice. Based on the above assessment the proposed use of the site for the processing of scrap metal can be carried out in accordance with engineering and management controls in place, and in compliance with relevant noise standards. Noise emissions have been minimised in line with Best Available Techniques, and represent an acceptable level of noise control. Prepared by: Tony Higgins MSc BSc(Hons) PGDip MIOA CMCIEH for Crestwood Environmental Limited

Enablelink Limited George Henry Road, Great Bridge, Tipton, DY4 7BS
Acoustic Impact Assessment
2 1 4 / E n a b l e l i n k P a g e | 26
Glossary of terms
Sound – an acoustic effect perceived by an individual. Sound is perceived differently by individuals
and is highly subjective. Acoustically for sound to be perceived it has to be above the threshold of hearing (typically taken to be 0dB) but this threshold varies between individuals.
Noise – noise is defined as unwanted sound. The level at which noise is present will indicate the
potential impact. In order for a sound to become noise, it has to be perceivable by the individual. Technically noise can be described in terms of its acoustic profile, typically though noise at or below the ambient levels is rarely loud enough to be considered significant.
Acoustic environment sound from all sound sources as modified by the environment [BS
ISO 12913-1:2013]
‘A’ Weighting – This function modifies the linear frequency response of the meter sound profile
to attempts to simulate the characteristics of human hearing. Hence a dB(A) reading is a subjective evaluation of what we actually hear whereas dB (LIN) (now written dBZ), is an objective reading of what is actually present. A weightings are normally used in environmental and occupational measurements
Ambient – This is the general level of sound in an area. It is usually composed of sound from many
sources near and far, that together make the ‘average’ noise for an area. Ambient noise is normally described using a long term average sound level (typically LAEQ).
Ambient sound – totally encompassing sound in a given situation at a given time, usually
composed of sound from many sources near and far. NOTE The ambient sound comprises the residual sound and the specific sound when present.
Ambient sound level, LAeq,T – equivalent continuous A-weighted sound pressure level
of the totally encompassing sound in a given situation at a given time, usually from many sources near and far, at the assessment location over a given time interval, T. NOTE The ambient sound level is a measure of the residual sound and the specific sound when present.
Attenuation – The loss in energy level of the sound usually used in relation to the loss due to
sound passing through a structure or enclosure.
Background Noise Level – The underlying level of sound in the absence of the source is
normally measured as an LA90, the level which is exceeded by 90% of sound present. This measurement effectively screens out transient noises. Occasionally LA99 is used which is the level which is exceeded by 99% of the sound present.
Background sound level, LA90,T – A-weighted sound pressure level that is exceeded
by the residual sound at the assessment location for 90% of a given time interval, T, measured using time weighting F and quoted to the nearest whole number of decibels
Decibel (dB) – a unit or level, derived from the logarithm of the ratio between the sound pressure
measured and a reference value. For sound pressure level the reference quantity is 20µPa, the threshold of normal hearing is in the region of 0 dB and 140 dB is the threshold of pain. A change of 1 dB is only barely perceptible whilst a change of 10dB is considered significant. Sound pressure levels are noted as SPL, sound power can also be measured as a ratio of energy values, and is normally noted as SWL.
dB(A) (See A weighting above) – decibels measured on a sound level meter weighted
by a scale which is designed to reflect the perception by the human ear. A noise meter incorporates a frequency weighting device to create this differentiation. Measurements in dB(A) broadly agree with people’s assessment of loudness for broadband noise. A change of 3 dB(A) is the minimum perceptible under normal conditions, and a change of 10 dB(A) corresponds roughly to halving or doubling the loudness of a sound. The background noise level in a living room may be about 30 dB(A); normal conversation about 60 dB(A) at 1 metre; a busy factory may have a level around 85dB(A); the level near a pneumatic drill about 100 dB(A).
Equivalent continuous A-weighted sound pressure level, LAeq,T –
value of the A-weighted sound pressure level in decibels of continuous steady sound that, within a specified time interval, T = t2 – t1, has the same mean-squared sound pressure as a sound that varies

Enablelink Limited George Henry Road, Great Bridge, Tipton, DY4 7BS
Acoustic Impact Assessment
2 1 4 / E n a b l e l i n k P a g e | 27
with time. NOTE The equivalent continuous A-weighted sound pressure level is normally quoted to the nearest whole number of decibels. Frequency – This is the number wavelengths passing a given point per second. The unit is the
hertz (Hz). Frequency is the normal variation in pitch that most sounds have over time. Sound is normally made up of many different frequencies, and they behave differently within the environment. For example, moderate and high frequencies are damped out easily by barriers, screens or enclosures while low frequencies are more difficult to attenuate, which explains why loud music from a neighbour perceived through a wall often only sounds like a dull base thumping noise.
Impulse Noise – Single or repeated sound of short duration such as a bang or crash.
LA90 – The A weighted noise level exceeded for 90% of the specified measurement period. It is a
statistical measurement. Used in BS 4142:2014 as the baseline for impact assessment and more generally it is used to define background noise level. Example, if a sound measurement carried out each second over 100 seconds the LA90 result would be the level representing the quietest 10% of the readings i.e. 10seconds.
LAeq – The equivalent continuous sound level - the sound level of a notionally steady sound having
the same energy as a fluctuating sound over a specified measurement period. LAeq is used to describe many types of noise and can be measured directly with an integrating sound level meter. It is obtained by continuously integrating (‘adding up the energy of’) a fluctuating sound signal and dividing by the elapsed time, to give the true mathematical average of any time varying signal. An Leq reading must always be related to a time period, it should not be read as an instantaneous value of sound pressure.
LAMax – The highest A weighted noise level recorded during a noise event. The time weighting
used (F or S) should be stated. Almost all environmental measurements are ‘Fast’ weighted.
Logarithmic – A scale where the exponent indicating the power to which a fixed number, the
base, must be raised to produce a given number. The base used in acoustics is 10. Thus, the logarithm of 10 = 1, the logarithm of 100 = 2 and the logarithm of 1000 = 3. Logarithms are used to convert very spans of pressure or energy measurements into usable scales.
Loudness – An observer’s auditory impression of the strength of a sound. It is a subjective effect
which is a function of the way we hear, and psychoacoustic response as well as the amplitude and frequency of the sound.
Masking – The process by which the threshold of hearing of one sound is reduced due to the
presence of another which ‘masks’ the first.
Measurement Periods (T) – is the period over which the measurement is taken, normally
varies between 5mins to an hour. More commonly ‘real time’ analysis and new data storage capabilities has allowed measurement times to be reduced to 1 second
Measurement time interval, Tm – total time over which measurements are taken.
NOTE This may consist of the sum of a number of non-contiguous, short-term measurement time intervals.
Meter response and time weightings – Sound Level Meters are provided with a
sampling reference time weightings dependent on the sounds to be assessed. The variable time response control with settings are:- ‘S’ Slow; ‘F’ Fast; ‘I’ Impulse; ‘P’ Peak.
‘S’ Slow – meter response is over damped with a time constant of approximately 1000ms. The
setting tends to average out variations in sound levels in the readings.
‘F’ Fast – meter responses sample over a response of 125ms. i.e. the measurement for variable
sound will respond each 1/8th of a second showing a value.
‘I’ Impulse – uses a special electrical circuit with a time constant of about 35ms (of the same order
as the response time of the human ear) to permit a very rapid response for investigating very sudden, short duration - impulsive - sounds. This setting incorporates a detector which in effect stores the signal for sufficient time to allow it to be displayed. Also, a slow decay rate is incorporated with time response of approx. 1500ms to allow more easy reading of the maximum value as the indicator moves back relatively slowly.
Peak – Sound Level Meters often incorporate this setting which enables the absolute peak (as
opposed to the rms) value of an impulsive waveform to be measured. A time constant of the order of

Enablelink Limited George Henry Road, Great Bridge, Tipton, DY4 7BS
Acoustic Impact Assessment
2 1 4 / E n a b l e l i n k P a g e | 28
20 - 50 micro seconds is now involved to permit the following of very sharp impulsive events. Evidently electrical signal storage is also required to permit the meter to register the peak of such very fast events.
Rating Level – The specific noise level of a source when measured at receiver location (usually
averaged over a time interval) plus any adjustment (penalty or weighting) for the characteristic features of the noise. It is used in BS4142 to rate the likelihood of complaints.
Reference time interval, Tr – specified interval over which the specific sound level is
determined. NOTE This is 1 h during the day from 07:00 h to 23:00 h and a shorter period of 15 min at night from 23:00 h to 07:00 h.
Residual sound – ambient sound remaining at the assessment location when the specific
sound source is suppressed to such a degree that it does not contribute to the ambient sound
Residual sound level, Lr = LAeq,T – equivalent continuous A-weighted sound
pressure level of the residual sound at the assessment location over a given time interval, T
Specific sound level, Ls = LAeq,Tr – equivalent continuous A-weighted sound
pressure level produced by the specific sound source at the assessment location over a given reference time interval, Tr
Specific sound source – sound source being assessed
WHO – World Health Organisation

Enablelink Limited George Henry Road, Great Bridge, Tipton, DY4 7BS
Acoustic Impact Assessment
2 1 4 / E n a b l e l i n k P a g e | 29
References 1. BS 7445-1:2003: Description and measurement of environmental noise. Guide to quantities and
procedures 2. BS 4142:2014+A1(2019) Method for rating and assessing industrial and commercial sound 3. BS 8233:2014 4. WHO Guidelines on Community Noise 1999
http://www.who.int/docstore/peh/noise/guidelines2.html 5. WHO Guidelines NIGHT NOISE GUIDELINES FOR EUROPE 2009
www.euro.who.int/en/health-topics/environment-and-health/noise/publications/2009/night-noise-guidelines-for-europe
6. WHO Noise Guidelines for Europe 2018 http://www.euro.who.int/en/health-topics/environment-and health/noise/publications/2018/environmental-noise-guidelines-for-the-european-region-2018
7. Ian Sharland Limited, Installation of Battery Storage Facility at Ocker Hill, Harvills Hawthorne, Greatbridge, November 2020. Ref: Ref: 4714 https://webcaps.sandwell.gov.uk/publicaccess/files/098F16D8EF0164A661A390824BE25C19/pdf/DC_20_65026-ACOUSTIC_DESIGN_SPECIFICATION-1098764.pdf
8. MLM Consulting Limited, Eagle Recovery Transfer Hub - Noise Impact Assessment (January 2011) Ref 500098/JF/R7 https://webcaps.sandwell.gov.uk/publicaccess/files/D39B629D9E1944EA23F1AE0154E6606C/pdf/DC_11_53005-NOISE_IMPACT_ASSESSMENT__R7_-485036.pdf
9. Sector Guidance Note IPPC S5.06 Guidance for the Recovery and Disposal of Hazardous and Non Hazardous Waste 2013
10. Horizontal Guidance Note IPPC H3 (part 2) Noise Assessment and Control 2004
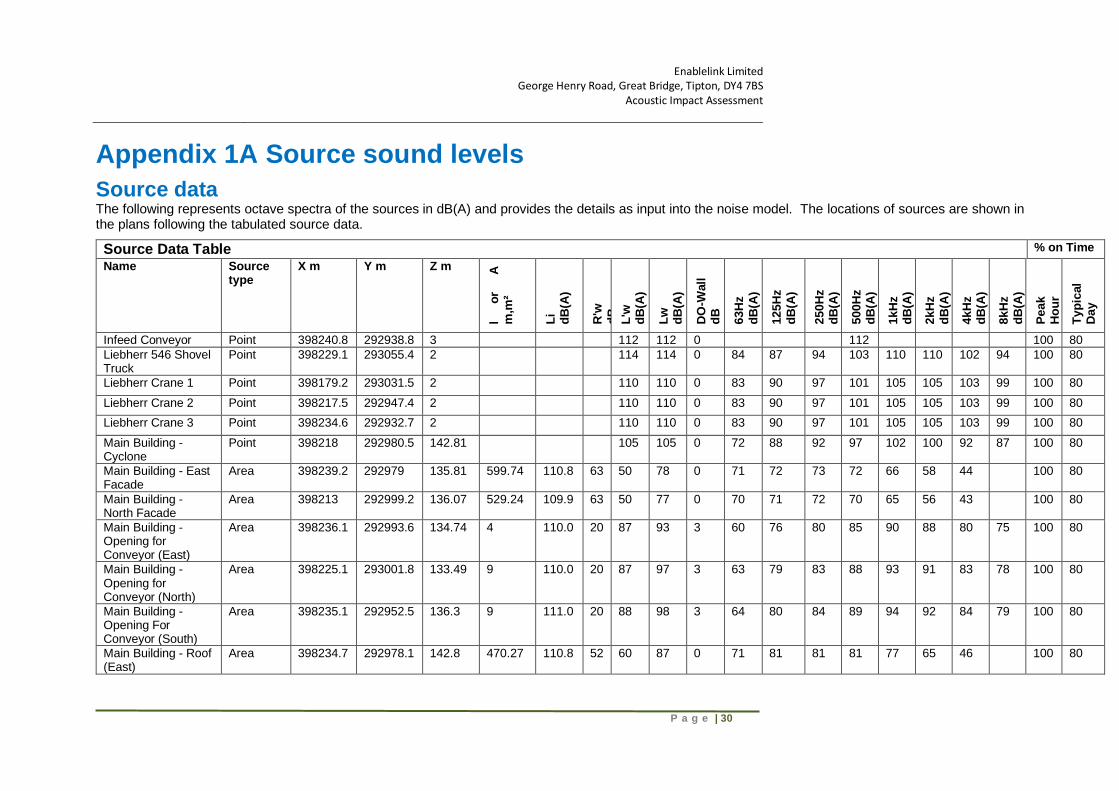
Enablelink Limited George Henry Road, Great Bridge, Tipton, DY4 7BS
Acoustic Impact Assessment
P a g e | 30
Appendix 1A Source sound levels
Source data The following represents octave spectra of the sources in dB(A) and provides the details as input into the noise model. The locations of sources are shown in the plans following the tabulated source data.
Source Data Table % on Time
Name Source type
X m Y m Z m
l o
r A
m
,m²
Li
dB
(A)
R'w
dB
L
'w
dB
(A)
Lw
d
B(A
)
DO
-Wall
d
B
63H
z
dB
(A)
125H
z
dB
(A)
250H
z
dB
(A)
500H
z
dB
(A)
1kH
z
dB
(A)
2kH
z
dB
(A)
4kH
z
dB
(A)
8kH
z
dB
(A)
Peak
Ho
ur
Typ
ical
Day
Infeed Conveyor Point 398240.8 292938.8 3
112 112 0
112
100 80
Liebherr 546 Shovel Truck
Point 398229.1 293055.4 2
114 114 0 84 87 94 103 110 110 102 94 100 80
Liebherr Crane 1 Point 398179.2 293031.5 2
110 110 0 83 90 97 101 105 105 103 99 100 80
Liebherr Crane 2 Point 398217.5 292947.4 2
110 110 0 83 90 97 101 105 105 103 99 100 80
Liebherr Crane 3 Point 398234.6 292932.7 2
110 110 0 83 90 97 101 105 105 103 99 100 80
Main Building - Cyclone
Point 398218 292980.5 142.81
105 105 0 72 88 92 97 102 100 92 87 100 80
Main Building - East Facade
Area 398239.2 292979 135.81 599.74 110.8 63 50 78 0 71 72 73 72 66 58 44
100 80
Main Building - North Facade
Area 398213 292999.2 136.07 529.24 109.9 63 50 77 0 70 71 72 70 65 56 43
100 80
Main Building - Opening for Conveyor (East)
Area 398236.1 292993.6 134.74 4 110.0 20 87 93 3 60 76 80 85 90 88 80 75 100 80
Main Building - Opening for Conveyor (North)
Area 398225.1 293001.8 133.49 9 110.0 20 87 97 3 63 79 83 88 93 91 83 78 100 80
Main Building - Opening For Conveyor (South)
Area 398235.1 292952.5 136.3 9 111.0 20 88 98 3 64 80 84 89 94 92 84 79 100 80
Main Building - Roof (East)
Area 398234.7 292978.1 142.8 470.27 110.8 52 60 87 0 71 81 81 81 77 65 46
100 80

Enablelink Limited George Henry Road, Great Bridge, Tipton, DY4 7BS
Acoustic Impact Assessment
2 1 4 / E n a b l e l i n k P a g e | 31
Main Building - Roof (Small Section)
Area 398206.2 292986 141.8 579.26 109.4 52 59 86 0 71 81 81 81 76 64 44
100 80
Main Building - Roof (West)
Area 398225.8 292976.2 142.8 470.27 110.8 52 60 87 0 71 81 81 81 77 65 46
100 80
Main Building - South Facade
Area 398235.5 292952.6 136.31 228.4 111.2 41 78 102 0 90 101 89 85 84 75 62
100 80
Main Building - South Facade (Smaller Section)
Area 398208.6 292974.7 135.8 300.84 109.2 63 49 74 0 67 68 69 67 62 53 39
100 80
Main Building - West Facade
Area 398223.7 292964 135.8 326.48 111.1 63 51 76 0 68 69 71 69 64 56 42
100 80
Main Building - West Facade (Smaller Section)
Area 398194 292983.4 135.8 277.27 109.4 63 49 74 0 66 67 69 67 61 53 39
100 80
Material Discharge Point 398220.8 293032.7 3 108 108.0 0 108
100 80
Non Ferrous Building - East Facade
Area 398256.2 293007.6 136.1 314.82 103.9 41 71 96 0 84 95 83 79 78 69 56
100 80
Non Ferrous Building - North Facade
Area 398246.4 293018.8 137.67 148.33 104.9 41 72 93 0 82 93 80 77 76 67 54
100 80
Non Ferrous Building - Open Area (North Facade)
Area 398246.5 293018.9 132.23 35.68 105.0 20 82 98 3 64 80 84 89 94 92 84 79 100 80
Non Ferrous Building - Open Area (South Facade)
Area 398252.1 292993.2 136.1 54.46 105.0 20 82 99 3 66 82 86 91 96 94 86 81 100 80
Non Ferrous Building - Roof (East)
Area 398252.8 293006.8 143.1 192.95 103.9 41 71 94 0 82 93 81 77 76 67 54
100 80
Non Ferrous Building - Roof (West)
Area 398245.8 293005.3 143.1 192.95 103.9 41 71 94 0 82 93 81 77 76 67 54
100 80
Non Ferrous Building - South Facade
Area 398252.2 292993.2 136.83 129.55 105.4 41 72 93 0 82 93 80 77 76 67 53
100 80
Non Ferrous Building - West Facade
Area 398242.4 293004.5 136.1 314.82 103.9 41 71 96 0 84 95 83 79 78 69 56
100 80

Enablelink Limited George Henry Road, Great Bridge, Tipton, DY4 7BS
Acoustic Impact Assessment
2 1 4 / E n a b l e l i n k P a g e | 32
Pre Shredder Point 398227 292943.2 2
107 107 0 73 89 95 98 103 102 93 87 100 80
Shear 1 - Side Area 398160.9 293040.9 132.5 32.09
88 103 3 82 83 90 95 97 97 95 88 100 80
Shear 1 - Side Area 398163 293055.7 132.5 83.56
88 107 3 86 87 95 99 101 101 99 92 100 80
Shear 1 - Side Area 398154.8 293068.1 132.5 32.09
88 103 3 82 83 90 95 97 97 95 88 100 80
Shear 1 - Side Area 398152.6 293053.3 132.5 83.56
88 107 3 86 87 95 99 101 101 99 92 100 80
Shear 1 - Top Area 398157.8 293054.5 134 297.97
88 112 0 91 93 100 105 107 107 104 98 100 80

Enablelink Limited George Henry Road, Great Bridge, Tipton, DY4 7BS
Acoustic Impact Assessment
P a g e | 33
Appendix 1B Plant Layout
Source Locations (external)
Shear
Leibherr Crane 1
Leibherr Crane 2
Leibherr 546 shovel truck
Pre-shredder
Leibherr Crane 3
Loading hopper

Enablelink Limited George Henry Road, Great Bridge, Tipton, DY4 7BS
Acoustic Impact Assessment
2 1 4 / E n a b l e l i n k P a g e | 34
Source Locations (internal)

Enablelink Limited George Henry Road, Great Bridge, Tipton, DY4 7BS
Acoustic Impact Assessment
P a g e | 35
Appendix 2 Model outputs
The model data outputs for ground floor sound levels at receptors to reflect garden area sound levels and incident levels in daytime usable rooms. E.g. living/dining rooms.
The data is presented in a colour coded format according to the key provided, and also numerically at key receptors in the following format:
Example below means, 47 dB internal, 54 dB external, 55 dB total.
Modelled 1 hour – No Additional Mitigation Peak 1hour Noise data, all plant operational
The predicted levels of noise emitted from the site are dominated by internal plant noise despite the robust building structure and insulation present. Breakout from the openings to the north and south of the main process buildings requires additional controls. Without these additional controls for the process building, noise breakout is significant and dominates the noise climate. Levels of noise exceeding WHO criterion would indicate potential adverse health impacts unless mitigated.
47 55 54
Contribution from internal
building
noise
Contribution from
external
plant noise
Total noise level

Enablelink Limited George Henry Road, Great Bridge, Tipton, DY4 7BS
Acoustic Impact Assessment
2 1 4 / E n a b l e l i n k P a g e | 36
Modelled 1 hour – with additional mitigation Peak 1hour Noise prediction
Implementation of the additional mitigation measures for the building, including additional cladding, and increasing barrier heights within the installation (and at the installation boundary) as described in the Mitigation Measures section above has a significant effect on emitted noise levels as shown above. The levels of reduction achieved are noted in the table below compared to the unmitigated scenario. Table of mitigation performance for key receptors
Receptor Predicted Level Before (dB)
Predicted Level After (dB)
Mitigation performance (dB)
5 Isaac Walton Place 67 55 12
141 Wolseley Road 62 55 7
135 Wolseley Road 70 54 16
125 Wolseley Road 70 54 16
111 Wolseley Road 71 52 19
The above data reflects a worst case with all plant operating. Incorporating typical on time for plant and equipment provides shows improvement in predicted levels (see plot below).

Enablelink Limited George Henry Road, Great Bridge, Tipton, DY4 7BS
Acoustic Impact Assessment
2 1 4 / E n a b l e l i n k P a g e | 37
Typical 1hour Noise prediction (with on time)
The maximum predicted level for 1 hour of operation based on typical operating conditions is note to prevent breakout be 54 dB. This value has been used in BS4142:2014 calculations.

Enablelink Limited George Henry Road, Great Bridge, Tipton, DY4 7BS
Acoustic Impact Assessment
2 1 4 / E n a b l e l i n k P a g e | 38
Typical Modelled Lday with mitigation Typical Lday (16hour) Noise prediction

Enablelink Limited George Henry Road, Great Bridge, Tipton, DY4 7BS
Acoustic Impact Assessment
2 1 4 / E n a b l e l i n k P a g e | 39
Appendix 3 Noise Mitigation Specifications
Cladding Euroclad 51.3

Enablelink Limited George Henry Road, Great Bridge, Tipton, DY4 7BS
Acoustic Impact Assessment
2 1 4 / E n a b l e l i n k P a g e | 40
ILG Panels
Barrier Technical Specification All barriers are constructed of minimum 100m thick interlocking concrete panels located into an H-frame steel girder guide. If the barrier is also to be a push wall then much large concrete blocks are used. The concrete panels are secured into position to provide a firm and robust barrier with high surface density mass. The specific design of the barriers will be submitted when structural surveys are completed. The existing Budden Road site confirms that high barrier can be constructed and are a viable BAT option. Fig.A3.1 Indicative schematic of panel
Concrete prefabricated panel 100mm thick

Enablelink Limited George Henry Road, Great Bridge, Tipton, DY4 7BS
Acoustic Impact Assessment
2 1 4 / E n a b l e l i n k P a g e | 41
Fig.A3.2 Photograph of panels at existing site.

Enablelink Limited George Henry Road, Great Bridge, Tipton, DY4 7BS
Acoustic Impact Assessment
2 1 4 / E n a b l e l i n k P a g e | 42
Fig.A3.3 Photograph of panels in context (height 10m)

Enablelink Limited George Henry Road, Great Bridge, Tipton, DY4 7BS
Acoustic Impact Assessment
2 1 4 / E n a b l e l i n k P a g e | 43
Appendix 4 Photographs
Additional Ridge photos