SECOND ASSESSMENT
448
SECOND ASSESSMENT of transboundary rivers, lakes and groundwaters ECONOMIC COMMISSION FOR EUROPE Convention on the Protection and Use of Transboundary Watercourses and International Lakes
-
Upload
khangminh22 -
Category
Documents
-
view
2 -
download
0
Transcript of SECOND ASSESSMENT

Second ASSeSSment of transboundary rivers, lakes and groundwaters
economic commiSSion for europeConvention on the Protection and Use of Transboundary Watercourses and International Lakes


Second ASSeSSment of transboundary rivers, lakes and groundwaters
economic commiSSion for europeConvention on the Protection and Use of Transboundary Watercourses and International Lakes
New York and Geneva, 2011

Note
The designations employed and the presentation of the material in this publication do not imply the expression of any opinion whatsoever on the part of the Secretariat of the United Nations concerning the legal status of any country, territory, city or area, or of its authorities, or concerning the delimitation of its frontiers or boundaries.
The approach to geographical names in this publication is not uniform. English names have been used in some cases and local names in others. In the text, either the English name was used or the names used in the different riparian countries. In maps, local names have been used to the extent possible.
Symbols of United Nations documents are composed of capital letters combined with figures. Mention of such a symbol indicates a reference to a United Nations document.
UNITED NATIONS PUBLICATIONS
Sales No E. 11.II.E.15
ISBN 978-92-1-117052-8
ECE/MP.WAT/33
SECond ASSESSmEnt | III
ForEword
Transboundary waters play a key role in the United Nations Economic Commission for Europe (UNECE) region. Their ba-sins cover more than 40% of the European and Asian surface of the UNECE region and are home to more than 50% of the European and Asian population of UNECE.
The Second Assessment of Transboundary Rivers, Lakes and Groundwaters is the most comprehensive, up-to-date overview of the status of transboundary waters in the European and Asian parts of the UNECE region. It has been prepared upon request by the Sixth “Environment for Europe” Ministerial Conference as an input for the Seventh Ministerial Conference in Astana in September 2011. It has been carried out under the auspices of the Meeting of the Parties to the Convention on the Protection and Use of Transboundary Watercourses and International Lakes (Water Convention), and under the overall leadership of Finland.
The Second Assessment presents a broad analysis of pressures, quantity and quality status, transboundary impacts, as well as responses and future trends of our transboundary water re-sources. It highlights regional differences, specificities and vul-nerabilities.
The overall picture that emerges from the Second Assessment is two-fold.
On the one hand, many efforts have been made to reduce trans-boundary impacts. The Second Assessment provides evidence that such efforts are bearing fruit and that in many parts of our region the status of transboundary waters is improving.
On the other hand, transboundary water resources are still under great stress as a result of poor management practices, pollution, overexploitation, unsustainable production and consumption patterns, hydromorphological pressures, inadequate investment in infrastructure and low efficiency in water use. The degra-dation and loss of ecosystems, and in particular wetlands, is a threat. Competition — and in some cases even conflicts — be-tween different water uses, often in different riparian countries, is also a challenge. Climate change impacts are expected to fur-ther aggravate these problems. The need for stronger water and environmental governance, sound land management policies and, above all, integration of sectoral policies so that improve-ments in water management are not compromised by policies in other sectors, is as pressing as ever.
With regard to transboundary water cooperation, the message is also mixed. Globally, the UNECE region is the most advanced in terms of cooperation on transboundary waters. Almost all concerned UNECE countries have taken measures to establish transboundary water cooperation on their shared waters. Much of this progress has been facilitated by the Water Convention. However, the level and effectiveness of cooperation varies great-ly: in some major transboundary rivers, a basin-wide framework for cooperation is still missing, in other cases, the level of co-operation is weak and not suited to respond to the complex challenge of balancing competing interests. These gaps and weaknesses underscore the importance of the Water Conven-tion in supporting UNECE countries to improve transbound-ary cooperation.
The Second Assessment gives prominence to the challenges we face today and which we have to address together. It also describes some of the ways in which countries and joint bodies have dealt with these challenges, providing options for consideration in other parts of the region. I hope that the Second Assessment will stimulate Governments, river basin organizations and interna-tional and non governmental organizations to improve the status of transboundary waters and related ecosystems.
Ján Kubiš
Executive SecretaryUnited Nations Economic Commission for Europe

IV | SECond ASSESSmEnt
PrEFACE
In 2003, the Parties to the Water Convention decided to regu-larly carry out regional assessments in order to keep the status of transboundary waters in the UNECE region under scrutiny, to benchmark progress and to provide the basis for continuous bilateral and multilateral work under the Water Convention. The Parties to the Convention mandated its Working Group on Monitoring and Assessment to prepare these assessments.
The First Assessment of Transboundary Rivers, Lakes and Groundwaters in the UNECE region was released at the Sixth “Environment for Europe” Ministerial Conference (Belgrade, October 2007), which requested the Meeting of the Parties to the Water Convention to prepare a second edition for the Seventh Ministerial Conference in Astana in September 2011.
While building on the results and lessons learned from the first edition, the Second Assessment is broader in scope and presents a number of novel features.
First of all, it has a strong focus on integrated water resources management (IWRM) and highlights achievements and chal-lenges in managing waters in an integrated manner on the basis of the river basin, both at the national and transboundary levels. Consequently, transboundary surface waters and groundwaters are assessed together, at the level of the transboundary basins. The importance of water resources in supporting different eco-nomic sectors is also highlighted.
Moreover, the geographical scope regarding groundwaters has expanded. While the First Assessment only covered transbound-ary aquifers in South-Eastern Europe, the Caucasus and Central Asia, in the second edition transboundary groundwaters in West-ern, Central, Eastern and Northern Europe are also assessed. This has unveiled information gaps and the need for stronger legal and institutional bases for groundwater management and for better integration with surface waters.
Legal, institutional and socio-economic issues have a prominent place in the Second Assessment, given their crucial importance for transboundary water cooperation. As national frameworks strongly influence water management and cooperation at the transboundary level, the Second Assessment also provides infor-mation on national institutional settings for water management. The legal basis for transboundary cooperation is also examined: bilateral and river basin agreements on transboundary waters, as well as relevant multilateral environmental agreements entered into by UNECE countries and their neighbours, are inventoried.
IWRM entails an ecosystem approach to water management. Therefore, specific attention is devoted to ecological issues, no-tably through the assessment of selected Ramsar Sites and other wetlands of transboundary importance, prepared by the secre-tariat of the Convention on Wetlands of International Impor-tance especially as Waterfowl Habitat (Ramsar Convention) in close cooperation with experts on those sites. Such assessments underline the importance of water-dependent ecosystems in transboundary basins, not least through the various services that they provide. These case studies also show the interlinkages be-tween transboundary wetland management and management of transboundary waters.
SECond ASSESSmEnt | V
PrEFACE
The Second Assessment recognizes the threats from climate change and seeks to provide a picture of the predicted impacts on transboundary water resources, as well as the measures planned or in place to adapt to climate change. The challenges deriving from climate change clearly demonstrate the value of long-term monitoring: only when reliable, consistent time series exist can the slowly evolving changes be detected, their causes analysed and the effectiveness of management interventions verified to guide further policy. Still, in many countries of the region the commitment to monitoring is not firm.
The UNECE region is highly diverse in terms of availability of water resources, pressures, status and responses, as well as with regard to the economic and social conditions that strongly in-fluence both the pressures on and the status of water resources, as well as the capacity of countries to implement management responses. Therefore, the Second Assessment has a strong subre-gional focus and highlights characteristics and specificities of five, partly overlapping, UNECE subregions which were defined for the purposes of the Assessment. The criteria for their delineation are not based on political boundaries, but rather with a view to taking into account similarities of water management issues in the transboundary basins. Yet, even within these subregions big differences are observed.
The Second Assessment is an example of international coopera-tion at its best. More than 250 experts from some 50 countries were involved in its preparation, providing data and information, and engaging in the exchanges at the workshops. Most remark-ably, not only the Parties to the Water Convention, but also UN-ECE members not Parties have contributed to the Second As-sessment. Moreover, experts from countries outside the UNECE region and sharing waters with UNECE countries — namely Afghanistan, China, the Islamic Republic of Iran and Mongo-lia — also participated in the process. I would like to thank all the experts for their invaluable contribution. I would also like to thank the many international and national partners that joined forces in the preparation of the Assessment: the Global Water Partnership Mediterranean; the International Water Assessment Centre (the Water Convention collaborative centre hosted by the Slovak Hydrometeorological Institute); the secretariat of the Ramsar Convention; the secretariats of the international com-missions for the Danube, Elbe, Meuse, Moselle and Saar, Oder, Rhine, Sava and Scheldt; the Global Resource Information Da-tabase Europe of the United Nations Environment Programme (UNEP/GRID-Geneva); and the International Groundwater Resources Assessment Centre. Finally, I would like to thank the Governments of Finland, Switzerland, Sweden, Germany, Hun-gary, the Netherlands and Georgia for their financial support to the Second Assessment. And last, but not least, my sincere thanks go to the UNECE secretariat of the Water Convention, in par-ticular to Annukka Lipponen, coordinator and main author of the Second Assessment, and to Francesca Bernardini, Secretary to the Convention. Without their expertise, commitment and dedication the Second Assessment could not have been realized.
The future economic and social development of the UNECE re-gion will very much depend on how we manage our waters. All living organisms are dependent on water. Water is a cornerstone
for societies: water-related ecosystem services are necessary for agriculture and forestry, but also a precondition for industry and service activities, as raw material and as a source of renewable energy. Under growing pressures and demands from all sectors of society — in particular agriculture, energy, transport, urban development and tourism — water has become a critical and, in some cases limiting, factor for sustainable development. Green economy, today high on the agenda of most countries, can only be realized when water is recognized as an integral part of all sec-toral policies, and sound policies and measures for the protection and sustainable use of this precious resource are in place.
The Second Assessment abounds with information that can serve as a firm foundation for future efforts towards sustainable growth in our region. It reviews persistent environmental problems and emerging issues and it lays out challenges and opportunities to support informed decision-making on the management of shared water resources. Its aim is to spur further action by Governments, river basin organizations and international and non-governmen-tal organizations to improve the status of transboundary waters and related ecosystems.
Lea Kauppi
Chair of the Water Convention’sWorking Group on Monitoring and AssessmentDirector General of the Finnish Environment Institute
VI | SECond ASSESSmEnt
ACknowlEdgmEntSThis Assessment could not have been prepared without the help and input of many individuals and organizations. The UNECE secretariat would like to thank the following people for their help in preparing the Assessment. All those whom we have involuntarily forgotten, please accept our sincere apologies along with our thanks.
AMalkhaz AdeishviliNatalya AgaltsevaVikhitjon AkhmadjonovSerik AkhmetovNadezhda AlexeevaDamian AllenJosé Álvarez DíazAndrás AmbrusHossein Farjad AminPaolo AngeliniMiguel AntolínDaniel AssfeldMatanat Avazova
BMarina Babic-MladenovicGrigore BaboianuMaria BabukchievaAlena BahadziazhAna BajloRuxandra BalaetKurbangeldy BallyevThomas BanafaPiotr BarańskiEliso BarnoviCristina Bayer Matthias BeilsteinKydykbek BeishekeevTatiana BelousOlga BerezkoAnne BerteigNatalia Bilotserkivs’kaJoachim BleyChristian BlumCorina Cosmina BoscorneaOlena BoyevaKaroline BrandlMihai BretoteanMitja BriceljMichael BrombacherSabine BrünickeTatjana BulavskajaZsuzsanna Buzás
c María Casado SáenzTanja CegnarNatalia ChizhmakovaBente ChristiansenAlan CibilićAlberto CisottoAdrienne ClementDmitry CoadaMassimo Cozzone
dIlya DanshynYakup DaramaDorjsuren DechinlkhundevGabriel De Los CobosAdriana DembowskaNickolai DenisovDidier D’hontLars DinesenDušan Đurić
Dušan Dobričić Jemal DolidzeZhakup DostaiAna Drapa Christian DronneauKarin DubskyGediminas DudenasAnnelieke Duker
eKarri EloheimoRainer EnderleinTaina Evans
fGábor FigeczkyJirí Flousek
GMagomed GadshievMaria GalambosJacques GanoulisMerab GaprindashviliEka GegiaPetar GjorgjioskiIrina Goncharova Samo GrošeljPetia GrozevaPrzemysław Gruszecki Tamara Guvir
HElizabeta Vojnić Stanić HajdukThomas Hansen Skender HasaAylin HasanMirja HeikkinenTuro HjerppeRon HofferBalázs HorváthSajmir HoxhaPavel HuckoJukka Höytämö
iIvan IgnatievAida IskoyanJadranka Ivanova
JBo JacobsenMilan JanakTatjana JansoneDarinka JantinskaHeide JekelKarén JenderedjianZurab JincharadzeBoban JolovicVeronica Josu
KJan KadlecikMarek KajsAnvar KamolidinovLea KauppiMarja KauppiZdena Kelnarova
Amirkhan KenshimovLaurentiu Kertesz Antton KetoKai KimmelJanusz KindlerRoman KishIldikó Kiss HorváthnéViktor KlimentSergey KlimovPavel KnotekDejan KomatinaMargarita Korkhmazyan Vladimir KorneevMikhail KornilovBoris Korolyev,Margus KorsjukovSergey KostarevPéter KozákBodo KraussPeter KristensenNeno Kukurić Eugen KullmanEmilia KunikovaTarik KupusovicAnna Kuznetshova
LArnould LefébureGuangchun LeiAgu LeivitsJiao LiHarry LiivTeppo LinjamaIgor LiskaUlrich LooserVictoria LuchianovaOlga Lysuk
mRodica MacaletViacheslav ManukaloSultan Mahmood MahmoodiMuhammadi MamanazarovRaimund MairAndrea MájovskáMariam MakarovaHarald MarencicAslan MavlonovTimur MavlyanovIrakli MegrelidzeKai Uwe MetznerOtilia MihailDragana Milovanovic Tatiana MinaevaBoris MinarikSeyran MinasyanMarin Minciuna Alexandr MindorashviliLidia MininaIskandar MirhashimovYlber MirtaSarac MirzaSari MitikkaLea MrafkovaAkhmed MusaevAizhan MusagazhinovaAri Mäkelä
n Enayatullah NabielAnnamaria NadorCatalin NagyAlireza Najafi Volodya NarimanyanDoubravka NedvedováEmílie NedvedováAdrienn NemesOleksandr NepapyshevRiitta NiiniojaVisa NiittyniemiDragana Ninković Viktor NovikovNuriddin Nuraliev
oErkin OrolbaevVolodymir OsadchyiZane Ozola
pMiklos PannonhalmiTibor ParragJean PauwelsSteen Pedersen Tor Simon PedersenBoyko PeevŽelimir PekašGrygorii PetrukAnatoly PichuginOleg PodolnyiNatalia PolikarpovaJoerg PrestorFrancesco Puma
rAleksandar Radunovic Ahmad RajaeiRumyana Rangelova-Bratovanova
Panu Ranta François RapinSeppo RekolainenRui Raposo RodriguesHeddy RiismaaJean-Paul RivaudWolfgang RodingerOlga RomanovaDag RoslandAurel RotaruVivi RoumeliotouAna Rukhadze Eldar RustamovPekka Räinä
SYekaterina SahvaevaTobias SalatheVilik SargsyanAnca Savin Monika SchaffnerAndreas ScheidlederAndrás SchmidtWillem SchreursAnne Schulte-Wülwer-Leidig

SECond ASSESSmEnt | VII
Karl Schwaiger Josef SchwankenMichael ScoullosRoger SedinTatiana SemezhKyryl Sereda Ubeyd SezerAzia ShamshievaNino SharashidzeMalak ShukurovaOtto SimonettEugene SimonovMałgorzata SkwarekDemyan SmilivetsPeter SomogySergey SpektorSergey SpektrovRichard StadlerMagdalena Stanecka
Konrad StaniaMiroslav Steinbauer Ulrika Stensdotter BlombergSvetlana StirbuYekaterina StrikilevaMichaela Stojkovová Viktor SubotićElnar SultanovGennadiy Syrodoev Éva SzabóSzakó Szilárd Teodora Szocs Maria Szomolanyi RitvayneMargit Säre
TArtur TakurbashevIveta TeibeJos TimmermanCarmen Toader
Sini TolonenGyörgy TóthIlya TrombitskyBadrakh TsendVano TsiklauriAnna Tsvetkova
UAndris UrtansVasil Uzunov
VRudy VannevelOlga VasnevaAsif VerdiyevRafiq VerdiyevFrederik VerhoogSibylleVermontSteven VinckierNiels Vlaanderen
Slavomir Vosika
WSteve WarrenAndre WeidenhauptKathrin WeisePhilip WellerEdith WengerKati WenzelBen van de WeteringAlvin WilsonRon Witt
YLlewellyn Young
ZNataliia ZakorchevnaMateusz ZakrzewskiIlie Zanfir
thE following ExpErtS wErE thE mAin AuthorS of SpECifiC ChAptErS:John Chilton (Western and Central Europe, summary of major findings)
Dimitris Faloutsos (South-Eastern Europe, summary and basin assessments)
mApS wErE dESignEd And prEpArEd byDominique Del Pietro (surface water maps and related graphics)
Cheryl van Kempen (groundwater maps)
publiCAtion dESign And lAyoutLisa Dodson
The Assessment has been a collective effort of the UNECE secretariat. The following team has been involved in its preparation:
Annukka Lipponen (coordinator and lead author)
Francesca BernardiniElla Behlyarova
Olga CarlosAmy EdgarChristopher EdgarEsther HaftendornAnne Hyvärinen
Marco KeinerSonja KoeppelBo LibertSergiusz LudwiczakAlisher Mamadzhanov
Cammile MarceloElina MirzoevaNataliya NikiforovaGulnara RollIulia Trombitcaia
UNECE would like to thank the following partners for their generous contribution to the Second Assessment:
Ministry of Foreign Affairs of FinlandInternational Water Assessment Centre (IWAC)Slovak Hydrometeorological InstituteSecretariat of the Ramsar Convention on WetlandsSwiss Federal Office for the EnvironmentSwedish Environmental Protection AgencyGerman Federal Ministry for the Environment, Nature
Conservation and Nuclear Safety
Hungarian Ministry of Rural DevelopmentMinistry of Infrastructure and Environment of the NetherlandsMinistry of Environment Protection of GeorgiaUNEP/DEWA/GRID-EuropeInternational Groundwater Resources Assessment Centre (IGRAC)Global Water Partnership Mediterranean
G R I DG e n e v a
international
groundwater
resources
assessment
centre
HUNGARIAN MINISTRY OF RURAL DEVELOPMENT
Ministry of Environment Protection of Georgia

VIII | SECond ASSESSmEnt

SECond ASSESSmEnt | IX
tAblE oF ContEntS
LISt oF CoUNtRY CoDeS ............................................................................................................................................................. XII
LISt oF ACRoNYMS AND UNItS oF MeASUReMeNt ................................................................................................................... XII
PArt i oVeRVIeW ........................................................................................................................................................................ 1
Background .................................................................. 2
A diverse region ............................................................ 2
Advancement of transboundary cooperation ................. 3
Climate change ............................................................. 4
Ecological and biodiversity issues .................................. 4
Main subregional findings ............................................ 5
Maps of transboundary surface waters ............................ 17
Maps of transboundary groundwaters ........................... 19
List of transboundary groundwaters .............................. 23
PArt ii oBJeCtIVeS AND SCoPe oF tHe ASSeSSMeNt ............................................................................................................. 29
Objectives .................................................................... 30
Scope ........................................................................... 31
Process ........................................................................ 32
Sources of information ................................................. 32
Partners ........................................................................ 33
Explanatory notes for reading the Second Assessment ..... 33
PArt iii MAJoR FINDINGS oF tHe ASSeSSMeNt ...................................................................................................................... 35
ChAPtEr 1 WESTErN ANd CENTrAL EUroPE ............... 37
ChAPtEr 2 SoUTh-EASTErN EUroPE ........................... 47
ChAPtEr 3 EASTErN ANd NorThErN EUroPE ............ 54
ChAPtEr 4 CAUCASUS ................................................... 61
ChAPtEr 5 CENTrAL ASIA.............................................. 66
PArt iV ASSeSSMeNt oF tRANSBoUNDARY RIVeRS, LAKeS AND GRoUNDWAteRS .............................................................. 75
ChAPtEr 1 drAINAgE BASINS of ThE WhITE SEA, BArENTS SEA ANd KArA SEA .................................................................... 77
Oulanka River Basin ..................................................... 78Tuloma River Basin ...................................................... 78Jakobselv River Basin .................................................... 81Paatsjoki/Pasvik River Basin .......................................... 82Pasvik Nature Reserve ................................................... 85Näätämö/Neiden River Basin ........................................ 86Teno/Tana River Basin .................................................. 86
Yenisey River Basin and the Selenga sub-basin .............. 88Ob River Basin ............................................................. 91Irtysh/Ertis sub-basin ................................................... 91Tobol sub-basin ............................................................ 94Ishim/Esil sub-basin ..................................................... 97Tobol-Ishim Forest-steppe ............................................ 97
ChAPtEr 2 drAINAgE BASINS of ThE SEA of oKhoTSK ANd SEA of JAPAN ........................................................................ 99
Amur River Basin ....................................................... 99Argun/Hailaer sub-basin ..............................................101Daurian wetlands in the Argun/Hailaer sub-basin ..........102Ussuri/Wusuli sub-basin ..............................................104
Lake Khanka/Xingkai ..................................................104Lake Khanka/Xingai wetlands ......................................105Sujfun/Razdolnaya River Basin ....................................106Tumen/Tumannaya River Basin ...................................106
ChAPtEr 3: drAINAgE BASINS of ThE ArAL SEA ANd oThEr TrANSBoUNdAry WATErS IN CENTrAL ASIA .......................107
Amu Darya River Basin ...............................................108Surkhan Darya sub-basin .............................................111Kafirnigan sub-basin ....................................................111Pyanj sub-basin ............................................................111Vakhsh sub-basin .........................................................112Zeravshan River Basin .................................................112Syr Darya River Basin ..................................................113Aydar Arnasay Lakes System ........................................116Naryn sub-basin ..........................................................117Kara Darya sub-basin ..................................................118Chirchik sub-basin ......................................................118
Chatkal sub-basin ........................................................119Aral Sea .......................................................................119Chu-Talas River Basins ................................................119Chu River Basin ..........................................................121Talas River Basin ..........................................................122Assa River Basin ...........................................................124Ili River Basin ..............................................................126Ili Delta – Balkhash Lake .............................................128Murgab River Basin .....................................................129Tejen/Harirud River Basin ...........................................129
X | SECond ASSESSmEnt
ChAPtEr 4: drAINAgE BASINS of ThE CASPIAN SEA ..............................................................................................................131
Ural River Basin ...........................................................132Atrek/Atrak River Basin ...............................................135Gomishan Lagoon .......................................................137Kura River Basin ..........................................................138Iori/Gabirri sub-basin .................................................142Alazani/Ganyh sub-basin .............................................143Agstev/Agstafachai sub-basin .......................................144Potskhovi/Posof sub-basin ............................................145Ktsia-Khrami sub-basin ...............................................146Debed/Debeda sub-basin .............................................147Lake Jandari .................................................................149Kartsakhi Lake/Aktaş Gölü ...........................................149Wetlands of Javakheti Region ......................................150Araks/Aras sub-basin ....................................................151
Akhuryan/Arpaçay sub-basin .......................................153Akhuryan/Arpaçay Reservoir .......................................154Arpa sub-basin .............................................................154Vorotan/Bargushad sub-basin ......................................155Voghji/Ohchu sub-basin ..............................................156Flood-plain marshes and fishponds in the Araks/Aras River Valley .................157Sarisu/Sari Su sub-basin ...............................................158Astarachay River Basin .................................................158Samur River Basin .......................................................159Sulak River Basin and Andis-Koisu sub-basin ..............159Terek River Basin .........................................................162Malyi Uzen/Saryozen River Basin ................................162Bolshoy Uzen/Karaozen River Basin ...........................163
ChAPtEr 5 drAINAgE BASINS of ThE BLACK SEA ..................................................................................................................165
Rezovska/Multudere River Basin ..................................167Danube River Basin .....................................................167Transboundary aquifers in the Danube Basin ...............175Reservoirs Iron Gate I and Iron Gate II .........................178Lake Neusiedl ..............................................................179Lower Danube Green Corridor and Delta Wetlands ......180Lech sub-basin .............................................................182Inn sub-basin ...............................................................182Morava and Dyje sub-basins ........................................183Floodplains of Morava-Dyje-Danube Confluence .........184Raab/Rába sub-basin ...................................................186Vah sub-basin ..............................................................189Ipel/Ipoly sub-basin .....................................................189Drava and Mura sub-basins .........................................191Drava-Danube confluence Ramsar Sites .......................198Tisza sub-basin ............................................................199Upper Tisza Valley .......................................................206Domica-Baradla Cave System ......................................207Somes/Szamos sub-basin ..............................................208Mures/Maros sub-basin ...............................................211Sava sub-basin .............................................................212
Velika Morava sub-basin ..............................................223Nisava sub-basin ..........................................................224Timok sub-basin ..........................................................226Siret sub-basin .............................................................226Prut sub-basin ..............................................................229Stanca-Costesti Reservoir .............................................231Cahul/Kagul River Basin .............................................232Yalpuh River Basin ......................................................232Cogilnik River Basin ....................................................232Dniester River Basin ....................................................234Kuchurhan sub-basin ...................................................237Dnieper River Basin ....................................................237Pripyat sub-basin .........................................................240Stokhid-Pripyat-Prostyr Rivers .....................................242Elancik River Basin ......................................................243Mius River Basin .........................................................243Siversky Donets sub-basin ...........................................244Psou River Basin ..........................................................248Chorokhi/Coruh River Basin .......................................249Machakhelisckali/Macahel sub-basin ...........................252
ChAPtEr 6 drAINAgE BASINS of ThE MEdITErrANEAN SEA ................................................................................................253
Ebro River Basin .........................................................254Rhone River Basin .......................................................254Lake Geneva/Lac Léman ..............................................258Lake Geneva/Lac Léman wetland area .........................259Lake Emosson ..............................................................260Po River Basin .............................................................260Lake Lugano ................................................................261Lake Maggiore .............................................................262Isonzo/Soča River Basin .............................................262Krka River Basin ..........................................................265Neretva River Basin .....................................................265Bileća Reservoir/Bilećko Lake ......................................270Drin River Basin ..........................................................270Lake Ohrid ..................................................................272Prespa Lakes ................................................................273
Prespa Park Wetlands ...................................................275Lake Skadar/Shkoder ...................................................276Lake Skadar/Shkoder and River Buna/Bojana Ramsar Sites .............................278Aoos/Vjosa River Basin ................................................279Vardar/Axios River Basin .............................................280Lake Dojran/Doirani ...................................................281Struma/Strymonas River Basin ....................................282Mesta/Nestos River Basin ............................................286Maritsa/Evros/Meric River Basin .................................288Arda/Ardas sub-basin ..................................................291Tundzha/Tundja/Tunca sub-basin ...............................292Transboundary aquifers which are not connected to surface waters assessed in the Mediterranean Sea drainage basin ...................................................293

SECond ASSESSmEnt | XI
ChAPtEr 7: drAINAgE BASINS of ThE NorTh SEA ANd EASTErN ATLANTIC ........................................................................299
Glama/Glomma River Basin ..............................................301Klarälven River Basin ..........................................................303Wiedau/Vidaa River Basin .................................................304Elbe River Basin District ....................................................306Krkonoše/Karkonosze subalpine peatbogs .......................310Ems River Basin ...................................................................311Wadden Sea ...........................................................................313Rhine River Basin District .................................................315Lake Constance ....................................................................318Upper Rhine/Oberrhein Ramsar Site ...............................319Moselle sub-basin and Saar sub-basin ..............................320Meuse River Basin District .................................................323Scheldt River Basin District ...............................................326Bidasoa River Basin .............................................................331
Bidasoa estuary/Txingudi ...................................................332Miño/Minho River Basin ...................................................333Frieira Reservoir ...................................................................335Lima/Limia River Basin ......................................................335Douro River Basin ...............................................................336Tejo/Tajo River Basin ..........................................................338Cedillo Reservoir .................................................................340Guadiana River Basin ..........................................................340Erne River Basin .................................................................342Lough Melvin ......................................................................344Foyle River Basin .................................................................344Lough Foyle wetland area in the Foyle Basin ..................345Neagh Bann River Basin District ......................................346
ChAPtEr 8: drAINAgE BASINS of ThE BALTIC SEA .................................................................................................................347
Torne River Basin ........................................................348Kemijoki River Basin ...................................................350Oulujoki River Basin ...................................................351Jänisjoki River Basin ...................................................352Kiteenjoki and Tohmajoki River Basins ........................355Hiitolanjoki River Basin ..............................................356Vuoksi River Basin .......................................................357Lake Pyhäjärvi .............................................................360Lake Saimaa .................................................................360Juustilanjoki River Basin ..............................................360Lake Nuijamaanjärvi ...................................................361Rakkolanjoki sub-basin of the Hounijoki River Basin ..................................362Urpalanjoki Basin ........................................................363Saimaa Canal, including the Soskuanjoki River ...........364Tervajoki, Vilajoki, Kaltonjoki (Santajoki) and Vaalimaanjoki River Basins.....................................364Narva River Basin ........................................................365Lake Peipsi/Chudskoe and surrounding lowlands .............................................369
Salaca River Basin ........................................................370Gauja/Koiva River Basin ....................................................370North Livonian Bogs ..........................................................371Daugava River Basin ...........................................................375Lake Drisvyaty/Druksiai .....................................................379Lielupe River Basin ..............................................................379Venta, Barta, Sventoji River Basins ...................................381Neman River Basin ..............................................................384Lake Galadus/Galadusys .....................................................388Pregel River Basin ................................................................388Prohladnaja/Świeza River Basin ........................................390Vistula River Basin ..............................................................391Bug sub-basin .......................................................................393Dunajec and Poprad sub-basins ........................................395Wetlands along the Bug ......................................................396Oder/Odra River Basin .......................................................398Transboundary aquifers which are not connected to surface waters assessed in the Baltic Sea drainage basin .................................................................402
AnnEx i Brief description of the water resources management frameworks in the countries ......................................................404
AnnEx ii Existing agreements related to the management of transboundary waters ..................................................................413
AnnEx iii Status of ratification of selected international agreements relevant to transboundary water management ................424
ALPHABetICAL INDeX oF RIVeRS, LAKeS, GRoUNDWAteRS AND RAMSAR SIteS ..................................................................426
XII | SECond ASSESSmEnt
liSt oF Country CodES Afghanistan AF
Albania AL
Andorra AD
Armenia AM
Austria AT
Azerbaijan AZ
Belarus BY
Belgium BE
Bosnia and Hesegovina BA
Bulgaria BG
China CN
Croatia HR
Cyprus CY
Czech Republic CZ
Denmark DK
Estonia EE
Finland FI
France FR
Georgia GE
Germany DE
Greece GR
Hungary HU
Iceland IS
Islamic Republic of Iran IR
Ireland IE
Italy IT
Kazakhstan KZ
Democratic People’s Republic of Korea KP
Kyrgyzstan KG
Latvia LV
Liechtenstein LI
Lithuania LT
Luxembourg LU
Malta MT
Monaco MC
Mongolia MN
Montenegro ME
Netherlands NL
Norway NO
Poland PL
Portugal PT
Republic of Moldova MD
Romania RO
Russian Federation RU
San Marino SM
Serbia RS
Slovakia SK
Slovenia SI
Spain ES
Sweden SE
Switzerland CH
Tajikistan TJ
The former Yugoslav Republic of Macedonia MK
Turkey TR
Turkmenistan TM
Ukraine UA
United Kingdom GB
Uzbekistan UZ
ACronymS Al Aluminium
As Arsenic
a.s.l. Above sea level
BOD Biochemical oxygen demand
BOD5 Biochemical oxygen demand for 5 days
CaCl2 Calcium chloride
CAREC Regional Environmental Centre for Central Asia
Cd Cadmium
CIPAIS International Commission for the Protection of Italian Swiss Waters
CIPEL International Commission for the Protection of Lake Geneva
Cl- Chloride
Co Cobalt
COD Chemical oxygen demand
CODCr
Chemical oxygen demand, using potassium dichromate (K
2Cr
2O
7) as oxidizing agent
CODMn
Chemical oxygen demand, using potassium permanganate (KMnO
4) as oxidizing agent
Cr Chromium
Cu Copper
EC-IFAS Executive Committee of the International Fund for Saving the Aral Sea
EEA European Environment Agency
EECCA Eastern Europe, the Caucasus and Central Asia
EIA Environmental Impact Assessment
ENVSEC Environment and Security Initiative
EU European Union
FASRB Framework Agreement on the Sava River Basin
Fe Iron
GDP Gross Domestic Product
GEF Global Environment Facility
GIS Geographical Information System
GRDC Global Runoff Data Centre (in Koblenz, Germany)
GWh Gigawatt-hour
GWP-Med Global Water Partnership Mediterranean
HMWB Heavily Modified Water Body
ICPDR International Commission for the Protection of the Danube River
ICPER International Commission for the Protection of the Elbe River
ICPMS International Commissions for the Protection of the Moselle and the Saar
ICPO International Commission for the Protection of the Oder
ICPR International Commission for the Protection of the Rhine
ICWC Inter-State Commission for Water Coordination
SECond ASSESSmEnt | XIII
IFAS International Fund for Saving the Aral Sea
Interreg Community initiative which aims to stimulate interregional cooperation in the EU between 2000-06
IPCC Intergovernmental Panel on Climate Change
IPPC Integrated Pollution Prevention and Control
IRBD International River Basin District according to the definition of the WFD
ISRBC International Sava River Basin Commission
ISWC Interstate Water Commission
IUCN International Union for Conservation of Nature
IWRM Integrated Water Resources Management
KMnO4 Potassium permanganate
MAC Maximum allowable concentration (in case of oxygen: minimum required concentration)
Mb Molybdenum
Mn Manganese
N Nitrogen
Ntot
Total nitrogen
NATO North Atlantic Treaty Organisation
NGO Non-governmental organization
NH4
+ Ammonium
Ni Nickel
NO3
- Nitrate
NO2
- Nitrite
N/A Not available
Qav Average water discharge
Qmax
Maximum water discharge
Qmin
Minimum water discharge
P Phosphorus
PAH Polycyclic aromatic hydrocarbons
Pb Lead
PCB Polychlorinated biphenyls
p.e. Population equivalent
PO4 Phosphate
ppm Parts per million
Ptot
Total phosphorus
RBD River Basin District according to the definition of the WFD
RBM River Basin Management
RBMP River Basin Management Plan
SAC Special Areas of Conservation
SEE South-Eastern Europe
SO2 Sulfur dioxide
SO4
2- Sulfate
SPA Special Protected Area
TACIS Technical Assistance to the Commonwealth of Independent States
TDS Total dissolved solids
TNMN TransNational Monitoring Network of the ICPDR
TOC Total organic carbon
UNDP United Nations Development Programme
UNECE United Nations Economic Commission for Europe
UNEP United Nations Environment Programme
UNESCO United Nations Educational, Scientific and Cultural Organization
UNFCCC United Nations Framework Convention on Climate Change
USAID United States Agency for International Development
USSR Union of Soviet Socialist Republics
UWWTD Urban Wastewater Treatment Directive, Council Directive 91/271/EEC of 21 May 1991 concerning urban wastewater treatment
UWWTP Urban wastewater treatment plant
V Vanadium
WFD Water Framework Directive, i.e. Directive 2000/60/EC of the European Parliament and of the Council of 23 October 2000 establishing a framework for Community action in the field of water policy
WHO World Health Organization
WWF World Wildlife Fund
Zn Zinc
~ Approximately
unitS oF mEASurE a Year
g Gram
h Hour
ha Hectare
km2 Square kilometre
kg Kilogram
km Kilometre
kt Kilotonne
l Litre
m Metre
m2 Square metre
m3 Cubic metre
mg Milligram
ml Millilitre
mS Milli Siemens
MW Megawatt
s Second
t Metric tonne
µg Microgram
°C Degree Celsius


SECond ASSESSmEnt | 1
pArt i OvErviEw
1
2 | PArt i
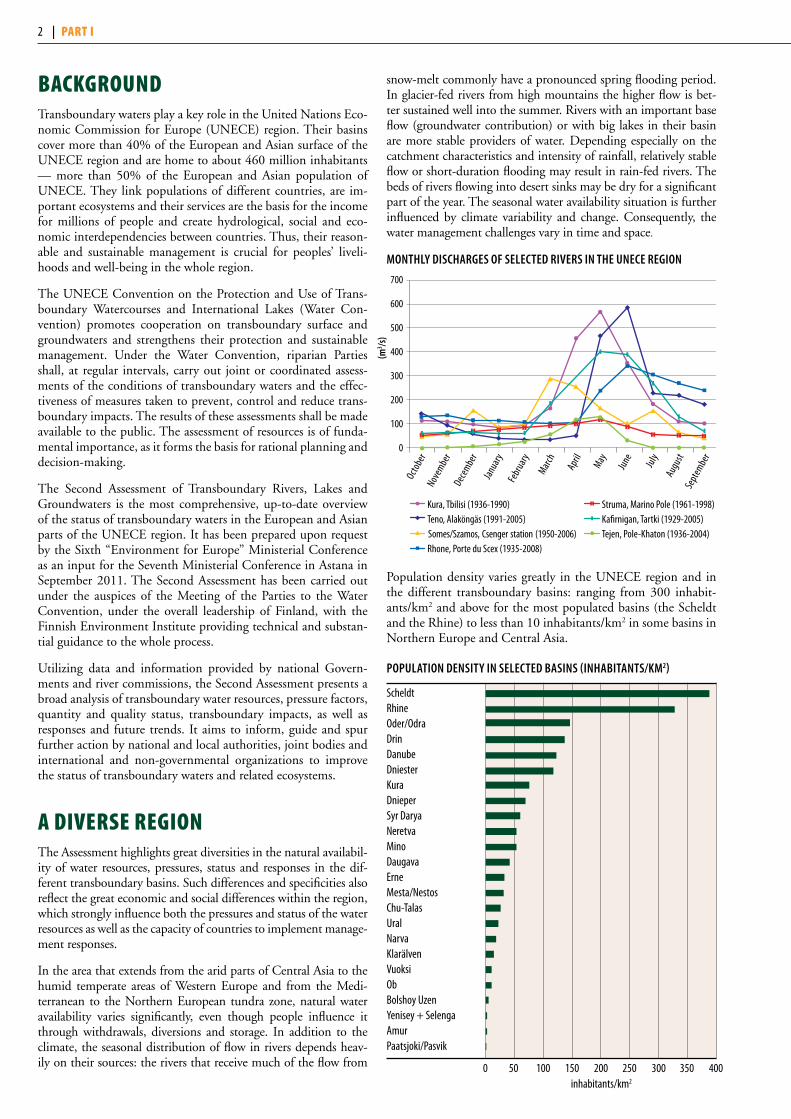
bACkgroundTransboundary waters play a key role in the United Nations Eco-nomic Commission for Europe (UNECE) region. Their basins cover more than 40% of the European and Asian surface of the UNECE region and are home to about 460 million inhabitants — more than 50% of the European and Asian population of UNECE. They link populations of different countries, are im-portant ecosystems and their services are the basis for the income for millions of people and create hydrological, social and eco-nomic interdependencies between countries. Thus, their reason-able and sustainable management is crucial for peoples’ liveli-hoods and well-being in the whole region.
The UNECE Convention on the Protection and Use of Trans-boundary Watercourses and International Lakes (Water Con-vention) promotes cooperation on transboundary surface and groundwaters and strengthens their protection and sustainable management. Under the Water Convention, riparian Parties shall, at regular intervals, carry out joint or coordinated assess-ments of the conditions of transboundary waters and the effec-tiveness of measures taken to prevent, control and reduce trans-boundary impacts. The results of these assessments shall be made available to the public. The assessment of resources is of funda-mental importance, as it forms the basis for rational planning and decision-making.
The Second Assessment of Transboundary Rivers, Lakes and Groundwaters is the most comprehensive, up-to-date overview of the status of transboundary waters in the European and Asian parts of the UNECE region. It has been prepared upon request by the Sixth “Environment for Europe” Ministerial Conference as an input for the Seventh Ministerial Conference in Astana in September 2011. The Second Assessment has been carried out under the auspices of the Meeting of the Parties to the Water Convention, under the overall leadership of Finland, with the Finnish Environment Institute providing technical and substan-tial guidance to the whole process.
Utilizing data and information provided by national Govern-ments and river commissions, the Second Assessment presents a broad analysis of transboundary water resources, pressure factors, quantity and quality status, transboundary impacts, as well as responses and future trends. It aims to inform, guide and spur further action by national and local authorities, joint bodies and international and non-governmental organizations to improve the status of transboundary waters and related ecosystems.
A diVErSE rEgionThe Assessment highlights great diversities in the natural availabil-ity of water resources, pressures, status and responses in the dif-ferent transboundary basins. Such differences and specificities also reflect the great economic and social differences within the region, which strongly influence both the pressures and status of the water resources as well as the capacity of countries to implement manage-ment responses.
In the area that extends from the arid parts of Central Asia to the humid temperate areas of Western Europe and from the Medi-terranean to the Northern European tundra zone, natural water availability varies significantly, even though people influence it through withdrawals, diversions and storage. In addition to the climate, the seasonal distribution of flow in rivers depends heav-ily on their sources: the rivers that receive much of the flow from
snow-melt commonly have a pronounced spring flooding period. In glacier-fed rivers from high mountains the higher flow is bet-ter sustained well into the summer. Rivers with an important base flow (groundwater contribution) or with big lakes in their basin are more stable providers of water. Depending especially on the catchment characteristics and intensity of rainfall, relatively stable flow or short-duration flooding may result in rain-fed rivers. The beds of rivers flowing into desert sinks may be dry for a significant part of the year. The seasonal water availability situation is further influenced by climate variability and change. Consequently, the water management challenges vary in time and space.
MoNtHLY DISCHARGeS oF SeLeCteD RIVeRS IN tHe UNeCe ReGIoN
Population density varies greatly in the UNECE region and in the different transboundary basins: ranging from 300 inhabit-ants/km2 and above for the most populated basins (the Scheldt and the Rhine) to less than 10 inhabitants/km2 in some basins in Northern Europe and Central Asia.
PoPULAtIoN DeNSItY IN SeLeCteD BASINS (INHABItANtS/KM2)
700
600
500
400
300
200
100
0
(m3 /s
)
Octob
erNov
embe
rDe
cembe
rJan
uary
March
Feb
ruary
April May
June July
Augu
stSe
ptem
ber
ScheldtRhineOder/OdraDrinDanubeDniesterKura DnieperSyr DaryaNeretvaMinoDaugavaErneMesta/NestosChu-TalasUralNarvaKlarälvenVuoksiObBolshoy UzenYenisey + SelengaAmurPaatsjoki/Pasvik
0 50 100 150 200 250 300 350 400inhabitants/km2
Kura, Tbilisi (1936-1990) Teno, Alaköngäs (1991-2005) Somes/Szamos, Csenger station (1950-2006) Rhone, Porte du Scex (1935-2008)
Struma, Marino Pole (1961-1998) Kafirnigan, Tartki (1929-2005) Tejen, Pole-Khaton (1936-2004)

OvErviEw | 3
Moreover, the diversity of demographic developments is reflected in the evolution of population trends over time. Between 1960 and 2010, several subregions have experienced considerably high growth rates: Central Asia, with a more than 145% population increase; the Caucasus, with a 65% increase; and South-Eastern Europe, showing a 75% increase. On the other hand, for most countries in Western and Central Europe, there is a trend to-wards stable or even declining populations.
The region is also highly diverse with respect to patterns of eco-nomic development. Some of its countries are among the richest in the world, while others — particularly those whose economies have been in transition since the 1990s — are still catching up. Per capita levels of gross domestic product (GDP) vary widely. While for the European Union (EU), the average GDP per capita at prices and purchasing power parities is about 30,000 USD, the average for countries in Eastern Europe, the Caucasus and Cen-tral Asia and the Balkans is around a third of that, and for several countries in the Caucasus and Central Asia the GDP per capita can be less than a sixth of this figure. Countries with transition economies experienced a major collapse in economic activity in the early 1990s. By 2010, two decades after the transition period began, some of the countries in Eastern Europe, the Caucasus and Central Asia as well as South-Eastern Europe have increased their per capita incomes approximately 50% above their 1990 levels. However, the majority has only returned to something similar to their 1990 level, while a few economies (Georgia, the Republic of Moldova, Serbia, Tajikistan, and Ukraine) remain 30 per cent or more below that level.
Finally, a factor that has a strong impact on the social and eco-nomic situations, on water and the environment, and, above all, on transboundary water cooperation, is the significant number of past — and in some cases still frozen — political conflicts, including in the Balkans, the Republic of Moldova and the Cau-casus, and to a lesser degree in Central Asia.
AdVAnCEmEnt oF trAnSboundAry CooPErAtionCompared with other regions in the world, the UNECE region is the most advanced in terms of cooperation on transboundary waters. Almost all concerned countries have taken measures to establish transboundary water cooperation on their shared wa-ters, have entered into bilateral and multilateral agreements and have established joint bodies to facilitate transboundary water cooperation. Much of this progress has been facilitated by the UNECE Water Convention.
However, the level and effectiveness of cooperation varies in the region. Transboundary water agreements range from specific technical ones only covering a part of a basin — e.g. boundary waters — to broad agreements covering the whole river basin and addressing a wide spectrum of water management and environ-mental protection issues.
Also, the competences of joint bodies vary: with time and trust they tend to expand to include new areas and an increasing en-vironmental mandate, so as to enable joint bodies and riparian States to implement the basin approach and the principles of in-tegrated water resources management (IWRM).
Despite the overall progress, on some major transboundary rivers there is still a need for an agreement covering the whole basin, and for a joint body to facilitate basin-wide cooperation. In other cases, the level of cooperation is weak and not suited to respond to the complex challenge of balancing competing uses, including environmental protection needs.
Therefore, the role of the Water Convention to support UN-ECE countries in their efforts to improve transboundary coop-eration, progress towards the conclusion of agreements, establish or strengthen joint bodies and address emerging issues of trans-boundary cooperation is important. That role will acquire an ad-ditional dimension with the entry into force of the amendments opening the Convention to countries outside the UNECE re-gion, thereby facilitating also the cooperation with non-UNECE countries sharing waters with UNECE countries.

4 | PArt i
ClimAtE ChAngERecognizing the threats from climate change, the Second Assess-ment seeks to provide a picture of the predicted impacts on trans-boundary water resources, as well as the measures planned or in place to adapt to climate change.
Climate change impacts will vary considerably across the region and even from basin to basin. Yearly and seasonal water avail-ability is projected to change significantly in the coming decades, and increased precipitation intensity and variability will increase the risks of floods and droughts. Mountainous areas will face glacier retreat and reduced snow cover. In Southern Europe, the Caucasus and Central Asia, climate change is projected to lead to high temperatures, droughts and water scarcity. In Central and Eastern Europe, summer precipitation is projected to decrease, causing higher water stress. In Northern Europe, a general in-crease in precipitation is projected.
Through the related changes in water resources, these impacts will have far-reaching effects on society. Economic sectors which are projected to be most affected are agriculture (increased de-mand for irrigation), forestry, energy (reduced hydropower po-tential and cooling water availability), recreation (water-linked tourism), fisheries and navigation. Serious impacts on biodiver-sity also loom.
UNECE countries are at different stages of developing and im-plementing adaptation strategies. But while efforts to plan and evaluate the options for adaptation at the national level are being carried out in most of the countries, such efforts are ongoing only in a few transboundary basins. Downscaling impacts of climate changes at the basin level is a common challenge.
ECologiCAl And biodiVErSity iSSuESA major innovation of the Second Assessment is the specific at-tention devoted to ecological and biodiversity issues, through the assessment of 25 Ramsar Sites1 and other wetlands of trans-boundary importance.
In spite of important progress made in recent decades in their protection and management, wetlands continue to be among the world’s most threatened ecosystems, mainly due to ongoing drainage, conversion, pollution, and over-exploitation of their resources. Instead, wetlands should be recognized as a natural infrastructure essential for the sustainable provision of water re-sources and related ecosystem services. Using a wetland wisely means to maintain its ecological character (i.e., the combination of the ecosystem processes, components and services) through the implementation of the ecosystem approach. In this respect, transboundary cooperation is crucial where functional units of wetland ecosystems stretch across national (or administrative) borders.
The selected sites in the Second Assessment, which have been assessed by the Ramsar Convention secretariat in close coopera-tion with experts on these sites, illustrate different degrees of transboundary cooperation in managing wetlands. In some cases, two or even three bordering countries have agreed to cooperate in the management of their shared wetland. Some Ramsar Sites included in the assessment have been declared by one country but extend into the territory of another country where they are not yet protected. Other Ramsar Sites have been included which have been designated separately on each side of the border, but miss a joint official designation as a transboundary wetland to enable joint management of the ecosystem.
1 A site included on the List of Wetlands of International Importance under the Convention on Wetlands of International Importance, especially as Waterfowl Habitat (Ramsar Convention).
OvErviEw | 5
mAin SubrEgionAl FindingS To reflect the great diversities of the UNECE region, the Second Assessment has a strong subregional focus and highlights characteristics and specificities of five UNECE subregions: Western and Central Europe; South-Eastern Europe; Eastern and Northern Europe; the Caucasus; and Central Asia.
These, partly overlapping, subregions were defined for the purposes of the Assessment. The criteria for their delineation are not based on political boundaries but rather with a view to taking into account similarities of water management issues in the transbound-ary basins. Yet, even within these subregions big differences are observed.
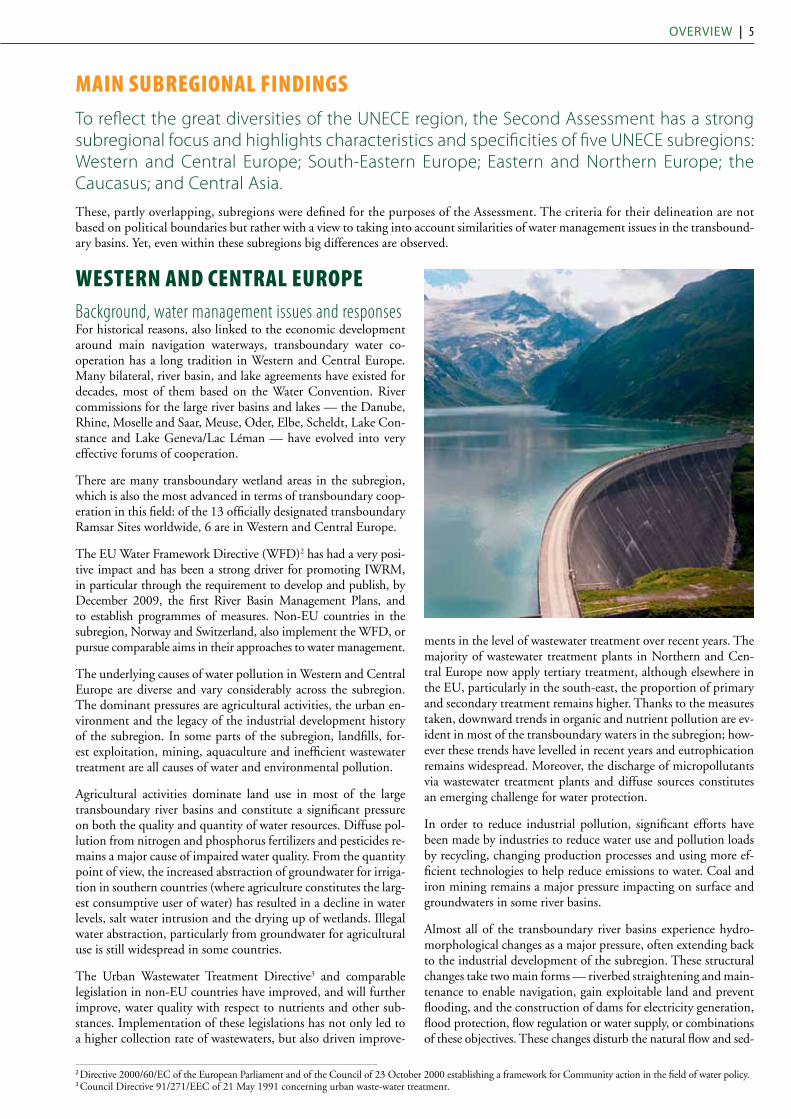
wEStErn And CEntrAl EuroPEBackground, water management issues and responsesFor historical reasons, also linked to the economic development around main navigation waterways, transboundary water co-operation has a long tradition in Western and Central Europe. Many bilateral, river basin, and lake agreements have existed for decades, most of them based on the Water Convention. River commissions for the large river basins and lakes — the Danube, Rhine, Moselle and Saar, Meuse, Oder, Elbe, Scheldt, Lake Con-stance and Lake Geneva/Lac Léman — have evolved into very effective forums of cooperation.
There are many transboundary wetland areas in the subregion, which is also the most advanced in terms of transboundary coop-eration in this field: of the 13 officially designated transboundary Ramsar Sites worldwide, 6 are in Western and Central Europe.
The EU Water Framework Directive (WFD)2 has had a very posi-tive impact and has been a strong driver for promoting IWRM, in particular through the requirement to develop and publish, by December 2009, the first River Basin Management Plans, and to establish programmes of measures. Non-EU countries in the subregion, Norway and Switzerland, also implement the WFD, or pursue comparable aims in their approaches to water management.
The underlying causes of water pollution in Western and Central Europe are diverse and vary considerably across the subregion. The dominant pressures are agricultural activities, the urban en-vironment and the legacy of the industrial development history of the subregion. In some parts of the subregion, landfills, for-est exploitation, mining, aquaculture and inefficient wastewater treatment are all causes of water and environmental pollution.
Agricultural activities dominate land use in most of the large transboundary river basins and constitute a significant pressure on both the quality and quantity of water resources. Diffuse pol-lution from nitrogen and phosphorus fertilizers and pesticides re-mains a major cause of impaired water quality. From the quantity point of view, the increased abstraction of groundwater for irriga-tion in southern countries (where agriculture constitutes the larg-est consumptive user of water) has resulted in a decline in water levels, salt water intrusion and the drying up of wetlands. Illegal water abstraction, particularly from groundwater for agricultural use is still widespread in some countries.
The Urban Wastewater Treatment Directive3 and comparable legislation in non-EU countries have improved, and will further improve, water quality with respect to nutrients and other sub-stances. Implementation of these legislations has not only led to a higher collection rate of wastewaters, but also driven improve-
ments in the level of wastewater treatment over recent years. The majority of wastewater treatment plants in Northern and Cen-tral Europe now apply tertiary treatment, although elsewhere in the EU, particularly in the south-east, the proportion of primary and secondary treatment remains higher. Thanks to the measures taken, downward trends in organic and nutrient pollution are ev-ident in most of the transboundary waters in the subregion; how-ever these trends have levelled in recent years and eutrophication remains widespread. Moreover, the discharge of micropollutants via wastewater treatment plants and diffuse sources constitutes an emerging challenge for water protection.
In order to reduce industrial pollution, significant efforts have been made by industries to reduce water use and pollution loads by recycling, changing production processes and using more ef-ficient technologies to help reduce emissions to water. Coal and iron mining remains a major pressure impacting on surface and groundwaters in some river basins.
Almost all of the transboundary river basins experience hydro-morphological changes as a major pressure, often extending back to the industrial development of the subregion. These structural changes take two main forms — riverbed straightening and main-tenance to enable navigation, gain exploitable land and prevent flooding, and the construction of dams for electricity generation, flood protection, flow regulation or water supply, or combinations of these objectives. These changes disturb the natural flow and sed-
2 Directive 2000/60/EC of the European Parliament and of the Council of 23 October 2000 establishing a framework for Community action in the field of water policy.3 Council Directive 91/271/EEC of 21 May 1991 concerning urban waste-water treatment.

6 | PArt i
tRANSBoUNDARY SURFACe WAteRS IN WeSteRN AND CeNtRAL eURoPe
iment regime of rivers, hinder the achievement of good ecological status objectives, destroy habitats for fish and other water organ-isms and prevent fish migration. As a result, many rivers have been disconnected from their flood-plains and the hydrological regimes of many wetland systems have been heavily altered in the past. An important cause of hydromorphological changes is the hydropower sector. In 2008, hydropower generated 16% of Europe’s electricity, and there are currently more than 7,000 large dams in Europe and a number of large reservoirs. Hydropower has been a particularly dominant aspect of industrial development in the northern and Alpine countries. To reduce the impacts of hydromorphological changes, numerous restoration projects are under way aiming to restore habitats, river continuity (e.g., to facilitate fish migration) and biodiversity. The water retention and flood protection func-tion of flood-plains is also increasingly recognized.
Water availability varies and populations are unevenly distributed through the subregion and within countries. Water scarcity occurs widely in the southern parts of the subregion, where demand is often met by water transfers from other river basins, water reuse and desalination. Also in the rest of the subregion, large areas are affected by water scarcity and droughts: a comparison of the im-pacts of droughts in the EU between 1976–1990 and 1991–2006 shows a doubling of both the area and the population affected.4
Climate change is projected to lead to significant changes in year-ly and seasonal water availability. Water availability is predicted to increase generally in the north, whereas southern areas, which already suffer most from water stress, are likely to be at risk of further reductions in water availability, with increasing frequency and intensity of droughts.5 Rising temperatures are expected to change the seasonal flow distribution of rivers by pushing the
4 Source: The European Environment: State and Outlook 2010. European Environment Agency.5 Source: Impacts of Europe’s changing climate — 2008 indicator-based assessment. EEA-European Commission Joint Research Centre-World Health Organization (WHO). 2008.
100 200 300 400 km0
Map produced by ZOÏ Environment Network, July 2011
!
WFD groundwater body (GWB)/set of GWBs
GWB (partially) overlapping with aquifer (Partially) overlapping aquifers
Aquifer
Exact location/extent of aquifer uncertain
OderElbe
Wiedau
Ems
Vechte
Yser
RhineMeuse
Scheldt
Erne
Foyle
Fane
Bann
MinoLimaDuoro
Tagus
Guadiana
Ebro
Rhone
Po
Isonzo
Lech Inn
MoravaOlse
Raba
Saar
Moselle
Bidasoa
Neisse
GlasgowEdinburgh
LiverpoolManchester
Birmingham
Belfast
CorkCardiff London
Paris
Brussels
Amsterdam
Dublin
Le Havre
Lille
ToursNantes
Bordeaux
ToulouseMontpellier Marseille
Nice
LyonGeneva
BernZurich
Strasbourg MunichSalzburg
Innsbruck
Stuttgart
NurembergFrankfurtLuxembourg
Antwerp
Rotterdam
Essen
Cologne
Hamburg
Malmo
Arhus
BremenHannover
Leipzig Dresden
GdanskKaliningrad
BerlinWarsaw
Copenhagen
PoznanSzczecin
Lodz
Wroclaw
Katowice
Krakow
Brno
Linz
Graz
Vienna
Prague
Bratislava
Budapest
LjubljanaZagreb
BanjaLuka
Split
RijekaVeniceMilan
Turin
GenovaBologna
Florence
Naples
Bari
Palermo
Catania
RomeAjaccio
Cagliari
TunisAlgiers
Palma de Mallorca
Porto
Seville
Malaga
Valencia
Barcelone
Zaragoza
Bilbao
Madrid
Lisbon
I R E L A N D
P O R T U G A L
A U S T R I A
SLOVENIA C R O A T I A
BOSNIAAND HERZ.
D E N M A R K
C Z E C H R E P.SLOVAKIA
H U N G A R Y
F R A N C E
G E R M A N Y
SWITZERLAND
BELGIUM
NETHERLANDS
I T A L Y
S P A I N
P O L A N D
RUSSIA
U N I T E DK I N G D O M
T U N I S I A
SWEDEN
A L G E R I A
100 200 300 400 km0
Map produced by ZOÏ Environment Network, July 2011
OvErviEw | 7
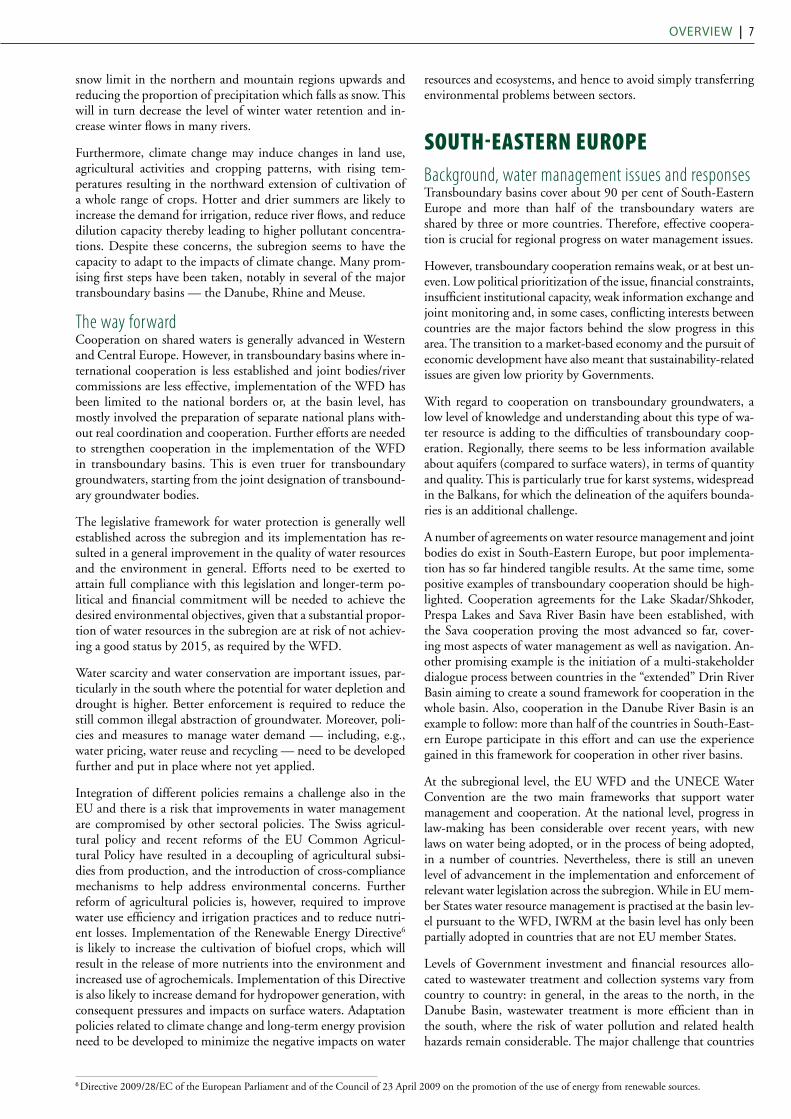
snow limit in the northern and mountain regions upwards and reducing the proportion of precipitation which falls as snow. This will in turn decrease the level of winter water retention and in-crease winter flows in many rivers.
Furthermore, climate change may induce changes in land use, agricultural activities and cropping patterns, with rising tem-peratures resulting in the northward extension of cultivation of a whole range of crops. Hotter and drier summers are likely to increase the demand for irrigation, reduce river flows, and reduce dilution capacity thereby leading to higher pollutant concentra-tions. Despite these concerns, the subregion seems to have the capacity to adapt to the impacts of climate change. Many prom-ising first steps have been taken, notably in several of the major transboundary basins — the Danube, Rhine and Meuse.
The way forwardCooperation on shared waters is generally advanced in Western and Central Europe. However, in transboundary basins where in-ternational cooperation is less established and joint bodies/river commissions are less effective, implementation of the WFD has been limited to the national borders or, at the basin level, has mostly involved the preparation of separate national plans with-out real coordination and cooperation. Further efforts are needed to strengthen cooperation in the implementation of the WFD in transboundary basins. This is even truer for transboundary groundwaters, starting from the joint designation of transbound-ary groundwater bodies.
The legislative framework for water protection is generally well established across the subregion and its implementation has re-sulted in a general improvement in the quality of water resources and the environment in general. Efforts need to be exerted to attain full compliance with this legislation and longer-term po-litical and financial commitment will be needed to achieve the desired environmental objectives, given that a substantial propor-tion of water resources in the subregion are at risk of not achiev-ing a good status by 2015, as required by the WFD.
Water scarcity and water conservation are important issues, par-ticularly in the south where the potential for water depletion and drought is higher. Better enforcement is required to reduce the still common illegal abstraction of groundwater. Moreover, poli-cies and measures to manage water demand — including, e.g., water pricing, water reuse and recycling — need to be developed further and put in place where not yet applied.
Integration of different policies remains a challenge also in the EU and there is a risk that improvements in water management are compromised by other sectoral policies. The Swiss agricul-tural policy and recent reforms of the EU Common Agricul-tural Policy have resulted in a decoupling of agricultural subsi-dies from production, and the introduction of cross-compliance mechanisms to help address environmental concerns. Further reform of agricultural policies is, however, required to improve water use efficiency and irrigation practices and to reduce nutri-ent losses. Implementation of the Renewable Energy Directive6
is likely to increase the cultivation of biofuel crops, which will result in the release of more nutrients into the environment and increased use of agrochemicals. Implementation of this Directive is also likely to increase demand for hydropower generation, with consequent pressures and impacts on surface waters. Adaptation policies related to climate change and long-term energy provision need to be developed to minimize the negative impacts on water
resources and ecosystems, and hence to avoid simply transferring environmental problems between sectors.
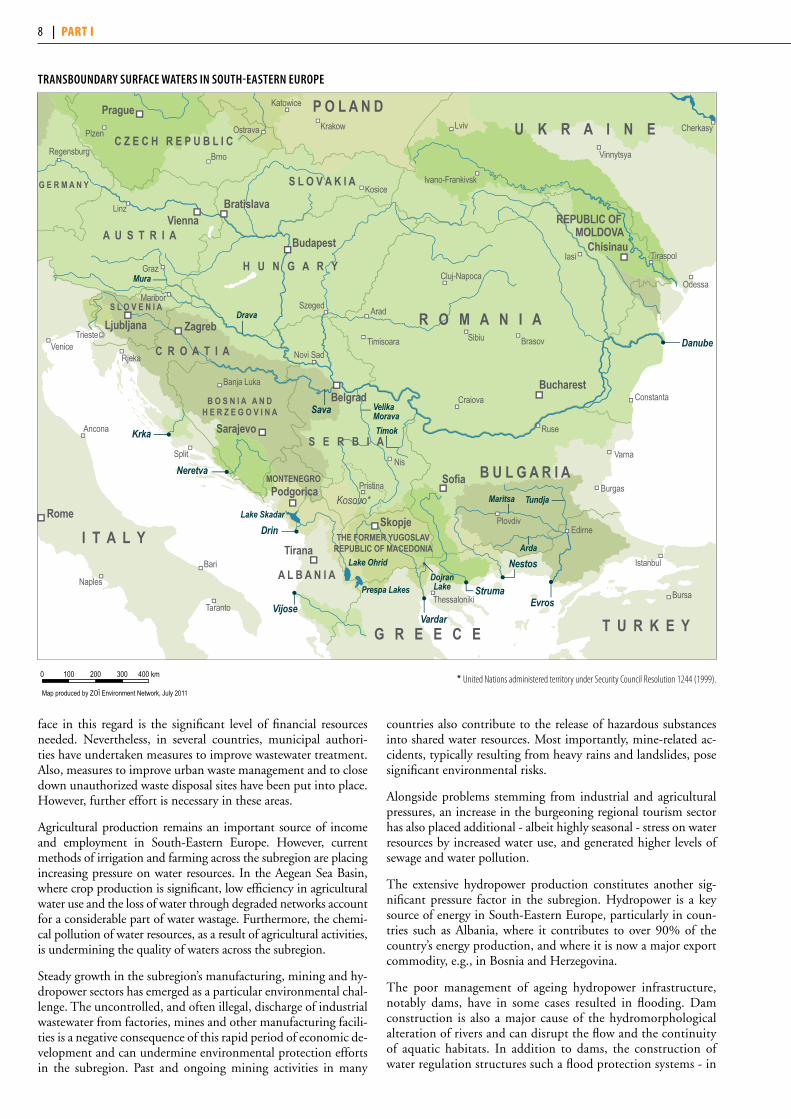
South-EAStErn EuroPEBackground, water management issues and responsesTransboundary basins cover about 90 per cent of South-Eastern Europe and more than half of the transboundary waters are shared by three or more countries. Therefore, effective coopera-tion is crucial for regional progress on water management issues.
However, transboundary cooperation remains weak, or at best un-even. Low political prioritization of the issue, financial constraints, insufficient institutional capacity, weak information exchange and joint monitoring and, in some cases, conflicting interests between countries are the major factors behind the slow progress in this area. The transition to a market-based economy and the pursuit of economic development have also meant that sustainability-related issues are given low priority by Governments.
With regard to cooperation on transboundary groundwaters, a low level of knowledge and understanding about this type of wa-ter resource is adding to the difficulties of transboundary coop-eration. Regionally, there seems to be less information available about aquifers (compared to surface waters), in terms of quantity and quality. This is particularly true for karst systems, widespread in the Balkans, for which the delineation of the aquifers bounda-ries is an additional challenge.
A number of agreements on water resource management and joint bodies do exist in South-Eastern Europe, but poor implementa-tion has so far hindered tangible results. At the same time, some positive examples of transboundary cooperation should be high-lighted. Cooperation agreements for the Lake Skadar/Shkoder, Prespa Lakes and Sava River Basin have been established, with the Sava cooperation proving the most advanced so far, cover-ing most aspects of water management as well as navigation. An-other promising example is the initiation of a multi-stakeholder dialogue process between countries in the “extended” Drin River Basin aiming to create a sound framework for cooperation in the whole basin. Also, cooperation in the Danube River Basin is an example to follow: more than half of the countries in South-East-ern Europe participate in this effort and can use the experience gained in this framework for cooperation in other river basins.
At the subregional level, the EU WFD and the UNECE Water Convention are the two main frameworks that support water management and cooperation. At the national level, progress in law-making has been considerable over recent years, with new laws on water being adopted, or in the process of being adopted, in a number of countries. Nevertheless, there is still an uneven level of advancement in the implementation and enforcement of relevant water legislation across the subregion. While in EU mem-ber States water resource management is practised at the basin lev-el pursuant to the WFD, IWRM at the basin level has only been partially adopted in countries that are not EU member States.
Levels of Government investment and financial resources allo-cated to wastewater treatment and collection systems vary from country to country: in general, in the areas to the north, in the Danube Basin, wastewater treatment is more efficient than in the south, where the risk of water pollution and related health hazards remain considerable. The major challenge that countries
6 Directive 2009/28/EC of the European Parliament and of the Council of 23 April 2009 on the promotion of the use of energy from renewable sources.
8 | PArt i
face in this regard is the significant level of financial resources needed. Nevertheless, in several countries, municipal authori-ties have undertaken measures to improve wastewater treatment. Also, measures to improve urban waste management and to close down unauthorized waste disposal sites have been put into place. However, further effort is necessary in these areas.
Agricultural production remains an important source of income and employment in South-Eastern Europe. However, current methods of irrigation and farming across the subregion are placing increasing pressure on water resources. In the Aegean Sea Basin, where crop production is significant, low efficiency in agricultural water use and the loss of water through degraded networks account for a considerable part of water wastage. Furthermore, the chemi-cal pollution of water resources, as a result of agricultural activities, is undermining the quality of waters across the subregion.
Steady growth in the subregion’s manufacturing, mining and hy-dropower sectors has emerged as a particular environmental chal-lenge. The uncontrolled, and often illegal, discharge of industrial wastewater from factories, mines and other manufacturing facili-ties is a negative consequence of this rapid period of economic de-velopment and can undermine environmental protection efforts in the subregion. Past and ongoing mining activities in many
countries also contribute to the release of hazardous substances into shared water resources. Most importantly, mine-related ac-cidents, typically resulting from heavy rains and landslides, pose significant environmental risks.
Alongside problems stemming from industrial and agricultural pressures, an increase in the burgeoning regional tourism sector has also placed additional - albeit highly seasonal - stress on water resources by increased water use, and generated higher levels of sewage and water pollution.
The extensive hydropower production constitutes another sig-nificant pressure factor in the subregion. Hydropower is a key source of energy in South-Eastern Europe, particularly in coun-tries such as Albania, where it contributes to over 90% of the country’s energy production, and where it is now a major export commodity, e.g., in Bosnia and Herzegovina.
The poor management of ageing hydropower infrastructure, notably dams, have in some cases resulted in flooding. Dam construction is also a major cause of the hydromorphological alteration of rivers and can disrupt the flow and the continuity of aquatic habitats. In addition to dams, the construction of water regulation structures such a flood protection systems - in
Mura
Drava
Krka
Neretva
Sava VelikaMoravaTimok
Drin
VijoseVardar
Struma
NestosArda
TundjaMaritsa
Evros
Danube
Lake Ohrid
Lake Skadar
Prespa LakesDojranLake
Venice
Ancona
Naples
Bari
Taranto
Rjeka
Split
Banja Luka
Novi Sad
Szeged
Timisoara
Craiova
Sibiu
Iasi Tiraspol
OdessaCluj-Napoca
Brasov
Arad
Nis
Pristina
Thessaloniki
PlovdivEdirne
Burgas
Constanta
Varna
Ruse
Istanbul
Bursa
Trieste
Regensburg
Plzen
Linz
Graz
Maribor
Brno
Ostrava
Kosice
Lviv
Ivano-Frankivsk
Vinnytsya
Cherkasy
Katowice
KrakowPrague
Bratislava
Budapest
Vienna
Ljubljana Zagreb
Sarajevo
Rome
Podgorica
Tirana
Skopje
Sofia
Bucharest
Chisinau
Belgrad
A U S T R I A
G E R M A N Y
C Z E C H R E P U B L I C
S L O V A K I A
P O L A N DU K R A I N E
R O M A N I A
H U N G A R Y
C R O A T I A
S L O V E N I A
B O S N I A A N DH E R Z E G O V I N A
MONTENEGRO
S E R B I A
A L B A N I A
I T A L Y THE FORMER YUGOSLAVREPUBLIC OF MACEDONIA
T U R K E Y
B U L G A R I A
G R E E C E
MOLDOVAREPUBLIC OF
Kosovo*
100 200 300 400 km0
Map produced by ZOÏ Environment Network, July 2011
UN administered territory under UNSC 1244*
tRANSBoUNDARY SURFACe WAteRS IN SoUtH-eASteRN eURoPe
100 200 300 400 km0
Map produced by ZOÏ Environment Network, July 2011
!
WFD groundwater body (GWB)/set of GWBs
GWB (partially) overlapping with aquifer (Partially) overlapping aquifers
Aquifer
Exact location/extent of aquifer uncertain
United Nations administered territory under Security Council Resolution 1244 (1999).
OvErviEw | 9
combination with the abstraction of surface water and ground-water for agricultural, municipal and industrial use - have in many cases caused hydromorphological alterations with differ-ent impacts.
Finally, climate change is an important aspect to be taken into account for the management of water resources in the subre-gion. South-Eastern Europe is predicted to become increas-ingly affected by climate change in numerous ways. Indeed, the subregion is currently one of the most at risk of water scarcity in Europe. The Intergovernmental Panel on Climate Change (IPCC) has predicted decreased amounts of summer rainfall for the region and an increase in the frequency and severity of droughts and other extreme weather events. According to IPCC, 100-year floods are projected to occur less frequently in large parts of the region. At the same time, the frequency of flash floods is likely to increase in the Mediterranean because of the projected increased intensity of rainfall.
The way forwardThere is a great potential for sharing the benefits of transbound-ary waters in South-Eastern Europe. However, the current level of cooperation is not suited to support such development, to ensure long-term sustainability or to prevent possible negative transboundary impacts in most of the basins.
In order to encourage political will and trust among riparian countries in South-Eastern Europe, more cooperation between countries and open dialogue between stakeholders is needed. Enhanced cooperation in the areas of water resource monitor-ing and assessment with a harmonized approach can be an im-portant starting point. Joint fact-finding exercises fostering a common understanding of water issues, and their root causes, can also create a good basis upon which to build trust and to develop commonly agreed objectives and solutions.
Regional cooperation is currently facilitated by various initia-tives; the support from donor countries, the EU and inter-national organizations, in particular the Global Environment Facility (GEF), plays an important role (an example is the Pe-tersberg Phase II/Athens Declaration Process). While support by international actors is a important driver of change, care should be taken to ensure there is no duplication of work.
The ownership of countries is also of paramount importance. While international actors help to initiate cooperation, em-power institutions and establish coordination mechanisms, the responsibility remains with the riparian countries to secure the continuation of efforts and the sustainability of outcomes.
Development plans at the national level should balance the need for development with the need for the sustainable use of natural resources and environmental protection. Governments should take into account both upstream and downstream con-siderations factoring in, for example, the possible negative impacts on the surrounding ecosystem and evolving climatic conditions when planning new dam infrastructure and making other development plans.
The EU Accession Process has played an important role in call-ing for the integration of policies and supporting water man-agement-related investments across the subregion. The trans-position of EU legislation into national law, as an important mechanism through which to improve national legal frame-works, should be continued. Furthermore, the implementation of the transposed legislation should be strengthened.
However, as the process of approximation to the standards of the EU in recent years has attracted most of the limited human resources available in the countries, it has, in some instances, had adverse effects on transboundary cooperation.
The UNECE Water Convention has a special role to play in South-Eastern Europe, as it offers a common platform for EU and non-EU countries, including for exchange, knowledge transfer and creation of a common understanding. It is also a useful tool for assisting the implementation of EU water legisla-tion by non-EU countries. Countries that have not yet done so should consider accession to the Water Convention.
EAStErn And northErn EuroPEBackground, water management issues and responsesThe majority of the water resources in Eastern and Northern Europe are of a transboundary nature, with many countries in the subregion highly dependent on flows generated outside their boundaries. Such interconnectedness and related vulnerability emphasize the importance of good transboundary cooperation.
Most of the existing agreements for transboundary water co-operation were signed in the late 1990s or in the 2000s, a ma-jor exception being the Finnish-Russian agreement operating since 1960s. As the Water Convention has provided the basis for these agreements, most of them involve the establishment of joint bodies, which, in many cases, have seen their scope and mandate expand progressively with time and trust. The need to take into account the provisions of the WFD, the principles of IWRM and the obligations under the Water Convention has also triggered recent revisions and new agreements. However, on some major transboundary rivers - for instance the Bug, Daugava, Dnieper and Neman - there is still neither an agree-ment covering the whole basin nor an established river basin commission.
In the western part of the subregion, there are well function-ing cooperation frameworks at the basin level, whereas in the eastern part, even if in many cases the legal basis for coopera-tion has been established, transboundary institutions are less effective and the level of cooperation is lower. The International Commission for the Protection of the Danube River (ICPDR) and the Finnish-Russian Commission stand as positive models for cooperation between EU and non-EU countries.
There are great differences in the water resources management frameworks in EU countries and their Eastern neighbours. In EU countries, requirements for the status of water resources are defined through the environmental objectives of the WFD, which also sets the schedule of measures to be taken. The obli-gation to publish by December 2009 the first River Basin Man-agement Plans has been a strong driver for EU member States to strengthen water management.
In Eastern Europe — Ukraine and the Republic of Moldova stand out as examples — the water resources policy empha-sizes meeting the economic needs of the society. Even if water management continues to be influenced by the Soviet legisla-tive and institutional legacy, non-EU countries are progressively making efforts to align their legislation to EU standards and to acknowledge the importance of IWRM. But implementation in practice is limited. National institutional problems remain to be solved and little coordination and integration between national organizations involved in the management of water resources exists, for example, between the agencies managing

10 | PArt i
surface waters and groundwaters. Weak institutions and legis-lation also make the application of IWRM difficult. Another challenge is the shortage of funding for the water sector: the preparation of river basin management plans has been mostly supported by external donors, and monitoring is commonly in-adequately funded.
As most of the water bodies concerned are shared by EU and non-EU countries, specific implications for the implementa-tion of the WFD arise. EU countries are encouraged to jointly prepare River Basin Management Plans with the non-EU coun-tries with which they share waters. However, the development
of River Basin Management Plans on the basis of the WFD across the EU border is not a common practice: for the non-EU countries it entails many changes in their legislation and water management practices; and for the EU countries the risk of not respecting the deadlines of the WFD discourage a strong engagement of non-EU countries in the process. A remarkable exception is the Danube River Basin Management Plan which was jointly developed by EU and non-EU countries in the Dan-ube River Basin District.
Although an improvement of water quality has been observed over the past decade, problems persist. Discharges of non-treat-
Tuloma
Teno Näätämö
JakobselvPaatsjoki
Kemijoki
Oulujoki
OulankaTorne
Vuoksi
Narva
JänisjokiTohmajoki
Hiitolanjoki
Lake Ladoga
SalacaGauja
DaugavaVenta
BartaSventoji
NemanPregolya
ProhladnayaBug
Vistula
Lielupe
Danube
CogilnicDniester
Dnieper
Don
Vah
Ipel
Dunajec
Poprad
Tisza Mures
Somes
Siret
Elancik
SiverskyDonets
Mius
Prut
Yalpuh
Lake Yalpuh
Kahul
Lake Kahul
Yahorlyk
Pripyat
Kuchurhan
VaalimaanjokiUrpalanjoki
KaltonjokiVilajoki
TervajokiRakkolanjokiJuustilanjoki
Glama LakeVänern
KlarälvenSaint Petersburg
Helsinki
Stockholm
Oslo
Copenhagen
Bergen
Trondheim
Tromso
LuleaArkhangelsk
Murmansk
Sundsvall
Turku
Malmo
Gothenburg
Hamburg
Leipzig
Bremen
Frankfurt
Stuttgart
Munich
ZurichSalzburg
BrnoPrague
Berlin
ViennaBratislava
Warsaw
LjubljanaZagreb
BelgradeSarajevo
Milan
Genoa
Florence
Venice
BanjaLuka
Cluj-Napoca
Budapest
BucharestConstanta
OdessaTiraspolChisinau
Kiev
Minsk
Vilnius
Riga
Tallinn
Moskva
Kaliningrad
Gdansk
Wroclaw
Katowice
Krakow Lviv Donetsk
Rostov-on-Don
Luhansk
Dnipropetrowsk
Sewastopol Sochi
Batumi
Nizhny Novgorod
Kazan
Volgograd
S W E D E N
A U S T R I A
SLOVENIA
CROATIA
S E R B I A
G E O R G I ABOSNIA
AND HERZ.
U K R A I N E
D E N M A R K
CZECH REP.
SLOVAKIA
H U N G A R YR O M A N I A
REP. OFMOLDOVA
B U L G A R I A
G E R M A N Y
CH
I T A L Y
P O L A N D
E S T O N I A
L A T V I A
L I T H U A N I A
RU
B E L A R U S
N O R W A Y
F I N L A N D
R U S S I A N F E D E R A T I O N
100 200 300 400 km0
Map produced by ZOÏ Environment Network, July 2011
tRANSBoUNDARY SURFACe WAteRS IN eASteRN AND NoRtHeRN eURoPe
100 200 300 400 km0
Map produced by ZOÏ Environment Network, July 2011
!
WFD groundwater body (GWB)/set of GWBs
GWB (partially) overlapping with aquifer (Partially) overlapping aquifers
Aquifer
Exact location/extent of aquifer uncertain

OvErviEw | 11
ed or insufficiently treated wastewater, municipal and industri-al, still remains a major widespread pressure factor, in particular in the eastern part of the subregion. This is particularly critical for industrial wastewaters with hazardous substances that are not treated before being discharged into surface waters or are not pretreated before being discharged into the public sewer systems.
Apart from the lack of sufficient funding for the maintenance and upgrading of industrial and/or municipal wastewater treat-ment plants in non-EU countries, there is the need to connect more people, particularly in rural areas and small towns, to wastewater and sanitation systems.
In EU member States, the transposition of EU environmental legislation and the significant investments and infrastructure pro-jects carried out to renovate existing wastewater treatment plants and build new ones have contributed to the reduction of the pol-lution load to surface waters and have had a positive impact on water quality. Due to the magnitude of this effort, transition-al periods for compliance with the requirements of the Urban Wastewater Treatment Directive were granted to many countries that acceded to the EU in the 2004 and 2007 enlargements.
Agriculture is another pressure factor: as a significant water user it has impacts on water quantity, and through the use of pes-ticides, manure and/or nitrogen and phosphorus fertilizers it has impacts on the quality of surface waters or groundwaters. Draining of agricultural land has also intensified nutrient emis-sions from the soil into groundwaters.
Diverse industries operate in the subregion, including food-processing, pulp and paper, chemical (e.g., oil refining), metal-lurgical and metal processing industries. Compared with other sectors, industry is not a big water user due to progress in water saving, but the industry’s environmental impact depends heav-ily on the type of industry, the processes used and the efficiency
of wastewater treatment. Heavy metals and hydrocarbons from industrial wastewater discharges are a concern in a number of basins. The mining industry can be a pressure factor too, com-monly with a local impact.
Also, hydromorphological changes impact on water resources, even though the extent has not been assessed much apart from the Danube. Infrastructure for flood protection, hydropower generation and water supply cause river and habitat continuity interruptions, disconnection of adjacent wetlands/flood-plains, hydrological alterations and problems of fish migration in many river basins. A considerable number of future infrastruc-ture projects are at different stages of planning in the subregion, and further construction could aggravate hydromorphological pressures if not managed responsibly.
The above pressures also have an impact on wetlands. Addi-tional challenges for wetlands in the subregion include: the reduction of the wetland area by the construction of agricul-tural polders and fishponds (that reduce biodiversity and alter natural flow); forestry operations (e.g., drainage, clear-cutting, replacement of natural communities with monocultures); peat extraction and associated drainage; agricultural practices (e.g., transformation of naturally flooded meadows into cul-tivated lands); abandonment of traditional agricultural lands and subsequent overgrowing of previously open areas; fires (in forests, on peat-lands and grasslands). All together, these pro-cesses lead to degradation of valuable wetland biotopes and the subsequent loss of biodiversity and certain ecosystem services. Invasive plant and animal species that out-compete native ones pose another threat.
Climate change is projected to cause increases in annual run-off in Northern Europe, and decreases in Eastern Europe. Seasonal variability of discharge is predicted to increase in Eastern Eu-
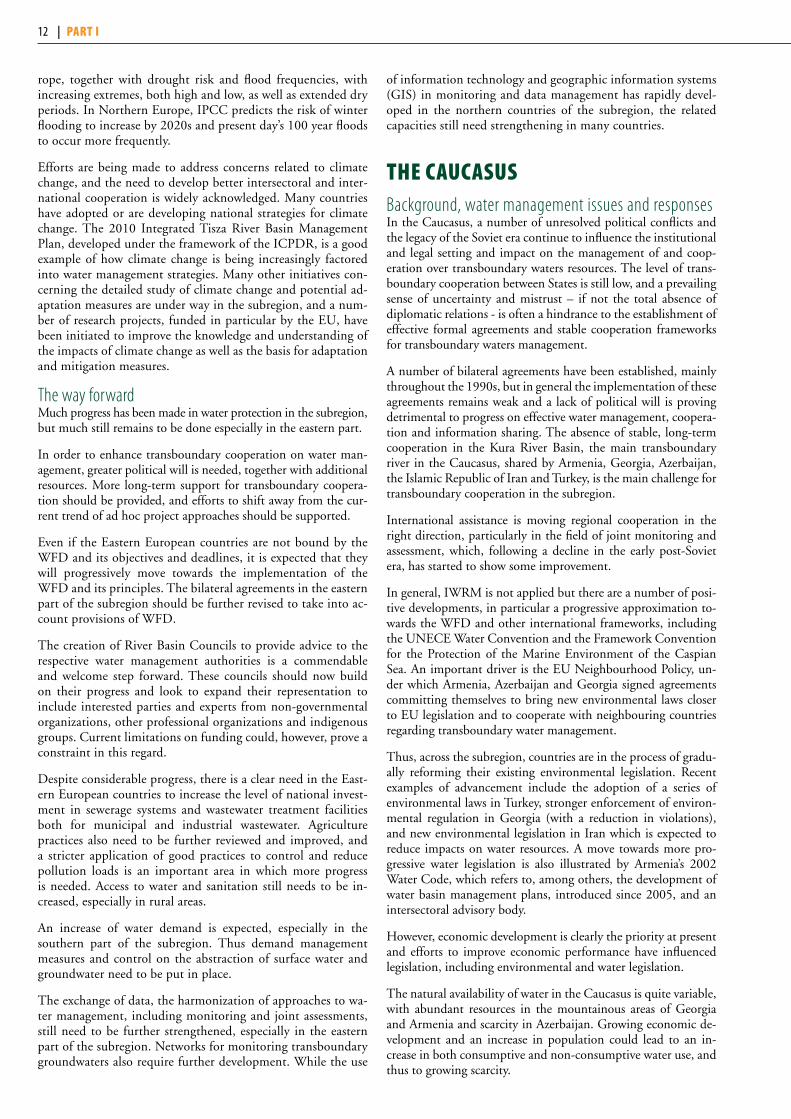
12 | PArt i
rope, together with drought risk and flood frequencies, with increasing extremes, both high and low, as well as extended dry periods. In Northern Europe, IPCC predicts the risk of winter flooding to increase by 2020s and present day’s 100 year floods to occur more frequently.
Efforts are being made to address concerns related to climate change, and the need to develop better intersectoral and inter-national cooperation is widely acknowledged. Many countries have adopted or are developing national strategies for climate change. The 2010 Integrated Tisza River Basin Management Plan, developed under the framework of the ICPDR, is a good example of how climate change is being increasingly factored into water management strategies. Many other initiatives con-cerning the detailed study of climate change and potential ad-aptation measures are under way in the subregion, and a num-ber of research projects, funded in particular by the EU, have been initiated to improve the knowledge and understanding of the impacts of climate change as well as the basis for adaptation and mitigation measures.
The way forwardMuch progress has been made in water protection in the subregion, but much still remains to be done especially in the eastern part.
In order to enhance transboundary cooperation on water man-agement, greater political will is needed, together with additional resources. More long-term support for transboundary coopera-tion should be provided, and efforts to shift away from the cur-rent trend of ad hoc project approaches should be supported.
Even if the Eastern European countries are not bound by the WFD and its objectives and deadlines, it is expected that they will progressively move towards the implementation of the WFD and its principles. The bilateral agreements in the eastern part of the subregion should be further revised to take into ac-count provisions of WFD.
The creation of River Basin Councils to provide advice to the respective water management authorities is a commendable and welcome step forward. These councils should now build on their progress and look to expand their representation to include interested parties and experts from non-governmental organizations, other professional organizations and indigenous groups. Current limitations on funding could, however, prove a constraint in this regard.
Despite considerable progress, there is a clear need in the East-ern European countries to increase the level of national invest-ment in sewerage systems and wastewater treatment facilities both for municipal and industrial wastewater. Agriculture practices also need to be further reviewed and improved, and a stricter application of good practices to control and reduce pollution loads is an important area in which more progress is needed. Access to water and sanitation still needs to be in-creased, especially in rural areas.
An increase of water demand is expected, especially in the southern part of the subregion. Thus demand management measures and control on the abstraction of surface water and groundwater need to be put in place.
The exchange of data, the harmonization of approaches to wa-ter management, including monitoring and joint assessments, still need to be further strengthened, especially in the eastern part of the subregion. Networks for monitoring transboundary groundwaters also require further development. While the use
of information technology and geographic information systems (GIS) in monitoring and data management has rapidly devel-oped in the northern countries of the subregion, the related capacities still need strengthening in many countries.
thE CAuCASuSBackground, water management issues and responsesIn the Caucasus, a number of unresolved political conflicts and the legacy of the Soviet era continue to influence the institutional and legal setting and impact on the management of and coop-eration over transboundary waters resources. The level of trans-boundary cooperation between States is still low, and a prevailing sense of uncertainty and mistrust – if not the total absence of diplomatic relations - is often a hindrance to the establishment of effective formal agreements and stable cooperation frameworks for transboundary waters management.
A number of bilateral agreements have been established, mainly throughout the 1990s, but in general the implementation of these agreements remains weak and a lack of political will is proving detrimental to progress on effective water management, coopera-tion and information sharing. The absence of stable, long-term cooperation in the Kura River Basin, the main transboundary river in the Caucasus, shared by Armenia, Georgia, Azerbaijan, the Islamic Republic of Iran and Turkey, is the main challenge for transboundary cooperation in the subregion.
International assistance is moving regional cooperation in the right direction, particularly in the field of joint monitoring and assessment, which, following a decline in the early post-Soviet era, has started to show some improvement.
In general, IWRM is not applied but there are a number of posi-tive developments, in particular a progressive approximation to-wards the WFD and other international frameworks, including the UNECE Water Convention and the Framework Convention for the Protection of the Marine Environment of the Caspian Sea. An important driver is the EU Neighbourhood Policy, un-der which Armenia, Azerbaijan and Georgia signed agreements committing themselves to bring new environmental laws closer to EU legislation and to cooperate with neighbouring countries regarding transboundary water management.
Thus, across the subregion, countries are in the process of gradu-ally reforming their existing environmental legislation. Recent examples of advancement include the adoption of a series of environmental laws in Turkey, stronger enforcement of environ-mental regulation in Georgia (with a reduction in violations), and new environmental legislation in Iran which is expected to reduce impacts on water resources. A move towards more pro-gressive water legislation is also illustrated by Armenia’s 2002 Water Code, which refers to, among others, the development of water basin management plans, introduced since 2005, and an intersectoral advisory body.
However, economic development is clearly the priority at present and efforts to improve economic performance have influenced legislation, including environmental and water legislation.
The natural availability of water in the Caucasus is quite variable, with abundant resources in the mountainous areas of Georgia and Armenia and scarcity in Azerbaijan. Growing economic de-velopment and an increase in population could lead to an in-crease in both consumptive and non-consumptive water use, and thus to growing scarcity.

OvErviEw | 13
The agricultural sector constitutes the largest consumer of water in the Caucasus, also due to substantial water losses (as much as 30 per cent) through inefficient and poorly maintained irrigation systems. Since 1991, there has been a marked increase in agricul-tural production and irrigation in some parts of the subregion, and the over-abstraction of groundwater resources for irrigation purposes is a problem across the Caucasus. The over-abstraction of groundwater, coupled with inefficient drainage systems, have in many cases led to the salinization of soils, especially in more arid areas, which affects plant growth and yield.
Diffuse pollution from agriculture, viniculture and animal hus-bandry is also a significant pressure factor in many basins. Water pollution generated by the agricultural use of pesticides, nitrogen, phosphorus and other substances is a challenge, including agri-cultural pollution in irrigation return flows containing residues of agrochemical waste, pesticides, nutrients and salts. However, in recent years, the application of fertilizers has been relatively limited and efforts to minimize the impact of agricultural activi-ties on water resources are increasingly taking hold in a number of countries in the subregion.
Organic and bacteriological pollution from discharge of poorly
treated or untreated wastewater is a widespread problem. In par-ticular, water quality in the Kura Basin has been severely affected. Wastewater treatment is commonly lacking for municipal waste-water and investments in wastewater treatment infrastructure are not enough. Even though many urban areas are connected to sewerage networks, few wastewater treatment plants have been set up. In rural settlements, even sewers are often lacking.
There is also room for improvement in solid waste management, as official landfills are often lacking and pollution from illegal landfills is a concern. Controlled dumpsites are reported to exert pressure on water quality, too.
Despite the general decrease in industrial activities since the 1990s, water pollution from the industrial sector remains a sig-nificant environmental problem, and the efficient management of industrial wastewater continues to be a challenge for many countries in the Caucasus. Although the significance of mining as a pressure factor has substantially decreased in the past 20 years, the mining of commodities such as copper still generates heavy metal pollution due to acid drainage from tailing dams.
Water-related infrastructure and development projects are often seen as key drivers for socio-economic development in the sub-
A b k h a z i a
SouthOssetia
Nakhchivan(AZ)
Lake Van
Lake Urmia
LakeSevan
Mingechevir Reservoir
Terek
Sulak
Samur
Psou
Chorokhi
Machakhelisckali
Kura
Araks
Kotur
Malka
Andis Koisu
Avarsk Koisu
AlazaniIori
Agstev
Debed
ArpaVorotan
Voghji
Akhuryan
B l a c k S e a
C a s p i a n S e a
Potskhovi
R U S S I A N F E D E R A T I O N
G E O R G I A
A R M E N I A A Z E R B A I J A N
K a z a k h s t a n
I S L A M I C R E P U B L I CO F I R A N
T U R K E Y
S y r i aI r a q
Tbilisi
Yerevan Baku
Tehran
Novorossiysk
Tuapse
Sochi
Maykop Nevinnomyssk
CherkesskMineralnye Vody
PyatigorskKislovodsk
Budennovsk
Prokhladnyy
Nalchik
VladikavkazGrozny
Makhachkala
Derbent
Suchumi
Batumi
PotiKutaisi
TskhinvaliGori
Rustavi
Shaki
MingechevirGanja Sumqayit
Shirvan
Khankendi(Stepanakert)
Nakhchivan
Gyumri
Kars
Erzurum
TrabzonOrdu
Samsun
Sivas
Osmaniye
Iskenderun
Antakya Aleppo
Gaziantep
Kahramanmaras
Sanliurfa
Adiyaman
Malatya
Elazig
Diyarbakir Batman
Van
Ar Raqqah
Al Hasakah
Al Qamishli
MosulArbil
Urmia
Tabriz
Ardabil
Rasht
Zanjan
Qazvin
Karaj
Turkmenbashi
Aktau
100 200 300 400 km0
Map produced by ZOÏ Environment Network, July 2011
tRANSBoUNDARY SURFACe WAteRS IN tHe CAUCASUS
100 200 300 400 km0
Map produced by ZOÏ Environment Network, July 2011
!
WFD groundwater body (GWB)/set of GWBs
GWB (partially) overlapping with aquifer (Partially) overlapping aquifers
Aquifer
Exact location/extent of aquifer uncertain

14 | PArt i
region. The construction of weirs, dams, hydropower plants and related structures for electricity generation, irrigation and water supply purposes is continuing apace, notably in Georgia, the Is-lamic Republic of Iran and Turkey. The rise of the hydropow-er sector in the subregion has raised particular concerns about changes to the natural river flows and other detrimental impacts on river dynamics, morphology and the transport of sediments.
Climate change is predicted to have a significant impact on the subregion, particularly in terms of water scarcity and the drying up of rivers. Increased summer temperatures have also been pre-dicted and the variability of flows and the risk of extreme weather events are predicted to increase. Natural disasters like landslides and mudflows are perceived as common problems in certain areas of the Caucasus. Some studies on the impact of climate change have been carried out for the Caucasus, but actual adaptation measures are mostly only starting to be considered. Turkey, for example, developed a “National Climate Change Strategy” in 2009, but the actual implementation of measures is still to be car-ried out. The Islamic Republic of Iran has also been developing a national plan for tackling climate change. Yet, in general, little has so far been done to better understand the potential impacts of climate change on the subregion.
The way forwardGreater political commitment to transboundary cooperation is needed to improve the institutional framework and the manage-ment of transboundary water resources in the Caucasus. The technical cooperation established under various projects should evolve in a more long-term, sustainable framework for coopera-tion to be able to tackle the variety and complexity of problems.
Also, the capacities of national institutions in the field of water management remain insufficient, and will need further improve-ment and support to meet the challenges faced by the subregion.
Economic development is clearly a priority for countries in the subregion, but efforts should be made to ensure that water re-sources and environmental protection are not overlooked or ne-glected if the region wants to guarantee its long-term and sus-tainable growth. In particular with regard to the development of infrastructure projects, ecological flows have to be considered to avoid straining relations between co-riparians and to ensure sustainability of use of the water resources.
This risk of water scarcity experienced downstream and seasonal-ly/periodically elsewhere calls for an overall improvement in wa-ter management and irrigation efficiency. Water saving measures, as well as the conjunctive use of surface water and groundwater, the reuse of drainage and return waters, should become matters of priority for Governments in the Caucasus.
In terms of agricultural pollution, tighter regulation and control of the use of pesticides, fertilizers and other pollutants will not only reduce the harmful effects on water quality in rivers, but also improve the potential for reusing return waters.
More comprehensive and collaborative research into the impacts of climate change is needed at the subregional level. Initiatives to develop a common understanding of major challenges and to collate existing knowledge should be developed, and moves to establish joint or coordinated adaptation strategies should be ac-celerated.
Donors currently providing financial support to water manage-ment, monitoring and protection programmes in the subregion
should ensure that their interventions do not overlap or duplicate each other and that they respond to the priority needs of the countries in the Caucasus. The impact and progress of funded activities should be monitored at the national level, and recipient countries should take responsibility for following up on projects in the long term.
CEntrAl ASiABackground, water management issues and responsesIn the past 20 years of political transition since the break-up of the Soviet Union, countries in Central Asia have each created their own distinct political and economic systems and focused on their own areas of national priority. Levels of socio-economic development and the availability of infrastructure and resources vary greatly from country to country. The uneven political and economic development and distribution of resources (especially of fossil fuel reserves and hydropower capacity) has created a complex and challenging context for cooperation on water re-sources.
Population growth has been rapid in the past 20 years and has consequently added additional pressure on water resources. The population in the Aral Sea Basin, for example, has more than doubled from 1960 to 2008, to almost 60 million.
Water resources in Central Asia are predominantly of a trans-boundary nature. Most of the region’s surface water resources are generated in the mountains of the upstream countries Kyr-gyzstan, Tajikistan and Afghanistan, eventually feeding Central Asia’s two major rivers, the Syr Darya and the Amu Darya, which flow through the downstream countries Kazakhstan, Turkmeni-stan and Uzbekistan, and are a part of the Aral Sea Basin.
These resources are of critical importance to the subregion’s economy, people and environment. Due to the arid regional cli-mate, irrigation water is an indispensable input for agricultural production. An estimated 22 million people depend directly or indirectly on irrigated agriculture in Tajikistan, Turkmenistan and Uzbekistan. Water is also important for energy production: hydropower covers more than 90% of total electricity needs in Kyrgyzstan and Tajikistan, and is also an export commodity.
Yet, the subregion does not have an overarching legal framework for the management and protection of shared water resources. The legal framework for cooperation on the Amu Darya and Syr Darya, put into place in the early 1990s, is increasingly consid-ered to have become outdated, resulting in generally poor imple-mentation. In the past few years, the agreed arrangements on wa-ter allocation have not been fully implemented or it has proven impossible to agree on water allocation. Another shortcoming of the existing cooperation is that it does not include Afghanistan. Thus a holistic, rational, equitable and sustainable approach to the use of transboundary water resources supported by all ripar-ian countries is lacking. This has resulted not only in tensions and suspicions over water allocation and energy generation, but also in social and economic problems, as well as environmental degradation.
A positive development is the cooperation between Kazakhstan and the Kyrgyzstan on the Chu and Talas Rivers: the Chu-Talas Commission,7 established in 2006, is an example of a function-ing joint body under a bilateral agreement. Over the years, the cooperation in the framework of the Chu-Talas Commission
7 The Commission of the Republic of Kazakhstan and the Kyrgyz Republic on the Use of Water Management Facilities of Intergovernmental Status on the Rivers Chu and Talas.
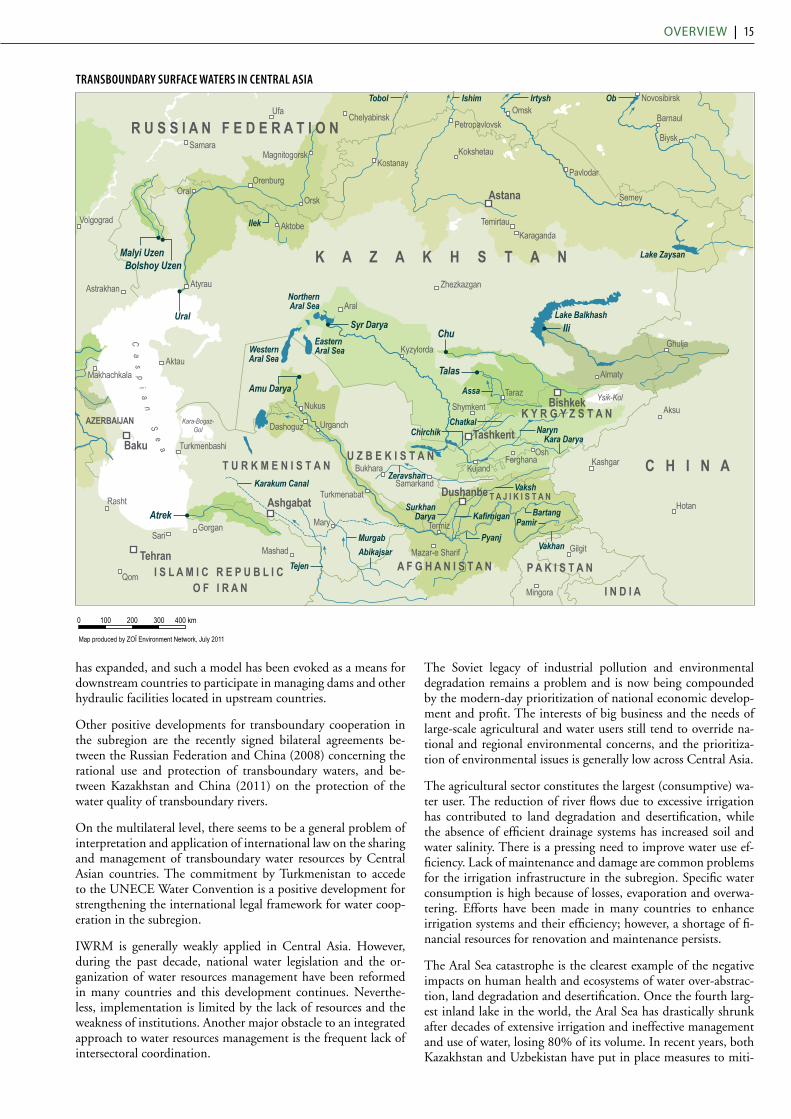
OvErviEw | 15
has expanded, and such a model has been evoked as a means for downstream countries to participate in managing dams and other hydraulic facilities located in upstream countries.
Other positive developments for transboundary cooperation in the subregion are the recently signed bilateral agreements be-tween the Russian Federation and China (2008) concerning the rational use and protection of transboundary waters, and be-tween Kazakhstan and China (2011) on the protection of the water quality of transboundary rivers.
On the multilateral level, there seems to be a general problem of interpretation and application of international law on the sharing and management of transboundary water resources by Central Asian countries. The commitment by Turkmenistan to accede to the UNECE Water Convention is a positive development for strengthening the international legal framework for water coop-eration in the subregion.
IWRM is generally weakly applied in Central Asia. However, during the past decade, national water legislation and the or-ganization of water resources management have been reformed in many countries and this development continues. Neverthe-less, implementation is limited by the lack of resources and the weakness of institutions. Another major obstacle to an integrated approach to water resources management is the frequent lack of intersectoral coordination.
The Soviet legacy of industrial pollution and environmental degradation remains a problem and is now being compounded by the modern-day prioritization of national economic develop-ment and profit. The interests of big business and the needs of large-scale agricultural and water users still tend to override na-tional and regional environmental concerns, and the prioritiza-tion of environmental issues is generally low across Central Asia.
The agricultural sector constitutes the largest (consumptive) wa-ter user. The reduction of river flows due to excessive irrigation has contributed to land degradation and desertification, while the absence of efficient drainage systems has increased soil and water salinity. There is a pressing need to improve water use ef-ficiency. Lack of maintenance and damage are common problems for the irrigation infrastructure in the subregion. Specific water consumption is high because of losses, evaporation and overwa-tering. Efforts have been made in many countries to enhance irrigation systems and their efficiency; however, a shortage of fi-nancial resources for renovation and maintenance persists.
The Aral Sea catastrophe is the clearest example of the negative impacts on human health and ecosystems of water over-abstrac-tion, land degradation and desertification. Once the fourth larg-est inland lake in the world, the Aral Sea has drastically shrunk after decades of extensive irrigation and ineffective management and use of water, losing 80% of its volume. In recent years, both Kazakhstan and Uzbekistan have put in place measures to miti-
WesternAral Sea
EasternAral Sea
NorthernAral Sea
Kara-Bogaz-Gol
Lake Balkhash
Ysik-Kol
Lake Zaysan
C a s p i a n S e a
Ural
Ilek
Malyi UzenBolshoy Uzen
Amu Darya
Syr Darya Chu
Talas
Assa
Pyanj
SurkhanDarya PamirKafirnigan
Zeravshan
ChirchikChatkal
Bartang
NarynKara Darya
Vaksh
VakhanMurgabAbikajsar
Karakum Canal
Tejen
Ili
Atrek
IshimTobol Irtysh Ob
Baku
Makhachkala
Astrakhan
Volgograd
Ufa
Samara
Orenburg
Chelyabinsk
Magnitogorsk
Orsk
PetropavlovskOmsk
Novosibirsk
Barnaul
Biysk
Semey
Almaty
Bishkek
Astana
KaragandaTemirtau
Kokshetau
Zhezkazgan
Kostanay
Aktobe
Oral
Atyrau
Aktau
Aral
Kyzylorda
TarazShymkentNukus
Turkmenbashi
Dashoguz Urganch
BukharaSamarkand
Tashkent
KujandFerghana
OshKashgar
Aksu
Ghulja
Pavlodar
Rasht
TehranSari
Qom
Gorgan
Mashad
AshgabatMary
Turkmenabat
Termiz
Mazar-e Sharif
Dushanbe
Gilgit
Mingora
Hotan
K A Z A K H S T A N
R U S S I A N F E D E R A T I O N
U Z B E K I S T A N
K Y R G Y Z S T A N
C H I N AT U R K M E N I S T A N
T A J I K I S T A N
P A K I S T A N
I N D I A
A F G H A N I S T A NI S L A M I C R E P U B L I C O F I R A N
AZERBAIJAN
100 200 300 400 km0
Map produced by ZOÏ Environment Network, July 2011
tRANSBoUNDARY SURFACe WAteRS IN CeNtRAL ASIA
100 200 300 400 km0
Map produced by ZOÏ Environment Network, July 2011
!
WFD groundwater body (GWB)/set of GWBs
GWB (partially) overlapping with aquifer (Partially) overlapping aquifers
Aquifer
Exact location/extent of aquifer uncertain

16 | PArt i
gate the environmental degradation of the Aral Sea, and the re-cent increase of the level of the North Aral Sea, thanks to the Kok-Aral Dam built by Kazakhstan, is an important result. The intense crop cultivation, water diversions and industrial devel-opment along the Ili River and in the Lake Balkhash Basin in general raise concerns that a new environmental disaster may be looming, with a pattern similar to that of the Aral Sea.
Alongside agriculture, hydropower is an increasingly important sector in the mountainous countries of Central Asia, where it generates a large proportion of domestic electricity. Rapid popu-lation growth over the past 20 years in combination with low en-ergy prices has increased the demand for energy. Construction of a number of new dams, mainly for hydropower but also to store water for irrigation, was initiated in the late 2000s. However, hydropower generation has placed pressure on water resources and dam infrastructure disrupts water flow, with consequences for other uses and ecosystems.
Concerns about the safety of more than 100 large dams and other water control facilities, located mostly on transboundary rivers, have grown in recent years. Ageing dams and their inadequate maintenance, coupled with population growth and development in flood-plains downstream from the dams, have resulted in in-creased risks. The inadequate and uncoordinated management of dams and reservoirs can pose a serious risk of flooding, as il-lustrated by the failure of the Kyzyl-Agash Dam, in Kazakhstan in March 2010.
Since 1991, the level of hydrological monitoring, forecasting and data collection has experienced a significant decline across the subregion. With the exception of Kazakhstan, where investment in water monitoring and assessment have increased in recent years, and the Russian Federation and Uzbekistan, where the water monitoring networks have been generally well preserved, the capacity of national authorities to effectively monitor water resources is low and requires greater investment. A specific chal-lenge is the monitoring of water quality, which is almost non-existent in some countries.
Finally, the negative impact of climate change is of mounting con-cern for the subregion. Despite the limited amount of data made available thus far, a significant number of predictions stress the vulnerability of water resources in Central Asia. An increase in air temperature and a short-term increase in river flows, due to the melting of glaciers, is one such likely consequence. In the long term, river flows are predicted to decrease, and the levels of aridity and evapotranspiration to rise, which would increase irrigation re-quirements for water and increase the risk of scarcity and droughts.
The way forwardA sustainable solution for cooperation on transboundary waters in Central Asia will require a careful balance between water use for irrigation, human consumption, the generation of electricity and the protection of ecosystems. The willingness of all the ripar-ian countries to cooperate, establish an open dialogue and com-promise to find a consensus between their positions is necessary for agreement. By enhancing transboundary water cooperation, Central Asian countries can also pave the way for future coop-eration in other fields like transport, trade, transit and energy, moving towards building consensus and away from the current politization and polarization of the water debate.
The recognition by the Heads of Central Asian Governments in April 2009 of the need to improve institutional and legal frame-works for regional water cooperation under the umbrella of the International Foundation for Saving the Aral Sea (IFAS) was a
promising step forward. Yet, its actual and effective implementa-tion remains a challenge for the future.
The lack of an overarching legal framework for the region contin-ues to undermine progress and needs to be addressed on the basis of international law. In particular, the involvement of Afghani-stan in regional cooperation needs to be considered.
The entry into force of articles 25 and 26 of the Water Conven-tion is particularly important for Central Asia, as it will allow accession by countries outside the UNECE region (i.e., in this subregion Afghanistan, the Islamic Republic of Iran, China and Mongolia) and contribute to the creation of a common legal ba-sis for bilateral and multilateral agreements.
The development of transboundary cooperation will need strength-ened institutions, the crucial one being IFAS. Central Asian States and the donor community need to undertake serious joint efforts to increase its capacities, sustainability and effectiveness.
The steps taken under the framework of the EU Strategy for Central Asia, including the joint approval of a Cooperation Plat-form on Environment and Water in November 2009, as well as the activities carried out within the National Policy Dialogues on IWRM under the EU Water Initiative can contribute to the exchange of experiences and joint undertakings between EU and Central Asia countries, with the aim to develop efficient and in-tegrated management of water resources.
Further efforts are also needed to improve water efficiency, in-crease effectiveness of irrigation systems - including by repair-ing and maintaining existing infrastructure - switch to less water demanding crops and limit the irrigated land area. Such efforts become even more urgent in the light of the projected increases in water scarcity.
With the current prioritization of economic development, it is a serious concern that water-dependent ecosystems get little atten-tion. Countries need to identify and apply best practices in the management of water resources and ecosystems, in particular en-suring minimum environmental flows. Also, more effective land management policies, such as limiting deforestation and encour-aging a shift away from unsustainable agricultural and grazing practices, are needed.
Environmental impact assessments of planned transboundary projects should be carried out in a more systematic manner, with involvement of affected countries and populations. This is partic-ularly relevant for planned hydropower projects in Kyrgyzstan and Tajikistan. Also, cooperation on the management of reservoirs can bring benefits by addressing the needs of different sectors; dif-ferent reservoirs in a cascade can have complementary operating modes. Developing small-scale hydropower projects, which do not disrupt water flows and are less damaging to the environment, could be considered as an option for energy generation.
Transboundary monitoring needs to be significantly strength-ened, especially that of water quality. Research on groundwater, which plays a potentially important role in sustaining ecosystems and limiting land degradation, should also be intensified.
Improved regional cooperation to develop scenarios and adapta-tion measures for climate change would be beneficial for all coun-tries. More also needs to be done to ensure that impacts of climate change are taken into account when national plans for water use and management are being formulated. Better monitoring of the status of glaciers and snow reserves in the mountains will provide indications about how water availability will develop.

OvErviEw | 17
oVErViEw mAP oF mAin trAnSboundAry SurFACE wAtErS in wEStErn, CEntrAl And EAStErn EuroPE
In
n
Drava
Mura
Tisz
a
Sava
Siret
Prut
Ebro
Rhon
e
Morava
Danube
Danube
Velika Morava
LakeIron Gate I
LakeIron Gate II
LakeNeusiedl
Stanca-CostestiReservoir
RoiaPo
Isonzo
KrkaNeretva
Vijose
VardarDrinLake Skadar
Lake Ohrid
Prespa Lakes
LakeDojran
MaritsaNestos
Struma
LakeGeneva
LakeConstance
LakeEmosson
LakeLugano
LakeMaggiore
Torne Kem
ijoki
Oulujoki
Vuoksi
Lake Ladoga
LakeNuijamaanjärvi
NarvaLake Peipsi
Gauja
Daugava
Venta
Lielupe
LakeDrisvyaty
Neman
Pregolya
Bug
Vistu la
DunajecPoprad
Oder
ElbeNeisse
Olse
LakePyhäjärvi
LakeSaimaa
LakeGaladus
Klaralven
Glama
Wiedau
Ems
Meuse
Saar
Moselle
Scheldt
Yser
BidasoaMino
Lima
Douro
TagusGuadiana
Erne
FoyleBann
FrieiraReservoir Alto Lindoso
Reservoir
Miranda Reservoir
CedilloReservoir
Rhine
The boundaries and names shown and the designations used on this mapdo not imply official endorsement or acceptance by the United Nations. UNEP/DEWA/GRID-Geneva 2011
0 250 500Kilometres
20o
0o
40o40o
50o
60o
70o
20o
60o
S K
H U
LUBE
K I N G D O M
U N I T E DIRELAND
NL
DK
ATF R A N C ER O M A N I A
SI
CH
B G
S P A I N
C Y P R U S
M A L T A
G E R M A N YP O L A N D
LT
LV
E E
I C E L A N D
PO
RT
UG
AL
NO
RW
AY
SW
ED
EN
FI
NL
AN
D
HRBA
MK
RS
AL
ME
T U R K E Y
G R
I T
C Z

18 | PArt i
The
boun
darie
s an
d na
mes
sho
wn a
nd th
e de
signa
tions
use
d on
this
map
do
not i
mpl
y of
ficia
l end
orse
men
t or a
ccep
tanc
e by
the
Unite
d Na
tions
.UN
EP/D
EWA/
GRID
-Gen
eva 2
011
025
050
075
010
00Ki
lomet
res
90o
60o
120o
150o
180o
30o
40o
50o
60o
70o
80o
Ussuri
Lake
Khan
ka
Syr Darya
Amu Darya
Pyan
j
Zeravsh
an
Dnieper
Dniester
Assa
Terek
Sula
k
Kemi
joki
Oulanka
Pripyat
TalasChu
Irtysh
Ishim
Tobo
l
Ural
Sele
nga
Argun
Amur
Amur
PrutTu
loma
Danu
be
Pasvi
k
Bug
Neman
Daug
ava La
kePe
ipsiNa
rva
Vuok
si
Oulu
joki
Sive
rs’k
y Do
nets’
Arak
s
Don
Preg
olya
Ili
Lake
Ba
lkha
sh
TumenMurga
b
Tejen
Atrek
Chor
okhi
Kura
Bolsh
oy U
zen
Mal
yiUz
en
Ob
Ob
YeniseyYenisey
La
keBa
ikal
T U R K M E N I STA N
BE LARUS
U K R A I N E
G E
KA
ZA
KH
ST
ANR
US
SI
AN
F
ED
ER
AT
IO
N
A Z
T U R K E Y
I S L A M I C R E P U B L I C
O F I R A N
A F G H A N I ST A N
MO
NG
OL
IA
KPC
HI
NA
MD AM
TJ
KG
UZ
oVEr
ViEw
mAP
oF
mAi
n tr
AnSb
ound
Ary
SurF
ACE
wAt
ErS
in E
AStE
rn E
uroP
E, t
hE C
AuCA
SuS
And
CEnt
rAl A
SiA
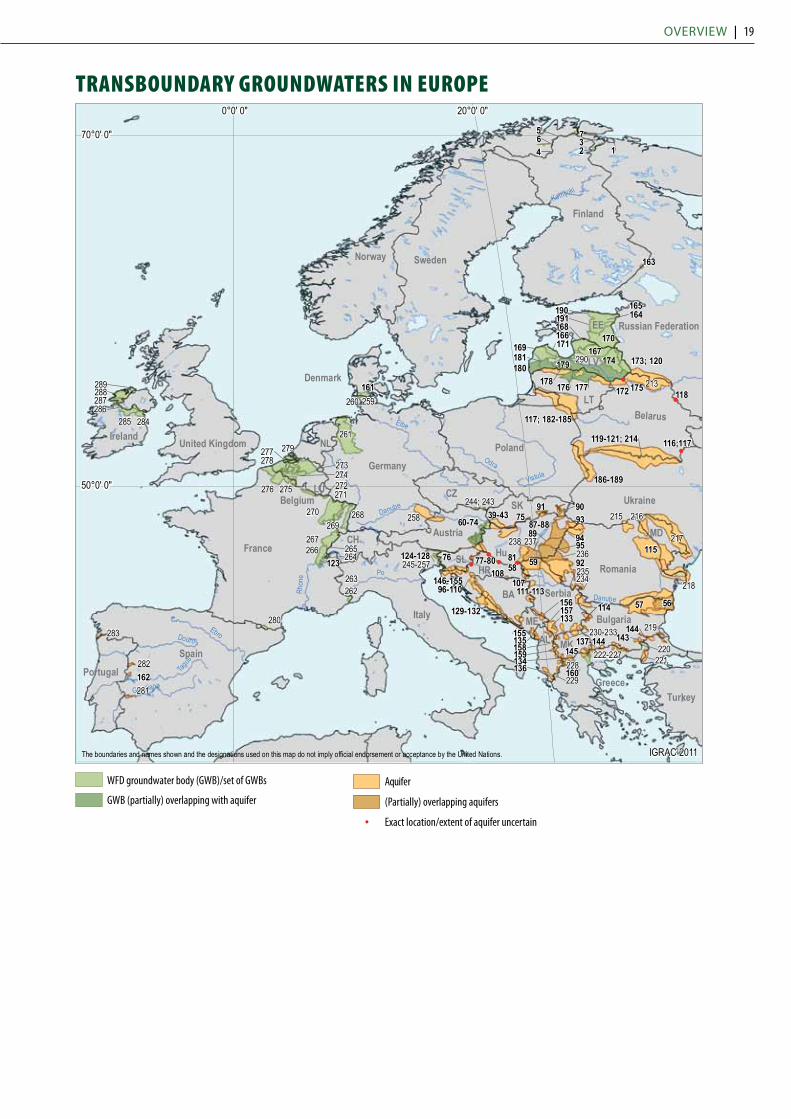
OvErviEw | 19
trAnSboundAry groundwAtErS in EuroPE
100 200 300 400 km0
Map produced by ZOÏ Environment Network, July 2011
!
WFD groundwater body (GWB)/set of GWBs
GWB (partially) overlapping with aquifer (Partially) overlapping aquifers
Aquifer
Exact location/extent of aquifer uncertain
Danube
Po
Odra
Ebro
Elbe
Rhine
Rhon
e
Vistula
Douro
Tagus
Kemijoki
Guadiana
Danube
Russian Federation
Spain
France
Sweden
Italy
Finland
Norway
PolandGermany
Ukraine
Belarus
Romania
United Kingdom
Turkey
Serbia
Austria
Ireland
CZ
Greece
Bulgaria
LV
Hu
Portugal
LT
HR
EE
SKBelgium
AL
CH
Denmark
NL
SL
BA
MD
MK
LU
ME
123
7
23
1465
9075
91
57 56
5981
9495
9258
89
177176
290171169
161
145
136
284
289288
259260
271
270 268
238
274
277
276
278
258
167
168
163
181180
172
174179
170
191
272
213
119-121; 214
217
216215
218
114
287
219144
221
143
134158
175
234235
133
135155
264
229228
275
262
265
280
263
267266
108
164
115
190
286285
282
283
281162
261
269
116;117
117; 182-185
186-189
93
237
273
279
178
166
236
160
159 220
107
165
157
87-88
173; 120
118
222-227
114
137-144230-233
129-132
146-15596-110
124-128245-257 77-80
111-113
60-74
156
244; 24339-43
76
114
0°0' 0" 20°0' 0"
70°0' 0"
50°0' 0"
IGRAC 2011The boundaries and names shown and the designations used on this map do not imply official endorsement or acceptance by the United Nations.

20 | PArt i
trAn
Sbou
ndAr
y gr
ound
wAt
ErS
in S
outh
-EAS
tErn
Eur
oPE
Italy
Rom
ania
Serb
ia
Bulg
aria
Hung
ary
Aust
ria
Ukra
ine
Croa
tia
Gree
ce
Slov
akia
Alba
nia
Turk
ey
Slov
enia
Bosn
ia an
d He
rzeg
ovin
a
Germ
any
Czec
h Re
publ
ic
Mont
eneg
ro
MD
Danu
be
Sava
Tisza
Danu
be
Rome
Zagr
eb
Tiran
a
Skop
je
Chişi
nău
Belgr
ade
Sara
jevo
Ljublj
ana
Buch
ares
t
San M
arino
90
75
91
95
5756
746973 72
68
64
59
76
81
7978
94
95
9258
93
89
77
145
138
137
142
136
239
240
241
238
237
258
217
216
215
218
113
236
144
221
222
223
134
160
134
158
233
232
23111
4
111
133
132
130
229
228
227
226
220
242
154
129
110
109
108
107
157
115
244
243
257
251 12
412
5
254
248
256
246
65-6
6
87-8
8
84-8
6
60-6
3
147-
149
70 6771
80
153
114
219
143
224
225
134
159
230
234
235
112 135
155
131
146
249
250
253
252
255
247
245
126
128
127
99-1
00
139-
141
101-
106
151;
155
150;
152
96-9
8
156
20°0
' 0"
40°0
' 0"
Blac
k Sea
MK
Aege
an S
ea
Adria
tic S
ea
IGRA
C 20
11Th
e bou
ndar
ies an
d nam
es sh
own a
nd th
e des
ignati
ons u
sed o
n this
map
do no
t imply
offic
ial
endo
rseme
nt or
acce
ptanc
e by t
he U
nited
Nati
ons.

OvErviEw | 21
trAn
Sbou
ndAr
y gr
ound
wAt
ErS
in t
hE C
AuCA
SuS
And
CEnt
rAl A
SiA
Baku
Tehr
an
Astan
a
Bish
kek
Yere
van
Dush
anbe
Ashg
abat
Tbilis
iTo
shke
nt
Russ
ian Fe
dera
tion
Kaza
khst
an
Chin
a
Turk
ey
Uzbe
kista
n
Turk
men
istan
Kyrg
yzst
an
Tajik
istan
Afgh
anist
an
Mong
olia
Geor
gia
Pakis
tan
Azer
baija
nAM
Ukra
ine
Casp
ian S
ea
Lake
Balk
hash
Amu D
arya
8
9
13
50
45
50
10
4242
4041
4953
48
32
3133
30
27
2232
29
47
212
209
211
210
205
208
207
206
204
208
4650
4814
1112
5554
5251
44
122
192
203
15-2
819
3-20
2
363539
34
3738
Ob
Irtysh
Volga
Yenis
ey
Ural
Don
Tobol Syr D
arya
Anga
ra
Nary
n
Kama
60°0
' 0"
40°0
' 0"
80°0
' 0"
100°
0' 0"
50°0
' 0"
60°0
' 0"
IGRA
C 20
11Th
e bou
ndar
ies an
d nam
es sh
own a
nd th
e des
ignati
ons u
sed o
n this
map
do no
t imply
offic
ial
endo
rseme
nt or
acce
ptanc
e by t
he U
nited
Nati
ons.
100 200 300 400 km0
Map produced by ZOÏ Environment Network, July 2011
!
WFD groundwater body (GWB)/set of GWBs
GWB (partially) overlapping with aquifer (Partially) overlapping aquifers
Aquifer
Exact location/extent of aquifer uncertain
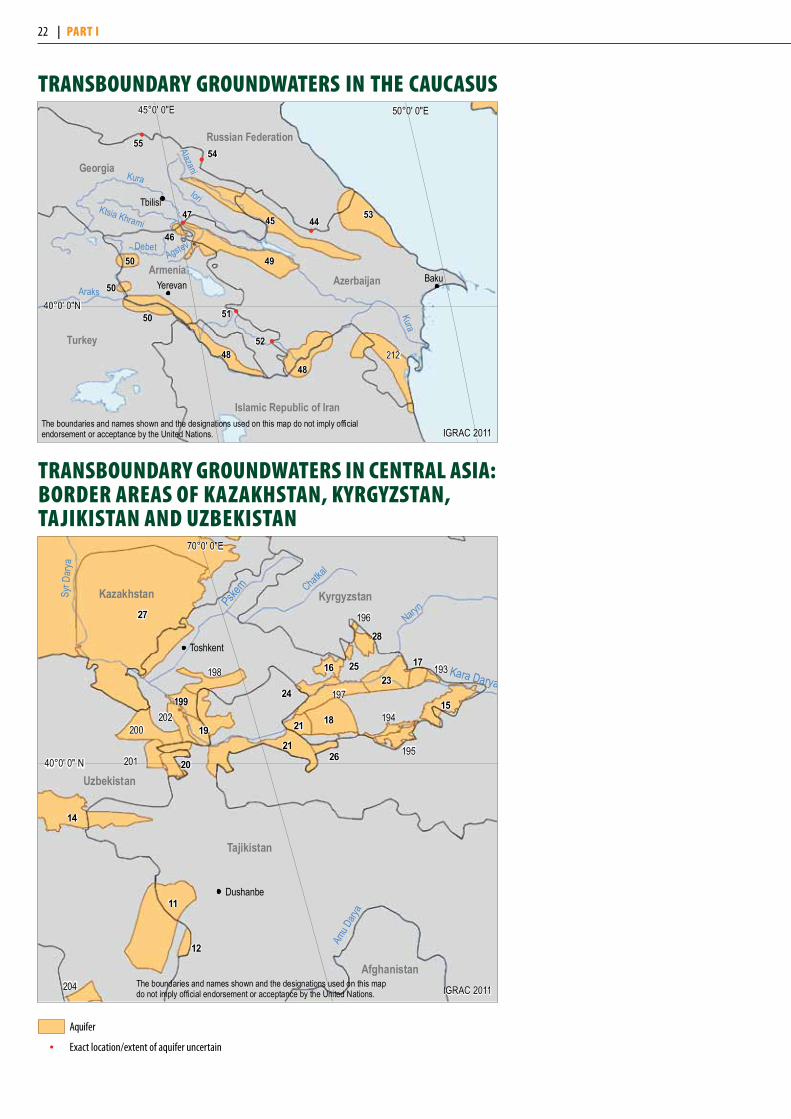
22 | PArt i
trAnSboundAry groundwAtErS in thE CAuCASuS
trAnSboundAry groundwAtErS in CEntrAl ASiA: bordEr ArEAS oF kAzAkhStAn, kyrgyzStAn, tAjikiStAn And uzbEkiStAn
Turkey
Azerbaijan
Georgia
Russian Federation
Armenia
Islamic Republic of Iran
BakuYerevan
Tbilisi
Araks
KuraIori
Alazani
DebetAgstev
Ktsia Khrami
Kura
50
45
50
50
48
49
53
48
51
4744
212
46
5554
52
45°0' 0"E 50°0' 0"E
40°0' 0"N
IGRAC 2011The boundaries and names shown and the designations used on this map do not imply official endorsement or acceptance by the United Nations.
27
15
2621
20
19
20
14
11
12
21
25
2423
17
28
16
18200
201
202199
198
196
195
194
197
204
193
Pskem
Tajikistan
KyrgyzstanKazakhstan
Uzbekistan
Afghanistan
Toshkent
Dushanbe
Kara Darya
Syr D
arya
Naryn
Chatkal
Amu D
arya
40°0' 0" N
70°0' 0"E
IGRAC 2011The boundaries and names shown and the designations used on this map do not imply official endorsement or acceptance by the United Nations.
!
Aquifer
Exact location/extent of aquifer uncertain
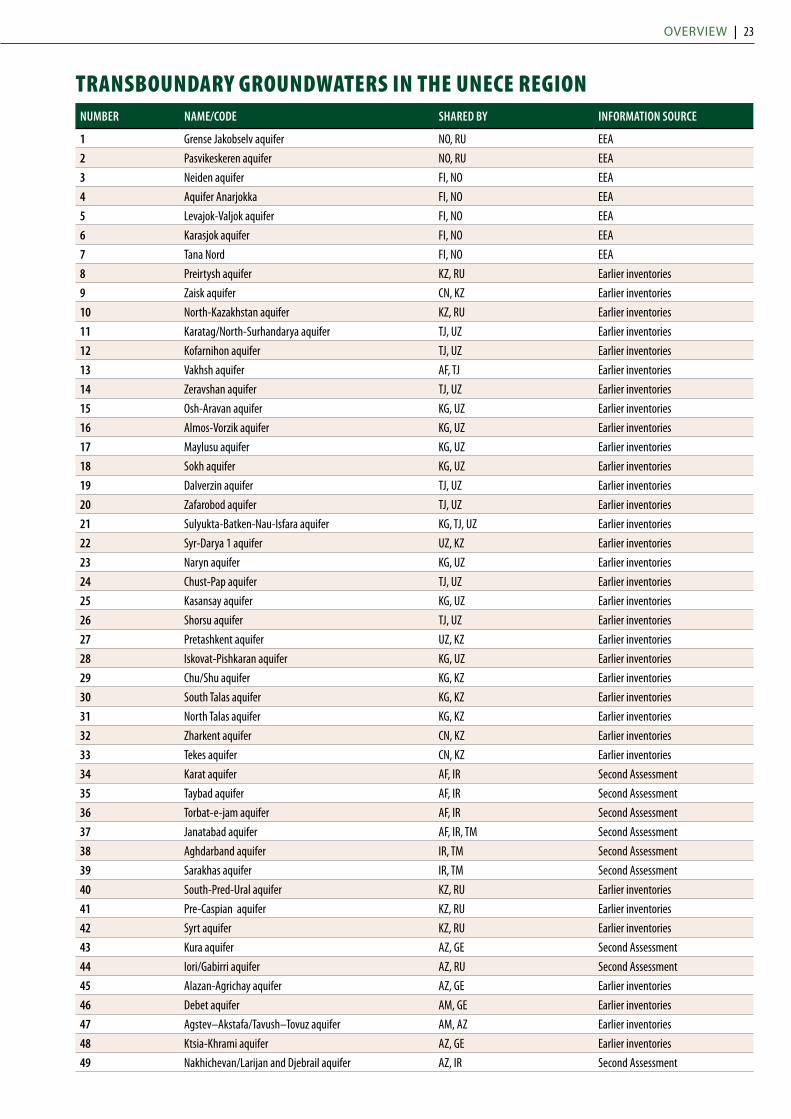
OvErviEw | 23
trAnSboundAry groundwAtErS in thE unECE rEgionNUMBeR NAMe/CoDe SHAReD BY INFoRMAtIoN SoURCe
1 Grense Jakobselv aquifer NO, RU EEA
2 Pasvikeskeren aquifer NO, RU EEA
3 Neiden aquifer FI, NO EEA
4 Aquifer Anarjokka FI, NO EEA
5 Levajok-Valjok aquifer FI, NO EEA
6 Karasjok aquifer FI, NO EEA
7 Tana Nord FI, NO EEA
8 Preirtysh aquifer KZ, RU Earlier inventories
9 Zaisk aquifer CN, KZ Earlier inventories
10 North-Kazakhstan aquifer KZ, RU Earlier inventories
11 Karatag/North-Surhandarya aquifer TJ, UZ Earlier inventories
12 Kofarnihon aquifer TJ, UZ Earlier inventories
13 Vakhsh aquifer AF, TJ Earlier inventories
14 Zeravshan aquifer TJ, UZ Earlier inventories
15 Osh-Aravan aquifer KG, UZ Earlier inventories
16 Almos-Vorzik aquifer KG, UZ Earlier inventories
17 Maylusu aquifer KG, UZ Earlier inventories
18 Sokh aquifer KG, UZ Earlier inventories
19 Dalverzin aquifer TJ, UZ Earlier inventories
20 Zafarobod aquifer TJ, UZ Earlier inventories
21 Sulyukta-Batken-Nau-Isfara aquifer KG, TJ, UZ Earlier inventories
22 Syr-Darya 1 aquifer UZ, KZ Earlier inventories
23 Naryn aquifer KG, UZ Earlier inventories
24 Chust-Pap aquifer TJ, UZ Earlier inventories
25 Kasansay aquifer KG, UZ Earlier inventories
26 Shorsu aquifer TJ, UZ Earlier inventories
27 Pretashkent aquifer UZ, KZ Earlier inventories
28 Iskovat-Pishkaran aquifer KG, UZ Earlier inventories
29 Chu/Shu aquifer KG, KZ Earlier inventories
30 South Talas aquifer KG, KZ Earlier inventories
31 North Talas aquifer KG, KZ Earlier inventories
32 Zharkent aquifer CN, KZ Earlier inventories
33 Tekes aquifer CN, KZ Earlier inventories
34 Karat aquifer AF, IR Second Assessment
35 Taybad aquifer AF, IR Second Assessment
36 Torbat-e-jam aquifer AF, IR Second Assessment
37 Janatabad aquifer AF, IR, TM Second Assessment
38 Aghdarband aquifer IR, TM Second Assessment
39 Sarakhas aquifer IR, TM Second Assessment
40 South-Pred-Ural aquifer KZ, RU Earlier inventories
41 Pre-Caspian aquifer KZ, RU Earlier inventories
42 Syrt aquifer KZ, RU Earlier inventories
43 Kura aquifer AZ, GE Second Assessment
44 Iori/Gabirri aquifer AZ, RU Second Assessment
45 Alazan-Agrichay aquifer AZ, GE Earlier inventories
46 Debet aquifer AM, GE Earlier inventories
47 Agstev–Akstafa/Tavush–Tovuz aquifer AM, AZ Earlier inventories
48 Ktsia-Khrami aquifer AZ, GE Earlier inventories
49 Nakhichevan/Larijan and Djebrail aquifer AZ, IR Second Assessment
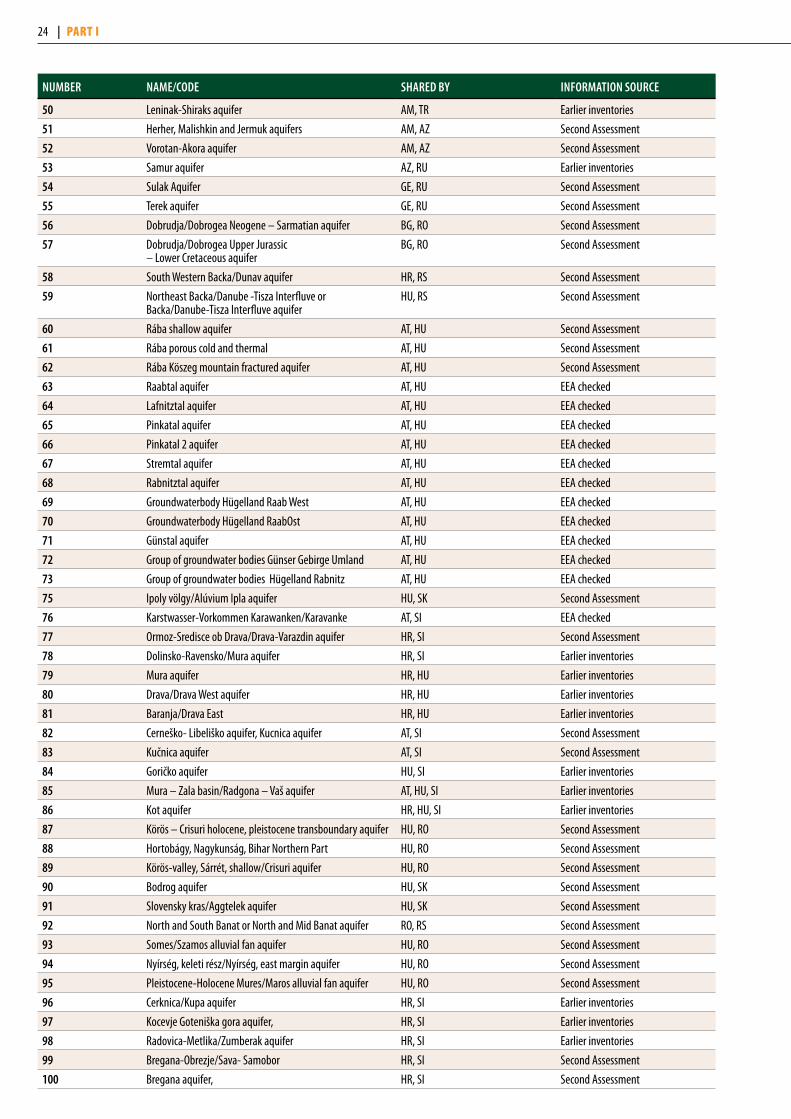
24 | PArt i
NUMBeR NAMe/CoDe SHAReD BY INFoRMAtIoN SoURCe
50 Leninak-Shiraks aquifer AM, TR Earlier inventories
51 Herher, Malishkin and Jermuk aquifers AM, AZ Second Assessment
52 Vorotan-Akora aquifer AM, AZ Second Assessment
53 Samur aquifer AZ, RU Earlier inventories
54 Sulak Aquifer GE, RU Second Assessment
55 Terek aquifer GE, RU Second Assessment
56 Dobrudja/Dobrogea Neogene – Sarmatian aquifer BG, RO Second Assessment
57 Dobrudja/Dobrogea Upper Jurassic – Lower Cretaceous aquifer
BG, RO Second Assessment
58 South Western Backa/Dunav aquifer HR, RS Second Assessment
59 Northeast Backa/Danube -Tisza Interfluve or Backa/Danube-Tisza Interfluve aquifer
HU, RS Second Assessment
60 Rába shallow aquifer AT, HU Second Assessment
61 Rába porous cold and thermal AT, HU Second Assessment
62 Rába Köszeg mountain fractured aquifer AT, HU Second Assessment
63 Raabtal aquifer AT, HU EEA checked
64 Lafnitztal aquifer AT, HU EEA checked
65 Pinkatal aquifer AT, HU EEA checked
66 Pinkatal 2 aquifer AT, HU EEA checked
67 Stremtal aquifer AT, HU EEA checked
68 Rabnitztal aquifer AT, HU EEA checked
69 Groundwaterbody Hügelland Raab West AT, HU EEA checked
70 Groundwaterbody Hügelland RaabOst AT, HU EEA checked
71 Günstal aquifer AT, HU EEA checked
72 Group of groundwater bodies Günser Gebirge Umland AT, HU EEA checked
73 Group of groundwater bodies Hügelland Rabnitz AT, HU EEA checked
75 Ipoly völgy/Alúvium Ipla aquifer HU, SK Second Assessment
76 Karstwasser-Vorkommen Karawanken/Karavanke AT, SI EEA checked
77 Ormoz-Sredisce ob Drava/Drava-Varazdin aquifer HR, SI Second Assessment
78 Dolinsko-Ravensko/Mura aquifer HR, SI Earlier inventories
79 Mura aquifer HR, HU Earlier inventories
80 Drava/Drava West aquifer HR, HU Earlier inventories
81 Baranja/Drava East HR, HU Earlier inventories
82 Cerneško- Libeliško aquifer, Kucnica aquifer AT, SI Second Assessment
83 Kučnica aquifer AT, SI Second Assessment
84 Goričko aquifer HU, SI Earlier inventories
85 Mura – Zala basin/Radgona – Vaš aquifer AT, HU, SI Earlier inventories
86 Kot aquifer HR, HU, SI Earlier inventories
87 Körös – Crisuri holocene, pleistocene transboundary aquifer HU, RO Second Assessment
88 Hortobágy, Nagykunság, Bihar Northern Part HU, RO Second Assessment
89 Körös-valley, Sárrét, shallow/Crisuri aquifer HU, RO Second Assessment
90 Bodrog aquifer HU, SK Second Assessment
91 Slovensky kras/Aggtelek aquifer HU, SK Second Assessment
92 North and South Banat or North and Mid Banat aquifer RO, RS Second Assessment
93 Somes/Szamos alluvial fan aquifer HU, RO Second Assessment
94 Nyírség, keleti rész/Nyírség, east margin aquifer HU, RO Second Assessment
95 Pleistocene-Holocene Mures/Maros alluvial fan aquifer HU, RO Second Assessment
96 Cerknica/Kupa aquifer HR, SI Earlier inventories
97 Kocevje Goteniška gora aquifer, HR, SI Earlier inventories
98 Radovica-Metlika/Zumberak aquifer HR, SI Earlier inventories
99 Bregana-Obrezje/Sava- Samobor HR, SI Second Assessment
100 Bregana aquifer, HR, SI Second Assessment
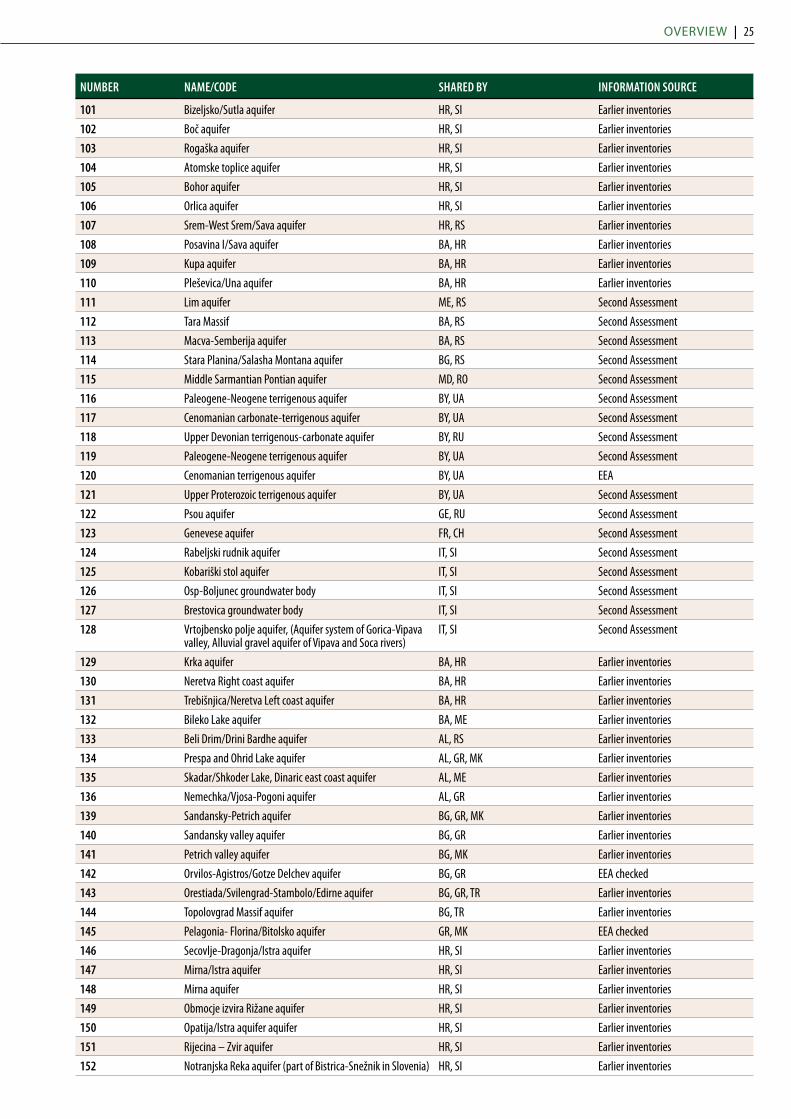
OvErviEw | 25
NUMBeR NAMe/CoDe SHAReD BY INFoRMAtIoN SoURCe
101 Bizeljsko/Sutla aquifer HR, SI Earlier inventories
102 Boč aquifer HR, SI Earlier inventories
103 Rogaška aquifer HR, SI Earlier inventories
104 Atomske toplice aquifer HR, SI Earlier inventories
105 Bohor aquifer HR, SI Earlier inventories
106 Orlica aquifer HR, SI Earlier inventories
107 Srem-West Srem/Sava aquifer HR, RS Earlier inventories
108 Posavina I/Sava aquifer BA, HR Earlier inventories
109 Kupa aquifer BA, HR Earlier inventories
110 Pleševica/Una aquifer BA, HR Earlier inventories
111 Lim aquifer ME, RS Second Assessment
112 Tara Massif BA, RS Second Assessment
113 Macva-Semberija aquifer BA, RS Second Assessment
114 Stara Planina/Salasha Montana aquifer BG, RS Second Assessment
115 Middle Sarmantian Pontian aquifer MD, RO Second Assessment
116 Paleogene-Neogene terrigenous aquifer BY, UA Second Assessment
117 Cenomanian carbonate-terrigenous aquifer BY, UA Second Assessment
118 Upper Devonian terrigenous-carbonate aquifer BY, RU Second Assessment
119 Paleogene-Neogene terrigenous aquifer BY, UA Second Assessment
120 Cenomanian terrigenous aquifer BY, UA EEA
121 Upper Proterozoic terrigenous aquifer BY, UA Second Assessment
122 Psou aquifer GE, RU Second Assessment
123 Genevese aquifer FR, CH Second Assessment
124 Rabeljski rudnik aquifer IT, SI Second Assessment
125 Kobariški stol aquifer IT, SI Second Assessment
126 Osp-Boljunec groundwater body IT, SI Second Assessment
127 Brestovica groundwater body IT, SI Second Assessment
128 Vrtojbensko polje aquifer, (Aquifer system of Gorica-Vipava valley, Alluvial gravel aquifer of Vipava and Soca rivers)
IT, SI Second Assessment
129 Krka aquifer BA, HR Earlier inventories
130 Neretva Right coast aquifer BA, HR Earlier inventories
131 Trebišnjica/Neretva Left coast aquifer BA, HR Earlier inventories
132 Bileko Lake aquifer BA, ME Earlier inventories
133 Beli Drim/Drini Bardhe aquifer AL, RS Earlier inventories
134 Prespa and Ohrid Lake aquifer AL, GR, MK Earlier inventories
135 Skadar/Shkoder Lake, Dinaric east coast aquifer AL, ME Earlier inventories
136 Nemechka/Vjosa-Pogoni aquifer AL, GR Earlier inventories
139 Sandansky-Petrich aquifer BG, GR, MK Earlier inventories
140 Sandansky valley aquifer BG, GR Earlier inventories
141 Petrich valley aquifer BG, MK Earlier inventories
142 Orvilos-Agistros/Gotze Delchev aquifer BG, GR EEA checked
143 Orestiada/Svilengrad-Stambolo/Edirne aquifer BG, GR, TR Earlier inventories
144 Topolovgrad Massif aquifer BG, TR Earlier inventories
145 Pelagonia- Florina/Bitolsko aquifer GR, MK EEA checked
146 Secovlje-Dragonja/Istra aquifer HR, SI Earlier inventories
147 Mirna/Istra aquifer HR, SI Earlier inventories
148 Mirna aquifer HR, SI Earlier inventories
149 Obmocje izvira Rižane aquifer HR, SI Earlier inventories
150 Opatija/Istra aquifer aquifer HR, SI Earlier inventories
151 Rijecina – Zvir aquifer HR, SI Earlier inventories
152 Notranjska Reka aquifer (part of Bistrica-Snežnik in Slovenia) HR, SI Earlier inventories
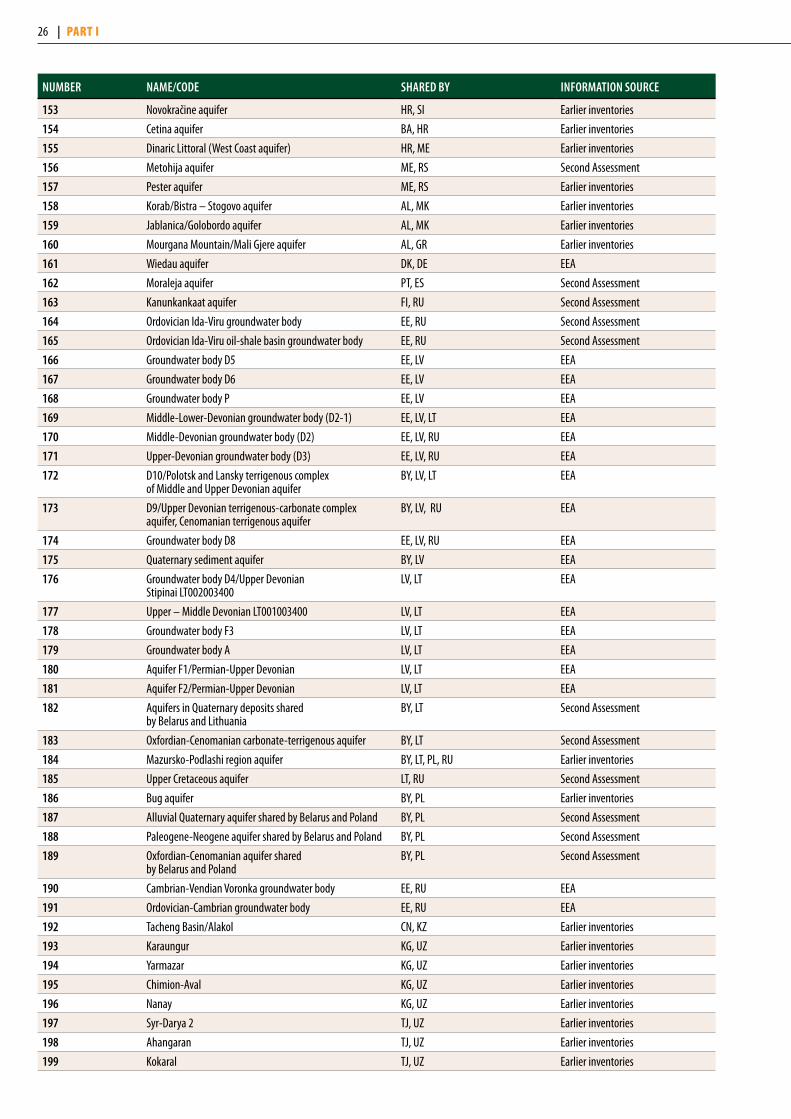
26 | PArt i
NUMBeR NAMe/CoDe SHAReD BY INFoRMAtIoN SoURCe
153 Novokračine aquifer HR, SI Earlier inventories
154 Cetina aquifer BA, HR Earlier inventories
155 Dinaric Littoral (West Coast aquifer) HR, ME Earlier inventories
156 Metohija aquifer ME, RS Second Assessment
157 Pester aquifer ME, RS Earlier inventories
158 Korab/Bistra – Stogovo aquifer AL, MK Earlier inventories
159 Jablanica/Golobordo aquifer AL, MK Earlier inventories
160 Mourgana Mountain/Mali Gjere aquifer AL, GR Earlier inventories
161 Wiedau aquifer DK, DE EEA
162 Moraleja aquifer PT, ES Second Assessment
163 Kanunkankaat aquifer FI, RU Second Assessment
164 Ordovician Ida-Viru groundwater body EE, RU Second Assessment
165 Ordovician Ida-Viru oil-shale basin groundwater body EE, RU Second Assessment
166 Groundwater body D5 EE, LV EEA
167 Groundwater body D6 EE, LV EEA
168 Groundwater body P EE, LV EEA
169 Middle-Lower-Devonian groundwater body (D2-1) EE, LV, LT EEA
170 Middle-Devonian groundwater body (D2) EE, LV, RU EEA
171 Upper-Devonian groundwater body (D3) EE, LV, RU EEA
172 D10/Polotsk and Lansky terrigenous complex of Middle and Upper Devonian aquifer
BY, LV, LT EEA
173 D9/Upper Devonian terrigenous-carbonate complex aquifer, Cenomanian terrigenous aquifer
BY, LV, RU EEA
174 Groundwater body D8 EE, LV, RU EEA
175 Quaternary sediment aquifer BY, LV EEA
176 Groundwater body D4/Upper Devonian Stipinai LT002003400
LV, LT EEA
177 Upper – Middle Devonian LT001003400 LV, LT EEA
178 Groundwater body F3 LV, LT EEA
179 Groundwater body A LV, LT EEA
180 Aquifer F1/Permian-Upper Devonian LV, LT EEA
181 Aquifer F2/Permian-Upper Devonian LV, LT EEA
182 Aquifers in Quaternary deposits shared by Belarus and Lithuania
BY, LT Second Assessment
183 Oxfordian-Cenomanian carbonate-terrigenous aquifer BY, LT Second Assessment
184 Mazursko-Podlashi region aquifer BY, LT, PL, RU Earlier inventories
185 Upper Cretaceous aquifer LT, RU Second Assessment
186 Bug aquifer BY, PL Earlier inventories
187 Alluvial Quaternary aquifer shared by Belarus and Poland BY, PL Second Assessment
188 Paleogene-Neogene aquifer shared by Belarus and Poland BY, PL Second Assessment
189 Oxfordian-Cenomanian aquifer shared by Belarus and Poland
BY, PL Second Assessment
190 Cambrian-Vendian Voronka groundwater body EE, RU EEA
191 Ordovician-Cambrian groundwater body EE, RU EEA
192 Tacheng Basin/Alakol CN, KZ Earlier inventories
193 Karaungur KG, UZ Earlier inventories
194 Yarmazar KG, UZ Earlier inventories
195 Chimion-Aval KG, UZ Earlier inventories
196 Nanay KG, UZ Earlier inventories
197 Syr-Darya 2 TJ, UZ Earlier inventories
198 Ahangaran TJ, UZ Earlier inventories
199 Kokaral TJ, UZ Earlier inventories

OvErviEw | 27
NUMBeR NAMe/CoDe SHAReD BY INFoRMAtIoN SoURCe
200 Dustlik TJ, UZ, KZ Earlier inventories
201 Havost TJ, UZ Earlier inventories
202 Syr-Darya 3 TJ, UZ Earlier inventories
203 Amudaryia AF, TJ, UZ Earlier inventories
204 Sherabad TM, UZ Earlier inventories
205 RU1 KZ, RU Earlier inventories
206 Xorezm TM, UZ Earlier inventories
207 Amu-Darya KZ, TM, UZ Earlier inventories
208 Ural KZ, RU Earlier inventories
209 RU4 KZ, RU Earlier inventories
210 RU2 KZ, RU Earlier inventories
211 RU3 KZ, RU Earlier inventories
212 Lenkoran/Astara AZ, IR Earlier inventories
213 Daugava BY, LV, LT, RU Earlier inventories
214 Pripyat BY, UA Earlier inventories
215 Siret RO, UA Earlier inventories
216 Prut MD, RO Earlier inventories
217 Dniester MD, UA Earlier inventories
218 Danube-Prut MD, RO, UA Earlier inventories
219 Malko Tarnovo kasrt waterbearing massif BG, TR Earlier inventories
220 Orestiadas System BG, GR, TR EEA checked
221 Evros/Meric GR, TR Earlier inventories
222 Erma Reka BG, GR Earlier inventories
223 Rudozem BG, GR Earlier inventories
224 Smolyan BG, GR Earlier inventories
225 Nastan-Trigrad BG, GR Earlier inventories
226 Systima Doiranis GR, MK EEA checked
227 Systima Axiou GR, MK Earlier inventories
228 Systima Triklariou Kastorias AL, GR EEA checked
229 Systima Pogonianis AL, GR EEA checked
230 Zemen BG, RS Earlier inventories
231 The former Yugoslav Republic of Macedonia - SW Serbia MK, RS Earlier inventories
232 The former Yugoslav Republic of Macedonia - Central Serbia MK, RS Earlier inventories
233 Tetovo-Gostivar MK, RS Earlier inventories
234 Dacian basin RO, RS Earlier inventories
235 Miroc & Golubac RO, RS Earlier inventories
236 Upper Pleistocenesomes alluvial fan HU, RO, RS Second Assessment
237 Danube-Tisza-interflowe/Backa aquifer HU, RS Second Assessment
238 Dunántúli középhegység északi rész/Komarnanska Vysoka Kryha
HU, SK Second Assessment
239 Komarnanska Vysoka Kryha/Dunántúli – középhegység északi rész
HU, SK Second Assessment
240 Komarnanska Vysoka Kryha/Dunántúli – középhegység északi rész
HU, SK Second Assessment
241 Szigetköz, Hanság-Rábca/Podunajska basin, Zitny Ostrov AT, HU, SK Second Assessment
242 Heideboden [DUJ] AT, HU EEA checked
243 CZ_GB_16520 AT, CZ, SK Second Assessment
244 CZ_GB_16410 AT, CZ Second Assessment
245 Flysch triestino IT, SI Second Assessment
246 Carso classico (isontino e triestino): falda freatica sviluppata in ambiente altamente carsificato, con circolazione per condotte/fessure
IT, SI Second Assessment

28 | PArt i
NUMBeR NAMe/CoDe SHAReD BY INFoRMAtIoN SoURCe
247 Alta pianura isontina IT, SI Second Assessment
248 Flysch goriziano IT, SI Second Assessment
249 Cividalese IT, SI Second Assessment
250 Canin IT, SI Second Assessment
251 Gail IT, SI Second Assessment
252 Massicci carbonatici della catena paleocarnica 3 AT, IT Second Assessment
253 Catena paleocarnica orientale - Val Canale AT, IT Second Assessment
254 Massicci carbonatici della catena paleocarnica 2 AT, IT Second Assessment
255 Catena paleocarnica centrale AT, IT Second Assessment
256 Massicci carbonatici della catena paleocarnica 1 AT, IT Second Assessment
257 Fleons-Cimon AT, IT Second Assessment
258 Deep groundwater body – thermal water AT, DE Second Assessment
259 DE_GB_Ei23 DK, DE EEA
260 DE_GB_Ei22 DK, DE EEA
261 DE_GB_3_03 DE, NL EEA
262 Domaine plissé BV Roya, Bévéra FR, IT EEA checked
263 Domaine plissé BV Cenise et Pô FR, IT EEA checked
264 Calcaires jurassiques sous couverture du Pays de Gex FR, CH EEA checked
265 Calcaires jurassiques BV de la Jougnena et Orbe FR, CH EEA checked
266 Calcaires et marnes jurassiques chaîne du Jura FR, CH EEA checked
267 Calcaires jurassiques chaîne du Jura - BV Doubs FR, CH EEA checked
268 Pliocène de Haguenau et nappe d’Alsace FR, DE, CH EEA
269 Grès vosgien en partie libre FR, DE EEA
270 Grès vosgien captif non minéralisé FR, DE EEA
271 Grès du Trias inférieur du bassin houiller FR, DE EEA
272 Grès du Lias inférieur d'Hettange Luxembourg FR, BE, LU EEA
273 cks_0200_gwl_1 BE, NL EEA
274 Socle du Brabant BE, FR EEA
275 Calcaires de l'Avesnois BE, FR EEA checked
276 Sables du Landenien d'Orchies BE, FR EEA
277 cvs_0160_gwl_1 BE, FR, NL EEA
278 Sables du Landenien des Flandres BE, FR, NL EEA
279 Zout grondwater in ondiepe zandlagen BE, NL EEA
280 Domaine plissé Pyrénées axiales et alluvions IVair AD, FR, ES EEA checked
281 Vegas Bajas PT, ES Second Assessment
282 Ciudad Rodrigo PT, ES Second Assessment
283 LOW MIÑO PT, ES Second Assessment
284 IEGBNI_NB_G_007 IE, GB EEA
285 IEGBNI_NW_G_028 IE, GB EEA
286 IE_NW_G_082 IE, GB EEA
287 IE_NW_G_082 IE, GB EEA
288 IEGBNI_NW_G_048 IE, GB EEA
289 IEGBNI_NW_G_050 IE, GB EEA
290 Quaternary sediment aquifer LV, LT Second Assessment
Note: The inventory of transboundary groundwaters is based on different sources of information. “EEA checked” information derives from the reporting by EU member States under the WFD which has been processed by EEA but not fully quality assured by the time of publication. “EEA” information was submitted to the EEA under the WFD but has not been processed by EEA. “Earlier inventories” information is based on the inventories carried out by the International Network of Water-Environment Centres for the Balkans for South-Eastern Europe in 2008, the one carried out by UNESCO and IGRAC in 2009 for the Caucasus and Central Asia, and the ones carried out under the Water Convention in 2007 (First Assessment) and in 1999. “Second Assessment” refers to information that was provided by countries in the process of preparation of the Second Assessment. Because of the large number of individual groundwater bodies (GWB), they have in some cases been grouped to form sets of GWBs. The locations and extent of a number of aquifers are only approximate because the information provided by the countries was limited. Numbers in bold in the maps indicate groundwaters assessed in the present publication.
SECond ASSESSmEnt | 29
pArt ii OBJECTivES AND SCOPE
29

30 | PArt ii
thE wAtEr ConVEntionThe Water Convention’s central aim is to strengthen measures at the, national and transboundary levels to protect and ensure the quantity, quality and sustainable use of transboundary water resources — both surface waters and groundwaters. The Conven-tion takes a holistic approach, based on the understanding that water resources play an integral part in ecosystems as well as in human societies and economies. Its commitment to integrated water resources management (IWRM) replaces an earlier focus on localized sources of pollution and management of separate components of the ecosystem. The Convention requires countries to fulfil certain obligations, from observing general principles to implementing concrete actions. These include:
• To prevent, control and reduce adverse transboundary impacts on the environment, human health and socio-economic conditions;
• To manage shared waters in a reasonable and equitable manner using the ecosystem approach and guided by the precautionary principle and the polluter-pays principle;
• To preserve and restore ecosystems;
• To carry out environmental impact assessments, draw up contingency plans, set water-quality objectives and minimize the risk of accidental water pollution.
The Convention requires Riparian Parties (Parties bordering the same transboundary waters) to enter into specific bilateral or multilateral agreements and to create institutions — joint bodies such as river and lake commissions — to meet these responsi-bilities. Riparian Parties also have other specific obligations. For example, they shall establish and implement joint programmes for monitoring the conditions of transboundary waters and, at regular intervals, carry out joint or coordinated assessments of the condition of transboundary waters and the effectiveness of measures taken to prevent, control and reduce transboundary impacts. Riparian Parties shall make the results of these assessments available to the public.
objECtiVESThe Second Assessment has been developed under the auspices of the United Nations Economic Commission for Europe (UN-ECE) Convention on the Protection and Use of Transboundary Watercourses and International Lakes (Water Convention). The Water Convention fosters sustainable management of shared wa-ter resources through stable and predictable cooperation. An im-portant obligation for Parties to achieve the Convention’s aims is to carry out, at regular intervals, joint or coordinated assessments of the conditions of transboundary waters and the effectiveness of measures taken to prevent, control and reduce transboundary impacts of their activities. Indeed, accurate assessments of the status of water resources, and the nature and magnitude of water problems, are essential for preparing proper policy actions at the local, national and transboundary levels.
The main objective of the Second Assessment is to provide an up-to-date overview of the state of transboundary waters and to identify joint priorities and challenges. This will improve the un-derstanding of the problems and strengthen the knowledge base for identification and implementation of appropriate manage-ment measures to reduce transboundary impacts and improve the status of transboundary waters. The Second Assessment is intended to serve as a tool to inform, guide and stimulate further action by Governments, river basin organizations, the interna-tional community, including donors, and concerned non-gov-ernmental organizations.
Furthermore, the process of preparing the Second Assessment supported exchange of information on the status of waters and the management measures in place or planned. It allowed ripar-ian countries to discuss and highlight needs in transboundary co-operation. The process of preparation of the Second Assessment included a series of subregional workshops which were important events to build capacity in the different countries and subregions and to promote transboundary dialogue and exchange. Also, sub-mitting data for the Second Assessment provided the countries
with an opportunity for self-assessment of water problems, avail-able policies and management responses.
A joint assessment is also important to progressively harmonize approaches. This is all the more important in the transboundary context and in a region as broad as the UNECE one, where meth-ods for water assessment and classification differ greatly between States — and not only between European Union (EU) members and non-EU countries. In order to reach a common understand-ing about the status of shared waters, the existing trends and the actions needed to improve the situation, the availability of reli-able and comparable information is of the utmost importance. The preparatory process for the Second Assessment allowed for a discussion of the existing differences in monitoring and assess-ment systems, the deriving problems regarding comparability of data and the lessons learned from those riparian countries which have harmonized or made compatible their monitoring and as-sessment systems.
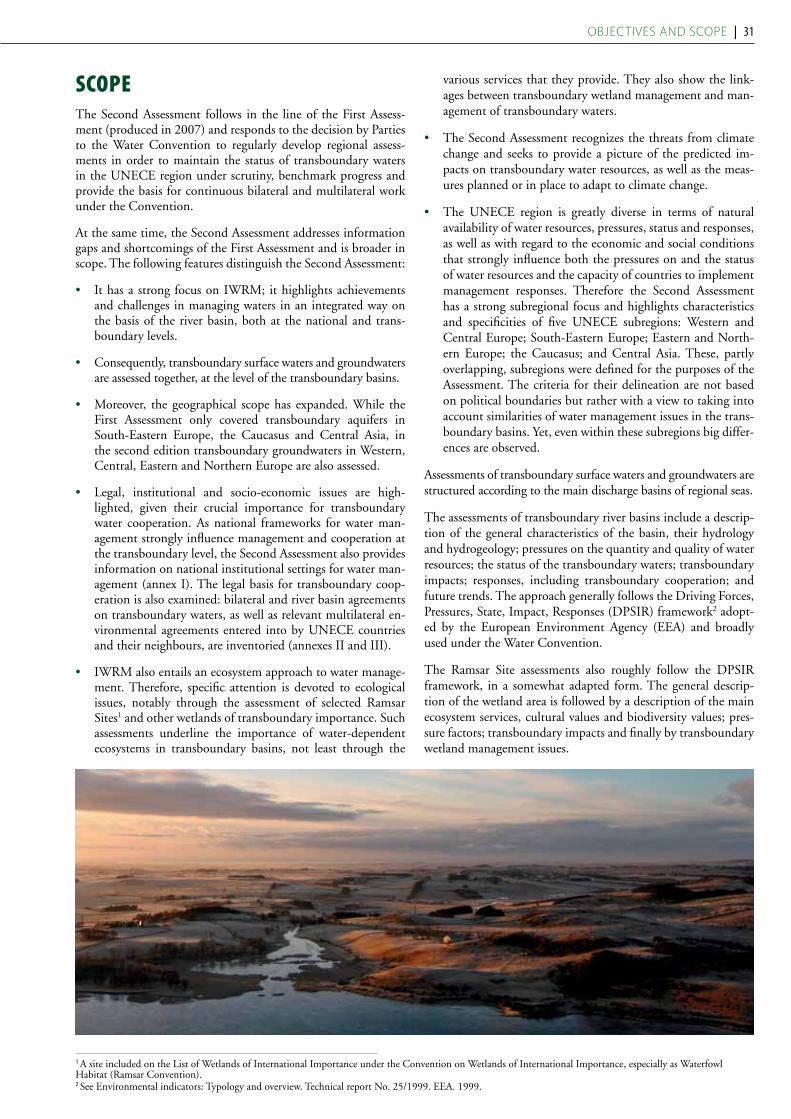
oBJECTIvES ANd SCoPE | 31
SCoPEThe Second Assessment follows in the line of the First Assess-ment (produced in 2007) and responds to the decision by Parties to the Water Convention to regularly develop regional assess-ments in order to maintain the status of transboundary waters in the UNECE region under scrutiny, benchmark progress and provide the basis for continuous bilateral and multilateral work under the Convention.
At the same time, the Second Assessment addresses information gaps and shortcomings of the First Assessment and is broader in scope. The following features distinguish the Second Assessment:
• It has a strong focus on IWRM; it highlights achievements and challenges in managing waters in an integrated way on the basis of the river basin, both at the national and trans-boundary levels.
• Consequently, transboundary surface waters and groundwaters are assessed together, at the level of the transboundary basins.
• Moreover, the geographical scope has expanded. While the First Assessment only covered transboundary aquifers in South-Eastern Europe, the Caucasus and Central Asia, in the second edition transboundary groundwaters in Western, Central, Eastern and Northern Europe are also assessed.
• Legal, institutional and socio-economic issues are high-lighted, given their crucial importance for transboundary water cooperation. As national frameworks for water man-agement strongly influence management and cooperation at the transboundary level, the Second Assessment also provides information on national institutional settings for water man-agement (annex I). The legal basis for transboundary coop-eration is also examined: bilateral and river basin agreements on transboundary waters, as well as relevant multilateral en-vironmental agreements entered into by UNECE countries and their neighbours, are inventoried (annexes II and III).
• IWRM also entails an ecosystem approach to water manage-ment. Therefore, specific attention is devoted to ecological issues, notably through the assessment of selected Ramsar Sites1 and other wetlands of transboundary importance. Such assessments underline the importance of water-dependent ecosystems in transboundary basins, not least through the
various services that they provide. They also show the link-ages between transboundary wetland management and man-agement of transboundary waters.
• The Second Assessment recognizes the threats from climate change and seeks to provide a picture of the predicted im-pacts on transboundary water resources, as well as the meas-ures planned or in place to adapt to climate change.
• The UNECE region is greatly diverse in terms of natural availability of water resources, pressures, status and responses, as well as with regard to the economic and social conditions that strongly influence both the pressures on and the status of water resources and the capacity of countries to implement management responses. Therefore the Second Assessment has a strong subregional focus and highlights characteristics and specificities of five UNECE subregions: Western and Central Europe; South-Eastern Europe; Eastern and North-ern Europe; the Caucasus; and Central Asia. These, partly overlapping, subregions were defined for the purposes of the Assessment. The criteria for their delineation are not based on political boundaries but rather with a view to taking into account similarities of water management issues in the trans-boundary basins. Yet, even within these subregions big differ-ences are observed.
Assessments of transboundary surface waters and groundwaters are structured according to the main discharge basins of regional seas.
The assessments of transboundary river basins include a descrip-tion of the general characteristics of the basin, their hydrology and hydrogeology; pressures on the quantity and quality of water resources; the status of the transboundary waters; transboundary impacts; responses, including transboundary cooperation; and future trends. The approach generally follows the Driving Forces, Pressures, State, Impact, Responses (DPSIR) framework2 adopt-ed by the European Environment Agency (EEA) and broadly used under the Water Convention.
The Ramsar Site assessments also roughly follow the DPSIR framework, in a somewhat adapted form. The general descrip-tion of the wetland area is followed by a description of the main ecosystem services, cultural values and biodiversity values; pres-sure factors; transboundary impacts and finally by transboundary wetland management issues.
1 A site included on the List of Wetlands of International Importance under the Convention on Wetlands of International Importance, especially as Waterfowl Habitat (Ramsar Convention).2 See Environmental indicators: Typology and overview. Technical report No. 25/1999. EEA. 1999.

32 | PArt ii
ProCESSBuilding on and expanding from the first edition, the Second As-sessment has been prepared in close cooperation with the envi-ronment and water administrations of some 50 countries. Experts nominated by the ministry of the environment or other ministry responsible for water resources in each country provided data and information. Most remarkably, not only the Parties to the Water Convention but also UNECE members not Parties have contrib-uted to the Assessment process. Moreover, experts from countries outside the UNECE region and sharing waters with UNECE countries — namely, Afghanistan, China, the Islamic Republic of Iran and Mongolia — also participated in the process.
A key step in the preparation of the Assessment was a series of subregional workshops, which allowed experts from the different riparian countries to work together to develop an accurate pic-ture of all transboundary waters in their subregion — both sur-face waters and groundwaters — and to discuss common issues specific to their subregion. The following workshops were held in the course of preparation of the Second Assessment.
• South-Eastern Europe (18–20 May 2009, Sarajevo, Bosnia and Herzegovina), organized with the Regional Cooperation Council, the Global Water Partnership Mediterranean and the Sava River Basin Commission;
• The Caucasus (8–10 December 2009, Tbilisi, Georgia), or-ganized with the Ministry of Environment Protection and Natural Resources of Georgia and the Regional Environmen-tal Centre for the Caucasus;
• Eastern and Northern Europe (27–29 April 2010, Kyiv, Ukraine), organized with the International Water Assessment Centre (IWAC)— the Water Convention collaborative cen-tre hosted by the Slovak Hydrometeorological Institute — in cooperation with the Ministry of Environment of Ukraine and the Ukrainian State Committee for Water Management;
• Central Asia (13–15 October 2010, Almaty, Kazakhstan), organized with the Ministry of Environment Protection of Kazakhstan, IWAC and the Regional Environmental Centre for Central Asia; and
• Western and Central Europe (8–10 February 2011, Budapest, Hungary), organized with the Ministry of Rural Development of Hungary, in the framework of the Hungarian EU Presidency.
Information from the workshops was used — in addition to the written input to the datasheets — in developing an overview of the situation in each of the subregions, including the main find-ings, tendencies and conclusions (section III).
The Convention’s Working Group on Monitoring and Assess-ment was responsible for overseeing the preparation of the Sec-ond Assessment: at its meetings draft assessment were discussed and revised by country representatives. Given its broader scope compared with the First Assessment, and the stronger focus on IWRM and governance issues, the Convention’s Working Group on Integrated Water Resources Management was also involved in the Second Assessment’s preparation. The Second Assessment was finalized and adopted by the Working Group on Monitoring and Assessment at its twelfth meeting in Geneva, held from 2 to 4 May 2011, including a special joint session with the Working Group on Integrated Water Resources Management.
SourCES oF inFormAtion The Assessment is essentially based on information submitted by countries in response to specifically designed datasheets. In the cases of the rivers Danube, Elbe, Meuse, Moselle and Saar, Oder, Rhine, Sava and Scheldt, the assessment is derived from contributions by the secretariats of the respective international commissions, mostly based on the official reports under the EU Water Framework Directive (WFD)3 and the River Basin Man-agement Plans.
In addition, the following sources of information were used:
• Information from the Global Runoff Data Centre for average annual flows;
• Data sets from GlobCover4 and from LandScan 2008 Global Population Database to address gaps in, respectively, land use/land cover and population information that was not pro-vided by countries;
• The First Assessment of Transboundary Rivers, Lakes and Groundwaters published in 2007, the Inventory of Trans-boundary Groundwaters prepared by the Task Force on Monitoring and Assessment under the Water Convention and published in 1999, as well as the 2009 inventory of trans-boundary groundwaters in the Caucasus and Central Asia prepared by the United Nations Educational, Scientific and Cultural Organization (UNESCO) and the International Groundwater Resources Assessment Centre (IGRAC);
• Geographical information system data on transboundary groundwater bodies provided by EEA and the European Top-ic Centre on Inland, Coastal and Marine Waters, based on reporting by EU member States under the WFD. These data are in a draft stage and have not been quality assured yet;
• Reports of the Intergovernmental Panel on Climate Change and national communications under the United Nations Framework Convention on Climate Change for climate change-related issues. Moreover, some replies by Caucasian countries to a survey conducted by the Water Convention’s Task Force on Water and Climate in 2008, which explored countries’ adaptation needs and the measures already under-taken, were used as complementary information;
• Environmental Performance Reviews undertaken by UN-ECE for countries in Eastern Europe, the Caucasus and Cen-tral Asia and other countries with economies in transition;
• The European environment — state and outlook 2010 (SOER 2010), prepared by EEA, in particular the thematic assessments of “Water resources: quantity and flows” and of “Freshwater quality”.
The source of information is always indicated in the Second As-sessment.
3 Directive 2000/60/EC of the European Parliament and of the Council of 23 October 2000 establishing a framework for Community action in the field of water policy.4 GlobCover is a product of the European Space Agency delivering global composites and land cover maps using as input a time series of remotely sensed imaging spectrometer data.
oBJECTIvES ANd SCoPE | 33
PArtnErS Several partners joined forces and contributed to the preparation of the Second Assessment:
• The Global Water Partnership Mediterranean assisted in the preparation of the assessment of transboundary rivers, lakes and groundwaters in South-Eastern Europe, as well as the summary of major findings for this subregion;
• IWAC assisted with regard to both substantial and practi-cal areas, in particular through the preparation of pre-filled datasheets and draft assessments, organization of subregional workshops and translations.
• The secretariat of the Convention on Wetlands of Interna-tional Importance especially as Waterfowl Habitat (Ramsar Convention) prepared the assessments of Ramsar Sites and other wetlands of transboundary importance in close coopera-tion with experts on those sites.
• The Global Resource Information Database (GRID) office of the United Nations Environment Programme/Division of Early Warning and Assessment (UNEP/DEWA/GRID-Ge-neva) prepared basin maps and accompanying graphs using various data sources in addition to those referred to earlier;
• IGRAC, working under the auspices of UNESCO and the World Meteorological Organization and funded by the Gov-ernment of the Netherlands, prepared the transboundary groundwaters maps.
The majority of the funding for the Second Assessment was pro-vided by the Ministry of Foreign Affairs of Finland. Other do-nors included the Swiss Federal Office for the Environment; the Swedish Environmental Protection Agency; the German Federal Ministry for the Environment, Nature Conservation and Nuclear Safety; the Hungarian Ministry of Rural Development; the Min-istry of Infrastructure and the Environment of the Netherlands; and the Ministry of Environment Protection of Georgia.
The Finnish Environment Institute (SYKE) provided technical and substantial guidance to the whole process.
5 Data as of July 2011.
thE rAmSAr ConVEntionThe Convention on Wetlands was signed in Ramsar, the Islamic Republic of Iran, in 1971 and entered into force in 1975. The Convention’s mission is the conservation and wise (that is, sustainable) use of all wetlands through local, regional and national actions and international cooperation, as a contribution towards achieving sustainable development throughout the world. The Convention uses a broad definition of wetlands that includes swamps and marshes, lakes and rivers, wet grasslands and peat-lands, oases, estuaries, deltas and tidal flats, near-shore marine areas, mangroves and coral reefs, and human-made sites such as fishponds, rice paddies, reservoirs and salt-pans.
As of August 2011, the Ramsar Convention has been ratified by 160 countries. These have together designated 1,950 Ramsar Sites for inclusion in the List of Wetlands of International Importance, covering more than 190 million hectares.5
The official name of the treaty, the Convention on Wetlands of International Importance especially as Waterfowl Habitat, reflects the original emphasis on the conservation of wetlands primarily as a habitat for water-birds. Since then, the Conven-tion has broadened its scope to cover all aspects of wetland conservation and wise use. Many of the listed Ramsar Sites concern wetland ecosystems that are shared between two or three countries. Thirteen of them have been formally designated as Trans-boundary Ramsar Sites, nearly all of them in Europe.
ExPlAnAtory notES For rEAding thE SECond ASSESSmEntThe Second Assessment includes a number of concepts and ap-proaches which should be explained for the benefit of the reader.
Transboundary groundwaters — aquifers and in the EU also groundwater bodies — which are connected with the surface waters of the basin or located within the basin boundaries are de-scribed as part of the basin’s assessment. The assessments of those groundwaters that are either not connected with the surface wa-ters of the basin — discharging directly to the sea for example— or for which the connection was not confirmed by the countries, have been placed at the end of the chapter.
Related to groundwaters, both the term aquifer and groundwater body occur widely in this report. An aquifer is the established sci-entific and technical term for a geological formation or material that is sufficiently porous to store water and permeable enough to
transmit water in sufficient quantities that can be economically exploited.
The widespread use of the term groundwater body is of more recent origin. Its common usage is derived from the WFD, in which surface water bodies and groundwater bodies are defined as water management units within river basins. One of the es-sential steps for EU member States in their implementation of the WFD has been to delineate and characterize bodies of surface water and groundwater. While the European Commis-sion provided guidance on the methods to be used to delineate groundwater bodies, there are still variations in national ap-proaches, partly due to the wide range of geological settings. In most cases, aquifers are subdivided hydrologically into ground-water bodies, although there are cases where groundwater bod-ies contain more than one aquifer. For the Western and Central Europe subregion, some of the transboundary river basins con-tain large numbers of groundwater bodies. Where the aquifer containing them is crossed by a national border, the respective groundwater bodies on each side may have been designated as

34 | PArt ii
transboundary, but not always. This could be a political choice, but even from a hydrogeological point of view, this could be quite rational.6
Because of the two different types of groundwater units involved, presenting information in a consistent way in map form at a suitable scale for the whole region covered by this assessment is
problematic. The difficulties are especially acute for the West-ern and Central European subregion, and to some extent also in South-Eastern Europe. Firstly, individual groundwater bodies are in many locations too small to appear at the selected map scale and, secondly, there are many areas where boundary rather than transboundary groundwater bodies have been designated by ei-ther or both countries, even where it is clear that a major aquifer traverses the national boundary.
When the information has been sufficient, the transboundary groundwaters have been classified into four types, which were al-ready used in the First Assessment and are illustrated in figure 1 below. In some cases the countries sharing the aquifer classified it differently and then both types are indicated. In some other cases the countries have provided sketches of the aquifers.
In the tables of total water withdrawal in the basin and with-drawals by sector, only consumptive water use related to energy generation was to be included as withdrawal for energy, but some countries have quoted separately the volume of non-consumptive diversion of water, which occurs related to, e.g., hydropower gen-eration.
Information on water quality classification is based on national assessment systems, which renders comparison between river basins difficult. Information on the status of water bodies in basins shared by EU member States refers to the classifications in accordance with the WFD. In many countries in Eastern Europe, the Caucasus and Central Asia, the quality status of waters is described using a Water Pollution Index, which is defined on the basis of the ratios of measured values and the “maximum allowable concentration of pollutants for a specific water use” (MAC).
6 If the national boundary follows either an elevated watershed recharge area or a major river (types 1 and 3 in figure 1 above), there may be no groundwater flow across the border, and no requirement for groundwater bodies on each side of the border to be considered as transboundary for joint management purposes. They may be considered instead as “boundary” groundwater bodies. In practice the groundwater divide may not continually follow the topographic divide, changing seasonally or over time as a result of pumping, and in such cases there would clearly be a case for joint management of a transboundary groundwater body.
Type 1: State border follows surface water catchment and groundwater divide, little transboundary groundwater flow.
Type 2: Surface water and groundwater divides separate from state border, recharge in one country, discharge in adjacent.
Type 3: State border follows major river or lake, alluvial aquifer connected to river, little transboundary flow.
Type 4: Large deep aquifer, recharged far from border, not connected to local surface water and groundwater.
FIGURe 1: General conceptual models (types, numbered 1 to 4) according to which transboundary aquifers have been classified in the Second Assessment
Phot
o by T
obias
Salat
he
PART III MAJOR FINDINGS OF THE ASSESSMENT
35
37
47
54
61
66
36 | PART III
ChAPTeR 1: Western and Central europe
ChAPTeR 2: south-eastern europe
ChAPTeR 3: eastern and northern europe
ChAPTeR 4: CauCasus
ChAPTeR 5: Central asia
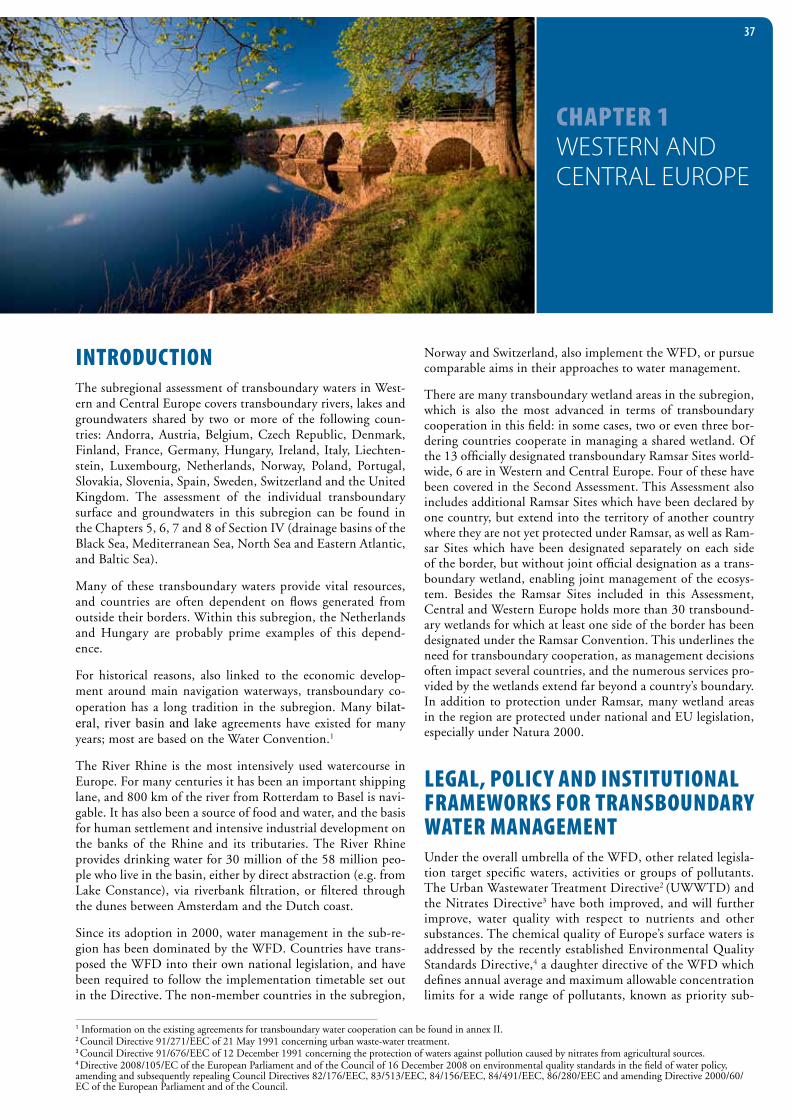
ChAPTeR 1 Western and Central europe
37
InTRoduCTIonThe subregional assessment of transboundary waters in West-ern and Central Europe covers transboundary rivers, lakes and groundwaters shared by two or more of the following coun-tries: Andorra, Austria, Belgium, Czech Republic, Denmark, Finland, France, Germany, Hungary, Ireland, Italy, Liechten-stein, Luxembourg, Netherlands, Norway, Poland, Portugal, Slovakia, Slovenia, Spain, Sweden, Switzerland and the United Kingdom. The assessment of the individual transboundary surface and groundwaters in this subregion can be found in the Chapters 5, 6, 7 and 8 of Section IV (drainage basins of the Black Sea, Mediterranean Sea, North Sea and Eastern Atlantic, and Baltic Sea).
Many of these transboundary waters provide vital resources, and countries are often dependent on flows generated from outside their borders. Within this subregion, the Netherlands and Hungary are probably prime examples of this depend-ence.
For historical reasons, also linked to the economic develop-ment around main navigation waterways, transboundary co-operation has a long tradition in the subregion. Many bilat-eral, river basin and lake agreements have existed for many years; most are based on the Water Convention.1
The River Rhine is the most intensively used watercourse in Europe. For many centuries it has been an important shipping lane, and 800 km of the river from Rotterdam to Basel is navi-gable. It has also been a source of food and water, and the basis for human settlement and intensive industrial development on the banks of the Rhine and its tributaries. The River Rhine provides drinking water for 30 million of the 58 million peo-ple who live in the basin, either by direct abstraction (e.g. from Lake Constance), via riverbank filtration, or filtered through the dunes between Amsterdam and the Dutch coast.
Since its adoption in 2000, water management in the sub-re-gion has been dominated by the WFD. Countries have trans-posed the WFD into their own national legislation, and have been required to follow the implementation timetable set out in the Directive. The non-member countries in the subregion,
Norway and Switzerland, also implement the WFD, or pursue comparable aims in their approaches to water management.
There are many transboundary wetland areas in the subregion, which is also the most advanced in terms of transboundary cooperation in this field: in some cases, two or even three bor-dering countries cooperate in managing a shared wetland. Of the 13 officially designated transboundary Ramsar Sites world-wide, 6 are in Western and Central Europe. Four of these have been covered in the Second Assessment. This Assessment also includes additional Ramsar Sites which have been declared by one country, but extend into the territory of another country where they are not yet protected under Ramsar, as well as Ram-sar Sites which have been designated separately on each side of the border, but without joint official designation as a trans-boundary wetland, enabling joint management of the ecosys-tem. Besides the Ramsar Sites included in this Assessment, Central and Western Europe holds more than 30 transbound-ary wetlands for which at least one side of the border has been designated under the Ramsar Convention. This underlines the need for transboundary cooperation, as management decisions often impact several countries, and the numerous services pro-vided by the wetlands extend far beyond a country’s boundary. In addition to protection under Ramsar, many wetland areas in the region are protected under national and EU legislation, especially under Natura 2000.
LegAL, PoLIC y And InsTITuTIonAL fRAmewoRks foR TRAnsboundARy wATeR mAnAgemenTUnder the overall umbrella of the WFD, other related legisla-tion target specific waters, activities or groups of pollutants. The Urban Wastewater Treatment Directive2 (UWWTD) and the Nitrates Directive3 have both improved, and will further improve, water quality with respect to nutrients and other substances. The chemical quality of Europe’s surface waters is addressed by the recently established Environmental Quality Standards Directive,4 a daughter directive of the WFD which defines annual average and maximum allowable concentration limits for a wide range of pollutants, known as priority sub-
1 Information on the existing agreements for transboundary water cooperation can be found in annex II. 2 Council Directive 91/271/EEC of 21 May 1991 concerning urban waste-water treatment.3 Council Directive 91/676/EEC of 12 December 1991 concerning the protection of waters against pollution caused by nitrates from agricultural sources.4 Directive 2008/105/EC of the European Parliament and of the Council of 16 December 2008 on environmental quality standards in the field of water policy, amending and subsequently repealing Council Directives 82/176/EEC, 83/513/EEC, 84/156/EEC, 84/491/EEC, 86/280/EEC and amending Directive 2000/60/EC of the European Parliament and of the Council.
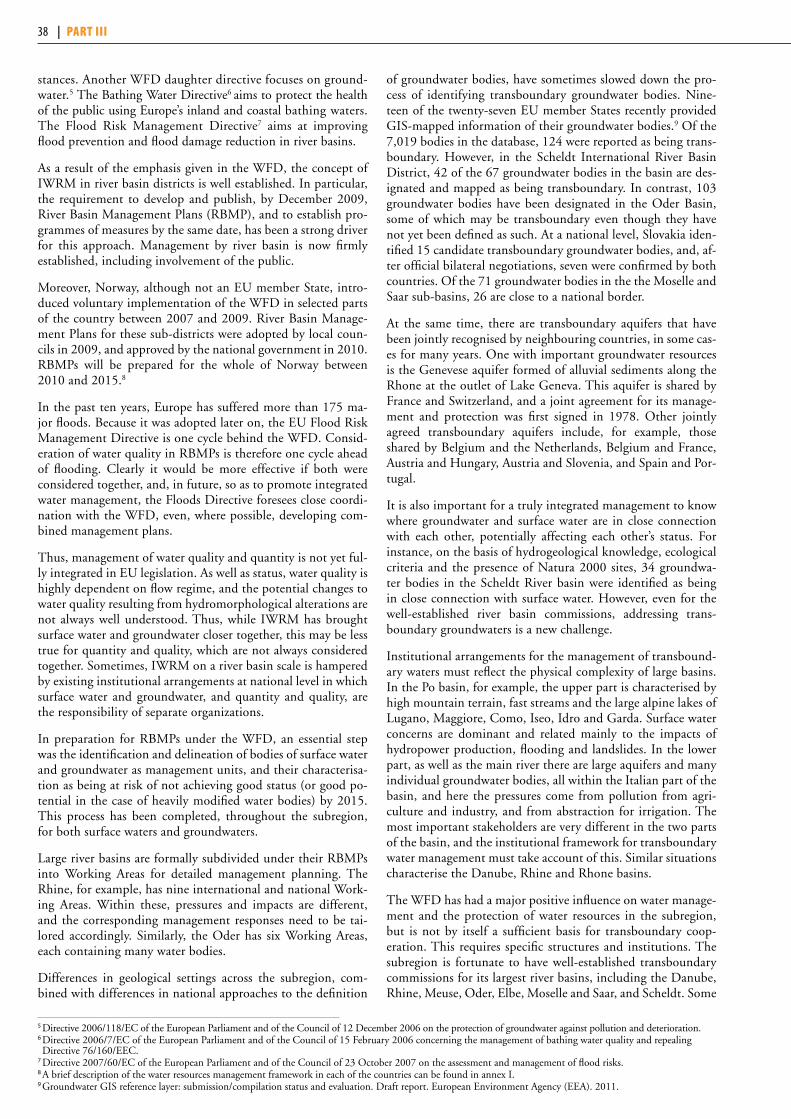
38 | PART III
5 Directive 2006/118/EC of the European Parliament and of the Council of 12 December 2006 on the protection of groundwater against pollution and deterioration.6 Directive 2006/7/EC of the European Parliament and of the Council of 15 February 2006 concerning the management of bathing water quality and repealing Directive 76/160/EEC.
7 Directive 2007/60/EC of the European Parliament and of the Council of 23 October 2007 on the assessment and management of flood risks.8 A brief description of the water resources management framework in each of the countries can be found in annex I.9 Groundwater GIS reference layer: submission/compilation status and evaluation. Draft report. European Environment Agency (EEA). 2011.
stances. Another WFD daughter directive focuses on ground-water.5 The Bathing Water Directive6 aims to protect the health of the public using Europe’s inland and coastal bathing waters. The Flood Risk Management Directive7 aims at improving flood prevention and flood damage reduction in river basins.
As a result of the emphasis given in the WFD, the concept of IWRM in river basin districts is well established. In particular, the requirement to develop and publish, by December 2009, River Basin Management Plans (RBMP), and to establish pro-grammes of measures by the same date, has been a strong driver for this approach. Management by river basin is now firmly established, including involvement of the public.
Moreover, Norway, although not an EU member State, intro-duced voluntary implementation of the WFD in selected parts of the country between 2007 and 2009. River Basin Manage-ment Plans for these sub-districts were adopted by local coun-cils in 2009, and approved by the national government in 2010. RBMPs will be prepared for the whole of Norway between 2010 and 2015.8
In the past ten years, Europe has suffered more than 175 ma-jor floods. Because it was adopted later on, the EU Flood Risk Management Directive is one cycle behind the WFD. Consid-eration of water quality in RBMPs is therefore one cycle ahead of flooding. Clearly it would be more effective if both were considered together, and, in future, so as to promote integrated water management, the Floods Directive foresees close coordi-nation with the WFD, even, where possible, developing com-bined management plans.
Thus, management of water quality and quantity is not yet ful-ly integrated in EU legislation. As well as status, water quality is highly dependent on flow regime, and the potential changes to water quality resulting from hydromorphological alterations are not always well understood. Thus, while IWRM has brought surface water and groundwater closer together, this may be less true for quantity and quality, which are not always considered together. Sometimes, IWRM on a river basin scale is hampered by existing institutional arrangements at national level in which surface water and groundwater, and quantity and quality, are the responsibility of separate organizations.
In preparation for RBMPs under the WFD, an essential step was the identification and delineation of bodies of surface water and groundwater as management units, and their characterisa-tion as being at risk of not achieving good status (or good po-tential in the case of heavily modified water bodies) by 2015. This process has been completed, throughout the subregion, for both surface waters and groundwaters.
Large river basins are formally subdivided under their RBMPs into Working Areas for detailed management planning. The Rhine, for example, has nine international and national Work-ing Areas. Within these, pressures and impacts are different, and the corresponding management responses need to be tai-lored accordingly. Similarly, the Oder has six Working Areas, each containing many water bodies.
Differences in geological settings across the subregion, com-bined with differences in national approaches to the definition
of groundwater bodies, have sometimes slowed down the pro-cess of identifying transboundary groundwater bodies. Nine-teen of the twenty-seven EU member States recently provided GIS-mapped information of their groundwater bodies.9 Of the 7,019 bodies in the database, 124 were reported as being trans-boundary. However, in the Scheldt International River Basin District, 42 of the 67 groundwater bodies in the basin are des-ignated and mapped as being transboundary. In contrast, 103 groundwater bodies have been designated in the Oder Basin, some of which may be transboundary even though they have not yet been defined as such. At a national level, Slovakia iden-tified 15 candidate transboundary groundwater bodies, and, af-ter official bilateral negotiations, seven were confirmed by both countries. Of the 71 groundwater bodies in the the Moselle and Saar sub-basins, 26 are close to a national border.
At the same time, there are transboundary aquifers that have been jointly recognised by neighbouring countries, in some cas-es for many years. One with important groundwater resources is the Genevese aquifer formed of alluvial sediments along the Rhone at the outlet of Lake Geneva. This aquifer is shared by France and Switzerland, and a joint agreement for its manage-ment and protection was first signed in 1978. Other jointly agreed transboundary aquifers include, for example, those shared by Belgium and the Netherlands, Belgium and France, Austria and Hungary, Austria and Slovenia, and Spain and Por-tugal.
It is also important for a truly integrated management to know where groundwater and surface water are in close connection with each other, potentially affecting each other’s status. For instance, on the basis of hydrogeological knowledge, ecological criteria and the presence of Natura 2000 sites, 34 groundwa-ter bodies in the Scheldt River basin were identified as being in close connection with surface water. However, even for the well-established river basin commissions, addressing trans-boundary groundwaters is a new challenge.
Institutional arrangements for the management of transbound-ary waters must reflect the physical complexity of large basins. In the Po basin, for example, the upper part is characterised by high mountain terrain, fast streams and the large alpine lakes of Lugano, Maggiore, Como, Iseo, Idro and Garda. Surface water concerns are dominant and related mainly to the impacts of hydropower production, flooding and landslides. In the lower part, as well as the main river there are large aquifers and many individual groundwater bodies, all within the Italian part of the basin, and here the pressures come from pollution from agri-culture and industry, and from abstraction for irrigation. The most important stakeholders are very different in the two parts of the basin, and the institutional framework for transboundary water management must take account of this. Similar situations characterise the Danube, Rhine and Rhone basins.
The WFD has had a major positive influence on water manage-ment and the protection of water resources in the subregion, but is not by itself a sufficient basis for transboundary coop-eration. This requires specific structures and institutions. The subregion is fortunate to have well-established transboundary commissions for its largest river basins, including the Danube, Rhine, Meuse, Oder, Elbe, Moselle and Saar, and Scheldt. Some
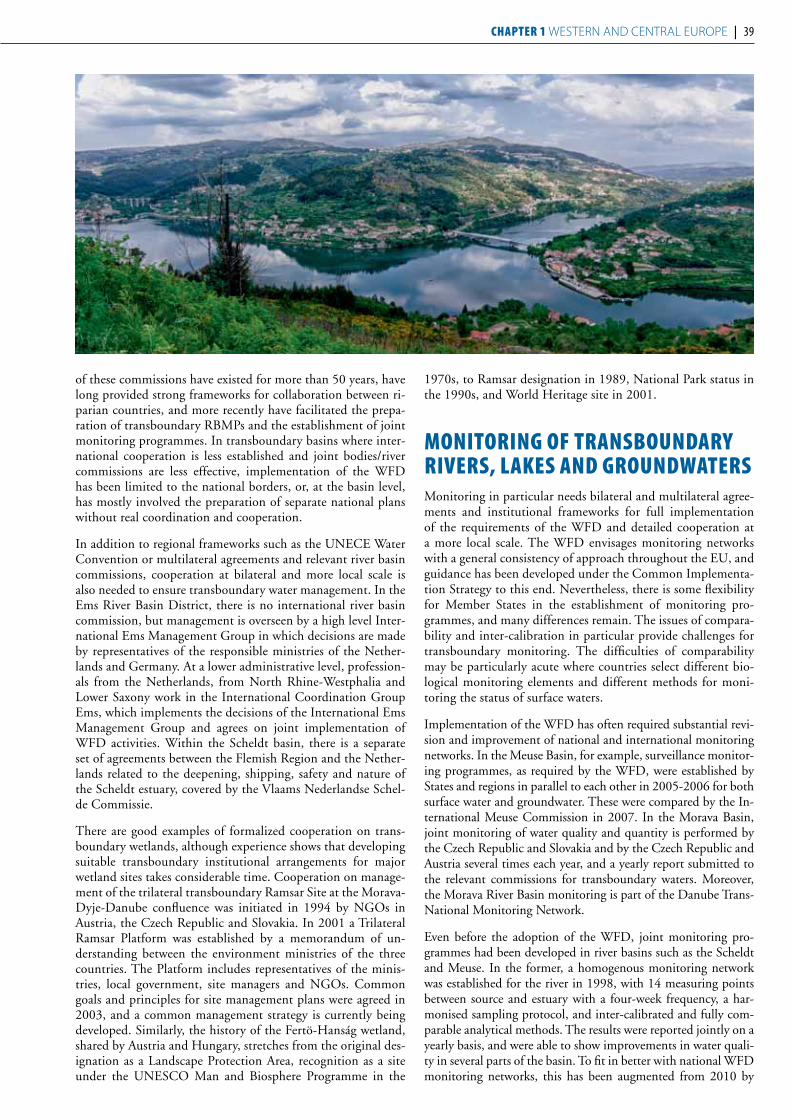
ChAPTeR 1 Western and Central europe | 39
of these commissions have existed for more than 50 years, have long provided strong frameworks for collaboration between ri-parian countries, and more recently have facilitated the prepa-ration of transboundary RBMPs and the establishment of joint monitoring programmes. In transboundary basins where inter-national cooperation is less established and joint bodies/river commissions are less effective, implementation of the WFD has been limited to the national borders, or, at the basin level, has mostly involved the preparation of separate national plans without real coordination and cooperation.
In addition to regional frameworks such as the UNECE Water Convention or multilateral agreements and relevant river basin commissions, cooperation at bilateral and more local scale is also needed to ensure transboundary water management. In the Ems River Basin District, there is no international river basin commission, but management is overseen by a high level Inter-national Ems Management Group in which decisions are made by representatives of the responsible ministries of the Nether-lands and Germany. At a lower administrative level, profession-als from the Netherlands, from North Rhine-Westphalia and Lower Saxony work in the International Coordination Group Ems, which implements the decisions of the International Ems Management Group and agrees on joint implementation of WFD activities. Within the Scheldt basin, there is a separate set of agreements between the Flemish Region and the Nether-lands related to the deepening, shipping, safety and nature of the Scheldt estuary, covered by the Vlaams Nederlandse Schel-de Commissie.
There are good examples of formalized cooperation on trans-boundary wetlands, although experience shows that developing suitable transboundary institutional arrangements for major wetland sites takes considerable time. Cooperation on manage-ment of the trilateral transboundary Ramsar Site at the Morava-Dyje-Danube confluence was initiated in 1994 by NGOs in Austria, the Czech Republic and Slovakia. In 2001 a Trilateral Ramsar Platform was established by a memorandum of un-derstanding between the environment ministries of the three countries. The Platform includes representatives of the minis-tries, local government, site managers and NGOs. Common goals and principles for site management plans were agreed in 2003, and a common management strategy is currently being developed. Similarly, the history of the Fertö-Hanság wetland, shared by Austria and Hungary, stretches from the original des-ignation as a Landscape Protection Area, recognition as a site under the UNESCO Man and Biosphere Programme in the
1970s, to Ramsar designation in 1989, National Park status in the 1990s, and World Heritage site in 2001.
monIToRIng of TRAnsboundARy RIveRs, LAkes And gRoundwATeRsMonitoring in particular needs bilateral and multilateral agree-ments and institutional frameworks for full implementation of the requirements of the WFD and detailed cooperation at a more local scale. The WFD envisages monitoring networks with a general consistency of approach throughout the EU, and guidance has been developed under the Common Implementa-tion Strategy to this end. Nevertheless, there is some flexibility for Member States in the establishment of monitoring pro-grammes, and many differences remain. The issues of compara-bility and inter-calibration in particular provide challenges for transboundary monitoring. The difficulties of comparability may be particularly acute where countries select different bio-logical monitoring elements and different methods for moni-toring the status of surface waters.
Implementation of the WFD has often required substantial revi-sion and improvement of national and international monitoring networks. In the Meuse Basin, for example, surveillance monitor-ing programmes, as required by the WFD, were established by States and regions in parallel to each other in 2005-2006 for both surface water and groundwater. These were compared by the In-ternational Meuse Commission in 2007. In the Morava Basin, joint monitoring of water quality and quantity is performed by the Czech Republic and Slovakia and by the Czech Republic and Austria several times each year, and a yearly report submitted to the relevant commissions for transboundary waters. Moreover, the Morava River Basin monitoring is part of the Danube Trans-National Monitoring Network.
Even before the adoption of the WFD, joint monitoring pro-grammes had been developed in river basins such as the Scheldt and Meuse. In the former, a homogenous monitoring network was established for the river in 1998, with 14 measuring points between source and estuary with a four-week frequency, a har-monised sampling protocol, and inter-calibrated and fully com-parable analytical methods. The results were reported jointly on a yearly basis, and were able to show improvements in water quali-ty in several parts of the basin. To fit in better with national WFD monitoring networks, this has been augmented from 2010 by
40 | PART III
sampling from 22 more locations, and the analysis of additional parameters. Coordination of groundwater monitoring in the ba-sin focuses in particular on the quantitative and qualitative status of the 42 groundwater bodies which belong to transboundary aquifers composed of the Carboniferous Chalk, the Brusselian sands and the coastal Flemish-Dutch alluvium. A coordinated transboundary waters monitoring programme has also been es-tablished by Spain and Portugal for the Miño/Minho Basin.
While groundwater monitoring is being enhanced, knowledge of status and trends for both quantity and quality is generally less comprehensive than for surface water. Groundwater bodies are monitored for both quantitative and chemical status. For the for-mer, critical parameters are the volume of available groundwater resources, the amount abstracted and the groundwater levels. In the Oder Basin, as in many similar locations, complex multi-layer aquifer systems require the different levels to be separately monitored.
Many of the countries of this subregion have had national moni-toring programmes for quantity and quality of surface waters and groundwater for many years. These have often produced long time series of historical data for river flows, spring discharges and groundwater levels, and for some chemical parameters such as nitrate. It is important that revisions of monitoring programmes in accordance with the WFD ensure comparability and continu-ity with this historical data, which has great value in relation to the assessment of climate change impacts, the effects of land use change, water quality trends, and the beneficial impacts of pro-grammes of measures.
mAIn PRobLems, ImPACTs And sTATus Compared with some of the other subregions covered by this As-sessment, water is relatively abundant and water scarcity is easier to manage in Western and Central Europe. Overall, less than 20% of the available water resources are used each year.10
However, water availability and populations are unevenly dis-tributed through the subregion and within countries, and wa-ter scarcity occurs widely, especially in the southern parts of the subregion, where demand is often met by transfers from other river basins, water reuse, and desalination. However, in the rest of the subregion, large areas are also affected by water scarcity and droughts. A comparison of the impacts of droughts in the EU between 1976-1990 and 1991-2006 shows a doubling of both area and population affected.11 As an example, the 2004/2005 hydrological year saw one of the worst droughts ever recorded in the Iberian Peninsula, with less than half of the average precipita-tion, much reduced river flows, a 40% reduction in hydropower generation, and a 40% decline in cereal production.12
Intensification of agriculture continues to be a major pressure factor. From a water quantity point of view, this is manifested in increased abstraction for irrigation, mainly in the southern coun-tries. In the Spanish parts of the Duero and Guadiana basins, respectively 92% and 88% of water withdrawal is for agricultural use. Water abstraction for irrigation is also a major pressure factor in the Po Basin, being 80% of the total water use. Over-exploi-tation of groundwater has resulted in declining water levels, salt
water intrusion and the drying up of wetlands. Water demand in summer for agriculture and tourism is particularly acute in the coastal regions and islands of the Mediterranean.
Groundwater abstraction is a major pressure in many parts of the sub-region. In the Scheldt Basin it is estimated that 844 × 106 m3 of groundwater is abstracted per year, of which 581 × 106 m3 is for drinking water supply. Groundwater abstraction for agricul-tural irrigation is a major pressure on the aquifers in the Tejo/Tajo Basin and elsewhere in Spain.
Hydromorphological changes disturb the natural flow and sedi-ment regime of rivers, hinder the achievement of ecological ob-jectives, destroy habitats for fish and other water organisms, and prevent fish migration. These structural changes take two main forms – river bed straightening and maintenance to enable water transport and prevent flooding, and the construction of trans-verse structures for electricity generation, flood protection, flow regulation or water supply, or combinations of these objectives. Almost all of the transboundary river basins experience hydro-morphological changes as a major pressure, often extending back to the industrial development of the subregion. For many dec-ades the Moselle and Saar have been developed as major shipping routes, and the 28 locks on the Moselle and 6 on the Saar present barriers to fish migration.
During the last two centuries there has been a marked increase in the size and number of large storage reservoirs, and there are now more than 7,000 large dams in Europe and thousands of smaller ones.13 Hydropower provided 16% of electricity generation in Europe in 2008, mainly in the northern and alpine countries, and mostly from large dams and reservoirs. Inland waterway transport plays an important role in the movement of goods in Europe, with more than 4,000 km of navigable waterways. 20 of the 27 Member States have inland waterways, 12 of which have interconnected transboundary networks. Thus, these major and long-established civil engineering works, in existence for many decades, mean that the original, natural state of the rivers prob-ably cannot be known.
The importance of the resulting hydromorphological changes was recognised in the WFD by the concept of “heavily modified” water bodies. In their first characterisation of river basins un-der the WFD, most EU member States indicated that pressures derived from urban development, flood defence, power genera-tion, navigation and river straightening and land drainage were important in affecting the hydromorphological status of water bodies. Four Member States, Netherlands, Belgium, Slovakia and the Czech Republic provisionally identified more than 50% of surface water bodies as being heavily modified or artificial, largely in the transboundary Rhine, Meuse and Oder Basins.14
In the International Oder River Basin District, 227 surface water bodies are considered to be artificial and 294 heavily modified, out of a total of 2,574. In the Scheldt, the proportion of heavily modified water bodies varies between 26% and 67% in the four riparian countries, and artificial water bodies between 12% and 33%. For the Elbe Basin, of a total of 3,896 surface water bod-ies, 777 are classified as artificial and 1,016 as heavily modified. Hydromorphological modifications have been even greater in the Rhine Basin, with three major phases of river regulation taking place since the 19th century. Many barrages and locks were built
10 Source: Water resources across Europe: confronting water scarcity and drought. EEA Report 2/2009. EEA. 2009. 11 Source: The European Environment: State and Outlook 2010. EEA. 2010.12 Source: García-Hernandez and others. The outstanding 2004/05 drought in the Iberian Peninsula, Journal of Hydrometeorology, 8 (3). 2007.13 Source: Water resources across Europe: confronting water scarcity and drought. EEA Report 2/2009. EEA. 2009.14 Source: First report on the implementation of the Water Framework Directive 2000/60/EC. EC, 2007.
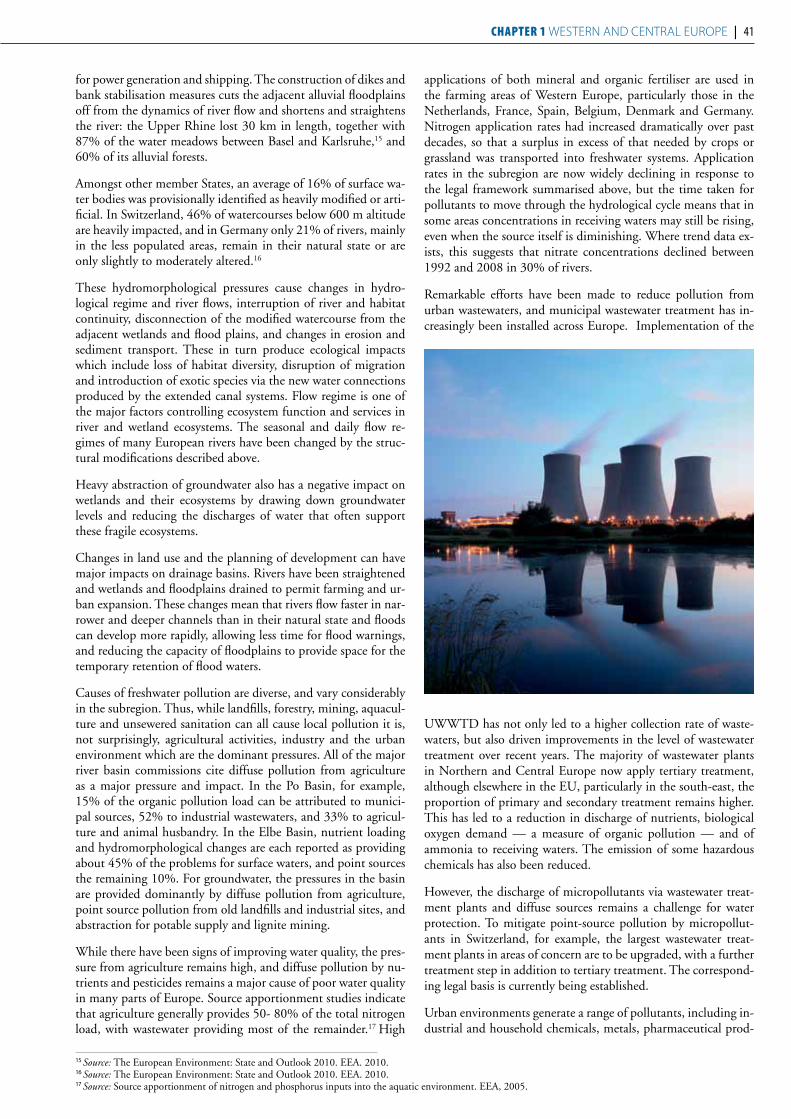
ChAPTeR 1 Western and Central europe | 41
for power generation and shipping. The construction of dikes and bank stabilisation measures cuts the adjacent alluvial floodplains off from the dynamics of river flow and shortens and straightens the river: the Upper Rhine lost 30 km in length, together with 87% of the water meadows between Basel and Karlsruhe,15 and 60% of its alluvial forests.
Amongst other member States, an average of 16% of surface wa-ter bodies was provisionally identified as heavily modified or arti-ficial. In Switzerland, 46% of watercourses below 600 m altitude are heavily impacted, and in Germany only 21% of rivers, mainly in the less populated areas, remain in their natural state or are only slightly to moderately altered.16
These hydromorphological pressures cause changes in hydro-logical regime and river flows, interruption of river and habitat continuity, disconnection of the modified watercourse from the adjacent wetlands and flood plains, and changes in erosion and sediment transport. These in turn produce ecological impacts which include loss of habitat diversity, disruption of migration and introduction of exotic species via the new water connections produced by the extended canal systems. Flow regime is one of the major factors controlling ecosystem function and services in river and wetland ecosystems. The seasonal and daily flow re-gimes of many European rivers have been changed by the struc-tural modifications described above.
Heavy abstraction of groundwater also has a negative impact on wetlands and their ecosystems by drawing down groundwater levels and reducing the discharges of water that often support these fragile ecosystems.
Changes in land use and the planning of development can have major impacts on drainage basins. Rivers have been straightened and wetlands and floodplains drained to permit farming and ur-ban expansion. These changes mean that rivers flow faster in nar-rower and deeper channels than in their natural state and floods can develop more rapidly, allowing less time for flood warnings, and reducing the capacity of floodplains to provide space for the temporary retention of flood waters.
Causes of freshwater pollution are diverse, and vary considerably in the subregion. Thus, while landfills, forestry, mining, aquacul-ture and unsewered sanitation can all cause local pollution it is, not surprisingly, agricultural activities, industry and the urban environment which are the dominant pressures. All of the major river basin commissions cite diffuse pollution from agriculture as a major pressure and impact. In the Po Basin, for example, 15% of the organic pollution load can be attributed to munici-pal sources, 52% to industrial wastewaters, and 33% to agricul-ture and animal husbandry. In the Elbe Basin, nutrient loading and hydromorphological changes are each reported as providing about 45% of the problems for surface waters, and point sources the remaining 10%. For groundwater, the pressures in the basin are provided dominantly by diffuse pollution from agriculture, point source pollution from old landfills and industrial sites, and abstraction for potable supply and lignite mining.
While there have been signs of improving water quality, the pres-sure from agriculture remains high, and diffuse pollution by nu-trients and pesticides remains a major cause of poor water quality in many parts of Europe. Source apportionment studies indicate that agriculture generally provides 50- 80% of the total nitrogen load, with wastewater providing most of the remainder.17 High
applications of both mineral and organic fertiliser are used in the farming areas of Western Europe, particularly those in the Netherlands, France, Spain, Belgium, Denmark and Germany. Nitrogen application rates had increased dramatically over past decades, so that a surplus in excess of that needed by crops or grassland was transported into freshwater systems. Application rates in the subregion are now widely declining in response to the legal framework summarised above, but the time taken for pollutants to move through the hydrological cycle means that in some areas concentrations in receiving waters may still be rising, even when the source itself is diminishing. Where trend data ex-ists, this suggests that nitrate concentrations declined between 1992 and 2008 in 30% of rivers.
Remarkable efforts have been made to reduce pollution from urban wastewaters, and municipal wastewater treatment has in-creasingly been installed across Europe. Implementation of the
UWWTD has not only led to a higher collection rate of waste-waters, but also driven improvements in the level of wastewater treatment over recent years. The majority of wastewater plants in Northern and Central Europe now apply tertiary treatment, although elsewhere in the EU, particularly in the south-east, the proportion of primary and secondary treatment remains higher. This has led to a reduction in discharge of nutrients, biological oxygen demand — a measure of organic pollution — and of ammonia to receiving waters. The emission of some hazardous chemicals has also been reduced.
However, the discharge of micropollutants via wastewater treat-ment plants and diffuse sources remains a challenge for water protection. To mitigate point-source pollution by micropollut-ants in Switzerland, for example, the largest wastewater treat-ment plants in areas of concern are to be upgraded, with a further treatment step in addition to tertiary treatment. The correspond-ing legal basis is currently being established.
Urban environments generate a range of pollutants, including in-dustrial and household chemicals, metals, pharmaceutical prod-
15 Source: The European Environment: State and Outlook 2010. EEA. 2010. 16 Source: The European Environment: State and Outlook 2010. EEA. 2010. 17 Source: Source apportionment of nitrogen and phosphorus inputs into the aquatic environment. EEA, 2005.
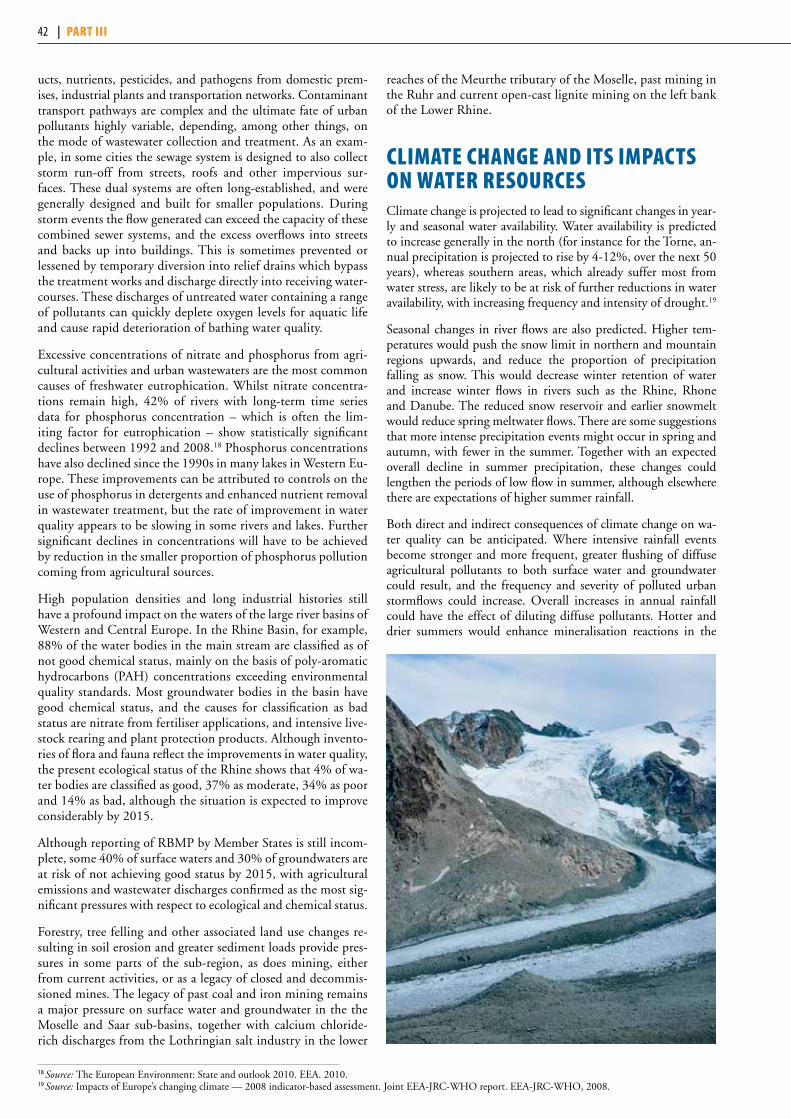
42 | PART III
ucts, nutrients, pesticides, and pathogens from domestic prem-ises, industrial plants and transportation networks. Contaminant transport pathways are complex and the ultimate fate of urban pollutants highly variable, depending, among other things, on the mode of wastewater collection and treatment. As an exam-ple, in some cities the sewage system is designed to also collect storm run-off from streets, roofs and other impervious sur-faces. These dual systems are often long-established, and were generally designed and built for smaller populations. During storm events the flow generated can exceed the capacity of these combined sewer systems, and the excess overflows into streets and backs up into buildings. This is sometimes prevented or lessened by temporary diversion into relief drains which bypass the treatment works and discharge directly into receiving water-courses. These discharges of untreated water containing a range of pollutants can quickly deplete oxygen levels for aquatic life and cause rapid deterioration of bathing water quality.
Excessive concentrations of nitrate and phosphorus from agri-cultural activities and urban wastewaters are the most common causes of freshwater eutrophication. Whilst nitrate concentra-tions remain high, 42% of rivers with long-term time series data for phosphorus concentration – which is often the lim-iting factor for eutrophication – show statistically significant declines between 1992 and 2008.18 Phosphorus concentrations have also declined since the 1990s in many lakes in Western Eu-rope. These improvements can be attributed to controls on the use of phosphorus in detergents and enhanced nutrient removal in wastewater treatment, but the rate of improvement in water quality appears to be slowing in some rivers and lakes. Further significant declines in concentrations will have to be achieved by reduction in the smaller proportion of phosphorus pollution coming from agricultural sources.
High population densities and long industrial histories still have a profound impact on the waters of the large river basins of Western and Central Europe. In the Rhine Basin, for example, 88% of the water bodies in the main stream are classified as of not good chemical status, mainly on the basis of poly-aromatic hydrocarbons (PAH) concentrations exceeding environmental quality standards. Most groundwater bodies in the basin have good chemical status, and the causes for classification as bad status are nitrate from fertiliser applications, and intensive live-stock rearing and plant protection products. Although invento-ries of flora and fauna reflect the improvements in water quality, the present ecological status of the Rhine shows that 4% of wa-ter bodies are classified as good, 37% as moderate, 34% as poor and 14% as bad, although the situation is expected to improve considerably by 2015.
Although reporting of RBMP by Member States is still incom-plete, some 40% of surface waters and 30% of groundwaters are at risk of not achieving good status by 2015, with agricultural emissions and wastewater discharges confirmed as the most sig-nificant pressures with respect to ecological and chemical status.
Forestry, tree felling and other associated land use changes re-sulting in soil erosion and greater sediment loads provide pres-sures in some parts of the sub-region, as does mining, either from current activities, or as a legacy of closed and decommis-sioned mines. The legacy of past coal and iron mining remains a major pressure on surface water and groundwater in the the Moselle and Saar sub-basins, together with calcium chloride-rich discharges from the Lothringian salt industry in the lower
reaches of the Meurthe tributary of the Moselle, past mining in the Ruhr and current open-cast lignite mining on the left bank of the Lower Rhine.
CLImATe ChAnge And ITs ImPACTs on wATeR ResouRCesClimate change is projected to lead to significant changes in year-ly and seasonal water availability. Water availability is predicted to increase generally in the north (for instance for the Torne, an-nual precipitation is projected to rise by 4-12%, over the next 50 years), whereas southern areas, which already suffer most from water stress, are likely to be at risk of further reductions in water availability, with increasing frequency and intensity of drought.19
Seasonal changes in river flows are also predicted. Higher tem-peratures would push the snow limit in northern and mountain regions upwards, and reduce the proportion of precipitation falling as snow. This would decrease winter retention of water and increase winter flows in rivers such as the Rhine, Rhone and Danube. The reduced snow reservoir and earlier snowmelt would reduce spring meltwater flows. There are some suggestions that more intense precipitation events might occur in spring and autumn, with fewer in the summer. Together with an expected overall decline in summer precipitation, these changes could lengthen the periods of low flow in summer, although elsewhere there are expectations of higher summer rainfall.
Both direct and indirect consequences of climate change on wa-ter quality can be anticipated. Where intensive rainfall events become stronger and more frequent, greater flushing of diffuse agricultural pollutants to both surface water and groundwater could result, and the frequency and severity of polluted urban stormflows could increase. Overall increases in annual rainfall could have the effect of diluting diffuse pollutants. Hotter and drier summers would enhance mineralisation reactions in the
18 Source: The European Environment: State and outlook 2010. EEA. 2010.19 Source: Impacts of Europe’s changing climate — 2008 indicator-based assessment. Joint EEA-JRC-WHO report. EEA-JRC-WHO, 2008.

ChAPTeR 1 Western and Central europe | 43
soil and thereby potentially increase nitrate concentrations in water. Rising water temperatures will increase the likelihood of cyanobacterial blooms, and hotter and drier summers would deplete river flows, reduce dilution capacity and lead to higher pollutant concentrations and possibly fish deaths (temperatures above 25ºC can be fatal).
In relation to management of the Genevese transboundary aq-uifer, the extreme heat wave of 2003 and heavy storms of 2007 both produced high turbidity in the Arve River water. This rendered the water unsuitable for artificial recharge of ground-water, and the plant had to be closed. Thus, opposite mete-orological extremes had the same practical impact, highlighting the potential implications of climate change for the control and management of artificial groundwater recharge with river water.
Climate change may also produce changes in land use, agricul-tural activities and cropping patterns. Rising temperatures may result in the northward extension of cultivation of a whole range of crops. Hotter and drier summers are likely to increase the de-mand for seasonal supplementary irrigation, both within and beyond existing irrigated lands. Modelling studies in the Gua-dalquivir River Basin suggested an increase in seasonal irriga-tion requirements of 15% to 20% by the 2050s, and even in the United Kingdom irrigation demand is likely to increase.20 These substantial demands may be difficult to predict and plan for.
Overall, whilst potential climate change impacts will vary, with the mountain areas particularly affected, this subregion may have the greatest capacity for adaptation to climate change. Policy choices to mitigate impacts are important, and some promising efforts are already being made in several of the major transboundary basins – the Rhine, Meuse and Danube. In the Rhine Basin an expert group has been established to review the state of knowledge of climate changes so far, and their likely impacts on the water regime in the Rhine Basin. Whilst annual average run-off remains largely constant, there is a transfer of flow from summer to winter. Further work involves drafting a scenario study for the flow regime of the Rhine, and, based on results, adaptation strategies will be drafted within the ICPR. In the Meuse, an EC Interreg project is currently working with the support of the International Meuse Commission to define a common strategy for adapting to the consequences of climate change in the river basin and measures for addressing the higher discharges, less rapid drainage and consequent increased flood risk that are likely to occur. This work will also contribute to the implementation of the EU Floods Directive. For the Dan-ube, work has also been initiated to analyse the state of knowl-edge on climate change and its impacts in the basin as a basis for discussing adaptation strategies.
Policy with respect to climate change adaptation is also being developed at national level. In Slovakia, for example, a national climate programme was established in 1993 to establish rele-vant monitoring and interpret the results in relation to possible climate change impacts on hydrological variability, agricultural production and forest ecosystems. The programme also consid-ers and proposes adaptation measures to reduce the negative impacts of climate change on the management of land and wa-ter resources.
ResPonses Until recently, water management has largely been directed to-wards increasing supply from wells, reservoirs, water diversions and desalination. Recognising that this could not continue indef-initely, attention has turned to the management of water demand by measures such as water pricing mechanisms, reduction of wa-ter losses, water reuse and recycling, increasing the efficiency of domestic, agricultural and industrial water uses, and water saving campaigns supported by public education. Reducing water de-mand can bring additional benefits in decreased pollution dis-charges and lower energy consumption.
The potential for water saving is considerable, with estimates that water efficiency could be improved by 40% through technologi-cal improvements alone,21 with changes in behaviour or produc-tion processes producing additional savings. At the household level, this is largely a matter of combining water-efficient instal-lations with raising awareness. Industrial users have reduced wa-ter use by recycling, reuse, changing production processes, using more efficient technologies and reducing leakage.
The EU sixth Environment Action Programme and EU water legislation, including the WFD, aim to ensure that water ab-straction is sustainable over the long term, and to promote the protection of water resources. Moreover, in 2007 the European Commission adopted a Communication “Towards Sustainable Water Management in the European Union” related to water scarcity and droughts.22 This set out the measures needed for a water-efficient, water-saving economy, with full implementa-tion of the WFD to include water pricing policies, and sustain-able land-use planning.
The WFD requires Member States to implement water pricing policies which provide adequate incentives for using water ef-ficiently. In practice, this usually means a combination of pric-ing and metering, which has been highly effective in changing consumer behaviour in many countries. Increased water prices have been a major factor in reducing public water demand in Eastern Europe, and have contributed to a desire for water sav-ing in Western Europe.23 To encourage efficient water use, pric-ing must be related to the volume of water consumed. Metering therefore plays a key role, and should be introduced for all sectors of water users, although not all countries meter the majority of water users.
In the southern part of the sub-region, agriculture is by far the dominant water use by volume abstracted from rivers and aqui-fers. Farmers have frequently changed to more water-intensive crops because of the high yields obtained and the high prices commanded, but agricultural users generally pay much less for water than other users. In Greece and Spain, for example, water for agriculture costs about €0.05/m3, compared with €0.85 to €1.35/m3 for household and industrial use.24 If water for agri-culture were paid for by volume and with the price reflecting full resource and environmental costs, farmers would respond by improving the timing of irrigation, adopting more efficient techniques such as sprinkler and drip irrigation, and changing to less water-demanding crops. In Spain, the total irrigated area has remained stable from 2002 to 2008 at 3.4 million hectares, while the area under gravity flood irrigation has decreased from
20 Source: The European Environment: State and Outlook 2010. EEA. 2010. 21 Source: The European Environment: State and Outlook 2010. EEA. 2010.22 Communication from the Commission to the European Parliament and the Council “Towards sustainable water management in the European Union - First stage
in the implementation of the Water Framework Directive 2000/60/EC”. COM(2007) 128 final. Commission of the European Communities.23 Source: The European Environment: State and Outlook 2010. EEA. 2010. 24 Source: The European Environment: State and Outlook 2010, Country Assessment — Greece. EEA. 2010.

44 | PART III
1.4 million to just over 1 million hectares, and the area watered by drip irrigation increased from 1.1 to 1.6 million hectares. In 2006, water use for drip irrigation was 3,800 m3/ha, compared to 6,200 m3/ha for gravity irrigation. In some cases the savings in water achieved by more efficient irrigation have been used by farmers to irrigate larger areas of land.
Leakage of water from supply systems in parts of the subre-gion remains substantial, and countries face major challenges to reduce these losses. Investment in detecting and repairing leaks is important, and improvements to the construction and maintenance of water supply systems have reduced leakage losses throughout the sub-region. In the past 10 to 15 years, 30-50% reductions in leakage have been achieved in the Czech Republic, Denmark, England and Wales, Germany, Malta, the Netherlands and Spain. In the Czech Republic, Spain and the United Kingdom they are now down to 20% or below.25 In a few countries, such as Germany and Denmark, losses are down to 10% or even lower, which is probably close to the limit of what is technically and economically feasible. Such conserva-
tion measures have significant economic and environmental benefits, delaying or avoiding additional water supply abstrac-tion, reducing sewage generation and investment in treatment capacity, and reducing energy requirements for abstracting, treating, and transporting both clean water and wastewater.
There have been visible benefits for the protection of water re-sources in the last two decades, thanks to investments in waste-water treatment. These have produced measurable improve-ments in water quality, particularly with respect to nutrients, biochemical oxygen demand, ammonia and hazardous chem-icals. Much of the early concern focussed on pollution from both active and closed industrial sources. For instance, between 1987 and 2000, measures under the Rhine Action Programme led to improvements in river water quality, recovery of the fau-na, and a significant reduction in the number and severity of accidental pollution incidents.
This process has been given further impetus by the implemen-tation of the UWWTD. Countries in the north and centre of the sub-region were already well provided with tertiary waste-water treatment for their urban populations. More than 96% of the 58 million inhabitants in the Rhine Basin are connected to wastewater treatment plants, and many industrial sites now have modern and comprehensive wastewater treatment facilities. In the northern countries of the sub-region, tertiary treatment has been provided for 70-80% of their populations for over twenty years, and the remaining 20% or so live in small, scattered ru-ral communities, with small-scale sewage treatment systems or septic tanks, which are, nowadays, quite strictly regulated. With conventional substances such as nutrients and certain heavy met-als largely addressed, the focus of urban wastewater treatment in these countries is increasingly shifting to address the elimina-tion of micro pollutants. Investment in environmental measures does, therefore, pay, but continuing efforts are required. How-ever, it can become disproportionately costly to serve the last communities in basins where most of the population are already connected to sewerage systems.
In countries in the south and centre of the subregion, the pro-portion of national populations connected to wastewater treat-ment systems has increased within the last two decades, and the proportion of plants with secondary or tertiary treatment have also increased substantially over the same period. In the Oder Basin, for example, some 500,000 and 150,000 addi-tional people in the Polish and Czech parts, respectively, are expected to be connected to sewage systems between 2005 and 2015. Continuing investment will still be required to increase coverage, and maintain or replace ageing water supply and sani-tation infrastructure. The high infrastructure costs of meeting the requirements of the UWWTD place a particular burden on new EU member States, who are therefore given more time to achieve compliance.
However, whilst implementation of the UWWTD has result-ed in more of the subregion’s population being provided with
25 Source: The European Environment: State and Outlook 2010. EEA. 2010.
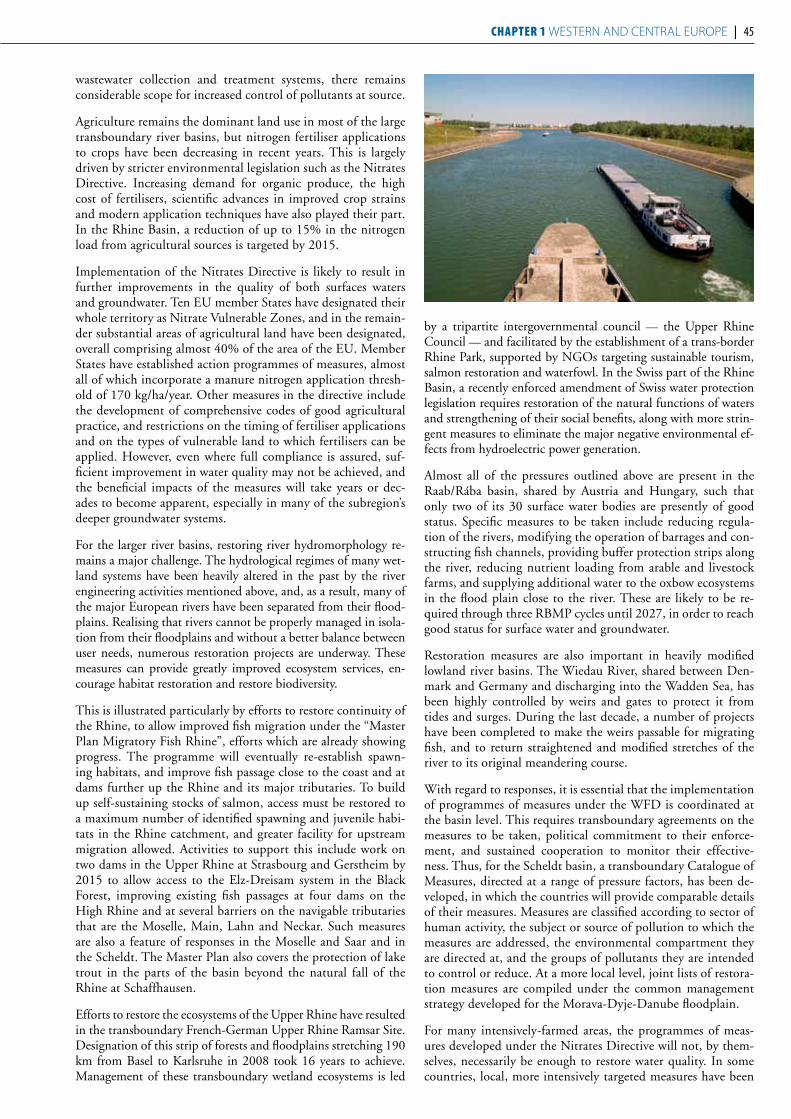
ChAPTeR 1 Western and Central europe | 45
wastewater collection and treatment systems, there remains considerable scope for increased control of pollutants at source.
Agriculture remains the dominant land use in most of the large transboundary river basins, but nitrogen fertiliser applications to crops have been decreasing in recent years. This is largely driven by stricter environmental legislation such as the Nitrates Directive. Increasing demand for organic produce, the high cost of fertilisers, scientific advances in improved crop strains and modern application techniques have also played their part. In the Rhine Basin, a reduction of up to 15% in the nitrogen load from agricultural sources is targeted by 2015.
Implementation of the Nitrates Directive is likely to result in further improvements in the quality of both surfaces waters and groundwater. Ten EU member States have designated their whole territory as Nitrate Vulnerable Zones, and in the remain-der substantial areas of agricultural land have been designated, overall comprising almost 40% of the area of the EU. Member States have established action programmes of measures, almost all of which incorporate a manure nitrogen application thresh-old of 170 kg/ha/year. Other measures in the directive include the development of comprehensive codes of good agricultural practice, and restrictions on the timing of fertiliser applications and on the types of vulnerable land to which fertilisers can be applied. However, even where full compliance is assured, suf-ficient improvement in water quality may not be achieved, and the beneficial impacts of the measures will take years or dec-ades to become apparent, especially in many of the subregion’s deeper groundwater systems.
For the larger river basins, restoring river hydromorphology re-mains a major challenge. The hydrological regimes of many wet-land systems have been heavily altered in the past by the river engineering activities mentioned above, and, as a result, many of the major European rivers have been separated from their flood-plains. Realising that rivers cannot be properly managed in isola-tion from their floodplains and without a better balance between user needs, numerous restoration projects are underway. These measures can provide greatly improved ecosystem services, en-courage habitat restoration and restore biodiversity.
This is illustrated particularly by efforts to restore continuity of the Rhine, to allow improved fish migration under the “Master Plan Migratory Fish Rhine”, efforts which are already showing progress. The programme will eventually re-establish spawn-ing habitats, and improve fish passage close to the coast and at dams further up the Rhine and its major tributaries. To build up self-sustaining stocks of salmon, access must be restored to a maximum number of identified spawning and juvenile habi-tats in the Rhine catchment, and greater facility for upstream migration allowed. Activities to support this include work on two dams in the Upper Rhine at Strasbourg and Gerstheim by 2015 to allow access to the Elz-Dreisam system in the Black Forest, improving existing fish passages at four dams on the High Rhine and at several barriers on the navigable tributaries that are the Moselle, Main, Lahn and Neckar. Such measures are also a feature of responses in the Moselle and Saar and in the Scheldt. The Master Plan also covers the protection of lake trout in the parts of the basin beyond the natural fall of the Rhine at Schaffhausen.
Efforts to restore the ecosystems of the Upper Rhine have resulted in the transboundary French-German Upper Rhine Ramsar Site. Designation of this strip of forests and floodplains stretching 190 km from Basel to Karlsruhe in 2008 took 16 years to achieve. Management of these transboundary wetland ecosystems is led
by a tripartite intergovernmental council — the Upper Rhine Council — and facilitated by the establishment of a trans-border Rhine Park, supported by NGOs targeting sustainable tourism, salmon restoration and waterfowl. In the Swiss part of the Rhine Basin, a recently enforced amendment of Swiss water protection legislation requires restoration of the natural functions of waters and strengthening of their social benefits, along with more strin-gent measures to eliminate the major negative environmental ef-fects from hydroelectric power generation.
Almost all of the pressures outlined above are present in the Raab/Rába basin, shared by Austria and Hungary, such that only two of its 30 surface water bodies are presently of good status. Specific measures to be taken include reducing regula-tion of the rivers, modifying the operation of barrages and con-structing fish channels, providing buffer protection strips along the river, reducing nutrient loading from arable and livestock farms, and supplying additional water to the oxbow ecosystems in the flood plain close to the river. These are likely to be re-quired through three RBMP cycles until 2027, in order to reach good status for surface water and groundwater.
Restoration measures are also important in heavily modified lowland river basins. The Wiedau River, shared between Den-mark and Germany and discharging into the Wadden Sea, has been highly controlled by weirs and gates to protect it from tides and surges. During the last decade, a number of projects have been completed to make the weirs passable for migrating fish, and to return straightened and modified stretches of the river to its original meandering course.
With regard to responses, it is essential that the implementation of programmes of measures under the WFD is coordinated at the basin level. This requires transboundary agreements on the measures to be taken, political commitment to their enforce-ment, and sustained cooperation to monitor their effective-ness. Thus, for the Scheldt basin, a transboundary Catalogue of Measures, directed at a range of pressure factors, has been de-veloped, in which the countries will provide comparable details of their measures. Measures are classified according to sector of human activity, the subject or source of pollution to which the measures are addressed, the environmental compartment they are directed at, and the groups of pollutants they are intended to control or reduce. At a more local level, joint lists of restora-tion measures are compiled under the common management strategy developed for the Morava-Dyje-Danube floodplain.
For many intensively-farmed areas, the programmes of meas-ures developed under the Nitrates Directive will not, by them-selves, necessarily be enough to restore water quality. In some countries, local, more intensively targeted measures have been

46 | PART III
developed. In the German Federal State of Baden-Württem-berg, the local Agro-Environmental Programme uses a point scoring system for a range of farming actions designed to mini-mise nutrient pollution, and provides payments of 10 euros per hectare for each credit point.
Considerable advances have been made in providing early warning of accidental pollution. The International Warning and Alarm Plan for the Elbe was established in 1991 with five warning centres. The plan is upgraded and revised from the experience of any accidents which occur and is regularly tested, and considered a major defence against transboundary impacts of accidental pollution. Similar warning systems for river basin protection are operated by other international commissions.
Where it is particularly difficult to achieve good status by 2015, the WFD allows extensions to this deadline for reasons of tech-nical unfeasibility or disproportionate costs of response meas-ures, or because the local natural environment and flow regimes mean that the beneficial impacts of the measures will be very slow to appear. The first two often apply to engineering works to improve the hydromorphological conditions, and the last to nitrate pollution of groundwater. Thus, in the Meuse for ex-ample, only about 280 out of 777 surface water and 42 out of 82 groundwater bodies are expected to reach the WFD targets by 2015, and 492 surface water and 29 groundwater bodies will require deadline extensions for one or more of the reasons mentioned above.
EU member States are now beginning to establish activities re-lated to the implementation of the Floods Directive. The lower part of the Klarälven is included in a pilot programme within the directive. In the Moselle and Saar, the Flood Action Plan, which was adopted in 1998 by the Commission and outlines activities up to 2020, will be incorporated into the flood risk planning required by the Floods Directive. The same applies to existing flood action plans or programmes in other international basins.
The wAy AheAd A comprehensive range of EU legislation has been established to protect freshwater from pollution. Full compliance with this legislation would result in substantial improvements in water quality, but the extent to which these can be achieved could be constrained by several factors, not least of which is the eco-nomic costs that will need to be borne by society to achieve good status under the WFD.
Although the legislative framework is well established, long-term political and institutional commitment will be needed to achieve the desired environmental benefits. In the Elbe Basin, for example, the expected reduction in nutrient loading in the first RBMP period to 2015 is 6% for nitrogen and 9% for phos-phorus. These are expected to result from measures to control nitrogen applications in excess of crop requirements, improve cultivation practices to help reduce nitrogen losses from the soil, and establish riparian buffer zones without fertiliser appli-cations, which will encourage denitrification. Even with these measures, the basin management plan anticipates the need for slow reductions in loading until 2027, because of the issues of technical feasibility and natural conditions referred to above.
Along with the requirement for long-term commitment will come a need for regular review and updating of monitoring programmes to take account of, for example, new substances and hazards, and evaluation of the effectiveness of programmes
of measures and other responses. It will be important in this process to review the lessons learned from implementation. In the Rhine Basin, for example, key lessons suggest it is important to establish priorities and tackle the important tasks first, allow for adequate public and stakeholder participation at the local level, keep things simple and concentrate on measures that are well understood. Ecological restoration is a complex process, but finding a symbol, in this case fish life, that both politicians and the public understand, has been of considerable benefit.
Other current and future driving forces could instead have negative impacts on water quantity and quality in the coming years. These include climate change impacts as well as changes in land use. Most studies predict a continuing decline in grass-land cover in the countries of the EU, with the area of perma-nent crops remaining stable or decreasing.
However, European legislation does not always move consist-ently in the same direction, and implementation of the Re-newable Energy Directive, for instance, is likely to result in an increase in the cultivation of biofuel crops. As it is unlikely that less food will be produced, formerly natural grassland or woodland might start to be cultivated, resulting in the release of additional carbon and nitrogen into the environment and in-creased use of agrochemicals. Implementation of this Directive is also likely to increase demand for hydro-electric power gen-eration, with consequent pressures and impacts on surface wa-ter systems. Adaptation policies related to climate change and long-term energy provision need to be developed to minimise the negative impacts on freshwater systems, and hence to avoid simply transferring environmental problems between sectors.
The political changes in Europe from 1989-90 resulted in less pronounced decreases in water abstraction and consumption in Western and Central Europe than in other subregions. Never-theless, within the Oder Basin, water consumption declined by 25-30% and, although demand has begun to recover, present water sources should meet demand at least until 2015. These economic and social changes also led to sharp declines in indus-trial activity and reductions in agrochemical usage, and hence pollution loading, but these are now beginning to recover and this is likely to continue.
Illegal abstraction, particularly from groundwater for agricul-tural use, is widespread in some countries. Addressing illegal water use presents major political challenges, and requires sur-veillance and fines to detect and control such activities. From 2010 the Good Agricultural and Environmental Condition framework, developed as part of the EU cross-compliance mechanisms, includes requirements for improved authorisation of water for irrigation. This should help in water management by providing a means by which member States can control il-legal abstraction of groundwater by unauthorised wells.
There remains a need to strengthen the integration of Euro-pean policy so that improvements in water management are not compromised by policies in other sectors, such as the EU Common Agricultural Policy and the proposed trans-European waterway network. Recent reforms of the CAP and Swiss ag-ricultural policy have resulted in a decoupling of agricultural subsidies from production, and the introduction of cross-com-pliance mechanisms to help address environmental concerns. Further reform of agricultural policies is, however, required to improve water use efficiency and irrigation practices.
ChAPTeR 2 south-eastern europe
47
InTRoduCTIonThe subregional assessment of transboundary waters in South-Eastern Europe (SEE) covers transboundary rivers, lakes and groundwaters shared by two or more of the following countries: Albania, Bosnia and Herzegovina, Bulgaria, Croatia, Greece, Hungary, Montenegro, Romania, Serbia, Slovenia, the former Yugoslav Republic of Macedonia and Turkey. The assessments of the individual transboundary surface and groundwaters in this subregion can be found in the Chapters 5 and 6 of Section IV (drainage basins of the Black Sea and of the Mediterranean Sea). The assessment of transboundary waters in SEE also contains assessment of a number of selected Ramsar Sites. Besides the as-sessed Ramsar Sites, there are important transboundary wetland areas elsewhere in SEE, e.g., the delta of Maritsa/Evros/Meriç River (a part of it is also a Ramsar Site), as well as important human-made wetlands, such as reservoir lakes and fish farming ponds along the Drava, Mura and smaller rivers in SEE. Very ex-tensive river flood-plains, temporary flooded grasslands and fens provide a number of services such as water storage, groundwater replenishment and support for livestock farming and biodiver-sity. The transboundary lakes Ohrid and Dojran are also of great socio-economic and cultural importance. Along the Adriatic and Aegean Seas an important number of coastal lagoons, salt-pans, and river delta wetlands exist in Albania, Croatia, Greece, Mon-tenegro and Slovenia. The same is true for the Black Sea coast of Bulgaria, Romania and Turkey.
There are 13 major transboundary rivers and four major inter-national lakes, as well as more than 50 transboundary aquifers, in SEE. With transboundary basins covering about 90% of the area of SEE, and more than half of these being shared by three or more countries, cooperation for effective shared water resources management is of particular importance, so as to en-sure the resources’ protection and sustainable use.
There is an increasing understanding that cooperation on trans-boundary waters provides opportunities for the creation of syner-gies and benefits for all parties involved. There is also an increas-ing consensus that countries should work to create a sustainable framework for cooperation at the transboundary level that will allow for sharing these benefits. Nevertheless, there are still nu-merous obstacles in achieving this objective that derive from the interdependence and the potential conflicts that exist among dif-ferent uses. Non-harmonized legal and institutional frameworks and varying infrastructure development and, in some cases, di-verging priorities and conflicting interests among riparian coun-tries, as well as political unrest in specific parts of the subregion, add to a complex picture.
A remarkable number of actors active in the subregion are sup-porting sustainable water resources management and trans-boundary cooperation. The role of EU, several United Nations agencies and other international organizations, as well as of do-nor countries and NGOs, has been important in this regard.
LegAL, PoLICy And InsTITuTIonAL fRAmewoRks foR TRAnsboundARy wATeR mAnAgemenT The establishment of IWRM in shared basins depends largely on the water management frameworks at the national level. In SEE, these are either under a reform process or have been through one recently. The EU acquis communautaire and in particular the WFD constitute the basis for this reform process both for the countries that are members of the EU and, to a certain extent, also for those that are not yet members.1 The Stabilization and Association Process and the EU Accession Process have played an important role in calling for integration of policies and support-ing water-related investments. These processes in the different
1 Greece, Slovenia, Bulgaria and Romania are members of the EU. Croatia has been a candidate country for EU membership since 2004. The Stabilization and Association Agreement (SAA, the contractual basis for relations between each individual country and the EU) with the EU was signed in 2001 and entered into force in 2005. Accession negotiations opened in 2005. In February 2008, the Council adopted the new Accession Partnership (AP) for the country. Turkey is a candidate country for EU membership. Accession negotiations started in 2005. Since then, the EU provisionally closed one chapter and opened negotiations on eleven chapters. The environment chapter was opened in December 2009. In February 2008, the Council adopted a revised AP with Turkey. The former Yugoslav Republic of Macedonia has been a candidate country for EU membership since 2005. The SAA was signed in 2001 and entered into force in 2004. In February 2008, the Council adopted the AP for the country. Albania is a potential candidate country for EU accession. In February 2008, the Council adopted a new European partnership with Albania. The SAA was signed in 2006 and entered into force in 2009. Bosnia and Herzegovina is a potential candidate country for EU accession. The SAA was signed in 2008 and has been ratified by the Parliament of Bosnia and Herzegovina. A new European partnership with Bosnia and Herzegovina was adopted by the Council in 2008. Montenegro is a candidate country for EU membership. The SAA was signed in 2007 and entered into force in 2010. A European partnership with Montenegro was adopted by the Council in 2007. Serbia is a potential candidate country for EU accession. The SAA was signed in 2008; ratification is pending. In 2008, the Council adopted the new European partnership for Serbia.
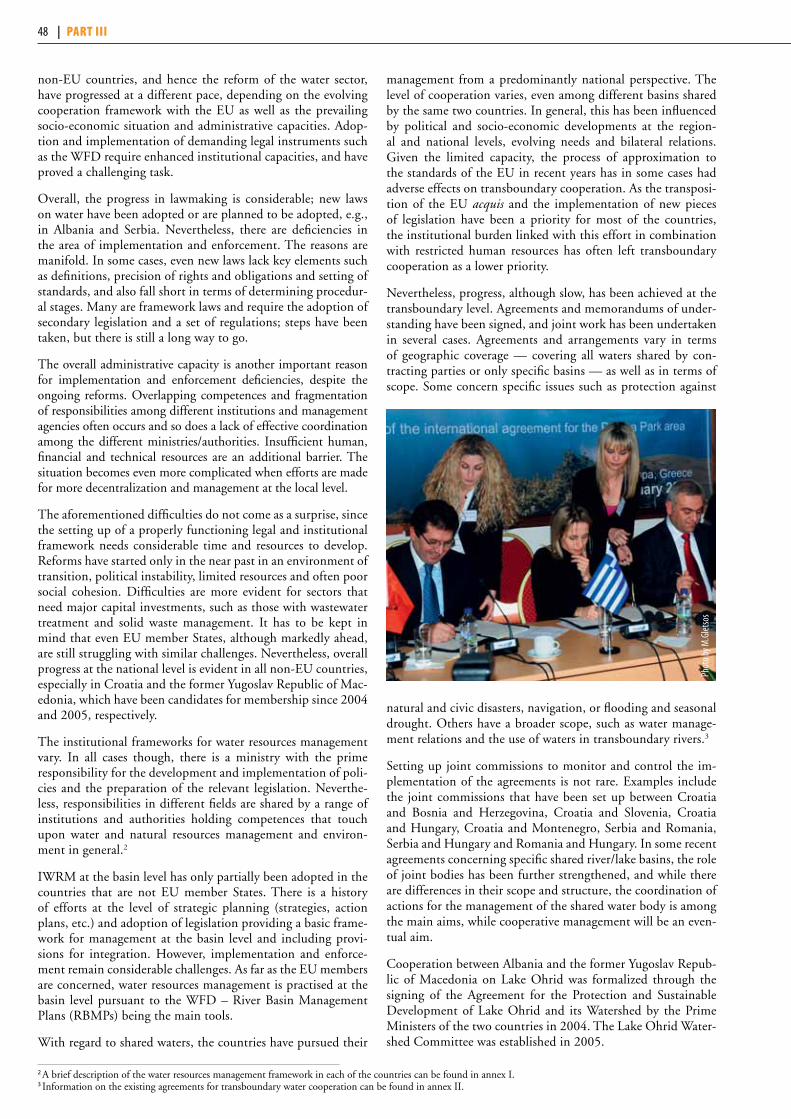
48 | PART III
non-EU countries, and hence the reform of the water sector, have progressed at a different pace, depending on the evolving cooperation framework with the EU as well as the prevailing socio-economic situation and administrative capacities. Adop-tion and implementation of demanding legal instruments such as the WFD require enhanced institutional capacities, and have proved a challenging task.
Overall, the progress in lawmaking is considerable; new laws on water have been adopted or are planned to be adopted, e.g., in Albania and Serbia. Nevertheless, there are deficiencies in the area of implementation and enforcement. The reasons are manifold. In some cases, even new laws lack key elements such as definitions, precision of rights and obligations and setting of standards, and also fall short in terms of determining procedur-al stages. Many are framework laws and require the adoption of secondary legislation and a set of regulations; steps have been taken, but there is still a long way to go.
The overall administrative capacity is another important reason for implementation and enforcement deficiencies, despite the ongoing reforms. Overlapping competences and fragmentation of responsibilities among different institutions and management agencies often occurs and so does a lack of effective coordination among the different ministries/authorities. Insufficient human, financial and technical resources are an additional barrier. The situation becomes even more complicated when efforts are made for more decentralization and management at the local level.
The aforementioned difficulties do not come as a surprise, since the setting up of a properly functioning legal and institutional framework needs considerable time and resources to develop. Reforms have started only in the near past in an environment of transition, political instability, limited resources and often poor social cohesion. Difficulties are more evident for sectors that need major capital investments, such as those with wastewater treatment and solid waste management. It has to be kept in mind that even EU member States, although markedly ahead, are still struggling with similar challenges. Nevertheless, overall progress at the national level is evident in all non-EU countries, especially in Croatia and the former Yugoslav Republic of Mac-edonia, which have been candidates for membership since 2004 and 2005, respectively.
The institutional frameworks for water resources management vary. In all cases though, there is a ministry with the prime responsibility for the development and implementation of poli-cies and the preparation of the relevant legislation. Neverthe-less, responsibilities in different fields are shared by a range of institutions and authorities holding competences that touch upon water and natural resources management and environ-ment in general.2
IWRM at the basin level has only partially been adopted in the countries that are not EU member States. There is a history of efforts at the level of strategic planning (strategies, action plans, etc.) and adoption of legislation providing a basic frame-work for management at the basin level and including provi-sions for integration. However, implementation and enforce-ment remain considerable challenges. As far as the EU members are concerned, water resources management is practised at the basin level pursuant to the WFD – River Basin Management Plans (RBMPs) being the main tools.
With regard to shared waters, the countries have pursued their
management from a predominantly national perspective. The level of cooperation varies, even among different basins shared by the same two countries. In general, this has been influenced by political and socio-economic developments at the region-al and national levels, evolving needs and bilateral relations. Given the limited capacity, the process of approximation to the standards of the EU in recent years has in some cases had adverse effects on transboundary cooperation. As the transposi-tion of the EU acquis and the implementation of new pieces of legislation have been a priority for most of the countries, the institutional burden linked with this effort in combination with restricted human resources has often left transboundary cooperation as a lower priority.
Nevertheless, progress, although slow, has been achieved at the transboundary level. Agreements and memorandums of under-standing have been signed, and joint work has been undertaken in several cases. Agreements and arrangements vary in terms of geographic coverage — covering all waters shared by con-tracting parties or only specific basins — as well as in terms of scope. Some concern specific issues such as protection against
natural and civic disasters, navigation, or flooding and seasonal drought. Others have a broader scope, such as water manage-ment relations and the use of waters in transboundary rivers.3
Setting up joint commissions to monitor and control the im-plementation of the agreements is not rare. Examples include the joint commissions that have been set up between Croatia and Bosnia and Herzegovina, Croatia and Slovenia, Croatia and Hungary, Croatia and Montenegro, Serbia and Romania, Serbia and Hungary and Romania and Hungary. In some recent agreements concerning specific shared river/lake basins, the role of joint bodies has been further strengthened, and while there are differences in their scope and structure, the coordination of actions for the management of the shared water body is among the main aims, while cooperative management will be an even-tual aim.
Cooperation between Albania and the former Yugoslav Repub-lic of Macedonia on Lake Ohrid was formalized through the signing of the Agreement for the Protection and Sustainable Development of Lake Ohrid and its Watershed by the Prime Ministers of the two countries in 2004. The Lake Ohrid Water-shed Committee was established in 2005.
2 A brief description of the water resources management framework in each of the countries can be found in annex I.3 Information on the existing agreements for transboundary water cooperation can be found in annex II.
Phot
o by M
.Glet
sos
ChAPTeR 2 south-eastern europe | 49
The Agreement for the Protection and Sustainable Develop-ment of the Skadar/Shkoder Lake was signed in 2008 by Mon-tenegro and Albania. It serves, inter alia, as the legal instru-ment for the implementation of the joint Strategic Action Plan regarding the lake, previously agreed by the two countries. The Skadar/Shkoder Lake Commission was established in 2009.
The most successful example of transboundary cooperation in SEE is the Framework Agreement on the Sava River Basin (FASRB) between Croatia, Bosnia and Herzegovina, Serbia and Slovenia, signed in 2002 and in force since 2004. It integrates most aspects of water resources management. Three protocols to the FASRB have been signed so far, while four additional ones are in different stages of preparation. The International Sava River Basin Commission (ISRBC) has been established, with the legal status of an international organization, for the purpose of implementation of the FASRB and the realization of the follow-ing mutually agreed goals: (a) establishment of an international navigation regime on the Sava and its navigable tributaries; (b) establishment of sustainable water management; and (c) under-taking measures to prevent or limit hazards and to reduce or eliminate their adverse consequences. FASRB gives to the ISRBC the international legal capacity for making decisions in the field of navigation and providing recommendations to the countries on all other issues.
A new agreement between Romania and Serbia is under develop-ment. Informal arrangements such as in the case of the Prespa Lakes, shared by Albania, Greece and the former Yugoslav Re-public of Macedonia, may also deliver results. The Prime Min-isters of the three countries declared the Prespa Lakes and their catchment as “Prespa Park”, the first transboundary protected area in South-Eastern Europe” in 2000. The Prespa Park Coor-dination Committee has been established as a non-legal entity. Work coordinated by the Committee has led, among others, to the joint preparation of a Strategic Action Plan, adopted in 2004, providing a direction for sustainable development in the basin. An official agreement on the Protection and Sustainable Devel-opment of the Prespa Park Area was signed by the Environment Ministers of the three countries and the EU Environment Com-missioner in 2010, setting out detailed principles and mecha-nisms of transboundary cooperation.
In most of the shared basins and aquifers, however, steps such as those described for the three shared lakes and the Sava River have yet to be taken. Among the reasons are the low political prioritization of the issue, financial constraints and, in some cases, insufficient institutional capacity. Conflicting interests among countries may also be a reason. These reasons, as well as different interpretation of provisions, have also affected the implementation of legal arrangements that are in place.
Regarding transboundary aquifers, in addition to the reasons mentioned above, the currently low knowledge level adds to the difficulties of transboundary cooperation. In many cases there is lack of consensus between the countries about the extent of aquifers or even their transboundary character. The First Assess-ment revealed many such examples. Different positions between countries regarding the transboundary character of an aquifer, its real extent or its hydraulic connection to surface water systems also emerged in the preparations of the Second Assessment.
At the regional level, the WFD and the UNECE Water Conven-tion are the two main frameworks that support water manage-ment and cooperation. Their consistency and complementarity represent a great asset for the subregion in terms of promoting cooperation through harmonization of policies and legal frame-
works on the one hand and providing a set of sound rules and conditions for cooperation on the other.
However, the different levels of advancement in the transposi-tion and implementation of the WFD and in the ratification to the Convention create some imbalances in many of the shared basins and prevent their application. It is a positive develop-ment that, since the First Assessment, Bosnia and Herzegovina and Serbia have acceded to the Convention and that the former Yugoslav Republic of Macedonia is preparing for accession.
monIToRIng of TRAnsboundARy RIveRs, LAkes And gRoundwATeRs The difficult conditions of the recent past in the area have had an effect also on the monitoring capacity of most of the countries. Monitoring systems have deteriorated and systematic monitoring in most of the cases have been interrupted for a period of time. Technical difficulties and limited financial resources have also re-duced the availability of data and information. At present, most of the countries are in the process of improving their monitoring systems.
The non-integrated management of water resources and the lack of coordination among institutions have affected both monitor-ing capacity as well as at the availability of data produced. Often, responsibilities for monitoring are fragmented between differ-ent institutions. Charging for data between Government agen-cies and services in some cases discourages the use of all data relevant to support decision-making. The ongoing reform in the water sector is an opportunity to improve coordination between institutions involved in monitoring and assessment, and also to involve the scientific community and academia.
All countries have established a certain level of monitoring of surface waters. In general, monitoring of groundwaters is less advanced in terms of quantity, and especially in terms of qual-ity. For many countries (particularly for non-EU countries), ei-ther quality or quantity monitoring has to be improved or still needs to be established. Some countries have jointly carried out a groundwater body characterization according to the require-ments of the WFD, e.g., Austria and Slovenia characterized the Karstwasser-Vorkommen Karawanken/Karavanke aquifer.
In the EU member States, monitoring, assessment and reporting activities are mostly guided by the obligations of the different EU water-related directives, in particular the WFD. But also, for some water bodies shared by EU countries, it was reported that monitoring needs to be improved at the national level and to be improved or established at the transboundary level.
The approximation to the EU acquis communautaire and the transposition of the WFD also has advantages for monitoring and assessment at the transboundary level, as they bring the na-tional systems closer together and promote harmonization.
In most transboundary basins in the subregion, information ex-change is still very weak and the information produced in ripari-an countries is not harmonized. Joint monitoring and assessment is almost non-existent.
Nevertheless, there are positive exemptions. For example, Bos-nia and Herzegovina and Croatia exchange information on the Trebišnjica/Neretva left aquifer. There is established coop-eration between Hungary and Serbia regarding the exchange of harmonized information on the basis of relevant agreements.

50 | PART III
Such agreements also exist between some of the countries that are Parties to the FASRB. The existence of the ISRBC facilitates the flow of information between countries. Serbia and Roma-nia have established cooperation on monitoring the common sector of the Danube, and are producing harmonized informa-tion. Regarding Lake Ohrid, Albania and the former Yugoslav Republic of Macedonia have harmonized procedures for water monitoring and established joint protocols for sampling analy-sis and quality assurance. Efforts have started in the Prespa Ba-sin, aiming to create a joint monitoring system to address biotic and abiotic parameters.
Certainly the most advanced example is the cooperation on monitoring under the Danube River Protection Convention. The Transnational Monitoring Network has been established to support the implementation of the Danube Convention and was revised in 2006 to ensure full compliance with the provi-sions of the WFD. The Network is based on national surface water monitoring networks and includes monitoring locations across the Danube (thus including the Iron Gates Reservoirs) and its main tributaries. Hence, it covers the Sava (as well as some of its main tributaries, notably the Una, the Vrbas and the Bosna), the Drava, the Tisza and the Velika Morava.
In the Maritsa/Evros/Meriç Basin, cooperation between the competent authorities of Bulgaria and Turkey has led to the establishment of four telemetry hydrometric stations in the Bulgarian part of the basin. The stations supply both countries with continuous real time data.
mAIn PRobLems, ImPACTs And sTATus Transboundary resources in the subregion commonly face nu-merous challenges: surface water and groundwater pollution from urban wastewater and agriculture; old, yet still operation-al, industrial facilities and mines; illegal wastewater discharge; and waste deposits; water scarcity; destructive floods; declines in groundwater levels; and saline water intrusion in deltas and coastal aquifers.
Regarding consumptive uses, agricultural irrigation and drinking water supply rank first by the share of total volume of water used in the basins. Water use for crop production has an important share in the waters in the Aegean Sea Basin; this can reach more than 50% in the Bulgarian part of the Maritsa/Evros/Meriç sub-basin and more than 80% in the Turkish part of the Maritsa/Evros/Meriç Basin.
Domestic water supply is the main use for most of the waters in the Black Sea Basin, followed by industrial water supply, agri-cultural irrigation and livestock raising; the order may vary on a case-by-case basis. As an example, in the Sava River Basin and in the Iron Gates Reservoirs, drinking water supply is the main use, followed by agricultural irrigation (not taking into account the water used for hydropower production). In Somes/Szamos alluvial fan aquifer (Romanian part), drinking water supply and industry are the main groundwater uses.
Water-use efficiency in the agricultural sector is a key issue due to the unsustainable irrigation techniques used and the deficiencies in the irrigation systems. Water loss due to the degraded drinking water supply networks is also an issue for many countries, such as Bosnia and Herzegovina, Montenegro and Albania; these losses are estimated in some cases to be more than 50%.
Groundwater abstraction is a major pressure factor in many ba-sins and aquifers, such as the Skadar/Shkoder Lake sub-basin, the North and South Banat, the North-East Backa/Danube-Tisza In-terfluve and the South-Western Backa/Dunav aquifers.
Agricultural activities contribute to the chemical pollution of water resources, mainly by nitrogen and phosphorous due to use of fertilizers, and pesticides. Pressure varies among basins due to countries’ specific hydrometeorological and socio-economic conditions (e.g., the need or financial capacity for agricultural irrigation), crop types and production patterns. Adverse effects on aquatic- and water-related ecosystems include the loss of bio-diversity and the deterioration of ecosystems. Diffuse pollution from agriculture is reported to be an issue, inter alia, in the Sava, Mesta/Nestos, Maritsa/Evros/Meriç and Somes/Szamos Basins. Unsustainable agricultural practices exert pressure both on sur-face and groundwaters in the basins of Neretva and Trebišnjica, as well as in the Prespa sub-basin.
Nutrient-loading deriving from diffuse pollution and the insuffi-cient treatment of urban wastewater has resulted in the slight eu-trophication of the Skadar/Shkoder Lake. Pollution reaches the receiving seas, e.g., considerable nutrient loads get transported into the Adriatic Sea via the Drin River.
Inappropriate sanitation — insufficiently treated and/or untreat-ed wastewater and/or improper use of septic tanks (mainly in rural areas) — as well as illegal wastewater discharges, are a ma-jor source of pollution for the river basins of the Sava, Maritsa/Evros/Meriç, Timok, Struma/Strymonas, Mesta/Nestos, Nisava and Neretva and in the Iron Gate reservoirs. Related impacts were reported for many groundwater bodies as well, e.g., in the Neretva and Trebišnjica hydrogeological basin, the Stara Planina/Salasha Montana and Tara.
Insufficiently treated and/or untreated industrial wastewaters (including illegal discharges) lead to water resources pollution by organic compounds, heavy metals and other hazardous sub-stances. Although industrial activity has significantly declined in the Skadar/Shkoder sub-basin, unsustainable industrial wastewa-ter management affects the quality of the lake, including sedi-ments. Untreated industrial wastewater is a pollution source in the Ohrid, Maritsa/Evros/Meriç, Neretva, Somes/Szamos and Trebišnjica Basins for both surface and groundwater bodies. In the Sava Basin, hazardous substances pollution is reported.
ChAPTeR 2 south-eastern europe | 51
Illegal waste disposal/uncontrolled dumpsites have been exerting pressures or are a potential pressure factor in a number of shared basins, impacting both surface and groundwaters. These include the Sava, Nisava, Neretva (where both municipal and industrial waste was reported), Struma/Strymonas and Mesta/Nestos Ba-sins and the Drin River and Skadar/Shkoder Lake sub-basins.
In the Drin River Basin, impacts from mining activities are likely to still be an issue for the Drin River and Lake Ohrid and, to a lesser extent, in the Skadar/Shkoder sub-basin. In some other basins, mining activities are reported to have impacts of low in-tensity and of local character.
Tourism activities, in the coastal areas of basins such as the Ner-etva and around Lakes Ohrid, Skadar/Shkoder and Prespa, ex-ert pressures since they periodically increase the liquid and solid waste generation as well as the water demands. Illegal construc-tion linked with tourism is of concern, e.g., in the Drin Basin, especially in the Albanian part.
When extensive, all of the above pressures may commonly result in transboundary impacts and pollution.
Climate change has already impacted some areas and may have significant further impacts in the future. Bulgaria reported that climate change has resulted in an approximately 30% decrease in precipitation and a subsequent decrease in water resources in the Mesta/Nestos Basin and Maritsa/Evros/Meriç sub-basin over the past 20 years. According to the Intergovernmental Panel on Climate Change (IPCC), SEE is among those subregions pro-jected to be most severely hit by climate change. Decreasing summer rainfall, decreasing average run-off and low summer flows are projected, as well as increasing frequency and sever-ity of droughts, the risk of floods, and other extreme weather events. This is expected to result in an increased water availa-bility/demand gap, the deterioration of water quality as a result of decreased flows, as well as other important impacts, such as damage to human health and settlements, forest fires, increasing desertification, soil degradation and loss of inhabitable and ar-able land and natural habitats. Economic activities depending on water will be adversely affected. This, in turn, will exacerbate the already demanding challenge of balancing competing demands among different uses — navigation, hydropower generation, ag-riculture, industry, tourism/recreation, etc. — at the national and transboundary levels, stemming from the multi-purpose use of basins. Additional attention should be given to water resources in such a changing environment, so as to ensure the functioning of ecosystems and the preservation of the natural capital.
In the case of transboundary aquifers, the above-mentioned is-sues are exacerbated by an insufficient knowledge base. This is of particular importance for karst aquifer systems. The extent and limits of karst systems, their drainage patterns and, most importantly, flow paths are little known, and the general lack of understanding of their vulnerability to anthropogenic as well as climatic stresses increases the level of difficulty of managing them and threatens their value and long-term sustainability. Their spe-cial characteristics are an additional factor of complexity when it comes to transboundary water resources management. The hydrogeological basin, encompassing the Neretva as well as the Trebišnjica and Trebižat “sinking” rivers, is a characteristic exam-ple. This basin extends across the same area as the Neretva River delta, hosting a range of socio-economic activities (e.g., human settlements, industry, hydropower generation, agriculture, tour-ism, recreation), as well as ecosystems of European significance. The Prespa and Ohrid Basins, which are linked through under-ground channels in the karst, provide an additional example, yet
information about this complicated interconnection is still in-complete.
Rivers and coasts are linked through numerous hydrological and socio-economic processes. Changing patterns of land and resources use upstream result in changes in the downstream coastal zone, and consequently commonly have an effect on coastal ecosystems and economic activities. The necessary inte-grated approach in river basin and coastal management becomes even more challenging when it comes to transboundary basins. The Maritsa/Evros/Meriç and Neretva Basins are characteristic cases where cooperation between the riparian countries on issues related to water and land resources use patterns is necessary to alleviate adverse effects such as flooding, the alteration of geo-morphology of the delta areas and salt water intrusion, as well as deterioration of soils, the quality of water and, to a certain extent, of ecosystems. Sustainability considerations have to be integrated in the development plans of the coastal areas. Unsustainable de-velopment patterns linked with agriculture and/or tourism result in the unsustainable use of water resources in water-scarce coastal areas of the Mediterranean Basin. This may exacerbate the con-sequences of the upstream pressures, where these exist. There are also cases in which such development patterns in coastal areas are felt outside the basin. For example, transfer of water outside Skadar/Shkoder Lake Basin is planned in Montenegro, to cover drinking water needs in the coastal areas of the country. Likewise, there are plans for water from Mesta/Nestos Basin to be used for agricultural irrigation in an adjacent river basin in Greece.
The reclamation of wetlands, uncontrolled urbanization and excessive illegal hunting and fishing have been pressure factors which, in addition to the alterations to the hydrological regimes, have caused impacts to the coastal ecosystems.
A great number of dams and associated reservoirs in the shared basins in SEE serve one or more of the following purposes: hy-dropower generation, irrigation, drinking and industrial water supply, flood protection and recreation. Some reservoirs, such as Iron Gates I and II in the transboundary area between Romania and Serbia, service navigational activities in addition to facilitat-ing flood control.
Hydropower production represents a major non-consumptive use in many countries. For instance, hydropower contributes to over 90% of the energy production in Albania, while in Bosnia and Herzegovina it is an export commodity. Certain river basins are of key importance in this regard. The hydropower plants built on the Drin River in Albania produce 70% of the total hydro and thermal energy production capacity in the country. Two major dams have been constructed on the Black Drin in the former Yu-goslav Republic of Macedonia. In Neretva and Trebišnjica hydro-geological basin, hydroelectric production infrastructure includes dams and underground channels for the transfer of water, includ-ing one that transfers water across the border between Bosnia and Herzegovina and Croatia, to the Dubrovnik hydropower plant. There are a number of dams in the Bulgarian part of the Maritsa/Evros/Meriç River Basin, and as many as 722 reservoirs. As far as the Sava River Basin is concerned, there are 21 dams with a res-ervoir capacity of over 5 million m3. Five of them have a reservoir capacity between 161 million m3 and 340 million m3 (the highest (131 m) dam in Serbia, in the Drina sub-basin, has a reservoir with a capacity of 170 million m3).
In addition to dams, the construction of water regulation struc-tures has in many cases caused hydrological and morphological alterations with different impacts. Indicative are the destruction of parts of wetlands in lakes and deltas, the interruption of bio-

52 | PART III
corridors and coastal erosion (e.g., the Drin River Basin), the in-terruption of river and habitat continuity and the loss of wetland areas (e.g., the Sava River Basin), the erosion of riverbeds and land as well as the decline of groundwater levels (e.g., the Ner-etva/Trebišnjica hydrogeological basin). In addition to altering the character of the aquatic and riparian habitats, resulting from reduced sediment transport capacity — as was reported among the main effects of the construction of Iron Gates I and II res-ervoirs — related sediment deposition has induced the gradual increase of high water levels upstream, reducing the safety of the existing flood protection system.
The occurrence of floods is a common extreme phenomenon, but according to IPCC 100-year floods are projected to occur less frequently in large parts of SEE. At the same time, the frequency of flash floods is likely to increase in the coming years because of the projected increased intensity of rainfall events. Detrimental socio-economic effects are felt in many basins such as the Sava, the Maritsa/Evros/Meriç and the Nisava. Extensive flood protec-tion systems can be found in the Sava River Basin. At the same time, the Sava is a very good example in SEE of a river where some of the natural flood-plains are still intact, supporting miti-gation of floods.
mAnAgemenT ResPonsesAll countries, at different paces, are making steps towards the development of basin management plans. In EU countries, the preparation of the RBMPs is mandatory and follows the rel-evant provisions and time frame of the WFD. In Croatia, a RBMP has been developed for the Krka River Basin as a pilot. In the former Yugoslav Republic of Macedonia, the process for the development of such plans will be initiated in the near fu-ture as part of the implementation of the newly adopted law that transposes the WFD.
The only joint transboundary management plan is the one pre-pared by the Sava Commission. As part of that the plan, the Sava River Basin Analysis Report was concluded and the Sava River Basin Management Plan is to be developed by end of 2011, also in accordance with the EU Floods Directive.
With regard to climate change impacts, information generated through different models needs to be downscaled to be used for planning at the basin level. Few projects are ongoing (e.g., on the Sava and Mesta/Nestos).
Specific measures are being taken or are planned for developing tools to support transboundary cooperation. One example, in the Sava Basin, is the development of a geographical information system (GIS), river information services (for the improvement of navigation safety) and a flood forecasting and early warning system, which is planned to be developed (by 2012). There is a protocol to the FASRB regarding flood protection and an Ac-cident Emergency Warning System is in place.
One of the measures to address issues linked with agriculture (e.g., the overuse of water, nutrient and pesticide pollution) is the implementation of good agricultural practices. Countries have either reported the need for such measures or that they have been implemented. Efforts need to be continued and enhanced, or initiated where absent. Command and control measures and/or incentives with regard to the use of dangerous pesticides and fertilizers have been adopted. Nevertheless, unauthorized use of pesticides has continued in several cases.
In EU member States, the construction of wastewater collection and treatment systems for human settlements in accordance to the Urban Wastewater Treatment Directive is in progress. Efforts are also being made in non-EU countries.
Measures to address waste-disposal-related issues include the construction of solid waste management systems and facilities. Examples where such measures have been taken include the Stara Planina/Salasha Montana aquifer and the Skadar/Shkoder, the Ohrid and the Maritsa/Evros/Meriç Basins. The major challenge that the countries face in this regard is the significant level of financial resources needed. Nevertheless, in several countries, for example in Bulgaria, the municipalities have undertaken meas-ures for the improvement of waste collection and transportation, and for shutting down unauthorized waste disposal sites.
As far as aquifers are concerned, protection zones for drinking water have been established in many cases. Nevertheless, relevant measures are reported as needing improvement for the majority of the aquifers and the efficiency of measures in place seems to vary on a case-by-case basis.
The wAy AheAd There is a great potential for sharing the benefits of transbound-ary waters in SEE. However, the current level of cooperation is not suited to support such development, to ensure long-term sus-tainability or to prevent possible negative transboundary impacts in most of the basins.
Action at the national level promoting integrated water and natu-ral resources management is crucial, since it creates the condi-tions for efficient management at the transboundary level. The ongoing reforms of the water sector — which will evidently continue — can benefit cooperation. The adoption and imple-mentation of legal instruments that fully transpose the WFD are of special importance in this regard, since they will support the harmonization of legal instruments for water management.
Until this becomes a reality, countries should use the momen-tum created through the reform process and go a step further. Taking into consideration the different level of the approxima-tion process in each country, commonly agreed standards for the management of the shared basins on the basis of the WFD and international conventions may be used to specifically design rules and regulations for managing basins in a coordinated and sus-tainable manner, taking into consideration the specific needs and realities in each case. Lake Ohrid, where recently established joint working groups of experts are assisting in the harmonization of national legislation to support conservation and sustainable de-velopment of the Lake and its Basin, can serve as an example.
Bearing in mind the conditions in SEE, the UNECE Water Con-vention has a special role to play, as it offers a basis for enhanced cooperation and a common platform for EU and non-EU coun-tries. It is a useful tool for assisting the implementation of EU water legislation by non-EU countries. Countries that have not done so yet should consider accession to the Convention.
Cooperation between riparian countries in monitoring and as-sessment may provide a starting point for cooperation. The establishment of harmonized monitoring approaches and data-collection methods, and eventually monitoring and information systems, would create the basis for establishing a common un-derstanding of water quantity and quality issues and their root causes. This would facilitate more efficient collaboration and
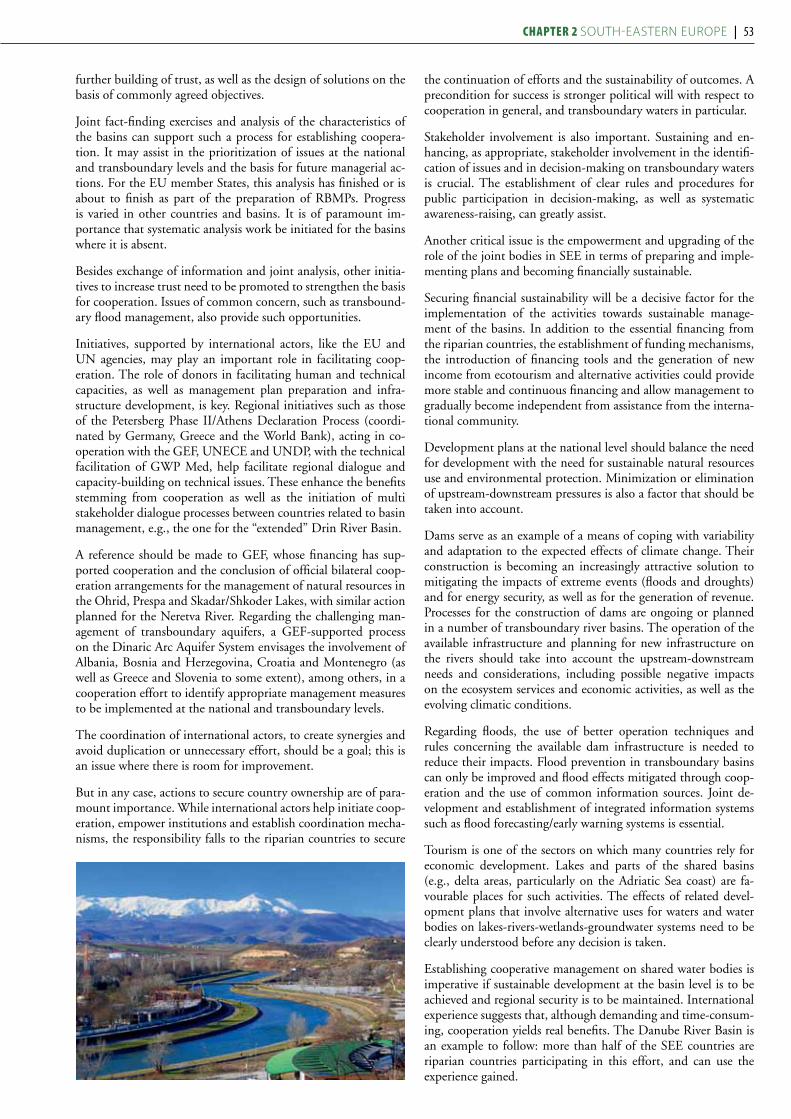
ChAPTeR 2 south-eastern europe | 53
further building of trust, as well as the design of solutions on the basis of commonly agreed objectives.
Joint fact-finding exercises and analysis of the characteristics of the basins can support such a process for establishing coopera-tion. It may assist in the prioritization of issues at the national and transboundary levels and the basis for future managerial ac-tions. For the EU member States, this analysis has finished or is about to finish as part of the preparation of RBMPs. Progress is varied in other countries and basins. It is of paramount im-portance that systematic analysis work be initiated for the basins where it is absent.
Besides exchange of information and joint analysis, other initia-tives to increase trust need to be promoted to strengthen the basis for cooperation. Issues of common concern, such as transbound-ary flood management, also provide such opportunities.
Initiatives, supported by international actors, like the EU and UN agencies, may play an important role in facilitating coop-eration. The role of donors in facilitating human and technical capacities, as well as management plan preparation and infra-structure development, is key. Regional initiatives such as those of the Petersberg Phase II/Athens Declaration Process (coordi-nated by Germany, Greece and the World Bank), acting in co-operation with the GEF, UNECE and UNDP, with the technical facilitation of GWP Med, help facilitate regional dialogue and capacity-building on technical issues. These enhance the benefits stemming from cooperation as well as the initiation of multi stakeholder dialogue processes between countries related to basin management, e.g., the one for the “extended” Drin River Basin.
A reference should be made to GEF, whose financing has sup-ported cooperation and the conclusion of official bilateral coop-eration arrangements for the management of natural resources in the Ohrid, Prespa and Skadar/Shkoder Lakes, with similar action planned for the Neretva River. Regarding the challenging man-agement of transboundary aquifers, a GEF-supported process on the Dinaric Arc Aquifer System envisages the involvement of Albania, Bosnia and Herzegovina, Croatia and Montenegro (as well as Greece and Slovenia to some extent), among others, in a cooperation effort to identify appropriate management measures to be implemented at the national and transboundary levels.
The coordination of international actors, to create synergies and avoid duplication or unnecessary effort, should be a goal; this is an issue where there is room for improvement.
But in any case, actions to secure country ownership are of para-mount importance. While international actors help initiate coop-eration, empower institutions and establish coordination mecha-nisms, the responsibility falls to the riparian countries to secure
the continuation of efforts and the sustainability of outcomes. A precondition for success is stronger political will with respect to cooperation in general, and transboundary waters in particular.
Stakeholder involvement is also important. Sustaining and en-hancing, as appropriate, stakeholder involvement in the identifi-cation of issues and in decision-making on transboundary waters is crucial. The establishment of clear rules and procedures for public participation in decision-making, as well as systematic awareness-raising, can greatly assist.
Another critical issue is the empowerment and upgrading of the role of the joint bodies in SEE in terms of preparing and imple-menting plans and becoming financially sustainable.
Securing financial sustainability will be a decisive factor for the implementation of the activities towards sustainable manage-ment of the basins. In addition to the essential financing from the riparian countries, the establishment of funding mechanisms, the introduction of financing tools and the generation of new income from ecotourism and alternative activities could provide more stable and continuous financing and allow management to gradually become independent from assistance from the interna-tional community.
Development plans at the national level should balance the need for development with the need for sustainable natural resources use and environmental protection. Minimization or elimination of upstream-downstream pressures is also a factor that should be taken into account.
Dams serve as an example of a means of coping with variability and adaptation to the expected effects of climate change. Their construction is becoming an increasingly attractive solution to mitigating the impacts of extreme events (floods and droughts) and for energy security, as well as for the generation of revenue. Processes for the construction of dams are ongoing or planned in a number of transboundary river basins. The operation of the available infrastructure and planning for new infrastructure on the rivers should take into account the upstream-downstream needs and considerations, including possible negative impacts on the ecosystem services and economic activities, as well as the evolving climatic conditions.
Regarding floods, the use of better operation techniques and rules concerning the available dam infrastructure is needed to reduce their impacts. Flood prevention in transboundary basins can only be improved and flood effects mitigated through coop-eration and the use of common information sources. Joint de-velopment and establishment of integrated information systems such as flood forecasting/early warning systems is essential.
Tourism is one of the sectors on which many countries rely for economic development. Lakes and parts of the shared basins (e.g., delta areas, particularly on the Adriatic Sea coast) are fa-vourable places for such activities. The effects of related devel-opment plans that involve alternative uses for waters and water bodies on lakes-rivers-wetlands-groundwater systems need to be clearly understood before any decision is taken.
Establishing cooperative management on shared water bodies is imperative if sustainable development at the basin level is to be achieved and regional security is to be maintained. International experience suggests that, although demanding and time-consum-ing, cooperation yields real benefits. The Danube River Basin is an example to follow: more than half of the SEE countries are riparian countries participating in this effort, and can use the experience gained.

ChAPTeR 3 eastern and northern europe
54
InTRoduCTIonThe subregional assessment of transboundary waters in Eastern and Northern Europe covers transboundary rivers, lakes and groundwaters shared by two or more of the following countries: Belarus, Estonia, Finland, Hungary, Latvia, Lithuania, Norway, Poland, the Republic of Moldova, Romania, the Russian Fed-eration, Slovakia and Ukraine. The assessment of the individual transboundary surface waters and groundwaters in this subregion can be found in Chapters 1, 5 and 8 of Section IV (drainage ba-sins of the White Sea, Barents Sea and Kara Sea; Black Sea; and Baltic Sea).
The assessment of transboundary waters in Eastern and North-ern Europe also contains an assessment of a number of selected Ramsar Sites and other wetlands of transboundary importance: the North Livonian Transboundary Ramsar Site, the Domica-Baradla Cave System, the Pasvik Nature Reserve as well as sites at Lake Peipsi, along the upper Tisza River, the Stokhid-Pripyat-Prostyr Rivers, the Lower Danube and the middle course of the Bug River. In addition to these, Eastern and Northern Europe holds a number of other important transboundary wetland areas, including numerous freshwater lakes and extensive mires con-nected by rivers and streams, which stretch all along the Russian, Norwegian and Finnish borders and further to the south along the Russian, Estonian, Latvian and Belarusian borders. Extensive river flood-plains, temporary flooded forests, grasslands and fens are also typical for the region, as well as coastal bays, lagoons and river deltas in the Barents, Baltic and Black Seas. The north-ernmost part of the region is characterized by permafrost. The numerous services provided by these wetlands extend far beyond their boundaries and range from harbouring rich and threatened biodiversity to water retention and storage as well as support to fishing, farming and various leisure activities.
The majority of the water resources in the subregion are of a transboundary nature, thus most countries are highly depend-ent on flows generated outside their boundaries. For example, Ukraine estimates that only a quarter of the surface water flow in the country is generated within its boundaries and more than 80% of the drinking water in the Republic of Moldova is ab-stracted from the Dniester River. Such interconnectedness and related vulnerability emphasize the importance of good trans-boundary cooperation.
There are great differences in the water resources management frameworks in EU countries and their Eastern neighbours. In
EU countries, requirements for the status of water resources are defined through the environmental objectives of the WFD, which also sets the schedule of measures to be taken. In East-ern Europe — Ukraine and the Republic of Moldova stand as examples — the water resources policy emphasizes meeting the economic needs of the society. As many of the water bodies concerned are shared by EU and non-EU countries, specific implications for the implementation of WFD arise.
In the western part of the subregion, there are well function-ing cooperation frameworks at the basin level, whereas in the eastern part, even if in many cases the legal basis for coopera-tion has been established, transboundary institutions are less effective and the level of cooperation is lower. The International Commission for the Protection of the Danube River (ICPDR) stands as a positive model for cooperation between EU and non-EU countries.
LegAL, PoLIC y And InsTITuTIonAL fRAmewoRks foR TRAnsboundARy wATeR mAnAgemenTMost of the existing agreements for transboundary water co-operation were signed in the late 1990s or in the 2000s.1 The Water Convention has provided the basis for such agreements. Older agreements date back mainly to the 1950s and 1960s, including the Finnish-Norwegian, Finnish-Russian and Polish-Russian agreements; the 1929 Convention between Norway and Sweden being the oldest. Currently, a number of countries are in the process of revising or have recently revised their bi-lateral agreements. Ukraine and the Republic of Moldova are preparing a new basin agreement on the Dniester, which fore-sees the establishment of a transboundary water commission. In June 2010, Romania and the Republic of Moldova entered into an agreement on the Prut. Moreover, a new intergovernmen-tal agreement on transboundary waters between Belarus and Poland as well as Romania and Serbia are under development. Factors that have triggered revisions is the need to take into account the provisions of the WFD, the principles of integrat-ed water resources management (IWRM) and the obligations under the Water Convention. For example, the bilateral agree-ment of 2003 between Romania and Hungary has a dedicated section on the harmonization of transboundary surface water and groundwater bodies according to the WFD and the Water
1 Information on the existing agreements for transboundary water cooperation can be found in annex II.

ChAPTeR 3 eastern and northern europe | 55
Convention However, on some major transboundary rivers — for instance the Bug and the Dnieper — there is still neither an agreement covering the whole basin nor an established river basin commission.
Where established, transboundary water commissions promote cooperation on various issues and, in many cases, their scope and mandate have progressively expanded with time and grow-ing trust. For example, today the Finnish-Russian transbound-ary water Commission deals with a broad range of manage-ment issues, including joint monitoring of pressures and water quantity/quality, joint management of water resource including joint operation of water level regulation, fisheries and threat-ened species. The Estonian-Russian joint commission in addi-tion to organizing the exchange of data also defines priority directions of future work and programmes of scientific studies on the protection and sustainable use of transboundary waters. It facilitates cooperation between various actors in the basin and ensures that discussions on relevant questions are open to the public.
In a number of countries, river basin councils or similar institu-tions advise water management authorities on the country’s or the basin’s water issues. As concerns transboundary waters, Ukraine and the Republic of Moldova have the intention to invite each other’s representatives to attend their basin councils meetings.
River basin councils have been established for all large river ba-sins in Ukraine and for a few tributaries. Legislative strengthen-ing of the status of these river basins could significantly enhance their impact on taking important management decisions. Ex-panding the participation in the work of councils to, for ex-ample, professionals’ organizations and non-governmental or-ganizations (NGOs) could strengthen the competence of the councils. However, costs are a limiting factor as lack of funds is already restricting the possibility to organize meetings. It is also important to include in the transboundary water agreements the interests of local populations, as Norwegian experience with indigenous peoples (the Saami) demonstrate.
Water resources management by river basins is firmly established in EU legislation. In particular, the obligation to publish by De-cember 2009 River Basin Management Plans has been a strong driver for water management in EU member States. Eastern neighbours are also interested in the application of the provi-sions of the WFD. Belarus has schemes for the complex use and protection of waters, and is interested in seeing how these com-pare with EU River Basin Management Plans. Due to lack of resources and capacity in the eastern neighbours, the preparation of River Basin Management Plans has been mostly supported by external donors, but the implementation of the developed plans in some cases advances very slowly. For instance, a draft man-agement plan for the Pripyat River Basin was developed in the framework of a Technical Aid to the Commonwealth of Inde-pendent States (TACIS) project, but has not been followed up.
EU countries are encouraged to jointly prepare River Basin Man-agement Plans with the non-EU countries with which they share waters. This is not completely new; e.g., the Finnish-Norwegian Commission prepared a multiple-use plan for the Paatsjoki/Pas-vik River with the involvement of the Russian authorities in the relevant process already in 1997. However, the development of River Basin Management Plans on the basis of the WFD across the EU border is not a common practice: for the non-EU coun-tries it entails many changes in the legislation and the water management practices; and for the EU countries the risk of not
respecting the deadlines of the WFD discourage a strong engage-ment of non-EU countries in the process.
Planning systems in the eastern neighbours of the EU are still influenced by their Soviet heritage. IWRM principles are ac-knowledged in these countries as important to follow, but the implementation in practice is limited. There are national insti-tutional problems that remain to be solved and little coordina-tion and integration between national organizations involved in the management of water resources, for example, exists between the agencies managing surface waters and groundwaters.2 Weak institutions and legislation also make the application of IWRM difficult. Another challenge is the shortage of funding for the water sector. The Siversky Donets Basin, on which a number of international projects have supported the preparation of a river basin management plan, demonstrates the challenges.
In the Republic of Moldova, a draft of a new water law incorpo-rating basin principles that would replace the water code of 1992 is in its final stage of agreement between sectoral ministries. The new law approximates to the EU acquis communautaire and the WFD. Recently, a piece of legislation for the control of wastewa-ter discharges from municipal sources was drawn up — under the National Policy Dialogue process within the EU Water Initiative, with UNECE as key strategic partner for the IWRM component — and has been adopted; however, its implementation is dif-ficult due to, among others, shortage of funds. A new strategy on drinking water and water management has also been prepared, but implementation has not advanced. A national strategy on waste management is currently being developed which, among others, aims to reduce impacts on water resources.
Also, the other non-EU countries of the subregion are progres-sively aligning their legislation to EU standards. In Ukraine, the need to introduce the principles of river basin management is reflected mainly in the Law on Environmental Protection and the Water Code.
monIToRIng of TRAnsboundARy RIveRs, LAkes And gRoundwATeRsMost of the bilateral agreements in the subregion, including the recent ones signed by countries in transition in the 2000s — e.g., Belarus-Ukraine and Belarus-Russian Federation — have among their key provisions the exchange of hydrometeorological or oth-er monitoring data on transboundary waters. The organization of joint monitoring programmes, data collection and data manage-ment varies. Between Romania and Hungary these are organized through a joint Hydrotechnical Commission. Agreements for the exchange of data have been made also between departments and institutions dealing with hydrometeorological information, as the example of Belarus and Poland demonstrates. Even when the bilateral agreement had not been signed yet, information from water quantity and water quality surveys on the Prut River were exchanged between water authorities from the Republic of Mol-dova and Romania.
The establishment of joint bodies greatly facilitates the exchange of monitoring information. For instance, in the Estonian-Russian joint commission and its working groups systematic exchange of information takes place. The experience of joint monitoring on Lakes Peipsi, Lake Pihkva, Lake Lämmijärv and Narva Reser-voir, based on an agreed monitoring programme, also illustrates the remaining challenges: monitoring programmes need to be
2 A brief description of the water resources management framework in each of the countries can be found in annex I.
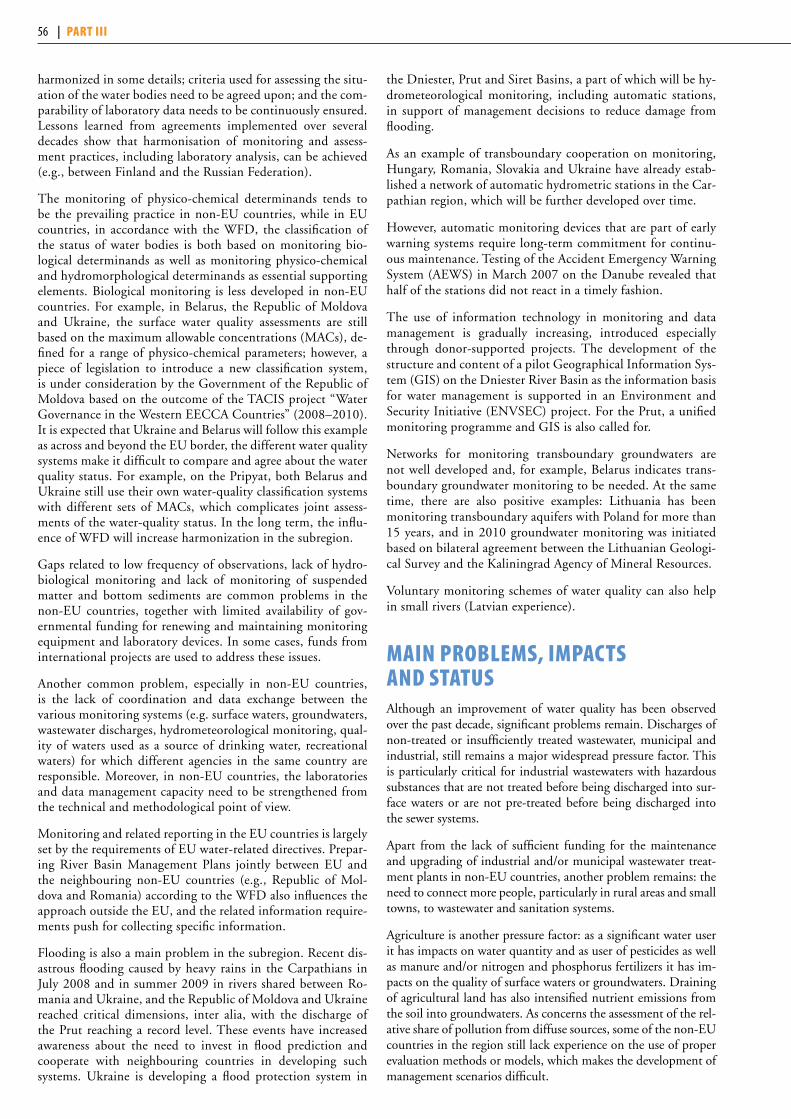
56 | PART III
harmonized in some details; criteria used for assessing the situ-ation of the water bodies need to be agreed upon; and the com-parability of laboratory data needs to be continuously ensured. Lessons learned from agreements implemented over several decades show that harmonisation of monitoring and assess-ment practices, including laboratory analysis, can be achieved (e.g., between Finland and the Russian Federation).
The monitoring of physico-chemical determinands tends to be the prevailing practice in non-EU countries, while in EU countries, in accordance with the WFD, the classification of the status of water bodies is both based on monitoring bio-logical determinands as well as monitoring physico-chemical and hydromorphological determinands as essential supporting elements. Biological monitoring is less developed in non-EU countries. For example, in Belarus, the Republic of Moldova and Ukraine, the surface water quality assessments are still based on the maximum allowable concentrations (MACs), de-fined for a range of physico-chemical parameters; however, a piece of legislation to introduce a new classification system, is under consideration by the Government of the Republic of Moldova based on the outcome of the TACIS project “Water Governance in the Western EECCA Countries” (2008–2010). It is expected that Ukraine and Belarus will follow this example as across and beyond the EU border, the different water quality systems make it difficult to compare and agree about the water quality status. For example, on the Pripyat, both Belarus and Ukraine still use their own water-quality classification systems with different sets of MACs, which complicates joint assess-ments of the water-quality status. In the long term, the influ-ence of WFD will increase harmonization in the subregion.
Gaps related to low frequency of observations, lack of hydro-biological monitoring and lack of monitoring of suspended matter and bottom sediments are common problems in the non-EU countries, together with limited availability of gov-ernmental funding for renewing and maintaining monitoring equipment and laboratory devices. In some cases, funds from international projects are used to address these issues.
Another common problem, especially in non-EU countries, is the lack of coordination and data exchange between the various monitoring systems (e.g. surface waters, groundwaters, wastewater discharges, hydrometeorological monitoring, qual-ity of waters used as a source of drinking water, recreational waters) for which different agencies in the same country are responsible. Moreover, in non-EU countries, the laboratories and data management capacity need to be strengthened from the technical and methodological point of view.
Monitoring and related reporting in the EU countries is largely set by the requirements of EU water-related directives. Prepar-ing River Basin Management Plans jointly between EU and the neighbouring non-EU countries (e.g., Republic of Mol-dova and Romania) according to the WFD also influences the approach outside the EU, and the related information require-ments push for collecting specific information.
Flooding is also a main problem in the subregion. Recent dis-astrous flooding caused by heavy rains in the Carpathians in July 2008 and in summer 2009 in rivers shared between Ro-mania and Ukraine, and the Republic of Moldova and Ukraine reached critical dimensions, inter alia, with the discharge of the Prut reaching a record level. These events have increased awareness about the need to invest in flood prediction and cooperate with neighbouring countries in developing such systems. Ukraine is developing a flood protection system in
the Dniester, Prut and Siret Basins, a part of which will be hy-drometeorological monitoring, including automatic stations, in support of management decisions to reduce damage from flooding.
As an example of transboundary cooperation on monitoring, Hungary, Romania, Slovakia and Ukraine have already estab-lished a network of automatic hydrometric stations in the Car-pathian region, which will be further developed over time.
However, automatic monitoring devices that are part of early warning systems require long-term commitment for continu-ous maintenance. Testing of the Accident Emergency Warning System (AEWS) in March 2007 on the Danube revealed that half of the stations did not react in a timely fashion.
The use of information technology in monitoring and data management is gradually increasing, introduced especially through donor-supported projects. The development of the structure and content of a pilot Geographical Information Sys-tem (GIS) on the Dniester River Basin as the information basis for water management is supported in an Environment and Security Initiative (ENVSEC) project. For the Prut, a unified monitoring programme and GIS is also called for.
Networks for monitoring transboundary groundwaters are not well developed and, for example, Belarus indicates trans-boundary groundwater monitoring to be needed. At the same time, there are also positive examples: Lithuania has been monitoring transboundary aquifers with Poland for more than 15 years, and in 2010 groundwater monitoring was initiated based on bilateral agreement between the Lithuanian Geologi-cal Survey and the Kaliningrad Agency of Mineral Resources.
Voluntary monitoring schemes of water quality can also help in small rivers (Latvian experience).
mAIn PRobLems, ImPACTs And sTATus Although an improvement of water quality has been observed over the past decade, significant problems remain. Discharges of non-treated or insufficiently treated wastewater, municipal and industrial, still remains a major widespread pressure factor. This is particularly critical for industrial wastewaters with hazardous substances that are not treated before being discharged into sur-face waters or are not pre-treated before being discharged into the sewer systems.
Apart from the lack of sufficient funding for the maintenance and upgrading of industrial and/or municipal wastewater treat-ment plants in non-EU countries, another problem remains: the need to connect more people, particularly in rural areas and small towns, to wastewater and sanitation systems.
Agriculture is another pressure factor: as a significant water user it has impacts on water quantity and as user of pesticides as well as manure and/or nitrogen and phosphorus fertilizers it has im-pacts on the quality of surface waters or groundwaters. Draining of agricultural land has also intensified nutrient emissions from the soil into groundwaters. As concerns the assessment of the rel-ative share of pollution from diffuse sources, some of the non-EU countries in the region still lack experience on the use of proper evaluation methods or models, which makes the development of management scenarios difficult.

ChAPTeR 3 eastern and northern europe | 57
Pollution by pesticides from agriculture and other hazardous sub-stances used in industries — which can seriously damage aquatic ecosystems — is among the significant water management issues identified in the Danube Basin. The importance of pesticide use varies along the basin: in comparison with the upstream Danube countries, the level of pesticide use in the central and lower Dan-ube countries remains relatively low. Another water management problem stems from “old” pesticides, which are not any more authorized in any of the Danube countries, but which are still present in sediments.
The identification of “heavily polluted sites”, either by pesticides, oil products or other hazardous substances, and their restoration is another critical issue in transboundary and domestic water management, including its health-related aspects. The Republic of Moldova, based on the provisions of the Protocol on Water and Health, and with the assistance of Switzerland and UNECE, has in October 2010 finalized work on setting targets and target dates for IWRM, safe drinking water and adequate sanitation, which includes measures to rehabilitate polluted sites.
Agricultural pressure is often significant in basins with a large percentage of cropland, — for example, in the Somes/Szamos and Lielupe with around 50%; in the Venta with around 40%; and in the Neman, Ipel/Ipoly and Salaca with around 30%. For EU countries, which have managed to get point source pollution fairly well under control, the diffuse pollution from agriculture is becoming the main challenge. Thus, the importance of agri-cultural pollution and other diffuse sources as pressure factors is increasing in relative terms, as efforts for many years have focused on pollution from point sources.
Diverse industries operate in the subregion, including food pro-cessing, pulp and paper industry, chemical (e.g., oil refining), metallurgical and metal processing industries. Compared with other sectors, industry is not a big water user due to progress in water saving and rational use of water, but the industry’s envi-ronmental impact depends heavily on the type of industry, the processes used and the efficiency of wastewater treatment. Heavy metals and hydrocarbons from industrial wastewater discharges are a concern in a number of basins, for instance the Siversky Donets, despite the legislation in place.
The mining industry can be a pressure factor, commonly with a local impact, for example in the Siret sub-basin, where storage facilities, including tailings dams, are located. In the Tisza and
Kórós Basins, there are cadmium and copper loads from mining activities. In the territories of the Russian Federation and Ukraine in the Siversky Donets Basin, coal industry has an impact. Dis-charges of saline waters from mines are reported to impact on water resources, e.g., in the Vistula Basin. Ore processing also has impacts; for example nickel smelters in Pechenga, Russian Federation, cause sulphur deposition in Norway (although this has been decreasing). In the Kemijoki Basin, several new mines are in the planning phases in the Finnish territory.
Inappropriate solid waste disposal, for example at uncontrolled dumping sites, is reported to be an issue in some basins, e.g., the Daugava, Ipoly, Vah and Prut, albeit commonly of local impact.
Also hydromorphological changes impact on the biological component of the river systems. The key hydromorphological pressure components are: interruption of river and habitat con-tinuity; disconnection of adjacent wetlands/floodplain; and hy-drological alterations. The key driving forces causing river and habitat continuity interruptions in the Danube River Basin Dis-trict are mainly flood protection (45%), hydropower generation (45%) and water supply (10%). A third of the channels along the main course of the Danube are either severely modified (29%) or totally modified (3%). Almost a tenth of the flood plain is totally modified. In general, the Upper Danube is hydromorphological-ly more altered that the downstream. In the Gauja/Koiva River, fragmentation by dams results in problems for fish migration. Systematic assessments of other major rivers would shed light on the extent of the hydromorphological changes in other parts of the subregion.
The impacts from infrastructure for hydropower generation are also an issue in many basins of the subregion. In those rivers where hydropower has been extensively developed — for exam-ple on the Dnieper, Bug’s tributaries and Kemijoki — significant stretches of the river are hydromorphologically heavily altered.
Ecological changes in the Danube delta itself, including the crea-tion of a network of canals through the delta to improve access and water circulation, and the reduction of the wetland area by the construction of agricultural polders and fishponds have re-duced biodiversity, altered natural flow and sedimentation pat-terns, and diminished the ability of the delta to retain nutrients. This is because more of the nutrient-rich water is now washed directly through the main canals rather than being distributed through the wetlands and reed beds.
Among other anthropogenic pressures that affect wetlands are forestry operations (e.g., cutting, replacement of natural com-munities with monocultures). Peat extraction and associated drainage contribute to the change of hydrological processes and pose a threat to ecosystem integrity. Similar effects are caused by agricultural practices (e.g., transformation of naturally flooded meadows into cultivated lands), while intensive grazing on wet pastures leads to the degradation of natural vegetation and dete-rioration of the soil structure. Another extreme is the abandon-ment of traditional agricultural lands and subsequent overgrow-ing of previously open areas. A specific threat is posed by fires — in forests, on peatlands and grasslands. Unsustainable fisheries and aquaculture, hunting, berry collecting, tourism and recrea-tion practices (including poaching, illegal dumps, etc.) contrib-ute to the deterioration of wetland ecosystems. All together, these processes lead to degradation of valuable aquatic and terrestrial wetland biotopes and the subsequent loss of biodiversity and cer-tain ecosystem services. Invasive plant and animal species that out-compete native ones pose another threat.

58 | PART III
CLImATe ChAnge And ITs ImPACTs on wATeR ResouRCesConcerning observed climate change, IPCC reports that mean winter precipitation increased over the period 1946–1999 across most of Northern Europe. In the future, IPCC projects sum-mer precipitation to decrease in Eastern Europe, causing higher water stress. Northern countries are also vulnerable to climate change, although in the initial stages of warming there may be some benefits in terms of, for example, increased crop yields and forest growth. The projected impacts include increases in annual run-off in Northern Europe, and decreases in Eastern Europe. In general, annual average run-off is projected to in-crease in Northern Europe (north of 47°N) by approximately 5–15% up to the 2020s and by 9–22% up to the 2070s. The increase in projected run-off and lower risk of drought could benefit the fauna of aquatic systems. Groundwater recharge is likely to be reduced in Eastern Europe, with a larger reduction in valleys and lowlands. Flow seasonality (and drought risk and flood frequencies) is predicted to increase also in Eastern Eu-rope, with higher flows in the peak flow season and either lower flows during the low-flow season or extended dry periods. In Northern Europe, IPCC predicts the risk of winter flooding to increase by 2020s and present day’s 100 year floods to occur more frequently.3
Ukraine is a good example to highlight the impact of climate change in the subregion: the total annual precipitation is in-creasing over most of its territory. Within the next 30 years, climate change is predicted to cause a 15%–25% increase of the mean annual run-off in the forested northern part of Ukraine, involving an increase of winter run-off and a decrease of spring run-off. In the southern and south-eastern parts of the country, Ukraine predicts a 30%–50% decrease in the mean annual run-off, with about a half of the flow occurring during the winter months. Drought risk is expected to increase in the south of the country. Along the rivers in the Carpathians, the frequency of extreme floods is predicted to increase. Predictions of run-off change have been made for individual rivers (the Dnieper, for example). Negative impacts are expected on the water quality in the south and south-east of Ukraine.
In Latvia, compared with the reference period 1961–1990, the to-tal annual precipitation is predicted to increase by 4%–11% in the period 2070–2100. Monthly precipitation is predicted to increase in winter and in the beginning of summer, but decrease in sum-mer. The number of days with intensive precipitation (more than 10 mm in 24 hours) is predicted to increase by 20–100. Moreover, periods without precipitation, i.e., more than five days without rain, are expected to occur more frequently.
In the northern part of the subregion, for the area of, e.g., the Kemijoki and Teno Basins in the north of Finland, a set of cli-mate change scenarios suggests an increase of 1.5 ºC–4.0 ºC in annual mean temperature and 4%–12% increase in annual precipitation in the next 50 years. Changes in seasonal flow are predicted to vary from -5% to +10%, depending on the area. In general, the frequency of spring floods may increase. Ground-water levels may increase in wintertime and decline in summer time, and groundwater quality in small groundwater bodies may be negatively affected.
No specific analysis of climate change and planning of related measures was required in the preparation of River Basin Man-agement Plans according to the WFD. However, in some cases — thanks to the activities of, for example, river basin commis-sions — climate change has been taken into consideration. The Tisza River Basin Management Plan 2010 in the framework of the ICPDR stands as an example. Significant impacts from cli-mate change on the Tisza and Danube water systems are expect-ed, in particular reduced average water flow and increase in the frequency and intensity of extreme events, even though there are significant regional and local variations. Historical changes in land use and water management complicate the assessment of climate change impacts. Changes in water quality and ecologi-cal status are considered likely, but have not been investigated. Current practical information needs — as demonstrated by the case of the Tisza — include the quantification of the predicted impacts on water resources and a better knowledge about their spatial distribution. A number of research projects, funded in particular by the EU, aim at strengthening the knowledge base.
Monitoring of the different components of the water cycle — including evapotranspiration — for water balance studies is needed, as well as an evaluation of the changes of the hydro-
3 Bates, B.C., Kundzewicz, Z.W. Wu, S. and Palutikof, J.P. (eds), Climate Change and Water. Technical Paper of the Intergovernmental Panel on Climate Change. IPCC Secretariat, Geneva. 2008.

ChAPTeR 3 eastern and northern europe | 59
logical regime through models. The necessity of strengthening interdisciplinary research of climate change impacts on water-related sectors of the economy requires coordination between different sectors and agencies. Further work is also needed to assess impacts on water uses, including those which are strongly health-related such as drinking water use and recreational use.
Many countries have developed or are in the course of develop-ing strategies on climate change: Romania, for example, has adopted a National Strategy for Climate Change, and Hun-gary proceeds in this direction. In Ukraine, a draft Climate Programme has been prepared by the Ukrainian Hydromete-orological Institute, paving the way for the drawing up of a national strategy. Work is carried out by Ukraine in the frame-work of the National Policy Dialogue on IWRM, which so far culminated in a draft concept for the State policy on the adap-tation of water management to climate change.
Efforts are also being made to address climate change-related concerns, and the need to develop intersectoral and interna-tional cooperation to this end is acknowledged. In the EU, the European Commission White Paper (2009) “Adapting to cli-mate change: towards a European framework for action” calls for the promotion of strategies which increase the resilience to climate change, and sees also a need for the development of guidance to ensure “climate proofing” of River Basin Manage-ment Plans by 2015.
The various programmes and initiatives include, for example, a programme set up in the Paatsjoki/Pasvik River Basin, which aims to produce knowledge and information on environmental impacts for decision-making and strategies for adaptation to climate change and anthropogenic effects and which will de-velop assessment tools for this border region. On the Dniester and Neman River Basins, two projects on adaptation to climate change are carried out aiming to promote a basin-wide assess-ment of the impacts of climate change applying the UNECE Guidance on Water and Adaptation to Climate Change (2009). Evaluation of costs of adaptation and comparison of different adaptation measures is commonly further down the road for many basins, and only a few countries have seriously embarked on these aspects yet.
ResPonses For most of the transboundary waters in the subregion, bilateral or multilateral agreements exist. Many bilateral agreements on transboundary waters are expected to be revised, taking into account provisions of the WFD and of the Water Convention (e.g., the agreement on the Dniester, which has been under ne-gotiation over the past few years). The studies, plans and rec-ommendations developed by established river basin commis-sions demonstrate the benefits of institutionalizing the basin level cooperation.
The WFD requirements have put in motion a process towards meeting the objective of good status by 2015. EU member States have transposed the Directive in their national legisla-tion. Preparing River Basin Management Plans has required an assessment of the situation in the basins according to a com-mon format. Programmes of measures have been defined as stipulated in the WFD to address the main concerns identified in the Plans. However, for transboundary river basins, activities in the different riparian countries need to be further coordi-nated and harmonized in River Basin Management Plan(s), in particular for basins shared by EU and non-EU countries.
A positive exception is the Danube, for which a Joint Pro-gramme of Measures has been defined to address the identified Significant Water Management Issues (organic, nutrient and hazardous substances pollution and hydromorphological altera-tions), as well as groundwater bodies of basin-wide importance. The Programme is based on the national programmes of meas-ures, which are to be made operational by December 2012.
Gradual rehabilitation, building and extension of sewerage sys-tems and wastewater treatment plants is being carried out. In the EU, the Urban Wastewater Treatment Directive (Council Directive 91/271/EEC) requires collection and treatment (ba-sically biological) of wastewater from agglomerations and sets the time frame for compliance. Many countries that acceded to the EU in 2004 and 2007 enlargements — in this subre-gion, Estonia, Hungary, Latvia, Lithuania, Poland, Slovakia and Romania — were granted transitional periods to comply with the Directive’s requirements. The investment needed in these EU member States in order to achieve compliance with the Directive is substantial. This is illustrated by the case of Estonia, where the biggest part of the EU Cohesion Fund to fulfil environmental commitments is planned to be used for reconstruction of wastewater treatment plants and renovating relevant collection systems.
The significant investments made and infrastructure projects carried out to renovate existing wastewater treatment plants and build new ones have contributed to the reduction of pol-lution load to surface waters. For example, for phosphorus, ni-trogen, BOD, chemical oxygen demand (COD) and suspended solids, the load to surface waters has decreased in Latvia by 10%–40% during 2004 to 2008. In Estonia, the pollution load has decreased in BOD
7 from 1992 to 2007 by 94%, in total
phosphorus by 79% and in total nitrogen by 71%.
EU countries are also taking supplementary measures to reduce nutrient pollution, as demonstrated by Slovakia, where these range from legislative measures for the production of phos-phorus-free detergents to the application of good agricultural practices (related to the implementation of the EU Nitrates Di-rective). Studies on the modelling and assessment of nutrient emissions (nitrogen and phosphorus) from point and diffuse pollution sources are also envisaged (e.g., Romania and Slova-kia) as supplementary measures.
Fulfilling the requirements of the Nitrates Directive and the Ur-ban Wastewater Treatment Directive are for EU countries the fun-damental measures for reducing nutrient load at basin level. Dif-fuse pollution by nutrients from agriculture is addressed through, for example, specific action programmes for Nitrate Vulnerable Zones where more stringent environmental requirements for ag-riculture are to be applied, such as requirements to construct ma-nure storages and prepare fertilization plans. ICPDR promotes its Best Agricultural Practices Recommendations to non-EU coun-tries in the Danube Basin. To limit impacts on quality of water resources, vulnerability mapping for nitrate pollution from agri-cultural sources has been carried out (e.g., Romania).
Even though the observed improvement of water quality in the past decade in the new EU member States like Romania is part-ly related to reduced industrial activity, a part of the credit is given to the implementation of principles like the polluter-pays principle in environmental regulation and the transposition of the EU environmental legislation. As an example, in the Mures/Maros sub-basin, heavy metal pollution from mining has been reduced by closing some mines and by rehabilitating the waste-water treatment plants.
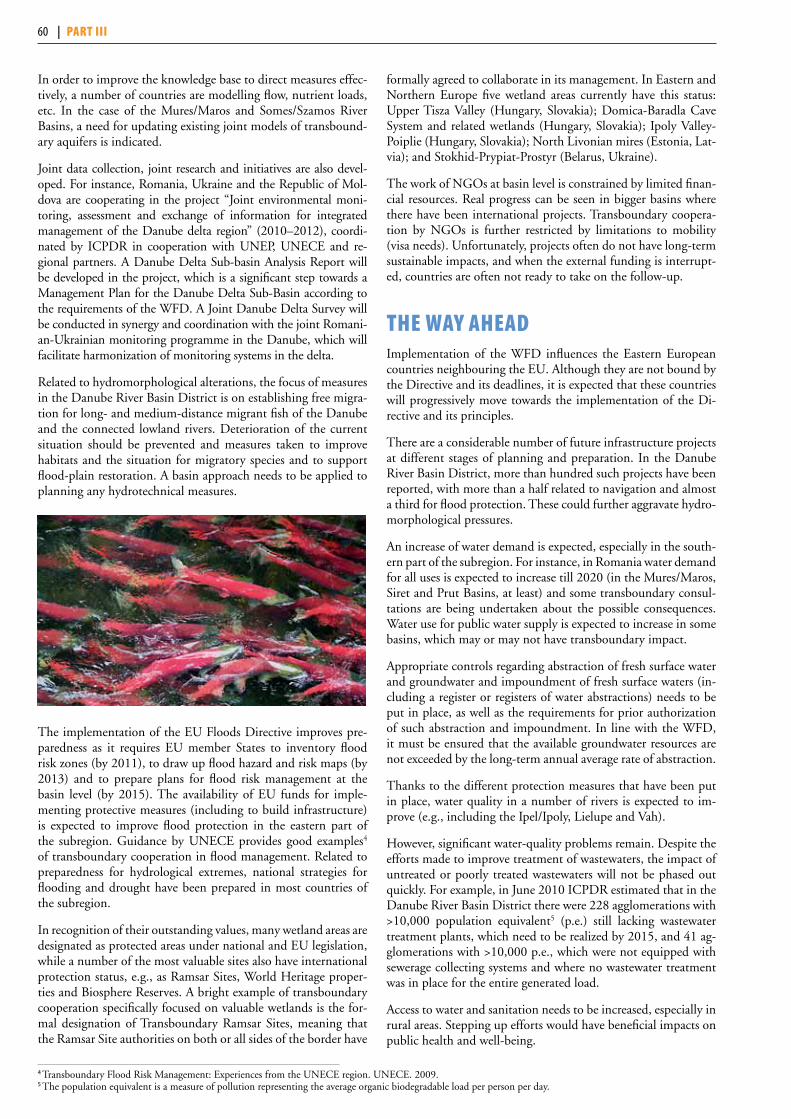
60 | PART III
In order to improve the knowledge base to direct measures effec-tively, a number of countries are modelling flow, nutrient loads, etc. In the case of the Mures/Maros and Somes/Szamos River Basins, a need for updating existing joint models of transbound-ary aquifers is indicated.
Joint data collection, joint research and initiatives are also devel-oped. For instance, Romania, Ukraine and the Republic of Mol-dova are cooperating in the project “Joint environmental moni-toring, assessment and exchange of information for integrated management of the Danube delta region” (2010–2012), coordi-nated by ICPDR in cooperation with UNEP, UNECE and re-gional partners. A Danube Delta Sub-basin Analysis Report will be developed in the project, which is a significant step towards a Management Plan for the Danube Delta Sub-Basin according to the requirements of the WFD. A Joint Danube Delta Survey will be conducted in synergy and coordination with the joint Romani-an-Ukrainian monitoring programme in the Danube, which will facilitate harmonization of monitoring systems in the delta.
Related to hydromorphological alterations, the focus of measures in the Danube River Basin District is on establishing free migra-tion for long- and medium-distance migrant fish of the Danube and the connected lowland rivers. Deterioration of the current situation should be prevented and measures taken to improve habitats and the situation for migratory species and to support flood-plain restoration. A basin approach needs to be applied to planning any hydrotechnical measures.
The implementation of the EU Floods Directive improves pre-paredness as it requires EU member States to inventory flood risk zones (by 2011), to draw up flood hazard and risk maps (by 2013) and to prepare plans for flood risk management at the basin level (by 2015). The availability of EU funds for imple-menting protective measures (including to build infrastructure) is expected to improve flood protection in the eastern part of the subregion. Guidance by UNECE provides good examples4
of transboundary cooperation in flood management. Related to preparedness for hydrological extremes, national strategies for flooding and drought have been prepared in most countries of the subregion.
In recognition of their outstanding values, many wetland areas are designated as protected areas under national and EU legislation, while a number of the most valuable sites also have international protection status, e.g., as Ramsar Sites, World Heritage proper-ties and Biosphere Reserves. A bright example of transboundary cooperation specifically focused on valuable wetlands is the for-mal designation of Transboundary Ramsar Sites, meaning that the Ramsar Site authorities on both or all sides of the border have
formally agreed to collaborate in its management. In Eastern and Northern Europe five wetland areas currently have this status: Upper Tisza Valley (Hungary, Slovakia); Domica-Baradla Cave System and related wetlands (Hungary, Slovakia); Ipoly Valley-Poiplie (Hungary, Slovakia); North Livonian mires (Estonia, Lat-via); and Stokhid-Prypiat-Prostyr (Belarus, Ukraine).
The work of NGOs at basin level is constrained by limited finan-cial resources. Real progress can be seen in bigger basins where there have been international projects. Transboundary coopera-tion by NGOs is further restricted by limitations to mobility (visa needs). Unfortunately, projects often do not have long-term sustainable impacts, and when the external funding is interrupt-ed, countries are often not ready to take on the follow-up.
The wAy AheAd Implementation of the WFD influences the Eastern European countries neighbouring the EU. Although they are not bound by the Directive and its deadlines, it is expected that these countries will progressively move towards the implementation of the Di-rective and its principles.
There are a considerable number of future infrastructure projects at different stages of planning and preparation. In the Danube River Basin District, more than hundred such projects have been reported, with more than a half related to navigation and almost a third for flood protection. These could further aggravate hydro-morphological pressures.
An increase of water demand is expected, especially in the south-ern part of the subregion. For instance, in Romania water demand for all uses is expected to increase till 2020 (in the Mures/Maros, Siret and Prut Basins, at least) and some transboundary consul-tations are being undertaken about the possible consequences. Water use for public water supply is expected to increase in some basins, which may or may not have transboundary impact.
Appropriate controls regarding abstraction of fresh surface water and groundwater and impoundment of fresh surface waters (in-cluding a register or registers of water abstractions) needs to be put in place, as well as the requirements for prior authorization of such abstraction and impoundment. In line with the WFD, it must be ensured that the available groundwater resources are not exceeded by the long-term annual average rate of abstraction.
Thanks to the different protection measures that have been put in place, water quality in a number of rivers is expected to im-prove (e.g., including the Ipel/Ipoly, Lielupe and Vah).
However, significant water-quality problems remain. Despite the efforts made to improve treatment of wastewaters, the impact of untreated or poorly treated wastewaters will not be phased out quickly. For example, in June 2010 ICPDR estimated that in the Danube River Basin District there were 228 agglomerations with >10,000 population equivalent5 (p.e.) still lacking wastewater treatment plants, which need to be realized by 2015, and 41 ag-glomerations with >10,000 p.e., which were not equipped with sewerage collecting systems and where no wastewater treatment was in place for the entire generated load.
Access to water and sanitation needs to be increased, especially in rural areas. Stepping up efforts would have beneficial impacts on public health and well-being.
4 Transboundary Flood Risk Management: Experiences from the UNECE region. UNECE. 2009.5 The population equivalent is a measure of pollution representing the average organic biodegradable load per person per day.
ChAPTeR 4 CauCasus
61
InTRoduCTIonThe subregional assessment of transboundary waters in the Caucasus covers transboundary rivers, lakes and groundwaters shared by two or more of the following countries: Armenia, Azerbaijan, Georgia, the Islamic Republic of Iran, the Russian Federation and Turkey. The assessment of the individual trans-boundary surface and groundwaters in this subregion can be found in the Chapters 4 and 5 of Section IV (drainage basins of the Caspian Sea and of the Black Sea). The assessment of trans-boundary waters in the Caucasus also contains assessments of a number of selected Ramsar Sites and other wetlands of trans-boundary importance: Javakheti Wetlands area (including Lake Arpi Ramsar Site; Madatapa, Bugdasheni, Sagamo and Khan-chali lakes and Kartsakhi/Aktas lake); and flood-plain marshes and fish ponds in the Araks/Aras River valley.
There are six major transboundary rivers and four major in-ternational lakes as well as 13 assessed transboundary aquifers in the Caucasus. By far the largest part of the subregion is covered by the basin of the Kura and its tributaries.
Natural availability of water in the Caucasus is quite variable, with abundant resources in the mountainous areas of Geor-gia and scarcity in Azerbaijan. Difficulties and deficiencies in water resources management aggravate problems of access to water in sufficient quantity and quality.
The Southern Caucasus countries share a common history as part of the former Soviet Union, which heavily influenced the institutional and legal setting for management of water resources, as well as their monitoring. Recent environmental protection efforts have improved water quality but the indus-trial and agricultural legacy of environmental degradation of the former regime has still an impact on water resources.
Past and unsolved political conflicts in the region remain a major obstacle for transboundary cooperation. A lack of trust between the countries persists, and it has thus far proven im-possible to enter into formal agreements and establish effec-tive institutional arrangements to manage most of the trans-boundary water resources. A number of positive steps have been taken in the direction of enhanced cooperation, mostly thanks to international assistance projects; however, a stronger political willingness to cooperate is needed to make substan-tial and sustainable progress.
LegAL, PoLICy And InsTITuTIonAL fRAmewoRks foR TRAnsboundARy wATeR mAnAgemenTIWRM is not currently applied in the Caucasus in general, but there are a number of positive developments: in many countries the water sector has undergone or is undergoing reform and new legislative water codes have been developed.
Moreover, there has been a progressive approximation towards the WFD. An important driver is the EU Neighbourhood Policy, under which Armenia, Azerbaijan and Georgia signed agreements committing themselves to bring new environmental laws closer to EU legislation and to cooperate with neighbouring countries regarding transboundary water management.
Armenia’s water code of 2002 is the first in the subregion to meet this obligation. It refers to, among others, development of water basin management plans, introduced since 2005, and to an inter-sectoral advisory body. In Georgia, water resources are managed according to principles of territorial administration (regional units) and river basin-based management is not applied. A new water law — as a basis for reforming the 1997 water resources management system — is being drafted and will include princi-ples of basin management. There are no river basin organizations in Turkey either, but the regional directorates of the General Directorate of State Hydraulic Works (DSI) are responsible for preparing master plans that set priorities for the development of water and land resources in the respective basins across water-related sectors.
Even if there is a lack of comprehensive IWRM plans in these countries, some steps are being progressively taken in that direc-tion. For example, Turkey plans to initiate the preparation of a river basin management plan on the Chorokhi/Coruh River. Ac-cording to draft strategic orientations of the Ministry of the Envi-ronment and Natural Resources of Georgia (2009), the develop-ment of a river basin management plan for the Georgian part of the Chorokhi Basin is scheduled for the period from 2011–2015. The Islamic Republic of Iran also reports that a comprehensive IWRM plan for the Araks/Aras Basin is under preparation.
Groundwater has a high importance in the subregion for drink-ing water supply, especially in rural areas. Some 80% of drinking water supplied in Georgia through centralized distribution net-works is abstracted from groundwater. In addition, groundwater is also an important source of irrigation water in some areas. Nev-

62 | PART III
ertheless, groundwater resources in general receive little atten-tion. Integrated management of groundwater and surface water is not occurring in the region and management of (transbound-ary) groundwaters is not advanced.1
The lack of formal cooperation between all countries in the Kura Basin, in particular the lack of a legal framework and joint body for transboundary water cooperation, is a regrettable limitation; such a development has not yet materialized despite the efforts made in various international projects, including the USAID South Caucasus Water Programme and an ENVSEC project.
The Caucasus, and in particular the Kura River Basin, has ben-efited from many international assistance projects. These offer opportunities but also risks of overlapping and duplication, and do not necessarily match with the countries’ priorities. The insti-tutionalization of cooperation and the creation of a joint body for transboundary water management would avoid overlapping and duplication, while also ensuring continuity and sustainabil-ity of activities and a more effective use of international funds.
Nevertheless, a few bilateral agreements and some joint commis-sions do exist, such as the agreements between the Islamic Re-public of Iran and Armenia and the Islamic Republic of Iran and Azerbaijan or the Interstate Commission of Armenia and Turkey on the Use of the Arpaçay/Akhuryan Water Reservoir.2
The level of implementation of bilateral agreements, especially their water management-related clauses, remains low and activ-ities are sporadic. For example, under the existing agreement on environmental cooperation between Georgia and Azerbaijan, no programme or actions have been developed and no official working group or intergovernmental body has been established to regularly oversee or support implementation of the agree-ment. Thus, the ongoing negotiations between Georgia and Azerbaijan aiming to establish an agreement and a permanent body for cooperation on IWRM are a promising step forward for the region which could provide a model for the further de-velopment of cooperation.
The status of ratification of the Water Convention is varied: Azerbaijan and the Russian Federation are Parties, while Geor-gia, Armenia and Turkey are not. Until the entry into force of the amendments to articles 25 and 26 to open the Convention to countries outside the UNECE region, the Islamic Republic of Iran cannot accede.3
Economic development is clearly the priority at the present time, and efforts to improve economic performance have influenced legislation, including environmental and water legislation. For example, in Georgia, the issuing of groundwater abstraction li-cences was transferred to the Ministry of Energy and Natural Re-sources and the requirement for an environmental impact permit is now limited to major enterprises; licences are not required by households using water for their domestic needs.
monIToRIng of TRAnsboundARy RIveRs, LAkes And gRoundwATeRsSince the break-up of the Soviet Union, monitoring and assess-ment declined in the Caucasus, demonstrated, for example, by a substantial decrease in the number of operational monitoring sta-
tions. Some improvement can be observed in recent years, thanks to international projects. However, there is a lack of continuity to these activities. Monitoring has suffered owing to a general lack of national funding, even if recently the situation has improved in some countries due to an increase in national environmental budgets (e.g., Armenia).
Groundwater monitoring and integration of surface and ground-water monitoring are particularly weak. In Georgia, no systemat-ic groundwater monitoring has taken place for the past 20 years.
No (hydro)biological monitoring has been introduced in the Caucasus; however, slow progress is being made towards this, thanks to important support from EU assistance projects. Im-provement in microbiological and biological monitoring is re-ported in Armenia and Georgia.
Water quality in lakes is not being monitored in Georgia, with the exception of checking parameters for recreational water quality.
There is no systematic control of wastewater. Self-monitoring of sewage water by enterprises has been introduced in Georgia, Ar-menia and Azerbaijan, but enforcement is not always strict.
A remaining Soviet influence is the still common reference to “maximum allowable concentrations of pollutants for a specific water use” (MAC) — seemingly stringent water quality standards that are difficult to comply with. Adoption and implementation of new water quality standards depends on legislation, and legislative changes are made slowly. Moreover, attachment to familiar systems and resistance to change make for slow progress in the transition from MAC values towards water quality objectives.
There are problems of quality assurance regarding data on water quality, not only in the analytics but also in the preceding chain of sampling and processing. There is no data comparability be-tween countries, due to, among others, a lack of consistency in methods. Some international projects, such as the TACIS project “Water Governance in the Western EECCA Countries” (2008–2010), aim at a higher degree or harmonization in water quality assessment and in related parameters. The requirements of the WFD give direction to these efforts.
Monitoring of water flow has also been disrupted since the col-lapse of the Soviet system. There are not enough hydrometric sta-tions (e.g., on the Kura for improving flood protection) and the riparian countries do not share them efficiently. Regular exchange of operative data, like daily water levels and weekly discharges, is missing. Early warning is also needed for hydrological extreme events and in case of accidental pollution. The recent exchanges reported between Georgian and Turkish delegations concerning establishment of early warning systems on the Chorokhi/Coruh River are a positive development.
Under the existing bilateral agreements, bilateral cooperation on monitoring is currently established between Azerbaijan and the Islamic Republic of Iran, Armenia and the Islamic Repub-lic of Iran, Armenia and Turkey (Araks/Aras and Akhuryan/Ar-paçay), Turkey and the Islamic Republic of Iran (Sarisu River), and Georgia and Turkey. While recent improvements have been achieved in the field of joint monitoring and assessment thanks to international projects, stable, long-term cooperation is missing in the Kura River Basin.
1 A brief description of the water resources management framework in each of the countries can be found in annex I.2 Information on the existing agreements for transboundary water cooperation can be found in annex II.3 The status of ratification of selected international agreements by Caucasus countries is presented in annex III.
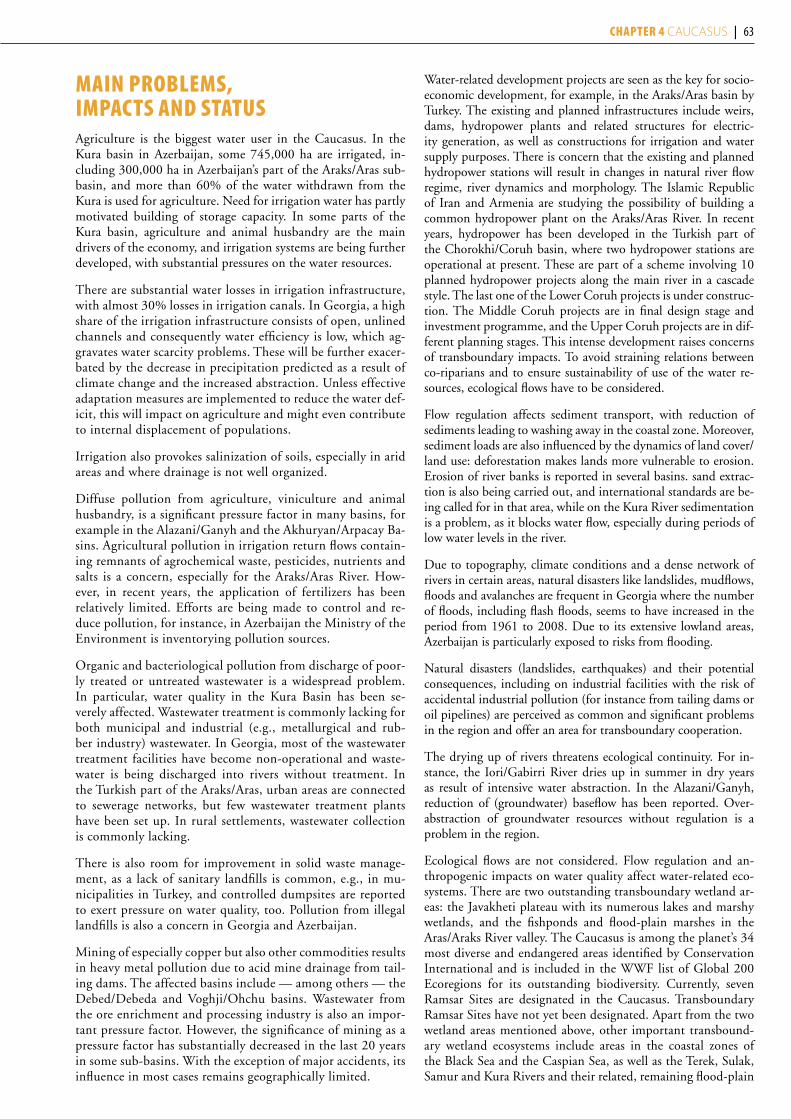
ChAPTeR 4 CauCasus | 63
mAIn PRobLems, ImPACTs And sTATusAgriculture is the biggest water user in the Caucasus. In the Kura basin in Azerbaijan, some 745,000 ha are irrigated, in-cluding 300,000 ha in Azerbaijan’s part of the Araks/Aras sub-basin, and more than 60% of the water withdrawn from the Kura is used for agriculture. Need for irrigation water has partly motivated building of storage capacity. In some parts of the Kura basin, agriculture and animal husbandry are the main drivers of the economy, and irrigation systems are being further developed, with substantial pressures on the water resources.
There are substantial water losses in irrigation infrastructure, with almost 30% losses in irrigation canals. In Georgia, a high share of the irrigation infrastructure consists of open, unlined channels and consequently water efficiency is low, which ag-gravates water scarcity problems. These will be further exacer-bated by the decrease in precipitation predicted as a result of climate change and the increased abstraction. Unless effective adaptation measures are implemented to reduce the water def-icit, this will impact on agriculture and might even contribute to internal displacement of populations.
Irrigation also provokes salinization of soils, especially in arid areas and where drainage is not well organized.
Diffuse pollution from agriculture, viniculture and animal husbandry, is a significant pressure factor in many basins, for example in the Alazani/Ganyh and the Akhuryan/Arpacay Ba-sins. Agricultural pollution in irrigation return flows contain-ing remnants of agrochemical waste, pesticides, nutrients and salts is a concern, especially for the Araks/Aras River. How-ever, in recent years, the application of fertilizers has been relatively limited. Efforts are being made to control and re-duce pollution, for instance, in Azerbaijan the Ministry of the Environment is inventorying pollution sources.
Organic and bacteriological pollution from discharge of poor-ly treated or untreated wastewater is a widespread problem. In particular, water quality in the Kura Basin has been se-verely affected. Wastewater treatment is commonly lacking for both municipal and industrial (e.g., metallurgical and rub-ber industry) wastewater. In Georgia, most of the wastewater treatment facilities have become non-operational and waste-water is being discharged into rivers without treatment. In the Turkish part of the Araks/Aras, urban areas are connected to sewerage networks, but few wastewater treatment plants have been set up. In rural settlements, wastewater collection is commonly lacking.
There is also room for improvement in solid waste manage-ment, as a lack of sanitary landfills is common, e.g., in mu-nicipalities in Turkey, and controlled dumpsites are reported to exert pressure on water quality, too. Pollution from illegal landfills is also a concern in Georgia and Azerbaijan.
Mining of especially copper but also other commodities results in heavy metal pollution due to acid mine drainage from tail-ing dams. The affected basins include — among others — the Debed/Debeda and Voghji/Ohchu basins. Wastewater from the ore enrichment and processing industry is also an impor-tant pressure factor. However, the significance of mining as a pressure factor has substantially decreased in the last 20 years in some sub-basins. With the exception of major accidents, its influence in most cases remains geographically limited.
Water-related development projects are seen as the key for socio-economic development, for example, in the Araks/Aras basin by Turkey. The existing and planned infrastructures include weirs, dams, hydropower plants and related structures for electric-ity generation, as well as constructions for irrigation and water supply purposes. There is concern that the existing and planned hydropower stations will result in changes in natural river flow regime, river dynamics and morphology. The Islamic Republic of Iran and Armenia are studying the possibility of building a common hydropower plant on the Araks/Aras River. In recent years, hydropower has been developed in the Turkish part of the Chorokhi/Coruh basin, where two hydropower stations are operational at present. These are part of a scheme involving 10 planned hydropower projects along the main river in a cascade style. The last one of the Lower Coruh projects is under construc-tion. The Middle Coruh projects are in final design stage and investment programme, and the Upper Coruh projects are in dif-ferent planning stages. This intense development raises concerns of transboundary impacts. To avoid straining relations between co-riparians and to ensure sustainability of use of the water re-sources, ecological flows have to be considered.
Flow regulation affects sediment transport, with reduction of sediments leading to washing away in the coastal zone. Moreover, sediment loads are also influenced by the dynamics of land cover/land use: deforestation makes lands more vulnerable to erosion. Erosion of river banks is reported in several basins. sand extrac-tion is also being carried out, and international standards are be-ing called for in that area, while on the Kura River sedimentation is a problem, as it blocks water flow, especially during periods of low water levels in the river.
Due to topography, climate conditions and a dense network of rivers in certain areas, natural disasters like landslides, mudflows, floods and avalanches are frequent in Georgia where the number of floods, including flash floods, seems to have increased in the period from 1961 to 2008. Due to its extensive lowland areas, Azerbaijan is particularly exposed to risks from flooding.
Natural disasters (landslides, earthquakes) and their potential consequences, including on industrial facilities with the risk of accidental industrial pollution (for instance from tailing dams or oil pipelines) are perceived as common and significant problems in the region and offer an area for transboundary cooperation.
The drying up of rivers threatens ecological continuity. For in-stance, the Iori/Gabirri River dries up in summer in dry years as result of intensive water abstraction. In the Alazani/Ganyh, reduction of (groundwater) baseflow has been reported. Over-abstraction of groundwater resources without regulation is a problem in the region.
Ecological flows are not considered. Flow regulation and an-thropogenic impacts on water quality affect water-related eco-systems. There are two outstanding transboundary wetland ar-eas: the Javakheti plateau with its numerous lakes and marshy wetlands, and the fishponds and flood-plain marshes in the Aras/Araks River valley. The Caucasus is among the planet’s 34 most diverse and endangered areas identified by Conservation International and is included in the WWF list of Global 200 Ecoregions for its outstanding biodiversity. Currently, seven Ramsar Sites are designated in the Caucasus. Transboundary Ramsar Sites have not yet been designated. Apart from the two wetland areas mentioned above, other important transbound-ary wetland ecosystems include areas in the coastal zones of the Black Sea and the Caspian Sea, as well as the Terek, Sulak, Samur and Kura Rivers and their related, remaining flood-plain

64 | PART III
wetlands. The waters of these river and lake drainage systems provide important resources for domestic water use, hydro-power generation and agricultural irrigation — especially in Armenia, Azerbaijan and Georgia. However, the same wetland ecosystems are also providing important services for human well-being, livelihoods and economies, such as recreation, fish-eries, hunting and livestock farming, and harbour a rich biodi-versity which depends on them.
Overfishing is a concern in the Kura Basin, where fishing is an important source of income for riparian communities. Instanc-es of illegal fishing occur, in which unsustainable harvesting methods are being used that threaten fish populations.
CLImATe ChAnge And ITs ImPACTs on wATeR ResouRCesIn Armenia, summer temperatures have increased by 1 ºC dur-ing the period 1935–2007, whereas the increase in winter is not statistically significant. Climate change forecasts for Arme-nia show a significant and consistent increase in temperatures projected for the three time horizons — 2030, 2070 and 2100 — with maximal increase in summer season. The central and western regions of Armenia are expected to experience more warming than the rest of the country. Air temperature is ex-pected to increase by about 1 ºC by 2030, with an approxi-mately 3% decrease in precipitation. The predicted reduction in the amount of precipitation (rain and snow) varies somewhat by area/basin: for example for Akhuryan/Arpaçhay it is 7% to 10%; for Voghji/Ohchu, 3% to 5%; and for Agstev/Agstafachai 3% to 4%. A decrease of 5% to 10% is predicted in run-off in the area of Agstev/Agstafachai, 8% to 10% in Vorotan/Bargu-shad and 2% to 3% in Voghji/Ohchu. A decrease in ground-water levels is also predicted. Armenia’s vulnerability to climate change is linked to the importance of the agriculture sector — highly dependent on irrigation from rivers — for the economy: it accounts for 20% of GDP in direct agricultural production and an additional 10% in food manufacturing.
Despite uncertainty, long-term forecasts of most global cli-mate models show about 5% decrease in precipitation on the territory of Georgia, with strong inter-seasonal variability. In Eastern Georgia the predicted decrease of summer precipita-tion will increase the frequencies of drought and accelerate the desertification process. The decrease of run-off is predicted for two major rivers of eastern Georgia, the Iori/Gabirri and Ala-zani/Ganyh, with potential impact on irrigated agriculture and drinking water supply.
In Azerbaijan, a decrease of 15% in both run-off and ground-water recharge is expected within the next 50 years due to the predicted increase of air temperature by 2 ºC to 3 ºC. Ground-water recharge is also influenced by reduced surface water flow. The influence of reduced run-off, as well as decreased quality of both surface water and groundwater in the Kura basin, is assessed as very negative. In the western part of the country, the impact of reduced groundwater recharge is predicted to be very nega-tive. In general, the coastal zone, lowlands and deserts are rated as most vulnerable to climate change. Implemented or planned adaptation mainly relate to technical flood protection, restriction of development in risk areas, improving flood forecasting and monitoring, technical measures to increase supply of water (for drought/low flow protection), application of economic instru-
ments and improvement of existing coastal infrastructure.
During the preparation process for their Second National Com-munications under the UNFCCC, Armenia, Azerbaijan and Georgia performed several runs of the PRECIS (Providing RE-gional Climates for Impacts Studies) Regional Climate Model for different socio-economic scenarios and two Global Climate Models (HadAM3P and ECHAM4),4 to evaluate future cli-mate in the Caucasus region. Towards this end, the countries cooperated by exchanging data and each country validated the baseline data obtained for their territory and used it for cli-mate scenarios and climate change impact assessment studies. Further work on compilation of future climate scenarios and agreement about them at the regional level is being carried out in the framework of the Regional Climate Change Study for the South Caucasus Region financed by ENVSEC.
In the Iranian part of the Araks/Aras basin, average annual tem-perature is predicted to increase by 1.5 ºC to 2 ºC by 2050. A reduction of 3% in precipitation is expected. The impacts on land use and cropping patterns and on irrigation needs are expected to be considerable.
For the part of the Araks/Aras that is in Turkish territory, Tur-key predicts a decrease of 10% to 20% in precipitation by 2070–2100, and increased seasonal variability of precipitation. A decrease of 10% to 20% in run-off is predicted, also with increased variability. A decrease of groundwater levels is pre-dicted too, with negative effects on groundwater quality. Both consumptive and non-consumptive water uses are foreseen to increase in the Turkish part of the Araks/Aras. But the trends are not uniform, as, for example, in the basin of the Chorokhi/Coruh a comparable increase in precipitation is expected and consequently groundwater levels are expected to rise.
So far adaptation to climate change has been limited to some studies and actual adaptation measures are mostly only starting to be considered. Turkey has developed a “National Climate Change Strategy” (2009), but the actual planning of measures lies ahead. The Islamic Republic of Iran has also been develop-ing its national plan for coping with climate change.
4 Turkey, the Russian Federation and the Islamic Republic of Iran were also involved in this regional implementation process, which was organized and directed operationally by the Hadley Centre for Climate Prediction and Research in the United Kingdom.
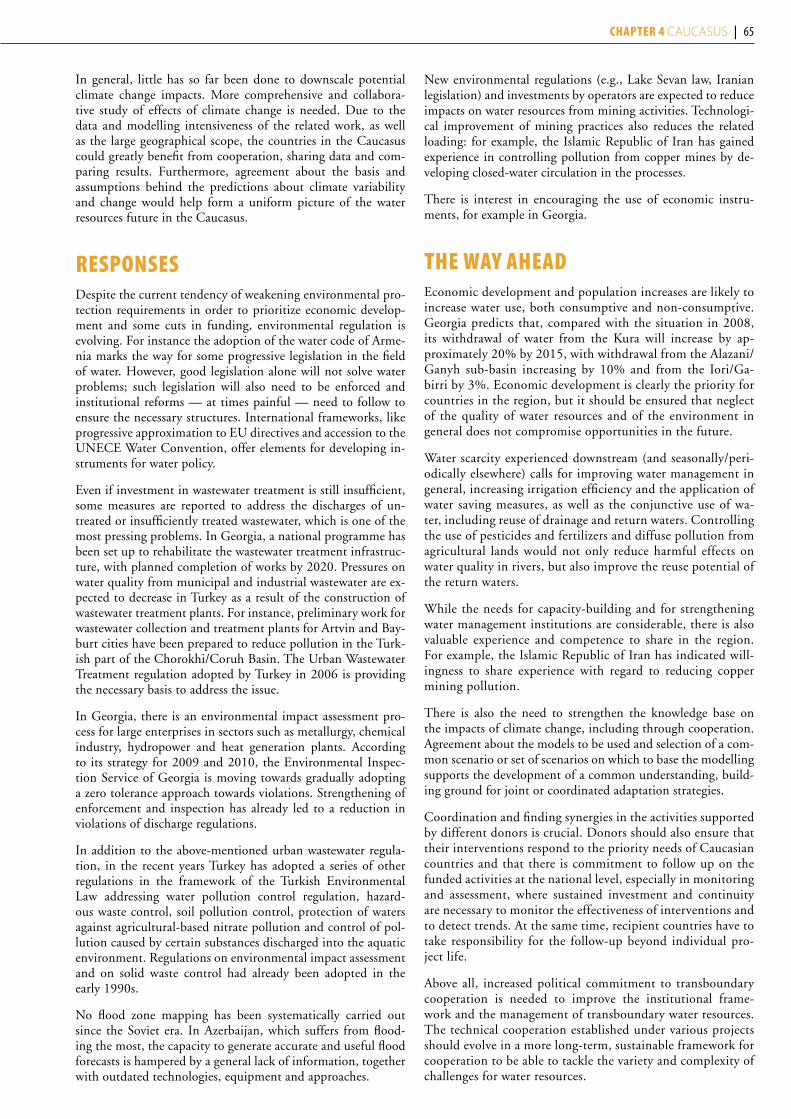
ChAPTeR 4 CauCasus | 65
In general, little has so far been done to downscale potential climate change impacts. More comprehensive and collabora-tive study of effects of climate change is needed. Due to the data and modelling intensiveness of the related work, as well as the large geographical scope, the countries in the Caucasus could greatly benefit from cooperation, sharing data and com-paring results. Furthermore, agreement about the basis and assumptions behind the predictions about climate variability and change would help form a uniform picture of the water resources future in the Caucasus.
ResPonsesDespite the current tendency of weakening environmental pro-tection requirements in order to prioritize economic develop-ment and some cuts in funding, environmental regulation is evolving. For instance the adoption of the water code of Arme-nia marks the way for some progressive legislation in the field of water. However, good legislation alone will not solve water problems; such legislation will also need to be enforced and institutional reforms — at times painful — need to follow to ensure the necessary structures. International frameworks, like progressive approximation to EU directives and accession to the UNECE Water Convention, offer elements for developing in-struments for water policy.
Even if investment in wastewater treatment is still insufficient, some measures are reported to address the discharges of un-treated or insufficiently treated wastewater, which is one of the most pressing problems. In Georgia, a national programme has been set up to rehabilitate the wastewater treatment infrastruc-ture, with planned completion of works by 2020. Pressures on water quality from municipal and industrial wastewater are ex-pected to decrease in Turkey as a result of the construction of wastewater treatment plants. For instance, preliminary work for wastewater collection and treatment plants for Artvin and Bay-burt cities have been prepared to reduce pollution in the Turk-ish part of the Chorokhi/Coruh Basin. The Urban Wastewater Treatment regulation adopted by Turkey in 2006 is providing the necessary basis to address the issue.
In Georgia, there is an environmental impact assessment pro-cess for large enterprises in sectors such as metallurgy, chemical industry, hydropower and heat generation plants. According to its strategy for 2009 and 2010, the Environmental Inspec-tion Service of Georgia is moving towards gradually adopting a zero tolerance approach towards violations. Strengthening of enforcement and inspection has already led to a reduction in violations of discharge regulations.
In addition to the above-mentioned urban wastewater regula-tion, in the recent years Turkey has adopted a series of other regulations in the framework of the Turkish Environmental Law addressing water pollution control regulation, hazard-ous waste control, soil pollution control, protection of waters against agricultural-based nitrate pollution and control of pol-lution caused by certain substances discharged into the aquatic environment. Regulations on environmental impact assessment and on solid waste control had already been adopted in the early 1990s.
No flood zone mapping has been systematically carried out since the Soviet era. In Azerbaijan, which suffers from flood-ing the most, the capacity to generate accurate and useful flood forecasts is hampered by a general lack of information, together with outdated technologies, equipment and approaches.
New environmental regulations (e.g., Lake Sevan law, Iranian legislation) and investments by operators are expected to reduce impacts on water resources from mining activities. Technologi-cal improvement of mining practices also reduces the related loading: for example, the Islamic Republic of Iran has gained experience in controlling pollution from copper mines by de-veloping closed-water circulation in the processes.
There is interest in encouraging the use of economic instru-ments, for example in Georgia.
The wAy AheAdEconomic development and population increases are likely to increase water use, both consumptive and non-consumptive. Georgia predicts that, compared with the situation in 2008, its withdrawal of water from the Kura will increase by ap-proximately 20% by 2015, with withdrawal from the Alazani/Ganyh sub-basin increasing by 10% and from the Iori/Ga-birri by 3%. Economic development is clearly the priority for countries in the region, but it should be ensured that neglect of the quality of water resources and of the environment in general does not compromise opportunities in the future.
Water scarcity experienced downstream (and seasonally/peri-odically elsewhere) calls for improving water management in general, increasing irrigation efficiency and the application of water saving measures, as well as the conjunctive use of wa-ter, including reuse of drainage and return waters. Controlling the use of pesticides and fertilizers and diffuse pollution from agricultural lands would not only reduce harmful effects on water quality in rivers, but also improve the reuse potential of the return waters.
While the needs for capacity-building and for strengthening water management institutions are considerable, there is also valuable experience and competence to share in the region. For example, the Islamic Republic of Iran has indicated will-ingness to share experience with regard to reducing copper mining pollution.
There is also the need to strengthen the knowledge base on the impacts of climate change, including through cooperation. Agreement about the models to be used and selection of a com-mon scenario or set of scenarios on which to base the modelling supports the development of a common understanding, build-ing ground for joint or coordinated adaptation strategies.
Coordination and finding synergies in the activities supported by different donors is crucial. Donors should also ensure that their interventions respond to the priority needs of Caucasian countries and that there is commitment to follow up on the funded activities at the national level, especially in monitoring and assessment, where sustained investment and continuity are necessary to monitor the effectiveness of interventions and to detect trends. At the same time, recipient countries have to take responsibility for the follow-up beyond individual pro-ject life.
Above all, increased political commitment to transboundary cooperation is needed to improve the institutional frame-work and the management of transboundary water resources. The technical cooperation established under various projects should evolve in a more long-term, sustainable framework for cooperation to be able to tackle the variety and complexity of challenges for water resources.

ChAPTeR 5 Central asia
66
InTRoduCTIonThe subregional assessment of transboundary waters in Central Asia covers transboundary rivers, lakes and groundwaters shared by two or more of the following countries: Afghanistan, China, the Islamic Republic of Iran, Kazakhstan, Kyrgyzstan, Mongolia, the Russian Federation, Tajikistan, Turkmenistan and Uzbeki-stan. The assessment of the individual transboundary surface and groundwaters in this subregion can be found in Chapters 1, 2, 3 and 4 of Section IV (drainage basins of the White Sea, Barents Sea and Kara Sea; of the Sea of Okhotsk and Sea of Japan; drainage basin of the Aral Sea and other transboundary waters in Central Asia; and drainage basin of the Caspian Sea). The assessment of transboundary waters in Central Asia also contains an assessment of a number of selected Ramsar Sites and other wetlands of trans-boundary importance with different transboundary settings: the Gomishan Lagoon, the Aydar-Arnasay Lakes system, the Tobol-Ishim Forest-steppe, the Xingkai Lake National Nature Reserve, Lake Khanka, the complex of Daurian Wetlands and the Ili Delta.
Water resources in Central Asia are predominantly of a trans-boundary nature. Most of the region’s surface water resources are generated in the mountains of the upstream countries Kyrgyzstan, Tajikistan and Afghanistan, eventually feeding Central Asia’s two major rivers, the Syr Darya and the Amu Darya, which flow though the downstream countries Kazakhstan, Turkmenistan and Uzbekistan, and are a part of the Aral Sea Basin.
Central Asia’s water resources are of critical importance to the re-gion’s economy, people and environment. Due to the arid regional climate, irrigation water is an indispensable input for agricultural production. An estimated 22 million people depend directly or indirectly on irrigated agriculture in Tajikistan, Turkmenistan and Uzbekistan. Water is also important for energy production: hy-dropower energy covers more than 90% of total electricity needs in Kyrgyzstan and Tajikistan and is also an export commodity.
The competing demands of agriculture in downstream countries and hydropower generation in upstream countries fuel serious political disputes in Central Asia, putting water at the heart of regional security and stability. The sensitivity of the topic is shown by the tendency for ministries of foreign affairs to be increasingly involved in transboundary water issues in Central Asian countries.
The population in the Aral Sea Basin has more than doubled from 1960 to 2008, to almost 60 million, increasing the pressure on water resources. In particular, population growth in some ur-ban centres of the Central Asian region has been rapid in the past 20 years. South-west Uzbekistan, the Fergana Valley, southern
Tajikistan (notably the Vakhsh Valley), and northern Afghanistan, for example, are densely populated zones in Central Asia. Since the break-up of the Soviet Union, national legal systems and gov-ernance structures in the Central Asian Republics have evolved to become quite different. Also the level of economic development of the different countries is highly diverse.
LegAL, PoLICy And InsTITuTIonAL fRAmewoRks foR TRAnsboundARy wATeR mAnAgemenTRegional cooperation to manage shared water resources, in particular for the two main rivers, Amu Darya and Syr Darya, became urgent after the Central Asian former Soviet republics became independent in 1991. The legal framework for this re-gional cooperation was put into place in the early 1990s, imme-diately after the break-up of the Soviet Union. It is increasingly considered that this legal framework, building on the Soviet-era allocation of water, has become largely outdated, resulting in generally poor implementation, and therefore requiring im-provement. During the past few years, the agreed arrangements on water allocation have not been fully implemented or it has proven impossible to agree on water allocation. A limitation is linked to the fact that the energy sector (hydropower, more pre-cisely) is not addressed by the existing regional organizations engaged in water management cooperation.
Finding sustainable long-term solutions for balancing different needs and uses of water resources, including irrigation, human consumption, the generation of electricity and the protection of fragile natural environments, has proved to be a difficult task. At present a holistic, rational and equitable approach to the use of transboundary water resources supported by all countries is lacking. This has resulted not only in tensions and suspicions over water allocation and energy generation, but also in social and economic problems, as well as environmental degradation.
Key principles of IWRM like the basin approach are not appro-priately reflected in the existing agreements, despite the effort to establish basin-level structures for the main basins, the Amu Dar-ya and Syr Darya. Cooperation largely focuses on water sharing and allocation according to Soviet practices, while cooperation on water quality or water-related ecosystems is almost non-existent.
The current legal framework for transboundary cooperation in-cludes both binding instruments and various semi-formal agree-

ChAPTeR 5 Central asia | 67
ments and documents. In addition to regional agreements which are general in nature, there are a number of bilateral and some trilateral agreements on specific issues or watercourses, most of them from the 1990s.1 One of the shortcomings of the existing legal framework is the insufficient links between the various legal instruments. Many of the agreements focus on water sharing and water allocation, but implementation is often poor — the agree-ment on the Chu and Talas Rivers between Kazakhstan and Kyr-gyzstan focusing on the joint financing and use of certain dams and canals being one of the few positive exceptions. Moreover, Afghanistan has not signed water management agreements with its neighbours downstream.
The basic agreement concerning transboundary waters in the region is the Agreement on Cooperation in Joint Manage-ment of Use and Protection of Water Resources of Interstate Sources signed in 1992 by Kazakhstan, Kyrgyzstan, Uzbekistan, Tajikistan and Turkmenistan. Under this agreement, countries confirmed the principles for water allocation as developed under the Soviet Union.
Based on the 1998 intergovernmental agreement signed by the countries sharing the Syr Darya, Protocols were signed annually (from 1999 to 2003) on the use of water and energy resources of the Naryn-Syr Darya cascade of reservoirs, depending on the dryness of the year. However implementation of the protocols was often weak. Since 2004, Uzbekistan has preferred to negoti-ate bilaterally with the countries of the Aral Sea Basin, including on the Syr Darya. With the support of the Asian Development Bank, a draft agreement on the Syr Darya was developed in 2005, but its finalization and adoption are still pending.
In some cases, the implementation of agreements signed by the Soviet Union has continued after the break-up; for example, Turk-menistan has continued implementing the agreements on the Tejen/Harirud with the Islamic Republic of Iran. Only fairly re-cently, in 1999, a new agreement was signed for the construction and management of the Dosti Dam on the Tejen/Harirud River.
The most recently signed bilateral agreements in the subregion are the ones concerning the rational use and protection of trans-boundary waters between the Russian Federation and China (2008), and the one on the protection of water quality of trans-boundary rivers between Kazakhstan and China (2011). Even though it is positive that attention is paid to water quality issues, it is not ideal that these issues are separated from other water management issues under a separate Kazakh-Chinese agreement.
The main institution at the regional level is the International Fund for Saving the Aral Sea (IFAS) led by the Presidents of the five Central Asian countries. The Executive Committee of the International Fund for Saving the Aral Sea (EC-IFAS; established 1993); the Inter-State Commission for Water Coordination (ICWC; established in 1992); and the Inter-State Commission for Sustainable Development (ICSD; established 1994); operate relatively independently of each other although they are all part of IFAS. The Amu Darya and Syr Darya Basin Water Organiza-tions (BWOs) were established as executive bodies of the ICWC, but their influence in terms of water management does not cover the upper part of the respective basins.
Kazakhstan, Uzbekistan and the Russian Federation are Parties to the UNECE Water Convention. Until the entry into force of the amendments to articles 25 and 26 to open the Convention to
countries outside the UNECE region, Afghanistan, China, the Islamic Republic of Iran and Mongolia cannot accede to the Con-vention.2 Kazakhstan, the Russian Federation and Turkmenistan have ratified the Framework Convention for the Protection of the Marine Environment of the Caspian Sea. In general, however, the countries do not have a common legal framework and show a dif-ferent understanding of the international water law, its principles and obligations.
The 2006 Framework Convention for the Protection of the En-vironment for Sustainable Development in Central Asia is an at-tempt to provide a legal basis for cooperation between Central Asian States on a broad range of environmental issues — among them sustainable use of water resources. The Convention has not been signed by all the Central Asian countries. Once the Conven-tion enters into force, a secretariat will be set up to support the implementation of the Convention, but it is not clear how it would interact with other regional organizations such as IFAS and ICWC.
Kazakhstan and the Russian Federation, China and the Russian Federation, Kazakhstan and China, as well as Mongolia and the Russian Federation, have established joint commissions on trans-boundary waters. The Commission of the Republic of Kazakh-stan and the Kyrgyz Republic on the Use of Water Management Facilities of Intergovernmental Status on the Rivers Chu and Ta-las (Chu-Talas Commission; established in 2006) is an example of a functioning joint body under a bilateral agreement. Accord-ing to this agreement, Kyrgyzstan has a right to compensation from Kazakhstan for a share of expenses incurred to ensure the safe and reliable exploitation of specified water management fa-cilities. Over the years, the cooperation in the framework of the Chu-Talas Commission has expanded; in 2009, it was extended to cover more facilities (the ratification by the countries is still pending). Such a model has been evoked as a means for down-stream countries to participate in managing dams and other hy-draulic facilities, the operation regime of which is commonly a source of tension.
With regard to the Ili and the Irtysh, it is a shortcoming that there is no permanent executive body of the Kazakh-Chinese or Kazakh-Russian Joint Commission.
During the past decade, national water legislation and organi-zation of water resources management have been reformed in many countries of the region and this development continues.3
For example, the 2003 Water Code of Kazakhstan introduced the principle of basin management and opened up the possibil-ity for the various governmental and non-governmental entities involved in water management or water use, such as water users’ associations or water-related NGOs, to be consulted before deci-sions are taken.
The Water Code of Kyrgyzstan of 2005 also establishes principles for an integrated approach to water resources management and includes basin management plans for the development, use and protection of water resources. A National Water Council with the task of coordinating activities on the water sector was established in 2006 in accordance with the Water Code, however it has not met yet. Moreover, the switch to a parliamentary form of govern-ment has led to a review of the earlier plans.
The principle of water basin management is also reflected in the legislation of Uzbekistan, where basin water administrations have been established since 2003.
1 Information on the existing agreements for transboundary water cooperation can be found in annex II.2 The status of ratification of selected international agreements relevant to transboundary water management is presented in annex III. 3 A brief description of the water resources management framework in each of the countries can be found in annex I.

68 | PART III
It is expected that as an outcome of the reform of the water sector in Tajikistan, water management will be transferred from admin-istrative units to river basin authorities, which should be created during 2011–2013. Afghanistan is also taking initial steps to-wards the basin approach, with the establishment of River Basin and Sub-Basin Agencies. The Water High Council of Afghani-stan and its secretariat is reviewing the Water Law and working on a transboundary water policy.
Despite the legal developments and policy reform, implementa-tion remains limited or has progressed slowly, affected by, e.g., lack of resources and weakness of institutions. Another major obstacle for an integrated approach to water resources manage-ment is the frequent lack of intersectoral coordination. The water management in some of the countries falls under the competence of one sectoral ministry, e.g., the ministry of agriculture in Ka-zakhstan, the ministry of agriculture and water management in Uzbekistan, focusing on water quantity issues in the interest of irrigation, or the ministry of energy, e.g., in the Islamic Republic of Iran. At the same time, effective structures and mechanisms for inter-agency cooperation do not exist.
A positive development is the setting up of basin councils to facilitate participation of all the concerned stakeholders. At the national level, advisory basin councils have been set up already in Kazakhstan and on the Talas in 2009 in Kyrgyzstan. Kyrgyzstan is expecting to complete the establishment of river basin manage-ment authorities and basin councils required by the Water Code in 2011. Establishment of an Inter-State Chu Talas Basin Coun-cil has been proposed and a concept for it developed. Mongolia established basin councils for the Eroo River in 2007 and for the Tuul River in 2010, with the support of a project for strengthen-ing IWRM in the country. However further efforts are needed in this area and, where established, councils need to be strengthened to function properly.
Water users’ associations have been established in many coun-tries of the region, in particular, in Kyrgyzstan, Tajikistan and Uzbekistan, with the responsibility for the maintenance and op-eration of irrigation networks, but also for water supply in rural communities. Afghanistan is also making preparations for their establishment. The emergence of the water user cooperatives il-lustrates a shift to a more decentralized operation of irrigation facilities, an important step in reforming the irrigation and agri-culture sectors.
In practice, in natural resources (including water) management, the local administrative units, like akims in Kazakhstan, may not be consistent in their approach and may lack resources for inspec-tion, etc.
The low attention to groundwater in overall water management is partly explained by the responsibility for aquifer resources and their identification lying with the agencies for geology and min-eral resources. It may also reflect a low awareness about the role played by groundwater resources, even though groundwater is locally very important in some areas. In Kazakhstan, positively, a comprehensive review of transboundary aquifers has been car-ried out.
Strengthening or even maintaining the capacity of personnel in water-related administration and services is a challenge, as many qualified experts seek to work in the private sector due to the low level of remuneration of public officers.
monIToRIng of TRAnsboundARy RIveRs, LAkes And gRoundwATeRsLimited monitoring and assessment data, data which is often not reliable and lack of data on uses and needs are common problems in Central Asian countries. The situation is particularly severe in Afghanistan.
Exchange of data is also very limited. The Central Asian Regional Water Information Base Project (CAREWIB) database, main-tained by the Scientific Information Centre of ICWC, is a recent effort to make information on water resources openly and readily accessible to all the countries in Central Asia, even if access to this information system is differentiated among users with differ-ent levels of accessibility of data. However, not all countries are comfortable with this information system being developed and centrally situated in another country.
Flow data up to 1990 is commonly quoted for rivers, indicating a lack of recent data or a difficulty to obtain information. After 1991, hydrological monitoring drastically decreased. For exam-ple, on the Chu and its tributaries, the number of hydrological monitoring stations has decreased by more than two thirds since the 1970s. Similarly, of some 100 hydrological monitoring sta-tions on Kyrgyz territory within the Syr Darya Basin in 1980, currently 28 are operational. A lack of material and equipment, and the not infrequently poor condition of the existing monitor-ing stations, also poses problems. Such reduction of flow moni-
toring complicates evaluating the impact of withdrawals and diversions, and the lack of continuity is also a constraint to as-sessing long-term change — i.e., climatic variability and change.
Nevertheless, the situation has been improved in, for example, Kazakhstan over the past seven years. This includes the establish-ment of new monitoring stations on the rivers shared by Kazakh-stan and China. In its national Water Resources Development Plan, Afghanistan gives a special priority to rehabilitation of its hydrometric network. Use of satellite remote sensing is to some degree a means of compensating for reduced in situ monitoring, but still requires ground truth observations for validation.
Bilateral and multilateral donors — among others, the World Bank and Switzerland — have supported monitoring and assess-
ChAPTeR 5 Central asia | 69
ment projects and data/information management, at regional and national levels. The challenge is how to sustain the monitor-ing beyond the life of the projects.
While in general data and information exchange needs improve-ment, more regularity, continuity, transparency and structure, there are some positive exceptions. For instance, there is regular joint water quality monitoring between the Russian Federation and China and the Russian Federation and Kazakhstan. Between the national hydrometeorological services of the Central Asian Republics data exchange (also partly on water quality) is work-ing, but a wider dissemination is needed. Where a bilateral com-mission functions, like the Joint Commission of Transboundary Waters between Mongolia and the Russian Federation, an appro-priate framework for data exchange exists: information on dis-charge, regime, quality monitoring results and flood and emer-gency situations is exchanged in the joint Mongolian-Russian Working Group. An important task of the Chu-Talas Commis-sion is to make improved water quantity measurements available to both Kyrgyzstan and Kazakhstan.
Water quality is monitored less than water quantity. The overall water quality is reported in the Russian Federation and Central Asian Republics using a water pollution index which is defined on the basis of the ratios of measured values and the maxi-mum allowable concentration of the water-quality parameters. Monitoring of suspended solids is limited, despite its relevance considering erosion problems and accumulation of sediment in reservoirs.
A lack of effective, sustainable groundwater monitoring pro-grammes in most countries in the region is an obstacle to the assessment of the quality and quantity of groundwater resources in the transboundary aquifers. Data on transboundary aquifers is not exchanged, and in many of the countries knowledge in this area is at a relatively low level.
Monitoring of glaciers and snow cover — the source of most of Central Asia’s rivers — is quite fragmented in the subregion as it is carried out by different organizations in different countries. The costly expeditions that have been important for glacier vol-ume estimations have been drastically reduced and attempts are made to fill gaps through other means such as remote sensing.
mAIn PRobLems, ImPACTs And sTATusThe major challenge in Central Asia is to agree on how to use the available water resources taking into account the interest of all countries and of the water-dependent ecosystems. The main issue is the conflict between water use for hydropower generation and for irrigation. While upstream countries like Kyrgyzstan and Tajikistan prioritize water use for energy pro-duction, therefore mainly in winter when it is most needed, the peak of water demand in the downstream countries for ir-rigation and agricultural production is in summer, during the height of the growing season.
The subregion’s critical dependence on water resources is illus-trated by the 2008-2009 crisis. A very dry year was followed by an extremely cold winter and energy needs in Tajikistan and Kyr-gyzstan could not be met due to low water levels in reservoirs leading to an energy and food crisis that caused terrible distress among the populations and the economies in the subregion. De-
graded energy infrastructure and shortcomings of energy regula-tion add to the problems.
Construction of a number of new dams, mainly for hydro-power but also to collect irrigation water, was initiated in the late 2000s. This includes Kambarata 2 on the Naryn; Sang-tuda 1 and 2 on the Vakhsh; Koksarai on the Syr Darya; and Kara-Burinsky on the Talas River. Afghanistan was obliged to suspend a number of construction projects for multiple-use res-ervoirs because of war and instability. Dam infrastructure helps to mitigate impacts of flooding, but also disrupts water flow, with consequences for other uses and ecosystems. The hydrau-lic system of the Argun River changed with the realization of major water transfer schemes in China.
Concerns over the safety of more than 100 large dams and other water control facilities, located mostly on transboundary rivers, have grown in recent years in the subregion. Ageing dams and their inadequate maintenance, coupled with population growth in flood plains downstream from the dams, have resulted in increased risks, as demonstrated by the failure of the Kyzyl-Agash Dam in Kazakhstan in 2010. The dam is privately owned and the failure was caused by lack of safety control measures, including from the side of State authorities. The accident un-derlined the importance of dam safety control, regardless the form of ownership. Another consequence of the ageing of water reservoirs is the increased volume of sediments, decreasing the operational volumes.
The agricultural sector is the biggest consumptive water user in the subregion, notably in the Aral Sea Basin. Agriculture repre-sents almost 99%4 of water withdrawal in the Chu Basin, 94% in the Bolshoy Uzen/Karaozen, 90% in the Atrek, 89% in the Syr Darya, 85% in the Ili and 73% in the Talas Basin, just to mention a few examples in addition to the heavily affected down-stream part of the Amu Darya.
The population in most of the countries is heavily dependent on agriculture, up to 80% in Afghanistan. This underlines the importance that water for agriculture currently has. There is a pressing need to improve water use efficiency. In Afghanistan, for example, where the aridity of the climate limits rain-fed ag-riculture, 90% of the irrigation systems are traditional, with an efficiency of the irrigation network of about 25%–30%. Lack of maintenance and damage is a common problem for the irrigation infrastructure in the subregion. Specific water use is high because of losses, evaporation and overwatering. Limited/local pressure from livestock also occurs, for example, in the Ili, Naryn and Chu Basins.
Leaking networks and irrigation canals, adding to recharge, may cause rising of the groundwater level and affect its quality nega-tively. As a result of water-logging, arable land is being lost or its quality degraded, limiting its uses. Irrigation return waters affect groundwater quality negatively, for example in the Tejen/Harirud Basin. Substantial stretches of irrigated area require draining, but the nutrients and agrochemicals that the waters from collectors carry degrade the environment where released. Notably in the Amu Darya, irrigation return waters affect the quality negatively with salinity and major ion concentrations increasing down-stream. In areas with high evaporation, evaporation from shallow groundwater and surface water contribute to salinization of soil and groundwater. Land salinization from mineralized drainage water leads to increased water use as the salts in the fields need to be washed out before the growing season.
4 Situation in 2006.

70 | PART III
Water deficit downstream in the major rivers, the Amu Darya and Syr Darya, is pressing, resulting from the combined effect of extensively developed irrigation, ineffective management and changes in water regime. Among the reasons for reduction of flows is the extensive, largely outdated and inefficient irrigation infrastructure, the maintenance and replacement of which is a big financial challenge for the countries. Little flow in the Syr Darya reaches the delta because of all the withdrawals. Also, in smaller basins like the Malyi Uzen/Saryozen, scarcity is experi-enced. The increased mineralization with reduced flow limits the use of the water. In addition to nutrient and pesticide pollution of irrigation return waters, anthropogenic pressures on water quality include discharges of untreated or insufficiently treated wastewater.
The Aral Sea catastrophe is the clearest example of the negative impacts on human health and ecosystems of overabstraction, land degradation and desertification. Since 1960, the Aral Sea Basin lost 80% of its volume, the surface area was reduced by more than two thirds, the water level dropped by 22 m, and wa-ter salinity increased 6 to 12 times. The rivers that feed it have been intensively used for irrigation. This has created tremendous ecological problems both for the lake and for the surrounding area. The lake is badly polluted, largely as a result of fertilizer run-off and industrial pollution. The ecosystem of the Aral Sea has been nearly destroyed: fish disappeared from the lake, and a significant number of waterfowl and water-related birds moved to other regions. Moreover, the receding lake has left huge plains covered with salt and toxic chemicals, which are picked up and carried away by the wind as toxic dust and thereby spread to the surrounding area. As a result, the land around the Aral Sea has become heavily polluted, and people living in the area are suffering from a lack of freshwater, as well as from a number of health problems, such as certain forms of cancer and lung disease. These processes result in the deteriorating drinking water quality and health of the population, in decreasing land productivity and crop yields, and in the growth of poverty, unemployment and migration. However in recent years there have been some positive developments. To increase the volume of water in the northern part of the sea, the Kok-Aral Dam has been built by Kazakhstan to capture the flow from the Syr Darya. As a consequence, the surface of the North Aral Sea has increased and the water level raised from 30 to 42 meters. An important effect is the revival
of fisheries. Efforts have also been made in the Amu Darya delta in Uzbekistan to establish waterbodies and artificially regulated lakes. Considerable social efforts are also made by the respective countries to alleviate the situation for the population suffering from the drying out of the Aral Sea.
In the Ili Delta, water-dependent ecosystems are also negatively affected by flow regulation and diversion. This site is under pres-sure from pollution and desertification too. It is crucial to estab-lish adequate protection of this area so as to maintain its ecologi-cal balance and biodiversity, and avoid another catastrophe like the Aral Sea.
The region is highly vulnerable to extreme hydrological events such as floods and droughts. Afghanistan is particularly vulner-able to flooding because it lacks flood protection infrastructure; elsewhere, such infrastructure is in need of rehabilitation. In the mountainous part of the subregion, for example in Kyrgyzstan, sudden flooding is occasionally caused by overflow of glacier lakes. Release of water from reservoirs in winter for hydropower generation may cause winter flooding in downstream countries. On the Syr Darya this is less of an issue now that Kazakhstan has developed reservoir capacity downstream. The Ussuri and the Sujfun, for instance, are heavily affected by flooding. In some basins, an additional concern related to flooding is the surface pollution it mobilizes.
In the mountainous upstream part of the major rivers, soil sta-bility problems such as landslides and mudflows are reported in several basins, among them the Naryn and Kara Darya. Prob-lems related to erosion are not limited to the arid and semi-arid parts of the subregion, but are an issue even in basins such as the Irtysh, Malyi Uzen/Saryozen and the Tumen/Tumannaya. High sediment loads due to erosion add to the silting of reservoirs. In the Chirchik, as well as Atrek and the tributary Sombar, sediment loads are a problem. Diverse factors related to land management can aggravate erosion problems, including, for example, expan-sion of settlements (Surkhan Darya), deforestation (Naryn, Amu Darya) and overgrazing (Selenga).
Groundwater level decrease has been observed, for example, in the Pre-Irtysh (transboundary between Kazakhstan and the Rus-sian Federation) and Pre-Tashkent aquifers (transboundary be-tween Kazakhstan and Uzbekistan) as a result of heavy abstrac-tion. Rising groundwater tables pose problems locally, e.g., in the Chu Basin.
Towards the north, the importance of industry as a water user in-creases, and so do pressures related to it. In the basins of the Ural and of the Irtysh/Ertis, withdrawals for industry are significant. Discharges of industrial wastewater are seen as a pressure factor in the Syr Darya, Naryn, Ural, Selenga, Atrek/Atrak, Irtysh/Ertis, Tobol, Ishim/Esil and Tumen, among others. The upper Argun is highly polluted from industry. The Amur has been seriously affected by industrial accidents on the Sungari tributary.
Discharges of untreated or insufficiently treated municipal waste-waters are a pressure factor in a number of basins: the Atrek, Bolshoy Uzen/Karaozen and Malyi Uzen/Saryozen, Chatkal, Chu, Ili, Ishim, Kafirnigan, Naryn, Surkhan Darya, Talas, Tu-men and Ural. Wastewater collection is often lacking, or where facilities exist the treatment is often limited to mechanical treat-ment or hampered by technical problems or their degraded state, or by the insufficient capacity of the network.
A number of ecological problems are inherited from the past and are legacies from industrial and radioactive pollution. Un-monitored storage or dumping of pesticides and other hazard-

ChAPTeR 5 Central asia | 71
ous chemicals is a problem in specific locations, for example, in the Vakhsh sub-basin. Remnants of mining activities include extensive uranium tailings areas in the Naryn and Kara Darya sub-basins of the Syr Darya. Their gradual degradation releases hazardous substances to the environment and accidental failures of tailings or flooding could have severe impacts. Mining also af-fects water quality in the basins of the Chu, Irtysh/Ertis, Selenga, Tobol, Tumen/Tumannaya and Vakhsh. Mining adds to erosion of slopes and triggering of landslides locally, which through sedi-ment transport affect water quality downstream. In the Ural and Ob basins, oil or gas exploration are potential pressure factors.
Sectoral and economic interests dominate over environmental concerns. In a subregion where poverty is widespread, countries give priority to economic development with serious threats for sustainability.
CLImATe ChAnge And ITs ImPACTs on wATeR ResouRCesIn Central Asia, the contribution of snow and ice melt to the formation of renewable water resources is decisive. The glaciers have a stabilizing effect on the stream-flow and add to the wa-ter flow during the important irrigation season after the melting of snow. The mean snow-water equivalent in the Northern and Western Tien Shan has remained relatively stable over the past few decades, but several studies have concluded that the glacial systems of the Central Asian mountains are decreasing in size and volume. A compensating mechanism such as meltwater con-tribution from thawing underground ice in areas of perennial
permafrost area may delay the impact on the observed run-off. The reliability of assessments of climate variability and related changes in water flow is affected by degradation of monitoring in the past 20 years and complicated by the human-induced chang-es in land use and in the river systems.5
Observations of climate change over many decades in Uzbekistan include a statistically significant increase in air temperature. The number of days of high air temperature (>40 °C) has increased from the 1950s to 2000s. The number of days with low tempera-tures (below either -15 °C or -20 °C) has decreased, for example, in Tashkent since the late 1870s. In Tashkent, variability of pre-cipitation has increased from the 1880s to the early 2000s, as has the number of days with heavy precipitation (>15 mm/day). A tendency towards decreasing snow cover has been observed, and glaciers continue to shrink at rates ranging from 0.2%–1% by area. According to scenario A2,6 no significant changes in water resources of the Amu Darya or Syr Darya by 2030 are predicted. By 2050, the reduction of water resources by 10%–15% in the basin of the Amu Darya and by 2%–5% in the basin of the Syr Darya is considered possible. In general, the zone where the total precipitation is less than 100 mm (arid) is predicted to decrease and zones with precipitation ranging from 100 to 200 mm/year (arid, 200 mm/year is low precipitation limit of semi-arid) will increase. According to scenario B2,7 an increase of 5%–15% in precipitation in Uzbekistan compared with the 1961–1990 ref-erence period is assessed as a possibility by 2030 and 2050. Due to the high level of zoning in the processes of formation of pre-cipitation, this can result in a decrease or even an increase in flow compared with the current situation in the shared rivers. Beyond 2030, the predicted increase in air temperature is expected to lead to reduced river flows.
5 Source: Severskiy, I. Current and projected changes of glaciation in Central Asia and their probable impact on water resources. In: Braun, L. N., Hagg, W., Severskiy, I., Young, G. (eds) Assessment of Snow, Glacier and Water Resources in Asia: Selected papers from the Workshop in Almaty, Kazakhstan, UNESCO-IHP and the German IHP/HWRP National Committee. 2006.
6 This refers to the scenarios described in the Intergovernmental Panel on Climate Change (IPCC) Special Report on Emissions Scenarios (SRES) (IPCC, Nakicenovic, N. and Swart, R., (eds.), Cambridge University Press, United Kingdom, 2000). The SRES scenarios are grouped into four scenario families (A1, A2, B1 and B2) that explore alternative development pathways, covering a wide range of demographic, economic and technological driving forces and resulting greenhouse gas emissions. Scenario A2 describes a very heterogeneous world with high population growth, slow economic development and slow technological change.
7 For explanation, please see the previous footnote. Scenario B2 describes a world with intermediate population and economic growth, emphasizing local solutions to economic, social, and environmental sustainability.

72 | PART III
Uzbekistan assesses the Amu Darya and small rivers of the region to be most vulnerable to climate change. The predicted increased aridity and evapotranspiration in the region are expected to be re-flected in increased irrigation requirements in the region. Among the implications of predicted changes is aggravated desertification. Frequency of drought events in the Pre-Aral area (around the for-mer Aral Sea) is predicted to increase with warming of the climate.
Options for adaptation to climate change identified in Uzbeki-stan include reconstruction of irrigation systems and introduc-tion of drought-resistant crops. Socio-economic scenarios, plans for long-term development of the agriculture sector and the development of a methodological basis for assessment of water losses, as well as the study of possible approaches to their reduc-tion, are needed.
Tajikistan is a pilot country in a World Bank project to study the impact of climate change on glaciers and the development of adaptation measures. During the past 60 years the air tempera-ture on average increased by 1 °C. By 2030, a further increase of 1.5 °C is predicted. Glaciers in Tajikistan are decreasing both in surface area and volume. The volume of glaciers is predicted to decrease by 30% in the coming 50 years. At the same time, the flow in large snow- or glacier-fed rivers is predicted to increase for 5 to 7 years and then to gradually decrease by 5%–15% over the next 30 years. The frequency of years with extremely low or high flows is expected to increase. By 2030, Tajikistan predicts the flow of the Amu Darya to decrease by 21%–40% and of the Syr Darya by 15%–28%.
Adaptation measures envisaged in Tajikistan include renovation and modernization of water infrastructure to reduce water losses, improvement of productivity in water use through, e.g., better irrigation technology; construction of reservoirs in the moun-tains to compensate for the diminishing glaciers; increase in the level of regulation of national and transboundary rivers; use of brackish groundwaters and desalinization; a switch to less water-demanding crops in agriculture; application of economic tools in water management; and improvement of water management effectiveness through introduction of an IWRM approach.
In Kyrgyzstan, a slight increase in run-off due to an increase in the proportion of glacial run-off is predicted by 2025–2030. In the subsequent years, run-off is expected to decrease. At the same time, the number of glacial lakes is predicted to increase, which may increase the risk of flooding events.
Vulnerability assessments for the glaciers and the amount of surface run-off in major hydrological basins have been carried out in Kyrgyzstan using digital elevation models and moisture conditions of Kyrgyzstan’s land area developed at the Institute of Water Problems and Hydropower of the National Academy of Sciences of Kyrgyzstan. The more systematically collected data on the glaciers in Kyrgyzstan is from the 1960s. With preparation of a national climate change adaptation strategy and its adoption by the Government, Kyrgyzstan expects to gradually take related measures in the coming years.
In Kazakhstan, the following are considered as priorities with regard to climate change adaptation: development of low-water technologies adapted to more arid conditions; increase in the proportion of groundwater use; inter-basin transfer; and integra-tion of water management issues in the instruments related to other sectors, such as agriculture, energy and industry.
Adaptation measures in the Russian Federation include flood pro-tection; regulation of run-off and redistribution of water resources; improvement of water management, including water-saving tech-
nologies; and introduction of insurance against natural disasters.
Strategies of the Islamic Republic of Iran to adapt to climate change include the following: development of agriculture and aquaculture activities based on brackish water use and increas-ing water use efficiency; development and implementation of national response strategies using innovative technology and en-gineering solutions for installation of flood warning and drought monitoring systems; construction of water resources facilities such as dams, aqueducts, well fields, levees, banks and drainage channels; non-structural measures including water conservation, integrated ground and surface water management and improved water supply; improved operation of reservoirs, water saving pol-icy and water recycling and reuse.
The problems associated with climate change are generally rec-ognized in the subregion, but the scientific basis is still weak and, due to this, the basis for adaptation measures in the water sector is poor. For example, future irrigation requirements remain to be assessed. In some countries, efforts have been made to assess the likely impact climate change will have on water resources in the major river basins. However, the limited results show a significant spread in predictions.
ResPonsesPlans for development, use and protection of water resources have been developed in Kyrgyzstan for some basins, includ-ing the Talas, and are expected to be adopted by the National Council on Water. In the implementation of the national water resources development plan, which has started in Afghanistan, priority is given to projects that reduce the likelihood of damage by drought and floods, create job opportunities, increase irriga-tion and power supply and provide access to safe drinking water.
There has been some cooperation in the development of hy-draulic infrastructure on transboundary rivers of the subregion. For example, in 2004 the Islamic Republic of Iran and Turk-menistan completed the construction of the Dosti Dam on the Tejen/Harirud. On the Chu and Talas Rivers, Kazakhstan and Kyrgyzstan cooperate on the operation and maintenance of flow regulation infrastructure. Turkmenistan and Uzbekistan cooper-ate in jointly operating the Tyuyamuyunsk Dam.
Several countries have been increasing their investments to en-hance irrigation systems, improve and rehabilitate the aged infra-structure. Moreover water saving technologies have been intro-duced, such as drip irrigation. However, a shortage of financial resources for renovation and maintenance persists and more ef-fort is needed to improve efficiency by reducing water losses.
Some change of crops has occurred in the past decades, with crop diversification, including replacing water consumptive crops such as cotton and rice with cereals, and thereby reducing water requirements.
Work has also been done to reduce risks of dam failures. Kyrgyz authorities have agreed to develop cooperation to jointly review and assess the safety of the Kirov Dam on the Talas in response to Kazakhstan’s concerns. Kyrgyzstan has gradually increased Gov-ernment funding, been involved in borrowing funds for reha-bilitation work on structures such as the Kirov, Orto-Tokoi and Papan Dams and on the Big Chu Canals. However, in general legislation and procedures for assessing, monitoring and com-municating about dam safety need improvement.

ChAPTeR 5 Central asia | 73
The Aral Sea Basin Programme-3 has been prepared. It seeks to improve the socio-economic and environmental situation by ap-plying the principles of IWRM to develop a mutually accept-able mechanism for a multipurpose use of water resources and to protect the environment in Central Asia, taking into account the interests of all the States in the region. Donor funding is sought for the projects identified for this Programme, prepared under the leadership of the Executive Committee of IFAS at the request of the Heads of the Central Asian States.
Countries report reduced pressure from wastewater discharges in a few basins, the Irtysh among them, where both the total sewage discharge and the untreated part have decreased. In the area of the basins of the Malyi Uzen/Saryozen and the Bolshoy Uzen/Karaozen in Saratov oblast in the Russian Federation a number of wastewater treatment plants have been constructed. Measures have also been taken elsewhere. In the Islamic Republic of Iran, wastewater treatment plants have been constructed in Mashhad (Tejen/Harirud Basin), but use of treated wastewater in agricul-ture is also foreseen.
Mongolia is limiting mining companies’ activities in the proximity of water bodies through the enforcement of a law adopted in 2009.
The wAy AheAdNoting the number of problems that Central Asia faces, the region has to work out its priorities within the limits of its re-sources, taking into account the limitations fixed by the history of environmental degradation and infrastructural set-up, and to orient water management accordingly.
A sustainable solution for cooperation on transboundary waters requires a careful balance between water use for irrigation, hu-man consumption, the generation of electricity and the protec-tion of fragile natural environments. It is important to note that water gains for one sector do not necessarily take away water from
another. For instance, it can be a question of using the reservoir infrastructure to optimally time the releases so that different sec-tors benefit simultaneously, or for different reservoirs in a cascade to have complementary operating modes. Regional cooperation on water should be complemented by cooperation in other eco-nomic sectors, and sustainable benefit-sharing arrangements may be developed that are not limited to water.
The willingness of all the riparian countries to cooperate, estab-lish an open dialogue and compromise to find a consensus be-tween their positions is necessary for agreement. There is concern that without the will to cooperate, knowledge of technical issues will not help. Cooperation on water can pave the way to coopera-tion in other fields like transport, trade, transit and energy.
Basin management institutions need to be enhanced and transboundary cooperation based on international legal in-struments strengthened. The region needs a common overarch-ing legal framework to serve as “rules of the game” for developing agreements and effective institutional arrangements for the man-agement and protection of shared waters. The Water Convention can play such a role and provide a fair, sound and sustainable framework for cooperation on shared water resources. It is posi-tive that Kazakhstan and Uzbekistan are Parties to the Conven-tion, that Turkmenistan is committed to acceding to it and that understanding of the Convention is growing also in the countries which are not Parties to it. It is important that the amendments to articles 25 and 26 of the Water Convention enter into force, opening it to countries outside the UNECE region, so that the region can have a common legal basis for cooperation including also non-UNECE countries such as Afghanistan, China, the Is-lamic Republic of Iran and Mongolia.
The present regional institutional mechanism, based on the in-ternational Fund for Saving the Aral Sea (IFAS), is in need of stronger efficiency, coordination and collaboration between its organizations. The recognition by the Heads of Central Asian Governments in April 2009 of the need to improve institutional

74 | PART III
and legal frameworks for regional cooperation under the um-brella of IFAS initiated an important process to strengthen the legal frameworks and build the institutional capacity of regional organizations.
Afghanistan is presently not represented in regional institutions related to water management. As Afghanistan’s need for water is increasing — with development of agriculture and irrigation among its national priorities — its participation in regional co-operation efforts would be beneficial.
Sustainability of structures of cooperation is a challenge, and reduction of their dependency on external funding should be aimed at. There is need for assistance but, in the long term, sustaining the water management institutions and the neces-sary information collection for decision-making will require the countries of the region to take responsibility. International organizations can facilitate transboundary cooperation, and coordination among them to avoid duplication is important.
There is a need for transparency and consultations among co-riparian countries concerning future development plans with implications for transboundary water resources, so that costs and benefits of various development plans can be analysed. Joint environmental impact assessments of planned trans-boundary projects should be carried out. This is particularly relevant considering further flow regulation. In addition, de-veloping small-scale hydropower, which many of the countries have the potential for, could be in some cases an option for energy provision which is less disruptive to the environment by not impounding the water flow.
Water allocation and water sharing are transboundary prob-lems, but efforts also need to be made nationally in, for exam-ple, reducing water use and increasing water efficiency. The water deficit experienced, especially downstream, is to a large degree a result of shortcomings in management of water and inefficient water use rather than physical scarcity. There have been increases in water use due to different reasons which in-clude demographic increase, expanded irrigation, losses and low water efficiency. Improving water use efficiency and intro-ducing water saving technology is necessary to ease the pres-sure and relieve scarcity. Moreover, the focus on national food sufficiency results in unnecessary production of certain crops using irrigation; food imports could help to decrease the pres-sure on water resources.
Efforts to address water quality issues are also needed together with a coherent regional strategy for water quality. Countries need to identify and apply best practices in the management of water resources and ecosystems. Moreover, with the reduc-tion of flows seriously affecting water quality, it is important to take measures to prevent anthropogenic water pollution.
With the current prioritization of economic development, it is a serious concern that water-dependent ecosystems get little attention. On the positive side, the Concept of the Devel-opment of the Water Sector and Water Management Policy until 2010 and the sectoral Programme on Drinking Water that were approved in Kazakhstan in 2002 encourage an eco-system approach to water management. Furthermore, Mon-golia would like to have special protected areas expanded in a transboundary direction. The operational rules for the joint management of some reservoirs — the Segrejevsk and Petropavlovsk reservoirs on the Ishim shared by the Russian Federation and Kazakhstan — specify a minimum flow at the border section. Signing an agreement on environmental flow and enhancement of the network of protected areas has been suggested for the Argun/Hailaer, which is subject to various development pressures.
Groundwater plays a potentially important role in sustaining ecosystems and limiting land degradation, at the same time wetlands can have an important groundwater recharge func-tion. Studies of groundwater resources need to be continued to address the current low level of knowledge.
Means of sound land management, like limiting deforestation and moving away from unsustainable agricultural and grazing practices, have potential for limiting erosion problems.
Only assessing reliably the quality and quantity status of wa-ter provides the necessary basis for management interventions to limit human impact, including economizing water use, and for decisions about water allocation. This requires taking monitoring of water resources seriously — investing in it and improving dissemination of the data where it is needed to sup-port management. More regular and systematic data exchange and harmonization of approaches is needed. Restoration and development of a monitoring network for water resources is called for, as well as monitoring of the status of glaciers, which will give indications about how water availability will develop. A complete inventory of glaciers of the Pamir-Alaya and Tien Shan with the help of high-resolution remotely sensed data and the development of regional mathematic models of snow cover formation in the mountains and of the glacial flow are all proposed to be carried out.
Not all the countries in the region give priority to climate change-related concerns, despite their awareness that it needs to be taken into account when making plans for water use and management. There is a need for training in this area and for a methodological basis for addressing the issue. In par-ticular, there is a need for studying probable impacts and for applying results to adapt river basin management. The predic-tions about the gravity of impacts of climate change — albeit known to be uncertain — vary substantially. Thus, regional cooperation on climate change and variability studies would be beneficial for all countries. Regional strategies for adapting to climate change, and to promote rational and economical use of water and conservation of water bodies are needed.
PART IV ASSESSMENT of TRANSBoUNDARY RIVERS, LAKES AND GRoUNDWATERS
75

77
77
99
107
253
131
299
165
347
ChAPTeR 1: Drainage basins of the White sea, barents sea anD Kara sea
ChAPTeR 2: Drainage basins of the sea of oKhotsK anD sea of JaPan
ChAPTeR 3: Drainage basin of the araL sea anD other transboUnDarY Waters in CentraL asia
ChAPTeR 4: Drainage basin of the CasPian sea
ChAPTeR 5: Drainage basin of the bLaCK sea
ChAPTeR 6: Drainage basin of the MeDiterranean sea
ChAPTeR 7: Drainage basins of the north sea anD eastern atLantiC
ChAPTeR 8: Drainage basin of the baLtiC sea
76 | PART IV
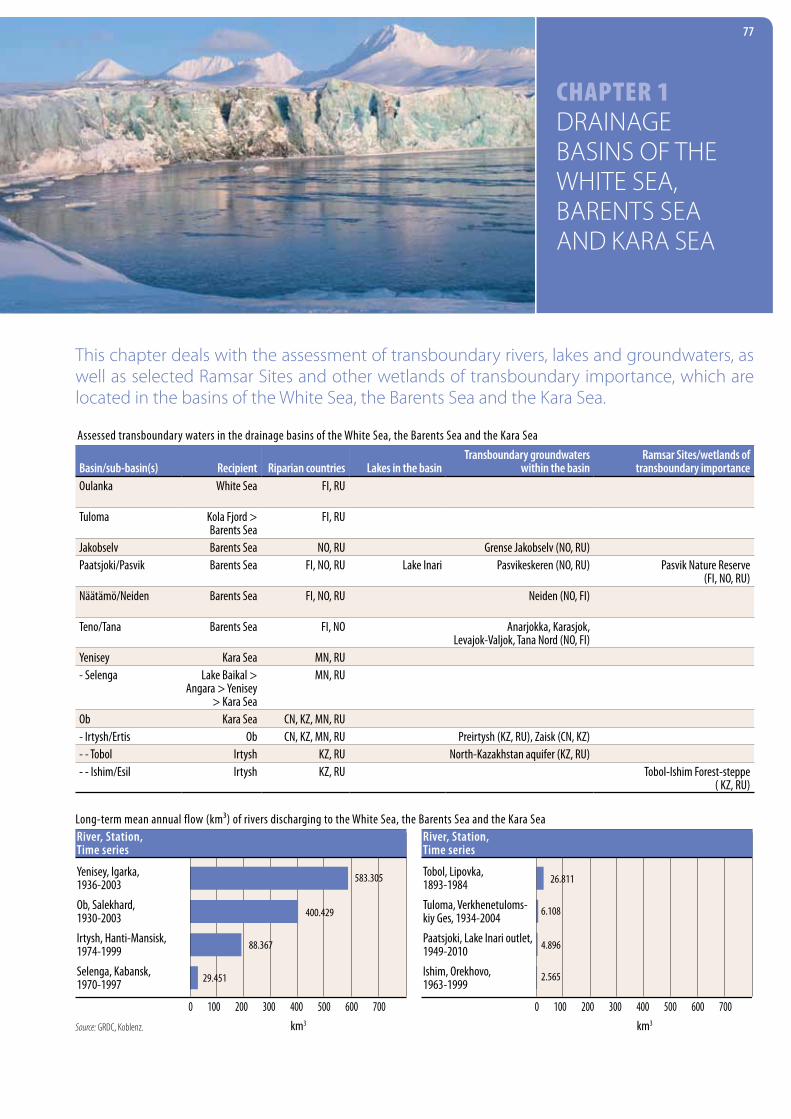
Chapter 1 Drainage basins of the White sea, barents sea anD Kara sea
77
this chapter deals with the assessment of transboundary rivers, lakes and groundwaters, as well as selected ramsar sites and other wetlands of transboundary importance, which are located in the basins of the White sea, the barents sea and the Kara sea.
Assessed transboundary waters in the drainage basins of the White Sea, the Barents Sea and the Kara Sea
Basin/sub-basin(s) Recipient Riparian countries Lakes in the basinTransboundary groundwaters
within the basin Ramsar Sites/wetlands of
transboundary importanceOulanka White Sea FI, RU
Tuloma Kola Fjord > Barents Sea
FI, RU
Jakobselv Barents Sea NO, RU Grense Jakobselv (NO, RU)Paatsjoki/Pasvik Barents Sea FI, NO, RU Lake Inari Pasvikeskeren (NO, RU) Pasvik Nature Reserve
(FI, NO, RU)Näätämö/Neiden Barents Sea FI, NO, RU Neiden (NO, FI)
Teno/Tana Barents Sea FI, NO Anarjokka, Karasjok, Levajok-Valjok, Tana Nord (NO, FI)
Yenisey Kara Sea MN, RU- Selenga Lake Baikal >
Angara > Yenisey > Kara Sea
MN, RU
Ob Kara Sea CN, KZ, MN, RU- Irtysh/Ertis Ob CN, KZ, MN, RU Preirtysh (KZ, RU), Zaisk (CN, KZ)- - Tobol Irtysh KZ, RU North-Kazakhstan aquifer (KZ, RU)- - Ishim/Esil Irtysh KZ, RU Tobol-Ishim Forest-steppe
( KZ, RU)
Yenisey, Igarka, 1936-2003
Ob, Salekhard, 1930-2003
Irtysh, Hanti-Mansisk, 1974-1999
Selenga, Kabansk, 1970-1997
0 100 200 300 400 500 600 700
km3
River, Station,Time series
583.305
400.429
88.367
29.451
Tobol, Lipovka, 1893-1984
Tuloma, Verkhenetuloms-kiy Ges, 1934-2004
Paatsjoki, Lake Inari outlet, 1949-2010
Ishim, Orekhovo, 1963-1999
0 100 200 300 400 500 600 700
km3
River, Station,Time series
26.811
6.108
4.896
2.565
Long-term mean annual flow (km³) of rivers discharging to the White Sea, the Barents Sea and the Kara Sea
Source: GRDC, Koblenz.
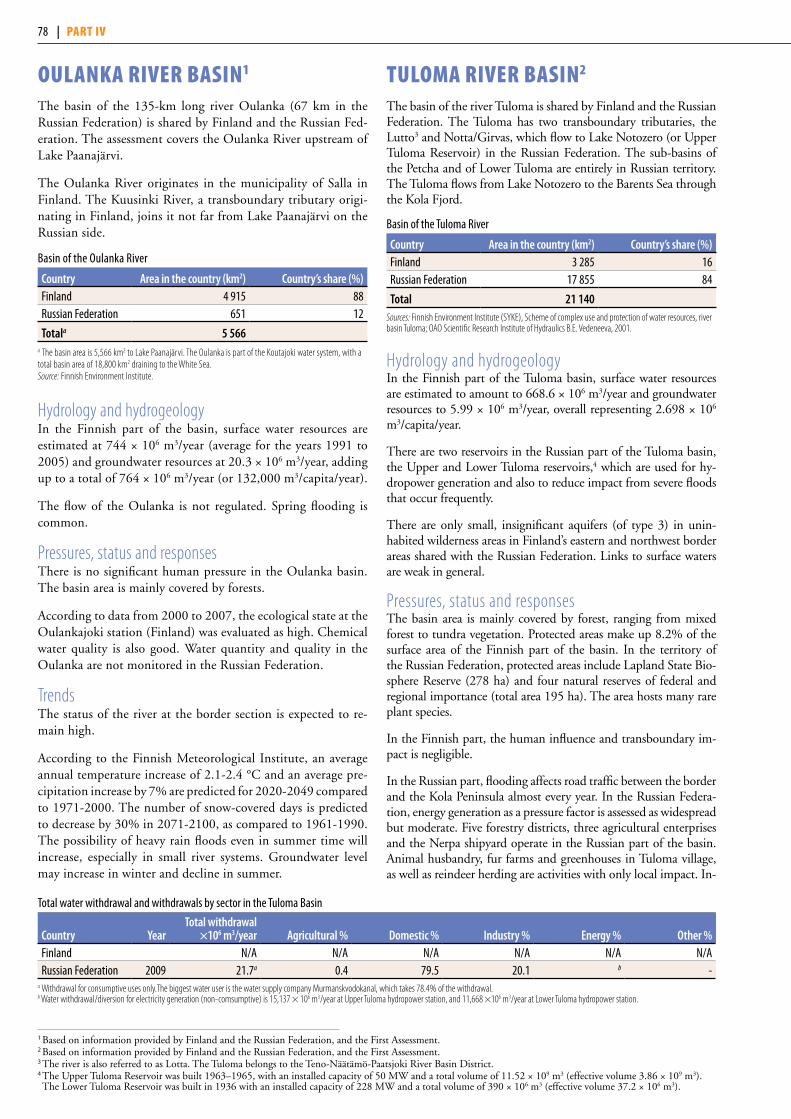
Oulanka river Basin1
The basin of the 135-km long river Oulanka (67 km in the Russian Federation) is shared by Finland and the Russian Fed-eration. The assessment covers the Oulanka River upstream of Lake Paanajärvi.
The Oulanka River originates in the municipality of Salla in Finland. The Kuusinki River, a transboundary tributary origi-nating in Finland, joins it not far from Lake Paanajärvi on the Russian side.
Basin of the Oulanka River
Country Area in the country (km2) Country’s share (%)Finland 4 915 88Russian Federation 651 12
Totala 5 566a The basin area is 5,566 km2 to Lake Paanajärvi. The Oulanka is part of the Koutajoki water system, with a total basin area of 18,800 km2 draining to the White Sea.Source: Finnish Environment Institute.
Hydrology and hydrogeologyIn the Finnish part of the basin, surface water resources are estimated at 744 × 106 m3/year (average for the years 1991 to 2005) and groundwater resources at 20.3 × 10⁶ m3/year, adding up to a total of 764 × 106 m3/year (or 132,000 m3/capita/year).
The flow of the Oulanka is not regulated. Spring flooding is common.
Pressures, status and responsesThere is no significant human pressure in the Oulanka basin. The basin area is mainly covered by forests.
According to data from 2000 to 2007, the ecological state at the Oulankajoki station (Finland) was evaluated as high. Chemical water quality is also good. Water quantity and quality in the Oulanka are not monitored in the Russian Federation.
TrendsThe status of the river at the border section is expected to re-main high.
According to the Finnish Meteorological Institute, an average annual temperature increase of 2.1-2.4 °C and an average pre-cipitation increase by 7% are predicted for 2020-2049 compared to 1971-2000. The number of snow-covered days is predicted to decrease by 30% in 2071-2100, as compared to 1961-1990. The possibility of heavy rain floods even in summer time will increase, especially in small river systems. Groundwater level may increase in winter and decline in summer.
tulOma river Basin2
The basin of the river Tuloma is shared by Finland and the Russian Federation. The Tuloma has two transboundary tributaries, the Lutto3 and Notta/Girvas, which flow to Lake Notozero (or Upper Tuloma Reservoir) in the Russian Federation. The sub-basins of the Petcha and of Lower Tuloma are entirely in Russian territory. The Tuloma flows from Lake Notozero to the Barents Sea through the Kola Fjord.
Basin of the Tuloma River
Country Area in the country (km2) Country’s share (%)Finland 3 285 16Russian Federation 17 855 84
Total 21 140Sources: Finnish Environment Institute (SYKE), Scheme of complex use and protection of water resources, river basin Tuloma; OAO Scientific Research Institute of Hydraulics B.E. Vedeneeva, 2001.
Hydrology and hydrogeologyIn the Finnish part of the Tuloma basin, surface water resources are estimated to amount to 668.6 × 10⁶ m3/year and groundwater resources to 5.99 × 10⁶ m3/year, overall representing 2.698 × 10⁶ m3/capita/year.
There are two reservoirs in the Russian part of the Tuloma basin, the Upper and Lower Tuloma reservoirs,4 which are used for hy-dropower generation and also to reduce impact from severe floods that occur frequently.
There are only small, insignificant aquifers (of type 3) in unin-habited wilderness areas in Finland’s eastern and northwest border areas shared with the Russian Federation. Links to surface waters are weak in general.
Pressures, status and responsesThe basin area is mainly covered by forest, ranging from mixed forest to tundra vegetation. Protected areas make up 8.2% of the surface area of the Finnish part of the basin. In the territory of the Russian Federation, protected areas include Lapland State Bio-sphere Reserve (278 ha) and four natural reserves of federal and regional importance (total area 195 ha). The area hosts many rare plant species.
In the Finnish part, the human influence and transboundary im-pact is negligible.
In the Russian part, flooding affects road traffic between the border and the Kola Peninsula almost every year. In the Russian Federa-tion, energy generation as a pressure factor is assessed as widespread but moderate. Five forestry districts, three agricultural enterprises and the Nerpa shipyard operate in the Russian part of the basin. Animal husbandry, fur farms and greenhouses in Tuloma village, as well as reindeer herding are activities with only local impact. In-
1 Based on information provided by Finland and the Russian Federation, and the First Assessment.2 Based on information provided by Finland and the Russian Federation, and the First Assessment. 3 The river is also referred to as Lotta. The Tuloma belongs to the Teno-Näätämö-Paatsjoki River Basin District. 4 The Upper Tuloma Reservoir was built 1963–1965, with an installed capacity of 50 MW and a total volume of 11.52 × 10⁹ m3 (effective volume 3.86 × 10⁹ m3). The Lower Tuloma Reservoir was built in 1936 with an installed capacity of 228 MW and a total volume of 390 × 106 m3 (effective volume 37.2 × 10⁶ m3).
Total water withdrawal and withdrawals by sector in the Tuloma Basin
Country YearTotal withdrawal
×106 m3/year Agricultural % Domestic % Industry % Energy % Other %Finland N/A N/A N/A N/A N/A N/ARussian Federation 2009 21.7a 0.4 79.5 20.1 b -
a Withdrawal for consumptive uses only.The biggest water user is the water supply company Murmanskvodokanal, which takes 78.4% of the withdrawal.b Water withdrawal/diversion for electricity generation (non-comsumptive) is 15,137 × 106 m3/year at Upper Tuloma hydropower station, and 11,668 ×106 m3/year at Lower Tuloma hydropower station.
78 | part iv
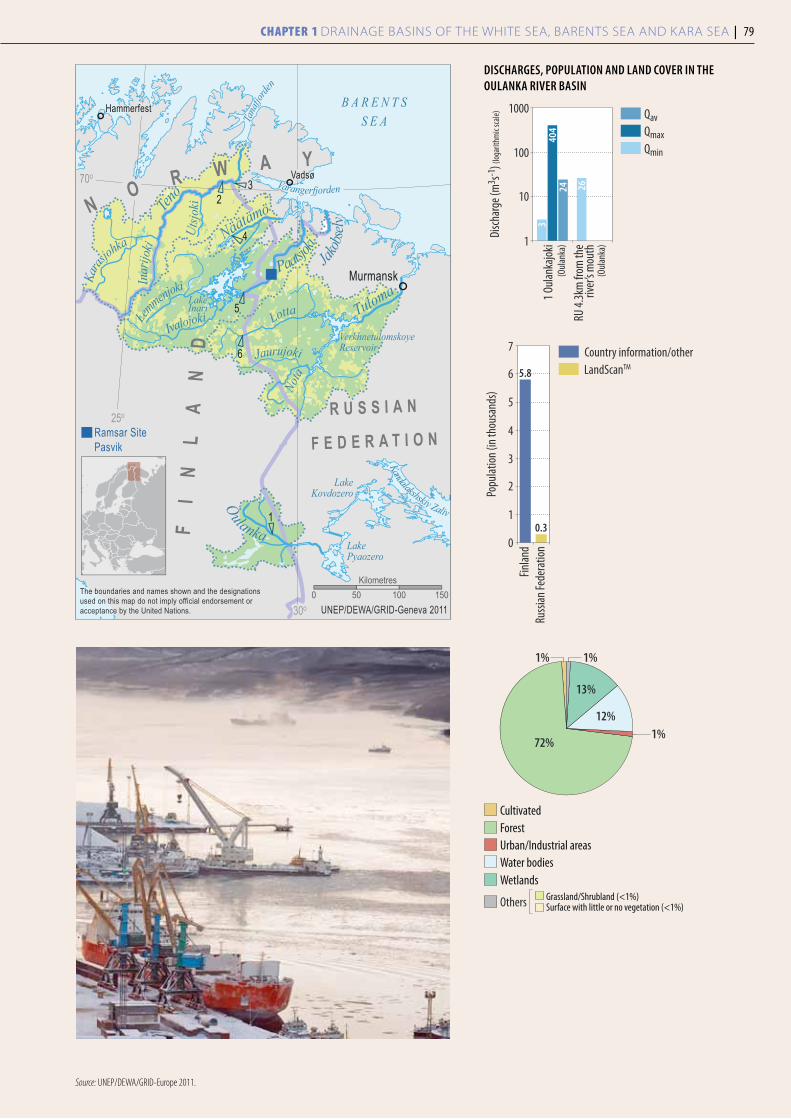
32
4
5
6
1
Murmansk
Vadsø
Hammerfest
Ramsar SitePasvik
Ten
o
Paatsjoki
LakeInari
VerkhnetulomskoyeReservoir
Tuloma
Näätämö
Jakob
selv
LakeKovdozero
LakePyaozero
B A R E N T SS E A
Varangerfjorden
Oulanka
Kandalakshskiy Zaliv
Lotta
Jaurujoki
Nota
Tana
fjorde
n
Inar
ijoki
Karas
johka
Utsjo
ki
IvalojokiLemmenjoki
FI
NL
AN
DN
O R W A Y
R U S S I A N
F E D E R A T I O N
70o
25o
30o
The boundaries and names shown and the designationsused on this map do not imply official endorsement oracceptance by the United Nations. UNEP/DEWA/GRID-Geneva 2011
0 50 100 150Kilometres
Source: UNEP/DEWA/GRID-Europe 2011.
DISChARgES, pOpuLATIOn AnD LAnD COvER In ThE OuLAnkA RIvER BASIn
RU 4.
3km
from
the
river
’s mou
th
1 Oul
anka
joki
Disc
harg
e (m
3 s-1) (
loga
rithm
ic sc
ale)
404
24(O
ulan
ka)
(Oul
anka
)1
10
100
1000
3
26
QavQmaxQmin
1%1%
1%72%
12%
13%
Grassland/Shrubland (<1%)Surface with little or no vegetation (<1%)
ForestUrban/Industrial areas
Others
Water bodiesWetlands
Cultivated
Popu
latio
n (in
thou
sand
s)
0
1
2
3
4
5
6
7
Russ
ian Fe
dera
tion
Finlan
d
5.8
0.3
Country information/otherLandScanTM
Chapter 1 Drainage basins of the White sea, barents sea anD Kara sea | 79
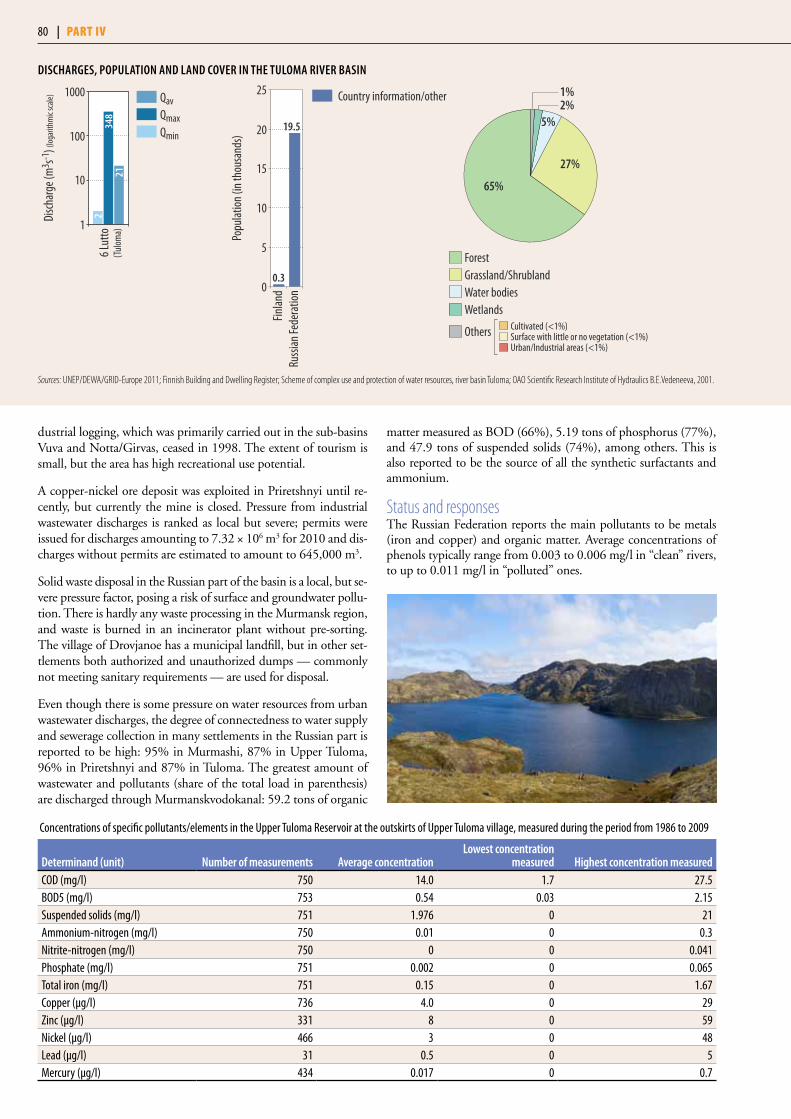
DISChARgES, pOpuLATIOn AnD LAnD COvER In ThE TuLOmA RIvER BASIn
6 Lut
to
Disc
harg
e (m
3 s-1) (
loga
rithm
ic sc
ale)
348
21(T
ulom
a)1
10
100
10002
QavQmaxQmin
1%2%
Cultivated (<1%)
Urban/Industrial areas (<1%)Surface with little or no vegetation (<1%)
65%
27%
5%
Grassland/ShrublandWater bodiesWetlands
Others
Forest
Sources: UNEP/DEWA/GRID-Europe 2011; Finnish Building and Dwelling Register; Scheme of complex use and protection of water resources, river basin Tuloma; OAO Scientific Research Institute of Hydraulics B.E.Vedeneeva, 2001.
dustrial logging, which was primarily carried out in the sub-basins Vuva and Notta/Girvas, ceased in 1998. The extent of tourism is small, but the area has high recreational use potential.
A copper-nickel ore deposit was exploited in Priretshnyi until re-cently, but currently the mine is closed. Pressure from industrial wastewater discharges is ranked as local but severe; permits were issued for discharges amounting to 7.32 × 10⁶ m3 for 2010 and dis-charges without permits are estimated to amount to 645,000 m3.
Solid waste disposal in the Russian part of the basin is a local, but se-vere pressure factor, posing a risk of surface and groundwater pollu-tion. There is hardly any waste processing in the Murmansk region, and waste is burned in an incinerator plant without pre-sorting. The village of Drovjanoe has a municipal landfill, but in other set-tlements both authorized and unauthorized dumps — commonly not meeting sanitary requirements — are used for disposal.
Even though there is some pressure on water resources from urban wastewater discharges, the degree of connectedness to water supply and sewerage collection in many settlements in the Russian part is reported to be high: 95% in Murmashi, 87% in Upper Tuloma, 96% in Priretshnyi and 87% in Tuloma. The greatest amount of wastewater and pollutants (share of the total load in parenthesis) are discharged through Murmanskvodokanal: 59.2 tons of organic
matter measured as BOD (66%), 5.19 tons of phosphorus (77%), and 47.9 tons of suspended solids (74%), among others. This is also reported to be the source of all the synthetic surfactants and ammonium.
Status and responsesThe Russian Federation reports the main pollutants to be metals (iron and copper) and organic matter. Average concentrations of phenols typically range from 0.003 to 0.006 mg/l in “clean” rivers, to up to 0.011 mg/l in “polluted” ones.
Concentrations of specific pollutants/elements in the Upper Tuloma Reservoir at the outskirts of Upper Tuloma village, measured during the period from 1986 to 2009
Determinand (unit) number of measurements Average concentrationLowest concentration
measured highest concentration measuredCOD (mg/l) 750 14.0 1.7 27.5BOD5 (mg/l) 753 0.54 0.03 2.15Suspended solids (mg/l) 751 1.976 0 21Ammonium-nitrogen (mg/l) 750 0.01 0 0.3Nitrite-nitrogen (mg/l) 750 0 0 0.041Phosphate (mg/l) 751 0.002 0 0.065Total iron (mg/l) 751 0.15 0 1.67Copper (µg/l) 736 4.0 0 29Zinc (µg/l) 331 8 0 59Nickel (µg/l) 466 3 0 48Lead (µg/l) 31 0.5 0 5Mercury (µg/l) 434 0.017 0 0.7
Popu
latio
n (in
thou
sand
s)
0
5
10
15
20
25
Russ
ian Fe
dera
tion
Finlan
d
19.5
0.3
Country information/other
80 | part iv
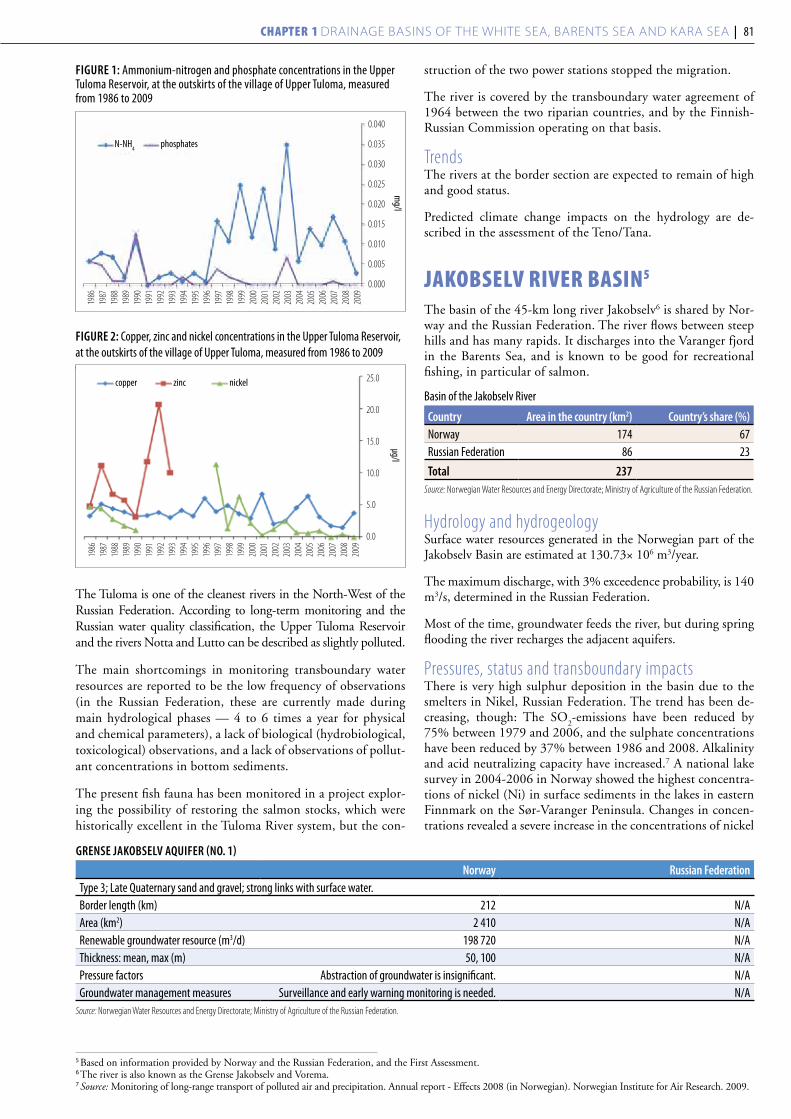
FIguRE 1: Ammonium-nitrogen and phosphate concentrations in the Upper Tuloma Reservoir, at the outskirts of the village of Upper Tuloma, measured from 1986 to 2009
FIguRE 2: Copper, zinc and nickel concentrations in the Upper Tuloma Reservoir, at the outskirts of the village of Upper Tuloma, measured from 1986 to 2009
The Tuloma is one of the cleanest rivers in the North-West of the Russian Federation. According to long-term monitoring and the Russian water quality classification, the Upper Tuloma Reservoir and the rivers Notta and Lutto can be described as slightly polluted.
The main shortcomings in monitoring transboundary water resources are reported to be the low frequency of observations (in the Russian Federation, these are currently made during main hydrological phases — 4 to 6 times a year for physical and chemical parameters), a lack of biological (hydrobiological, toxicological) observations, and a lack of observations of pollut-ant concentrations in bottom sediments.
The present fish fauna has been monitored in a project explor-ing the possibility of restoring the salmon stocks, which were historically excellent in the Tuloma River system, but the con-
struction of the two power stations stopped the migration.
The river is covered by the transboundary water agreement of 1964 between the two riparian countries, and by the Finnish-Russian Commission operating on that basis.
TrendsThe rivers at the border section are expected to remain of high and good status.
Predicted climate change impacts on the hydrology are de-scribed in the assessment of the Teno/Tana.
JakOBselv river Basin5
The basin of the 45-km long river Jakobselv6 is shared by Nor-way and the Russian Federation. The river flows between steep hills and has many rapids. It discharges into the Varanger fjord in the Barents Sea, and is known to be good for recreational fishing, in particular of salmon.
Basin of the Jakobselv River
Country Area in the country (km2) Country’s share (%)Norway 174 67Russian Federation 86 23
Total 237Source: Norwegian Water Resources and Energy Directorate; Ministry of Agriculture of the Russian Federation.
Hydrology and hydrogeologySurface water resources generated in the Norwegian part of the Jakobselv Basin are estimated at 130.73× 10⁶ m3/year.
The maximum discharge, with 3% exceedence probability, is 140 m3/s, determined in the Russian Federation.
Most of the time, groundwater feeds the river, but during spring flooding the river recharges the adjacent aquifers.
Pressures, status and transboundary impactsThere is very high sulphur deposition in the basin due to the smelters in Nikel, Russian Federation. The trend has been de-creasing, though: The SO
2-emissions have been reduced by
75% between 1979 and 2006, and the sulphate concentrations have been reduced by 37% between 1986 and 2008. Alkalinity and acid neutralizing capacity have increased.7 A national lake survey in 2004-2006 in Norway showed the highest concentra-tions of nickel (Ni) in surface sediments in the lakes in eastern Finnmark on the Sør-Varanger Peninsula. Changes in concen-trations revealed a severe increase in the concentrations of nickel
1986
1987
1988
1989
1990
1991
1992
1993
1994
1995
1996
1997
1998
1999
2000
2001
2002
2003
2004
2005
2006
2007
2008
2009
0.040
0.035
0.030
0.025
0.020
0.015
0.010
0.005
0.000
mg/l
N-NH4
phosphates
1986
1987
1988
1989
1990
1991
1992
1993
1994
1995
1996
1997
1998
1999
2000
2001
2002
2003
2004
2005
2006
2007
2008
2009
25.0
20.0
15.0
10.0
5.0
0.0
µg/lcopper zinc nickel
gREnSE JAkOBSELv AquIFER (nO. 1)
norway Russian FederationType 3; Late Quaternary sand and gravel; strong links with surface water.Border length (km) 212 N/AArea (km2) 2 410 N/ARenewable groundwater resource (m3/d) 198 720 N/AThickness: mean, max (m) 50, 100 N/APressure factors Abstraction of groundwater is insignificant. N/AGroundwater management measures Surveillance and early warning monitoring is needed. N/A
Source: Norwegian Water Resources and Energy Directorate; Ministry of Agriculture of the Russian Federation.
5 Based on information provided by Norway and the Russian Federation, and the First Assessment.6 The river is also known as the Grense Jakobselv and Vorema.7 Source: Monitoring of long-range transport of polluted air and precipitation. Annual report - Effects 2008 (in Norwegian). Norwegian Institute for Air Research. 2009.
Chapter 1 Drainage basins of the White sea, barents sea anD Kara sea | 81

in surface sediments compared with subsurface sediment, indi-cating influence of the smelters. The same pattern of increasing nickel was observed in water chemistry and in air pollutants.8
In the Russian part of the basin, the only reported concern — albeit moderate and local in extent — is breaking and hydro-morphological change of the right bank of the river. This is ad-dressed by reinforcing the bank: in 2007 some 5 km of bank was strengthened by rock rubble.
paatsJOki/pasvik river Basin9 Finland, Norway and the Russian Federation share the basin of the Paatsjoki/Pasvik River10. The river, which is long 143 km, is the outlet from Lake Inari in Finland to the Barents Sea. The river flows into the Varangerfjord, not far from Kirkenes. Vaggatem, Fjørvatnet and Hestefossdammen are transboundary lakes within the basin.
Lake Inari is a large (1,084 km2) subarctic, oligotrophic clear lake. The catchment area of Lake Inari forms the Finnish part of the Paatsjoki water system. Lake Inari has been regulated since 1942 by power plants situated in the Russian Federation and Norway.
Basin of the Paatsjoki/Pasvik River
Country Area in the country (km2) Country’s share (%)Norway 1 109 6Finland 14 512 79Russian Federation 2 7 82 15Total 18 403
Source: Lapland regional environment centre, Finland, Statistics Norway, 2008.
The basin is in taiga and tundra zones. Bogs of various types are common; some 12% of the basin area in Finland is wetlands or peatlands. Pasture area has decreased in the Russian part due to increased groundwater levels. The Pasvik National Park is trans-
boundary, with 14,700 ha of its total surface area of 16,610 ha in the Russian Federation (Pechenga district) and the rest in Norway (Øvre Pasvik, also a Ramsar Site). Some 43.2% of the basin area in Finland is protected.
Hydrology and hydrogeologyHigh flows result from substantial amounts of water retained in snow cover over long winters released upon melting. The river flow is regulated and there are seven hydroelectric power plants, five of which are Russian. The related reservoirs are Kaitakoski, Jäniskos-ki, Rajakoski, Hevoskoski and Borisoglebsk. Skogfoss (maximum capacity 46.5 MW) and Melkefoss (22 MW) hydropower stations are located in the Norwegian part.
Surface water resources generated in Norway’s part of Paatsjoki/Pasvik Basin are estimated at 5,344 m3/year (1961 to 1990)11. Sur-face water resources generated in Finland’s part of Paatsjoki/Pasvik Basin are estimated at 5,140 × 106 m3/year, groundwater resources are 36.8 × 10⁶ m3/year.
Based on measurements made from 2005 to 2009 at the gauging station at the Kaitakoski hydropower station in the Russian Fed-eration, the average discharge is 167.2 m3/s.
Of the total amount withdrawn in the Russian Federation (11.90 × 10⁶ m3/year), 78.3% was surface water and 21.7% groundwater according to the State statistic reports on water use. Some 48% of the withdrawal was for industry and 32% for domestic use. The total water use (including non-consumptive) for hydropower gen-eration is some 37 × 109 m3/year. In Finland, withdrawal from the rivers Teno/Tana, Näätämö/Neiden and Paatsjoki/Pasvik in total was 0.55 × 10⁶ m3 in 2007. Skogfoss Waterworks in Norway ab-stracts some 19,000 m3/year destined to domestic use.
In the Finnish part, the aquifers that continue to the neighbouring countries’ territory are small, insignificant for water use, and con-sist of sands and gravels with a mean thickness of some 15 m and maximum thickness of some 100 m.
DISChARgES, pOpuLATIOn AnD LAnD COvER In ThE JAkOBSELv RIvER BASIn
RU
Disc
harg
e (m
3 s-1) (
loga
rithm
ic sc
ale)
140
(Jako
bselv
)1
10
100
1000 QavQmaxQmin
1%2%
8%
89%
Cultivated (<1%)
Urban/Industrial areas (<1%)Surface with little or no vegetation (<1%)
Wetlands (<1%)
Forest
Others
Grassland/ShrublandWater bodies
Sources: UNEP/DEWA/GRID-Europe 2011; In the municipality of Sør-Varanger (Norway), according to the Statistics Norway.Note: Population in the Russian part of the Basin is less than 50.
8 Source: National Lake Survey 2004–2006. Part III: AMAP. Norwegian Institute for Water Research. 2008.9 Based on information provided by Finland, Norway and the Russian Federation, and the First Assessment.10 The river is known as Paatsjoki in Finland and as Pasvik or Pasvikelva in Norway.11 Source: Norwegian Water Resources and Energy Directorate.
Popu
latio
n (in
thou
sand
s)
0.00
0.05
0.10
0.15
0.20
0.25
Russ
ian Fe
dera
tion
Norw
ay
0.2
0.0
LandScanTM
82 | part iv
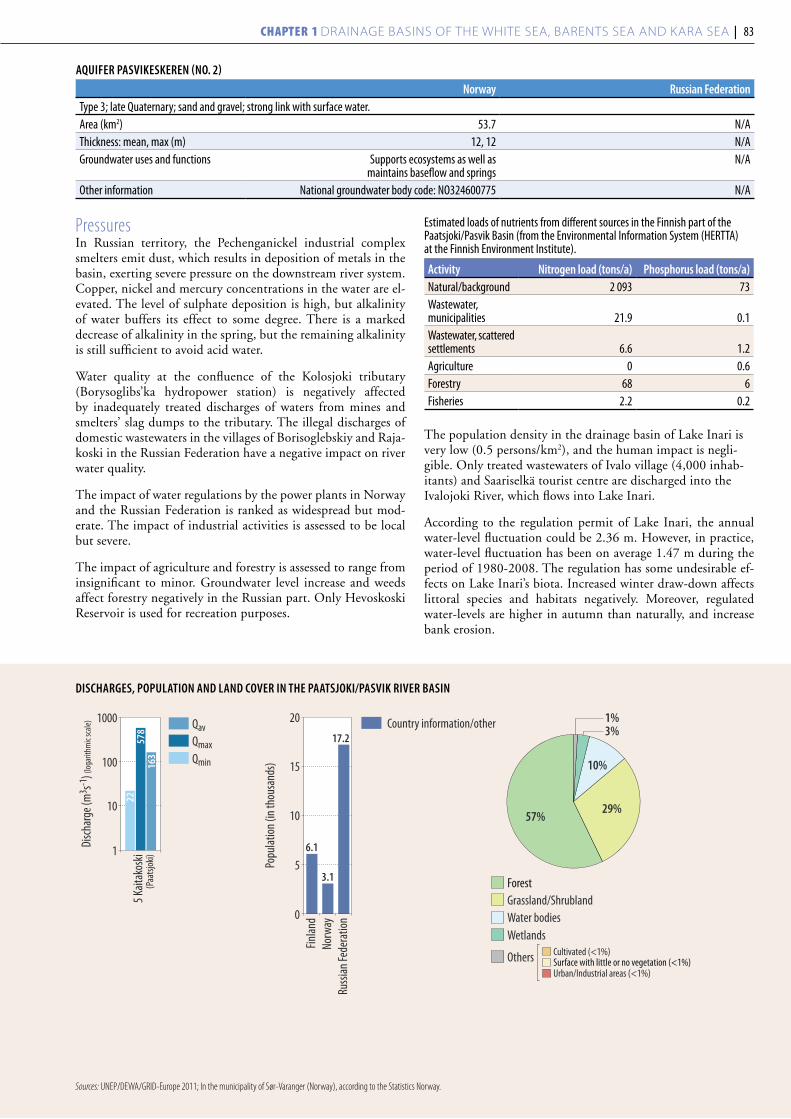
PressuresIn Russian territory, the Pechenganickel industrial complex smelters emit dust, which results in deposition of metals in the basin, exerting severe pressure on the downstream river system. Copper, nickel and mercury concentrations in the water are el-evated. The level of sulphate deposition is high, but alkalinity of water buffers its effect to some degree. There is a marked decrease of alkalinity in the spring, but the remaining alkalinity is still sufficient to avoid acid water.
Water quality at the confluence of the Kolosjoki tributary (Borysoglibs’ka hydropower station) is negatively affected by inadequately treated discharges of waters from mines and smelters’ slag dumps to the tributary. The illegal discharges of domestic wastewaters in the villages of Borisoglebskiy and Raja-koski in the Russian Federation have a negative impact on river water quality.
The impact of water regulations by the power plants in Norway and the Russian Federation is ranked as widespread but mod-erate. The impact of industrial activities is assessed to be local but severe.
The impact of agriculture and forestry is assessed to range from insignificant to minor. Groundwater level increase and weeds affect forestry negatively in the Russian part. Only Hevoskoski Reservoir is used for recreation purposes.
Estimated loads of nutrients from different sources in the Finnish part of the Paatsjoki/Pasvik Basin (from the Environmental Information System (HERTTA) at the Finnish Environment Institute).
Activity nitrogen load (tons/a) phosphorus load (tons/a)Natural/background 2 093 73Wastewater, municipalities 21.9 0.1Wastewater, scattered settlements 6.6 1.2Agriculture 0 0.6Forestry 68 6Fisheries 2.2 0.2
The population density in the drainage basin of Lake Inari is very low (0.5 persons/km2), and the human impact is negli-gible. Only treated wastewaters of Ivalo village (4,000 inhab-itants) and Saariselkä tourist centre are discharged into the Ivalojoki River, which flows into Lake Inari.
According to the regulation permit of Lake Inari, the annual water-level fluctuation could be 2.36 m. However, in practice, water-level fluctuation has been on average 1.47 m during the period of 1980-2008. The regulation has some undesirable ef-fects on Lake Inari’s biota. Increased winter draw-down affects littoral species and habitats negatively. Moreover, regulated water-levels are higher in autumn than naturally, and increase bank erosion.
AquIFER pASvIkESkEREn (nO. 2)
norway Russian FederationType 3; late Quaternary; sand and gravel; strong link with surface water. Area (km2) 53.7 N/AThickness: mean, max (m) 12, 12 N/AGroundwater uses and functions Supports ecosystems as well as
maintains baseflow and springsN/A
Other information National groundwater body code: NO324600775 N/A
DISChARgES, pOpuLATIOn AnD LAnD COvER In ThE pAATSJOkI/pASvIk RIvER BASIn
Sources: UNEP/DEWA/GRID-Europe 2011; In the municipality of Sør-Varanger (Norway), according to the Statistics Norway.
5 Kait
akos
ki
Disc
harg
e (m
3 s-1) (
loga
rithm
ic sc
ale)
578
163
(Paa
tsjok
i)1
10
100
1000
22
QavQmaxQmin
Popu
latio
n (in
thou
sand
s)
0
5
10
15
20
Russ
ian Fe
dera
tion
Norw
ayFin
land
6.1
3.1
17.2Country information/other
3%1%
57%29%
10%
Cultivated (<1%)Surface with little or no vegetation (<1%)Urban/Industrial areas (<1%)
ForestGrassland/Shrubland
Others
Water bodiesWetlands
Chapter 1 Drainage basins of the White sea, barents sea anD Kara sea | 83
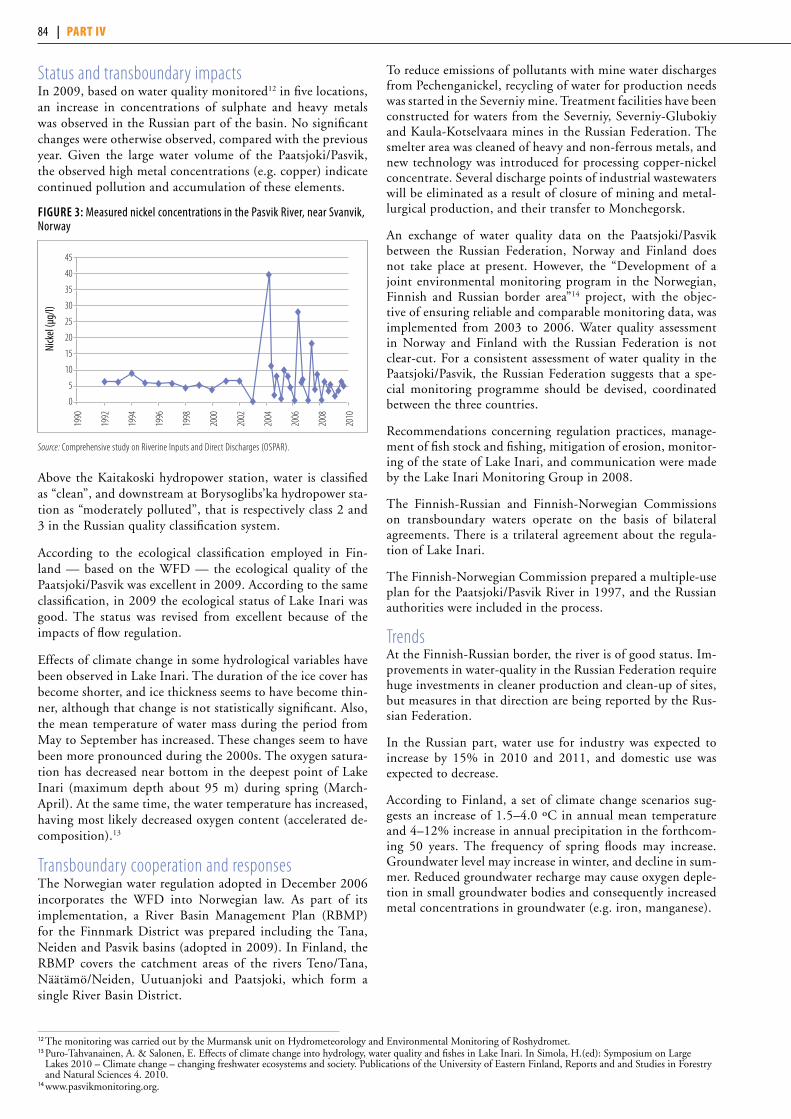
Status and transboundary impactsIn 2009, based on water quality monitored12 in five locations, an increase in concentrations of sulphate and heavy metals was observed in the Russian part of the basin. No significant changes were otherwise observed, compared with the previous year. Given the large water volume of the Paatsjoki/Pasvik, the observed high metal concentrations (e.g. copper) indicate continued pollution and accumulation of these elements.
FIguRE 3: Measured nickel concentrations in the Pasvik River, near Svanvik, Norway
Source: Comprehensive study on Riverine Inputs and Direct Discharges (OSPAR).
Above the Kaitakoski hydropower station, water is classified as “clean”, and downstream at Borysoglibs’ka hydropower sta-tion as “moderately polluted”, that is respectively class 2 and 3 in the Russian quality classification system.
According to the ecological classification employed in Fin-land — based on the WFD — the ecological quality of the Paatsjoki/Pasvik was excellent in 2009. According to the same classification, in 2009 the ecological status of Lake Inari was good. The status was revised from excellent because of the impacts of flow regulation.
Effects of climate change in some hydrological variables have been observed in Lake Inari. The duration of the ice cover has become shorter, and ice thickness seems to have become thin-ner, although that change is not statistically significant. Also, the mean temperature of water mass during the period from May to September has increased. These changes seem to have been more pronounced during the 2000s. The oxygen satura-tion has decreased near bottom in the deepest point of Lake Inari (maximum depth about 95 m) during spring (March-April). At the same time, the water temperature has increased, having most likely decreased oxygen content (accelerated de-composition).13
Transboundary cooperation and responsesThe Norwegian water regulation adopted in December 2006 incorporates the WFD into Norwegian law. As part of its implementation, a River Basin Management Plan (RBMP) for the Finnmark District was prepared including the Tana, Neiden and Pasvik basins (adopted in 2009). In Finland, the RBMP covers the catchment areas of the rivers Teno/Tana, Näätämö/Neiden, Uutuanjoki and Paatsjoki, which form a single River Basin District.
To reduce emissions of pollutants with mine water discharges from Pechenganickel, recycling of water for production needs was started in the Severniy mine. Treatment facilities have been constructed for waters from the Severniy, Severniy-Glubokiy and Kaula-Kotselvaara mines in the Russian Federation. The smelter area was cleaned of heavy and non-ferrous metals, and new technology was introduced for processing copper-nickel concentrate. Several discharge points of industrial wastewaters will be eliminated as a result of closure of mining and metal-lurgical production, and their transfer to Monchegorsk.
An exchange of water quality data on the Paatsjoki/Pasvik between the Russian Federation, Norway and Finland does not take place at present. However, the “Development of a joint environmental monitoring program in the Norwegian, Finnish and Russian border area”14 project, with the objec-tive of ensuring reliable and comparable monitoring data, was implemented from 2003 to 2006. Water quality assessment in Norway and Finland with the Russian Federation is not clear-cut. For a consistent assessment of water quality in the Paatsjoki/Pasvik, the Russian Federation suggests that a spe-cial monitoring programme should be devised, coordinated between the three countries.
Recommendations concerning regulation practices, manage-ment of fish stock and fishing, mitigation of erosion, monitor-ing of the state of Lake Inari, and communication were made by the Lake Inari Monitoring Group in 2008.
The Finnish-Russian and Finnish-Norwegian Commissions on transboundary waters operate on the basis of bilateral agreements. There is a trilateral agreement about the regula-tion of Lake Inari.
The Finnish-Norwegian Commission prepared a multiple-use plan for the Paatsjoki/Pasvik River in 1997, and the Russian authorities were included in the process.
TrendsAt the Finnish-Russian border, the river is of good status. Im-provements in water-quality in the Russian Federation require huge investments in cleaner production and clean-up of sites, but measures in that direction are being reported by the Rus-sian Federation.
In the Russian part, water use for industry was expected to increase by 15% in 2010 and 2011, and domestic use was expected to decrease.
According to Finland, a set of climate change scenarios sug-gests an increase of 1.5–4.0 ºC in annual mean temperature and 4–12% increase in annual precipitation in the forthcom-ing 50 years. The frequency of spring floods may increase. Groundwater level may increase in winter, and decline in sum-mer. Reduced groundwater recharge may cause oxygen deple-tion in small groundwater bodies and consequently increased metal concentrations in groundwater (e.g. iron, manganese).
Nick
el (µ
g/l)
45
40
35
30
25
20
15
10
5
0
1990
1992
1994
1996
1998
2000
2002
2004
2006
2008
2010
12 The monitoring was carried out by the Murmansk unit on Hydrometeorology and Environmental Monitoring of Roshydromet. 13 Puro-Tahvanainen, A. & Salonen, E. Effects of climate change into hydrology, water quality and fishes in Lake Inari. In Simola, H.(ed): Symposium on Large
Lakes 2010 – Climate change – changing freshwater ecosystems and society. Publications of the University of Eastern Finland, Reports and and Studies in Forestry and Natural Sciences 4. 2010.
14 www.pasvikmonitoring.org.
84 | part iv
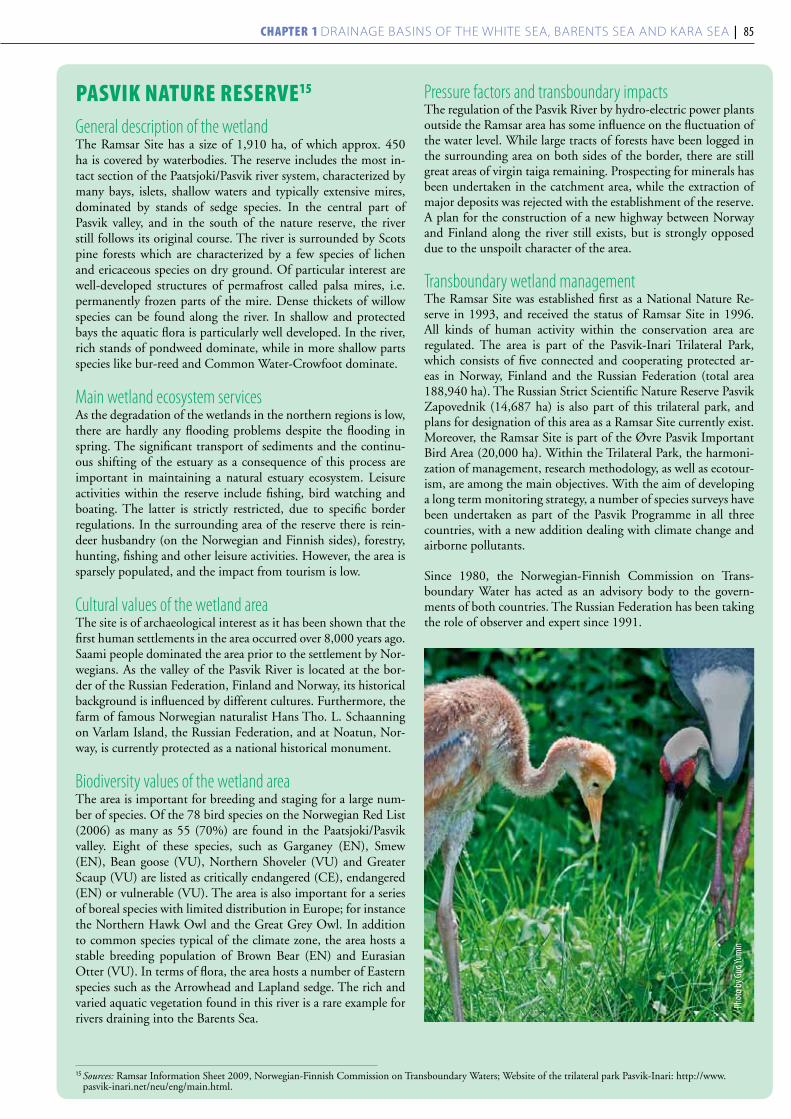
15 Sources: Ramsar Information Sheet 2009, Norwegian-Finnish Commission on Transboundary Waters; Website of the trilateral park Pasvik-Inari: http://www.pasvik-inari.net/neu/eng/main.html.
pasvik nature reserve15 General description of the wetland The Ramsar Site has a size of 1,910 ha, of which approx. 450 ha is covered by waterbodies. The reserve includes the most in-tact section of the Paatsjoki/Pasvik river system, characterized by many bays, islets, shallow waters and typically extensive mires, dominated by stands of sedge species. In the central part of Pasvik valley, and in the south of the nature reserve, the river still follows its original course. The river is surrounded by Scots pine forests which are characterized by a few species of lichen and ericaceous species on dry ground. Of particular interest are well-developed structures of permafrost called palsa mires, i.e. permanently frozen parts of the mire. Dense thickets of willow species can be found along the river. In shallow and protected bays the aquatic flora is particularly well developed. In the river, rich stands of pondweed dominate, while in more shallow parts species like bur-reed and Common Water-Crowfoot dominate.
Main wetland ecosystem services As the degradation of the wetlands in the northern regions is low, there are hardly any flooding problems despite the flooding in spring. The significant transport of sediments and the continu-ous shifting of the estuary as a consequence of this process are important in maintaining a natural estuary ecosystem. Leisure activities within the reserve include fishing, bird watching and boating. The latter is strictly restricted, due to specific border regulations. In the surrounding area of the reserve there is rein-deer husbandry (on the Norwegian and Finnish sides), forestry, hunting, fishing and other leisure activities. However, the area is sparsely populated, and the impact from tourism is low.
Cultural values of the wetland areaThe site is of archaeological interest as it has been shown that the first human settlements in the area occurred over 8,000 years ago. Saami people dominated the area prior to the settlement by Nor-wegians. As the valley of the Pasvik River is located at the bor-der of the Russian Federation, Finland and Norway, its historical background is influenced by different cultures. Furthermore, the farm of famous Norwegian naturalist Hans Tho. L. Schaanning on Varlam Island, the Russian Federation, and at Noatun, Nor-way, is currently protected as a national historical monument.
Biodiversity values of the wetland areaThe area is important for breeding and staging for a large num-ber of species. Of the 78 bird species on the Norwegian Red List (2006) as many as 55 (70%) are found in the Paatsjoki/Pasvik valley. Eight of these species, such as Garganey (EN), Smew (EN), Bean goose (VU), Northern Shoveler (VU) and Greater Scaup (VU) are listed as critically endangered (CE), endangered (EN) or vulnerable (VU). The area is also important for a series of boreal species with limited distribution in Europe; for instance the Northern Hawk Owl and the Great Grey Owl. In addition to common species typical of the climate zone, the area hosts a stable breeding population of Brown Bear (EN) and Eurasian Otter (VU). In terms of flora, the area hosts a number of Eastern species such as the Arrowhead and Lapland sedge. The rich and varied aquatic vegetation found in this river is a rare example for rivers draining into the Barents Sea.
Pressure factors and transboundary impactsThe regulation of the Pasvik River by hydro-electric power plants outside the Ramsar area has some influence on the fluctuation of the water level. While large tracts of forests have been logged in the surrounding area on both sides of the border, there are still great areas of virgin taiga remaining. Prospecting for minerals has been undertaken in the catchment area, while the extraction of major deposits was rejected with the establishment of the reserve. A plan for the construction of a new highway between Norway and Finland along the river still exists, but is strongly opposed due to the unspoilt character of the area.
Transboundary wetland managementThe Ramsar Site was established first as a National Nature Re-serve in 1993, and received the status of Ramsar Site in 1996. All kinds of human activity within the conservation area are regulated. The area is part of the Pasvik-Inari Trilateral Park, which consists of five connected and cooperating protected ar-eas in Norway, Finland and the Russian Federation (total area 188,940 ha). The Russian Strict Scientific Nature Reserve Pasvik Zapovednik (14,687 ha) is also part of this trilateral park, and plans for designation of this area as a Ramsar Site currently exist. Moreover, the Ramsar Site is part of the Øvre Pasvik Important Bird Area (20,000 ha). Within the Trilateral Park, the harmoni-zation of management, research methodology, as well as ecotour-ism, are among the main objectives. With the aim of developing a long term monitoring strategy, a number of species surveys have been undertaken as part of the Pasvik Programme in all three countries, with a new addition dealing with climate change and airborne pollutants.
Since 1980, the Norwegian-Finnish Commission on Trans-boundary Water has acted as an advisory body to the govern-ments of both countries. The Russian Federation has been taking the role of observer and expert since 1991.
Phot
o by G
uo Yu
min
Chapter 1 Drainage basins of the White sea, barents sea anD Kara sea | 85
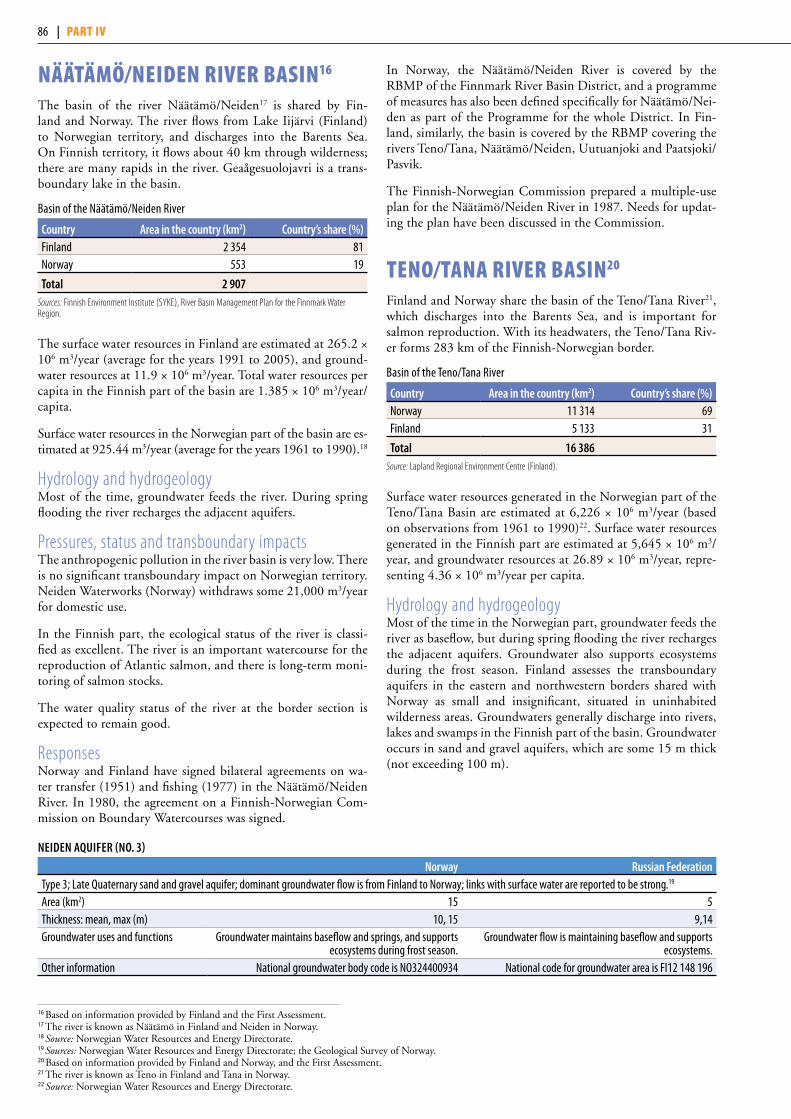
näätämö/neiden river Basin16 The basin of the river Näätämö/Neiden17 is shared by Fin-land and Norway. The river flows from Lake Iijärvi (Finland) to Norwegian territory, and discharges into the Barents Sea. On Finnish territory, it flows about 40 km through wilderness; there are many rapids in the river. Geaågesuolojavri is a trans-boundary lake in the basin.
Basin of the Näätämö/Neiden River
Country Area in the country (km2) Country’s share (%)Finland 2 354 81Norway 553 19
Total 2 907 Sources: Finnish Environment Institute (SYKE), River Basin Management Plan for the Finnmark Water Region.
The surface water resources in Finland are estimated at 265.2 × 10⁶ m3/year (average for the years 1991 to 2005), and ground-water resources at 11.9 × 10⁶ m3/year. Total water resources per capita in the Finnish part of the basin are 1.385 × 10⁶ m3/year/capita.
Surface water resources in the Norwegian part of the basin are es-timated at 925.44 m3/year (average for the years 1961 to 1990).18
Hydrology and hydrogeologyMost of the time, groundwater feeds the river. During spring flooding the river recharges the adjacent aquifers.
Pressures, status and transboundary impactsThe anthropogenic pollution in the river basin is very low. There is no significant transboundary impact on Norwegian territory. Neiden Waterworks (Norway) withdraws some 21,000 m3/year for domestic use.
In the Finnish part, the ecological status of the river is classi-fied as excellent. The river is an important watercourse for the reproduction of Atlantic salmon, and there is long-term moni-toring of salmon stocks.
The water quality status of the river at the border section is expected to remain good.
Responses Norway and Finland have signed bilateral agreements on wa-ter transfer (1951) and fishing (1977) in the Näätämö/Neiden River. In 1980, the agreement on a Finnish-Norwegian Com-mission on Boundary Watercourses was signed.
In Norway, the Näätämö/Neiden River is covered by the RBMP of the Finnmark River Basin District, and a programme of measures has also been defined specifically for Näätämö/Nei-den as part of the Programme for the whole District. In Fin-land, similarly, the basin is covered by the RBMP covering the rivers Teno/Tana, Näätämö/Neiden, Uutuanjoki and Paatsjoki/Pasvik.
The Finnish-Norwegian Commission prepared a multiple-use plan for the Näätämö/Neiden River in 1987. Needs for updat-ing the plan have been discussed in the Commission.
tenO/tana river Basin20
Finland and Norway share the basin of the Teno/Tana River21, which discharges into the Barents Sea, and is important for salmon reproduction. With its headwaters, the Teno/Tana Riv-er forms 283 km of the Finnish-Norwegian border.
Basin of the Teno/Tana River
Country Area in the country (km2) Country’s share (%)Norway 11 314 69Finland 5 133 31
Total 16 386Source: Lapland Regional Environment Centre (Finland).
Surface water resources generated in the Norwegian part of the Teno/Tana Basin are estimated at 6,226 × 106 m3/year (based on observations from 1961 to 1990)22. Surface water resources generated in the Finnish part are estimated at 5,645 × 106 m3/year, and groundwater resources at 26.89 × 10⁶ m3/year, repre-senting 4.36 × 10⁶ m3/year per capita.
Hydrology and hydrogeologyMost of the time in the Norwegian part, groundwater feeds the river as baseflow, but during spring flooding the river recharges the adjacent aquifers. Groundwater also supports ecosystems during the frost season. Finland assesses the transboundary aquifers in the eastern and northwestern borders shared with Norway as small and insignificant, situated in uninhabited wilderness areas. Groundwaters generally discharge into rivers, lakes and swamps in the Finnish part of the basin. Groundwater occurs in sand and gravel aquifers, which are some 15 m thick (not exceeding 100 m).
nEIDEn AquIFER (nO. 3)
norway Russian FederationType 3; Late Quaternary sand and gravel aquifer; dominant groundwater flow is from Finland to Norway; links with surface water are reported to be strong.19
Area (km2) 15 5Thickness: mean, max (m) 10, 15 9,14Groundwater uses and functions Groundwater maintains baseflow and springs, and supports
ecosystems during frost season.Groundwater flow is maintaining baseflow and supports
ecosystems.Other information National groundwater body code is NO324400934 National code for groundwater area is FI12 148 196
16 Based on information provided by Finland and the First Assessment. 17 The river is known as Näätämö in Finland and Neiden in Norway. 18 Source: Norwegian Water Resources and Energy Directorate. 19 Sources: Norwegian Water Resources and Energy Directorate; the Geological Survey of Norway. 20 Based on information provided by Finland and Norway, and the First Assessment.21 The river is known as Teno in Finland and Tana in Norway. 22 Source: Norwegian Water Resources and Energy Directorate.
86 | part iv

DISChARgES, pOpuLATIOn AnD LAnD COvER In ThE nääTämö/nEIDEn RIvER BASIn
DISChARgES, pOpuLATIOn AnD LAnD COvER In ThE TEnO/TAnA RIvER BASIn
Sources: UNEP/DEWA/GRID-Europe 2011; Finnish Building and Dwelling Register, Statistics Norway.
Sources: UNEP/DEWA/GRID-Europe 2011; Finnish Building and Dwelling Register, Statistics Norway.
4 Iijä
rvi
Disc
harg
e (m
3 s-1) (
loga
rithm
ic sc
ale)
171
8(N
äätä
mö)1
10
100
1000
2
QavQmaxQmin
Popu
latio
n (in
thou
sand
s)
0.00
0.05
0.10
0.15
0.25
0.20
Norw
ayFin
land
0.2 0.2
Country information/other 2%
Cultivated (<1%)Grassland/Shrubland (<1%)
Urban/Industrial areas (<1%)Surface with little or no vegetation (<1%)
63%25%
10%
Forest
Others
Water bodiesWetlands
3 Pol
mak
2 Alak
öngä
s
Disc
harg
e (m
3 s-1) (
loga
rithm
ic sc
ale)
3844
169
2155
179
(Teno
)
(Teno
)1
10
100
1000
10000
21 14
QavQmaxQmin
Popu
latio
n (in
thou
sand
s)
0
1
2
3
4
5
6
Norw
ayFin
land
5.3
1.3
Country information/otherLandScanTM
1%1%2%
8%
88%
Cultivated (<1%)
Urban/Industrial areas (<1%)Surface with little or no vegetation (<1%)
Forest
Others
Grassland/ShrublandWater bodiesWetlands
Chapter 1 Drainage basins of the White sea, barents sea anD Kara sea | 87
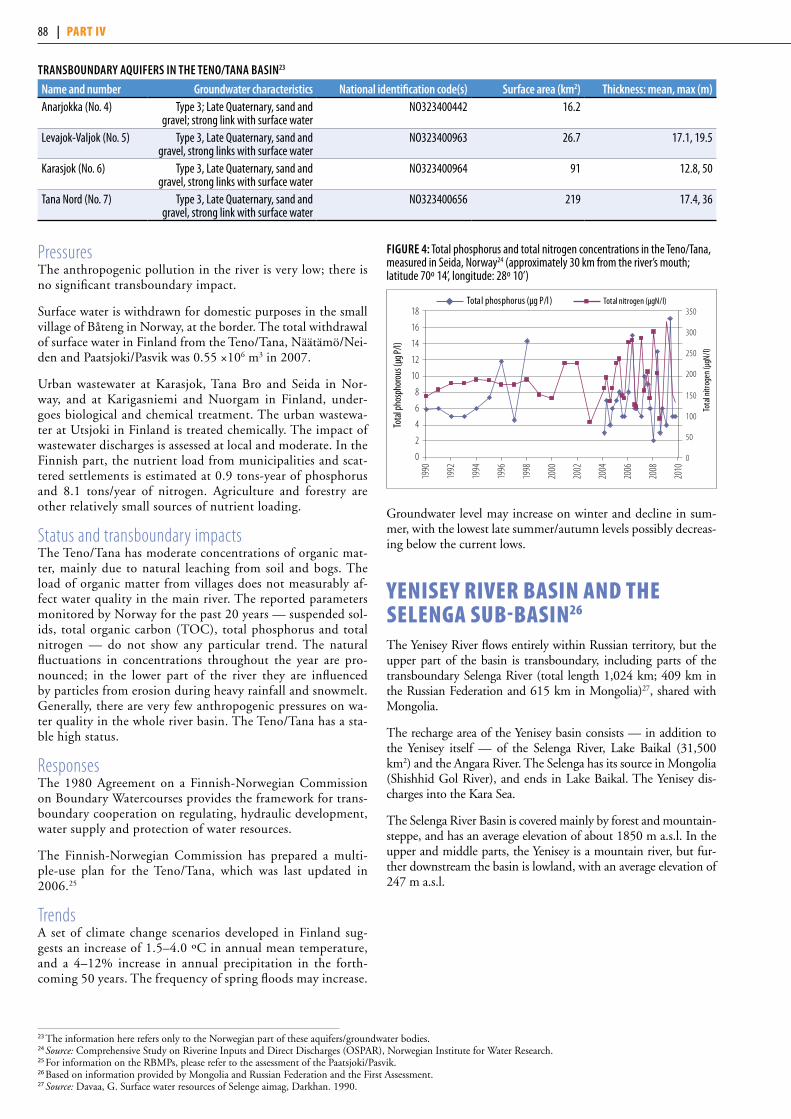
PressuresThe anthropogenic pollution in the river is very low; there is no significant transboundary impact.
Surface water is withdrawn for domestic purposes in the small village of Båteng in Norway, at the border. The total withdrawal of surface water in Finland from the Teno/Tana, Näätämö/Nei-den and Paatsjoki/Pasvik was 0.55 ×10⁶ m3 in 2007.
Urban wastewater at Karasjok, Tana Bro and Seida in Nor-way, and at Karigasniemi and Nuorgam in Finland, under-goes biological and chemical treatment. The urban wastewa-ter at Utsjoki in Finland is treated chemically. The impact of wastewater discharges is assessed at local and moderate. In the Finnish part, the nutrient load from municipalities and scat-tered settlements is estimated at 0.9 tons-year of phosphorus and 8.1 tons/year of nitrogen. Agriculture and forestry are other relatively small sources of nutrient loading.
Status and transboundary impactsThe Teno/Tana has moderate concentrations of organic mat-ter, mainly due to natural leaching from soil and bogs. The load of organic matter from villages does not measurably af-fect water quality in the main river. The reported parameters monitored by Norway for the past 20 years — suspended sol-ids, total organic carbon (TOC), total phosphorus and total nitrogen — do not show any particular trend. The natural fluctuations in concentrations throughout the year are pro-nounced; in the lower part of the river they are influenced by particles from erosion during heavy rainfall and snowmelt. Generally, there are very few anthropogenic pressures on wa-ter quality in the whole river basin. The Teno/Tana has a sta-ble high status.
ResponsesThe 1980 Agreement on a Finnish-Norwegian Commission on Boundary Watercourses provides the framework for trans-boundary cooperation on regulating, hydraulic development, water supply and protection of water resources.
The Finnish-Norwegian Commission has prepared a multi-ple-use plan for the Teno/Tana, which was last updated in 2006.25
TrendsA set of climate change scenarios developed in Finland sug-gests an increase of 1.5–4.0 ºC in annual mean temperature, and a 4–12% increase in annual precipitation in the forth-coming 50 years. The frequency of spring floods may increase.
Groundwater level may increase on winter and decline in sum-mer, with the lowest late summer/autumn levels possibly decreas-ing below the current lows.
YeniseY river Basin and the selenga suB-Basin26
The Yenisey River flows entirely within Russian territory, but the upper part of the basin is transboundary, including parts of the transboundary Selenga River (total length 1,024 km; 409 km in the Russian Federation and 615 km in Mongolia)27, shared with Mongolia.
The recharge area of the Yenisey basin consists — in addition to the Yenisey itself — of the Selenga River, Lake Baikal (31,500 km2) and the Angara River. The Selenga has its source in Mongolia (Shishhid Gol River), and ends in Lake Baikal. The Yenisey dis-charges into the Kara Sea.
The Selenga River Basin is covered mainly by forest and mountain-steppe, and has an average elevation of about 1850 m a.s.l. In the upper and middle parts, the Yenisey is a mountain river, but fur-ther downstream the basin is lowland, with an average elevation of 247 m a.s.l.
TRAnSBOunDARY AquIFERS In ThE TEnO/TAnA BASIn23
name and number groundwater characteristics national identification code(s) Surface area (km2) Thickness: mean, max (m)Anarjokka (No. 4) Type 3; Late Quaternary, sand and
gravel; strong link with surface waterNO323400442 16.2
Levajok-Valjok (No. 5) Type 3, Late Quaternary, sand and gravel, strong links with surface water
NO323400963 26.7 17.1, 19.5
Karasjok (No. 6) Type 3, Late Quaternary, sand and gravel, strong links with surface water
NO323400964 91 12.8, 50
Tana Nord (No. 7) Type 3, Late Quaternary, sand and gravel, strong link with surface water
NO323400656 219 17.4, 36
23 The information here refers only to the Norwegian part of these aquifers/groundwater bodies.24 Source: Comprehensive Study on Riverine Inputs and Direct Discharges (OSPAR), Norwegian Institute for Water Research.25 For information on the RBMPs, please refer to the assessment of the Paatsjoki/Pasvik. 26 Based on information provided by Mongolia and Russian Federation and the First Assessment.27 Source: Davaa, G. Surface water resources of Selenge aimag, Darkhan. 1990.
FIguRE 4: Total phosphorus and total nitrogen concentrations in the Teno/Tana, measured in Seida, Norway24 (approximately 30 km from the river’s mouth; latitude 70º 14’, longitude: 28º 10’)
18
16
14
12
10
8
6
4
2
0
1990
1992
1994
1996
1998
2000
2002
2004
2006
2008
2010
Total phosphorus (µg P/l) Total nitrogen (µgN/l)
Tota
l pho
spho
rous
(µg P
/l)
0
50
100
150
200
250
300
350
Tota
l nitr
ogen
(µgN
/l)
88 | part iv
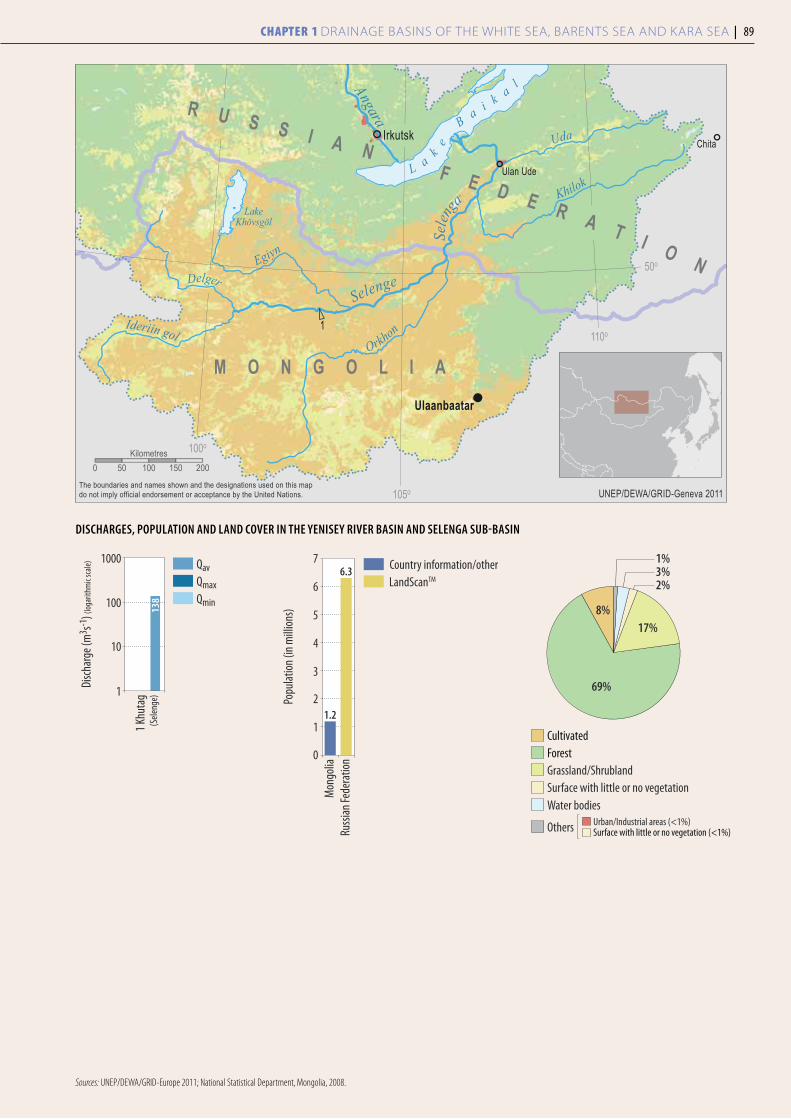
DISChARgES, pOpuLATIOn AnD LAnD COvER In ThE YEnISEY RIvER BASIn AnD SELEngA SuB-BASIn
1
Ulaanbaatar
Irkutsk
Ulan Ude
Chita
LakeKhövsgöl
L a
ke
Ba i k a
l
Selen
ga
Selenge
Angara
Egiyn
Delger
Ideriin golOrkhon
Uda
Khilok
M O N G O L I A
R U S S I A N F E D E R A T I O N
100o
105o
110o
50o
UNEP/DEWA/GRID-Geneva 2011The boundaries and names shown and the designations used on this mapdo not imply official endorsement or acceptance by the United Nations.
0 50 100 150 200Kilometres
Sources: UNEP/DEWA/GRID-Europe 2011; National Statistical Department, Mongolia, 2008.
1 Khu
tag
Disc
harg
e (m
3 s-1) (
loga
rithm
ic sc
ale)
138
(Sele
nge)1
10
100
1000 QavQmaxQmin
Popu
latio
n (in
mill
ions
)
0
1
2
3
4
5
6
7
Russ
ian Fe
dera
tion
Mon
golia
1.2
6.3 Country information/otherLandScanTM 2%
3%1%
8%
69%
17%
Urban/Industrial areas (<1%)Surface with little or no vegetation (<1%)
ForestGrassland/Shrubland
Others
Surface with little or no vegetationWater bodies
Cultivated
Chapter 1 Drainage basins of the White sea, barents sea anD Kara sea | 89

Basin of the Yenisey River and sub-basin of the Selenga River
Country Area in the country (km2) Country’s share (%)Selenga sub-basinMongolia 282 050 63.3Russian Federation 163 195 36.7Total Selenga sub-basin 445 245Yenisey basinMongolia 282 050 11.1Russian Federation 2 261 700 88.9Total Yenisey basin 2 543 750
Sources: Integrated Management and Protection of Water Resources of the Yenisey and Angara rivers, Krasnojarsk Regional Branch of the International Academy of Ecology and Nature, Krasnojarsk, 2006; Surface water resources of the USSR, Gidrometizdat, Leningrad, 1973; Davaa, G. Surface water of Mongolia, Ulaanbaatar, 1999.
Hydrology and hydrogeologySurface water resources generated in the Mongolian part of the Selenga river basin are estimated at 18 × 109 m3/year, and groundwater resources at 6.6 × 10⁶ m3/year, representing 20,960 m3/year/capita.28
The average discharge of the Selenga is 290 m3/s in the border sec-tion. The total discharge of the Yenisey at the mouth is 18,730 m3/s.
According to Mongolia, transboundary groundwaters occur in 1) Quaternary alluvial deposits (mean thickness 10–15 m and maximum thickness 20 m); 2) Cambrian limestones, sandstones, siltstones and conglomerates; and 3) fracture sys-tems related to tectonic faults in Precambrian granites. The dominant groundwater flow direction is from Mongolia to-wards the Russian Federation. The links between surface and groundwater are medium, with groundwater mainly recharg-ing from surface water, and interaction between surface water and groundwater in the basin is reported to play an important role in the functioning of the riparian ecosystem.
PressuresWidespread and severe pressure factors in the Mongolian part of the Selenga Basin include floods caused by heavy rain, gold mining (52 companies operating), forest fires, and insects af-fecting forests (beetles Coleoptera sp.). Also widespread, but more moderate in impact, are wool processing, tanneries and beverage factories, as well as overgrazing. Hydromorphologi-cal change of the river channel is a local but potentially severe pressure factor. Thermal power stations in Ulaanbaatar city and discharge of urban wastewater are assessed to be of com-parable importance.
Status and transboundary impacts Average mineralization of groundwater in the Selenga river basin is 450 mg/l. Based on data from four monitoring sta-tions, the pH is 7.8.
In the Russian Federation, heavy metals and petroleum prod-ucts exceed the maximum allowable concentrations for fisher-
ies in the water of the Selenga River. Water quality is assessed as “very polluted”.
Lake Baikal serves as a natural barrier for the transboundary flow of pollutants, preventing their impact on the downstream part of the watercourse.
ResponsesManagement activities implemented by the Russian Federa-tion in the Selenga River basin in 2008-2010 with federal funding included a complete renovation of four dams and two protection dams. The work includes overhaul of hydraulic structures, dredging/clearing the channel of the river Selenga, and clearing/dredging the channels of its tributaries. Measures were also taken to protect the area and population from the negative impacts of water.
Renovation of the technology and facilities of the following wastewater treatment plants is foreseen during the period 2010-2021 in the framework of the National Programme on Water in Mongolia: Tolgoit in Ulaanbaatar, Moron city of Khovsgol aimag and Darkhan city. Mongolian water legisla-tion requires mining companies and factories to take measures to protect water resources. Accordingly, in Orkhon aimag, Erdenet copper mine is reusing its wastewater.
The Russian-Mongolian Joint Commission on the Protection and Use of Transboundary Waters, which operates on the basis of the intergovernmental 1995 Agreement on the protection and use of transboundary waters, meets regularly. The provi-sions of the Agreement include an exchange of information on transboundary waters. Monitoring surface water quality is car-ried out at four monitoring points. Information on discharge, regime, quality monitoring results and flood and emergency situations is exchanged in the joint Mongolian-Russian Work-ing Group, established by order of the Minister of Nature and Environment of Mongolia, and its Russian counterpart.
Currently, there are 19 surface water monitoring stations ob-serving daily in the Selenga Basin in Mongolia. In the frame-work of the “Strengthening Integrated Water Resources Man-agement in Mongolia” project, 17 groundwater-monitoring wells will be set up within the Selenga River Basin area.
The Eroo River Basin Council was established in 2007, and the Tuul River Basin Council in 2010 in Mongolia. The first Meet-ing of River Basin Councils of Mongolia was held in Ulaanbaatar in June 2010. In the framework of a project, the Water Agency of Mongolia develops IWRM Plans for the Orkhon and Tuul River Basins. A vulnerability assessment of these two basins was carried out by UNEP, in collaboration with Peking University and the Water Institute, from 2005 to 2007. Mongolia is interested in conducting joint research and studies on developing an IWRM plan for the Selenga River Basin. In recent years, the riparian countries have jointly carried out several studies, e.g. a survey of the Selenga River’s water regime, a fishery survey, and an inven-tory of pollution sources in the Upper Selenga Basin.
Total water withdrawal and withdrawals by sector in the Selenga sub-basin
Country YearTotal withdrawal
×106 m3/year Agricultural % Domestic % Industry % Energy % Other %Mongolia 2009 539.8a 36 13 22 0 28Russian Federation 2009 425b 8 N/A 74 N/A N/A
Note: Groundwater makes up 60–80% of the total water use in Mongolia. Rural people in Mongolia use water from rivers, streams and snow water as drinking water.a Water Authority of Mongolia.b Withdrawal in the Selenga River Basin.
28 Sources: Regional scheme of use and protection of water resources in Selenge river basin, Ulaanbaatar, 1986 and for groundwater resources: Jadambaa, D., Geo-ecology Institute of Mongolia, Ulaanbaatar.
90 | part iv

TrendsAt the present time, a scheme of complex use and protection of the water bodies of the Selenga River is being developed in the Russian Federation, including planning and implementation of water management and water conservation measures, measures to mitigate impacts of floods, and other adverse impacts.
Mining companies’ activities in the proximity of water bodies is limited through enforcement of the 2009 Mongolian Law on “Prohibition of the prospecting and exploitation of the mineral resources within the forest and water reservoir areas”. A campaign (Atar III) aimed at increasing crop and vegetable production will continue.
Mongolia is very sensitive to climate change due to its geo-graphic location, sensitive ecosystems and socioeconomic condition. Surface water resources are predicted to increase during the first stage of climate change. However, there is no sign whatsoever of increase yet. In the last 60 years, the aver-age yearly temperature has increased by 1.9 ºC, while annual precipitation has decreased by about 10%. Depending on the location, dynamics of temperature and precipitation changes differ. Melting of the permafrost area is expected to have ef-fects on bridge and road constructions as well as buildings. To adapt to climate change in the water sector, Mongolia pri-oritizes the formulation and stabilization of a water resources management policy. Water saving and protection activities are also promoted.29
OB river Basin30
The basin of the Ob River is shared by China, Kazakhstan, Mongolia and the Russian Federation.
The Irtysh/Ertis is the main (first order) tributary of the Ob. The Tobol and the Ishim/Esil are transboundary tributaries of the Irtysh/Ertis.
Basin of the Ob River
Country Area in the country (km2) Country’s share (%)Russian Federation 2 192 700 73.77Kazakhstan 734 543 24.71China 45 050 1.51Mongolia 200 0.01Total 2 972 493
In the Russian part of the Ob Basin, surface water resources are es-timated at 408.3 km3/year and groundwater resources at 0.47 km3.
Pressure, status and responsesIn addition to the pressure factors in the basin of the for Irtysh/Ertis and its tributaries (see separate assessment), exploitation
of oil and gas in the Russian Federation exerts pressure on the water resources in the Middle and Lower Ob.
irtYsh/ertis suB-Basin31 The basin of the 4,248-km long river Irtysh/Ertis32 is shared by the Russian Federation, Kazakhstan, and, with a very small share, by China and Mongolia. The river has its source in the Altai Mountains in Mongolia (at an altitude of 2,500 m), and discharges into the Ob. The average elevation of the basin in the Russian Federation is of the order of 250–285m a.s.l. The character of the basin varies from plain to high-mountain. The Tobol and the Ishim are transboundary tributaries of the Irtysh/Ertis River.
Sub-basin of the Irtysh/Ertis River
Country Area in the country (km2) Country’s share (%)Russian Federation 726 000 67Kazakhstan 316 472 29 China and Mongolia 45 250 4Total 1 087 722
Sources: Scheme of complex use and protection of water resources in the Irtysh basin, volume 1, general characteristics of the Irtysh Basin, ZAO PO “Sovintervod”, Moscow, 2009; Scheme of complex use and protection of water resources in the basin of the Irtysh River. Consolidated Note 2005.
Hydrology and hydrogeologySurface water resources in Kazakhstan’s part of the Irtysh/Ertis Basin are estimated at 33.66 km3/year (out of which 7.8 km3/year is incoming water from outside the territory of Kazakh-stan). Explored exploitable groundwater resources in Kazakh-stan’s part of the basin are estimated at 2.967 km3/year.
In Kazakhstan, a cascade of large hydroelectric power stations (Bukhtarminskaya, Shulbinskaya, Ust-Kamenogorskaya and others) is used to regulate the flow.
PressuresIn the upper reaches in Mongolia, the Irtysh/Ertis is one of the cleanest and least mineralized rivers in the world.
Pressure factors in China include industry and water with-drawal for irrigated agriculture (e.g. through the more than 300-km long canal from the Black Irtysh33 to Karamay).
In the mid-1990s, the Irtysh/Ertis in Kazakhstan was heav-ily affected by pollution from the metal-processing industry, discharge of untreated water from mines, ore enrichment, and leakages from tailing dams, as well as wastewater discharges from Ust-Kamenogorsk. In the past years, several measures have been taken to improve the situation by Kazakh authori-ties, also with the support of international organizations.
Total withdrawal and withdrawals by sector in the Ob River Basin
Country YearTotal withdrawal
×106 m3/year Agricultural % Domestic % Industry % Energy % Other %Russian Federation 2003 923.4a N/A N/A N/A N/A N/AKazakhstan 2003, 2004 3 530.6b 30.4 8.4 50.8 N/A 10.4
a The amount withdrawn by the Russian Federation is 70.3% surface water and 29.7% groundwater. The figure is the total withdrawal from all water bodies of the Ob Basin. b The figure for Kazakhstan consists of withdrawals from tributaries of the Ob, the Irtysh, Tobol and Ishim.
29 Source: Mongolia: Assessment Report on Climate Change 2009. Ministry of Environment, Nature and Tourism, Mongolia. 2009.30 Based on information provided by the Russian Federation and the First Assessment.31 Based on information provided by Kazakhstan and the Russian Federation, and the First Assessment.32 The river is known as Irtysh in the Russian Federation, and as Ertis in Kazakhstan.33 The upstream part of the Irtysh flowing to Lake Zaysan is called Black Irtysh.
Chapter 1 Drainage basins of the White sea, barents sea anD Kara sea | 91
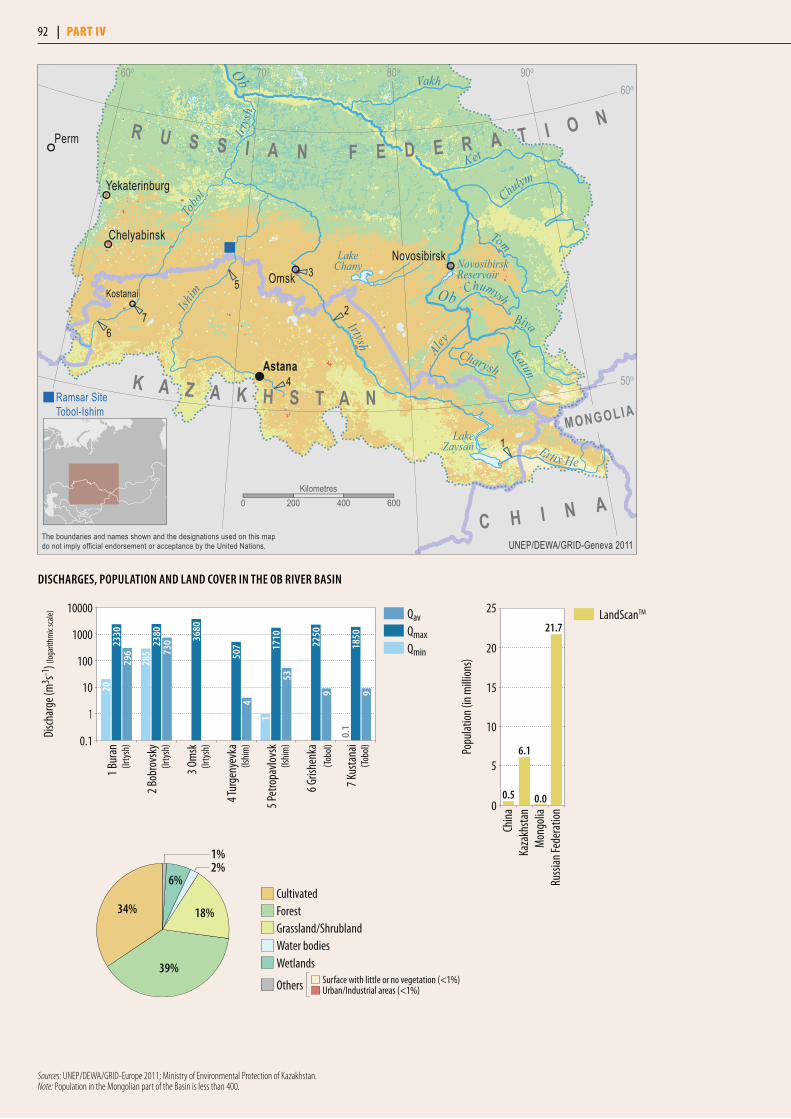
DISChARgES, pOpuLATIOn AnD LAnD COvER In ThE OB RIvER BASIn
7 Kus
tana
i
6 Gris
henk
a
5 Pet
ropa
vlovs
k
4 Tur
geny
evka
3 Om
sk
2 Bob
rovs
ky
1 Bur
an
Disc
harg
e (m
3 s-1) (
loga
rithm
ic sc
ale)
296
(Irty
sh)
(Irty
sh)
(Irty
sh)
(Ishi
m)
(Ishi
m)
(Tobo
l)
(Tobo
l)
730 36
80
2380
2330
507 17
10
2250
1850
20
285
1
4
53
9 9
0.1
QavQmaxQmin
0.1
10
1000
100
10000
1
Popu
latio
n (in
mill
ions
)
0
5
10
15
20
25
Russ
ian Fe
dera
tion
Mon
golia
Kaza
khsta
nCh
ina
0.5
6.1
0.0
21.7LandScanTM
1
2
3
4
5
67
Omsk
Perm
Yekaterinburg
NovosibirskChelyabinsk
Astana
Kostanai
Ramsar SiteTobol-Ishim
Ob
Tobo
lIsh
im
Ob
LakeChany
LakeZaysan
NovosibirskReservoir
BiyaKatun
Aley
Ertix He
Irtysh
Charysh
Chumysh
Vakh
Tom
Irtys
h
Ket
Chulym
K A Z A K H S T A N
C H I N A
MO NG O L I A
R U S S I A N F E D E R A T I O N60o
50o
60o 70o 80o 90o
0 200 400 600Kilometres
The boundaries and names shown and the designations used on this mapdo not imply official endorsement or acceptance by the United Nations. UNEP/DEWA/GRID-Geneva 2011
Sources: UNEP/DEWA/GRID-Europe 2011; Ministry of Environmental Protection of Kazakhstan. Note: Population in the Mongolian part of the Basin is less than 400.
2%1%
34%
39%
6%
18%
Surface with little or no vegetation (<1%)Urban/Industrial areas (<1%)
ForestGrassland/Shrubland
Others
Water bodiesWetlands
Cultivated
92 | part iv
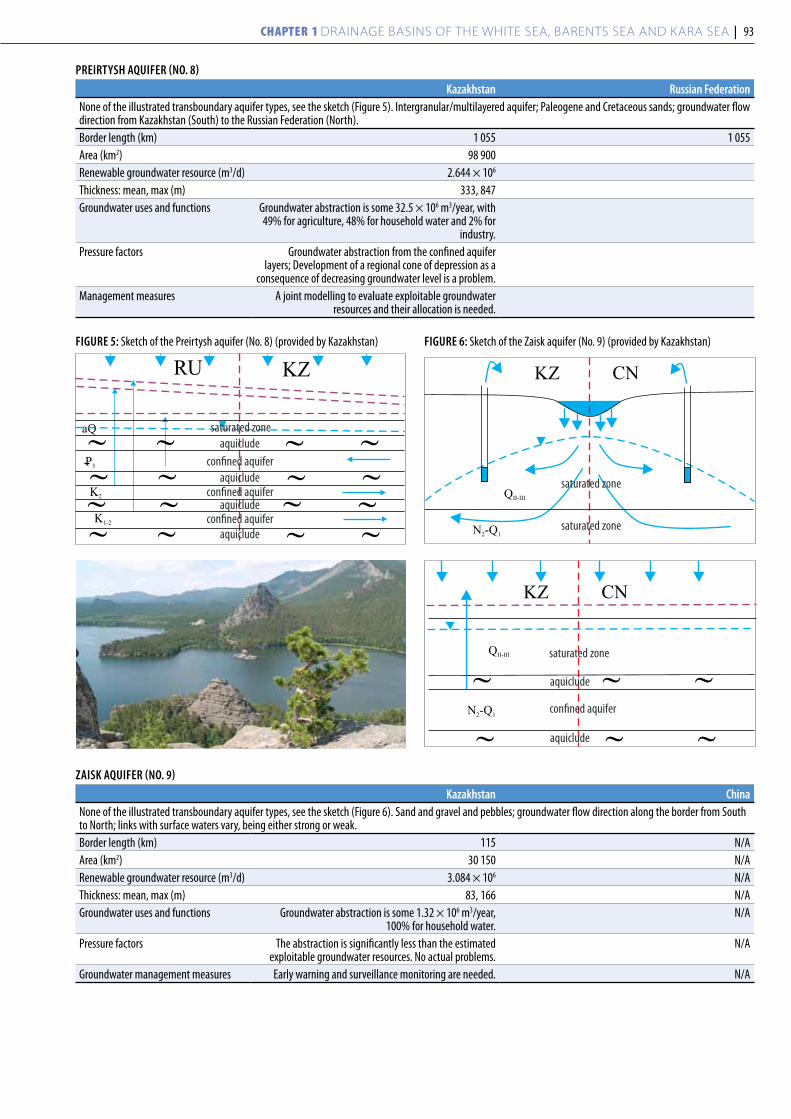
pREIRTYSh AquIFER (nO. 8)
kazakhstan Russian FederationNone of the illustrated transboundary aquifer types, see the sketch (Figure 5). Intergranular/multilayered aquifer; Paleogene and Cretaceous sands; groundwater flow direction from Kazakhstan (South) to the Russian Federation (North).Border length (km) 1 055 1 055Area (km2) 98 900Renewable groundwater resource (m3/d) 2.644 × 10⁶
Thickness: mean, max (m) 333, 847Groundwater uses and functions Groundwater abstraction is some 32.5 × 10⁶ m3/year, with
49% for agriculture, 48% for household water and 2% for industry.
Pressure factors Groundwater abstraction from the confined aquifer layers; Development of a regional cone of depression as a
consequence of decreasing groundwater level is a problem.Management measures A joint modelling to evaluate exploitable groundwater
resources and their allocation is needed.
aQ
KZRU
K1-2
K2
P3
saturated zone
confined aquifer
confined aquifer
confined aquifer
aquiclude
aquiclude
aquiclude
aquiclude
ZAISk AquIFER (nO. 9)
kazakhstan ChinaNone of the illustrated transboundary aquifer types, see the sketch (Figure 6). Sand and gravel and pebbles; groundwater flow direction along the border from South to North; links with surface waters vary, being either strong or weak. Border length (km) 115 N/AArea (km2) 30 150 N/ARenewable groundwater resource (m3/d) 3.084 × 10⁶ N/AThickness: mean, max (m) 83, 166 N/AGroundwater uses and functions Groundwater abstraction is some 1.32 × 10⁶ m3/year,
100% for household water.N/A
Pressure factors The abstraction is significantly less than the estimated exploitable groundwater resources. No actual problems.
N/A
Groundwater management measures Early warning and surveillance monitoring are needed. N/A
FIguRE 5: Sketch of the Preirtysh aquifer (No. 8) (provided by Kazakhstan) FIguRE 6: Sketch of the Zaisk aquifer (No. 9) (provided by Kazakhstan)
N -Q2 1
KZ CN
QII-III
N -Q2 1
QII-III
KZ CN
saturated zone
saturated zone
confined aquifer
saturated zone
aquiclude
aquiclude
Chapter 1 Drainage basins of the White sea, barents sea anD Kara sea | 93

The conflict between hydropower production and shipping has been increasing due to limited water resource availability, and due to such factors as retaining water in the reservoir of Shul’binsk in the summer for hydropower production.
The main natural factors resulting in adverse impacts from water on the population and economic infrastructure in the Russian part of the Irtysh/Ertis Basin are floods, ice dams, rise of water levels in lakes, water erosion and the reduction of river channel capacity.
Wastewater discharges to the Irtysh/Ertis in the Russian part of the basin were estimated at some 2,167 × 106 m3 in 2007. From 2002 to 2009, the volume of sewage discharge in total and of untreated sewage in the Omsk region in the Russian Federation has been decreasing fairly constantly.34
Status and transboundary impactsAt the monitoring station Boran, water entering the territory of Ka-zakhstan from China was classified as “clean” (class 2) in 2009. The concentration of total dissolved solids was 140 mg/l on average.
At the border with the Russian Federation, the water flowing from Kazakhstan was classified as “moderately polluted” (water quality class 3) in 2009. The concentration of total dissolved solids was 185 mg/l.
In the Russian part, the overall water quality was ranked as “very polluted” (class 4A) in 2007, according to the Russian classifica-tion. At the Tatarka monitoring station (17 km downstream from the border with Kazakhstan), water quality was classified as “pol-luted” (class 3b) in the same year.35 From 2006 to 2009, a general decrease has been observed in the concentrations of metals (copper, iron, magnesium and zinc). Phenol and oil product concentrations also decreased in the same period. Downstream from Omsk, the concentrations of these metals, phenols and oil products, as well as biochemical oxygen demand (BOD5) and chemical oxygen de-mand (COD), have been observed to increase towards the border of Omsk and Tyumen oblasts in the Russian Federation.36
TrendsWater quality in the Irtysh/Ertis tended to improve in the late 1990s and in the 2000s.
At the same time, industrial and agricultural production in the basin has increased in the 2000s, and this trend is predicted to continue.
tOBOl suB-Basin37
The sub-basin of the 1,591-km long river Tobol is shared by the Russian Federation and Kazakhstan. The river has its source be-tween the southern Ural and Turgay Plateau in Kostanai Oblast in northern Kazakhstan, and discharges into the Irtysh/Ertis River in the Tyumen Oblast (Russian Federation). The major transboundary tributaries are the Ubagan, Uy,38 Ayat, Sintashta39 and Toguzyak.
34 Annual Nature Protection Reports of Omsk Regional Government.35 Scheme of complex use and protection of water resources in the Irtysh River Basin. Book 2. Assessing the environmental status and key issues of water bodies of the
Irtysh Basin. ZAO PO Sovintervod, Moscow, 2009. 36 Annual Nature Protection Reports of Omsk Regional Government (2006-2009). 37 Based on information provided by Kazakhstan and the Russian Federation, and the First Assessment. 38 The river is known as Uy in the Russian Federation and as Ujem in Kazakhstan.39 The river is also known as the Sintasti (Zkelkuar).
Water quality classification of the Irtysh/Ertis in Kazakhstan
Location of observation on the Irtysh/Ertis
Water pollution indexa – water quality classification
parameters exceeding mAC multiplier of mAC exceedence2008 2009Boran village, at the border with China
0.47; class 2, “clean” 0.70; class 2, “clean”copper (2+) 1.39
Preirtysh, at the border with the Russian Federation
0.75; class 2, “clean” 1.07; class 3, “moderately polluted”
copper (2+) 1.8
total iron 1.75a The water pollution index is defined on the basis of the ratios of measured values and the maximum allowable concentration of the water-quality determinands.Source: Kazhydromet, Ministry of Environmental Protection of Kazakhstan.
Popu
latio
n (in
mill
ions
)
0
2
4
6
8
10
12
Russi
an Fe
dera
tion
Mon
golia
Kaza
khsta
nCh
ina
0.5
2.0
0.0
10.9 Country information/otherLandScanTM
Sources: UNEP/DEWA/GRID-Europe 2011; Ministry of Environmental Protection of Kazakhstan.Note: Population in the Mongolian part of the sub-basin is less than 400.
pOpuLATIOn In ThE IRTYSh/ERTIS SuB-BASIn
Total water withdrawal and withdrawals by sector in the Irtysh/Ertis sub-basin
Country YearTotal withdrawal
×106 m3/year Agricultural % Domestic % Industry % Energy % Other %Russian Federation 2007 2 785a N/A N/A N/A N/A N/AKazakhstan 2003 3 166 31.5 5 52.9 - 10.6
2010 4 100 34.2 5 45.2 - 15.6a Of this total amount, some 77.7% (2,600 × 106 m3/year) was surface water and 22.3% (620 × 106 m3/year) was groundwater.
94 | part iv

The basin area has a lowland character, with an elevation from 100 to 200 m a.s.l.
Sub-basin of the Tobol River
Country Area in the country (km2) Country’s share (%)Russian Federation 305 000 74.4Kazakhstan 105 110 25.6
Total 410 110Sources: Scheme of complex use and protection of water resources in the basin of the Irtysh River, volume 1, general characteristics of the Irtysh Basin, ZAO PO “Sovintervod”, Moscow, 2009; Integrated River Basin Management Plan, Kazakhstan, 2006.
Hydrology and hydrogeologyIn the part of the basin that is Kazakhstan’s territory, surface water resources are estimated at 777 × 106 m3/year (average for the years from 1938 to 2004), and groundwater resources at 286 × 106 m3/year.
The mean annual flow of the Tobol is 0.48 km3/year (15.2 m3/s). There are 624 reservoirs in the basin, providing drinking water and serving flow regulation.
FIguRE 8: Sketch of the North Kazakhstan aquifer (No. 10) (provided by Kazakhstan)
PressuresParts of the Tobol basin, for example in the Ural region and in the area of natural salt lakes in the Ubagan River sub-basin, have mineral rich bed-rock or high salinity soils that cause el-evated concentrations of certain metals and other elements.
Industry and agriculture are developed in the sub-basin. Water management infrastructure and works, including withdraw-als, inter-basin water transfer, operation of dams and reservoirs (Karatomarsk in particular), as well as amelioration work on agricultural and forested land, also impact on the flow and wa-ter availability.
In Kazakhstan, the main anthropogenic pollution sources are municipal and industrial (mining and ore processing) waste-waters, residual pollution from closed-down chemical plants in Kostanai, accidental water pollution with mercury from gold mining in the Toguzyak sub-basin, and heavy metals from other tributaries to the Tobol. Diffuse pollution from fertilizers in agriculture has been decreasing, but remains a problem. Spring floods result in polluted surface run-off.
In the Russian part, the main sources of pollution of surface waters are wastewater discharges from settlements where waste-water treatment does not meet the regulatory requirements. Di-version of water from the river, inter-basin transfer, operation of dams and reservoirs, and drainage works on agricultural land and forested areas are also among the pressures.
Erosion by water is intensified during periods of flooding, causing, for example, destruction of river banks in the Kurgan and Chely-abinsk regions in the Russian Federation.
nORTh-kAZAkhSTAn AquIFER (nO. 10)
kazakhstan Russian FederationNone of the illustrated transboundary aquifer types, see sketch (Figure 7). Intergranular/multilayered aquifer (confined), sand and gravel; groundwater flow direction from Kazakhstan (South) to the Russian Federation (North); links with surface waters. The aquifer extends to the basins of both Tobol and Ishim (in Kazakhstan the aquifer is within the Tobol Basin).Border length (km) 1 840Area (km2) 147 600Groundwater uses and functions Groundwater abstraction about 47.3 × 10⁶ m3/year (2008).
Some 80% of it was for domestic use and 20% for industry.
N-Q
K
P
KZ RU
saturated zone
confined aquifer
confined aquifer
aquiclude
aquiclude
aquiclude
Total water withdrawal and withdrawals by sector in the Tobol sub-basin
Country YearTotal withdrawal
×106 m3/year Agricultural % Domestic % Industry % Energy % Other %Russian Federation 2009 2 090.87 N/A N/A N/A N/A N/AKazakhstan 2004 151.62 17 31.65 50.92 - 0.43
2010a 182.12 28.65 26.9 44.2 - 0.25a The figures of Kazakhstan for 2010 are estimates. Withdrawals in 2015 are expected to be more than 20% higher than in 2010. Withdrawals for household water and for industrial purposes are predicted to decrease, and
agricultural withdrawals are expected to increase.
Chapter 1 Drainage basins of the White sea, barents sea anD Kara sea | 95
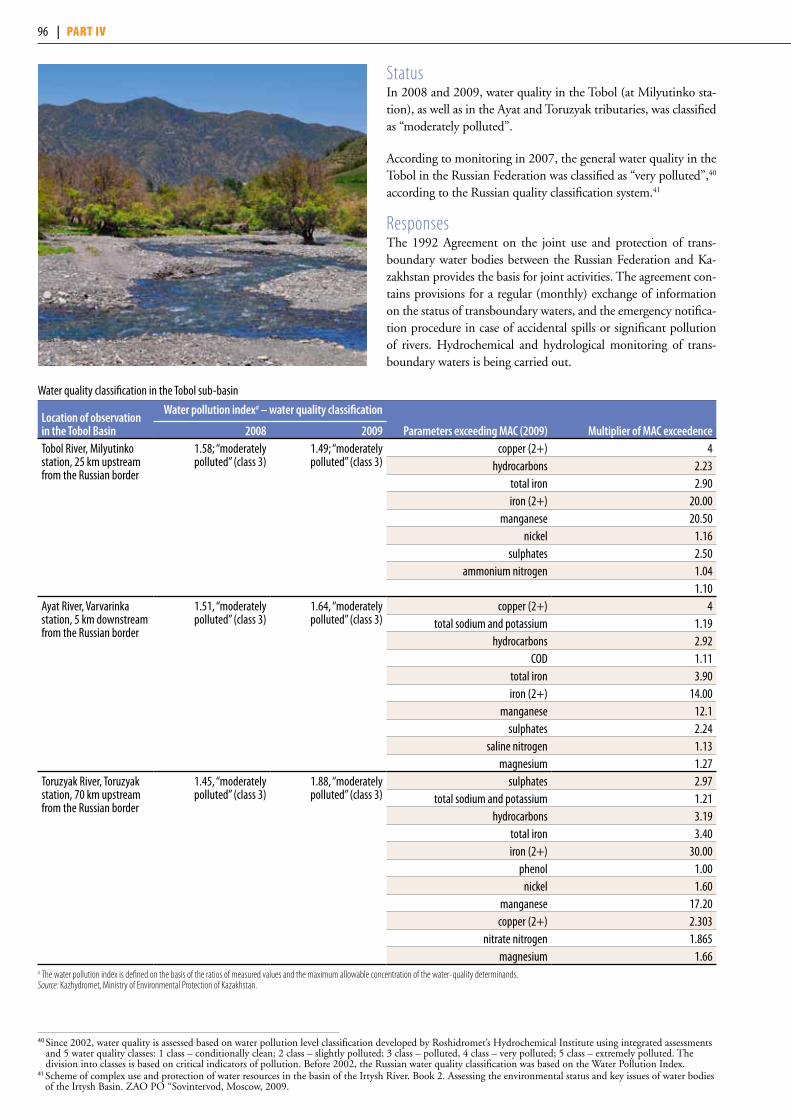
StatusIn 2008 and 2009, water quality in the Tobol (at Milyutinko sta-tion), as well as in the Ayat and Toruzyak tributaries, was classified as “moderately polluted”.
According to monitoring in 2007, the general water quality in the Tobol in the Russian Federation was classified as “very polluted”,40
according to the Russian quality classification system.41
ResponsesThe 1992 Agreement on the joint use and protection of trans-boundary water bodies between the Russian Federation and Ka-zakhstan provides the basis for joint activities. The agreement con-tains provisions for a regular (monthly) exchange of information on the status of transboundary waters, and the emergency notifica-tion procedure in case of accidental spills or significant pollution of rivers. Hydrochemical and hydrological monitoring of trans-boundary waters is being carried out.
Water quality classification in the Tobol sub-basin
Location of observation in the Tobol Basin
Water pollution indexa – water quality classification
parameters exceeding mAC (2009) multiplier of mAC exceedence2008 2009Tobol River, Milyutinko station, 25 km upstream from the Russian border
1.58; “moderately polluted” (class 3)
1.49; “moderately polluted” (class 3)
copper (2+) 4hydrocarbons 2.23
total iron 2.90iron (2+) 20.00
manganese 20.50nickel 1.16
sulphates 2.50ammonium nitrogen 1.04
1.10Ayat River, Varvarinka station, 5 km downstream from the Russian border
1.51, “moderately polluted” (class 3)
1.64, “moderately polluted” (class 3)
copper (2+) 4total sodium and potassium 1.19
hydrocarbons 2.92COD 1.11
total iron 3.90iron (2+) 14.00
manganese 12.1sulphates 2.24
saline nitrogen 1.13magnesium 1.27
Toruzyak River, Toruzyak station, 70 km upstream from the Russian border
1.45, “moderately polluted” (class 3)
1.88, “moderately polluted” (class 3)
sulphates 2.97total sodium and potassium 1.21
hydrocarbons 3.19total iron 3.40iron (2+) 30.00
phenol 1.00nickel 1.60
manganese 17.20copper (2+) 2.303
nitrate nitrogen 1.865magnesium 1.66
a The water pollution index is defined on the basis of the ratios of measured values and the maximum allowable concentration of the water-quality determinands.Source: Kazhydromet, Ministry of Environmental Protection of Kazakhstan.
40 Since 2002, water quality is assessed based on water pollution level classification developed by Roshidromet’s Hydrochemical Institute using integrated assessments and 5 water quality classes: 1 class – conditionally clean; 2 class – slightly polluted; 3 class – polluted, 4 class – very polluted; 5 class – extremely polluted. The division into classes is based on critical indicators of pollution. Before 2002, the Russian water quality classification was based on the Water Pollution Index.
41 Scheme of complex use and protection of water resources in the basin of the Irtysh River. Book 2. Assessing the environmental status and key issues of water bodies of the Irtysh Basin. ZAO PO “Sovintervod, Moscow, 2009.
96 | part iv

TrendsPollution in the Tobol in Kazakhstan has been increasing since 2001, and water quality has been downgraded from class 2 (clean) to class 3 (moderately polluted). Pollution has an adverse impact on drinking-water supply.
ishim/esil suB-Basin42
The sub-basin of the Ishim/Esil43 is shared by Kazakhstan and the Russian Federation. The river originates in the Niaz moun-tains in Kazakhstan, and flows into the Irtysh/Ertis River.
Sub-basin of the Ishim/Esil River
Country Area in the country (km2) Country’s share (%)Russian Federation 34 000 18Kazakhstan 155 000 82
Total 189 000Sources: Scheme of complex use and protection of water resources in the basin of the Irtysh River, volume 1, general characteristics of the Irtysh Basin, ZAO PO “Sovintervod”, Moscow, 2009; Integrated River Basin Management Plan.
Hydrology and hydrogeologyThe surface water resources in the part of the basin that is Ka-zakhstan’s territory are estimated at 2.59 km3/year, and ground-water resources at 0.165 km3/year.
In the Russian part, surface water resources are estimated at 2,630 m3/year and groundwater resources at 48.329 m3/year,
representing 5.9 m3/year/capita.44
There are 16 reservoirs, with a volume exceeding 1 million m3 on the Ishim/Esil River; all of them in Kazakhstan. The guaranteed minimum flow at the border section (2.4 m3/s) is reflected in the operational rules for the joint management of two reservoirs (Seg-rejevsk and Petropavlovsk reservoirs). A specific working group under the auspices of the joint Russian-Kazakh Commission deals with water-quantity issues, including flow regulation.
PressuresIn the settlements in the Ishim/Esil Basin in the Russian Feder-ation, the requirements for water supply sources and treatment of municipal and industrial sewage are not met.
StatusWater quality in the Ishim/Esil at the Dolmatovo station (689 km from the river mouth) in Kazakhstan was classified as “mod-erately polluted” (Water Pollution Index 1.70). A concentra-tion exceeding the Maximum Allowable Concentration was ob-served for copper (5.02 times MAC, zinc 1.08 MAC, sulphate 1.30 MAC and total iron 1.43 MAC).
From the mid-1990s onwards, the water quality has been de-scribed as “clean” (class 2) or “moderately polluted” (class 3).
Overall assessment of water quality of the Ishim/Esil in the Russian Federation was classified in 2007 as “very polluetd” (class 4B) according to the Russian classification system (water pollution index 4.9).45
42 Based on information provided by Kazakhstan and the Russian Federation, and the First Assessment. 43 The river is known as Ishim in the Russian Federation and as Esil in Kazakhstan. 44 Scheme of complex use and protection of water resources of the Ishim. Volumes 1 (Summary of the explanatory note, 2004), 3 (water resources and their current
status, 2004) and 6 (water management and protection activities, 2005), ZAO PO “Sovintervod, Moscow. 45 Scheme of complex use and protection of water resources in the basin of the Irtysh River. Book 2. Assessing the environmental status and key issues of water bodies
basin. Irtysh. ZAO PO “Sovintervod, Moscow, 2009. 46 Source: Ramsar Information Sheet. 47 The Emets River is a tributary of the Vagay which is a tributary of the Irtysh.
Total water withdrawal and withdrawals by sector in the Ishim/Esil sub-basin
Country YearTotal withdrawal
×106 m3/year Agricultural % Domestic % Industry % Energy % Other %Russian Federation 2009 12.26 N/A N/A N/A N/A N/AKazakhstan 2004 212.97 22 42.4 20.3 - 15.3
2010a 33.05 11.9 56.5 30.7 - 0.9a The figures of Kazakhstan for 2010 are estimates.
tOBOl-ishim FOrest-steppe46 General description of the wetland The site covers 217,000 ha, and is located in the Ishim prov-ince of the forest-steppe zone (birch and aspen forests inter-spersed with meadows and steppe) on the Western Siberian Plain (average elevation 138 m a.s.l.), 190-250 km south of the city of Tumen and 7 km to the south of the town of Ishim. Characteristic features of the landscape include enclosed lakes, linear formations such as gently sloping ridges, dry river-beds, depressions and wide shallow river valleys (the Ishim/Esil and Emets47). The wetlands are represented mainly by lakes (which cover an area of 95,000 ha) and small rivers with marshy catch-ments, but also by forested peatlands, salt inland marshes and wet meadows. The lakes vary in salinity from 1 g/l (freshwater), dominating in the northwest, to more than 25 g/l in a south-easterly direction as climatic conditions become more arid and
Chapter 1 Drainage basins of the White sea, barents sea anD Kara sea | 97
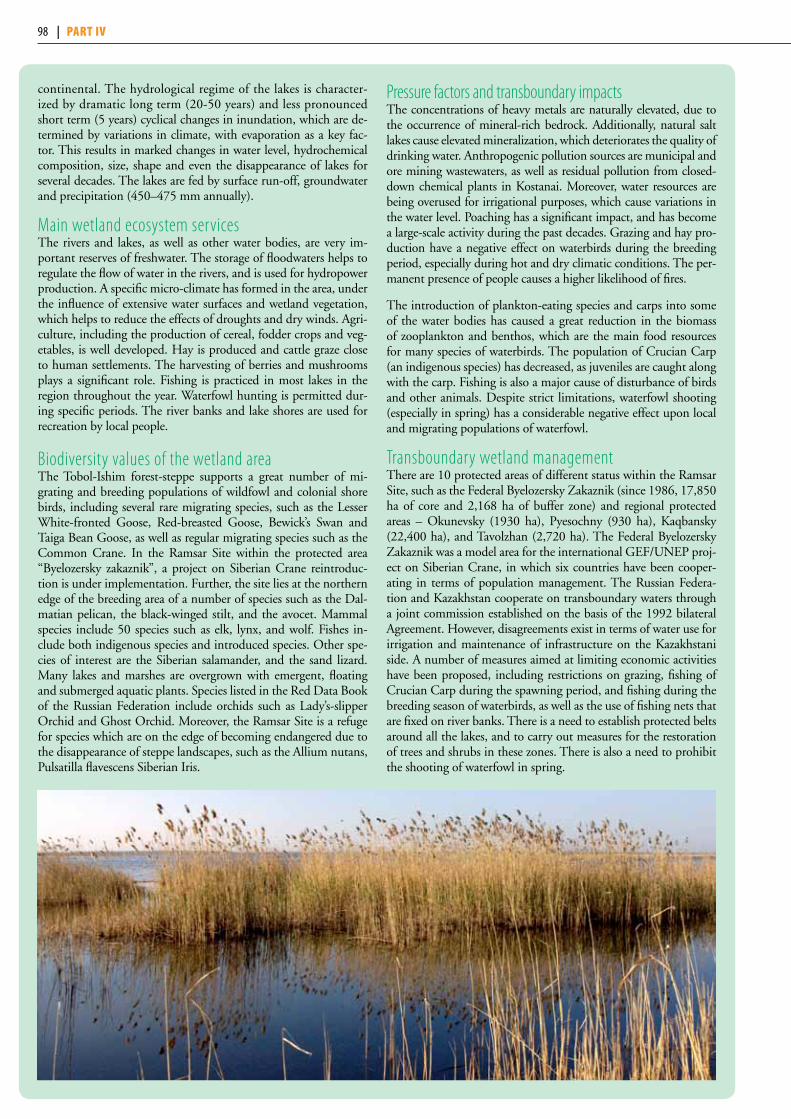
continental. The hydrological regime of the lakes is character-ized by dramatic long term (20-50 years) and less pronounced short term (5 years) cyclical changes in inundation, which are de-termined by variations in climate, with evaporation as a key fac-tor. This results in marked changes in water level, hydrochemical composition, size, shape and even the disappearance of lakes for several decades. The lakes are fed by surface run-off, groundwater and precipitation (450–475 mm annually).
Main wetland ecosystem services The rivers and lakes, as well as other water bodies, are very im-portant reserves of freshwater. The storage of floodwaters helps to regulate the flow of water in the rivers, and is used for hydropower production. A specific micro-climate has formed in the area, under the influence of extensive water surfaces and wetland vegetation, which helps to reduce the effects of droughts and dry winds. Agri-culture, including the production of cereal, fodder crops and veg-etables, is well developed. Hay is produced and cattle graze close to human settlements. The harvesting of berries and mushrooms plays a significant role. Fishing is practiced in most lakes in the region throughout the year. Waterfowl hunting is permitted dur-ing specific periods. The river banks and lake shores are used for recreation by local people.
Biodiversity values of the wetland areaThe Tobol-Ishim forest-steppe supports a great number of mi-grating and breeding populations of wildfowl and colonial shore birds, including several rare migrating species, such as the Lesser White-fronted Goose, Red-breasted Goose, Bewick’s Swan and Taiga Bean Goose, as well as regular migrating species such as the Common Crane. In the Ramsar Site within the protected area “Byelozersky zakaznik”, a project on Siberian Crane reintroduc-tion is under implementation. Further, the site lies at the northern edge of the breeding area of a number of species such as the Dal-matian pelican, the black-winged stilt, and the avocet. Mammal species include 50 species such as elk, lynx, and wolf. Fishes in-clude both indigenous species and introduced species. Other spe-cies of interest are the Siberian salamander, and the sand lizard. Many lakes and marshes are overgrown with emergent, floating and submerged aquatic plants. Species listed in the Red Data Book of the Russian Federation include orchids such as Lady’s-slipper Orchid and Ghost Orchid. Moreover, the Ramsar Site is a refuge for species which are on the edge of becoming endangered due to the disappearance of steppe landscapes, such as the Allium nutans, Pulsatilla flavescens Siberian Iris.
Pressure factors and transboundary impactsThe concentrations of heavy metals are naturally elevated, due to the occurrence of mineral-rich bedrock. Additionally, natural salt lakes cause elevated mineralization, which deteriorates the quality of drinking water. Anthropogenic pollution sources are municipal and ore mining wastewaters, as well as residual pollution from closed-down chemical plants in Kostanai. Moreover, water resources are being overused for irrigational purposes, which cause variations in the water level. Poaching has a significant impact, and has become a large-scale activity during the past decades. Grazing and hay pro-duction have a negative effect on waterbirds during the breeding period, especially during hot and dry climatic conditions. The per-manent presence of people causes a higher likelihood of fires.
The introduction of plankton-eating species and carps into some of the water bodies has caused a great reduction in the biomass of zooplankton and benthos, which are the main food resources for many species of waterbirds. The population of Crucian Carp (an indigenous species) has decreased, as juveniles are caught along with the carp. Fishing is also a major cause of disturbance of birds and other animals. Despite strict limitations, waterfowl shooting (especially in spring) has a considerable negative effect upon local and migrating populations of waterfowl.
Transboundary wetland managementThere are 10 protected areas of different status within the Ramsar Site, such as the Federal Byelozersky Zakaznik (since 1986, 17,850 ha of core and 2,168 ha of buffer zone) and regional protected areas – Okunevsky (1930 ha), Pyesochny (930 ha), Kaqbansky (22,400 ha), and Tavolzhan (2,720 ha). The Federal Byelozersky Zakaznik was a model area for the international GEF/UNEP proj-ect on Siberian Crane, in which six countries have been cooper-ating in terms of population management. The Russian Federa-tion and Kazakhstan cooperate on transboundary waters through a joint commission established on the basis of the 1992 bilateral Agreement. However, disagreements exist in terms of water use for irrigation and maintenance of infrastructure on the Kazakhstani side. A number of measures aimed at limiting economic activities have been proposed, including restrictions on grazing, fishing of Crucian Carp during the spawning period, and fishing during the breeding season of waterbirds, as well as the use of fishing nets that are fixed on river banks. There is a need to establish protected belts around all the lakes, and to carry out measures for the restoration of trees and shrubs in these zones. There is also a need to prohibit the shooting of waterfowl in spring.
9998 | part iv
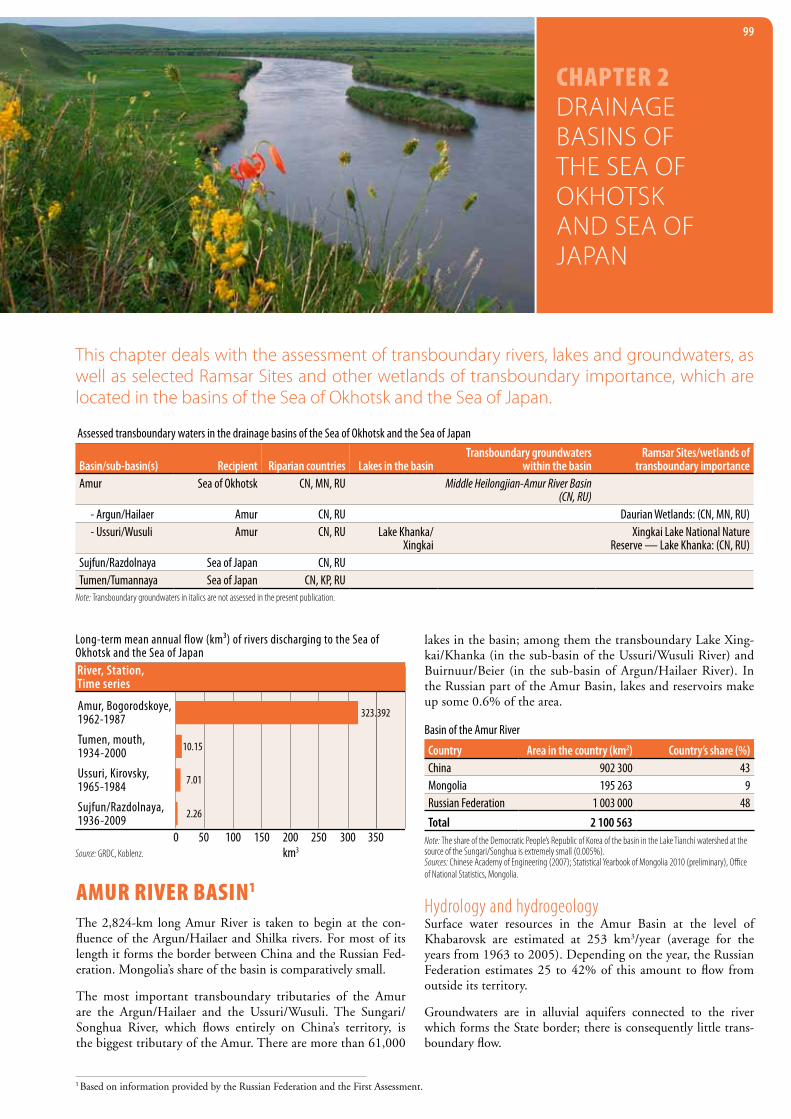
amur river Basin1
The 2,824-km long Amur River is taken to begin at the con-fluence of the Argun/Hailaer and Shilka rivers. For most of its length it forms the border between China and the Russian Fed-eration. Mongolia’s share of the basin is comparatively small.
The most important transboundary tributaries of the Amur are the Argun/Hailaer and the Ussuri/Wusuli. The Sungari/Songhua River, which flows entirely on China’s territory, is the biggest tributary of the Amur. There are more than 61,000
lakes in the basin; among them the transboundary Lake Xing-kai/Khanka (in the sub-basin of the Ussuri/Wusuli River) and Buirnuur/Beier (in the sub-basin of Argun/Hailaer River). In the Russian part of the Amur Basin, lakes and reservoirs make up some 0.6% of the area.
Basin of the Amur River
Country Area in the country (km2) Country’s share (%)China 902 300 43Mongolia 195 263 9Russian Federation 1 003 000 48
Total 2 100 563Note: The share of the Democratic People’s Republic of Korea of the basin in the Lake Tianchi watershed at the source of the Sungari/Songhua is extremely small (0.005%).Sources: Chinese Academy of Engineering (2007); Statistical Yearbook of Mongolia 2010 (preliminary), Office of National Statistics, Mongolia.
Hydrology and hydrogeologySurface water resources in the Amur Basin at the level of Khabarovsk are estimated at 253 km3/year (average for the years from 1963 to 2005). Depending on the year, the Russian Federation estimates 25 to 42% of this amount to flow from outside its territory.
Groundwaters are in alluvial aquifers connected to the river which forms the State border; there is consequently little trans-boundary flow.
Chapter 2 Drainage basins of the sea of oKhotsK anD sea of JaPan
this chapter deals with the assessment of transboundary rivers, lakes and groundwaters, as well as selected ramsar sites and other wetlands of transboundary importance, which are located in the basins of the sea of okhotsk and the sea of Japan.
Assessed transboundary waters in the drainage basins of the Sea of Okhotsk and the Sea of Japan
Basin/sub-basin(s) Recipient Riparian countries Lakes in the basinTransboundary groundwaters
within the basin Ramsar Sites/wetlands of
transboundary importanceAmur Sea of Okhotsk CN, MN, RU Middle Heilongjian-Amur River Basin
(CN, RU)- Argun/Hailaer Amur CN, RU Daurian Wetlands: (CN, MN, RU)- Ussuri/Wusuli Amur CN, RU Lake Khanka/
XingkaiXingkai Lake National Nature
Reserve — Lake Khanka: (CN, RU)Sujfun/Razdolnaya Sea of Japan CN, RUTumen/Tumannaya Sea of Japan CN, KP, RU
Note: Transboundary groundwaters in italics are not assessed in the present publication.
1 Based on information provided by the Russian Federation and the First Assessment.
99
Amur, Bogorodskoye,1962-1987
Tumen, mouth,1934-2000
Ussuri, Kirovsky,1965-1984
Sujfun/Razdolnaya,1936-2009
0 50 100 150 200 250 300 350km3
10.15
7.01
2.26
323.392
River, Station,Time series
Source: GRDC, Koblenz.
Long-term mean annual flow (km³) of rivers discharging to the Sea of Okhotsk and the Sea of Japan

Pressures and statusIn China part of the main pressures on the basin are from agricul-ture (affecting both quality and quantity), industrial pollution, flow regulation by hydropower dams, mining, sewage and waste management in cities, wetland degradation and water withdraw-als in dryer western part of the basin. Pressures are most devel-oped in the Sungari/Songhua sub-basin.2
The pollution load from the Argun/Hailaer, Sungari/Songhua and Ussuri/Wusuli impacts on the status of the Amur the most.
The waters of the Sungari/Songhua River are the most significant sources of pollution in the middle part of the Amur basin, and water quality has continued to deteriorate. Chemical production
along the river in particular has negatively affected water qual-ity, with pollution by oil products and their derivatives, phenols, pesticides and herbicides; industrial accidents have added to this.
ResponsesManagement measures related to riverbed stabilization, limiting erosion, restriction of activities in water protection zones, as well as wastewater and storm water treatment, have been identified in the Russian Federation as key in achieving good status of waters in the Amur Basin. River bank protections are being built on the Amur in 2011 in the town Blagoveshchensk.
In the Russian area of the Amur Basin, there are 651 protected areas — including ones for water protection purposes — with a total area
5
3
1
2 4
Vladivostok
Ulaanbaatar
Qiqihar
Harbin
Changchun JilinSapporo
ShenyangFushun
Ulan-Ude Chita
Khabarovsk
Ch’ongjin
Ramsar Sites1 Daurian Wetlands2 Xingkai Lake/Lake Khanka
2
1
Amur
AmurShilka
OnonIngoda
Argu
n
Ussu
ri
LakeKhanka
S E A O F
J A PA N
SEA OFOKHOTSKZeya
Reservoir
Zeya
Bureya
Amgun
Song
hua
Nen
Tumen
Sujfun
C H I N A
KP
M O N G O L I A
JA
PA
N
R U S S I A N F E D E R A T I O N
45o
55o
120o
110o
130o
140o
UNEP/DEWA/GRID-Geneva 2011The boundaries and names shown and the designations used on this mapdo not imply official endorsement or acceptance by the United Nations.
0 200 400 600Kilometres
1
10
100
10000
1000
100000
4 Kha
baro
vsk
3 Kiro
vsk
2 Pas
hkov
o
1 Olo
cha
Disc
harg
e (m
3 s-1) (
loga
rithm
ic sc
ale)
361
204
90
2100
044
40
1344
217
2550
0
(Arg
un)
(Am
ur)
(Uss
uri)
(Am
ur)
2
8360
QavQmaxQmin
4360
1%1%2%
Urban/Industrial areas (<1%)Wetlands (<1%)
CultivatedForestGrassland/ShrublandSurface with little or no vegetationWater bodies
Others
20%
57%
19%
Sources: UNEP/DEWA/GRID-Europe 2011; Chinese Academy of Engineering, 2007; Office of National Statistics, Mongolia, 2010.Note: Population in the Mongolian part of the Basin is approximately 10,000.
DISChARgES, pOpuLATIOn AnD LAnD COvER In ThE AmuR RIvER BASIn
2 Source: On Some Strategic Questions in water and land resource allocation, environment and sustainable development in North East China. Summary Report. Shen Guo Fang, et al. (eds) Chinese Academy of Engineering. Chinese Academy of Engineering Publishing, Beijing.), 2007. Volume: Water Resources pp 7-8.
0.1
1
10
1000
100
10000
5 Ter
ehov
ka57
8071
(Suj
fun)
0.25
QavQmaxQmin
Disc
harg
e (m
3 s-1) (
loga
rithm
ic sc
ale)
Popu
latio
n (in
mill
ions
)
0
10
20
30
40
50
60
70
80
Russ
ian Fe
dera
tion
Mon
golia
Chin
a
70.0
0.03.8
Country information/other
100 | part iv

Total water withdrawal and withdrawals by sector in the Amur Basin
Country YearTotal withdrawal
×106 m3/year Agricultural % Domestic % Industry % Energy % Other %
China 2003 35 500 69 10 21 a -2030 53 180 74b 9 17 a -
Russian Federation 2010 1 179 21.6 26.8 46.3 38.6a 5.3a Included in industry. b Expected increase in water for agriculture in China partly related to plans to convert much of upland cropland into irrigated paddy-fields. Note: The share of groundwater of the total water use in the Russian Federation’s part of the basin is about 37%.Source (information on China): Chinese Academy of Engineering. On Some Strategic Questions in water and land resource allocation, environment and sustainable development in North East China. Summary Report. Shen Guo Fang, et al. (eds) Chinese Academy of Engineering. Chinese Academy of Engineering Publishing, Beijing.), 2007. Volume: Water Resources pp 7-8.
3 Source: WWF-IUCN database on protected areas. 4 Source: The Songhua River Spill, China, December 2005 - Field Mission Report. UNEP. 5 Source: ADB Technical Assistance Project on Songhua River Water Quality and Pollution Control Management 2005. 6 Based on information provided by the Russian Federation and the First Assessment.
of 117,224 km2 (11.7% of the Russian area of the basin). In Mon-golia protected areas occupy 24,560 km2 and in China 142,630 km2 (about 13% and 16% of the Mongolian and Chinese areas of the basin, respectively).3
Since 2005, when a major accidental spill in the upper Sungari/Songhua River4 draw attention to pressing problems, China has implemented a comprehensive programme to reduce industrial and municipal pollution, with considerable investment from central and local governments. However, up to 2005, a significant share of water pollution in the Sungari/Songhua came from non-point sources.5
A Chinese-Russian joint commission operates on the basis of the 2008 Agreement between the countries concerning rational use and protection of transboundary waters.
TrendsImprovement of the ecological and chemical status of the river depends heavily on pollution control in China.
argun/hailaer suB-Basin6
The 1,620-km long Argun/Hailaer River originates in China. The upper part of the Argun in China is called Hailaer. After the Mutnaya Channel connects it to the Dalai/Hulun Lake, for 940 km the river act as the Sino-Russian border and finally, after confluence with the River Shilka, forms the Amur River.
The basin has a hilly character, with the mean elevation in the range from 530 to 600 m a.s.l.
Hydrology and hydrogeologyGroundwaters are in alluvial aquifers connected to the river which makes up the State border, consequently there is little transboundary flow.
PressuresThe Russian Federation assesses as severe the pollution of the river from industrial discharges to the river in the Chinese area of the basin, which occur regularly during wintertime between the
villages of Molokanka and Kuti.
Sub-basin of the Argun/Hailaer River
Country Area in the country (km2) Country’s share (%)China 164 304 69Russian Federation 49 100 21Mongolia 23 443 10
Total 236 847 Sources: On Some Strategic Questions in water and land resource allocation, environment and sustainable development in North East China. Summary Report. Shen Guo Fang, et al. (eds) Chinese Academy of Engineering, Chinese Academy of Engineering Publishing, Beijing. 2007 Volume: Water Resources pp 7-8; Statistical Yearbook of Mongolia 2010 (preliminary), Office of National Statistics, Mongolia.
In 2008, a canal was built in China for transferring some 1.05 km3/year from the river into Dalai/Hulun Lake (see box on the Daurian wetlands for details on pressures).
Status and responsesCompared with the mid-1990s, deterioration of water quality in the Russian Federation downstream from the border with China is demonstrated by increased concentrations of copper, zinc, phenols and oil products in the river.
The overall water quality in the river downstream from the border with China has been classified according to the Russian classification as “polluted” or “very polluted”.
In 2006, an agreement was signed between adjacent provinces of the Russian Federation and China on cooperation related to the protection of water quality and the ecological status of the Argun/Hailaer River, and a plan for joint water quality moni-toring was approved.
TrendsAs described in the box on the Daurian wetlands, new water infrastructure projects are planned for the river in China.
The Russian Federation predicts its water withdrawal to de-crease less than 4% in the period from 2010 to 2012, compared with the withdrawal in 2009. The percentages of the different sectors are not expected to change markedly.
Total water withdrawal and withdrawals by sector in the Argun/Hailaer sub-basin
Country YearTotal withdrawal
×106 m3/year Agricultural % Domestic % Industry % Energy % Other %
China 2003 200 40 20 40 - -2030 970 60 10 30 - -
Russian Federation 2010 63.44 0.02 30.8 66.2 4.1 3.0Note: Groundwater is not really used in the Russian part of the basin.
Chapter 2 Drainage basins of the sea of oKhotsK anD sea of JaPan | 101

daurian wetlands in the argun/hailaer suB-Basin7
General description of the wetland areaThe Argun/Hailaer River in the Dauria Steppe supports a glob-ally significant network of wetlands. The network includes the following transboundary wetlands: 1) Argun/Hailaer River transboundary floodplains8 (200,000 ha, shared by the Russian Federation and China, 40% and 60% of the area, respectively); 2) Dalai Lake National Nature Reserve (750,000 ha; in China, the site’s southern edge borders Mongolia on transboundary Buir Lake); and 3) Lake Buir and its surrounding wetlands9
(104,000 ha, of which the lake covers 61,500 ha).
The Transboundary stretch of the Argun/Hailaer from the con-fluence of the Mutnaya River10 to Priargunsk includes 2,000 km2 of wide floodplain, rich in biodiversity.
The large, shallow Dalai/Hulun Lake is the most prominent natural feature of the Argun/Hailaer River Basin in China. It receives the waters of the Kherlen and Wuershun rivers from Mongolia.
Buir Lake shared by Mongolia and China is fed by the Khalkh River, with headwaters in China.
The Dauria Steppe’s natural climate cycle, with a span of 25-40 years, is the major force shaping regional ecosystems and lifestyles. The pulsating Dalai/Hulun Lake body at maximum covers 2,300 km2, but is known to become a chain of shallow pools. “Pulsating” water bodies provide much higher (but un-even) biological productivity than stable ones as the increase in number of ecological niches as well as diversity in water bodies is of key importance in sustaining biodiversity and productivity of the ecosystems.
Main wetland ecosystem services The Daurian wetlands provide the following main ecosystem services: water retention in a semi-arid region; cyclical change in water levels, which sustains river floodplains and supports productivity and dynamic diversity of successional lake habi-tats; faunal refuges in times of drought; bird migratory routes and stop-over sites; high biological productivity, breeding areas for aquatic fauna; groundwater recharge and discharge; flood control, storm protection, flow regulation; sediment retention and nutrient cycling, accumulation of organic matter; and cli-mate regulation.
The three sites possess complementary qualities. For example, Buir Lake is the most important stable water body; Dalai/Hu-lun Lake has the greater temporal and spatial diversity in habi-tats; and the Argun/Hailaer floodplain provides more impor-tant faunal refuges in time of drought.
The Upper Argun/Hailaer River is the source of municipal wa-ter supply for southeast Zabaikalsky province in the Russian Federation and Hulubeier in China, as well as a water source for industry, mining enterprises and agriculture. Local farm-ing communities heavily depend on the Argun/Hailaer River
floodplain for watering for cattle, pastures and hayfields, which is most critical in dry years. Subsistence fishing and hunting are also widespread. In China, riverscapes are important assets for nature-based tourism. Both Dalai/Hulun and Buir lakes sus-tain important fishing enterprises, with just Dalai Lake Fishing Farm producing up to 10,000 tons of fish per year. The lake supports numerous tourist camps and resorts. The grasslands on the lakeshores support a total of 2 million livestock. Both lakes are important sources of water for livestock farms and mining enterprises. The Khalkh River supports municipalities and irrigated agriculture in both China and Mongolia. Alto-gether approximately 2 million people directly depend on wet-lands of the Argun/Hailaer River Basin.
Cultural values of the wetland areaThe nomadic lifestyle of Mongolian tribes is the key cultural value of the Dauria – and for centuries has been the most effec-tive socio-economic adaptation to climate fluctuations. Lakes and river valleys have many sacred places where locals worship deities and organize religious festivals. Many areas are associ-ated with Genghis Khan, and there are several archeological sites. Buir Lake’s shores contain important memorials of the Kahlkhin-Gol Battle of 1939.
Biodiversity values of the wetland areaThe wetlands in the Argun/Hailaer sub-basin host the nesting sites of rare birds, as well as several million migrating waterbirds. Al-most 300 bird species have been recorded. There are globally sig-nificant populations of 20 IUCN Red List bird species, including the Japanese Crane, Swan Goose, Great Bustard, and Tundra and Whooper Swans. Areas of reed marshes provide important breed-ing areas for many rare birds and spawning areas for fish.
Buir Lake, the most species-rich lake in Mongolia, has 29 species of fish, among them, for example, Taimen, Lenok, Amur gray-ling, Amur pike and Amur catfish.
Pressure factors and transboundary impactsWastewater from upstream industries in China makes the Up-per Argun/Hailaer highly polluted. Wildfires annually affect vegetation in most of the Argun/Hailaer valley. In both lakes, over-fishing results in exhaustion of resources. Over-grazing is resulting in desertification in the area surrounding Dalai/Hulun Lake. During the dry phases of the climate cycle, populations of rare species have been especially vulnerable to human pressure.
Since 1960 the mean annual temperature in Dauria has already increased by 2º C and more prolonged and severe droughts are predicted, resulting in low grass productivity, higher evaporation, a greater competition for remaining water between humans, cat-tle and wildlife.
The impacts of climate change and resulting water shortages are being intensified by the accelerating unsustainable development that threatens both the traditional lifestyle, as well as biodiversi-ty. Mongolian nomadic tribes adapted to the naturally occurring changes in the availability of water, but this is rapidly changing, with increasing numbers of stationary settlements and demand for water.
7 Sources: Kiriliuks, V., Goroshko, O. DIPA -10 years of cooperation. Express, Chita. 2006; Simonov, E., and others, Transboundary conservation of wetlands in Dauria and adaptation to climate change. International Congress for Conservation Biology. Beijing, July 2009. Report at Wetlands Conservation Section; Wetlands of the Amur River Basin. Compiled by: Markina, A., Minaeva, T., Titova, S. WWF, Vladivostok. 2008; Internet site of Ramsar Convention (www.ramsar.org); Simonov, E., Dahmer, T. Amur-Heilong River Basin Reader. Ecosystems LTD, Hongkong. 2008.
8 In China the site is protected by three local nature reserves: Erka, Huliyetu, and Ergunashidi. In the Russian Federation a cluster of Daursky biosphere reserves is envisioned in the National Protected Areas plan.
9 The establishment of a nature reserve is planned by the Mongolian Government. 10 The Mutnaya River is also known as Xinkaihe Canal.
102 | part iv
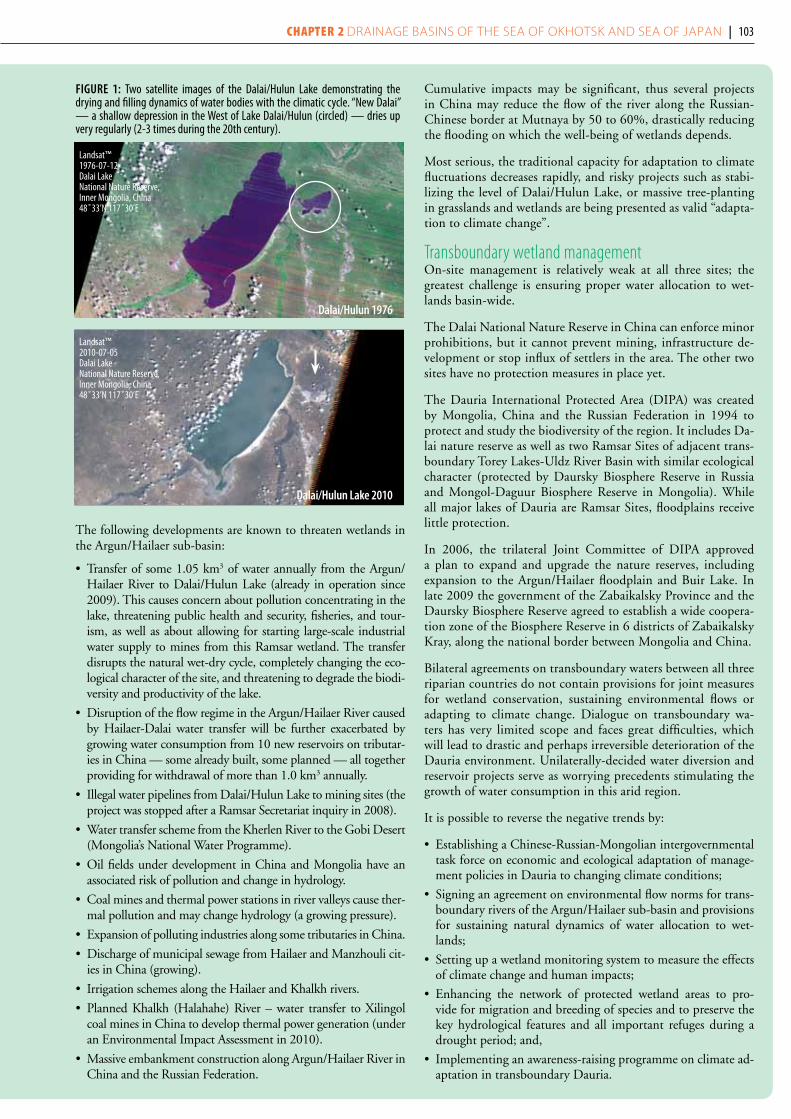
The following developments are known to threaten wetlands in the Argun/Hailaer sub-basin:
• Transferofsome1.05km3 of water annually from the Argun/Hailaer River to Dalai/Hulun Lake (already in operation since 2009). This causes concern about pollution concentrating in the lake, threatening public health and security, fisheries, and tour-ism, as well as about allowing for starting large-scale industrial water supply to mines from this Ramsar wetland. The transfer disrupts the natural wet-dry cycle, completely changing the eco-logical character of the site, and threatening to degrade the biodi-versity and productivity of the lake.
• DisruptionoftheflowregimeintheArgun/HailaerRivercausedby Hailaer-Dalai water transfer will be further exacerbated by growing water consumption from 10 new reservoirs on tributar-ies in China — some already built, some planned — all together providing for withdrawal of more than 1.0 km3 annually.
• IllegalwaterpipelinesfromDalai/HulunLaketominingsites(theproject was stopped after a Ramsar Secretariat inquiry in 2008).
• WatertransferschemefromtheKherlenRivertotheGobiDesert(Mongolia’s National Water Programme).
• Oilfieldsunderdevelopment inChinaandMongoliahaveanassociated risk of pollution and change in hydrology.
• Coalminesandthermalpowerstationsinrivervalleyscausether-mal pollution and may change hydrology (a growing pressure).
• ExpansionofpollutingindustriesalongsometributariesinChina.
• DischargeofmunicipalsewagefromHailaerandManzhoulicit-ies in China (growing).
• IrrigationschemesalongtheHailaerandKhalkhrivers.
• PlannedKhalkh (Halahahe)River–water transfer toXilingolcoal mines in China to develop thermal power generation (under an Environmental Impact Assessment in 2010).
• MassiveembankmentconstructionalongArgun/HailaerRiverinChina and the Russian Federation.
Cumulative impacts may be significant, thus several projects in China may reduce the flow of the river along the Russian-Chinese border at Mutnaya by 50 to 60%, drastically reducing the flooding on which the well-being of wetlands depends.
Most serious, the traditional capacity for adaptation to climate fluctuations decreases rapidly, and risky projects such as stabi-lizing the level of Dalai/Hulun Lake, or massive tree-planting in grasslands and wetlands are being presented as valid “adapta-tion to climate change”.
Transboundary wetland managementOn-site management is relatively weak at all three sites; the greatest challenge is ensuring proper water allocation to wet-lands basin-wide.
The Dalai National Nature Reserve in China can enforce minor prohibitions, but it cannot prevent mining, infrastructure de-velopment or stop influx of settlers in the area. The other two sites have no protection measures in place yet.
The Dauria International Protected Area (DIPA) was created by Mongolia, China and the Russian Federation in 1994 to protect and study the biodiversity of the region. It includes Da-lai nature reserve as well as two Ramsar Sites of adjacent trans-boundary Torey Lakes-Uldz River Basin with similar ecological character (protected by Daursky Biosphere Reserve in Russia and Mongol-Daguur Biosphere Reserve in Mongolia). While all major lakes of Dauria are Ramsar Sites, floodplains receive little protection.
In 2006, the trilateral Joint Committee of DIPA approved a plan to expand and upgrade the nature reserves, including expansion to the Argun/Hailaer floodplain and Buir Lake. In late 2009 the government of the Zabaikalsky Province and the Daursky Biosphere Reserve agreed to establish a wide coopera-tion zone of the Biosphere Reserve in 6 districts of Zabaikalsky Kray, along the national border between Mongolia and China.
Bilateral agreements on transboundary waters between all three riparian countries do not contain provisions for joint measures for wetland conservation, sustaining environmental flows or adapting to climate change. Dialogue on transboundary wa-ters has very limited scope and faces great difficulties, which will lead to drastic and perhaps irreversible deterioration of the Dauria environment. Unilaterally-decided water diversion and reservoir projects serve as worrying precedents stimulating the growth of water consumption in this arid region.
It is possible to reverse the negative trends by:
• EstablishingaChinese-Russian-Mongolianintergovernmentaltask force on economic and ecological adaptation of manage-ment policies in Dauria to changing climate conditions;
• Signinganagreementonenvironmentalflownormsfortrans-boundary rivers of the Argun/Hailaer sub-basin and provisions for sustaining natural dynamics of water allocation to wet-lands;
• Settingupawetlandmonitoringsystemtomeasuretheeffectsof climate change and human impacts;
• Enhancing the network of protected wetland areas to pro-vide for migration and breeding of species and to preserve the key hydrological features and all important refuges during a drought period; and,
• Implementinganawareness-raisingprogrammeonclimatead-aptation in transboundary Dauria.
FIguRE 1: Two satellite images of the Dalai/Hulun Lake demonstrating the drying and filling dynamics of water bodies with the climatic cycle. “New Dalai” — a shallow depression in the West of Lake Dalai/Hulun (circled) — dries up very regularly (2-3 times during the 20th century).
Dalai/hulun 1976
Dalai/hulun Lake 2010
Landsat™ 1976-07-12Dalai LakeNational Nature Reserve,Inner Mongolia, China48˚33’N 117˚30’E
Landsat™2010-07-05Dalai LakeNational Nature Reserve,Inner Mongolia, China48˚33’N 117˚30’E
Chapter 2 Drainage basins of the sea of oKhotsK anD sea of JaPan | 103
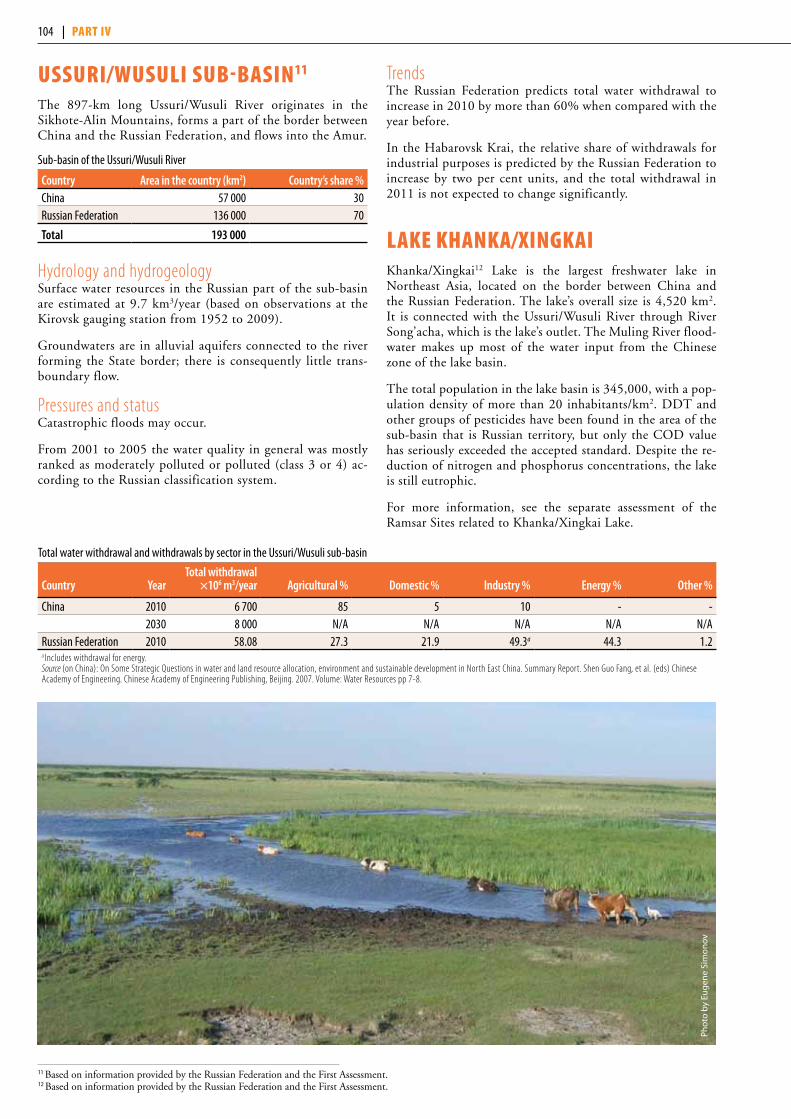
ussuri/wusuli suB-Basin11
The 897-km long Ussuri/Wusuli River originates in the Sikhote-Alin Mountains, forms a part of the border between China and the Russian Federation, and flows into the Amur.
Sub-basin of the Ussuri/Wusuli River
Country Area in the country (km2) Country’s share %China 57 000 30Russian Federation 136 000 70
Total 193 000
Hydrology and hydrogeologySurface water resources in the Russian part of the sub-basin are estimated at 9.7 km3/year (based on observations at the Kirovsk gauging station from 1952 to 2009).
Groundwaters are in alluvial aquifers connected to the river forming the State border; there is consequently little trans-boundary flow.
Pressures and statusCatastrophic floods may occur.
From 2001 to 2005 the water quality in general was mostly ranked as moderately polluted or polluted (class 3 or 4) ac-cording to the Russian classification system.
TrendsThe Russian Federation predicts total water withdrawal to increase in 2010 by more than 60% when compared with the year before.
In the Habarovsk Krai, the relative share of withdrawals for industrial purposes is predicted by the Russian Federation to increase by two per cent units, and the total withdrawal in 2011 is not expected to change significantly.
lake khanka/XingkaiKhanka/Xingkai12 Lake is the largest freshwater lake in Northeast Asia, located on the border between China and the Russian Federation. The lake’s overall size is 4,520 km2. It is connected with the Ussuri/Wusuli River through River Song’acha, which is the lake’s outlet. The Muling River flood-water makes up most of the water input from the Chinese zone of the lake basin.
The total population in the lake basin is 345,000, with a pop-ulation density of more than 20 inhabitants/km2. DDT and other groups of pesticides have been found in the area of the sub-basin that is Russian territory, but only the COD value has seriously exceeded the accepted standard. Despite the re-duction of nitrogen and phosphorus concentrations, the lake is still eutrophic.
For more information, see the separate assessment of the Ramsar Sites related to Khanka/Xingkai Lake.
Total water withdrawal and withdrawals by sector in the Ussuri/Wusuli sub-basin
Country YearTotal withdrawal
×106 m3/year Agricultural % Domestic % Industry % Energy % Other %
China 2010 6 700 85 5 10 - -2030 8 000 N/A N/A N/A N/A N/A
Russian Federation 2010 58.08 27.3 21.9 49.3a 44.3 1.2a Includes withdrawal for energy. Source (on China): On Some Strategic Questions in water and land resource allocation, environment and sustainable development in North East China. Summary Report. Shen Guo Fang, et al. (eds) Chinese Academy of Engineering. Chinese Academy of Engineering Publishing, Beijing. 2007. Volume: Water Resources pp 7-8.
11 Based on information provided by the Russian Federation and the First Assessment.12 Based on information provided by the Russian Federation and the First Assessment.
Phot
o by
Eug
ene
Sim
onov
104 | part iv

lake khanka/Xingkai wetlands13
General description of the wetland The Russian Federation and China have designated parts of Lake Khanka/Xingkai as well as surrounding areas as Wetlands of In-ternational Importance under the Ramsar Convention.14 Some 70% of the lake is located in Russia and 30% in China. The lake is situated at 69 m a.s.l., with a water depth varying from 4.5 m to 6.5 m. The Ramsar Sites include around one third of the total water area of the lake and surrounding lowland forests, swamps, marshes, and small freshwater lakes, as well as rice paddies and managed meadows. In China, the lake consists of Greater Xing-kai Lake and Lesser Xingkai Lake, separated by narrow forested sand dunes, with a maximum width of 1 km in dry season. In summer, the two lakes connect. Lake Khanka/Xingkai has 23 inflowing rivers (8 from China and 15 from Russia) draining the basin area of 16,890 km2. The Song’acha River is the only outflow river from the lake, and is subsequently connected with the Ussuri/Wusuli River and the Amur/Heilong River system.
Main wetland ecosystem services The area is important in terms of its functions for groundwater recharge and discharge as well as flood regulation. Furthermore, it plays an important role as a source of drinking water, and ir-rigation for 20,000 ha of rice paddies in China. Both sides of the lake are important for fisheries, in particular for the white fish (2,000 tons annually). The lake is also an important resort on the Chinese side, attracting at least 1 million people annually. Ecotourism is being developed on the Russian side where recrea-tional fishing is an important activity.
Cultural values of the wetland areaSome 6,000 years ago, the ancient ethnic people of “Man” thrived around Xingkai Lake, and created a special fishing and hunting culture. In Qing Dynasty the entire lake was a non-hunting/non-fishing area for 200 years.
Biodiversity values of the wetland areaXingkai Lake is one of the key staging sites for migratory birds along the East Asian – Australasian Flyway in spring and au-tumn. In particular during late March and early April, more than 35,000 migratory birds roost at the outlet of the lake, while the lake and associated wetlands can host about 500,000 individual waterfowl during mass migration in autumn. The wetlands are also important breeding habitats for endangered and vulnerable species, such as the Redcrowned Crane, Oriental Stork, Lesser White-fronted Geese, Chinese Egret and White-naped Crane.
Additionally, the site hosts rare mammal species such as the Mountain Weasel and is occasionally visited by the Amur (Si-berian) Tiger. The most vulnerable species are the Chinese soft-shell turtle for which Lake Khanka/Xingkai is the main breeding habitat within the Amur basin and the Mountain Grass Lizard – for which it is the only habitat in the Russian Federation.
At least 68 fish species have been recorded, among them Amur Whitefish and Burbot and the Amur Pike.
Pressure factors and transboundary impactsAbout 80% of the wetlands around Khanka/Xingkai Lake have been converted into rice paddies and grain fields resulting in heavy pollution of water and soil in both countries. Furthermore, the lakeshore in China is undergoing intensive tourist development and has been altered by the construction of long embankments. The remaining wetlands are threatened by fast development, par-ticularly the restoration of rice-paddies on the Russian side (sup-ported by Chinese capital and workforce), which had mostly been abandoned 20 years ago. Human-caused fires lead to the degrada-tion of ecosystems and further deforestation of the area, especially in the Russian Federation. The over-harvesting of fish leads to the disappearance of valuable species, and cross-border poaching is a major concern for border guards. There has been local extinction of at least one species of bird (Asian Crested Ibis). Despite these problems, Lake Khanka/Xingkai is not covered by the Sino-Rus-sian bilateral agreement on aquatic biological resources conserva-tion in the Amur and Ussuri/Wusuli Rivers.
Transboundary wetland managementXinkaihu National Nature Reserve in China (established in 1986) is managed by the “Committee for Khanka Lake Nature Reserve”. Its management has recently been improved due to lo-cal demands for legislation and its involvement in a number of international and national programs.
The Russian Khankaisky Zapovednik (Strict Scientific Nature Reserve; established in 1990) consists mainly of pristine wet-lands surrounding the lake. It is managed by an administrative body, which reports to the federal level, with relatively strong enforcement capabilities and a very efficient environmental edu-cation unit conducting region-wide public-outreach activities.
A Joint Commission was established for the implementation of the 1996 agreement between China and the Russian Federation, by which the Lake Khanka/Xingkai transboundary nature reserve was created to ensure the mutual benefit of the two reserves, as well as regular communication. Both reserves conduct coordinated an-nual bird surveys, water quality monitoring (facilitated since 2006 by a Sino-Russian Joint Monitoring Program on Water Quality of Transboundary Water Bodies) and various joint education and awareness-raising activities. In 2006-2007, both the Russian and Chinese reserve received biosphere reserve status.
13 Sources: Wang, F. International cooperation in Xinkaihu. (in Chinese and in Russian). Xinkaihu National Nature Reserve. 2007; Andronov. V.A. State of nature reserves in Russian Far East Federal District in 2004-2005. Report and presentation at a Conference dedicated to 15th anniversary of Khankaisky Zapovednik. Spassk Dalny. 2006; Simonov, E., Dahmer, T. Amur-Heilong River Basin Reader. Ecosystems LTD, Hongkong. 2008; Li, X. M. Wetlands of Heilongjiang basin and their protection (in Chinese). Monograph. North East Forestry University Publishers, Harbin, Heilongjiang, China. 2006; Dahmer, T. Review of Wetland Biodiversity Conservation Management in the Sanjiang Plain. Project report, Sanjiang Plain Wetlands Protection Project, Asian Development Bank and Global Environment Facility. September 2003.
14 The total water area within the Ramsar Sites makes up 1,247 km2 in China and 59.5 km2 in Russia.
Chapter 2 Drainage basins of the sea of oKhotsK anD sea of JaPan | 105

suJFun/razdOlnaYa river Basin15
The Sujfun/Razdolnaya16 River rises in China in the East-Manchuria highlands and flows through the Russian Federa-tion’s territory before flowing into the Sea of Japan. The Gran-itnaya River is a transboundary tributary.
The average elevation of the basin is 434 m a.s.l.
Basin of the Sujfun/Razdolnaya River
Country Area in the country (km2) Country’s share (%)Russian Federation 6 820 40.5China 10 010 59.5
Total 16 830
Surface water resources in the Sujfun/Razdolnaya Basin are estimated at 2.3 km3/year (average for the years from 1936 to 2006) at the Terehovka gauging station. Of this amount, 1.5 km3/year is estimated to be in the Russian Federation’s territory.
PressuresAnnual flooding commonly reaches a high level in the basin.
Water is mainly withdrawn for domestic and industrial uses in the part of the basin within the Russian Federation.
tumen/tumannaYa river BasinThe 549-km long Tumen/Tumannaya17 forms the border of the Democratic People’s Republic of Korea with China, and, further downstream, with the Russian Federation.
Basin of the Tumen/Tumannaya River
Country Area in the country (km2) Country’s share (%)China 23 660 70Democratic People’s Republic of Korea 10 140 30Russian Federation 26 0.01
Total 33 826Note: The figures for China and the Democratic People’s Republic of Korea are estimates.
Hydrology and hydrogeologyThe surface water resources are estimated at 10.1 km3/year (based on the years from 1934 to 2000).
Groundwaters are in alluvial aquifers connected to the riv-er which forms the State border, there is consequently little transboundary flow.
Pressures and statusIndustrial wastewaters impact on the water resources. The main sources are in the Democratic People’s Republic of Korea, including iron mining in Musansk and industries at
Undoksk (production of chemicals, paper and sugar). Indus-trial pollution in China has been decreasing. Discharges of municipal wastewaters in the Democratic People’s Republic of Korea and in China are another major impacting factor. There is almost no anthropogenic pressure in the very small part of the basin that is in Russian territory; the area consists of wetlands of the Hasansky natural park. Erosion of the left riverbank, shifting the riverbed further into the Russian Fed-eration, causes further problems.
Responses and trendsIn November 2008, the constructions to stabilize the riverbed of the river in order to consolidate the border between the Russian Federation and Democratic People’s Republic of Ko-rea, initiated in 2004, were completed. As a result, the shift-ing of the left (Russian) bank ceased. Before the construction, erosion of the riverbank on the Russian side by flood waters also affected wetlands.
Preparing a trilateral agreement between China, the Demo-cratic People’s Republic of Korea and the Russian Federation which would provide for joint measures on monitoring and assessment, as well as water-quality targets, is very important for improving water quality in the river.
Urbanization and the destruction of wetlands threatening the important breeding grounds of birds in the basin and adjacent areas in the Democratic People’s Republic of Korea highlight the need for wetland protection and restoration measures.
15 Based on information provided by the Russian Federation and the first Assessment of Transboundary Rivers, Lakes and Groundwaters.16 The river is called Sujfun in China and Razdolnaya in the Russian Federation.17 The river is known as Tumen in China and as Tumannaya in the Russian Federation.
Total water withdrawal and withdrawals by sector in the Sujfun/Razdolnaya Basin
Country YearTotal withdrawal
×106 m3/year Agricultural % Domestic % Industry % Energy % Other %
Russian Federation 2010 24.15 0.2 83.4 16.1a 5.2 0.3China N/A N/A N/A N/A N/A N/A N/A
a Includes the withdrawal for energy.
106 | part iv

Chapter 3 DRAINAGE BASIN OF THE ARAL SEA AND OTHER TRANSBOUNDARY WATERS IN CENTRAL ASIA
107
This chapter deals with the assessment of transboundary rivers, lakes and groundwaters, as well as selected Ramsar Sites and other wetlands of transboundary importance, which are located in Central Asia and discharge into the Aral Sea Basin, into another lake, or have a desert sink.
Assessed transboundary waters in Central Asia
Basin/sub-basin(s) Recipient Riparian countries Lakes in the basinTransboundary groundwaters
within the basin Ramsar Sites/wetlands of
transboundary importanceAmu Darya Aral Sea AF, KG, TJ, TM, UZ Aral Sea Karatag/North-Surhandarya (TJ, UZ),
Kofarnihon (TJ, UZ), Sherabad (TM, UZ), Xorezm (TM, UZ), Amu-Darya (KZ, TM,
UZ), Amudarya (AF, TJ, UZ)- Surkhan Darya Amu Darya TJ, UZ - Kafirnigan Amu Darya TJ, UZ- Pyanj Amu Darya AF, TJ- Vakhsh Amu Darya KG, TJ Vakhsh aquifer (TJ, KG)Zeravshan Desert sink TJ, UZ Zeravshan aquifer (TJ, UZ)Syr Darya Aral Sea KZ, KG, TJ, UZ Osh-Aravan, Almos-Vorzik, Maylusu,
Sokh, Iskovat-Pishkaran (KG, UZ), Dalverzin, Zafarobod, Shorsu (TJ, UZ),
Sulyukta-Batken-Nau-Isfara (KG, TJ, UZ), Syr Darya 1, Pretashkent (KZ, UZ),
Naryn, Chust-Pap, Kasansay (KG, UZ), Syr Darya 2–3 (TJ, UZ), Karaungur,
Yarmazar, Chimion-Aval, Nanay (KG, UZ), Ahangaran (TJ, UZ), Kokaral (KZ, UZ),
Havost (AF, TJ), Dustlik (TJ, UZ)
Aydar-Arnasay Lakes System (KZ, UZ)
- Naryn Syr Darya KG, UZ- Kara Darya Syr Darya KG, UZ- Chirchik Syr Darya KZ, KG, UZ- - Chatkal Chirchik KG, UZChu Desert sink KZ, KG Chu/Shu (KZ, KG)Talas Desert sink KZ, KG North-Talas, South-Talas (KZ, KG)Assa Desert sink KZ, KG, UZ Ili Lake Balkhash CN, KZ Lake Balkhash Zharkent, Tekes (KZ, CH) Ili Delta - Balkhash Lake (CN, KZ)Murgab Desert sink AF, TMTejen/Harirud Desert sink AF, IR, TM Karat, Taybad, Torbat-e-jam (AF, IR),
Janatabad (AF, IR, TM), Aghdarband, Sarakhas (IR, TM)
Note: Transboundary groundwaters in italics are not assessed in the present publication.

amu Darya river Basin1 The Amu Darya, one of the main rivers of Central Asia, is taken to begin from the confluence of the Pyanj — biggest tributary in terms of flow volume — and the Vakhsh rivers. Afghanistan, Kyrgyzstan, Tajikistan, Turkmenistan and Uzbekistan share the Amu Darya Basin.
In addition to the Pyanj and the Vakhsh, the major transbounda-ry tributaries include the Surkhan Darya and the Kafirnigan. The former tributary Zeravshan no longer reaches the Amu Darya.
The upstream catchment area of the Amu Darya contributing water to the main river at Kerki gauging station, where the riv-er leaves the mountains and flows into the desert lowlands, is 309,000 km2. It includes a large part of Tajikistan, the southwest corner of Kyrgyzstan (the Alai Valley) and the northeast corner of Afghanistan. With the mid- and down-stream sections of the po-tential drainage area in Turkmenistan and Uzbekistan included,
the total catchment area varies from 465 000 km2 to 612 000 km2, depending on the source of data.2
Hydrology and hydrogeologyThe mean annual run-off in the Amu Darya Basin is about 78 km3. Some 80% of the flow is estimated to be generated in Tajikistan.
Volume of run-off in the Amu Darya Basin by country
Country Volume of run-off (km3/year)Afghanistan 6.18Kyrgyzstan 1.9Tajikistan 62.9Turkmenistan 2.27Uzbekistan 4.7Total 78.46
Source: Executive Committee of the International Fund for Saving the Aral Sea.
Groundwater resources in the Amu Darya Basin that can be abstracted without significantly af-fecting surface water flow are estimated at 7.1 km3/year.
More than 35 reservoirs with a capacity greater than 10 × 106 m3 have been built in the Amu Darya Basin, and their total water storage ex-
ceeds 29.8 km3. Some 17 km3 of this amount is on the main Amu Darya River, among them the Tyuyamuyunsk Reservoir (7.27 km3). There are four water reservoirs with a total storage capacity of 2.5 km3 on the Karakum Canal in Turkmenistan, and a second phase of the Zeyid Reservoir is under construction, with a design storage capacity of 3.2 km3.3 The generally smaller reservoirs in-side the complex systems of canals, such as the Talimardjansky and Tudakulsky reservoirs in Uzbekistan, play an important role in storing seasonal water.
The flow of the Vakhsh is regulated (the Nurek Reservoir, with a water storage volume of 10.5 km3, being the main reservoir) but regulation of the Pyanj is limited, which leads to frequent occur-rences of flooding between the confluence of these rivers and the Tyuyamuyunsk Reservoir.
When flowing through the lowland part, the flow reduces through evaporation, infiltration, and withdrawal for irrigation.
Amu Darya, Chatly, 1931-1973
Pyanj, Niz. Pyandzh, 1965-1989
Vakhsh, Tutkaul, 1932-1967
Syr Darya, Tyumen-Aryk, 1930-1986
Naryn, Uch- Kurgan, 1933-1990
Chirchik, Hodjikent, 1935-1985
Kafi rnigan, Tartki, 1932-1992
Kara Darya, Uch-Terek, 1933-1990
Surkhan Darya, Manguzar, 1932-1989
0 5 10 15 20 25 30 35 40 45 50
km3
River, Station,Time series
43.197
32.223
20.191
16.631
11.595
6.868
5.129
4.051
1.55
Long-term mean annual flow (km³) of rivers in the Aral Sea Basin
Source: Global Runoff Data Centre, Koblenz.
KaRaTag/NoRTh-SuRhaNdaRya aquifeR (No. 11)4
Tajikistan uzbekistanAt least partly confined Quaternary aquifer; boulder, cobble sediments (Tajikistan) and pebble drifts with streaks of clay loam (Uzbekistan); groundwater flow direction towards Uzbekistan; medium links with surface waters.Border length (km) 46 50Area (km2) 3 428 3 550Thickness: mean, max (m) 50–100, 100 70, 100Groundwater uses and functions Drinking water supply Drinking water supplyPressure factors Water abstraction. Change of water resources
on the edge of sustainability. Negligible local contamination by nitrate (agriculture).
Water abstraction. Change of water resources based on the water abstraction in Tajikistan. Negligible
local contamination by nitrate (agriculture).Groundwater management measures Joint monitoring of the groundwater. Joint monitoring of the groundwater.Other information Enhancement of the monitoring network
of groundwater most needed. Enhancement of the monitoring network
of groundwater most needed.
1 Based on information provide by Kyrgyzstan and Tajikistan, the Executive Committee of the International Fund for Saving the Aral Sea, CAWATERinfo and the First Assessment.
2 Source: Environment and Security in the Amu Darya Basin. ENVSEC. 2011. 3 Source: Dam Safety in Central Asia: Capacity-Building and Regional Cooperation. UNECE. Water Series No. 5. 2007. 4 The Karatag aquifer was already assessed in the First Assessment, in which it was called Karotog. The names of some of the aquifers have been revised since. The updated inventory is mostly based on the inventory by UNESCO and IGRAC in 2009.
108 | part iv
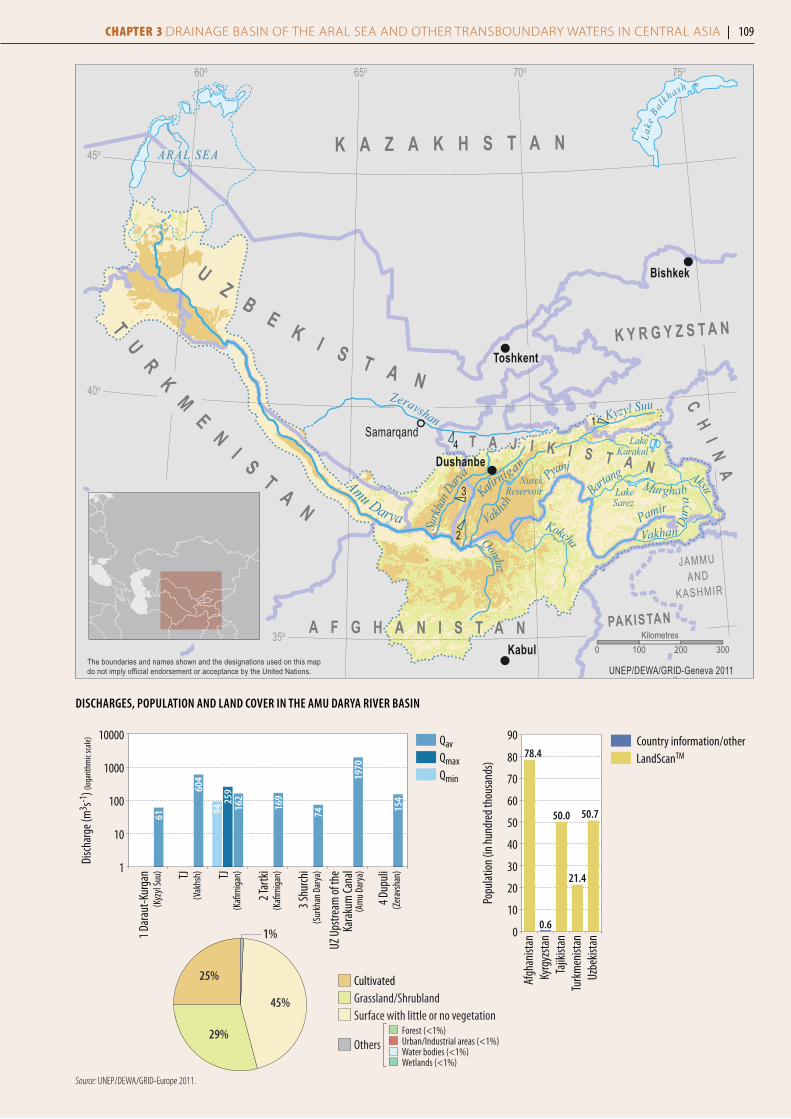
1
2
3
4
Kabul
Bishkek
Toshkent
Dushanbe
Samarqand
Amu Darya
Surkh
an Dary
aKaf
irnigan
Bartang
Pamir
Zeravshan
MurghabAksu
Kyzyl Suu
LakeKarakul
LakeSarez
NurekReservoir
Dary
a
Vakhan Pya
nj
Vakhsh
Qonduz
Kokcha
ARAL SEA
Lake
Bal
khash
K A Z A K H S T A N
TU
RK
M
EN
I ST
AN
UZ
BE K I S T A N
T A J I K I S T A N
K Y R G Y Z S T A N
A F G H A N I S T A N
CH
IN
A
PAKISTAN
JAMMUAND
KASHMIR
45o
40o
35o
60o 65o 70o 75o
UNEP/DEWA/GRID-Geneva 2011The boundaries and names shown and the designations used on this mapdo not imply official endorsement or acceptance by the United Nations.
0 100 200 300Kilometres
diSChaRgeS, popuLaTioN aNd LaNd CoVeR iN The amu daRya RiVeR BaSiN
4 Dup
uli
UZ U
pstre
am of
the
Kara
kum
Cana
l
3 Shu
rchi
2 Tar
tkiTJTJ
1 Dar
aut-K
urga
n
Disc
harg
e (m
3 s-1) (
loga
rithm
ic sc
ale)
61(K
yzyl
Suu)
(Vak
hsh)
(Kafi
rnig
an)
(Kafi
rnig
an)
(Sur
khan
Dar
ya)
(Am
u Dar
ya)
(Zer
avsh
an)1
10
1000
100
10000
604
259
162
94 169
74
1970
154
QavQmaxQmin
Popu
latio
n (in
hun
dred
thou
sand
s)
0
10
20
30
40
50
60
70
80
90
Uzbe
kista
nTu
rkm
enist
anTa
jikist
anKy
rgyz
stan
Afgh
anist
an
78.4
0.6
50.0
21.4
50.7
Country information/otherLandScanTM
1%
25%
29%
45%
Forest (<1%)Urban/Industrial areas (<1%)Water bodies (<1%)Wetlands (<1%)
Grassland/ShrublandSurface with little or no vegetation
Others
Cultivated
Source: UNEP/DEWA/GRID-Europe 2011.
Chapter 3 DRAINAGE BASIN OF THE ARAL SEA AND OTHER TRANSBOUNDARY WATERS IN CENTRAL ASIA | 109
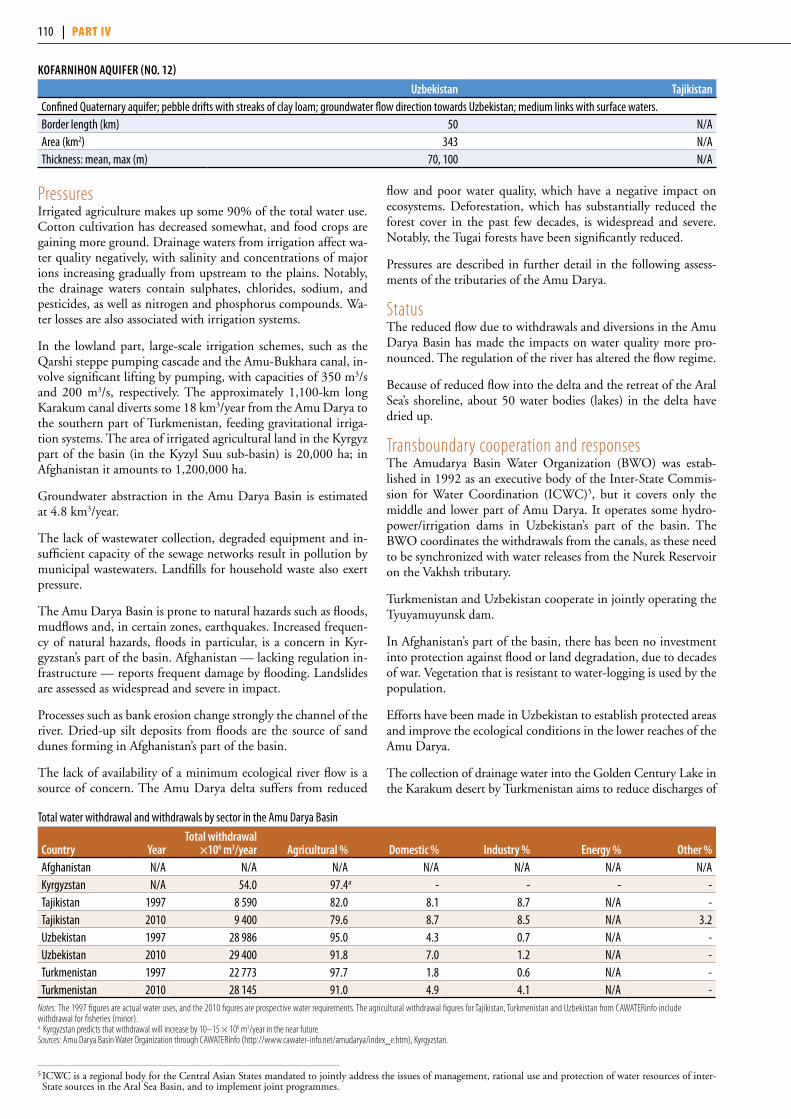
PressuresIrrigated agriculture makes up some 90% of the total water use. Cotton cultivation has decreased somewhat, and food crops are gaining more ground. Drainage waters from irrigation affect wa-ter quality negatively, with salinity and concentrations of major ions increasing gradually from upstream to the plains. Notably, the drainage waters contain sulphates, chlorides, sodium, and pesticides, as well as nitrogen and phosphorus compounds. Wa-ter losses are also associated with irrigation systems.
In the lowland part, large-scale irrigation schemes, such as the Qarshi steppe pumping cascade and the Amu-Bukhara canal, in-volve significant lifting by pumping, with capacities of 350 m3/s and 200 m3/s, respectively. The approximately 1,100-km long Karakum canal diverts some 18 km3/year from the Amu Darya to the southern part of Turkmenistan, feeding gravitational irriga-tion systems. The area of irrigated agricultural land in the Kyrgyz part of the basin (in the Kyzyl Suu sub-basin) is 20,000 ha; in Afghanistan it amounts to 1,200,000 ha.
Groundwater abstraction in the Amu Darya Basin is estimated at 4.8 km3/year.
The lack of wastewater collection, degraded equipment and in-sufficient capacity of the sewage networks result in pollution by municipal wastewaters. Landfills for household waste also exert pressure.
The Amu Darya Basin is prone to natural hazards such as floods, mudflows and, in certain zones, earthquakes. Increased frequen-cy of natural hazards, floods in particular, is a concern in Kyr-gyzstan’s part of the basin. Afghanistan — lacking regulation in-frastructure — reports frequent damage by flooding. Landslides are assessed as widespread and severe in impact.
Processes such as bank erosion change strongly the channel of the river. Dried-up silt deposits from floods are the source of sand dunes forming in Afghanistan’s part of the basin.
The lack of availability of a minimum ecological river flow is a source of concern. The Amu Darya delta suffers from reduced
flow and poor water quality, which have a negative impact on ecosystems. Deforestation, which has substantially reduced the forest cover in the past few decades, is widespread and severe. Notably, the Tugai forests have been significantly reduced.
Pressures are described in further detail in the following assess-ments of the tributaries of the Amu Darya.
StatusThe reduced flow due to withdrawals and diversions in the Amu Darya Basin has made the impacts on water quality more pro-nounced. The regulation of the river has altered the flow regime.
Because of reduced flow into the delta and the retreat of the Aral Sea’s shoreline, about 50 water bodies (lakes) in the delta have dried up.
Transboundary cooperation and responsesThe Amudarya Basin Water Organization (BWO) was estab-lished in 1992 as an executive body of the Inter-State Commis-sion for Water Coordination (ICWC)5, but it covers only the middle and lower part of Amu Darya. It operates some hydro-power/irrigation dams in Uzbekistan’s part of the basin. The BWO coordinates the withdrawals from the canals, as these need to be synchronized with water releases from the Nurek Reservoir on the Vakhsh tributary.
Turkmenistan and Uzbekistan cooperate in jointly operating the Tyuyamuyunsk dam.
In Afghanistan’s part of the basin, there has been no investment into protection against flood or land degradation, due to decades of war. Vegetation that is resistant to water-logging is used by the population.
Efforts have been made in Uzbekistan to establish protected areas and improve the ecological conditions in the lower reaches of the Amu Darya.
The collection of drainage water into the Golden Century Lake in the Karakum desert by Turkmenistan aims to reduce discharges of
KofaRNihoN aquifeR (No. 12)
uzbekistan TajikistanConfined Quaternary aquifer; pebble drifts with streaks of clay loam; groundwater flow direction towards Uzbekistan; medium links with surface waters.Border length (km) 50 N/AArea (km2) 343 N/AThickness: mean, max (m) 70, 100 N/A
Total water withdrawal and withdrawals by sector in the Amu Darya Basin
Country yearTotal withdrawal
×106 m3/year agricultural % domestic % industry % energy % other %Afghanistan N/A N/A N/A N/A N/A N/A N/AKyrgyzstan N/A 54.0 97.4a - - - -Tajikistan 1997 8 590 82.0 8.1 8.7 N/A -Tajikistan 2010 9 400 79.6 8.7 8.5 N/A 3.2Uzbekistan 1997 28 986 95.0 4.3 0.7 N/A -Uzbekistan 2010 29 400 91.8 7.0 1.2 N/A -Turkmenistan 1997 22 773 97.7 1.8 0.6 N/A -Turkmenistan 2010 28 145 91.0 4.9 4.1 N/A -
Notes: The 1997 figures are actual water uses, and the 2010 figures are prospective water requirements. The agricultural withdrawal figures for Tajikistan, Turkmenistan and Uzbekistan from CAWATERinfo include withdrawal for fisheries (minor).a Kyrgyzstan predicts that withdrawal will increase by 10–15 × 106 m3/year in the near future. Sources: Amu Darya Basin Water Organization through CAWATERinfo (http://www.cawater-info.net/amudarya/index_e.htm), Kyrgyzstan.
5 ICWC is a regional body for the Central Asian States mandated to jointly address the issues of management, rational use and protection of water resources of inter-State sources in the Aral Sea Basin, and to implement joint programmes.
110 | part iv
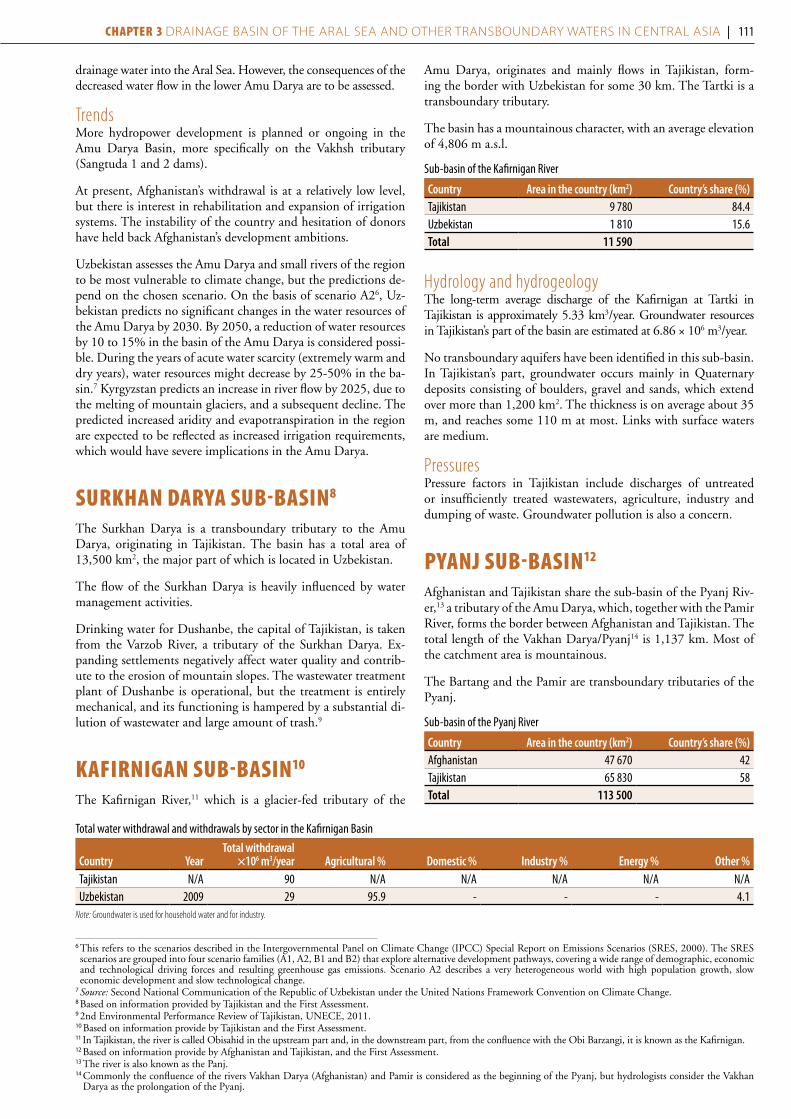
drainage water into the Aral Sea. However, the consequences of the decreased water flow in the lower Amu Darya are to be assessed.
TrendsMore hydropower development is planned or ongoing in the Amu Darya Basin, more specifically on the Vakhsh tributary (Sangtuda 1 and 2 dams).
At present, Afghanistan’s withdrawal is at a relatively low level, but there is interest in rehabilitation and expansion of irrigation systems. The instability of the country and hesitation of donors have held back Afghanistan’s development ambitions.
Uzbekistan assesses the Amu Darya and small rivers of the region to be most vulnerable to climate change, but the predictions de-pend on the chosen scenario. On the basis of scenario A26, Uz-bekistan predicts no significant changes in the water resources of the Amu Darya by 2030. By 2050, a reduction of water resources by 10 to 15% in the basin of the Amu Darya is considered possi-ble. During the years of acute water scarcity (extremely warm and dry years), water resources might decrease by 25-50% in the ba-sin.7 Kyrgyzstan predicts an increase in river flow by 2025, due to the melting of mountain glaciers, and a subsequent decline. The predicted increased aridity and evapotranspiration in the region are expected to be reflected as increased irrigation requirements, which would have severe implications in the Amu Darya.
surkhan Darya suB-Basin8 The Surkhan Darya is a transboundary tributary to the Amu Darya, originating in Tajikistan. The basin has a total area of 13,500 km2, the major part of which is located in Uzbekistan.
The flow of the Surkhan Darya is heavily influenced by water management activities.
Drinking water for Dushanbe, the capital of Tajikistan, is taken from the Varzob River, a tributary of the Surkhan Darya. Ex-panding settlements negatively affect water quality and contrib-ute to the erosion of mountain slopes. The wastewater treatment plant of Dushanbe is operational, but the treatment is entirely mechanical, and its functioning is hampered by a substantial di-lution of wastewater and large amount of trash.9
kafirnigan suB-Basin10 The Kafirnigan River,11 which is a glacier-fed tributary of the
Amu Darya, originates and mainly flows in Tajikistan, form-ing the border with Uzbekistan for some 30 km. The Tartki is a transboundary tributary.
The basin has a mountainous character, with an average elevation of 4,806 m a.s.l.
Sub-basin of the Kafirnigan River
Country area in the country (km2) Country’s share (%)Tajikistan 9 780 84.4Uzbekistan 1 810 15.6Total 11 590
Hydrology and hydrogeologyThe long-term average discharge of the Kafirnigan at Tartki in Tajikistan is approximately 5.33 km3/year. Groundwater resources in Tajikistan’s part of the basin are estimated at 6.86 × 10⁶ m3/year.
No transboundary aquifers have been identified in this sub-basin. In Tajikistan’s part, groundwater occurs mainly in Quaternary deposits consisting of boulders, gravel and sands, which extend over more than 1,200 km2. The thickness is on average about 35 m, and reaches some 110 m at most. Links with surface waters are medium.
PressuresPressure factors in Tajikistan include discharges of untreated or insufficiently treated wastewaters, agriculture, industry and dumping of waste. Groundwater pollution is also a concern.
pyanj suB-Basin12 Afghanistan and Tajikistan share the sub-basin of the Pyanj Riv-er,13 a tributary of the Amu Darya, which, together with the Pamir River, forms the border between Afghanistan and Tajikistan. The total length of the Vakhan Darya/Pyanj14 is 1,137 km. Most of the catchment area is mountainous.
The Bartang and the Pamir are transboundary tributaries of the Pyanj.
Sub-basin of the Pyanj River
Country area in the country (km2) Country’s share (%)Afghanistan 47 670 42Tajikistan 65 830 58Total 113 500
Total water withdrawal and withdrawals by sector in the Kafirnigan Basin
Country yearTotal withdrawal
×106 m3/year agricultural % domestic % industry % energy % other %Tajikistan N/A 90 N/A N/A N/A N/A N/AUzbekistan 2009 29 95.9 - - - 4.1
Note: Groundwater is used for household water and for industry.
6 This refers to the scenarios described in the Intergovernmental Panel on Climate Change (IPCC) Special Report on Emissions Scenarios (SRES, 2000). The SRES scenarios are grouped into four scenario families (A1, A2, B1 and B2) that explore alternative development pathways, covering a wide range of demographic, economic and technological driving forces and resulting greenhouse gas emissions. Scenario A2 describes a very heterogeneous world with high population growth, slow economic development and slow technological change.
7 Source: Second National Communication of the Republic of Uzbekistan under the United Nations Framework Convention on Climate Change.8 Based on information provided by Tajikistan and the First Assessment.9 2nd Environmental Performance Review of Tajikistan, UNECE, 2011.10 Based on information provide by Tajikistan and the First Assessment.11 In Tajikistan, the river is called Obisahid in the upstream part and, in the downstream part, from the confluence with the Obi Barzangi, it is known as the Kafirnigan.12 Based on information provide by Afghanistan and Tajikistan, and the First Assessment.13 The river is also known as the Panj. 14 Commonly the confluence of the rivers Vakhan Darya (Afghanistan) and Pamir is considered as the beginning of the Pyanj, but hydrologists consider the Vakhan
Darya as the prolongation of the Pyanj.
Chapter 3 DRAINAGE BASIN OF THE ARAL SEA AND OTHER TRANSBOUNDARY WATERS IN CENTRAL ASIA | 111
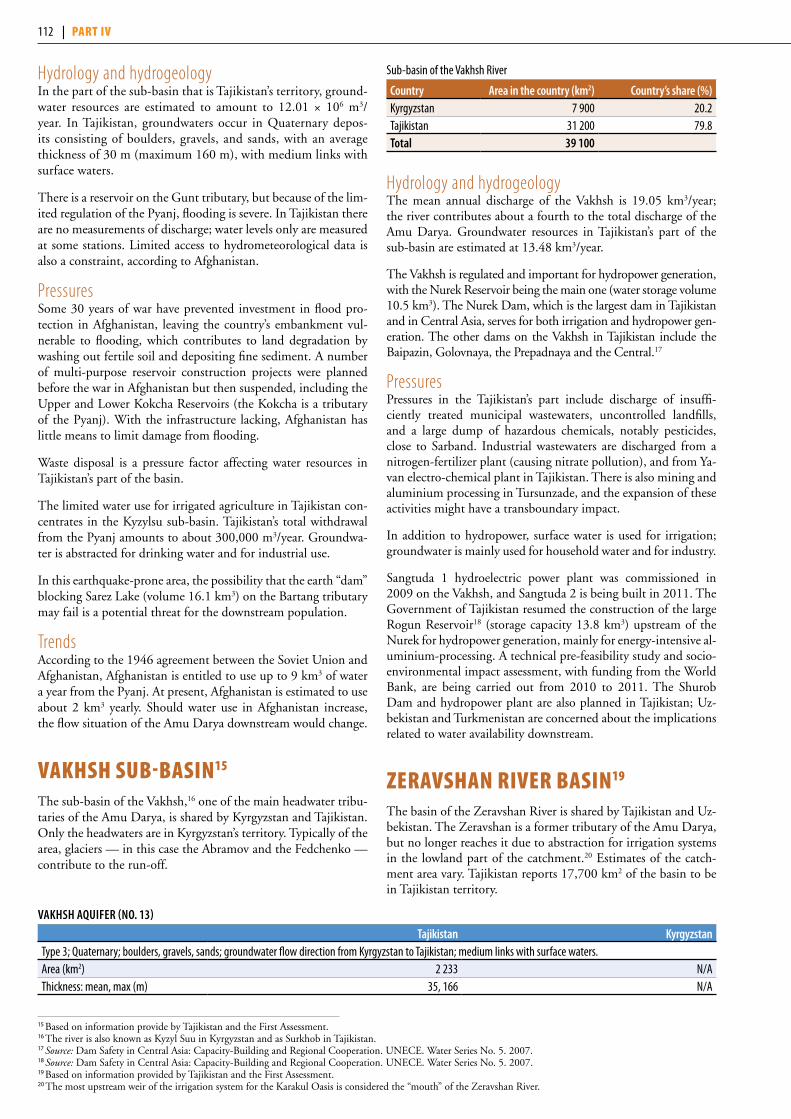
15 Based on information provide by Tajikistan and the First Assessment. 16 The river is also known as Kyzyl Suu in Kyrgyzstan and as Surkhob in Tajikistan. 17 Source: Dam Safety in Central Asia: Capacity-Building and Regional Cooperation. UNECE. Water Series No. 5. 2007. 18 Source: Dam Safety in Central Asia: Capacity-Building and Regional Cooperation. UNECE. Water Series No. 5. 2007.19 Based on information provided by Tajikistan and the First Assessment. 20 The most upstream weir of the irrigation system for the Karakul Oasis is considered the “mouth” of the Zeravshan River.
Hydrology and hydrogeologyIn the part of the sub-basin that is Tajikistan’s territory, ground-water resources are estimated to amount to 12.01 × 10⁶ m3/year. In Tajikistan, groundwaters occur in Quaternary depos-its consisting of boulders, gravels, and sands, with an average thickness of 30 m (maximum 160 m), with medium links with surface waters.
There is a reservoir on the Gunt tributary, but because of the lim-ited regulation of the Pyanj, flooding is severe. In Tajikistan there are no measurements of discharge; water levels only are measured at some stations. Limited access to hydrometeorological data is also a constraint, according to Afghanistan.
PressuresSome 30 years of war have prevented investment in flood pro-tection in Afghanistan, leaving the country’s embankment vul-nerable to flooding, which contributes to land degradation by washing out fertile soil and depositing fine sediment. A number of multi-purpose reservoir construction projects were planned before the war in Afghanistan but then suspended, including the Upper and Lower Kokcha Reservoirs (the Kokcha is a tributary of the Pyanj). With the infrastructure lacking, Afghanistan has little means to limit damage from flooding.
Waste disposal is a pressure factor affecting water resources in Tajikistan’s part of the basin.
The limited water use for irrigated agriculture in Tajikistan con-centrates in the Kyzylsu sub-basin. Tajikistan’s total withdrawal from the Pyanj amounts to about 300,000 m3/year. Groundwa-ter is abstracted for drinking water and for industrial use.
In this earthquake-prone area, the possibility that the earth “dam” blocking Sarez Lake (volume 16.1 km3) on the Bartang tributary may fail is a potential threat for the downstream population.
TrendsAccording to the 1946 agreement between the Soviet Union and Afghanistan, Afghanistan is entitled to use up to 9 km3 of water a year from the Pyanj. At present, Afghanistan is estimated to use about 2 km3 yearly. Should water use in Afghanistan increase, the flow situation of the Amu Darya downstream would change.
vakhsh suB-Basin15
The sub-basin of the Vakhsh,16 one of the main headwater tribu-taries of the Amu Darya, is shared by Kyrgyzstan and Tajikistan. Only the headwaters are in Kyrgyzstan’s territory. Typically of the area, glaciers — in this case the Abramov and the Fedchenko — contribute to the run-off.
Sub-basin of the Vakhsh River
Country area in the country (km2) Country’s share (%)Kyrgyzstan 7 900 20.2Tajikistan 31 200 79.8Total 39 100
Hydrology and hydrogeologyThe mean annual discharge of the Vakhsh is 19.05 km3/year; the river contributes about a fourth to the total discharge of the Amu Darya. Groundwater resources in Tajikistan’s part of the sub-basin are estimated at 13.48 km3/year.
The Vakhsh is regulated and important for hydropower generation, with the Nurek Reservoir being the main one (water storage volume 10.5 km3). The Nurek Dam, which is the largest dam in Tajikistan and in Central Asia, serves for both irrigation and hydropower gen-eration. The other dams on the Vakhsh in Tajikistan include the Baipazin, Golovnaya, the Prepadnaya and the Central.17
PressuresPressures in the Tajikistan’s part include discharge of insuffi-ciently treated municipal wastewaters, uncontrolled landfills, and a large dump of hazardous chemicals, notably pesticides, close to Sarband. Industrial wastewaters are discharged from a nitrogen-fertilizer plant (causing nitrate pollution), and from Ya-van electro-chemical plant in Tajikistan. There is also mining and aluminium processing in Tursunzade, and the expansion of these activities might have a transboundary impact.
In addition to hydropower, surface water is used for irrigation; groundwater is mainly used for household water and for industry.
Sangtuda 1 hydroelectric power plant was commissioned in 2009 on the Vakhsh, and Sangtuda 2 is being built in 2011. The Government of Tajikistan resumed the construction of the large Rogun Reservoir18 (storage capacity 13.8 km3) upstream of the Nurek for hydropower generation, mainly for energy-intensive al-uminium-processing. A technical pre-feasibility study and socio-environmental impact assessment, with funding from the World Bank, are being carried out from 2010 to 2011. The Shurob Dam and hydropower plant are also planned in Tajikistan; Uz-bekistan and Turkmenistan are concerned about the implications related to water availability downstream.
Zeravshan river Basin19
The basin of the Zeravshan River is shared by Tajikistan and Uz-bekistan. The Zeravshan is a former tributary of the Amu Darya, but no longer reaches it due to abstraction for irrigation systems in the lowland part of the catchment.20 Estimates of the catch-ment area vary. Tajikistan reports 17,700 km2 of the basin to be in Tajikistan territory.
VaKhSh aquifeR (No. 13)
Tajikistan KyrgyzstanType 3; Quaternary; boulders, gravels, sands; groundwater flow direction from Kyrgyzstan to Tajikistan; medium links with surface waters.Area (km2) 2 233 N/AThickness: mean, max (m) 35, 166 N/A
112 | part iv

The average discharge at Dupuli, Tajikistan, is 4.86 km3/year. Groundwater resources in the Tajik part of the basin are esti-mated at 3.289 × 10⁶ m3/year. From the point of view of use, they are not considered important by Tajikistan.
PressuresThe flow is regulated at the Karaultepinsky, Kattakurgansky and Kuyumazarsky dams, which serve irrigation in Uzbekistan.21 It has been estimated that some 96% of the water resources are used for irrigation, mainly in Uzbekistan.
The Ayni hydropower plant is planned upstream, in Tajikistan.
Tailings and wastewaters of mines (Dzhipsiprutsky Mining and Panjakent gold mining — about 17 km upstream from the bor-der) and uncontrolled dumps of household waste are reported by Tajikistan to be pressure factors.
The quality of waters is also affected by natural background pol-lution, municipal and industrial wastewaters, pollution from agriculture (nutrients, pesticides) as well as suspended sediment and debris flows.
The main uses of groundwater are for household and industry.
syr Darya river Basin22
Kazakhstan, Kyrgyzstan, Tajikistan and Uzbekistan share the ba-sin of the Syr Darya. The Naryn, Kara Darya and Chirchik trans-boundary sub-basins of the Syr Darya are assessed separately.
Some literature sources quote a basin area of up to 782,600 km2; some quote 142,200 km2 as the basin area upstream of the point where the river leaves the Fergana Valley.
Hydrology and hydrogeologyThe river is strongly regulated, major reservoirs include the Kay-rakkum Reservoir (design capacity 3.4 km3) and the Chardara Reservoir in Kazakhstan (design capacity 5.2 km3). The infra-structure for flow regulation was built mainly from the 1960s to 1980s, but some developments date from the 2000s. The most recently constructed dam is the Koksarai in Kazakhstan (volume about 3 km3), the filling of which began in January 2011, to sup-ply irrigation water to the provinces of Kyzyl-Orda and Southern Kazakhstan.
In Kyrgyzstan, the surface water flow amounts to 27.6 km3/year including the tributaries Naryn and Kara Darya. In Kazakhstan, surface water resources are estimated at 19.66 km3/year (14.96 km3 of it originating from outside the country), and groundwater resources at 2.838 km3/year.
21 Source: Dam Safety in Central Asia: Capacity-Building and Regional Cooperation. UNECE. Water Series No. 5. 2007.22 Based on information provided by Kazakhstan, Kyrgyzstan and Tajikistan, as well as the First Assessment. 23 The updated inventory is for the most part based on the inventory by UNESCO and IGRAC in 2009.
ZeRaVShaN aquifeR (No. 14)
Tajikstan uzbekistanType 4, Quaternary; boulder-pebble, pebble; groundwater flow direction from Tajikistan to Uzbekistan; medium links with surface waters. Area (km2) 383 N/AThickness: mean, max (m) 36, 110 N/A
TRaNSBouNdaRy aquifeRS iN The SyR daRya RiVeR BaSiN23
Name
Country to which the information refers (country also sharing the aquifer) area (km2)
Shared boundary
length (km)
Confined/unconfined, aquifer type
Lithologies and stratigraphy
mean thickness
(m)
max thickness
(m)dominant
flow directionLink with
surface waterOsh-Aravan (No. 15)*
Kyrgyzstan 718.3 mostly unconfined
boulder-pebble, pebble
200-250 400 towards Uzbekistan
medium
Uzbekistan 1 266 90 confined boulder-pebble drifts
90-150 300 towards Uzbekistan
medium
Almos-Vorzik (No. 16)*
Uzbekistan (Kyrgyzstan)
485 20 unconfined pebbles with streaks of clay
loam
100 300 towards Uzbekistan
medium
Maylusu (No. 17)*
Uzbekistan (Kyrgyzstan)
387 25 confined pebble with streaks of clay and
loam
150 300 towards Uzbekistan
medium
Sokh (No. 18)*
Uzbekistan (Kyrgyzstan)
1 810 55 confined boulder-pebble drifts with streaks
of clay loam,
200 350 towards Uzbekistan
medium
Dalverzin (No. 19)*
Tajikistan (Uzbekistan)
1 029 100 boulder, cobble sediments
20-120 120 towards Uzbekistan
Zafarobod (No. 20)*
Tajikistan, (Uzbekistan)
3 833 229 boulder, cobble sediments
60-70 70 towards Uzbekistan
Sulyukta-Batken-Nau-Isfara (No. 21)*
Tajikistan (Kyrgyzstan, Uzbekistan)
3 339 323 boulder, cobble sediments
50-120 120 towards Tajikistan,
Uzbekistan* The aquifers indicated with an asterisk were already assessed in the First Assessment and some complementary information can be found there. Please note that the names of some of the aquifers have been revised since.
Chapter 3 DRAINAGE BASIN OF THE ARAL SEA AND OTHER TRANSBOUNDARY WATERS IN CENTRAL ASIA | 113

figuRe 1: Sketch of the Syr Darya 1 aquifer (No. 22) (provided by Kazakhstan) PressuresKyrgyzstan assesses debris flows and landslides as a widespread and severe problem. The increased number of natural hazards, such as floods, is a concern. In terms of impact, Kyrgyzstan ranks all other pressure factors as local and moderate. The town of Kyzylorda and other settlements are generally flooded in winter when hydropower generation is maximized at the Toktogul Res-ervoir in Kyrgyzstan.
Irrigated agriculture is the biggest water user. Diversion of water for irrigation and water losses in the low-efficiency irrigation systems affect the hydrology, resulting in flow reduction below ecological flow. Because of all the withdrawals, little flow reaches Kazakhstan.
In Kazakhstan, Uzbekistan and Tajikistan, water pollution by return waters from extensively developed irrigated agriculture and from industrial wastewaters is reported. Pollution by urban wastewaters occurs also commonly, for instance in Kyrgyzstan,
Name
Country to which the information refers (country also sharing the aquifer) area (km2)
Shared boundary
length (km)
Confined/unconfined, aquifer type
Lithologies and stratigraphy
mean thickness
(m)
max thickness
(m)dominant
flow directionLink with
surface waterSyr-Darya 1 (No. 22)
Kazakhstan (Uzbekistan)
189 000 960 confined, intergranular/
multilayered
sand, gravel, pebbles
0.5-40 500-3000 Along the border
towards north-west
weak
Naryn (No. 23) Uzbekistan (Kyrgyzstan)
1 424 36 confined boulder-pebble drifts
200 350 towards Uzbekistan
medium
Chust-Pap (No. 24)
Uzbekistan (Kyrgyzstan)
456 55 confined pebble, boulder, gravel
100 200 towards Uzbekistan
medium
Kasansay (No. 25)
Uzbekistan (Kyrgyzstan)
164 30 confined pebble with streaks of clay
loam
80 200 towards Uzbekistan
medium
Shorsu (No. 26) Uzbekistan, Tajikistan
658 35 confined boulder, pebble with streaks of
clay loam
175 350 towards Uzbekistan
medium
Pretashkent (No. 27)*
Kazakhstan 17 020 394 confined, intergranular/
multilayered
sand, clay 200 400 towards Uzbekistan/
N-S
weak
Uzbekistan 1 079 85 confined/artesian
boulder and pebble sediment
with streaks of clay loam
300 550 towards Uzbekistan
medium
Iskovat-Pishkaran (No. 28)
Uzbekistan (Kyrgyzstan)
444 32 confined pebble with boulders
100 350 towards Uzbekistan
medium
* The aquifers indicated with an asterisk were already assessed in the First Assessment and some complementary information can be found there. Please note that the names of some of the aquifers have been revised since.
SyR daRya 1 aquifeR (No. 22)
Kazakhstan uzbekistanDoes not correspond with any of the described model aquifer types (see Figure 1); intergranular/multilayered aquifer (confined); sand, gravel and pebbles; groundwater flow direction along the border towards north-west; weak links with surface waters.Border length (km) 960 N/AArea (km2) 189 000 N/ARenewable groundwater resource (m3/d) 7.776 × 10⁶ N/AThickness: mean, max (m) 0.5–40, 500–3 000 N/AGroundwater uses and functions Some 67.73 × 10⁶ m3/year was abstracted in
2009, mainly for household water (88 %) and some for agriculture (8%) and industry (4%).
N/A
Pressure factors No problems reported at present time. Groundwater resources are used little.
N/A
Groundwater management measures Surveillance and early warning monitoring is indicated to be needed.
N/A
N -Q2 1
K al-s1-2
P N1 2-
PZ
K t2 1
K t sn2 2-
UZ KZ
saturated zone
confined aquifer
confined aquifer
aquiclude
aquiclude
114 | part iv

1
23
5
6 4
Toshkent
Bishkek
Almaty
Dushanbe
Ramsar SiteAydar-Arnasay Lakes
Syr DaryaChirchik
Chatkal
Kara Darya
NarynToktogulReservoir
KayrakkumRes.
ChardaraRes.
Son Kul
Issyk Kul
Chatyr KulAydarLake
CharvakRes.
Lake
Ba lkhash
ARAL SEA
PskemK Y R G Y Z S T A N
K A Z A K H S T A N
T A J I K I S T A N
UZ
BE
K
IS
TA
N C H I N A
70o 75o65o60o
45o
40o
The boundaries and names shown and the designations used on this mapdo not imply official endorsement or acceptance by the United Nations. UNEP/DEWA/GRID-Geneva 2011
0 100 200 300Kilometres
diSChaRgeS, popuLaTioN aNd LaNd CoVeR iN The SyR daRya RiVeR BaSiN
6 Chi
naz
5 Mou
th of
the T
ers r
iver
4 Kzy
lkish
lak
3 Uch
tepe
2 And
izhan
rese
rvoi
r
1 Uch
tere
k
Disc
harg
e (m
3 s-1) (
loga
rithm
ic sc
ale)
342
(Nar
yn)
(Kar
a Dar
ya)
(Kar
a Dar
ya)
(Syr
Dar
ya)
(Cha
tkal)
(Chi
rchik)
10000
1000
100
10
1
122
1190
1010
837
450
9
476
66 104
QavQmaxQmin
Popu
latio
n (in
mill
ions
)
0
4
8
12
16Uz
bekis
tan
Tajik
istan
Kyrg
yzsta
nKa
zakh
stan
2.92.0
2.8
14.4 Country information/otherLandScanTM
2%1%
21%
19% 57%
Forest (<1%)Urban/Industrial areas (<1%)Wetlands (<1%)
Grassland/ShrublandSurface with little or no vegetation
Others
Water bodies
Cultivated
Sources: UNEP/DEWA/GRID-Europe 2011; Statistics Agency of Kazakhstan, 2006
Chapter 3 DRAINAGE BASIN OF THE ARAL SEA AND OTHER TRANSBOUNDARY WATERS IN CENTRAL ASIA | 115

due to wastewater collection frequently lacking, or the capacity of the network being insufficient. Landfills for household waste are also a pressure factor.
StatusIn 2009, the water quality of both the Syr Darya and the Keles tributary was classified as “polluted” (class 4) according to the water quality classification of Kazakhstan. From 2001 to 2006 and in 2008, the water quality was classified as “moderately pol-luted” (class 3). The water quality has degraded slightly based on the water pollution index, which has increased from 1.26 in 2001 to 2.57 in 2009 (Kokbulak station).
Transboundary cooperation and responsesFollowing the 1998 Agreement concerning the use of water and energy resources in the Syr Darya River Basin between Kazakh-stan, Kyrgyzstan, Tajikistan and Uzbekistan, a number of annual intergovernmental bilateral and multilateral agreements have been signed over the past fifteen years, mainly related to use of water and energy resources of the Naryn-Syr Darya cascade of reservoirs. In 2003 and subsequently, only ad-hoc annual bilat-eral or multi-lateral agreements have been made, and lately such agreements have been limited to Kazakhstan and Kyrgyzstan.
Since late 2005, under the regional technical assistance of the Asian Development Bank, a draft agreement has been developed on the Syr Darya, but its finalization and adoption are still pending.
From some 100 hydrological monitoring stations in Kyrgyz ter-ritory within the Syr Darya Basin in 1980, currently only 28 are operational.
Water users’ associations are being established to improve agri-cultural water use in Kyrgyzstan, where tariffs on supply of ir-rigation water are also applied. The Water Resources Committee of Kyrgyzstan, plans to set up an analysis and information center and develop a unified information system on water.
Total water withdrawal and withdrawals by sector in the Syr Darya Basin
Country yearTotal withdrawal
×106 m3/year agricultural % domestic % industry % energy % other %Kazakhstan 2006 7 722 88.62 0.96 0.61 - 9.81Kyrgyzstan 2007 1 665 77 10.6 12.4 - -Tajikistan N/A 0.000035 N/A N/A N/A N/A N/AUzbekistan 2009 10 127 93.8 4.1 1.0 0.2 0.9
Water quality classification in the Syr Darya Basin
Location of observation in the Syr darya Basin
Water pollution indexa – water quality classification
parameters exceeding maC multiplier of maC exceedence2008 2009Syr Darya, Kokbulak station
2.15; “moderately polluted” (class 3)
2.57; “polluted” (class 4) sulphates 3.79copper (2+) 4.63
nitrite nitrogen 3.13phenols 3.00
Keles tributary, at the mouth
3.76, “polluted” (class 4) 3.30, “polluted” (class 4) sulphates 9.21copper (2+) 2.90magnesium 1.56phosphates 1.31
a The water pollution index is based on the relationship of the measured values, and the maximum allowable concentration (MAC) of water-polluting components. Source: Kazhydromet, Ministry of Environmental Protection of Kazakhstan.
ayDar arnasay Lakes system24
General description of the wetland The Aydar Arnasay Lakes System is a human-made reservoir located in the salt flats of south-eastern Kyzylkum desert. It was formed as a result of an emergency measure of flood con-trol to prevent the breaking of Chardara irrigation dam, and in order to prevent damage downstream of the Syr Darya in the territory of Kazakhstan in 1969 (21.0 km3). The System includes three brackish water lakes (Aydar-Kul, Arnasay and Tuzkan). It is one of the largest reservoirs in Uzbekistan, cov-ering about 3,500 km2, with an average depth of 8-10 meters. The water of the reservoir ranges from medium to strongly saline. Being located at the crossroads of two migratory bird flyways, the Afro-Eurasian and the Central-Asian, the lake system plays an extremely important role as a gathering site. The area is only sparsely populated.
Main wetland ecosystem services Given that the Aydar Arnasay Lakes System could not al-ways protect downstream of Syr Darya River from flooding in the spring and winter periods, the Koksarai Reservoir was built. Before that, large floods on Kazakh territory caused by the changing of Toktogul hydropower station’s operational regime from irrigational to energetic triggered significant economic losses. The reservoir stores collector-drainage wa-ters, which cannot be used for irrigational purposes without additional treatment. During the spring period, concentra-tions of polluting substances are below MACs in the most parts of the reservoir. This allows the use of the reservoir for aquaculture and subsistence, as well as industrial fish-ing purposes, for which a number of fish have been intro-duced into the lakes. Fishing accounted for 73.5 % of the total amount of fish from natural reservoirs in Uzbekistan in 2003, and 41.6 % in 2005. Besides fishing, the reservoir
24 Source: Information Sheet on Ramsar Wetlands.
116 | part iv
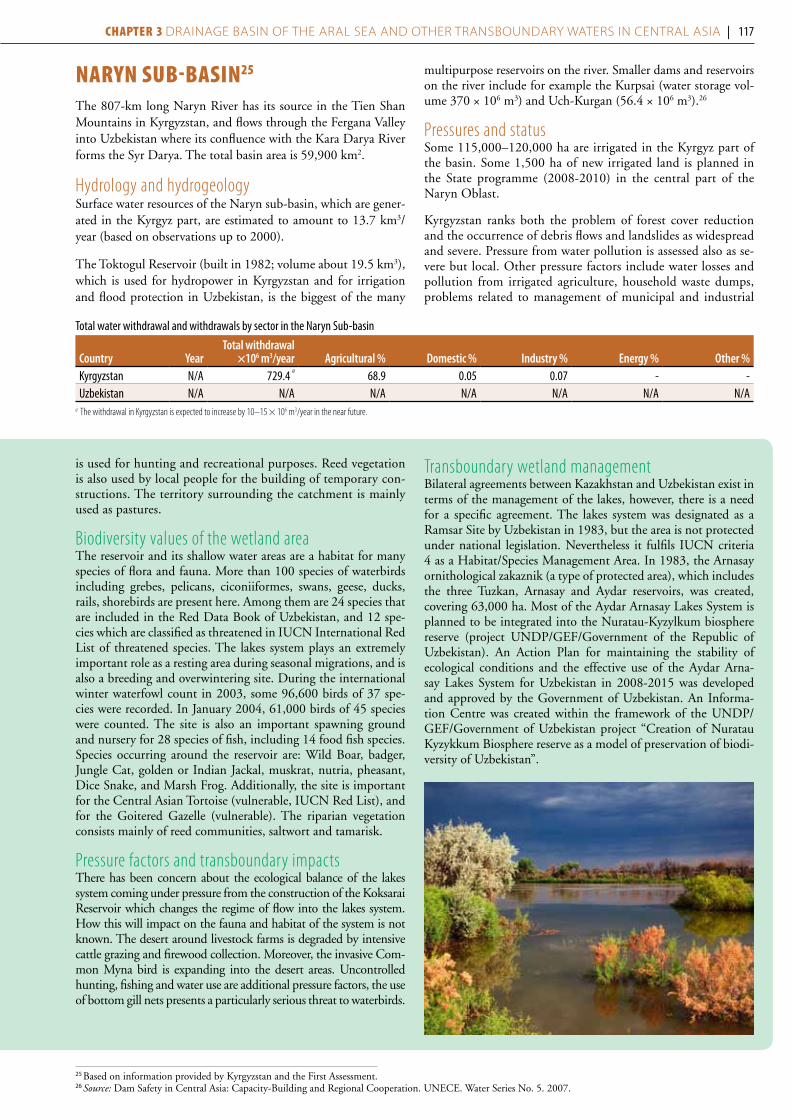
is used for hunting and recreational purposes. Reed vegetation is also used by local people for the building of temporary con-structions. The territory surrounding the catchment is mainly used as pastures.
Biodiversity values of the wetland areaThe reservoir and its shallow water areas are a habitat for many species of flora and fauna. More than 100 species of waterbirds including grebes, pelicans, ciconiiformes, swans, geese, ducks, rails, shorebirds are present here. Among them are 24 species that are included in the Red Data Book of Uzbekistan, and 12 spe-cies which are classified as threatened in IUCN International Red List of threatened species. The lakes system plays an extremely important role as a resting area during seasonal migrations, and is also a breeding and overwintering site. During the international winter waterfowl count in 2003, some 96,600 birds of 37 spe-cies were recorded. In January 2004, 61,000 birds of 45 species were counted. The site is also an important spawning ground and nursery for 28 species of fish, including 14 food fish species. Species occurring around the reservoir are: Wild Boar, badger, Jungle Cat, golden or Indian Jackal, muskrat, nutria, pheasant, Dice Snake, and Marsh Frog. Additionally, the site is important for the Central Asian Tortoise (vulnerable, IUCN Red List), and for the Goitered Gazelle (vulnerable). The riparian vegetation consists mainly of reed communities, saltwort and tamarisk.
Pressure factors and transboundary impactsThere has been concern about the ecological balance of the lakes system coming under pressure from the construction of the Koksarai Reservoir which changes the regime of flow into the lakes system. How this will impact on the fauna and habitat of the system is not known. The desert around livestock farms is degraded by intensive cattle grazing and firewood collection. Moreover, the invasive Com-mon Myna bird is expanding into the desert areas. Uncontrolled hunting, fishing and water use are additional pressure factors, the use of bottom gill nets presents a particularly serious threat to waterbirds.
Transboundary wetland managementBilateral agreements between Kazakhstan and Uzbekistan exist in terms of the management of the lakes, however, there is a need for a specific agreement. The lakes system was designated as a Ramsar Site by Uzbekistan in 1983, but the area is not protected under national legislation. Nevertheless it fulfils IUCN criteria 4 as a Habitat/Species Management Area. In 1983, the Arnasay ornithological zakaznik (a type of protected area), which includes the three Tuzkan, Arnasay and Aydar reservoirs, was created, covering 63,000 ha. Most of the Aydar Arnasay Lakes System is planned to be integrated into the Nuratau-Kyzylkum biosphere reserve (project UNDP/GEF/Government of the Republic of Uzbekistan). An Action Plan for maintaining the stability of ecological conditions and the effective use of the Aydar Arna-say Lakes System for Uzbekistan in 2008-2015 was developed and approved by the Government of Uzbekistan. An Informa-tion Centre was created within the framework of the UNDP/GEF/Government of Uzbekistan project “Creation of Nuratau Kyzykkum Biosphere reserve as a model of preservation of biodi-versity of Uzbekistan”.
naryn suB-Basin25 The 807-km long Naryn River has its source in the Tien Shan Mountains in Kyrgyzstan, and flows through the Fergana Valley into Uzbekistan where its confluence with the Kara Darya River forms the Syr Darya. The total basin area is 59,900 km2.
Hydrology and hydrogeologySurface water resources of the Naryn sub-basin, which are gener-ated in the Kyrgyz part, are estimated to amount to 13.7 km3/year (based on observations up to 2000).
The Toktogul Reservoir (built in 1982; volume about 19.5 km3), which is used for hydropower in Kyrgyzstan and for irrigation and flood protection in Uzbekistan, is the biggest of the many
multipurpose reservoirs on the river. Smaller dams and reservoirs on the river include for example the Kurpsai (water storage vol-ume 370 × 106 m3) and Uch-Kurgan (56.4 × 10⁶ m3).26
Pressures and statusSome 115,000–120,000 ha are irrigated in the Kyrgyz part of the basin. Some 1,500 ha of new irrigated land is planned in the State programme (2008-2010) in the central part of the Naryn Oblast.
Kyrgyzstan ranks both the problem of forest cover reduction and the occurrence of debris flows and landslides as widespread and severe. Pressure from water pollution is assessed also as se-vere but local. Other pressure factors include water losses and pollution from irrigated agriculture, household waste dumps, problems related to management of municipal and industrial
25 Based on information provided by Kyrgyzstan and the First Assessment. 26 Source: Dam Safety in Central Asia: Capacity-Building and Regional Cooperation. UNECE. Water Series No. 5. 2007.
Total water withdrawal and withdrawals by sector in the Naryn Sub-basin
Country yearTotal withdrawal
×106 m3/year agricultural % domestic % industry % energy % other %Kyrgyzstan N/A 729.4
a68.9 0.05 0.07 - -
Uzbekistan N/A N/A N/A N/A N/A N/A N/Aa The withdrawal in Kyrgyzstan is expected to increase by 10–15 × 106 m3/year in the near future.
Chapter 3 DRAINAGE BASIN OF THE ARAL SEA AND OTHER TRANSBOUNDARY WATERS IN CENTRAL ASIA | 117

wastewater (including lack of wastewater collection, or insuffi-cient capacity of networks and resulting pollution), waste from mining and pollution from livestock breeding.
Pressures from pollution concentrate in the more populated downstream part, whereas in the upper reaches water quality is generally good.
Transboundary cooperation and responsesIssues related to the operation of the Naryn-Syr Darya cascade of reservoirs are settled in the framework of the Interstate Commis-sion for Water Coordination of Central Asia, or in the bilateral intergovernmental commission.
In the Kyrgyz part of the basin, there are nine gauging stations operating at present. With the commissioning of the Kambara-ta dam and reservoir for hydropower generation,27 setting one up upstream becomes necessary. Despite some recent enhance-ments, the monitoring network of water resources and glaciers is not adequate.
kara Darya suB-Basin28 The 180-km long Kara Darya is a tributary of the Syr Darya, originating in Kyrgyzstan and flowing into Uzbekistan in the Fer-gana Valley. The catchment area of the Kara Darya is 30,100 km2.
Hydrology and hydrogeologyIn Kyrgyzstan, surface water resources are estimated at 7.10 km3/year (based on observations up to 2000).
The flow is heavily regulated. The reservoirs in the sub-basin include the Andijan29 (constructed in 1978 with storage capac-ity of 1.75 km3), the smaller Teshiktash, and Kujganya Reser-voirs, and the Bazar-Kurgansky Reservoir (built 1962) on the Kara Unkur tributary.
PressuresIn the area of the Mailuu-Suu (a tributary of the Kara Darya) in Kyrgyzstan, 23 uranium tailings ponds and 13 mining dumps pose a contamination risk. The total area of the tailings and waste rock dumps is 606,800 m2, and the total volume of mate-rial dumped is about 2 million m3. An accidental release of the contents, due to the failure of a tailings pond wall, would affect downstream.
An increase in the occurrence of natural hazards such as floods, is a concern. Debris flows and landslides are ranked as a wide-spread and severe pressure factor by Kyrgyzstan.
ResponsesRehabilitation of irrigation canals and water diversion struc-tures, and strengthening of river banks has been carried out in Kyrgyzstan.
There is a lack of observations of water quality and suspended solids. Constraints to monitoring include an insufficient network of monitoring stations, a lack of equipment, as well as the poor state of gauging stations and living conditions of observers. Some of these gaps are foreseen to be addressed through the World Bank projects “Improving Water Management” and “Improving the provision of services related to weather, climate and water resources” in Kyrgyzstan. Information is exchanged between Kyr-gyzstan and Uzbekistan about the Andijan Reservoir.
The Jalal-Abad River Basin Council was established from 2008 to 2009 in the Kara Darya Basin in Kyrgyzstan. The council is expected to increase public participation in decision-making. The above-mentioned World Bank project also involves prepara-tion of basin plans for development, use and protection of water resources. Specifically, a plan for development, use and protec-tion of water resources is being developed for the Kugart tribu-tary of the Kara Darya.
TrendsThe inauguration of some new irrigated land is planned in the near future, according to the Kyrgyz State Programme of con-struction of water facilities and development of new irrigated land for the period 2008-2010.
ChirChik suB-Basin30
Kazakhstan, Kyrgyzstan and Uzbekistan are riparian countries to the Chirchik River. The total catchment area is 14,240 km2. The Chirchik originates in Kyrgyzstan at the confluence of the Chatkal (shared by Kyrgyzstan and Uzbekistan) and the Pskem. Currently, both rivers supply the Charvak Reservoir.
Hydrology and hydrogeologyDownstream from the Charvak Reservoir, the Chirchik is fully regulated, for example at Charvaksky (for hydropower, irriga-tion) and Tashkentsky (for irrigation).
Flow is transferred to the Keles31 and Akhangaran Basins from time to time.
PressuresThe main uses of the Chirchik’s water are irrigation and hydro-power generation. The Chirchik is used intensively in the low-land part for irrigation through a canal system, which includes the Zakh, Bozsu and Northern Tashkent canals.
Main industries in the basin include the Khodjikent asphalt and concrete plant, the Electrokhimprom manufacturing firm, and the Uzbek metal manufacturing complex. Pollution emissions from these industries in many cases exceed allowed standards.
The high sediment load in the upstream part of the river has re-quired setting up facilities to protect the Chirchik-Bozsu Cascade of hydropower stations.
Total water withdrawal and withdrawals by sector in the Kara Darya Sub-basin
Country yearTotal withdrawal
×106 m3/year agricultural % domestic % industry % energy % other %Kyrgyzstan N/A 831.4
a93 4.3 0.3 - 0.2
Uzbekistan 2009 2 542 86.5 6.0 0.1 - 7.3a Withdrawal in Kyrgyzstan is expected to increase by 160 × 106 m3/year.
27 Kambarata 2 has been constructed, Kambarata 1 is pending.28 Based on information provided by Kyrgyzstan and the First Assessment. 29 The reservoir is also known as Kampyrravatsk, due to the location in the gorge with that name.30 Based on information provided by Kazakhstan and the First Assessment.31 The Keles is a non-transboundary tributary of the Syr Darya in Kazakhstan.
118 | part iv

ChatkaL suB-Basin32 The 217-km long Chatkal River originates in Kyrgyzstan and flows into the Chirchik in Uzbekistan. Some 5,520 km2 of the total catchment area (7,110 km2) is reported to be in Kyrgyzstan’s territory.
Surface water resources in the Kyrgyz part of the sub-basin are estimated at 2.71 km3/year.
Pressures Water pollution by return waters and water losses related to ir-rigation are reported among the pressures. The area of irrigated land in the Kyrgyz part of the basin is 6,451 ha.
Wastewaters are not collected, and their untreated or insufficient-ly-treated discharges cause water pollution. Only Kanysh-Kiya, out of eight villages in the sub-basin, has a wastewater treatment plant. Dumps of household waste also exert pressure.
According to Kyrgyzstan, the increase in the number of floods is a concern. Mudflows and landslides are assessed as a widespread and severe problem. Suspended solids degrade water quality.
Responses and trendsThe former gauging station at the mouth of the tributary Ters in Kyrgyzstan is out of operation since 1992. The Hydrometeoro-logical Service of Uzbekistan has an operating gauging station in Khudajdodsaj.
Due to climate change impacts, in Kyrgyzstan river flow is ex-pected to increase by 2025, and decline after. Under such cir-cumstances, the formation and breaking of proglacial lakes is considered possible, increasing the risk of floods and flood debris along the river.
araL sea33 The Aral Sea is an endorheic lake (or presently a group of lakes) shared by Kazakhstan and Uzbekistan. The basin of the lake consists of the basins of the rivers Amu Darya, Syr Darya and Zeravshan.
Since the 1960s, due to the intensive use for irrigation (mainly for cotton) of the rivers that feed it, the lake has shrunk, and its water level has dropped. The Aral Sea first split into two, separate lakes: the North Aral Sea and the South Aral Sea. Later, in 2003, the latter split into eastern and western lakes.
Pressures and statusThe surface area of the South Aral Sea is still shrinking, and the pollution and increased salinity have killed most of its natural flora and fauna. The water situation from year to year is, however, highly variable. A significant proportion of the Aral Sea (some 33,000 km2) has dried up, leaving plains covered with salt and toxic chemicals from weapons testing, industry and agriculture (fertilizers), which are blown around by the wind.
The lack of freshwater and the dust impact negatively on human health.
ResponsesThere has been a partial reversal in the loss of the North Aral Sea in Kazakhstan, which is sustained by the Syr Darya. The Kok-Aral Dam project (completed in 2005) separating this lake raised its water level from 30 to 42 meters, causing the salinity to drop. An important positive effect was the revival of fisheries. This ef-fort is planned to be followed up, and a possible increase of the water level is being discussed. Efforts have also been made in the Amu Darya delta in Uzbekistan to establish water bodies and artificially regulated lakes.
Various donors have supported projects aimed at improving the Aral Sea conditions under different frameworks, including the Global Environmental Facility, TACIS, the World Bank, and in-dividual donors. Efforts to improve the microclimate, combat erosion, and limit desertification, deforestation, and the loss of biodiversity, have been carried out with variable success.
Considerable social efforts are also made by the respective coun-tries to alleviate the situation of the population suffering from the drying out of the Sea. The Heads of State of the Central Asian countries have reiterated in declarations their concern for the situation of the Aral Sea.
A third phase of the Aral Sea Basin Programme (ASBP-3) has been prepared to improve the socio-economic and environmen-tal situation in the Aral Sea Basin, and donor funding is sought for the portfolio of projects. The four main directions of the ASBP-3 are: IWRM; environmental protection; socio-economic development; and improving institutional and legal instruments.
TrendsThe deltas and delta lakes of the Amu Darya and Syr Darya are important for the local population for their livelihoods, and for the quality of the environment. Efforts to support their conserva-tion are needed.
The situation of the South Aral Sea is only expected to change if the (consumptive) withdrawals from the Amu Darya River are reduced. The efforts that have been made to increase water ef-ficiency should be continued and further increased.
The management of drainage water from irrigation also influenc-es the situation. The collection of drainage water into the Gold-en Century Lake by Turkmenistan aims to reduce discharges of drainage water into the Aral Sea. However, the consequences of the decreased water flow in the lower Amu Darya are to be as-sessed.
Chu-taLas river Basins34 The Chu-Talas Basins, which are shared by Kazakhstan and Kyr-gyzstan, include the basins of three transboundary rivers: the Chu,35 the Talas and the Assa. Most of the run-off of the Chu, Talas and Assa forms in Kyrgyzstan. The flow of the three rivers is regulated. In addition to 204 smaller rivers, the Chu-Talas Basins encompass 35 lakes and a few large water reservoirs.
32 Based on information provided by Kyrgyzstan and the First Assessment.33 Based on the First Assessment and the Second Environmental Performance Review of Uzbekistan, UNECE, 2010.34 Based on information provided by Kazakhstan and Kyrgyzstan, and the First Assessment. 35 In Kazakhstan the river is known as the Shu.
Chapter 3 DRAINAGE BASIN OF THE ARAL SEA AND OTHER TRANSBOUNDARY WATERS IN CENTRAL ASIA | 119
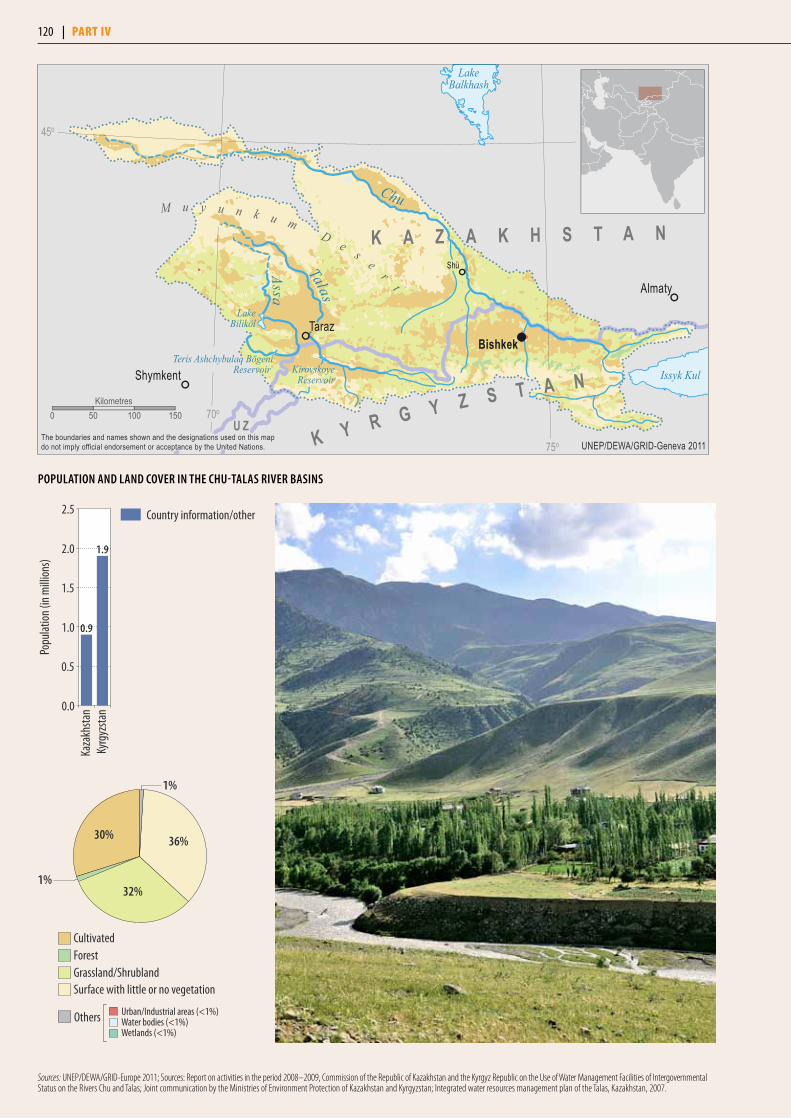
popuLaTioN aNd LaNd CoVeR iN The Chu-TaLaS RiVeR BaSiNS
Popu
latio
n (in
mill
ions
)
0.0
0.5
1.0
1.5
2.0
2.5
Kyrg
yzsta
nKa
zakh
stan
0.9
1.9
Country information/other
Urban/Industrial areas (<1%)Water bodies (<1%)Wetlands (<1%)
CultivatedForestGrassland/Shrubland
1%
43%
1%
52%
30%
32%
36%
Others
Surface with little or no vegetation
Almaty
TarazBishkek
Shymkent
Shü
LakeBiliköl
Issyk Kul
LakeBalkhash
Chu
Talas
Assa
KirovskoyeReservoir
Teris Ashchybulaq BögeniReservoir
K A Z A K H S T A N
K Y R G Y Z S T A N
M u y u n k u m De s
er
t
U Z
45o
75o
70o0 50 100 150Kilometres
The boundaries and names shown and the designations used on this mapdo not imply official endorsement or acceptance by the United Nations. UNEP/DEWA/GRID-Geneva 2011
Sources: UNEP/DEWA/GRID-Europe 2011; Sources: Report on activities in the period 2008–2009, Commission of the Republic of Kazakhstan and the Kyrgyz Republic on the Use of Water Management Facilities of Intergovernmental Status on the Rivers Chu and Talas; Joint communication by the Ministries of Environment Protection of Kazakhstan and Kyrgyzstan; Integrated water resources management plan of the Talas, Kazakhstan, 2007.
120 | part iv
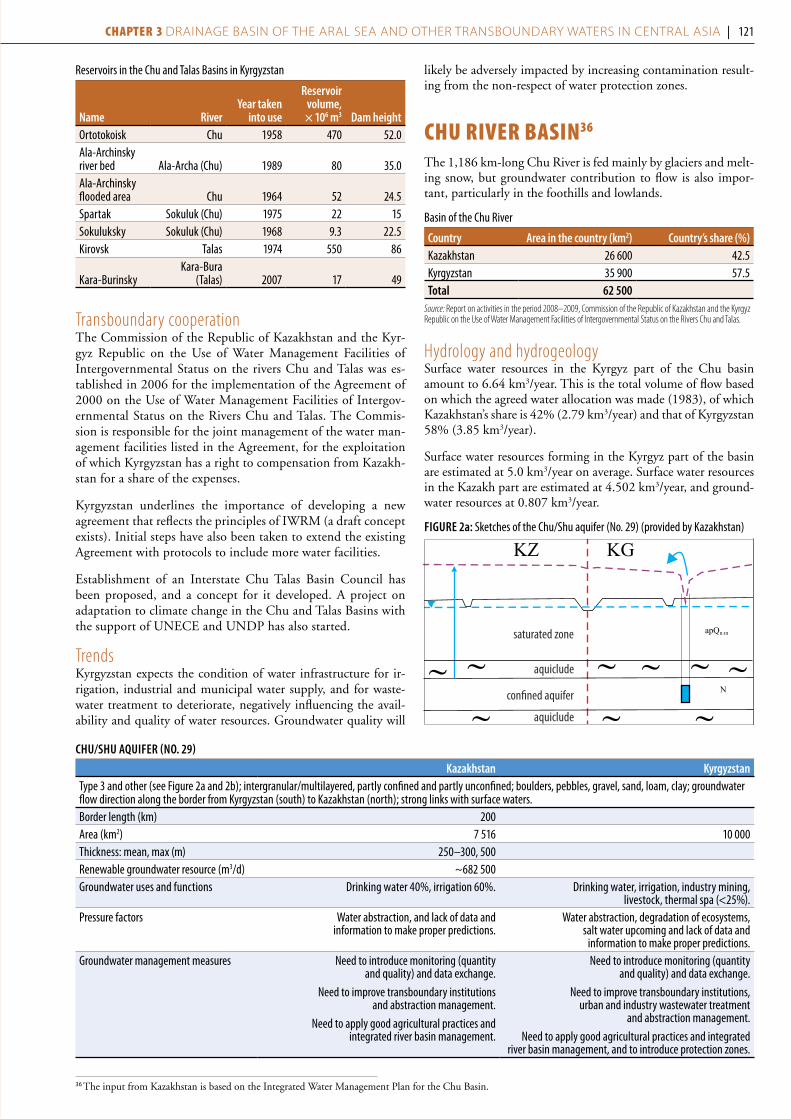
Reservoirs in the Chu and Talas Basins in Kyrgyzstan
Name Riveryear taken
into use
Reservoir volume, × 106 m3 dam height
Ortotokoisk Chu 1958 470 52.0Ala-Archinsky river bed Ala-Archa (Chu) 1989 80 35.0Ala-Archinsky flooded area Chu 1964 52 24.5Spartak Sokuluk (Chu) 1975 22 15Sokuluksky Sokuluk (Chu) 1968 9.3 22.5Kirovsk Talas 1974 550 86
Kara-BurinskyKara-Bura
(Talas) 2007 17 49
Transboundary cooperationThe Commission of the Republic of Kazakhstan and the Kyr-gyz Republic on the Use of Water Management Facilities of Intergovernmental Status on the rivers Chu and Talas was es-tablished in 2006 for the implementation of the Agreement of 2000 on the Use of Water Management Facilities of Intergov-ernmental Status on the Rivers Chu and Talas. The Commis-sion is responsible for the joint management of the water man-agement facilities listed in the Agreement, for the exploitation of which Kyrgyzstan has a right to compensation from Kazakh-stan for a share of the expenses.
Kyrgyzstan underlines the importance of developing a new agreement that reflects the principles of IWRM (a draft concept exists). Initial steps have also been taken to extend the existing Agreement with protocols to include more water facilities.
Establishment of an Interstate Chu Talas Basin Council has been proposed, and a concept for it developed. A project on adaptation to climate change in the Chu and Talas Basins with the support of UNECE and UNDP has also started.
TrendsKyrgyzstan expects the condition of water infrastructure for ir-rigation, industrial and municipal water supply, and for waste-water treatment to deteriorate, negatively influencing the avail-ability and quality of water resources. Groundwater quality will
likely be adversely impacted by increasing contamination result-ing from the non-respect of water protection zones.
Chu river Basin36 The 1,186 km-long Chu River is fed mainly by glaciers and melt-ing snow, but groundwater contribution to flow is also impor-tant, particularly in the foothills and lowlands.
Basin of the Chu River
Country area in the country (km2) Country’s share (%)Kazakhstan 26 600 42.5Kyrgyzstan 35 900 57.5Total 62 500
Source: Report on activities in the period 2008–2009, Commission of the Republic of Kazakhstan and the Kyrgyz Republic on the Use of Water Management Facilities of Intergovernmental Status on the Rivers Chu and Talas.
Hydrology and hydrogeologySurface water resources in the Kyrgyz part of the Chu basin amount to 6.64 km3/year. This is the total volume of flow based on which the agreed water allocation was made (1983), of which Kazakhstan’s share is 42% (2.79 km3/year) and that of Kyrgyzstan 58% (3.85 km3/year).
Surface water resources forming in the Kyrgyz part of the basin are estimated at 5.0 km3/year on average. Surface water resources in the Kazakh part are estimated at 4.502 km3/year, and ground-water resources at 0.807 km3/year.
figuRe 2a: Sketches of the Chu/Shu aquifer (No. 29) (provided by Kazakhstan)
Chu/Shu aquifeR (No. 29)
Kazakhstan KyrgyzstanType 3 and other (see Figure 2a and 2b); intergranular/multilayered, partly confined and partly unconfined; boulders, pebbles, gravel, sand, loam, clay; groundwater flow direction along the border from Kyrgyzstan (south) to Kazakhstan (north); strong links with surface waters.Border length (km) 200Area (km2) 7 516 10 000Thickness: mean, max (m) 250–300, 500Renewable groundwater resource (m3/d) ~682 500Groundwater uses and functions Drinking water 40%, irrigation 60%. Drinking water, irrigation, industry mining,
livestock, thermal spa (<25%).Pressure factors Water abstraction, and lack of data and
information to make proper predictions. Water abstraction, degradation of ecosystems,
salt water upcoming and lack of data and information to make proper predictions.
Groundwater management measures Need to introduce monitoring (quantity and quality) and data exchange.
Need to improve transboundary institutions and abstraction management.
Need to apply good agricultural practices and integrated river basin management.
Need to introduce monitoring (quantity and quality) and data exchange.
Need to improve transboundary institutions, urban and industry wastewater treatment
and abstraction management.Need to apply good agricultural practices and integrated
river basin management, and to introduce protection zones.
36 The input from Kazakhstan is based on the Integrated Water Management Plan for the Chu Basin.
KGKZ
apQII-III
N
saturated zone
confined aquifer
aquiclude
aquiclude
Chapter 3 DRAINAGE BASIN OF THE ARAL SEA AND OTHER TRANSBOUNDARY WATERS IN CENTRAL ASIA | 121

In both riparian countries, irrigated agriculture exerts pressure on water resources. The irrigated area is 131,000 ha in Kazakhstan and 330,000 ha in Kyrgyzstan. In addition, in Kyrgyzstan, the main pressure factors include untreated industrial and municipal waste-waters (e.g. Gorvodokanal in Bishkek), animal husbandry, mining (in the mountainous part), and unauthorized waste disposal close to settlements. Kyrgyzstan ranks wastewater discharges as widespread but moderate in impact. Radioactive substances are also among the problems. The flow regulation has decreased flooding of the low-lands, but this has adverse impacts on vegetation. Kyrgyzstan also reports problems with rising groundwater tables, as well as the wa-terlogging of irrigated lands and settlements. Water scarcity and drought are locally a concern in Kyrgyzstan.
StatusThe river Chu was classified as “polluted” (class 4) in 2010 according to the water resources quality classification in Kazakhstan; the water pollution index being 2.65. With the exception of 2002, when it was classified as “polluted” (class 4), water quality has consistently been “moderately polluted” from 2001 to 2006. The concentrations of the following substances exceeded the MAC in 2009: copper (4.37 MAC), BOD
5 (2.14 MAC), phenols (1.90 MAC), oil (1.05 MAC),
nitrite nitrogen (1.66 MAC).
ResponsesSince the 1970s, the number of hydrological monitoring stations on the Chu and its tributaries has decreased by more than two thirds; only seven remain operational. Below Ortotokoisk reservoir, there is not a single gauging station operating. Departmental gauging sta-tions of Zhambylhydrometcenter are built on the Aksy, Shargo and Karabalta tributaries. The Swiss Agency for Development and Co-operation has supported setting up a supervisory control and data acquisition system at irrigation facilities on the West Big Chu Canal to provide real-time information on water availability.
The technical status of water construction works, including irriga-tion channels, has been deteriorating. However, investments have been made, including the construction of the Kara-Burinsky dam in Kyrgyzstan for irrigation.
taLas river Basin37
The 661-km long Talas River is formed by the confluence of the Karakol and Uchkosha rivers, which originate from the Kyrgyz Ridge and the Talas Alatau. The river disappears into the Moinkum sands before reaching Lake Aydyn.
Basin of the Talas River
Country area in the country (km2) Country’s share (%)Kazakhstan 41 270 78.3Kyrgyzstan 11 430 21.7Total 52 700
Source: Joint communication by the Ministries of Environment Protection of Kazakhstan and Kyrgyzstan; Integrated water resources management plan of the Talas, Kazakhstan, 2007.
Hydrology and hydrogeologyAn investigation of channel water balances and an assessment of sur-face and groundwater resources are needed, due to absence of up-dated data. The estimated flow on which the equally-shared water allocation on the Talas has been made is 1.616 km3/year (based on the flow in 1983).
Total water withdrawal and withdrawals by sector in the Kara Darya Sub-basin
Country yearTotal withdrawal
×106 m3/year agricultural % domestic % industry % energy % other %Kyrgyzstan N/A 2 800 41.4 2.6 29.1 N/A N/AKazakhstan 2006 641 98.5 0.19 0.81 - 0.5
2010a 1 087 96.48 0.19 0.48 - 2.85a The figures are estimates.
SouTh TaLaS aquifeR (No. 30)
Kazakhstan KyrgyzstanDoes not correspond to any of the described model aquifer types (see Figure 3); intergranular/multilayered, partly confined (weak links with surface waters) and partly unconfined (strong links with surface waters); the Quaternary aquifer in the foothills consists of boulders-pebbles and towards north the sediment is increasingly fine-grained; the deeper Pliocene (Neogene) aquifer horizon is dominated by clays, conglomerates, and breccias with interlayers of sands and gravels; groundwater flow direction along the border from Kyrgyzstan (south) to Kazakhstan (north). Border length (km) 54 N/AArea (km2) 1 160Renewable groundwater resource (m3/d)
Exploitable resources in the Quaternary aquifer in Kazakhstan are estimated at 3 m3/s.
N/A
Thickness: mean, max (m) 50, 500 N/AGroundwater uses and functions Some 0.33 × 10⁶ m3/year was abstracted for household
water (80%) and for agriculture (20%) in 2009.N/A
Other information Recharged from streams flowing over pre-mountain (alluvial) cones.
N/A
37 The input from Kazakhstan is based on the Integrated Water Management Plan for the Talas Basin (2007).
apQII-III
apQII-III
apQII-III
N
KG KZ
figuRe 2b: Sketches of the Chu/Shu aquifer (No. 29)
122 | part iv

NoRTh TaLaS aquifeR (No. 31)
Kazakhstan KyrgyzstanDoes not correspond to any of the described model aquifer types (see Figure 4); intergranular/multilayered, partly confined and partly unconfined; consists of an upper Quaternary and a lower Pliocene aquifer; the Quaternary aquifer is made of pebbles, boulders and sand, the Pliocene one of conglomerates and sandstone; groundwater flow direction along the border from Kyrgyzstan (south) to Kazakhstan (north); strong links with surface waters.Border length (km) 58 N/AArea (km2) 689 N/ARenewable groundwater resource Exploitable resources in the Quaternary aquifer
in Kazakhstan are estimated at 8.4 m3/s.N/A
Thickness: mean, max (m) 25, 98 N/AGroundwater uses and functions Some 37.72 × 10⁶ m3/year was abstracted for
household water in 2009. Supports agriculture.N/A
Other information Quaternary aquifer has the maximum groundwater flow rate in the area between the Assa and Talas rivers.
Pliocene aquifer has been studied little.
N/A
apQI
KZ KG
KGKZ
apQI
N2
KZ KG
apQII-III
apQII-III
apQII-III
N2
KGKZ
apQII-IIIsaturated zone
confined aquifer
aquiclude
aquiclude
figuRe 3: Sketches of the South Talas aquifer (No. 30) (provided by Kazakhstan)
aQII-IV
N2
KG KZ
figuRe 4: Sketch of the North Talas aquifer (No. 31) (provided by Kazakhstan)
Chapter 3 DRAINAGE BASIN OF THE ARAL SEA AND OTHER TRANSBOUNDARY WATERS IN CENTRAL ASIA | 123

PressuresAgriculture is an important water user in both countries, and exerts pressure on water quantity. The irrigated area is 90,000 ha (including 27,000 ha of meadows and grasslands) in Ka-zakhstan, and 115,000 ha in Kyrgyzstan.
The main pressure factors in Kyrgyzstan are similar to those reported for the Chu River Basin, including untreated munic-ipal and industrial wastewater discharges, animal husbandry, mining in the mountainous parts and unauthorized disposal of waste next to settlements.
In Kazakhstan, there is also pressure on water quality from return waters from wastewater infiltration fields of the sugar and alcohol industries.
ResponsesAccording to Kyrgyzstan, 13 gauging stations are still opera-tional on the Talas (out of 21 formerly).
An advisory basin council was established in 2009 on the Ta-las in Kyrgyzstan. A plan for the development, use and protec-tion of water resources of the Talas has also been developed in Kyrgyzstan. The plan is expected to be implemented after consideration by the National Council on Water (established in 2006). Water users’ associations are being established.
assa river Basin38
The Assa River, shared by Kyrgyzstan and Kazakhstan, is formed by the confluence of two rivers – the Ters and Kukureusu (the last one is on the territory of Kyrgyzstan). The river is 253 km long, and the catchment area is 8,756 km2.
Water resources at the maximum run-off cross section in an average year is 12.5 m3/s. The flow of the Assa River is regulated by the Ters-Ashibulak Reservoir. Groundwater resources in the basin are estimated at 930,500 m3/day.
The water quality of the river Assa is classified as moderately polluted (class 3); the water pollution index is 1.2. There is no discharge of wastewaters into the river.
Total water withdrawal and withdrawals by sector in the Talas Basin
Country yearTotal withdrawal
×106 m3/year agricultural % domestic % industry % energy % other %Kyrgyzstan N/A 850 73.2 0.2 N/A N/A N/AKazakhstan N/A N/A N/A N/A N/A N/A N/A
Water quality classification in the Syr Darya Basin
Location of observation in the Talas Basin
Water pollution indexa – water quality classification
parameters exceeding maC multiplier of maC exceedence2008 2009Talas, Zhasorken station 1.18; “moderately
polluted” (class 3)1.17; “moderately polluted” (class 3)
copper (2+) 2.73total iron 1.1
Aksu 2.09, “moderately polluted” (class 3)
2.35, “moderately polluted” (class 3)
copper (2+) 4.46total iron 2.85sulphates 2.36
phenols 2.00Toktash N/A 2.97, “polluted” (class 4) copper (2+) 5.92
sulphates 3.40BOD5 2.98
phenols 2.08Oil products 1.06
Karabalta, at the border with Kyrgyzstan
3.96, “polluted” (class 4) 3.41, “polluted” (class 4) sulphates 7.14copper (2+) 5.32
total iron 3.00BOD5 2.19
manganese 2.2phenols 2.0
a The water pollution index is defined on the basis of the ratios of measured values and the maximum allowable concentration (MAC) of the water-quality determinands.Source: Kazhydromet, Ministry of Environmental Protection of Kazakhstan.
Status
38 Based on information provided by Kazakhstan.
124 | part iv

Bishkek
Almaty
Taldykorgan
Potential Ramsar SiteIli-Delta
La
ke
B a l k h a s h
Kapchagai Reservoir
Ili
Ili
Tekes
Kunes
Kash
K A Z A K H S T A N
K Y R G Y Z S T A N
C H I N A
45o
75o 80o
85o
UNEP/DEWA/GRID-Geneva 2011The boundaries and names shown and the designations used on this mapdo not imply official endorsement or acceptance by the United Nations.
0 50 100 150Kilometres
popuLaTioN aNd LaNd CoVeR iN The iLi RiVeR BaSiN
Popu
latio
n (in
mill
ions
)
0.0
0.5
1.0
1.5
2.0
2.5
3.0
Kaza
khsta
nCh
ina
2.22.4
Country information/otherLandScanTM
Sources: UNEP/DEWA/GRID-Europe 2011; Ministry of Environment Protection of Kazakhstan; Scheme of complex use and protection of water resources, Kazakhstan, 2008; Ministry of Environment Protection of Kazakhstan; Scheme of complex use and protection of water resources, Kazakhstan, 2008.
1%1%
28%
35%
29%
6%
Urban/Industrial areas (<1%)Wetlands (<1%)
ForestGrassland/Shrubland
Others
Surface with little or no vegetationWater bodies
Cultivated
Chapter 3 DRAINAGE BASIN OF THE ARAL SEA AND OTHER TRANSBOUNDARY WATERS IN CENTRAL ASIA | 125
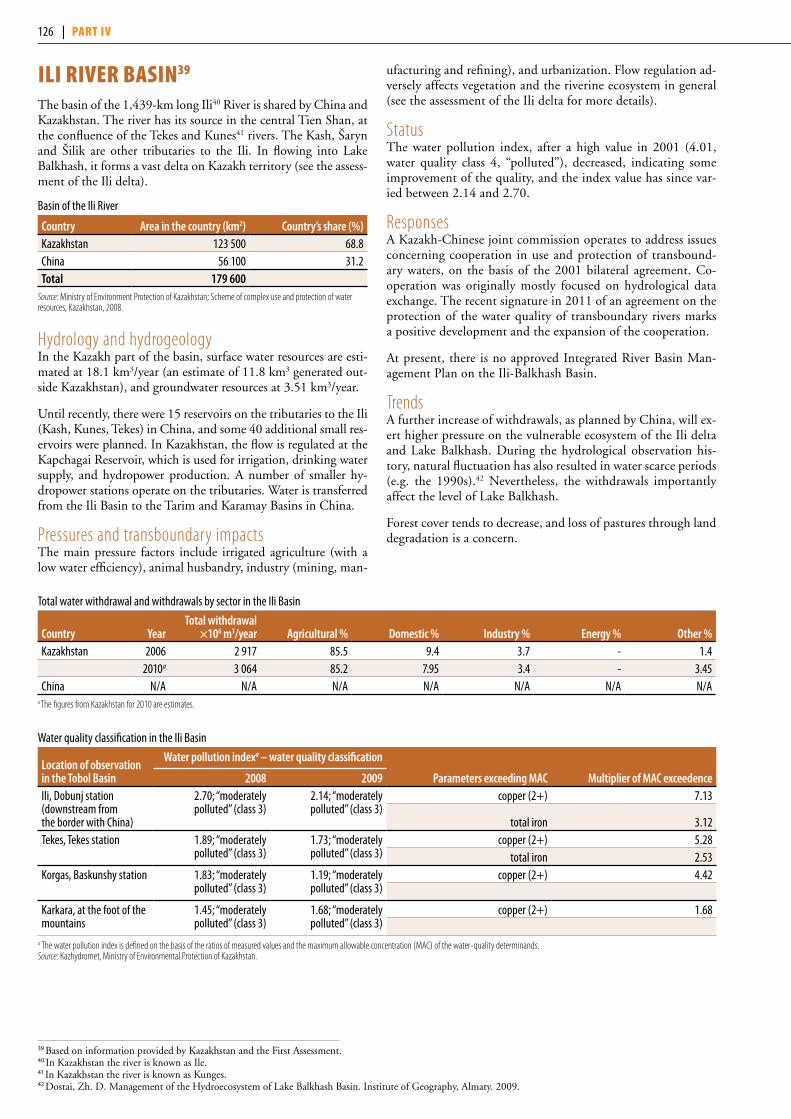
iLi river Basin39
The basin of the 1,439-km long Ili40 River is shared by China and Kazakhstan. The river has its source in the central Tien Shan, at the confluence of the Tekes and Kunes41 rivers. The Kash, Šaryn and Šilik are other tributaries to the Ili. In flowing into Lake Balkhash, it forms a vast delta on Kazakh territory (see the assess-ment of the Ili delta).
Basin of the Ili River
Country area in the country (km2) Country’s share (%)Kazakhstan 123 500 68.8China 56 100 31.2Total 179 600
Source: Ministry of Environment Protection of Kazakhstan; Scheme of complex use and protection of water resources, Kazakhstan, 2008.
Hydrology and hydrogeologyIn the Kazakh part of the basin, surface water resources are esti-mated at 18.1 km3/year (an estimate of 11.8 km3 generated out-side Kazakhstan), and groundwater resources at 3.51 km3/year.
Until recently, there were 15 reservoirs on the tributaries to the Ili (Kash, Kunes, Tekes) in China, and some 40 additional small res-ervoirs were planned. In Kazakhstan, the flow is regulated at the Kapchagai Reservoir, which is used for irrigation, drinking water supply, and hydropower production. A number of smaller hy-dropower stations operate on the tributaries. Water is transferred from the Ili Basin to the Tarim and Karamay Basins in China.
Pressures and transboundary impactsThe main pressure factors include irrigated agriculture (with a low water efficiency), animal husbandry, industry (mining, man-
ufacturing and refining), and urbanization. Flow regulation ad-versely affects vegetation and the riverine ecosystem in general (see the assessment of the Ili delta for more details).
StatusThe water pollution index, after a high value in 2001 (4.01, water quality class 4, “polluted”), decreased, indicating some improvement of the quality, and the index value has since var-ied between 2.14 and 2.70.
ResponsesA Kazakh-Chinese joint commission operates to address issues concerning cooperation in use and protection of transbound-ary waters, on the basis of the 2001 bilateral agreement. Co-operation was originally mostly focused on hydrological data exchange. The recent signature in 2011 of an agreement on the protection of the water quality of transboundary rivers marks a positive development and the expansion of the cooperation.
At present, there is no approved Integrated River Basin Man-agement Plan on the Ili-Balkhash Basin.
TrendsA further increase of withdrawals, as planned by China, will ex-ert higher pressure on the vulnerable ecosystem of the Ili delta and Lake Balkhash. During the hydrological observation his-tory, natural fluctuation has also resulted in water scarce periods (e.g. the 1990s).42 Nevertheless, the withdrawals importantly affect the level of Lake Balkhash.
Forest cover tends to decrease, and loss of pastures through land degradation is a concern.
Total water withdrawal and withdrawals by sector in the Ili Basin
Country yearTotal withdrawal
×106 m3/year agricultural % domestic % industry % energy % other %Kazakhstan 2006 2 917 85.5 9.4 3.7 - 1.4
2010a 3 064 85.2 7.95 3.4 - 3.45China N/A N/A N/A N/A N/A N/A N/A
a The figures from Kazakhstan for 2010 are estimates.
Water quality classification in the Ili Basin
Location of observation in the Tobol Basin
Water pollution indexa – water quality classification
parameters exceeding maC multiplier of maC exceedence2008 2009Ili, Dobunj station (downstream from the border with China)
2.70; “moderately polluted” (class 3)
2.14; “moderately polluted” (class 3)
copper (2+) 7.13
total iron 3.12Tekes, Tekes station 1.89; “moderately
polluted” (class 3)1.73; “moderately polluted” (class 3)
copper (2+) 5.28total iron 2.53
Korgas, Baskunshy station 1.83; “moderately polluted” (class 3)
1.19; “moderately polluted” (class 3)
copper (2+) 4.42
Karkara, at the foot of the mountains
1.45; “moderately polluted” (class 3)
1.68; “moderately polluted” (class 3)
copper (2+) 1.68
a The water pollution index is defined on the basis of the ratios of measured values and the maximum allowable concentration (MAC) of the water-quality determinands.Source: Kazhydromet, Ministry of Environmental Protection of Kazakhstan.
39 Based on information provided by Kazakhstan and the First Assessment.40 In Kazakhstan the river is known as Ile.41 In Kazakhstan the river is known as Kunges.42 Dostai, Zh. D. Management of the Hydroecosystem of Lake Balkhash Basin. Institute of Geography, Almaty. 2009.
126 | part iv

TeKeS aquifeR (No. 33)
Kazakhstan ChinaDoes not correspond to any of the described model aquifer types (see Figure 6); intergranular/multilayered, unconfined and confined aquifer in an intermountain artesian basin; boulders, pebbles, sand and gravel, with interbedded clays; groundwater flow direction from Kazakhstan (west) to China (east); strong links with surface waters.Border length (km) 70 N/AArea (km2) 1 876 N/AThickness: mean, max (m) 25, 50 N/ARenewable groundwater resource (m3/d) ~25 600Pressure factors Abstraction is substantially less than exploitable
groundwater resources. No problems present. N/A
Groundwater management measures Early warning and (regular) surveillance monitoring are needed.
N/A
apQII
KZ CN
figuRe 6: Sketch showing a part of the Tekes aquifer (No. 33) at Naryngolsky groundwater abstraction site (provided by Kazakhstan)
ZhaRKeNT aquifeR (No. 32)
Kazakhstan ChinaDoes not correspond to any of the described model aquifer types (see Figure 5); intergranular/multilayered, unconfined and confined aquifer in the Kopa-Ili intermountain artesian basin; Quaternary and Paleogene aquifer layers, underlain by Cretaceous-Palaeogene deposits; sand, gravel, pebbles, sandy loam; groundwater flow direction from both South to North and from North to South; links with surface waters range from strong to weak.Border length (km) 115 N/AArea (km2) 12 080 N/ARenewable groundwater resource (m3/d) 3.672 × 10⁶ N/AThickness: mean, max (m) 1 300, 2 830 N/AGroundwater uses and functions In 2009, groundwater abstraction about 3.52 × 10⁶ m3/
year; 50% for agricultural use, 50% for other uses.N/A
Pressure factors Abstraction is substantially less than exploitable groundwater resources. No problems present.
N/A
Groundwater management measures Early warning and (regular) surveillance monitoring need to be set up.
N/A
apQII-III
KZ CN
N2
aQ, apQ
KZ CN
K -P2 1
1
saturated zone
confined aquifer
confined aquifer
aquiclude
aquiclude
aquiclude
figuRe 5: Sketches of the Zharkent aquifer (No. 32) showing the aquifer in the foothills of the Dzhungaria in the northern part, where infiltrating surface water recharges the aquifer. The upper aquifer horizon is unconfined, and the lower aquifers lies at considerable depth (provided by Kazakhstan)
Chapter 3 DRAINAGE BASIN OF THE ARAL SEA AND OTHER TRANSBOUNDARY WATERS IN CENTRAL ASIA | 127
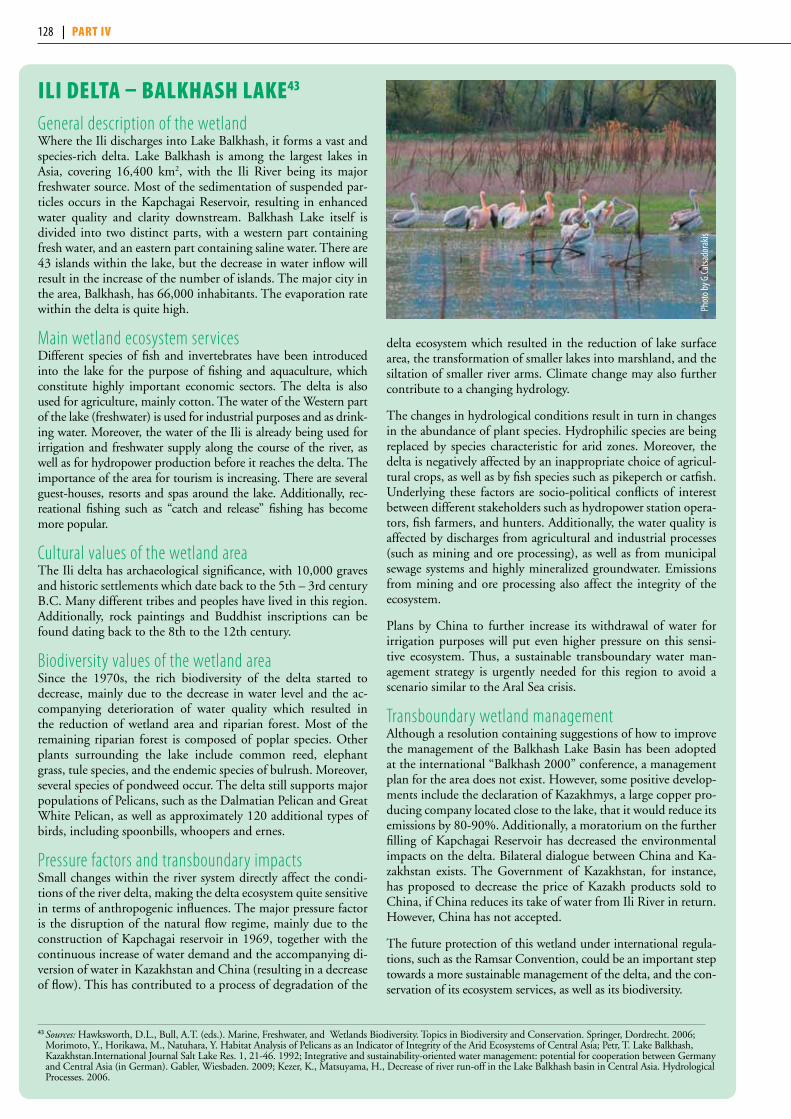
iLi DeLta – BaLkhash Lake43 General description of the wetland Where the Ili discharges into Lake Balkhash, it forms a vast and species-rich delta. Lake Balkhash is among the largest lakes in Asia, covering 16,400 km2, with the Ili River being its major freshwater source. Most of the sedimentation of suspended par-ticles occurs in the Kapchagai Reservoir, resulting in enhanced water quality and clarity downstream. Balkhash Lake itself is divided into two distinct parts, with a western part containing fresh water, and an eastern part containing saline water. There are 43 islands within the lake, but the decrease in water inflow will result in the increase of the number of islands. The major city in the area, Balkhash, has 66,000 inhabitants. The evaporation rate within the delta is quite high.
Main wetland ecosystem services Different species of fish and invertebrates have been introduced into the lake for the purpose of fishing and aquaculture, which constitute highly important economic sectors. The delta is also used for agriculture, mainly cotton. The water of the Western part of the lake (freshwater) is used for industrial purposes and as drink-ing water. Moreover, the water of the Ili is already being used for irrigation and freshwater supply along the course of the river, as well as for hydropower production before it reaches the delta. The importance of the area for tourism is increasing. There are several guest-houses, resorts and spas around the lake. Additionally, rec-reational fishing such as “catch and release” fishing has become more popular.
Cultural values of the wetland areaThe Ili delta has archaeological significance, with 10,000 graves and historic settlements which date back to the 5th – 3rd century B.C. Many different tribes and peoples have lived in this region. Additionally, rock paintings and Buddhist inscriptions can be found dating back to the 8th to the 12th century.
Biodiversity values of the wetland areaSince the 1970s, the rich biodiversity of the delta started to decrease, mainly due to the decrease in water level and the ac-companying deterioration of water quality which resulted in the reduction of wetland area and riparian forest. Most of the remaining riparian forest is composed of poplar species. Other plants surrounding the lake include common reed, elephant grass, tule species, and the endemic species of bulrush. Moreover, several species of pondweed occur. The delta still supports major populations of Pelicans, such as the Dalmatian Pelican and Great White Pelican, as well as approximately 120 additional types of birds, including spoonbills, whoopers and ernes.
Pressure factors and transboundary impactsSmall changes within the river system directly affect the condi-tions of the river delta, making the delta ecosystem quite sensitive in terms of anthropogenic influences. The major pressure factor is the disruption of the natural flow regime, mainly due to the construction of Kapchagai reservoir in 1969, together with the continuous increase of water demand and the accompanying di-version of water in Kazakhstan and China (resulting in a decrease of flow). This has contributed to a process of degradation of the
delta ecosystem which resulted in the reduction of lake surface area, the transformation of smaller lakes into marshland, and the siltation of smaller river arms. Climate change may also further contribute to a changing hydrology.
The changes in hydrological conditions result in turn in changes in the abundance of plant species. Hydrophilic species are being replaced by species characteristic for arid zones. Moreover, the delta is negatively affected by an inappropriate choice of agricul-tural crops, as well as by fish species such as pikeperch or catfish. Underlying these factors are socio-political conflicts of interest between different stakeholders such as hydropower station opera-tors, fish farmers, and hunters. Additionally, the water quality is affected by discharges from agricultural and industrial processes (such as mining and ore processing), as well as from municipal sewage systems and highly mineralized groundwater. Emissions from mining and ore processing also affect the integrity of the ecosystem.
Plans by China to further increase its withdrawal of water for irrigation purposes will put even higher pressure on this sensi-tive ecosystem. Thus, a sustainable transboundary water man-agement strategy is urgently needed for this region to avoid a scenario similar to the Aral Sea crisis.
Transboundary wetland managementAlthough a resolution containing suggestions of how to improve the management of the Balkhash Lake Basin has been adopted at the international “Balkhash 2000” conference, a management plan for the area does not exist. However, some positive develop-ments include the declaration of Kazakhmys, a large copper pro-ducing company located close to the lake, that it would reduce its emissions by 80-90%. Additionally, a moratorium on the further filling of Kapchagai Reservoir has decreased the environmental impacts on the delta. Bilateral dialogue between China and Ka-zakhstan exists. The Government of Kazakhstan, for instance, has proposed to decrease the price of Kazakh products sold to China, if China reduces its take of water from Ili River in return. However, China has not accepted.
The future protection of this wetland under international regula-tions, such as the Ramsar Convention, could be an important step towards a more sustainable management of the delta, and the con-servation of its ecosystem services, as well as its biodiversity.
43 Sources: Hawksworth, D.L., Bull, A.T. (eds.). Marine, Freshwater, and Wetlands Biodiversity. Topics in Biodiversity and Conservation. Springer, Dordrecht. 2006; Morimoto, Y., Horikawa, M., Natuhara, Y. Habitat Analysis of Pelicans as an Indicator of Integrity of the Arid Ecosystems of Central Asia; Petr, T. Lake Balkhash, Kazakhstan.International Journal Salt Lake Res. 1, 21-46. 1992; Integrative and sustainability-oriented water management: potential for cooperation between Germany and Central Asia (in German). Gabler, Wiesbaden. 2009; Kezer, K., Matsuyama, H., Decrease of river run-off in the Lake Balkhash basin in Central Asia. Hydrological Processes. 2006.
Phot
o by G
.Catsa
dora
kis
128 | part iv
murgaB river Basin44 The basin of the 852-km long Murgab River is shared by Af-ghanistan and Turkmenistan. The river originates in Afghani-stan at about 2,600 m a.s.l., and disappears into a desert sink in Kara Kum in Turkmenistan. The Abikajsar River is a major transboundary tributary. Other transboundary tributaries are the Gulrom, Khash and Kushan. The total basin area is ap-proximately 46,880 km2.
The long-term mean discharge of the river in Turkmenistan is 1,657 × 106 m3/year. In the part of the basin that is Afghani-stan’s territory, the run-off is 1,480 ×106 m3/year.
Agriculture is the predominant water user in the Murgab Ba-sin, feeding many irrigation channels. Some 80% of the popu-lation in the basin in Afghanistan live from agriculture. The bad conditions of the irrigation and water supply infrastruc-ture are a problem in Afghanistan. The efficiency of irrigation networks is estimated to be from 25 to 30%. However, the country has started to rehabilitate its irrigation infrastructure.
An increase of organic pollution has been observed in the past few years.
tejen/hariruD river Basin45 Afghanistan, the Islamic Republic of Iran, and Turkmenistan share the basin of the 1,124-km long Tejen/Harirud46 River. The river originates in the high mountains in Afghanistan. The Karukh is a major transboundary tributary.
Basin of the Harirud/Tejen River
Country area in the country (km2) Country’s share %Afghanistan 39 300 39.5Iran 49 264 43.7Turkmenistan 23 640 20.9Total 112 204
Sources: Ministry of Nature Protection of Turkmenistan, Ministry of Energy and Water of Afghanistan, Ministry of Energy (Water and Electricity) of the Islamic Republic of Iran, East West Institute (Making the most of Afghanistan’s River Basins opportunities for more cooperation, 2010).
Hydrology and hydrogeologyIn the Iranian part of the basin, surface water resources for the whole basin are estimated at 535 ×106 m3/year (average for the years 1950 to 2007), and groundwater resources at 2,547 ×106 m3/year. These represent 874 m3/year/capita. There is no permanent flow in the river, only seasonal.
Only the Sarakhs sub-basin in the border area has been studied; the rest of the basin is considered to have low transboundary groundwater potential (impermeable formations). Karstic aq-uifers may have some potential, but would need to be studied.
In Iran, in the Karat, Taybad, Torbat-e-jam, Janatabad and Aghdarband aquifers there is an extreme water deficit and wa-ter withdrawal from the aquifers is forbidden.
Pressures and statusThe Tejen/Harirud River is important to Afghanistan, not only because of its economic significance in Herat Province, but also due to its political importance as the border between Afghanistan and the Islamic Republic of Iran. In the Islamic Republic of Iran, the river is important for regional develop-ment in all sectors, and is vital for supplying water to the eastern part of Khorasan Razavi Province.
The total irrigable land area in Afghanistan’s part of the basin is 100,000 ha, but, due to the limited water availability, only 40,000 ha is being irrigated. Irrigated cropland (both by sur-face waters and groundwaters) makes up 292,920 ha in the Islamic Republic of Iran, representing 20% of the country’s share of the basin. Irrigation return waters affect water quality.
In Afghanistan, about 90% of the irrigation systems are tra-ditional, and the irrigation network’s efficiency is estimated at 25-30%. At the same time, insufficiency of water for ir-rigation is experienced both in Afghanistan and the Islamic Republic of Iran. The Shirtappeh diversion dam between Iran and Turkmenistan is under construction to supply water to agricultural areas around Sarakhs in both countries.
Water scarcity also affects forests.
44 Based on information provided by Afghanistan and on the First Assessment.45 Based on information provided by the Islamic Republic of Iran and the First Assessment. 46 The river is called Harirud in Iran and Tejen in Turkmenistan. It is also known as the Tedshen and the Gerirud.47 According to a water balance study in the Islamic Republic of Iran.
Name
Country to which the information refers
(country also sharing the aquifer) area (km2) mean thickness (m) max thickness (m)
dominant flow direction
Link with surface water
Karat aquifer (no. 34) Islamic Republic of Iran (Afghanistan)
350 65 N/A towards Afghanistan
medium
Taybad aquifer (No. 35) Islamic Republic of Iran (Afghanistan)
896 60 250 towards Afghanistan
medium
Torbat-e-jam aquifer (No. 36) Islamic Republic of Iran (Afghanistan)
2 142 65 300 towards Afghanistan
weak
Janatabad aquifer (No. 37) Islamic Republic of Iran (Afghanistan,
Turkmenistan)
350 35 N/A towards Afghanistan,
Turkmenistan
medium
Aghdarband aquifer (No. 38) Islamic Republic of Iran (Turkmenistan)
100 30 N/A towards Turkmenistan
weak
Sarakhas aquifer (No. 39)a Islamic Republic of Iran (Turkmenistan)
710 45 130 towards Turkmenistan
strong
Notes: All the aquifers in the table are of Type 3, alluvial and Quaternary in age. In the Islamic Republic of Iran , in the Karat, Taybad, Torbat-e-jam, Janatabad and Aghdarband aquifers there is an extreme water deficit and water withdrawal from the aquifers is forbidden. Groundwater supports ecosystems and agriculture, maintains base flow and springs, and prevents land subsidence.a According to a water balance study in the Islamic Republic of Iran, the Sarakhas aquifer is estimated to recharge by about 110 × 106 m3/year, mostly from the Tejen/Harirud River.Source: Islamic Republic of Iran.
Chapter 3 DRAINAGE BASIN OF THE ARAL SEA AND OTHER TRANSBOUNDARY WATERS IN CENTRAL ASIA | 129
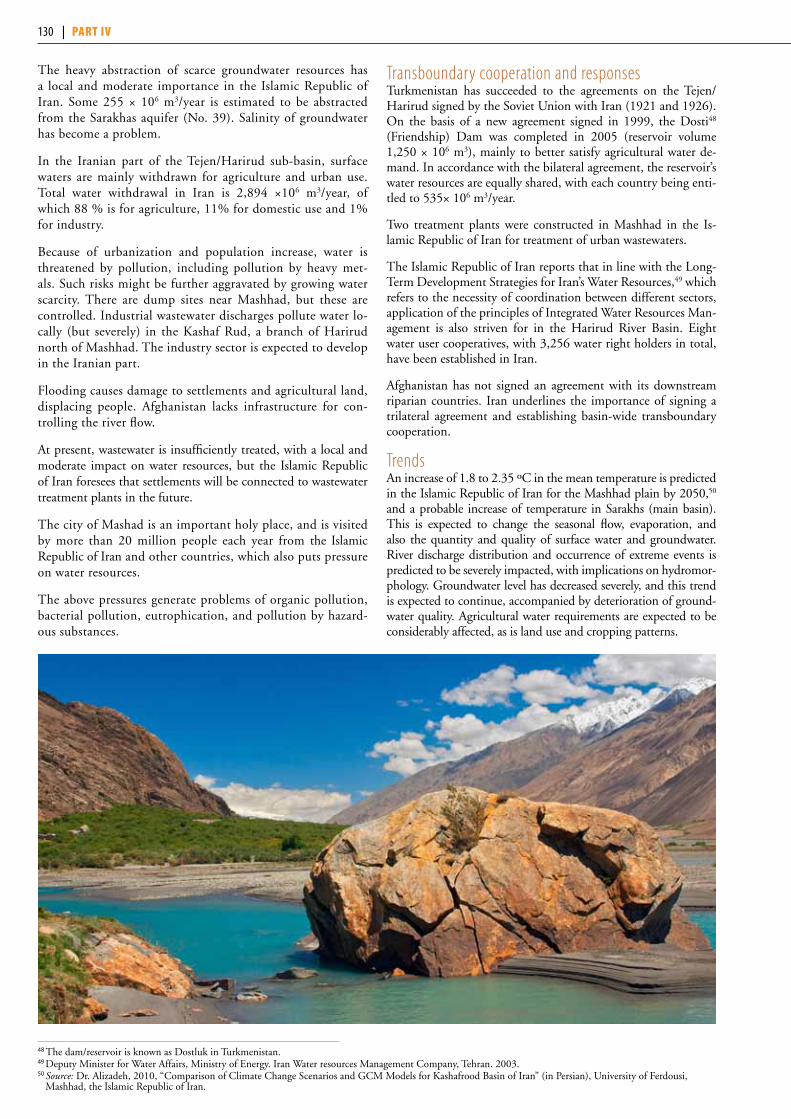
The heavy abstraction of scarce groundwater resources has a local and moderate importance in the Islamic Republic of Iran. Some 255 × 106 m3/year is estimated to be abstracted from the Sarakhas aquifer (No. 39). Salinity of groundwater has become a problem.
In the Iranian part of the Tejen/Harirud sub-basin, surface waters are mainly withdrawn for agriculture and urban use. Total water withdrawal in Iran is 2,894 ×106 m3/year, of which 88 % is for agriculture, 11% for domestic use and 1% for industry.
Because of urbanization and population increase, water is threatened by pollution, including pollution by heavy met-als. Such risks might be further aggravated by growing water scarcity. There are dump sites near Mashhad, but these are controlled. Industrial wastewater discharges pollute water lo-cally (but severely) in the Kashaf Rud, a branch of Harirud north of Mashhad. The industry sector is expected to develop in the Iranian part.
Flooding causes damage to settlements and agricultural land, displacing people. Afghanistan lacks infrastructure for con-trolling the river flow.
At present, wastewater is insufficiently treated, with a local and moderate impact on water resources, but the Islamic Republic of Iran foresees that settlements will be connected to wastewater treatment plants in the future.
The city of Mashad is an important holy place, and is visited by more than 20 million people each year from the Islamic Republic of Iran and other countries, which also puts pressure on water resources.
The above pressures generate problems of organic pollution, bacterial pollution, eutrophication, and pollution by hazard-ous substances.
Transboundary cooperation and responsesTurkmenistan has succeeded to the agreements on the Tejen/Harirud signed by the Soviet Union with Iran (1921 and 1926). On the basis of a new agreement signed in 1999, the Dosti48 (Friendship) Dam was completed in 2005 (reservoir volume 1,250 × 106 m3), mainly to better satisfy agricultural water de-mand. In accordance with the bilateral agreement, the reservoir’s water resources are equally shared, with each country being enti-tled to 535× 106 m3/year.
Two treatment plants were constructed in Mashhad in the Is-lamic Republic of Iran for treatment of urban wastewaters.
The Islamic Republic of Iran reports that in line with the Long-Term Development Strategies for Iran’s Water Resources,49 which refers to the necessity of coordination between different sectors, application of the principles of Integrated Water Resources Man-agement is also striven for in the Harirud River Basin. Eight water user cooperatives, with 3,256 water right holders in total, have been established in Iran.
Afghanistan has not signed an agreement with its downstream riparian countries. Iran underlines the importance of signing a trilateral agreement and establishing basin-wide transboundary cooperation.
Trends An increase of 1.8 to 2.35 ºC in the mean temperature is predicted in the Islamic Republic of Iran for the Mashhad plain by 2050,50 and a probable increase of temperature in Sarakhs (main basin). This is expected to change the seasonal flow, evaporation, and also the quantity and quality of surface water and groundwater. River discharge distribution and occurrence of extreme events is predicted to be severely impacted, with implications on hydromor-phology. Groundwater level has decreased severely, and this trend is expected to continue, accompanied by deterioration of ground-water quality. Agricultural water requirements are expected to be considerably affected, as is land use and cropping patterns.
48 The dam/reservoir is known as Dostluk in Turkmenistan.49 Deputy Minister for Water Affairs, Ministry of Energy. Iran Water resources Management Company, Tehran. 2003.50 Source: Dr. Alizadeh, 2010, “Comparison of Climate Change Scenarios and GCM Models for Kashafrood Basin of Iran” (in Persian), University of Ferdousi,
Mashhad, the Islamic Republic of Iran.
130 | part iv
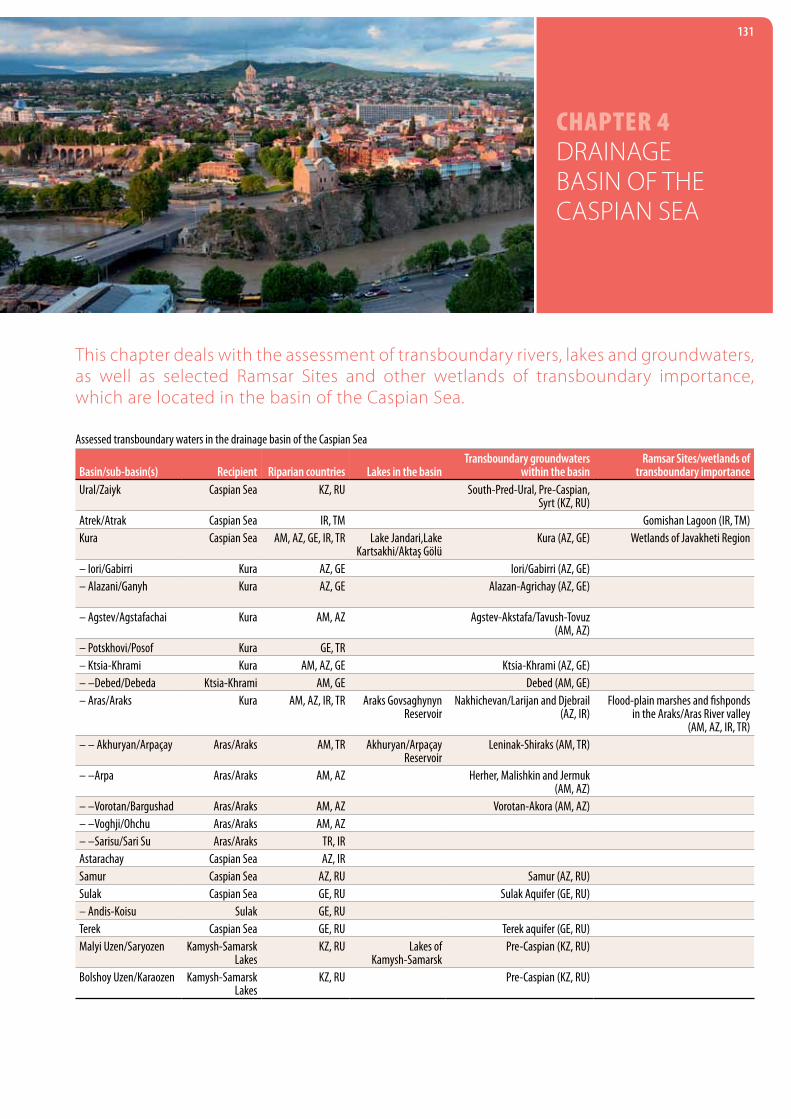
Chapter 4 Drainage basin of the Caspian sea
this chapter deals with the assessment of transboundary rivers, lakes and groundwaters, as well as selected ramsar sites and other wetlands of transboundary importance, which are located in the basin of the Caspian sea.
Assessed transboundary waters in the drainage basin of the Caspian Sea
Basin/sub-basin(s) Recipient Riparian countries Lakes in the basinTransboundary groundwaters
within the basin Ramsar Sites/wetlands of
transboundary importanceUral/Zaiyk Caspian Sea KZ, RU South-Pred-Ural, Pre-Caspian,
Syrt (KZ, RU)Atrek/Atrak Caspian Sea IR, TM Gomishan Lagoon (IR, TM)Kura Caspian Sea AM, AZ, GE, IR, TR Lake Jandari,Lake
Kartsakhi/Aktaş GölüKura (AZ, GE) Wetlands of Javakheti Region
– Iori/Gabirri Kura AZ, GE Iori/Gabirri (AZ, GE)– Alazani/Ganyh Kura AZ, GE Alazan-Agrichay (AZ, GE)
– Agstev/Agstafachai Kura AM, AZ Agstev-Akstafa/Tavush-Tovuz (AM, AZ)
– Potskhovi/Posof Kura GE, TR– Ktsia-Khrami Kura AM, AZ, GE Ktsia-Khrami (AZ, GE)– –Debed/Debeda Ktsia-Khrami AM, GE Debed (AM, GE)– Aras/Araks Kura AM, AZ, IR, TR Araks Govsaghynyn
ReservoirNakhichevan/Larijan and Djebrail
(AZ, IR)Flood-plain marshes and fishponds
in the Araks/Aras River valley (AM, AZ, IR, TR)
– – Akhuryan/Arpaçay Aras/Araks AM, TR Akhuryan/Arpaçay Reservoir
Leninak-Shiraks (AM, TR)
– –Arpa Aras/Araks AM, AZ Herher, Malishkin and Jermuk (AM, AZ)
– –Vorotan/Bargushad Aras/Araks AM, AZ Vorotan-Akora (AM, AZ)– –Voghji/Ohchu Aras/Araks AM, AZ– –Sarisu/Sari Su Aras/Araks TR, IRAstarachay Caspian Sea AZ, IRSamur Caspian Sea AZ, RU Samur (AZ, RU)Sulak Caspian Sea GE, RU Sulak Aquifer (GE, RU)– Andis-Koisu Sulak GE, RUTerek Caspian Sea GE, RU Terek aquifer (GE, RU)Malyi Uzen/Saryozen Kamysh-Samarsk
LakesKZ, RU Lakes of
Kamysh-SamarskPre-Caspian (KZ, RU)
Bolshoy Uzen/Karaozen Kamysh-Samarsk Lakes
KZ, RU Pre-Caspian (KZ, RU)
131

Ural river Basin1
The basin of the 2,428-km long Ural/Zaiyk2 River is shared by Kazakhstan and the Russian Federation. Geographically, the ba-sin is shaped by the Ural-Tau ridge (elevation commonly 700-900 m a.s.l.), the Zilairskoe plateau (elevation commonly 500-600 m a.s.l.) and the Obschiy Syrt (elevation mostly 200-300 m a.s.l.).
The Ilek, Or, Kigach, Khobda, Urta-Burtya, and the Chagan are transboundary tributaries.
Basin of the Ural River
Country Area in the country (km2) Country’s share (%)Russian Federation 83 200 36Kazakhstan 147 800 64 Total 231 000
Note: Other sources report a size of the basin ranging from 231,000 km2 to 311,000 km2.
PRe-CASPiAn AquifeR (no. 41)
Kazakhstan Russian federationMedium- to fine-grained sands; groundwater flow from the Russian Federation (north) to Kazakhstan (south) or along the border; medium links with surface waters. The aquifer extends to the Malyi Uzen/Saryozen and Bolshoy Uzen/Karaozen Basins.Border length (km) 1 680 N/AArea (km2) 75 000 N/AThickness: mean, max (m) 21, 42 N/AGroundwater management measures Development of the groundwater requires agreement
and sharing of resources between the countries. N/A
1 Based on information from Kazakhstan, the Russian Federation and the First Assessment.2 The river is known as Ural in the Russian Federation and as Zaiyk in Kazakhstan. 3 Source: Committee on Water Resources of the Orenburg oblast, the Russian Federation.
SouTh-PRed-uRAL AquifeR (no. 40)
Kazakhstan Russian federationSand and gravel; intergranular/multilayered, partly confined and partly unconfined; groundwater flow from the Russian Federation (north-east) to Kazakhstan (south-west); weak links with surface waters.Border length (km) 106 N/AArea (km2) 9 512 N/ARenewable groundwater resource (m3/d) 777 534 N/AThickness: mean, max (m) 75, 200 N/AGroundwater uses and functions 80% for household water, 20% for technical purposes. N/APressure factors Groundwater abstraction is significantly
smaller than exploitable resources.N/A
Groundwater management measures Surveillance and early warning monitoring is needed. N/A
aQ
K al-s1-2
KZRU
J
Р-T
con�ned aquifer
con�ned aquifer
con�ned aquifer
aquiclude
aquiclude
saturated zone
figuRe1: Conceptual sketch of the South-Pred-Ural aquifer (No. 40) (provided by Kazakhstan)
Hydrology and hydrogeologyThe right bank tributaries, which originate in the more elevated Ural-Tau, the Malyi and Bolshoy Kizil and Sakmara, have an impor-tant role in feeding the flow of the Ural/Zai-yk. Towards the south, run-off significantly decreases, with increased aridity.
Surface water resources in the Russian part of the basin are estimated to amount to some 10.6 km3/year (based on observation during the period from 1958 to 2009).3
In Kazakhstan’s part of the basin, surface wa-ter resources are estimated at 12.8 km3/year
(with 4.1 km3/year estimated generated within the borders of Kazakhstan and 8.7 km3/year flowing from the Russian Fed-eration). Groundwater resources are estimated at 1.03 km3/year. These add up to a total of 13.83 km3/year, which equals 6,612 m3/year/capita.
Kura, Surra,1930-1987
Ural, Kushum,1915-1988
Terek, Vladikavkaz (Ordzhonikidze),1965-1987
Malyi Uzen, Aleksashkino,1965-1970
0 2 4 6 8 10 12 14 16 18km3
River, Station,Time series
17.105
9.349
0.98
0.028
Long-term mean annual flow (km³) of rivers discharging to the Caspian Sea
Source: GRDC, Koblenz.
132 | part iv
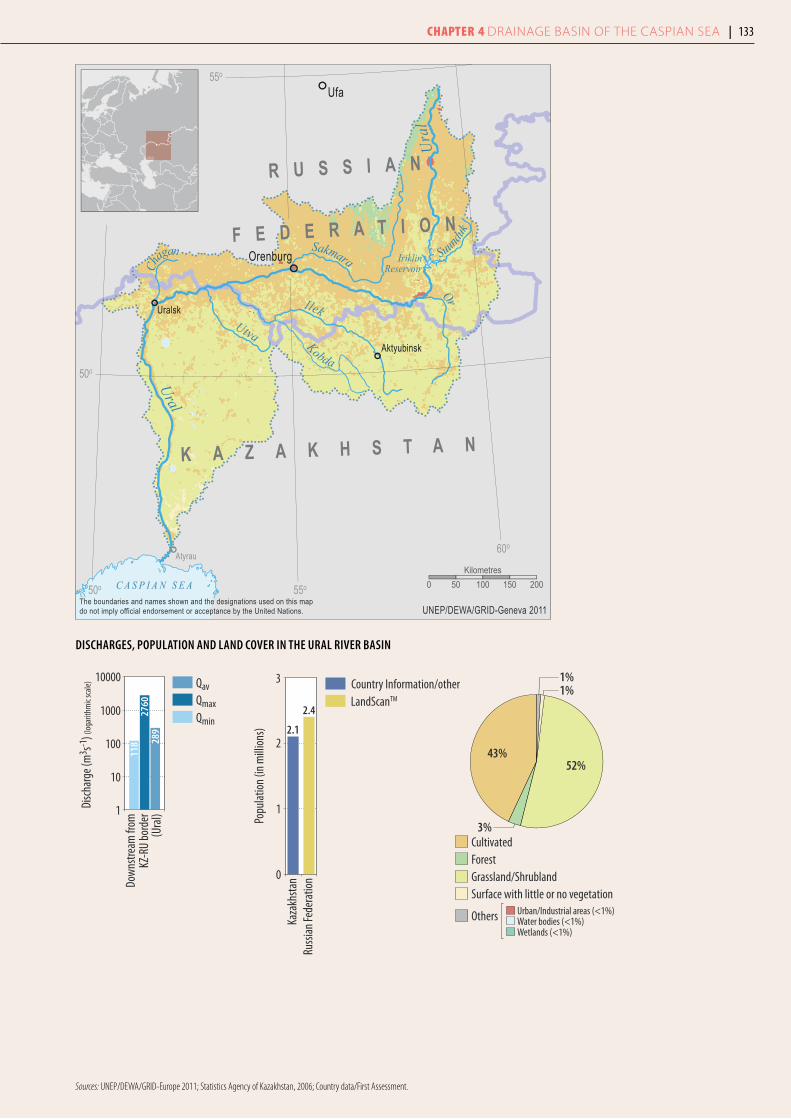
Atyrau
Uralsk
Aktyubinsk
Ufa
Orenburg
C A S P I A N S E A
Ural
Ural
IlekUtva
Sakmara IriklinReservoir
Suunduk
Ch
agan
Kobda
Or
K A Z A K H S T A N
R U S S I A N
F E D E R A T I O N
50o
50o 55o
60o
55o
UNEP/DEWA/GRID-Geneva 2011The boundaries and names shown and the designations used on this mapdo not imply official endorsement or acceptance by the United Nations.
0 50 100 150 200Kilometres
Dow
nstre
am fr
om K
Z-RU
bord
er27
6028
9(U
ral)1
10
100
1000
10000
118
QavQmaxQmin
Disc
harg
e (m
3 s-1) (
loga
rithm
ic sc
ale)
1%1%
43%
3%
52%
Urban/Industrial areas (<1%)Water bodies (<1%)Wetlands (<1%)
CultivatedForestGrassland/ShrublandSurface with little or no vegetation
Others
Sources: UNEP/DEWA/GRID-Europe 2011; Statistics Agency of Kazakhstan, 2006; Country data/First Assessment.
diSChARgeS, PoPuLATion And LAnd CoveR in The uRAL RiveR BASin
Popu
latio
n (in
mill
ions
)
0
1
2
3
Russ
ian Fe
dera
tion
Kaza
khsta
n
2.1
2.4
Country Information/otherLandScanTM
Chapter 4 Drainage basin of the Caspian sea | 133

PressuresThe main pressure factors in the basin are industry (especially in Magnitogorsk and the Orenburg oblast) and discharges of municipal wastewaters (the cities of Uralsk and Atyrau). Spring flooding and run-off in general mobilizes pollutants, among them oil products from oil extraction sites on the Caspian coast (Tengiz, Prorva, Martyshi, Kalamkas, Karazhmbas). In addition to oil products, phenols and heavy metals are principal pollutants in the Ural/Zaiyk Basin.
StatusThe total concentration of dissolved solids of the Ural/Zaiyk River at the Yanvartsevo monitoring station was on average 848 mg/l in 2009. According to the water quality classification of Ka-zakhstan, water quality was classified as “moderately polluted” (class 3). At Uralsk, some 65 km downstream, the water pol-lution index was largely in the 1.18-1.68 (moderately polluted) range in the period from 1994 to 2004, even though water qual-ity appeared to deteriorate (classified as “polluted”, i.e. class 4) in the late 1990 and in the beginning of the 2000s.
TrendsKazakhstan predicts water withdrawal from the Ural/Zaiyk to in-crease by almost 70% by 2020, compared with the level in 2006. Withdrawal for agriculture is expected to increase relatively, and the percentage share of withdrawals for other uses is expected to decrease.
SyRT AquifeR (no. 42)
Kazakhstan Russian federationQuaternary gravel, pebbles, and sand, Cretaceous chalk; groundwater flow from the Russian Federation (north-east) to Kazakhstan (south-west); medium links with surface waters.Border length (km) 212 N/AArea (km2) 2 410 N/ARenewable groundwater resource (m3/d) 198 720 N/AThickness: mean, max (m) 50, 100 N/APressure factors Abstraction of groundwater is insignificant. N/AGroundwater management measures Surveillance and early warning monitoring is needed. N/A
Total water withdrawal and withdrawals by sector in the Ural/Zaiyk Basin
Country yearTotal withdrawal
×106 m3/year Agricultural % domestic % industry % energy % other %Russian Federation 2009 1 650a N/A N/A N/A N/A N/AKazakhstan 2006 1 429 49.9 14.9 33.8 - 1.4
2020b 2 406 64.8 10.0 24.3 - 0.9a For Orenburg oblast. b Forecast.
Water quality classification in the Ural/Zaiyk Basin
Location of observation in the ural Basin
Water pollution indexa – water quality classification
Parameters exceeding MAC Multiplier of MAC exceedence2008 2009Ural/Zaiyk River, station Yanvartsevo (on the Russian-Kazakhstan border)
1.25; “moderately polluted” (class 3)
1.67; “moderately polluted” (class 3)
total iron 3.16ammonium nitrogen 2.25
Chromium (+6) 1.75phenols 1.19
Chagan tributary, station at the village of Kamennyi
1.35, “moderately polluted” (class 3)
1.26, “moderately polluted” (class 3)
BOD5
2.25phenols 1.40
sulphates 1.27total iron 1.10
a The water pollution index is defined on the basis of the ratios of measured values and the maximum allowable concentration of specific water-quality determinants.Source: Kazhydromet, Ministry of Environmental Protection of Kazakhstan.
aQ
KZRU
K2
P1
saturated zone
confined aquifer
confined aquifer
aquiclude
aquiclude
figuRe 3: Conceptual sketch of the Syrt aquifer (No. 42) (provided by Kazakhstan)
mQ hvIII
mQ hzII
mQ bI
RU KZ
confined aquifer
confined aquifer
confined aquifer
figuRe 2: Conceptual sketch of the Pre-Caspian aquifer (No. 41) (provided by Kazakhstan)
134 | part iv
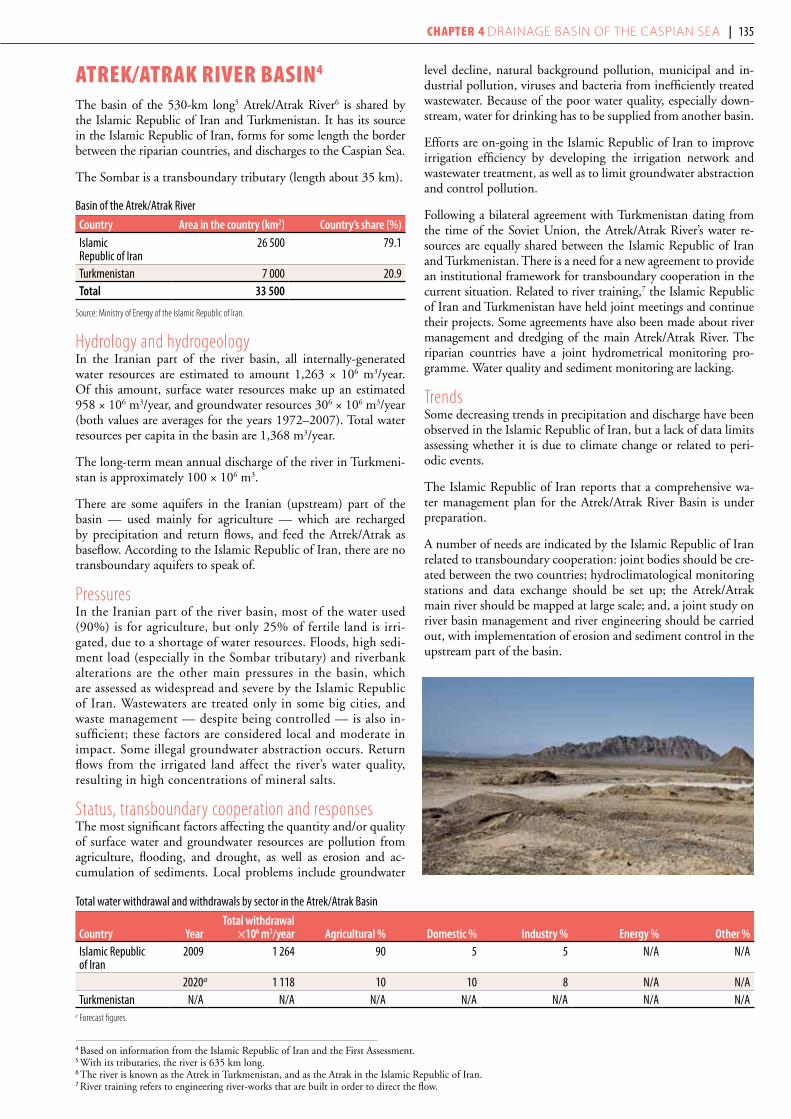
atrek/atrak river Basin4
The basin of the 530-km long5 Atrek/Atrak River6 is shared by the Islamic Republic of Iran and Turkmenistan. It has its source in the Islamic Republic of Iran, forms for some length the border between the riparian countries, and discharges to the Caspian Sea.
The Sombar is a transboundary tributary (length about 35 km).
Basin of the Atrek/Atrak River
Country Area in the country (km2) Country’s share (%)Islamic Republic of Iran
26 500 79.1
Turkmenistan 7 000 20.9Total 33 500
Source: Ministry of Energy of the Islamic Republic of Iran.
Hydrology and hydrogeologyIn the Iranian part of the river basin, all internally-generated water resources are estimated to amount 1,263 × 106 m3/year. Of this amount, surface water resources make up an estimated 958 × 106 m3/year, and groundwater resources 306 × 106 m3/year (both values are averages for the years 1972–2007). Total water resources per capita in the basin are 1,368 m3/year.
The long-term mean annual discharge of the river in Turkmeni-stan is approximately 100 × 106 m3.
There are some aquifers in the Iranian (upstream) part of the basin — used mainly for agriculture — which are recharged by precipitation and return flows, and feed the Atrek/Atrak as baseflow. According to the Islamic Republic of Iran, there are no transboundary aquifers to speak of.
PressuresIn the Iranian part of the river basin, most of the water used (90%) is for agriculture, but only 25% of fertile land is irri-gated, due to a shortage of water resources. Floods, high sedi-ment load (especially in the Sombar tributary) and riverbank alterations are the other main pressures in the basin, which are assessed as widespread and severe by the Islamic Republic of Iran. Wastewaters are treated only in some big cities, and waste management — despite being controlled — is also in-sufficient; these factors are considered local and moderate in impact. Some illegal groundwater abstraction occurs. Return flows from the irrigated land affect the river’s water quality, resulting in high concentrations of mineral salts.
Status, transboundary cooperation and responsesThe most significant factors affecting the quantity and/or quality of surface water and groundwater resources are pollution from agriculture, flooding, and drought, as well as erosion and ac-cumulation of sediments. Local problems include groundwater
level decline, natural background pollution, municipal and in-dustrial pollution, viruses and bacteria from inefficiently treated wastewater. Because of the poor water quality, especially down-stream, water for drinking has to be supplied from another basin.
Efforts are on-going in the Islamic Republic of Iran to improve irrigation efficiency by developing the irrigation network and wastewater treatment, as well as to limit groundwater abstraction and control pollution.
Following a bilateral agreement with Turkmenistan dating from the time of the Soviet Union, the Atrek/Atrak River’s water re-sources are equally shared between the Islamic Republic of Iran and Turkmenistan. There is a need for a new agreement to provide an institutional framework for transboundary cooperation in the current situation. Related to river training,7 the Islamic Republic of Iran and Turkmenistan have held joint meetings and continue their projects. Some agreements have also been made about river management and dredging of the main Atrek/Atrak River. The riparian countries have a joint hydrometrical monitoring pro-gramme. Water quality and sediment monitoring are lacking.
TrendsSome decreasing trends in precipitation and discharge have been observed in the Islamic Republic of Iran, but a lack of data limits assessing whether it is due to climate change or related to peri-odic events.
The Islamic Republic of Iran reports that a comprehensive wa-ter management plan for the Atrek/Atrak River Basin is under preparation.
A number of needs are indicated by the Islamic Republic of Iran related to transboundary cooperation: joint bodies should be cre-ated between the two countries; hydroclimatological monitoring stations and data exchange should be set up; the Atrek/Atrak main river should be mapped at large scale; and, a joint study on river basin management and river engineering should be carried out, with implementation of erosion and sediment control in the upstream part of the basin.
Total water withdrawal and withdrawals by sector in the Atrek/Atrak Basin
Country yearTotal withdrawal
×106 m3/year Agricultural % domestic % industry % energy % other %Islamic Republic of Iran
2009 1 264 90 5 5 N/A N/A
2020a 1 118 10 10 8 N/A N/ATurkmenistan N/A N/A N/A N/A N/A N/A N/A
a Forecast figures.
4 Based on information from the Islamic Republic of Iran and the First Assessment. 5 With its tributaries, the river is 635 km long.6 The river is known as the Atrek in Turkmenistan, and as the Atrak in the Islamic Republic of Iran.7 River training refers to engineering river-works that are built in order to direct the flow.
Chapter 4 Drainage basin of the Caspian sea | 135
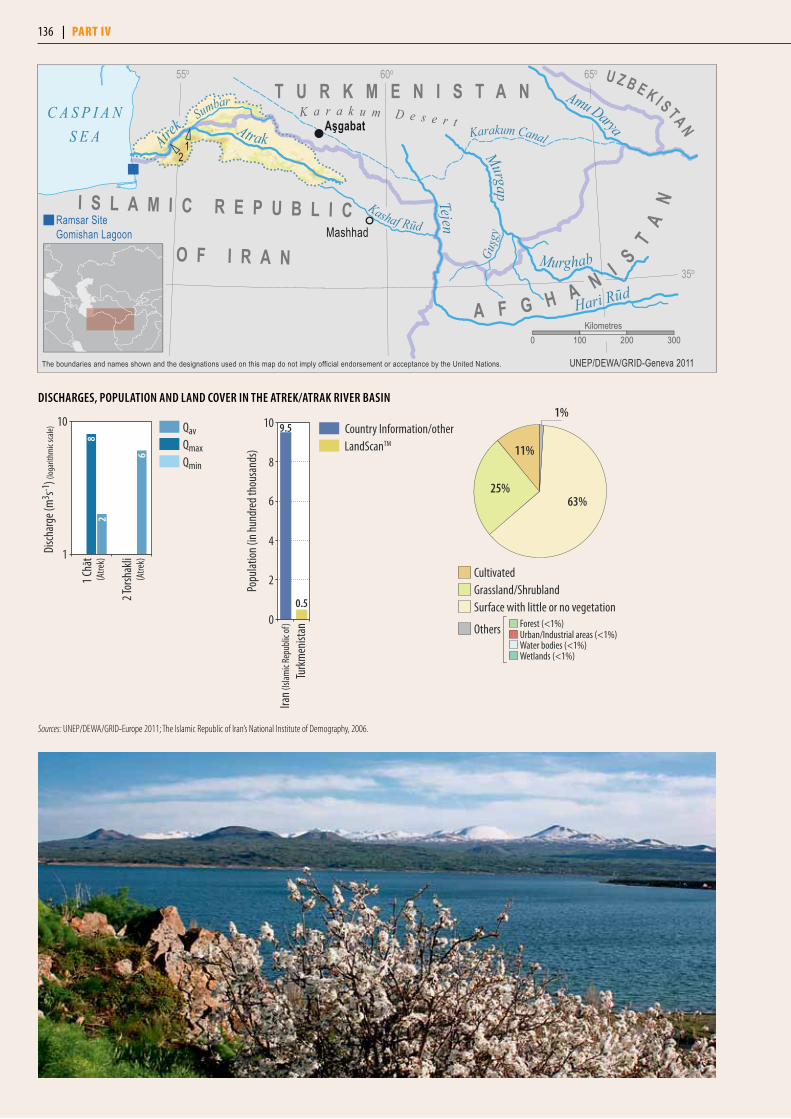
21
Mashhad
Aşgabat
Ramsar SiteGomishan Lagoon
C A S P I A NS E A Atrak
Sumbar
Hari Rūd
Tejen
Kashaf Rūd
MurghabGuşg
y
Murgap
Atr
ek Karakum Canal
Amu Darya
K a r a k u m D e s e r t
I S L A M I C R E P U B L I C
O F I R A N
T U R K M E N I S T A N
A F G H A N I S
TA
N
U Z B E K I S TA N
55o 60o 65o
35o
UNEP/DEWA/GRID-Geneva 2011The boundaries and names shown and the designations used on this map do not imply official endorsement or acceptance by the United Nations.
0 100 200 300Kilometres
10
1
2 Tor
shak
li
1 Chā
t
6
82
(Atre
k)
(Atre
k)
Disc
harg
e (m
3 s-1) (
loga
rithm
ic sc
ale) Qav
QmaxQmin
1%
25%63%
11%
Urban/Industrial areas (<1%)Water bodies (<1%)
Forest (<1%)
Wetlands (<1%)
CultivatedGrassland/ShrublandSurface with little or no vegetation
Others
diSChARgeS, PoPuLATion And LAnd CoveR in The ATReK/ATRAK RiveR BASin
Sources: UNEP/DEWA/GRID-Europe 2011; The Islamic Republic of Iran’s National Institute of Demography, 2006.
Popu
latio
n (in
hun
dred
thou
sand
s)
0
2
4
6
8
10
Turk
men
istan
Iran (
Islam
ic Re
publ
ic of
)
9.5
0.5
Country Information/otherLandScanTM
136 | part iv
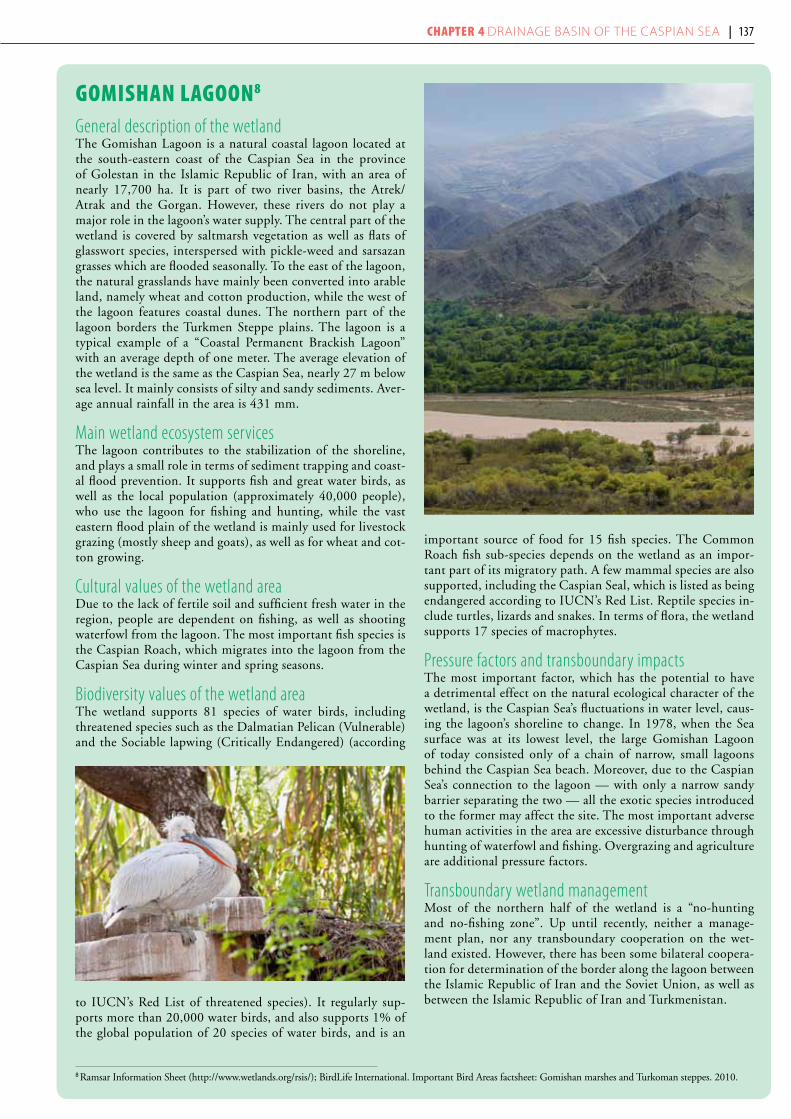
Gomishan laGoon8
General description of the wetlandThe Gomishan Lagoon is a natural coastal lagoon located at the south-eastern coast of the Caspian Sea in the province of Golestan in the Islamic Republic of Iran, with an area of nearly 17,700 ha. It is part of two river basins, the Atrek/Atrak and the Gorgan. However, these rivers do not play a major role in the lagoon’s water supply. The central part of the wetland is covered by saltmarsh vegetation as well as flats of glasswort species, interspersed with pickle-weed and sarsazan grasses which are flooded seasonally. To the east of the lagoon, the natural grasslands have mainly been converted into arable land, namely wheat and cotton production, while the west of the lagoon features coastal dunes. The northern part of the lagoon borders the Turkmen Steppe plains. The lagoon is a typical example of a “Coastal Permanent Brackish Lagoon” with an average depth of one meter. The average elevation of the wetland is the same as the Caspian Sea, nearly 27 m below sea level. It mainly consists of silty and sandy sediments. Aver-age annual rainfall in the area is 431 mm.
Main wetland ecosystem services The lagoon contributes to the stabilization of the shoreline, and plays a small role in terms of sediment trapping and coast-al flood prevention. It supports fish and great water birds, as well as the local population (approximately 40,000 people), who use the lagoon for fishing and hunting, while the vast eastern flood plain of the wetland is mainly used for livestock grazing (mostly sheep and goats), as well as for wheat and cot-ton growing.
Cultural values of the wetland areaDue to the lack of fertile soil and sufficient fresh water in the region, people are dependent on fishing, as well as shooting waterfowl from the lagoon. The most important fish species is the Caspian Roach, which migrates into the lagoon from the Caspian Sea during winter and spring seasons.
Biodiversity values of the wetland areaThe wetland supports 81 species of water birds, including threatened species such as the Dalmatian Pelican (Vulnerable) and the Sociable lapwing (Critically Endangered) (according
to IUCN’s Red List of threatened species). It regularly sup-ports more than 20,000 water birds, and also supports 1% of the global population of 20 species of water birds, and is an
important source of food for 15 fish species. The Common Roach fish sub-species depends on the wetland as an impor-tant part of its migratory path. A few mammal species are also supported, including the Caspian Seal, which is listed as being endangered according to IUCN’s Red List. Reptile species in-clude turtles, lizards and snakes. In terms of flora, the wetland supports 17 species of macrophytes.
Pressure factors and transboundary impactsThe most important factor, which has the potential to have a detrimental effect on the natural ecological character of the wetland, is the Caspian Sea’s fluctuations in water level, caus-ing the lagoon’s shoreline to change. In 1978, when the Sea surface was at its lowest level, the large Gomishan Lagoon of today consisted only of a chain of narrow, small lagoons behind the Caspian Sea beach. Moreover, due to the Caspian Sea’s connection to the lagoon — with only a narrow sandy barrier separating the two — all the exotic species introduced to the former may affect the site. The most important adverse human activities in the area are excessive disturbance through hunting of waterfowl and fishing. Overgrazing and agriculture are additional pressure factors.
Transboundary wetland managementMost of the northern half of the wetland is a “no-hunting and no-fishing zone”. Up until recently, neither a manage-ment plan, nor any transboundary cooperation on the wet-land existed. However, there has been some bilateral coopera-tion for determination of the border along the lagoon between the Islamic Republic of Iran and the Soviet Union, as well as between the Islamic Republic of Iran and Turkmenistan.
8 Ramsar Information Sheet (http://www.wetlands.org/rsis/); BirdLife International. Important Bird Areas factsheet: Gomishan marshes and Turkoman steppes. 2010.
Chapter 4 Drainage basin of the Caspian sea | 137

The largest protected areas located in the Kura River Basin11
Protected area Country Coverage (ha)Sevan National Park including lake Sevan Armenia 150 100 Marakan protected area Islamic Republic of Iran 92 715 Agel National Park Azerbaijan 17 924 Kiamaki protected area Islamic Republic of Iran 84 400 Agri Mountain National Park Turkey 87 380Arasbaran Biosphere Reserve Islamic Republic of Iran 72 460 Borjomi-Kharagauli National Park Georgia 57 963 Shirvan National Park Azerbaijan 54 373
9 Based on information from Armenia, Azerbaijan, Georgia, the Islamic Republic of Iran, Turkey and the First Assessment. 10 The Russian Federation is usually not considered as a basin country, as its territory in the basin is far below 1% of the total basin area. 11 Source: Kura-Aras River Basin Transboundary Diagnostic Analysis. Project Reducing Trans–boundary Degradation of the Kura-Aras River Basin. January 2007.
kUra river Basin9
The basin of the river Kura is shared by Armenia, Azerbaijan, Georgia, the Islamic Republic of Iran and Turkey.10 The 1,515 km long river has its source in Turkey on the north slope of the Allahuekber Mountains Range at the height of 3,068 m a.s.l., and discharges to the Caspian Sea.
The basin has a pronounced mountainous and highland charac-ter in Turkey, with an elevation between 1,300–3,068 m a.s.l., and an average elevation of 2,184 m a.s.l.
Major transboundary tributaries include the following rivers: the Araks/Aras, Iori/Gabirri, Alazani/Ganyh, Debed/Debeda, Ag-stev/Agstafachai, Potskhovi/Posof and Ktsia-Khrami.
Basin of the Kura River
Country Area in the country (km2) Country’s share (%)Armenia 29 743 15.8Azerbaijan 57 831 30.7Georgia 29 741 15.8Islamic Republic of Iran
43 209 23.0
Turkey 27 548a 14.6Total 188 072
a The figure refers to the total area within the whole Kura-Araks Basin which is Turkey’s territory; the area within the Kura Basin only is 4,662 km2.
Sources: UNECE Environmental Performance Review (EPR) programme; Ministry of Nature Protection of Armenia; Ministry of Ecology and Natural Resources of Azerbaijan; Ministry of Environment Protection and Natural Resources of Georgia; Iranian Ministry of Energy/Deputy of Water and Wastewater Affairs; and Turkey’s General Directorate of State Hydraulic Works.
Spring floods cause damage in some parts of the basin. A number of reservoirs and dams on the Kura also help with flood regulation. The Mingechevir Reservoir has improved the situa-tion regarding flood control in the lowlands of the river.
PressuresThe economy of the Turkish part of the Kura Basin relies on agriculture and animal husbandry. In Azerbaijan, extensive ar-eas are under irrigated agriculture (some 745,000 ha, including
300,000 ha in the Azerbaijani part of the Araks/Aras sub-basin). In the part of the basin that is Turkey’s territory, nearly one fifth of irrigable land is irrigated, but the area is increasing, due to land development projects. Upon completion of Turkey’s Kura Master Plan, more than 38,000 ha of land will be irrigated. Where the groundwater table is high and there are problems with drainage, ir-rigation contributes to soil salinization. Water withdrawal from the Kura for irrigation occurs mainly downstream from Mingechevir.
Animal stocks have also gradually increased in parallel with irriga-tion, with manure and fertilizer pollution problems related to agri-cultural activities in the basin. There is some limited manufactur-ing activity in Turkey based on agriculture and animal husbandry.
Logging has reduced forested areas, and deforestation and over-grazing makes areas vulnerable to erosion, resulting in reduced stability of the ground, and loose sediment making the river wa-ter turbid. Climatic, topographic and geological conditions also
Renewable water resources per capita in the Kura Basin per country
CountryRenewable surface water
resources (km3/year)Renewable groundwater
resources (km3/year)Total renewable water
resources (km3/year)
Renewable water resources per capita
(m3/capita/year)
Period of observations used for estimating
water resourcesArmenia 4.858 4.311 7.769 2.778 1977-2001Azerbaijan 8.704 5.2 13.9 1 913 1953–2008Georgia 6.438 1.923 8.362 3 144 1935–1990Islamic Republic of Iran N/A N/A N/A N/A N/ATurkey 1.093 0.040 1.133 10 067 1969–1997
Most important water reservoirs in the Kura River Basin
River/tributary Reservoir, countryfull volume
(106 × m3)Payload volume
(106 × m3)Kura Mingachevir (AZ) 15 730 4 665Kura Shamkir (AZ) 2 677 1 425Aras Aras (AZ) 1 350 1 150Aragvi Jhinvali (GE) 520 370Iori Sioni (GE) 325 315Khrami Khrami (GE) 313 293
Samgori (Tbilisi) (GE) 308 155Agstafa Agstafa AZ) 120 111Kura Yenikend (AZ) 158 136Algeti Algeti (GE) 65 60Kura Barbarinsk (AZ) 62 10
Jandari (GE) 54.28 25.03Patara Liahvi Zonkari (GE) 40.3 39
Iakublo (GE) 11 10.8Sources: Azerbaijan, Georgia and UNDP/Sida project Reducing Trans–boundary Degradation of the Kura-Aras river basin. 2005.
138 | part iv

4
3
8
16
18
21
15
17
20
19
22
1
5
2
911
10
1314
12
7 6
Tbilis
i
Yere
van
Baku
Tabr
iz
Erzu
rum
Rams
ar S
ites
1 Wetl
ands
of Ja
vakh
eti R
egion
: Lak
e Arp
i2 A
rara
t Vall
ey an
d Ara
ks R
iver:
Flood
-plai
n mar
shes
and f
ish-p
onds
in the
Ara
ks R
iver V
alley
2
1
Kura
Kura
Araks
Arak
s
Voro
tan Vogh
ji
Arpa
Kotu
r
Akhuryan
Min
gech
evir
Rese
rvoi
r
Lake
Se
van
BL
AC
K
SEA
Alaz
ani
Iori
Khra
mi
Debe
tAg
stev
Ktsia
Potskhov
i
Arpa
çay
Rese
rvoi
r
Arak
s Gov
sagh
ynyn
Rese
rvoi
r
Lake
Jand
ari
Lake
Karts
akhi
CA
SPIA
N
SEA
GE
OR
GI
A
ISL
AM
IC R
EP
UB
LIC
OF
IR
AN
TU
RK
EY
AZ
ER
BA
IJ
AN
AR
ME
N
IA
RU
SS
IA
N
FE
DE
RA
TI
ON
N A K H C H I VA N
(AZ )
40o
45o
50o
The
boun
darie
s an
d na
mes
sho
wn a
nd th
e de
signa
tions
use
d on
this
map
do n
ot im
ply
offic
ial e
ndor
sem
ent o
r acc
epta
nce
by th
e Un
ited
Natio
ns.
UNEP
/DEW
A/GR
ID-G
enev
a 201
1
025
5075
100
Kilom
etre
s
Sources: UNEP/DEWA/GRID-Europe 2011.
Chapter 4 Drainage basin of the Caspian sea | 139
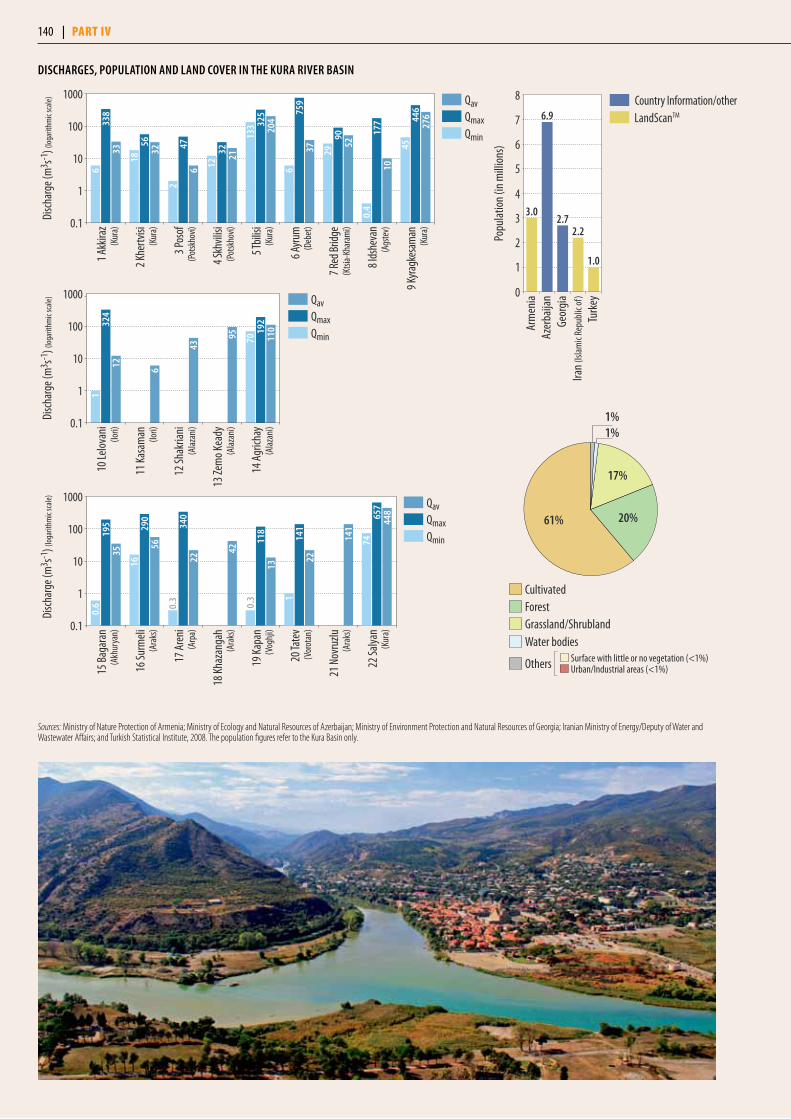
diSChARgeS, PoPuLATion And LAnd CoveR in The KuRA RiveR BASin
9 Kyr
agke
sam
an
8 Ids
heva
n
7 Red
Brid
ge
6 Ayr
um
5 Tbi
lisi
4 Skh
vilisi
3 Pos
of
2 Khe
rtvisi
1 Akk
iraz
133 20
4
6
33
18
32
2
6 12
21
6
37 29
52
0.4
10
45
276
338
56 47 32
325 75
9
90 177 44
6
(Kur
a)
(Kur
a)
(Pot
skho
vi)
(Pot
skho
vi)
(Kur
a)
(Deb
et)
(Ktsi
a-Kh
aram
i)
(Ags
tev)
(Kur
a)
1000
100
10
1
0.1
14 A
grich
ay
13 Ze
mo K
eady
12 Sh
akria
ni
11 K
asam
an
10 Le
lova
ni
192
1
12 6
70
324
43
95 110
(Iori)
(Iori)
(Alaz
ani)
(Alaz
ani)
(Alaz
ani)
1000
100
10
1
0.1
22 Sa
lyan
21 N
ovru
zlu
20 Ta
tev
19 K
apan
18 K
haza
ngah
17 A
reni
16 Su
rmeli
15 B
agar
an
0.3
13
0.6
35
16
56
0.3
22
42
1
22
141
74
448
195 29
0
340
118
141
657
(Akh
urya
n)
(Ara
ks)
(Arp
a)
(Ara
ks)
(Vog
hji)
(Vor
otan
)
(Ara
ks)
(Kur
a)
1000
100
10
1
0.1
QavQmaxQmin
Disc
harg
e (m
3 s-1) (
loga
rithm
ic sc
ale)
Disc
harg
e (m
3 s-1) (
loga
rithm
ic sc
ale)
Disc
harg
e (m
3 s-1) (
loga
rithm
ic sc
ale)
QavQmaxQmin
QavQmaxQmin
1%1%
61% 20%
17%
Urban/Industrial areas (<1%)Surface with little or no vegetation (<1%)
CultivatedForestGrassland/Shrubland
Others
Water bodies
Sources: Ministry of Nature Protection of Armenia; Ministry of Ecology and Natural Resources of Azerbaijan; Ministry of Environment Protection and Natural Resources of Georgia; Iranian Ministry of Energy/Deputy of Water and Wastewater Affairs; and Turkish Statistical Institute, 2008. The population figures refer to the Kura Basin only.
Popu
latio
n (in
mill
ions
)
0
1
2
3
4
5
6
7
8
Turk
eyIra
n (Is
lam
ic Re
publ
ic of
)
Geor
gia
Azer
baija
nAr
men
ia
3.0
6.9
2.72.2
1.0
Country Information/otherLandScanTM
140 | part iv
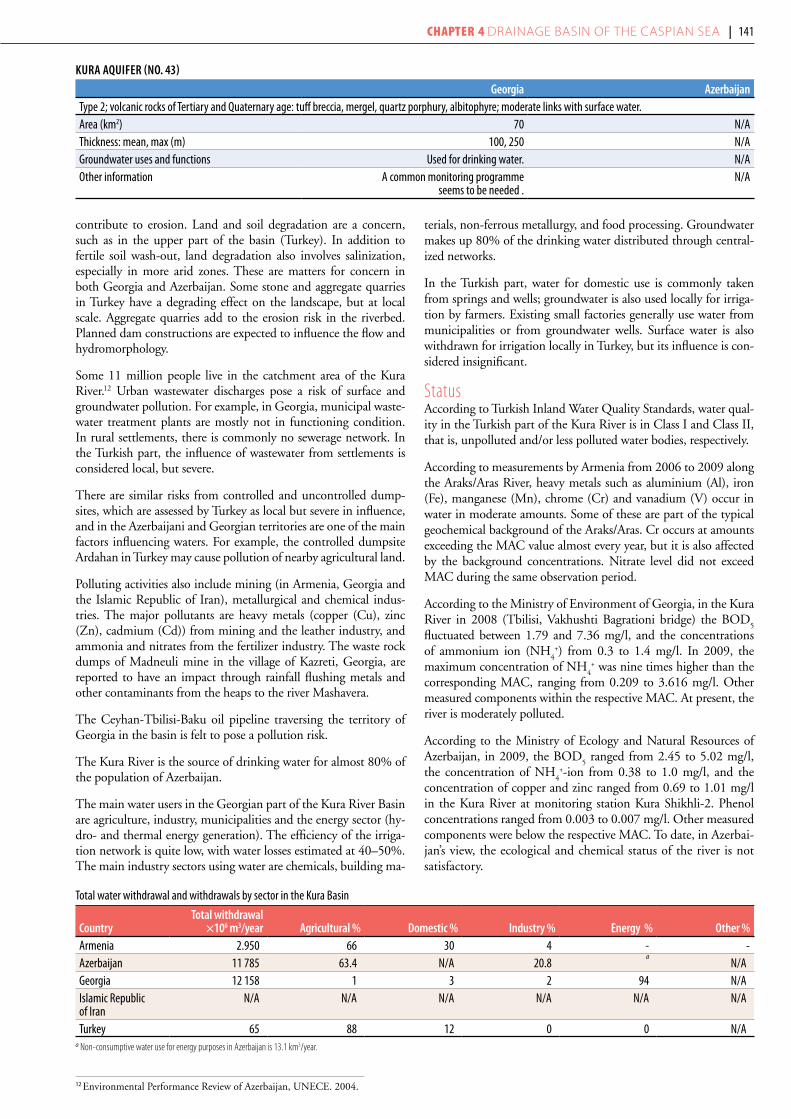
contribute to erosion. Land and soil degradation are a concern, such as in the upper part of the basin (Turkey). In addition to fertile soil wash-out, land degradation also involves salinization, especially in more arid zones. These are matters for concern in both Georgia and Azerbaijan. Some stone and aggregate quarries in Turkey have a degrading effect on the landscape, but at local scale. Aggregate quarries add to the erosion risk in the riverbed. Planned dam constructions are expected to influence the flow and hydromorphology.
Some 11 million people live in the catchment area of the Kura River.12 Urban wastewater discharges pose a risk of surface and groundwater pollution. For example, in Georgia, municipal waste-water treatment plants are mostly not in functioning condition. In rural settlements, there is commonly no sewerage network. In the Turkish part, the influence of wastewater from settlements is considered local, but severe.
There are similar risks from controlled and uncontrolled dump-sites, which are assessed by Turkey as local but severe in influence, and in the Azerbaijani and Georgian territories are one of the main factors influencing waters. For example, the controlled dumpsite Ardahan in Turkey may cause pollution of nearby agricultural land.
Polluting activities also include mining (in Armenia, Georgia and the Islamic Republic of Iran), metallurgical and chemical indus-tries. The major pollutants are heavy metals (copper (Cu), zinc (Zn), cadmium (Cd)) from mining and the leather industry, and ammonia and nitrates from the fertilizer industry. The waste rock dumps of Madneuli mine in the village of Kazreti, Georgia, are reported to have an impact through rainfall flushing metals and other contaminants from the heaps to the river Mashavera.
The Ceyhan-Tbilisi-Baku oil pipeline traversing the territory of Georgia in the basin is felt to pose a pollution risk.
The Kura River is the source of drinking water for almost 80% of the population of Azerbaijan.
The main water users in the Georgian part of the Kura River Basin are agriculture, industry, municipalities and the energy sector (hy-dro- and thermal energy generation). The efficiency of the irriga-tion network is quite low, with water losses estimated at 40–50%. The main industry sectors using water are chemicals, building ma-
terials, non-ferrous metallurgy, and food processing. Groundwater makes up 80% of the drinking water distributed through central-ized networks.
In the Turkish part, water for domestic use is commonly taken from springs and wells; groundwater is also used locally for irriga-tion by farmers. Existing small factories generally use water from municipalities or from groundwater wells. Surface water is also withdrawn for irrigation locally in Turkey, but its influence is con-sidered insignificant.
StatusAccording to Turkish Inland Water Quality Standards, water qual-ity in the Turkish part of the Kura River is in Class I and Class II, that is, unpolluted and/or less polluted water bodies, respectively.
According to measurements by Armenia from 2006 to 2009 along the Araks/Aras River, heavy metals such as aluminium (Al), iron (Fe), manganese (Mn), chrome (Cr) and vanadium (V) occur in water in moderate amounts. Some of these are part of the typical geochemical background of the Araks/Aras. Cr occurs at amounts exceeding the MAC value almost every year, but it is also affected by the background concentrations. Nitrate level did not exceed MAC during the same observation period.
According to the Ministry of Environment of Georgia, in the Kura River in 2008 (Tbilisi, Vakhushti Bagrationi bridge) the BOD
5
fluctuated between 1.79 and 7.36 mg/l, and the concentrations of ammonium ion (NH
4+) from 0.3 to 1.4 mg/l. In 2009, the
maximum concentration of NH4+ was nine times higher than the
corresponding MAC, ranging from 0.209 to 3.616 mg/l. Other measured components within the respective MAC. At present, the river is moderately polluted.
According to the Ministry of Ecology and Natural Resources of Azerbaijan, in 2009, the BOD
5 ranged from 2.45 to 5.02 mg/l,
the concentration of NH4+-ion from 0.38 to 1.0 mg/l, and the
concentration of copper and zinc ranged from 0.69 to 1.01 mg/l in the Kura River at monitoring station Kura Shikhli-2. Phenol concentrations ranged from 0.003 to 0.007 mg/l. Other measured components were below the respective MAC. To date, in Azerbai-jan’s view, the ecological and chemical status of the river is not satisfactory.
KuRA AquifeR (no. 43)
georgia AzerbaijanType 2; volcanic rocks of Tertiary and Quaternary age: tuff breccia, mergel, quartz porphury, albitophyre; moderate links with surface water.Area (km2) 70 N/AThickness: mean, max (m) 100, 250 N/AGroundwater uses and functions Used for drinking water. N/AOther information A common monitoring programme
seems to be needed .N/A
12 Environmental Performance Review of Azerbaijan, UNECE. 2004.
Total water withdrawal and withdrawals by sector in the Kura Basin
CountryTotal withdrawal
×106 m3/year Agricultural % domestic % industry % energy % other %Armenia 2.950 66 30 4 - -Azerbaijan 11 785 63.4 N/A 20.8
aN/A
Georgia 12 158 1 3 2 94 N/AIslamic Republic of Iran
N/A N/A N/A N/A N/A N/A
Turkey 65 88 12 0 0 N/Aa Non-consumptive water use for energy purposes in Azerbaijan is 13.1 km3/year.
Chapter 4 Drainage basin of the Caspian sea | 141

TrendsAccording to Turkish national predictions and long-term scenar-ios, both precipitation and river run-off are expected to decrease by 10 to 20%, the former by 2030 and the latter by 2070–2100. Seasonal variability in precipitation and flood/drought risk are predicted to increase. Based on expert knowledge, groundwater level is predicted to decrease and groundwater quality to be af-fected negatively. Both consumptive and non-consumptive water uses are foreseen to increase.
To assess the future impact of predicted climate changes on the hydrological regime of the Alazani/Ganyh and Iori/Gabirri Riv-ers in East Georgia, a hydrological model — the Water Evalua-tion and Planning System (WEAP) — was applied. The water resources of these rivers are used intensively for the irrigation of crops and pastures. A forecast of changes in climatic parameters (temperature, precipitation) has been made for the Georgian upstream part applying two regional models.13 For the period 2070–2100, the annual mean temperature forecast is 8.9 °C (current average 3.3 °C) in the upper part of the Alazani/Ganyh and 11.9 °C (current average 6.4 °C) in the upper part of the Iori/Gabirri. The projected average for the annual sum of precip-itation is 2,260 mm (current average 2,280 mm) for the Alazani/Ganyh and 1,351 mm (current average 1,325 mm) for the Iori/Gabirri. The predicted decreases in flow are about 8.5% in the Alazani/Ganyh and 11% in the Iori/Gabirri.
In the Turkish part of the Kura Basin, water use is expected to increase substantially, to 0.331 km3/year (presently 0.065 km3/year), upon the completion of the projects in the Kura Master Plan. In particular, water use for hydropower is foreseen to in-crease. Georgia predicts increases in withdrawals in some tribu-taries, including the Alazani, Iori and Ktsia-Khrami Rivers, from a few% up to 10% by 2015.
iori/GaBirri sUB-Basin14
The basin of the 320-km long Iori/Gabirri River15 is shared by Georgia and Azerbaijan. The river has its source in the Main Caucasian Range at 2,600 m and discharges into the Kura. The upper part of the sub-basin is mountainous (Kaveazskogo ridge), and the lower part is lowland steppe (Kakheti Kartlino plateau).
Sub-basin of the Iori/Gabirri River
Country Area in the country (km2) Country’s share (%)Georgia 4 650 88.4Azerbaijan 610 11.6Total 5 260
Sources: Ministry of Environment Protection and Natural Resources of Georgia for the area in Georgia; Ministry of Ecology and Natural Resources of Azerbaijan.
Hydrology and hydrogeologySurface water resources in the Georgian part of the basin are esti-mated at 0.366 km3/year (average for the years 1963–1992) and groundwater resources at 0.155 km3/year (based on 2004), add-ing up to a total of 0.522 km3/year (or 2,166 m3/capita/year). The hydrological regime of the river is characterized by spring floods, summer/autumn high waters, and steady low water levels in winter.
In Georgia, there are three large irrigation reservoirs on the Iori/Gabirri River: the Sioni Reservoir, which is also used for hydro-power generation and water supply; the Tbilisi Reservoir, used also for water supply; and the Dalimta Reservoir.
Pressures and statusDiffuse pollution from agriculture (about 94,000 ha are used for irrigated agriculture) and municipal wastewater are the main anthropogenic pollution sources in Georgia, which Geor-gia considers moderate and limited in extent. In Azerbaijan, 1,522 ha are used for irrigated agriculture. Some 30% of the basin area in Georgia and 10% in Azerbaijan is cropland, and in both countries some 50% is grassland.
One of the main factors influencing water quality negatively in the Georgian part is uncontrolled waste dumps on the river banks, with a severe but local influence.
In the Georgian part, wastewater treatment facilities in munici-palities are not operational, and in rural settlements there is no wastewater collection system. Georgia ranks the influence of this pressure as severe and widespread.
According to Georgia, the withdrawal of surface water is a pres-sure factor, with withdrawal for agriculture having the most widespread and severe influence. Drinking water to a part of Tbilisi is supplied from the Tbilisi Reservoir (a part of the Sio-ni-Zhinvali Reservoir complex), receiving water from the Iori/Gabirri River. A few years ago there were concerns about capac-ity to meet the increasing drinking water demands of Tbilisi, together with agricultural water demands. Currently, the city of Tbilisi is improving its water supply — including by reducing water losses.
Only 1.4% of the total water demand is met from groundwater in Georgia’s territory in the sub-basin. However, the Iori Val-ley is mainly supplied with groundwater from the flood-plain and river terraces above the flood-plain. Furthermore, drilled wells tap artesian groundwater for use by the population and industry.
Azerbaijan reported that there was little human impact on the river. The Ministry of Environment of Azerbaijan evaluates the ecological and chemical status of rivers as moderately polluted.
13 Regional climate models PRECIS and MAGICC/SCHENGEN. 14 Based on information from Azerbaijan and Georgia, and the First Assessment.15 The river is known as Iori in Georgia and Gabirri in Azerbaijan.
ioRi/gABiRRi AquifeR (no. 44)
georgia Azerbaijan Sandstones, conglomerates, marls, limestone, alluvial-proluvial pebbles and sands; Tertiary and Quaternary in age; groundwater flow direction from Georgia to Azerbaijan; medium links with surface water.Area (km2) 100 N/AThickness: mean, max (m) 100, 300 N/AGroundwater uses and functions Used for drinking. N/AOther information A common monitoring programme
is indicated to be needed.N/A
142 | part iv

Pollution is mainly transboundary. The Ministry of Environ-ment of Georgia assesses the river’s ecological and chemical sta-tus as “good”.
Trends By 2015, Georgia predicts an increase of approximately 3% in water withdrawal from the Iori/Gabirri, to approximately 300 × 106 m3/year. A slight relative decrease is expected in agricultural water withdrawal, but small increases are expected in withdraw-als for households and industry.
alazani/Ganyh sUB-Basin16
The basin of the river Alazani/Ganyh17 is shared by Georgia and Azerbaijan. The 391-km long river has its source in the Main Caucasus Mountain Range (elevation 2,600–2,800 m a.s.l.). The Alazani/Ganyh flows for a substantial part of its length along the Georgia-Azerbaijan border, and discharges into the Mingachevir Reservoir in Azerbaijan.
In the basins of left bank tributaries of the Alazani/Ganyh, the baseflow component to the river flow (from groundwater) is es-timated to be 40–50%. There is currently some concern about worsening conditions for generating baseflow.
In addition to spring flooding, flooding in the summer can also result in significant increases in water levels, especially in the lower reaches of the river.
Sub-basin of the Alazani/Ganyh River
Country Area in the country (km2) Country’s share (%)Azerbaijan 4 755 41Georgia 6 962 59Total 11 717
Transboundary protected areas within the Alazani/Ganyh sub-basin include Lagodekhi-Zagatala-West Dagestan (between Georgia, Azerbaijan and the Russian Federation, the total area of 498,706 ha), and Alazani Ganyh (between Georgia and Azerbaijan; 51,230 ha).
Pressures Azerbaijan expresses concern about transboundary pollution from municipal wastewater (e.g. BOD, COD, nitrogen, phos-phorus) and pollution from agriculture (e.g., nitrogen, phos-phorus, pesticides). Municipal wastewaters are among the main anthropogenic pollution sources in Georgia.
Georgia ranks diffuse pollution from agriculture, viniculture
Total water withdrawal and withdrawal by sector in the Iori/Gabirri sub-basin
Country yearTotal withdrawal
×106 m3/year Agricultural % domestic % industry % energy % other %Azerbaijan N/A N/A 10 N/A N/A N/A 0.01Georgia 2008 291 2.95 1.31 0.31 94.75 0.68
Renewable water resources in the parts of the Alazani/Ganyh sub-basin that are the territory of Azerbaijan and Georgia
CountryRenewable surface water
resources (km3/year)Renewable groundwater
resources (km3/year)Total renewable water
resources (km3/year)
Renewable water resources per capita
(m3/capita/year)
Period of observations used for estimating
water resourcesAzerbaijan 3.472 0.0007 3.473 6,150 195–2008Georgia 1.360a 1.24 2.60 7,600 1946–1992
a Surface water resources in the Georgian part of the Alazani//Ganyh basin are estimated at 1.360 km3/year at Shakriani gauging station and 3.001 km3/year at Zemo-Kedi gauging station.
16 Based on information from Azerbaijan and the First Assessment. 17 The river is known as Alazani in Georgia and as Ganyh in Azerbaijan.
ALAZAn-AgRiChAy AquifeR (no. 45)
georgia AzerbaijanType 3; slate and clay shale, siltstone, sandstone, limestone, marl, sea and continental Molasse, conglomerates, sands; Jurassic, Cretaceous, Tertiary and Quaternary in age; consists of an unconfined part (more vulnerable to pollution) at the top of an alluvial cone located at the foot of the mountains, underlain by confined aquifer where groundwater is artesian; groundwater flow direction from Greater Caucasus to the Alazani/Ganyh River, i.e., from Georgia to Azerbaijan; medium links with surface water.Border length (km) 140 N/AArea (km2) 980 3 050Thickness: mean, max (m) 150, 320 N/AGroundwater uses and functions Used for drinking water (e.g. towns of Telavi
and Gurjaani are supplied from groundwater in the alluvium); agriculture.
Irrigation (80–85%)Drinking water supply (10–15%)
Industry (3–5%)Groundwater management measures Need to be improved:
integrated management, abstraction management, efficiency of use, monitoring, agricultural
practices, protection zones, mapping.Need to be applied:
treatment of urban and industrial wastewater, transboundary institutions, data exchange.
Need to be improved: control of the use of groundwater resources.
Need to be applied: treatment of urban and industrial
wastewater, monitoring programmes both quantity and quality, data exchange.
Other information A common monitoring programme seems to be needed. A substantial problem related to groundwater quantity or quality. Water demand was expected to increase. There is no information about transboundary impacts.
Chapter 4 Drainage basin of the Caspian sea | 143
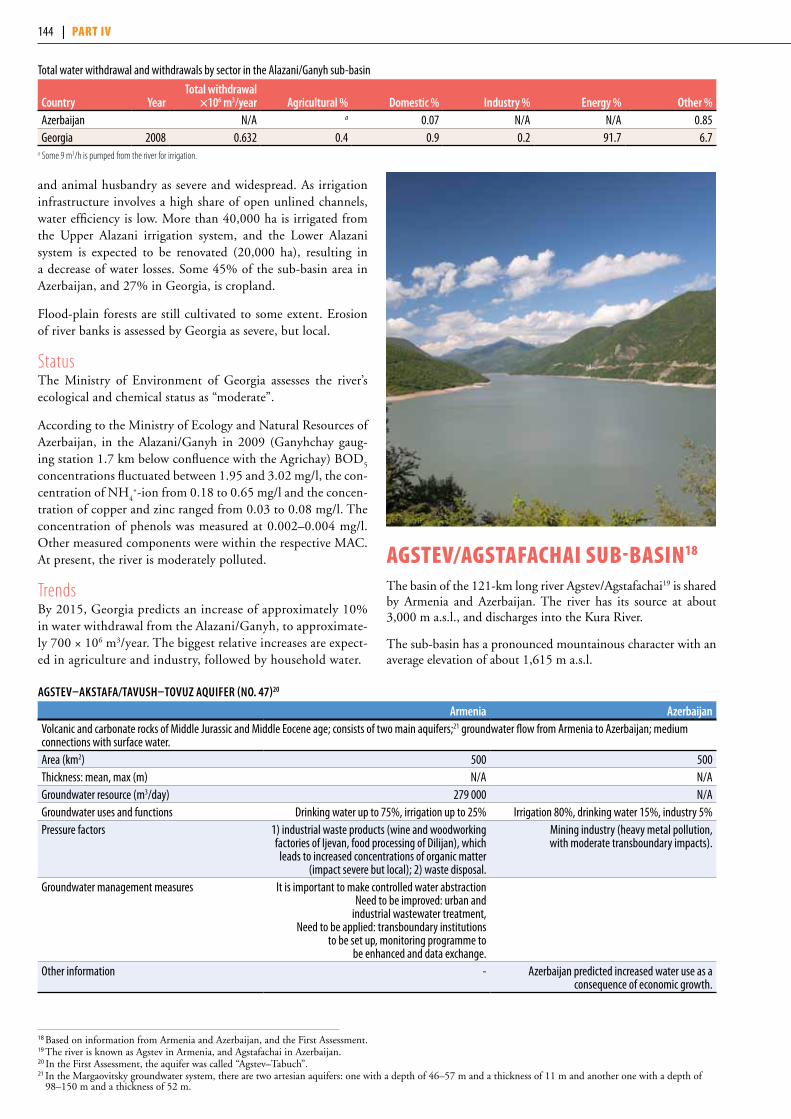
and animal husbandry as severe and widespread. As irrigation infrastructure involves a high share of open unlined channels, water efficiency is low. More than 40,000 ha is irrigated from the Upper Alazani irrigation system, and the Lower Alazani system is expected to be renovated (20,000 ha), resulting in a decrease of water losses. Some 45% of the sub-basin area in Azerbaijan, and 27% in Georgia, is cropland.
Flood-plain forests are still cultivated to some extent. Erosion of river banks is assessed by Georgia as severe, but local.
Status The Ministry of Environment of Georgia assesses the river’s ecological and chemical status as “moderate”.
According to the Ministry of Ecology and Natural Resources of Azerbaijan, in the Alazani/Ganyh in 2009 (Ganyhchay gaug-ing station 1.7 km below confluence with the Agrichay) BOD
5
concentrations fluctuated between 1.95 and 3.02 mg/l, the con-centration of NH
4+-ion from 0.18 to 0.65 mg/l and the concen-
tration of copper and zinc ranged from 0.03 to 0.08 mg/l. The concentration of phenols was measured at 0.002–0.004 mg/l. Other measured components were within the respective MAC. At present, the river is moderately polluted.
Trends By 2015, Georgia predicts an increase of approximately 10% in water withdrawal from the Alazani/Ganyh, to approximate-ly 700 × 106 m3/year. The biggest relative increases are expect-ed in agriculture and industry, followed by household water.
aGstev/aGstafaChai sUB-Basin18
The basin of the 121-km long river Agstev/Agstafachai19 is shared by Armenia and Azerbaijan. The river has its source at about 3,000 m a.s.l., and discharges into the Kura River.
The sub-basin has a pronounced mountainous character with an average elevation of about 1,615 m a.s.l.
Total water withdrawal and withdrawals by sector in the Alazani/Ganyh sub-basin
Country yearTotal withdrawal
×106 m3/year Agricultural % domestic % industry % energy % other %Azerbaijan N/A a 0.07 N/A N/A 0.85Georgia 2008 0.632 0.4 0.9 0.2 91.7 6.7
a Some 9 m3/h is pumped from the river for irrigation.
18 Based on information from Armenia and Azerbaijan, and the First Assessment. 19 The river is known as Agstev in Armenia, and Agstafachai in Azerbaijan.20 In the First Assessment, the aquifer was called “Agstev–Tabuch”. 21 In the Margaovitsky groundwater system, there are two artesian aquifers: one with a depth of 46–57 m and a thickness of 11 m and another one with a depth of
98–150 m and a thickness of 52 m.
AgSTev–AKSTAfA/TAvuSh–TovuZ AquifeR (no. 47)20
Armenia AzerbaijanVolcanic and carbonate rocks of Middle Jurassic and Middle Eocene age; consists of two main aquifers;21 groundwater flow from Armenia to Azerbaijan; medium connections with surface water.Area (km2) 500 500Thickness: mean, max (m) N/A N/AGroundwater resource (m3/day) 279 000 N/AGroundwater uses and functions Drinking water up to 75%, irrigation up to 25% Irrigation 80%, drinking water 15%, industry 5%Pressure factors 1) industrial waste products (wine and woodworking
factories of Ijevan, food processing of Dilijan), which leads to increased concentrations of organic matter
(impact severe but local); 2) waste disposal.
Mining industry (heavy metal pollution, with moderate transboundary impacts).
Groundwater management measures It is important to make controlled water abstractionNeed to be improved: urban and
industrial wastewater treatment,Need to be applied: transboundary institutions
to be set up, monitoring programme to be enhanced and data exchange.
Other information - Azerbaijan predicted increased water use as a consequence of economic growth.
144 | part iv

Major transboundary tributaries include the 58-km long Getik River (basin area 586 km2) and the 58-km long Voskepar River (basin area 510 km2). Lake Parz and Ijevan Reservoir are located within the sub-basin.
PressuresIn the Armenian part of the basin, the Ijevan and Dilidzhane landfills are close to the river and not protected from the effects of wind, which blows waste into the river. Also, drainage water from the landfills damages water quality, either directly, or pos-sibly by seeping into groundwater. The groundwater resource is not significant, however, and this location is not a recharge area. Furthermore, in many rural areas located in the Armenian part of the aquifer Agstev–Tavush (No. 47), landfills are not controlled. Recreational visitors also leave behind refuse, which adds to the pollution of the river.
The high concentration of heavy metals (iron (Fe), copper (Cu), manganese (Mn) is mainly due to natural background pollution, according to Armenia.
Domestic and municipal wastewaters are one of the main sources of anthropogenic pollution of the river in the territory of Armenia, assessed as severe and widespread in impact.
Another main factor of anthropogenic pollution of surface wa-ter — ranked as severe and widespread by Armenia — is diffuse pollution from agriculture.
Status and transboundary impactsAccording to Armenia, in the period 2006–2009, water quality in the Agstev/Agstafachai was evaluated mainly as “good”. In the Armenian part of the sub-basin, the river is exposed to back-ground contamination as a result of hydrochemical processes. The increased concentrations of heavy metals (vanadium — V, Mn, Cu, Fe) already exceed the MACs for the fish in the upper part of the sub–basin. The main factors that have a negative im-pact on surface water resources are untreated urban wastewater (indicated by elevated levels of BOD and COD downstream from Ijevan, nitrogen, phosphorus and sulfate), contamina-tion of agricultural products (e.g., nitrogen, phosphorus) and contamination by industrial wastewater (mostly with organic substances). The concentrations of, for example, zinc (Zn), Fe and sulphate, decrease from upstream to the monitoring station just upstream from the border of Armenia and Azerbaijan, in-dicating reduced potential for transboundary impact. At three out of four reported monitoring stations22 in the Armenian part of the sub-basin, the amount of suspended solids has increased from 2006 to 2009. In 2006–2009, the total dissolved solids at the border of Armenia and Azerbaijan was on average 330 mg/l. In the period 2004–2006, the average concentration of dissolved solids at the border was 559 mg/l and the maximum 600 mg/l.23
According to monitoring carried out by Azerbaijani specialists during the period from 2006 to 2009, the average content of total dissolved solids on the border between Armenia and Azer-baijan is 570 mg/l.
TrendsBy 2030, air temperature is forecast to rise by 1.1 °C, while rainfall will decrease by 3.1%. Under the influence of climate change, rainfall is predicted to decrease by 3–4% and run-off to decrease by 5–10%. Groundwater levels are expected to de-crease, with minor changes in groundwater quality.
potskhovi/posof sUB–Basin24
The sub–basin of the river Potskhovi/Posof 25 is shared by Tur-key and Georgia. The 64-km river has its source in Turkey from springs on Goze Mountain (Göze Dağı), and discharges into the Kura River.
The sub-basin has a pronounced hilly, rough, and mountain-ous character on the Turkish side, with an average elevation of about 2,100–2,200 m a.s.l., and is hilly on the Georgian side, with an average elevation of about 1,700 m a.s.l.
Sub-basin of the Potskhovi/Posof River
Country Area in the country (km2) Country’s share (%)Turkey 601 31.1Georgia 1 331a 68.9Total 1 932
a Source: Ministry of Environment Protection and Natural Resources of Georgia.
Hydrology and hydrogeologyFloods mostly occur in late March, and reach their height in April-May.
Surface water resources in the territory of Turkey are estimated to be approximately 0.217 km3/year, which is 18,310 m3/year/capita. In the part of the basin that is Georgia’s territory, the surface water resources are estimated, based on observations from 1936 to 1990, to be approximately 0.672 km3/year, about 14,400 m3/year/capita.
PressuresIn the part of the basin that is Turkey’s territory, human pres-sure on water resources is relatively low due to the small, rural population. In Georgia’s part of the basin, water withdrawal is 9.156 × 10⁶ m3/year, with 78% withdrawn for energy, 13% for agricultural purposes, 4% for domestic uses and 5% for industry.
Problems related to landslides and erosion are local and moder-ate. Animal husbandry and agriculture are the main sources of income, and are increasing in the Turkish territory in the Kura basin (see assessment of the Kura). Almost half of the Turkish basin share is cropland, and some 30% is grassland. Georgia has much less cropland (7%), and almost 30% grassland.
At present, there are no installed treatment plants for municipal wastewater, which results in a risk of surface and groundwater being polluted by untreated wastewater. Turkey assesses this pressure as local and moderate.
In Georgia, pressure from diffuse pollution from fertilizers is assessed as local and moderate, and Georgia assesses as local but severe both discharge of non–treated wastewater from settle-ments, and illegal landfills on riverbanks.
StatusAccording to the information of the Ministry of Environment Protection and Natural Resources of Georgia, the concentration of ammonium has increased in the period from 2007 to 2009 to be a few times higher than MAC: 1.5 times higher in 2008 and three times higher in 2009. In general, Georgia estimates the ecological and chemical status of the river as satisfactory.
22 Monitoring stations at Dilijan, Ijevan and a station just upstream from the border with Azerbaijan.23 The MAC for TDS for fisheries is 1,000 mg/l in Armenia. 24 Based on information from Georgia, Turkey, and the First Assessment. 25 The river is known as Potskhovi in Georgia and as Posof in Turkey.
Chapter 4 Drainage basin of the Caspian sea | 145
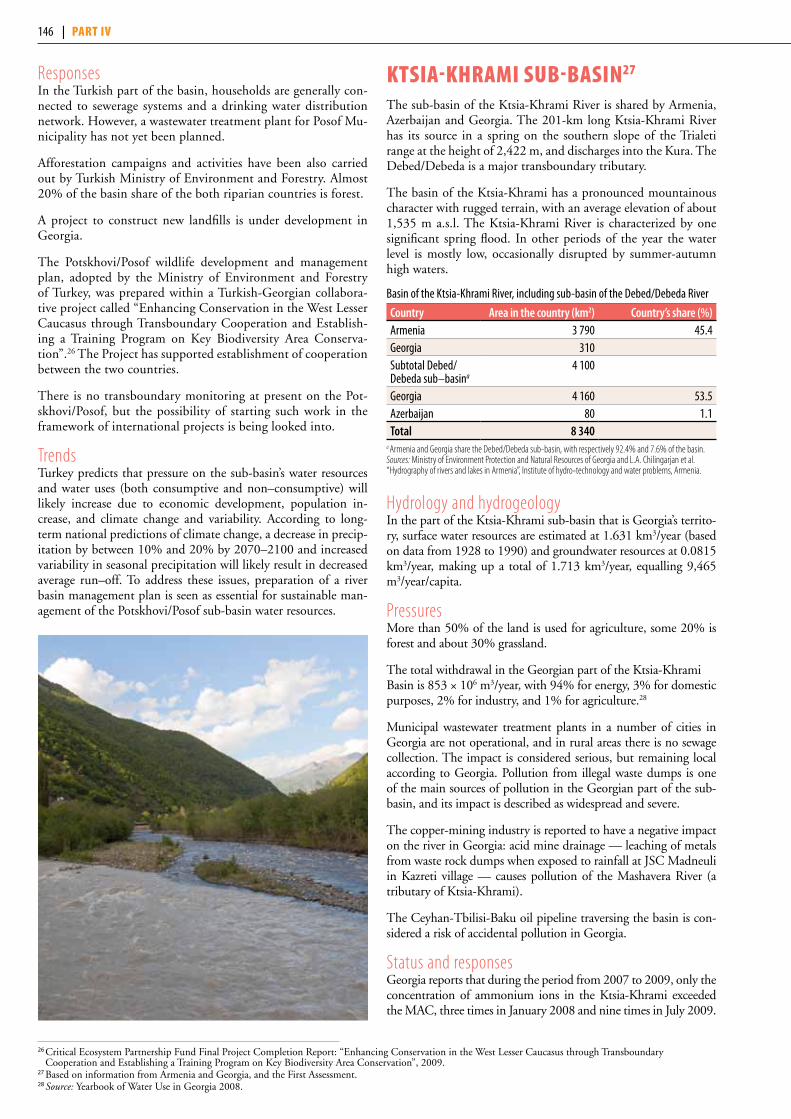
Responses In the Turkish part of the basin, households are generally con-nected to sewerage systems and a drinking water distribution network. However, a wastewater treatment plant for Posof Mu-nicipality has not yet been planned.
Afforestation campaigns and activities have been also carried out by Turkish Ministry of Environment and Forestry. Almost 20% of the basin share of the both riparian countries is forest.
A project to construct new landfills is under development in Georgia.
The Potskhovi/Posof wildlife development and management plan, adopted by the Ministry of Environment and Forestry of Turkey, was prepared within a Turkish-Georgian collabora-tive project called “Enhancing Conservation in the West Lesser Caucasus through Transboundary Cooperation and Establish-ing a Training Program on Key Biodiversity Area Conserva-tion”.26 The Project has supported establishment of cooperation between the two countries.
There is no transboundary monitoring at present on the Pot-skhovi/Posof, but the possibility of starting such work in the framework of international projects is being looked into.
TrendsTurkey predicts that pressure on the sub-basin’s water resources and water uses (both consumptive and non–consumptive) will likely increase due to economic development, population in-crease, and climate change and variability. According to long-term national predictions of climate change, a decrease in precip-itation by between 10% and 20% by 2070–2100 and increased variability in seasonal precipitation will likely result in decreased average run–off. To address these issues, preparation of a river basin management plan is seen as essential for sustainable man-agement of the Potskhovi/Posof sub-basin water resources.
ktsia-khrami sUB-Basin27
The sub-basin of the Ktsia-Khrami River is shared by Armenia, Azerbaijan and Georgia. The 201-km long Ktsia-Khrami River has its source in a spring on the southern slope of the Trialeti range at the height of 2,422 m, and discharges into the Kura. The Debed/Debeda is a major transboundary tributary.
The basin of the Ktsia-Khrami has a pronounced mountainous character with rugged terrain, with an average elevation of about 1,535 m a.s.l. The Ktsia-Khrami River is characterized by one significant spring flood. In other periods of the year the water level is mostly low, occasionally disrupted by summer-autumn high waters.
Basin of the Ktsia-Khrami River, including sub-basin of the Debed/Debeda River
Country Area in the country (km2) Country’s share (%)Armenia 3 790 45.4Georgia 310Subtotal Debed/Debeda sub–basina
4 100
Georgia 4 160 53.5Azerbaijan 80 1.1Total 8 340
a Armenia and Georgia share the Debed/Debeda sub-basin, with respectively 92.4% and 7.6% of the basin. Sources: Ministry of Environment Protection and Natural Resources of Georgia and L.A. Chilingarjan et al. “Hydrography of rivers and lakes in Armenia”, Institute of hydro-technology and water problems, Armenia.
Hydrology and hydrogeology In the part of the Ktsia-Khrami sub-basin that is Georgia’s territo-ry, surface water resources are estimated at 1.631 km3/year (based on data from 1928 to 1990) and groundwater resources at 0.0815 km3/year, making up a total of 1.713 km3/year, equalling 9,465 m3/year/capita.
PressuresMore than 50% of the land is used for agriculture, some 20% is forest and about 30% grassland.
The total withdrawal in the Georgian part of the Ktsia-Khrami Basin is 853 × 106 m3/year, with 94% for energy, 3% for domestic purposes, 2% for industry, and 1% for agriculture.28
Municipal wastewater treatment plants in a number of cities in Georgia are not operational, and in rural areas there is no sewage collection. The impact is considered serious, but remaining local according to Georgia. Pollution from illegal waste dumps is one of the main sources of pollution in the Georgian part of the sub-basin, and its impact is described as widespread and severe.
The copper-mining industry is reported to have a negative impact on the river in Georgia: acid mine drainage — leaching of metals from waste rock dumps when exposed to rainfall at JSC Madneuli in Kazreti village — causes pollution of the Mashavera River (a tributary of Ktsia-Khrami).
The Ceyhan-Tbilisi-Baku oil pipeline traversing the basin is con-sidered a risk of accidental pollution in Georgia.
Status and responsesGeorgia reports that during the period from 2007 to 2009, only the concentration of ammonium ions in the Ktsia-Khrami exceeded the MAC, three times in January 2008 and nine times in July 2009.
26 Critical Ecosystem Partnership Fund Final Project Completion Report: “Enhancing Conservation in the West Lesser Caucasus through Transboundary Cooperation and Establishing a Training Program on Key Biodiversity Area Conservation”, 2009.
27 Based on information from Armenia and Georgia, and the First Assessment. 28 Source: Yearbook of Water Use in Georgia 2008.
146 | part iv
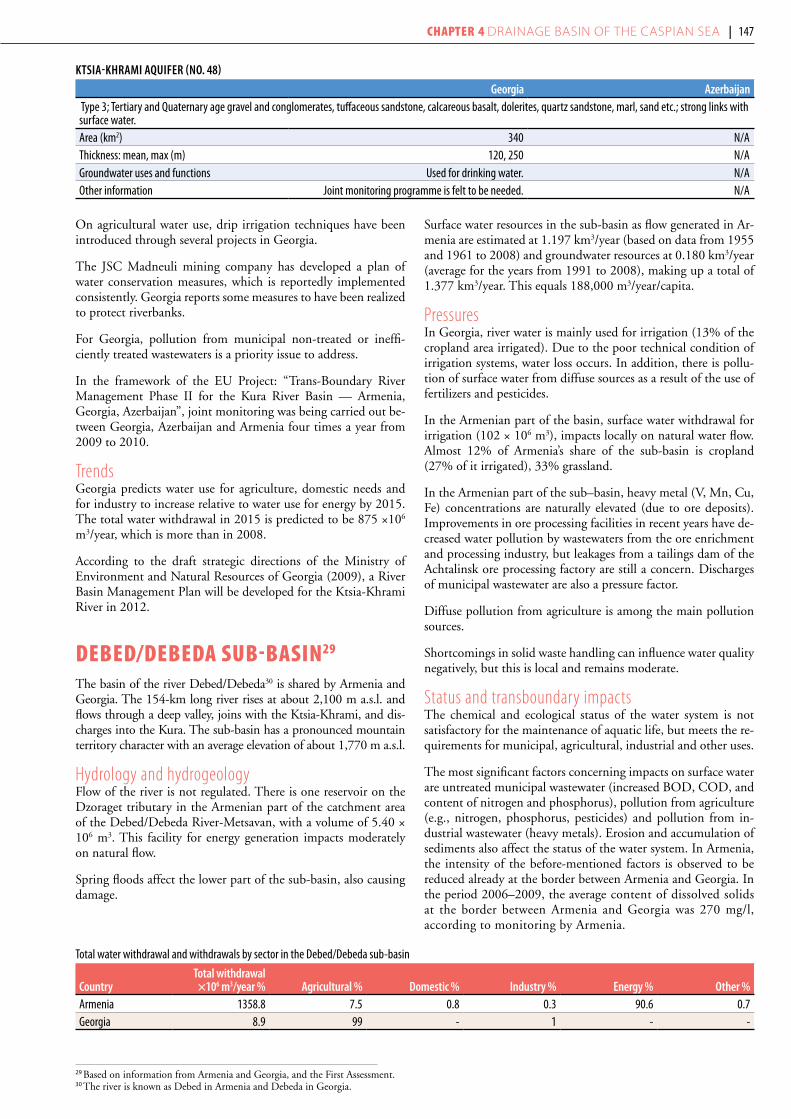
On agricultural water use, drip irrigation techniques have been introduced through several projects in Georgia.
The JSC Madneuli mining company has developed a plan of water conservation measures, which is reportedly implemented consistently. Georgia reports some measures to have been realized to protect riverbanks.
For Georgia, pollution from municipal non-treated or ineffi-ciently treated wastewaters is a priority issue to address.
In the framework of the EU Project: “Trans-Boundary River Management Phase II for the Kura River Basin — Armenia, Georgia, Azerbaijan”, joint monitoring was being carried out be-tween Georgia, Azerbaijan and Armenia four times a year from 2009 to 2010.
Trends Georgia predicts water use for agriculture, domestic needs and for industry to increase relative to water use for energy by 2015. The total water withdrawal in 2015 is predicted to be 875 ×106 m3/year, which is more than in 2008.
According to the draft strategic directions of the Ministry of Environment and Natural Resources of Georgia (2009), a River Basin Management Plan will be developed for the Ktsia-Khrami River in 2012.
DeBeD/DeBeDa sUB-Basin29
The basin of the river Debed/Debeda30 is shared by Armenia and Georgia. The 154-km long river rises at about 2,100 m a.s.l. and flows through a deep valley, joins with the Ktsia-Khrami, and dis-charges into the Kura. The sub-basin has a pronounced mountain territory character with an average elevation of about 1,770 m a.s.l.
Hydrology and hydrogeology Flow of the river is not regulated. There is one reservoir on the Dzoraget tributary in the Armenian part of the catchment area of the Debed/Debeda River-Metsavan, with a volume of 5.40 × 10⁶ m3. This facility for energy generation impacts moderately on natural flow.
Spring floods affect the lower part of the sub-basin, also causing damage.
Surface water resources in the sub-basin as flow generated in Ar-menia are estimated at 1.197 km3/year (based on data from 1955 and 1961 to 2008) and groundwater resources at 0.180 km3/year (average for the years from 1991 to 2008), making up a total of 1.377 km3/year. This equals 188,000 m3/year/capita.
Pressures In Georgia, river water is mainly used for irrigation (13% of the cropland area irrigated). Due to the poor technical condition of irrigation systems, water loss occurs. In addition, there is pollu-tion of surface water from diffuse sources as a result of the use of fertilizers and pesticides.
In the Armenian part of the basin, surface water withdrawal for irrigation (102 × 106 m3), impacts locally on natural water flow. Almost 12% of Armenia’s share of the sub-basin is cropland (27% of it irrigated), 33% grassland.
In the Armenian part of the sub–basin, heavy metal (V, Mn, Cu, Fe) concentrations are naturally elevated (due to ore deposits). Improvements in ore processing facilities in recent years have de-creased water pollution by wastewaters from the ore enrichment and processing industry, but leakages from a tailings dam of the Achtalinsk ore processing factory are still a concern. Discharges of municipal wastewater are also a pressure factor.
Diffuse pollution from agriculture is among the main pollution sources.
Shortcomings in solid waste handling can influence water quality negatively, but this is local and remains moderate.
Status and transboundary impacts The chemical and ecological status of the water system is not satisfactory for the maintenance of aquatic life, but meets the re-quirements for municipal, agricultural, industrial and other uses.
The most significant factors concerning impacts on surface water are untreated municipal wastewater (increased BOD, COD, and content of nitrogen and phosphorus), pollution from agriculture (e.g., nitrogen, phosphorus, pesticides) and pollution from in-dustrial wastewater (heavy metals). Erosion and accumulation of sediments also affect the status of the water system. In Armenia, the intensity of the before-mentioned factors is observed to be reduced already at the border between Armenia and Georgia. In the period 2006–2009, the average content of dissolved solids at the border between Armenia and Georgia was 270 mg/l, according to monitoring by Armenia.
KTSiA-KhRAMi AquifeR (no. 48)
georgia Azerbaijan Type 3; Tertiary and Quaternary age gravel and conglomerates, tuffaceous sandstone, calcareous basalt, dolerites, quartz sandstone, marl, sand etc.; strong links with surface water.Area (km2) 340 N/AThickness: mean, max (m) 120, 250 N/AGroundwater uses and functions Used for drinking water. N/AOther information Joint monitoring programme is felt to be needed. N/A
29 Based on information from Armenia and Georgia, and the First Assessment. 30 The river is known as Debed in Armenia and Debeda in Georgia.
Total water withdrawal and withdrawals by sector in the Debed/Debeda sub-basin
CountryTotal withdrawal
×106 m3/year % Agricultural % domestic % industry % energy % other %Armenia 1358.8 7.5 0.8 0.3 90.6 0.7Georgia 8.9 99 - 1 - -
Chapter 4 Drainage basin of the Caspian sea | 147
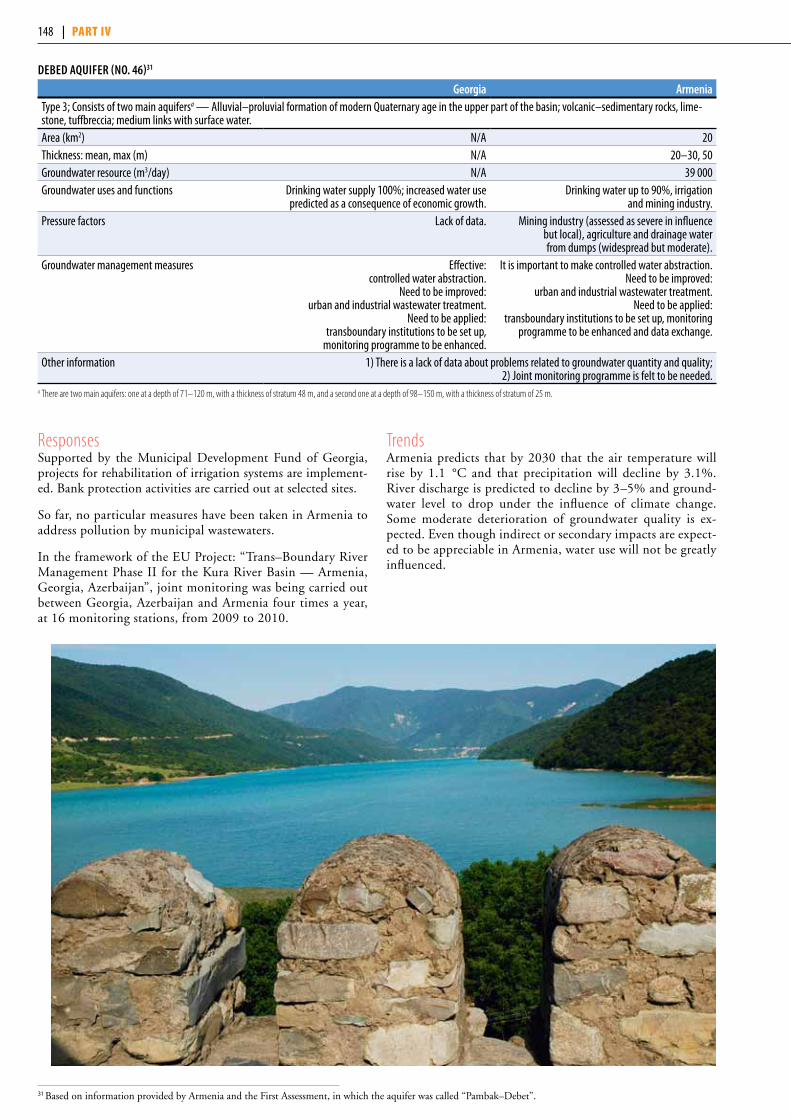
ResponsesSupported by the Municipal Development Fund of Georgia, projects for rehabilitation of irrigation systems are implement-ed. Bank protection activities are carried out at selected sites.
So far, no particular measures have been taken in Armenia to address pollution by municipal wastewaters.
In the framework of the EU Project: “Trans–Boundary River Management Phase II for the Kura River Basin — Armenia, Georgia, Azerbaijan”, joint monitoring was being carried out between Georgia, Azerbaijan and Armenia four times a year, at 16 monitoring stations, from 2009 to 2010.
TrendsArmenia predicts that by 2030 that the air temperature will rise by 1.1 °C and that precipitation will decline by 3.1%. River discharge is predicted to decline by 3–5% and ground-water level to drop under the influence of climate change. Some moderate deterioration of groundwater quality is ex-pected. Even though indirect or secondary impacts are expect-ed to be appreciable in Armenia, water use will not be greatly influenced.
deBed AquifeR (no. 46)31
georgia ArmeniaType 3; Consists of two main aquifersa — Alluvial–proluvial formation of modern Quaternary age in the upper part of the basin; volcanic–sedimentary rocks, lime-stone, tuffbreccia; medium links with surface water.Area (km2) N/A 20Thickness: mean, max (m) N/A 20–30, 50Groundwater resource (m3/day) N/A 39 000 Groundwater uses and functions Drinking water supply 100%; increased water use
predicted as a consequence of economic growth.Drinking water up to 90%, irrigation
and mining industry.Pressure factors Lack of data. Mining industry (assessed as severe in influence
but local), agriculture and drainage water from dumps (widespread but moderate).
Groundwater management measures Effective: controlled water abstraction.
Need to be improved: urban and industrial wastewater treatment.
Need to be applied: transboundary institutions to be set up,
monitoring programme to be enhanced.
It is important to make controlled water abstraction. Need to be improved:
urban and industrial wastewater treatment.Need to be applied:
transboundary institutions to be set up, monitoring programme to be enhanced and data exchange.
Other information 1) There is a lack of data about problems related to groundwater quantity and quality; 2) Joint monitoring programme is felt to be needed.
a There are two main aquifers: one at a depth of 71–120 m, with a thickness of stratum 48 m, and a second one at a depth of 98–150 m, with a thickness of stratum of 25 m.
31 Based on information provided by Armenia and the First Assessment, in which the aquifer was called “Pambak–Debet”.
148 | part iv

lake JanDari32
Lake Jandari (surface area 12.5 km2), which, through con-struction of the Gardaban Canal, was turned into a reservoir, is shared by Georgia and Azerbaijan. The volume of water is 51.15 × 10⁶ m3, with a maximum depth of 7.2 m and average depth of 4.8 m. Water comes mainly through the Gardaban Canal (maximum capacity 15 m3/s) from the Kura River, and another canal starting from the Tbilisi (Samgori) water reser-voir. The lake is quite rich in fish (carp and catfish).
Basin of Lake Jandari
Country Area in the country (km2) Country’s share (%)Georgia 68 67Azerbaijan 34 33Total 102
Pressures and statusWastes from industry, residential areas and agriculture pollute water coming into the reservoir from the Kura River.
A channel was dug from the south-eastern bank of the lake for irrigating land in the territory of Azerbaijan.
In Georgia, lake waters are not used for industrial purposes, and there are no industrial enterprises in the surroundings. There are no direct wastewater discharges to the lake in Georgia. The lake is an important area for commercial fisheries.
Lake Jandari does not have a good ecological or chemical status. Increased pollution from the Kura River and from reservoirs is affecting water quality. Moreover, expansion of irrigated land in both countries and uncoordinated use of water by various users have been decreasing the water level.
Transboundary cooperationAccording to the agreement concluded in 1993 between the State Committee of Irrigation and Water Economy of the Azerbaijan Republic and the Department of Management of Melioration Systems of Georgia, 70 × 106 m3 of water is delivered annually to Jandari water reservoir from Georgia. This includes 50 × 106 m3
for irrigation of 8,500 ha of land of the Akstaphi region of Azer-baijan, and 20 × 106 m3 for maintaining the ecological balance of the water reservoirs.
According to the Agreement on Collaboration in Environmental Protection between the Governments of Georgia and Azerbaijan (1997), the Parties of the Agreement shall consolidate their ef-forts and take all appropriate measures to ensure that the Kura River and Lake Jandari waters are used with the aim of ecologi-cally sound and rational water management, conservation of wa-ter resources, and environmental protection.
kartsakhi lake/aktaş Gölü33
The area of the lake surface is 27 km2, (about 13 km2 in Turkey and 14 km2 in Georgia) and the basin is 158 km2.34 The average and maximum depths are respectively 1.5 and 3.5 m.
The basin is characterized by a very weakly developed hydro-graphical network, consisting mainly of seasonal streams. On the South-Western side (Turkish territory), there are some springs.
Pressures and statusThe lake is not designated as protected area but, being located in a military zone on the Turkish side, human activities are highly restricted. Therefore the quantity and quality of the lake water is preserved as in natural conditions. Only three villages are located near the lake in Turkish territory (population some 700). In the Georgian part, the population is some 5,900 within a radius of 7 km from the lake. There is no extraction of water from the lake in Turkey, nor does Georgia use the lake water for industrial or household needs.
The lake water has naturally elevated salinity of 880 mg/l, af-fected by volcanic rocks occurring in the area.
Lake Kartsakhi/Aktaş Gölü belongs to the Javakheti Wetlands, of which Lake Arpi is included in the List of Wetlands of Inter-national Importance under the Ramsar Convention. The lake is a breeding site for White Pelican and the Dalmatian Pelican, as well as for a variety of other bird species.
32 Based on information from Georgia and the First Assessment. 33 Based on information from Georgia, Turkey and the First Assessment.34 Source: Turkish Statistical Institute, 2008; Resource of Surface Water, Georgia, 1974.
Chapter 4 Drainage basin of the Caspian sea | 149

WetlanDs of Javakheti reGion35
General description of the wetland areaThe distinctive characteristic of the Javakheti region, which distinguishes it from the whole Caucasus, is the presence of nu-merous lakes. Most are connected by rivers, although ground-water interchange is also notable, and all together they represent an ecological entity. Several lakes are of great importance for maintaining the biodiversity of this region. These are, specifi-cally, Lake Arpi in Armenia, which became a reservoir (2,120 ha) after construction of a dam in 1946–1950; Georgian high mountain shallow freshwater lakes Madatapa (870 ha), Khan-chali (590 ha) and Bugdasheni (30 ha); and Lake Kartsakhi/Aktaş/Gölü (2,660 ha), shared by Georgia and Turkey. Adjacent marshes and wet meadows as well as flood-plains also represent important wetland ecosystems.
Main wetland ecosystem services Lake Arpi is considered to play a significant role in sediment trapping. The lakes in this area are valuable sources of freshwater. Lake Arpi also provides water for irrigation, while cattle watering and fishing are also of major importance for the local economy. Lake Khanchali and springs fed by the lake are important sourc-es of drinking and irrigation water for local villages; in Geor-gia some lakes are also used by the local population for fishing. Around the lakes, adjacent meadows are traditionally used for mowing and cattle and sheep grazing. Javakheti landscapes are of high aesthetic value, and the region has good potential for recrea-tion and nature tourism development.
Biodiversity values of the wetland areaJavakheti wetland ecosystems support species-rich natural com-munities that include endemic species (e.g., reptiles, plants and Armenian Gulls), as well as other threatened elements of biologi-cal diversity.
One of the main bird migration routes in the Caucasus crosses the Javakheti Plateau, with lakes Arpi, Madatapa, Bugdashen and Khanchali being the most important for migratory birds in this region. In Georgia alone, the lakes receive about 30,000–40,000 migratory birds each year. The lakes provide important feeding, resting and breeding habitats for grebes, pelicans, herons, geese, ducks, waders, gulls, terns and other waterfowl, as well as for birds of prey, including globally threatened species mentioned in the IUCN Red List: Dalmatian Pelican, Imperial Eagle and Greater Spotted Eagle. Many species are also covered by the Afri-can-Eurasian Waterbird Agreement and national Red Lists.
Pressure factors and transboundary impactsAfter construction of the dam, the surface of the lake/reservoir Arpi increased around five times, the volume around 20 times, and seasonal water-level fluctuation started exceeding 3 m (nat-ural fluctuations less than 0.5 m). The average turnover period became one year (while the natural one is one month). This caused loss of submerged, floating and emergent vegetation, and degradation of habitats for waterfowl and fish. In addition, droughts downstream cause serious deterioration of spawning and nesting conditions for fish and birds. Organic pollution from agriculture (mainly livestock) in the form of nitrogen and phosphorus represents another threat.
On the Georgian side, large-scale draining of wetlands for agri-cultural purposes or transforming them into fish farms began in the 1960s. Lake Khanchali was affected the most: due to drain-age it lost two thirds of its surface area, and later was completely drained several times. The draining of Bugdasheni Lake began in 1998 due to draw-off for drinking water supply for the town Ninotsminda. The southern part of Lake Madatapa is dammed for fishing and agricultural needs; this prevents water exchange and facilitates eutrophication. Draining of lakes leads to the loss of habitats important for waterbirds; another effect is decreasing humidity leading to changes in plant communities that may also affect agricultural production. Additional water loss occurs due to damaged irrigation systems. Disturbing factors for waterbirds include illegal hunting in spring, as well as mowing on lakes' shores and egg-collecting by locals.
In Georgia, introduction of non–native fish species negatively af-fected local fish communities. In addition, Crucian Carp, which has minor economic value, has been accidentally introduced and has out-competed all native fish species. One positive conse-quence is that these fish provide a food source for birds on those lakes where there was no fish before.
Transboundary wetland managementThe “Eco-regional Nature Protection Programme for the South Caucasus Region”, part of the Caucasus Initiative launched by the German Federal Ministry for Economic Cooperation and Development (BMZ), aims to promote cooperation on develop-ment of a coherent strategy to ensure biodiversity conservation in the region. A number of wetlands will be given the status of pro-tected areas on both sides of Armenian-Georgian border. In Ar-menia, the Programme component “Establishment of Protected Areas in the Armenian Javakheti Region” is aimed at establishing a National Park and integrating it into the local context, as well as promoting related transboundary cooperation. The National Park was established in 2009, and includes Lake Arpi and its ba-sin, as well as flood-plains of the upper stream of the Akhuryan/Arpaçay River. At present Ramsar Site Lake Arpi covers 3,149 ha, and includes the whole reservoir and surrounding marshes.
A project aimed at establishment of Javakheti National Park and Kanchali, Madatapa and Bugdasheni Managed Reserves is im-plemented by the Agency of Protected Areas of Georgia and the WWF Caucasus Programme Office with financial support of the BMZ and German Credit Bank of Reconstruction (KFW).
35 Sources: Information Sheet on Ramsar Wetlands (RIS), available at the Ramsar Sites Information Service; Lake Arpi Ramsar site; Armenia (RIS updated in 1997); Jenderedjian, K., and others. About Wetlands, and around Wetlands in Armenia. Zangak, Yerevan. 2004; Jenderedjian, K. Transboundary management of Kura Basin wetlands as an important step towards waterbird conservation in the South Caucasus region; Boere, G.C., Galbraith, C.A., Stroud, D.A. (eds). Waterbirds around the world. The Stationery Office, Edinburgh, UK. 2006; Matcharashvili I. and others. Javakheti Wetlands: biodiversity and conservation, NACRES, Tbilisi. 2004.
150 | part iv

araks/aras sUB-Basin36
The sub-basin of the 1,072-km river Araks/Aras37 is shared by Armenia, Azerbaijan, the Islamic Republic of Iran and Turkey. The river has its source at 2,732 m a.s.l. and discharges into the Kura. The character of the basin ranges from mountain terrain, with an elevation from 2,200 to 2,700 m a.s.l., to lowland.
Major transboundary tributaries to the Araks/Aras River include the rivers Akhuryan/Arpaçay, Arpa, Sarisu/Sari Su, Kotur/Qotur, Voghji/Ohchu and Vorotan/Bargushad.
The reservoirs in the Iranian part of the sub-basin include Aras storage dam, Mill-Moghan diversion dam, Khoda-Afarin storage dam, and the Ghiz-Gale diversion dam.
The following wetlands/peatlands are located in the Iranian part of the basin: Arasbaran protected area; Marakan protected area; Kiamaki wildlife preserve; Yakarat no-hunting zone; Aghaghol wetland and no-hunting zone; and Yarim Ghijel wetland. Also the protected areas of Ghare Boulagh wetland, Sari Su wetland, Eshgh Abad wetland and Siah Baz wetland are located in the Iranian part.
Sub-basin of the Araks/Aras River
Country Area in the country (km2) Country’s share (%)Armenia 22 560a 22Azerbaijan 18 140 17Islamic Republic of Iran
41 800 40
Turkey 22 285b 21Total 104 785
a Chilingaryan, L.A. and others, “Hydrography of rivers and lakes in Armenia”, Institute of hydro-technology and water problems, Armenia. 2002.b Total catchment area of the Kura-Aras basin in Turkey is 27,548 km2.
In the part of the Araks/Aras sub-basin that is Turkey’s territo-ry, surface water resources are estimated at 2.190 km3/year and groundwater resources at 0.144 km3/year, making up a total of 2.334 km3/year, representing 3,058 m3/year/capita.
In the Iranian part of the basin, surface water resources are estimat-ed at 1.327 km3/year and groundwater resources at 0.730 km3/year, making up a total of 2.057 km3/year, almost 854 m3/year/capita.
PressuresThere are pressures on water quality from mining, industrial and municipal wastewater, as well as natural geochemical pro-
cesses. Agricultural pollution from return flows consisting of agrochemical waste, pesticides, nutrients and salts is a particular concern along the whole Araks/Aras River.
Agriculture and animal husbandry are the main economic ac-tivities in the Turkish part of the basin, where there is need for development of irrigation (including efficient techniques). Some 28% of Turkey’s territory in the basin is cropland (20% of it irrigated). The shares of cropland of the basin area in Arme-nia and in the Islamic Republic of Iran are somewhat smaller, about 13% and 15% (37% irrigated), respectively. The Turkish part of the basin is not industrialized, with manufacturing in-dustry limited to small- and medium-size factories; the tourist sector is growing.
Urban areas are connected to a sewerage network, but in gen-eral no wastewater treatment plants have been set up yet. Con-cerning solid waste disposal, in the Turkish part, only Erzurum province has a sanitary landfill. Municipalities’ controlled dump sites cause a pollution risk to surface water and groundwater. The pressures from wastewater and solid waste are both assessed by Turkey as widespread but moderate. Wastewater discharges from small and medium industries are reported to cause pollu-tion in Turkey, but it is considered local and moderate, whereas in the Islamic Republic of Iran discharges from industries are viewed to have a widespread and severe influence.
Flooding of the plain areas in Iğdır province in Turkey is a longstanding issue, despite protection works over decades. The lower part of the Araks/Aras River in Turkey is at a risk of flood-ing during high flows in winter and spring.
nAKhiChevAn/LARijAn And djeBRAiL AquifeR (no. 49)38
Azerbaijan islamic Republic of iranType 3; gravel-pebble, sand, boulder. Strong and shallow links with surface water. Area (km2) 1 480 N/AThickness: mean, max (m) 60, 150 N/AGroundwater uses and functions Irrigation (55–60%)
drinking water (40–45%)N/A
Groundwater management measures Need to be improved: abstraction management, quantity and quality monitoring, protection zones,
good agricultural practices, mapping.Need to be applied: transboundary institutions,
data exchange, integrated river basin management, treatment of urban and industrial wastewater.
N/A
Other information 1) Joint monitoring programme is felt to be needed; 2) Increased water use is expected in Azerbaijan; 3) no water quality or quantity problems are reported.
N/A
36 Based on information from Armenia, the Islamic Republic of Iran, Turkey and the First Assessment.37 The river is known as Aras in Azerbaijan, the Islamic Republic of Iran and Turkey. 38 In the First Assessment, the aquifer was called “Middle and Lower Araks”.
Chapter 4 Drainage basin of the Caspian sea | 151

Hydraulic action, particularly in the plain regions, has resulted in intense bank erosion. In Turkey, erosion is severe in steep valleys and slopes, from where sediments are transported from tributar-ies into the main river course. Morphological changes and ero-sion in the riverbed and riverbanks have occurred also due to ag-gregate mining, which is assessed as severe in influence, ranging from local to widespread. Medium- and small-scale quarrying in the Turkish part of the sub-basin result in morphological changes in landscape.
According to the Islamic Republic of Iran, heavy metals (Cu, Mn, Fe etc.) from mining waste in left-side tributaries from Armenia rank among the main sources of transboundary pollution in the Araks/Aras River. However, investments in improving the facili-ties in recent years, including by international companies, have improved the situation. According to Armenia, 1) the wastewater flow from mining on the Armenian side is small and their pre-liminary treatment should limit adding to heavy metals content in the river; 2) heavy metals content in the river at the Armenian-Iranian border, according to the Armenian-Iranian monitoring data 2006-2009, is typical geochemical background.
Transfer of experience within the region could be beneficial, for example in controlling pollution from copper mines, in which area the Islamic Republic of Iran has gained experience by devel-oping closed water circulation in the processes. There is aware-ness that tailings dams are vulnerable to earthquakes.
In Turkey, water supply for villages and municipalities is mainly provided from groundwater sources, and groundwater is also used by farmers for local irrigation. Surface water is withdrawn for irrigation. There are hydropower projects under develop-ment, which may influence water availability for other sectors.
The Islamic Republic of Iran expects its water use to increase from 3,000 × 106 m3/year to 4,800 × 106 m3/year.
StatusThe ecological and chemical status of the river is reported as sat-isfactory for aquatic life, municipal and industrial uses, and other uses.
According to measurements by Armenia from 2006 to 2009 along the Araks/Aras, heavy metals such as Al, Fe, Mn, Cr and V occur in the water in moderate amounts. Some of these are part of the typical geochemical background of the Araks/Aras. The Islamic Republic of Iran rates the issue of naturally elevated metal concentrations as serious but local; Armenia, as widespread but moderate (considering the levels of the following elements: Al, Fe, Mn, V, Cr, cobalt (Co), nickel (Ni), Cu and Zn). Chrome (Cr) occurs at amounts exceeding MAC almost every year. The nitrate level did not exceed MAC during the same observation period. Metal concentrations are influenced by elevated back-ground levels in the area.
Water quality monitoring results from the period 2006–2009 in Armenia indicate a gradual increasing trend of BOD
5 (MAC: 3
mg/l), especially during 2009. The concentration of total phos-phorus was lower than MAC (MAC: 1–0.4 mg/l). The nitrite ion exceeded MAC (MAC: 0.024 mg N/l) during the 2006–2009 period, and the greatest influence of municipal wastewater on water quality in the river has been observed before and after mix-ing with waters of the tributary Razdan.
The previously important industrial activities in Armenia (min-eral fertilizers, synthetics for instruments and watches, fiberglass) have considerably decreased in the past two-three decades; the chemical industry essentially shut down for a long period after the break-up of the Soviet Union. While the Islamic Republic of Iran assesses that there are still problems of heavy metal pollu-tion, in particular downstream the Agarak copper-molybdenum mine (on the Karchevan tributary), Armenia assesses mining im-pacts limited, taking into account the geochemical background concentrations and that the treatment of wastewater from min-ing has improved.
In the section of the river downstream in Azerbaijan, the high-est concentrations in river water are observed for phenols (13 MAC), metals (9 MAC), sulphate (6 MAC) and petroleum (4 MAC),39 and the quantity of mineralization/total dissolved solids (1,130 mg/l) exceeds the sanitary norm by 25-35%.
Heavy metal concentrations from monitoring locations on the Araks/Aras in Armenia before (IMS-1, 500 m upstream) and after (IMS-3; 2.5 km downstream) the confluence with the Karchevan tributary where wastewaters from the Agarak mine are discharged
Sites Copper (mg/l)Manganese
(mg/l) iron (mg/l) Chrome (mg/l)IMS-1 0.0039 0.0130 0.1729 0.0045IMS-3 0.0022 0.0106 0.2016 0.0040
Source: Armenian – Iranian joint monitoring.
According to Turkish Inland Water Quality Standards, water quality in the Turkish part of the Araks/Aras River is in Class I and Class II, that is, unpolluted and/or less polluted water bod-ies, respectively.
ResponsesIn the Araks/Aras River Basin, the monitoring network in Turk-ish territory includes some 55 monitoring stations (regular moni-toring of water quantity and quality goes back to the 1960s), and the network in Armenian territory 80 stations (regular monitor-ing of quality since 1977).
The development of Water Resources Management Plan for the Araks/Aras River sub-basin is a part of Turkey’s medium- to long-term national environmental strategies. Water and land develop-ment projects carried out in the Turkish part of the Araks/Aras River sub-basin are mainly oriented towards developing hydro-power, irrigation and domestic water supply. There is at present
Total water withdrawal and withdrawals per sector in the Araks/Aras sub-basin
CountryTotal withdrawal
×106 m3/year Agricultural % domestic % industry % energy % other %Armenia N/A N/A N/A N/A N/A N/AAzerbaijan N/A N/A N/A N/A N/A N/AIslamic Republic of Iran
3 000 93 5.5 0.76 0 0.5
Turkeya 507 89 11 N/A N/A N/Aa Agriculture and domestic are the main water-user sectors (no information available on the others).
39 The MAC for phenols and petroleum is 0.05 mg/l in Armenia. In Armenia the detected concentrations have been reported to be a few times lower.
152 | part iv
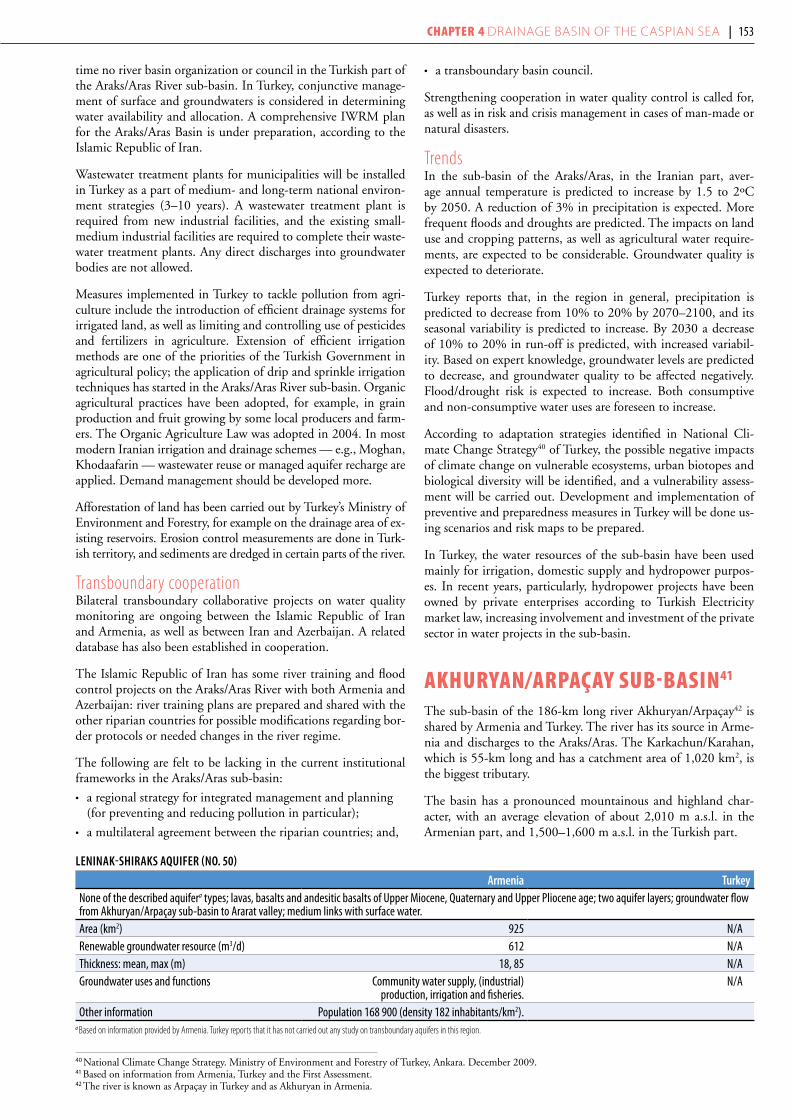
time no river basin organization or council in the Turkish part of the Araks/Aras River sub-basin. In Turkey, conjunctive manage-ment of surface and groundwaters is considered in determining water availability and allocation. A comprehensive IWRM plan for the Araks/Aras Basin is under preparation, according to the Islamic Republic of Iran.
Wastewater treatment plants for municipalities will be installed in Turkey as a part of medium- and long-term national environ-ment strategies (3–10 years). A wastewater treatment plant is required from new industrial facilities, and the existing small-medium industrial facilities are required to complete their waste-water treatment plants. Any direct discharges into groundwater bodies are not allowed.
Measures implemented in Turkey to tackle pollution from agri-culture include the introduction of efficient drainage systems for irrigated land, as well as limiting and controlling use of pesticides and fertilizers in agriculture. Extension of efficient irrigation methods are one of the priorities of the Turkish Government in agricultural policy; the application of drip and sprinkle irrigation techniques has started in the Araks/Aras River sub-basin. Organic agricultural practices have been adopted, for example, in grain production and fruit growing by some local producers and farm-ers. The Organic Agriculture Law was adopted in 2004. In most modern Iranian irrigation and drainage schemes — e.g., Moghan, Khodaafarin — wastewater reuse or managed aquifer recharge are applied. Demand management should be developed more.
Afforestation of land has been carried out by Turkey’s Ministry of Environment and Forestry, for example on the drainage area of ex-isting reservoirs. Erosion control measurements are done in Turk-ish territory, and sediments are dredged in certain parts of the river.
Transboundary cooperationBilateral transboundary collaborative projects on water quality monitoring are ongoing between the Islamic Republic of Iran and Armenia, as well as between Iran and Azerbaijan. A related database has also been established in cooperation.
The Islamic Republic of Iran has some river training and flood control projects on the Araks/Aras River with both Armenia and Azerbaijan: river training plans are prepared and shared with the other riparian countries for possible modifications regarding bor-der protocols or needed changes in the river regime.
The following are felt to be lacking in the current institutional frameworks in the Araks/Aras sub-basin:
• a regional strategy for integrated management and planning (for preventing and reducing pollution in particular);
• a multilateral agreement between the riparian countries; and,
• a transboundary basin council.
Strengthening cooperation in water quality control is called for, as well as in risk and crisis management in cases of man-made or natural disasters.
TrendsIn the sub-basin of the Araks/Aras, in the Iranian part, aver-age annual temperature is predicted to increase by 1.5 to 2ºC by 2050. A reduction of 3% in precipitation is expected. More frequent floods and droughts are predicted. The impacts on land use and cropping patterns, as well as agricultural water require-ments, are expected to be considerable. Groundwater quality is expected to deteriorate.
Turkey reports that, in the region in general, precipitation is predicted to decrease from 10% to 20% by 2070–2100, and its seasonal variability is predicted to increase. By 2030 a decrease of 10% to 20% in run-off is predicted, with increased variabil-ity. Based on expert knowledge, groundwater levels are predicted to decrease, and groundwater quality to be affected negatively. Flood/drought risk is expected to increase. Both consumptive and non-consumptive water uses are foreseen to increase.
According to adaptation strategies identified in National Cli-mate Change Strategy40 of Turkey, the possible negative impacts of climate change on vulnerable ecosystems, urban biotopes and biological diversity will be identified, and a vulnerability assess-ment will be carried out. Development and implementation of preventive and preparedness measures in Turkey will be done us-ing scenarios and risk maps to be prepared.
In Turkey, the water resources of the sub-basin have been used mainly for irrigation, domestic supply and hydropower purpos-es. In recent years, particularly, hydropower projects have been owned by private enterprises according to Turkish Electricity market law, increasing involvement and investment of the private sector in water projects in the sub-basin.
akhUryan/arpaçay sUB-Basin41
The sub-basin of the 186-km long river Akhuryan/Arpaçay42 is shared by Armenia and Turkey. The river has its source in Arme-nia and discharges to the Araks/Aras. The Karkachun/Karahan, which is 55-km long and has a catchment area of 1,020 km2, is the biggest tributary.
The basin has a pronounced mountainous and highland char-acter, with an average elevation of about 2,010 m a.s.l. in the Armenian part, and 1,500–1,600 m a.s.l. in the Turkish part.
40 National Climate Change Strategy. Ministry of Environment and Forestry of Turkey, Ankara. December 2009.41 Based on information from Armenia, Turkey and the First Assessment.42 The river is known as Arpaçay in Turkey and as Akhuryan in Armenia.
LeninAK-ShiRAKS AquifeR (no. 50)
Armenia TurkeyNone of the described aquifera types; lavas, basalts and andesitic basalts of Upper Miocene, Quaternary and Upper Pliocene age; two aquifer layers; groundwater flow from Akhuryan/Arpaçay sub-basin to Ararat valley; medium links with surface water.Area (km2) 925 N/ARenewable groundwater resource (m3/d) 612 N/AThickness: mean, max (m) 18, 85 N/AGroundwater uses and functions Community water supply, (industrial)
production, irrigation and fisheries.N/A
Other information Population 168 900 (density 182 inhabitants/km2).a Based on information provided by Armenia. Turkey reports that it has not carried out any study on transboundary aquifers in this region.
Chapter 4 Drainage basin of the Caspian sea | 153

Sub-basin of the Akhuryan/Arpaçay River
Country Area in the country (km2)a Country’s share (%)Turkey 6 798 71Armenia 2 784 29Total 9 582
a Source: Chilingaryan, L.A. and others. Hydrography of rivers and lakes in Armenia, Institute of hydro-technology and water problems, Armenia. 2002.
In the part of the basin that is Turkey’s territory, surface water resources are estimated at 0.781 km3/year and groundwater re-sources at 0.020 km3/year, making up a total of 0.801 km3/year, representing 3,055 m3/capita/year. In the part of the sub-basin that is Armenia’s territory, surface water resources are estimated at 1.093 km3/year (based on data from 1983 to 2008) and ground-water resources at 0.369 km3/year (based on data from 1983 to 2008), a total of 1.462 km3/year, with an approximate total of 5,200 m3/capita/year.
The river flow of the Akhuryan/Arpaçay is heavily regulated by reservoirs: Akhuryan/Arpaçay Reservoir (volume 525 × 106 m3) and Arpilits Reservoir (105 × 106 m3).
PressuresSurface water is mainly used for irrigation purposes in the Turk-ish part of the sub-basin. Water supply for municipalities is gen-erally provided from groundwater sources, and this is also used for local irrigation by farmers.
Some 913 × 106 m3 of water was withdrawn in 2009 in the Turk-ish part of the basin, including withdrawal from storage water of Arpacay Reservoir. Some 97% of the withdrawal was for agricul-tural and 3% for domestic purposes. Some 35% of Turkey’s ter-ritory in the basin is cropland (about 10% irrigated), and almost 40% is grassland; for Armenia, the figures are 27% and 43%, respectively. Water use for industry may be considered insignifi-cant in the Turkish share of the basin; the existing small factories are supplied generally with water from municipalities or with groundwater from wells.
The main pressure factors in the Akhuryan/Arpaçay basin in-clude agriculture and animal husbandry, as well as discharge of untreated or insufficiently treated urban/municipal wastewater. Municipalities in urban areas are generally connected to a sewer-age network, but they mostly do not have wastewater treatment plants in place for the time being. Controlled municipal dump sites also cause a pollution risk for surface and groundwater re-sources. Morphological changes and erosion in the riverbed are also a concern. Geochemical processes are another factor that af-fects water quality. River water quality is assessed as moderate.
TrendsAccording to predictions reported by Armenia, air temperature is expected to increase by 1.1ºC, and precipitation to decrease by 3.1%, by 2030. Later, the amount of precipitation is predicted to decrease by 7 to 10%. As a result of climate change, groundwater
level is expected to decrease. River discharges are predicted to decrease by 10–15%. The impact on water use is also expected to be significant.
Turkey reports that there is no existing study or research involv-ing climate change modelling for the sub-basin of the Akhuryan/Arpaçay River based on observations. However, according to national predictions and long-term scenarios, both precipitation and river run-off are expected to decrease by 10 to 20% — the former by 2070–2100 and the latter by 2030 — with increased seasonal variability in precipitation and flood/drought risk. Wa-ter use is foreseen to increase.
akhUryan/arpaçay reservoir43
The Akhuryan/Arpaçay dam44 (active storage capacity of 525 × 106 m3/year) was jointly constructed by Turkey and the Soviet Union, mainly for irrigation and flood protection, between the period from 1979 to 1983, along the Akhuryan/Arpaçay bound-ary river, in accordance with the Cooperation Agreement of 1975 between the two countries. Up until the 1990s the dam was jointly operated by Turkey and the Soviet Union and, since then, by Turkey and Armenia.
PressuresIn Turkey, the water of Akhuryan/Arpaçay Reservoir and the flow of the Araks/Aras River is used for irrigation of Iğdır Plain (70,530 ha). The Serdarabat Regulator for diverting irrigation water was constructed in 1937 downstream of the dam, on the main course of the Araks/Aras River, in accordance with a 1927 agreement between Turkey and the Soviet Union.
Since 2004, there is an Interstate Commission of Armenia and Turkey on the Use of Akhuryan Water Reservoir.
arpa sUB-Basin45
The sub-basin of the 92-km river Arpa is shared by Armenia and Azerbaijan. The river has its source at an elevation of 3,200 m a.s.l. and discharges into the Araks/Aras River.
The sub-basin has a pronounced mountainous character, with an average elevation of about 2,090 m a.s.l.
Sub-basin of the Arpa River
Country Area in the country (km2) Country’s share (%)Armenia 2 080 79Azerbaijan 550 21Total 2 630
Source: L.A. Chilingarjan et al. “Hydrography of rivers and lakes in Armenia”, Institute of hydro-technology and water problems, Armenia.
Hydrology and hydrogeologyReservoirs on the Arpa include Gerger (volume 26.0 × 10⁶ m3)
43 Based on information from Armenia, Turkey and the First Assessment.44 The dam is called “Arpaçay Baraji” and the reservoir “Arpaçay Baraj Gölü” in Turkey.
heRheR, MALiShKin And jeRMuK AquifeRS (no. 51)43
Armenia AzerbaijanDoes not correspond with described aquifer types; volcanic rocks of Upper and Middle Eocene age; weak links with surface water.Groundwater uses and functions Domestic water supply and irrigation. N/APressure factors Agriculture. N/AOther information In the Armenian part of the aquifer, groundwater
storage is estimated to be about 40 × 106 m3. N/A
154 | part iv
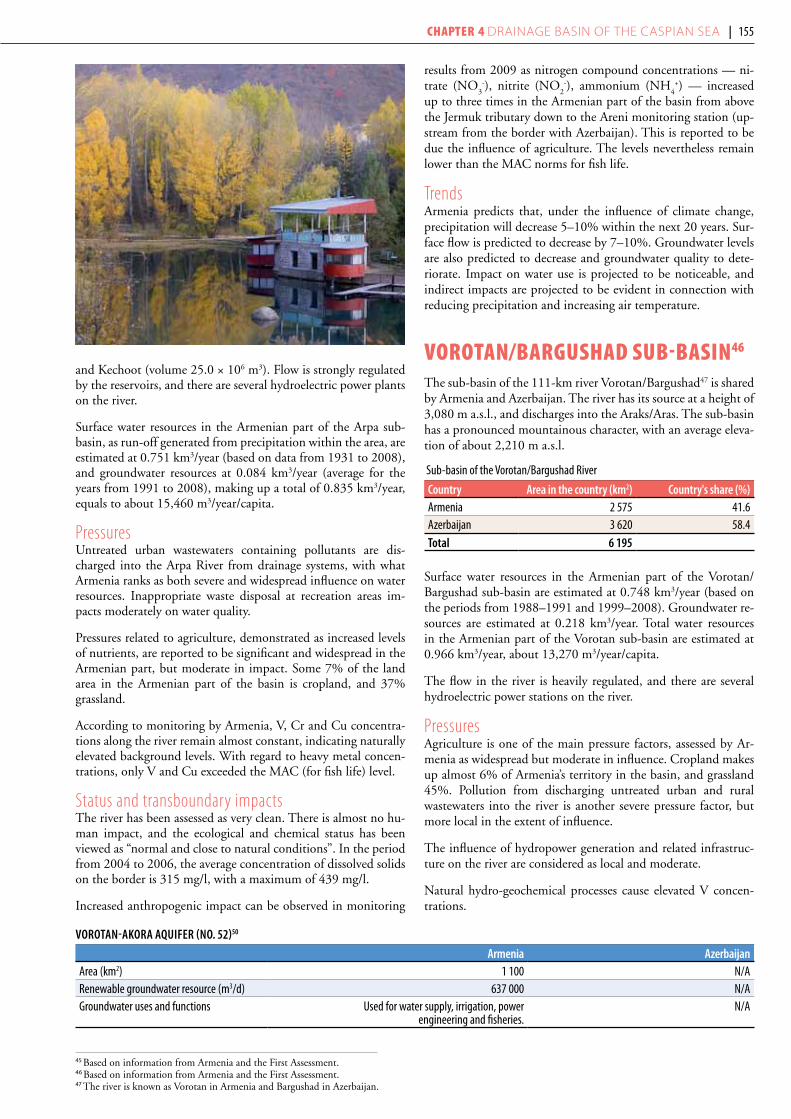
and Kechoot (volume 25.0 × 10⁶ m3). Flow is strongly regulated by the reservoirs, and there are several hydroelectric power plants on the river.
Surface water resources in the Armenian part of the Arpa sub-basin, as run-off generated from precipitation within the area, are estimated at 0.751 km3/year (based on data from 1931 to 2008), and groundwater resources at 0.084 km3/year (average for the years from 1991 to 2008), making up a total of 0.835 km3/year, equals to about 15,460 m3/year/capita.
PressuresUntreated urban wastewaters containing pollutants are dis-charged into the Arpa River from drainage systems, with what Armenia ranks as both severe and widespread influence on water resources. Inappropriate waste disposal at recreation areas im-pacts moderately on water quality.
Pressures related to agriculture, demonstrated as increased levels of nutrients, are reported to be significant and widespread in the Armenian part, but moderate in impact. Some 7% of the land area in the Armenian part of the basin is cropland, and 37% grassland.
According to monitoring by Armenia, V, Cr and Cu concentra-tions along the river remain almost constant, indicating naturally elevated background levels. With regard to heavy metal concen-trations, only V and Cu exceeded the MAC (for fish life) level.
Status and transboundary impactsThe river has been assessed as very clean. There is almost no hu-man impact, and the ecological and chemical status has been viewed as “normal and close to natural conditions”. In the period from 2004 to 2006, the average concentration of dissolved solids on the border is 315 mg/l, with a maximum of 439 mg/l.
Increased anthropogenic impact can be observed in monitoring
results from 2009 as nitrogen compound concentrations — ni-trate (NO
3-), nitrite (NO
2-), ammonium (NH
4+) — increased
up to three times in the Armenian part of the basin from above the Jermuk tributary down to the Areni monitoring station (up-stream from the border with Azerbaijan). This is reported to be due the influence of agriculture. The levels nevertheless remain lower than the MAC norms for fish life.
TrendsArmenia predicts that, under the influence of climate change, precipitation will decrease 5–10% within the next 20 years. Sur-face flow is predicted to decrease by 7–10%. Groundwater levels are also predicted to decrease and groundwater quality to dete-riorate. Impact on water use is projected to be noticeable, and indirect impacts are projected to be evident in connection with reducing precipitation and increasing air temperature.
vorotan/BarGUshaD sUB-Basin46
The sub-basin of the 111-km river Vorotan/Bargushad47 is shared by Armenia and Azerbaijan. The river has its source at a height of 3,080 m a.s.l., and discharges into the Araks/Aras. The sub-basin has a pronounced mountainous character, with an average eleva-tion of about 2,210 m a.s.l.
Sub-basin of the Vorotan/Bargushad River
Country Area in the country (km2) Country's share (%)Armenia 2 575 41.6Azerbaijan 3 620 58.4Total 6 195
Surface water resources in the Armenian part of the Vorotan/Bargushad sub-basin are estimated at 0.748 km3/year (based on the periods from 1988–1991 and 1999–2008). Groundwater re-sources are estimated at 0.218 km3/year. Total water resources in the Armenian part of the Vorotan sub-basin are estimated at 0.966 km3/year, about 13,270 m3/year/capita.
The flow in the river is heavily regulated, and there are several hydroelectric power stations on the river.
PressuresAgriculture is one of the main pressure factors, assessed by Ar-menia as widespread but moderate in influence. Cropland makes up almost 6% of Armenia’s territory in the basin, and grassland 45%. Pollution from discharging untreated urban and rural wastewaters into the river is another severe pressure factor, but more local in the extent of influence.
The influence of hydropower generation and related infrastruc-ture on the river are considered as local and moderate.
Natural hydro-geochemical processes cause elevated V concen-trations.
voRoTAn-AKoRA AquifeR (no. 52)50
Armenia AzerbaijanArea (km2) 1 100 N/ARenewable groundwater resource (m3/d) 637 000 N/AGroundwater uses and functions Used for water supply, irrigation, power
engineering and fisheries.N/A
45 Based on information from Armenia and the First Assessment.46 Based on information from Armenia and the First Assessment.47 The river is known as Vorotan in Armenia and Bargushad in Azerbaijan.
Chapter 4 Drainage basin of the Caspian sea | 155

StatusThe ecological and chemical status has been assessed as “normal and close to natural conditions”. The average content of dissolved solids was found at the border to be 199 mg/l, with a maximum of 260 mg/l during the period from 2004 to 2006.48
The anthropogenic impact is manifested by the fact that the con-centrations of NO
3-, NO
2-, NH
4+, phosphate (PO
43-) ions and
CODCr
in river water increased 1.5–2.5 times from source to mouth, but remain lower than the MAC norms for fish life.49 The increases in concentrations may be due to diffuse pollution from agriculture and/or pollution from municipal wastewater. Moni-toring results in Armenia in 2009 show the concentrations of both nitrogen compounds and phosphate to have peaked below the confluence of the Sisian tributary. BOD and dissolved oxygen remained approximately unchanged along the length of the river in the Armenian part.
Heavy metal concentrations, except V and Cu, were within the MAC (for fish life) level in the Armenian part of the basin. The consistency of Cd, Cu, Fe and Cr concentrations may be influ-enced by the natural geochemical background. In 2009, V and arsenic (As) concentrations were clearly more elevated on the Si-sian tributary and below its confluence. Mn, molybdenum (Mo) and lead (Pb) were highest on the main course of the river, below the confluence of the Sisian, and Cu reached its highest concen-tration at the Tatev hydroelectric station monitoring station, just upstream from the border with Azerbaijan.
Transboundary cooperationAn agreement between Armenia and Azerbaijan on the joint utilization of the waters of the river Vorotan/Bargushad was signed in 1974.
TrendsAccording to Armenian predictions, precipitation should de-crease in the area by 5–10% within the next 20 years, due to climate change. Surface flow is predicted to decrease by 8–10%. Groundwater level is also expected to decrease, and groundwa-ter quality to deteriorate somewhat. Some indirect or secondary impacts, such as on land use and agriculture, are also expected.
voGhJi/ohChU sUB-Basin50
The sub-basin of the 82-km river Voghji/Ohchu51 is shared by Ar-menia and Azerbaijan. The river discharges into the Araks/Aras. The Geghi is the most important tributary. The sub-basin has a pro-nounced mountainous character, with an average elevation of 2,337 m a.s.l. Lakes Gazana and Kaputan are located in the sub-basin.
At present, the river flow is not regulated. The Geghi Reservoir in the Armenian part is unfinished.
Sub-basin of the Voghji/Ohchu River
Country Area in the country (km2) Country's share (%)Armenia 880 70Azerbaijan 377 30Total 1 257
Surface water resources in the Armenian part of the Voghji/Oh-chu sub-basin — estimated as run-off generated from precipitation
— are approximately 0.472 km3/year (based on the periods from 1965-1991 and 2000-2008). Groundwater resources are estimated at 0.036 km3/year (average for years from 1991–2008). Total water resources in the Armenian part of the sub-basin are estimated at 0.508 km3/year, about 10,100 m3/year/capita.
PressuresIn Armenian territory, arable lands are mainly on slopes, especially in Kapan region, limiting effective land cultivation. These areas commonly serve as pastures, limiting the impact of agriculture.
Groundwater discharging from springs is used for domestic water supply and for irrigation. Groundwater occurs in intrusive rocks and metamorphic slates of Upper Jurassic and Middle Devonian age. Links with surface water systems are medium.
Discharges of untreated or insufficiently treated municipal wastewater into the river, in addition to industrial activities, are among the main pressure factors. Their influence is assessed as widespread and severe.
Water seeping from Artsvanik tailings dam in Kapan affects the river water quality, mainly by increasing heavy metal concentra-tions (V, Mn, Zn, Mo, Cd).
The influence of hydropower generation and related infrastructure on the river are considered as local and moderate in Armenia.
StatusAt the time of the First Assessment (2007), the ecological and chemical status of the Voghji/Ohchu River system was reported to be “not satisfactory for aquatic life”, but appropriate for other uses. The average mineral content was at the time reported to be 296 mg/l, with a maximum of 456 mg/l during the period from 2004 to 2006.
The annual average concentrations of NO3-, NO
2- and NH
4+
measured in Armenia increased by 2.7–7.8 times from the source of the Voghji/Ohchu River to the downstream monitoring site lo-cated close to the border. This demonstrates anthropogenic impact, mainly from pollution by municipal wastewater and/or agriculture. At the monitoring site located close to the border, only NH
4+ con-
centrations exceed the MAC norms (for fish life), by 1.3 times, in particular at the monitoring station located at the mouth of the Norashenik tributary. NO
2- ion concentrations were clearly higher
compared with the rest, as were to some degree those of NO3-.
Natural hydro-geochemical processes in the areas of ore deposits cause elevated metal concentrations in water (Pb, Fe and Cr), but this influence is rated as local and moderate by Armenia. However, as an increase in concentrations of heavy metals such as Zn, Cd, Mn and Cu has been observed from upstream to down-stream in 2009, increasing markedly below Kapan and staying at elevated levels down to the last monitoring station upstream from the border, some influence of sewage and industrial efflu-ents is inferred in Armenian territory.
TrendsPrecipitation is predicted by Armenia to decrease in the area by 3–5% within the next 20 years, due to climate change. Surface water flow is predicted to decrease (by 2–3%), and groundwater level also. A marked impact from climate change on water use is expected, as well as impacts on land use and agriculture.
48 Source: The First Assessment. 49 In Armenia, water classification is based on MAC values for maintenance of aquatic life, which are more stringent than the MAC values for other uses. 50 Based on information from Armenia and the First Assessment.51 The river is known as Voghji in Armenia and Ohchu in Azerbaijan.
156 | part iv
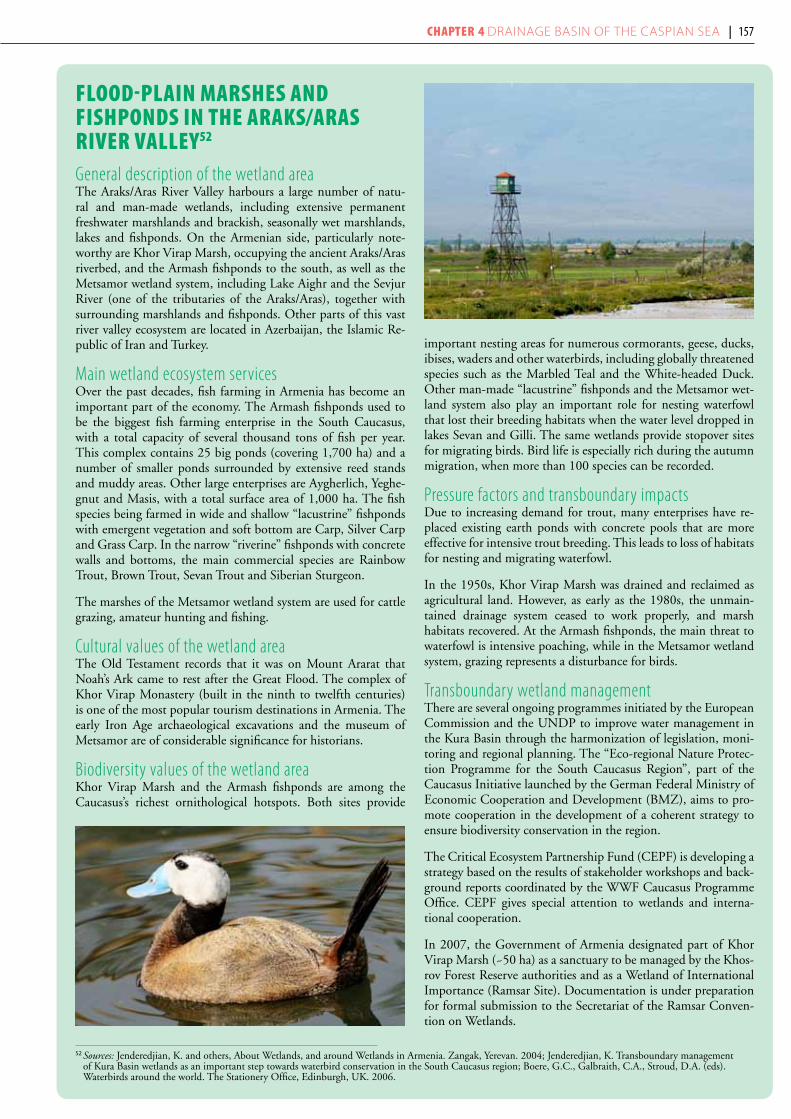
52 Sources: Jenderedjian, K. and others, About Wetlands, and around Wetlands in Armenia. Zangak, Yerevan. 2004; Jenderedjian, K. Transboundary management of Kura Basin wetlands as an important step towards waterbird conservation in the South Caucasus region; Boere, G.C., Galbraith, C.A., Stroud, D.A. (eds). Waterbirds around the world. The Stationery Office, Edinburgh, UK. 2006.
flooD-plain marshes anD fishponDs in the araks/aras river valley52
General description of the wetland areaThe Araks/Aras River Valley harbours a large number of natu-ral and man-made wetlands, including extensive permanent freshwater marshlands and brackish, seasonally wet marshlands, lakes and fishponds. On the Armenian side, particularly note-worthy are Khor Virap Marsh, occupying the ancient Araks/Aras riverbed, and the Armash fishponds to the south, as well as the Metsamor wetland system, including Lake Aighr and the Sevjur River (one of the tributaries of the Araks/Aras), together with surrounding marshlands and fishponds. Other parts of this vast river valley ecosystem are located in Azerbaijan, the Islamic Re-public of Iran and Turkey.
Main wetland ecosystem servicesOver the past decades, fish farming in Armenia has become an important part of the economy. The Armash fishponds used to be the biggest fish farming enterprise in the South Caucasus, with a total capacity of several thousand tons of fish per year. This complex contains 25 big ponds (covering 1,700 ha) and a number of smaller ponds surrounded by extensive reed stands and muddy areas. Other large enterprises are Aygherlich, Yeghe-gnut and Masis, with a total surface area of 1,000 ha. The fish species being farmed in wide and shallow “lacustrine” fishponds with emergent vegetation and soft bottom are Carp, Silver Carp and Grass Carp. In the narrow “riverine” fishponds with concrete walls and bottoms, the main commercial species are Rainbow Trout, Brown Trout, Sevan Trout and Siberian Sturgeon.
The marshes of the Metsamor wetland system are used for cattle grazing, amateur hunting and fishing.
Cultural values of the wetland areaThe Old Testament records that it was on Mount Ararat that Noah’s Ark came to rest after the Great Flood. The complex of Khor Virap Monastery (built in the ninth to twelfth centuries) is one of the most popular tourism destinations in Armenia. The early Iron Age archaeological excavations and the museum of Metsamor are of considerable significance for historians.
Biodiversity values of the wetland areaKhor Virap Marsh and the Armash fishponds are among the Caucasus’s richest ornithological hotspots. Both sites provide
important nesting areas for numerous cormorants, geese, ducks, ibises, waders and other waterbirds, including globally threatened species such as the Marbled Teal and the White-headed Duck. Other man-made “lacustrine” fishponds and the Metsamor wet-land system also play an important role for nesting waterfowl that lost their breeding habitats when the water level dropped in lakes Sevan and Gilli. The same wetlands provide stopover sites for migrating birds. Bird life is especially rich during the autumn migration, when more than 100 species can be recorded.
Pressure factors and transboundary impactsDue to increasing demand for trout, many enterprises have re-placed existing earth ponds with concrete pools that are more effective for intensive trout breeding. This leads to loss of habitats for nesting and migrating waterfowl.
In the 1950s, Khor Virap Marsh was drained and reclaimed as agricultural land. However, as early as the 1980s, the unmain-tained drainage system ceased to work properly, and marsh habitats recovered. At the Armash fishponds, the main threat to waterfowl is intensive poaching, while in the Metsamor wetland system, grazing represents a disturbance for birds.
Transboundary wetland managementThere are several ongoing programmes initiated by the European Commission and the UNDP to improve water management in the Kura Basin through the harmonization of legislation, moni-toring and regional planning. The “Eco-regional Nature Protec-tion Programme for the South Caucasus Region”, part of the Caucasus Initiative launched by the German Federal Ministry of Economic Cooperation and Development (BMZ), aims to pro-mote cooperation in the development of a coherent strategy to ensure biodiversity conservation in the region.
The Critical Ecosystem Partnership Fund (CEPF) is developing a strategy based on the results of stakeholder workshops and back-ground reports coordinated by the WWF Caucasus Programme Office. CEPF gives special attention to wetlands and interna-tional cooperation.
In 2007, the Government of Armenia designated part of Khor Virap Marsh (~50 ha) as a sanctuary to be managed by the Khos-rov Forest Reserve authorities and as a Wetland of International Importance (Ramsar Site). Documentation is under preparation for formal submission to the Secretariat of the Ramsar Conven-tion on Wetlands.
Chapter 4 Drainage basin of the Caspian sea | 157
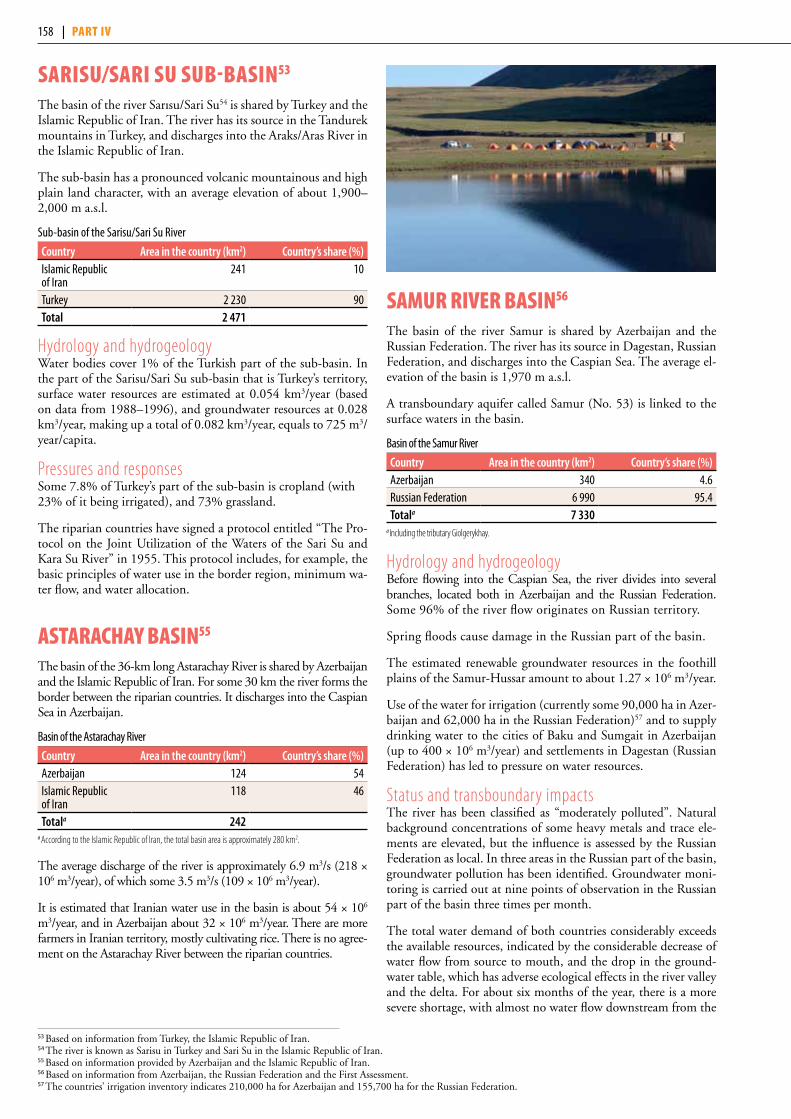
sarisU/sari sU sUB-Basin53
The basin of the river Sarısu/Sari Su54 is shared by Turkey and the Islamic Republic of Iran. The river has its source in the Tandurek mountains in Turkey, and discharges into the Araks/Aras River in the Islamic Republic of Iran.
The sub-basin has a pronounced volcanic mountainous and high plain land character, with an average elevation of about 1,900–2,000 m a.s.l.
Sub-basin of the Sarisu/Sari Su River
Country Area in the country (km2) Country’s share (%)Islamic Republic of Iran
241 10
Turkey 2 230 90Total 2 471
Hydrology and hydrogeologyWater bodies cover 1% of the Turkish part of the sub-basin. In the part of the Sarisu/Sari Su sub-basin that is Turkey’s territory, surface water resources are estimated at 0.054 km3/year (based on data from 1988–1996), and groundwater resources at 0.028 km3/year, making up a total of 0.082 km3/year, equals to 725 m3/year/capita.
Pressures and responsesSome 7.8% of Turkey’s part of the sub-basin is cropland (with 23% of it being irrigated), and 73% grassland.
The riparian countries have signed a protocol entitled “The Pro-tocol on the Joint Utilization of the Waters of the Sari Su and Kara Su River” in 1955. This protocol includes, for example, the basic principles of water use in the border region, minimum wa-ter flow, and water allocation.
astaraChay Basin55
The basin of the 36-km long Astarachay River is shared by Azerbaijan and the Islamic Republic of Iran. For some 30 km the river forms the border between the riparian countries. It discharges into the Caspian Sea in Azerbaijan.
Basin of the Astarachay River
Country Area in the country (km2) Country’s share (%)Azerbaijan 124 54Islamic Republic of Iran
118 46
Totala 242a According to the Islamic Republic of Iran, the total basin area is approximately 280 km2.
The average discharge of the river is approximately 6.9 m3/s (218 × 106 m3/year), of which some 3.5 m3/s (109 × 106 m3/year).
It is estimated that Iranian water use in the basin is about 54 × 106 m3/year, and in Azerbaijan about 32 × 106 m3/year. There are more farmers in Iranian territory, mostly cultivating rice. There is no agree-ment on the Astarachay River between the riparian countries.
samUr river Basin56
The basin of the river Samur is shared by Azerbaijan and the Russian Federation. The river has its source in Dagestan, Russian Federation, and discharges into the Caspian Sea. The average el-evation of the basin is 1,970 m a.s.l.
A transboundary aquifer called Samur (No. 53) is linked to the surface waters in the basin.
Basin of the Samur River
Country Area in the country (km2) Country’s share (%)Azerbaijan 340 4.6Russian Federation 6 990 95.4Totala 7 330
a Including the tributary Giolgerykhay.
Hydrology and hydrogeologyBefore flowing into the Caspian Sea, the river divides into several branches, located both in Azerbaijan and the Russian Federation. Some 96% of the river flow originates on Russian territory.
Spring floods cause damage in the Russian part of the basin.
The estimated renewable groundwater resources in the foothill plains of the Samur-Hussar amount to about 1.27 × 10⁶ m3/year.
Use of the water for irrigation (currently some 90,000 ha in Azer-baijan and 62,000 ha in the Russian Federation)57 and to supply drinking water to the cities of Baku and Sumgait in Azerbaijan (up to 400 × 106 m3/year) and settlements in Dagestan (Russian Federation) has led to pressure on water resources.
Status and transboundary impactsThe river has been classified as “moderately polluted”. Natural background concentrations of some heavy metals and trace ele-ments are elevated, but the influence is assessed by the Russian Federation as local. In three areas in the Russian part of the basin, groundwater pollution has been identified. Groundwater moni-toring is carried out at nine points of observation in the Russian part of the basin three times per month.
The total water demand of both countries considerably exceeds the available resources, indicated by the considerable decrease of water flow from source to mouth, and the drop in the ground-water table, which has adverse ecological effects in the river valley and the delta. For about six months of the year, there is a more severe shortage, with almost no water flow downstream from the
53 Based on information from Turkey, the Islamic Republic of Iran. 54 The river is known as Sarisu in Turkey and Sari Su in the Islamic Republic of Iran.55 Based on information provided by Azerbaijan and the Islamic Republic of Iran.56 Based on information from Azerbaijan, the Russian Federation and the First Assessment.57 The countries’ irrigation inventory indicates 210,000 ha for Azerbaijan and 155,700 ha for the Russian Federation.
158 | part iv

hydrotechnical installation at Samursk. Otherwise, the impact of groundwater level decrease is assessed by the Russian Federation as widespread but moderate in influence.
Transboundary cooperationAn intergovernmental agreement on joint use and protection of the transboundary Samur River was signed between Azerbaijan and the Russian Federation on 3 September 2010 (and entered into force on 21 December 2010).
At the present time there is no exchange of monitoring informa-tion, although the agreement provides for it.
sUlak river Basin anD anDis-koisU sUB-Basin59
The basin of the river Sulak is shared by Georgia and the Rus-sian Federation. The river has its source in the confluence of the Avarsk-Koisu (Russian Federation) and the Andis-Koisu, and discharges into the Caspian Sea. The Sulak River itself flows entirely in the Russian Federation. Andis-Koisu is a ma-jor transboundary tributary, shared by Georgia and the Rus-sian Federation (basin area 4,810 km2), originating in Geor-gian territory at the confluence of the Pirikita Alazani and
Tushetskaya Alazani rivers.
The Georgian part of the basin is traversed by deep gorges and ra-vines. The lower part of the basin has a meandering lowland char-acter. The average elevation of the basin is about 1,800 m a.s.l.
Basin of the Sulak River and sub-basin of the Andis-Koisu
Country Area in the country (km2) Country’s share (%)Georgia 869 18Russian Federation 3 941 82Andis-Koisu subtotal 4 810Total 15 200
Hydrology and hydrogeologyIn the part of the Andis-Koisu sub-basin that is Georgia’s terri-tory, total water resources are estimated at 0.802 km3/year (based on data from 1951–1977), equals to 400,827 m3/year/capita. The surface water resources in the Russian part of the basin are estimated at some 2.26 × 10⁶ m3/year (based on data from 1929–1980), and groundwater resources at 0.26 km3/year.
Pressures and statusIrrigation and human settlements constitute the main pressure factors in the sub-basin of the Andis-Koisu River. The trans-
58 Based on information from Azerbaijan, the Russian Federation and the First Assessment.59 Based on information from Georgia, the Russian Federation and the First Assessment.60 Based on information provided by the Russian Federation.
SuLAK AquifeR (no. 54)60
georgia Russian federationType 2; The upper aquifer consists of sand and gravel of Quaternary age (Q); the lower aquifer consists of sandstone, siltstone and limestone of Jurassic and Cretaceous age (J-K). In the upper aquifer, groundwater flow is from Georgia and the Russian Federation to the Sulak River. In the lower aquifer, the flow direction is from Georgia to the Russian Federation. Both aquifers have medium links with surface water.Thickness: mean, max (m) N/A Q: 30, 50
J-K: 25, 50Groundwater uses and functions N/A Some 20 × 106 m3/year of groundwater is
abstracted for drinking water and for irrigation.Pressure factors N/A Six areas of groundwater contamination
have been identified.
SAMuR AquifeR (no. 53)58
Azerbaijan Russian federationType 3; The upper, alluvial aquifer consists of gravel-pebble, sand and boulders of Neogene-Quaternary age (N-Q); the lower aquifer consists of fractured sandstones and siltstones of Jurassic and Cretaceous age (J-K). In the alluvial aquifer groundwater flow is from Azerbaijan and the Russian Federation to the Samur River. In the lower aquifer the flow direction is from Azerbaijan to the Russian Federation. Both aquifers have strong links with surface water.Area (km2) 2 900 699Thickness: mean, max (m) 50, 100 N-Q: 50, 100
J-K: 40, 90N/A
Groundwater uses and functions Drinking water (90–92%)irrigation (5–8%)industry (2–3%)
Drinking water (90%)irrigation (7%)industry (3%)
Pressures No pressure factors, no problems related to groundwater quantity and no substantial problems related to groundwater quality.
Groundwater management measures Need to be improved: abstraction management, quantity and quality monitoring, protection zones, good agricultural practices, mapping.
Need to be applied: transboundary institutions, data exchange, integrated river basin management,
treatment of urban and industrial wastewater.
Improvement of water management system, coordination of groundwater monitoring
(observed parameters, monitoring network, procedures for information exchange).
Other information Joint monitoring programme felt to be needed. Azerbaijan predicts increased water
use as a consequence of economic growth.
Chapter 4 Drainage basin of the Caspian sea | 159
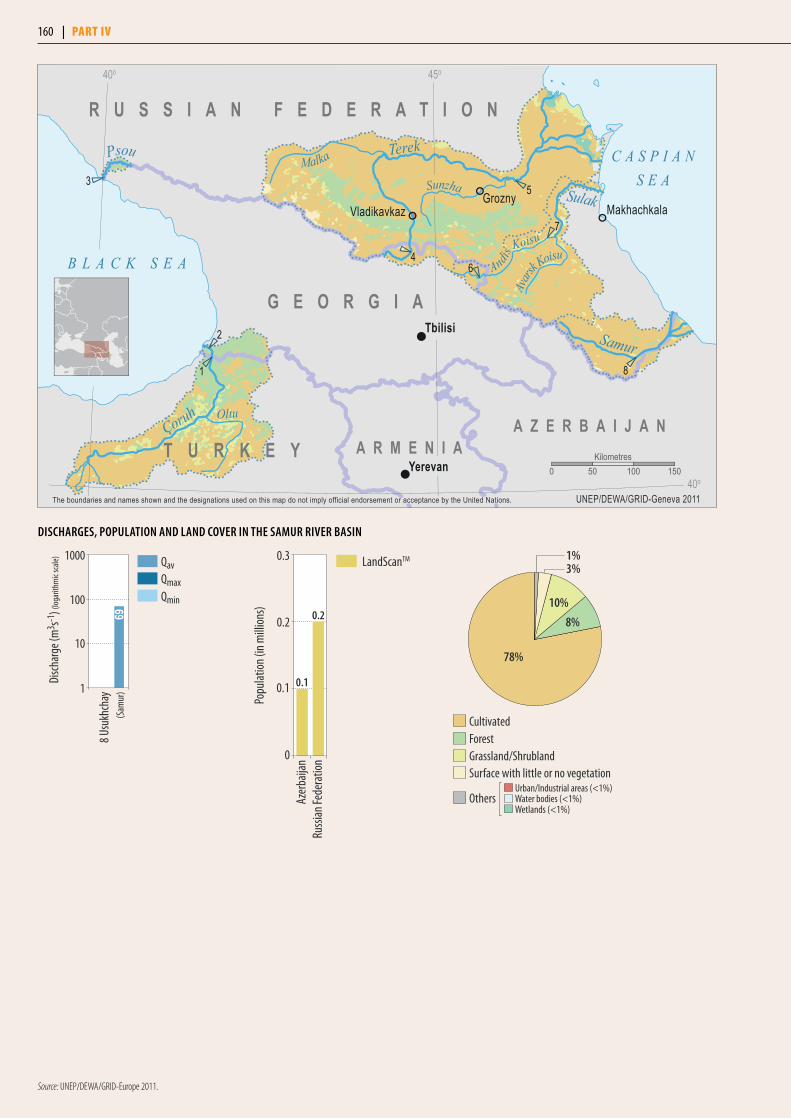
3
2
1
4
5
8
6
7
Grozny
Yerevan
Tbilisi
MakhachkalaVladikavkaz
Çoruh
Terek
Sunzha
Malka
Koisu
Avars
k Koisu
Samur
Psou
Sulak
Andis
Oltu
B L A C K S E A
C A S P I A NS E A
G E O R G I A
R U S S I A N F E D E R A T I O N
T U R K E Y A R M E N I AA Z E R B A I J A N
40o 45o
40o0 50 100 150
Kilometres
UNEP/DEWA/GRID-Geneva 2011The boundaries and names shown and the designations used on this map do not imply official endorsement or acceptance by the United Nations.
8 Usu
khch
ay69
(Sam
ur)1
10
100
1000
Disc
harg
e (m
3 s-1) (
loga
rithm
ic sc
ale) Qav
QmaxQmin
Popu
latio
n (in
mill
ions
)
0
0.1
0.2
0.3
Russ
ian Fe
dera
tion
Azer
baija
n
0.2
0.1
LandScanTM 1%3%
78%
8%
10%
Urban/Industrial areas (<1%)Water bodies (<1%)Wetlands (<1%)
CultivatedForestGrassland/Shrubland
Others
Surface with little or no vegetation
diSChARgeS, PoPuLATion And LAnd CoveR in The SAMuR RiveR BASin
Source: UNEP/DEWA/GRID-Europe 2011.
160 | part iv

7 Shi
rkot
a
6 She
nako
3825
(And
is-Ko
isu)
(And
is-Ko
isu)1
10
100
1000
19
72
Disc
harg
e (m
3 s-1) (
loga
rithm
ic sc
ale) Qav
QmaxQmin
1%2%
74%
11%
12%
Urban/Industrial areas (<1%)Water bodies (<1%)Wetlands (<1%)
CultivatedForestGrassland/Shrubland
Others
Surface with little or no vegetation
5 Ste
pnoe
4 Ste
pant
smin
da
2000
68
296
30 24(Te
rek)
(Tere
k)1
10
100
1000
10000
19
Disc
harg
e (m
3 s-1) (
loga
rithm
ic sc
ale) Qav
QmaxQmin
2%
1%1%
69%
19%
8%
Urban/Industrial areas (<1%)Water bodies (<1%)
CultivatedForestGrassland/Shrubland
Others
Surface with little or no vegetationWetlands
diSChARgeS, PoPuLATion And LAnd CoveR in The SuLAK RiveR BASin
diSChARgeS, PoPuLATion And LAnd CoveR in The TeReK RiveR BASin
Source: UNEP/DEWA/GRID-Europe 2011
Popu
latio
n (in
ten
thou
sand
s)
0
10
20
30
40
50
Russ
ian Fe
dera
tion
Geor
gia
44.8
0.2
Country Information/otherLandScanTM
Popu
latio
n (in
ten
thou
sand
s)
0
100
200
300
400
Russ
ian Fe
dera
tion
Geor
gia
350
0.5
Country Information/otherLandScanTM
boundary impact is assessed to be insignificant. The Andis-Koisu River has a good ecological and chemical status.
Increased pumping lifts and costs for groundwater abstraction are an issue in the Russian Federation, but this concerns a lim-ited area. The State groundwater monitoring network in the Russian part of the basin consists of six monitoring points, with 3–10 observations per month.
There have been plans to construct a number of hydropower stations in the Russian part of the Andis-Koisu sub-basin.
TrendsBased on research studies and expert knowledge, a decrease in precipitation is expected in Georgia in the next 50 years: by 7% in eastern part of the country (where the Sulak Basin is also located) during fall, winter and spring, and by 30% in the summer. Increase in drought frequency is expected in the eastern part of Georgia, but no data is available.61
61 Sources: Second National Communication of Georgia to the UNFCCC; Adaptation to Climate Change in Eastern Europe, Caucasus and Central Asia and South–Eastern Europe. UNECE, WHO. 2008.
Chapter 4 Drainage basin of the Caspian sea | 161

terek river Basin62
The basin of the river Terek is shared by Georgia and the Russian Federation. The 623-km long river has its source in the slopes of Mount Kazbek in Georgia and discharges into the Caspian Sea. The river flows through North Ossetia/Alania, Kabardino-Balkaria, the Stavropol Kraj, Chechnya and Dagestan (Russian Federation). In the Georgian part, the basin is characterized by mountainous, glacial topography.
The Assa (total basin area 2,060 km2) and the Argun (total basin area 3,390 km2) are transboundary tributaries to the Terek.
Basin of the Terek River
Country Area in the country (km2) Country’s share (%)Georgia 1 559 3.6Russian Federation 41 641 96.4Total 43 200
Sources: Ministry of Environment Protection and Natural Resources (Georgia) and Federal Agency for Water Resources (Russian Federation).
Hydrology and hydrogeologyThe period of high water levels in spring-summer is very long (end of March to September). Spring floods cause damage, espe-cially in the Russian part of the basin.
In the part of the Terek Basin that is Georgia’s territory, surface water resources are estimated at 0.761 km3/year (based on data from 1928–1990), equals to some 155,220 m3/year/capita. In the Russian Federation, water resources amount to 11.0 km3/year in an average year (based on data from 1912–1980). Groundwa-ter resources are estimated at 5.04 km3/year in the Russian part of the basin.
Pressures and statusHuman settlements are the main pressure factors in the Georgian part of the basin. More than half of the Georgian territory in the basin is grassland (53.6%), and only about 1% is cropland. In the Russian part of the basin, pressure arises from irrigation (>700,000 ha), industry, aquaculture/fisheries and human settlements.
According to data provided by the Russian Federation, the Terek has been in the “polluted” category of the Russian water quality classification from 2005 to 2008, without significant variation.
malyi Uzen/saryozen Basin63
The 638-km long Malyi Uzen/Saryozen64 originates in the Syrt chain of hills in the Russian Federation (Saratov oblast) and dis-
charges into Lake Sorajdyn, which is one of the Kamysh-Samarsk lakes in Kazakhstan.
Basin of the Malyi Uzen/Saryozen River
Country Area in the country (km2) Country’s share (%)Russian Federation 5 980 51.6Kazakhstan 5 620 48.4
Total 11 600
Hydrology and hydrogeologySurface water resources in the Russian part of the basin are estimated at 88 × 106 m3/year (based on observations from 1948 to 1987).66
According to the Russian Federation, the river practically does not have baseflow from groundwater, due to the clay riverbed. The Pre-Caspian aquifer (No. 41) extends to the Malyi Uzen/Saryozen Basin (see the assessment of the Ural).
As in the basin of the Bolshoy Uzen/Karaozen, the lack of rain and short duration of rainfall events, dryness of the air and soil, as well as high levels of evaporation, is typical of the area.
On the Russian side, the biggest reservoirs are the Upper Pereko-pnovsk (volume 65.4 × 10⁶ m3), Molouzensk (18.0 × 10⁶ m3) and Varfolomejevsk (26.5 × 10⁶ m3) reservoirs and several artificial lakes (87.33 × 10⁶ m3). Reservoirs in Kazakhstan include: the Kaztalovsk-I (7.20 × 10⁶ m3), the Kaztalovsk-II (3.55 × 10⁶ m3) and the Mamajevsk (3.50 × 10⁶ m3) reservoirs and several artifi-cial lakes (4.83 × 10⁶ m3).
Pressures and statusWater scarcity is severe in the basin. Irrigated agriculture is the main pressure factor.
Wastewater discharges and surface run-off, as well as sediments and riverbank erosion, degrade water quality. Non-respect of wa-ter protection zones and unauthorized reconstruction works have affected water quality.
The status of the watercourses is assessed as “stable”.
Responses and transboundary cooperationMonitoring the water resources of the Malyi Uzen/Saryozen and Bolshoy Uzen/Karaozen in the Russian Federation is car-ried out by the Regional Centre for Hydrometeorology and Environmental Monitoring of Saratov, and of reservoirs also by “Saratovmeliovodhoz”. Surface water quality is monitored on the Malyi Uzen/Saryozen (at monitoring station Malyi Uzen), with sampling during the main hydrological seasons and, monthly, on the Bolshoy Uzen/Karaozen (at the town of Novouzensk). A
TeReK AquifeR (no. 55)65
georgia Russian federationType 2/3; The aquifer consists of sand and gravel of Quaternary age (Q). Groundwater flow is from Georgia and the Russian Federation to the Terek. Strong links with surface water. Thickness: mean, max (in m) N/A 20, 50Groundwater uses and functions N/A Some 409 × 106 m3/year of groundwater is
abstracted for drinking water and for irrigation.Pressure factors N/A 75 areas of groundwater contamination
have been identified.Other information N/A The length of the aquifer is 12 km.
62 Based on information from Georgia, the Russian Federation and the First Assessment. 63 Based on the information provided by Russian Federation and the First Assessment. 64 In the Russian Federation the river is known as Malyi Uzen and in Kazakhstan as Saryozen.65 Based on information provided by the Russian Federation.66 Source: Water management balance of the Malyi and Bolshoy Uzen River basins, TOO Uralvodproject 1998.
162 | part iv
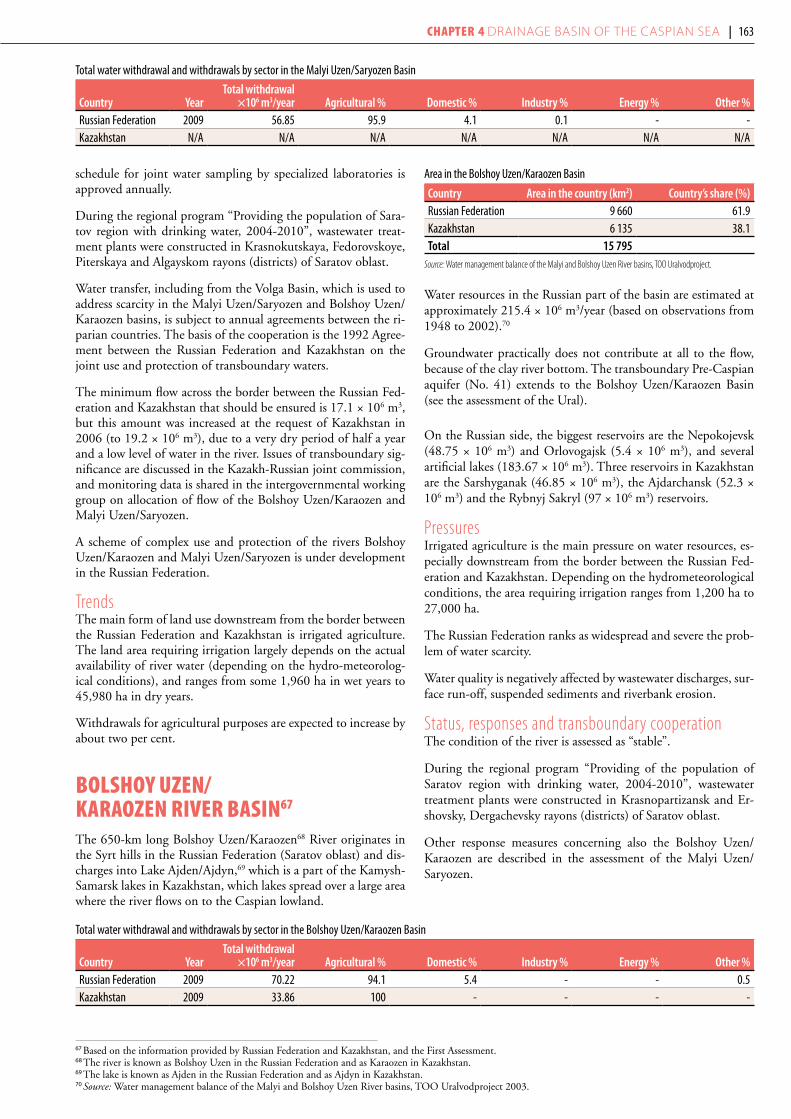
Total water withdrawal and withdrawals by sector in the Malyi Uzen/Saryozen Basin
Country yearTotal withdrawal
×106 m3/year Agricultural % domestic % industry % energy % other %Russian Federation 2009 56.85 95.9 4.1 0.1 - -Kazakhstan N/A N/A N/A N/A N/A N/A N/A
schedule for joint water sampling by specialized laboratories is approved annually.
During the regional program “Providing the population of Sara-tov region with drinking water, 2004-2010”, wastewater treat-ment plants were constructed in Krasnokutskaya, Fedorovskoye, Piterskaya and Algayskom rayons (districts) of Saratov oblast.
Water transfer, including from the Volga Basin, which is used to address scarcity in the Malyi Uzen/Saryozen and Bolshoy Uzen/Karaozen basins, is subject to annual agreements between the ri-parian countries. The basis of the cooperation is the 1992 Agree-ment between the Russian Federation and Kazakhstan on the joint use and protection of transboundary waters.
The minimum flow across the border between the Russian Fed-eration and Kazakhstan that should be ensured is 17.1 × 10⁶ m3, but this amount was increased at the request of Kazakhstan in 2006 (to 19.2 × 10⁶ m3), due to a very dry period of half a year and a low level of water in the river. Issues of transboundary sig-nificance are discussed in the Kazakh-Russian joint commission, and monitoring data is shared in the intergovernmental working group on allocation of flow of the Bolshoy Uzen/Karaozen and Malyi Uzen/Saryozen.
A scheme of complex use and protection of the rivers Bolshoy Uzen/Karaozen and Malyi Uzen/Saryozen is under development in the Russian Federation.
TrendsThe main form of land use downstream from the border between the Russian Federation and Kazakhstan is irrigated agriculture. The land area requiring irrigation largely depends on the actual availability of river water (depending on the hydro-meteorolog-ical conditions), and ranges from some 1,960 ha in wet years to 45,980 ha in dry years.
Withdrawals for agricultural purposes are expected to increase by about two per cent.
Bolshoy Uzen/ karaozen river Basin67
The 650-km long Bolshoy Uzen/Karaozen68 River originates in the Syrt hills in the Russian Federation (Saratov oblast) and dis-charges into Lake Ajden/Ajdyn,69 which is a part of the Kamysh-Samarsk lakes in Kazakhstan, which lakes spread over a large area where the river flows on to the Caspian lowland.
Area in the Bolshoy Uzen/Karaozen Basin
Country Area in the country (km2) Country’s share (%)Russian Federation 9 660 61.9Kazakhstan 6 135 38.1Total 15 795
Source: Water management balance of the Malyi and Bolshoy Uzen River basins, TOO Uralvodproject.
Water resources in the Russian part of the basin are estimated at approximately 215.4 × 10⁶ m3/year (based on observations from 1948 to 2002).70
Groundwater practically does not contribute at all to the flow, because of the clay river bottom. The transboundary Pre-Caspian aquifer (No. 41) extends to the Bolshoy Uzen/Karaozen Basin (see the assessment of the Ural).
On the Russian side, the biggest reservoirs are the Nepokojevsk (48.75 × 10⁶ m3) and Orlovogajsk (5.4 × 10⁶ m3), and several artificial lakes (183.67 × 10⁶ m3). Three reservoirs in Kazakhstan are the Sarshyganak (46.85 × 10⁶ m3), the Ajdarchansk (52.3 × 10⁶ m3) and the Rybnyj Sakryl (97 × 106 m3) reservoirs.
PressuresIrrigated agriculture is the main pressure on water resources, es-pecially downstream from the border between the Russian Fed-eration and Kazakhstan. Depending on the hydrometeorological conditions, the area requiring irrigation ranges from 1,200 ha to 27,000 ha.
The Russian Federation ranks as widespread and severe the prob-lem of water scarcity.
Water quality is negatively affected by wastewater discharges, sur-face run-off, suspended sediments and riverbank erosion.
Status, responses and transboundary cooperationThe condition of the river is assessed as “stable”.
During the regional program “Providing of the population of Saratov region with drinking water, 2004-2010”, wastewater treatment plants were constructed in Krasnopartizansk and Er-shovsky, Dergachevsky rayons (districts) of Saratov oblast.
Other response measures concerning also the Bolshoy Uzen/Karaozen are described in the assessment of the Malyi Uzen/Saryozen.
67 Based on the information provided by Russian Federation and Kazakhstan, and the First Assessment.68 The river is known as Bolshoy Uzen in the Russian Federation and as Karaozen in Kazakhstan.69 The lake is known as Ajden in the Russian Federation and as Ajdyn in Kazakhstan.70 Source: Water management balance of the Malyi and Bolshoy Uzen River basins, TOO Uralvodproject 2003.
Total water withdrawal and withdrawals by sector in the Bolshoy Uzen/Karaozen Basin
Country yearTotal withdrawal
×106 m3/year Agricultural % domestic % industry % energy % other %Russian Federation 2009 70.22 94.1 5.4 - - 0.5Kazakhstan 2009 33.86 100 - - - -
Chapter 4 Drainage basin of the Caspian sea | 163
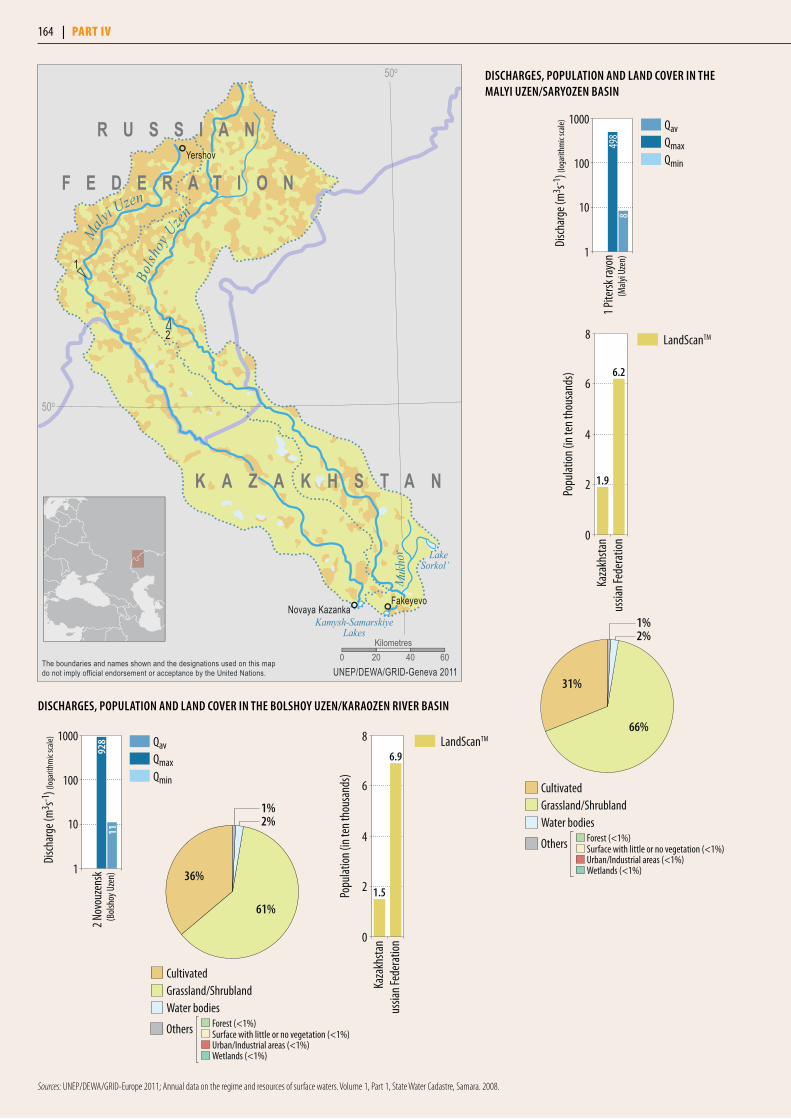
Sources: UNEP/DEWA/GRID-Europe 2011; Annual data on the regime and resources of surface waters. Volume 1, Part 1, State Water Cadastre, Samara. 2008.
1
2
FakeyevoNovaya Kazanka
Yershov
LakeSorkol’
Muk
hor
Kamysh-SamarskiyeLakes
Malyi
Uzen
Bolsh
oy U
zenF E D E R A T I O N
R U S S I A N
K A Z A K H S T A N
50o
50o
0 20 40 60Kilometres
The boundaries and names shown and the designations used on this mapdo not imply official endorsement or acceptance by the United Nations. UNEP/DEWA/GRID-Geneva 2011
2 Nov
ouze
nsk
928
11(B
olsh
oy U
zen)
1
10
100
1000
Disc
harg
e (m
3 s-1) (
loga
rithm
ic sc
ale) Qav
QmaxQmin
Popu
latio
n (in
ten t
hous
ands
)
0
2
4
6
8
Russ
ian Fe
dera
tion
Kaza
khsta
n
1.5
6.9LandScanTM
1%2%
36%
61%
CultivatedGrassland/ShrublandWater bodies
Surface with little or no vegetation (<1%)Urban/Industrial areas (<1%)
Forest (<1%)
Wetlands (<1%)
Others
1 Pite
rsk ra
yon
498
8(M
alyi U
zen)
1
10
100
1000
Disc
harg
e (m
3 s-1) (
loga
rithm
ic sc
ale) Qav
QmaxQmin
Popu
latio
n (in
ten t
hous
ands
)
0
2
4
6
8
Russ
ian Fe
dera
tion
Kaza
khsta
n
1.9
6.2
LandScanTM
1%2%
31%
66%
CultivatedGrassland/ShrublandWater bodies
Surface with little or no vegetation (<1%)Urban/Industrial areas (<1%)
Forest (<1%)
Wetlands (<1%)
Others
diSChARgeS, PoPuLATion And LAnd CoveR in The MALyi uZen/SARyoZen BASin
diSChARgeS, PoPuLATion And LAnd CoveR in The BoLShoy uZen/KARAoZen RiveR BASin
164 | part iv

Chapter 5 Drainage basin of the black sea
165
this chapter deals with the assessment of transboundary rivers, lakes and groundwa-ters, as well as selected ramsar sites and other wetlands of transboundary importance, which are located in the basin of the black sea.
Assessed transboundary waters in the drainage basin of the Black Sea
Basin/sub-basin(s) Recipient Riparian countries Lakes in the basinTransboundary groundwaters
within the basinRamsar Sites/wetlands of
transboundary importanceRezovska/Multudere Black Sea BG, TR
Danube Black Sea AT, BA, BG, HR, CZ, DE,
HU, MD, ME, RO, RS, SI,
CH, UA
Reservoirs Iron Gate I and
Iron Gate II, Lake Neusiedl
Silurian-Cretaceous (MD, RO, UA), Q,N1-2,Pg2-3,Cr2 (RO, UA), Dobrudja/Dobrogea Neogene-Sarmatian (BG-RO), Dobrudja/
Dobrogea Upper Jurassic-Lower Cretaceous (BG-RO), South
Western Backa/Dunav aquifer (RS, HR), Northeast Backa/Danube -Tisza Interfluve or
Backa/Danube-Tisza Interfluve aquifer (RS, HU), Podunajska Basin, Zitny Ostrov/Szigetköz,
Hanság-Rábca (HU), Komarnanska Vysoka Kryha/Dunántúli –
középhegység északi rész (HU)
Lower Danube Green Corridor and Delta Wetlands (BG, MD, RO, UA)
- Lech Danube AT, DE- Inn Danube AT, DE, IT, CH- Morava Danube AT, CZ, SK Floodplains of the Morava-
Dyje-Danube Confluence--Dyje Morava AT, CZ
- Raab/Rába Danube AT, HU Rába shallow aquifer, Rába porous cold and thermal aquifer, Rába
Kőszeg mountain fractured aquifer, Günser Gebirge Umland, Günstal,
Hügelland Raab Ost, Hügelland Raab West, Hügelland Rabnitz,
Lafnitztal, Pinkatal 1, Pinkatal 2, Raabtal, Rabnitzeinzugsgebiet,
Rabnitztal, Stremtal (AT, HU) - Vah Danube CZ, PL, SK- Ipel/Ipoly Danube HU, SK Ipoly völgy/Alúvium Ipľa (SK, HU)- Drava and Mura Danube AT, HR, HU,
IT, SIKarstwasser-Vorkommen Karawanken/
Karavanke (AT, SI), Ormoz-Sredisce ob Drava/Drava-Varazdin (HR, SI), Dolinsko-Ravensko/Mura (HR, SI),
Mura (HR, HU), Drava/Drava West (HR, HU), Baranja/Drava East (HR, HU),
Černeško-Libeliško (AT, SI), Kučnica (AT, SI), Goričko (AT, SI), Mura-Zala basin/Radgona-Vaš (AT, HU, SI), Kot (HU, SI)
Drava-Danube confluence Ramsar Sites (HR, HU, RS)

Basin/sub-basin(s) Recipient Riparian countries Lakes in the basinTransboundary groundwaters
within the basinRamsar Sites/wetlands of
transboundary importance- Tisza Danube HU, RO, RS, SK, UA Körös – Crisuri holocene, pleistocene
(Hortobágy-Nagykunság Bihar Northern Part, Hortobágy, Nagykunság, Bihar northern part), Körös-valley, Sárrét,
shallow/Crişuri (RO, HU), Slovensky kras/Aggtelek (HU, SK), Quaternary alluvial
sediments of Bodrog/Bodrogkoz (SK, HU), North and South Banat or North
and Mid Banat aquifer (RS, RO), Alluvial Quaternary aquifer (UA, SK, HU, RO)
Upper Tisza Valley (HU, SK, UA),
Domica-Baradla Cave System (HU, SK)
- - Somes/Szamos Tisza HU, RO Samos/Somes alluvial fan (RO, HU), Nyírség, keleti rész/Nyírség, east margin (RO, HU)
- -Mures/Maros Tisza HU, RO Pleistocene-Holocene Mures/Maros Alluvial Fan (RO, HU)
- Sava Danube AL, BA, HR, ME, RS, SI
Cerknica/Kupa, Kočevje Goteniška gora, Radovic-Metlika/Zumberak, Bregana-
Obrezje/Sava-Samobor, Bregana, Bizeljsko/Sutla (Boč, Rogaška, Atomske toplice,
Bohor, Orlica) (HR, SI), Dolinsko-Ravensko/Mura (HR, SI), Srem-West Srem/Sava (HR,
RS), Posavina I/Sava, Kupa, Pleševica/Una (BA, HR), Macva-Semberija (BA,
RS), Lim (ME, RS), Tara massif (BA, RS)- Velika Morava Danube BG, MK, ME, RS- - Nisava Juzna Morava
(Velika Morava)BG, RS Stara Planina/Salasha Montana (BG, RS)
- Timok Danube BG, RS- Siret Danube RO, UA Middle Sarmatian Pontian (MD, RO)- Prut Danube MD, RO, UA Stanca-Costesti
ReservoirMiddle Sarmatian Pontian (MD, RO), Alluvial Quaternary aquifer (UA, RO)
Cahul/Kagul Lake Cahul/Kagul MD, UA, Pliocene terrigenous aquifer (UA, RO)Yalpuh Lake Yalpuh MD, UA Alluvial Quaternary aquifer (MD, UA),
Alluvial Quaternary aquifer (UA, RO), Pliocene terrigenous aquifer (UA, RO)
Cogilnik Lake Sasyk > Black Sea
MD, UA Sarmatian terrigenous carbonate aquifer (UA, MD)
Dniester Black Sea UA, MD, PL Shallow Groundwater (Q)/Qall,N,K2 (MD, UA), Sarmatian terrigenous
carbonate aquifer (UA, MD)- Yahorlyk Dniester UA, MD- Kuchurhan Dniester UA, MD Sarmatian terrigenous carbonate
aquifer (UA, MD)Dnieper Black Sea BY, RU, UA Paleogene-Neogene terrigenous
aquifer, Cenomanian carbonate-terrigenous (BY, UA), Upper Devonian
terrigenous-carbonate aquifer (BY, RU), Q, Pg2+Pg3,Cr2,A+Pt1 (BY, UA),
Quaternary alluvial aquifer (UA, BY), Eocene and Oligocene terrigenous aquifer
(UA, BY), Eocene terrigenous aquifer (UA, BY), Cretaceous carbonate and
terigenous aquifer (UA, RU), Senonian-Turonian carbonate aquifer (UA, BY),
Lower Cretaceous-Cenomanian carbonate and terrigenous aquifer (UA, BY),
Jurassic and Lower Cretaceous carbonate and terrigenous aquifer (UA, BY)
- Pripyat Dnieper BY, UA Paleogene-Neogene terrigenous aquifer (BY, UA), Cenomanian terrigenous
aquifer (BY, UA), Upper Proterozoic terrigenous aquifer (BY, UA), Eocene terrigenous aquifer (UA, BY), Jurassic
and Lower Cretaceous carbonaceous and terrigenous aquifer (UA, BY)
Stokhid-Pripyat-Prostyr Rivers (BY, UA)
Elancik Black Sea RU, UAMius Black Sea RU, UA Carbonaceous terrigenous-
carbonaceous aquifer (UA, RU)Siversky Donets Don > Black Sea RU, UA Upper Cretaceous-carbonaceous-
terrigenous aquifer (UA, RU), Carboniferous terrigenous-carbonaceous aquifer (UA, RU)
166 | part IV

Basin/sub-basin(s) Recipient Riparian countries Lakes in the basinTransboundary groundwaters
within the basinRamsar Sites/wetlands of
transboundary importancePsou Black Sea GE, RU Psou aquifer (GE, RU)Chorokhi/Coruh Black Sea GE, TR- Machakhelisckali/Macahel
Chorokhi/Coruh GE, TR
Note: Transboundary groundwaters in italics are not assessed in the present publication.
Long-term mean annual flow (km³) of rivers discharging to the Black Sea
Source: Hungary (Mura); Ukraine (Siversky Donets); GRDC, Koblenz (all other rivers).
Danube,Ceatal Izmail, 1921-2008Sava, Sremska Mitrovica, 1926-2003Dnieper, Kakhovskoye hydropower station,1959-1988Tisza, Senta, 1931-1984
Inn, Schaerding, 1930-2007
Drava, Donji Miholjac, 1921-1984
Pripyat, Mazyr (Mozyr), 1965-2002
Dniester, Tighina(Bendery), 1881-1985
Velika Morava, Lubicevsky Most, 1931-2003
Siret, Lungoci, 1930-1995
0 50 100 150 200 250km3
River, Station,Time series
202.902
49.295
42.629
24.723
23.152
17.543
13.827
10.234
7.137
6.309
0 50 100 150 200 250km3
River, Station,Time series
Mures/Maros, Mako, 1930-1995
Mura, Letenye, 1971-2000
Vah, Sala, 1920-2008
Siversky Donets, Kruzhilovka, 1957-2000
Somes/Szamos, Satu Mare, 1925-2008
Lech, Augsburg Below Wertach, 1959-2009
Morava, Moravsky Jan, 1921-2008
Prut, Radauti, 1960-2008
Raab/Rába, Szentgotthard, 1978-1995
Ipel, Ipelsky Sokolec, 1930-1992
5.46
5.425
4.567
4.32
4.013
3.594
3.372
2.555
0.686
0.619
1 Based on information provided by Bulgaria and Turkey. 2 The river is known as Rezovska in Bulgaria and as Multudere in Turkey. It is also known as Rezvaya.3 Based on information provided by the secretariat of the International Commission for the Protection of the Danube River (ICPDR) based on the Danube River Basin District Management Plan.
4 This value does not include the length of the Chilia and St. Gheorghe Danube Delta branches.
rezoVska/Multudere rIVer BasIn1
The basin of the Rezovska/Multudere River2 is shared by Bul-garia and Turkey, and covers an area of approximately 740 km2. The river, with a total length of 112 km, springs from the Turk-ish part of the Strandja Mountain, where it is called Passpalder-essi. For almost its entire length, it forms the border between Bulgaria and Turkey. The river runs into the Black Sea near the village of Rezovo, district of Bourgas (Bulgaria). The up-per part of the river is in “natural conditions” and most of its downstream parts are in “good ecological and chemical status”.
The agreement signed in 1997 by the riparian countries has as an integral part an annex representing a Joint Engineer-ing Project regarding the Free Outflow of the Rezovska/Mul-tudere River.
danuBe rIVer BasIn3
The Danube River Basin (DRB) is the “most international” river basin in the world, covering territories of 19 countries. Of these 19 countries, Albania, Italy, Poland, Switzerland and the former Yugoslav Republic of Macedonia usually do not appear in com-pilations of the relative share of the 19 countries in the basin due to their very small areas that belong to the DRB. This also applies to the tables in this assessment report; however, the total area of the basin includes the areas of these countries as referenced in relevant footnotes. The Danube River itself has a length of 2,587 km4 and an approximate discharge of 6,500 m3/s at the river mouth.
Following provisions of the WFD, all watercourses in the Dan-ube River Basin as well as the river basins in Romania discharg-ing to the Black Sea and the Romanian-Ukrainian coastal waters of the Black Sea have been grouped into the so-called Danube River Basin District (DRBD) with an area of 807,827 km² and approximately 80.5 million inhabitants. Note should be taken of the fact in the following assessment reference is made either to the DRB or the DRBD.
166 | part IV Chapter 5 Drainage basin of the black sea | 167
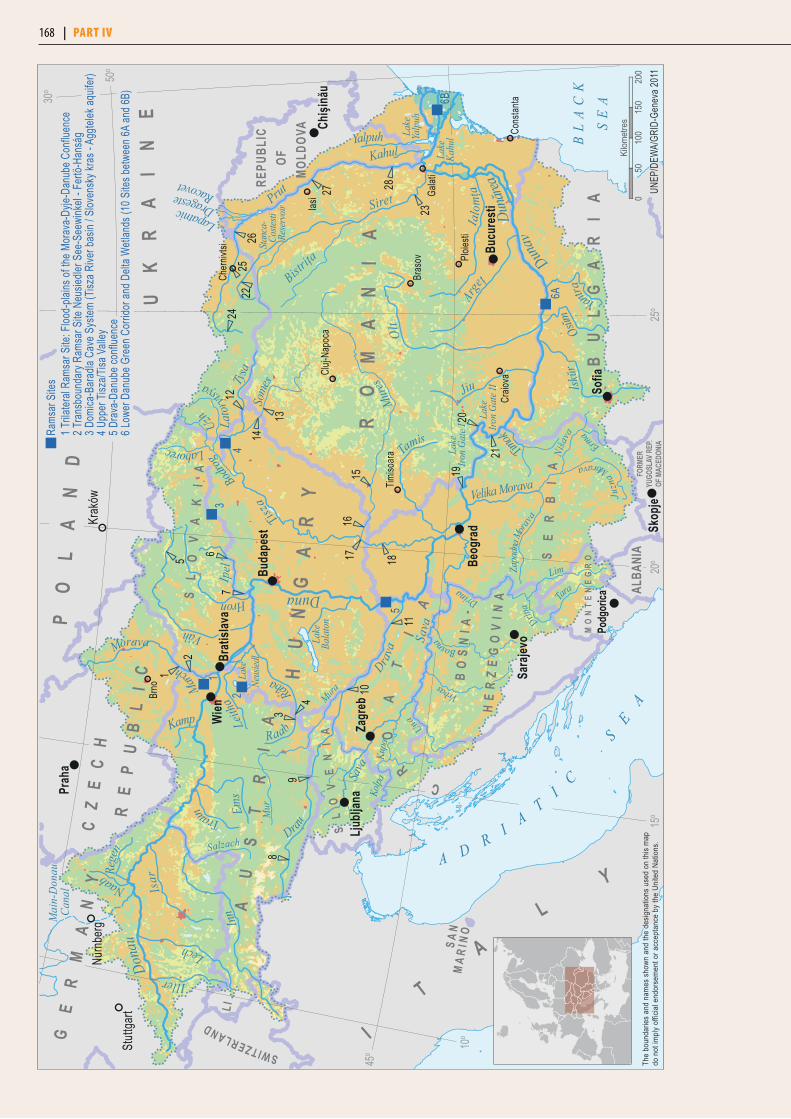
1615
14
13
17 18
12
5
2425
26
2827
76
2019
21
11
10
98
22
23
1
2
4
3
Prah
a
Sara
jevo
Skop
je
Sofia
Wien
Brati
slava
Buda
pest
Beog
rad
Zagr
ebLju
bljan
a
Bucu
resti
Podg
orica
Krak
ów
Brno
Stutt
gart
Cons
tanta
Bras
ov
Craio
va
Timiso
ara
Cher
nivtsi
Iasi Ga
lati
Cluj-
Napo
ca
Ploie
sti
Chisi
nau
Nürn
berg
Rams
ar S
ites
1 Trila
teral
Rams
ar S
ite: F
lood-
plains
of th
e Mor
ava-
Dyje-
Danu
be C
onflu
ence
2 Tra
nsbo
unda
ry Ra
msar
Site
Neu
siedle
r See
-See
wink
el - F
ertö-
Hans
ág3 D
omica
-Bar
adla
Cave
Sys
tem (T
isza R
iver b
asin
/ Slov
ensk
y kra
s - A
ggtel
ek aq
uifer
)4 U
pper
Tisz
a/Tisa
Valle
y5 D
rava
-Dan
ube c
onflu
ence
6 L
ower
Dan
ube G
reen
Cor
ridor
and D
elta W
etlan
ds (1
0 Site
s betw
een 6
A an
d 6B)
13
4
6A
6B
5
2
A D RI A
TI
C
SE
A
BL
AC
KS
EA
Rába
Dona
u
Duna
Dunav
Lech
Inn
Salzach
Mura
Mur
Raab
Morava
Váh
Ipel
’
Drau
Drava
Tisza
Mur
es
Some
sTysa
Lake
Bala
ton
Bodrog
Lato
rytsya
Uzh
Laborec
Sava
Sava
Velika Morava
Juzn
a Morava
Niša
va
Timok
SiretPrut
Lake
Kahu
lLake
Yalp
uh
YalpuhKahul
Lapatnic
Stanc
a- C
ostes
ti
Rese
rvoir
Lak
eNe
usied
l
Lake
Iron
Gate
I
Lake
Iro
n Ga
te II
Mai
n-D
onau
Cana
l
ErmaLim
Drina
Tara
Zapa
dna M
orava
Tamis
Una
Dună
rea
Isar
Iller
Naab Rege
n
Traun Ems
Leith
a
Kamp
Marc
h
Hron
Arge ţ
JiuO
lt
Ialo
mţa
Iskŭ
rOsŭm
Yantra
Drina
Bosna
Vrbas
Kupa
Kolpa
Bistr
iţa
Drageste Racovet
AU
ST
RI
AH
UN
GA
RY
RO
MA
NI
A
BO
SN
I A-P
OL
AN
D
SL
OV
AK
IA
MO
NT
EN
EG
RO
B
UL
GA
RI
A
I
T
A
LY
C
RO
AT
IA
SAN
MA R
I NO
SL
OV
EN
IA
HE
RZ
EG
OV
I NA AL
BANI
A
CZ
EC
H
R
EP
UB
LI
CU
KR
AI
NE
GE
RM
AN
Y
L I
SE
RB
IA
REPU
BLIC
OF
MOL
DOVA
FORM
ERYU
GOSL
AV R
EP.
OF M
ACED
ONIA
SWITZERLAND
50o
45o
15o
20o
25o
30o
10o
050
100
150
200
Kilom
etre
s
The
boun
darie
s an
d na
mes
sho
wn a
nd th
e de
signa
tions
use
d on
this
map
do n
ot im
ply
offic
ial e
ndor
sem
ent o
r acc
epta
nce
by th
e Un
ited
Natio
ns.
UNEP
/DEW
A/GR
ID-G
enev
a 201
1
168 | part IV

DiSchaRgeS, popuLaTion anD LanD coveR in The DanuBe RiveR BaSin
21 Ţi
găna
şi
20 D
robe
ta-Tu
rnu S
ever
in
19 B
aziaş
Disc
harg
e (m
3 s-1) (
loga
rithm
ic sc
ale)
1580
056
78
1470
1580
056
84
1580
0
(Dan
ube)
(Dan
ube)
(Dan
ube)1000
10000
100000
1490
1500 56
83
QavQmaxQmin
1%4%
47%
34%
8%
6%
Surface with little or no vegetation (<1%)Wetlands (<1%)
ForestGrassland/Shrubland
Others
Urban/Industrial areasWater bodies
Cultivated
Sources: UNEP/DEWA/GRID-Europe 2011“; National Administration “Apele Romane”, Romania (discharges); International Commission for the Protection of the Danube River (population).
Share of DRBD per country; percentage of country’s territory within the Danube River Basin District (DRBD); water body5 delineation for all DRBD rivers with catchment areas >4000 km2 and the Danube River
country Surface area (km2) Share of DRBD (%)
percentage of country’s territory
within the DRBD (%)Length of national DRB river network
number of water bodies (WB)Share of all
DRBD WBs (%)all DanubeAT 80 800 10.0 96.1 2 392 190 13 25.6BA 38 000 4.7 74.9 1 602 35 0 4.7BG 46 900 5.8 42.6 1 291 15 1 2.0HR 34 700 4.3 61,9 1 470 33 2 4.4CZ 21 800 2.7 27.3 598 32 0 4.3DE 56 500 7.0 16.0 1 503 53a 15 7.1HU 92 900 11.5 100.0 3 189 57 4 7.7MD 12 100 1.5 36.2 837 no informationME 7 300 0.9 55.0 no informationRO 239 100 29.6 100.0 9 474 182b 7 24.5RS 81 600 10.1 92.8 3 277 63c 10 8.5SI 16 200 2.0 81.1 834 25 0 3.4SK 46 900 5.8 96.0 1 811 45 4 6.1UA 36 400 4.5 6.0 1 056 13 1 1.7Total 100d 25 117e 68 115 4 514 100
a This value includes two artificial canal water bodies (Main-Danube Canal).b This value includes two artificial canal water bodies (Danube-Black Sea Canal). c This value includes 11 artificial canal water bodies (Danube-Tisa-Danube Canal System). d This value includes the area of CH, IT, PL, AL and MK. e This value does exclude doublecounts linked to river stretches shared by countries, and is therefore not the sum of individual river network lengths respectively.
5 According to the WFD a body of surface water means a discrete and significant element of surface water such as a lake, a reservoir, a stream, river or canal, part of stream, river or canal, a transitional water or a stretch of coastal water.
Popu
latio
n (in
mill
ions
)
0
5
10
15
20
25
CH, IT
, PL,
AL, M
KUk
rain
eSlo
veni
aSlo
vakia
Serb
iaRo
man
iaM
onte
negr
oRe
publ
ic of
Mol
dova
Hung
ary
Germ
any
Czec
h Re
publ
icCr
oatia
Bulg
aria
Bosn
ia an
d Her
zego
vina
Austr
ia
7.9
2.9 3.4 3.1 2.8
9.7 10.2
1.10.2
21.6
7.5
5.2
1.8 2.60.5
Country information/other
168 | part IV Chapter 5 Drainage basin of the black sea | 169
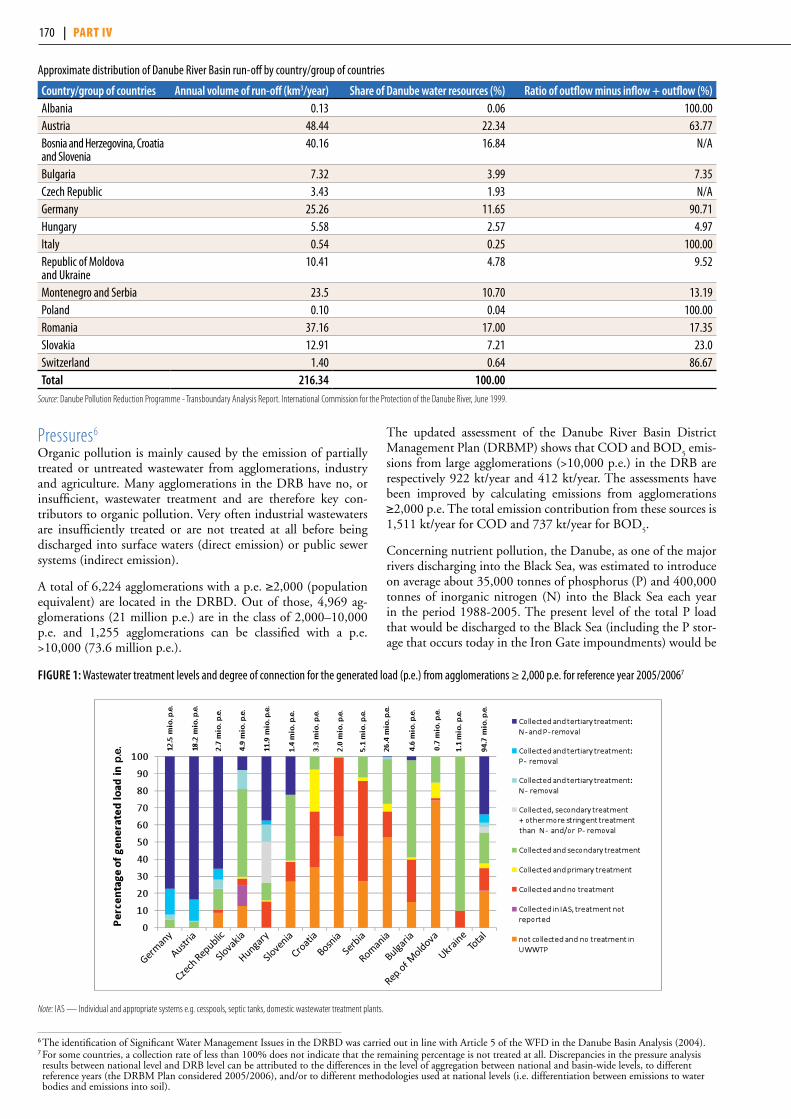
6 The identification of Significant Water Management Issues in the DRBD was carried out in line with Article 5 of the WFD in the Danube Basin Analysis (2004).7 For some countries, a collection rate of less than 100% does not indicate that the remaining percentage is not treated at all. Discrepancies in the pressure analysis results between national level and DRB level can be attributed to the differences in the level of aggregation between national and basin-wide levels, to different reference years (the DRBM Plan considered 2005/2006), and/or to different methodologies used at national levels (i.e. differentiation between emissions to water bodies and emissions into soil).
Approximate distribution of Danube River Basin run-off by country/group of countries
country/group of countries annual volume of run-off (km3/year) Share of Danube water resources (%) Ratio of outflow minus inflow + outflow (%)Albania 0.13 0.06 100.00Austria 48.44 22.34 63.77Bosnia and Herzegovina, Croatia and Slovenia
40.16 16.84 N/A
Bulgaria 7.32 3.99 7.35Czech Republic 3.43 1.93 N/AGermany 25.26 11.65 90.71Hungary 5.58 2.57 4.97Italy 0.54 0.25 100.00Republic of Moldova and Ukraine
10.41 4.78 9.52
Montenegro and Serbia 23.5 10.70 13.19Poland 0.10 0.04 100.00Romania 37.16 17.00 17.35Slovakia 12.91 7.21 23.0Switzerland 1.40 0.64 86.67Total 216.34 100.00
Source: Danube Pollution Reduction Programme - Transboundary Analysis Report. International Commission for the Protection of the Danube River, June 1999.
Pressures6
Organic pollution is mainly caused by the emission of partially treated or untreated wastewater from agglomerations, industry and agriculture. Many agglomerations in the DRB have no, or insufficient, wastewater treatment and are therefore key con-tributors to organic pollution. Very often industrial wastewaters are insufficiently treated or are not treated at all before being discharged into surface waters (direct emission) or public sewer systems (indirect emission).
A total of 6,224 agglomerations with a p.e. ≥2,000 (population equivalent) are located in the DRBD. Out of those, 4,969 ag-glomerations (21 million p.e.) are in the class of 2,000–10,000 p.e. and 1,255 agglomerations can be classified with a p.e. >10,000 (73.6 million p.e.).
The updated assessment of the Danube River Basin District Management Plan (DRBMP) shows that COD and BOD
5 emis-
sions from large agglomerations (>10,000 p.e.) in the DRB are respectively 922 kt/year and 412 kt/year. The assessments have been improved by calculating emissions from agglomerations ≥2,000 p.e. The total emission contribution from these sources is 1,511 kt/year for COD and 737 kt/year for BOD
5.
Concerning nutrient pollution, the Danube, as one of the major rivers discharging into the Black Sea, was estimated to introduce on average about 35,000 tonnes of phosphorus (P) and 400,000 tonnes of inorganic nitrogen (N) into the Black Sea each year in the period 1988-2005. The present level of the total P load that would be discharged to the Black Sea (including the P stor-age that occurs today in the Iron Gate impoundments) would be
FiguRe 1: Wastewater treatment levels and degree of connection for the generated load (p.e.) from agglomerations ≥ 2,000 p.e. for reference year 2005/20067
Note: IAS — Individual and appropriate systems e.g. cesspools, septic tanks, domestic wastewater treatment plants.
170 | part IV

8 The total nitrogen emissions in t/year for non-EU countries are currently unknown.9 BG, CZ: Data not reported for EPER 2004, therefore no illustration is included. The total phosphorus emissions in t/year for non-EU countries States are currently unknown.
10 UNDP GEF Danube Regional Project: Inventory of Agricultural Pesticide Use in the DRB Countries.11 Liska, I., Wagner, F., Slobodnik, J. (eds), Joint Danube Survey 2, Final Scientific Report. International Commission for the Protection of the Danube River, Vienna 2008. 12 The meanings of the classes employed the Joint Danube Survey 2: class 1 — channel nearly natural, class 2: — channel slightly modified, class 3 — channel
moderately modified, class 4 — channel severely modified, class 5 — channel totally modified.
FiguRe 2: Industrial direct emissions of nitrogen per relevant types of industries and EU member States (2004; RO: 2005)8
FiguRe 3: Industrial direct emissions of phosphorus per relevant types of industries and EU member States (2004; RO: 2005)9
Total nitrogen (Ntot
) and total phosphorus (Ptot
) emissions from agglomerations ≥2,000 p.e. for each Danube country and the entire DRBD emitted through all pathways (reference year 2005/2006)
aT Ba Bg hR cZ De hu MD Ro RS Si SK ua ToTalEmissions N
tot (kt/year) 9.5 7.3 6.5 10.9 2.8 12.3 14.7 1.9 69.3 16.0 3.2 11.4 2.1 168.0
Emissions P tot
(kt/year) 0.8 1.6 1.3 2.8 0.4 1.0 2.8 0.4 11.5 2.9 0.7 1.7 0.7 28.6
Pulp and paper industry Food industry Chemical industry Other industries
0 300 600 900 1200 1500 1800 2100t/year
BG
RO
SI
SK
CZ
HU
AT
DE
0 5 10 15 20 25 30 35 40 45 50t/year
RO
SI
SK
HU
AT
DE
about 20% higher than in the early 1960s (based on modelling results). The Iron Gate Dams are a significant factor in reducing the amount of P from countries upstream on the Danube River, as the large amounts of sediment containing attached P settle out in the reservoir.
Pollution by hazardous substances can seriously damage river-ine ecology, and consequently impact upon water status, affect-ing the health of the human population.
Information provided by the EU member States in the Euro-pean Pollutant Emission Register (EPER) reporting shows an increase of the reported load values of arsenic, cadmium, chromium, copper, mercury, nickel, lead and zinc in 2004 (compared with 2001 values). In 2004, the amount of lead directly discharged was 138 t/year, and for zinc, 171 t/year.
Another major source of hazardous substances is pesticides used in agriculture. Information on pesticides’ use within the Danube countries prepared for the DBA10 showed that 29 relevant active ingredients were used in pesticide products. Of these, only three pesticides are authorized for use in all of the DRB countries, while seven are not authorized in any of the countries, despite the fact that they have been found when testing water and sediments. Compared with Western Europe, and including the upstream Danube countries, the level of pesticide use in central and lower DRB countries is still relatively low.
Three key hydromorphological pressure components of basin-wide importance have been identified: (1) interruption of river and habitat continuity; (2) disconnection of adjacent wetlands/floodplains; and (3) hydrological alterations.
The Joint Danube Survey 2 (JDS 2) in 200711 delivered results on hydromorphological alterations for the entire length of the Danube River. A 5-class evaluation for three categories (channels; banks; floodplains) formed the basis for the overall hydromorphological as-sessment, which concluded that more than one third (39%) of the Danube River from Kehlheim to the Black Sea can be classified as class 212. However, 30% of the Danube River’s length is character-ised as class 3, 28% as class 4 and 3% as class 5.
FiguRe 4: Overall hydromorphological assessment of the Danube River in five classes as longitudinal colour-ribbon visualisation
The pressure analysis in the DRBMP showed that the key driving forces causing eventual river and habitat continuity interruptions in the DRBD are mainly flood protection (45%), hydropower genera-tion (45%) and water supply (10%). Some 600 of the 1,688 con-tinuity interruptions are dams/weirs, 729 are ramps/sills and 359
2500 2250 2000 1750 1500 1250 1000 750 500 250 0
Class 1 (reference conditions) Class 2 Class 3 Class 4 Class 5
170 | part IV Chapter 5 Drainage basin of the black sea | 171
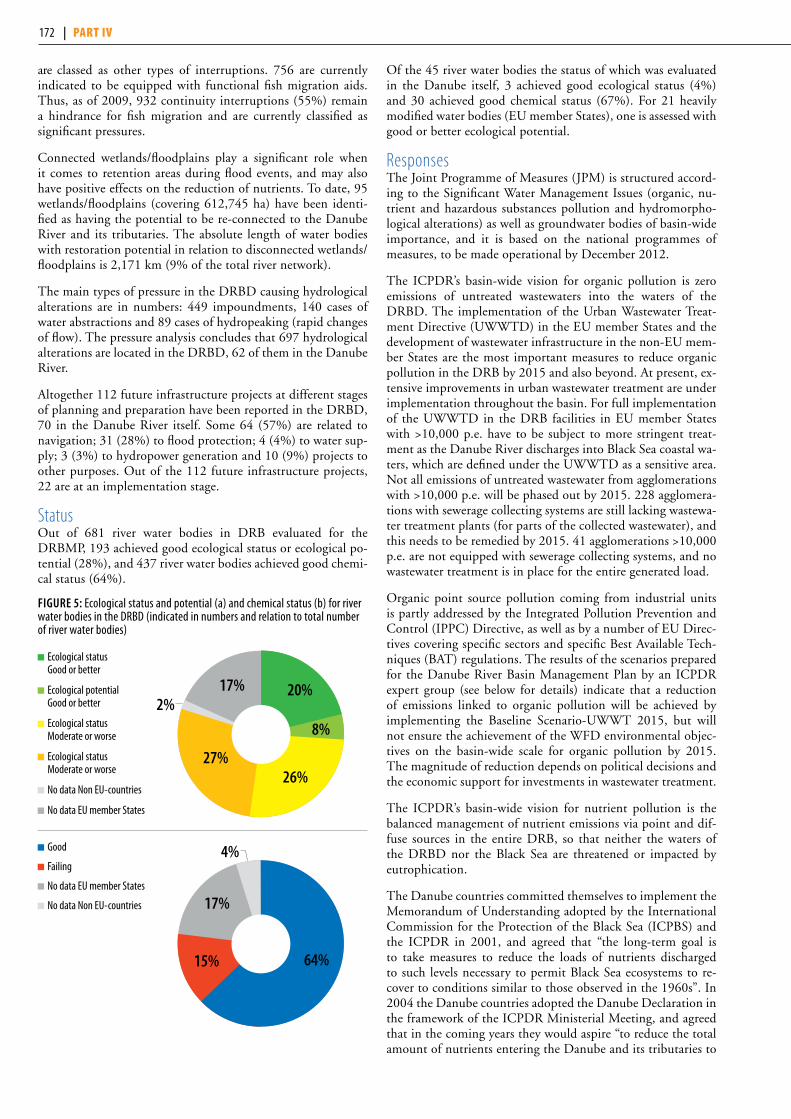
are classed as other types of interruptions. 756 are currently indicated to be equipped with functional fish migration aids. Thus, as of 2009, 932 continuity interruptions (55%) remain a hindrance for fish migration and are currently classified as significant pressures.
Connected wetlands/floodplains play a significant role when it comes to retention areas during flood events, and may also have positive effects on the reduction of nutrients. To date, 95 wetlands/floodplains (covering 612,745 ha) have been identi-fied as having the potential to be re-connected to the Danube River and its tributaries. The absolute length of water bodies with restoration potential in relation to disconnected wetlands/floodplains is 2,171 km (9% of the total river network).
The main types of pressure in the DRBD causing hydrological alterations are in numbers: 449 impoundments, 140 cases of water abstractions and 89 cases of hydropeaking (rapid changes of flow). The pressure analysis concludes that 697 hydrological alterations are located in the DRBD, 62 of them in the Danube River.
Altogether 112 future infrastructure projects at different stages of planning and preparation have been reported in the DRBD, 70 in the Danube River itself. Some 64 (57%) are related to navigation; 31 (28%) to flood protection; 4 (4%) to water sup-ply; 3 (3%) to hydropower generation and 10 (9%) projects to other purposes. Out of the 112 future infrastructure projects, 22 are at an implementation stage.
Status Out of 681 river water bodies in DRB evaluated for the DRBMP, 193 achieved good ecological status or ecological po-tential (28%), and 437 river water bodies achieved good chemi-cal status (64%).
FiguRe 5: Ecological status and potential (a) and chemical status (b) for river water bodies in the DRBD (indicated in numbers and relation to total number of river water bodies)
Of the 45 river water bodies the status of which was evaluated in the Danube itself, 3 achieved good ecological status (4%) and 30 achieved good chemical status (67%). For 21 heavily modified water bodies (EU member States), one is assessed with good or better ecological potential.
ResponsesThe Joint Programme of Measures (JPM) is structured accord-ing to the Significant Water Management Issues (organic, nu-trient and hazardous substances pollution and hydromorpho-logical alterations) as well as groundwater bodies of basin-wide importance, and it is based on the national programmes of measures, to be made operational by December 2012.
The ICPDR’s basin-wide vision for organic pollution is zero emissions of untreated wastewaters into the waters of the DRBD. The implementation of the Urban Wastewater Treat-ment Directive (UWWTD) in the EU member States and the development of wastewater infrastructure in the non-EU mem-ber States are the most important measures to reduce organic pollution in the DRB by 2015 and also beyond. At present, ex-tensive improvements in urban wastewater treatment are under implementation throughout the basin. For full implementation of the UWWTD in the DRB facilities in EU member States with >10,000 p.e. have to be subject to more stringent treat-ment as the Danube River discharges into Black Sea coastal wa-ters, which are defined under the UWWTD as a sensitive area.Not all emissions of untreated wastewater from agglomerations with >10,000 p.e. will be phased out by 2015. 228 agglomera-tions with sewerage collecting systems are still lacking wastewa-ter treatment plants (for parts of the collected wastewater), and this needs to be remedied by 2015. 41 agglomerations >10,000 p.e. are not equipped with sewerage collecting systems, and no wastewater treatment is in place for the entire generated load.
Organic point source pollution coming from industrial units is partly addressed by the Integrated Pollution Prevention and Control (IPPC) Directive, as well as by a number of EU Direc-tives covering specific sectors and specific Best Available Tech-niques (BAT) regulations. The results of the scenarios prepared for the Danube River Basin Management Plan by an ICPDR expert group (see below for details) indicate that a reduction of emissions linked to organic pollution will be achieved by implementing the Baseline Scenario-UWWT 2015, but will not ensure the achievement of the WFD environmental objec-tives on the basin-wide scale for organic pollution by 2015. The magnitude of reduction depends on political decisions and the economic support for investments in wastewater treatment.
The ICPDR’s basin-wide vision for nutrient pollution is the balanced management of nutrient emissions via point and dif-fuse sources in the entire DRB, so that neither the waters of the DRBD nor the Black Sea are threatened or impacted by eutrophication.
The Danube countries committed themselves to implement the Memorandum of Understanding adopted by the International Commission for the Protection of the Black Sea (ICPBS) and the ICPDR in 2001, and agreed that “the long-term goal is to take measures to reduce the loads of nutrients discharged to such levels necessary to permit Black Sea ecosystems to re-cover to conditions similar to those observed in the 1960s”. In 2004 the Danube countries adopted the Danube Declaration in the framework of the ICPDR Ministerial Meeting, and agreed that in the coming years they would aspire “to reduce the total amount of nutrients entering the Danube and its tributaries to
20%
26%27%
8%
17%2%
Ecological status Good or better
Ecological potential Good or better
Ecological status Moderate or worse
Ecological status Moderate or worse
No data Non EU-countries
No data EU member States
64%15%
17%
4% Good
Failing
No data EU member States
No data Non EU-countries
172 | part IV
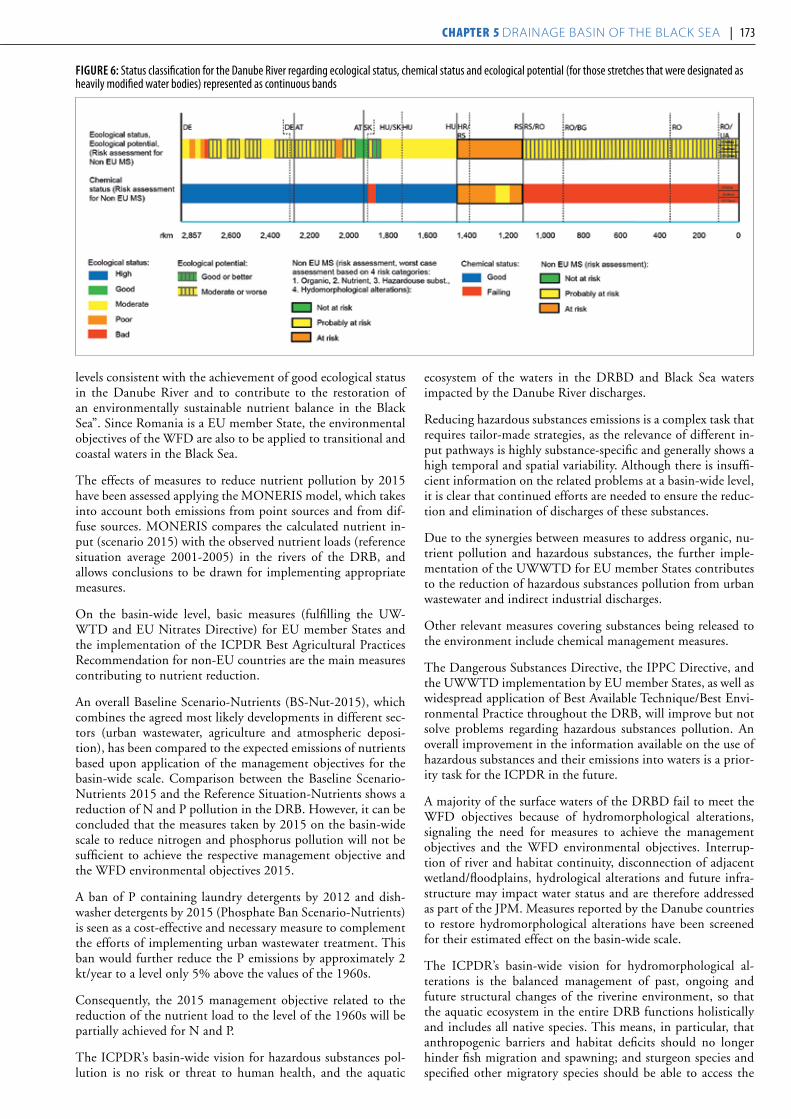
levels consistent with the achievement of good ecological status in the Danube River and to contribute to the restoration of an environmentally sustainable nutrient balance in the Black Sea”. Since Romania is a EU member State, the environmental objectives of the WFD are also to be applied to transitional and coastal waters in the Black Sea.
The effects of measures to reduce nutrient pollution by 2015 have been assessed applying the MONERIS model, which takes into account both emissions from point sources and from dif-fuse sources. MONERIS compares the calculated nutrient in-put (scenario 2015) with the observed nutrient loads (reference situation average 2001-2005) in the rivers of the DRB, and allows conclusions to be drawn for implementing appropriate measures.
On the basin-wide level, basic measures (fulfilling the UW-WTD and EU Nitrates Directive) for EU member States and the implementation of the ICPDR Best Agricultural Practices Recommendation for non-EU countries are the main measures contributing to nutrient reduction.
An overall Baseline Scenario-Nutrients (BS-Nut-2015), which combines the agreed most likely developments in different sec-tors (urban wastewater, agriculture and atmospheric deposi-tion), has been compared to the expected emissions of nutrients based upon application of the management objectives for the basin-wide scale. Comparison between the Baseline Scenario-Nutrients 2015 and the Reference Situation-Nutrients shows a reduction of N and P pollution in the DRB. However, it can be concluded that the measures taken by 2015 on the basin-wide scale to reduce nitrogen and phosphorus pollution will not be sufficient to achieve the respective management objective and the WFD environmental objectives 2015.
A ban of P containing laundry detergents by 2012 and dish-washer detergents by 2015 (Phosphate Ban Scenario-Nutrients) is seen as a cost-effective and necessary measure to complement the efforts of implementing urban wastewater treatment. This ban would further reduce the P emissions by approximately 2 kt/year to a level only 5% above the values of the 1960s.
Consequently, the 2015 management objective related to the reduction of the nutrient load to the level of the 1960s will be partially achieved for N and P.
The ICPDR’s basin-wide vision for hazardous substances pol-lution is no risk or threat to human health, and the aquatic
ecosystem of the waters in the DRBD and Black Sea waters impacted by the Danube River discharges.
Reducing hazardous substances emissions is a complex task that requires tailor-made strategies, as the relevance of different in-put pathways is highly substance-specific and generally shows a high temporal and spatial variability. Although there is insuffi-cient information on the related problems at a basin-wide level, it is clear that continued efforts are needed to ensure the reduc-tion and elimination of discharges of these substances.
Due to the synergies between measures to address organic, nu-trient pollution and hazardous substances, the further imple-mentation of the UWWTD for EU member States contributes to the reduction of hazardous substances pollution from urban wastewater and indirect industrial discharges.
Other relevant measures covering substances being released to the environment include chemical management measures.
The Dangerous Substances Directive, the IPPC Directive, and the UWWTD implementation by EU member States, as well as widespread application of Best Available Technique/Best Envi-ronmental Practice throughout the DRB, will improve but not solve problems regarding hazardous substances pollution. An overall improvement in the information available on the use of hazardous substances and their emissions into waters is a prior-ity task for the ICPDR in the future.
A majority of the surface waters of the DRBD fail to meet the WFD objectives because of hydromorphological alterations, signaling the need for measures to achieve the management objectives and the WFD environmental objectives. Interrup-tion of river and habitat continuity, disconnection of adjacent wetland/floodplains, hydrological alterations and future infra-structure may impact water status and are therefore addressed as part of the JPM. Measures reported by the Danube countries to restore hydromorphological alterations have been screened for their estimated effect on the basin-wide scale.
The ICPDR’s basin-wide vision for hydromorphological al-terations is the balanced management of past, ongoing and future structural changes of the riverine environment, so that the aquatic ecosystem in the entire DRB functions holistically and includes all native species. This means, in particular, that anthropogenic barriers and habitat deficits should no longer hinder fish migration and spawning; and sturgeon species and specified other migratory species should be able to access the
FiguRe 6: Status classification for the Danube River regarding ecological status, chemical status and ecological potential (for those stretches that were designated as heavily modified water bodies) represented as continuous bands
172 | part IV Chapter 5 Drainage basin of the black sea | 173
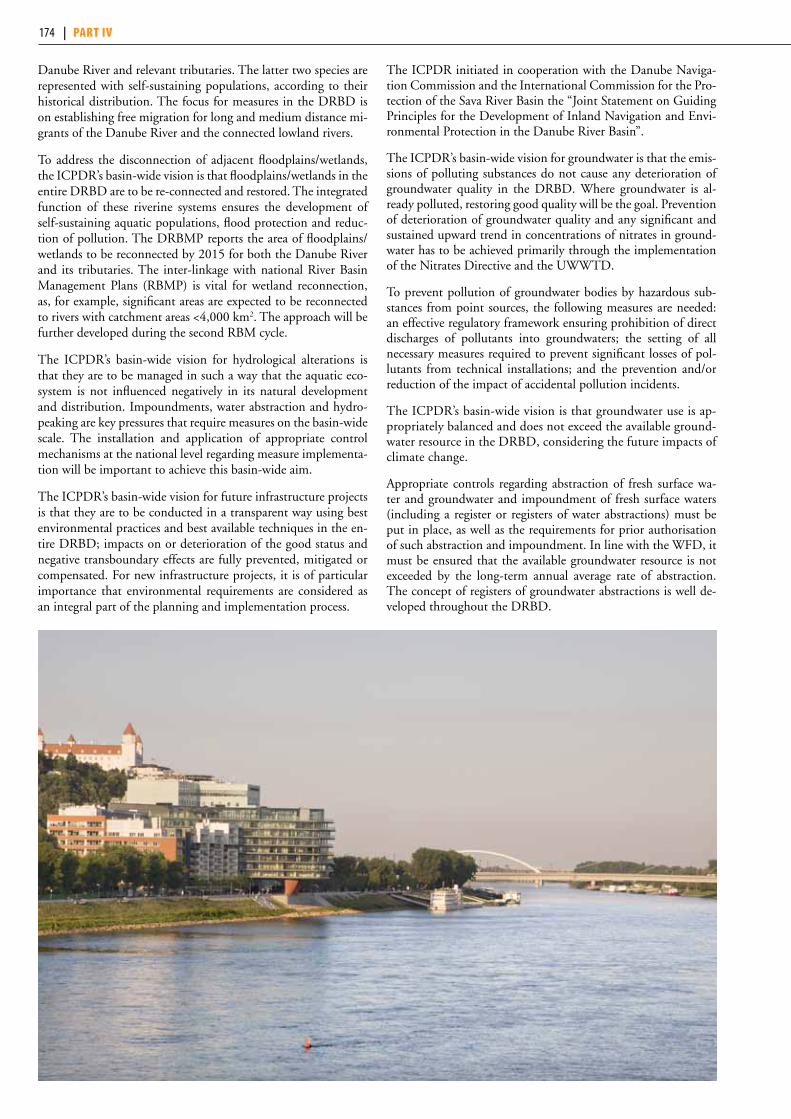
Danube River and relevant tributaries. The latter two species are represented with self-sustaining populations, according to their historical distribution. The focus for measures in the DRBD is on establishing free migration for long and medium distance mi-grants of the Danube River and the connected lowland rivers.
To address the disconnection of adjacent floodplains/wetlands, the ICPDR’s basin-wide vision is that floodplains/wetlands in the entire DRBD are to be re-connected and restored. The integrated function of these riverine systems ensures the development of self-sustaining aquatic populations, flood protection and reduc-tion of pollution. The DRBMP reports the area of floodplains/wetlands to be reconnected by 2015 for both the Danube River and its tributaries. The inter-linkage with national River Basin Management Plans (RBMP) is vital for wetland reconnection, as, for example, significant areas are expected to be reconnected to rivers with catchment areas <4,000 km2. The approach will be further developed during the second RBM cycle.
The ICPDR’s basin-wide vision for hydrological alterations is that they are to be managed in such a way that the aquatic eco-system is not influenced negatively in its natural development and distribution. Impoundments, water abstraction and hydro-peaking are key pressures that require measures on the basin-wide scale. The installation and application of appropriate control mechanisms at the national level regarding measure implementa-tion will be important to achieve this basin-wide aim.
The ICPDR’s basin-wide vision for future infrastructure projects is that they are to be conducted in a transparent way using best environmental practices and best available techniques in the en-tire DRBD; impacts on or deterioration of the good status and negative transboundary effects are fully prevented, mitigated or compensated. For new infrastructure projects, it is of particular importance that environmental requirements are considered as an integral part of the planning and implementation process.
The ICPDR initiated in cooperation with the Danube Naviga-tion Commission and the International Commission for the Pro-tection of the Sava River Basin the “Joint Statement on Guiding Principles for the Development of Inland Navigation and Envi-ronmental Protection in the Danube River Basin”.
The ICPDR’s basin-wide vision for groundwater is that the emis-sions of polluting substances do not cause any deterioration of groundwater quality in the DRBD. Where groundwater is al-ready polluted, restoring good quality will be the goal. Prevention of deterioration of groundwater quality and any significant and sustained upward trend in concentrations of nitrates in ground-water has to be achieved primarily through the implementation of the Nitrates Directive and the UWWTD.
To prevent pollution of groundwater bodies by hazardous sub-stances from point sources, the following measures are needed: an effective regulatory framework ensuring prohibition of direct discharges of pollutants into groundwaters; the setting of all necessary measures required to prevent significant losses of pol-lutants from technical installations; and the prevention and/or reduction of the impact of accidental pollution incidents.
The ICPDR’s basin-wide vision is that groundwater use is ap-propriately balanced and does not exceed the available ground-water resource in the DRBD, considering the future impacts of climate change.
Appropriate controls regarding abstraction of fresh surface wa-ter and groundwater and impoundment of fresh surface waters (including a register or registers of water abstractions) must be put in place, as well as the requirements for prior authorisation of such abstraction and impoundment. In line with the WFD, it must be ensured that the available groundwater resource is not exceeded by the long-term annual average rate of abstraction. The concept of registers of groundwater abstractions is well de-veloped throughout the DRBD.
174 | part IV
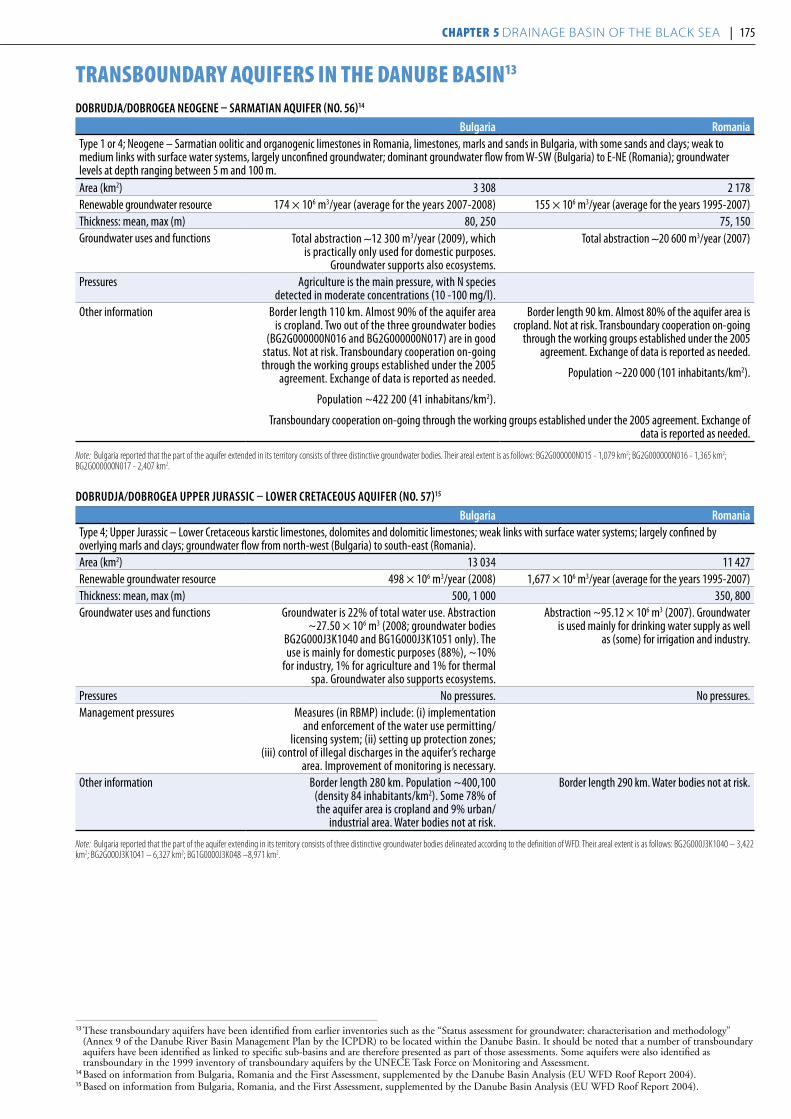
DoBRuDja/DoBRogea neogene – SaRMaTian aquiFeR (no. 56)14
Bulgaria RomaniaType 1 or 4; Neogene – Sarmatian oolitic and organogenic limestones in Romania, limestones, marls and sands in Bulgaria, with some sands and clays; weak to medium links with surface water systems, largely unconfined groundwater; dominant groundwater flow from W-SW (Bulgaria) to E-NE (Romania); groundwater levels at depth ranging between 5 m and 100 m.Area (km2) 3 308 2 178Renewable groundwater resource 174 × 106 m3/year (average for the years 2007-2008) 155 × 106 m3/year (average for the years 1995-2007)Thickness: mean, max (m) 80, 250 75, 150Groundwater uses and functions Total abstraction ∼12 300 m3/year (2009), which
is practically only used for domestic purposes. Groundwater supports also ecosystems.
Total abstraction ∼20 600 m3/year (2007)
Pressures Agriculture is the main pressure, with N species detected in moderate concentrations (10 -100 mg/l).
Other information Border length 110 km. Almost 90% of the aquifer area is cropland. Two out of the three groundwater bodies
(BG2G000000N016 and BG2G000000N017) are in good status. Not at risk. Transboundary cooperation on-going through the working groups established under the 2005
agreement. Exchange of data is reported as needed.
Population ~422 200 (41 inhabitans/km2).
Border length 90 km. Almost 80% of the aquifer area is cropland. Not at risk. Transboundary cooperation on-going
through the working groups established under the 2005 agreement. Exchange of data is reported as needed.
Population ~220 000 (101 inhabitants/km2).
Transboundary cooperation on-going through the working groups established under the 2005 agreement. Exchange of data is reported as needed.
Note: Bulgaria reported that the part of the aquifer extended in its territory consists of three distinctive groundwater bodies. Their areal extent is as follows: BG2G000000N015 - 1,079 km2; BG2G000000N016 - 1,365 km2; BG2G000000N017 - 2,407 km2.
13 These transboundary aquifers have been identified from earlier inventories such as the “Status assessment for groundwater: characterisation and methodology” (Annex 9 of the Danube River Basin Management Plan by the ICPDR) to be located within the Danube Basin. It should be noted that a number of transboundary aquifers have been identified as linked to specific sub-basins and are therefore presented as part of those assessments. Some aquifers were also identified as transboundary in the 1999 inventory of transboundary aquifers by the UNECE Task Force on Monitoring and Assessment.
14 Based on information from Bulgaria, Romania and the First Assessment, supplemented by the Danube Basin Analysis (EU WFD Roof Report 2004).15 Based on information from Bulgaria, Romania, and the First Assessment, supplemented by the Danube Basin Analysis (EU WFD Roof Report 2004).
DoBRuDja/DoBRogea uppeR juRaSSic – LoWeR cReTaceouS aquiFeR (no. 57)15
Bulgaria RomaniaType 4; Upper Jurassic – Lower Cretaceous karstic limestones, dolomites and dolomitic limestones; weak links with surface water systems; largely confined by overlying marls and clays; groundwater flow from north-west (Bulgaria) to south-east (Romania).Area (km2) 13 034 11 427Renewable groundwater resource 498 × 106 m3/year (2008) 1,677 × 106 m3/year (average for the years 1995-2007)Thickness: mean, max (m) 500, 1 000 350, 800Groundwater uses and functions Groundwater is 22% of total water use. Abstraction
~27.50 × 10⁶ m3 (2008; groundwater bodies BG2G000J3K1040 and BG1G000J3K1051 only). The use is mainly for domestic purposes (88%), ~10%
for industry, 1% for agriculture and 1% for thermal spa. Groundwater also supports ecosystems.
Abstraction ~95.12 × 10⁶ m3 (2007). Groundwater is used mainly for drinking water supply as well
as (some) for irrigation and industry.
Pressures No pressures. No pressures.Management pressures Measures (in RBMP) include: (i) implementation
and enforcement of the water use permitting/ licensing system; (ii) setting up protection zones;
(iii) control of illegal discharges in the aquifer’s recharge area. Improvement of monitoring is necessary.
Other information Border length 280 km. Population ~400,100 (density 84 inhabitants/km2). Some 78% of the aquifer area is cropland and 9% urban/
industrial area. Water bodies not at risk.
Border length 290 km. Water bodies not at risk.
Note: Bulgaria reported that the part of the aquifer extending in its territory consists of three distinctive groundwater bodies delineated according to the definition of WFD. Their areal extent is as follows: BG2G000J3K1040 – 3,422 km2; BG2G000J3K1041 – 6,327 km2; BG1G0000J3K048 –8,971 km2.
transBoundary aquIfers In the danuBe BasIn13
174 | part IV Chapter 5 Drainage basin of the black sea | 175

SouTh WeSTeRn BacKa/Dunav aquiFeR (no. 58)16
Serbia croatia Type 3; Eopleistocene alluvial aquifer of mainly medium and coarse grained sands and some gravels, of average thickness 20 m and up to 45 m; partly confined with medium links to surface water systems; dominant groundwater flow direction from Serbia to Croatia.Area (km2) 441 N/AGroundwater uses and functions 50-75% of the groundwater is used for drinking water
supply (covering the total of drinking water needs in the area) and less than 25% for irrigation, industry and
livestock. Groundwater also supports ecosystems.
N/A
Groundwater abstraction is the main pressure. Apart from the Danube riparian zone, abstraction from deep horizons
with a natural renewal rate that does not meet consumption. Groundwater depletion observed in some deep wells
(Pliocene sediments) while groundwater level has dropped locally (< 5 m - from the 1960s until 2000) in the Quaternary
aquifer; Natural organic compounds, ammonia, Fe, Mn at high concentrations. Widespread naturally-occurring arsenic at concentrations from 10 to 100 µg/l. Ammonium pollution
and pathogens result from inappropriate sanitation.
N/A
Other information Population ~32,500 (density 74 inhabitants/km2) Part of the Panonian Basin, within the Danube basin. Some
50% of the aquifer area is cropland, ∼30% forest.
According to existing data, no transboundary groundwater is recognized.
16 Based on information from Serbia and Croatia. 17 Source: Project 353 Final Report: Sustainable solutions to improve quality of drinking water affected by high arsenic contents in 3 Vojvodinian regions (AP Vojvodina,
Provincial Secretariat for Env. Protection and Sust. Development, 2006) – Provided by the Ministry of Agriculture, Forestry and Water Management, Serbia.
Range oF concenTRaTionS oF chaRacTeRiSTic quaLiTy paRaMeTeRS in DRinKing WaTeR in ToWnS anD viLLageS in The SeRBian aRea17
Town/village population Fe (mg/l) Mn (mg/l) nh3 (mg/l)
KMno4
consumption (mg/l) as (mg/l)
Apatin 19 289 1.6-2.7a 0.09-0.3a 2.2a 11a 0.006-0.012b
Prigrevica 4 786 Connected to Apatin waterworksSvilojevo 1 354 Not Detected Not Detected Not Detected Not Detected Not DetectedSonta 4 994 1-3a 0.1-0.13a 1.5a 12-26a 0.001-0.26a
Bogojevo 2 120 0.1-0.5a 0.08-0.23a 9.6-45.6a 0.134a
a Concentrations exceeding limits set for drinking water.b Concentrations below limits set for drinking water.
The construction of the regional water supply system of Backa, which will use groundwater from the Danube alluvium and serve more than 200,000 inhabitants of Western and Mid Backa Re-gion (work is in the preparatory phase – field investigations and some studies have been completed), is included in the DRBMP and the Programme of Measures (final draft) prepared by ICP-DR. It is among the measures planned to provide a solution to
problems related to drinking water supply and to reduce or even eliminate the quantitative risk that the aquifer is currently under. The groundwater body is not at risk as far as quality is concerned. Nevertheless, its status was reported by Serbia as poor.
Transboundary cooperation on the aquifer has not been considered so far by Serbia as it is assumed that joint decisions are not needed.
176 | part IV
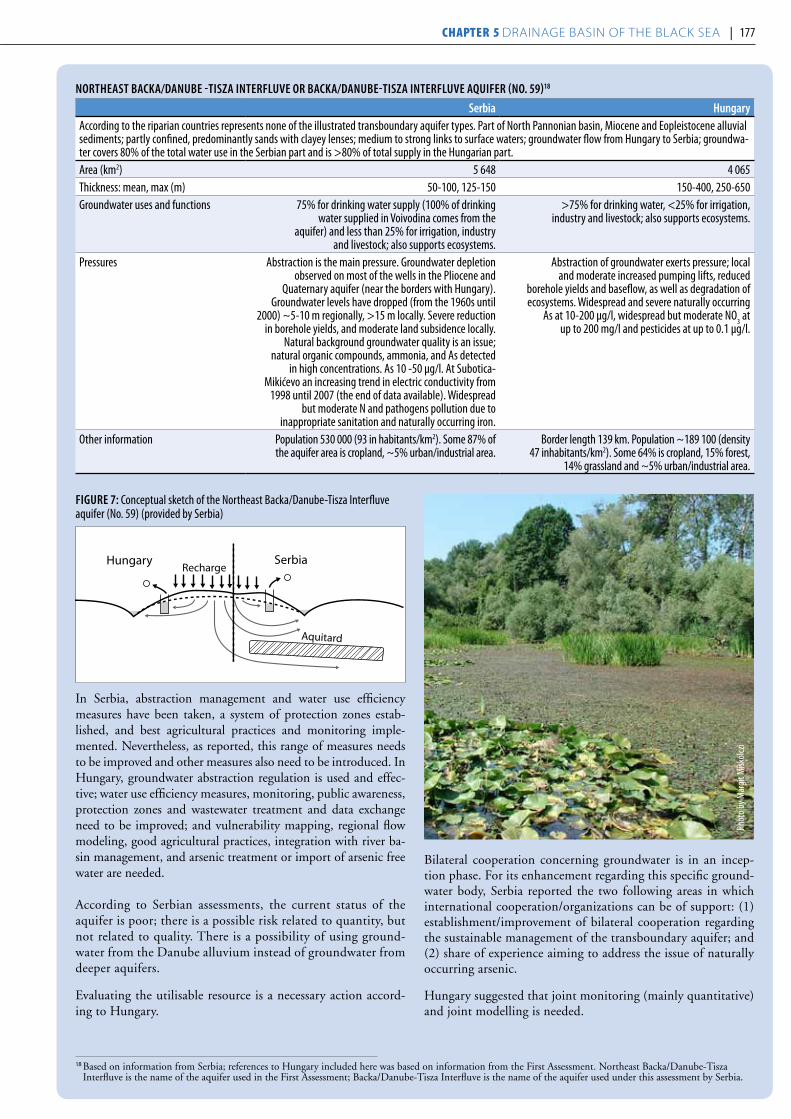
FiguRe 7: Conceptual sketch of the Northeast Backa/Danube-Tisza Interfluve aquifer (No. 59) (provided by Serbia)
Hungary SerbiaRecharge
In Serbia, abstraction management and water use efficiency measures have been taken, a system of protection zones estab-lished, and best agricultural practices and monitoring imple-mented. Nevertheless, as reported, this range of measures needs to be improved and other measures also need to be introduced. In Hungary, groundwater abstraction regulation is used and effec-tive; water use efficiency measures, monitoring, public awareness, protection zones and wastewater treatment and data exchange need to be improved; and vulnerability mapping, regional flow modeling, good agricultural practices, integration with river ba-sin management, and arsenic treatment or import of arsenic free water are needed.
According to Serbian assessments, the current status of the aquifer is poor; there is a possible risk related to quantity, but not related to quality. There is a possibility of using ground-water from the Danube alluvium instead of groundwater from deeper aquifers.
Evaluating the utilisable resource is a necessary action accord-ing to Hungary.
Bilateral cooperation concerning groundwater is in an incep-tion phase. For its enhancement regarding this specific ground-water body, Serbia reported the two following areas in which international cooperation/organizations can be of support: (1) establishment/improvement of bilateral cooperation regarding the sustainable management of the transboundary aquifer; and (2) share of experience aiming to address the issue of naturally occurring arsenic.
Hungary suggested that joint monitoring (mainly quantitative) and joint modelling is needed.
noRTheaST BacKa/DanuBe -TiSZa inTeRFLuve oR BacKa/DanuBe-TiSZa inTeRFLuve aquiFeR (no. 59)18
Serbia hungaryAccording to the riparian countries represents none of the illustrated transboundary aquifer types. Part of North Pannonian basin, Miocene and Eopleistocene alluvial sediments; partly confined, predominantly sands with clayey lenses; medium to strong links to surface waters; groundwater flow from Hungary to Serbia; groundwa-ter covers 80% of the total water use in the Serbian part and is >80% of total supply in the Hungarian part.Area (km2) 5 648 4 065Thickness: mean, max (m) 50-100, 125-150 150-400, 250-650Groundwater uses and functions 75% for drinking water supply (100% of drinking
water supplied in Voivodina comes from the aquifer) and less than 25% for irrigation, industry
and livestock; also supports ecosystems.
>75% for drinking water, <25% for irrigation, industry and livestock; also supports ecosystems.
Pressures Abstraction is the main pressure. Groundwater depletion observed on most of the wells in the Pliocene and
Quaternary aquifer (near the borders with Hungary). Groundwater levels have dropped (from the 1960s until
2000) ~5-10 m regionally, >15 m locally. Severe reduction in borehole yields, and moderate land subsidence locally.
Natural background groundwater quality is an issue; natural organic compounds, ammonia, and As detected
in high concentrations. As 10 -50 µg/l. At Subotica-Mikićevo an increasing trend in electric conductivity from
1998 until 2007 (the end of data available). Widespread but moderate N and pathogens pollution due to
inappropriate sanitation and naturally occurring iron.
Abstraction of groundwater exerts pressure; local and moderate increased pumping lifts, reduced
borehole yields and baseflow, as well as degradation of ecosystems. Widespread and severe naturally occurring
As at 10-200 µg/l, widespread but moderate NO3 at
up to 200 mg/l and pesticides at up to 0.1 µg/l.
Other information Population 530 000 (93 in habitants/km2). Some 87% of the aquifer area is cropland, ~5% urban/industrial area.
Border length 139 km. Population ~189 100 (density 47 inhabitants/km2). Some 64% is cropland, 15% forest,
14% grassland and ~5% urban/industrial area.
18 Based on information from Serbia; references to Hungary included here was based on information from the First Assessment. Northeast Backa/Danube-Tisza Interfluve is the name of the aquifer used in the First Assessment; Backa/Danube-Tisza Interfluve is the name of the aquifer used under this assessment by Serbia.
Phot
o by M
argi
t Misk
olcz
i
176 | part IV Chapter 5 Drainage basin of the black sea | 177

reserVoIrs Iron Gate I and Iron Gate II19
The Iron Gate is a gorge between the Carpathian and Balkan mountains on the Danube River on the border between Roma-nia and Serbia. Historically, it was an obstacle for shipping. Iron Gate I (upstream of Drobeta-Turnu Severin) includes one of Eu-rope’s largest hydroelectric power dams, operated as a run-off-the-river plant. The dam was built by Romania and the former Yugoslavia between 1970 and 1972. The Iron Gate II dam was built in 1985, also by Romania and the former Yugoslavia.
Hydrology and hydrogeologyThe total area of the Iron Gate I Reservoir is 330 km2 and the total volume 3.5 km3. The reservoir is relatively shallow; the mean depth is 25 m while its deepest point is at 70 m.
Iron Gate II, located downstream of Drobeta-Turnu Severin is smaller (79 km2) than Iron Gate I; the total volume of the lake is 0.8 km3. The reservoir is shallower than Iron Gate I, the mean depth is 10 m and its deepest point is at 25 m.
Floods are an issue of concern in Romania; extreme events usu-ally occur during the high flow period (March – May). Among the most severe floods were events in 1999, 2005 and 2008. The construction of the dams facilitated flood control, as well as navigation activities.
PressuresThe construction of the Iron Gates has caused an alteration of the hydrological regime of the Danube River. Reduction of sediment transport capacity, leading to sediment deposition at certain parts and alteration of the character of the aquatic and riparian habitats, were among the main effects. Sediment deposition induced the gradual increase of high water levels upstream, reducing the safety of the existing flood protection system. While pressure has been exerted on some fish species, others (some rare species) have benefited.
The lack of proper sewage collection and treatment facilities in the Drobeta-Turnu Severin agglomeration is the main pressure in the Romanian territory related to Iron Gate II. Some small-er towns, such as Orsova, also lack a treatment plant. Pressure factors reported by Romania as of low importance include de-creasing forest cover; mining activities, open storage of wastes
as well as tailings dams; the wastewater discharges from a unit which produces raw heavy water causing thermal pollution as well as sulphide hydrogen pollution (although wastewaters are treated); some inappropriate industrial wastewater collection and treatment facilities; and uncontrolled dumpsites in the riverbeds, especially in rural areas. The construction of new wastewater col-lection and treatment systems for human settlements and the rehabilitation of the existing systems for human settlements and industries are in progress, in accordance with the UWWTD.20
Status and transboundary impactsThere are no major water quality problems in the Iron Gate I and II reservoirs. Nevertheless, the Iron Gates’ water quality significantly depends on the input of pollutants from upstream Danubian countries. Pollutants accumulated in the sediments of the reservoirs may be of concern; heavy metals as well as other chemical substances have been detected in the sediments of the reservoirs, which also function as phosphorous traps.
The concentration of total suspended solids in the reservoirs has remained at approximately the same level, 27.5-32.5 mg/l, during the above-mentioned period.
Responses In Romania, the Iron Gates Reservoirs have been assigned to the Jiu River Basin Administration; a water management au-thority and a river basin committee (at the river basin level) have been established. Plans prepared at the national and River Basin Administrations’ level include: a River Basin Manage-ment Plan and a River Basin Development Plan (the first fo-cuses on water quality issues and the latter on water quantity issues); a Regional Action Plan for Environment; a Preventing and Fighting Accidental Pollution Plan; and a Drought Periods Water Use Operational Plan. The Rules of Operation of the Iron Gates include water demand management measures and measures aiming to increase water use efficiency.
In Serbia, the Iron Gate Authority is responsible for reservoir management, pursuant to the water permit issued in 2005. Water management plans pursuant to the WFD, as envisaged in the new water law (May 2010) will be prepared in the following years.
In Romania, monitoring has been established and functions in accordance with the WFD. The Iron Gates are covered by the Jiu Water Quality Monitoring System, which includes surveil-lance and operational monitoring. Wastewater discharges and water abstractions are also monitored.
Concentration of heavy metals in the sediments of Iron Gate I Reservoir (Serbia), based on a specific investigation of heavy metals in sediment cores taken from the reservoir bottom were done in 2009, approximately 50 km upstream of the Iron Gate I Dam (location with the largest deposits)
element
concentration (mg/kg) Sediment quality criteria, icpDR (mg/kg)
Range average quality target Basic LevelIron 17 606.7 – 42 350.4 29 205.0Manganese 523.4 - 1124.6 866.3Zinc 129.4 - 823.8 291.2 200 130Copper 15.7 - 118.6 51.8 60 35Chromium 27.7 - 120.9 82.1 100 10-50Lead 19.4 - 126.1 56.6 100 25Cadmium 0.69 - 4.03 1.68 1.2 0.25Arsenic 0.0 - 15.5 7.1 20 10Nickel 34.3 - 140.8 74.7 50 10Mercury 0.0 - 1.0 0.25 0.80 0.2
19 Based on information from Romania and from Serbia. 20 Romania, being a recent EU member country, was given a transition period for its implementation; the final date for the compliance with the Directive for
agglomerations of less than 10,000 p.e. is 31 December 2018.
178 | part IV
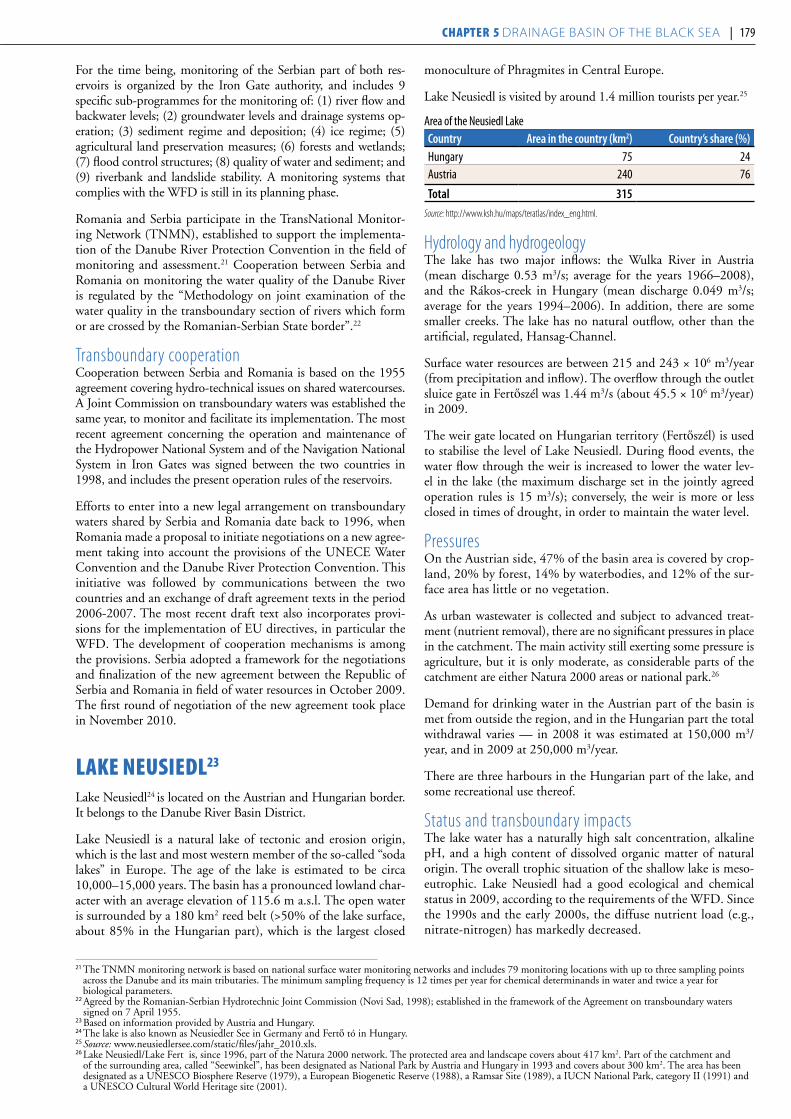
For the time being, monitoring of the Serbian part of both res-ervoirs is organized by the Iron Gate authority, and includes 9 specific sub-programmes for the monitoring of: (1) river flow and backwater levels; (2) groundwater levels and drainage systems op-eration; (3) sediment regime and deposition; (4) ice regime; (5) agricultural land preservation measures; (6) forests and wetlands; (7) flood control structures; (8) quality of water and sediment; and (9) riverbank and landslide stability. A monitoring systems that complies with the WFD is still in its planning phase.
Romania and Serbia participate in the TransNational Monitor-ing Network (TNMN), established to support the implementa-tion of the Danube River Protection Convention in the field of monitoring and assessment.21 Cooperation between Serbia and Romania on monitoring the water quality of the Danube River is regulated by the “Methodology on joint examination of the water quality in the transboundary section of rivers which form or are crossed by the Romanian-Serbian State border”.22
Transboundary cooperationCooperation between Serbia and Romania is based on the 1955 agreement covering hydro-technical issues on shared watercourses. A Joint Commission on transboundary waters was established the same year, to monitor and facilitate its implementation. The most recent agreement concerning the operation and maintenance of the Hydropower National System and of the Navigation National System in Iron Gates was signed between the two countries in 1998, and includes the present operation rules of the reservoirs.
Efforts to enter into a new legal arrangement on transboundary waters shared by Serbia and Romania date back to 1996, when Romania made a proposal to initiate negotiations on a new agree-ment taking into account the provisions of the UNECE Water Convention and the Danube River Protection Convention. This initiative was followed by communications between the two countries and an exchange of draft agreement texts in the period 2006-2007. The most recent draft text also incorporates provi-sions for the implementation of EU directives, in particular the WFD. The development of cooperation mechanisms is among the provisions. Serbia adopted a framework for the negotiations and finalization of the new agreement between the Republic of Serbia and Romania in field of water resources in October 2009. The first round of negotiation of the new agreement took place in November 2010.
lake neusIedl23
Lake Neusiedl24 is located on the Austrian and Hungarian border. It belongs to the Danube River Basin District.
Lake Neusiedl is a natural lake of tectonic and erosion origin, which is the last and most western member of the so-called “soda lakes” in Europe. The age of the lake is estimated to be circa 10,000–15,000 years. The basin has a pronounced lowland char-acter with an average elevation of 115.6 m a.s.l. The open water is surrounded by a 180 km2 reed belt (>50% of the lake surface, about 85% in the Hungarian part), which is the largest closed
monoculture of Phragmites in Central Europe.
Lake Neusiedl is visited by around 1.4 million tourists per year.25
Area of the Neusiedl Lakecountry area in the country (km2) country’s share (%)Hungary 75 24Austria 240 76
Total 315Source: http://www.ksh.hu/maps/teratlas/index_eng.html.
Hydrology and hydrogeologyThe lake has two major inflows: the Wulka River in Austria (mean discharge 0.53 m3/s; average for the years 1966–2008), and the Rákos-creek in Hungary (mean discharge 0.049 m3/s; average for the years 1994–2006). In addition, there are some smaller creeks. The lake has no natural outflow, other than the artificial, regulated, Hansag-Channel.
Surface water resources are between 215 and 243 × 106 m3/year (from precipitation and inflow). The overflow through the outlet sluice gate in Fertőszél was 1.44 m3/s (about 45.5 × 10⁶ m3/year) in 2009.
The weir gate located on Hungarian territory (Fertőszél) is used to stabilise the level of Lake Neusiedl. During flood events, the water flow through the weir is increased to lower the water lev-el in the lake (the maximum discharge set in the jointly agreed operation rules is 15 m3/s); conversely, the weir is more or less closed in times of drought, in order to maintain the water level.
PressuresOn the Austrian side, 47% of the basin area is covered by crop-land, 20% by forest, 14% by waterbodies, and 12% of the sur-face area has little or no vegetation.
As urban wastewater is collected and subject to advanced treat-ment (nutrient removal), there are no significant pressures in place in the catchment. The main activity still exerting some pressure is agriculture, but it is only moderate, as considerable parts of the catchment are either Natura 2000 areas or national park.26
Demand for drinking water in the Austrian part of the basin is met from outside the region, and in the Hungarian part the total withdrawal varies — in 2008 it was estimated at 150,000 m3/year, and in 2009 at 250,000 m3/year.
There are three harbours in the Hungarian part of the lake, and some recreational use thereof.
Status and transboundary impacts The lake water has a naturally high salt concentration, alkaline pH, and a high content of dissolved organic matter of natural origin. The overall trophic situation of the shallow lake is meso-eutrophic. Lake Neusiedl had a good ecological and chemical status in 2009, according to the requirements of the WFD. Since the 1990s and the early 2000s, the diffuse nutrient load (e.g., nitrate-nitrogen) has markedly decreased.
21 The TNMN monitoring network is based on national surface water monitoring networks and includes 79 monitoring locations with up to three sampling points across the Danube and its main tributaries. The minimum sampling frequency is 12 times per year for chemical determinands in water and twice a year for biological parameters.
22 Agreed by the Romanian-Serbian Hydrotechnic Joint Commission (Novi Sad, 1998); established in the framework of the Agreement on transboundary waters signed on 7 April 1955.
23 Based on information provided by Austria and Hungary.24 The lake is also known as Neusiedler See in Germany and Fertő tó in Hungary. 25 Source: www.neusiedlersee.com/static/files/jahr_2010.xls.26 Lake Neusiedl/Lake Fertő is, since 1996, part of the Natura 2000 network. The protected area and landscape covers about 417 km2. Part of the catchment and
of the surrounding area, called “Seewinkel”, has been designated as National Park by Austria and Hungary in 1993 and covers about 300 km2. The area has been designated as a UNESCO Biosphere Reserve (1979), a European Biogenetic Reserve (1988), a Ramsar Site (1989), a IUCN National Park, category II (1991) and a UNESCO Cultural World Heritage site (2001).
178 | part IV Chapter 5 Drainage basin of the black sea | 179
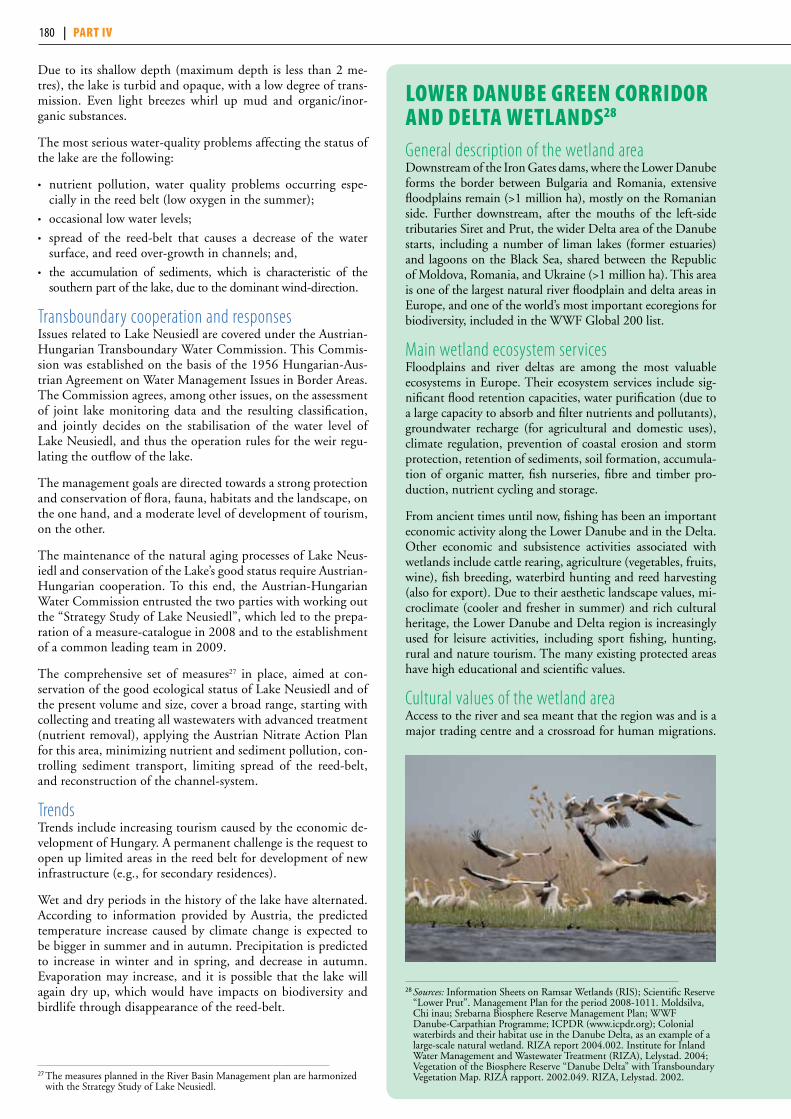
Due to its shallow depth (maximum depth is less than 2 me-tres), the lake is turbid and opaque, with a low degree of trans-mission. Even light breezes whirl up mud and organic/inor-ganic substances.
The most serious water-quality problems affecting the status of the lake are the following:
• nutrient pollution, water quality problems occurring espe-cially in the reed belt (low oxygen in the summer);
• occasional low water levels;
• spread of the reed-belt that causes a decrease of the water surface, and reed over-growth in channels; and,
• the accumulation of sediments, which is characteristic of the southern part of the lake, due to the dominant wind-direction.
Transboundary cooperation and responses Issues related to Lake Neusiedl are covered under the Austrian-Hungarian Transboundary Water Commission. This Commis-sion was established on the basis of the 1956 Hungarian-Aus-trian Agreement on Water Management Issues in Border Areas. The Commission agrees, among other issues, on the assessment of joint lake monitoring data and the resulting classification, and jointly decides on the stabilisation of the water level of Lake Neusiedl, and thus the operation rules for the weir regu-lating the outflow of the lake.
The management goals are directed towards a strong protection and conservation of flora, fauna, habitats and the landscape, on the one hand, and a moderate level of development of tourism, on the other.
The maintenance of the natural aging processes of Lake Neus-iedl and conservation of the Lake’s good status require Austrian-Hungarian cooperation. To this end, the Austrian-Hungarian Water Commission entrusted the two parties with working out the “Strategy Study of Lake Neusiedl”, which led to the prepa-ration of a measure-catalogue in 2008 and to the establishment of a common leading team in 2009.
The comprehensive set of measures27 in place, aimed at con-servation of the good ecological status of Lake Neusiedl and of the present volume and size, cover a broad range, starting with collecting and treating all wastewaters with advanced treatment (nutrient removal), applying the Austrian Nitrate Action Plan for this area, minimizing nutrient and sediment pollution, con-trolling sediment transport, limiting spread of the reed-belt, and reconstruction of the channel-system.
Trends Trends include increasing tourism caused by the economic de-velopment of Hungary. A permanent challenge is the request to open up limited areas in the reed belt for development of new infrastructure (e.g., for secondary residences).
Wet and dry periods in the history of the lake have alternated. According to information provided by Austria, the predicted temperature increase caused by climate change is expected to be bigger in summer and in autumn. Precipitation is predicted to increase in winter and in spring, and decrease in autumn. Evaporation may increase, and it is possible that the lake will again dry up, which would have impacts on biodiversity and birdlife through disappearance of the reed-belt.
lower danuBe Green CorrIdor and delta wetlands28
General description of the wetland areaDownstream of the Iron Gates dams, where the Lower Danube forms the border between Bulgaria and Romania, extensive floodplains remain (>1 million ha), mostly on the Romanian side. Further downstream, after the mouths of the left-side tributaries Siret and Prut, the wider Delta area of the Danube starts, including a number of liman lakes (former estuaries) and lagoons on the Black Sea, shared between the Republic of Moldova, Romania, and Ukraine (>1 million ha). This area is one of the largest natural river floodplain and delta areas in Europe, and one of the world’s most important ecoregions for biodiversity, included in the WWF Global 200 list.
Main wetland ecosystem servicesFloodplains and river deltas are among the most valuable ecosystems in Europe. Their ecosystem services include sig-nificant flood retention capacities, water purification (due to a large capacity to absorb and filter nutrients and pollutants), groundwater recharge (for agricultural and domestic uses), climate regulation, prevention of coastal erosion and storm protection, retention of sediments, soil formation, accumula-tion of organic matter, fish nurseries, fibre and timber pro-duction, nutrient cycling and storage.
From ancient times until now, fishing has been an important economic activity along the Lower Danube and in the Delta. Other economic and subsistence activities associated with wetlands include cattle rearing, agriculture (vegetables, fruits, wine), fish breeding, waterbird hunting and reed harvesting (also for export). Due to their aesthetic landscape values, mi-croclimate (cooler and fresher in summer) and rich cultural heritage, the Lower Danube and Delta region is increasingly used for leisure activities, including sport fishing, hunting, rural and nature tourism. The many existing protected areas have high educational and scientific values.
Cultural values of the wetland areaAccess to the river and sea meant that the region was and is a major trading centre and a crossroad for human migrations.
27 The measures planned in the River Basin Management plan are harmonized with the Strategy Study of Lake Neusiedl.
28 Sources: Information Sheets on Ramsar Wetlands (RIS); Scientific Reserve “Lower Prut”. Management Plan for the period 2008-1011. Moldsilva, Chiőinau; Srebarna Biosphere Reserve Management Plan; WWF Danube-Carpathian Programme; ICPDR (www.icpdr.org); Colonial waterbirds and their habitat use in the Danube Delta, as an example of a large-scale natural wetland. RIZA report 2004.002. Institute for Inland Water Management and Wastewater Treatment (RIZA), Lelystad. 2004; Vegetation of the Biosphere Reserve “Danube Delta” with Transboundary Vegetation Map. RIZA rapport. 2002.049. RIZA, Lelystad. 2002.
180 | part IV

In particular, in the Danube Delta, many different groups (Or-thodox old-church believers, Muslims, Jews, and others) settled over the centuries and maintained their specific cultures, includ-ing ways of nature management and uses of natural resources. The historical evolution of the settlements and the associated economic activities influenced architectural designs, including fish collecting points, houses and churches. The region harbours important archaeological sites, and a great cultural heritage.
Biodiversity values of the wetland areaWetlands along the Lower Danube and especially in its Delta support a very rich variety of life, including a number of globally threatened species, as well as habitats and species of Europe-wide concern. This area is internationally known for its bird fauna, both in terms of numbers (e.g., several million waterbirds stop over in the delta during their migration; it is also of great importance for breeding, moulting and wintering waterbirds) and of rare species. Noteworthy are, among others, globally im-portant breeding colonies of Pygmy Cormorant and pelicans. In some winters, the Danube delta hosts almost the entire world population of the globally threatened Red-necked Goose. The delta is also important for fish spawning, nursery and migration, including commercially important and threatened species, such as sturgeon.
Pressure factors and transboundary impactsThreats to hydrological flows, habitats, biodiversity, water quality and wetland ecosystem services derive from man-made changes in the area, through the construction of industrial plants, ship-ping canals, large polders, river banks, dikes, locks, and sluices, as well as drainage of wetlands along the entire Danube and its tributaries. Simultaneously with these changes comes a dramatic reduction in the catch of high-value fish, a visible increase in eu-trophication, and increased rates of sedimentation. In particular, industrial pollution, agricultural run-offs and urban wastewater, as well as overfishing and direct destruction of breeding grounds of wetland fauna, are additional pressures.
Building in the floodplain increases the risk of severe impacts of flooding, as it removes water retention capacity, and results in floods with higher intensity and duration downstream. Re-sults of a recent study, financed by the Global Environmental Facility (GEF) and carried out by WWF, showed that over 80% of the Danube River Basin wetlands and floodplains have been destroyed since the turn of the 20th century, which also means a decrease of the ecosystem services provided by these wetlands and floodplains. Most recently, hydro-morphological modifications, made in view of increasing navigation corridors and partly sub-sidized through EU transport policies, are increasingly changing the river ecosystem.
Other notable negative factors include poaching, overgrazing, illegal tree cutting and unsustainable agricultural and forestry practices, including turning natural alluvial forests into plan-tations. Disturbance from recreational activities and visitors is increasing. Further pressures include disturbances from fishery and by-catch of birds and otters, oil extraction and transpor-tation (with the danger of regular and accidental spills), solid waste disposals, invasive exotic species of plants and fishes, high numbers of wild boars, reed-burning, unsustainable collection of medical plants, landslides, and more frequent occurrence of drought periods. Diminishing rural populations is a problem, because traditional practices have become part of the function-ing of the ecosystem, and lively rural areas have an important tourism potential.
Transboundary wetland managementAlong the lower Danube, a mosaic of protected areas exists that includes Ramsar Sites, Biosphere reserves, World Heritage Sites, Natura 2000 sites, National/Nature Parks, and others. Ten Ram-sar Sites are upstream: Ibisha Island (372 ha), Belene Islands Complex (6,898 ha) and Srebarna (1,357 ha; also World Her-itage Site and Biosphere Reserve) in Bulgaria, Small Island of Braila (17,586 ha) in Romania, Lower Prut Lakes (19,152 ha) in the Republic of Moldova, Kartal Lake (500 ha), Kugurlui Lake (6,500 ha) and Sasyk Lake (21,000 ha, with 3,850 ha belonging to the Danube Delta Biosphere Reserve) in Ukraine, included in the Transboundary Biosphere Reserve Danube Delta (647,000 ha, also World Heritage Site) in Romania and Kyliiske Mouth (32,800 ha) in Ukraine.
On 5 June 2000, the Ministers of Environment from Bulgaria, Romania, the Republic of Moldova and Ukraine signed a Dec-laration (deposited with the Ramsar Convention Secretariat) on Cooperation for the Creation of a Lower Danube Green Corri-dor, to take concerted actions, establish new protected areas, and restore natural floodplains. This initiative was triggered by and receives support from WWF. The commitment was to include in the Corridor 773,166 ha of existing protected areas, 160,626 ha of new protected areas, and 223,608 ha of areas to be restored. In 2010, this was exceeded, with over 1.4 million ha now under protection. Different wetland restoration projects have been im-plemented in all four countries, but they have not yet reached their target for the restoration of former wetland areas.
Another agreement was signed on the same day under the aegis of the Council of Europe, for the Creation and Management of a Cross-Border Protected Area between the Republic of Moldova, Romania and Ukraine in the Danube Delta and the Lower River Prut Nature Protected Areas.
In December 2007, the Republic of Moldova, Romania and Ukraine signed the Joint Declaration to work towards a River Basin Management Plan for the Danube Delta supporting Sus-tainable Development in the Region, that provided the three countries with the necessary framework to cooperate for the good ecological status of the Danube delta and to meet the objectives set by the WFD.
Transboundary cooperation exists between the Romanian and Ukrainian parts of the Transboundary Biosphere Reserve and Ramsar Sites, notably in the field of inventories and monitoring (e.g., published inventories of vegetation and colonial waterbirds).
Phot
o by T
obias
Salat
he
180 | part IV Chapter 5 Drainage basin of the black sea | 181

leCh suB-BasIn29
The basin of the Lech, a 254-km long tributary of the Danube, is shared by Austria and Germany, and covers an area of approx-imately 4,125 km. Discharge at the mouth of the river is 115 m3/s (based on the years 1982-2000), discharge in the border section is 44 m3/s (based on the years 1982-2000).
The Austrian part of the catchment area is rather mountainous, and covered mostly by forest and grassland. The impact from human activities is low. The quality of the water is excellent, and the status is at least good in the part that is in Austrian territory.
Between Austria and Germany, issues such as flood protection, hydropower generation, wastewater treatment and status and ecological potential of the river are solved in line with the provi-sions of EU WFD, within the framework of the joint bilateral transboundary commission.
Inn suB-BasIn30
The catchment of the 515-km long Inn, a tributary of the Dan-ube, is shared by Austria, Germany, Italy and Switzerland. The main tributary of the Inn is the Salzach River, which is shared by Austria and Germany.
The total area of the sub-basin is 26,130 km2, of which the Swiss part of the basin covers 2,093, the Austrian part 15,842 and the German part 8,195 km2.
The Swiss part of the catchment is somewhat mountainous, the Austrian part mainly mountainous, while in the German part a minor share of the catchment is mountainous. These moun-tainous areas are characterized by high levels of precipitation (up to 2,000 mm and more), while the fertile, slightly hilly forelands of the Alps receive considerably less precipitation.
Hydrology and hydrogeologyThe Inn is the third largest tributary of the Danube by dis-charge (735 m3/s at the mouth, 1921-1998).
Surface water resources generated in the Swiss part of the Inn sub-basin are estimated at 2.36 km3/year based on measured precipitation for the years 1901 to 2000 and the run-off is es-timated to be 1.84 km3/year. Austria’s purely national run-off (without the inflow from Switzerland) near the border of Aus-tria and Germany at Kirchbichl gauging station is 7.4 km³/year, adding to an overall run off of 9.2 km³/year. A rough ap-proximation of the Inn´s total run-off near the mouth is 23.3 km³/year (including all tributaries from Switzerland, Germany and Austria).
Pressures The mountainous parts of the Inn River sub-basin are char-acterized by forests, grassland and land without or with little vegetation cover. Recreation and tourism (intensive but well-managed) is widespread. Settlements, commercial activities, and traffic routes are situated in the narrow valleys and small catchments within the Alps. This infrastructure has to be pro-tected against natural hazards such as floods, torrents and ava-lanches, which have resulted in hydromorphological changes of the river and its banks.
The forelands of the Alps are characterized by considerably more anthropogenic activities, a considerably higher density of popula-tion, and significantly intensive agriculture.
Nevertheless, anthropogenic pressures potentially affecting wa-ter quality are low, mostly local and moderate in importance, as wastewater is treated in line with stringent national provisions (fully in line with the provisions for nutrient sensitive areas of the UWWTD for Austria and Germany) and the treated wastewater is diluted further by the abundance of water in these parts of the sub-basin.
The abundance of water and the steep slopes in the Inn River sub-basin also provide perfect preconditions for the generation of hydropower, but result also in erosion, accumulation of sedi-ments, and suspended sediments in river water and mud flows, which also create local but severe pressures.
The infrastructure in place has to be protected against natural hazards such as floods, torrents and avalanches; this need for protection – together with the pressures inherent to hydropower generation – has resulted in considerable hydromorphological changes of the river and its banks. These pressures are of more local nature in the Swiss share of the sub-basin, and more wide-spread in the Austrian and German share of the Inn River sub-basin as there is a chain of hydropower plants on the Lower Inn.
Responses Transboundary river commissions have been in place for quite some time so as to coordinate, on a bilateral basis, all issues of relevance of water management.
Considerable efforts were taken to remediate impacts on water quality. As a result all urban wastewater is treated in line with stringent national and stringent EU legislation. As a conse-quence, BOD and ammonium levels in the Inn are rather low and have still a slight decreasing tendency according to the Trans National Monitoring Network (TNMN) in the Danube River Basin. Switzerland reports, however, that trace concentrations of synthetic organic compounds (from wastewaters) are increasingly detected in surface waters.
Challenges which are being tackled are the restoration of river continuity to allow for appropriate migration by fish, and the improvement of hydromorphology. Wherever and whenever feasible, more room is given to the river, providing protection against natural hazards and enhancing nature, nature protection and biodiversity.31
A protected Ramsar Site, Vadret da Roseg, and two parks of na-tional importance, the Swiss National Park and the Biosfera Val Müstair, are located on the Swiss side of the sub-basin. The wa-ter reservoirs along the Austrian-German border for hydropower generation on the Lower Inn and Salzach are protected Ramsar Sites.
The programme of measures in line with the WFD is well-coor-dinated in the shared parts of the Inn and its tributaries, within the frame of the joint transboundray water commission of Aus-tria and Germany.
TrendsAs described in more detail in the assessment of the Rhone, the predicted variability and decrease in the amount of precipitation,
29 Based on information provided by Austria and on the First Assessment.30 Based on information provided by Switzerland and Austria, and on the First Assessment.31 For information on the response measures taken in Switzerland to address the hydromorphological pressures, please refer to the attachment on the Rhone.
182 | part IV
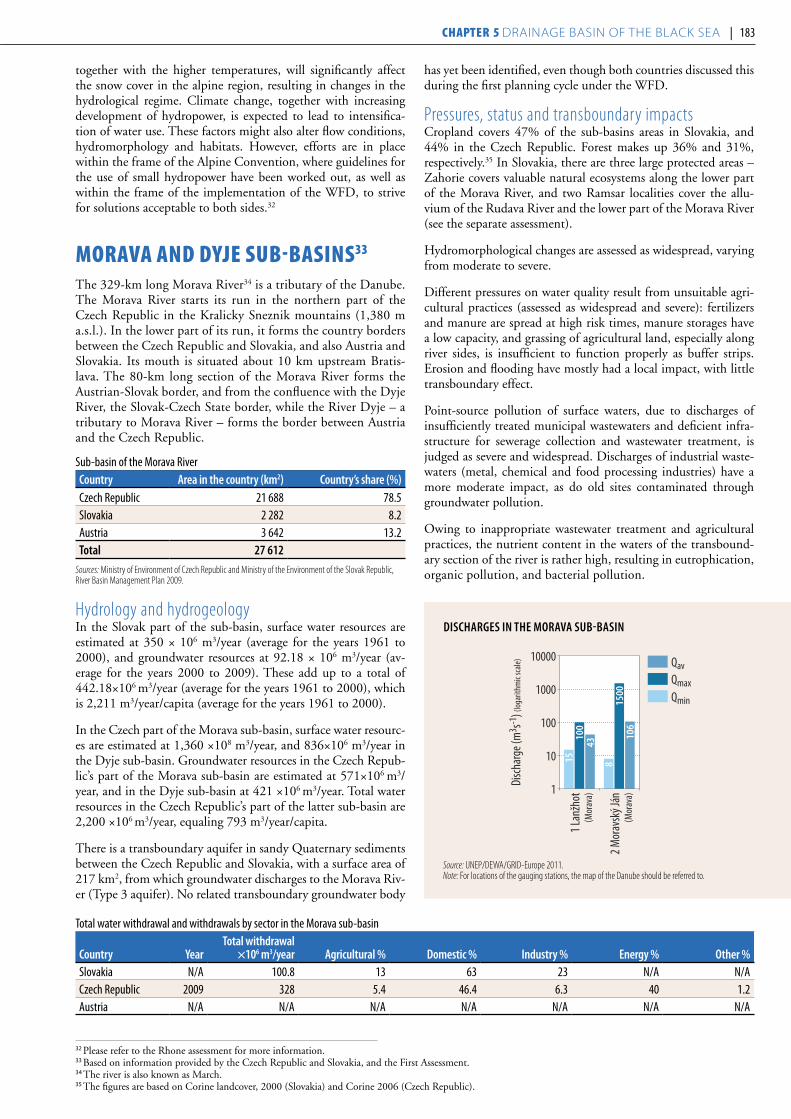
together with the higher temperatures, will significantly affect the snow cover in the alpine region, resulting in changes in the hydrological regime. Climate change, together with increasing development of hydropower, is expected to lead to intensifica-tion of water use. These factors might also alter flow conditions, hydromorphology and habitats. However, efforts are in place within the frame of the Alpine Convention, where guidelines for the use of small hydropower have been worked out, as well as within the frame of the implementation of the WFD, to strive for solutions acceptable to both sides.32
MoraVa and dyje suB-BasIns33
The 329-km long Morava River34 is a tributary of the Danube. The Morava River starts its run in the northern part of the Czech Republic in the Kralicky Sneznik mountains (1,380 m a.s.l.). In the lower part of its run, it forms the country borders between the Czech Republic and Slovakia, and also Austria and Slovakia. Its mouth is situated about 10 km upstream Bratis-lava. The 80-km long section of the Morava River forms the Austrian-Slovak border, and from the confluence with the Dyje River, the Slovak-Czech State border, while the River Dyje – a tributary to Morava River – forms the border between Austria and the Czech Republic.
Sub-basin of the Morava Rivercountry area in the country (km2) country’s share (%)Czech Republic 21 688 78.5Slovakia 2 282 8.2Austria 3 642 13.2Total 27 612
Sources: Ministry of Environment of Czech Republic and Ministry of the Environment of the Slovak Republic, River Basin Management Plan 2009.
Hydrology and hydrogeologyIn the Slovak part of the sub-basin, surface water resources are estimated at 350 × 106 m3/year (average for the years 1961 to 2000), and groundwater resources at 92.18 × 10⁶ m3/year (av-erage for the years 2000 to 2009). These add up to a total of 442.18×10⁶ m3/year (average for the years 1961 to 2000), which is 2,211 m3/year/capita (average for the years 1961 to 2000).
In the Czech part of the Morava sub-basin, surface water resourc-es are estimated at 1,360 ×108 m3/year, and 836×106 m3/year in the Dyje sub-basin. Groundwater resources in the Czech Repub-lic’s part of the Morava sub-basin are estimated at 571×106 m3/year, and in the Dyje sub-basin at 421 ×106 m3/year. Total water resources in the Czech Republic’s part of the latter sub-basin are 2,200 ×106 m3/year, equaling 793 m3/year/capita.
There is a transboundary aquifer in sandy Quaternary sediments between the Czech Republic and Slovakia, with a surface area of 217 km2, from which groundwater discharges to the Morava Riv-er (Type 3 aquifer). No related transboundary groundwater body
has yet been identified, even though both countries discussed this during the first planning cycle under the WFD.
Pressures, status and transboundary impactsCropland covers 47% of the sub-basins areas in Slovakia, and 44% in the Czech Republic. Forest makes up 36% and 31%, respectively.35 In Slovakia, there are three large protected areas – Zahorie covers valuable natural ecosystems along the lower part of the Morava River, and two Ramsar localities cover the allu-vium of the Rudava River and the lower part of the Morava River (see the separate assessment).
Hydromorphological changes are assessed as widespread, varying from moderate to severe.
Different pressures on water quality result from unsuitable agri-cultural practices (assessed as widespread and severe): fertilizers and manure are spread at high risk times, manure storages have a low capacity, and grassing of agricultural land, especially along river sides, is insufficient to function properly as buffer strips. Erosion and flooding have mostly had a local impact, with little transboundary effect.
Point-source pollution of surface waters, due to discharges of insufficiently treated municipal wastewaters and deficient infra-structure for sewerage collection and wastewater treatment, is judged as severe and widespread. Discharges of industrial waste-waters (metal, chemical and food processing industries) have a more moderate impact, as do old sites contaminated through groundwater pollution.
Owing to inappropriate wastewater treatment and agricultural practices, the nutrient content in the waters of the transbound-ary section of the river is rather high, resulting in eutrophication, organic pollution, and bacterial pollution.
32 Please refer to the Rhone assessment for more information. 33 Based on information provided by the Czech Republic and Slovakia, and the First Assessment.34 The river is also known as March. 35 The figures are based on Corine landcover, 2000 (Slovakia) and Corine 2006 (Czech Republic).
Total water withdrawal and withdrawals by sector in the Morava sub-basin
country yearTotal withdrawal
×106 m3/year agricultural % Domestic % industry % energy % other %Slovakia N/A 100.8 13 63 23 N/A N/ACzech Republic 2009 328 5.4 46.4 6.3 40 1.2Austria N/A N/A N/A N/A N/A N/A N/A
DiSchaRgeS in The MoRava SuB-BaSin2 M
orav
ský J
án
1 Lan
žhot
Disc
harg
e (m
3 s-1) (
loga
rithm
ic sc
ale)
1500
8
106
100
43(M
orav
a)
(Mor
ava)1
10
100
1000
10000
15
QavQmaxQmin
Source: UNEP/DEWA/GRID-Europe 2011.Note: For locations of the gauging stations, the map of the Danube should be referred to.
182 | part IV Chapter 5 Drainage basin of the black sea | 183

The status of the main course of the Morava in the border sec-tion in the Czech Republic was classified as “polluted water” (class III in the Czech national system) in 2007-2008, which is a clear improvement from the situation in 1991-1992 when the same stretch was classified as “heavily polluted” or “very heavily polluted water” (classes IV and V, respectively).
The Morava basin is characterized by rather intensive agricul-ture in the Austrian part, and by widespread protection of in-frastructure against floods, which has resulted in hydromorpho-logical changes of the river and its banks.
Anthropogenic pressures potentially affecting water quality from point sources are low in Austria, and mostly local and moderate in importance, as wastewater is treated in line with stringent national provisions.
According to the WFD, the Austrian and Slovakian joint assess-ments of the Morava, as well as the Austrian and Czech joint assessments of the Dyje, have determined a good chemical and a moderate ecological status of the river in 2010.
Responses The Czech Republic reports mainly legislative and technical measures that have been taken. As a concrete example, some old contaminated sites have been clean, so as to reduce groundwater pollution. Charges for groundwater abstraction have also been increased. On good agricultural practices, the Czech Ministry of Agriculture has, since 2009, a programme for reconstructing irrigation systems and building more efficient ones.
The Czech Republic and Austria have a bilateral Commission for Transboundary Waters, wherein issues related to the Morava are dealt with, and Austria and Slovakia have a bilateral Com-mission for Transboundary Waters to also deal with theses is-sues; the focus is on water quantity, quality, and WFD issues.
The agreement between the Czech Republic and Slovakia on transboundary waters (in force since 1999) provides the frame-work for cooperation. The Czech-Slovak Commission for Trans-boundary Waters functions on this basis, with three joint work-ing groups focusing on water quantity, quality and WFD issues.
Multilateral cooperation is carried out in the framework of the International Commission for the Protection of the Danube River (ICPDR). For instance, the Morava and the Dyje are cov-ered by the Trans-National Monitoring Network in the Danube River Basin.
Recently-agreed transboundary actions include joint measure-ments, data harmonisation, exchange of data and experience, as well as joint projects. Focused monitoring programmes with concrete objectives are approved by the Czech – Slovak and Czech – Austrian commissions. Among the main objectives of bilateral cooperation on transboundary water is the harmonized implementation of the WFD.
The Morava and the Dyje are covered by the CEframe (Central European Flood Risk Assessment and Management in Central Europe) initiative (to 2013) — triggered by knowledge gaps revealed by the flooding in 2006, with bilateral water commis-sions taking the first contacts — to improve flood management, with institutions from Austria, the Czech Republic, Hungary and Slovakia.
The trilateral expert conference of Austria, the Czech Republic and Slovakia on measures of transboundary meaning referring to the Morava and the Dyje deals with hydrographic and hy-dromorphologic issues, as well as with the use of the waterways by tourist boats.
Trends No significant changes in water withdrawal are expected in Slo-vakia by the year 2015 in comparison with the current situ-ation. By 2015, in the Czech part of the Morava sub-basin and the Dyje sub-basin, withdrawal for energy may increase the most (up to 5%), industrial withdrawal may even decrease slightly (down to 5%), and agricultural and domestic with-drawal increase by 2% at most.
New areas where the legislative base requires strengthening in-dicated by the Czech Republic include the use of hydrothermal energy/heat pumps, and dealing with drought situations. Re-strictions could be better employed in legal provisions related to agricultural production.
36 Source: Information Sheets on Ramsar Wetlands (RIS).37 The river is also known as the Thaya.
floodplaIns of MoraVa-dyje-danuBe ConfluenCe36
General description of the wetland areaThe trilateral Ramsar Site Floodplains of the Morava-Dyje-Danube Confluence is situated on the Danube River between Vienna and Bratislava, and extends further north of the Dan-ube, starting from the Danube-Morava confluence in Devín, and continuing alongside the Morava and Dyje Rivers. The 80-km long section of the Morava River forms the Austrian-Slovak border, and from the confluence with Dyje River37 forms the Slovak-Czech State border, while the River Dyje — a tribu-tary to the Morava River — forms the State border between Austria and the Czech Republic. In the Czech Republic, the site continues northwest of the town of Břeclav into the Czech territory, alongside the Dyje River, also encompassing part of the Novomlýnské nádrže water reservoirs. The transboundary Ramsar Site comprises of the three national Ramsar Sites: Do-nau-March-Thaya-Auen (Austria): 36,090 ha, Mokřady dol-ního Podyjí (Czech Republic): 11,525 ha and Moravské luhy (Slovakia): 5380 ha (total area 52,995 ha).
The site consists of fluvial plain formed by alluvial sediments, fluvo-eolic hilly plain and dune hilly plain on sediments of fluvial terraces and blown sands. Though large areas of former floodplain meadows were ploughed in order to increase the area of arable land, 3,450 ha of alluvial meadows in total were preserved until the present, most of them located in Slovakia. Around 45% (app. 24,000 ha) of the site’s total area is covered by forests. The elevation varies from 130 – 180 m a.s.l. The climate is warm to moderate with mild winters; precipitation can vary widely annually.
Main Wetland Ecosystem ServicesThe site represents the largest natural complex of floodplain meadows in Central Europe, and as such provides food, cover, resting and breeding opportunities for many species. Addi-tionally, its hydrological importance is very high. Despite the intensive water engineering works, in large areas the natural flood and groundwater dynamics have remained. The site rep-
184 | part IV

resents an important groundwater source used for drinking water supply and irrigation in all three countries. It has also an important water retention and flood protection function, and is regularly flooded in spring/summer during the snow melting period. The Danube River is also used for navigation purposes, while on the Morava and Dyje rivers only recrea-tional boating is allowed from June to December. The most important economic uses of the area are forestry (timber pro-duction), agriculture and tourism.
Cultural values of the wetland areaThe floodplains of the Morava and Dyje rivers were first in-habited in the Mesolithic period (8,000 – 6,000 B.C.). The warm climate and fertile soil induced the continuous settle-ment of the area. The evolution of the floodplain ecosystem was significantly influenced by people of the Hallstatt culture (700 – 400 B.C.). The Celts and the Romans also inhabited the area, followed by Slavic and German tribes. Thus, the area is extremely rich in archaeological monuments and artefacts.
The highlight of the site is surely the Schloss Hof, which extends over more than 50 ha, situated directly nearby the Morava River encompassing Baroque Palace, the Manor farm and vast Terraced Garden.
Today, the Stork Festival takes place in June in the town of Marchegg which hosts one of the largest White Stork colonies in Europe.
Biodiversity values of the wetland areaThe Floodplains of Morava-Dyje-Danube Confluence rep-resent a diverse complex of wetlands — river channels, ox-bow lakes, seasonal pools, alluvial meadows, sedge marshes and reed beds, floodplain forests, etc., including 16 habitat types of European importance. As such, it hosts the largest complex of species-rich alluvial meadows, and also the largest floodplain forest systems in Central Europe. The site provides habitat for almost 800 species of vascular plants, 275 species
of birds, 55 fish species, 300 species of beetles and numerous groups of other invertebrates. Altogether 42 species of Euro-pean importance are present including: beetles, dragonflies, molluscs, and fish, which latter include especially abundant European Bitterling, rare streber, and extremely rare ziege or Sabre Carp. Furthermore, amphibians, reptiles and mammals such as prosperous populations of beaver inhabit the site. Bats connected to wetland and water habitats are also present, and raptors such as eagles, Black Kite, or Saker Falcon regularly breed at the site. It is also an important winter roosting place for many birds, especially geese.
Pressure factors and transboundary impactsRiver regulation and engineering works have had the most significant impact on the site, with the first regulation works dating back to between 1882 to 1900, straightening and shortening the rivers as well as reducing their floodplain areas. The construction of the Nové Mlýny reservoirs on the Dyje River (1976–1989), intended to provide flood retention and a possibility to enhance low flow during droughts, changed the character of the river below the reservoir, and, besides other changes, reduced spring floods of the neighbouring flood-plain. The most negative impact of river regulation works is nowadays the dredging of the riverbed, causing disconnection of the river-floodplain system, decrease of the water table, and potentially threatening groundwater sources. Additionally, the site suffers from intensified agricultural production in some parts, while in other parts former agricultural fields are now being abandoned. Transport development also poses threats to the site; this includes plans for navigability improvement and water engineering on the Danube and the so-called Danube-Odra-Elbe Canal. There are several road construction projects planned to cross the site in different locations, which could lead to habitat fragmentation.
Transboundary wetland managementSince 1994, the environmental NGOs DAPHNE (SK), Dis-telverein (AT), Veronica (CZ) and WWF have worked to-gether with the goal of supporting the trilateral region along the Morava and Dyje rivers through awareness raising, envi-ronmental policy and conservation management of the site. They have implemented a number of joint projects, facilitated cross-border networking, and finally contributed substantially to constituting the Memorandum of Understanding on the Morava-Dyje Floodplains, signed by the national Ramsar au-thorities of Austria, the Czech Republic and Slovakia in August 2001 on the basis of which the Trilateral Ramsar Platform was established. It consists of the representatives of environmental ministries, nature conservation authorities, Ramsar site and river basin managers and NGOs. As a first step forward, the common goals and principles for the transboundary site man-agement were agreed in 2003 – 2004, and the trilateral Ram-sar site Floodplains of the Morava-Dyje-Danube Confluence was designated in 2007. The joint effort is now focusing espe-cially on the preparation of a common management strategy for the Trilateral Ramsar Site, and the development of a joint information system to make decision-making more efficient. Besides having been designated as a trilateral Ramsar Site, the major parts of the area were designated as Special Protection Areas under the EU Birds Directive 79/409/EEC, and also as proposed Sites of Community Interest under the Habitats Directive 92/43/EC.
184 | part IV Chapter 5 Drainage basin of the black sea | 185

raaB/ráBa suB-BasIn38
The sub-basin of the 311-km long Raab/Rába is shared by Austria and Hungary. The river has its source in the Fischbacher Alps in Austria, and discharges into the Moson-Danube at Győr. The ba-sin has a typical mountain and hilly character, with a few lowland parts. The average altitude is around 210 m a.s.l. in Hungary; in the Austrian part the elevation ranges from 228 to 1,750 m a.s.l.
Major transboundary tributaries include the Lapincs/Lafnitz, Pinka/Pinka, Gyöngyös/Güns, Strem/Strembach, Repce/Rab-nitz; all of them originating from Austria.
Sub-basin of the Raab/Rába Rivercountry area in the country (km2) country’s share (%)Hungary 6 847 56Austria 4 480a 44
Total 10 113a The surface areas of the sub-basins in Austria: Raab 1,009 km2; Lafnitz 1,990 km2; Pinka 742 km2; Strem 428
km2; Güns 260 km2; others 51 km2.Source: Federal Ministry of Agriculture, Forestry, Environment and Water Resources, 2011.
Hydrology and hydrogeology39
At the Sárvár gauging station in Hungary, surface water resources are estimated at 1.12 km3/year (the long-term average discharge is 35.6 m3/s, based on observations from 1956 to 1992), out of which 0.82 km3/year come from Austria upstream and 0.13 km3/year originates from Hungary. At the Neumarkt gauging station in Austria, surface water resources generated in Austria are esti-mated to be 0.21 km3/year (average for 1976-200840).
Groundwater resources in Hungary are estimated to be 128 km3/year. Groundwater inflow from outside the Hungarian border is small, estimated at 1.3 – 1.9 km3/year (1–1.5 %).
In total, water resources in the Hungarian part of the sub-basin are estimated to be 1.25 km3/year, which equals 5,710 m3/year/capita.
The long-term average discharges of the transboundary tribu-taries of the Raab are as follows: Pinka 3.4 m3/s (at Felsőcsatár,
Hungary); Strem 1.46 m3/s (at Heiligenbrunn, Austria); Güns 1.57 m3/s (at Kőszeg, Hungary); Lafnitz 13.8 m3/s (Eltendorf, Austria — near the border with Hungary); and Rabnitz 0.89 m3/s (at Rabnitz, Austria).41
Up to 2,000 m thick Pannonian sediments overlie the predom-inantly Palaeozoic crystalline basement formation; the lower part has low hydraulic conductivity, the upper part (0-1,500 m) has good hydraulic conductivity, storing thermal water and supplying drinking water. Above the Upper-Pannonian lies a Pleistocene sand-gravel aquifer (on average 10 m thick), which has strong links with surface waters (see the tables of aquifers/groundwater bodies for details). The transboundary groundwa-ters in this sub-basin are presented as individual groundwater bodies or aquifers from either the Austrian or the Hungarian side. Small groundwaters are summarized in Austria as groups of groundwater bodies.
Total water withdrawal and withdrawals by sector the Raab/Rába sub basin
countryTotal withdrawal
×106 m3/year agricultural % Domestic % industry % energy % other%Hungary, surface water 0.38 99.86 0.04 0.02 0 0.08Hungary, surface water 11.66 0.78 90.92 8.22 0 0.08
38 Based on the information given by Austria and Hungary. 39 The sources of the information concerning aquifers and groundwater bodies in Austria are the following: 1) Austrian Federal Agency for Environment; and 2) Report Inven-
tory under Article 3 and 5 of the WFD, Danube River Basin. Planning Area Leitha, Raab and Rabnitz, Work Package “Location and Boundaries of Groundwater”. 2005. 40 Source: Hydrographical yearbook 2008. Federal Ministry of Agriculture, Forestry, Environment and Water Resources, Unit VII 3, vol. 116, 2010.41 Source: Hydrographical yearbook 2008. Federal Ministry of Agriculture, Forestry, Environment and Water Resources, Unit VII 3, vol. 116, 2010.
DiSchaRgeS in The RaaB/RáBa SuB-BaSin
4 Sze
ntgo
tthar
d
3 Neu
mar
kt
Disc
harg
e (m
3 s-1) (
loga
rithm
ic sc
ale)
900
9
25
120
7(R
aab)
(Raa
b)
1
10
100
1000
10000
2
QavQmaxQmin
Sources: UNEP/DEWA/GRID-Europe 2011; Hydrographical yearbook 2008. Federal Ministry of Agriculture, Forestry, Environment and Water Resources. 2010 (for Neumarkt gauging station).Note: For locations of the gauging stations, the map of the Danube should be referred to.
RaBa ShaLLoW aquiFeR (no. 60)
hungarya austriab
Type 5; Aleurite, clay, sand, gravel; Pleistocene, dominant groundwater flow from west to east; strong links with surface water. Area (km2) 1 650 N/AThickness: mean, max (m) 10, 20 N/AGroundwater uses and functions For drinking water, agricultural sector (including irrigation). N/AOther information Agriculture exerts pressure on water quality; This
Pleistocene aquifer overlying the Upper Pannonian sustains river flow during dry periods.
N/A
a This aquifer is part of a boundary groundwater body in Hungary. b Due to limited information, it was not possible to link this aquifer to a corresponding aquifer in Austria.
186 | part IV

Transboundary groundwaters shared by Austria and Hungary in the Raab/Raba Basin.42 The aquifers or groundwater bodies are commonly only a few metres thick, up to about 10 m. The thickness of Günstal aquifer and groundwater bodies of the Günser Gebirge Umland group reaches some 30 m, and Rabnitzeinzugsgebiet 165 m. Groundwater is mainly used for drinking water and for the agricultural sector (including irrigation). For all the groundwaters, exept Günstal for which it has not been specified, the dominant groundwater flow direction is from Austria to Hungary.
name and numberaquifer/
groundwater bodygroundwater
characteristicsnational
identification code(s) Surface area (km2)
pressure factorsRaabtal (No. 63) aquifer Mainly porous, with
more local and limited porous-, fissured- or
karst groundwater
PG13310, GWK100131 114 Industry, existing waste deposits, agriculture and
forestry; agricultural land use 94% of the area
Lafnitztal (No. 64) aquifer Mainly porous, with more local and limited
porous-, fissured- or karst groundwater
PG13350, GWK100129 96 Artificial recharge of groundwater, waste
dumps and agriculture; agricultural land use 92%
Pinkatal (No. 65) aquifer Mainly porous, with more local and limited
porous-, fissured- or karst groundwater
PG13321, GWK100130 44 Waste dumps and agriculture, agricultural
land use 90%
Pinkatal 2 (No. 66) aquifer Mainly porous, with more local and limited
porous-, fissured- or karst groundwater
PG13322, GWK100130 40 Waste dumps and agriculture, agricultural
land use 90%
Stremtal (No. 67) aquifer Mainly porous, with more local and limited
porous-, fissured- or karst groundwater
PG13340, GWK100136 50 Old landfills and agriculture; agricultural
land use 90%.
Rabnitztal (No. 68) aquifer Mainly porous, with more local and limited
porous-, fissured- or karst groundwater
PG13260, GWK100132 40 Agricultural land use 94%.
Hügelland Raab West (No. 69)
Group of groundwater bodies
Predominantly porous 100187 1 352 Agriculture and forestry and existing waste
deposits; agricultural land use 56%.
Hügelland Raab Ost (No. 70)
Group of groundwater bodies
Predominantly porous 100181 1 079 Pressures from agriculture and forestry and existing
waste deposits and dumps; agricultural
land use 53%.Günstal (No. 71) aquifer porous GWK 100127 14 Agricultural land
use 66%.
42 The information here refers only to the Austrian part of these aquifers/groundwater bodies, as there was no information available on the territory of Hungary. Sources: 1) Austrian Federal Agency for Environment; and 2) Report Inventory under Article 3 and 5 of the WFD, Danube River Basin. Planning Area Leitha, Raab and Rabnitz, Work Package “Location and Boundaries of Groundwater”. 2005.
RaBa poRouS coLD anD TheRMaL aquiFeR (no. 61)
hungarya austriab
Type 5; Aleurite, clay, sand; Upper-Pannonian; dominant groundwater flow from west to east; weak links with surface water.Area (km2) 1 650 N/AThickness: mean; max. (m) 800; 1 500 N/AGroundwater uses and functions For drinking water, agricultural sector (irrigation included). N/AOther information Upper-Pannonian down to the depth of 1 500 m)
has got good hydraulic conductivity. The lower part of Upper-Pannonian stores thermal water and the
upper 250 m is used to supply drinking water.
N/A
a This aquifer is part of a boundary groundwater body in Hungary.b Due to the limited information, It was not possible to link this aquifer to a corresponding aquifer in Austria.
RaBa KŐSZeg MounTain FRacTuReD aquiFeR (no. 62)
hungarya austriab
Type 5; Phyllite (carbonate-bearing), Jurassic to Cretaceous, fracture aquifer; dominant groundwater flow from north-west to south-east; weak links with surface water.Area (km2) 52 N/AThickness: mean, max. (m) >100, - N/AGroundwater uses and functions For drinking water, agricultural sector
(irrigation included).N/A
a This aquifer is part of a boundary groundwater body in Hungary.b Due to limited information, it was not possible to link this aquifer to a corresponding aquifer in Austria.
186 | part IV Chapter 5 Drainage basin of the black sea | 187
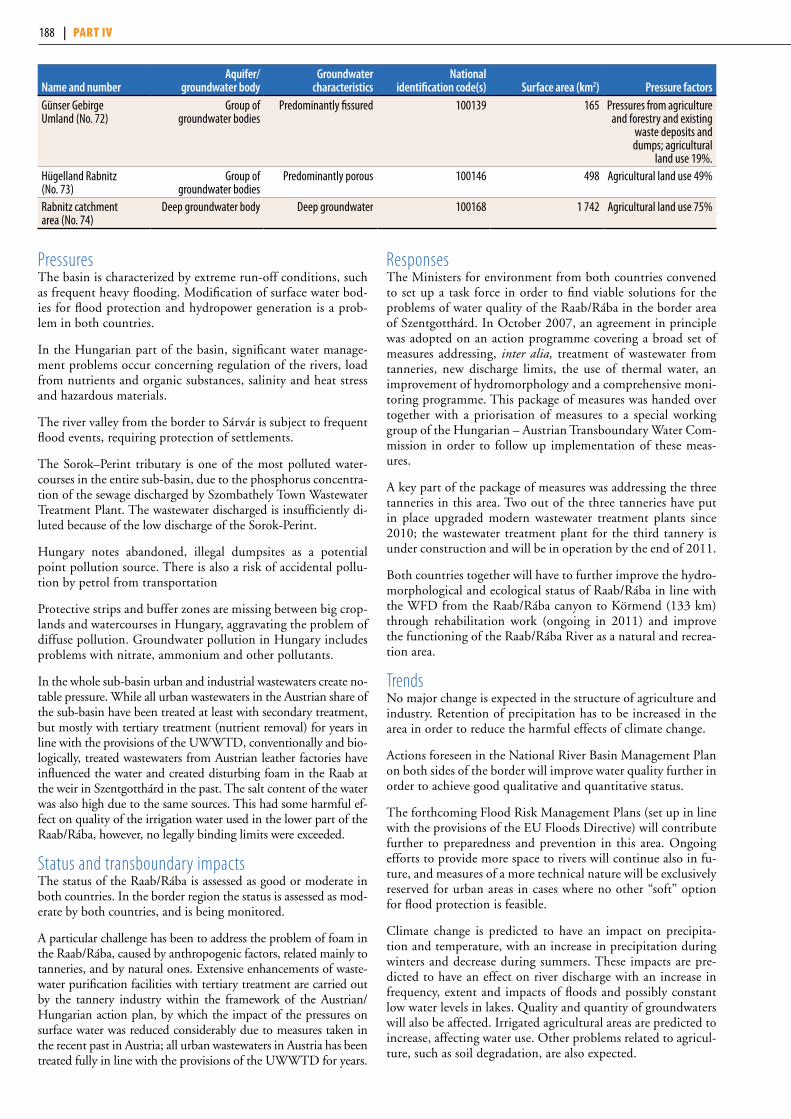
PressuresThe basin is characterized by extreme run-off conditions, such as frequent heavy flooding. Modification of surface water bod-ies for flood protection and hydropower generation is a prob-lem in both countries.
In the Hungarian part of the basin, significant water manage-ment problems occur concerning regulation of the rivers, load from nutrients and organic substances, salinity and heat stress and hazardous materials.
The river valley from the border to Sárvár is subject to frequent flood events, requiring protection of settlements.
The Sorok–Perint tributary is one of the most polluted water-courses in the entire sub-basin, due to the phosphorus concentra-tion of the sewage discharged by Szombathely Town Wastewater Treatment Plant. The wastewater discharged is insufficiently di-luted because of the low discharge of the Sorok-Perint.
Hungary notes abandoned, illegal dumpsites as a potential point pollution source. There is also a risk of accidental pollu-tion by petrol from transportation
Protective strips and buffer zones are missing between big crop-lands and watercourses in Hungary, aggravating the problem of diffuse pollution. Groundwater pollution in Hungary includes problems with nitrate, ammonium and other pollutants.
In the whole sub-basin urban and industrial wastewaters create no-table pressure. While all urban wastewaters in the Austrian share of the sub-basin have been treated at least with secondary treatment, but mostly with tertiary treatment (nutrient removal) for years in line with the provisions of the UWWTD, conventionally and bio-logically, treated wastewaters from Austrian leather factories have influenced the water and created disturbing foam in the Raab at the weir in Szentgotthárd in the past. The salt content of the water was also high due to the same sources. This had some harmful ef-fect on quality of the irrigation water used in the lower part of the Raab/Rába, however, no legally binding limits were exceeded.
Status and transboundary impactsThe status of the Raab/Rába is assessed as good or moderate in both countries. In the border region the status is assessed as mod-erate by both countries, and is being monitored.
A particular challenge has been to address the problem of foam in the Raab/Rába, caused by anthropogenic factors, related mainly to tanneries, and by natural ones. Extensive enhancements of waste-water purification facilities with tertiary treatment are carried out by the tannery industry within the framework of the Austrian/Hungarian action plan, by which the impact of the pressures on surface water was reduced considerably due to measures taken in the recent past in Austria; all urban wastewaters in Austria has been treated fully in line with the provisions of the UWWTD for years.
ResponsesThe Ministers for environment from both countries convened to set up a task force in order to find viable solutions for the problems of water quality of the Raab/Rába in the border area of Szentgotthárd. In October 2007, an agreement in principle was adopted on an action programme covering a broad set of measures addressing, inter alia, treatment of wastewater from tanneries, new discharge limits, the use of thermal water, an improvement of hydromorphology and a comprehensive moni-toring programme. This package of measures was handed over together with a priorisation of measures to a special working group of the Hungarian – Austrian Transboundary Water Com-mission in order to follow up implementation of these meas-ures.
A key part of the package of measures was addressing the three tanneries in this area. Two out of the three tanneries have put in place upgraded modern wastewater treatment plants since 2010; the wastewater treatment plant for the third tannery is under construction and will be in operation by the end of 2011.
Both countries together will have to further improve the hydro-morphological and ecological status of Raab/Rába in line with the WFD from the Raab/Rába canyon to Körmend (133 km) through rehabilitation work (ongoing in 2011) and improve the functioning of the Raab/Rába River as a natural and recrea-tion area.
TrendsNo major change is expected in the structure of agriculture and industry. Retention of precipitation has to be increased in the area in order to reduce the harmful effects of climate change.
Actions foreseen in the National River Basin Management Plan on both sides of the border will improve water quality further in order to achieve good qualitative and quantitative status.
The forthcoming Flood Risk Management Plans (set up in line with the provisions of the EU Floods Directive) will contribute further to preparedness and prevention in this area. Ongoing efforts to provide more space to rivers will continue also in fu-ture, and measures of a more technical nature will be exclusively reserved for urban areas in cases where no other “soft” option for flood protection is feasible.
Climate change is predicted to have an impact on precipita-tion and temperature, with an increase in precipitation during winters and decrease during summers. These impacts are pre-dicted to have an effect on river discharge with an increase in frequency, extent and impacts of floods and possibly constant low water levels in lakes. Quality and quantity of groundwaters will also be affected. Irrigated agricultural areas are predicted to increase, affecting water use. Other problems related to agricul-ture, such as soil degradation, are also expected.
name and numberaquifer/
groundwater bodygroundwater
characteristicsnational
identification code(s) Surface area (km2)
pressure factorsGünser Gebirge Umland (No. 72)
Group of groundwater bodies
Predominantly fissured 100139 165 Pressures from agriculture and forestry and existing
waste deposits and dumps; agricultural
land use 19%.Hügelland Rabnitz (No. 73)
Group of groundwater bodies
Predominantly porous 100146 498 Agricultural land use 49%
Rabnitz catchment area (No. 74)
Deep groundwater body Deep groundwater 100168 1 742 Agricultural land use 75%
188 | part IV
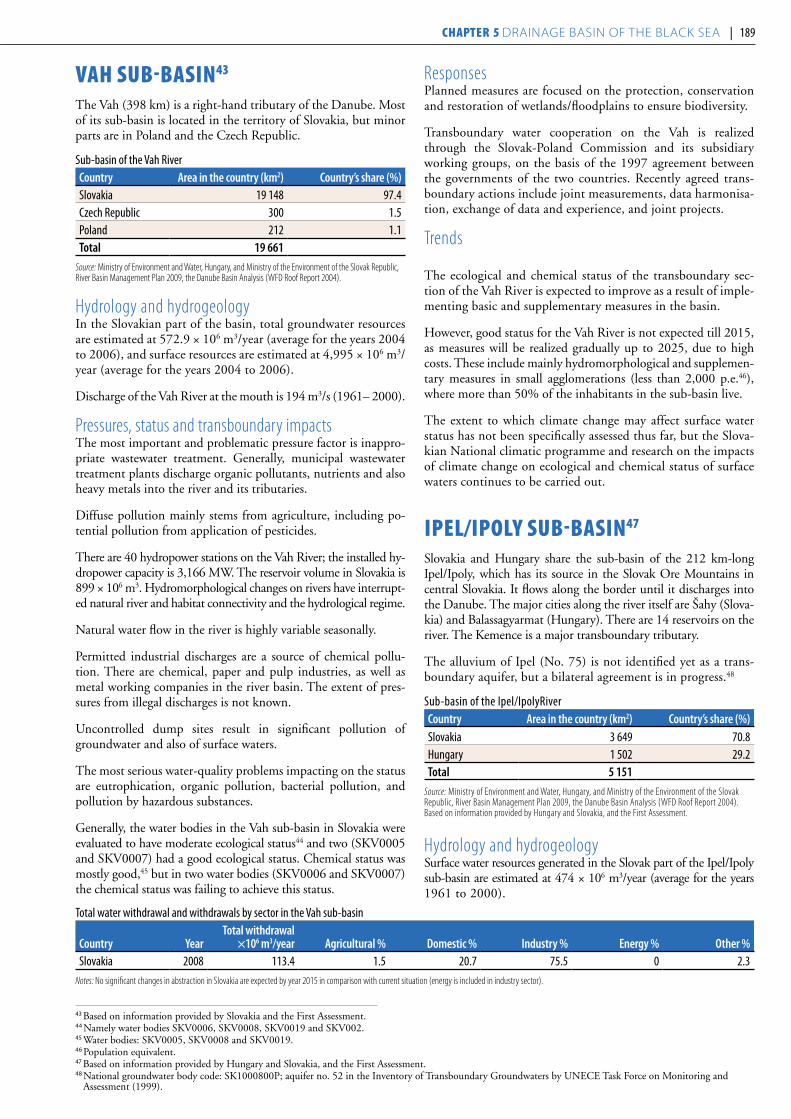
Vah suB-BasIn43
The Vah (398 km) is a right-hand tributary of the Danube. Most of its sub-basin is located in the territory of Slovakia, but minor parts are in Poland and the Czech Republic.
Sub-basin of the Vah Rivercountry area in the country (km2) country’s share (%)Slovakia 19 148 97.4Czech Republic 300 1.5Poland 212 1.1Total 19 661
Source: Ministry of Environment and Water, Hungary, and Ministry of the Environment of the Slovak Republic, River Basin Management Plan 2009, the Danube Basin Analysis (WFD Roof Report 2004).
Hydrology and hydrogeologyIn the Slovakian part of the basin, total groundwater resources are estimated at 572.9 × 10⁶ m3/year (average for the years 2004 to 2006), and surface resources are estimated at 4,995 × 106 m3/year (average for the years 2004 to 2006).
Discharge of the Vah River at the mouth is 194 m3/s (1961– 2000).
Pressures, status and transboundary impacts The most important and problematic pressure factor is inappro-priate wastewater treatment. Generally, municipal wastewater treatment plants discharge organic pollutants, nutrients and also heavy metals into the river and its tributaries.
Diffuse pollution mainly stems from agriculture, including po-tential pollution from application of pesticides.
There are 40 hydropower stations on the Vah River; the installed hy-dropower capacity is 3,166 MW. The reservoir volume in Slovakia is 899 × 106 m3. Hydromorphological changes on rivers have interrupt-ed natural river and habitat connectivity and the hydrological regime.
Natural water flow in the river is highly variable seasonally.
Permitted industrial discharges are a source of chemical pollu-tion. There are chemical, paper and pulp industries, as well as metal working companies in the river basin. The extent of pres-sures from illegal discharges is not known.
Uncontrolled dump sites result in significant pollution of groundwater and also of surface waters.
The most serious water-quality problems impacting on the status are eutrophication, organic pollution, bacterial pollution, and pollution by hazardous substances.
Generally, the water bodies in the Vah sub-basin in Slovakia were evaluated to have moderate ecological status44 and two (SKV0005 and SKV0007) had a good ecological status. Chemical status was mostly good,45 but in two water bodies (SKV0006 and SKV0007) the chemical status was failing to achieve this status.
Responses Planned measures are focused on the protection, conservation and restoration of wetlands/floodplains to ensure biodiversity.
Transboundary water cooperation on the Vah is realized through the Slovak-Poland Commission and its subsidiary working groups, on the basis of the 1997 agreement between the governments of the two countries. Recently agreed trans-boundary actions include joint measurements, data harmonisa-tion, exchange of data and experience, and joint projects.
Trends
The ecological and chemical status of the transboundary sec-tion of the Vah River is expected to improve as a result of imple-menting basic and supplementary measures in the basin.
However, good status for the Vah River is not expected till 2015, as measures will be realized gradually up to 2025, due to high costs. These include mainly hydromorphological and supplemen-tary measures in small agglomerations (less than 2,000 p.e.46), where more than 50% of the inhabitants in the sub-basin live.
The extent to which climate change may affect surface water status has not been specifically assessed thus far, but the Slova-kian National climatic programme and research on the impacts of climate change on ecological and chemical status of surface waters continues to be carried out.
Ipel/Ipoly suB-BasIn47
Slovakia and Hungary share the sub-basin of the 212 km-long Ipel/Ipoly, which has its source in the Slovak Ore Mountains in central Slovakia. It flows along the border un til it discharges into the Danube. The major cities along the river itself are Šahy (Slova-kia) and Balassagyarmat (Hungary). There are 14 reservoirs on the river. The Kemence is a major transboundary tributary.
The alluvium of Ipel (No. 75) is not identified yet as a trans-boundary aquifer, but a bilateral agreement is in progress.48
Sub-basin of the Ipel/IpolyRivercountry area in the country (km2) country’s share (%)Slovakia 3 649 70.8Hungary 1 502 29.2Total 5 151
Source: Ministry of Environment and Water, Hungary, and Ministry of the Environment of the Slovak Republic, River Basin Management Plan 2009, the Danube Basin Analysis (WFD Roof Report 2004). Based on information provided by Hungary and Slovakia, and the First Assessment.
Hydrology and hydrogeologySurface water resources generated in the Slovak part of the Ipel/Ipoly sub-basin are estimated at 474 × 106 m3/year (average for the years 1961 to 2000).
Total water withdrawal and withdrawals by sector in the Vah sub-basin
country yearTotal withdrawal
×106 m3/year agricultural % Domestic % industry % energy % other %Slovakia 2008 113.4 1.5 20.7 75.5 0 2.3
Notes: No significant changes in abstraction in Slovakia are expected by year 2015 in comparison with current situation (energy is included in industry sector).
43 Based on information provided by Slovakia and the First Assessment. 44 Namely water bodies SKV0006, SKV0008, SKV0019 and SKV002.45 Water bodies: SKV0005, SKV0008 and SKV0019. 46 Population equivalent.47 Based on information provided by Hungary and Slovakia, and the First Assessment.48 National groundwater body code: SK1000800P; aquifer no. 52 in the Inventory of Transboundary Groundwaters by UNECE Task Force on Monitoring and
Assessment (1999).
188 | part IV Chapter 5 Drainage basin of the black sea | 189
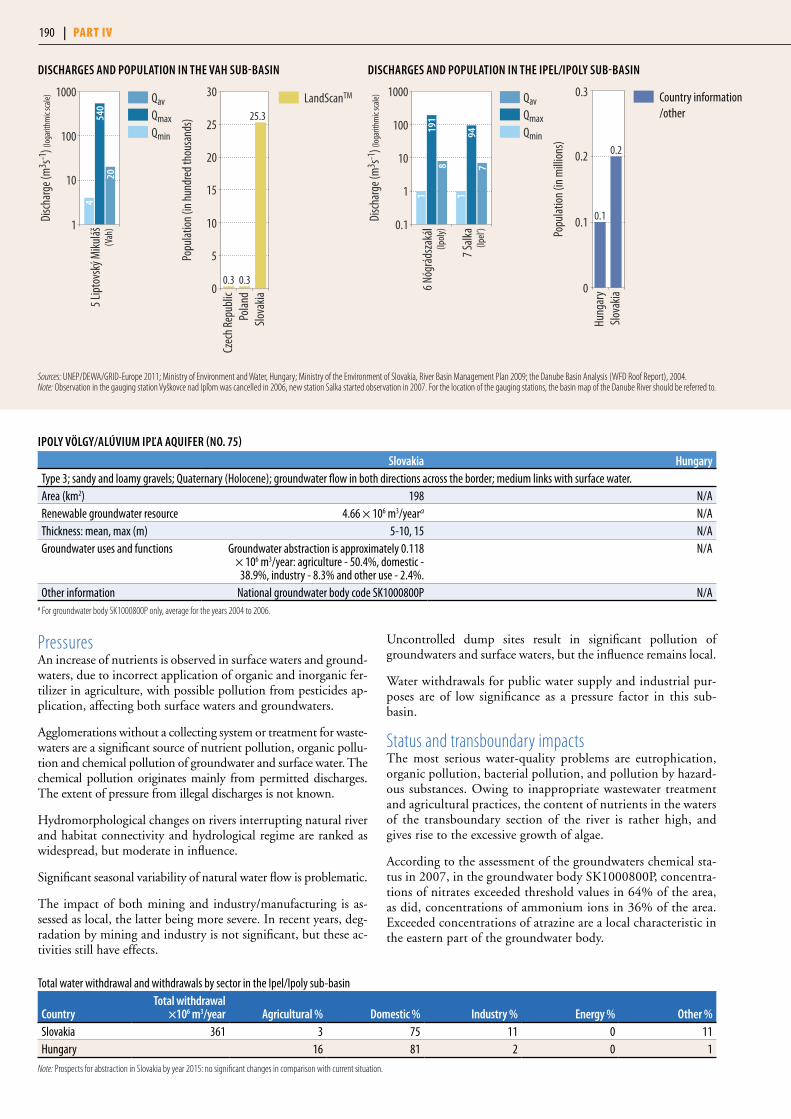
Pressures An increase of nutrients is observed in surface waters and ground-waters, due to incorrect application of organic and inorganic fer-tilizer in agriculture, with possible pollution from pesticides ap-plication, affecting both surface waters and groundwaters.
Agglomerations without a collecting system or treatment for waste-waters are a significant source of nutrient pollution, organic pollu-tion and chemical pollution of groundwater and surface water. The chemical pollution originates mainly from permitted discharges. The extent of pressure from illegal discharges is not known.
Hydromorphological changes on rivers interrupting natural river and habitat connectivity and hydrological regime are ranked as widespread, but moderate in influence.
Significant seasonal variability of natural water flow is problematic.
The impact of both mining and industry/manufacturing is as-sessed as local, the latter being more severe. In recent years, deg-radation by mining and industry is not significant, but these ac-tivities still have effects.
Uncontrolled dump sites result in significant pollution of groundwaters and surface waters, but the influence remains local.
Water withdrawals for public water supply and industrial pur-poses are of low significance as a pressure factor in this sub-basin.
Status and transboundary impacts The most serious water-quality problems are eutrophication, organic pollution, bacterial pollution, and pollution by hazard-ous substances. Owing to inappropriate wastewater treatment and agricultural practices, the content of nutrients in the waters of the transboundary section of the river is rather high, and gives rise to the excessive growth of algae.
According to the assessment of the groundwaters chemical sta-tus in 2007, in the groundwater body SK1000800P, concentra-tions of nitrates exceeded threshold values in 64% of the area, as did, concentrations of ammonium ions in 36% of the area. Exceeded concentrations of atrazine are a local characteristic in the eastern part of the groundwater body.
DiSchaRgeS anD popuLaTion in The vah SuB-BaSin
5 Lip
tovs
ký M
ikuláš
Disc
harg
e (m
3 s-1) (
loga
rithm
ic sc
ale)
540
20(V
ah)1
10
100
10004
QavQmaxQmin
Popu
latio
n (in
hun
dred
thou
sand
s)
0
5
10
15
20
25
30
Slova
kiaPo
land
Czec
h Re
publ
ic
0.3 0.3
25.3
LandScanTM
DiSchaRgeS anD popuLaTion in The ipeL/ipoLy SuB-BaSin
7 Salk
a
6 Nóg
ráds
zaká
l
Disc
harg
e (m
3 s-1) (
loga
rithm
ic sc
ale)
191
8
947
(Ipol
y)
(Ipel’
)0.1
1
100
10
1000
11
QavQmaxQmin
Total water withdrawal and withdrawals by sector in the Ipel/Ipoly sub-basin
countryTotal withdrawal
×106 m3/year agricultural % Domestic % industry % energy % other %Slovakia 361 3 75 11 0 11Hungary 16 81 2 0 1
Note: Prospects for abstraction in Slovakia by year 2015: no significant changes in comparison with current situation.
ipoLy vöLgy/aLúviuM ipľa aquiFeR (no. 75)
Slovakia hungaryType 3; sandy and loamy gravels; Quaternary (Holocene); groundwater flow in both directions across the border; medium links with surface water.Area (km2) 198 N/ARenewable groundwater resource 4.66 × 10⁶ m3/yeara N/AThickness: mean, max (m) 5-10, 15 N/AGroundwater uses and functions Groundwater abstraction is approximately 0.118
× 106 m3/year: agriculture - 50.4%, domestic - 38.9%, industry - 8.3% and other use - 2.4%.
N/A
Other information National groundwater body code SK1000800P N/Aa For groundwater body SK1000800P only, average for the years 2004 to 2006.
Sources: UNEP/DEWA/GRID-Europe 2011; Ministry of Environment and Water, Hungary; Ministry of the Environment of Slovakia, River Basin Management Plan 2009; the Danube Basin Analysis (WFD Roof Report), 2004.Note: Observation in the gauging station Vyškovce nad Ipľom was cancelled in 2006, new station Salka started observation in 2007. For the location of the gauging stations, the basin map of the Danube River should be referred to.
Popu
lation
(in m
illion
s)
0
0.1
0.2
0.3
Slova
kiaHu
ngar
y
0.1
0.2
Country information/other
190 | part IV

Responses Transboundary water cooperation in the Ipel/Ipoly sub-basin is carried out in the framework of the Hungarian-Czechoslovakian (today: Slovakian) Committee on Transboundary Waters, which has operated since 1978 on the basis of a bilateral agreement (1976; followed by a new agreement in 1999). Multilateral co-operation takes place, with the International Commission for the Protection of the Danube River (ICPDR) as the platform.
Protection, conservation and restoration of wetlands and flood-plains are carried out to ensure biodiversity, the good status in the connected river by 2015, flood protection and pollution reduction.
Recently-agreed transboundary actions include joint measure-ments, data harmonisation, exchange of data and experience, as well as joint projects.
Trends The ecological status and the chemical status of transboundary section of the Ipel/Ipoly River will improve, due to realization of basic and supplementary measures in the river basin.
However, good status in the Ipel/Ipoly is not expected to be achieved by 2015, as the realization of measures — mainly hy-dromorphological and supplementary measures in small agglom-erations of the river basin (more than 50% inhabitants live in agglomerations below 2000 p.e.) — will be realized gradually up to 2025, due to high financial needs.
Climate change may affect the surface water status, but the ex-tent of its impact has not been specifically predicted so far. To this end, efforts continue in implementing the national climate programmes and in research on the impacts of climate change on the ecological and chemical status of surface water.
Implementing the UWWTD by the year 2010 has required building and upgrading wastewater treatment plants in both Slo-vakia and Hungary. In Hungary, individual connections to the sewage network have increased about 20% over the past 5 years.
Organic pollution and pollution by dangerous substances is thus expected to substantially decrease. The trend of nutrient pollu-tion from agriculture is still uncertain.
draVa and Mura suB-BasIns49
The sub-basin of the Drava River50 is shared by Austria, Croatia, Hungary, Italy and Slovenia. This river of about 890-km rises in the Italian Alps (Toblach, ~ 1,450 m a.s.l.); it is navigable for about 100 km from Čađavica to Osijek in Croatia, where it joins the Danube. It is the Danube’s fourth largest tributary with a surface area of 41,238 km2.
Sections of the Drava in Hungary and Croatia are some of the most natural and unspoiled waters in Europe, hosting many rare species.
The Mura River51 (445 km long) is the largest tributary of the Drava. It rises in Austria in the “Niedere Tauern” (~ 1,900 m a.s.l.), and meets the Drava at the Croatian-Hungarian borders. The sub-basin of the Mura extends over an area of some 13,800 km2, and is shared by Austria, Croatia, Hungary and Slovenia.
The Drava forms a big part of the Croatian-Hungarian borders,
while the Mura forms a small part of the Austrian-Slovenian, Slovenian-Croatian and Croatian-Hungarian borders.
Hydrology and hydrogeologyThree dams with associated reservoirs and hydropower plants ex-ist in Austria, Hungary, Slovenia and Croatia.
The Drava River has a pluvial-glacial (rain-and-ice) water regime, characterized by small quantities of water during winter and large quantities of water in late spring and early summer.
The average flow of the Drava at the point where it enters Slove-nia flowing from Austria is 290 m³/s, and in Croatia above the confluence with the Mura it is already 552 m3/s (1961-1990). The average flow of the Mura at the point where it flows into the Drava River is 182 m3/s.
Hungary estimates the surface water resources for Hungary’s part of the Mura sub-basin to add up to 0.176 km3/year, and ground-water resources to approximately 0.202 km3/year (based on aver-ages for the years 1951-1980). In total, these make up 2,300 m3/year/capita. In the Drava sub-basin, the surface water resources in Hungary’s territory are estimated at 16.4 km3/year, and ground-water resources at 0.0314 km3/year (based on averages for the years 1960-2008).
Several transboundary aquifers or groundwater bodies are linked with the surface water system of the Drava and Mura rivers.
49 Based on information from Austria, Croatia, Slovenia and the First Assessment.50 The river is called Drava in Italy, Slovenia and Croatia, Drau in Austria and Dráva in Hungary. 51 The river is called Mura in Slovenia and Croatia, and Mur in Austria.
DiSchaRgeS anD popuLaTion in The DRava SuB-BaSinS
Source: UNEP/DEWA/GRID-Europe 2011.Note: For the location of the gauging stations, the basin map of the Danube River should be referred to.
11 B
elišć
e
10 B
otov
o
9 Lav
amün
d
8 Am
lach
Disc
harg
e (m
3 s-1) (
loga
rithm
ic sc
ale)
985
128
20
1565
525 13
86
(Dra
u)
(Dra
u)
(Dra
va)
(Dra
va)1
10
100
1000
10000
174
558
234
290
QavQmaxQmin
Popu
lation
(in h
undr
ed th
ousa
nds)
0
2
4
6
8
Slove
niaItaly
Hung
ary
Croa
tiaAu
stria
6.1
6.9
2.0
0.1
5.3
Country information/otherLandScanTM
190 | part IV Chapter 5 Drainage basin of the black sea | 191

The “Karstwasser-Vorkommen Karawanken” (Karavanke trans-boundary groundwater body (No. 76) was identified by the two countries following an agreement between Slovenia and Austria (2004), and was characterized in accordance with the WFD re-quirements. A “Water supply” commission for Karavanke Moun-tains has been established; meetings take place twice per year.
The Karavanke/Karawanken groundwater body (No. 76) is fur-ther divided in five cross-border aquifers: (1) the Kepa/Mittag-
skogel aquifer (furthest west); (2) the long (60 km), but nar-row massif Košuta aquifer; (3) the Bela/Vellach valley aquifer; (4) the Mount Olševa/Uschowa, which is an important aquifer - groundwater discharges to the Austrian side; (5) the massif Peca/Petzen (furthest east); water from this aquifer drains to both countries, and the recharge areas of individual sources within the aquifer are intertwined with each other.
KaRSTWaSSeR-voRKoMMen KaRaWanKen/KaRavanKe aquiFeR (no. 76)52
austria SloveniaType 2; Triassic limestone, dolomite (Austria); Limestones and dolomites/carbonate; Triassic rocks form aquifers, barriers to groundwater flow are formed from various rocks from Paleozoic to Tertiary rocks (Slovenia); groundwater flow direction from Slovenia to Austria, with medium links to surface waters. Groundwater flow is variable; from one country to the other depending on the aquifer (in the Peca aquifer direction is from Austria to Slovenia - in the Kosuta aquifer flow is predominately parallel to the State boundary). There are weak links with surface water systems. Pressure condition: partly confined, partly unconfined. Groundwater covers the total of water used in the Slovenian part. Area (km2) 210 414
Thickness: mean, max (m) 700, 1000 Max > 1000 (thickness varies strongly)
Groundwater uses and functions Covers about 14% of drinking water supply in the Austrian part (200 l/s out of 1,460 l/s in total) covering related needs of 30,000 inhabitants and up to 15,000 tourists
(total hotel beds capacity in the area). It is considered and treated as a drinking water reserve for future use. A part
is used for irrigated agriculture. Groundwater supports also ecosystems and maintains baseflow and springs.
Drinking water supply; also supports ecosystems and maintaining baseflow and springs (there are several springs with outflow up to 1 m3/s). Water
is used locally for spa related tourism. There is also small scale hydropower production.
Pressure factors No pressure factors. Winter tourism activities and settlements (local importance). Spring water quantity fluctuates significantly
due to the karstic geomorphology. Bacteriological quality problems (of local character). Turbidity in spring/rain season.
Groundwater management measures In accordance to the WFD. Basic measures are implemented; no supplementary or additional measures are foreseen.
Other information In line with the target set in WFD, good status is expected to be maintained.
Population some 8,700 inhabitants (density 22/km2); it is predicted that climate change will result
in diminished infiltration in the southern slopes thus lowered spring yield. Vulnerability is high, however anthropogenic activities in the area are not intense,
hence the risk is low; tourism development may become a risk factor in the future. Establishment of
transboundary groundwater protection areas is needed.
oRMoZ-SReDiSce oB DRava/DRava-vaRaZDin aquiFeR (no. 77)53
Slovenia croatiaType 2; Quaternary sands and gravels of average thickness 50 m and maximum 150 m; groundwater flow from Slovenia to Croatia; strong links with surface water systems. Area (km2) 27 768
Thickness: mean, max (m) 50, 150 50, 150Groundwater uses and functions Drinking water supply; supporting
ecosystems and agriculture.Drinking water supply, agriculture;
also supports ecosystems.Pressure factors Agriculture, hydropower schemes, Drava river regulation. Agriculture and population of local communities.
Nitrate concentrations above the drinking water standard in the first shallow aquifer; in the
deeper aquifer, the water is of good quality.Groundwater management measures None Existing protection zonesOther information No groundwater quality or quantity problems observed.
Good chemical status. No transboundary impact.Population: ~4 400 (6 inhabitants/km2); agreed
delineation of transboundary groundwaters, and development of monitoring programmes
are needed. No transboundary impact.
52 Based on information from Slovenia and Austria.53 Based on information from Croatia and the First Assessment.
192 | part IV

DoLinSKo-RavenSKo/MuRa aquiFeR (no. 78)54
Slovenia croatiaQuaternary alluvial sands and gravel, groundwater hydraulically corresponding to surface water systems of the Mura River and in strong connection; groundwater flow from Slovenia to Croatia and from Croatia to Slovenia.Area (km2) 449 N/A
Groundwater uses and functions Drinking water supply of town Murska Sobota, local water supply systems.
N/A
Pressure factors Intensive agriculture; pan-European transport corridor. N/A
Problems related to groundwater quantity
Degradation of the Mura River due to river regulation and hydropower schemes.
N/A
Problems related to groundwater quality
Nitrate, pesticides. N/A
Trends and future prospects At risk. Delineation of transboundary groundwater systems needs common research and bilateral expert group decision.
N/A
Other information Probably only part of the Dolinsko-Ravensko ground-water system is relevant. No transboundary impact.
According to existing data, no transboundary groundwater is recognised.
MuRa aquiFeR (no. 79)55
hungary croatiaType 3/4; Quaternary alluvial aquifer of sands and gravels; strong links to surface waters of the Mura River; groundwater flow towards the river. Area (km2) 300 98Thickness: mean, max (m) 5-10, 30 5-10, 20
Groundwater uses and functions >75% drinking water, <25% for industry, irrigation and livestock, provides >80% of total water supply,
maintaining baseflow and support of ecosystems.
No demand for groundwater.
Pressure factors Agriculture and settlements (fertilisers, pesticides, sewage, traffic), groundwater abstraction. Local and
moderate groundwater depletion (at settlements), increased pumping lifts, reduced yields and baseflow,
degradation of ecosystems. Local but severe nitrate pollution from agriculture, sewers and septic tanks
at up to 200 mg/l, pesticides at up to 0.1 µg/l.
No data
Groundwater management measures Groundwater abstraction management used and effective; transboundary institutions, monitoring,
public awareness, protection zones, treatment, need improvement; vulnerability mapping, regional flow modeling, good agricultural practices and priorities
for wastewater treatment, integration with river basin management need to be introduced.
N/A
Other information Border length 52 km. No transboundary impact. Evaluation of the utilizable resource
is needed. Exporting drinking water.
Border length 52 km.
DRava/DRava WeST aquiFeR (no. 80)56
hungary croatiaType 3/4; Quaternary alluvial aquifer of sands and gravels; medium to strong links to surface waters; groundwater flow from Hungary to Croatia, but mainly towards the border river. Area (km2) 262 97Thickness: mean, max (m) 10, 70 10, 100
Groundwater uses and functions >75% drinking water, <25% for irrigation, industry and livestock
Agriculture; supports ecosystems
Pressure factors Agriculture (fertilizers and pesticides), sewage from settlements, traffic, gravel extraction under water in open pits. Local increases in pumping lifts, reduction
of borehole yields and baseflow and degradation of ecosystems; affected by gravel extraction under water
from open pits. Widespread but moderate nitrate pollution at up to 200 mg/l from agriculture, sewers
and septic tanks, pesticides at up to 0.1 µg/l.
Extraction of sand and gravel under water in pits. Changes in groundwater levels detected.
54 Based on information from Croatia and the First Assessment. In the First Assessment, this aquifer was indicated to be located within the Sava River basin. However, Croatia reports that it is part of the Drava River Basin.
55 Based on information from Croatia and the First Assessment.56 Based on information from Croatia and the First Assessment.
192 | part IV Chapter 5 Drainage basin of the black sea | 193

hungary croatiaGroundwater management measures Groundwater abstraction management used and
effective; transboundary institutions, monitoring, protection zones need improvement; vulnerability
mapping, regional flow modeling, good agricultural practices and priorities for wastewater treatment,
integration into river basin management, protection of open pit areas need to be introduced.
None
Other information Border length is 31 km. Exporting drinking water. Evaluation of the utilisable resource
is needed. No transboundary impact.
Border length is 31 km. Needed: agreed delineation of transboundary groundwaters
(presently under consideration), and development of monitoring programmes.
BaRanja/DRava eaST aquiFeR (no. 81)57
hungary croatiaType 4; Quaternary fluvial sands and gravels; medium to weak links to surface waters; groundwater flow from Hungary to Croatia.Area (km2) 607 955Thickness: mean, max (m) 50-100, 200 50-100, 100
Groundwater uses and functions >75% drinking water, >25% for irrigation, industry and livestock, maintaining baseflow and spring flow;
Groundwater makes up 80-90% of total water use.
Provides 20% of total supply. Supports ecosystems.
Pressure factors Agriculture, sewers and septic tanks, traffic. Widespread but moderate pollution by nitrate at up to 200 mg/l,
local and moderate pesticides up to 0.1 µg/l, widespread but moderate arsenic up to 50 µg/l. Local and moderate
increases in pumping lifts, reductions in borehole yields and baseflow, degradation of ecosystems.
None. Iron occurs naturally. No problems related to groundwater quantity.
Groundwater management measures Control of groundwater abstraction by regulation used and effective; transboundary institutions, water use efficiency, monitoring, public awareness, protection
zones, effluent treatment and data exchange need improvement; vulnerability mapping, regional flow
modeling, better agricultural practices, priorities for wastewater treatment, integration with river basin
management and arsenic removal need to be applied.
Need to establish protection zones.
Other information Border length 67 km. No transboundary impact. Evaluation of the utilisable resource and status of groundwater quality are needed and so are joint
monitoring (mainly quantitative) and joint modeling.
Border length 67 km. No transboundary impact. Needed: Agreed delineation of transboundary
groundwaters (presently under consideration), and development of monitoring programmes.
ČeRnešKo-LiBeLišKo aquiFeR (no. 82)58
austria SloveniaType 2; Quaternary silicate/carbonate gravel and sand alluvial; dominant groundwater flow direction is from Austria to Slovenia; pressure condition: unconfined; depth of groundwater levels at 20-30 m; strong links with surface water systems.Area (km2) 11Thickness: mean, max (m) 25, 35 25, 35
Groundwater uses and functions N/A Support ecosystems and maintain baseflow and springs.Pressure factors N/A Municipal wastewater and agriculture. Nitrate pollution
(below quality standards) from municipal wastewater and agriculture; also pesticides pollution.
Groundwater management measures N/A Basic measures are implemented, supplementary measures are not foreseen. Groundwater dependent terrestrial ecosystems
criteria for hydrogeological characterization are to be defined.Other information Austria expresses uncertainty about
the location of this aquifer.Population ∼4 400 (density 388 inhabitants/km2).
No transboundary impact. Decreased intensity of significant pressures is expected till 2015. Transboundary
groundwater flow characterization is needed.
57 Based on information from Croatia and the First Assessment. 58 Based on information from Slovenia, the Černeško-Libeliško and Kučnica are part of the alluvial aquifers system of Drava and Mura rivers at Austrian – Slovenian borders.
DRava/DRava WeST aquiFeR (no. 80) -continued-
194 | part IV
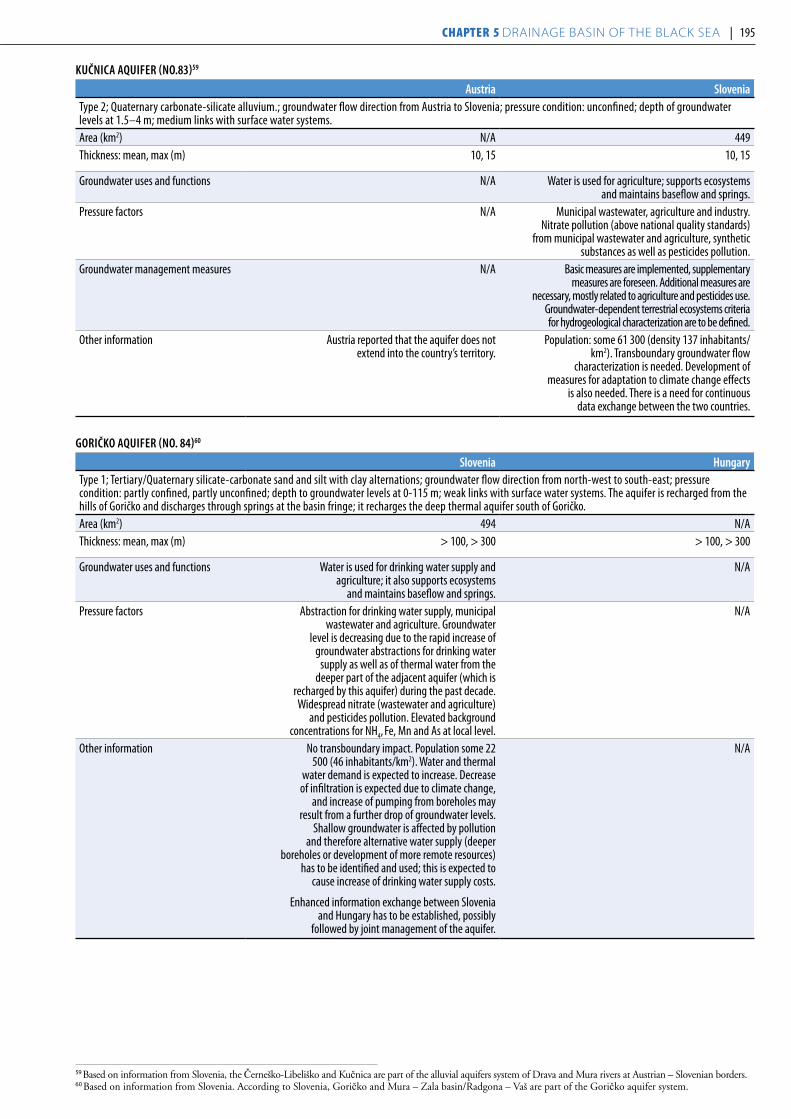
KuČnica aquiFeR (no.83)59
austria SloveniaType 2; Quaternary carbonate-silicate alluvium.; groundwater flow direction from Austria to Slovenia; pressure condition: unconfined; depth of groundwater levels at 1.5–4 m; medium links with surface water systems.Area (km2) N/A 449Thickness: mean, max (m) 10, 15 10, 15
Groundwater uses and functions N/A Water is used for agriculture; supports ecosystems and maintains baseflow and springs.
Pressure factors N/A Municipal wastewater, agriculture and industry. Nitrate pollution (above national quality standards)
from municipal wastewater and agriculture, synthetic substances as well as pesticides pollution.
Groundwater management measures N/A Basic measures are implemented, supplementary measures are foreseen. Additional measures are
necessary, mostly related to agriculture and pesticides use. Groundwater-dependent terrestrial ecosystems criteria for hydrogeological characterization are to be defined.
Other information Austria reported that the aquifer does not extend into the country’s territory.
Population: some 61 300 (density 137 inhabitants/km2). Transboundary groundwater flow
characterization is needed. Development of measures for adaptation to climate change effects
is also needed. There is a need for continuous data exchange between the two countries.
goRiČKo aquiFeR (no. 84)60
Slovenia hungaryType 1; Tertiary/Quaternary silicate-carbonate sand and silt with clay alternations; groundwater flow direction from north-west to south-east; pressure condition: partly confined, partly unconfined; depth to groundwater levels at 0-115 m; weak links with surface water systems. The aquifer is recharged from the hills of Goričko and discharges through springs at the basin fringe; it recharges the deep thermal aquifer south of Goričko. Area (km2) 494 N/AThickness: mean, max (m) > 100, > 300 > 100, > 300
Groundwater uses and functions Water is used for drinking water supply and agriculture; it also supports ecosystems
and maintains baseflow and springs.
N/A
Pressure factors Abstraction for drinking water supply, municipal wastewater and agriculture. Groundwater
level is decreasing due to the rapid increase of groundwater abstractions for drinking water
supply as well as of thermal water from the deeper part of the adjacent aquifer (which is
recharged by this aquifer) during the past decade. Widespread nitrate (wastewater and agriculture)
and pesticides pollution. Elevated background concentrations for NH4,
Fe, Mn and As at local level.
N/A
Other information No transboundary impact. Population some 22 500 (46 inhabitants/km2). Water and thermal
water demand is expected to increase. Decrease of infiltration is expected due to climate change,
and increase of pumping from boreholes may result from a further drop of groundwater levels.
Shallow groundwater is affected by pollution and therefore alternative water supply (deeper
boreholes or development of more remote resources) has to be identified and used; this is expected to
cause increase of drinking water supply costs.
Enhanced information exchange between Slovenia and Hungary has to be established, possibly
followed by joint management of the aquifer.
N/A
59 Based on information from Slovenia, the Černeško-Libeliško and Kučnica are part of the alluvial aquifers system of Drava and Mura rivers at Austrian – Slovenian borders.60 Based on information from Slovenia. According to Slovenia, Goričko and Mura – Zala basin/Radgona – Vaš are part of the Goričko aquifer system.
194 | part IV Chapter 5 Drainage basin of the black sea | 195
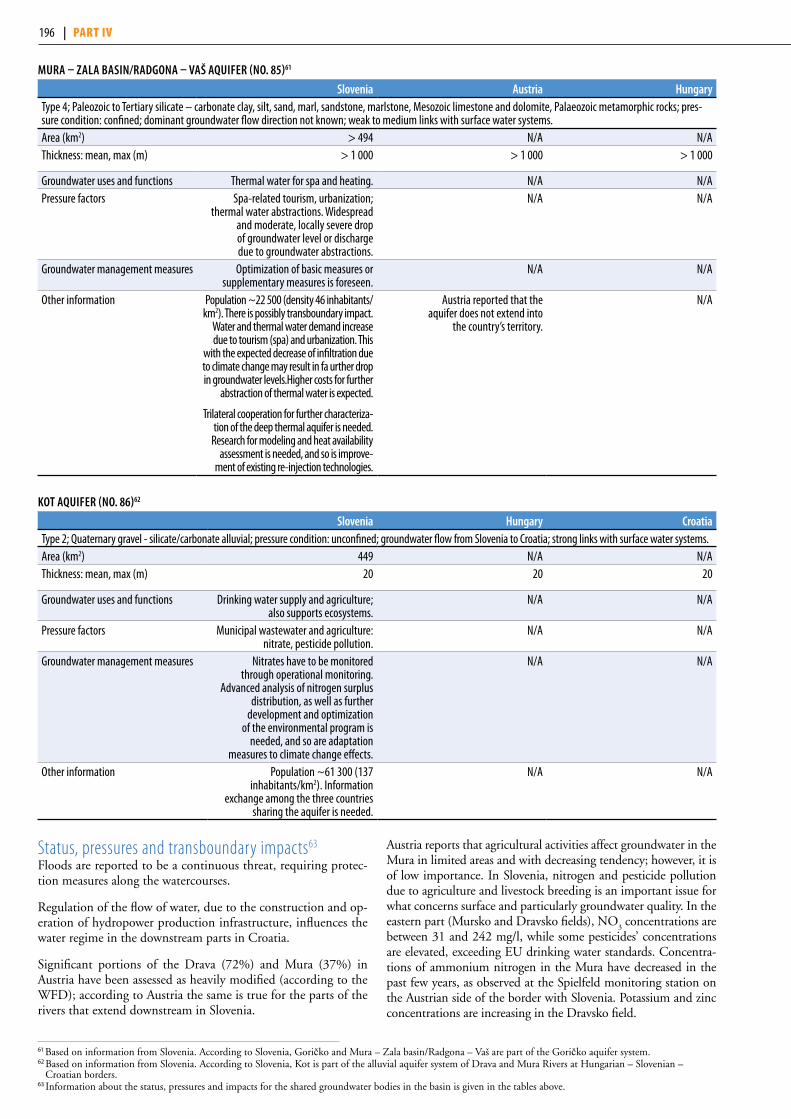
MuRa – ZaLa BaSin/RaDgona – vaš aquiFeR (no. 85)61
Slovenia austria hungaryType 4; Paleozoic to Tertiary silicate – carbonate clay, silt, sand, marl, sandstone, marlstone, Mesozoic limestone and dolomite, Palaeozoic metamorphic rocks; pres-sure condition: confined; dominant groundwater flow direction not known; weak to medium links with surface water systems.Area (km2) > 494 N/A N/AThickness: mean, max (m) > 1 000 > 1 000 > 1 000
Groundwater uses and functions Thermal water for spa and heating. N/A N/APressure factors Spa-related tourism, urbanization;
thermal water abstractions. Widespread and moderate, locally severe drop of groundwater level or discharge due to groundwater abstractions.
N/A N/A
Groundwater management measures Optimization of basic measures or supplementary measures is foreseen.
N/A N/A
Other information Population ~22 500 (density 46 inhabitants/km2). There is possibly transboundary impact.
Water and thermal water demand increase due to tourism (spa) and urbanization. This
with the expected decrease of infiltration due to climate change may result in fa urther drop in groundwater levels.Higher costs for further
abstraction of thermal water is expected.
Trilateral cooperation for further characteriza-tion of the deep thermal aquifer is needed.
Research for modeling and heat availability assessment is needed, and so is improve-
ment of existing re-injection technologies.
Austria reported that the aquifer does not extend into
the country’s territory.
N/A
KoT aquiFeR (no. 86)62
Slovenia hungary croatiaType 2; Quaternary gravel - silicate/carbonate alluvial; pressure condition: unconfined; groundwater flow from Slovenia to Croatia; strong links with surface water systems. Area (km2) 449 N/A N/AThickness: mean, max (m) 20 20 20
Groundwater uses and functions Drinking water supply and agriculture; also supports ecosystems.
N/A N/A
Pressure factors Municipal wastewater and agriculture: nitrate, pesticide pollution.
N/A N/A
Groundwater management measures Nitrates have to be monitored through operational monitoring.
Advanced analysis of nitrogen surplus distribution, as well as further
development and optimization of the environmental program is
needed, and so are adaptation measures to climate change effects.
N/A N/A
Other information Population ~61 300 (137 inhabitants/km2). Information
exchange among the three countries sharing the aquifer is needed.
N/A N/A
61 Based on information from Slovenia. According to Slovenia, Goričko and Mura – Zala basin/Radgona – Vaš are part of the Goričko aquifer system.62 Based on information from Slovenia. According to Slovenia, Kot is part of the alluvial aquifer system of Drava and Mura Rivers at Hungarian – Slovenian –
Croatian borders. 63 Information about the status, pressures and impacts for the shared groundwater bodies in the basin is given in the tables above.
Status, pressures and transboundary impacts63
Floods are reported to be a continuous threat, requiring protec-tion measures along the watercourses.
Regulation of the flow of water, due to the construction and op-eration of hydropower production infrastructure, influences the water regime in the downstream parts in Croatia.
Significant portions of the Drava (72%) and Mura (37%) in Austria have been assessed as heavily modified (according to the WFD); according to Austria the same is true for the parts of the rivers that extend downstream in Slovenia.
Austria reports that agricultural activities affect groundwater in the Mura in limited areas and with decreasing tendency; however, it is of low importance. In Slovenia, nitrogen and pesticide pollution due to agriculture and livestock breeding is an important issue for what concerns surface and particularly groundwater quality. In the eastern part (Mursko and Dravsko fields), NO
3 concentrations are
between 31 and 242 mg/l, while some pesticides’ concentrations are elevated, exceeding EU drinking water standards. Concentra-tions of ammonium nitrogen in the Mura have decreased in the past few years, as observed at the Spielfeld monitoring station on the Austrian side of the border with Slovenia. Potassium and zinc concentrations are increasing in the Dravsko field.
196 | part IV

FiguRe 8: Ammonium nitrogen concentration (mg/l) in the Mura River at Spielfeld monitoring station64
Groundwater from alluvium in the Drava sub-basin is dis-charged into the Drava River, thus the pressures from diffuse pollution sources have an important impact in terms of nitro-gen loads entering the river.
Only 22% of the settlements in the part of the Drava sub-basin that is Hungary’s territory have sufficient wastewater treatment. There are controlled and uncontrolled dumpsites in areas where groundwater resources of the alluvial aquifers of the Drava and Mura rivers are highly vulnerable to pollution. Uncontrolled landfills sometimes pollute surrounding soil and groundwater in Croatia. Industrial pollution in Slovenia (due to significant chemical industry) in the Drava sub-basin is reported to be in decline.
ResponsesA River Basin Management Plan has been prepared for both sub-basins in Austria in conformity with the WFD. Permit and licensing systems are in place and enforced, vulnerability map-ping for land use planning exists, good agricultural practices have been developed and implemented, and protection zones for drinking water supply have been established. Water protection is integrated in agricultural policy and in licensing procedures for industrial plants, as well as in hydropower development. Wastewater treatment infrastructure is in place. Austria reports that there is no urgent necessity for measures to adapt to climate change; scenarios have been developed and possible consequenc-es investigated. Joint monitoring with neighbouring countries is not practiced, but information and data in the boundary region are harmonized.
Hungary completed the River Basin Management Plan on the Drava according to the requirements of the WFD in May 2010.
In Slovenia, water quality monitoring is carried out in 18 differ-ent water bodies; 84 sampling points are used.
A number of water resource management plans and measures are implemented in Croatia. Monitoring in Croatia is conducted 26 times per year, using one station on the Mura River and four on the Drava River.
Monitoring of both rivers is also conducted jointly by Croa-tia and Hungary in accordance with the work plan of the Wa-ter Protection Sub-commission under the Croatian-Hungarian Commission for Water Management (see below). The project “Integrated Drava Monitoring” that involved Slovenia, Hungary and Croatia, carried out from 2004 to 2006 in framework of the Interreg IIIA Neighbourhood Programme posted all the national surface monitoring stations real-time data (chemical and biologi-cal) on a common website.65
Cooperation between Austria and Slovenia on the Drava and Mura Rivers dates back to 1954 (Slovenia was then within the State of Yugoslavia), and covers all issues that might have a nega-tive effect on the rivers. There is a permanent Austrian — Slove-nian Commission dealing with all related issues.
A Croatian — Hungarian Water Management Commission has been created under the Agreement on Water Management Rela-tions, signed by the two countries in 1994. Sub-commissions have been set up for, among others: Drava and Danube water manage-ment; the Mura River; water use and pollution control; and water quality control. An environmental impact study was carried out based on joint models and plans for setting up technological meas-ures to prevent erosion of riverbanks at the confluence of the Drava and the Mura, in order to protect the near-by railway.
There is also an agreement between Slovenia and Hungary; in the framework of the Hungarian — Slovenian transboundary com-mission, a reservoir on Kebele creek was put into use to reduce flood impact in 2008.
The 1996 agreement between Slovenia and Croatia also covers water resources in the Drava and Mura sub-basins.
A project is developed by Croatia for the preparation of an Inte-grated River Basin Management Plan for the Drava River.
Representatives from the Drava River riparian countries signed a declaration on joint approaches to water management, flood protection, hydropower utilization and nature and biodiversity conservation in the Drava River basin in Maribor, Slovenia in September 2008 on the occasion of an international symposium entitled “Drava River Vision”. This symposium was prepared by the Drava countries in the framework of the WFD joint Drava River Basin Management plan till 2015.
Hungary considers that there is a need to start establishing groundwater protection zones for drinking water supply on the transboundary level. Transboundary cooperation in structural and technological measures is also a gap that Hungary believes should be addressed.
TrendsCroatia reports that the decrease in precipitation has resulted in a decrease of groundwater levels. Hungary reports that in the last decades the decreasing amount of snow is expected to result in a decrease of the level of shallow groundwater level. Hungary notes that there is a need for joint “Drava basin scenarios” to assess the impacts of climate change.
64 Data provided by Austria. 65 http://www.dravamonitoring.eu/.
2004 2005 2006 2007 2008
0.6
0.5
0.4
0.3
0.2
0.1
-0.0
-0.1
-0.2
Mean value Mean value+/- standard deviation Mean value +/- 1.96 standard deviation
Phot
o by T
obias
Salat
he
196 | part IV Chapter 5 Drainage basin of the black sea | 197

66 Sources: (1) Information Sheet on Ramsar Wetlands (RIS), available at the Ramsar Sites Information Service: Nature Park Kopacki rit (Kopački rit) Ramsar Site; Croatia (RIS updated in 2007); Béda-Karapancsa Ramsar Site; Hungary (RIS updated in 2006); Gornje Podunavlje Ramsar Site; Serbia (RIS submitted in 2007). (2) Environmental Status Report (Environmental Assessment), Social Impact Assessment (Public Consultation) – Final report within the DDNP Component of the Reduction of Nutrient Discharges Project; prepared by VITUKI, Environmental and Water Management Research Centre, VTK Innosystem Ltd.
draVa-danuBe ConfluenCe raMsar sItes66
General description of the wetland The wetland where the Drava River enters the Danube is the largest and best-preserved flood retention area on the Middle Danube. It represents a naturally functioning inner delta with typical floodplain habitats, featuring a unique combination of lakes, marshes, wet grasslands, reed beds, willow shrubs and riverine forests. The entire area beyond the river embank-ments is flooded annually in spring, for a duration of one to three months.
Main wetland ecosystem services The wetland is important for water flow regulation and flood control (although this role was more significant before the riv-er embankments were constructed), purification of the river waters, sedimentation of transported matters, and groundwa-ter recharge. The presence of vast forest and wetland areas humidifies the regional climate.
The wetland is used for timber production, hunting, fishing and tourism. Wetland water is used for irrigated agriculture and fish-pond farming. Wetland aquifers provide important drinking water supplies. Leisure and tourist activities, such as nature tours and village tourism, are developing rapidly.
Cultural values of the wetland areaLocal life has always been connected to the rivers, their forests and marshland. A number of traditional events are connected with fishing. Local Phragmites reed is used for constructions, and Typha reed serves to make bags and mats. These uses avoid overgrowing of the open water surfaces.
Biodiversity valuesThe wetland is exceptionally rich in biodiversity, including a large number of threatened species, as well as a number of nat-ural habitats of European Union-wide interest. The wetland is important for large numbers of waterbirds, and several species of birds of prey depend on the floodplain and its forest.
The floodplain is the most significant fish spawning ground on the Middle Danube with more than 50 species, including Sterlet and wild Carp, two vulnerable species on the IUCN Red List. The wetland is also an important foraging, nursery, and overwintering area, and a migratory route for fish.
Pressure factors and transboundary impactsThe most significant pressures on the wetland ecosystem stems from water management, timber plantations and log-ging, agricultural and industrial effluents polluting the water, household sewage and urban wastewater run-offs, disturbance through fishing, hunting and leisure activities, and the spread of alien invasive species. The transformation of water bodies for navigation purposes puts further pressures on the wetland ecosystem.
River regulation and flood control measures have had serious impacts on the hydrological regime. River channels have been shortened and narrowed, resulting in a significant increase of
water flow speed and erosion force, leading to the degrada-tion of the river bed and a lowering of the river water level. This resulted in shorter inundation periods of the natural floodplain, and lowered groundwater levels. These processes, together with amelioration and hydrotechnical activities for agricultural purposes, lead to the loss of alluvial habitats and the deterioration of living conditions for fish, amphibians and shorebirds. The continuous aggradation of the floodplain due to the sediments carried by the river and deposited in inunda-tion areas enhances desiccation problems. The construction of protective levees along the Danube in the 1960s prevented the temporary inundation of large areas on the Serbian side. The increased nutrient content of the water inflows resulted in eutrophication of the floodplain waterbodies.
Forestry plantations are increasingly replacing native gallery woodlands and wet meadows, and high numbers of wild boar and red deer prevent natural forest regeneration. Non-sustain-able levels of fishing and hunting may threaten specific popu-lations. The abandonment of fish farming ponds and of mow-ing of wet meadows leads to the loss of these habitats. The occasional burning of reed beds reduces this habitat, creating unnecessary carbon release into the atmosphere.
The wetland was an area of armed conflict during the 1990s, and this resulted in the temporary suspension of conservation measures, infrastructure destruction, creation of un-mapped minefields, and the abandonment of traditional settlements in the protected floodplain. A new phase of wetland conserva-tion and management started in 1997, when Croatia created the Kopački Rit Nature Park, followed in 2001 by the proc-lamation of the Special Nature Reserve Gornje Podunavlje on the Serbian side. However, intensive timber exploitation and illegal waterfowl hunting continue to exert pressures on the ecosystem.
Transboundary wetland managementThe core wetland area benefits in all three countries from a specific legal protection status, and was designated as a Ram-sar Site.
The Croatian Ramsar Site (23,894 ha) coincides with the Nature Park Kopački rit. With the financial support of the Global Environment Facility, an ecological research, monitor-ing and education centre was put in place, and a new visitor centre was opened. The Serbian Ramsar Site (22,480 ha) in-cludes the Gornje Podunavlje Special Nature Reserve (19,648 ha). The Hungarian Ramsar Site Béda-Karapancsa (1,150 ha) forms part of the Duna-Dráva National Park.
A number of wetland restoration and management activities are implemented on the Croatian and Hungarian sides, also as a part of transboundary cooperation. With the declaration of the Serbian Ramsar Site, the management of the Gornje Podunavlje Reserve is also increasingly developed in consulta-tion and cooperation with the Hungarian and Croatian neigh-bors. At a wider scale, the area is intended to become part of the planned Transboundary Biosphere Reserve along the Drava and Mura rivers, with parts in Austria, Croatia, Hun-gary, Serbia and Slovenia.
198 | part IV

tIsza suB-BasIn67
Hungary, Romania, Slovakia, Serbia and Ukraine share the sub-ba-sin of the 966-km long Tisza.68 The Tisza has the largest sub-basin of the Danube River Basin. Major transboundary tributaries include the Mures/Maros, Körös/Criş, Somes/Szamos and Slaná/Sajó, and Bodrog (shared by Hungary, Slovakia and Ukraine), among others.
The sub-basin of the Tisza River can be divided into two main parts: (1) the mountainous catchments of the Tisza and the tributaries in Ukraine, Romania and Eastern –Slovakia; and (2) the lowland parts, mainly in Hungary and in Serbia. The Tisza River itself can be divid-ed into three parts: the Upper-Tisza, upstream from the confluence of the Somes/Szamos River; the Middle-Tisza between the mouth
of the Somes/Szamos and the Mures/Maros rivers; and the Lower-Tisza, downstream from the confluence of the Mures/Maros River.
Sub-basin of the Tiszacountry area in the country (km2) country’s share (%)Ukraine 12 732 8.1Romania 72 620 42.6Slovakia 15 247 9.7Hungary 46 213 29.4Serbia 10 374 6.6Total 157 186
Source: Ministry of Environment and Water, Hungary and Central Statistic Office (Hungary, Budapest), 2009; the Danube Basin Analysis (WFD Roof Report 2004).
Renewable water resources in the Tisza sub-basin
countrySurface water resources
(×106 m3/year)groundwater resources
(×106 m3/year)Total water resources
(×106 m3/year)Water resources per capita
(m3/year/person)Ukraine 7 040a 333.5 7 374 5 924Romania 2 770 1 495 4 264b 819Slovakia 5 216c 430d 5 646 3 381Hungary 27 215e 901 28 116 6 945Serbia 25 291f 500 25 791 26 738
a Source: Regional Environmental Report on Zakarpaskaya oblast, 2009.b Mean value for 1995-2007 period. Source: Environmental Management Programms in hydrographic basins of rivers Mures/Maros, Somes/Szamos-Tisza, Krisuri, Banat.c Mean value for 1961-2000 period.d Determined for year 2008.e Based on average surface water run-off for the years 1960 to 2000. Source: Middle-Tisza District Environment and Water Directorate (Szolnok, Hungary).f Determined at Senta hydrographic station as the average value for the years 1946 to 2006.g Average annual run-off.
KöRöS – cRiSuRi hoLocene, pLeiSTocene TRanSBounDaRy aquiFeR (hoRToBágy-nagyKunSág BihaR noRTheRn paRT) (no. 87)
Romania hungaryHolocene - end of Pleistocene, sand, loess, loessal sand, boulders, gravel to fine sands; medium links with surface water.Area (km2) 6 700 9 000Thickness: mean, max (m) 25, - N/AGroundwater uses and functions Used for drinking water, irrigation water,
livestock farms.N/A
Other information Associated groundwater body ROCR01 (Oradea) is of good quantitative and chemical status.
Associated groundwater body HU_p.2.6.1 (Nyírség Southern Part, Hajdúság)
is of poor quantitative status.
HU _p.2.6.1 is of good chemical status.
popuLaTion anD LanD coveR in The TiSZa SuB-BaSin
Source: UNEP/DEWA/GRID-Europe 2011.Note: For the location of the gauging stations, the basin map of the Danube River should be referred to.
67 Based on information provided by Hungary, Romania, Serbia, Slovakia and Ukraine, as well as the Draft of Integrated Tisza River Basin Management Plan for public consultation.
68 The river is also known as the Tysa.
18 Se
nta
17 Sz
eged
12 Vy
lok
Disc
harg
e (m
3 s-1) (
loga
rithm
ic sc
ale)
3650
210
10
4000
863
3718
(Tys
a)
(Tisz
a)
(Tisa
)1
10
100
1000
10000
58 85
802
QavQmaxQmin
Popu
lation
(in m
illion
s)
0
1
2
3
4
5
6
Ukra
ineSlo
vakia
Serb
iaRo
man
iaHu
ngar
y
4.0
5.2
1.0
1.71.2
Country information/other
1%3%
45%
30%
21%
Surface with little or no vegetation (<1%)Water bodies (<1%)Wetlands (<1%)
ForestGrassland/Shrubland
Others
Urban/Industrial areas
Cultivated
198 | part IV Chapter 5 Drainage basin of the black sea | 199

hoRToBágy, nagyKunSág, BihaR noRTheRn paRT (no. 88) aquiFeR
Romania hungaryHolocene, end of Pleistocene, loess, loessal sand, sand, mud; medium links with surface water.Area (km2) 3 148 N/AThickness: mean, max (m) 30 N/AGroundwater uses and functions Used for drinking water, water supply
of industry, livestock farm.N/A
Other information N/A
N/A
Associated groundwater body HU _p.2.6.2 is of poor quantitative status.
HU _p.2.6.2 is of good chemical status.
KöRöS vaLLey, SáRRéT, ShaLLoW cRişuRi aquiFeR (no. 89)
Romania hungaryHolocene - end of Pleistocene, eolian sediment, gravel to fine sands; medium links with surface water.Area (km2) 4 288 4 162Thickness: mean, max (m) 27, 15/120-150 30-40Groundwater uses and functions Used for drinking water, water supply
of industry, livestock farms.N/A
Other information Associated groundwater body ROCR06 is of good quantitative and chemical status.
HU _p.2.12.2 is of good quantitative status. HU _p.2.12.2 is of good chemical status.
BoDRog aquiFeR (no. 90)
Slovakia hungaryType 2; Holocene – Pleistocene, loamy and sandy gravels; medium links with surface water.Area (km2) 1 471 N/ARenewable groundwater resource (m3/d)
256 × 103 (for groundwater body SK1001500P) N/A
Thickness: mean, max (m) 20-23, 30 N/AGroundwater uses and functions Used 100% for drinking water, (regionally important)
abstracted primarily through springs, a small proportion through wells. Total abstraction 465 × 106 m3 in 2007.
N/A
SLovenSKy KRaS/aggTeLeK aquiFeR (no. 91)
hungary SlovakiaThe most important aquifer part is karstified Middle and Upper Triassic limestone and dolomites.Area (km2) 4 493a 598Renewable groundwater resource (m3/d)
43 800
(16 × 106 m3/year)
110 700
(40.4 × 10⁶ m3/year)Thickness: mean, max (m) 600, 1 000Groundwater uses and functions Used 100% for drinking water, (regionally
important) abstracted primarily through springs, a small proportion through wells.
Total abstraction 465 × 106 m3 in 2007.
Mainly for drinking water (significant resource)
Other information Population in the aquifer area 14 800 (30 inhabitants/km2), in the infiltration area 7 430. Important
hydrogeological units (Hungary) are Alsóhegy, Nagyoldal, Hasagistya and Galyaság, which contain
the Aggtelek-Domica cave system.b National parks cover the majority of the area. Forestry a predominant activity (forests cover 55% of the
area), there is also non-intensive agriculture and settlements (2% of the area). Of the aquifer area, cropland covers 18% and grassland 24%; 5% and
14% of the infiltration area, respectively. The total area of the groundwater body is considered
as Nitrate-sensitive. Country code HU_K.2.2.
National parks cover the majority of the area. Forestry a predominant activity, there is also non-intensive
agriculture and settlements. Country code: SK200480KF.
a The area of the uncovered part is 181 km2.b See the related Ramsar Site assessment.
200 | part IV

noRTh anD SouTh BanaT oR noRTh anD MiD BanaT aquiFeR (no. 92)
Serbia RomaniaType 4; thick (up to 2 000 m) alluvial aquifer of sands and gravels of Tertiary to Pleistocene age in a deep tectonic depression, forming a confined aquifer sequence with Quaternary lacustrine and alluvial sediments above. Part of the Panonian basin. Weak links to surface water systems, dominant groundwater flow from Romania to Serbia. The depth of groundwater levels is 10-30 m.Border length (km) 255 267Area (km2) 2 560a 11 393Groundwater uses and functions A very important aquifer – provides 100% of
drinking water supplies in VojvodinaThe share among water uses is:
50% drinking water, 30% industry and 20% irrigation.
Other information Population 135 000 (density 53 inhabitants/km2). Separate groundwater bodies in Serbia as North and Mid Banat (both in Tisza catchment).
National codes of related groundwater bodies: RS_TIS_GW_SI_4, RS_TIS_GW_SI_7,RS_TIS_GW_I_4,RS_TIS_GW_I_7.
Population 857 600 (density 75 inhabitants/km2);
the share among water uses is: 50% drinking water,
30% industry and 20% irrigation.
a Only groundwater bodies – the regional aquifer extents at about 20,000 km2.
Land cover/land use in the area of the North and South Banat or North and Mid Banat aquifer (No. 92) (% of the part of the aquifer extending in each country)
country Water bodies (%) Forest (%) cropland (%) grassland (%)
urban/industrial areas
(%)
Surfaces with little or no
vegetation (%)Wetlands/
peatlands (%)other forms of
land use (%)Romania 0.27 19.03 72.04 3.01 5.57 N/A N/A N/ASerbia 2.00 1.93 81.72 9.74 4.61 - - -
Notes: In the Romanian part, protected area make up 6.4% of the area.
FiguRe 9: Conceptual sketch of the North and South Banat or North and Mid Banat aquifer (No. 92) (provided by Serbia)
Romania SerbiaRecharge
Total water withdrawal and withdrawals by sector from the North and South Banat or North and Mid Banat aquifer (No. 92)
country yearTotal withdrawal
m3/year agricultural % Domestic % industrya % energy % other %Romania 2008 36 100 5.10 74.32 19.94 N/A N/ASerbia Prospects
for 201578 100 3.25 73.54 22.42 N/A N/A
In Serbia the abstracted groundwater covers 90% of the wa-ter being used; 75% of the abstracted groundwater is used for drinking water supply (covering the total of drinking water sup-ply in the area), and less than 10% for irrigation, industry, live-stock and spa centres; it also supports ecosystems.
A severe increase in pumping lifts locally, which is a concern in Serbia, led to the local decrease of borehole yields and the decline of groundwater levels of 0.5 m/year (in Kikinda). Groundwater depletion has been observed on most of the wells in North part of Banat, near the borders with Romania. Groundwater level has dropped (from the 1960s until 2000) about 5-10 m in the area; a drop of more than 15 m has been observed locally. Ro-mania reports that there are no transboundary impacts; how-ever, this should be studied further, in cooperation with Serbia.
In Serbia, natural/background groundwater quality does not meet national standards due to the occurrence of natural or-ganic compounds; ammonia, boron and arsenic in high con-centrations (for arsenic, more than 100 μg/l in some parts of
Groundwater in the aquifer is recharged by precipitation and from rivers in the outcropping zone towards the mountains, as well as through the overlying younger porous-permeable strata. The estimated recharge is 112 × 106 m3/year (average for the years 1995-2007).
Phot
o by M
argi
t Misk
olcz
i
200 | part IV Chapter 5 Drainage basin of the black sea | 201
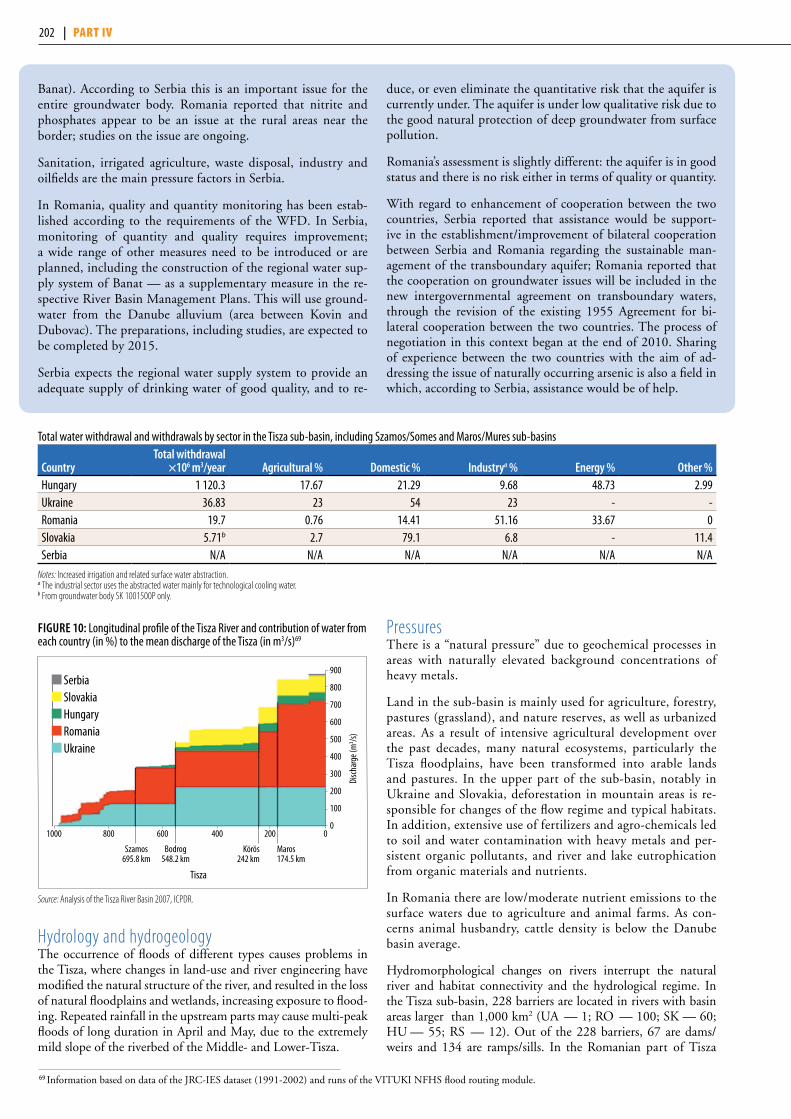
Banat). According to Serbia this is an important issue for the entire groundwater body. Romania reported that nitrite and phosphates appear to be an issue at the rural areas near the border; studies on the issue are ongoing.
Sanitation, irrigated agriculture, waste disposal, industry and oilfields are the main pressure factors in Serbia.
In Romania, quality and quantity monitoring has been estab-lished according to the requirements of the WFD. In Serbia, monitoring of quantity and quality requires improvement; a wide range of other measures need to be introduced or are planned, including the construction of the regional water sup-ply system of Banat — as a supplementary measure in the re-spective River Basin Management Plans. This will use ground-water from the Danube alluvium (area between Kovin and Dubovac). The preparations, including studies, are expected to be completed by 2015.
Serbia expects the regional water supply system to provide an adequate supply of drinking water of good quality, and to re-
duce, or even eliminate the quantitative risk that the aquifer is currently under. The aquifer is under low qualitative risk due to the good natural protection of deep groundwater from surface pollution.
Romania’s assessment is slightly different: the aquifer is in good status and there is no risk either in terms of quality or quantity.
With regard to enhancement of cooperation between the two countries, Serbia reported that assistance would be support-ive in the establishment/improvement of bilateral cooperation between Serbia and Romania regarding the sustainable man-agement of the transboundary aquifer; Romania reported that the cooperation on groundwater issues will be included in the new intergovernmental agreement on transboundary waters, through the revision of the existing 1955 Agreement for bi-lateral cooperation between the two countries. The process of negotiation in this context began at the end of 2010. Sharing of experience between the two countries with the aim of ad-dressing the issue of naturally occurring arsenic is also a field in which, according to Serbia, assistance would be of help.
Hydrology and hydrogeologyThe occurrence of floods of different types causes problems in the Tisza, where changes in land-use and river engineering have modified the natural structure of the river, and resulted in the loss of natural floodplains and wetlands, increasing exposure to flood-ing. Repeated rainfall in the upstream parts may cause multi-peak floods of long duration in April and May, due to the extremely mild slope of the riverbed of the Middle- and Lower-Tisza.
PressuresThere is a “natural pressure” due to geochemical processes in areas with naturally elevated background concentrations of heavy metals.
Land in the sub-basin is mainly used for agriculture, forestry, pastures (grassland), and nature reserves, as well as urbanized areas. As a result of intensive agricultural development over the past decades, many natural ecosystems, particularly the Tisza floodplains, have been transformed into arable lands and pastures. In the upper part of the sub-basin, notably in Ukraine and Slovakia, deforestation in mountain areas is re-sponsible for changes of the flow regime and typical habitats. In addition, extensive use of fertilizers and agro-chemicals led to soil and water contamination with heavy metals and per-sistent organic pollutants, and river and lake eutrophication from organic materials and nutrients.
In Romania there are low/moderate nutrient emissions to the surface waters due to agriculture and animal farms. As con-cerns animal husbandry, cattle density is below the Danube basin average.
Hydromorphological changes on rivers interrupt the natural river and habitat connectivity and the hydrological regime. In the Tisza sub-basin, 228 barriers are located in rivers with basin areas larger than 1,000 km2 (UA — 1; RO — 100; SK — 60; HU — 55; RS — 12). Out of the 228 barriers, 67 are dams/weirs and 134 are ramps/sills. In the Romanian part of Tisza
Total water withdrawal and withdrawals by sector in the Tisza sub-basin, including Szamos/Somes and Maros/Mures sub-basins
countryTotal withdrawal
×106 m3/year agricultural % Domestic % industrya % energy % other %Hungary 1 120.3 17.67 21.29 9.68 48.73 2.99Ukraine 36.83 23 54 23 - -Romania 19.7 0.76 14.41 51.16 33.67 0Slovakia 5.71b 2.7 79.1 6.8 - 11.4Serbia N/A N/A N/A N/A N/A N/A
Notes: Increased irrigation and related surface water abstraction.a The industrial sector uses the abstracted water mainly for technological cooling water.b From groundwater body SK 1001500P only.
900
800
700
600
500
400
300
200
100
0
Szamos695.8 km
Bodrog548.2 km
Tisza
Körös242 km
Maros174.5 km
Disc
harg
e (m
3 /s)
FiguRe 10: Longitudinal profile of the Tisza River and contribution of water from each country (in %) to the mean discharge of the Tisza (in m3/s)69
Source: Analysis of the Tisza River Basin 2007, ICPDR.
Serbia Slovakia Hungary Romania Ukraine
69 Information based on data of the JRC-IES dataset (1991-2002) and runs of the VITUKI NFHS flood routing module.
202 | part IV

sub-basin, 110 barriers are located in rivers with basin areas larger than 1,000 km2. Out of 223 river water bodies on the Tisza River and its tributaries, 75 were designated as heavily modified (75 with final status, 4 with provisional status and 2 have unknown status) representing 34% of the total river water bodies. Further, 18 river water bodies were designated artificial water bodies, representing 8% of the total number of river water bodies.
Problems related to the natural flow include various types of flooding, the challenges of meeting ecological water demands
in the smaller Tisza tributaries, and the water scarcity in the Körösök.
Afforestation of the floodplain is needed, and the spreading of invasive tree species is a concern. Another concern is lignite mining, which requires groundwater abstractions to lower the water table in the mining areas.
Industrial activities such as metallurgy and mining, as well as solid waste disposals, can contribute to deterioration of the quality of water resources in the Tisza sub-basin. Large storage tanks of chemicals and fuels are also potential accidental risk spots in the area. Manufacturing industries are responsible for a part of the emission of organic substances and nutrients (es-pecially the chemical, pulp and paper, and food industries).
The main pressures arise from untreated or insufficiently treated urban wastewater, which increases the nutrients’ and organic substances’ concentrations in the rivers. The UW-WTD has not yet been fully implemented in Hungary, Ro-mania and Slovakia. In 2007, 50% of the total population in the Romanian part of Tisza sub-basin was connected to the sewerage systems, and only 43% to the wastewater treatment plants. Discharges to the smaller tributaries in particular re-sult in a problem of nutrient and organic loads. In the Ukrain-ian part, a significant share of the wastewater (and water sup-ply) infrastructure is in a degraded condition.
Solid waste-related problems, such as plastic bottles and plas-tic bags blocking up rivers during high floods, are also an issue. Pollution from sites contaminated by former industrial activities or waste disposal has been identified as still significant
Relative importance of the influence of different pressure factors in the Tisza sub-basin by country (1 — local and moderate, 2 — local but severe, 3 — widespread but moderate, 4 — widespread and severe).pressure factors ukraine Romania Slovakia hungary SerbiaGeochemical processes or other natural pressure factors 3 (heavy metal) x 4 (sedimentation)Natural water flow in the basin (extreme events, seasonality)
4 (floods) 2 (floods) 4 (floods), 2 (scarcity)
4 (floods), 2 (ecological
demand/scarcity)
3 (drought, flooding)
Hydromorphological changes 2 (bank erosion) 2 (interruption of river and habitat
continuity)
4 (sedimentation), 2a
Agriculture and animal production 2 2 3 3 3Forestry 4b
Mining and quarrying 3 2 2 (desiccation from lignite mining)
Industry and manufacturing 2Electricity and generation (e.g. hydropower, thermal power, nuclear power station)
1 2
Sewerage (e.g. untreated/insufficiently treated urban wastewater)
3 (degraded infrastructure)
3 3 2
Waste management (e.g. controlled and uncontrolled dump sites)
4 2 3 3
Transportation (road, pipielines) 4 (oil, gas etc pipes)Storage (including tailing dams for mining and industrial wastes)
1 3 (Cd, Cu mining) 3 (ind./waste)
NavigationIndustrial accidents 2 1Discharges (permitted and illegal) from industries 2 x - 2Groundwater abstraction 1 2 4/2 3 (level decline)Surface water withdrawal 1Recreation and tourism 1 (baths)
a The longitudinal habitat continuity (mainly for fish) along the Tisza is not ensured because of the hydromorphological changes (for example: barrages) on the Hungarian part of the river. b Forestation of the floodplain by invasive tree species (obstructs flow during flood events).
Phot
o by M
argi
t Misk
olcz
i
202 | part IV Chapter 5 Drainage basin of the black sea | 203

in the event of a flood. In the Ukrainian part, a large part of the landfills for solid municipal waste have exceeded their design capacity.
Accidental pollution from the industrial sites has more com-monly only local effects, but may at worst have transboundary impacts in the Tisza sub-basin, and, as the cyanide accident at Baia Mare in 2000 demonstrated, insufficient precaution-ary measures at the site of the tailings management facilty has had significant harmful effects on people, transboundary water-courses and the environment, in general, and caused significant economic impact. Flood events, including the floods in August 2002, highlighted the problem of inundation of landfills, dump sites and storage facilities where harmful substances are depos-ited. Transfer of both pathogens and toxic substances into the water may occur.
Among other pressures and impacts that play a role in two or more of the Tisza countries are also loss of wetlands, and groundwater depletion due to abstraction.
Status and transboundary impacts The surface water status (good ecological potential, ecological status and chemical status) and the groundwater status (quan-titative and qualitative status) were evaluated in each country according to the requirements of WFD.
Some 42.4% of the Tisza’s length (~410 km) were identified as “highly modified water bodies” or “provisionally highly modi-fied water bodies”. The distribution along the length of the river is shown in Figure 11.
Altogether, 223 river water bodies were evaluated for water-quality in the Analysis of the Tisza River Basin in 2007.70 Out of these, 51 (23%) achieved high ecological status and 51 (23%) achieved moderate or worse ecological status. Some 36 (16%) river water bodies achieved high ecological potential, and 46 (21%) achieved a moderate or a worse status. The sta-tus of 39 river water bodies (17%) remained undetermined in the Non-EU countries. Based on the data mentioned above, approximately 40% of the river water bodies in the Tisza sub-basin obtained a good or better ecological status or ecological
FiguRe 11: Heavily modified water bodies of the Tisza River71
FiguRe 12: Status classification for the Tisza River72
70 Source: Draft of Integrated Tisza River Basin Management Plan.71 Source: Draft of Integrated Tisza River Basin Management Plan. In Serbia these were not finally designated, because there is no legal obligation to do so. 72 Draft of Integrated Tisza River Basin Management Plan.
204 | part IV
73 UNDP/GEF Tisza MSP - Integrating multiple benefits of wetlands and floodplains into improved transboundary management for the Tisza River Basin.74 Developed by the ICPDR Tisza Group and supported by the EU via the EU Grant – TISAR 2007 (Development of Tisza cooperation on River Basin
Management), as well as by UNDP/GEF Danube Regional Project.75 Source: Draft of Integrated Tisza River Basin Management Plan for public consultation.
potential, and around 44% have moderate or worse ecological status or ecological potential. Regarding the chemical status, 107 (48%) of the 223 river water bodies reached good chemical status and 43 (19%) failed. The chemical status is unknown for 73 (33%) river water bodies.
Responses The Tisza countries have a long history of cooperation, includ-ing the agreement on the protection of the Tisza and its tribu-taries in 1986, the establishment of the Tisza Forum to address flood issues in 2000, as well as the adoption of the Budapest Initiative (2002) at the Prime Minister level to strengthen in-ternational cooperation for sustainable management of floods. In addition to having signed the Danube River Protection Con-vention (1994) — the most comprehensive agreement in force for all Danube countries — all Tisza countries are Parties to the Carpathian Convention (2003).
In 2004, the five Tisza countries committed themselves to producing the Integrated Tisza River Basin Management Plan (ITRBM Plan, at the sub-basin level) by signing a Memorandum of Understanding. The ICPDR established the Tisza Group as the platform for strengthening coordination and information exchange related to international, regional and national activi-ties in the Tisza River Basin, and to ensure harmonization and effectiveness of related efforts. The plan integrates issues of wa-ter quality and quantity, land and water management, floods and drought. It was further developed in 2010 for submission to the public participation process, and the final plan was in-troduced to the ICPDR Tisza Countries Heads of Delegation in December 2010. This process (2008-2011) is supported by the UNDP/GEF Tisza project73 (and project partners by the ICPDR, UNDP, EU and UNEP), and is based on the Analysis of the Tisza River Basin (2007).74
Europe‘s largest flood defense system in the basin encompasses the regulation of rivers, construction of flood embankments and floodwalls, systems of drainage canals, pumping stations and designated flood detention reservoirs (polders).
Bilateral agreements on management of transboundary waters include those signed by Hungary with Romania, Ukraine, for-mer Yugoslavia (currently implemented with Serbia) and for-mer Czechoslovakia (currently implemented with Slovakia)
Joint bodies include the Hungarian-Romanian Joint Water Commission, the Hungarian-Serbian Committee on Water Management, the Hungarian-Slovakian Committee on Trans-boundary Waters, and the Serbian-Romanian Hydrotechnical Commission. All of these committees consist of plenipoten-tiaries and their members/experts. Sub-committees or expert groups have been formed, in particular to deal with flooding and water quality related issues, but also on hydrology and wa-ter management.
The plenipotentiaries of Hungary and Ukraine, Ukraine and Slovakia, as well as Romania and Ukraine also meet regularly. Bilateral Ukranian-Hungarian and Ukranian-Slovak coopera-tion is oriented in two directions: environmental protection (nature reserve management and studies), and protection of surface waters; Ukranian-Romanian cooperation is focused on surface waters protection.
The Joint Programme of Measures (JPM) is structured accord-
ing to the Significant Water Management Issues (organic, nu-trient and hazardous substances pollution, hydromorphological alterations and groundwater).75 In addition, it includes other issues on integration of water quality and water quantity as relevant issues for the Tisza sub-basin. The implementation of measures of basin-wide importance is ensured through their re-spective integration into the national programme of measures of each Tisza country. A continuous feedback mechanism from the international to the national level and vice versa will be cru-cial for the achievement of the basin-wide objectives to improve the ecological and chemical status of the water bodies.
A range of measures to address the sources of the solid waste problems, such as plastic bottles, is being tested under the UNDP/GEF Tisza Project in Ukraine with ICPDR/Coca Cola support, and the active support of local authorities. These measures range from education and awareness-raising to collec-tion and recycling activities.
Water scarcity, droughts and floods are major challenges in the Tisza sub-basin and have been identified as the key water quantity issues along with climate change, affecting low flow in particular. Among implemented measures are the construction of Cigánd and Tiszaroff (already completed and operational), and Hanyi-Tiszasüly and Nagykunság flood reservoirs (under construction) in Hungary, as part of the “Update of the Vásár-helyi Plan”.
In Romania, works are carried out to reduce the effects of natu-ral disasters in the Barcau catchment area (Suplacu de Barcau Reservoir) and for ecological restoration of Crisu Repede River. Wastewater treatment plants are rehabilitated or constructed in Cluj Napoca, Targu Mures, Satu Mare, Oradea, and Timisoara.
Trends The implementation of the Urban Wastewater Treatment Di-rective and the implementation of the EU Nitrates Directive are decisive steps to significantly improve the status of the Tisza in Hungary and its tributaries in Slovakia and Romania.
According to the Analysis of the Tisza River Basin (ICPDR, 2007), water quality evaluation must be improved by:
• Unifying the approaches to risk assessment between coun-tries, as well as providing data for impact assessment to vali-date risk estimation;
• Refining the assessment of the risk of failing to meet Good Ecological Status; and,
• Improving the monitoring of all parameters required by the WFD.
Water quantity evaluation must be improved by improving data on water uses; and developing flood maps including flood haz-ard and risk maps.
Management of water quality and quantity must be better in-tegrated by: improving flood risk maps; improving inventories of pollution hot spots; collecting and organising information on planned infrastructure projects; improving assessments re-garding excessive river engineering projects; and, defining mini-mum flows for ecological quality and pressure criteria.
Due to the common elements, the following horizontal meas-ures were identified relevant to the identified three key water
204 | part IV Chapter 5 Drainage basin of the black sea | 205
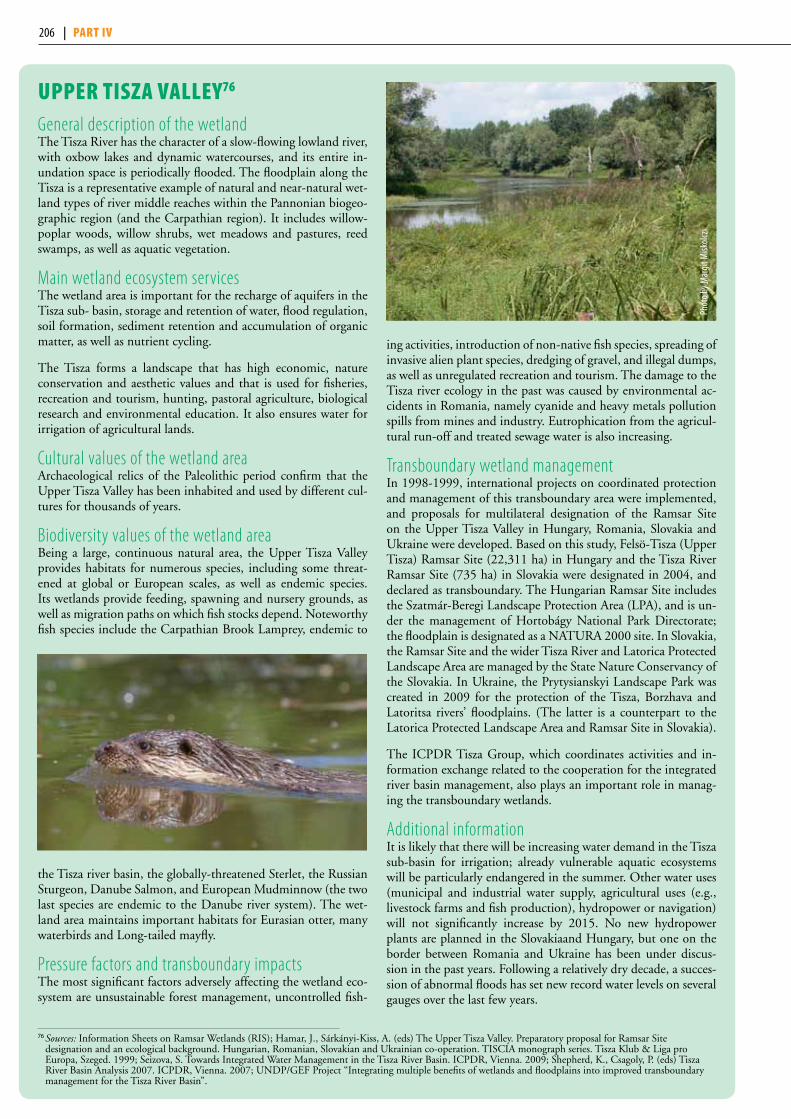
upper tIsza Valley76
General description of the wetland The Tisza River has the character of a slow-flowing lowland river, with oxbow lakes and dynamic watercourses, and its entire in-undation space is periodically flooded. The floodplain along the Tisza is a representative example of natural and near-natural wet-land types of river middle reaches within the Pannonian biogeo-graphic region (and the Carpathian region). It includes willow-poplar woods, willow shrubs, wet meadows and pastures, reed swamps, as well as aquatic vegetation.
Main wetland ecosystem services The wetland area is important for the recharge of aquifers in the Tisza sub- basin, storage and retention of water, flood regulation, soil formation, sediment retention and accumulation of organic matter, as well as nutrient cycling.
The Tisza forms a landscape that has high economic, nature conservation and aesthetic values and that is used for fisheries, recreation and tourism, hunting, pastoral agriculture, biological research and environmental education. It also ensures water for irrigation of agricultural lands.
Cultural values of the wetland areaArchaeological relics of the Paleolithic period confirm that the Upper Tisza Valley has been inhabited and used by different cul-tures for thousands of years.
Biodiversity values of the wetland areaBeing a large, continuous natural area, the Upper Tisza Valley provides habitats for numerous species, including some threat-ened at global or European scales, as well as endemic species. Its wetlands provide feeding, spawning and nursery grounds, as well as migration paths on which fish stocks depend. Noteworthy fish species include the Carpathian Brook Lamprey, endemic to
the Tisza river basin, the globally-threatened Sterlet, the Russian Sturgeon, Danube Salmon, and European Mudminnow (the two last species are endemic to the Danube river system). The wet-land area maintains important habitats for Eurasian otter, many waterbirds and Long-tailed mayfly.
Pressure factors and transboundary impactsThe most significant factors adversely affecting the wetland eco-system are unsustainable forest management, uncontrolled fish-
ing activities, introduction of non-native fish species, spreading of invasive alien plant species, dredging of gravel, and illegal dumps, as well as unregulated recreation and tourism. The damage to the Tisza river ecology in the past was caused by environmental ac-cidents in Romania, namely cyanide and heavy metals pollution spills from mines and industry. Eutrophication from the agricul-tural run-off and treated sewage water is also increasing.
Transboundary wetland managementIn 1998-1999, international projects on coordinated protection and management of this transboundary area were implemented, and proposals for multilateral designation of the Ramsar Site on the Upper Tisza Valley in Hungary, Romania, Slovakia and Ukraine were developed. Based on this study, Felsö-Tisza (Upper Tisza) Ramsar Site (22,311 ha) in Hungary and the Tisza River Ramsar Site (735 ha) in Slovakia were designated in 2004, and declared as transboundary. The Hungarian Ramsar Site includes the Szatmár-Beregi Landscape Protection Area (LPA), and is un-der the management of Hortobágy National Park Directorate; the floodplain is designated as a NATURA 2000 site. In Slovakia, the Ramsar Site and the wider Tisza River and Latorica Protected Landscape Area are managed by the State Nature Conservancy of the Slovakia. In Ukraine, the Prytysianskyi Landscape Park was created in 2009 for the protection of the Tisza, Borzhava and Latoritsa rivers’ floodplains. (The latter is a counterpart to the Latorica Protected Landscape Area and Ramsar Site in Slovakia).
The ICPDR Tisza Group, which coordinates activities and in-formation exchange related to the cooperation for the integrated river basin management, also plays an important role in manag-ing the transboundary wetlands.
Additional informationIt is likely that there will be increasing water demand in the Tisza sub-basin for irrigation; already vulnerable aquatic ecosystems will be particularly endangered in the summer. Other water uses (municipal and industrial water supply, agricultural uses (e.g., livestock farms and fish production), hydropower or navigation) will not significantly increase by 2015. No new hydropower plants are planned in the Slovakiaand Hungary, but one on the border between Romania and Ukraine has been under discus-sion in the past years. Following a relatively dry decade, a succes-sion of abnormal floods has set new record water levels on several gauges over the last few years.
76 Sources: Information Sheets on Ramsar Wetlands (RIS); Hamar, J., Sárkányi-Kiss, A. (eds) The Upper Tisza Valley. Preparatory proposal for Ramsar Site designation and an ecological background. Hungarian, Romanian, Slovakian and Ukrainian co-operation. TISCIA monograph series. Tisza Klub & Liga pro Europa, Szeged. 1999; Seizova, S. Towards Integrated Water Management in the Tisza River Basin. ICPDR, Vienna. 2009; Shepherd, K., Csagoly, P. (eds) Tisza River Basin Analysis 2007. ICPDR, Vienna. 2007; UNDP/GEF Project “Integrating multiple benefits of wetlands and floodplains into improved transboundary management for the Tisza River Basin”.
Phot
o by M
argi
t Misk
olcz
i
206 | part IV

doMICa-Baradla CaVe systeM77
General description of the wetland areaThe 25-km long Domica-Baradla Cave System is the largest (2,697 ha) subterranean hydrological system of the karst trans-boundary plateau shared by Slovakia and Hungary. The site is characterised by a permanent and episodic subterranean stream, ponds, rich dripstone features and diverse representatives of sub-surface fauna, as well as rich archaeological findings. The site lies in a low-lying karst area in the catchment of the Sajó River, which flows into the Tisza.
Main wetland ecosystem servicesGroundwater is mostly stored in karst hydrogeological structures of Triassic limestones and dolomites. The discharge of the karst springs varies between a few l/min and a few thousand l/min.
The cave system also plays a part in water purification and flood control. Caves with (seasonally) active groundwater streams have a fundamental role in supplying high quality potable water to several villages, e.g., Kečovo (Slovakia), supplied from the Br-ezovsko–Kečovský aquifer, which also supports forestry, agricul-ture, tourism and recreation.
The importance of the karstic springs has been recognised locally since medieval times for crushing ore, to mill grains, and to gener-ate electricity. Therapies for respiratory diseases have been practised in the Béke cave since 1957. The Domica-Baradla Cave System is a famous tourist site, with around 130,000 visitors annually. Regular programmes include cave tours, hiking and hunting.
Cultural values of the wetland areaThe whole Cave System is an important archaeological site, with Neolithic settlements of the Bükk Mountain Culture and charcoal drawings unique in Central Europe. Archaeological findings un-earthed from the fill of 53 caves (38 in Slovakia and 15 in Hungary) provide evidence of different cultures from the last 40,000 years.
The caves fantasy- and awe-inspiring beauty is reflected in early myths and legends, literary, artistic and musical works.
Biodiversity values of the wetland areaThe Domica-Baradla Cave System is home to more than 500 species of cave-dwelling and cave-tolerating animal species. The fauna includes rare, threatened and endemic species, as well as species first described from this region that have adapted to the dark, nutrient-poor environment. Rich bat fauna is noteworthy.
This karst region represents an independent floral area on the border between the Carpathian and the Pannonic regions. The karst surface, with its specific geological and microclimatic con-ditions, results in a particularly high diversity of habitats and spe-cies. Over a thousand plant species and nearly eight thousand animal species are found here.
Pressure factors and transboundary impactsCaves are threatened primarily by human negligence, rather than by intentional damage. Indirect threats are posed by activities on the surface affecting the caves, such as inappropriate agriculture, forestry or industry, infrastructure development, waste disposal and sewage run-off (see the assessment of the Tisza for more infor-mation on the pressures). Direct damage may be caused by works inside the cave, pollution, and collection of artefacts (biological, archaeological or palaeontological). Nowadays, any activity that may change the conditions in the cave requires official permission.
Transboundary wetland managementThe Ramsar Sites Baradla Cave System and related wetlands (2,075 ha, Hungary) and Domica (622 ha, Slovakia) were for-mally designated as a Transboundary Ramsar Site in 2001. They form part of the Transboundary Biosphere Reserve and the Ag-gtelek (Hungary) and Slovenský kras (Slovakia) National Parks. Both are included in the World Heritage List, and are part of the Natura 2000 network.
Conservation management is harmonised across the border by means of regular expert meetings and contacts. There is good co-operation in terms of cultural programmes, tourism and sport, public events and publications. An Agreement on cooperation between the State Nature Conservancy of Slovakia and the Ag-gtelek National Park Directorate in Hungary (2001) is followed up through annual implementation protocols. Long-term cooperation exists through the Slovak-Hungarian Working Group for Nature and Landscape Protection. The Hungarian-Slovak Committee on Transboundary Waters governs water use and management.
The foreseeable future of the site is likely to be positive, with growing interest in ecotourism, and developments taking into consideration the protected natural and cultural heritage, thanks to the various designations of the site. However, climate change may have serious consequences. Two consecutive floods of un-precedented water levels occurred in May-June 2010, damaging human settlements. Serious droughts have also taken place in recent years, testing the adaptive abilities of wildlife as well as human populations.
77 The site is linked to the Tisza River basin and Slovensky kras – Aggtelek aquifer. Sources: Information Sheets on Ramsar Wetlands (RIS); Tardy J. (ed) The world of wetlands in Hungary – Hungary’s Ramsar Sites (in Hungarian). 2007.
206 | part IV Chapter 5 Drainage basin of the black sea | 207

quantity issues: international coordination, communication and consultation (including education and awareness-raising), and incentives (e.g. related to land uses).
Currently, studies are being undertaken to predict the possible impacts of climate change in the sub-basin, and it is crucial that their results are followed up and adaptive measures are identified accordingly. The EU’s Sixth Framework Programme project CLAVIER (CLimate ChAnge and Variability: Impact on Central and Eastern EuRope) aims to contribute to coping with the related challenges (Hungary, Romania and Bulgaria are studied in detail). It is already estimated that, in the long term, it is likely that extreme events such as floods and droughts will occur more frequently and with greater intensity. Ukraine predicts a substantial impact on rain floods, and water avail-ability in the sub-basin is reported to have decreased by 2-5% due to the decrease in run-off during the cold period. Working towards more resilient ecosystems, which are more resilient to climate change impacts, is a 'no-regret' measure. In addition, it is already clear that long-term costly infrastructure works could be developed with different climate scenarios in mind.
soMes/szaMos suB-BasIn78
The sub-basin of the river Somes/Szamos79 is shared by Ro-mania and Hungary. The river has its source in the Rodnei Mountains in Romania and discharges into the Tisza. The sub-basin has an average elevation of about 534 m a.s.l.
There are the following reservoirs in the Romanian part: Fan-tanele, Tarnita, Somes Cald, Gilau, Colibita and Stramtori-Firiza. There are also two natural lakes in the sub-basin, Stiu-cilor and Bodi-Mogosa, and numerous fishponds.
Major transboundary tributaries in the Hungarian part of the sub-basin include the Northern Main Channel and the Eastern Channel, which are, however, only partly natural. The Szamos-Somes alluvial fan aquifer is located in the sub-basin.
Sub-basin of the Somes/Szamos Rivercountry area in the country (km2) country’s share (%)Hungary 306 2Romania 15 740 98Total 16 046
Sources: Ministry of Environment and Water, Hungary; National Administration “Apele Romane”, Romania.
Hydrology and hydrogeologyTotal theoretical renewable surface water resources are esti-mated at 4,012 × 106 m3/year, and groundwater resources to some 349 × 106 m3/year (calculated for year 2007) in the Ro-manian part of the sub-basin. In the Hungarian part, the sur-face water resources are estimated at 652 × 106 m3/year, and groundwater resources at 41 × 106 m3/year. The total in the Hungarian part equals 3,171 m3/year/capita.
Seventeen surface water bodies are heavily modified in the Ro-manian part of the sub-basin (including 6 reservoirs) because of river regulation works, embankments and bottom sills. The hydromorphology of the Hungarian part is also affected; upon regulating the river in 1890, 22 cuts through river bends were made to straighten the river.
Pressures, status and transboundary impactsUntreated or insufficiently treated urban wastewater discharg-es cause nutrient pollution. Some 55% of the total population is connected to the sewerage system (and the wastewater is treated). The influence is ranked as widespread but moderate. Discharges from manufacturing are assessed as insignificant due to decreased industrial production in the 1990s, espe-cially in heavily water-consuming industries, which has re-mained somewhat low. Furthermore, the new activity devel-oped since, in particular small industry, is technologically up to environmental standards. Uncontrolled dump sites are also a concern, but exceedence of the threshold values for ammo-nium, organic substances and lead have also been recorded in the area of the controlled Satu Mare waste dump. During ex-ceptional flooding, trash such as driftwood and plastic bottles gets washed into the river and transported across the border.
DiSchaRgeS anD popuLaTion in The SoMeS/SZaMoS SuB-BaSin
14 Cs
enge
r
13 Sa
tu M
are
Disc
harg
e (m
3 s-1) (
loga
rithm
ic sc
ale)
3360
132
3342
126
(Som
es)
(Sza
mos
)1
10
100
1000
10000
5
11
QavQmaxQmin
Sources: UNEP/DEWA/GRID-Europe 2011; National Administration “Apele Romane”, Romania (gauging station Satu Mare); Upper-Tisza regional Environmental and Water Directorate database, Hungary (gauging station Csenger).Note: For the location of the gauging stations, the basin map of the Danube River should be referred to.
78 Based on information provided by Hungary and Romania, as well as the First Assessment.79 In Romania, Somes sub-basin is considered separately to Crasna sub-basin, but the Hungarian position is that there is a single Szamos sub-basin.
Popu
lation
(in h
undr
ed th
ousa
nds)
0
5
10
15
Rom
ania
Hung
ary
0.2
13.4Country information/otherLandScanTM
208 | part IV
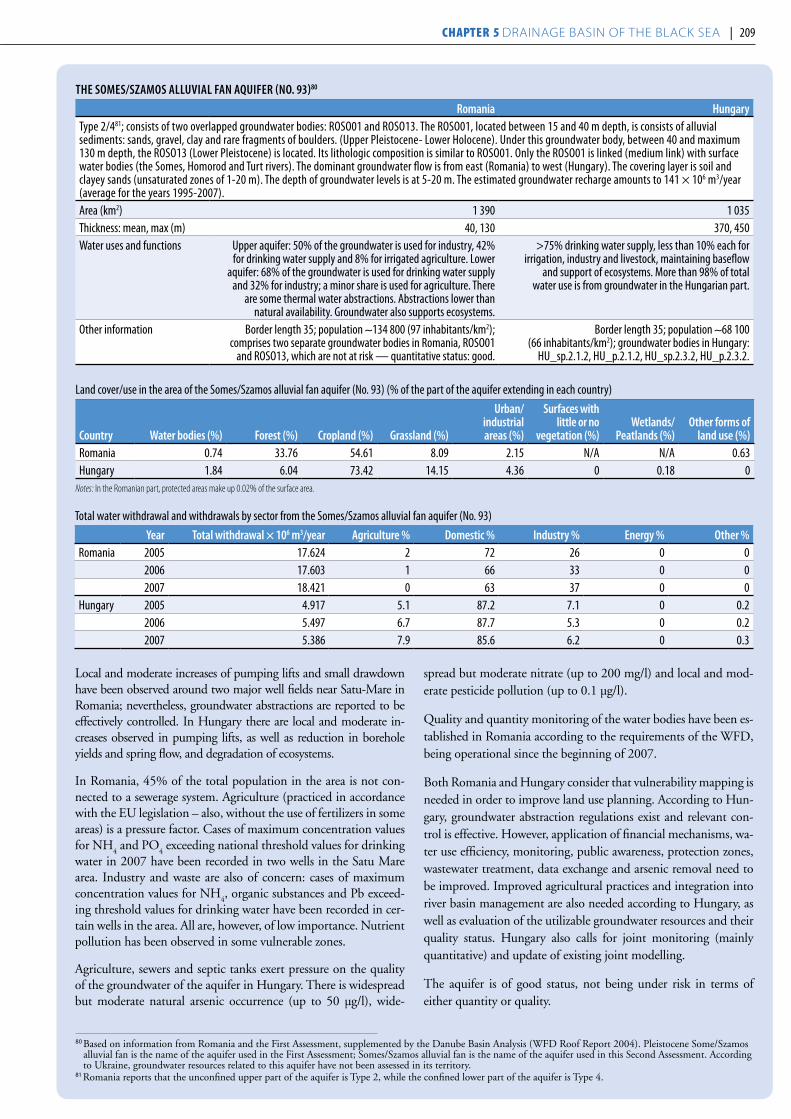
Total water withdrawal and withdrawals by sector from the Somes/Szamos alluvial fan aquifer (No. 93)
year Total withdrawal × 106 m3/year agriculture % Domestic % industry % energy % other %Romania 2005 17.624 2 72 26 0 0
2006 17.603 1 66 33 0 02007 18.421 0 63 37 0 0
Hungary 2005 4.917 5.1 87.2 7.1 0 0.22006 5.497 6.7 87.7 5.3 0 0.22007 5.386 7.9 85.6 6.2 0 0.3
Local and moderate increases of pumping lifts and small drawdown have been observed around two major well fields near Satu-Mare in Romania; nevertheless, groundwater abstractions are reported to be effectively controlled. In Hungary there are local and moderate in-creases observed in pumping lifts, as well as reduction in borehole yields and spring flow, and degradation of ecosystems.
In Romania, 45% of the total population in the area is not con-nected to a sewerage system. Agriculture (practiced in accordance with the EU legislation – also, without the use of fertilizers in some areas) is a pressure factor. Cases of maximum concentration values for NH
4 and PO
4 exceeding national threshold values for drinking
water in 2007 have been recorded in two wells in the Satu Mare area. Industry and waste are also of concern: cases of maximum concentration values for NH
4, organic substances and Pb exceed-
ing threshold values for drinking water have been recorded in cer-tain wells in the area. All are, however, of low importance. Nutrient pollution has been observed in some vulnerable zones.
Agriculture, sewers and septic tanks exert pressure on the quality of the groundwater of the aquifer in Hungary. There is widespread but moderate natural arsenic occurrence (up to 50 μg/l), wide-
spread but moderate nitrate (up to 200 mg/l) and local and mod-erate pesticide pollution (up to 0.1 μg/l).
Quality and quantity monitoring of the water bodies have been es-tablished in Romania according to the requirements of the WFD, being operational since the beginning of 2007.
Both Romania and Hungary consider that vulnerability mapping is needed in order to improve land use planning. According to Hun-gary, groundwater abstraction regulations exist and relevant con-trol is effective. However, application of financial mechanisms, wa-ter use efficiency, monitoring, public awareness, protection zones, wastewater treatment, data exchange and arsenic removal need to be improved. Improved agricultural practices and integration into river basin management are also needed according to Hungary, as well as evaluation of the utilizable groundwater resources and their quality status. Hungary also calls for joint monitoring (mainly quantitative) and update of existing joint modelling.
The aquifer is of good status, not being under risk in terms of either quantity or quality.
80 Based on information from Romania and the First Assessment, supplemented by the Danube Basin Analysis (WFD Roof Report 2004). Pleistocene Some/Szamos alluvial fan is the name of the aquifer used in the First Assessment; Somes/Szamos alluvial fan is the name of the aquifer used in this Second Assessment. According to Ukraine, groundwater resources related to this aquifer have not been assessed in its territory.
81 Romania reports that the unconfined upper part of the aquifer is Type 2, while the confined lower part of the aquifer is Type 4.
The SoMeS/SZaMoS aLLuviaL Fan aquiFeR (no. 93)80
Romania hungaryType 2/481; consists of two overlapped groundwater bodies: ROSO01 and ROSO13. The ROSO01, located between 15 and 40 m depth, is consists of alluvial sediments: sands, gravel, clay and rare fragments of boulders. (Upper Pleistocene- Lower Holocene). Under this groundwater body, between 40 and maximum 130 m depth, the ROSO13 (Lower Pleistocene) is located. Its lithologic composition is similar to ROSO01. Only the ROSO01 is linked (medium link) with surface water bodies (the Somes, Homorod and Turt rivers). The dominant groundwater flow is from east (Romania) to west (Hungary). The covering layer is soil and clayey sands (unsaturated zones of 1-20 m). The depth of groundwater levels is at 5-20 m. The estimated groundwater recharge amounts to 141 × 106 m3/year (average for the years 1995-2007).Area (km2) 1 390 1 035Thickness: mean, max (m) 40, 130 370, 450Water uses and functions Upper aquifer: 50% of the groundwater is used for industry, 42%
for drinking water supply and 8% for irrigated agriculture. Lower aquifer: 68% of the groundwater is used for drinking water supply
and 32% for industry; a minor share is used for agriculture. There are some thermal water abstractions. Abstractions lower than
natural availability. Groundwater also supports ecosystems.
>75% drinking water supply, less than 10% each for irrigation, industry and livestock, maintaining baseflow
and support of ecosystems. More than 98% of total water use is from groundwater in the Hungarian part.
Other information Border length 35; population ∼134 800 (97 inhabitants/km2); comprises two separate groundwater bodies in Romania, ROSO01
and ROSO13, which are not at risk — quantitative status: good.
Border length 35; population ∼68 100 (66 inhabitants/km2); groundwater bodies in Hungary:
HU_sp.2.1.2, HU_p.2.1.2, HU_sp.2.3.2, HU_p.2.3.2.
Land cover/use in the area of the Somes/Szamos alluvial fan aquifer (No. 93) (% of the part of the aquifer extending in each country)
country Water bodies (%) Forest (%) cropland (%) grassland (%)
urban/industrial areas (%)
Surfaces with little or no
vegetation (%)Wetlands/
peatlands (%)other forms of
land use (%)Romania 0.74 33.76 54.61 8.09 2.15 N/A N/A 0.63Hungary 1.84 6.04 73.42 14.15 4.36 0 0.18 0
Notes: In the Romanian part, protected areas make up 0.02% of the surface area.
208 | part IV Chapter 5 Drainage basin of the black sea | 209

In the central part of the basin, in Romania’s territory, heavy metal pollution (copper, zinc, lead, cadmium and mercury) from mining and related tailings dams is ranked as widespread but moderate in influence. Background levels of some heavy metals are also naturally elevated, for example arsenic in Hungary, and lead, cadmium, manganese and iron in Romania.
Groundwater abstracted in Martinesti – Micula and Doba - Vetis is used to supply drinking water to the Satu Mare and Carei cities in the Romanian part. Deep groundwater (at depths > 600m) is used for thermal spas in Satu Mare.
Some impact from agriculture is observed periodically through elevated phosphate and ammonium concentrations in Romania, but this remains local and moderate.
The influence of hydromorphological changes is considered widespread and either moderate (Romania), or severe (Hungary).
Indirect and direct water withdrawal is assessed in Hungary as less than the usable water resource.
ResponsesBoth quality and quantity of surface and groundwaters are regu-larly monitored in both countries. Surface water monitoring in the Hungarian part involves monitoring basic chemistry, biological parameters, dangerous substances and hydromorphology, as well as frequent gauging.
Sewerage systems and/or wastewater treatment plants are reha-bilitated, built and extended in Romania. In Hungary, the con-struction of sewerage systems and wastewater treatment plants for several settlements is either completed — Csenger, Csenger-sima, Szamosszeg, Tunyogmatolcs, Kocsord, Tyukod, Fehérgyar-mat, Ököritófülpös in 2009 — or planned — Csenger in 2012, Nagyecsed-Fábianhaza and Jánkmajtis-Csegöld in 2013, and ex-tension of the capacity of Szamosszeg in the near future.
Mine wastewater treatment plants are also rehabilitated, and mine closures are taking place. The County Council of Satu Mare is de-veloping a Master Plan for waste management for the county, and similar plans are under preparation in other counties of the Somes sub-basin. There are local investments for the rehabilitation and clean-up of areas around closed mines as well as tailings ponds.
Diffuse pollution from agriculture is addressed through action programmes in zones vulnerable to nitrates to adhere to the good agricultural practices’ code, involving, for example, the improve-
ment of manure application practices, and the creation of buffer zones around streams.
Some flood prevention measures are also being taken, including the EU-financed construction of the Hungarian Szamos-Kraszna reser-voir to reduce water levels in the Somes/Szamos during high flows.
Transboundary cooperationThe bilateral agreement of 2003 between Romania and Hungary has a dedicated section on the harmonization of transboundary surface water and groundwater bodies. Under this agreement, the Romanian-Hungarian Joint Hydrotechnical Commission was established that operates through three sub-commissions: hydro-meteorology and water management, water quality, and defence against floods. From 2007 to November 2010, under the Sub-commission on hydro-meteorology and water management, a WFD Working Group was constituted, in order to harmonize delineation and characterization of transboundary surface water bodies and groundwater bodies. Since November 2010, the tasks under the WFD will be dealt with within the Water Management and Hydrometorology Sub-commission.
Developing and updating existing joint models of aquifers between Romania, Hungary and Ukraine is an important challenge for the future, and should be one of the main aims for further trilateral cooperation on groundwater issues.
TrendsDuring the last 50 years, an increase of annual average tempera-ture and a decreasing tendency of the total annual precipitation has been observed in Hungary. Hungary predicts an increase of the average temperature, a decrease of average annual precipitation and a change of its distribution (more in the winter, less in the summer) in the following decades, together with the increase of the frequen-cy and intensity of extreme weather conditions. Higher and ear-lier flood levels are expected, due to increased winter run-off. The quantity of shallow groundwaters of the Great Plain, which are mainly used for irrigation, is predicted to decrease, also affecting groundwater quality and those ecosystems that depend on them. Harvests are predicted to be affected by drier and hotter summers, which will not be compensated for by warmer and rainier winters and a longer vegetative stage.
With the exception of irrigation, which is expected to remain sta-ble, water demands for all other uses are expected to increase until 2020 in the Romanian part of the sub-basin, in particular for sur-face water resources in its southern part.
nyíRSég, KeLeTi RéSZ/nyíRSég, eaST MaRgin aquiFeR (no. 94)
Romania hungaryQuaternary and Pleistocene-Pannonian Fine gravel, sands, intercalated with numerous clay and silt lenses. Upper part unconfined. Area (km2) 633 607Thickness: mean, max (m) Consists of 0-30 m thick Quaternary and 30-280 m
thick Pleistocene-Pannonian sediment sequencesConsists of 120-280 m thick Quaternary and 80-100
m thick upper Pannonian sediment sequencesNotes The Quaternary groundwater body is referred
to with the code ROSO06 (in Kraszna sub-basin) and the Pleistocene-Pannonian as ROCR06.
Groundwater table at a depth of 8 to 12 m. There are some 800 wells in the aquifer. Both of the shallow and
deeper groundwater bodies are of good quantitative and chemical status, have low TDS and chloride content
(below 10 mg/l). Groundwater body HU_sp 2.3.1. corresponds with ROSO06 on Romania’s side.
Total water withdrawal and withdrawals by sector in the Somes/Szamos sub-basin
country yearTotal withdrawal
×106 m3/year agricultural % Domestic % industry % energy % other %Hungary 2006 7.3 8 85 6 0 1Romania 2005–2007 17.624 2 72 26 0 0
210 | part IV
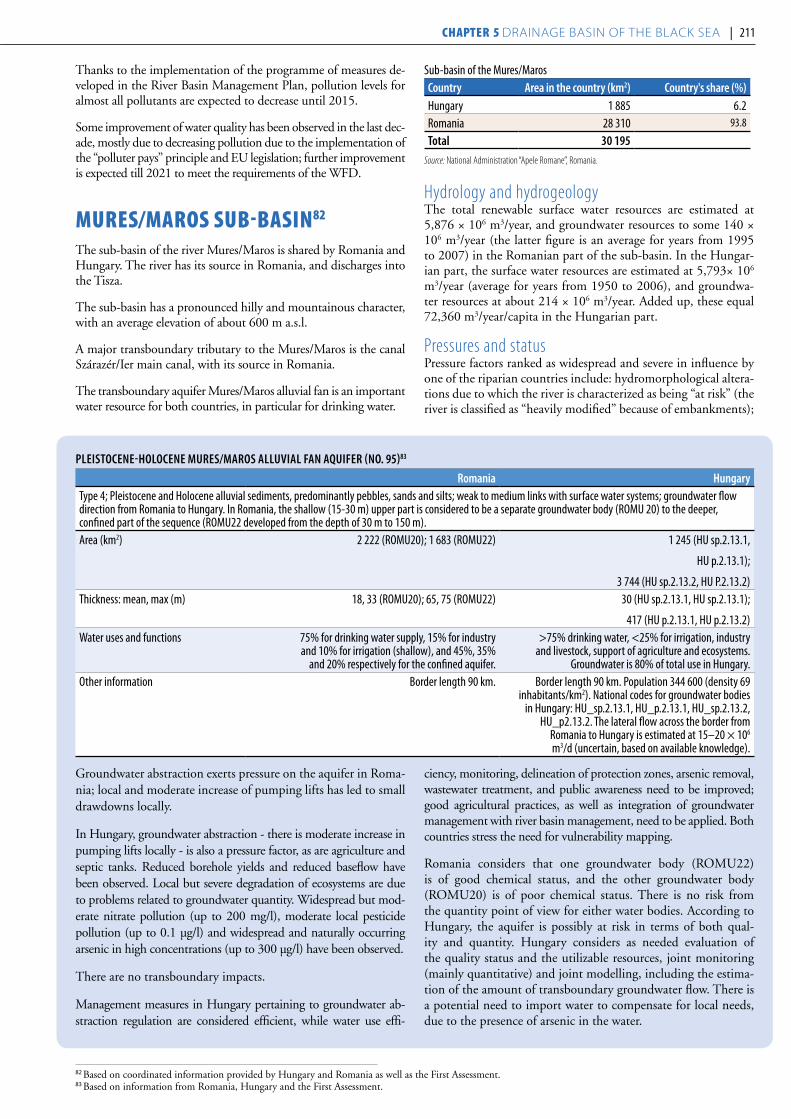
Thanks to the implementation of the programme of measures de-veloped in the River Basin Management Plan, pollution levels for almost all pollutants are expected to decrease until 2015.
Some improvement of water quality has been observed in the last dec-ade, mostly due to decreasing pollution due to the implementation of the “polluter pays” principle and EU legislation; further improvement is expected till 2021 to meet the requirements of the WFD.
Mures/Maros suB-BasIn82
The sub-basin of the river Mures/Maros is shared by Romania and Hungary. The river has its source in Romania, and discharges into the Tisza.
The sub-basin has a pronounced hilly and mountainous character, with an average elevation of about 600 m a.s.l.
A major transboundary tributary to the Mures/Maros is the canal Szárazér/Ier main canal, with its source in Romania.
The transboundary aquifer Mures/Maros alluvial fan is an important water resource for both countries, in particular for drinking water.
Sub-basin of the Mures/Maroscountry area in the country (km2) country's share (%)Hungary 1 885 6.2Romania 28 310 93.8
Total 30 195Source: National Administration “Apele Romane”, Romania.
Hydrology and hydrogeologyThe total renewable surface water resources are estimated at 5,876 × 106 m3/year, and groundwater resources to some 140 × 106 m3/year (the latter figure is an average for years from 1995 to 2007) in the Romanian part of the sub-basin. In the Hungar-ian part, the surface water resources are estimated at 5,793× 106 m3/year (average for years from 1950 to 2006), and groundwa-ter resources at about 214 × 106 m3/year. Added up, these equal 72,360 m3/year/capita in the Hungarian part.
Pressures and statusPressure factors ranked as widespread and severe in influence by one of the riparian countries include: hydromorphological altera-tions due to which the river is characterized as being “at risk” (the river is classified as “heavily modified” because of embankments);
pLeiSTocene-hoLocene MuReS/MaRoS aLLuviaL Fan aquiFeR (no. 95)83
Romania hungaryType 4; Pleistocene and Holocene alluvial sediments, predominantly pebbles, sands and silts; weak to medium links with surface water systems; groundwater flow direction from Romania to Hungary. In Romania, the shallow (15-30 m) upper part is considered to be a separate groundwater body (ROMU 20) to the deeper, confined part of the sequence (ROMU22 developed from the depth of 30 m to 150 m).Area (km2) 2 222 (ROMU20); 1 683 (ROMU22) 1 245 (HU sp.2.13.1,
HU p.2.13.1);
3 744 (HU sp.2.13.2, HU P.2.13.2) Thickness: mean, max (m) 18, 33 (ROMU20); 65, 75 (ROMU22) 30 (HU sp.2.13.1, HU sp.2.13.1);
417 (HU p.2.13.1, HU p.2.13.2)Water uses and functions 75% for drinking water supply, 15% for industry
and 10% for irrigation (shallow), and 45%, 35% and 20% respectively for the confined aquifer.
>75% drinking water, <25% for irrigation, industry and livestock, support of agriculture and ecosystems.
Groundwater is 80% of total use in Hungary.Other information Border length 90 km. Border length 90 km. Population 344 600 (density 69
inhabitants/km2). National codes for groundwater bodies in Hungary: HU_sp.2.13.1, HU_p.2.13.1, HU_sp.2.13.2,
HU_p2.13.2. The lateral flow across the border from Romania to Hungary is estimated at 15–20 × 106 m3/d (uncertain, based on available knowledge).
82 Based on coordinated information provided by Hungary and Romania as well as the First Assessment.83 Based on information from Romania, Hungary and the First Assessment.
Groundwater abstraction exerts pressure on the aquifer in Roma-nia; local and moderate increase of pumping lifts has led to small drawdowns locally.
In Hungary, groundwater abstraction - there is moderate increase in pumping lifts locally - is also a pressure factor, as are agriculture and septic tanks. Reduced borehole yields and reduced baseflow have been observed. Local but severe degradation of ecosystems are due to problems related to groundwater quantity. Widespread but mod-erate nitrate pollution (up to 200 mg/l), moderate local pesticide pollution (up to 0.1 μg/l) and widespread and naturally occurring arsenic in high concentrations (up to 300 μg/l) have been observed.
There are no transboundary impacts.
Management measures in Hungary pertaining to groundwater ab-straction regulation are considered efficient, while water use effi-
ciency, monitoring, delineation of protection zones, arsenic removal, wastewater treatment, and public awareness need to be improved; good agricultural practices, as well as integration of groundwater management with river basin management, need to be applied. Both countries stress the need for vulnerability mapping.
Romania considers that one groundwater body (ROMU22) is of good chemical status, and the other groundwater body (ROMU20) is of poor chemical status. There is no risk from the quantity point of view for either water bodies. According to Hungary, the aquifer is possibly at risk in terms of both qual-ity and quantity. Hungary considers as needed evaluation of the quality status and the utilizable resources, joint monitoring (mainly quantitative) and joint modelling, including the estima-tion of the amount of transboundary groundwater flow. There is a potential need to import water to compensate for local needs, due to the presence of arsenic in the water.
210 | part IV Chapter 5 Drainage basin of the black sea | 211
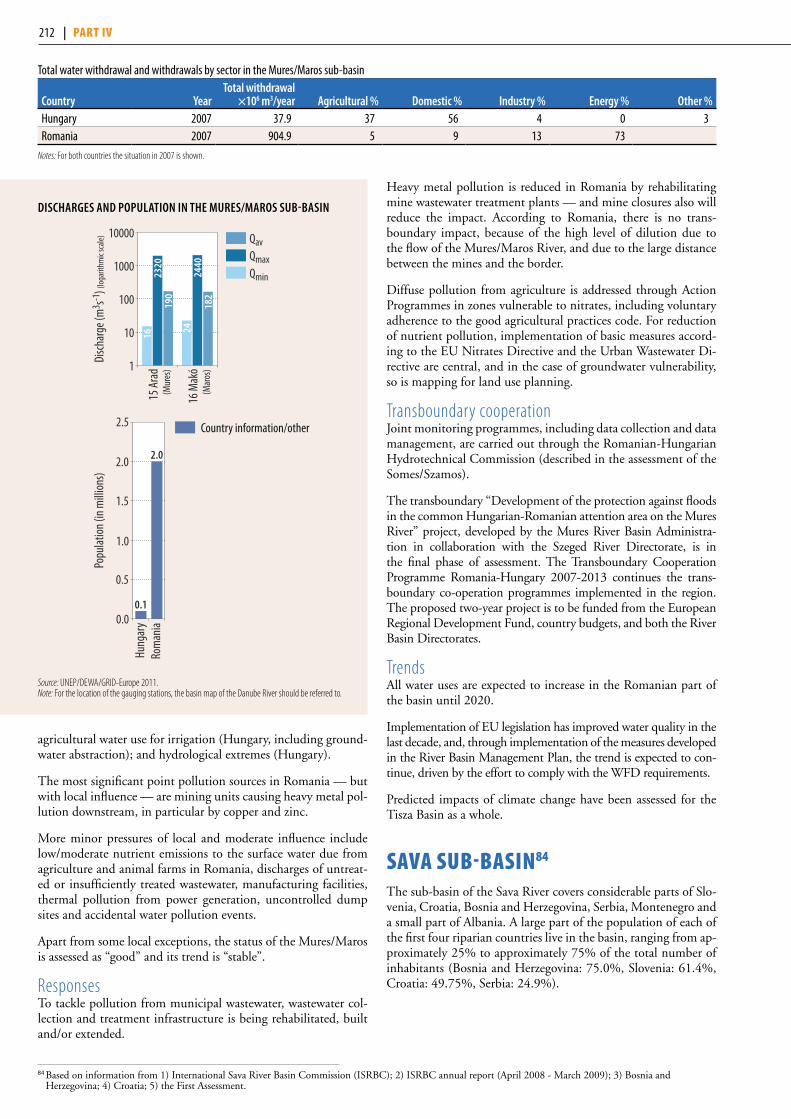
agricultural water use for irrigation (Hungary, including ground-water abstraction); and hydrological extremes (Hungary).
The most significant point pollution sources in Romania — but with local influence — are mining units causing heavy metal pol-lution downstream, in particular by copper and zinc.
More minor pressures of local and moderate influence include low/moderate nutrient emissions to the surface water due from agriculture and animal farms in Romania, discharges of untreat-ed or insufficiently treated wastewater, manufacturing facilities, thermal pollution from power generation, uncontrolled dump sites and accidental water pollution events.
Apart from some local exceptions, the status of the Mures/Maros is assessed as “good” and its trend is “stable”.
ResponsesTo tackle pollution from municipal wastewater, wastewater col-lection and treatment infrastructure is being rehabilitated, built and/or extended.
Heavy metal pollution is reduced in Romania by rehabilitating mine wastewater treatment plants — and mine closures also will reduce the impact. According to Romania, there is no trans-boundary impact, because of the high level of dilution due to the flow of the Mures/Maros River, and due to the large distance between the mines and the border.
Diffuse pollution from agriculture is addressed through Action Programmes in zones vulnerable to nitrates, including voluntary adherence to the good agricultural practices code. For reduction of nutrient pollution, implementation of basic measures accord-ing to the EU Nitrates Directive and the Urban Wastewater Di-rective are central, and in the case of groundwater vulnerability, so is mapping for land use planning.
Transboundary cooperationJoint monitoring programmes, including data collection and data management, are carried out through the Romanian-Hungarian Hydrotechnical Commission (described in the assessment of the Somes/Szamos).
The transboundary “Development of the protection against floods in the common Hungarian-Romanian attention area on the Mures River” project, developed by the Mures River Basin Administra-tion in collaboration with the Szeged River Directorate, is in the final phase of assessment. The Transboundary Cooperation Programme Romania-Hungary 2007-2013 continues the trans-boundary co-operation programmes implemented in the region. The proposed two-year project is to be funded from the European Regional Development Fund, country budgets, and both the River Basin Directorates.
TrendsAll water uses are expected to increase in the Romanian part of the basin until 2020.
Implementation of EU legislation has improved water quality in the last decade, and, through implementation of the measures developed in the River Basin Management Plan, the trend is expected to con-tinue, driven by the effort to comply with the WFD requirements.
Predicted impacts of climate change have been assessed for the Tisza Basin as a whole.
saVa suB-BasIn84
The sub-basin of the Sava River covers considerable parts of Slo-venia, Croatia, Bosnia and Herzegovina, Serbia, Montenegro and a small part of Albania. A large part of the population of each of the first four riparian countries live in the basin, ranging from ap-proximately 25% to approximately 75% of the total number of inhabitants (Bosnia and Herzegovina: 75.0%, Slovenia: 61.4%, Croatia: 49.75%, Serbia: 24.9%).
Total water withdrawal and withdrawals by sector in the Mures/Maros sub-basin
country yearTotal withdrawal
×106 m3/year agricultural % Domestic % industry % energy % other %Hungary 2007 37.9 37 56 4 0 3Romania 2007 904.9 5 9 13 73
Notes: For both countries the situation in 2007 is shown.
DiSchaRgeS anD popuLaTion in The MuReS/MaRoS SuB-BaSin
Source: UNEP/DEWA/GRID-Europe 2011.Note: For the location of the gauging stations, the basin map of the Danube River should be referred to.
16 M
akó
15 A
rad
Disc
harg
e (m
3 s-1) (
loga
rithm
ic sc
ale)
2440
182
2320
190
(Mur
es)
(Mar
os)1
10
100
1000
10000
16 24
QavQmaxQmin
Popu
lation
(in m
illion
s)
0.0
0.5
1.0
1.5
2.0
2.5
Rom
ania
Hung
ary
0.1
2.0
Country information/other
84 Based on information from 1) International Sava River Basin Commission (ISRBC); 2) ISRBC annual report (April 2008 - March 2009); 3) Bosnia and Herzegovina; 4) Croatia; 5) the First Assessment.
212 | part IV
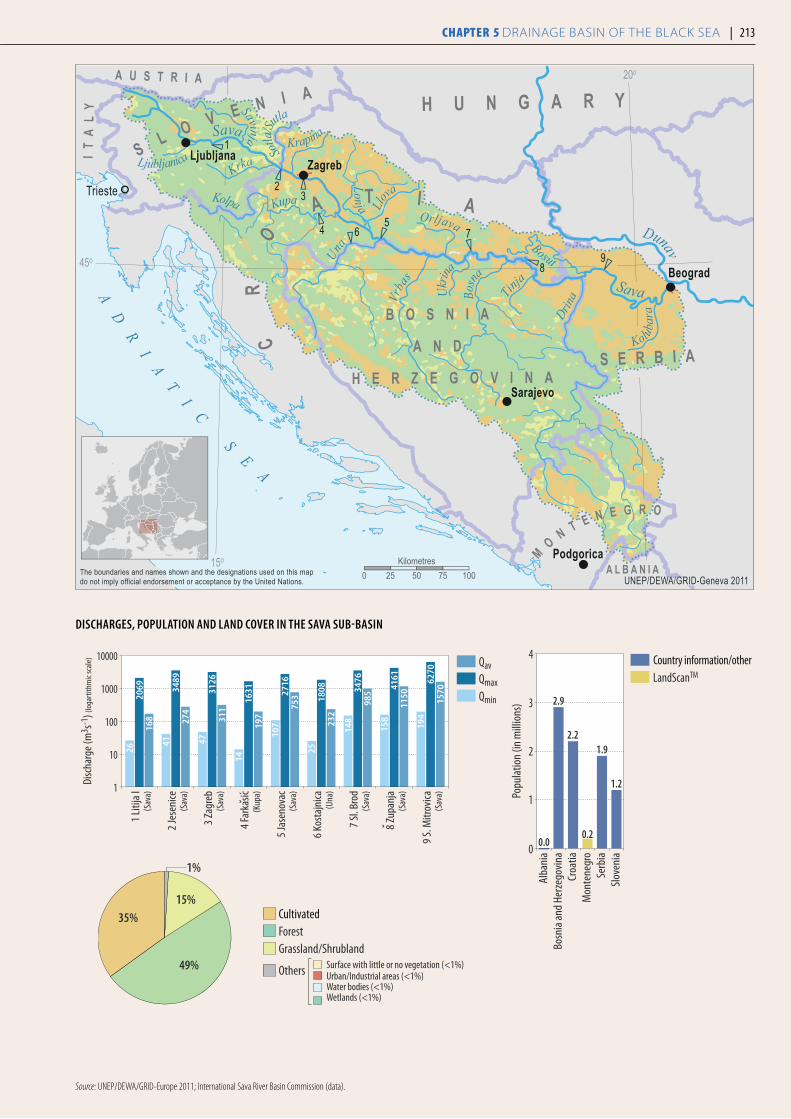
1%
35%
49%
15%
Surface with little or no vegetation (<1%)Urban/Industrial areas (<1%)Water bodies (<1%)Wetlands (<1%)
ForestGrassland/Shrubland
Others
Cultivated
9 S.
Mitr
ovica
8 Zu
panj
a
7 Sl
. Bro
d
6 Ko
staj
nica
5 Ja
seno
vac
4 Fa
rkas
ic
3 Za
greb
2 Je
seni
ce
1 Li
tija
I
107
753
26
168
41
274
47
311
14
197
25
232
148
985
158
1150
194
1570
2069 34
89
3126
1631 27
16
1808 34
76
4161 62
70
(Sav
a)
(Sav
a)
(Sav
a)
(Kup
a)
(Sav
a)
(Una
)
(Sav
a)
(Sav
a)
(Sav
a)
Disc
harg
e (m
3 s-1) (
loga
rtith
mic
scal
e) 10000
1000
100
10
1
QavQmaxQmin
DiSchaRgeS, popuLaTion anD LanD coveR in The Sava SuB-BaSin
Source: UNEP/DEWA/GRID-Europe 2011; International Sava River Basin Commission (data).
Country information/other
Popu
latio
n (in
mill
ions
)
LandScanTM
0
3
1
2
4
Slov
enia
Serb
iaM
onte
negr
oCr
oatia
Bosn
ia an
d He
rzeg
ovin
aAl
bani
a
2.9
2.2
0.2
1.9
1.2
0.0
1
23
4 56 7
89
Zagreb
Trieste
Beograd
Sarajevo
Ljubljana
Podgorica
AD
RI
AT
IC
S
EA
Sava
Sava
Koluba
ra
Bosut
DrinaTin
ja
Bosna
Ukrin
a
Orljava
Vrba
s
Una
Llova
Lonja
Krapina
Sotla
/Su
tla
Savinja
LjubljanicaKrka
Dunav
KupaKolpa
B O S N I A
A N D
H E R Z E G O V I N AS E R B I A
H U N G A R Y
CR
O
A T I A
S L O V E N I AI
TA
LY
A U S T R I A
MO N T E N E G R O
A L B A N I A
45o
15o
20o
The boundaries and names shown and the designations used on this mapdo not imply official endorsement or acceptance by the United Nations. UNEP/DEWA/GRID-Geneva 20110 25 50 75 100
Kilometres
212 | part IV Chapter 5 Drainage basin of the black sea | 213

Sub-basin of the Sava Rivercountry area in the country (km2) country’s share (%)Slovenia 11 734.8 12.0Croatia 25 373.5 26.0Bosnia and Herzegovina
38 349.1 39.2
Serbia 15 147.0 15.5Montenegro 6 929.8 7.1Albania 179.0 0.2
Hydrology and hydrogeologyThe Sava River emerges in the mountains of western Slovenia, and flows into the Danube in Belgrade, Serbia. The river is the third longest tributary (about 945 km) to the Danube, and the largest by discharge (1,722 m3/s, at its mouth). In Croatia, the average discharge of the Sava River immediately upstream from the mouth of the Sutla River is around 290 m3/s; it is 314 m3/s in Zagreb, and around 1,179 m3/s at the point where the Sava exits Croatia.
The morphology of the terrain of the basin varies. While rugged mountains (the Alps and the Dinarides) dominate in the upper part, the middle and lower parts of the sub-basin are character-ized by flat plains and low mountains. The areas in the south, in Croatia, Bosnia and Herzegovina, Montenegro and Albania, drained by tributaries ending in the middle section of the Sava watercourse, are characterised by mountainous landscape. Eleva-tion varies between 2,864 m a.s.l. (Triglav, Slovenian Alps) and about 71 m a.s.l. at the mouth of the Sava.
The Sava receives water from a number of rivers, many of which are also transboundary. The most important is the Drina (itself transboundary); its main tributaries are the Piva, Tara, Lim and Uvac rivers.
Main transboundary rivers of the hydrographical network of the Sava sub-basin.
RiverSub-basin area
(km2)
countr(ies) that the sub-basin is
extending to Length (km)Sotla/Sutla 584.3 SI, HR 88.6Kupa/Kolpa 10 225.6 HR,SI 297.2Una 9 828.9 BA,HR 214.6Drina 20 319.9 ME, AL, BA, RS 346.0Bosut 2 943.1 HR, RS N/A
The Sava sub-basin hosts large lowland forest complexes and the largest complex of alluvial wetlands in the Danube basin (Posavi-na - Central Sava basin).
The Sava is a fine example of a river where some of the floodplains are still intact, supporting both mitigation of floods and biodiver-sity. There are six designated Ramsar Sites; a number of areas of ecological importance are under national protection status.
The Sava sub-basin is characterized by diverse geological struc-tures and a complex tectonic setting under which two main units stand out, determining the type of aquifers that occur: the Pan-nonian area with dominant inter-granular aquifers and the Di-narides with mostly limestone aquifers.
The following transboundary aquifers were identified as hydrau-lically linked to the surface waters of the Sava River basin, and included in the First Assessment:
(1) Cerknica/Kupa (No. 96), shared by Croatia and Slovenia;85
(2) Radovica-Metlika/Zumberak (No. 98), shared by Slovenia and Croatia;86
(3) Bregana-Obrezje/Sava-Samobor (No. 99), shared by Slove-nia and Croatia;87
(4) Bizeljsko/Sutla (No. 101), shared by Slovenia and Croatia;88
(5) Srem-West Srem/Sava (No. 107), shared by Serbia and Croatia;(6) Posavina I/Sava (No. 108), shared by Bosnia and Herzego-
vina and Croatia;(7) Kupa (No. 109), shared by Bosnia and Herzegovina and
Croatia;89
(8) Pleševica/Una (No. 110), shared by Bosnia and Herzegovina and Croatia;
(9) Lim (No. 111), shared by Serbia and Montenegro;(10) Tara massif (No. 112), shared by Serbia and Bosnia and
Herzegovina;90 and,(11) Macva-Semberija (No. 113), shared by Serbia and Bosnia
and Herzegovina.
Since the First Assessment, further research by some of the countries has revealed the existence of additional transboundary groundwater bodies that form part of the earlier identified aqui-fers.91 Information on the transboundary aquifers that have been identified as hydraulically linked with the surface water systems of the Sava River are already in the First Assessment. It is likely that the list developed is not exhaustive.
Total water withdrawal and withdrawals by sector in the Sava sub-basina
Total withdrawal ×106 m3/year agricultural % Domestic % industry % energy % other %
Total 48 969 11.2 16 5.9 66.9 -a Figures for years 2003-2005.
85 According to Croatia this transboundary aquifer is under consideration but not approved.86 According to Croatia this transboundary aquifer is under consideration but not approved.87 According to Croatia this transboundary aquifer is under consideration but not approved.88 According to Croatia this transboundary aquifer is under consideration but not approved.89 According to Croatia this transboundary aquifer is under consideration but not approved.90 According to both countries there are negligible conditions for nomination as a transboundary groundwater.91 Bosnia and Herzegovina, Croatia, Slovenia and Serbia identified the most important groundwater bodies for the needs of the Sava River Basin Analysis Report,
being prepared by the ISRBC. According to the ISRBC secretariat, information related to groundwater bodies was incomplete. As far as the issue of transboundary groundwater bodies is concerned, this will be reconsidered in the next phase of the preparation of the Sava River Basin Management Plan (coordinated by the ISRBC).
214 | part IV

92 Based on information from Slovenia, Croatia and the First Assessment. Part of the Kolpa - carbonate fissured and karst aquifers of the Kolpa and Ljubljanica area; Kupa/Kolpa (shared by Slovenia and Croatia) and Ljubljanica (Slovenia) Rivers are tributaries to the Sava. Cerknica/Kupa and Kočevje Goteniška gora are part of the same system.
93 Based on information from Slovenia. Part of the Kolpa - carbonate fissured and karst aquifers of Kolpa and Ljubljanica area; Kupa/Kolpa (shared by Slovenia and Croatia) and Ljubljanica (Slovenia) Rivers are tributaries of the Sava. Cerknica/Kupa and Kočevje Goteniška gora are part of the same system.
94 Based on information from Slovenia, Croatia and the First Assessment. Part of the Kolpa - Carbonate fissured and karst aquifers of Kolpa and Ljubljanica area; Kupa/Kolpa (shared by Slovenia and Croatia) and Ljubljanica (Slovenia) Rivers are tributaries of the Sava.
ceRKnica/Kupa aquiFeR (no. 96)92
croatia SloveniaType 2 (SI)/the aquifer represents none of the illustrated transboundary aquifer types (HR); Mesozoic/Triassic and Cretaceous limestones and dolomites with some alluvium in the river valley; unconfined; groundwater flow from Croatia to Slovenia and Slovenia to Croatia; weak to medium links with surface waters systems. Area (km2) 137 238Groundwater uses and functions Drinking water supply; supports ecosystems. Local drinking water supply.Pressure factors None, very scattered population; occasional
bacteriological pollution the only reported problem. None, sparsely populated, forested with some
extensive agriculture and pasture.Groundwater management measures Existing protection zones. NoneTrends and future prospects Border length 32 km. No transboundary impact. Delineation
of transboundary groundwater is needed (through common research), and development of monitoring programmes.
Border length 32 km. Population ~10 635 (45 inhabitants/km2). No transboundary impact. Not at risk. Good chemical status. It is unclear which groundwater
systems in the two countries correspond to each other; delineation of transboundary groundwater needs
common research and a bilateral decision to propose a transboundary groundwater, if appropriate.
Other information Transboundary aquifer under consideration, but not approved. In the basin of the Kolpa/Kupa River, within that of the Sava River.
KoČevje goTenišKa goRa aquiFeR (no. 97)93
croatia SloveniaType 2; Mesozoic carbonates, dominantly karstic limestones; pressure condition: unconfined; weak to medium links to surface water systems. Area (km2) 595Groundwater uses and functions Local drinking water supplyOther information Population ~18 200 (density 31 inhabitants/km2)
RaDovica-MeTLiKa/ZuMBeRaK94 aquiFeR (no. 98)
croatia SloveniaType 2 (SI)/represents none of the illustrated transboundary aquifer types (HR); Upper Triassic dolomites, Upper Jurassic limestones, Cretaceous predominantly carbonate flysch, karstic limestones; pressure condition: partly confined, partly unconfined. Recharge area is both in Croatia and Slovenia; the discharge area is in Slovenia. Possible drainage to surface water systems; groundwater covers the total of the water used in the Slovenian part; groundwater flow direction from Croatia to Slovenia.Area (km2) 158 27Thickness: mean, max (m) N/A > 1 000Groundwater uses and functions Dominantly drinking water supply; supports ecosystems. Drinking water supply (town of Metlika;
minimum yield of the Obrh spring discharge is about 50 l/s, maximum yield > 1 000 l/s).
Pressure factors None Agricultural activities, lack of sewerage in the spring recharge area, illegal dump sites. Spring water
quantity fluctuates significantly due to the karstic geomorphology; water scarcity in summer; possible problem regarding the surface stream hydrological
minimum during drought. Excessive pesticide content, possible microbiological pollution; turbidity
of water is observed during the rainy season.Groundwater management measures Need to establish protection zones. Wastewater treatment infrastructure and septic tank
systems being developed in the recharge area (in progress); uncontrolled dump site inventory and appropriate
addressing of the issue is planned for the future.Other information Border length 12 km. Agreed delineation of transboundary
groundwaters, and development of monitoring programmes are needed. No transboundary impact. Transboundary
aquifer under consideration, but not approved
Border length 12 km. Population ~2 500 (density 95 inhabitants/km2). No transboundary impact. Possible additional and more frequent discharge reduction in
drought seasons as a consequence of climate change.
It is unclear which groundwater systems in the two countries correspond to each other; delineation of
transboundary groundwater systems needs common research and a bilateral expert group decision to propose
a transboundary groundwater, if appropriate.
Establishment of transboundary water protection areas is needed; the bilateral water
commission will discuss this issue.
214 | part IV Chapter 5 Drainage basin of the black sea | 215
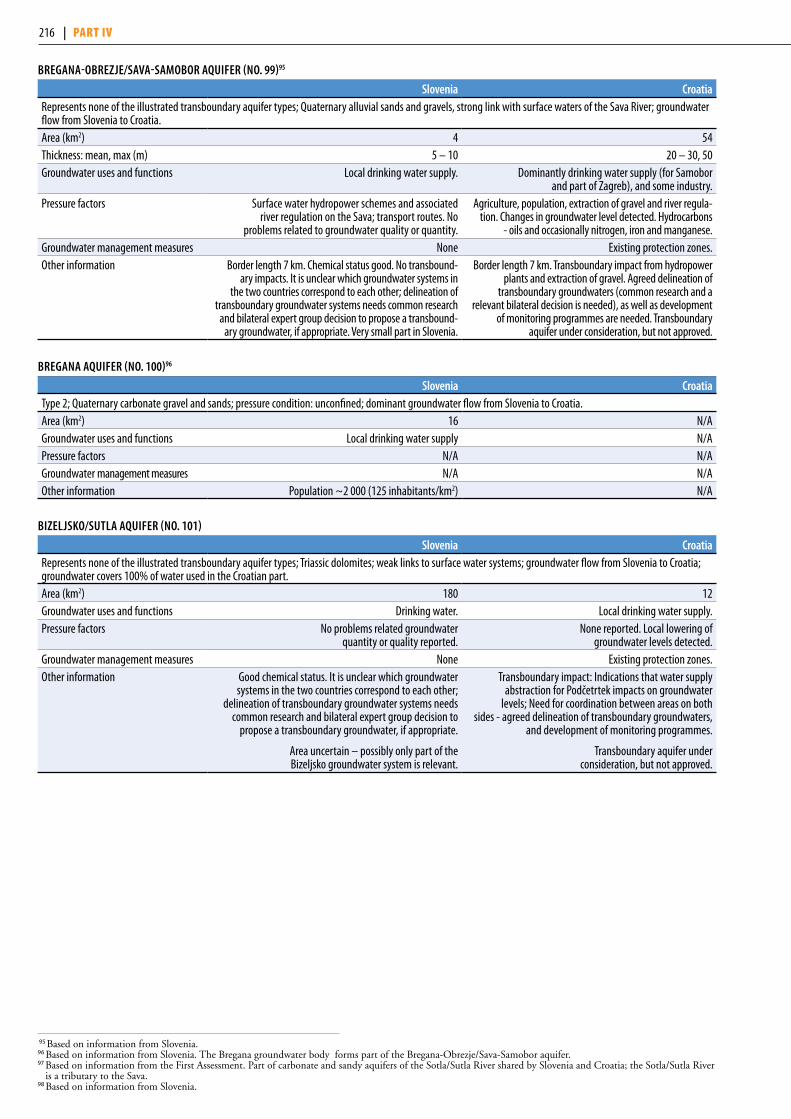
BRegana-oBReZje/Sava-SaMoBoR aquiFeR (no. 99)95
Slovenia croatiaRepresents none of the illustrated transboundary aquifer types; Quaternary alluvial sands and gravels, strong link with surface waters of the Sava River; groundwater flow from Slovenia to Croatia.Area (km2) 4 54Thickness: mean, max (m) 5 – 10 20 – 30, 50Groundwater uses and functions Local drinking water supply. Dominantly drinking water supply (for Samobor
and part of Zagreb), and some industry.Pressure factors Surface water hydropower schemes and associated
river regulation on the Sava; transport routes. No problems related to groundwater quality or quantity.
Agriculture, population, extraction of gravel and river regula-tion. Changes in groundwater level detected. Hydrocarbons
- oils and occasionally nitrogen, iron and manganese.Groundwater management measures None Existing protection zones.Other information Border length 7 km. Chemical status good. No transbound-
ary impacts. It is unclear which groundwater systems in the two countries correspond to each other; delineation of
transboundary groundwater systems needs common research and bilateral expert group decision to propose a transbound-
ary groundwater, if appropriate. Very small part in Slovenia.
Border length 7 km. Transboundary impact from hydropower plants and extraction of gravel. Agreed delineation of
transboundary groundwaters (common research and a relevant bilateral decision is needed), as well as development
of monitoring programmes are needed. Transboundary aquifer under consideration, but not approved.
BRegana aquiFeR (no. 100)96
Slovenia croatiaType 2; Quaternary carbonate gravel and sands; pressure condition: unconfined; dominant groundwater flow from Slovenia to Croatia. Area (km2) 16 N/AGroundwater uses and functions Local drinking water supply N/APressure factors N/A N/AGroundwater management measures N/A N/AOther information Population ~2 000 (125 inhabitants/km2) N/A
BiZeLjSKo/SuTLa aquiFeR (no. 101)
Slovenia croatiaRepresents none of the illustrated transboundary aquifer types; Triassic dolomites; weak links to surface water systems; groundwater flow from Slovenia to Croatia; groundwater covers 100% of water used in the Croatian part.Area (km2) 180 12Groundwater uses and functions Drinking water. Local drinking water supply.Pressure factors No problems related groundwater
quantity or quality reported.None reported. Local lowering of
groundwater levels detected.Groundwater management measures None Existing protection zones.Other information Good chemical status. It is unclear which groundwater
systems in the two countries correspond to each other; delineation of transboundary groundwater systems needs
common research and bilateral expert group decision to propose a transboundary groundwater, if appropriate.
Area uncertain – possibly only part of the Bizeljsko groundwater system is relevant.
Transboundary impact: Indications that water supply abstraction for Podčetrtek impacts on groundwater
levels; Need for coordination between areas on both sides - agreed delineation of transboundary groundwaters,
and development of monitoring programmes.
Transboundary aquifer under consideration, but not approved.
95 Based on information from Slovenia. 96 Based on information from Slovenia. The Bregana groundwater body forms part of the Bregana-Obrezje/Sava-Samobor aquifer.97 Based on information from the First Assessment. Part of carbonate and sandy aquifers of the Sotla/Sutla River shared by Slovenia and Croatia; the Sotla/Sutla River
is a tributary to the Sava.98 Based on information from Slovenia.
216 | part IV
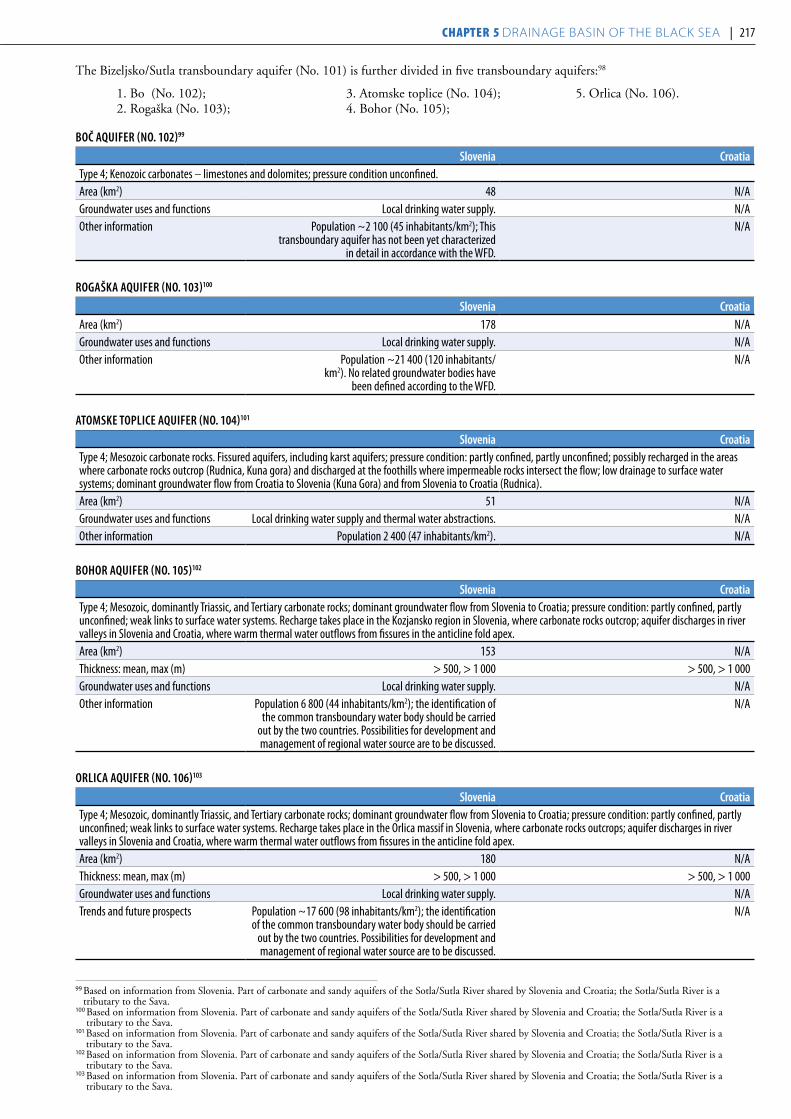
BoČ aquiFeR (no. 102)99
Slovenia croatiaType 4; Kenozoic carbonates – limestones and dolomites; pressure condition unconfined.Area (km2) 48 N/AGroundwater uses and functions Local drinking water supply. N/AOther information Population ~2 100 (45 inhabitants/km2); This
transboundary aquifer has not been yet characterized in detail in accordance with the WFD.
N/A
RogašKa aquiFeR (no. 103)100
Slovenia croatiaArea (km2) 178 N/AGroundwater uses and functions Local drinking water supply. N/AOther information Population ~21 400 (120 inhabitants/
km2). No related groundwater bodies have been defined according to the WFD.
N/A
aToMSKe TopLice aquiFeR (no. 104)101
Slovenia croatiaType 4; Mesozoic carbonate rocks. Fissured aquifers, including karst aquifers; pressure condition: partly confined, partly unconfined; possibly recharged in the areas where carbonate rocks outcrop (Rudnica, Kuna gora) and discharged at the foothills where impermeable rocks intersect the flow; low drainage to surface water systems; dominant groundwater flow from Croatia to Slovenia (Kuna Gora) and from Slovenia to Croatia (Rudnica).Area (km2) 51 N/AGroundwater uses and functions Local drinking water supply and thermal water abstractions. N/AOther information Population 2 400 (47 inhabitants/km2). N/A
BohoR aquiFeR (no. 105)102
Slovenia croatiaType 4; Mesozoic, dominantly Triassic, and Tertiary carbonate rocks; dominant groundwater flow from Slovenia to Croatia; pressure condition: partly confined, partly unconfined; weak links to surface water systems. Recharge takes place in the Kozjansko region in Slovenia, where carbonate rocks outcrop; aquifer discharges in river valleys in Slovenia and Croatia, where warm thermal water outflows from fissures in the anticline fold apex. Area (km2) 153 N/AThickness: mean, max (m) > 500, > 1 000 > 500, > 1 000Groundwater uses and functions Local drinking water supply. N/AOther information Population 6 800 (44 inhabitants/km2); the identification of
the common transboundary water body should be carried out by the two countries. Possibilities for development and management of regional water source are to be discussed.
N/A
oRLica aquiFeR (no. 106)103
Slovenia croatiaType 4; Mesozoic, dominantly Triassic, and Tertiary carbonate rocks; dominant groundwater flow from Slovenia to Croatia; pressure condition: partly confined, partly unconfined; weak links to surface water systems. Recharge takes place in the Orlica massif in Slovenia, where carbonate rocks outcrops; aquifer discharges in river valleys in Slovenia and Croatia, where warm thermal water outflows from fissures in the anticline fold apex.Area (km2) 180 N/AThickness: mean, max (m) > 500, > 1 000 > 500, > 1 000Groundwater uses and functions Local drinking water supply. N/ATrends and future prospects Population ~17 600 (98 inhabitants/km2); the identification
of the common transboundary water body should be carried out by the two countries. Possibilities for development and management of regional water source are to be discussed.
N/A
99 Based on information from Slovenia. Part of carbonate and sandy aquifers of the Sotla/Sutla River shared by Slovenia and Croatia; the Sotla/Sutla River is a tributary to the Sava.
100 Based on information from Slovenia. Part of carbonate and sandy aquifers of the Sotla/Sutla River shared by Slovenia and Croatia; the Sotla/Sutla River is a tributary to the Sava.
101 Based on information from Slovenia. Part of carbonate and sandy aquifers of the Sotla/Sutla River shared by Slovenia and Croatia; the Sotla/Sutla River is a tributary to the Sava.
102 Based on information from Slovenia. Part of carbonate and sandy aquifers of the Sotla/Sutla River shared by Slovenia and Croatia; the Sotla/Sutla River is a tributary to the Sava.
103 Based on information from Slovenia. Part of carbonate and sandy aquifers of the Sotla/Sutla River shared by Slovenia and Croatia; the Sotla/Sutla River is a tributary to the Sava.
The Bizeljsko/Sutla transboundary aquifer (No. 101) is further divided in five transboundary aquifers:98
1. Boő (No. 102); 2. Rogaška (No. 103);
3. Atomske toplice (No. 104);4. Bohor (No. 105);
5. Orlica (No. 106).
216 | part IV Chapter 5 Drainage basin of the black sea | 217
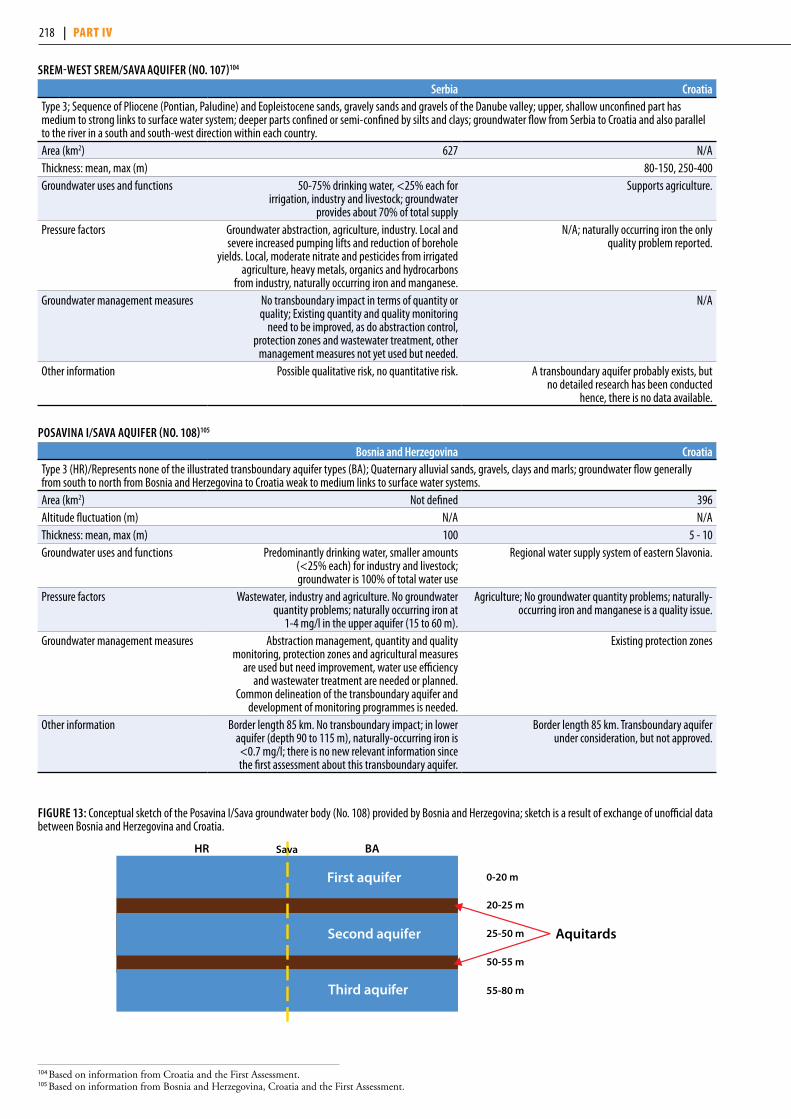
SReM-WeST SReM/Sava aquiFeR (no. 107)104
Serbia croatiaType 3; Sequence of Pliocene (Pontian, Paludine) and Eopleistocene sands, gravely sands and gravels of the Danube valley; upper, shallow unconfined part has medium to strong links to surface water system; deeper parts confined or semi-confined by silts and clays; groundwater flow from Serbia to Croatia and also parallel to the river in a south and south-west direction within each country.Area (km2) 627 N/AThickness: mean, max (m) 80-150, 250-400Groundwater uses and functions 50-75% drinking water, <25% each for
irrigation, industry and livestock; groundwater provides about 70% of total supply
Supports agriculture.
Pressure factors Groundwater abstraction, agriculture, industry. Local and severe increased pumping lifts and reduction of borehole
yields. Local, moderate nitrate and pesticides from irrigated agriculture, heavy metals, organics and hydrocarbons
from industry, naturally occurring iron and manga nese.
N/A; naturally occurring iron the only quality problem reported.
Groundwater management measures No transboundary impact in terms of quantity or quality; Existing quantity and quality monitoring
need to be improved, as do abstraction control, protection zones and wastewater treatment, other
management measures not yet used but needed.
N/A
Other information Possible qualitative risk, no quantitative risk. A transboundary aquifer probably exists, but no detailed research has been conducted
hence, there is no data available.
poSavina i/Sava aquiFeR (no. 108)105
Bosnia and herzegovina croatiaType 3 (HR)/Represents none of the illustrated transboundary aquifer types (BA); Quaternary alluvial sands, gravels, clays and marls; groundwater flow generally from south to north from Bosnia and Herzegovina to Croatia weak to medium links to surface water systems.Area (km2) Not defined 396Altitude fluctuation (m) N/A N/AThickness: mean, max (m) 100 5 - 10Groundwater uses and functions Predominantly drinking water, smaller amounts
(<25% each) for industry and livestock; groundwater is 100% of total water use
Regional water supply system of eastern Slavonia.
Pressure factors Wastewater, industry and agriculture. No groundwater quantity problems; naturally occurring iron at
1-4 mg/l in the upper aquifer (15 to 60 m).
Agriculture; No groundwater quantity problems; naturally-occurring iron and manganese is a quality issue.
Groundwater management measures Abstraction management, quantity and quality monitoring, protection zones and agricultural measures
are used but need improvement, water use efficiency and wastewater treatment are needed or planned.
Common delineation of the transboundary aquifer and development of monitoring programmes is needed.
Existing protection zones
Other information Border length 85 km. No transboundary impact; in lower aquifer (depth 90 to 115 m), naturally-occurring iron is <0.7 mg/l; there is no new relevant information since the first assessment about this transboundary aquifer.
Border length 85 km. Transboundary aquifer under consideration, but not approved.
FiguRe 13: Conceptual sketch of the Posavina I/Sava groundwater body (No. 108) provided by Bosnia and Herzegovina; sketch is a result of exchange of unofficial data between Bosnia and Herzegovina and Croatia.
104 Based on information from Croatia and the First Assessment. 105 Based on information from Bosnia and Herzegovina, Croatia and the First Assessment.
HR BASava
0-20 m
20-25 m
25-50 m
50-55 m
55-80 m
First aquifer
Second aquifer Aquitards
Third aquifer
218 | part IV

Kupa aquiFeR (no. 109)106
Bosnia and herzegovina croatiaType 2 (HR)/represents none of the illustrated transboundary aquifer types (BA); Triassic and Cretaceous karstic limestones and dolomites; groundwater flow generally from east to west from Bosnia and Herzegovina to Croatia (HR)/from south to north (BA); strong links to surface water systems (associated with the Kupa River in BA and Korana River in HR).Area (km2) N/A 100Groundwater uses and functions No data Predominantly drinking water; also supports
ecosystems; 20% of total water used groundwater.Groundwater management measures Agreed delineation of possible transboundary
groundwater is needed.Agreed delineation of transboundary groundwaters,
and development of monitoring programmes are needed. Need to establish protection zones.
Other information Border length 130 km. Possible transboundary aquifer should be considered. There is no clear indication (based
on field research) that this aquifer is transboundary.
Border length 130 km. Transboundary aquifer under consideration, but not approved.
pLeševica/una aquiFeR (no. 110)107
Bosnia and herzegovina croatiaType 2 (BA)/represents none of the illustrated transboundary aquifer types (HR); thick Mesozoic (dominantly Cretaceous), Neogene (dominantly Miocene) and Quaternary limestones and dolomites; flow from Croatia (swallow holes in Krbavsko, Lapačko and Koreničko fields and the area of National Park Plitvice) to Bosnia and Herzegovina (towards the strong karstic springs in the Una River watershed, namely Klokot I and II, Privilica, ostrovica, Žegar etc); thick Palaeozoic, Mesozoic and Cenozoic limestones and dolomites, in hydraulic connection with overlying alluvial sediments; strong links with surface waters; flow from Croatia to Bosnia and Herzegovina. Area (km2) N/A 1 564Thickness: mean, max (m) 1 000, > 1 500 200, 500Groundwater uses and functions >75% to support ecosystems and fishing, 25-50%
of abstraction is used for drinking water supply.Predominantly drinking water supply; also supports
ecosystems; some 25% of total water use is groundwater.Pressure factors Wastewater from septic pits is the main pressure
factor. PCBs from former military airport Željava and relay station in Plješevica mountain might be
an issue of concern; more research is needed in this regard. Solid waste disposal is also a pressure factor.
Polluted water is locally drawn into the aquifer. Local but severe nitrogen, heavy metals and pathogens.
Communities. No problems related to groundwater quantity.
Groundwater management measures Many used but need improving, others needed or currently planned.
Protection zones exist at Klokot, Privilica, Toplica, Ostrovica and need to be established
in Korenički Izvor, Stipinovac and Mlinac.Other information Transboundary impact for quality only. Sinkholes in Bosnia and Herzegovina with
transboundary effects in Croatia. Transboundary aquifer under consideration, but not approved.
Border length 130 km. Delineation of transboundary groundwaters needs common research and bilateral decision to propose a transboundary groundwater, if appropriate. Development of monitoring programmes is needed.
106 Based on information from Bosnia and Herzegovina, Croatia and the First Assessment.107 Based on information from Bosnia and Herzegovina, Croatia and the First Assessment.
218 | part IV Chapter 5 Drainage basin of the black sea | 219
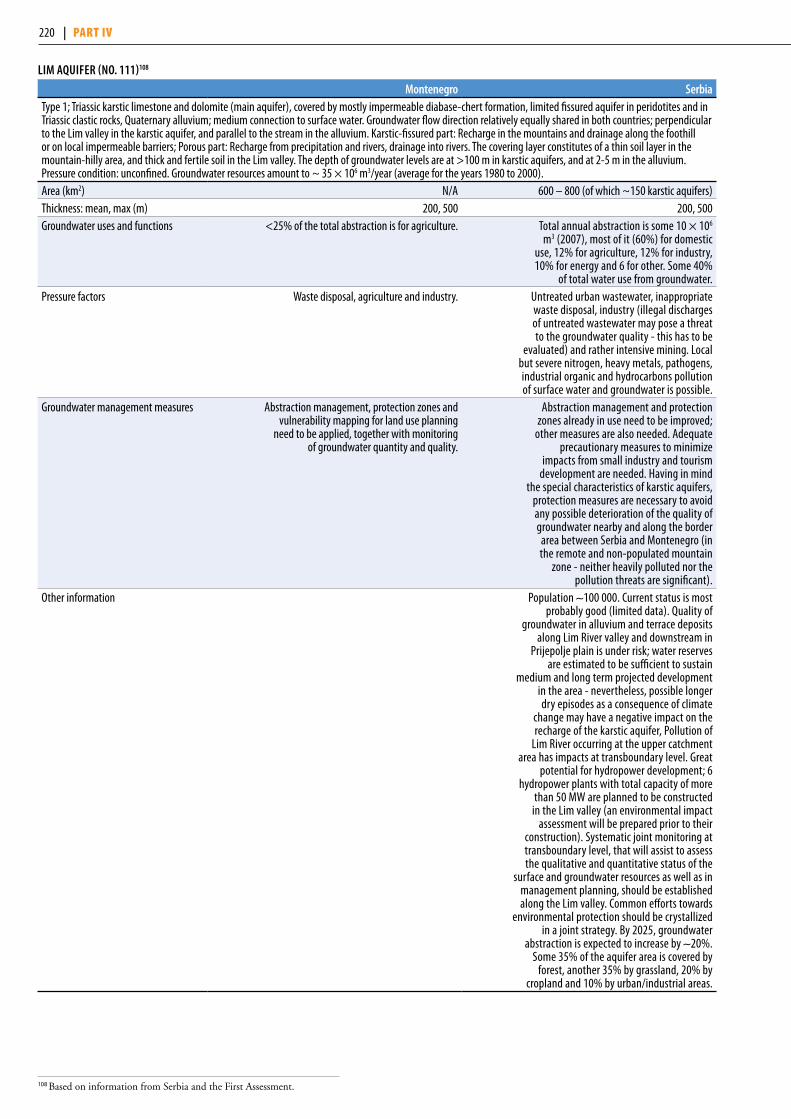
LiM aquiFeR (no. 111)108
Montenegro SerbiaType 1; Triassic karstic limestone and dolomite (main aquifer), covered by mostly impermeable diabase-chert formation, limited fissured aquifer in peridotites and in Triassic clastic rocks, Quaternary alluvium; medium connection to surface water. Groundwater flow direction relatively equally shared in both countries; perpendicular to the Lim valley in the karstic aquifer, and parallel to the stream in the alluvium. Karstic-fissured part: Recharge in the mountains and drainage along the foothill or on local impermeable barriers; Porous part: Recharge from precipitation and rivers, drainage into rivers. The covering layer constitutes of a thin soil layer in the mountain-hilly area, and thick and fertile soil in the Lim valley. The depth of groundwater levels are at >100 m in karstic aquifers, and at 2-5 m in the alluvium. Pressure condition: unconfined. Groundwater resources amount to ~ 35 × 106 m3/year (average for the years 1980 to 2000).Area (km2) N/A 600 – 800 (of which ~150 karstic aquifers)Thickness: mean, max (m) 200, 500 200, 500Groundwater uses and functions <25% of the total abstraction is for agriculture. Total annual abstraction is some 10 × 106
m3 (2007), most of it (60%) for domestic use, 12% for agriculture, 12% for industry, 10% for energy and 6 for other. Some 40%
of total water use from groundwater.Pressure factors Waste disposal, agriculture and industry. Untreated urban wastewater, inappropriate
waste disposal, industry (illegal discharges of untreated wastewater may pose a threat to the groundwater quality - this has to be
evaluated) and rather intensive mining. Local but severe nitrogen, heavy metals, pathogens, industrial organic and hydrocarbons pollution of surface water and groundwater is possible.
Groundwater management measures Abstraction management, protection zones and vulnerability mapping for land use planning
need to be applied, together with monitoring of groundwater quantity and quality.
Abstraction management and protection zones already in use need to be improved;
other measures are also needed. Adequate precautionary measures to minimize
impacts from small industry and tourism development are needed. Having in mind
the special characteristics of karstic aquifers, protection measures are necessary to avoid any possible deterioration of the quality of groundwater nearby and along the border
area between Serbia and Montenegro (in the remote and non-populated mountain
zone - neither heavily polluted nor the pollution threats are significant).
Other information Population ∼100 000. Current status is most probably good (limited data). Quality of
groundwater in alluvium and terrace deposits along Lim River valley and downstream in
Prijepolje plain is under risk; water reserves are estimated to be sufficient to sustain
medium and long term projected development in the area - nevertheless, possible longer dry episodes as a consequence of climate
change may have a negative impact on the recharge of the karstic aquifer, Pollution of
Lim River occurring at the upper catchment area has impacts at transboundary level. Great
potential for hydropower development; 6 hydropower plants with total capacity of more
than 50 MW are planned to be constructed in the Lim valley (an environmental impact
assessment will be prepared prior to their construction). Systematic joint monitoring at transboundary level, that will assist to assess the qualitative and quantitative status of the
surface and groundwater resources as well as in management planning, should be established along the Lim valley. Common efforts towards
environmental protection should be crystallized in a joint strategy. By 2025, groundwater
abstraction is expected to increase by ∼20%. Some 35% of the aquifer area is covered by
forest, another 35% by grassland, 20% by cropland and 10% by urban/industrial areas.
108 Based on information from Serbia and the First Assessment.
220 | part IV

TaRa MaSSiF aquiFeR (no. 112)109
Serbia Bosnia and herzegovinaType 3; Triassic and Jurassic karstified limestones, strong links to surface water systems, groundwater flow from Serbia to Bosnia and Herzegovina (generally perpendicular to Drina River). The recharge area is estimated at 75-80 km2, while the discharge area is well defined and present as major karst springs (Perucac spring, and one submerged spring in artificial reservoir of Bajina Basta reversible hydropower plant). Depth of groundwater levels varies from 100 to over 300 m. Pressure condition: Unconfined. According to Serbia groundwater resources of Tara Massif amount to 4.47 × 10⁶ m3/year. Groundwater covers 10% of the water being used in the Serbian part. Area (km2) 211 >100Thickness: mean, max (m) 250 – 300, 600 250 – 300, 600Groundwater uses and functions 80% of groundwater for drinking purposes, 10% for
irrigated agriculture; also supports fish breeding and ecosystems. Total water withdrawals were 6 × 10⁶ m3/
year in 2008 (not taking into account water used for hydropower generation; the figure corresponding to
total water withdrawals is 1.15 × 10⁹ m3/year).
Drinking water, mostly small amounts for supplying villages.
Pressure factors Hydropower (Bajina Basta reversible hydropower plant system - including two reservoirs located at the top of the Tara plateau); intensive tourism activities at zones that are highly vulnerable to pollution; lack of sewage collection and treatment facilities (apart from a small wastewater facility treating wastewater in a touristic area); partially uncontrolled dumpsites. Moderate to strong environmental impacts (related to the Bajina
Basta reversible hydropower plant system). Issues related to intensive tourism activities at zones that are highly
vulnerable to pollution; continuous bacterial pollution due to leakage of septic tanks; potential pollution from
uncontrolled dumpsites; accidental pollution (road).
Wastewater, mining activity. Local moderate drawing of polluted water into the aquifer. Bacteriological
contamination is a quality problem.
Groundwater management measures Groundwater abstraction management and quantity monitoring in use needs improvement. Assessment
of the vulnerability of karst groundwater is necessary as a basic tool for groundwater protection and
development planning in an area that is almost entirely (91%) a National Park; establishment of an integrated
monitoring system is essential in this regard.
Protection zones needed for some significant but as yet unused karst springs.
Other information Estimated reserves of groundwater can sustain drinking water supply and further economic development,
particularly with regard to fish breeding, tourism and some minor hydropower generation. Population density
ranges from 1 to 5 inhabitants/km2. No transboundary impact reported. Controlled quarrying in the area has
relatively negative impacts. Some 80% of the land use is forest, 15% grassland, cropland and urban area
each <5%. Population density 1-5 inhabitants/km2.
No transboundary impact.
Negligible conditions for nomination as a transboundary groundwater.
Macva-SeMBeRija aquiFeR (no. 113)110
Serbia Bosnia and herzegovinaAlluvial aquifer - Type 3; Quaternary alluvial gravels, sandy gravels, sands, with clayey lenses; there is no transboundary flow. Drina River is a hydraulic boundary (and country border) dividing the body into two separate aquifers. In Semberija (Bosnia and Herzegovina), groundwater flow is from south to north (towards the Sava River). The Semberija alluvium aquifer is mainly recharged by the Drina River. Thermo-mineral aquifer: Type 4, Mesozoic limestones; strong links to surface water systems. Groundwater is 40-60% of total water use in the Serbian part, and 100% in the part in Bosnia and Herzegovina.Area (km2) 967 250Thickness: mean, max (m) Alluvial aquifer: 35–60, 75–100; thermo-mineral/Mesozoic limestone aquifer: >1 000 mGroundwater uses and functions 50-75% drinking water, <25% for irrigation,
industry and livestock, and support of ecosystems.Drinking water, irrigation, industry and livestock.
Pressure factors Agriculture and wastewater, some industry. Local and moderate increase in pumping lifts,
no declines in groundwater levels. Local and moderate nitrogen and pesticides from agriculture,
local and moderate heavy metals and organics from industry, natural Fe and Mn in alluvium.
Agriculture and wastewater; local and moderate increase in pumping lifts, no
significant declines in groundwater levels. Local and moderate nitrogen and
pesticides from agriculture.
Groundwater management measures Abstraction control, monitoring of groundwater, protection zones and wastewater treatment need improvement, other management measures need
to be introduced or are currently planned.
Groundwater abstraction regulation and quantity monitoring, protection zones, and
good agricultural practices used and effective, water use efficiency, public awareness,
wastewater treatment need to be applied.
109 Based on information from Serbia and the First Assessment.110 Based on information from Bosnia and Herzegovina and the First Assessment.
220 | part IV Chapter 5 Drainage basin of the black sea | 221
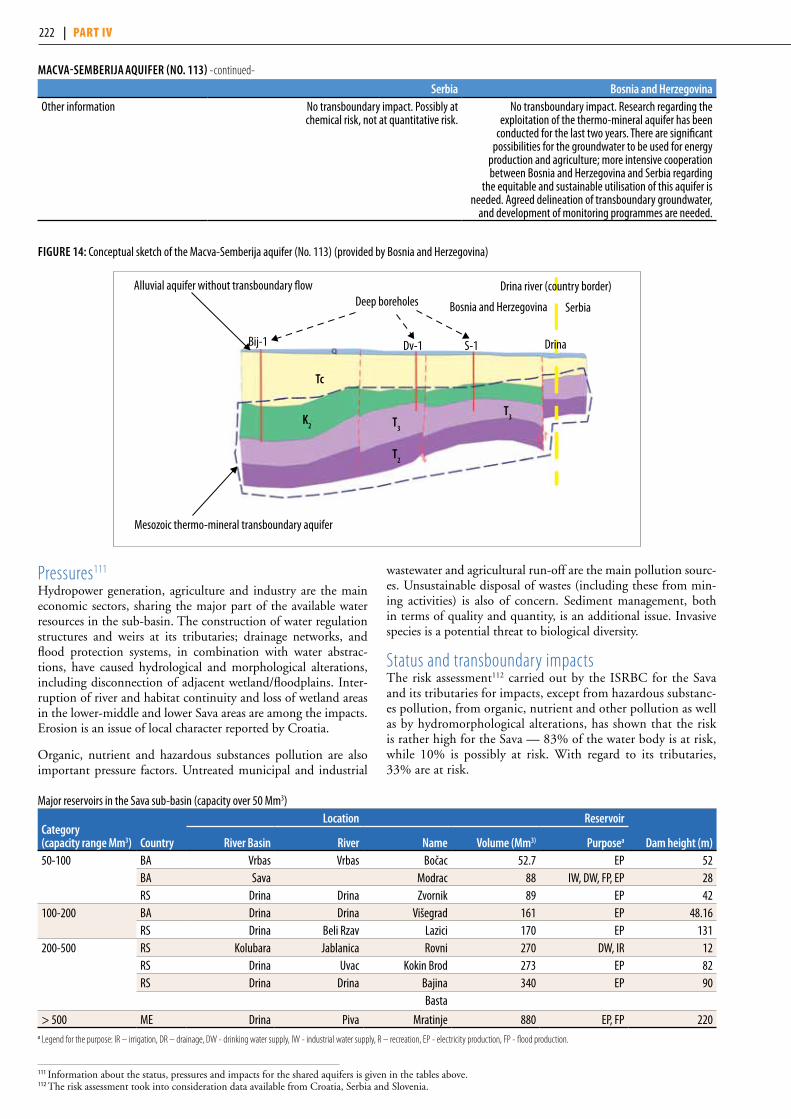
Serbia Bosnia and herzegovinaOther information No transboundary impact. Possibly at
chemical risk, not at quantitative risk.No transboundary impact. Research regarding the
exploitation of the thermo-mineral aquifer has been conducted for the last two years. There are significant
possibilities for the groundwater to be used for energy production and agriculture; more intensive cooperation between Bosnia and Herzegovina and Serbia regarding
the equitable and sustainable utilisation of this aquifer is needed. Agreed delineation of transboundary groundwater,
and development of monitoring programmes are needed.
FiguRe 14: Conceptual sketch of the Macva-Semberija aquifer (No. 113) (provided by Bosnia and Herzegovina)
111 Information about the status, pressures and impacts for the shared aquifers is given in the tables above.112 The risk assessment took into consideration data available from Croatia, Serbia and Slovenia.
Macva-SeMBeRija aquiFeR (no. 113) -continued-
Pressures111
Hydropower generation, agriculture and industry are the main economic sectors, sharing the major part of the available water resources in the sub-basin. The construction of water regulation structures and weirs at its tributaries; drainage networks, and flood protection systems, in combination with water abstrac-tions, have caused hydrological and morphological alterations, including disconnection of adjacent wetland/floodplains. Inter-ruption of river and habitat continuity and loss of wetland areas in the lower-middle and lower Sava areas are among the impacts. Erosion is an issue of local character reported by Croatia.
Organic, nutrient and hazardous substances pollution are also important pressure factors. Untreated municipal and industrial
wastewater and agricultural run-off are the main pollution sourc-es. Unsustainable disposal of wastes (including these from min-ing activities) is also of concern. Sediment management, both in terms of quality and quantity, is an additional issue. Invasive species is a potential threat to biological diversity.
Status and transboundary impactsThe risk assessment112 carried out by the ISRBC for the Sava and its tributaries for impacts, except from hazardous substanc-es pollution, from organic, nutrient and other pollution as well as by hydromorphological alterations, has shown that the risk is rather high for the Sava — 83% of the water body is at risk, while 10% is possibly at risk. With regard to its tributaries, 33% are at risk.
Major reservoirs in the Sava sub-basin (capacity over 50 Mm3)
category (capacity range Mm3) country
Location Reservoir
Dam height (m)River Basin River name volume (Mm3) purposea
50-100 BA Vrbas Vrbas Bočac 52.7 EP 52BA Sava Modrac 88 IW, DW, FP, EP 28RS Drina Drina Zvornik 89 EP 42
100-200 BA Drina Drina Višegrad 161 EP 48.16RS Drina Beli Rzav Lazici 170 EP 131
200-500 RS Kolubara Jablanica Rovni 270 DW, IR 12RS Drina Uvac Kokin Brod 273 EP 82RS Drina Drina Bajina 340 EP 90
Basta
> 500 ME Drina Piva Mratinje 880 EP, FP 220a Legend for the purpose: IR – irrigation, DR – drainage, DW - drinking water supply, IW - industrial water supply, R – recreation, EP - electricity production, FP - flood production.
Alluvial aquifer without transboundary flow
Mesozoic thermo-mineral transboundary aquifer
Drina river (country border)Deep boreholes SerbiaBosnia and Herzegovina
Bij-1 Dv-1 S-1
K2 T
3
T3
T2
Tc
Drina
222 | part IV
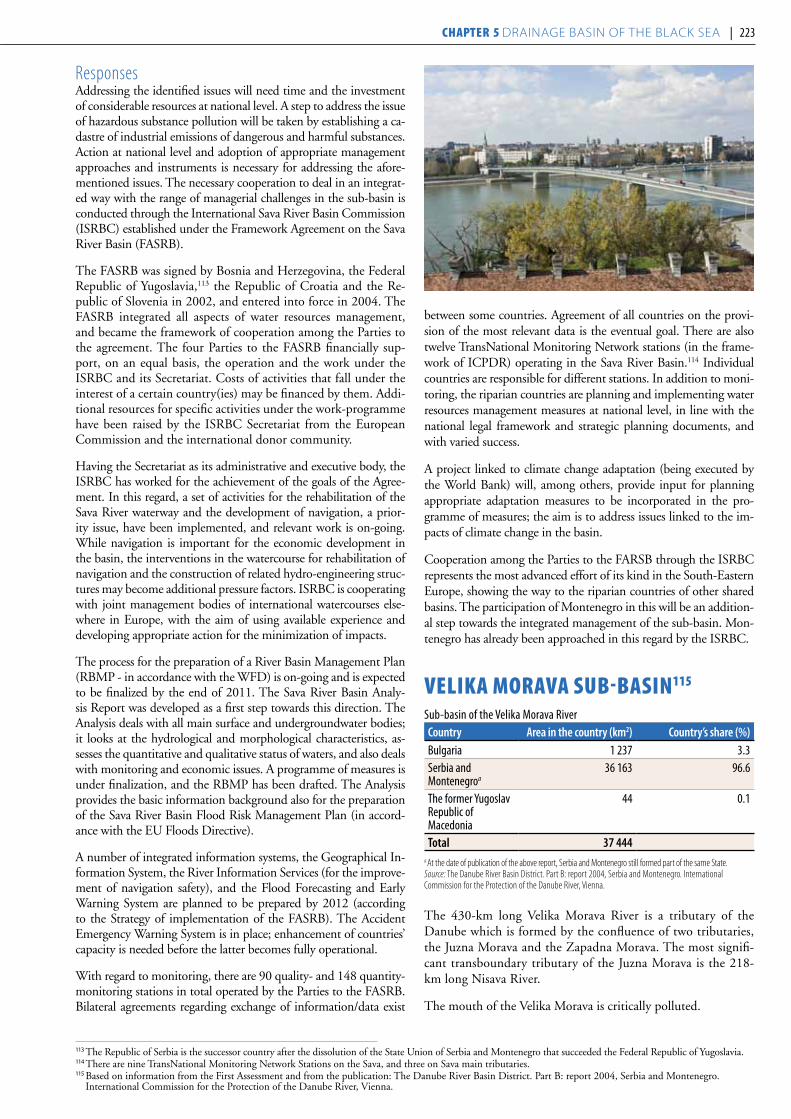
Responses Addressing the identified issues will need time and the investment of considerable resources at national level. A step to address the issue of hazardous substance pollution will be taken by establishing a ca-dastre of industrial emissions of dangerous and harmful substances. Action at national level and adoption of appropriate management approaches and instruments is necessary for addressing the afore-mentioned issues. The necessary cooperation to deal in an integrat-ed way with the range of managerial challenges in the sub-basin is conducted through the International Sava River Basin Commission (ISRBC) established under the Framework Agreement on the Sava River Basin (FASRB).
The FASRB was signed by Bosnia and Herzegovina, the Federal Republic of Yugoslavia,113 the Republic of Croatia and the Re-public of Slovenia in 2002, and entered into force in 2004. The FASRB integrated all aspects of water resources management, and became the framework of cooperation among the Parties to the agreement. The four Parties to the FASRB financially sup-port, on an equal basis, the operation and the work under the ISRBC and its Secretariat. Costs of activities that fall under the interest of a certain country(ies) may be financed by them. Addi-tional resources for specific activities under the work-programme have been raised by the ISRBC Secretariat from the European Commission and the international donor community.
Having the Secretariat as its administrative and executive body, the ISRBC has worked for the achievement of the goals of the Agree-ment. In this regard, a set of activities for the rehabilitation of the Sava River waterway and the development of navigation, a prior-ity issue, have been implemented, and relevant work is on-going. While navigation is important for the economic development in the basin, the interventions in the watercourse for rehabilitation of navigation and the construction of related hydro-engineering struc-tures may become additional pressure factors. ISRBC is cooperating with joint management bodies of international watercourses else-where in Europe, with the aim of using available experience and developing appropriate action for the minimization of impacts.
The process for the preparation of a River Basin Management Plan (RBMP - in accordance with the WFD) is on-going and is expected to be finalized by the end of 2011. The Sava River Basin Analy-sis Report was developed as a first step towards this direction. The Analysis deals with all main surface and undergroundwater bodies; it looks at the hydrological and morphological characteristics, as-sesses the quantitative and qualitative status of waters, and also deals with monitoring and economic issues. A programme of measures is under finalization, and the RBMP has been drafted. The Analysis provides the basic information background also for the preparation of the Sava River Basin Flood Risk Management Plan (in accord-ance with the EU Floods Directive).
A number of integrated information systems, the Geographical In-formation System, the River Information Services (for the improve-ment of navigation safety), and the Flood Forecasting and Early Warning System are planned to be prepared by 2012 (according to the Strategy of implementation of the FASRB). The Accident Emergency Warning System is in place; enhancement of countries’ capacity is needed before the latter becomes fully operational.
With regard to monitoring, there are 90 quality- and 148 quantity-monitoring stations in total operated by the Parties to the FASRB. Bilateral agreements regarding exchange of information/data exist
between some countries. Agreement of all countries on the provi-sion of the most relevant data is the eventual goal. There are also twelve TransNational Monitoring Network stations (in the frame-work of ICPDR) operating in the Sava River Basin.114 Individual countries are responsible for different stations. In addition to moni-toring, the riparian countries are planning and implementing water resources management measures at national level, in line with the national legal framework and strategic planning documents, and with varied success.
A project linked to climate change adaptation (being executed by the World Bank) will, among others, provide input for planning appropriate adaptation measures to be incorporated in the pro-gramme of measures; the aim is to address issues linked to the im-pacts of climate change in the basin.
Cooperation among the Parties to the FARSB through the ISRBC represents the most advanced effort of its kind in the South-Eastern Europe, showing the way to the riparian countries of other shared basins. The participation of Montenegro in this will be an addition-al step towards the integrated management of the sub-basin. Mon-tenegro has already been approached in this regard by the ISRBC.
VelIka MoraVa suB-BasIn115
Sub-basin of the Velika Morava Rivercountry area in the country (km2) country’s share (%)Bulgaria 1 237 3.3Serbia and Montenegroa
36 163 96.6
The former Yugoslav Republic of Macedonia
44 0.1
Total 37 444a At the date of publication of the above report, Serbia and Montenegro still formed part of the same State. Source: The Danube River Basin District. Part B: report 2004, Serbia and Montenegro. International Commission for the Protection of the Danube River, Vienna.
The 430-km long Velika Morava River is a tributary of the Danube which is formed by the confluence of two tributaries, the Juzna Morava and the Zapadna Morava. The most signifi-cant transboundary tributary of the Juzna Morava is the 218-km long Nisava River.
The mouth of the Velika Morava is critically polluted.
113 The Republic of Serbia is the successor country after the dissolution of the State Union of Serbia and Montenegro that succeeded the Federal Republic of Yugoslavia.114 There are nine TransNational Monitoring Network Stations on the Sava, and three on Sava main tributaries.115 Based on information from the First Assessment and from the publication: The Danube River Basin District. Part B: report 2004, Serbia and Montenegro.
International Commission for the Protection of the Danube River, Vienna.
222 | part IV Chapter 5 Drainage basin of the black sea | 223

nIsaVa suB-BasIn116
Sub-basin of the Nisava Rivercountry area in the country (km2) country’s share (%)Bulgaria 1 151 27.7Serbia 3 010 72.3Total 4 161
The sub-basin of the Nisava River is shared by Bulgaria and Serbia. It has its source at the Stara Planina Mountain in Bulgaria and flows into the Juzna Morava River near the city of Nis in Serbia. The Nisava sub-basin is part of the Velika Morava River system.
Major transboundary tributaries include the Visočica,117 Gaber-ska118 and Jerma/Erma119 Rivers.
The sub-basin is characterized by a diverse relief. The elevation ranges from 173 m a.s.l. to 2,169 m a.s.l., the average being 700-800 m a.s.l. In terms of geology, the sub-basin is dominated by karstic formations of the Karpato–Balcanides region.
HydrologyThere is a high risk of floods and droughts in the Serbian part, due to the sub-basin’s geomorphologic and hydrological characteristics.
Serbia reports that the flow of the river has decreased by ~0.42
m3/s (average value) since the diversion of the Nisava River, in Bulgaria, towards the Brzija River in 1953.
PressuresThe Serbian part is dominated by forestland.
Hydromorphological changes in the Nisava River in Serbia in-clude bank reinforcement, and hydrotechnical structures for flood protection in the areas of major settlements (Nis, Pirot, Dimitrovgrad), but this pressure was reported as of minor im-portance. The Pirot hydropower plant (capacity 80 MW) and the Zavoj Reservoir (capacity 180 × 106 m3) were brought into use in 1990 on the Visočica River.
The major pressure in the Serbian part stems from the lack of wastewater treatment plants. The most significant sources of pollu-tion are the cities of Nis (emission level higher than 150,000 p.e.) and Pirot (emission level higher than 100,000 p.e.). Management of solid waste is an issue of concern. Pressures in Bulgaria derive from coal mining effluent discharge into surface waters. Such ef-fluents have high concentration of suspended solids and of iron.
Responses A bilateral cooperation agreement was signed between Yugoslavia and Bulgaria in 1958. A new bilateral agreement on the manage-ment of transboundary waters shared by Serbia and Bulgaria appears to be needed (see also the assessment of the Timok River basin).
116 Based on information from Bulgaria and Serbia. Bulgaria and Serbia reported that parts of the Stara Planina/Salasha Montana aquifer are hydraulically linked to the surface water system of the Nisava and Timok Rivers Basins – see respective part of the assessment for additional information.
117 The sub-basin covers 441 km2, 25 % of which is in Bulgaria.118 The sub-basin covers 258 km2, 77% of which is in Bulgaria.119 Called Jerma in Serbia and Erma in Bulgaria. The sub-basin covers 800 km2, 55% of which is in Bulgaria.120 Based on information provided by Bulgaria and Serbia. Bulgaria reports that:
- “Karst waters in West Balkan Karst Basin” are hydraulically linked with the surface water systems of Timok River Basin (shared by Bulgaria and Serbia); there is no available information with regard to the hydraulic connection of this body with the Nisava River basin. - “Karst waters in Godech massif ” are hydraulically linked with the surface water systems of Nisava River Basin. - “Fissured waters in Volcanogenic- sedimentary formation” are hydraulically linked with the surface water systems of Timok River Basin; there is no information available with regard to the hydraulic connection of this body with the Nisava River basin. The three above-mentioned groundwater bodies are part of the Stara Planina/Salasha Montana aquifer system. The Vidlic/Nishava, which in the first Assessment was reported as a part of the Stara Planina/Salasha Montana aquifer system, is actually a separate transboundary aquifer, in the Nisava River Basin.
STaRa pLanina/SaLaSha MonTana aquiFeR (no. 114)120
Serbia Bulgaria Type 2; Triassic and Cretaceous karstic limestones with some overlying Quaternary alluvium; medium links to surface water systems; groundwater flow from north east to south west, from Bulgaria to Serbia.Area (km2) 3 375 (Karst waters in the Western Balkans, BG1G0000TJK044);
53.3 (Salasha-Monatan karst aquifer system). Thickness: mean, max (m) 100 - 200, 400 100 – 200, 400Other information Population 11 000 (18 inhabitants/km2)
The information regarding Serbia included here concerns the part of the aquifer system that is hydraulically linked with the surface waters of both the Nisava sub-basin (in the south; shared by Bulgaria and Serbia) and the Timok sub-basin (in the north); this is fur-ther divided into four groundwater bodies (the characteristics and uses are given in the table below).
Characteristics and uses of groundwater bodies in the part of Stara Planina/Salasha Montana (No. 114) in the territory of Serbia
groundwater body/national identification code
Karst waters in nisava Basin/RS_ni_gW_K1
Karst waters in nisava Basin/RS_ni_gW_K2
Fissured waters in nisava Basin/RS_ni_gW_p1
Fissured waters in nisava Basin/RS_ni_gW_p4
Area (km2) 285 337 110 456Type Karst Karst Fissured FissuredPredominant litholoqy/lithologies
Limestones, dolomitic and sandy limestones
Karstic limestones dolomitic limestones
Conglomerates, quartz sandstones
Magmatic – metamorphic complex
Stratigraphy and age Jurassic and Cretaceous karstic limestones
Triassic and Jurassic karstic limestones
Cambrian, Permian and lower Triassic deposits
Mesozoic and Paleozoic
Thickness average:150 m; max: 400 m 100 m - 500 m 100 m – 500 m 600 m -900 m
Bulgaria reported that there are four groundwater bodies in the area, which are not hydraulically connected and hence do not form
224 | part IV

one aquifer system (identified in accordance with the WFD); their characteristics and uses are given in the table below.
Characteristics and uses of groundwater bodies in the part of Stara Planina/Salasha Montana (No. 114) in the territory of Bulgaria.
groundwater body/ national identification code
Karst waters in West Balkan Karst Basin/Bg1g0000TjK044
Karst waters in godech massif/Bg1g00000Tj046
Fissured waters in volcanogenic- sedimentary
formation/Bg1g00000K2038
porous groundwater in alluvial quaternary of
Bregovo – novo selo low land/Bg1g0000qal001
Area (km2) 53 1 836 2 109 137Type Karst Karst Fissured FissuredPredominant litholoqy/lithologies Limestones, marl
limestones, clayey limestones and marble
Karstic limestones and dolomites
Magmatic and volcanogenic rocks, sediments
Sands, clayey sands, pebbles
Stratigraphy and age Triassic and Jurassic karstic limestones
Triassic and Jurassic karstic limestones
Triassic and Jurassic karstic limestones
Quaternary
Thickness average:150 m;
max: 300 m
max: 600 m max: 200 m average: 13 m
Pressure condition Unconfined Unconfined Unconfined UnconfinedWater flow (×103 m3/year) 298 646 92 400 13 245 17 345Total withdrawal (×103 m3/year) 3.7 7 511 2 729 2 460Uses and functions 80-90% of groundwater is used for
drinking purposes and industry29 % of groundwater is used for drinking purposes.
Other information In good condition; no additional management measures are needed.
In Serbia, the area is sparsely populated. More than half is covered by forests; crop production is the second most important land use.
Land cover/use in Stara Planina/Salasha Montana aquifer (% of the part of the aquifer extending in each country).
country Water bodies (%) Forest (%) cropland (%) grassland (%)
urban/industrial areas (%)
Surfaces with little or no vegetation (%)
Wetlands/ peatlands (%)
other forms of land usea (%)
Bulgaria 0.01 63.01 11.1 8.2 2.5 N/A N/A 15Serbia 0.84 52.92 22.83 22.41 0.37 - - 0.63
a For Bulgaria — sparsely vegetated areas, for Serbia — bare rocks.
Groundwater covers 50% of the water being used in the Serbian part. While 25-50% of groundwater is used for drinking pur-poses, less than 25% is used for irrigation, industry, thermal spa and livestock. Groundwater also supports ecosystems.
Water abstraction is not a significant pressure factor in Serbia. Wastewater is collected and treated in the largest settlement (Dim-itrovgrad), while in rural areas septic tanks are mainly used. Com-munal waste disposal and agriculture activities may locally put groundwater quality at a risk. The moderate nitrogen and patho-gen pollution observed may have an effect on groundwater quality.
The construction of a regional waste disposal site in the town of Pirot (begun in 2008), which would also serve the town of Dim-itrovgrad, should be followed by an end to operations, followed by a clean up of local dump sites in order to minimize risks for groundwater quality. There is a need for establishing systematic quantity and quality monitoring.
In Serbia, pathogens are an issue for groundwater quality, local but severe in nature, originating from farming. No transbound-ary impacts have been observed in Serbia.
Serbia indicated the need for a number of groundwater man-agement measures, namely the following: transboundary insti-tutions, groundwater abstraction management by regulation, monitoring of both groundwater quantity and quality, exchange of data, establishment of protection zones for public water sup-plies, good agricultural practices, as well as treatment of urban wastewater and industrial effluents. Furthermore, groundwater needs to be integrated into river basin management.
224 | part IV Chapter 5 Drainage basin of the black sea | 225
tIMok suB-BasIn121
Sub-basin of the Timok Rivercountry area in the country (km2) country’s share (%)Serbia 4,607 97.2Bulgaria 132.5 2.8
The sub-basin is shared by Bulgaria and Serbia. The 180-km long river starts at the confluence of the Beli Timok and the Crni Timok (in Serbia) near the city of Zajecar. For a distance of 17.5 km before it empties into the Danube, the Timok forms the bor-der between the two countries. The sub-basin is characterized by a diverse relief including mountains, valleys, depressions and narrow passages. The highest altitude is 2,070 m a.s.l.; the aver-age elevation is 472 m.
The mean value for discharge at the mouth was 31 m3/s for the period 1950 -1980.
Pressures and transboundary impactsCopper and gold mining activities in Serbia, especially in the Bor area, are the major pressure factor and it is of transboundary im-portance. Unsustainable operations, storage practices, effluent discharged into surface waters and waste management have re-sulted in severe pollution of the surface water and groundwater.
Heavy metals (Cu, As, Zn, Fe and Ni) were detected on the generated effluents in the Bor area in 2005, in concentrations above limits set in Serbia; the pH was found to be highly acidic.
The Crni Timok (“Black Timok”) River, with its tributaries, drain the highly polluted area of Bor. Contamination of the Bor-ska River is clearly visible between Bor and Slatina. Accidents that took place in the past at the Bor tailings pond have deposited tailings at the riverbanks. An accidental pollution incident re-sulted in severe contamination of over 40 km2 of the most fertile agricultural land along the banks of Borska and Timok Rivers in Serbia and in Bulgaria (4.5 km2) by heavy metals and other toxic substances. Old plans for the re-cultivation of the contaminated soils have not yet been realized due to financial constraints.
The water of Borska River is still acidic, and contains elevated levels of suspended solids and copper concentrations as far as 10 km from the metallurgical complex. The Kriveljska stream south of the Veliki Krivelj mine and tailings ponds is also acidic, and contains high levels of suspended solids, iron, copper and zinc. Pollutants have been accumulated in the rivers’ sediments.
Untreated urban wastewater is also a major source of pollution in both countries, resulting in impacts on water-related ecosystems.
Human health is at risk due to the bioaccumulation of heavy metals in the fish species that are caught and eaten.
Responses Reducing pollution stemming from the mining industry is a pri-ority for Serbia. The privatization process of the mining sector in the area will continue, with the assistance of the World Bank.
Reduction of pollution caused by urban wastewater discharges is also a priority; the construction of sewage networks and wastewa-ter treatment plants is necessary in both countries.
Sustainable use and management of groundwater is another im-portant future task.
Two agreements were signed in 1954 and 1961 concerning is-sues linked to the position of the riverbed of Timok, and hence the border between the two countries. An agreement was signed between Yugoslavia and Bulgaria under which a Mixed Com-mission was established. Quality and allocation of transbound-ary waters were the main issues discussed. The last meeting of the Commission took place in 1982; joint activities have since come to an halt.
A project led by the Regional Environmental Center for Cen-tral and Eastern Europe (REC), in cooperation with UNECE, under the ENVSEC initiative, has resulted in (1) the publishing of the Environment and Risk Assessment of the Timok River Basin, prepared by Serbian and Bulgarian experts, and, (2) the establishment of the Timok River Forum, a multistakeholder platform to facilitate transboundary cooperation, in particular at the local level.
There is also an on-going cooperation between the two coun-tries in the framework of the Convention for the Protection of the Danube River.
TrendsThe situation in the Timok River basin calls for joint action; the two riparian countries should initiate a realistic dialogue to define priorities and long-term objectives and actions, taking into account the economic development prospects in the area and the need to reduce, or even eliminate, risks to the environ-ment and human health in the long term.
Managing environmental and technological risks and natural disasters is one of the priorities of an eventually enhanced co-operation, as is reducing pollution from industry and urban wastewater as well as from agriculture (through the introduc-tion of agricultural good practices). Cooperation for the resto-ration of polluted and degraded lands is needed.
Both countries reported that the on-going discussions about the Timok River should result in the preparation and conclusion of an agreement on the management of transboundary watercourses.
sIret suB-BasIn122
The sub-basin of the 559-km long Siret River is shared by Ukraine and Romania. The river has its source in the Eastern Carpathian Mountains (Ukraine), and discharges to the Dan-ube. There are over 30 man-made lakes in the sub-basin. Natu-ral lakes in Romania include the Rosu, Lala, Balatau, Cuejdel, Vintileasca and Carpanoaia Lakes. The sub-basin has a pro-nounced mountain character in the upper reaches, and down-stream flows through lowland. The average elevation is about 515 m a.s.l. Transboundary tributaries include the Mikhidra, Bilka, Small Siret and Kotovets.
The Middle Sarmantian Pontian transboundary aquifer (No. 115), shared by Romania and the Republic of Moldova, is weakly linked to the surface waters of the Siret.123
Hydropower is generated at over 25 sites along the river.
121 Based on information from Bulgaria, Serbia and the “Environmental and Risk Assessment of the Timok River basin” report elaborated by Ventzislav Vassilev, Svetoslav Cheshmedjiev, Momir Paunoviő and Vladica Simiő in the framework of the ENVSEC Timok project, implemented by REC and UNECE. Bulgaria and Serbia reported that parts of the Stara Planina/Salasha Montana aquifer are hydraulically linked to the surface water system of the Timok and the Nisava Rivers Basins – see respective part of the assessment for additional information.
122 Based on information provided by the Republic of Moldova, Ukraine and Romania, and the First Assessment.123 As Middle Sarmantian Pontian aquifer is also linked to the surface waters of the Prut, it is assessed together with the Prut.
226 | part IV
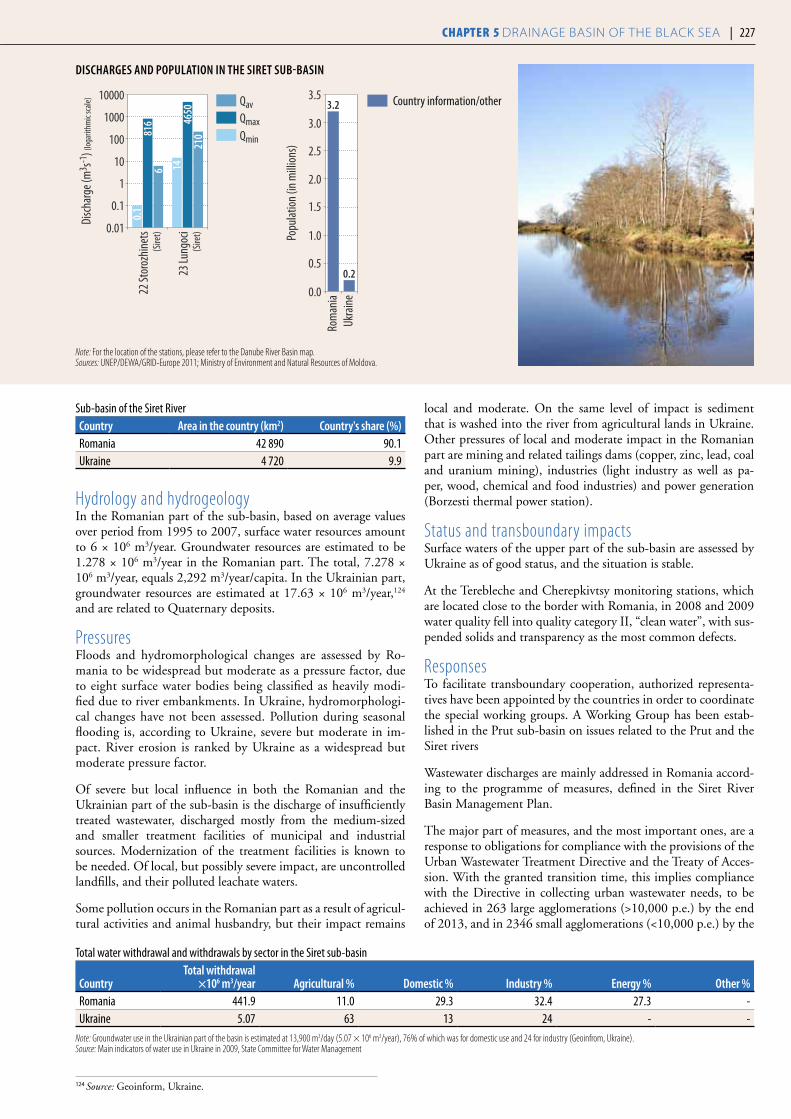
Sub-basin of the Siret Rivercountry area in the country (km2) country's share (%)Romania 42 890 90.1Ukraine 4 720 9.9
Hydrology and hydrogeologyIn the Romanian part of the sub-basin, based on average values over period from 1995 to 2007, surface water resources amount to 6 × 10⁶ m3/year. Groundwater resources are estimated to be 1.278 × 10⁶ m3/year in the Romanian part. The total, 7.278 × 10⁶ m3/year, equals 2,292 m3/year/capita. In the Ukrainian part, groundwater resources are estimated at 17.63 × 10⁶ m3/year,124 and are related to Quaternary deposits.
PressuresFloods and hydromorphological changes are assessed by Ro-mania to be widespread but moderate as a pressure factor, due to eight surface water bodies being classified as heavily modi-fied due to river embankments. In Ukraine, hydromorphologi-cal changes have not been assessed. Pollution during seasonal flooding is, according to Ukraine, severe but moderate in im-pact. River erosion is ranked by Ukraine as a widespread but moderate pressure factor.
Of severe but local influence in both the Romanian and the Ukrainian part of the sub-basin is the discharge of insufficiently treated wastewater, discharged mostly from the medium-sized and smaller treatment facilities of municipal and industrial sources. Modernization of the treatment facilities is known to be needed. Of local, but possibly severe impact, are uncontrolled landfills, and their polluted leachate waters.
Some pollution occurs in the Romanian part as a result of agricul-tural activities and animal husbandry, but their impact remains
local and moderate. On the same level of impact is sediment that is washed into the river from agricultural lands in Ukraine. Other pressures of local and moderate impact in the Romanian part are mining and related tailings dams (copper, zinc, lead, coal and uranium mining), industries (light industry as well as pa-per, wood, chemical and food industries) and power generation (Borzesti thermal power station).
Status and transboundary impactsSurface waters of the upper part of the sub-basin are assessed by Ukraine as of good status, and the situation is stable.
At the Terebleche and Cherepkivtsy monitoring stations, which are located close to the border with Romania, in 2008 and 2009 water quality fell into quality category II, “clean water”, with sus-pended solids and transparency as the most common defects.
ResponsesTo facilitate transboundary cooperation, authorized representa-tives have been appointed by the countries in order to coordinate the special working groups. A Working Group has been estab-lished in the Prut sub-basin on issues related to the Prut and the Siret rivers
Wastewater discharges are mainly addressed in Romania accord-ing to the programme of measures, defined in the Siret River Basin Management Plan.
The major part of measures, and the most important ones, are a response to obligations for compliance with the provisions of the Urban Wastewater Treatment Directive and the Treaty of Acces-sion. With the granted transition time, this implies compliance with the Directive in collecting urban wastewater needs, to be achieved in 263 large agglomerations (>10,000 p.e.) by the end of 2013, and in 2346 small agglomerations (<10,000 p.e.) by the
DiSchaRgeS anD popuLaTion in The SiReT SuB-BaSin
Note: For the location of the stations, please refer to the Danube River Basin map.Sources: UNEP/DEWA/GRID-Europe 2011; Ministry of Environment and Natural Resources of Moldova.
23 Lu
ngoc
i
22 St
oroz
hine
ts
Disc
harg
e (m
3 s-1) (
loga
rithm
ic sc
ale)
816
6(S
iret)
(Sire
t)0.01
0.1
1
100
10
10000
10000.
1
4650
210
14
QavQmaxQmin
Popu
lation
(in m
illion
s)0.0
0.5
1.0
1.5
2.0
2.5
3.0
3.5
Ukra
ineRo
man
ia
3.2
0.2
Country information/other
124 Source: Geoinform, Ukraine.
Total water withdrawal and withdrawals by sector in the Siret sub-basin
countryTotal withdrawal
×106 m3/year agricultural % Domestic % industry % energy % other %Romania 441.9 11.0 29.3 32.4 27.3 -Ukraine 5.07 63 13 24 - -
Note: Groundwater use in the Ukrainian part of the basin is estimated at 13,900 m3/day (5.07 × 10⁶ m3/year), 76% of which was for domestic use and 24 for industry (Geoinfrom, Ukraine).Source: Main indicators of water use in Ukraine in 2009, State Committee for Water Management
226 | part IV Chapter 5 Drainage basin of the black sea | 227
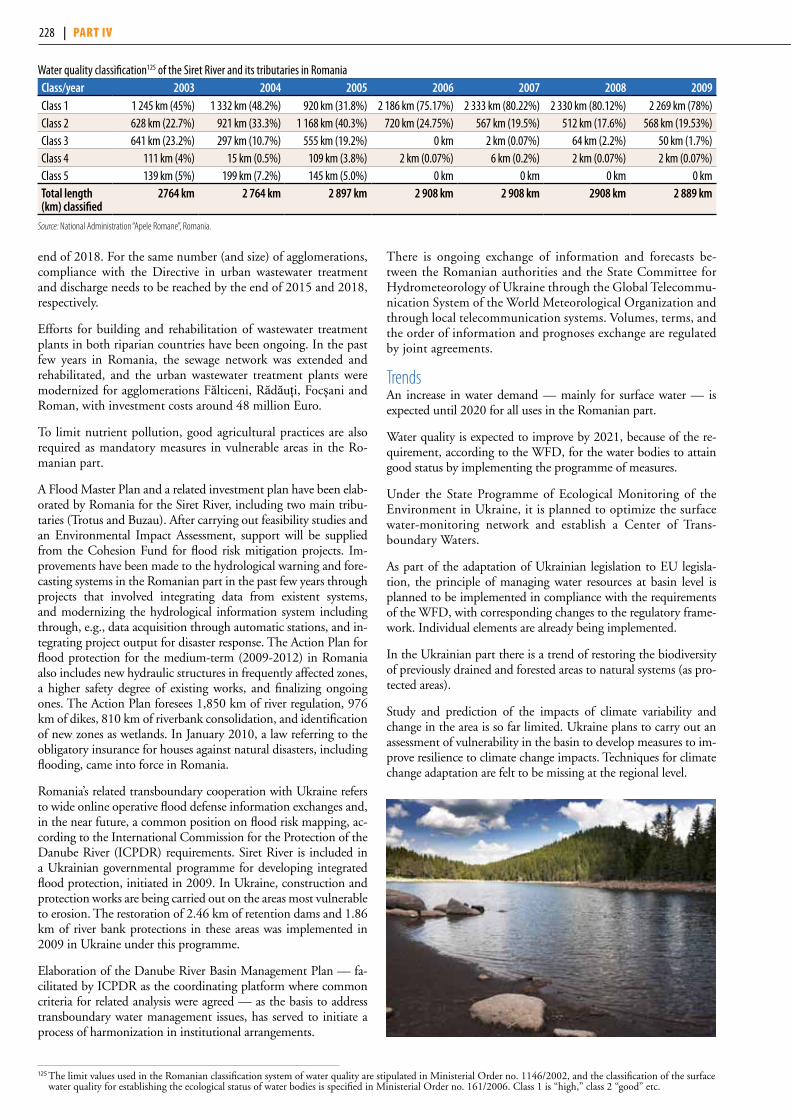
125 The limit values used in the Romanian classification system of water quality are stipulated in Ministerial Order no. 1146/2002, and the classification of the surface water quality for establishing the ecological status of water bodies is specified in Ministerial Order no. 161/2006. Class 1 is “high,” class 2 “good” etc.
Water quality classification125 of the Siret River and its tributaries in Romania class/year 2003 2004 2005 2006 2007 2008 2009Class 1 1 245 km (45%) 1 332 km (48.2%) 920 km (31.8%) 2 186 km (75.17%) 2 333 km (80.22%) 2 330 km (80.12%) 2 269 km (78%)Class 2 628 km (22.7%) 921 km (33.3%) 1 168 km (40.3%) 720 km (24.75%) 567 km (19.5%) 512 km (17.6%) 568 km (19.53%)Class 3 641 km (23.2%) 297 km (10.7%) 555 km (19.2%) 0 km 2 km (0.07%) 64 km (2.2%) 50 km (1.7%)Class 4 111 km (4%) 15 km (0.5%) 109 km (3.8%) 2 km (0.07%) 6 km (0.2%) 2 km (0.07%) 2 km (0.07%)Class 5 139 km (5%) 199 km (7.2%) 145 km (5.0%) 0 km 0 km 0 km 0 kmTotal length (km) classified
2764 km 2 764 km 2 897 km 2 908 km 2 908 km 2908 km 2 889 km
Source: National Administration “Apele Romane”, Romania.
end of 2018. For the same number (and size) of agglomerations, compliance with the Directive in urban wastewater treatment and discharge needs to be reached by the end of 2015 and 2018, respectively.
Efforts for building and rehabilitation of wastewater treatment plants in both riparian countries have been ongoing. In the past few years in Romania, the sewage network was extended and rehabilitated, and the urban wastewater treatment plants were modernized for agglomerations Fălticeni, Rădăuți, Focșani and Roman, with investment costs around 48 million Euro.
To limit nutrient pollution, good agricultural practices are also required as mandatory measures in vulnerable areas in the Ro-manian part.
A Flood Master Plan and a related investment plan have been elab-orated by Romania for the Siret River, including two main tribu-taries (Trotus and Buzau). After carrying out feasibility studies and an Environmental Impact Assessment, support will be supplied from the Cohesion Fund for flood risk mitigation projects. Im-provements have been made to the hydrological warning and fore-casting systems in the Romanian part in the past few years through projects that involved integrating data from existent systems, and modernizing the hydrological information system including through, e.g., data acquisition through automatic stations, and in-tegrating project output for disaster response. The Action Plan for flood protection for the medium-term (2009-2012) in Romania also includes new hydraulic structures in frequently affected zones, a higher safety degree of existing works, and finalizing ongoing ones. The Action Plan foresees 1,850 km of river regulation, 976 km of dikes, 810 km of riverbank consolidation, and identification of new zones as wetlands. In January 2010, a law referring to the obligatory insurance for houses against natural disasters, including flooding, came into force in Romania.
Romania’s related transboundary cooperation with Ukraine refers to wide online operative flood defense information exchanges and, in the near future, a common position on flood risk mapping, ac-cording to the International Commission for the Protection of the Danube River (ICPDR) requirements. Siret River is included in a Ukrainian governmental programme for developing integrated flood protection, initiated in 2009. In Ukraine, construction and protection works are being carried out on the areas most vulnerable to erosion. The restoration of 2.46 km of retention dams and 1.86 km of river bank protections in these areas was implemented in 2009 in Ukraine under this programme.
Elaboration of the Danube River Basin Management Plan — fa-cilitated by ICPDR as the coordinating platform where common criteria for related analysis were agreed — as the basis to address transboundary water management issues, has served to initiate a process of harmonization in institutional arrangements.
There is ongoing exchange of information and forecasts be-tween the Romanian authorities and the State Committee for Hydrometeorology of Ukraine through the Global Telecommu-nication System of the World Meteorological Organization and through local telecommunication systems. Volumes, terms, and the order of information and prognoses exchange are regulated by joint agreements.
TrendsAn increase in water demand — mainly for surface water — is expected until 2020 for all uses in the Romanian part.
Water quality is expected to improve by 2021, because of the re-quirement, according to the WFD, for the water bodies to attain good status by implementing the programme of measures.
Under the State Programme of Ecological Monitoring of the Environment in Ukraine, it is planned to optimize the surface water-monitoring network and establish a Center of Trans-boundary Waters.
As part of the adaptation of Ukrainian legislation to EU legisla-tion, the principle of managing water resources at basin level is planned to be implemented in compliance with the requirements of the WFD, with corresponding changes to the regulatory frame-work. Individual elements are already being implemented.
In the Ukrainian part there is a trend of restoring the biodiversity of previously drained and forested areas to natural systems (as pro-tected areas).
Study and prediction of the impacts of climate variability and change in the area is so far limited. Ukraine plans to carry out an assessment of vulnerability in the basin to develop measures to im-prove resilience to climate change impacts. Techniques for climate change adaptation are felt to be missing at the regional level.
228 | part IV
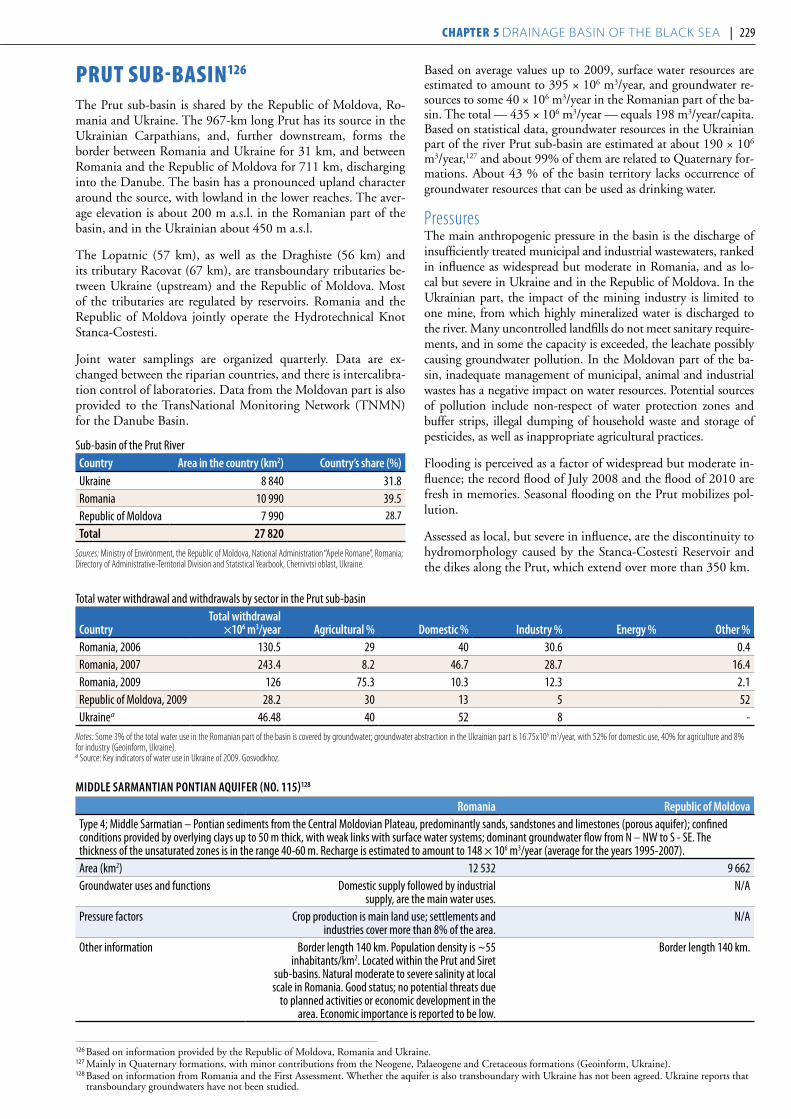
prut suB-BasIn126
The Prut sub-basin is shared by the Republic of Moldova, Ro-mania and Ukraine. The 967-km long Prut has its source in the Ukrainian Carpathians, and, further downstream, forms the border between Romania and Ukraine for 31 km, and between Romania and the Republic of Moldova for 711 km, discharging into the Danube. The basin has a pronounced upland character around the source, with lowland in the lower reaches. The aver-age elevation is about 200 m a.s.l. in the Romanian part of the basin, and in the Ukrainian about 450 m a.s.l.
The Lopatnic (57 km), as well as the Draghiste (56 km) and its tributary Racovat (67 km), are transboundary tributaries be-tween Ukraine (upstream) and the Republic of Moldova. Most of the tributaries are regulated by reservoirs. Romania and the Republic of Moldova jointly operate the Hydrotechnical Knot Stanca-Costesti.
Joint water samplings are organized quarterly. Data are ex-changed between the riparian countries, and there is intercalibra-tion control of laboratories. Data from the Moldovan part is also provided to the TransNational Monitoring Network (TNMN) for the Danube Basin.
Sub-basin of the Prut Rivercountry area in the country (km2) country’s share (%)Ukraine 8 840 31.8Romania 10 990 39.5Republic of Moldova 7 990 28.7
Total 27 820
Sources: Ministry of Environment, the Republic of Moldova, National Administration “Apele Romane”, Romania; Directory of Administrative-Territorial Division and Statistical Yearbook, Chernivtsi oblast, Ukraine.
Based on average values up to 2009, surface water resources are estimated to amount to 395 × 106 m3/year, and groundwater re-sources to some 40 × 106 m3/year in the Romanian part of the ba-sin. The total — 435 × 106 m3/year — equals 198 m3/year/capita. Based on statistical data, groundwater resources in the Ukrainian part of the river Prut sub-basin are estimated at about 190 × 106 m3/year,127 and about 99% of them are related to Quaternary for-mations. About 43 % of the basin territory lacks occurrence of groundwater resources that can be used as drinking water.
Pressures The main anthropogenic pressure in the basin is the discharge of insufficiently treated municipal and industrial wastewaters, ranked in influence as widespread but moderate in Romania, and as lo-cal but severe in Ukraine and in the Republic of Moldova. In the Ukrainian part, the impact of the mining industry is limited to one mine, from which highly mineralized water is discharged to the river. Many uncontrolled landfills do not meet sanitary require-ments, and in some the capacity is exceeded, the leachate possibly causing groundwater pollution. In the Moldovan part of the ba-sin, inadequate management of municipal, animal and industrial wastes has a negative impact on water resources. Potential sources of pollution include non-respect of water protection zones and buffer strips, illegal dumping of household waste and storage of pesticides, as well as inappropriate agricultural practices.
Flooding is perceived as a factor of widespread but moderate in-fluence; the record flood of July 2008 and the flood of 2010 are fresh in memories. Seasonal flooding on the Prut mobilizes pol-lution.
Assessed as local, but severe in influence, are the discontinuity to hydromorphology caused by the Stanca-Costesti Reservoir and the dikes along the Prut, which extend over more than 350 km.
MiDDLe SaRManTian ponTian aquiFeR (no. 115)128
Romania Republic of MoldovaType 4; Middle Sarmatian – Pontian sediments from the Central Moldovian Plateau, predominantly sands, sandstones and limestones (porous aquifer); confined conditions provided by overlying clays up to 50 m thick, with weak links with surface water systems; dominant groundwater flow from N – NW to S - SE. The thickness of the unsaturated zones is in the range 40-60 m. Recharge is estimated to amount to 148 × 106 m3/year (average for the years 1995-2007).Area (km2) 12 532 9 662Groundwater uses and functions Domestic supply followed by industrial
supply, are the main water uses.N/A
Pressure factors Crop production is main land use; settlements and industries cover more than 8% of the area.
N/A
Other information Border length 140 km. Population density is ~55 inhabitants/km2. Located within the Prut and Siret
sub-basins. Natural moderate to severe salinity at local scale in Romania. Good status; no potential threats due
to planned activities or economic development in the area. Economic importance is reported to be low.
Border length 140 km.
126 Based on information provided by the Republic of Moldova, Romania and Ukraine. 127 Mainly in Quaternary formations, with minor contributions from the Neogene, Palaeogene and Cretaceous formations (Geoinform, Ukraine).128 Based on information from Romania and the First Assessment. Whether the aquifer is also transboundary with Ukraine has not been agreed. Ukraine reports that
transboundary groundwaters have not been studied.
Total water withdrawal and withdrawals by sector in the Prut sub-basin
countryTotal withdrawal
×106 m3/year agricultural % Domestic % industry % energy % other %Romania, 2006 130.5 29 40 30.6 0.4Romania, 2007 243.4 8.2 46.7 28.7 16.4Romania, 2009 126 75.3 10.3 12.3 2.1Republic of Moldova, 2009 28.2 30 13 5 52Ukrainea 46.48 40 52 8 -
Notes: Some 3% of the total water use in the Romanian part of the basin is covered by groundwater; groundwater abstraction in the Ukrainian part is 16.75x10⁶ m3/year, with 52% for domestic use, 40% for agriculture and 8% for industry (Geoinform, Ukraine). a Source: Key indicators of water use in Ukraine of 2009. Gosvodkhoz.
228 | part IV Chapter 5 Drainage basin of the black sea | 229
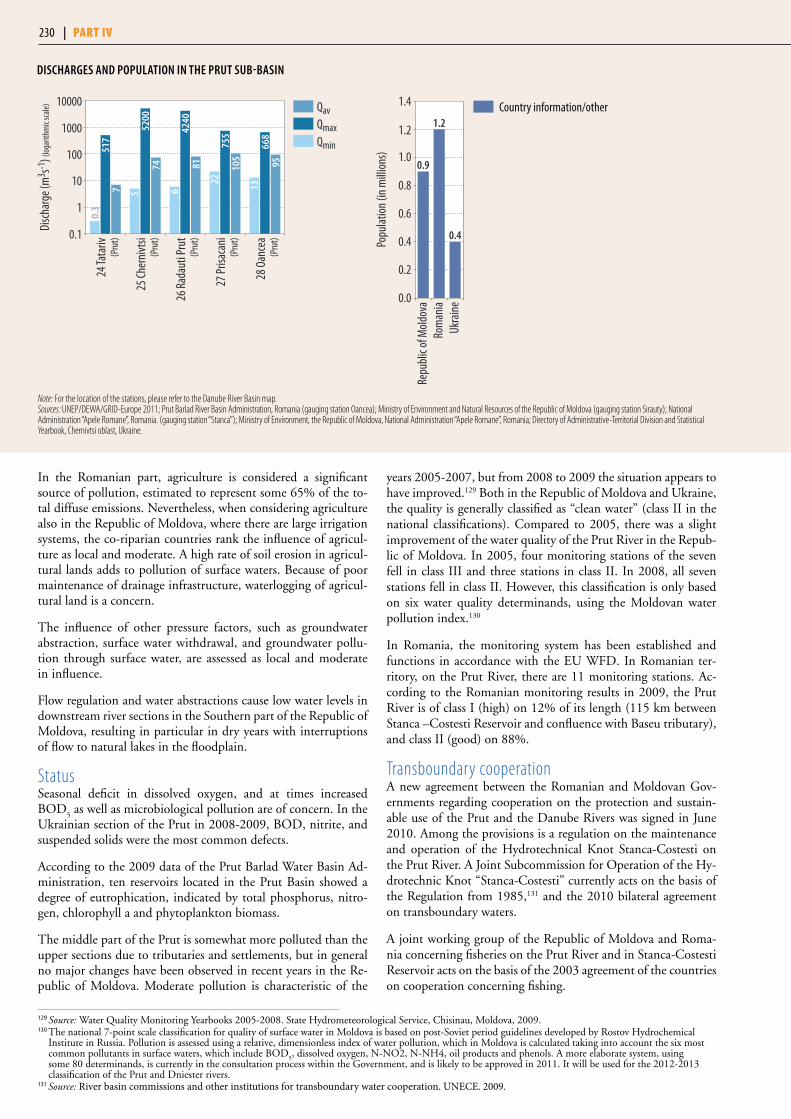
In the Romanian part, agriculture is considered a significant source of pollution, estimated to represent some 65% of the to-tal diffuse emissions. Nevertheless, when considering agriculture also in the Republic of Moldova, where there are large irrigation systems, the co-riparian countries rank the influence of agricul-ture as local and moderate. A high rate of soil erosion in agricul-tural lands adds to pollution of surface waters. Because of poor maintenance of drainage infrastructure, waterlogging of agricul-tural land is a concern.
The influence of other pressure factors, such as groundwater abstraction, surface water withdrawal, and groundwater pollu-tion through surface water, are assessed as local and moderate in influence.
Flow regulation and water abstractions cause low water levels in downstream river sections in the Southern part of the Republic of Moldova, resulting in particular in dry years with interruptions of flow to natural lakes in the floodplain.
StatusSeasonal deficit in dissolved oxygen, and at times increased BOD
5 as well as microbiological pollution are of concern. In the
Ukrainian section of the Prut in 2008-2009, BOD, nitrite, and suspended solids were the most common defects.
According to the 2009 data of the Prut Barlad Water Basin Ad-ministration, ten reservoirs located in the Prut Basin showed a degree of eutrophication, indicated by total phosphorus, nitro-gen, chlorophyll a and phytoplankton biomass.
The middle part of the Prut is somewhat more polluted than the upper sections due to tributaries and settlements, but in general no major changes have been observed in recent years in the Re-public of Moldova. Moderate pollution is characteristic of the
years 2005-2007, but from 2008 to 2009 the situation appears to have improved.129 Both in the Republic of Moldova and Ukraine, the quality is generally classified as “clean water” (class II in the national classifications). Compared to 2005, there was a slight improvement of the water quality of the Prut River in the Repub-lic of Moldova. In 2005, four monitoring stations of the seven fell in class III and three stations in class II. In 2008, all seven stations fell in class II. However, this classification is only based on six water quality determinands, using the Moldovan water pollution index.130
In Romania, the monitoring system has been established and functions in accordance with the EU WFD. In Romanian ter-ritory, on the Prut River, there are 11 monitoring stations. Ac-cording to the Romanian monitoring results in 2009, the Prut River is of class I (high) on 12% of its length (115 km between Stanca –Costesti Reservoir and confluence with Baseu tributary), and class II (good) on 88%.
Transboundary cooperationA new agreement between the Romanian and Moldovan Gov-ernments regarding cooperation on the protection and sustain-able use of the Prut and the Danube Rivers was signed in June 2010. Among the provisions is a regulation on the maintenance and operation of the Hydrotechnical Knot Stanca-Costesti on the Prut River. A Joint Subcommission for Operation of the Hy-drotechnic Knot “Stanca-Costesti” currently acts on the basis of the Regulation from 1985,131 and the 2010 bilateral agreement on transboundary waters.
A joint working group of the Republic of Moldova and Roma-nia concerning fisheries on the Prut River and in Stanca-Costesti Reservoir acts on the basis of the 2003 agreement of the countries on cooperation concerning fishing.
Popu
lation
(in m
illion
s)
0.0
0.2
0.4
0.6
0.8
1.0
1.2
1.4
Ukra
ineRo
man
iaRe
publi
c of M
oldov
a
0.9
1.2
0.4
Country information/other
Note: For the location of the stations, please refer to the Danube River Basin map. Sources: UNEP/DEWA/GRID-Europe 2011; Prut Barlad River Basin Administration, Romania (gauging station Oancea); Ministry of Environment and Natural Resources of the Republic of Moldova (gauging station Sirauty); National Administration “Apele Romane”, Romania. (gauging station “Stanca”); Ministry of Environment, the Republic of Moldova, National Administration “Apele Romane”, Romania; Directory of Administrative-Territorial Division and Statistical Yearbook, Chernivtsi oblast, Ukraine.
28 O
ance
a
27 Pr
isaca
ni
26 R
adau
ti Pr
ut
25 Ch
erni
vtsi
24 Ta
tariv
Disc
harg
e (m
3 s-1) (
loga
rithm
ic sc
ale)
517
7
5200
74
(Pru
t)
(Pru
t)
(Pru
t)
(Pru
t)
(Pru
t)
0.3
4240
81
6
755
105
22
668
95
13
0.1
10
1
1000
100
10000
5
QavQmaxQmin
DiSchaRgeS anD popuLaTion in The pRuT SuB-BaSin
129 Source: Water Quality Monitoring Yearbooks 2005-2008. State Hydrometeorological Service, Chisinau, Moldova, 2009.130 The national 7-point scale classification for quality of surface water in Moldova is based on post-Soviet period guidelines developed by Rostov Hydrochemical
Institute in Russia. Pollution is assessed using a relative, dimensionless index of water pollution, which in Moldova is calculated taking into account the six most common pollutants in surface waters, which include BOD
5, dissolved oxygen, N-NO2, N-NH4, oil products and phenols. A more elaborate system, using
some 80 determinands, is currently in the consultation process within the Government, and is likely to be approved in 2011. It will be used for the 2012-2013 classification of the Prut and Dniester rivers.
131 Source: River basin commissions and other institutions for transboundary water cooperation. UNECE. 2009.
230 | part IV
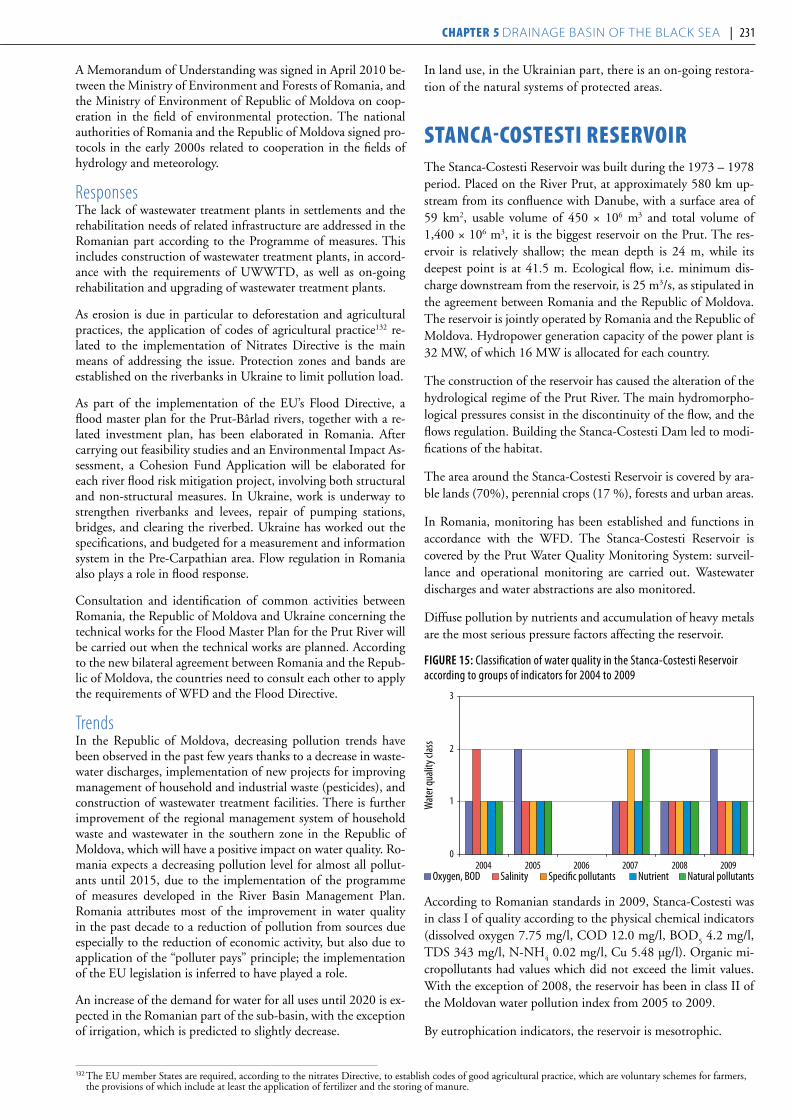
A Memorandum of Understanding was signed in April 2010 be-tween the Ministry of Environment and Forests of Romania, and the Ministry of Environment of Republic of Moldova on coop-eration in the field of environmental protection. The national authorities of Romania and the Republic of Moldova signed pro-tocols in the early 2000s related to cooperation in the fields of hydrology and meteorology.
ResponsesThe lack of wastewater treatment plants in settlements and the rehabilitation needs of related infrastructure are addressed in the Romanian part according to the Programme of measures. This includes construction of wastewater treatment plants, in accord-ance with the requirements of UWWTD, as well as on-going rehabilitation and upgrading of wastewater treatment plants.
As erosion is due in particular to deforestation and agricultural practices, the application of codes of agricultural practice132 re-lated to the implementation of Nitrates Directive is the main means of addressing the issue. Protection zones and bands are established on the riverbanks in Ukraine to limit pollution load.
As part of the implementation of the EU’s Flood Directive, a flood master plan for the Prut-Bârlad rivers, together with a re-lated investment plan, has been elaborated in Romania. After carrying out feasibility studies and an Environmental Impact As-sessment, a Cohesion Fund Application will be elaborated for each river flood risk mitigation project, involving both structural and non-structural measures. In Ukraine, work is underway to strengthen riverbanks and levees, repair of pumping stations, bridges, and clearing the riverbed. Ukraine has worked out the specifications, and budgeted for a measurement and information system in the Pre-Carpathian area. Flow regulation in Romania also plays a role in flood response.
Consultation and identification of common activities between Romania, the Republic of Moldova and Ukraine concerning the technical works for the Flood Master Plan for the Prut River will be carried out when the technical works are planned. According to the new bilateral agreement between Romania and the Repub-lic of Moldova, the countries need to consult each other to apply the requirements of WFD and the Flood Directive.
TrendsIn the Republic of Moldova, decreasing pollution trends have been observed in the past few years thanks to a decrease in waste-water discharges, implementation of new projects for improving management of household and industrial waste (pesticides), and construction of wastewater treatment facilities. There is further improvement of the regional management system of household waste and wastewater in the southern zone in the Republic of Moldova, which will have a positive impact on water quality. Ro-mania expects a decreasing pollution level for almost all pollut-ants until 2015, due to the implementation of the programme of measures developed in the River Basin Management Plan. Romania attributes most of the improvement in water quality in the past decade to a reduction of pollution from sources due especially to the reduction of economic activity, but also due to application of the “polluter pays” principle; the implementation of the EU legislation is inferred to have played a role.
An increase of the demand for water for all uses until 2020 is ex-pected in the Romanian part of the sub-basin, with the exception of irrigation, which is predicted to slightly decrease.
In land use, in the Ukrainian part, there is an on-going restora-tion of the natural systems of protected areas.
stanCa-CostestI reserVoIrThe Stanca-Costesti Reservoir was built during the 1973 – 1978 period. Placed on the River Prut, at approximately 580 km up-stream from its confluence with Danube, with a surface area of 59 km2, usable volume of 450 × 106 m3 and total volume of 1,400 × 106 m3, it is the biggest reservoir on the Prut. The res-ervoir is relatively shallow; the mean depth is 24 m, while its deepest point is at 41.5 m. Ecological flow, i.e. minimum dis-charge downstream from the reservoir, is 25 m3/s, as stipulated in the agreement between Romania and the Republic of Moldova. The reservoir is jointly operated by Romania and the Republic of Moldova. Hydropower generation capacity of the power plant is 32 MW, of which 16 MW is allocated for each country.
The construction of the reservoir has caused the alteration of the hydrological regime of the Prut River. The main hydromorpho-logical pressures consist in the discontinuity of the flow, and the flows regulation. Building the Stanca-Costesti Dam led to modi-fications of the habitat.
The area around the Stanca-Costesti Reservoir is covered by ara-ble lands (70%), perennial crops (17 %), forests and urban areas.
In Romania, monitoring has been established and functions in accordance with the WFD. The Stanca-Costesti Reservoir is covered by the Prut Water Quality Monitoring System: surveil-lance and operational monitoring are carried out. Wastewater discharges and water abstractions are also monitored.
Diffuse pollution by nutrients and accumulation of heavy metals are the most serious pressure factors affecting the reservoir.
FiguRe 15: Classification of water quality in the Stanca-Costesti Reservoir according to groups of indicators for 2004 to 2009
0
1
2
3
2004 2005 2006 2007 2008 2009 Oxygen, BOD Salinity Specific pollutants Nutrient Natural pollutants
According to Romanian standards in 2009, Stanca-Costesti was in class I of quality according to the physical chemical indicators (dissolved oxygen 7.75 mg/l, COD 12.0 mg/l, BOD
5 4.2 mg/l,
TDS 343 mg/l, N-NH4 0.02 mg/l, Cu 5.48 μg/l). Organic mi-
cropollutants had values which did not exceed the limit values. With the exception of 2008, the reservoir has been in class II of the Moldovan water pollution index from 2005 to 2009.
By eutrophication indicators, the reservoir is mesotrophic.
132 The EU member States are required, according to the nitrates Directive, to establish codes of good agricultural practice, which are voluntary schemes for farmers, the provisions of which include at least the application of fertilizer and the storing of manure.
230 | part IV Chapter 5 Drainage basin of the black sea | 231
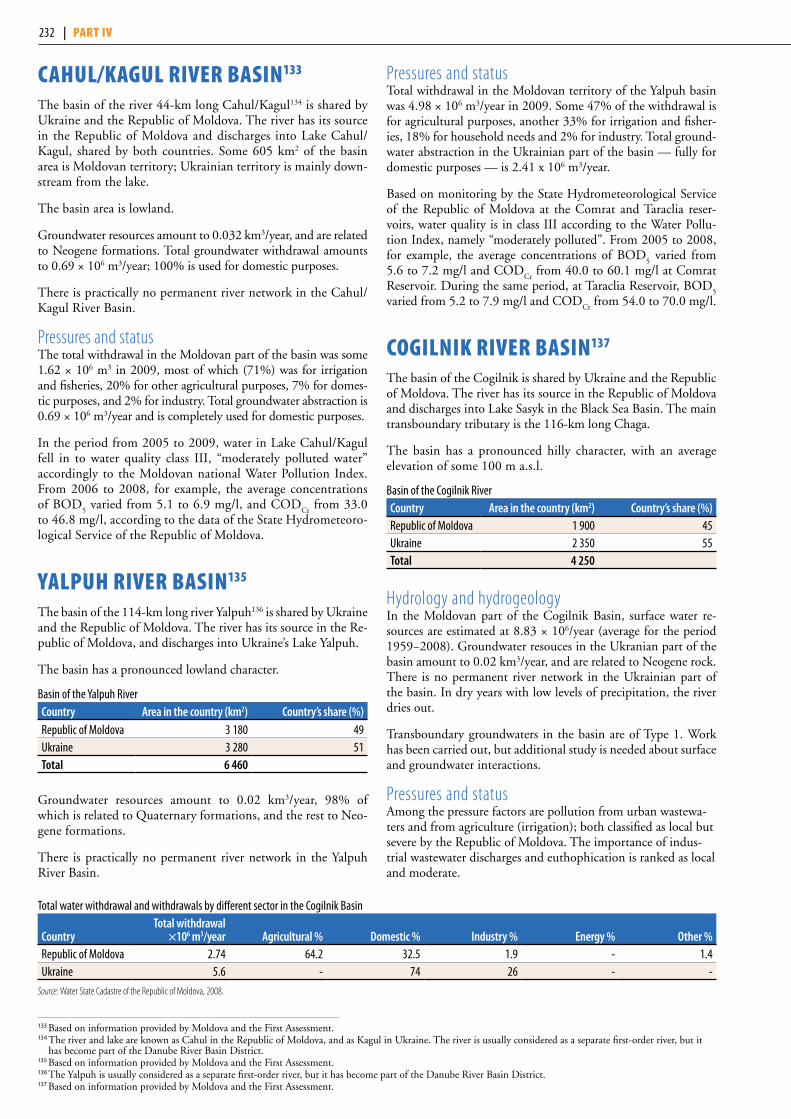
Cahul/kaGul rIVer BasIn133
The basin of the river 44-km long Cahul/Kagul134 is shared by Ukraine and the Republic of Moldova. The river has its source in the Republic of Moldova and discharges into Lake Cahul/Kagul, shared by both countries. Some 605 km2 of the basin area is Moldovan territory; Ukrainian territory is mainly down-stream from the lake.
The basin area is lowland.
Groundwater resources amount to 0.032 km3/year, and are related to Neogene formations. Total groundwater withdrawal amounts to 0.69 × 10⁶ m3/year; 100% is used for domestic purposes.
There is practically no permanent river network in the Cahul/Kagul River Basin.
Pressures and statusThe total withdrawal in the Moldovan part of the basin was some 1.62 × 10⁶ m3 in 2009, most of which (71%) was for irrigation and fisheries, 20% for other agricultural purposes, 7% for domes-tic purposes, and 2% for industry. Total groundwater abstraction is 0.69 × 10⁶ m3/year and is completely used for domestic purposes.
In the period from 2005 to 2009, water in Lake Cahul/Kagul fell in to water quality class III, “moderately polluted water” accordingly to the Moldovan national Water Pollution Index. From 2006 to 2008, for example, the average concentrations of BOD
5 varied from 5.1 to 6.9 mg/l, and COD
Cr from 33.0
to 46.8 mg/l, according to the data of the State Hydrometeoro-logical Service of the Republic of Moldova.
yalpuh rIVer BasIn135
The basin of the 114-km long river Yalpuh136 is shared by Ukraine and the Republic of Moldova. The river has its source in the Re-public of Moldova, and discharges into Ukraine’s Lake Yalpuh.
The basin has a pronounced lowland character.
Basin of the Yalpuh River country area in the country (km2) country’s share (%)Republic of Moldova 3 180 49Ukraine 3 280 51Total 6 460
Groundwater resources amount to 0.02 km3/year, 98% of which is related to Quaternary formations, and the rest to Neo-gene formations.
There is practically no permanent river network in the Yalpuh River Basin.
Pressures and statusTotal withdrawal in the Moldovan territory of the Yalpuh basin was 4.98 × 10⁶ m3/year in 2009. Some 47% of the withdrawal is for agricultural purposes, another 33% for irrigation and fisher-ies, 18% for household needs and 2% for industry. Total ground-water abstraction in the Ukrainian part of the basin — fully for domestic purposes — is 2.41 x 10⁶ m3/year.
Based on monitoring by the State Hydrometeorological Service of the Republic of Moldova at the Comrat and Taraclia reser-voirs, water quality is in class III according to the Water Pollu-tion Index, namely “moderately polluted”. From 2005 to 2008, for example, the average concentrations of BOD
5 varied from
5.6 to 7.2 mg/l and CODCr
from 40.0 to 60.1 mg/l at Comrat Reservoir. During the same period, at Taraclia Reservoir, BOD
5
varied from 5.2 to 7.9 mg/l and CODCr
from 54.0 to 70.0 mg/l.
CoGIlnIk rIVer BasIn137
The basin of the Cogilnik is shared by Ukraine and the Republic of Moldova. The river has its source in the Republic of Moldova and discharges into Lake Sasyk in the Black Sea Basin. The main transboundary tributary is the 116-km long Chaga.
The basin has a pronounced hilly character, with an average elevation of some 100 m a.s.l.
Basin of the Cogilnik River country area in the country (km2) country’s share (%)Republic of Moldova 1 900 45Ukraine 2 350 55Total 4 250
Hydrology and hydrogeologyIn the Moldovan part of the Cogilnik Basin, surface water re-sources are estimated at 8.83 × 10⁶/year (average for the period 1959−2008). Groundwater resouces in the Ukranian part of the basin amount to 0.02 km3/year, and are related to Neogene rock. There is no permanent river network in the Ukrainian part of the basin. In dry years with low levels of precipitation, the river dries out.
Transboundary groundwaters in the basin are of Type 1. Work has been carried out, but additional study is needed about surface and groundwater interactions.
Pressures and statusAmong the pressure factors are pollution from urban wastewa-ters and from agriculture (irrigation); both classified as local but severe by the Republic of Moldova. The importance of indus-trial wastewater discharges and euthophication is ranked as local and moderate.
133 Based on information provided by Moldova and the First Assessment. 134 The river and lake are known as Cahul in the Republic of Moldova, and as Kagul in Ukraine. The river is usually considered as a separate first-order river, but it
has become part of the Danube River Basin District.135 Based on information provided by Moldova and the First Assessment. 136 The Yalpuh is usually considered as a separate first-order river, but it has become part of the Danube River Basin District.137 Based on information provided by Moldova and the First Assessment.
Total water withdrawal and withdrawals by different sector in the Cogilnik Basin
countryTotal withdrawal
×106 m3/year agricultural % Domestic % industry % energy % other %Republic of Moldova 2.74 64.2 32.5 1.9 - 1.4Ukraine 5.6 - 74 26 - -
Source: Water State Cadastre of the Republic of Moldova, 2008.
232 | part IV
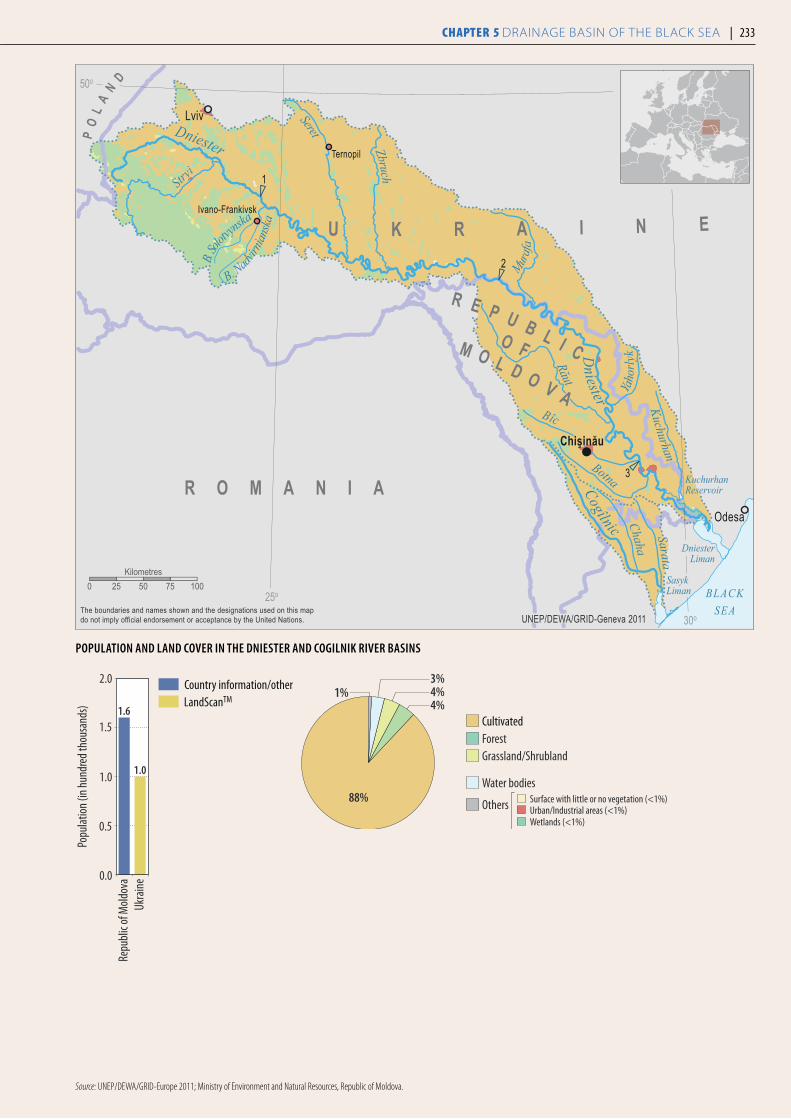
Source: UNEP/DEWA/GRID-Europe 2011; Ministry of Environment and Natural Resources, Republic of Moldova.
popuLaTion anD LanD coveR in The DnieSTeR anD cogiLniK RiveR BaSinS
Popu
lation
(in h
undr
ed th
ousa
nds)
0.0
0.5
1.0
1.5
2.0
Ukra
ineRe
publi
c of M
oldov
a
1.0
1.6LandScanTMCountry information/other
3
2
1
Chisinau
Lviv
Odesa
Ternopil
Ivano-Frankivsk
BLACKSEA
Dniester
Dniester Ya
horly
k
Kuchurhan
KuchurhanReservoir
Dniester Liman
Raut
Botna
Muraf
a
Seret
ZbruchBîc
Stryi
B. Sol
otvynska
B. Nadvirn
iansk
a
Cogîlnic ChahaSarata
SasykLiman
M O L D O V A
O F
R E P U B L I C
R O M A N I A
PO
LA
ND
U K R A I N E
50o
30o
25o
The boundaries and names shown and the designations used on this mapdo not imply official endorsement or acceptance by the United Nations. UNEP/DEWA/GRID-Geneva 2011
0 25 50 75 100Kilometres
4%1%
3%4%
88% Surface with little or no vegetation (<1%)Urban/Industrial areas (<1%)Wetlands (<1%)
Water bodies
Others
ForestGrassland/Shrubland
Cultivated
232 | part IV Chapter 5 Drainage basin of the black sea | 233

Hydrochemical characteristic of the Cogilnik at the monitoring site Hincesti in the Republic of MoldovaDeterminands Mac 2005 2006 2007 2008BOD
5,
mg/l 3.0 5.51 2.29 12.99 8.47
CODCr
, mg/l 30 27.55 14.01 39.94 28.56
N-NH4, mg/l 0.39 2.36 1.15 1.34 3.13
N-NO2,
mg/l 0.02 0.190 0.210 0.040 0.07
N-NO3, mg/l 9.0 1.75 2.48 2.19 2.11
P-PO4, mg/l 0.2 0.3 0.24 0.20 0.69
Petroleum hydrocarbons, mg/l
0.05 0.28 0.05 0.34 0.09
Cu, mg/l 0.001 0.004 0.010 0.003 N/AZn, mg/l 0.01 0.001 0.002 0.013 N/A
Source: State Hydrometeorological Service of the Republic of Moldova.
There is a high level of organic pollution (indicated as BOD and COD) in the river. The average annual concentrations of nitro-gen compounds exceed the MAC and the phosphorus content tends to increase. The river is considered by the Republic of Mol-dova as very polluted by organic substances. The oxygen content downstream from Kotovska is low.
ResponsesIn accordance with the bilateral agreement between the riparian countries on the joint use and protection of transboundary waters (1994), the laboratory of the Moldovan State Hydrometeorologi-cal Service exchanges information on water quality in the Cogilnik with Ukraine. The Republic of Moldova regrets that governmental funding is insufficient for renewing instruments and equipment, for paying for technical maintenance, and for the purchase of ma-terials and spare parts. Project funding is partly used for this, and is sought in order to train specialists. Efforts are being made to improve monitoring (adapting principles of the WFD).
Gaps in the institutional frameworks include a lack of specific action to involve interested non-governmental organizations and a lack of river basin commissions. There is no legal requirement for public involvement.
dnIester rIVer BasIn138
The basin of the 1,362-km long river Dniester is commonly considered shared by Ukraine and the Republic of Moldova, as the share of Poland is very small. The river has its source in the Ukrainian Carpathians, and discharges into the Black Sea. Major transboundary tributaries include the Kuchurhan and the Yahor-lyk. The basin is mountainous in the upper part, and lowlands prevail in the lower part. Valuable wetland systems extend along the Dniester Estuary, including some 100 wetland lakes (10-15
of the lakes are major). They play a vital role in maintaining the water balance and supporting the basin’s biological diversity.139
Basin of the Dniester River country area in the country (km2) country’s share (%)Ukraine 52 700 72.1Republic of Moldova 19 400 26.8Poland 226 0.4Total 72 326
Source: Statistical Yearbook Environment of Ukraine, Kyiv 2008; Ministry of Environment, the Republic of Moldova.
Hydrology and hydrogeologySurface water resources in the Ukrainian part of the Dniester ba-sin are estimated at 10.7 km3/year in an average year (at 6 km3/year in a dry year) and groundwater resources at 1.87 km3/year. More than 90% of the total flow of the Dniester is generated in Ukraine. Approximately 40% of the groundwater resources are in Cretaceous formations, less than 20% in Quaternary, and around 12-13% each in Neogene, Devonian and Silurian.140 The major-ity of the aquifers are only weakly connected to surface waters.
In the Moldovan part, surface water resources are estimated at 9.87 km3/year (average for the years 1954 to 2008).
The Dniester has a highly specific flood regime, featuring up to five flood events annually, during which water levels may increase by 3–4 m or even more. The significant variability of water levels, especially in the upper Carpathian reach, is attributed to the river channel’s low capacity.
The level of flow regulation is very low in the upper reach of the Dniester, with only one small reservoir established on the Chechvinsky tributary (storage capacity 12.1 × 10⁶ m3). The larg-est dams in the middle section are the Dubossary (1954) and Dniestrovsky (1983).
138 Based on information provided by the Republic of Moldova and Ukraine, and the First Assessment. 139 The total area of the Dniester Wetlands enjoying international recognition under the Ramsar Convention includes both Moldovan and Ukrainian parts of the
Dniester Estuary (with a total surface area of 150,000 ha). In 2005, the area along the Dniester and its Unguri-Holosnita valley on the Moldovan side were added to the Ramsar List. A similar decision was recommended in 2005 on the basis of a transboundary diagnostic study carried out in the framework of an OSCE/UNECE project for the same area along the Dniester on the Ukrainian side, so as to support its joint management.
140 Source: Geoinform, Ukraine.
Total water withdrawal and withdrawals by sector in the Dniester Basin
countryTotal withdrawal
×106 m3/year agricultural % Domestic % industry % energy % other %Ukraine 610.6a 29.9 58.6 4.7 5.7 1.1Republic of Moldova 765.16b N/A N/A N/A N/A N/A
Notes: Groundwater use is some 106 × 106 m3/year in the Moldovan part of the basin. Groundwater also has important functions such as maintaining baseflow and springs and supporting ecosystems. In Ukraine, groundwater is mainly used for household water. Surface water is used for agriculture, household needs and for industry. a Total groundwater abstraction amounts to 186 ×106 m3/year in the Ukranian part of the basin; of which 14% is used for agriculture, 78% for domestic purposes and 8% for industry. (Geoinform, Ukraine) b Major part of withdrawal used for cooling of a power station, i.e. all water comes back with about the same quality.
234 | part IV

PressuresThe high level of land use for agriculture has led to a significant increase of diffuse pollution loads. The pressure from field run-off and wastewater discharges from animal farms is assessed by Ukraine as widespread but moderate. Extensive diversion of water for irrigation reduces flow in the river, contributing to increased salinity in the liman (estuary).
Pollution through surface water affects the quality of shallow groundwater; for example nitrates (in Anenii Noi), chlorine (in Stefan Voda) and ammonium have been detected in elevated con-centrations.
Discharges of municipal wastewaters are among the main pres-sure factors in the basin, which has many densely populated areas (influence widespread and severe according to Ukraine), especially as in many settlements wastewater is not collected. Most of the treatment plants in Ukraine and the Republic of Moldova oper-ate ineffectively and are in need of major repairs and upgrading. There is also a decreasing trend of discharges treated according to regulatory requirements in Ukraine. The impact of the presence of viruses and bacteria from insufficient wastewater treatment is, however, assessed by the Republic of Moldova as local and moder-ate. In Ukraine, 15% of surface water samples do not meet the requirements for bacterial indicators.
Both permitted and illegal discharges from industries add to the pollution load. Industrial activity in the basin includes mining and petrol extraction, wood-processing, and the food and chemical in-dustries (e.g. oil refining). Industries are clustered in the main ur-ban centres: in Ukraine Lviv, Chernivtsy, Ivano-Frankivsk, Terno-pil and Kamianets-Podilsky; and in the Republic of Moldova Balti, Chisinau, Soroca, Orhei, Ribnita, Dubossary, Tiraspol and Bend-ery. In the last few years, industrial accidents have been associated with the accidental breaking through of a sewage collector near Mogilev-Podolskyi. There is also a risk of failing for the storage dam of a reservoir holding industrial brines close to Stebnik or the tailings dams of Dombrovskyi mine in Ivano-Frankovskoi oblast.
The impact of the change of thermal regime — in addition to
the flow speed — as a result of building the dams for hydropower development in the Middle Dniester in particular is assessed to be widespread and severe in the Moldovan territory.
Solid waste management in the Moldovan part of the basin is re-ported to be inadequate, with the only authorised or controlled dump sites existing in Chisinau. In Ukraine, municipal solid waste landfills do not meet environmental and health regulations (wide-spread but moderate influence). Dumping trash on the riverbank strips is reported to be widespread in Ukraine.
Flooding causes problems on the river (assessed as widespread and severe by Ukraine); at a larger scale most recently in July 2008 in the western region of Ukraine.
Hydromorphological changes are a concern, and regulation for hy-dropower use affects the ecological status of the river (e.g. down-stream from the Dnestrovsky hydropower station). The dams trap suspended sediment and pollutants such as organic compounds and heavy metals. The water surfaces of the Dniester wetlands are gradu-ally shrinking due to intensive sediment deposition and plant over-growth. In the Ukrainian territory, there is a high level of soil ero-sion, with washing-away affecting some 70% of the basin area, with tree-cutting (illegal and legal) and over-grazing adding to it. The loss of biodiversity in surface waters and water-related ecosystems is re-ported to be widespread (but moderate) in the Republic of Moldova.
StatusPreviously, the quality status was affected more by industrial pol-lution, but, at present, urban wastewater discharges (especially in the Lower Dniester, the Odessa region), run-off from agricultural land/irrigation return flows and erosion are more prominent fac-tors. In the Lower Dniester an increase of organic and nutrient pollution and a decrease of water quality into category 4 (or qual-ity class III) are observed. Water in most of the monitored river sections in Ukraine was in quality category 3 (or quality class II).
The Republic of Moldova assesses that water in the Upper and Middle Dniester basin are in class II (“clean water”), whereas the Dniester tributaries are substantially polluted.141 During the dry season water quality gets worse due to wastewater discharges.
3 Ben
dery
2 Mog
ilev-
Podo
lskyi
1 Gali
tsh
Disc
harg
e (m
3 s-1) (
loga
rithm
ic sc
ale)
4750
160
14
4510
255
3000
(Dni
este
r)
(Dni
este
r)
(Dni
este
r)1
10
100
1000
10000
49
313
15
QavQmaxQmin
Popu
lation
(in m
illion
s)
0
1
2
3
4
5
6
Ukra
ineRe
publi
c of M
oldov
a
2.7
5.0 LandScanTMCountry information/other
DiSchaRgeS, popuLaTion anD LanD coveR in The DnieSTeR RiveR BaSin
Sources: UNEP/DEWA/GRID-Europe 2011; Long-term data on the status and resources of surface waters, 1981-2000 and the entire period of observation, Ukraine; Statistical Yearbook Environment of Ukraine, Kyiv 2008; Action Programme to Improve Transboundary Cooperation and Sustainable Management of the Dniester River Basin (Dniester – III).
Wetlands (<1%)
Surface with little or no vegetation (<1%)Urban/Industrial areas (<1%)Others
Water bodies
1%1%2%
75%
21%
ForestGrassland/Shrubland
Cultivated
141 State Hydrometeorological Service, Republic of Moldova.
234 | part IV Chapter 5 Drainage basin of the black sea | 235
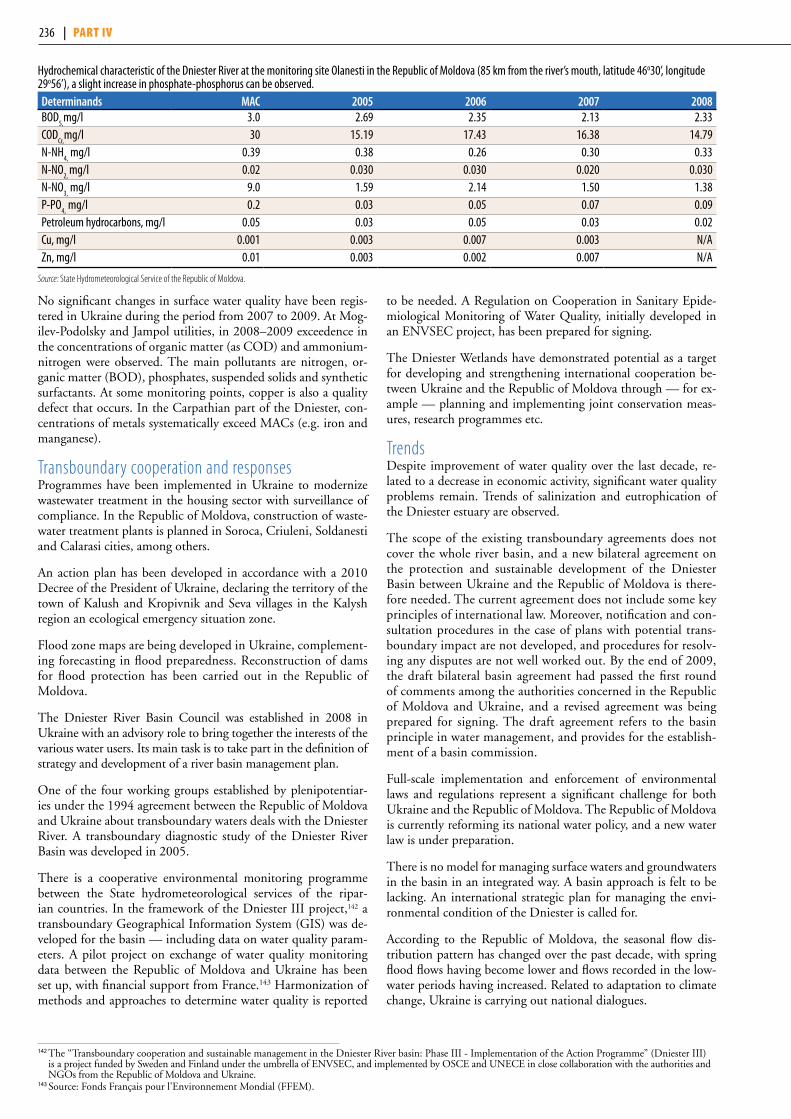
No significant changes in surface water quality have been regis-tered in Ukraine during the period from 2007 to 2009. At Mog-ilev-Podolsky and Jampol utilities, in 2008–2009 exceedence in the concentrations of organic matter (as COD) and ammonium-nitrogen were observed. The main pollutants are nitrogen, or-ganic matter (BOD), phosphates, suspended solids and synthetic surfactants. At some monitoring points, copper is also a quality defect that occurs. In the Carpathian part of the Dniester, con-centrations of metals systematically exceed MACs (e.g. iron and manganese).
Transboundary cooperation and responsesProgrammes have been implemented in Ukraine to modernize wastewater treatment in the housing sector with surveillance of compliance. In the Republic of Moldova, construction of waste-water treatment plants is planned in Soroca, Criuleni, Soldanesti and Calarasi cities, among others.
An action plan has been developed in accordance with a 2010 Decree of the President of Ukraine, declaring the territory of the town of Kalush and Kropivnik and Seva villages in the Kalysh region an ecological emergency situation zone.
Flood zone maps are being developed in Ukraine, complement-ing forecasting in flood preparedness. Reconstruction of dams for flood protection has been carried out in the Republic of Moldova.
The Dniester River Basin Council was established in 2008 in Ukraine with an advisory role to bring together the interests of the various water users. Its main task is to take part in the definition of strategy and development of a river basin management plan.
One of the four working groups established by plenipotentiar-ies under the 1994 agreement between the Republic of Moldova and Ukraine about transboundary waters deals with the Dniester River. A transboundary diagnostic study of the Dniester River Basin was developed in 2005.
There is a cooperative environmental monitoring programme between the State hydrometeorological services of the ripar-ian countries. In the framework of the Dniester III project,142 a transboundary Geographical Information System (GIS) was de-veloped for the basin — including data on water quality param-eters. A pilot project on exchange of water quality monitoring data between the Republic of Moldova and Ukraine has been set up, with financial support from France.143 Harmonization of methods and approaches to determine water quality is reported
to be needed. A Regulation on Cooperation in Sanitary Epide-miological Monitoring of Water Quality, initially developed in an ENVSEC project, has been prepared for signing.
The Dniester Wetlands have demonstrated potential as a target for developing and strengthening international cooperation be-tween Ukraine and the Republic of Moldova through — for ex-ample — planning and implementing joint conservation meas-ures, research programmes etc.
TrendsDespite improvement of water quality over the last decade, re-lated to a decrease in economic activity, significant water quality problems remain. Trends of salinization and eutrophication of the Dniester estuary are observed.
The scope of the existing transboundary agreements does not cover the whole river basin, and a new bilateral agreement on the protection and sustainable development of the Dniester Basin between Ukraine and the Republic of Moldova is there-fore needed. The current agreement does not include some key principles of international law. Moreover, notification and con-sultation procedures in the case of plans with potential trans-boundary impact are not developed, and procedures for resolv-ing any disputes are not well worked out. By the end of 2009, the draft bilateral basin agreement had passed the first round of comments among the authorities concerned in the Republic of Moldova and Ukraine, and a revised agreement was being prepared for signing. The draft agreement refers to the basin principle in water management, and provides for the establish-ment of a basin commission.
Full-scale implementation and enforcement of environmental laws and regulations represent a significant challenge for both Ukraine and the Republic of Moldova. The Republic of Moldova is currently reforming its national water policy, and a new water law is under preparation.
There is no model for managing surface waters and groundwaters in the basin in an integrated way. A basin approach is felt to be lacking. An international strategic plan for managing the envi-ronmental condition of the Dniester is called for.
According to the Republic of Moldova, the seasonal flow dis-tribution pattern has changed over the past decade, with spring flood flows having become lower and flows recorded in the low-water periods having increased. Related to adaptation to climate change, Ukraine is carrying out national dialogues.
Hydrochemical characteristic of the Dniester River at the monitoring site Olanesti in the Republic of Moldova (85 km from the river’s mouth, latitude 46o30’, longitude 29o56’), a slight increase in phosphate-phosphorus can be observed.Determinands Mac 2005 2006 2007 2008BOD
5,mg/l 3.0 2.69 2.35 2.13 2.33
CODCr,
mg/l 30 15.19 17.43 16.38 14.79N-NH
4, mg/l 0.39 0.38 0.26 0.30 0.33
N-NO2,
mg/l 0.02 0.030 0.030 0.020 0.030N-NO
3, mg/l 9.0 1.59 2.14 1.50 1.38
P-PO4,
mg/l 0.2 0.03 0.05 0.07 0.09Petroleum hydrocarbons, mg/l 0.05 0.03 0.05 0.03 0.02Cu, mg/l 0.001 0.003 0.007 0.003 N/AZn, mg/l 0.01 0.003 0.002 0.007 N/A
Source: State Hydrometeorological Service of the Republic of Moldova.
142 The “Transboundary cooperation and sustainable management in the Dniester River basin: Phase III - Implementation of the Action Programme” (Dniester III) is a project funded by Sweden and Finland under the umbrella of ENVSEC, and implemented by OSCE and UNECE in close collaboration with the authorities and NGOs from the Republic of Moldova and Ukraine.
143 Source: Fonds Français pour l'Environnement Mondial (FFEM).
236 | part IV
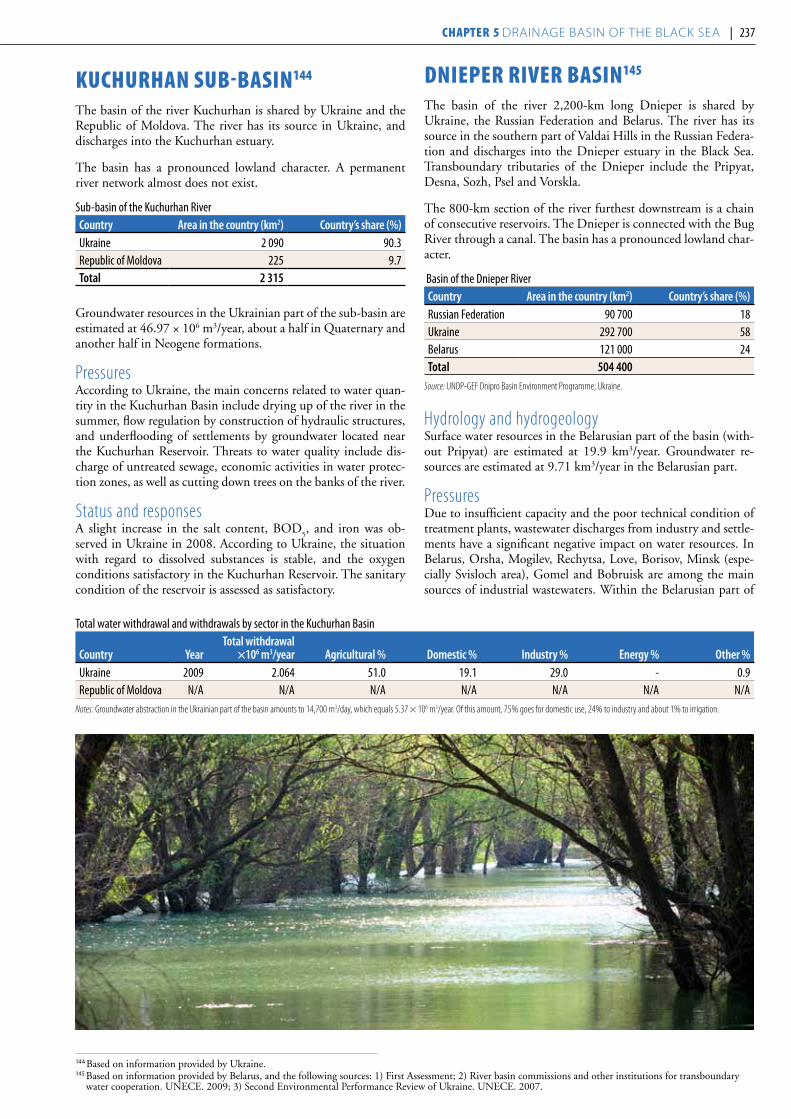
kuChurhan suB-BasIn144
The basin of the river Kuchurhan is shared by Ukraine and the Republic of Moldova. The river has its source in Ukraine, and discharges into the Kuchurhan estuary.
The basin has a pronounced lowland character. A permanent river network almost does not exist.
Sub-basin of the Kuchurhan Rivercountry area in the country (km2) country’s share (%)Ukraine 2 090 90.3Republic of Moldova 225 9.7Total 2 315
Groundwater resources in the Ukrainian part of the sub-basin are estimated at 46.97 × 10⁶ m3/year, about a half in Quaternary and another half in Neogene formations.
PressuresAccording to Ukraine, the main concerns related to water quan-tity in the Kuchurhan Basin include drying up of the river in the summer, flow regulation by construction of hydraulic structures, and underflooding of settlements by groundwater located near the Kuchurhan Reservoir. Threats to water quality include dis-charge of untreated sewage, economic activities in water protec-tion zones, as well as cutting down trees on the banks of the river.
Status and responsesA slight increase in the salt content, BOD
5, and iron was ob-
served in Ukraine in 2008. According to Ukraine, the situation with regard to dissolved substances is stable, and the oxygen conditions satisfactory in the Kuchurhan Reservoir. The sanitary condition of the reservoir is assessed as satisfactory.
dnIeper rIVer BasIn145
The basin of the river 2,200-km long Dnieper is shared by Ukraine, the Russian Federation and Belarus. The river has its source in the southern part of Valdai Hills in the Russian Federa-tion and discharges into the Dnieper estuary in the Black Sea. Transboundary tributaries of the Dnieper include the Pripyat, Desna, Sozh, Psel and Vorskla.
The 800-km section of the river furthest downstream is a chain of consecutive reservoirs. The Dnieper is connected with the Bug River through a canal. The basin has a pronounced lowland char-acter.
Basin of the Dnieper Rivercountry area in the country (km2) country’s share (%)Russian Federation 90 700 18Ukraine 292 700 58Belarus 121 000 24Total 504 400
Source: UNDP-GEF Dnipro Basin Environment Programme; Ukraine.
Hydrology and hydrogeologySurface water resources in the Belarusian part of the basin (with-out Pripyat) are estimated at 19.9 km3/year. Groundwater re-sources are estimated at 9.71 km3/year in the Belarusian part.
PressuresDue to insufficient capacity and the poor technical condition of treatment plants, wastewater discharges from industry and settle-ments have a significant negative impact on water resources. In Belarus, Orsha, Mogilev, Rechytsa, Love, Borisov, Minsk (espe-cially Svisloch area), Gomel and Bobruisk are among the main sources of industrial wastewaters. Within the Belarusian part of
Total water withdrawal and withdrawals by sector in the Kuchurhan Basin
country yearTotal withdrawal
×106 m3/year agricultural % Domestic % industry % energy % other %Ukraine 2009 2.064 51.0 19.1 29.0 - 0.9Republic of Moldova N/A N/A N/A N/A N/A N/A N/A
Notes: Groundwater abstraction in the Ukrainian part of the basin amounts to 14,700 m3/day, which equals 5.37 × 10⁶ m3/year. Of this amount, 75% goes for domestic use, 24% to industry and about 1% to irrigation.
144 Based on information provided by Ukraine.145 Based on information provided by Belarus, and the following sources: 1) First Assessment; 2) River basin commissions and other institutions for transboundary
water cooperation. UNECE. 2009; 3) Second Environmental Performance Review of Ukraine. UNECE. 2007.
236 | part IV Chapter 5 Drainage basin of the black sea | 237

1
2
3
4
5
Kharkiv
DnipropetrovskDonetsk
Odesa
Kyiv
Minsk
Vilnius
Chisinau
Ramsar SiteStokhid-Pripyat-Prostyr Rivers
KremenchukReservoir
KyivReservoir
Dnie
per
Dnieper
KakhovkaReservoir
S e ao f
A z o vB L A C K
S E A
Sozh
Pripyat
Desna
Psyol
Seym
Teter
iv
De
sna
Iput
Berezina
Inhu
lets
Hory
n
B E L A R U S
L I T H U A N I A
R O M A N I A
MOLDOVA
REPUBLIC OF
L A T V I A
R U S S I A N
F E D E R A T I O N
U K R A I N E50o
55o
35o
30o
25o
0 100 200 300Kilometres
UNEP/DEWA/GRID-Geneva 2011
The boundaries and names shown and the designationsused on this map do not imply official endorsement oracceptance by the United Nations.
0.01
0.1
1
10
100
1000
10000
5 Pin
sk
4 Lju
bjaz
3 Rec
hitsa
2 Mog
ilev
1 Orsh
a
Disc
harg
e (m
3 s-1) (
loga
rithm
ic sc
ale)
2000
125
2360
144
(Dni
eper
)
(Dni
eper
)
(Dni
eper
)
(Prip
yat)
(Prip
yat)
15
4970
361
94
331
12
0.07
634
70
1526
QavQmaxQmin
Popu
lation
(in m
illion
s)
0
5
10
15
20
25
Ukra
ineRu
ssian
Fede
ratio
nBe
larus
6.1
3.6
22.3Country information/otherLandScanTM
DiSchaRgeS, popuLaTion anD LanD coveR in The DniepeR RiveR BaSin
Sources: UNEP/DEWA/GRID-Europe 2011; UNDP-GEF Dnipro Basin Environment Programme; Ukraine; Long-term data on the status and resources of surface waters, 1981-2000 and the entire period of observation, Ukraine (gauging station Ljubjaz); Annual data on the regime and surface water resources for 2008, volume 3, State Water Cadastre, 2009 (Pinsk and Mozyr gauging stations).
Surface with little or no vegetation (<1%)Urban/Industrial areas (<1%)Wetlands (<1%)
Others
Water bodies
1%2%2%
66%
29% ForestGrassland/Shrubland
Cultivated
238 | part IV
the basin, the most significant pollution load as urban/municipal wastewater originates from Svisloch, where the Minsk wastewater treatment plant is located, but some load also originates from Mogilev. Nutrients are the most important pollutants. Belarus assesses the impact of municipal wastewaters as widespread but moderate. The Dnieper is among the biggest recipients of pol-lutants in Ukraine, where until at least until recently (2004) metallurgy was the biggest wastewater producer, followed by the coal industry and the chemical and petrochemical industries. Zaporozhye oblast has a large industrial zone, including metal-lurgy. Untreated or insufficiently treated wastewaters of these in-dustries typically contain heavy metals, phenols, oil products and other hazardous substances.146
Run-off from agricultural areas has a local but severe impact on water resources (Belarusian part). Large-scale development of tim-berland and draining of waterlogged lands for agriculture, as well as pollution with surface run-off from urban and agricultural areas, has impacted on the environment in the basin. In recent years, pol-lution by household waste, including waste left by holiday-makers, has increased along the Dnieper River and its tributaries.
Belarus ranks the impact related to nuclear power generation as widespread and severe. However, the transboundary transfer of cesium-137 from the radioactively contaminated Belarus-Bryansk area, transported through surface waters of Sozh and its tributaries, has naturally decayed to insignificant levels. The ac-tivity of lower-activity strontium-90 is markedly amplified dur-ing flooding. Radioactive elements have been monitored since the Chernobyl catastrophe. In the reservoirs of the Dnieper cas-cade, a decrease in mean annual cesium-137 and strontium-90 concentrations is observed.
Status and transboundary impactsThe chemical status of the river in the Belarusian part has re-mained stable during the period from 2006 to early 2010, or the general condition of water bodies has even improved. According to the classification of water resources adopted in Belarus, 76.1% of water in the basin is classified as "relatively clean", 19.7% as "moderately polluted", 1.4% as "polluted" and 2.8% as "dirty". In general, the Dnieper’s water resources can be classified as
“clean water” (II class of quality in the national classification of Ukraine). Main pollutants are nutrients (nitrogen compounds), organic substances (including phenols) and heavy metals.
The high degree of flow regulation contributes to eutrophication of water bodies, as well as accumulation of polluted sediments.
Transboundary cooperationA draft intergovernmental agreement between Belarus, Rus-sian Federation and Ukraine on Cooperation in the Field of Management and Protection in the Dnieper River Basin was developed within the framework of the UNDP-GEF Dnipro Basin Environment Programme. The draft agreement, which provides for the establishment of a joint commission has not yet been adopted.147
The Russian Federation-Belarus Commission has developed an effective programme for joint monitoring of transboundary sec-tions of the Dnieper.
Responses In the border zone in Belarus, groundwater monitoring is carried out at eight monitoring stations; three times a month for levels and temperature, once a year for physico-chemical parameters. According to Belarus, the current groundwater monitoring net-work is not sufficient, and joint monitoring is lacking. A gradual development of a network of monitoring wells for transboundary groundwaters is planned from 2011 to 2015.148 A joint Belarus and Ukraine project aims at transboundary monitoring. Joint monitoring of Ukraine and the Russian Federation has been challenging.
To ensure effective functioning of the majority of company/in-dustry treatment facilities, they have been included in the system of local monitoring. Belarus also reports that protection zones have been established around water bodies. In Ukraine, measures for water protection are carried out in the framework of the State programme of ecological rehabilitation of the Dnieper Basin and improvement of drinking water quality. Both Belarus and Ukraine report on-going efforts to reconstruct and extend waste-water treatment facilities.
146 Source: Second Environmental Performance Review of Ukraine. UNECE. 2007. 147 River basin commissions and other institutions for transboundary water cooperation. UNECE. 2009. 148 This is to be made under the National Development Plan of the National Environmental Monitoring System in the Republic of Belarus for 2011-2015.
paLeogene-neogene TeRRigenouS aquiFeR (no. 116)
Belarus ukraineSand, sandstones of Paleogene-Neogene age; groundwater flow direction is from Belarus to Ukraine; medium links with surface waters. Thickness: mean, max (m) 25–75, 150 N/AGroundwater uses and functions Groundwater is mainly used for household/drinking water. N/A
cenoManian caRBonaTe-TeRRigenouS aquiFeR (no. 117)
Belarus ukraineSand, sandstones, chalk, marl of Cenomanian age (Cretaceous); groundwater flow direction is from Belarus to Ukraine; weak links with surface waters.Thickness: mean, max (m) 50-100, 290 N/AGroundwater uses and functions Groundwater is mainly used for household/drinking water. N/A
uppeR Devonian TeRRigenouS-caRBonaTe aquiFeR (no. 118)
Belarus Russian FederationType 2/4; limestone, sandstone and marl of Upper Devonian age; groundwater flow direction is from Russian Federation to Belarus; weak links with surface waters. Thickness: mean, max (m) 100-150, 180 N/AGroundwater uses and functions Groundwater is mainly used for household/drinking water. N/A
238 | part IV Chapter 5 Drainage basin of the black sea | 239

paLeogene-neogene TeRRigenouS aquiFeR (no. 119)151
Belarus ukraineType 2/4; sand and sandstone; mean thickness 25–75 m, maximum thickness 150 m; groundwater flow direction from Belarus to Ukraine; Medium connection to surface waters.
cenoManian TeRRigenouS aquiFeR (no. 120)152
Belarus ukraineType 2/4; sand and sandstone, sandy loam; groundwater flow direction from Belarus to Ukraine; weak link to surface waters.Thickness: mean, max (m) 50-100, 290 N/A
uppeR pRoTeRoZoic TeRRigenouS aquiFeR (no. 121)153
Belarus ukraineType 2/4; sand and sandstone; groundwater flow direction from Ukraine to Belarus; weak link to surface waters. Area (km2) N/A N/AThickness: mean, max (m) 200, - N/A
Total water withdrawal and withdrawals by sector in the Pripyat sub-basin
country yearTotal withdrawal ×
10 6 m3/year agriculture % Domestic % industry % energy % other %Belarus 2000-2009a 371.2 64.4 23.0 11.0 1.3 0.3Ukraine 2009 525.6 37.1 17.3 7.0 37.4 2.0Ukraine 158.1b 13.7 66.6 10.0 - 9c
Notes: Groundwater is used for drinking and household water both in Belarus and Ukraine. In Ukraine groundwater is partly used for industrial purposes. a The withdrawal figure is an average for years from 2000 to 2009.b Groundwater only.c Removal of water from mines (not actual consumptive use).
149 Based on information provided by Belarus and Ukraine, and the First Assessment. 150 Report of Water Management in the Pripyat River Basin, Joint Programme TACIS, 2003.151 Based on information from Belarus.152 Based on information from Belarus.153 Based on information from Belarus.
prIpyat suB-BasIn149
The sub-basin of the 710-km long Pripyat River is shared by Ukraine and Belarus. The Pripyat originates in Ukraine in the area of Shatski Lakes, and, after traversing Belarusian territory, returns to Ukraine, before discharging into the Dnieper.
Among the many smaller transboundary rivers in the Pripyat sub-ba-sin are the following: Styr, Goryn, L’va, Stviga, Ubort and Slovechna.
Sub-basin of the Pripyat Rivercountry area in the country (km2) country’s share (%)Belarus 52 700 43Ukraine 69 140 57Total 121 840
Source: Report of Water Management in the Pripyat River Basin, Joint Programme TACIS, 2003. Blue Treasure Belarus: Encyclopedia. BelEn, Minsk. 2007.
Hydrology and hydrogeologyWater resources in the Ukrainian part of the basin are estimated at 7.4 km3/year.150 Groundwater resources are estimated at 484.6 × 10⁶ m3. Some 86% of these groundwater resources are in Creta-ceous formations. About a half of the remaining resources are in Palaeogene formations, a significant share in Jurassic formations, and some also in Quaternary formations.
In the Belarusian part, surface water resources are estimated at 5.6 km3/year and groundwater resources at 2.56 km3/year.
PressuresThe flow being fed by marshlands, and forest and peatlands be-ing abundant in the basin, results in the water of the Pripyat
and most of the tributaries having low salinity and being rich in organic substances. Elevated concentrations of iron and manga-nese in groundwater are common. These natural factors have a widespread but moderate influence on water quality. The content of organic matter and also of nutrients is increased by agriculture in Ukrainian territory, also locally (but potentially severely) af-fecting water entering the territory of Belarus.
The basin is still affected by the radioactive fallout that resulted from the nuclear accident at Chernobyl in 1986 (judged wide-spread and severe by Belarus), even though a decreasing trend in radioactive cesium (Cs) and strontium (Sr) is reported by Ukraine in most monitoring points. Higher levels of radionu-clides mainly occur in basins within 30 km from Chernobyl. The transboundary transport of 90Sr varies, depending on the extent of annual flooding. Transport of radioactive pollution occurs both in dissolved form and with sediments. While in normal op-eration, thermal pollution from nuclear power station at Rivne (of the same type as Chernobyl), Ukraine on the Styr River is re-ported to be negligible. Concentration of 137Cs and 90Sr radionu-clids in the surface waters at monitoring stations near the Roven-skaya nuclear power plant, as well as in industrial wastewaters and storm waters, is insignificant and does not exceed permissible limits (12-15 times lower).
Wastewater treatment plants are not working effectively — most of them are in need of renovation and major repairs — and the pressure from resulting discharges is ranked by Ukraine as widespread and severe. In the following towns or settlements, the load is reported to exceed the capacity of treatment plants: Slutsk, Pljuban and Starie-Dorogi in Belarus; and Korosten in Ukraine. Among the sources of industrial wastewaters in Belarus are the oil processing plant at Mosyr in the lower catchment area,
240 | part IV
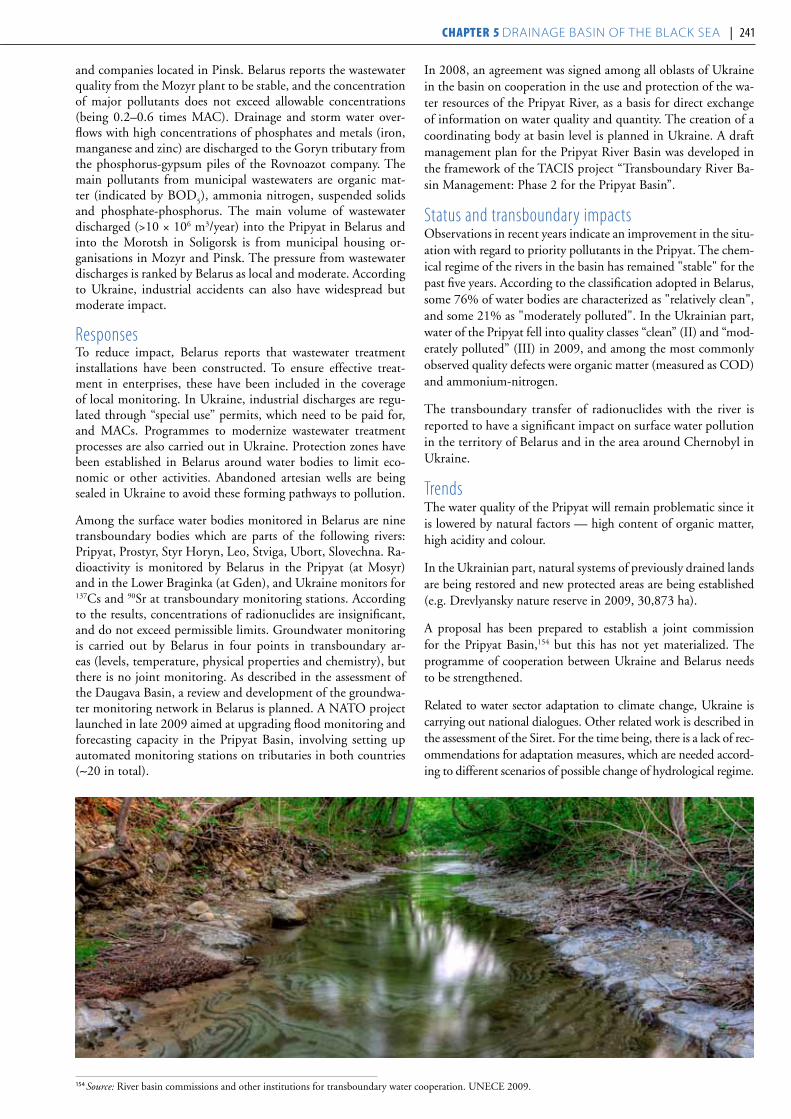
and companies located in Pinsk. Belarus reports the wastewater quality from the Mozyr plant to be stable, and the concentration of major pollutants does not exceed allowable concentrations (being 0.2–0.6 times MAC). Drainage and storm water over-flows with high concentrations of phosphates and metals (iron, manganese and zinc) are discharged to the Goryn tributary from the phosphorus-gypsum piles of the Rovnoazot company. The main pollutants from municipal wastewaters are organic mat-ter (indicated by BOD
5), ammonia nitrogen, suspended solids
and phosphate-phosphorus. The main volume of wastewater discharged (>10 × 106 m3/year) into the Pripyat in Belarus and into the Morotsh in Soligorsk is from municipal housing or-ganisations in Mozyr and Pinsk. The pressure from wastewater discharges is ranked by Belarus as local and moderate. According to Ukraine, industrial accidents can also have widespread but moderate impact.
ResponsesTo reduce impact, Belarus reports that wastewater treatment installations have been constructed. To ensure effective treat-ment in enterprises, these have been included in the coverage of local monitoring. In Ukraine, industrial discharges are regu-lated through “special use” permits, which need to be paid for, and MACs. Programmes to modernize wastewater treatment processes are also carried out in Ukraine. Protection zones have been established in Belarus around water bodies to limit eco-nomic or other activities. Abandoned artesian wells are being sealed in Ukraine to avoid these forming pathways to pollution.
Among the surface water bodies monitored in Belarus are nine transboundary bodies which are parts of the following rivers: Pripyat, Prostyr, Styr Horyn, Leo, Stviga, Ubort, Slovechna. Ra-dioactivity is monitored by Belarus in the Pripyat (at Mosyr) and in the Lower Braginka (at Gden), and Ukraine monitors for 137Cs and 90Sr at transboundary monitoring stations. According to the results, concentrations of radionuclides are insignificant, and do not exceed permissible limits. Groundwater monitoring is carried out by Belarus in four points in transboundary ar-eas (levels, temperature, physical properties and chemistry), but there is no joint monitoring. As described in the assessment of the Daugava Basin, a review and development of the groundwa-ter monitoring network in Belarus is planned. A NATO project launched in late 2009 aimed at upgrading flood monitoring and forecasting capacity in the Pripyat Basin, involving setting up automated monitoring stations on tributaries in both countries (∼20 in total).
In 2008, an agreement was signed among all oblasts of Ukraine in the basin on cooperation in the use and protection of the wa-ter resources of the Pripyat River, as a basis for direct exchange of information on water quality and quantity. The creation of a coordinating body at basin level is planned in Ukraine. A draft management plan for the Pripyat River Basin was developed in the framework of the TACIS project “Transboundary River Ba-sin Management: Phase 2 for the Pripyat Basin”.
Status and transboundary impactsObservations in recent years indicate an improvement in the situ-ation with regard to priority pollutants in the Pripyat. The chem-ical regime of the rivers in the basin has remained "stable" for the past five years. According to the classification adopted in Belarus, some 76% of water bodies are characterized as "relatively clean", and some 21% as "moderately polluted". In the Ukrainian part, water of the Pripyat fell into quality classes “clean” (II) and “mod-erately polluted” (III) in 2009, and among the most commonly observed quality defects were organic matter (measured as COD) and ammonium-nitrogen.
The transboundary transfer of radionuclides with the river is reported to have a significant impact on surface water pollution in the territory of Belarus and in the area around Chernobyl in Ukraine.
TrendsThe water quality of the Pripyat will remain problematic since it is lowered by natural factors — high content of organic matter, high acidity and colour.
In the Ukrainian part, natural systems of previously drained lands are being restored and new protected areas are being established (e.g. Drevlyansky nature reserve in 2009, 30,873 ha).
A proposal has been prepared to establish a joint commission for the Pripyat Basin,154 but this has not yet materialized. The programme of cooperation between Ukraine and Belarus needs to be strengthened.
Related to water sector adaptation to climate change, Ukraine is carrying out national dialogues. Other related work is described in the assessment of the Siret. For the time being, there is a lack of rec-ommendations for adaptation measures, which are needed accord-ing to different scenarios of possible change of hydrological regime.
154 Source: River basin commissions and other institutions for transboundary water cooperation. UNECE 2009.
240 | part IV Chapter 5 Drainage basin of the black sea | 241

stokhId-prIpyat-prostyr rIVers155
General description of the wetland The upper reaches of the Pripyat River are characterized by nu-merous river beds, arms, oxbow lakes and creeks with dozens of sandy islands, surrounded by forests, mires and lakes. Together they represent one of the largest remaining European floodplain meadow and fen complex shared by Belarus and Ukraine. On the Ukrainian side, three Ramsar Sites cover natural floodplains along the Pripyat River and its tributaries Stokhid, Stviga and L’va, as well as Perebrodi bog. The adjacent Ramsar Site in Be-larus includes fen mires and wet meadows between the rivers Pripyat, Prostyr, Gnilaya Pripyat and Styr.
Main wetland ecosystem services The wetland area has large groundwater reserves that contribute to the hydrological regime of the region. Due to its consider-able size and water retention capacity, this wetland area plays an important role in reducing the risk of disastrous floods in the Pripyat floodplain.
Natural habitats are used for haymaking, cattle pasturing, forest-ry (in Ukraine), small scale commercial and recreational fishing, sport hunting and various recreational activities. In general the Belarusian part is less accessible. Tourist activities have begun on the Ukrainian side thanks to the efforts of the National Park ad-ministration. In Belarus, there is also a good potential for further development of nature tourism.
Cultural values of the wetland areaThe everyday life of local residents is closely connected with nature and natural resources; they are used in a sustainable way. In Ukraine, there are several ancient villages with typical Polissyan architecture, and good examples of the traditional use of local construction mate-rials (wood, reed and cattail). The area also has numerous religious buildings, architectural monuments and memorials.
Biodiversity values of the wetland areaThe large, relatively untouched natural area is characterized by a rich biodiversity, including globally threatened species, and spe-cies and habitats of European concern. It forms one of the major transboundary ecological corridors in Europe — an important contribution to the European Nature Conservation Network currently in development.
During the migration seasons the wetland area offers stop-over sites for geese, ducks, coots, rails, terns, gulls, waders, swallows and other birds (the total number exceeds 100,000 individu-als). The wetland also provides breeding grounds for more than 10,000 pairs of waterbirds, including some listed on the IUCN Red List of Threatened Species, including Greater Spotted Eagle and Aquatic Warbler.
Long floods and well preserved wet meadows create favorable conditions for spawning fish. There are also important feeding, nursery and wintering sites for fish.
Pressure factors and transboundary impactsThe Polesie region covers southern Belarus, northern Ukraine and adjacent areas of Poland and the Russian Federation. It lost most of its natural wetland areas as a result of drainage, accompa-nied by irreversible losses of biodiversity. The remaining natural and semi-natural areas are now extremely vulnerable to outside impacts.
Changes of the hydrological balance and of the river water level started in the 1960-70s, when a number of irrigation systems were constructed and the Pripyat was narrowed and diked. This lead to the deterioration of valuable habitats (including spawn-ing sites) and loss or decrease of populations of wetland species. Accidental pollution from agricultural lands, loss of habitats due to overgrowing of abandoned meadows with bushes and (in Be-larus) spring fires are additional pressures. In Ukraine, illegal fish-ing and hunting, and in some places overgrazing, are noticed.
Transboundary wetland managementIn Belarus, the Ramsar Site Prostyr (9,500 ha) includes a na-tional landscape reserve of the same name. In Ukraine, Ram-sar Sites Stokhid River Floodplains (10,000 ha), Prypiat River Floodplains (12,000 ha) and Stvigi and L’va Rivers’ Floodplains (12,718 ha) include landscape and hydrological reserves, as well as parts of “Prypiat-Stokhid” National Park, “Prypiat-Stokhid” Regional Landscape Park and “Rovenskiy” Wildlife Manage-ment Area. All three Ramsar Sites are Important Bird Areas. In 2008 the Governments of Belarus and Ukraine designated a transboundary Ramsar Site “Stokhid-Prypiat-Prostyr” with the aim of continuing collaboration for the joint management of this wetland area. This work is largely supported by the UNDP/GEF projects “Catalyzing sustainability of the wetland protected area system in Belarusian Polesie through increased management efficiency and realigned land use practices” and “Strengthening governance and financial sustainability of the national protected area system in Ukraine”.
155 Source: Information Sheets on Ramsar Wetlands (RIS).
242 | part IV
elanCIk rIVer BasIn156
The basin of the Elancik River is shared by Ukraine and the Rus-sian Federation. The river has its source in the Russian Federa-tion and discharges into the Black Sea (Sea of Azov). The 77-km long Suhoi Elancik is a transboundary tributary. Flow in the Elancik and the Suhoi Elancik is regulated to a large degree. In the Russian territory, there are six reservoirs.
The basin is lowland, with an average elevation of 110 m a.s.l.
Basin of the Elancik River country area in the country (km2) country’s share (%)Russian Federation 310 60.2Ukraine 197 38.3Sub-total, Suhoi elancik tributary
507
Russian Federation 978 70.4Ukraine 316 22.7Total, elancik 1 294
In the Russian part of the basin, surface water resources are esti-mated at 0.0151 km3/year (based on observations from 1950 to 1962), and groundwater resources at 0.209 km3/year, adding up to a total of 0.224 km3/year.
The basin of the Elancik is located within the Azov-Kuban Arte-sian Basin, where there are six major aquifer systems in the Upper Cretaceous, Paleocene-Eocene, Miocene and Quaternary sedi-ments. Groundwater is used to support agriculture in the basin.
In total, there are some 20 ponds on the Elancik and the tributar-ies, which are used for fish farming. The river regulation causes reduction of reservoir volume by accumulating sediment, which, according to the Russian Federation, has a local but severe im-pact. The Elancik dries up in the summer, and ecosystems being negatively affected is a concern.
With a centralized water supply and wastewater collection lack-ing, wastewater is discharged into dug canals/pits. Water quality is affected in the Russian part by violations of limitations to eco-nomic activity in water protection zones, uncontrolled landfills, and watering livestock. All these factors are assessed by the Rus-sian Federation as severe, but local in impact. Recreational use of the water bodies is a minor pressure.
In the Ukrainian part of the basin, there is hardly any economic activity; only one agricultural enterprise used water in 2009. Some 67% of the water use is met from groundwater. The trend of water withdrawal for agricultural use in the Ukrainian part has been decreasing since 2001. Urban wastewater discharges in Ukraine were limited in 2009 to one housing company.
Status and responsesThe concentration of sulphates, among other elements, is natu-rally elevated. Anthropogenic pressure in the Russian part is less pronounced, limited to the concentrations of some substances
exceeding MAC, among them nitrites and BOD5, as well as pes-
ticides. In general, in Marfinka, 75 km from the river’s mouth, water is classified as “dirty” (class 4b) according to the Russian system. These results are in line with the previous years.
An analysis of the current state of water resources in the Donetsk region — including the Elancik — was made in 2009 through a programme of restoring and maintaining the flow and cleanness of water in small rivers, financed from a local fund for environ-mental protection.
More than nine km of the river channel, from the Ukrainian bor-der to Anastasievka village in Rostov oblast, have been dredged by the Russian Federation, contributing to both the reduction of impacts from flooding and clean-up of accumulated pollution. In the Russian Federation, the implementation of water conservation measures is constrained by the financial capacity of water users.
The Elancik is not included in joint monitoring between Ukraine and the Russian Federation. Ukraine underlines the need for har-monisation of methods and approaches in determining water quality at transboundary level, noting also a lack of prediction models for changes in the ecological status of water resources.
TrendsNo significant improvement is expected in the condition of the river. Regarding climate change, a scenario up to 2030 has been developed in Ukraine. Sector-specific vulnerability assessment at basin level is planned, to be followed by developing measures to improve resilience to climate change. The introduction of IWRM and rationalization of water use are already identified as a means to that end.
MIus BasIn157
The basin of the river Mius is shared by Ukraine and the Russian Federation. The river has its source in Ukraine and discharges into the Black Sea (Sea of Azov). The Krinka is a major transboundary tributary originating in the Donetsk region, and discharging into the Mius in the Rostov region of the Russian Federation.
The basin is characterized by Donetsk ridge and Pryazovska el-evated plain, consisting mainly of lowland.
Sub-basin of the Mius Rivercountry area in the country (km2) country’s share (%)Ukraine 2 530 96.2Russian Federation 100 3.8Sub-total, Krinka 2 630Ukraine 1 384 20.7Russian Federation 5 296 79.3Total 6 680
Most of the annual run-off occurs during snow melting pe-riod, but, during low flow period, groundwater contribution
156 Based on information provided by the Russian Federation and Ukraine. 157 Based on information provide by Ukraine and the Russian Federation.
Total water withdrawal and withdrawals by sector in the Elancik Basin
country yearTotal withdrawal
×106 m3/year agricultural % Domestic % industry % energy % other %Russian Federation 2009 0.34a 76 24 - - -Ukraine 2009 0.024b 100 - - - -
a Use is predicted to stay approximately at the same level until 2013.b Main indicators of water use in Ukraine for 2009. Gosvodkhoz.
242 | part IV Chapter 5 Drainage basin of the black sea | 243
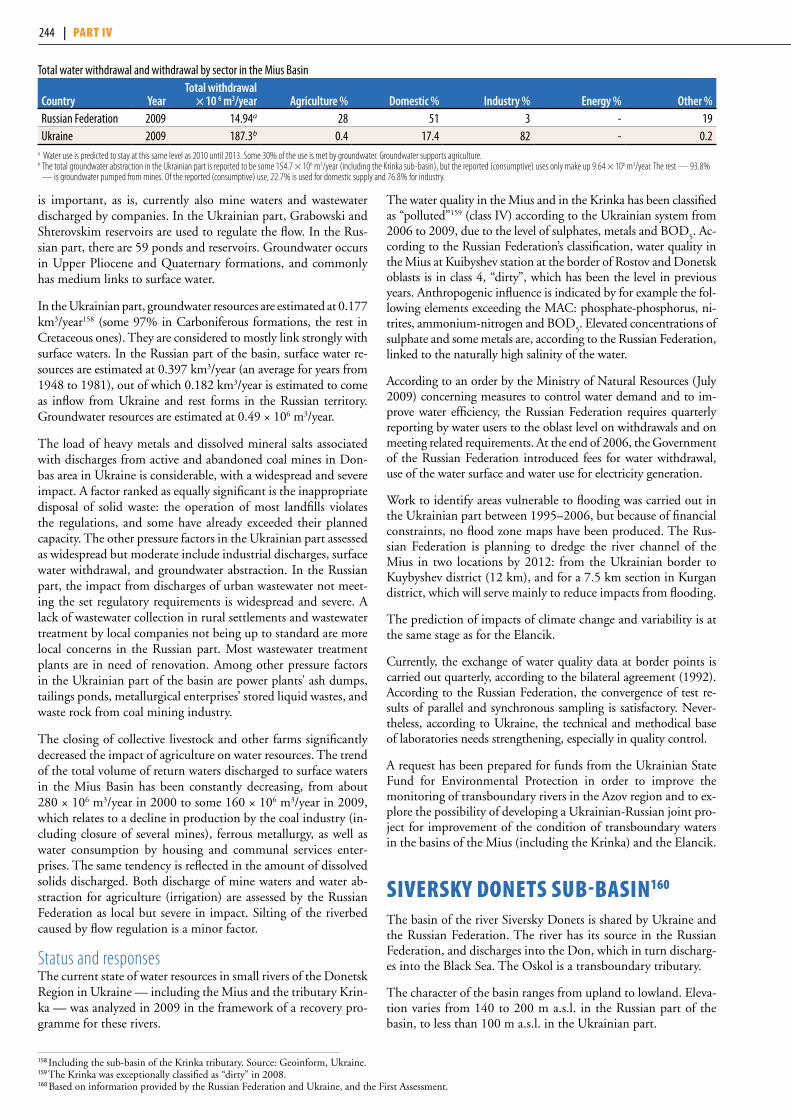
is important, as is, currently also mine waters and wastewater discharged by companies. In the Ukrainian part, Grabowski and Shterovskim reservoirs are used to regulate the flow. In the Rus-sian part, there are 59 ponds and reservoirs. Groundwater occurs in Upper Pliocene and Quaternary formations, and commonly has medium links to surface water.
In the Ukrainian part, groundwater resources are estimated at 0.177 km3/year158 (some 97% in Carboniferous formations, the rest in Cretaceous ones). They are considered to mostly link strongly with surface waters. In the Russian part of the basin, surface water re-sources are estimated at 0.397 km3/year (an average for years from 1948 to 1981), out of which 0.182 km3/year is estimated to come as inflow from Ukraine and rest forms in the Russian territory. Groundwater resources are estimated at 0.49 × 10⁶ m3/year.
The load of heavy metals and dissolved mineral salts associated with discharges from active and abandoned coal mines in Don-bas area in Ukraine is considerable, with a widespread and severe impact. A factor ranked as equally significant is the inappropriate disposal of solid waste: the operation of most landfills violates the regulations, and some have already exceeded their planned capacity. The other pressure factors in the Ukrainian part assessed as widespread but moderate include industrial discharges, surface water withdrawal, and groundwater abstraction. In the Russian part, the impact from discharges of urban wastewater not meet-ing the set regulatory requirements is widespread and severe. A lack of wastewater collection in rural settlements and wastewater treatment by local companies not being up to standard are more local concerns in the Russian part. Most wastewater treatment plants are in need of renovation. Among other pressure factors in the Ukrainian part of the basin are power plants’ ash dumps, tailings ponds, metallurgical enterprises’ stored liquid wastes, and waste rock from coal mining industry.
The closing of collective livestock and other farms significantly decreased the impact of agriculture on water resources. The trend of the total volume of return waters discharged to surface waters in the Mius Basin has been constantly decreasing, from about 280 × 106 m3/year in 2000 to some 160 × 106 m3/year in 2009, which relates to a decline in production by the coal industry (in-cluding closure of several mines), ferrous metallurgy, as well as water consumption by housing and communal services enter-prises. The same tendency is reflected in the amount of dissolved solids discharged. Both discharge of mine waters and water ab-straction for agriculture (irrigation) are assessed by the Russian Federation as local but severe in impact. Silting of the riverbed caused by flow regulation is a minor factor.
Status and responsesThe current state of water resources in small rivers of the Donetsk Region in Ukraine — including the Mius and the tributary Krin-ka — was analyzed in 2009 in the framework of a recovery pro-gramme for these rivers.
The water quality in the Mius and in the Krinka has been classified as “polluted”159 (class IV) according to the Ukrainian system from 2006 to 2009, due to the level of sulphates, metals and BOD
5. Ac-
cording to the Russian Federation’s classification, water quality in the Mius at Kuibyshev station at the border of Rostov and Donetsk oblasts is in class 4, “dirty”, which has been the level in previous years. Anthropogenic influence is indicated by for example the fol-lowing elements exceeding the MAC: phosphate-phosphorus, ni-trites, ammonium-nitrogen and BOD
5. Elevated concentrations of
sulphate and some metals are, according to the Russian Federation, linked to the naturally high salinity of the water.
According to an order by the Ministry of Natural Resources (July 2009) concerning measures to control water demand and to im-prove water efficiency, the Russian Federation requires quarterly reporting by water users to the oblast level on withdrawals and on meeting related requirements. At the end of 2006, the Government of the Russian Federation introduced fees for water withdrawal, use of the water surface and water use for electricity generation.
Work to identify areas vulnerable to flooding was carried out in the Ukrainian part between 1995–2006, but because of financial constraints, no flood zone maps have been produced. The Rus-sian Federation is planning to dredge the river channel of the Mius in two locations by 2012: from the Ukrainian border to Kuybyshev district (12 km), and for a 7.5 km section in Kurgan district, which will serve mainly to reduce impacts from flooding.
The prediction of impacts of climate change and variability is at the same stage as for the Elancik.
Currently, the exchange of water quality data at border points is carried out quarterly, according to the bilateral agreement (1992). According to the Russian Federation, the convergence of test re-sults of parallel and synchronous sampling is satisfactory. Never-theless, according to Ukraine, the technical and methodical base of laboratories needs strengthening, especially in quality control.
A request has been prepared for funds from the Ukrainian State Fund for Environmental Protection in order to improve the monitoring of transboundary rivers in the Azov region and to ex-plore the possibility of developing a Ukrainian-Russian joint pro-ject for improvement of the condition of transboundary waters in the basins of the Mius (including the Krinka) and the Elancik.
sIVersky donets suB-BasIn160
The basin of the river Siversky Donets is shared by Ukraine and the Russian Federation. The river has its source in the Russian Federation, and discharges into the Don, which in turn discharg-es into the Black Sea. The Oskol is a transboundary tributary.
The character of the basin ranges from upland to lowland. Eleva-tion varies from 140 to 200 m a.s.l. in the Russian part of the basin, to less than 100 m a.s.l. in the Ukrainian part.
158 Including the sub-basin of the Krinka tributary. Source: Geoinform, Ukraine.159 The Krinka was exceptionally classified as “dirty” in 2008.160 Based on information provided by the Russian Federation and Ukraine, and the First Assessment.
Total water withdrawal and withdrawal by sector in the Mius Basin
country yearTotal withdrawal
× 10 6 m3/year agriculture % Domestic % industry % energy % other %Russian Federation 2009 14.94a 28 51 3 - 19Ukraine 2009 187.3b 0.4 17.4 82 - 0.2
a Water use is predicted to stay at this same level as 2010 until 2013. Some 30% of the use is met by groundwater. Groundwater supports agriculture.b The total groundwater abstraction in the Ukrainian part is reported to be some 154.7 × 10⁶ m3/year (including the Krinka sub-basin), but the reported (consumptive) uses only make up 9.64 × 10⁶ m3/year. The rest — 93.8%
— is groundwater pumped from mines. Of the reported (consumptive) use, 22.7% is used for domestic supply and 76.8% for industry.
244 | part IV

157 In this case MAC for fish life, which are the most strict.
5
43
2
1
Rostov-na-Donu
Donetsk
VolgogradKharkiv
Voronezh
Stavropol
Belgorod
Lipetsk
Don
Don
Oskol
Severskiy Donets
S e ao f
A z o v
Volga-DonCanal
Volga
LakeManych-GudiloVeselovskoye
Reservoir
Tsimlyanskoye Reservoir
BLACK SEA
Medvedi
tsa
Voro
nezh
Sal
U K R A I N E
R U S SI A
NF
ED
ER
AT
IO
N
35o
50o
40o 45o
45o 0 100 200Kilometres
UNEP/DEWA/GRID-Geneva 2011The boundaries and names shown and the designations used on this mapdo not imply official endorsement or acceptance by the United Nations.
1
10
100
1000
10000
5 Kru
zhilo
vka
4 Sta
rodu
bovk
a
3 Yer
emov
ka
2 Iziu
m
1 Ogu
rtsov
o
Disc
harg
e (m
3 s-1) (
loga
rithm
ic sc
ale)
1090
18
1920
55
(Sev
ersk
iy Do
nets)
(Sev
ersk
iy Do
nets)
(Sev
ersk
iy Do
nets)
(Sev
ersk
iy Do
nets)
(Sev
ersk
iy Do
nets)
2
2760
102
12
3400
86
2
2920
137
5
QavQmaxQmin
Popu
lation
(in m
illion
s)
0
2
4
6
8
10
Ukra
ineRu
ssian
Fede
ratio
n
2.0
8.0
Country information/otherLandScanTM
DiSchaRgeS, popuLaTion anD LanD coveR in The SiveRSKy DoneTS SuB-BaSin
1%1%2%
84%
12%
Surface with little or no vegetation (<1%)Water bodies (<1%)Wetlands (<1%)
ForestGrassland/Shrubland
Others
Urban/Industrial areas
Cultivated
Source: UNEP/DEWA/GRID-Europe 2011.
244 | part IV Chapter 5 Drainage basin of the black sea | 245
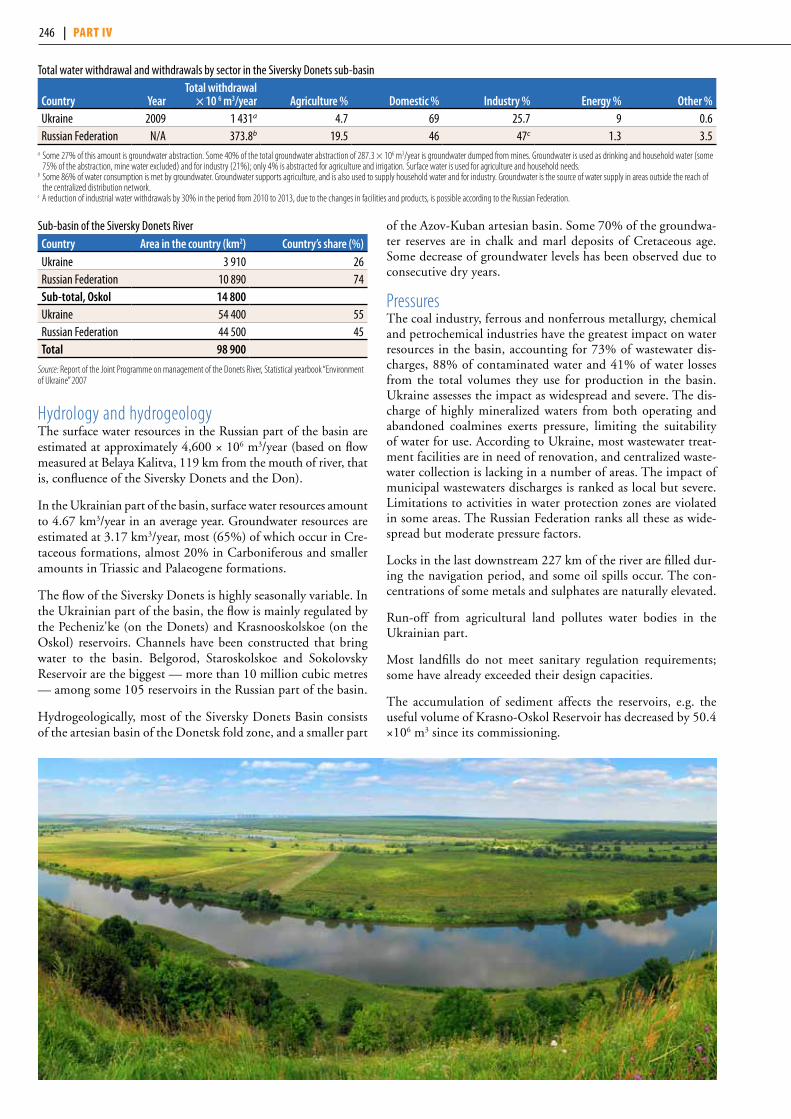
Sub-basin of the Siversky Donets River country area in the country (km2) country’s share (%)Ukraine 3 910 26Russian Federation 10 890 74Sub-total, oskol 14 800Ukraine 54 400 55Russian Federation 44 500 45Total 98 900
Source: Report of the Joint Programme on management of the Donets River, Statistical yearbook “Environment of Ukraine” 2007
Hydrology and hydrogeologyThe surface water resources in the Russian part of the basin are estimated at approximately 4,600 × 106 m3/year (based on flow measured at Belaya Kalitva, 119 km from the mouth of river, that is, confluence of the Siversky Donets and the Don).
In the Ukrainian part of the basin, surface water resources amount to 4.67 km3/year in an average year. Groundwater resources are estimated at 3.17 km3/year, most (65%) of which occur in Cre-taceous formations, almost 20% in Carboniferous and smaller amounts in Triassic and Palaeogene formations.
The flow of the Siversky Donets is highly seasonally variable. In the Ukrainian part of the basin, the flow is mainly regulated by the Pecheniz'ke (on the Donets) and Krasnooskolskoe (on the Oskol) reservoirs. Channels have been constructed that bring water to the basin. Belgorod, Staroskolskoe and Sokolovsky Reservoir are the biggest — more than 10 million cubic metres — among some 105 reservoirs in the Russian part of the basin.
Hydrogeologically, most of the Siversky Donets Basin consists of the artesian basin of the Donetsk fold zone, and a smaller part
of the Azov-Kuban artesian basin. Some 70% of the groundwa-ter reserves are in chalk and marl deposits of Cretaceous age. Some decrease of groundwater levels has been observed due to consecutive dry years.
PressuresThe coal industry, ferrous and nonferrous metallurgy, chemical and petrochemical industries have the greatest impact on water resources in the basin, accounting for 73% of wastewater dis-charges, 88% of contaminated water and 41% of water losses from the total volumes they use for production in the basin. Ukraine assesses the impact as widespread and severe. The dis-charge of highly mineralized waters from both operating and abandoned coalmines exerts pressure, limiting the suitability of water for use. According to Ukraine, most wastewater treat-ment facilities are in need of renovation, and centralized waste-water collection is lacking in a number of areas. The impact of municipal wastewaters discharges is ranked as local but severe. Limitations to activities in water protection zones are violated in some areas. The Russian Federation ranks all these as wide-spread but moderate pressure factors.
Locks in the last downstream 227 km of the river are filled dur-ing the navigation period, and some oil spills occur. The con-centrations of some metals and sulphates are naturally elevated.
Run-off from agricultural land pollutes water bodies in the Ukrainian part.
Most landfills do not meet sanitary regulation requirements; some have already exceeded their design capacities.
The accumulation of sediment affects the reservoirs, e.g. the useful volume of Krasno-Oskol Reservoir has decreased by 50.4 ×10⁶ m3 since its commissioning.
Total water withdrawal and withdrawals by sector in the Siversky Donets sub-basin
country yearTotal withdrawal
× 10 6 m3/year agriculture % Domestic % industry % energy % other %Ukraine 2009 1 431a 4.7 69 25.7 9 0.6Russian Federation N/A 373.8b 19.5 46 47c 1.3 3.5
a Some 27% of this amount is groundwater abstraction. Some 40% of the total groundwater abstraction of 287.3 × 10⁶ m3/year is groundwater dumped from mines. Groundwater is used as drinking and household water (some 75% of the abstraction, mine water excluded) and for industry (21%); only 4% is abstracted for agriculture and irrigation. Surface water is used for agriculture and household needs.
b Some 86% of water consumption is met by groundwater. Groundwater supports agriculture, and is also used to supply household water and for industry. Groundwater is the source of water supply in areas outside the reach of the centralized distribution network.
c A reduction of industrial water withdrawals by 30% in the period from 2010 to 2013, due to the changes in facilities and products, is possible according to the Russian Federation.
246 | part IV
A lack of necessary funds for the planned reconstruction of sew-age treatment facilities is a problem in the Russian part of the basin. As water protection measures tend to be supported from funds that remain after other costs have been covered by users, implementation often remains incomplete.
Status and transboundary impactsNo significant changes in river water quality have been ob-served in the Russian part in the past few years. There is an in-tensive human impact both in Ukraine and in the Russian Fed-eration, mainly from the coal industry, mine water discharges, irrigated agriculture, and public utilities. Industrial discharges have a transboundary impact.
From Lugansk oblast in Ukraine, river water entering the Rus-sian Rostov oblast is reported to be in class 4, “dirty”. Periodic releases of distillation liquids from a sodium carbonate com-pany in Lugansk are reported. The Russian water management authorities had planned to strengthen water quality monitor-ing in 2010. The exchange of monitoring information between Ukraine and the Russian Federation is regular.
The discharges of return flows, salts (or dissolved solids) and organic matter (as BOD) has been decreasing since at least 2000, due to a decline in the production of the ferrous metal-lurgy and coal industries, and in water consumption in mu-nicipal housing services.
Ukraine reports that water quality in Siversky Donets at the village Ogurtsovo at the border of Belgogrod and Kharkiv oblasts fell into quality class 3, “moderately polluted” from 2006 to 2009. During the same period, water at the Popo-vka station at the border of Lugansk and Rostov oblasts in Ukraine was classified as “polluted” (class III). Water quality at Staraya Tavolzhanka (950 km from the river’s mouth) in the Belgorod oblast of the Russian Federation, at the border with the Kharkov oblast of Ukraine, was classified as “polluted” (class 3) and the parameters exceeding MACs161 were Cu, Cr6+, Fe and BOD
5.
As mine water discharges have decreased due to the reduction of production and the closure of several mines, the related load has decreased, and no trend of significant deterioration in the quality of surface waters is observed, but their overall ecologi-cal condition is still a concern.
A decreasing trend of pesticide pollution has been observed in the past 15 years according to Ukraine’s State Committee of Statistics, and during the past couple of years a small increase has been observed.
Transboundary cooperation and responses Cooperation on the Siversky Donets is formalized through the 1992 agreement between Ukraine and the Russian Fed-eration. There are two border monitoring points where paral-lel sampling is carried out regularly. Based on the agreement, an exchange of data between Ukraine and the Russian Fed-eration about water quality in the border segment is carried out quarterly in the intergovernmental data exchange system, adopted by the plenipotentiaries of Ukraine and Russia for every five years. This includes determining the locations, in-dicators of cross-sections of transboundary water bodies, a list of defined indicators, and methods and frequency of sampling. The system of data exchange on the status of transboundary waters in the basins of the Siversky Donets River and Azov region between water management organizations of the Siver-
sky Donetsk in Ukraine and of the Don in Russia exists since 2006. A Memorandum of joint actions on the protection and use of water bodies of the Siversky Donets has also been signed (2001), involving Belgogrod, Donetsk, Kharkiv, Lugansk and Rostov oblasts. The oblasts of Lugansk (Ukraine) and Rostov (Russian Federation) have, since 1999, an agreement on the Kundryuchya River (a transboundary tributary).
In 2010, Heads of State of Ukraine and the Russian Federation decided to update the Interregional Ecological Programme on protection and use of waters in the basin of Siversky Donets River, developed in 2004, and to ratify it at the intergovern-mental level.
Under the bilateral agreements (1992, 1996) an exchange of hydrometeorological information is carried out, including in-formation about dangerous hydrometeorological events and environmental status.
At the national level in Ukraine, in 2009 Kharkiv, Donetsk and Lugansk oblasts’ councils and the regional state admin-istrations signed an agreement on joint use, conservation and restoration of water resources of the Siversky Donets. A River Basin Council for the Ukrainian part of the basin was established in 2007, and organising Ukrainian-Russian "round tables" was initiated in the framework of the Basin Council, bringing together representatives of Donetsk, Lugansk and Kharkiv oblasts.
A number of projects have supported the introduction of plan-ning and management at basin level, the adoption of which is still pending. Among them are the project "Management of transboundary river basin: Phase 2 — Siversky Donets Ba-sin", which led to development of a draft management plan, a TACIS project (2006-2007) where an enlarged River Basin Management Plan was developed and recommendations for experts in water management were prepared, and a Ukraini-an-Danish project "Integrated water resources management in eastern Ukraine — the Siversky Donets River" (2006). An initi-ative has been prepared in 2010 for a third phase of the TACIS project, with the aim of developing a more detailed river basin management plan and program of measures to implement it.
Since 2006, a system of data exchange on the status of trans-boundary waters in the basins of the Siversky Donets River and Priasovie rivers between water management organizations of Ukraine and the Russian Federation has been developed un-der the above-mentioned TACIS project. The lack of a unified transboundary monitoring programme and GIS system for the basin is a shortcoming.
Programmes are being implemented in Ukraine to modernize urban wastewater treatment processes and to reduce discharges of untreated wastewaters. Surface waters are monitored for pollutants, and groundwaters are surveyed for possible impact of landfills. Radioactive elements are periodically monitored.
The draft plan for protection zones of water supplies and pro-tective buffer zones around watercourses in the Russian part is reported to require revision. A new scheme of complex use and protection of water resources of the Don (including the Siver-sky Donets) is planned for 2014 in the Russian Federation.
In the Russian part, flood protection work has been carried out, in particular in the form of clearing some 11 km of river channel by removing silt and aquatic vegetation, and increasing the chan-nel cross-section in narrow points.
161 In this case MAC for fish life, which are the most strict.
246 | part IV Chapter 5 Drainage basin of the black sea | 247
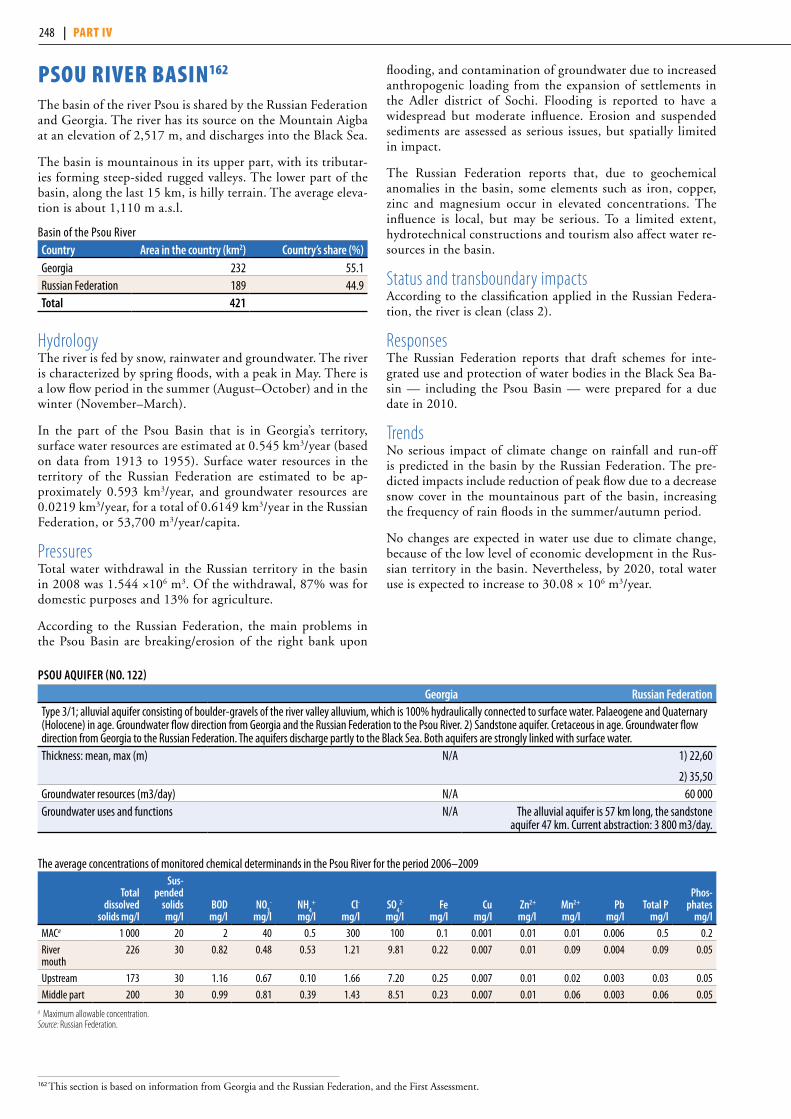
psou rIVer BasIn162
The basin of the river Psou is shared by the Russian Federation and Georgia. The river has its source on the Mountain Aigba at an elevation of 2,517 m, and discharges into the Black Sea.
The basin is mountainous in its upper part, with its tributar-ies forming steep-sided rugged valleys. The lower part of the basin, along the last 15 km, is hilly terrain. The average eleva-tion is about 1,110 m a.s.l.
Basin of the Psou Rivercountry area in the country (km2) country’s share (%)Georgia 232 55.1Russian Federation 189 44.9Total 421
HydrologyThe river is fed by snow, rainwater and groundwater. The river is characterized by spring floods, with a peak in May. There is a low flow period in the summer (August–October) and in the winter (November–March).
In the part of the Psou Basin that is in Georgia’s territory, surface water resources are estimated at 0.545 km3/year (based on data from 1913 to 1955). Surface water resources in the territory of the Russian Federation are estimated to be ap-proximately 0.593 km3/year, and groundwater resources are 0.0219 km3/year, for a total of 0.6149 km3/year in the Russian Federation, or 53,700 m3/year/capita.
PressuresTotal water withdrawal in the Russian territory in the basin in 2008 was 1.544 ×10⁶ m3. Of the withdrawal, 87% was for domestic purposes and 13% for agriculture.
According to the Russian Federation, the main problems in the Psou Basin are breaking/erosion of the right bank upon
flooding, and contamination of groundwater due to increased anthropogenic loading from the expansion of settlements in the Adler district of Sochi. Flooding is reported to have a widespread but moderate influence. Erosion and suspended sediments are assessed as serious issues, but spatially limited in impact.
The Russian Federation reports that, due to geochemical anomalies in the basin, some elements such as iron, copper, zinc and magnesium occur in elevated concentrations. The influence is local, but may be serious. To a limited extent, hydrotechnical constructions and tourism also affect water re-sources in the basin.
Status and transboundary impactsAccording to the classification applied in the Russian Federa-tion, the river is clean (class 2).
ResponsesThe Russian Federation reports that draft schemes for inte-grated use and protection of water bodies in the Black Sea Ba-sin — including the Psou Basin — were prepared for a due date in 2010.
TrendsNo serious impact of climate change on rainfall and run-off is predicted in the basin by the Russian Federation. The pre-dicted impacts include reduction of peak flow due to a decrease snow cover in the mountainous part of the basin, increasing the frequency of rain floods in the summer/autumn period.
No changes are expected in water use due to climate change, because of the low level of economic development in the Rus-sian territory in the basin. Nevertheless, by 2020, total water use is expected to increase to 30.08 × 10⁶ m3/year.
The average concentrations of monitored chemical determinands in the Psou River for the period 2006–2009
Total dissolved
solids mg/l
Sus-pended
solids mg/l
BoD mg/l
no3
-
mg/lnh
4+
mg/lcl-
mg/lSo
42-
mg/lFe
mg/lcu
mg/lZn2+
mg/lMn2+
mg/lpb
mg/lTotal p
mg/l
phos-phates
mg/lMACa 1 000 20 2 40 0.5 300 100 0.1 0.001 0.01 0.01 0.006 0.5 0.2River mouth
226 30 0.82 0.48 0.53 1.21 9.81 0.22 0.007 0.01 0.09 0.004 0.09 0.05
Upstream 173 30 1.16 0.67 0.10 1.66 7.20 0.25 0.007 0.01 0.02 0.003 0.03 0.05Middle part 200 30 0.99 0.81 0.39 1.43 8.51 0.23 0.007 0.01 0.06 0.003 0.06 0.05
a Maximum allowable concentration. Source: Russian Federation.
162 This section is based on information from Georgia and the Russian Federation, and the First Assessment.
pSou aquiFeR (no. 122)
georgia Russian FederationType 3/1; alluvial aquifer consisting of boulder-gravels of the river valley alluvium, which is 100% hydraulically connected to surface water. Palaeogene and Quaternary (Holocene) in age. Groundwater flow direction from Georgia and the Russian Federation to the Psou River. 2) Sandstone aquifer. Cretaceous in age. Groundwater flow direction from Georgia to the Russian Federation. The aquifers discharge partly to the Black Sea. Both aquifers are strongly linked with surface water. Thickness: mean, max (m) N/A 1) 22,60
2) 35,50Groundwater resources (m3/day) N/A 60 000Groundwater uses and functions N/A The alluvial aquifer is 57 km long, the sandstone
aquifer 47 km. Current abstraction: 3 800 m3/day.
248 | part IV

3 Ves
elyi
935
19(P
sou)
1
10
100
1000
2Disc
harg
e (m
3 s-1) (
loga
rithm
ic sc
ale) Qav
QmaxQmin
Popu
lation
(in t
hous
ands
)0
2
4
6
8
10
12
Russi
an Fe
dera
tion
Geor
gia
11.1
2.0
Country information/otherLandScanTM
19%
66%
15%
CultivatedForestGrassland/Shrubland
25%
DiSchaRgeS, popuLaTion anD LanD coveR in The pSou RiveR BaSin
ChorokhI/Coruh rIVer BasInThe basin of the river Chorokhi/Coruh163 is shared by Turkey and Georgia.164 The more than 430 km-long165 river has its source in Turkey, at the height of approximately 2,700 m a.s.l., and discharges into the Black Sea. The Machakhelisckali/Maca-hel River is a transboundary tributary.
The basin has a pronounced high and hilly mountainous char-acter, with an average elevation of about 1,132 m a.s.l. The Coruh River leaves the mountainous topography and enters into meandering floodplain in Georgia before it flows into the Black Sea.
Basin of the Chorokhi/Coruh Rivercountry area in the country (km2) country’s share (%)Turkey 19 872 91.3 Georgia 1 900a 8.7Total 21 772
a Source: Resource of Surface Water. National Agency of Environment, Department of Hydrology, Georgia. 1974.
Hydrology and hydrogeologyIn the Turkish part, the flow regimes are irregular, with a large variation in run-off parameters. This part of the river basin is also prone to floods.
Surface water resources in the territory of Turkey are estimated to be approximately 6.3 km3/year, and groundwater resources 0.045 km3/year, making up a total of 6.345 km3/year or 19,650 m3/year/capita. In Georgia’s territory (based on observations
from 1951 to 1992), the surface water resources are estimated to be approximately 8.711 km3/year or 64,475 m3/year/capita.
Pressures Groundwater and spring water is used in both Turkish and Geor-gian territory for domestic water supply in the settlements of the river basin.
In the Turkish part of the basin, two hydropower stations are operational at the present time: Muratli dam, 100 m upstream from the border, since 2005; and Borçka dam, since 2007. They have installed capacities of 115 MW and 300 MW, respective-ly. In the Coruh River Development Plan (General Directorate of State Hydraulic Works, Turkey, 1982), 10 hydropower pro-jects along the main river are planned in a cascade style on the upper, middle and lower main course in the Turkish part of the Coruh River. The Lower Coruh projects are either in operation (Muratli and Borcka) or under construction (Deriner). The Middle Coruh projects (Yusufeli and Artvin) are under final design or in the process of arranging investment, and the Up-per Coruh projects (Laleli, Ispir, Gullubag, Aksu and Arpun) are either in the early planning or the planning stage. Together, they will have an installed capacity of 2,536 MW, and will be utilized for the generation of 8,320 GWh/year when all the proposed projects are operational. In this development plan, three large reservoirs are to be constructed at Laleli, Yusufeli, and Deriner sites. The regulation will mitigate the effects of floods downstream. Existing and planned hydropower stations will result in some changes in natural river flow regime, river dynamics and morphology.
163 The river is known as Chorokhi in Georgia and as Coruh in Turkey.164 For the location, please refer to the map in the assessment of the Samur River. 165 According to Turkey, the length of the river is approximately 431 km (410 km in Turkey and 21 km in Georgia), and according to Georgia approximately 438
km (Source: Resource of Surface Water. National Agency Of Environment, Department of Hydrology, 1974). Georgia reports about 26 km of the river length to be in Georgia.
Total water withdrawal and withdrawals by sector in the Chorokhi/Coruh Basin
countryTotal withdrawal
×106 m3/year agricultural % Domestic % industry % energy % other %Georgia 724 0.4 0.1 99 0.5Turkey 81a 56 44 N/A 0 N/A
a This figure only includes the estimated agricultural (45 × 106 m3/year) and domestic use (36 × 106 m3/year), which are the main recorded consumptive uses. No consumptive use for energy purposes is reported.
Source: UNEP/DEWA/GRID-Europe 2011.
248 | part IV Chapter 5 Drainage basin of the black sea | 249
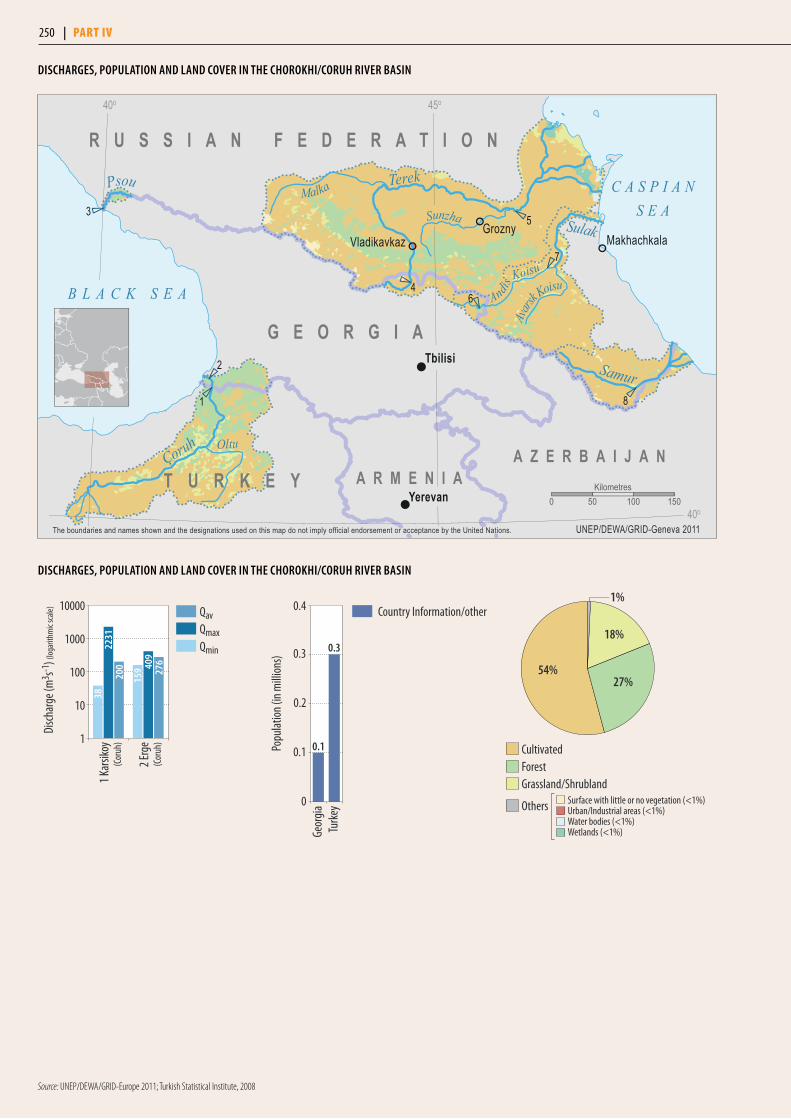
DiSchaRgeS, popuLaTion anD LanD coveR in The choRoKhi/coRuh RiveR BaSin
DiSchaRgeS, popuLaTion anD LanD coveR in The choRoKhi/coRuh RiveR BaSin
2 Erg
e
1 Kar
sikoy
409
159 27
6
2231
200
(Cor
uh)
(Cor
uh)1
10
100
1000
10000
38
Disc
harg
e (m
3 s-1) (
loga
rithm
ic sc
ale) Qav
QmaxQmin
Popu
lation
(in m
illion
s)
0
0.1
0.2
0.3
0.4
Turke
yGe
orgia
0.3
0.1
Country Information/other1%
Urban/Industrial areas (<1%)Surface with little or no vegetation (<1%)
Water bodies (<1%)Wetlands (<1%)
54%27%
18%
CultivatedForestGrassland/Shrubland
Others
3
2
1
4
5
8
6
7
Grozny
Yerevan
Tbilisi
MakhachkalaVladikavkaz
Çoruh
Terek
Sunzha
Malka
Koisu
Avars
k Koisu
Samur
Psou
Sulak
Andis
Oltu
B L A C K S E A
C A S P I A NS E A
G E O R G I A
R U S S I A N F E D E R A T I O N
T U R K E Y A R M E N I AA Z E R B A I J A N
40o 45o
40o0 50 100 150
Kilometres
UNEP/DEWA/GRID-Geneva 2011The boundaries and names shown and the designations used on this map do not imply official endorsement or acceptance by the United Nations.
Source: UNEP/DEWA/GRID-Europe 2011; Turkish Statistical Institute, 2008
250 | part IV

A “washing away” problem is experienced in the coastal zone near the river mouth due to reduced sediment load. The main-tenance of the sediment transport to sustain sandy beaches at the Black Sea coast is vital for tourism, which is of prime im-portance to Georgia’s earnings. The problem of erosion, mani-fested by a high load of sediments in the river water (estimated at 5.8 × 10⁶ m³ annually), is assessed by Turkey as widespread but moderate.
The impact of agriculture is reported to be only local in both countries, but severe in the Georgian part and moderate in the Turkish part of the basin. The nutrient loads from agriculture in the Turkish part of the basin were estimated in 2005 to be 1,528 tons/year of nitrogen and 153 tons/year of total phosphorus.166
Because of a lack of wastewater treatment plants in urban set-tlements, wastewater discharges exert a pressure on water qual-ity. Considered local and moderate in impact, the loads from municipal wastewater in the Turkish part of the basin were es-timated in 2005 to be as follows: BOD 1,135 tons/year; COD 2,579 tons/year; nitrogen 213 tons/year; and total phosphorus 43 tons/year. Organic loads from industrial wastewater were es-timated to be 858 tons/year as BOD and/or 1,850 tons/year as COD.167 There are no sanitary landfills in municipalities on the Turkish side yet, and controlled dumpsites are reported to exert pressure on water quality, human health, and landscape.
The region of the Coruh River Basin has a considerable poten-tial for nature and eco-tourism, which at the present is relatively little developed.
StatusAccording to water quality measurements, the water quality of the Coruh River generally falls into Class I and Class II (Un-polluted and Less polluted water body), according to Turkish Inland Water Quality Standards (derived from Water Pollution Control Regulation).
According to the Ministry of the Environment and Natural Resources of Georgia, based on data from 2007 to 2009, the chemical and ecological status of the river system is good.
Transboundary cooperationThere are no joint bodies on transboundary waters in the Chorokhi/Coruh River Basin at the present time. Only some bilateral agreements and protocols exist on water-related issues in the basin between Georgia and Turkey, based on which bi-lateral technical cooperation and technical meetings have been held since 1994, and a working group for joint monitoring has been in existence since 1998. This cooperation is regular. Based on the agreement between the Turkish and Georgian Governments, three flow-gauging stations were established by the Turkish Government at three locations in Georgia: on the Acara tributary, the Machakhelisckali/Macahel tributary, and on the main river channel at Erge. Since 1999, 20 sets of joint measurements have been carried out, and the results have been communicated to Georgia through diplomatic channels.
In order to identify, monitor and evaluate changes which may occur after implementation of the planned dam projects, in-cluding the situation of sediment trapping in reservoirs, Tur-key and Georgia have agreed on and implemented, since 1996,
166 National Action Plan for Land Based Sources for Turkey. Scientific and Technological Research Council of Turkey (TÜBőTAK), Marmara Research Centre (MRC), Chemistry and Environment Institute (CEI), Kocaeli, Turkey. 2005.
167 National Action Plan for Land Based Sources for Turkey. Scientific and Technological Research Council of Turkey (TÜBőTAK), Marmara Research Centre (MRC), Chemistry and Environment Institute (CEI), Kocaeli, Turkey. 2005.
250 | part IV Chapter 5 Drainage basin of the black sea | 251
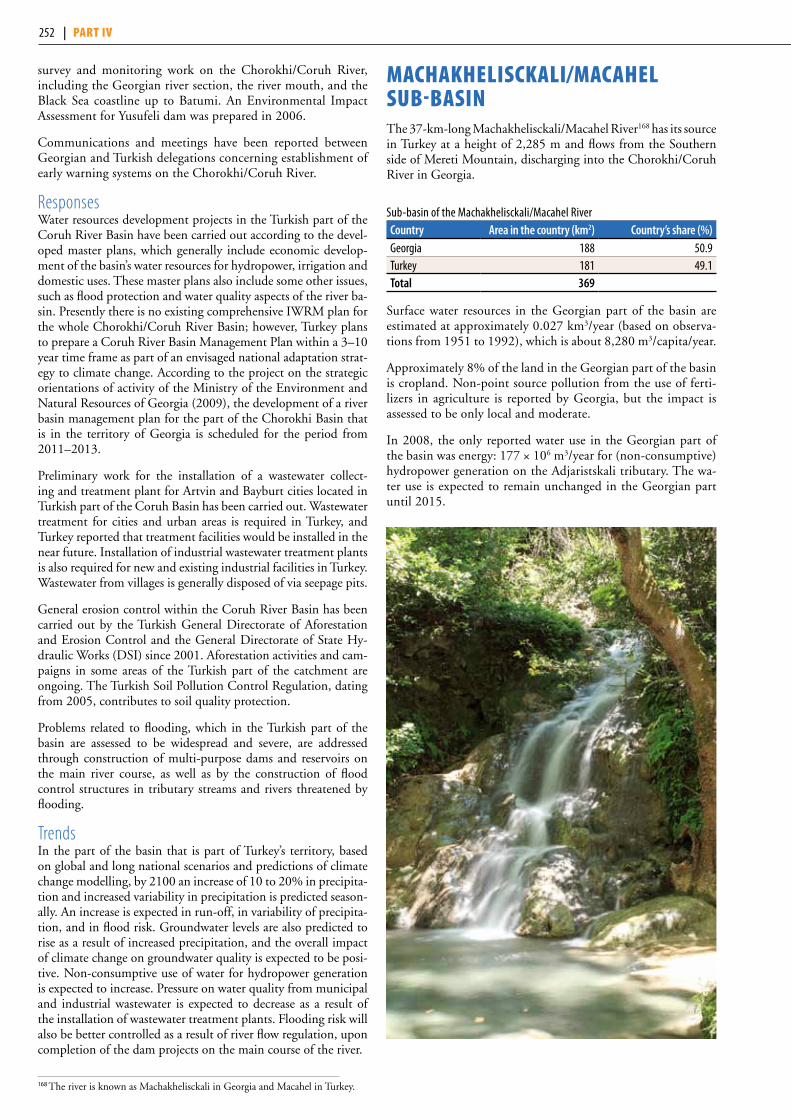
survey and monitoring work on the Chorokhi/Coruh River, including the Georgian river section, the river mouth, and the Black Sea coastline up to Batumi. An Environmental Impact Assessment for Yusufeli dam was prepared in 2006.
Communications and meetings have been reported between Georgian and Turkish delegations concerning establishment of early warning systems on the Chorokhi/Coruh River.
ResponsesWater resources development projects in the Turkish part of the Coruh River Basin have been carried out according to the devel-oped master plans, which generally include economic develop-ment of the basin’s water resources for hydropower, irrigation and domestic uses. These master plans also include some other issues, such as flood protection and water quality aspects of the river ba-sin. Presently there is no existing comprehensive IWRM plan for the whole Chorokhi/Coruh River Basin; however, Turkey plans to prepare a Coruh River Basin Management Plan within a 3–10 year time frame as part of an envisaged national adaptation strat-egy to climate change. According to the project on the strategic orientations of activity of the Ministry of the Environment and Natural Resources of Georgia (2009), the development of a river basin management plan for the part of the Chorokhi Basin that is in the territory of Georgia is scheduled for the period from 2011–2013.
Preliminary work for the installation of a wastewater collect-ing and treatment plant for Artvin and Bayburt cities located in Turkish part of the Coruh Basin has been carried out. Wastewater treatment for cities and urban areas is required in Turkey, and Turkey reported that treatment facilities would be installed in the near future. Installation of industrial wastewater treatment plants is also required for new and existing industrial facilities in Turkey. Wastewater from villages is generally disposed of via seepage pits.
General erosion control within the Coruh River Basin has been carried out by the Turkish General Directorate of Aforestation and Erosion Control and the General Directorate of State Hy-draulic Works (DSI) since 2001. Aforestation activities and cam-paigns in some areas of the Turkish part of the catchment are ongoing. The Turkish Soil Pollution Control Regulation, dating from 2005, contributes to soil quality protection.
Problems related to flooding, which in the Turkish part of the basin are assessed to be widespread and severe, are addressed through construction of multi-purpose dams and reservoirs on the main river course, as well as by the construction of flood control structures in tributary streams and rivers threatened by flooding.
TrendsIn the part of the basin that is part of Turkey’s territory, based on global and long national scenarios and predictions of climate change modelling, by 2100 an increase of 10 to 20% in precipita-tion and increased variability in precipitation is predicted season-ally. An increase is expected in run-off, in variability of precipita-tion, and in flood risk. Groundwater levels are also predicted to rise as a result of increased precipitation, and the overall impact of climate change on groundwater quality is expected to be posi-tive. Non-consumptive use of water for hydropower generation is expected to increase. Pressure on water quality from municipal and industrial wastewater is expected to decrease as a result of the installation of wastewater treatment plants. Flooding risk will also be better controlled as a result of river flow regulation, upon completion of the dam projects on the main course of the river.
MaChakhelIsCkalI/MaCahel suB-BasInThe 37-km-long Machakhelisckali/Macahel River168 has its source in Turkey at a height of 2,285 m and flows from the Southern side of Mereti Mountain, discharging into the Chorokhi/Coruh River in Georgia.
Sub-basin of the Machakhelisckali/Macahel Rivercountry area in the country (km2) country’s share (%)Georgia 188 50.9 Turkey 181 49.1Total 369
Surface water resources in the Georgian part of the basin are estimated at approximately 0.027 km3/year (based on observa-tions from 1951 to 1992), which is about 8,280 m3/capita/year.
Approximately 8% of the land in the Georgian part of the basin is cropland. Non-point source pollution from the use of ferti-lizers in agriculture is reported by Georgia, but the impact is assessed to be only local and moderate.
In 2008, the only reported water use in the Georgian part of the basin was energy: 177 × 106 m3/year for (non-consumptive) hydropower generation on the Adjaristskali tributary. The wa-ter use is expected to remain unchanged in the Georgian part until 2015.
168 The river is known as Machakhelisckali in Georgia and Macahel in Turkey.
252 | part IV
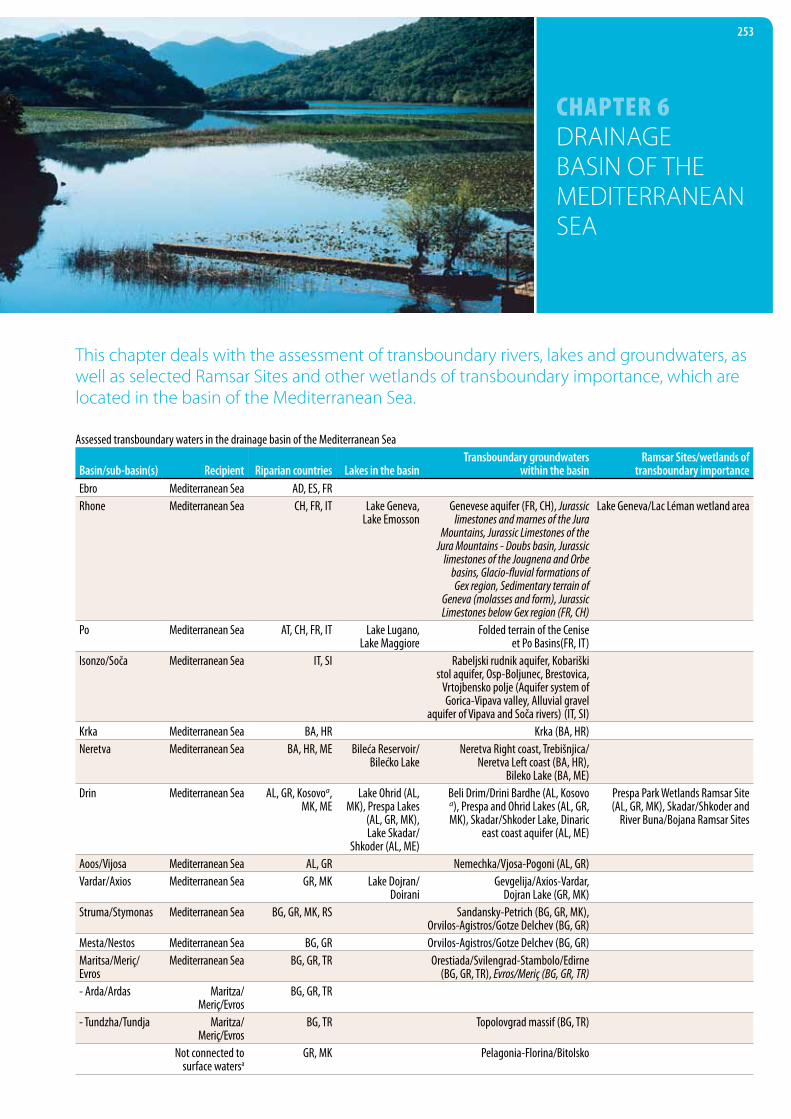
Chapter 6 DRAINAGE BASIN OF THE MEDITERRANEAN SEA
253
This chapter deals with the assessment of transboundary rivers, lakes and groundwaters, as well as selected Ramsar Sites and other wetlands of transboundary importance, which are located in the basin of the Mediterranean Sea.
Assessed transboundary waters in the drainage basin of the Mediterranean Sea
Basin/sub-basin(s) Recipient Riparian countries Lakes in the basinTransboundary groundwaters
within the basin Ramsar Sites/wetlands of
transboundary importanceEbro Mediterranean Sea AD, ES, FRRhone Mediterranean Sea CH, FR, IT Lake Geneva,
Lake EmossonGenevese aquifer (FR, CH), Jurassic
limestones and marnes of the Jura Mountains, Jurassic Limestones of the
Jura Mountains - Doubs basin, Jurassic limestones of the Jougnena and Orbe
basins, Glacio-fluvial formations of Gex region, Sedimentary terrain of
Geneva (molasses and form), Jurassic Limestones below Gex region (FR, CH)
Lake Geneva/Lac Léman wetland area
Po Mediterranean Sea AT, CH, FR, IT Lake Lugano, Lake Maggiore
Folded terrain of the Cenise et Po Basins(FR, IT)
Isonzo/Soča Mediterranean Sea IT, SI Rabeljski rudnik aquifer, Kobariški stol aquifer, Osp-Boljunec, Brestovica,
Vrtojbensko polje (Aquifer system of Gorica-Vipava valley, Alluvial gravel
aquifer of Vipava and Soča rivers) (IT, SI)Krka Mediterranean Sea BA, HR Krka (BA, HR)Neretva Mediterranean Sea BA, HR, ME Bileća Reservoir/
Bilećko LakeNeretva Right coast, Trebišnjica/
Neretva Left coast (BA, HR), Bileko Lake (BA, ME)
Drin Mediterranean Sea AL, GR, Kosovoa, MK, ME
Lake Ohrid (AL, MK), Prespa Lakes
(AL, GR, MK), Lake Skadar/
Shkoder (AL, ME)
Beli Drim/Drini Bardhe (AL, Kosovo
a), Prespa and Ohrid Lakes (AL, GR, MK), Skadar/Shkoder Lake, Dinaric
east coast aquifer (AL, ME)
Prespa Park Wetlands Ramsar Site (AL, GR, MK), Skadar/Shkoder and
River Buna/Bojana Ramsar Sites
Aoos/Vijosa Mediterranean Sea AL, GR Nemechka/Vjosa-Pogoni (AL, GR)Vardar/Axios Mediterranean Sea GR, MK Lake Dojran/
DoiraniGevgelija/Axios-Vardar,
Dojran Lake (GR, MK)Struma/Stymonas Mediterranean Sea BG, GR, MK, RS Sandansky-Petrich (BG, GR, MK),
Orvilos-Agistros/Gotze Delchev (BG, GR)Mesta/Nestos Mediterranean Sea BG, GR Orvilos-Agistros/Gotze Delchev (BG, GR)Maritsa/Meriç/ Evros
Mediterranean Sea BG, GR, TR Orestiada/Svilengrad-Stambolo/Edirne (BG, GR, TR), Evros/Meriç (BG, GR, TR)
- Arda/Ardas Maritza/Meriç/Evros
BG, GR, TR
- Tundzha/Tundja Maritza/Meriç/Evros
BG, TR Topolovgrad massif (BG, TR)
Not connected to surface watersa
GR, MK Pelagonia-Florina/Bitolsko

rhone river Basin2
The Rhone River basin is shared by France, Switzerland and Italy; the Italian part is negligible. The 750-km long river origi-nates from the Rhone glacier in Switzerland, at an altitude of 1,765 m a.s.l., flowing through France to the Mediterranean Sea. Before entering the Mediterranean Sea the Rhone divides into two branches which form the Camargue delta; one of the major wildlife areas of Europe.
Lake Geneva and Lake Emosson are transboundary lakes in the basin (see the assessments below). The Arve and the Doubs (transboundary tributary of the Saône) are major transbound-ary tributaries in the Rhone Basin. There are also a number of small transboundary rivers discharging into Lake Geneva. In addition to four Ramsar Sites related to Lake Geneva (see sepa-rate box), there are several other protected sites.
Basin of the Rhone RiverCountry Area in the country (km2) Country’s share (%)France 90 000 92Switzerland 7 739 8Italy 50Total 97 789
Source: Freshwater in Europe – Facts, Figures and Maps. UNEP/DEWA-Europe, 2004.
Hydrology and hydrogeologyThe Alpine part of the Rhone Basin (upstream from Lake Ge-neva) ranges from high-altitude mountain peaks and the higher valley to the main Rhone valley, where the river is more influ-enced by river training works and land reclamation. The av-erage elevation of the catchment area of the Rhone River in Switzerland is 1,580 m a.s.l.
In the Alpine Rhone in Switzerland, precipitation amounts to approximately 7.26 km3/year, and surface water resources gen-erated upstream from Lake Geneva are estimated at 5.71 km3/year. The outflow of the Rhone below Lake Geneva is regulated.
Basin/sub-basin(s) Recipient Riparian countries Lakes in the basinTransboundary groundwaters
within the basin Ramsar Sites/wetlands of
transboundary importanceNot connected to
surface watersbHR, SI Secovlje-Dragonja/Istra, Mirna/
Istra, Mirna, Območje izvira Rižane, Opatija/Istra, Riječina-Zvir,
Notranjska Reka, Novokračine Not connected to
surface watersbBA, HR Cetina
Not connected to surface watersb
HR, ME Dinaric Littoral (West Coast)
Not connected to surface watersb
Kosovo,a ME Metohija
Not connected to surface watersb
ME, RS Pester
Not connected to surface watersb
AL, MK Korab/Bistra – Stogovo, Jablanica/Golobordo
Not connected to surface watersb
AL, GR Mourgana Mountain/Mali Gjere
Not e: Transboundary groundwaters in italics are not assessed in the present publication.a United Nations administered territory under Security Council Resolution 1244 (1999).b The transboundary groundwaters indicated as not connected to surface waters either discharge directly into the sea, represent deep groundwaters, or their connection to a specific surface water course has not been confirmed by
the countries concerned.
Rhone, Beaucaire, 1920-1999
Po, Pontelagoscuro, 1918-1998
Drin, Vau I Dejes, 1965-1968
Maritza, Meric Koep, 1975-1986
Vijose, Dorez, 1965-1984
Struma, Marino Pole, 1978-1986
Vardar, Skopje, 1978-1990
Krka, Podbocje, 1933-2008
Nestos, Temenos, 1965-1990
0 10 20 30 40 50 60
km3
River, Station,Time series
53.89
47.737
10.0 42
6.082
4.595
2.209
1.807
1.723
1.405
Long-term mean annual flow (km³) of rivers discharging to the Mediterranean Sea
Source: Global Runoff Data Centre, Koblenz.
1 Based on the First Assessment. 2 Based on information provide by Switzerland, the First Assessment, “The Rhone River: Hydromorphological and Ecological Rehabilitation of a Heavily Man-Used Hydrosystem” (Y. Souchon, Cemagref; available at http://cmsdata.iucn.org/downloads/france.pdf ), as well as information on the official website of the French Water Information system for the Rhone-Mediterranean Basin (http://www.rhone-mediterranee.eaufrance.fr/) and of the Rhone-Mediterranean and Corsica Water Agency (http://www.eaurmc.fr/).
eBro river Basin1 The Ebro River rises near the Atlantic coast in the Cantabrian Mountains in northern Spain, drains an area of 86,000 km2 be-tween the Pyrenees and the Iberian mountains, and discharges through a wide delta into the Mediterranean Sea. The Ebro River Basin is shared by Andorra, France and Spain. Due to the very small share of Andorra and France in the total basin area, the Ebro River was not assessed in the present publication.
254 | part iv
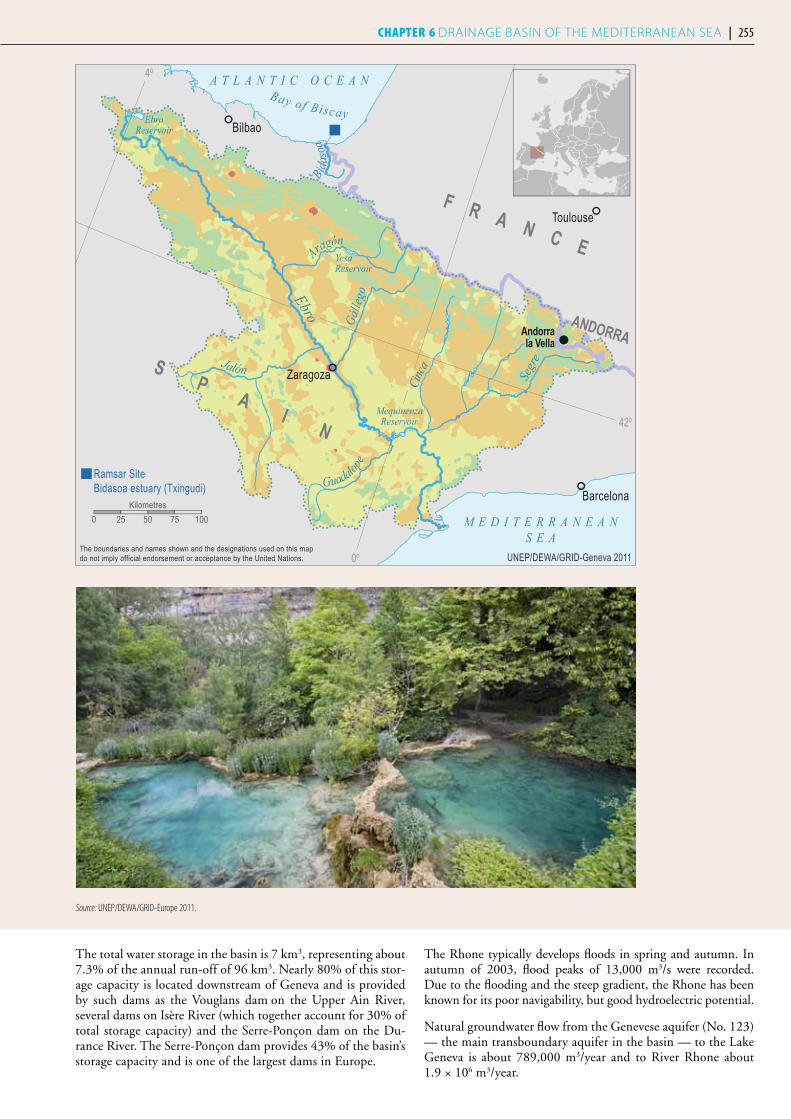
Andorrala Vella
Toulouse
Barcelona
Zaragoza
Ramsar SiteBidasoa estuary (Txingudi)
Ebro Gálle
go
Cinc
a
Segr
e
Guadalope
MequinenzaReservoir
Jalón
YesaReservoir
EbroReservoir
Aragón
M E D I T E R R A N E A NS E A
A T L A N T I C O C E A NBay of Biscay
Bida
soa
F R A N C E
SP
AI
N
ANDORRA
Bilbao
0o
4o
42o
0 25 50 75 100Kilometres
UNEP/DEWA/GRID-Geneva 2011The boundaries and names shown and the designations used on this mapdo not imply official endorsement or acceptance by the United Nations.
The total water storage in the basin is 7 km3, representing about 7.3% of the annual run-off of 96 km3. Nearly 80% of this stor-age capacity is located downstream of Geneva and is provided by such dams as the Vouglans dam on the Upper Ain River, several dams on Isère River (which together account for 30% of total storage capacity) and the Serre-Ponçon dam on the Du-rance River. The Serre-Ponçon dam provides 43% of the basin’s storage capacity and is one of the largest dams in Europe.
The Rhone typically develops floods in spring and autumn. In autumn of 2003, flood peaks of 13,000 m3/s were recorded. Due to the flooding and the steep gradient, the Rhone has been known for its poor navigability, but good hydroelectric potential.
Natural groundwater flow from the Genevese aquifer (No. 123) — the main transboundary aquifer in the basin — to the Lake Geneva is about 789,000 m3/year and to River Rhone about 1.9 × 10⁶ m3/year.
Source: UNEP/DEWA/GRID-Europe 2011.
254 | part iv Chapter 6 DRAINAGE BASIN OF THE MEDITERRANEAN SEA | 255

Sources: UNEP/DEWA/GRID-Europe 2011; OECD-EUROSTAT reporting for Switzerland in 2010 (the population figure for 2005); The Rhone-Mediterranean and Corsica Water Agency, France (the figure for Rhone-Mediterranean Basin).
DiSChARgeS, popuLATion AnD LAnD CoveR in The Rhone RiveR BASin
4
132
Lyon
Strasbourg
Marseille
Genova
Bern
Grenoble
Lausanne
Basel
Montpellier
Clermont-Ferrand
Dijon
Besançon
Torino
Monaco
GenèveRamsar SiteLake Geneva/Lac Léman wetland area
Rhôn
e
GrandRhône
PetitRhône
Drôme
Ardèche
Dura
nce
Verd
on
Gard
Isère
Drac
Ain
Saôn
e
Doubs
Ognon
L’Arve
Golfe du Lion
Golfodi
Genova
Lacd’Annecy
Lacdu Bourget
Lac Léman
L’AireLac d’Emosson
MEDITERRANEAN SEA
Canaldu Rhôneau Rhin
Canalde l’Est
Canalde Bourgogne
Canalde la Marneà la Saône
Canaldu Centre
RhôneL’Hermance
Le Foron
La Versoix
I T A L Y
F R A N C ES W I T Z E R L A N D
GERM
ANY
MONACO
45o
5o
0 50 100 150Kilometres
The boundaries and names shown and the designations used on this mapdo not imply official endorsement or acceptance by the United Nations. UNEP/DEWA/GRID-Geneva 2011
1000
100
10
1
4 Oco
urt
3 Cha
ncy a
ux R
ipes
2 Hall
e de l
'Île
1 Por
te du
Scex
Disc
harg
e (m
3 s-1) (
loga
rithm
ic sc
ale)
227
182
127
327 43
4
250
166 34
1
52
(Rhô
ne)
(Rhô
ne)
(Rhô
ne)
(Dou
bs)
219
33
QavQmaxQmin
13
Popu
latio
n (in
mill
ions
)
0
3
6
9
12
15
Switz
erlan
dIta
lyFr
ance
14.0
0.01.2
Country information/other
3%
1%1%
Urban/Industrial areas (<1%)Wetlands (<1%)
CultivatedForestGrassland/ShrublandSurface with little or no vegetationWater bodies
Others
37%
34%
24%
256 | part iv

geneveSe AquifeR (no. 123)
france SwitzerlandSilty-sandy gravel of glacial and glacio-fluvial origin (glacial period Wurm), lying directly on a Molasse formation; groundwater flow directions are from the Arve to the lake, and from the Arve to the west part of the canton of Geneva; the flow is roughly parallel to the border; strong links with surface waters (River Arve).Area (km2) 30 in total for both countriesRenewable groundwater resource (m3/d) On average, natural annual recharge of is 7 × 10⁶ m3
and artificial recharge is 8 × 10⁶ m3 (1980 - 2010).Thickness: mean, max (m) 25, 60 25, 60Groundwater uses and functions Drinking water Drinking water (source of some 20% of
Geneva’s water supply), 0.2 % for agriculture. Availability of water has an impact on costs, social
development and key sectors of economy.Pressure factors Annual average withdrawal from wells, five in France
and ten in Switzerland, is 15.6 × 10⁶ m3 (1980-2010).Local and moderate pressure from natural/background
pollution, pollution from municipal and industrial wastewaters, agriculture, flooding and groundwater pollution. Local but severe pressure from suspended
sediments and mud flow. Heat waves, turbidity and surges affect the artificial recharge. Low water levels at times. Flow
variations. Flow surges are likely to occur at all seasons. Groundwater management measures Groundwater monitoring is managed by the geological survey of Geneva. Vulnerability mapping, protection zones for
drinking water supply and water safety plans have been set up.
A joint commission is in place for the protection and management of the joint resource. Other information Private drilling and individual geothermal
boreholes are an issue to groundwater protection: an attempt is made at getting the same level of
legislation between Switzerland and France.
PressuresIn the whole Rhone-Mediterranean basin — and hence as in-dicative only for the Rhone Basin — some 70% of surface water withdrawn is for agricultural purposes, 15% for domestic use and 15% for industry. Groundwater is mainly used for domestic use (65%), and less for industry (25%) or for agriculture (10%).3
The main pressures in the Alpine Rhone section are hydropow-er production, intensive tourism, and recreation activities.
The main Rhone valley has been affected by river corrections and flood control measures, and is under pressure from settle-ments, traffic routes and industrial areas. The Rhone Basin is densely populated, and most of the pollution originates from agriculture, industry and transport. In the Swiss part of the ba-sin, pressure from agricultural pollution is assessed as local but severe, to widespread but moderate, pressure from pollution from municipal wastewaters is assessed as local and moderate, and pollution from industrial wastewaters as local but severe. Pesticides and herbicides, medicines and synthetic organic compounds from consumer products can pollute the surface waters and also infiltrate groundwaters. Trace concentrations of such micropollutants are increasingly being detected in surface waters and groundwaters. On the valley bottoms and agglom-eration areas there is a pressure on river water quality from mo-torway traffic.
The damage potential of flooding is high in densely populated areas and in valley bottoms. Albeit periodical, flooding is as-sessed to have a widespread impact in Switzerland. In the lower part of the Rhone (the French part), flow regulation and hy-dropower production has been developed (as described above).
The importance of scarcity and drought, as well as thermal pollution, is ranked as local and moderate. Pressure from sus-pended sediments and mudflows are assessed as local but severe in Switzerland.
Status and transboundary impactsThe overall reduction of biodiversity of the river is evaluated as widespread but moderate in Switzerland; there is a scarcity of species whose life histories are linked to a dynamic fluvial system. Species preferring fast-moving water have declined, and com-munities shifted more to species living in marshes or pools. The impacts of change in physical habitat have been considerable in ecological terms. The morphology of the river channel has been altered by straightening and canalizing, in some places becoming eroded and incised. This is ranked as a widespread and severe pressure in the Swiss part of the Rhone, in the main Rhone val-ley. Furthermore, the level of groundwater has decreased. Due to groundwater depletion, several natural biotopes have disap-peared, and riparian forest has evolved to hardwood forest. Dams block the migration of amphibiotic fish (such as shad, eel, and lamprey), and numerous lateral connections with tributaries or side channels have been modified, and sometimes cut off.
Transboundary cooperation and responsesIn the framework of the International Commission for the Protec-tion of Lake Geneva (CIPEL), the focus of the river management of the Rhone is on rehabilitation or re-naturalisation, flood de-fence, water quality management and water resource protection.
A new agreement (following the 1978 agreement) relating to the use, recharge and monitoring of the Franco-Swiss Genevese groundwater signed between, on the one hand, the communes of the greater Annemasse region (France), the Genevese communes and the commune of Viry, and, on the other hand, the State Council of the Republic and the Canton of Geneva (Switzer-land), is in force since January 2008. Setting up a joint com-mission allowed identification of the roles and responsibilities on each side, and determined the financial modalities governing the use of the resource. Cooperation evolved from the initial need to manage the aquifer to respond to groundwater depletion result-ing from heavy abstraction. The agreement is a good example of advanced cooperation for the management of transboundary groundwater.
3 Source: www.eaurmc.fr.
256 | part iv Chapter 6 DRAINAGE BASIN OF THE MEDITERRANEAN SEA | 257

Water protection in Switzerland has a firm legal basis, and sev-eral guidelines concerning the state, management and protection of waters have been produced (e.g. Water Protection Act and Ordinance, Water Engineering Act and Ordinance, Watershed Management – Guiding Principles for Integrated Management of Water in Switzerland).
In response to hydromorphological pressures, an amendment of the Swiss Water Protection legislation (Act and Ordinance) en-tered into force in 2011, demanding waters be returned to their natural functions and strengthening their social benefit, along with more stringent measures to eliminate the major negative en-vironmental effects arising from hydroelectric power generation. The regulations also include a planning and financing scheme for the implementation of required measures.
In addition, parks of national importance have been created to help the protection and enhance exceptional natural habitats or landscapes of outstanding beauty.
Flood risk prevention in the Swiss part of the Rhone Basin includes a preliminary flood risk assessment and hazard mapping by 2011, along with the promotion of a modern flood protection policy.4
TrendsAccording to the climate scenarios available for the Alpine area, precipitation is predicted to increase during winters and decrease during summers. Overall annual precipitation is predicted to decrease by 5-10%. Intensive rain and the number of rainless days in summertime could increase. Temperature measurements indicate an increase of the annual mean in the last century twice as high as the global average, with a projected further increase of +2.7 °C by 2100.
The temperature rise and the significant reduction in the extent and volume of the snow cover will lead to changes in the hydro-logical run-off regime: stronger and longer-lasting low-flow con-ditions in summer, higher run-off in winter, and more frequent high floods in the lower part of Switzerland. Due to climate change, the hydrology and the water balance of the Alpine region is predicted to be substantially affected, and extreme weather
events are likely to occur more frequently. The spatial resolution of the current regional climate models does not allow more accu-rate quantitative predictions for the Alps, and consequently these assessments must be based on expert judgement.5
Climate change may cause more extreme events such as water scar-city and floods, which will have a negative impact on managed aquifer recharge, due either lack of water or to higher turbidity.
Switzerland abstracts about 5% of its precipitation for all water use purposes; therefore overall water quantity is not the limiting factor for a climate change adaptation strategy.6
Economical attractiveness, safety of hydropower and the trend to migrate towards CO
2-free energy are leading to increased hydro-
power production. This might lead to changes in run-off condi-tions (residual flow, hydropeaking), cause general depletion in habitats in and around water bodies, and also cause structural changes to surface waters.
Growth in the demand for hydropower, together with climate change, are predicted to create temporal and spatial changes in water availability, as well as leading to an intensification of water use. These factors, combined with increasing water protection concerns, might aggravate conflicts concerning water.7
Lake Geneva/LaC Léman8
Lake Geneva/Lac Léman is one of the largest lakes in Western Europe. It covers an area of some 580 km2, and has a volume of 89 km3. Approximately 60% of the lake surface area belongs to Switzerland, the rest to France. The lake forms part of the course of the river Rhone. The lake has a glacial origin, with an average depth of 153 m and a maximum depth of 310 m.
The catchment area of Lake Geneva is of mountainous character, with an average elevation of about 1,670 m a.s.l.
Lake Geneva is important as a source of drinking water and from the ecosystem/biodiversity point of view (for details, see the as-sessment of the related wetland area).
4 Source: Flood control at rivers and streams. Federal Office for the Environment, Switzerland. 2001.5 Source: Aschwanden, H., Schädler, B. Climate Change and Water Resources Management. Proceedings of the 4th Yangtze Forum. Nanjing, China. April 2011. (The adaptation strategy in the field of water described in the paper is part of a wider initiative "Adaption to Climate Change in Switzerland – The National Strategy" (working title), which is under preparation.).
6 Source: Aschwanden, H., Schädler, B. Climate Change and Water Resources Management. Proceedings of the 4th Yangtze Forum. Nanjing, China. April 2011. 7 Core indicator Production of hydroelectric power, Federal Office for the Environment. (http://www.bafu.admin.ch/umwelt/indikatoren/). 8 Based on the First Assessment.
258 | part iv

Lake Geneva/LaC Léman wetLand area9
General description of the wetland areaThere are four Ramsar Sites in the area of Lake Geneva/Lac Lé-man. Two of them were designated by France. The “Rives du Lac Léman” Ramsar Site includes several physically separate zones of ecological interest on the shores of the lake, such as alluvial terraces, gravel islands, lacustrine dunes, extensive reedbeds, and parts of the Dranse, Redon, Foron and Vion rivers. The “Im-pluvium d’Evian” Ramsar Site is made up of seasonal and per-manent freshwater marshes, forested and non-forested peatlands, rivers and streams. Both Ramsar Sites designated by Switzerland cover parts of the Rhone River: “Les Grangettes” Ramsar Site includes parts of the Rhone delta, open water, reedbeds, marshes, and riparian woodland; and “Le Rhône genevois – Vallons de l’Allondon et de La Laire” Ramsar Site covers a section of the Rhone River in and downstream from the city of Geneva, in-cluding the shores of the lake, riverbanks, and along two small tributaries, the Allondon and La Laire. While habitats include reedbeds, grasslands subject to seasonal inundation, and scrub and alluvial woodland, the key value of this site is that it includes some of the last remaining relatively unmodified stretches of the Rhone in Switzerland.
Main wetland ecosystem services The lake is a major drinking water reservoir. The surrounding areas of the lake are mostly agricultural, urban or industrial with a few natural stretches such as the area of the “Les Grangettes” Ramsar Site. The area is important in terms of commercial (146 professionals) as well as recreational fishing (7,800 amateurs) and fish farming, resulting in a production of 600-1,100 t/year. Further uses include agriculture, forestry, livestock rearing and viticulture. Additionally, the lake’s tributaries are used for power generation: in addition to numerous hydropower plants situated in the upper part of the Rhone, there are also two plants in op-eration at Verbois and Chancy-Pougny in the lower parts of the Rhone. The area of the “Impluvium d’Evian” Ramsar Site is par-ticularly important for the production of “Evian” mineral water. Additionally, the area of the lake and its surroundings are very important in terms of recreation and tourism. Activities include walking, cycling, canoeing, rafting, swimming and camping.
Cultural values of the wetland areaThe area has some archaeological importance, as prehistoric ves-tiges, such as mammoth tusks and bones, have been found on the left bank of the Rhone, in the valley of the Allondon and near the village of Russin. Furthermore, its landscape and its climate give the area a special aesthetic value that is complemented by the multitude of historical monuments along the shores of the lake, such as castles and churches from the 11th to the 15th century.
Biodiversity values of the wetland areaThe lake is the second most important wintering area for water birds in France. Areas of the lake (including parts of the Swiss side) are used as breeding and staging sites. Species include the Great Crested Grebe and the Black Kite, as well as large numbers of wintering ducks such as the Tufted Duck. In particular, “Les Grangettes” Ramsar Site also harbours small flocks of non-breed-ing Common Eider, an unusual range extension for this generally marine duck. Within Switzerland, the “Rhône genevois” offers
one of the most important wintering sites for Goosander, as well as the Little Grebe.
In addition to various mammals in the surroundings, the lake supports over 60 fish species including the spirlin and the perch. The “Impluvium d’Evian” Ramsar Site provides an important habitat for invertebrates, in particular for two butterfly species, the Large Heath Butterfly and the Cranberry Fritillary, whose populations are in decline everywhere else in the region.
The area also offers a rich flora. Different species of orchids, such as the Fen Orchid, can be found.
Pressure factors and transboundary impactsIn general the lake and its surrounding area have been affected by urban developments such as shoreline modifications, which have in the past caused a decline in nesting birds. Water abstraction is another possible threat for the maintenance of the hydrological balance, as well as for biodiversity. The latter is also threatened by the increase in abundance of invasive species such as the Japa-nese Knotweed. Pollution was greatly reduced in the last decades. However, there is still need for reduction of the amounts of ag-ricultural fertilizer, as well as micropollutants from agriculture, households and industry. Further threats include erosion as well as pressures from navigation and tourism activities.
Transboundary wetland managementWhile parts of the shores, areas surrounding the lake or parts of its tributaries are under national, European (Natura 2000) or international (Ramsar) protection, there is no protection of the lake as a whole. The International Commission for the Protection of Lake Geneva (CIPEL), founded by an agreement between the governments of France and Switzerland in 1962, has been mostly focusing on the improvement of water qual-ity. It is now also involved in restoration projects within the catchment area, in order to preserve biodiversity. CIPEL fulfils an important role as a government advisory body. Its policy recommendations are based on annual monitoring of the lake, and help coordinate water policy for the lake basin between the two countries. The Commission’s current action plan covers the period from 2011 to 2020, and comprises of 17 objectives, such as the reduction of micropollutants and the limitation of phosphorus levels; the preservation and improvement of natu-ral conditions of wetlands in the basin; as well as ensuring the migration of fish species and the sustainable use of the ecosys-tem in terms of swimming, boating, tourism, etc.
9 Sources: Information Sheets on Ramsar Wetlands; CIPEL, Action Plan 2011-2020.
Phot
o by T
obias
Salat
he
258 | part iv Chapter 6 DRAINAGE BASIN OF THE MEDITERRANEAN SEA | 259
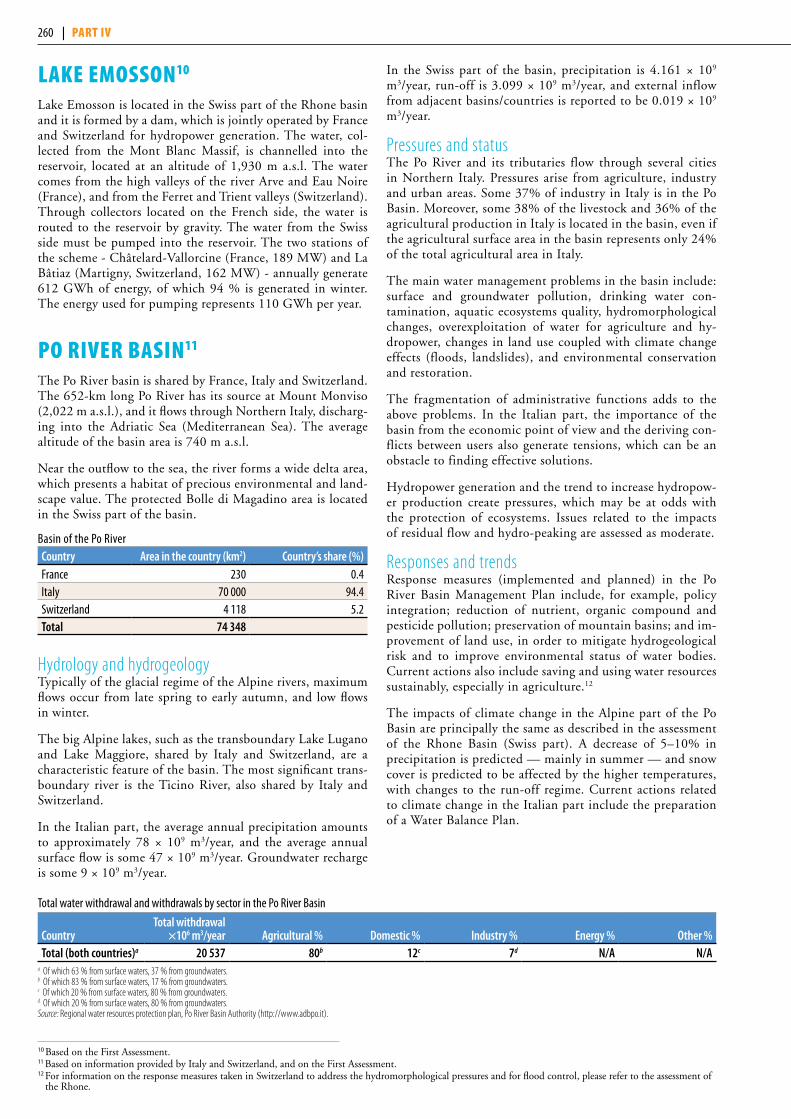
Lake emosson10
Lake Emosson is located in the Swiss part of the Rhone basin and it is formed by a dam, which is jointly operated by France and Switzerland for hydropower generation. The water, col-lected from the Mont Blanc Massif, is channelled into the reservoir, located at an altitude of 1,930 m a.s.l. The water comes from the high valleys of the river Arve and Eau Noire (France), and from the Ferret and Trient valleys (Switzerland). Through collectors located on the French side, the water is routed to the reservoir by gravity. The water from the Swiss side must be pumped into the reservoir. The two stations of the scheme - Châtelard-Vallorcine (France, 189 MW) and La Bâtiaz (Martigny, Switzerland, 162 MW) - annually generate 612 GWh of energy, of which 94 % is generated in winter. The energy used for pumping represents 110 GWh per year.
po river Basin11
The Po River basin is shared by France, Italy and Switzerland. The 652-km long Po River has its source at Mount Monviso (2,022 m a.s.l.), and it flows through Northern Italy, discharg-ing into the Adriatic Sea (Mediterranean Sea). The average altitude of the basin area is 740 m a.s.l.
Near the outflow to the sea, the river forms a wide delta area, which presents a habitat of precious environmental and land-scape value. The protected Bolle di Magadino area is located in the Swiss part of the basin.
Basin of the Po RiverCountry Area in the country (km2) Country’s share (%)France 230 0.4Italy 70 000 94.4Switzerland 4 118 5.2Total 74 348
Hydrology and hydrogeologyTypically of the glacial regime of the Alpine rivers, maximum flows occur from late spring to early autumn, and low flows in winter.
The big Alpine lakes, such as the transboundary Lake Lugano and Lake Maggiore, shared by Italy and Switzerland, are a characteristic feature of the basin. The most significant trans-boundary river is the Ticino River, also shared by Italy and Switzerland.
In the Italian part, the average annual precipitation amounts to approximately 78 × 109 m3/year, and the average annual surface flow is some 47 × 109 m3/year. Groundwater recharge is some 9 × 10⁹ m3/year.
In the Swiss part of the basin, precipitation is 4.161 × 10⁹ m3/year, run-off is 3.099 × 10⁹ m3/year, and external inflow from adjacent basins/countries is reported to be 0.019 × 10⁹ m3/year.
Pressures and statusThe Po River and its tributaries flow through several cities in Northern Italy. Pressures arise from agriculture, industry and urban areas. Some 37% of industry in Italy is in the Po Basin. Moreover, some 38% of the livestock and 36% of the agricultural production in Italy is located in the basin, even if the agricultural surface area in the basin represents only 24% of the total agricultural area in Italy.
The main water management problems in the basin include: surface and groundwater pollution, drinking water con-tamination, aquatic ecosystems quality, hydromorphological changes, overexploitation of water for agriculture and hy-dropower, changes in land use coupled with climate change effects (floods, landslides), and environmental conservation and restoration.
The fragmentation of administrative functions adds to the above problems. In the Italian part, the importance of the basin from the economic point of view and the deriving con-flicts between users also generate tensions, which can be an obstacle to finding effective solutions.
Hydropower generation and the trend to increase hydropow-er production create pressures, which may be at odds with the protection of ecosystems. Issues related to the impacts of residual flow and hydro-peaking are assessed as moderate.
Responses and trends Response measures (implemented and planned) in the Po River Basin Management Plan include, for example, policy integration; reduction of nutrient, organic compound and pesticide pollution; preservation of mountain basins; and im-provement of land use, in order to mitigate hydrogeological risk and to improve environmental status of water bodies. Current actions also include saving and using water resources sustainably, especially in agriculture.12
The impacts of climate change in the Alpine part of the Po Basin are principally the same as described in the assessment of the Rhone Basin (Swiss part). A decrease of 5–10% in precipitation is predicted — mainly in summer — and snow cover is predicted to be affected by the higher temperatures, with changes to the run-off regime. Current actions related to climate change in the Italian part include the preparation of a Water Balance Plan.
10 Based on the First Assessment. 11 Based on information provided by Italy and Switzerland, and on the First Assessment.12 For information on the response measures taken in Switzerland to address the hydromorphological pressures and for flood control, please refer to the assessment of
the Rhone.
Total water withdrawal and withdrawals by sector in the Po River Basin
CountryTotal withdrawal
×106 m3/year Agricultural % Domestic % industry % energy % other %Total (both countries)a 20 537 80b 12c 7d n/A n/A
a Of which 63 % from surface waters, 37 % from groundwaters.b Of which 83 % from surface waters, 17 % from groundwaters.c Of which 20 % from surface waters, 80 % from groundwaters.d Of which 20 % from surface waters, 80 % from groundwaters. Source: Regional water resources protection plan, Po River Basin Authority (http://www.adbpo.it).
260 | part iv
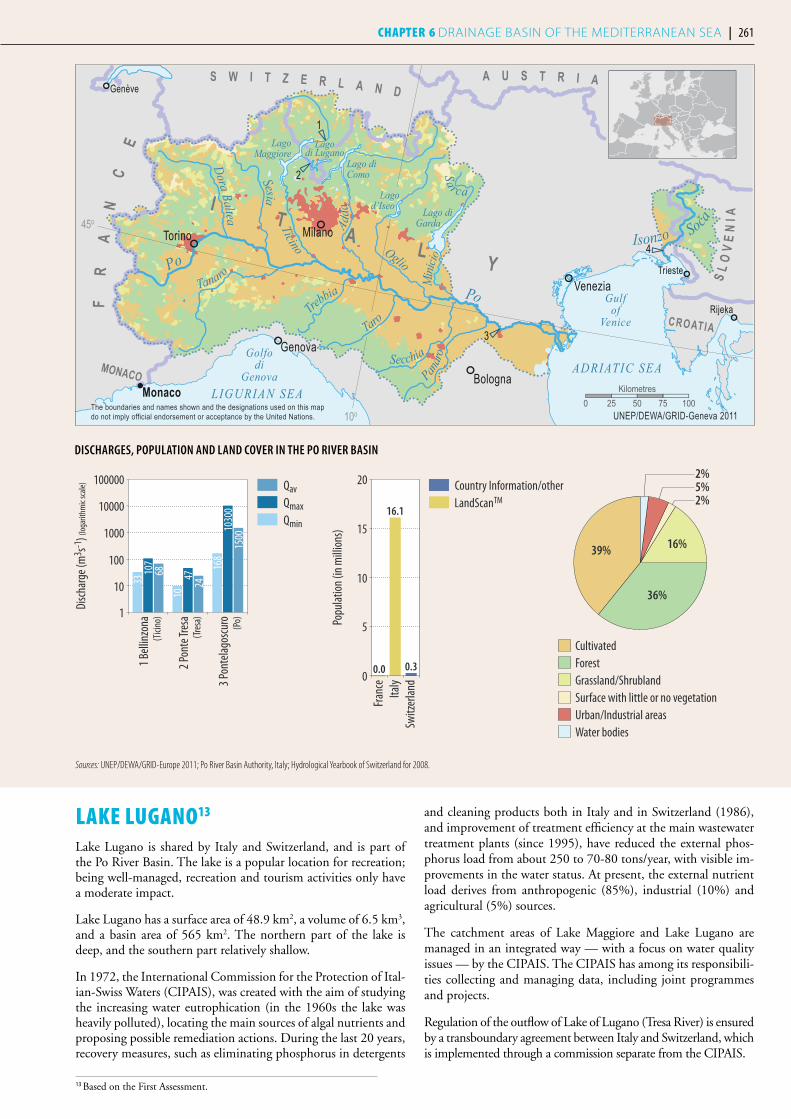
3 Pon
telag
oscu
ro
2 Pon
te Tr
esa
1 Bell
inzo
na
Disc
harg
e (m
3 s-1) (
loga
rithm
ic sc
ale)
107
68
33 4724
1030
0
(Tici
no)
(Tre
sa)
(Po)1
10
100
1000
10000
100000
10
168
1500
QavQmaxQmin
Popu
latio
n (in
mill
ions
)
0
5
10
15
20
Switz
erlan
dIta
lyFr
ance
0.0
16.1
0.3
LandScanTM
Country Information/other2%5%2%
CultivatedForestGrassland/ShrublandSurface with little or no vegetationUrban/Industrial areasWater bodies
39%
36%
16%
1
2
3
4Torino Milano
Genova
Bologna
Venezia
Genève
Trieste
Rijeka
Monaco
Golfodi
GenovaLIGURIAN SEA
ADRIATIC SEA
Gulfof
Venice
PoTanaro
Trebbia
Taro
Panar
oSecchia
Dora Baltea Ticino Oglio
Adda
Mini
cio
LagoMaggiore
Lago diComo
Lagodi Lugano
Lagod’Iseo Lago di
Garda
Sa r ca
Isonzo Soča
Sesia
Po
IT
AL Y
FR
AN
CE
S W I T Z E R L A N DA U S T R I A
SL O
VE
NI A
CROATIA
MONACO
10o
45o
The boundaries and names shown and the designations used on this mapdo not imply official endorsement or acceptance by the United Nations. UNEP/DEWA/GRID-Geneva 2011
0 25 50 75 100Kilometres
DiSChARgeS, popuLATion AnD LAnD CoveR in The po RiveR BASin
Sources: UNEP/DEWA/GRID-Europe 2011; Po River Basin Authority, Italy; Hydrological Yearbook of Switzerland for 2008.
Lake LuGano13
Lake Lugano is shared by Italy and Switzerland, and is part of the Po River Basin. The lake is a popular location for recreation; being well-managed, recreation and tourism activities only have a moderate impact.
Lake Lugano has a surface area of 48.9 km2, a volume of 6.5 km3, and a basin area of 565 km2. The northern part of the lake is deep, and the southern part relatively shallow.
In 1972, the International Commission for the Protection of Ital-ian-Swiss Waters (CIPAIS), was created with the aim of studying the increasing water eutrophication (in the 1960s the lake was heavily polluted), locating the main sources of algal nutrients and proposing possible remediation actions. During the last 20 years, recovery measures, such as eliminating phosphorus in detergents
and cleaning products both in Italy and in Switzerland (1986), and improvement of treatment efficiency at the main wastewater treatment plants (since 1995), have reduced the external phos-phorus load from about 250 to 70-80 tons/year, with visible im-provements in the water status. At present, the external nutrient load derives from anthropogenic (85%), industrial (10%) and agricultural (5%) sources.
The catchment areas of Lake Maggiore and Lake Lugano are managed in an integrated way — with a focus on water quality issues — by the CIPAIS. The CIPAIS has among its responsibili-ties collecting and managing data, including joint programmes and projects.
Regulation of the outflow of Lake of Lugano (Tresa River) is ensured by a transboundary agreement between Italy and Switzerland, which is implemented through a commission separate from the CIPAIS.
13 Based on the First Assessment.
260 | part iv Chapter 6 DRAINAGE BASIN OF THE MEDITERRANEAN SEA | 261
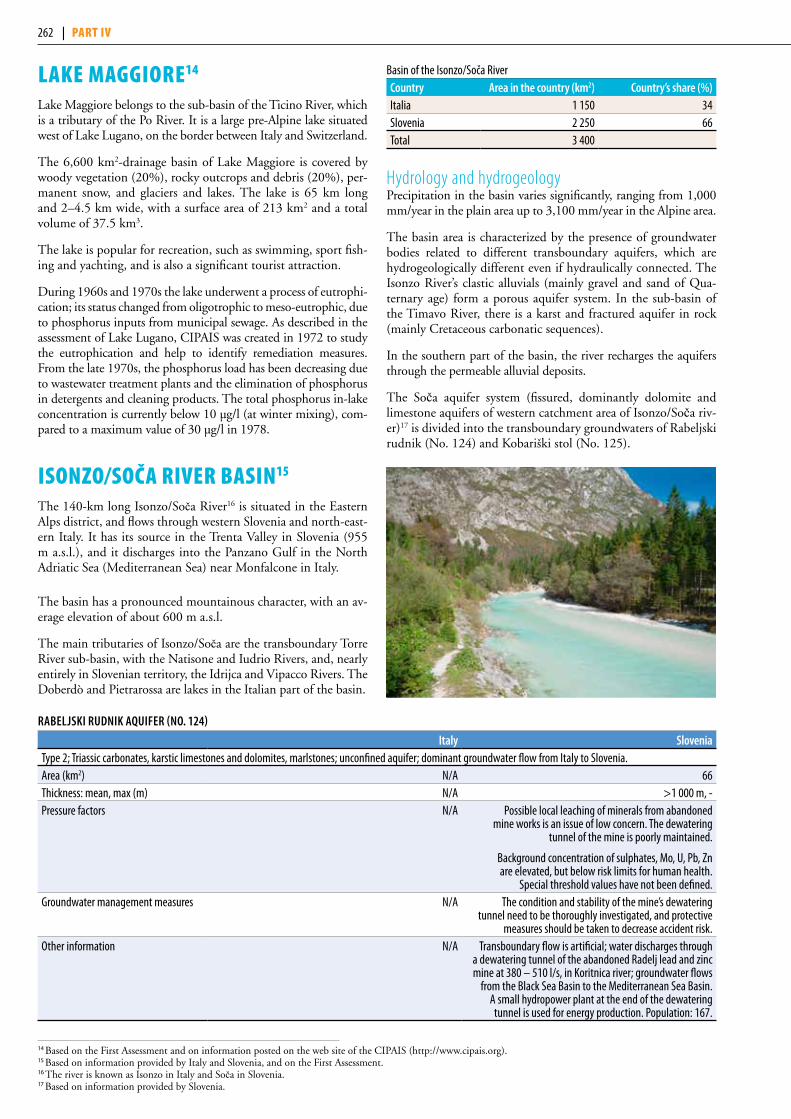
Lake maGGiore14
Lake Maggiore belongs to the sub-basin of the Ticino River, which is a tributary of the Po River. It is a large pre-Alpine lake situated west of Lake Lugano, on the border between Italy and Switzerland.
The 6,600 km2-drainage basin of Lake Maggiore is covered by woody vegetation (20%), rocky outcrops and debris (20%), per-manent snow, and glaciers and lakes. The lake is 65 km long and 2–4.5 km wide, with a surface area of 213 km2 and a total volume of 37.5 km3.
The lake is popular for recreation, such as swimming, sport fish-ing and yachting, and is also a significant tourist attraction.
During 1960s and 1970s the lake underwent a process of eutrophi-cation; its status changed from oligotrophic to meso-eutrophic, due to phosphorus inputs from municipal sewage. As described in the assessment of Lake Lugano, CIPAIS was created in 1972 to study the eutrophication and help to identify remediation measures. From the late 1970s, the phosphorus load has been decreasing due to wastewater treatment plants and the elimination of phosphorus in detergents and cleaning products. The total phosphorus in-lake concentration is currently below 10 μg/l (at winter mixing), com-pared to a maximum value of 30 μg/l in 1978.
isonzo/soča river Basin15
The 140-km long Isonzo/Soča River16 is situated in the Eastern Alps district, and flows through western Slovenia and north-east-ern Italy. It has its source in the Trenta Valley in Slovenia (955 m a.s.l.), and it discharges into the Panzano Gulf in the North Adriatic Sea (Mediterranean Sea) near Monfalcone in Italy.
The basin has a pronounced mountainous character, with an av-erage elevation of about 600 m a.s.l.
The main tributaries of Isonzo/Soča are the transboundary Torre River sub-basin, with the Natisone and Iudrio Rivers, and, nearly entirely in Slovenian territory, the Idrijca and Vipacco Rivers. The Doberdò and Pietrarossa are lakes in the Italian part of the basin.
Basin of the Isonzo/Soča RiverCountry Area in the country (km2) Country’s share (%)Italia 1 150 34Slovenia 2 250 66Total 3 400
Hydrology and hydrogeologyPrecipitation in the basin varies significantly, ranging from 1,000 mm/year in the plain area up to 3,100 mm/year in the Alpine area.
The basin area is characterized by the presence of groundwater bodies related to different transboundary aquifers, which are hydrogeologically different even if hydraulically connected. The Isonzo River’s clastic alluvials (mainly gravel and sand of Qua-ternary age) form a porous aquifer system. In the sub-basin of the Timavo River, there is a karst and fractured aquifer in rock (mainly Cretaceous carbonatic sequences).
In the southern part of the basin, the river recharges the aquifers through the permeable alluvial deposits.
The Soča aquifer system (fissured, dominantly dolomite and limestone aquifers of western catchment area of Isonzo/Soča riv-er)17 is divided into the transboundary groundwaters of Rabeljski rudnik (No. 124) and Kobariški stol (No. 125).
14 Based on the First Assessment and on information posted on the web site of the CIPAIS (http://www.cipais.org).15 Based on information provided by Italy and Slovenia, and on the First Assessment. 16 The river is known as Isonzo in Italy and Soča in Slovenia.17 Based on information provided by Slovenia.
RABeLjSki RuDnik AquifeR (no. 124)
italy SloveniaType 2; Triassic carbonates, karstic limestones and dolomites, marlstones; unconfined aquifer; dominant groundwater flow from Italy to Slovenia.Area (km2) N/A 66Thickness: mean, max (m) N/A >1 000 m, -Pressure factors N/A Possible local leaching of minerals from abandoned
mine works is an issue of low concern. The dewatering tunnel of the mine is poorly maintained.
Background concentration of sulphates, Mo, U, Pb, Zn are elevated, but below risk limits for human health.
Special threshold values have not been defined. Groundwater management measures N/A The condition and stability of the mine’s dewatering
tunnel need to be thoroughly investigated, and protective measures should be taken to decrease accident risk.
Other information N/A Transboundary flow is artificial; water discharges through a dewatering tunnel of the abandoned Radelj lead and zinc mine at 380 – 510 l/s, in Koritnica river; groundwater flows
from the Black Sea Basin to the Mediterranean Sea Basin. A small hydropower plant at the end of the dewatering
tunnel is used for energy production. Population: 167.
262 | part iv
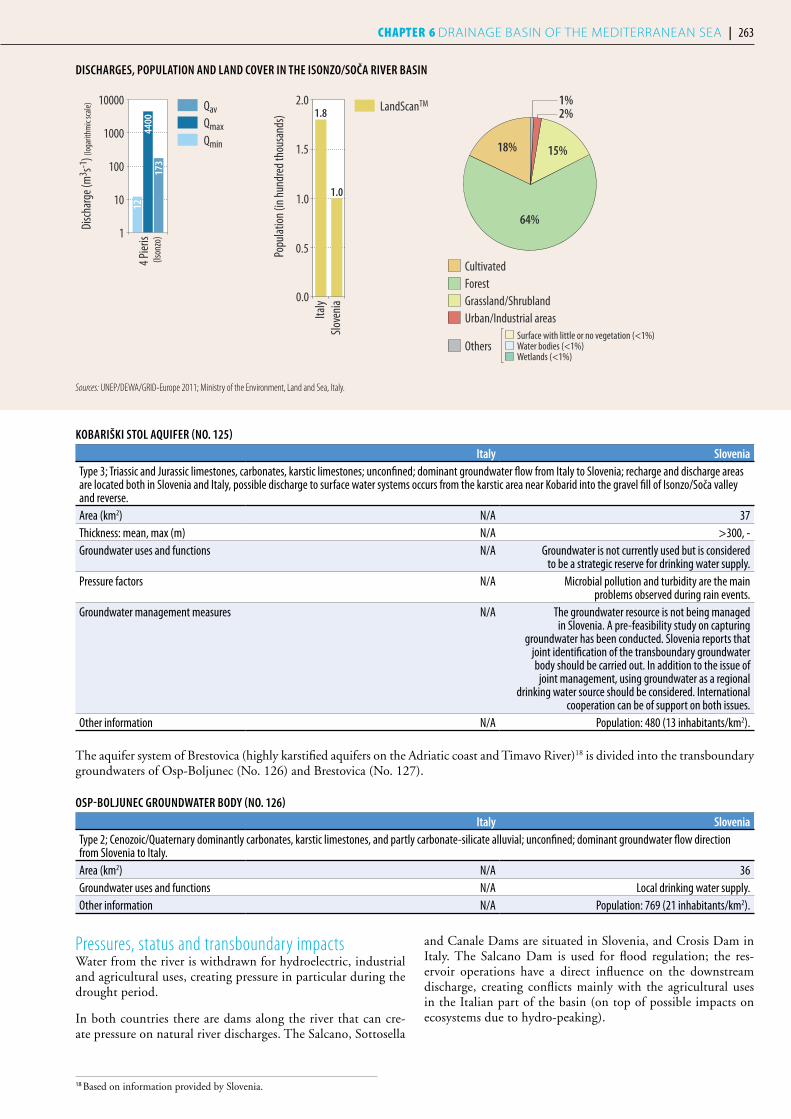
koBARiški SToL AquifeR (no. 125)
italy SloveniaType 3; Triassic and Jurassic limestones, carbonates, karstic limestones; unconfined; dominant groundwater flow from Italy to Slovenia; recharge and discharge areas are located both in Slovenia and Italy, possible discharge to surface water systems occurs from the karstic area near Kobarid into the gravel fill of Isonzo/Soča valley and reverse.Area (km2) N/A 37Thickness: mean, max (m) N/A >300, -Groundwater uses and functions N/A Groundwater is not currently used but is considered
to be a strategic reserve for drinking water supply.Pressure factors N/A Microbial pollution and turbidity are the main
problems observed during rain events. Groundwater management measures N/A The groundwater resource is not being managed
in Slovenia. A pre-feasibility study on capturing groundwater has been conducted. Slovenia reports that
joint identification of the transboundary groundwater body should be carried out. In addition to the issue of
joint management, using groundwater as a regional drinking water source should be considered. International
cooperation can be of support on both issues. Other information N/A Population: 480 (13 inhabitants/km2).
The aquifer system of Brestovica (highly karstified aquifers on the Adriatic coast and Timavo River)18 is divided into the transboundary groundwaters of Osp-Boljunec (No. 126) and Brestovica (No. 127).
oSp-BoLjuneC gRounDwATeR BoDy (no. 126)
italy SloveniaType 2; Cenozoic/Quaternary dominantly carbonates, karstic limestones, and partly carbonate-silicate alluvial; unconfined; dominant groundwater flow direction from Slovenia to Italy. Area (km2) N/A 36Groundwater uses and functions N/A Local drinking water supply.Other information N/A Population: 769 (21 inhabitants/km2).
4 Pier
is
Disc
harg
e (m
3 s-1) (
loga
rithm
ic sc
ale)
4400
173
(Ison
zo)1
10
100
1000
10000
12
QavQmaxQmin
Popu
latio
n (in
hun
dred
thou
sand
s)
0.0
0.5
1.0
1.5
2.0
Slove
nia
Italy
1.0
1.8 LandScanTM2%1%
Surface with little or no vegetation (<1%)Water bodies (<1%)Wetlands (<1%)
CultivatedForestGrassland/ShrublandUrban/Industrial areas
Others
18%
64%
15%
DiSChARgeS, popuLATion AnD LAnD CoveR in The iSonZo/SoČA RiveR BASin
Sources: UNEP/DEWA/GRID-Europe 2011; Ministry of the Environment, Land and Sea, Italy.
18 Based on information provided by Slovenia.
Pressures, status and transboundary impacts Water from the river is withdrawn for hydroelectric, industrial and agricultural uses, creating pressure in particular during the drought period.
In both countries there are dams along the river that can cre-ate pressure on natural river discharges. The Salcano, Sottosella
and Canale Dams are situated in Slovenia, and Crosis Dam in Italy. The Salcano Dam is used for flood regulation; the res-ervoir operations have a direct influence on the downstream discharge, creating conflicts mainly with the agricultural uses in the Italian part of the basin (on top of possible impacts on ecosystems due to hydro-peaking).
262 | part iv Chapter 6 DRAINAGE BASIN OF THE MEDITERRANEAN SEA | 263
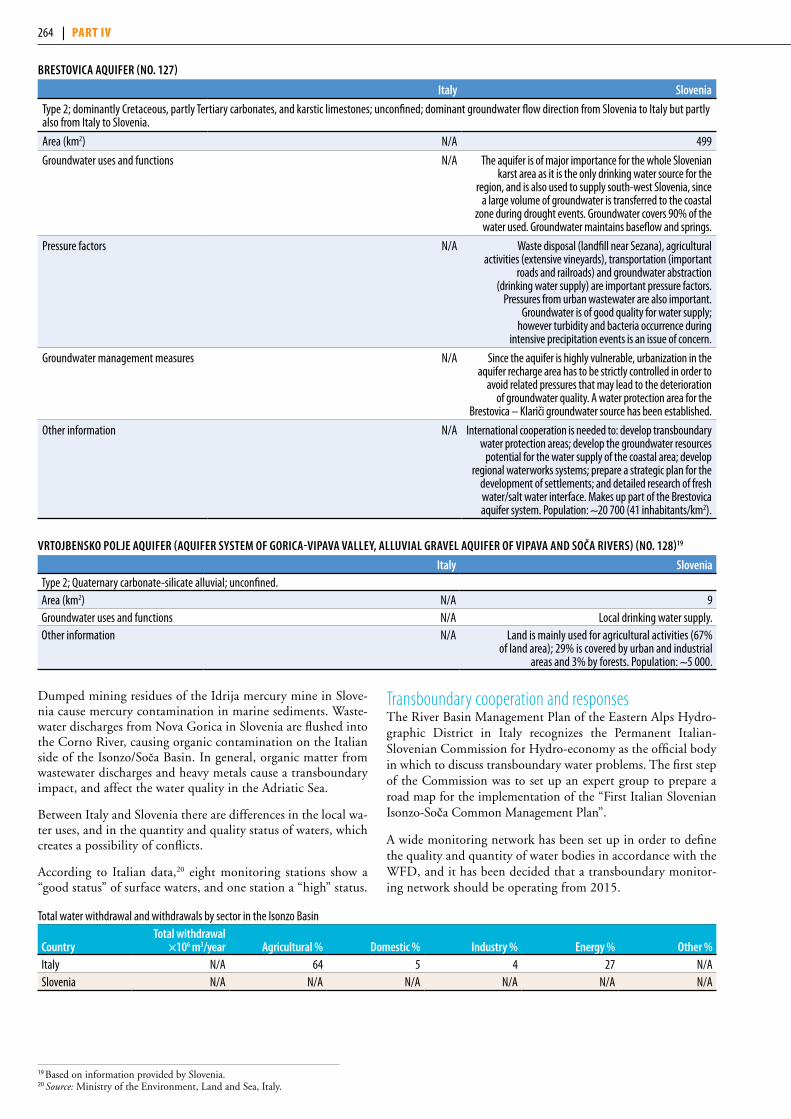
BReSToviCA AquifeR (no. 127)
italy Slovenia
Type 2; dominantly Cretaceous, partly Tertiary carbonates, and karstic limestones; unconfined; dominant groundwater flow direction from Slovenia to Italy but partly also from Italy to Slovenia.
Area (km2) N/A 499
Groundwater uses and functions N/A The aquifer is of major importance for the whole Slovenian karst area as it is the only drinking water source for the
region, and is also used to supply south-west Slovenia, since a large volume of groundwater is transferred to the coastal
zone during drought events. Groundwater covers 90% of the water used. Groundwater maintains baseflow and springs.
Pressure factors N/A Waste disposal (landfill near Sezana), agricultural activities (extensive vineyards), transportation (important
roads and railroads) and groundwater abstraction (drinking water supply) are important pressure factors.
Pressures from urban wastewater are also important. Groundwater is of good quality for water supply;
however turbidity and bacteria occurrence during intensive precipitation events is an issue of concern.
Groundwater management measures N/A Since the aquifer is highly vulnerable, urbanization in the aquifer recharge area has to be strictly controlled in order to
avoid related pressures that may lead to the deterioration of groundwater quality. A water protection area for the
Brestovica – Klariči groundwater source has been established.
Other information N/A International cooperation is needed to: develop transboundary water protection areas; develop the groundwater resources
potential for the water supply of the coastal area; develop regional waterworks systems; prepare a strategic plan for the
development of settlements; and detailed research of fresh water/salt water interface. Makes up part of the Brestovica aquifer system. Population: ∼20 700 (41 inhabitants/km2).
vRTojBenSko poLje AquifeR (AquifeR SySTem of goRiCA-vipAvA vALLey, ALLuviAL gRAveL AquifeR of vipAvA AnD SoČA RiveRS) (no. 128)19
italy SloveniaType 2; Quaternary carbonate-silicate alluvial; unconfined. Area (km2) N/A 9Groundwater uses and functions N/A Local drinking water supply. Other information N/A Land is mainly used for agricultural activities (67%
of land area); 29% is covered by urban and industrial areas and 3% by forests. Population: ∼5 000.
19 Based on information provided by Slovenia.20 Source: Ministry of the Environment, Land and Sea, Italy.
Total water withdrawal and withdrawals by sector in the Isonzo Basin
CountryTotal withdrawal
×106 m3/year Agricultural % Domestic % industry % energy % other %Italy N/A 64 5 4 27 N/ASlovenia N/A N/A N/A N/A N/A N/A
Dumped mining residues of the Idrija mercury mine in Slove-nia cause mercury contamination in marine sediments. Waste-water discharges from Nova Gorica in Slovenia are flushed into the Corno River, causing organic contamination on the Italian side of the Isonzo/Soča Basin. In general, organic matter from wastewater discharges and heavy metals cause a transboundary impact, and affect the water quality in the Adriatic Sea.
Between Italy and Slovenia there are differences in the local wa-ter uses, and in the quantity and quality status of waters, which creates a possibility of conflicts.
According to Italian data,20 eight monitoring stations show a “good status” of surface waters, and one station a “high” status.
Transboundary cooperation and responsesThe River Basin Management Plan of the Eastern Alps Hydro- graphic District in Italy recognizes the Permanent Italian- Slovenian Commission for Hydro-economy as the official body in which to discuss transboundary water problems. The first step of the Commission was to set up an expert group to prepare a road map for the implementation of the “First Italian Slovenian Isonzo-Soča Common Management Plan”.
A wide monitoring network has been set up in order to define the quality and quantity of water bodies in accordance with the WFD, and it has been decided that a transboundary monitor-ing network should be operating from 2015.
264 | part iv

krka river Basin21
Basin of the Krka RiverCountry Area in the country (km2) Country’s share (%)Bosnia and Herzegovina 300 12Croatia 2200 88Total 5 613
The river has its source in Croatia and discharges into the Adri-atic Sea in Croatia. The basin has a pronounced mountainous character, with an average elevation of about 100 m a.s.l. The National Park “Krka” covers 4.5% of the basin area.
Hydrology and hydrogeologyA major transboundary tributary is the river Butišnica. Major lakes are Lake Brljan (man-made), Lake Golubić (man-made), Lake Visovac (natural), and Lake Prokljan (natural).
There are three hydropower stations located on the Krka, and two located on the Butišnica and Krčić tributaries.
Hydrogeologically, the basin of the upper course of the Krka River around the town of Knin and the Kosovo Polje valley is mostly made up of impermeable and poorly permeable depos-its, less vulnerable to pollution transport.
Pressures, status and transboundary impactsThe main forms of land use include grasslands (44%), forests (30%) and cropland (15%).
In the Croatian part of the basin, some 6% of the area is under protection. Industry uses 27% of the water from the public water supply systems, and the urban sector, 73%.
The pressure from agriculture is insignificant as agricultural pro-duction of fruits, vegetables and olives is still low, as is animal hus-bandry. However, production is slowly increasing, which in turn may lead to increasing pressure and transboundary impact. Sus-tainable agriculture and technological development are necessary.
There are 18 small sites for stone and alabaster excavation. The in-tensity of exploitation and the number of sites are slowly increasing.
Intensive aluminium production and shipyards are located in the coastal area. Other industry sectors are less intensive, and have not recovered after the war. They are mostly connected to the sewer systems. The number of industrial zones is rapidly increasing, but all are required by law to have adequate wastewater treatment, or to be connected to municipal wastewater treatment plants.
There are still unfinished sewerage systems and untreated ur-ban wastewaters from Knin (40,000 p.e.) and Drniš (10,000 p.e.) towns. The three controlled dumping sites do not cause significant impact; however, there are also several small illegal dumpsites. The generally good chemical status of groundwater in the Krka River basin indicates insignificant salinization and seawater intrusion.
Storm waters from highways are treated by oil-separators and dis-posed of underground or discharged into rivers. However, treated waters cannot be disposed of underground in the vicinity of wa-ter abstraction sites (sanitary protection zones).
The water bodies mostly have a “good” ecological status. The sur-face waters in the National Park “Krka” have a “moderate” status, because of the ecological requirements of the National Park for high water quality, and the untreated urban wastewater discharges from Drniš and Knin, which are located upstream. Phosphorus concentrations have increased in some areas, but not significantly. BOD and COD have increased, particularly in the vicinity of Knin. The area of the port of Šibenik is extremely eutrophic.
Reduced springflow in Bosnia and Herzegovina results in eco-system degradation; nevertheless the Krka aquifer (No. 129) is not at risk.
Responses and trendsCroatia has partly transposed the WFD into its legal frame-work. A river basin management plan (in accordance to the WFD) has been developed for the Krka river basin, being a pilot for the country.
There was an oil spill into the Orašnica River in Knin in 2007. A pollution risk is posed by a petrol station constructed on a flood plain in the vicinity of Knin. Croatia reported that in-vestments in flood protection facilities, and hydro-amelioration systems in general, are required.
The tourism sector has developed favourably in the past years, and the capacity to receive tourists is planned to increase.
neretva river Basin23
The Neretva River basin is shared by Bosnia and Herzegovina and Croatia, and through the Trebišnjica River, which is hy-draulically connected with the Neretva, also by Montenegro. Some 10,100 km2 of the basin area is in Bosnia and Herzego-vina, and 280 km2 in Croatia.24
kRkA AquifeR (no. 129)22
Bosnia and herzegovina CroatiaDoes not correspond to any of the described model aquifer types; Cretaceous karstic limestone; strong links to surface water system; groundwater flow from Bosnia and Herzegovina to Croatia. Groundwater uses and functions >95% to support ecosystems, <5% for drinking water. Drinking water supply.Pressure factors Solid waste disposal; polluted water
locally drawn in the aquifer. Industry.
Management measures Groundwater quantity and quality monitoring need to be improved, as do abstraction control,
protection zones and wastewater treatment.
Protection zones need to be established. The two countries should cooperate for the delineation of transboundary
groundwaters, and in the field of monitoring.Other information Border length 42 km. Not at risk. Border length 42 km. Transboundary aquifer
under consideration, but not approved.
21 Based on information from Croatia and the First Assessment.22 Based on information from the First Assessment.23 Based on information from Bosnia and Herzegovina, Croatia; the Environmental Performance Review of Bosnia and Herzegovina (UNECE 2004); and the
Neretva and Trebišnjica Management Project, Appraisal Document, The World Bank/GEF.24 Including also the basin of the Trebišnjica River.
264 | part iv Chapter 6 DRAINAGE BASIN OF THE MEDITERRANEAN SEA | 265

DiSChARgeS, popuLATion AnD LAnD CoveR in The kRkA RiveR BASin
1
23
4
5
67
89
10
11
12
13
1415
Sarajevo
Beograd
Skopje
Tiranë
Sofia
Podgorica
Thessaloniki
Ramsar Sites1 Lake Skadar/Shkoder and Buna/Bojana River2 Prespa Park Wetlands
1
2
Kr
ka
Neretva
Trebižat
LakeSkadar
LakeOhrid
Prespa Lakes
LakeDojran
LakeBilećko
Drin
Beli DrimDrini i Zi
Crn Drim
Vijosë
Aoos
Vard
ar
Axios
AD
RI
AT
IC
S
EA
AEGEAN
SEA
Morača
Crna
Drino
Bregalnica
I T A L Y
B O S N I AA N D
H E R Z E G O V I N A
S E R B I A
A L B A N I A
CR
OA
T
IA
BU
LG
AR
I A
GR
EE
CE
M O N T E N E G R O
FORMER YUGOSLAVREPUBLIC
OF MACEDONIA
40o
20oThe boundaries and names shown and the designations used on this mapdo not imply official endorsement or acceptance by the United Nations. UNEP/DEWA/GRID-Geneva 2011
0 50 100 150Kilometres
1 Mar
janov
ići
Disc
harg
e (m
3 s-1) (
loga
rithm
ic sc
ale)
125
21(K
rka)1
10
100
1000
3
QavQmaxQmin
Popu
latio
n (in
thou
sand
s)
0
20
40
60
80
100
Croa
tiaBo
snia
and H
erze
govin
a
80.0
0.4
LandScanTM3%1%
Urban/Industrial areas (<1%)Surface with little or no vegetation (<1%)
Water bodies (<1%)Wetlands (<1%)
CultivatedForestGrassland/Shrubland
Others
86%
10%
Source: UNEP/DEWA/GRID-Europe 2011.
266 | part iv
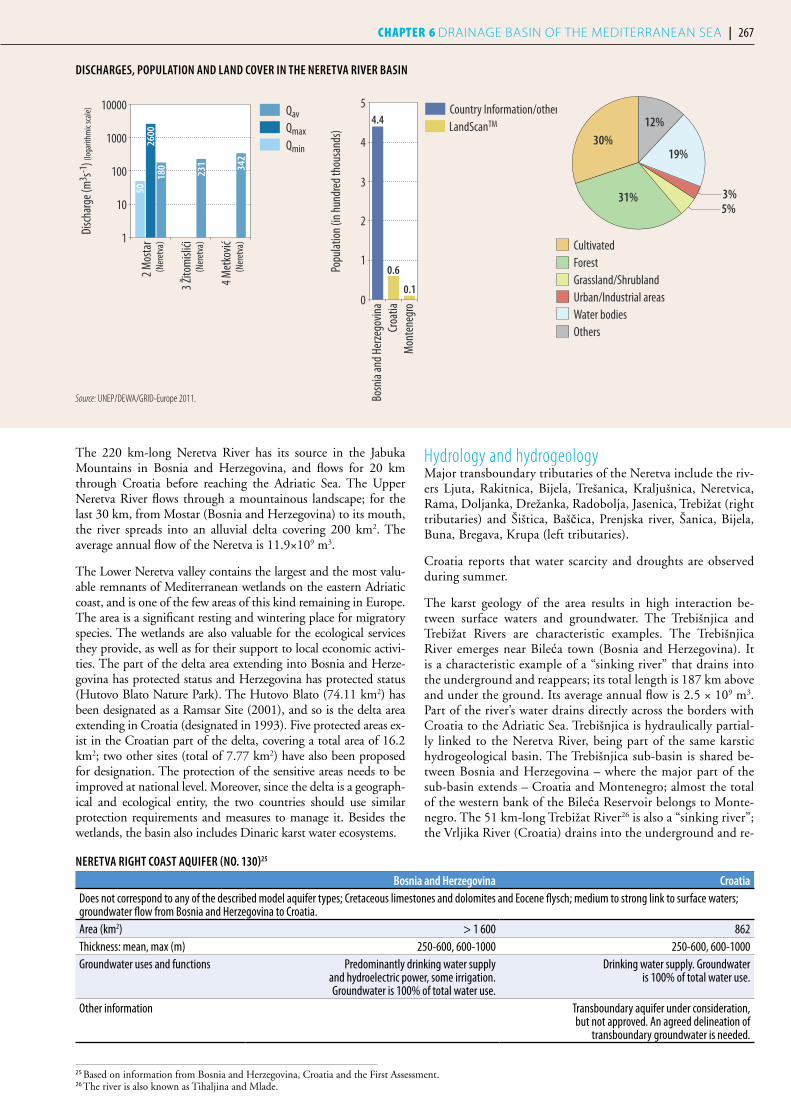
The 220 km-long Neretva River has its source in the Jabuka Mountains in Bosnia and Herzegovina, and flows for 20 km through Croatia before reaching the Adriatic Sea. The Upper Neretva River flows through a mountainous landscape; for the last 30 km, from Mostar (Bosnia and Herzegovina) to its mouth, the river spreads into an alluvial delta covering 200 km2. The average annual flow of the Neretva is 11.9×10⁹ m3.
The Lower Neretva valley contains the largest and the most valu-able remnants of Mediterranean wetlands on the eastern Adriatic coast, and is one of the few areas of this kind remaining in Europe. The area is a significant resting and wintering place for migratory species. The wetlands are also valuable for the ecological services they provide, as well as for their support to local economic activi-ties. The part of the delta area extending into Bosnia and Herze-govina has protected status and Herzegovina has protected status (Hutovo Blato Nature Park). The Hutovo Blato (74.11 km2) has been designated as a Ramsar Site (2001), and so is the delta area extending in Croatia (designated in 1993). Five protected areas ex-ist in the Croatian part of the delta, covering a total area of 16.2 km2; two other sites (total of 7.77 km2) have also been proposed for designation. The protection of the sensitive areas needs to be improved at national level. Moreover, since the delta is a geograph-ical and ecological entity, the two countries should use similar protection requirements and measures to manage it. Besides the wetlands, the basin also includes Dinaric karst water ecosystems.
Hydrology and hydrogeologyMajor transboundary tributaries of the Neretva include the riv-ers Ljuta, Rakitnica, Bijela, Trešanica, Kraljušnica, Neretvica, Rama, Doljanka, Drežanka, Radobolja, Jasenica, Trebižat (right tributaries) and Šištica, Baščica, Prenjska river, Šanica, Bijela, Buna, Bregava, Krupa (left tributaries).
Croatia reports that water scarcity and droughts are observed during summer.
The karst geology of the area results in high interaction be-tween surface waters and groundwater. The Trebišnjica and Trebižat Rivers are characteristic examples. The Trebišnjica River emerges near Bileća town (Bosnia and Herzegovina). It is a characteristic example of a “sinking river” that drains into the underground and reappears; its total length is 187 km above and under the ground. Its average annual flow is 2.5 × 10⁹ m3. Part of the river’s water drains directly across the borders with Croatia to the Adriatic Sea. Trebišnjica is hydraulically partial-ly linked to the Neretva River, being part of the same karstic hydrogeological basin. The Trebišnjica sub-basin is shared be-tween Bosnia and Herzegovina – where the major part of the sub-basin extends – Croatia and Montenegro; almost the total of the western bank of the Bileća Reservoir belongs to Monte-negro. The 51 km-long Trebižat River26 is also a “sinking river”; the Vrljika River (Croatia) drains into the underground and re-
neReTvA RighT CoAST AquifeR (no. 130)25
Bosnia and herzegovina CroatiaDoes not correspond to any of the described model aquifer types; Cretaceous limestones and dolomites and Eocene flysch; medium to strong link to surface waters; groundwater flow from Bosnia and Herzegovina to Croatia. Area (km2) > 1 600 862Thickness: mean, max (m) 250-600, 600-1000 250-600, 600-1000Groundwater uses and functions Predominantly drinking water supply
and hydroelectric power, some irrigation. Groundwater is 100% of total water use.
Drinking water supply. Groundwater is 100% of total water use.
Other information Transboundary aquifer under consideration, but not approved. An agreed delineation of
transboundary groundwater is needed.
4 Met
ković
3 Žito
misl
ići
2 Mos
tar
Disc
harg
e (m
3 s-1) (
loga
rithm
ic sc
ale)
2600
180
50
231
(Ner
etva
)
(Ner
etva
)
(Ner
etva
)1
10
100
1000
10000
342
QavQmaxQmin
Popu
latio
n (in
hun
dred
thou
sand
s)
0
1
2
3
4
5
Mon
tene
gro
Croa
tiaBo
snia
and H
erze
govin
a
4.4
0.6
0.1
LandScanTM
Country Information/other
3%5%
CultivatedForestGrassland/ShrublandUrban/Industrial areasWater bodiesOthers
30%
31%
12%
19%
DiSChARgeS, popuLATion AnD LAnD CoveR in The neReTvA RiveR BASin
25 Based on information from Bosnia and Herzegovina, Croatia and the First Assessment. 26 The river is also known as Tihaljina and Mlade.
Source: UNEP/DEWA/GRID-Europe 2011.
266 | part iv Chapter 6 DRAINAGE BASIN OF THE MEDITERRANEAN SEA | 267
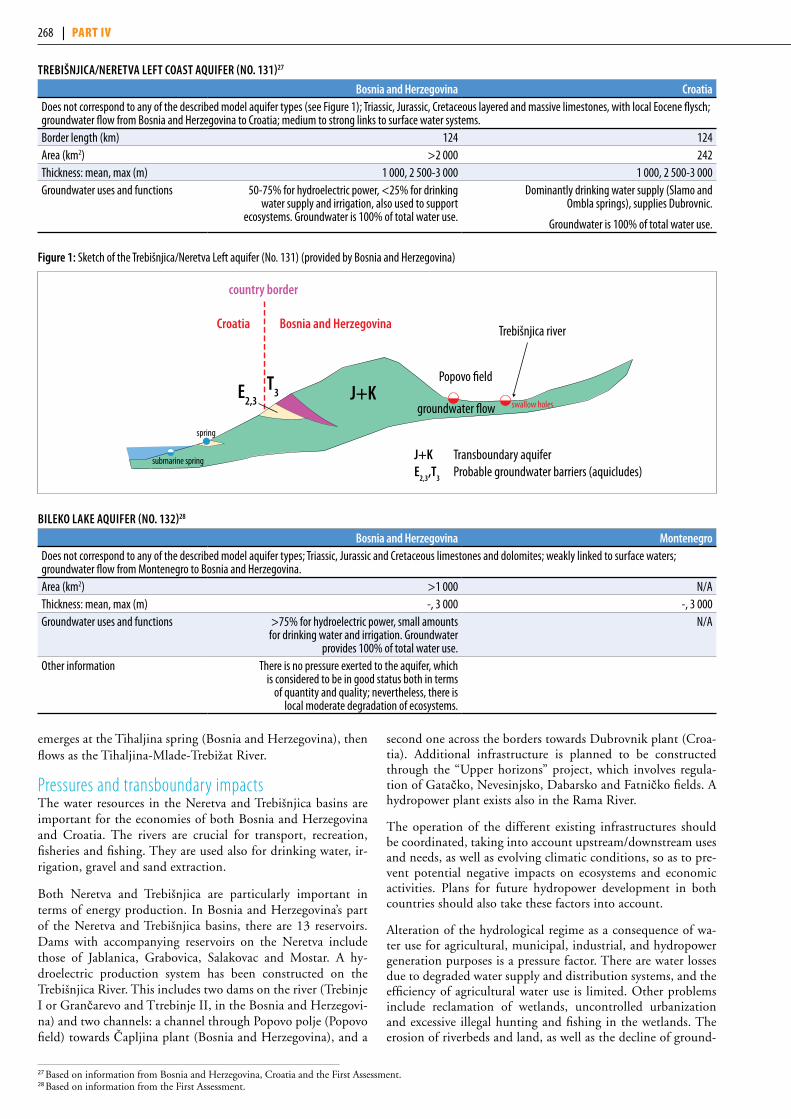
emerges at the Tihaljina spring (Bosnia and Herzegovina), then flows as the Tihaljina-Mlade-Trebižat River.
Pressures and transboundary impactsThe water resources in the Neretva and Trebišnjica basins are important for the economies of both Bosnia and Herzegovina and Croatia. The rivers are crucial for transport, recreation, fisheries and fishing. They are used also for drinking water, ir-rigation, gravel and sand extraction.
Both Neretva and Trebišnjica are particularly important in terms of energy production. In Bosnia and Herzegovina’s part of the Neretva and Trebišnjica basins, there are 13 reservoirs. Dams with accompanying reservoirs on the Neretva include those of Jablanica, Grabovica, Salakovac and Mostar. A hy-droelectric production system has been constructed on the Trebišnjica River. This includes two dams on the river (Trebinje I or Grančarevo and Ttrebinje II, in the Bosnia and Herzegovi-na) and two channels: a channel through Popovo polje (Popovo field) towards Čapljina plant (Bosnia and Herzegovina), and a
second one across the borders towards Dubrovnik plant (Croa-tia). Additional infrastructure is planned to be constructed through the “Upper horizons” project, which involves regula-tion of Gatačko, Nevesinjsko, Dabarsko and Fatničko fields. A hydropower plant exists also in the Rama River.
The operation of the different existing infrastructures should be coordinated, taking into account upstream/downstream uses and needs, as well as evolving climatic conditions, so as to pre-vent potential negative impacts on ecosystems and economic activities. Plans for future hydropower development in both countries should also take these factors into account.
Alteration of the hydrological regime as a consequence of wa-ter use for agricultural, municipal, industrial, and hydropower generation purposes is a pressure factor. There are water losses due to degraded water supply and distribution systems, and the efficiency of agricultural water use is limited. Other problems include reclamation of wetlands, uncontrolled urbanization and excessive illegal hunting and fishing in the wetlands. The erosion of riverbeds and land, as well as the decline of ground-
27 Based on information from Bosnia and Herzegovina, Croatia and the First Assessment.28 Based on information from the First Assessment.
TReBišnjiCA/neReTvA LefT CoAST AquifeR (no. 131)27
Bosnia and herzegovina CroatiaDoes not correspond to any of the described model aquifer types (see Figure 1); Triassic, Jurassic, Cretaceous layered and massive limestones, with local Eocene flysch; groundwater flow from Bosnia and Herzegovina to Croatia; medium to strong links to surface water systems. Border length (km) 124 124Area (km2) >2 000 242Thickness: mean, max (m) 1 000, 2 500-3 000 1 000, 2 500-3 000Groundwater uses and functions 50-75% for hydroelectric power, <25% for drinking
water supply and irrigation, also used to support ecosystems. Groundwater is 100% of total water use.
Dominantly drinking water supply (Slamo and Ombla springs), supplies Dubrovnic.
Groundwater is 100% of total water use.
BiLeko LAke AquifeR (no. 132)28
Bosnia and herzegovina montenegroDoes not correspond to any of the described model aquifer types; Triassic, Jurassic and Cretaceous limestones and dolomites; weakly linked to surface waters; groundwater flow from Montenegro to Bosnia and Herzegovina. Area (km2) >1 000 N/AThickness: mean, max (m) -, 3 000 -, 3 000Groundwater uses and functions >75% for hydroelectric power, small amounts
for drinking water and irrigation. Groundwater provides 100% of total water use.
N/A
Other information There is no pressure exerted to the aquifer, which is considered to be in good status both in terms
of quantity and quality; nevertheless, there is local moderate degradation of ecosystems.
figure 1: Sketch of the Trebišnjica/Neretva Left aquifer (No. 131) (provided by Bosnia and Herzegovina)
country border
Croatia Bosnia and Herzegovina Trebišnjica river
Popovo �eld
J+K Transboundary aquiferE
2,3,T
3 Probable groundwater barriers (aquicludes)
groundwater �ow swallow holes
spring
submarine spring
J+KE2,3
T3
268 | part iv

water levels in the Trebišnjica/Neretva Left coast aquifer (No. 131), have been observed in Bosnia and Herzegovina, together with a reduced springflow in both Neretva Right coast (No. 130) and Trebišnjica/Neretva Left coast aquifers (No. 131).
Point-source pollution (from untreated municipal and industrial wastewaters and uncontrolled dumpsites, both for municipal and industrial wastes) and diffuse pollution (due to unsustainable ag-ricultural practices) exert pressure both on surface waters and on aquifers. The widespread but moderate drawing of polluted wa-ter in the Neretva Right coast (No. 130) and Trebišnjica/Neretva Left coast aquifers (No. 131) exacerbates the situation. Bosnia and Herzegovina reported that water pollution by nutrients, pes-ticides, heavy metals and organic compounds are issues of con-cern. Access by the population to sanitation systems has been low in Bosnia and Herzegovina, and there is room for improvement in treatment facilities for municipal wastewater. There is pollu-tion from municipal wastewater in the areas of Metković, Ro-gotin and Opuzen in Croatia. The following has been reported: occasional microbiological pollution in the Neretva Right coast (No. 130) and the Trebišnjica/Neretva Left coast aquifers (No. 131) in Croatia; moderate nitrogen, pathogen and organic com-pounds pollution in the Neretva Right coast aquifer (No. 130); and wide but moderate nitrogen, pathogens and heavy metals and some local, moderate pesticide pollution in the Trebišnjica/Neretva Left coast aquifer (No. 131) in Bosnia and Herzegovina. Groundwater pollution has effects at the transboundary level.
The cumulative impacts of these pressures have led to degra-dation, in terms of quality and quantity, of surface waters and groundwater, and subsequently of associated ecosystems.
Pressures and impacts have in many cases an upstream – down-stream character; for instance, the regulation of the flow of the river has led to salt water intrusion in the Neretva delta, as well as the reduction of sediment deposition in the alluvium affect-ing the natural system, its functions and services, as well as eco-nomic activities downstream. This is not applicable everywhere throughout the area, since the existence of karstic geological for-mations may, for example, cause impacts of point pollution that occur downstream to be transported in groundwater to other parts of the basin.
ResponsesA number of water resource management plans and measures are implemented in Croatia, reflecting the changes made to wa-ter management legislation, aimed towards harmonizing it with EU standards and the requirements of the WFD. The prepara-tion of a River Basin Management Plan in accordance with the WFD by Croatian Waters, in cooperation with the Ministry of Regional Development, Forestry and Water Management, is underway.
Bosnia and Herzegovina has established protection zones for drinking water supply for the Neretva Right coast aquifer (No. 130). Wastewater treatment plants exist in the area, but im-provements are needed. Vulnerability mapping is planned for the Neretva Right coast (No. 130) and the Trebišnjica/Ner-etva Left coast aquifers (No. 131) in Bosnia and Herzegovi-na. Groundwater quantity is being monitored in the Neretva Right coast aquifer (No. 130) in Bosnia and Herzegovina, while groundwater quality is being monitored in Bilećko Lake aquifer (No. 132); improvements are, however, necessary in both cases. Data on Trebišnjica/Neretva Left coast aquifer (No. 131) has been exchanged between the two countries, but improvement is needed in this regard; enhanced monitoring is needed in both countries.
Monitoring of water flow and quality is being improved; more efforts are needed in the area of biological monitoring. This will allow the assessment of the status with regard to water supply, demand and quality, in a basin with a rather complex hydro-geology, providing the basis for adequate planning and regula-tion on a river basin level. The essential balancing of compet-ing water demands, taking into account social, economic and environmental considerations, through a comprehensive and coordinated strategy agreed by the two countries, may follow. Enhancement of the national institutional capacity to plan, im-plement and enforce management measures on water demand and water use is indispensable.
Croatia reports that investments on flood protection and hy-dro-amelioration are necessary.
268 | part iv Chapter 6 DRAINAGE BASIN OF THE MEDITERRANEAN SEA | 269

Transboundary cooperationAn agreement between Bosnia and Herzegovina and Croatia on Water Management Relations was signed in 1996, and is implemented through a joint commission, which is also the key bilateral mechanism for transboundary cooperation in the Ner-etva and Trebišnjica basins.
A Memorandum on Cooperation on the Neretva River was signed among Bosnia and Herzegovina, Croatia, the Principal-ity of Monaco, and the Coordination unit of the Mediterranean Initiative of the Ramsar Convention on Wetlands (MedWet) in 2003. Pollution in the delta of the Neretva River, hydropower utilization, and water supply were among the priority themes.
In Bosnia and Herzegovina, the multiple levels of administration involved make coordination of international and bilateral coop-eration challenging. This results in considerable delays in coor-dination, and difficulties in entering international agreements.
A GEF/World Bank project has been initiated with the objec-tive to support IWRM in the basin, by harmonizing manage-ment approaches and legal frameworks across the two coun-tries, and by ensuring improved stakeholder participation at all levels. The WFD principles and guidelines are used for what concerns the preparation of the river basin management plan. The Commission has been involved in the project preparation, and will oversee its implementation.
TrendsThere is an accidental pollution risk due to the storage of large quantities of dangerous substances in the port of Ploce in Croa-tia, and their transport along the Neretva.
Rural tourism is under development in Croatia; it may foster the reduction of pressures in the delta area of Neretva.
BiLeća reservoir/BiLećko Lake29
Bileća Reservoir/Bilećko Lake is located in the territory of Bos-nia and Herzegovina and Montenegro. It was formed when the concrete arch dam of Grančarevo (height 123 m, the length of the crown 439 m) was constructed, with the goal of exploiting the hydro-energy power of the Trebišnjica River. The length of the reservoir is about 17 km, and width ranges between 250 and 5,400 m. At largest, the surface area of the lake is about
27.8 km2, with a volume of about 1,278 × 106 m³. The average discharge of the river Trebišnjica in the profile of the dam was 67 m³/s during the monitoring period from 1956 to 2005.
Water from the lake is used for hydropower generation at the hydro-power plants of Trebinje in Bosnia and Herzegovina, and of Dubrovnik in Croatia.
drin river Basin31
The Drin River starts at the confluence of its two headwaters, the transboundary Black Drin32 and White Drin33 Rivers at Kukës in Albania. The interconnected hydrological system of the Drin River basin comprises the transboundary sub-basins of the Black Drin, White Drin, and Buna/Bojana34 (outflow of Skadar/Shkoder Lake in the Adriatic Sea) Rivers, and the sub-basins of Prespa, Ohrid and Skadar/Shkoder35 Lakes.
Albania, Greece, the former Yugoslav Republic of Macedonia, Kosovo (UN administered territory under UN Security Coun-cil Resolution 1244) and Montenegro share the Drin Basin.
Hydrology and hydrogeology36
Water flows out of Lake Ohrid (average discharge: 22 m3/s) into the Black Drin River near Struga, in the former Yugoslav Republic of Macedonia. The Radika River is a major trans-boundary tributary of the Black Drin. The river runs 149 km (as Drin i Zi) until Kukës, Albania, where it joins the White Drin River (136 km long). Their confluence, the Drin, flows further westward and discharges into the Adriatic Sea. The old Drin channel discharges into the Adriatic south of the Buna/Bojana River near the city of Lezhe, but the Drin's major chan-nel is the 11-km Drinasa, which joins the Buna/Bojana just 1 km beyond the latter's outlet from Skadar/Shkoder Lake near the city of Shkodra. The Drin delta is located 20 km south of the Buna/Bojana Delta.
The Drin River Basin is characterized by mountainous relief, with a mean elevation of 971 m a.s.l. (the highest peaks are over 2,500 m), and flat land in the coastal area.
The White Drin is hydraulically connected with the shared karstic Beli Drim/Drini Bardhe aquifer (No. 133).
BeLi DRim/DRini BARDhe AquifeR (no. 133)30
Albaniakosovo (un administered territory under
un Security Council Resolution 1244)Type 3; Lower and Upper Cretaceous karstic and dolomitised limestone, Miocene to Quaternary multilayer sequence; groundwater flow from Kosovo (UN administered territory under UN Security Council Resolution 1244) to Albania; medium to strong links with surface waters.Border length (km) 30 30Area (km2) 170 1 000Thickness: mean, max (m) 100, 200 N/AGroundwater uses and functions Groundwater is 60-70% of total water use.
75% for irrigation, <25% for drinking water and livestock. It also maintains baseflow.
Groundwater is 30 % of total water use. 25-50% for irrigation, <25% for drinking water
and industry. It also maintains baseflow.
29 Based on information provided by Bosnia and Herzegovina.30 Based on information from the First Assessment.31 Based on information from Montenegro; the First Assessment; and on Faloutsos D., Constantianos V. and Scoullos M. Status Paper - Management of the extended
Transboundary Drin Basin. GWP-Med, Athens. 2008. Some information was also provided by the former Yugoslav Republic of Macedonia and Albania. The same sources were used for the assessments of Lake Ohrid, Prespa Lakes and Lake Skadar/Shkoder.
32 The river is called Drin i Zi in Albania and Crn Drim in the former Yugoslav Republic of Macedonia.33 The river is called Drin i Bardhë in Albania and Beli Drin in Kosovo (UN administered territory under UN Security Council Resolution 1244).34 The river is called Buna in Albania and Bojana in Montenegro.35 The lake is called Skadar in Montenegro and Shkoder in Albania.36 Some additional hydrological information is given in the table “Characteristics of the shared water bodies”.
270 | part iv

Pressures, status and transboundary impactsThe Black Drin sub-basin, in the former Yugoslav Republic of Macedonia, is mainly covered by forests (52%) and agricultural land (16%).
The significance of the Drin River and its main tributaries in terms of hydropower production is major, especially for Alba-nia, where plants installed produce 85% of hydropower, and represent 70% of the total hydro and thermal installed capac-ity in the country. In Albania, there are 44 dams (4 for energy production and 40 for irrigation purposes). The construction of the Ashta hydropower plant began in 2009 near Skadar/Shkoder, with capacity downscaled to 40 megawatts (MW) from the original 80 MW, after consultations with Montene-gro. There are plans for the construction of an additional plant (Skavica, planned installed capacity of 350 MW), — the pro-cess for the expression of interest was initiated in 2008. Two major dams, Globochica and Spilja, exist on the Black Drin in the former Yugoslav Republic of Macedonia, with a main purpose of hydropower production. The alteration of the hy-drological characteristics of the Drin, due to dam construction, has had an impact in the distribution of sediments, and caused
disturbances to the ecosystems supported. Biological corridors that facilitate migration have been interrupted, exerting major pressure on biodiversity.
Open-cast metal (iron and nickel) mines in Albania were closed a long time ago, but the sites have not been landscaped, and tailings continue to cause heavy metal pollution (iron, copper etc.); there is no available data regarding the level of pollution.
Abstraction of groundwater in Kosovo (UN administered ter-ritory under UN Security Council resolution 1244) and waste disposal, sanitation and sewer leakage in Albania are the main pressure factors as far as Beli Drim/Drini Bardhe aquifer (No. 133) is concerned. Nitrogen, pesticides and pathogens (only locally in Albania) have been observed.
In the Black Drin sub-basin, in the former Yugoslav Republic of Macedonia, there is extensive cattle production. The inten-sive tourism around lakes Ohrid and Prespa and in the Na-tional Park Mavrovo is another pressure factor. The expected increase in water demand in the Black Drin sub-basin catch-ment area38 for drinking water, irrigation and fisheries will re-sult in increased pressure on the system.
DiSChARgeS, popuLATion AnD LAnD CoveR in The DRin RiveR BASin
1000
100
10
1
11 D
rin es
tuar
y
10 Fr
aska
njel
9 Lak
e Ska
dar o
utlet
8 Vau
i Dejë
s
7 Beli
Drin
6 Drin
i i Zi
5 Lak
e Ohr
id ou
tlet
Disc
harg
e (m
3 s-1) (
loga
rithm
ic sc
ale)
22
(Drin
)
(Boj
ana)
116
66
318
320 68
2
350
QavQmaxQmin
Popu
latio
n (in
ten t
hous
ands
)
0
20
40
60
80
100
Serb
iaM
onte
negr
ofo
rmer
Yugo
slav R
ep. o
f Mac
edon
iaGr
eece
Alba
nia
69.2
0.2
18.6
29.6
76.4
LandScanTM
1%5%
Urban/Industrial areas (<1%)Surface with little or no vegetation (<1%)
Wetlands (<1%)
CultivatedForestGrassland/ShrublandWater bodies
Others
6%
53% 35%
Water demands in the Black Drin Basin District in the former Yugoslav Republic of Macedonia (for 2008 and projection for 2020)37
yearTotal demands
×106 m3/year
population and tourists
×106 m3/yearindustry
×106 m3/yearirrigation
×106 m3/yearfisheries
×106 m3/yearminimum accepted flow ×106 m3/year
Black Drin River Basin District
2008 274.3 21.2 8.2 49.7 31.3 1642020 446.7 36.8 8.6 98.6 138.7 164
Total in the country
2008 2 227.9 218.3 274.1 899.3 202.1 6352020 3 491.3 348.3 287.0 1 806.7 414.3 635
37 Second National Communication on Climate Change. Ministry of Environment and Physical Planning, the former Yugoslav Republic of Macedonia, 2008. 38 In the former Yugoslav Republic of Macedonia, the catchment area of the Crn Drim River constitutes one of the four Basin Districts and includes in addition to
the Crn Drim also the Ohrid and Prespa sub-basins. The Crn Drim catchment area in the former Yugoslav Republic of Macedonia covers an area of 3,359 km2, or 13.1% of the total territory of the country. The average annual volume of discharged water is approximately 1.64×10⁹ m3.
Source: UNEP/DEWA/GRID-Europe 2011.Note: The map in the assessment of the Neretva should be referred to for the locations of the gauging stations.
270 | part iv Chapter 6 DRAINAGE BASIN OF THE MEDITERRANEAN SEA | 271
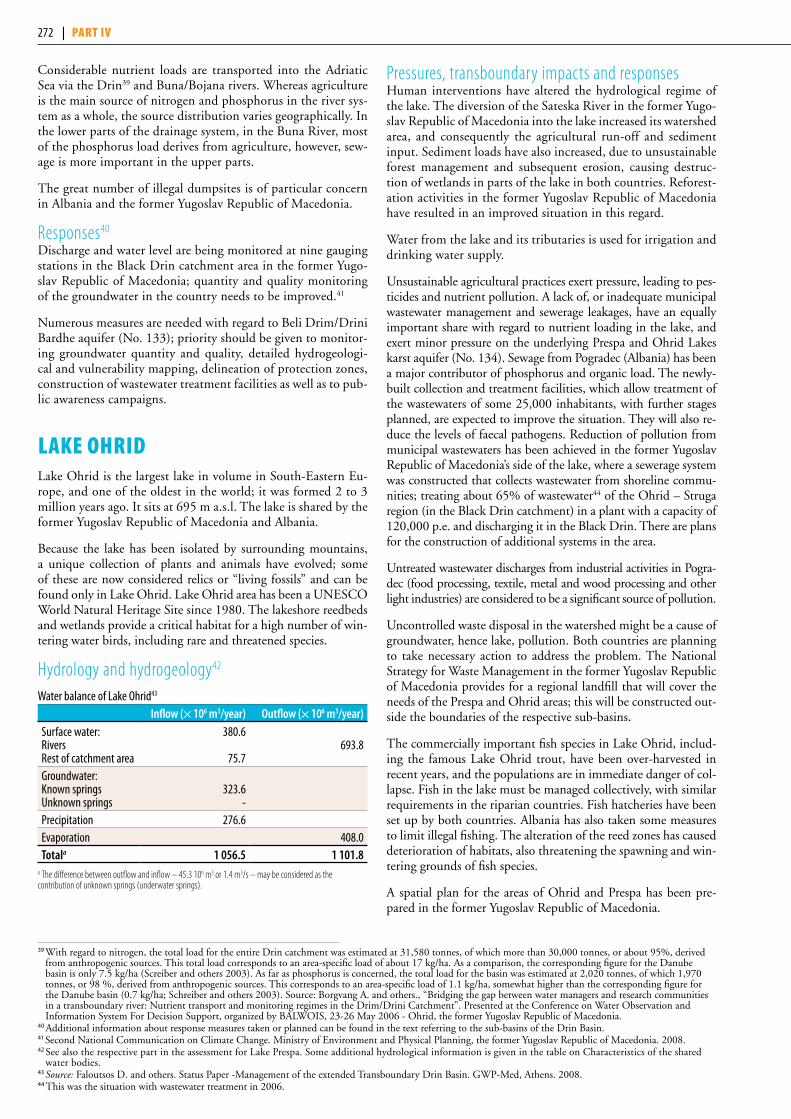
Considerable nutrient loads are transported into the Adriatic Sea via the Drin39 and Buna/Bojana rivers. Whereas agriculture is the main source of nitrogen and phosphorus in the river sys-tem as a whole, the source distribution varies geographically. In the lower parts of the drainage system, in the Buna River, most of the phosphorus load derives from agriculture, however, sew-age is more important in the upper parts.
The great number of illegal dumpsites is of particular concern in Albania and the former Yugoslav Republic of Macedonia.
Responses40
Discharge and water level are being monitored at nine gauging stations in the Black Drin catchment area in the former Yugo-slav Republic of Macedonia; quantity and quality monitoring of the groundwater in the country needs to be improved.41
Numerous measures are needed with regard to Beli Drim/Drini Bardhe aquifer (No. 133); priority should be given to monitor-ing groundwater quantity and quality, detailed hydrogeologi-cal and vulnerability mapping, delineation of protection zones, construction of wastewater treatment facilities as well as to pub-lic awareness campaigns.
Lake ohridLake Ohrid is the largest lake in volume in South-Eastern Eu-rope, and one of the oldest in the world; it was formed 2 to 3 million years ago. It sits at 695 m a.s.l. The lake is shared by the former Yugoslav Republic of Macedonia and Albania.
Because the lake has been isolated by surrounding mountains, a unique collection of plants and animals have evolved; some of these are now considered relics or “living fossils” and can be found only in Lake Ohrid. Lake Ohrid area has been a UNESCO World Natural Heritage Site since 1980. The lakeshore reedbeds and wetlands provide a critical habitat for a high number of win-tering water birds, including rare and threatened species.
Hydrology and hydrogeology42
Water balance of Lake Ohrid43
inflow (× 106 m3/year) outflow (× 106 m3/year)Surface water:RiversRest of catchment area
380.6
75.7693.8
Groundwater:Known springsUnknown springs
323.6-
Precipitation 276.6Evaporation 408.0Totala 1 056.5 1 101.8
a The difference between outflow and inflow – 45.3 106 m3 or 1.4 m3/s – may be considered as the contribution of unknown springs (underwater springs).
Pressures, transboundary impacts and responses Human interventions have altered the hydrological regime of the lake. The diversion of the Sateska River in the former Yugo-slav Republic of Macedonia into the lake increased its watershed area, and consequently the agricultural run-off and sediment input. Sediment loads have also increased, due to unsustainable forest management and subsequent erosion, causing destruc-tion of wetlands in parts of the lake in both countries. Reforest-ation activities in the former Yugoslav Republic of Macedonia have resulted in an improved situation in this regard.
Water from the lake and its tributaries is used for irrigation and drinking water supply.
Unsustainable agricultural practices exert pressure, leading to pes-ticides and nutrient pollution. A lack of, or inadequate municipal wastewater management and sewerage leakages, have an equally important share with regard to nutrient loading in the lake, and exert minor pressure on the underlying Prespa and Ohrid Lakes karst aquifer (No. 134). Sewage from Pogradec (Albania) has been a major contributor of phosphorus and organic load. The newly-built collection and treatment facilities, which allow treatment of the wastewaters of some 25,000 inhabitants, with further stages planned, are expected to improve the situation. They will also re-duce the levels of faecal pathogens. Reduction of pollution from municipal wastewaters has been achieved in the former Yugoslav Republic of Macedonia’s side of the lake, where a sewerage system was constructed that collects wastewater from shoreline commu-nities; treating about 65% of wastewater44 of the Ohrid – Struga region (in the Black Drin catchment) in a plant with a capacity of 120,000 p.e. and discharging it in the Black Drin. There are plans for the construction of additional systems in the area.
Untreated wastewater discharges from industrial activities in Pogra-dec (food processing, textile, metal and wood processing and other light industries) are considered to be a significant source of pollution.
Uncontrolled waste disposal in the watershed might be a cause of groundwater, hence lake, pollution. Both countries are planning to take necessary action to address the problem. The National Strategy for Waste Management in the former Yugoslav Republic of Macedonia provides for a regional landfill that will cover the needs of the Prespa and Ohrid areas; this will be constructed out-side the boundaries of the respective sub-basins.
The commercially important fish species in Lake Ohrid, includ-ing the famous Lake Ohrid trout, have been over-harvested in recent years, and the populations are in immediate danger of col-lapse. Fish in the lake must be managed collectively, with similar requirements in the riparian countries. Fish hatcheries have been set up by both countries. Albania has also taken some measures to limit illegal fishing. The alteration of the reed zones has caused deterioration of habitats, also threatening the spawning and win-tering grounds of fish species.
A spatial plan for the areas of Ohrid and Prespa has been pre-pared in the former Yugoslav Republic of Macedonia.
39 With regard to nitrogen, the total load for the entire Drin catchment was estimated at 31,580 tonnes, of which more than 30,000 tonnes, or about 95%, derived from anthropogenic sources. This total load corresponds to an area-specific load of about 17 kg/ha. As a comparison, the corresponding figure for the Danube basin is only 7.5 kg/ha (Screiber and others 2003). As far as phosphorus is concerned, the total load for the basin was estimated at 2,020 tonnes, of which 1,970 tonnes, or 98 %, derived from anthropogenic sources. This corresponds to an area-specific load of 1.1 kg/ha, somewhat higher than the corresponding figure for the Danube basin (0.7 kg/ha; Schreiber and others 2003). Source: Borgvang A. and others., “Bridging the gap between water managers and research communities in a transboundary river: Nutrient transport and monitoring regimes in the Drim/Drini Catchment”. Presented at the Conference on Water Observation and Information System For Decision Support, organized by BALWOIS, 23-26 May 2006 - Ohrid, the former Yugoslav Republic of Macedonia.
40 Additional information about response measures taken or planned can be found in the text referring to the sub-basins of the Drin Basin.41 Second National Communication on Climate Change. Ministry of Environment and Physical Planning, the former Yugoslav Republic of Macedonia. 2008.42 See also the respective part in the assessment for Lake Prespa. Some additional hydrological information is given in the table on Characteristics of the shared
water bodies.43 Source: Faloutsos D. and others. Status Paper -Management of the extended Transboundary Drin Basin. GWP-Med, Athens. 2008.44 This was the situation with wastewater treatment in 2006.
272 | part iv
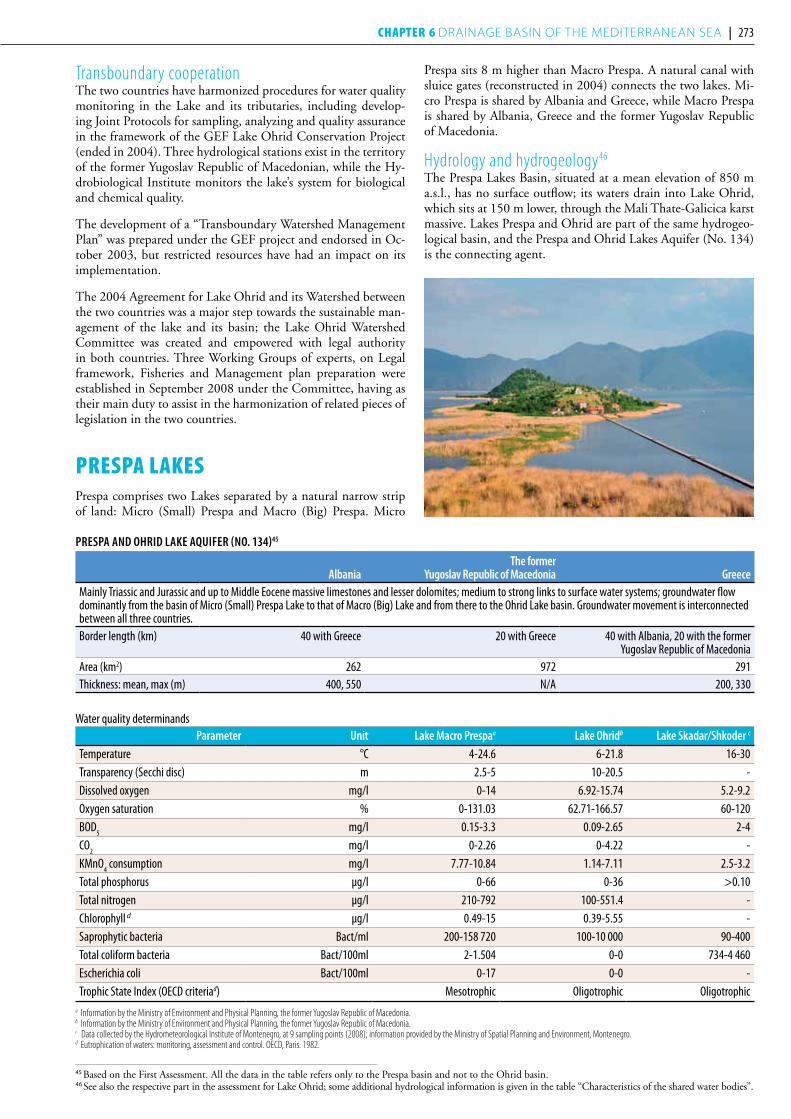
Transboundary cooperationThe two countries have harmonized procedures for water quality monitoring in the Lake and its tributaries, including develop-ing Joint Protocols for sampling, analyzing and quality assurance in the framework of the GEF Lake Ohrid Conservation Project (ended in 2004). Three hydrological stations exist in the territory of the former Yugoslav Republic of Macedonian, while the Hy-drobiological Institute monitors the lake’s system for biological and chemical quality.
The development of a “Transboundary Watershed Management Plan” was prepared under the GEF project and endorsed in Oc-tober 2003, but restricted resources have had an impact on its implementation.
The 2004 Agreement for Lake Ohrid and its Watershed between the two countries was a major step towards the sustainable man-agement of the lake and its basin; the Lake Ohrid Watershed Committee was created and empowered with legal authority in both countries. Three Working Groups of experts, on Legal framework, Fisheries and Management plan preparation were established in September 2008 under the Committee, having as their main duty to assist in the harmonization of related pieces of legislation in the two countries.
prespa LakesPrespa comprises two Lakes separated by a natural narrow strip of land: Micro (Small) Prespa and Macro (Big) Prespa. Micro
Prespa sits 8 m higher than Macro Prespa. A natural canal with sluice gates (reconstructed in 2004) connects the two lakes. Mi-cro Prespa is shared by Albania and Greece, while Macro Prespa is shared by Albania, Greece and the former Yugoslav Republic of Macedonia.
Hydrology and hydrogeology46
The Prespa Lakes Basin, situated at a mean elevation of 850 m a.s.l., has no surface outflow; its waters drain into Lake Ohrid, which sits at 150 m lower, through the Mali Thate-Galicica karst massive. Lakes Prespa and Ohrid are part of the same hydrogeo-logical basin, and the Prespa and Ohrid Lakes Aquifer (No. 134) is the connecting agent.
45 Based on the First Assessment. All the data in the table refers only to the Prespa basin and not to the Ohrid basin. 46 See also the respective part in the assessment for Lake Ohrid; some additional hydrological information is given in the table “Characteristics of the shared water bodies”.
pReSpA AnD ohRiD LAke AquifeR (no. 134)45
AlbaniaThe former
yugoslav Republic of macedonia greeceMainly Triassic and Jurassic and up to Middle Eocene massive limestones and lesser dolomites; medium to strong links to surface water systems; groundwater flow dominantly from the basin of Micro (Small) Prespa Lake to that of Macro (Big) Lake and from there to the Ohrid Lake basin. Groundwater movement is interconnected between all three countries. Border length (km) 40 with Greece 20 with Greece 40 with Albania, 20 with the former
Yugoslav Republic of MacedoniaArea (km2) 262 972 291Thickness: mean, max (m) 400, 550 N/A 200, 330
Water quality determinandsparameter unit Lake macro prespaa Lake ohridb Lake Skadar/Shkoder c
Temperature °C 4-24.6 6-21.8 16-30Transparency (Secchi disc) m 2.5-5 10-20.5 -Dissolved oxygen mg/l 0-14 6.92-15.74 5.2-9.2Oxygen saturation % 0-131.03 62.71-166.57 60-120BOD
5mg/l 0.15-3.3 0.09-2.65 2-4
CO2
mg/l 0-2.26 0-4.22 -KMnO
4 consumption mg/l 7.77-10.84 1.14-7.11 2.5-3.2
Total phosphorus µg/l 0-66 0-36 >0.10Total nitrogen µg/l 210-792 100-551.4 -Chlorophyll d µg/l 0.49-15 0.39-5.55 -Saprophytic bacteria Bact/ml 200-158 720 100-10 000 90-400Total coliform bacteria Bact/100ml 2-1.504 0-0 734-4 460Escherichia coli Bact/100ml 0-17 0-0 -Trophic State Index (OECD criteriad) Mesotrophic Oligotrophic Oligotrophic
a Information by the Ministry of Environment and Physical Planning, the former Yugoslav Republic of Macedonia.b Information by the Ministry of Environment and Physical Planning, the former Yugoslav Republic of Macedonia.c Data collected by the Hydrometeorological Institute of Montenegro, at 9 sampling points (2008); information provided by the Ministry of Spatial Planning and Environment, Montenegro.d Eutrophication of waters: monitoring, assessment and control. OECD, Paris. 1982.
272 | part iv Chapter 6 DRAINAGE BASIN OF THE MEDITERRANEAN SEA | 273
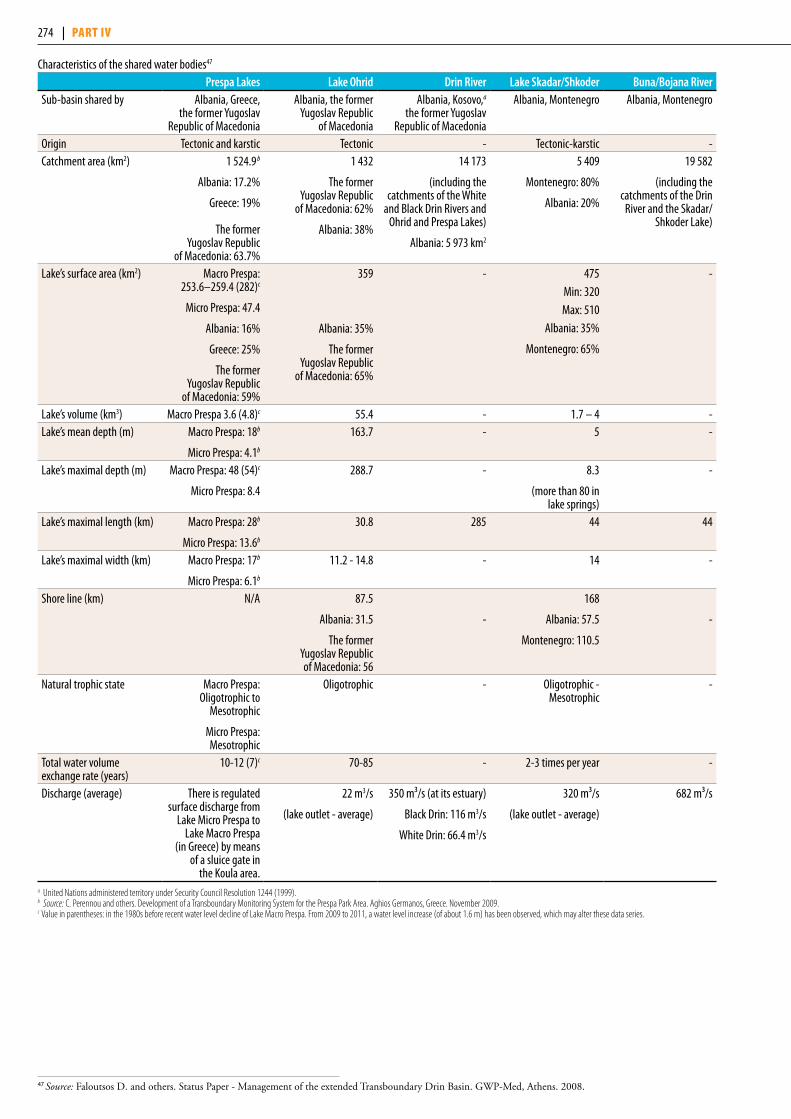
47 Source: Faloutsos D. and others. Status Paper - Management of the extended Transboundary Drin Basin. GWP-Med, Athens. 2008.
Characteristics of the shared water bodies47
prespa Lakes Lake ohrid Drin River Lake Skadar/Shkoder Buna/Bojana RiverSub-basin shared by Albania, Greece,
the former Yugoslav Republic of Macedonia
Albania, the former Yugoslav Republic
of Macedonia
Albania, Kosovo,a
the former Yugoslav Republic of Macedonia
Albania, Montenegro Albania, Montenegro
Origin Tectonic and karstic Tectonic - Tectonic-karstic -Catchment area (km2) 1 524.9b
Albania: 17.2%
Greece: 19%
The former Yugoslav Republic
of Macedonia: 63.7%
1 432
The former Yugoslav Republic
of Macedonia: 62%
Albania: 38%
14 173
(including the catchments of the White
and Black Drin Rivers and Ohrid and Prespa Lakes)
Albania: 5 973 km2
5 409
Montenegro: 80%
Albania: 20%
19 582
(including the catchments of the Drin
River and the Skadar/Shkoder Lake)
Lake’s surface area (km2) Macro Prespa: 253.6–259.4 (282)c
Micro Prespa: 47.4
Albania: 16%
Greece: 25%
The former Yugoslav Republic
of Macedonia: 59%
359
Albania: 35%
The former Yugoslav Republic
of Macedonia: 65%
- 475Min: 320Max: 510
Albania: 35%
Montenegro: 65%
-
Lake’s volume (km3) Macro Prespa 3.6 (4.8)c 55.4 - 1.7 – 4 -Lake’s mean depth (m) Macro Prespa: 18b
Micro Prespa: 4.1b
163.7 - 5 -
Lake’s maximal depth (m) Macro Prespa: 48 (54)c
Micro Prespa: 8.4
288.7 - 8.3
(more than 80 in lake springs)
-
Lake’s maximal length (km) Macro Prespa: 28b
Micro Prespa: 13.6b
30.8 285 44 44
Lake’s maximal width (km) Macro Prespa: 17b
Micro Prespa: 6.1b
11.2 - 14.8 - 14 -
Shore line (km) N/A 87.5
Albania: 31.5
The former Yugoslav Republic of Macedonia: 56
-
168
Albania: 57.5
Montenegro: 110.5
-
Natural trophic state Macro Prespa: Oligotrophic to
Mesotrophic
Micro Prespa: Mesotrophic
Oligotrophic - Oligotrophic - Mesotrophic
-
Total water volume exchange rate (years)
10-12 (7)c 70-85 - 2-3 times per year -
Discharge (average) There is regulated surface discharge from
Lake Micro Prespa to Lake Macro Prespa
(in Greece) by means of a sluice gate in
the Koula area.
22 m3/s
(lake outlet - average)
350 m³/s (at its estuary)
Black Drin: 116 m3/s
White Drin: 66.4 m3/s
320 m³/s
(lake outlet - average)
682 m³/s
a United Nations administered territory under Security Council Resolution 1244 (1999). b Source: C. Perennou and others. Development of a Transboundary Monitoring System for the Prespa Park Area. Aghios Germanos, Greece. November 2009.c Value in parentheses: in the 1980s before recent water level decline of Lake Macro Prespa. From 2009 to 2011, a water level increase (of about 1.6 m) has been observed, which may alter these data series.
274 | part iv

prespa park wetLands48
General description of the wetland The Prespa Lakes and their basin include important freshwater and shoreline ecosystems, including riverine forests and shrub formations that gradually lead up to mountain oak, beech and beech-fir forests, as well as pseudo-Alpine meadows located above the forest limit.
Main wetland ecosystem services The lakes perform important water storage, flood control and storm protection functions, and serve as a retention basin for sediments and nutrients that are utilized by wetland vegetation. Buffaloes graze on the littoral zone of Lake Micro Prespa as part of a vegetation management scheme, while a few more cattle may graze seasonally; very few cattle breeders will use wetland vegetation for fodder. However, wetland vegetation could po-tentially be used as a supplementary food source for domestic animals, but with concrete and controlled management objec-tives, for the benefit of biodiversity. Being part of a complex karst system, the lakes provide groundwater recharge, and make the local climate milder. The lakes and their aquifers provide drinking and irrigation water. The lakes are important for fish-ing and cattle grazing. The area is a well-known cultural tour-ism destination, while nature tourism is developing. The basin is recognized as an important area for environmental education and ecological, hydrological, and geological research.
Cultural values of the wetland area Besides pre-historic caves and fortifications, as well as monu-ments and artwork from the Classical, Hellenistic, Roman, and post-Byzantine periods, the region maintains a wealth of local traditions, many of which are connected with nature.
Biodiversity values of the wetland areaThe relatively uninterrupted lakes ecosystem and surrounding area support exceptionally rich biodiversity, with a large num-ber of endemic and threatened species, as well as natural habi-tats of European interest.
The isolation of the basin for millions of years has resulted in high level of endemism: more than 45 invertebrate species and 9 fish species are endemic for Prespa Lakes and their basin.
Large numbers of waterbirds use Prespa Lakes for breeding, feeding, wintering and as a stop-over site during migration. It is the most important breeding site for Dalmatian Pelican, with more than 1,100 pairs, about 18% of the world population of this vulnerable species included in the IUCN Red List.
Periodically flooded meadows, rocky and gravel shores, riv-erbanks and permanent springs provide important spawning grounds for fish.
Pressure factors and transboundary impactsA substantial decrease in Lake Macro Prespa’s water level had been observed since the late 1980s, while, since 2009, the water level of the lake has been increasing. It is assumed that the dry period after 1987, in combination with the underground out-flow to Lake Ohrid and increased water abstraction, resulted in
the decrease of the water level. This affected natural ecosystems and made shoreline areas less attractive for tourists. Combined with increased nutrients input, this has led to increased eutro-phication. The construction of irrigation systems resulted in drainage of a number of wet areas in the 1960s, mainly near Micro Prespa, and in extensive sedimentation of the lake from the 1970s onwards due to the Devolli River diversion in the Albanian part of Micro Prespa. At present, abstraction of water throughout the basin puts a pressure on natural ecosystems. Il-legal sand and gravel extraction also can affect the hydrological regime of the wetland.
Tourism and recreation need to be developed in a sustainable way, minimizing direct disturbances of the natural ecosystems and pressures through water abstraction and wastewater dis-charges, among others. Other disturbing activities are non-sustainable (including illegal) hunting and fishing, and intro-duction of alien fish species49 (e.g. Prussian Carp, Grass Carp, Eastern Mosquitofish, Silver Carp, Tench, White Amur Bream, Stone Moroko, Pumpkinseed Sunfish, Rainbow Trout, Europe-an Bitterling, Wels Catfish and Ohrid Trout) that affect native fish and invertebrate populations.
The abandoning of cattle grazing on littoral meadows has led to the loss of these important habitats, and expansion of the reed beds in Micro Prespa. Attempts to partially solve the problem by reed burning led to an additional disturbance of wetland ecosystems and carbon release into the atmosphere, but dur-ing the last decade an effective restoration and management programme by grazing and summer cutting of the reed bed veg-etation, coupled with management of the water level, has been implemented by the Society for the Protection of Prespa.
Transboundary wetland managementIn 2000, the Prime Ministers of Albania, Greece, and the for-mer Yugoslav Republic of Macedonia declared the creation of the Prespa Park, under the auspices of the Ramsar Conven-tion, upon a proposal by the Society for the Protection of Pre-spa, WWF Greece and the Mediterranean Wetlands Initiative (MedWet). This decision was followed by the establishment
48 Sources: Prespa Park Coordination Committee (www.prespapark.org); UNDP GEF Prespa Regional Project “Integrated ecosystem management in the Prespa Lakes Basin in Albania, the former Yugoslav Republic of Macedonia and Greece”; Strategic Action Plan for the Sustainable Development of the Prespa Park, Aghios Germanos. Society for the Protection of Prespa, WWF-Greece, Protection and Preservation of Natural Environment in Albania, Macedonian Alliance for Prespa.
49 Sources: Crivelli, A. J. and others. Fish and fisheries of the Prespa lakes. In Crivelli, A. J., Catsadorakis, G. (eds), Lake Prespa, Northwestern Greece: A unique Balkan wetland, Hydrobiologia 351, 107-125. 1997; A. J. Crivelli unpublished data – a report included in the programme “Design and organization of a Transboundary Monitoring System (TMS) for the Prespa Park”. December 2009.
Phot
o by T
obias
Salat
he
274 | part iv Chapter 6 DRAINAGE BASIN OF THE MEDITERRANEAN SEA | 275
of the trilateral Prespa Park Coordination Committee. Since 2006, transboundary cooperation is enhanced through the project “Integrated ecosystem management in the Prespa Lakes Basin in Albania, the former Yugoslav Republic of Macedonia and Greece”, financially supported by the GEF. A number of parallel projects are supported by UNDP, German Develop-ment Bank (KfW), Swiss Development and Cooperation Agen-cy, Swedish International Development Cooperation Agency, NGOs and the three national Governments.
In 2010, the Environment Ministers of the three countries and the EU Environment Commissioner signed an Agreement on the Protection and Sustainable Development of the Prespa Park Area that sets out detailed principles and mechanisms of trans-boundary cooperation. The priority issue for transboundary cooperation is water resources management at basin level, in accordance with the WFD and with the aim of maintaining wa-ter-dependent ecosystem values, and satisfying needs for drink-ing and irrigation water. A transboundary monitoring system
in the Prespa Basin is under development; sustainable fishery and tourism, biodiversity and hydrogeology studies, the man-agement of protected areas, education and public awareness on the Prespa Lakes wetlands are also addressed at transboundary and national level.
In all three countries, lake, shoreline and forest areas have the status of nationally-protected areas. In Albania, Prespa National Park (27,750 ha) covers the whole Albanian catchment. Two park information centers are located in the villages of Gorice Vogel and Zagradec. In Greece, the Prespa National Park (32,700 ha) was designated in July 2009 including Ramsar Site Lake Micro Prespa (5,078 ha) and Natura 2000 sites. Three information centers operate in the area. In the former Yugoslav Republic of Macedonia, Lake Prespa is designated as natural monument and Ramsar Site (18,920 ha), which includes Strict Nature Reserve Ezerani (2,080 ha). Additionally, large parts of Galicica National Park and Pelister National Park are found within the Prespa Basin.
Lake skadar/shkoderLake Skadar/Shkoder is the largest lake by surface in the Balkan Peninsula, and sits at 6 m a.s.l. in the karst terrain of the south-eastern Dinaric Alps.
Hydrology and hydrogeologyThe lake discharges through the 44 km long Buna/Bojana River (shared by Albania and Montenegro) into the Adriatic Sea. The connection between Drin River, Buna/Bojana River and Skadar/Shkoder Lake determines the seasonal variations in the state and characteristics of the lake, as well as the Buna/Bojana and the tributaries in their catchment area, and has an important impact on the morphology of the Buna/Bojana delta. The hydrological regime is conditioned, among others, by water releases from big hydro-power dams in the Drin River in Albania.
The Buna/Bojana bed is lower than sea level (“crypto depres-sion”), resulting in saltwater intruding into the lake’s outlet.
Pressures, status, transboundary impacts and responsesIn the Montenegrin part, arable land makes up 40%, and pas-tures 10% of the basin. In the Albanian part, 13% of the land is used for agricultural activities, while 64% is forests, pastures and abandoned land.
Agricultural as well as industrial pollution (heavy industries in the Montenegrin side are also significant water consumers),
and pollution from municipal wastewater, reach the lake both through surface and groundwater (due to the karstic geology). Due to the nutrient loading, the lake has eutrophied slightly. In-adequate solid waste management in both countries and illegal disposal of wastes directly to the water bodies has exerted pres-sure on the lake’s system. Wastewater collection and treatment fa-cilities that are currently being constructed in the Albanian side, the reconstruction of existing facilities in Montenegro (in Pod-gorica), as well as the construction of solid waste management facilities in both countries, are expected to improve the situation. Heavy metal pollution, especially in lake sediments, and moder-ate pathogen loads have been observed locally in the aquifer. The Drin contributes to some extent, with trace metals originating from the disposal of by-products from iron and copper mines located upstream.
Unsustainable forest management in the Albanian side and sub-sequent erosion as well as illegal construction, has led to the de-terioration of shoreline habitats.
In general, the quality of the lake’s water is considered to be rea-sonably good, due to the high renewal rate (2-3 times per year), the inaccessibility of the higher parts of the catchment, and the sharp reduction in inflowing industrial effluents and agricultural run-off. The Buna/Bojana’s water quality also seems to be in the same generally good condition.
Total biodiversity is high, and the region is considered to be a biogenetic reserve of European importance. The large, geograph-
SkADAR/ShkoDeR LAke, DinARiC eAST CoAST AquifeR (no. 135)50
Albania montenegroType 2; Jurassic, Cretaceous and lesser Palaeogene massive and stratified limestones and dolomites; groundwater flow in both directions; strong links to surface water systemsArea (km2) ~ 450 ~ 460 (karstic aquifer)
~ 200 (shallow aquifer in Zeta Plain)Thickness: mean, max (m) 150-500, 300-1 000, alluvial fans along
the lake up to 80-100 m thick.150-500, 300-1 000, alluvial fans along
the lake up to 80-100 m thick.Groundwater uses and functions 50-75% for irrigation, <25% for drinking water
supply, industry and livestock, also maintaining baseflow and support for ecosystems. Groundwater
covers 80-90% of total water use.
25-50% for drinking water supply, <25% for irrigation, industry and livestock. Groundwater
covers 100% of total water use.
Other information Border length 35 km (excluding the lake border). Border length 35 km (excluding the lake border).
50 Based on information from Montenegro and the First Assessment.
276 | part iv
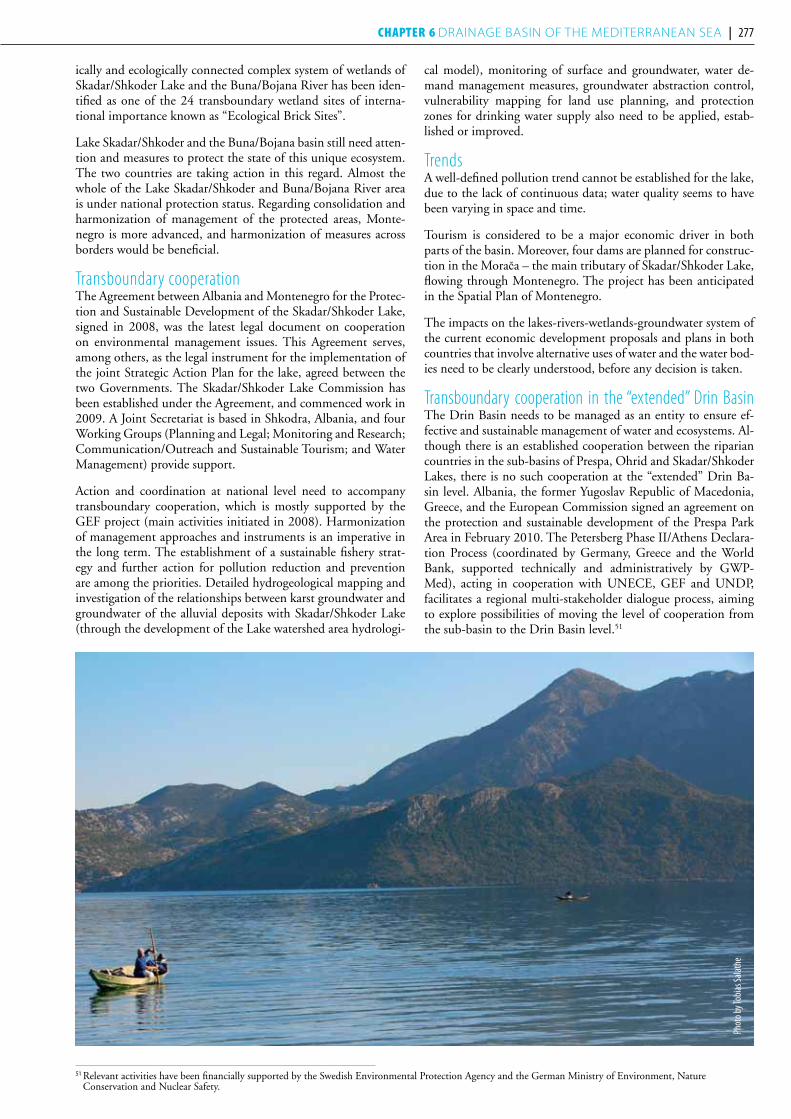
ically and ecologically connected complex system of wetlands of Skadar/Shkoder Lake and the Buna/Bojana River has been iden-tified as one of the 24 transboundary wetland sites of interna-tional importance known as “Ecological Brick Sites”.
Lake Skadar/Shkoder and the Buna/Bojana basin still need atten-tion and measures to protect the state of this unique ecosystem. The two countries are taking action in this regard. Almost the whole of the Lake Skadar/Shkoder and Buna/Bojana River area is under national protection status. Regarding consolidation and harmonization of management of the protected areas, Monte-negro is more advanced, and harmonization of measures across borders would be beneficial.
Transboundary cooperationThe Agreement between Albania and Montenegro for the Protec-tion and Sustainable Development of the Skadar/Shkoder Lake, signed in 2008, was the latest legal document on cooperation on environmental management issues. This Agreement serves, among others, as the legal instrument for the implementation of the joint Strategic Action Plan for the lake, agreed between the two Governments. The Skadar/Shkoder Lake Commission has been established under the Agreement, and commenced work in 2009. A Joint Secretariat is based in Shkodra, Albania, and four Working Groups (Planning and Legal; Monitoring and Research; Communication/Outreach and Sustainable Tourism; and Water Management) provide support.
Action and coordination at national level need to accompany transboundary cooperation, which is mostly supported by the GEF project (main activities initiated in 2008). Harmonization of management approaches and instruments is an imperative in the long term. The establishment of a sustainable fishery strat-egy and further action for pollution reduction and prevention are among the priorities. Detailed hydrogeological mapping and investigation of the relationships between karst groundwater and groundwater of the alluvial deposits with Skadar/Shkoder Lake (through the development of the Lake watershed area hydrologi-
cal model), monitoring of surface and groundwater, water de-mand management measures, groundwater abstraction control, vulnerability mapping for land use planning, and protection zones for drinking water supply also need to be applied, estab-lished or improved.
TrendsA well-defined pollution trend cannot be established for the lake, due to the lack of continuous data; water quality seems to have been varying in space and time.
Tourism is considered to be a major economic driver in both parts of the basin. Moreover, four dams are planned for construc-tion in the Morača – the main tributary of Skadar/Shkoder Lake, flowing through Montenegro. The project has been anticipated in the Spatial Plan of Montenegro.
The impacts on the lakes-rivers-wetlands-groundwater system of the current economic development proposals and plans in both countries that involve alternative uses of water and the water bod-ies need to be clearly understood, before any decision is taken.
Transboundary cooperation in the “extended” Drin Basin The Drin Basin needs to be managed as an entity to ensure ef-fective and sustainable management of water and ecosystems. Al-though there is an established cooperation between the riparian countries in the sub-basins of Prespa, Ohrid and Skadar/Shkoder Lakes, there is no such cooperation at the “extended” Drin Ba-sin level. Albania, the former Yugoslav Republic of Macedonia, Greece, and the European Commission signed an agreement on the protection and sustainable development of the Prespa Park Area in February 2010. The Petersberg Phase II/Athens Declara-tion Process (coordinated by Germany, Greece and the World Bank, supported technically and administratively by GWP-Med), acting in cooperation with UNECE, GEF and UNDP, facilitates a regional multi-stakeholder dialogue process, aiming to explore possibilities of moving the level of cooperation from the sub-basin to the Drin Basin level.51
51 Relevant activities have been financially supported by the Swedish Environmental Protection Agency and the German Ministry of Environment, Nature Conservation and Nuclear Safety.
Phot
o by T
obias
Salat
he
276 | part iv Chapter 6 DRAINAGE BASIN OF THE MEDITERRANEAN SEA | 277

Lake skadar/shkoder and river Buna/Bojana ramsar sites52
General description of the wetland The Skadar/Shkoder Lake and Buna/Bojana River system, with its delta area on the Adriatic Sea, contains important ecosys-tems with fresh and brackish water, and a variety of natural and human-made coastal habitats, including floodplain forests, freshwater marshes, extensive reed beds, sand dunes, karst for-mations, calcareous rocks, wet pastures, ponds, and irrigated lands. The Buna/Bojana River mouth represents a rare example of a natural delta on the East Adriatic coast.
Main wetland ecosystem servicesThe wetland is important for water retention and flood con-trol for a wide area around lake Skadar/Shkoder and along the Buna/Bojana and Lower Drin Rivers floodplains. The presence of large water bodies and vast floodplain forest significantly humidifies the regional climate, thus mitigating Mediterrane-an summer droughts. The large amounts of sediments carried by the Drin and Buna Rivers support the stabilization of the Adriatic shoreline, and prevent the salinization of the coastal aquifers and agricultural lands, provided that human interven-tions allow the continued functioning of these natural dynam-ics. The wetland is also used for fishing, and, to some extent, for hunting, and provides essential support for agriculture and livestock rearing on temporarily flooded grasslands. Peat, sand, and gravel are exploited along the lake and river shores. Lei-sure activities for urban dwellers from Podgorica (the capital of Montenegro) and Shkodra (Albania), as well as beach, natural, village and cultural tourism are developing rapidly in the area.
Biodiversity values of the wetland area The temporally inundated floodplains and the shallow water zones of lake Skadar/Shkoder and along the lower part of Buna/Bojana River in particular provide unique habitats for a rich bio-diversity in the near Adriatic part of South-Eastern Europe. A significant number of threatened species at national, European and global level depend on this wetland ecosystem.
Important migration routes, especially of fish and birds, pass through the wetland area. For waterbirds the wetland area is also important as a breeding and wintering site. Floating islands with colonies of cormorants, herons and pelicans are unique in Europe. A breeding colony of Dalmatian Pelican, a globally threatened spe-cies, exists on Lake Skadar/Shkoder, one of only a handful of such colonies in South-Eastern Europe. Other important numbers of wetland birds include ducks, geese, waders, gulls, birds of prey, owls and passerines. The number of wintering waterbirds on the Albanian side only reaches 24,000 – 30,000 individuals.
The globally-threatened Common Sturgeon, Stellate Sturgeon, and Adriatic Sturgeon, as well as other migratory fish, use the Buna/Bojana River to forage and spawn upstream. Coastal bays and lagoons, in particular the largest, near Velipoja in Alba-nia, are crucial as spawning and nursery areas for a number of commercially-important fish species.
Pressure factors and transboundary impactsThe most significant pressures on the wetland ecosystems are listed in the assessment text on Lake Skadar/Shkoder.
The expansion of agricultural lands, at the expense of natural wetland and forest habitats, took place mainly in 1950-1960, and led to loss, degradation, and fragmentation of habitats, as well as a decrease of biodiversity. Nowadays, the expansion of tourism areas and related infrastructure, combined with signifi-cantly increasing disturbance from visitors, and boat and car traffic (including off-road), represent a threat, especially for at-tractive, and at the same time sensitive, coastal habitats. The development of urban settlements, roads, agriculture, tourism, and industry in the catchment basin, with the associated in-creased abstraction of water, provides additional pressures on the downstream wetland ecosystems.
Several hydroelectric plants built on the River Drin during the last 30-40 years have reduced the sediment flow to the Buna/Bojana River. This has led to increased coastal erosion, and the continuous loss of coastal land areas. A plan to construct dams on the Morača River – the main tributary of Skadar/Shkoder Lake, flowing through Montenegro – is likely to also have sig-nificant impacts on the water level of Skadar/Shkoder Lake.
In addition to non-sustainable levels and means (explosive) of fishing, the populations of some introduced non-native fish, like Goldfish, European Perch, and Topmouth Gudgeon, had negative impacts on the population of the native fish species, such as cyprinids, and especially the commercially-important wild Carp. Wood harvesting and the expansion of pastures con-tribute to continued deforestation.
The low level of public awareness about environmental issues is a specific problem, resulting in the lack of appreciation of the ecosystem services and natural values.
Transboundary wetland managementThe lake, including a narrow strip of its shoreline, has a specific legal protection status in both countries, and was designated as a Ramsar Site. Also, on the Albanian side, the outflowing river Buna/Bojana (forming the border with Montenegro in its lower course), its delta and coastal areas, as well as the adjacent part of the Adriatic coast, have national protection status, and are included in the Ramsar List.
The Albanian Lake Shkodra and River Buna (49,562 ha) Ramsar Site includes a number of nationally-protected areas beyond Shkoder Lake and the Buna River and its delta, no-tably Velipoja beach, Domni marsh, Viluni lagoon, Rrenci mountain, and Velipoja forest. The Montenegrin Ramsar Site (20,000 ha) coincides with National Park Skadarsko Jezero, including some strictly protected areas (permanent ornitho-logical reserves of scientific importance). The National Park has three visitor’s centers in the villages of Vranjina, Mirići and Rijeka Crnojevića.
Environmental protection and sustainable development issues are included in a number of on-going transboundary Albani-an-Montenegrin initiatives on Skadar/Shkoder Lake, includ-ing the Lake Skadar/Shkodra Integrated Ecosystem Manage-ment Project, financially supported by the GEF. The Concept on Cross-Border Development of the lake Skadar/Shkoder area has been prepared by GTZ Albania and Montenegro in the GTZ project “Cross-boundary spatial planning Lake Skadar/Shkoder region, Albania and Montenegro”, which has been implemented since 2006.
52 Sources: Information Sheets on Ramsar Wetlands (RIS). Skadar Lake Concept on Cross-Border Development – a spatial perspective; prepared by GTZ (Deutsche Gesellschaft für Technische Zusammenarbeit GmbH, project offices in Albania and Montenegro). Podgorica 2007.
278 | part iv

nemeChkA/vjoSA-pogoni AquifeR (no. 136)55
Albania greeceType 1; succession of large anticlines containing karstic limestones of mainly Jurassic and Cretaceous age and synclines with formations of Palaeocene and Eocene flysch. The complicated geological structures and hydrogeological conditions which bring these formations together produce large karst springs; groundwater discharges towards both countries. The links to surface waters are weak.Area (km2) 550 370Thickness: mean, max (m) 2 500, 4 000 100, 150Groundwater uses and functions 25-50% irrigation, <25% each for drinking water
supply, livestock and industry, maintaining baseflow and springs and supporting ecosystems.
25-50% irrigation, <25% each for drinking water supply and livestock, maintaining baseflow
and springs and supporting ecosystems.Pressure factors Minor waste disposal and sewer leakage result in
local and moderate pathogen occurrence.Agriculture; pumping lifts have increased
locally; sulphate concentrations of 300-800 mg/l observed in many of the springs.
Groundwater management Need to be applied: detailed hydrogeological and vulnerability mapping, groundwater monitoring, public awareness,
delineation of protection zones and wastewater treatment.
Existing monitoring needs improvement.
Other information Border length 37 km. Large karst groundwater quantities (average about 8 m3/s) discharge into the Vjosa River gorge in Albanian territory. There are also other large
karst springs; the Glina sulphate spring is a well-known karst spring for bottled water. The aquifer is not at risk.
Border length 37 km. Large spring discharges of Kalama, Gormou and Drinou
aoos/vjosa river Basin53
The Aoos/Vjosa River54 basin is shared by Greece and Albania.
Basin of the Aoos/Vjosa River Country Area in the country (km2) Country’s share (%)Albania 4 365 67Greece 2 154 33Total 5 613
Hydrology and hydrogeologyThe 260-km long Aoos/Vjosa River (70 km in Greece) has its source in the Northern Pindos Mountains, and ends in the Adriatic Sea (Mediterranean Sea). The basin has a pronounced mountainous character, with an average elevation of about 885 m a.s.l.
Major transboundary tributaries include the rivers Saranta-poros (870 km2) and Voidomatis (384 km2).
PressuresIn Greece, the Aoos Springs Hydroelectric Dam was built on the river.
Of the basin area, 47% is covered with forests. Other forms of land use include: cropland (3.5%), grassland (13.6%), barren (6.4%) and shrubs (29.5%). In Greece, the Aoos is part of the Vikos-Aoos National Park, a Natura 2000 site.
The main pressures result from agricultural activities, animal production and aquaculture.
Pumping lifts have increased locally in Greece, where agricul-tural activities exert pressure on the Nemechka/Vjosa-Pogoni aquifer (No. 136). There have been sulphate concentrations of 300-800 mg/l observed in many of the springs. In Albania, mi-nor waste disposal and sewer leakages result in local and moder-ate pathogen occurrence in the aquifer.
Transboundary cooperation and responsesAn agreement concluded between Albania and Greece, which entered into force in 2005, provides for the establishment of
a Permanent Greek-Albanian Commission on transboundary freshwater issues. The specific tasks of the Commission include setting joint water-quality objectives and criteria, drafting pro-posals for relevant measures to achieve the water-quality ob-jectives, and organizing and promoting national networks for water-quality monitoring.
In Greece, implementation of the WFD is in progress. Existing awareness and monitoring need improvement with regard to the aquifer; other measures need to be applied, or are planned, according to WFD requirements. No management measures are yet used in Albania for the aquifer, but a range of measures need to be applied.
TrendsThe river has a “very good water quality”, which is appropriate for all uses in the basin. Nevertheless, an integrated approach of all environmental, social, economic and technical aspects of water resources management is needed in order to ensure water preservation and environmental integrity in the region.
Local and moderate degradation of ecosystems supported by the Nemechka/Vjosa-Pogoni aquifer (No. 136) has been ob-served in Albania, and related to issues linked to groundwater quantity. The aquifer, however, is not at risk since population is small and industry is not developed.
53 Based on the First Assessment.54 The river is known as Aoos in Greece and Vjosa in Albania.55 Based on the First Assessment.
278 | part iv Chapter 6 DRAINAGE BASIN OF THE MEDITERRANEAN SEA | 279
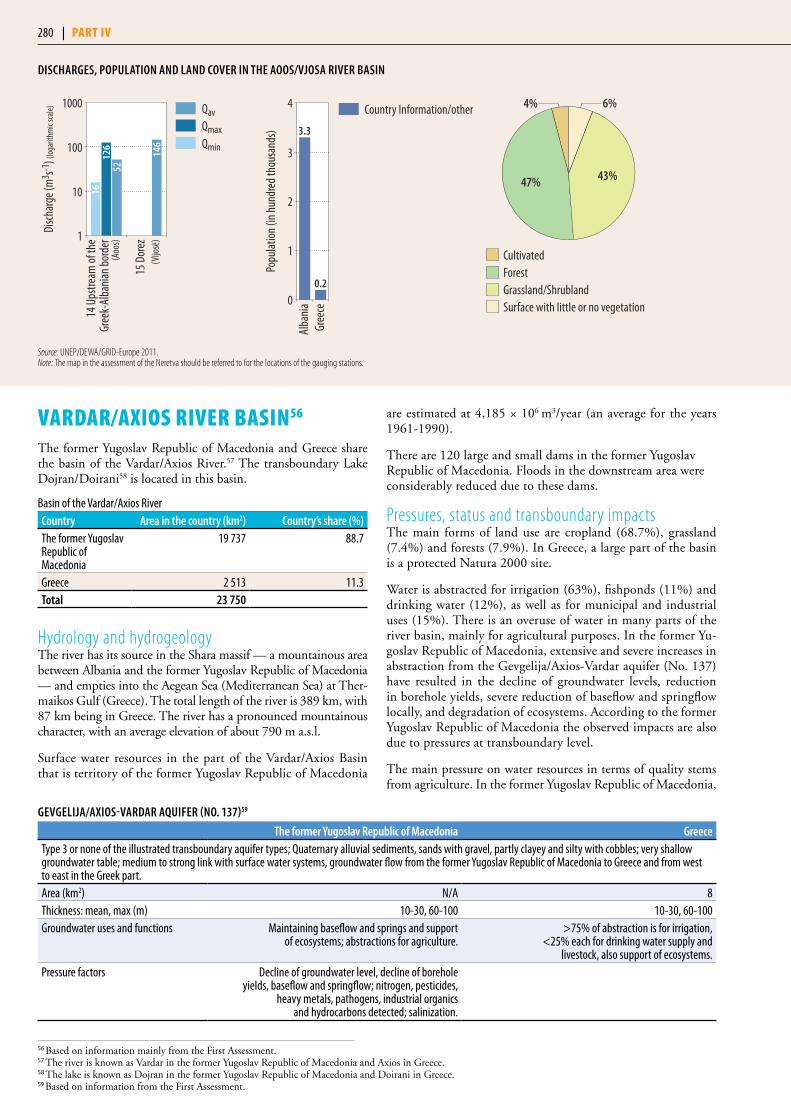
15 D
orez
14 U
pstre
am of
the
Gree
k-Al
bani
an bo
rder
Disc
harg
e (m
3 s-1) (
loga
rithm
ic sc
ale)
126
52(A
oos)
(Vijo
së)1
10
100
100016
146
QavQmaxQmin
Popu
lation
(in h
undr
ed th
ousa
nds)
0
1
2
3
4
Gree
ceAl
bania
0.2
3.3
Country Information/other 4% 6%
CultivatedForestGrassland/ShrublandSurface with little or no vegetation
47% 43%
DiSChARgeS, popuLATion AnD LAnD CoveR in The AooS/vjoSA RiveR BASin
Source: UNEP/DEWA/GRID-Europe 2011.Note: The map in the assessment of the Neretva should be referred to for the locations of the gauging stations.
vardar/axios river Basin56
The former Yugoslav Republic of Macedonia and Greece share the basin of the Vardar/Axios River.57 The transboundary Lake Dojran/Doirani58 is located in this basin.
Basin of the Vardar/Axios RiverCountry Area in the country (km2) Country’s share (%)The former Yugoslav Republic of Macedonia
19 737 88.7
Greece 2 513 11.3Total 23 750
Hydrology and hydrogeologyThe river has its source in the Shara massif — a mountainous area between Albania and the former Yugoslav Republic of Macedonia — and empties into the Aegean Sea (Mediterranean Sea) at Ther-maikos Gulf (Greece). The total length of the river is 389 km, with 87 km being in Greece. The river has a pronounced mountainous character, with an average elevation of about 790 m a.s.l.
Surface water resources in the part of the Vardar/Axios Basin that is territory of the former Yugoslav Republic of Macedonia
are estimated at 4,185 × 106 m3/year (an average for the years 1961-1990).
There are 120 large and small dams in the former Yugoslav Republic of Macedonia. Floods in the downstream area were considerably reduced due to these dams.
Pressures, status and transboundary impactsThe main forms of land use are cropland (68.7%), grassland (7.4%) and forests (7.9%). In Greece, a large part of the basin is a protected Natura 2000 site.
Water is abstracted for irrigation (63%), fishponds (11%) and drinking water (12%), as well as for municipal and industrial uses (15%). There is an overuse of water in many parts of the river basin, mainly for agricultural purposes. In the former Yu-goslav Republic of Macedonia, extensive and severe increases in abstraction from the Gevgelija/Axios-Vardar aquifer (No. 137) have resulted in the decline of groundwater levels, reduction in borehole yields, severe reduction of baseflow and springflow locally, and degradation of ecosystems. According to the former Yugoslav Republic of Macedonia the observed impacts are also due to pressures at transboundary level.
The main pressure on water resources in terms of quality stems from agriculture. In the former Yugoslav Republic of Macedonia,
gevgeLijA/AxioS-vARDAR AquifeR (no. 137)59
The former yugoslav Republic of macedonia greeceType 3 or none of the illustrated transboundary aquifer types; Quaternary alluvial sediments, sands with gravel, partly clayey and silty with cobbles; very shallow groundwater table; medium to strong link with surface water systems, groundwater flow from the former Yugoslav Republic of Macedonia to Greece and from west to east in the Greek part.Area (km2) N/A 8Thickness: mean, max (m) 10-30, 60-100 10-30, 60-100Groundwater uses and functions Maintaining baseflow and springs and support
of ecosystems; abstractions for agriculture.>75% of abstraction is for irrigation,
<25% each for drinking water supply and livestock, also support of ecosystems.
Pressure factors Decline of groundwater level, decline of borehole yields, baseflow and springflow; nitrogen, pesticides,
heavy metals, pathogens, industrial organics and hydrocarbons detected; salinization.
56 Based on information mainly from the First Assessment.57 The river is known as Vardar in the former Yugoslav Republic of Macedonia and Axios in Greece.58 The lake is known as Dojran in the former Yugoslav Republic of Macedonia and Doirani in Greece.59 Based on information from the First Assessment.
280 | part iv
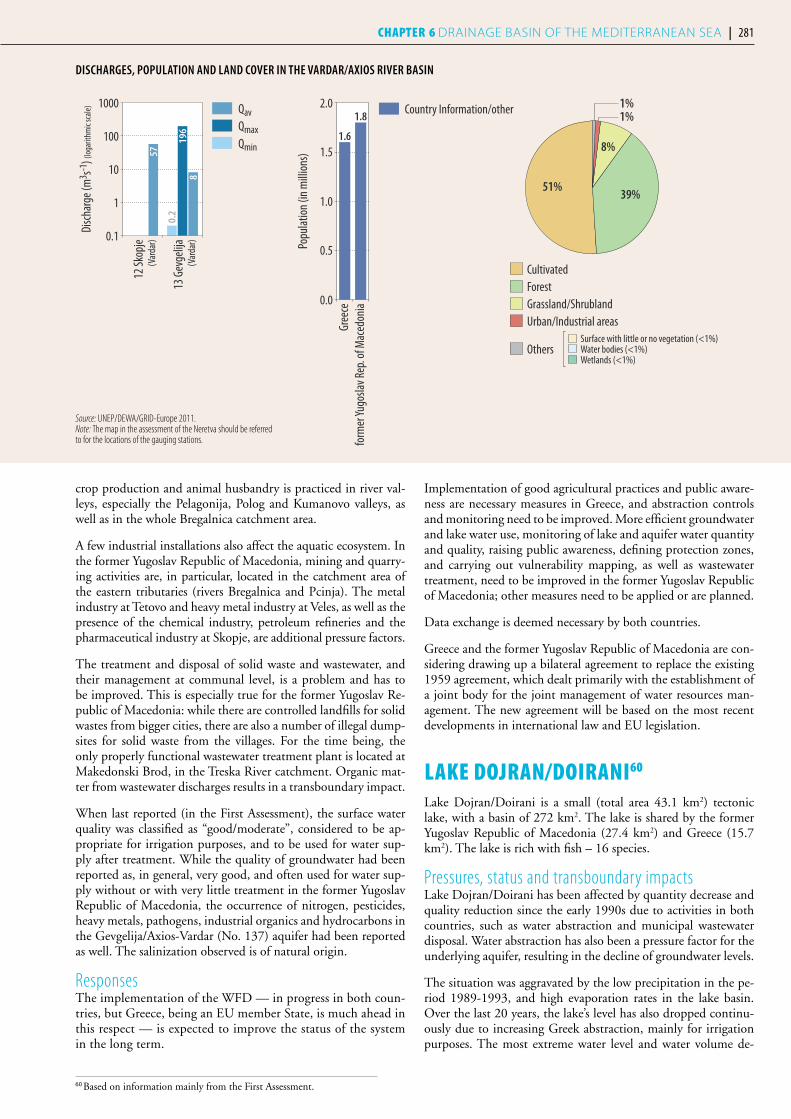
DiSChARgeS, popuLATion AnD LAnD CoveR in The vARDAR/AxioS RiveR BASin
1%1%
Surface with little or no vegetation (<1%)Water bodies (<1%)Wetlands (<1%)
CultivatedForestGrassland/ShrublandUrban/Industrial areas
Others
51%39%
8%
13 G
evge
lija
12 Sk
opje
Disc
harg
e (m
3 s-1) (
loga
rithm
ic sc
ale)
196
0.2
8
57(V
arda
r)
(Var
dar)0.1
1
10
100
1000 QavQmaxQmin
Popu
lation
(in m
illion
s)0.0
0.5
1.0
1.5
2.0
form
er Yu
gosla
v Rep
. of M
aced
onia
Gree
ce
1.8
1.6
Country Information/other
crop production and animal husbandry is practiced in river val-leys, especially the Pelagonija, Polog and Kumanovo valleys, as well as in the whole Bregalnica catchment area.
A few industrial installations also affect the aquatic ecosystem. In the former Yugoslav Republic of Macedonia, mining and quarry-ing activities are, in particular, located in the catchment area of the eastern tributaries (rivers Bregalnica and Pcinja). The metal industry at Tetovo and heavy metal industry at Veles, as well as the presence of the chemical industry, petroleum refineries and the pharmaceutical industry at Skopje, are additional pressure factors.
The treatment and disposal of solid waste and wastewater, and their management at communal level, is a problem and has to be improved. This is especially true for the former Yugoslav Re-public of Macedonia: while there are controlled landfills for solid wastes from bigger cities, there are also a number of illegal dump-sites for solid waste from the villages. For the time being, the only properly functional wastewater treatment plant is located at Makedonski Brod, in the Treska River catchment. Organic mat-ter from wastewater discharges results in a transboundary impact.
When last reported (in the First Assessment), the surface water quality was classified as “good/moderate”, considered to be ap-propriate for irrigation purposes, and to be used for water sup-ply after treatment. While the quality of groundwater had been reported as, in general, very good, and often used for water sup-ply without or with very little treatment in the former Yugoslav Republic of Macedonia, the occurrence of nitrogen, pesticides, heavy metals, pathogens, industrial organics and hydrocarbons in the Gevgelija/Axios-Vardar (No. 137) aquifer had been reported as well. The salinization observed is of natural origin.
ResponsesThe implementation of the WFD — in progress in both coun-tries, but Greece, being an EU member State, is much ahead in this respect — is expected to improve the status of the system in the long term.
Implementation of good agricultural practices and public aware-ness are necessary measures in Greece, and abstraction controls and monitoring need to be improved. More efficient groundwater and lake water use, monitoring of lake and aquifer water quantity and quality, raising public awareness, defining protection zones, and carrying out vulnerability mapping, as well as wastewater treatment, need to be improved in the former Yugoslav Republic of Macedonia; other measures need to be applied or are planned.
Data exchange is deemed necessary by both countries.
Greece and the former Yugoslav Republic of Macedonia are con-sidering drawing up a bilateral agreement to replace the existing 1959 agreement, which dealt primarily with the establishment of a joint body for the joint management of water resources man-agement. The new agreement will be based on the most recent developments in international law and EU legislation.
Lake dojran/doirani60
Lake Dojran/Doirani is a small (total area 43.1 km2) tectonic lake, with a basin of 272 km2. The lake is shared by the former Yugoslav Republic of Macedonia (27.4 km2) and Greece (15.7 km2). The lake is rich with fish – 16 species.
Pressures, status and transboundary impactsLake Dojran/Doirani has been affected by quantity decrease and quality reduction since the early 1990s due to activities in both countries, such as water abstraction and municipal wastewater disposal. Water abstraction has also been a pressure factor for the underlying aquifer, resulting in the decline of groundwater levels.
The situation was aggravated by the low precipitation in the pe-riod 1989-1993, and high evaporation rates in the lake basin. Over the last 20 years, the lake’s level has also dropped continu-ously due to increasing Greek abstraction, mainly for irrigation purposes. The most extreme water level and water volume de-
60 Based on information mainly from the First Assessment.
Source: UNEP/DEWA/GRID-Europe 2011.Note: The map in the assessment of the Neretva should be referred to for the locations of the gauging stations.
280 | part iv Chapter 6 DRAINAGE BASIN OF THE MEDITERRANEAN SEA | 281
crease have occurred since 1988; from 262 × 106 m3 in 1988, the volume decreased to 80 × 106m3 in 2000.
Pollution is caused by municipal wastewater, municipal solid wastes, sewage from tourist facilities, and agricultural point source and non–point source pollution; its impacts are felt in both countries.
Water quality is characterized by high alkalinity and elevated car-bonate and magnesium hardness. Additionally, concentrations of certain toxic substances are near or even beyond toxic levels. In Greece, there are high values of phosphates; low concentrations of heavy metals have been observed in the aquifer.
In recent years, the lake has been struggling for survival. Since 1988, because of the decrease in water level and volume, accord-ing to biologists over 140 species of flora and fauna have disap-peared. The water level has dropped 1.5 m below its permitted hydro-biological minimum.
Responses62
The lake, in the former Yugoslav Republic of Macedonia, is be-ing recharged by water coming from the Gjavato wells through a pumping and transfer system that has a capacity of 1 m3/s; the “Feasibility study on Dojran lake salvation” project was financed by the Ministry of Environment and Physical Planning and the Ministry of Agriculture, Forestry and Water Economy in 2001.
struma/strymonas river Basin63
The basin of the Struma/Strymonas64 River is typically considered to be shared by Bulgaria and Greece; the shares of Serbia and the former Yugoslav Republic of Macedonia in the total basin area are small. The river has its source in western Bulgaria (Vitosha Mountain, south of Sofia) and ends in the Aegean Sea (Strymonikos Gulf – Greece).
Basin of the Struma/Strymonas River Country Area in the country (km2) Country’s share (%)Bulgaria 8 545 46.6Greece 7 282 39.7Serbia 865 4.7The former Yugoslav Republic of Macedonia
1 648 9.0
Total 18 340
Hydrology and hydrogeologyThe total length of the river is 400 km, with its last 110 km flow-ing through Greece. Major transboundary tributaries include the following rivers: Butkovas, Exavis, Krousovitis, Xiropota-mos, and Aggitis, shared by Bulgaria and Greece; Dragovishtitsa, shared by Serbia and Bulgaria; Lebnitsa, and Strumica/Strumesh-nitsa shared by the former Yugoslav Republic of Macedonia and Bulgaria.
The basin has a pronounced mountainous character, with an av-erage elevation of about 900 m a.s.l.
There are about 60 artificial lakes in the Bulgarian part of the riv-er basin, used for water supply, power generation and irrigation purposes. The Kerkini Reservoir in Greece was created with the construction of a levee in 1933 for regulating the river discharges, for irrigation purposes, and flood protection (a new levee was constructed in 1982). The Kerkini Reservoir was finally devel-oped into an important wetland, protected under the Ramsar Convention. In Greece, irrigation dams also exist at Lefkogeia and Katafyto. The Lisina Reservoir on the Dragovishtitsa River in Serbia is a part of the Vlasina hydropower production system.
There is a high risk of flooding in Bulgaria due to the basin’s geomorphological and hydrological characteristics. Bulgaria re-ported that climate change over the last 20 years has resulted in an approximately 30% decrease in precipitation and a sub-sequent decrease in water resources in the basin65; provisions to address the decrease of water resources will be included in the programme of measures of the RBMP.
In the part of the basin that is Bulgaria’s territory, surface water resources are estimated at 1,961 × 106 m3/year (average for the years 1980-2004) and groundwater resources at some 200 × 106 m3/year (average for the years 1980-2004), adding up to a total of 2,160 × 106 m3/year (4,435 m3/year).
Two transboundary aquifers were identified as hydraulically linked to the surface water system and included in the first as-sessment: the Sandansky – Petrich aquifer (No. 139) (shared by Bulgaria, Greece and the former Yugoslav Republic of Macedo-nia), and the Orvilos-Agistros/Gotze Delchev karst aquifer (No. 142) (shared by Bulgaria and Greece - as reported by Bulgaria, it also extends to and is hydraulically linked with the surface water systems of the Mesta/Nestos River basin).
Bulgaria reported that new data available suggests that the San-dansky – Petrich aquifer (No. 139) is divided into two distinct
DojRAn/DoiRAni LAke AquifeR (no. 138)61
The former yugoslav Republic of macedonia greeceType 3; Quaternary and Upper Eocene alluvial aquifer, lake deposits and terraces of silts, clays, sands and gravels, overlying metamorphic rocks, sedimentary sequences and carbonate formations (Precambrian, older Paleozoic); unconfined, with strong links with surface water systems, groundwater flow is from north to south in the Nikolic area of the former Yugoslav Republic of Macedonia, north east to south west on the Greek side and generally towards the lake. Area (km2) 92 120Thickness: mean, max (m) 150, 250 150, 250Groundwater uses and functions Irrigation and drinking water supply >75% for irrigation, <25% for drinking water supply and
livestock, maintaining baseflow and springs and support of ecosystems. Groundwater is 90% of total water use.
Other information Groundwater abstraction exceeds mean annual recharge.
61 Based on information from the First Assessment.62 See also “Responses” under Vardar/Axios.63 Based on information from Bulgaria, Serbia and the former Yugoslav Republic of Macedonia. Information about Strumica river catchment area (the former
Yugoslav Republic of Macedonia) is based on the Second Communication on Climate Change. The former Yugoslav Republic of Macedonia. December 2006. References related to Greece are based on the First Assessment.
64 The River is called Struma in Bulgaria and Strymonas in Greece.65 No detailed information has been provided by Bulgaria on the spatial or temporal extent of the underlying observations.
282 | part iv

1 2 3
4
5
8
9
6
7
Thessaloniki
Sofia
Edirne
Burgas
Struma
LakeKerkinis
Strymonas
Strumica
Mesta
Nestos
ThissavrosRes.
Dospat Dam
Dospat
Ergene
Evro
sMer
iç
Arda
Maritsa
Tundja
Erythropotamos
A E G E A NS E A
SEA OFMARMARA
BLACKSEA
FORM
ER YU
GOSL
AV R
EP. O
F MAC
EDON
IA
GR
E E C E
B U L G A R I A
SERBIA
T U R K E Y
40o
25o
The boundaries and names shown and the designations used on this map do not imply official endorsement or acceptance by the United Nations. UNEP/DEWA/GRID-Geneva 2011
0 25 50 75 100Kilometres
2 Mar
ino P
ole
1 Nov
o Selo
Disc
harg
e (m
3 s-1) (
loga
rithm
ic sc
ale)
280
4(S
trum
ica)
(Stru
ma)1
10
100
1000
7783
39
QavQmaxQmin
Popu
lation
(in h
undr
ed th
ousa
nds)
0
1
2
3
4
5
6
Serb
iaTh
e form
er Yu
gosla
v Rep
. of M
aced
onia
Gree
ceBu
lgaria
4.9
3.2
1.2
0.1
LandScanTMCountry Information/other 2%
1%
Surface with little or no vegetation (<1%)Water bodies (<1%)Wetlands (<1%)
CultivatedForestGrassland/ShrublandUrban/Industrial areas
Others
32%
48%
17%
DiSChARgeS, popuLATion AnD LAnD CoveR in The STRumA/STRymonAS RiveR BASin
Source: UNEP/DEWA/GRID-Europe 2011; Ministry of Environment and Water, Bulgaria.Note: The data on Bulgaria is for 2006, and on the former Yugoslav Republic of Macedonia for 2002.
282 | part iv Chapter 6 DRAINAGE BASIN OF THE MEDITERRANEAN SEA | 283

66 The position of Greece and the former Yugoslav Republic of Macedonia in this regard is not available.67 Based on information provided by Greece. 68 This is due to the State border between Bulgaria and Greece being located in a highland area where the aquifer is inferred to extend along the local watershed
divide. Thus, the flow may be towards Bulgaria in the northern part, and towards Greece in the south. It should be noted, though, that karstic aquifer flow systems are difficult to characterize, and the groundwater divide does not necessarily coincide with the topographic divide.
SAnDAnSky-peTRiCh AquifeR (no. 139)
Bulgaria greeceThe former yugoslav
Republic of macedoniaPliocene and Quaternary alluvial sands, gravels, clays and sandy clays of the Sandansky and Petrich valleys, with aquifer with free level of groundwater from 10 to 100 m, thermal water is characterized from 100 to 300 m in Paleozoic rocky masses with schists and Paleozoic limestones with karst aquifers with different quantity of groundwater; flow occurs from the former Yugoslav Republic of Macedonia to Bulgaria and Greece.Groundwater uses and functions N/A N/A Drinking water, irrigation and industry,
thermal springs, agriculture.Other information Border length 18 km (GR), 5 km (MK). 18 km (BG) 5 km (BG)
SAnDAnSky vALLey AquifeR (no. 140)
Bulgaria greecePliocene, predominantly, and Quaternary lake sediments and alluvial sands, gravels, clays and sandy clays of Sandansky (up to 1000 m thick) valley, free groundwater table at a depth varying from 10 to 100 m; flow occurs from Bulgaria to Greece. Area (km2) 630.5 N/AGroundwater uses and functions Maintaining baseflow and springs. Supports ecosystems. N/AOther information Border length 18 km. Border length 18 km.
peTRiCh vALLey AquifeR (no. 141)
Bulgaria The former yugoslav Republic of macedoniaPliocene, predominantly, and Quaternary lake sediments and alluvial sands, gravels, clays and sandy clays of Petrich (up to 400 m) valley, free groundwater table up to 10 m; flow occurs from the former Yugoslav Republic of Macedonia to Bulgaria.Area (km2) 124 N/AGroundwater uses and functions Drinking water, irrigation and industry. Maintaining
baseflow and springs. Supports ecosystems.N/A
Other information Border length 5 km. Border length 5 km.
oRviLoS-AgiSTRoS/goTZe DeLChev AquifeR (no. 142)
Bulgaria greeceArea (km2) 325 95Groundwater uses and functions Irrigated agriculture and drinking water
supply; it supports ecosystems.<25% for irrigation, drinking water supply, industry,
mining, thermal spa, livestock, fish production, hydropower, also maintaining baseflow and support of ecosystems.
Other information Border length 22 km. Border length 22 km.
Total water withdrawal and withdrawals by sector in the Struma/Strymonas River Basin
CountryTotal withdrawal
×106 m3/year Agricultural % Domestic % industry % energy % other %Bulgariaa 54.7 7 30 52 N/A 11Greece N/A N/A N/A N/A N/A N/A
a 755 × 106 m3/year used for hydropower production is not included.
Water demands in the Strumica catchment area in the former Yugoslav Republic of MacedoniaTotal water demands
(×106 m3/year)population and tourists
(×106 m3/year)industry
(×106 m3/year)irrigation
(×106 m3/year)minimum accepted flow
(×106 m3/year)Strumica 2006 175.3 11.5 33.0 117.9 13.0
2020 235.0 18.2 34.4 169.3 13.0Total in the country
2006 2 227.9 218.3 274.1 899.3 635.02020 3 491.3 348.3 287.0 1 806.7 635.0
Source: Second Communication on Climate Change. The former Yugoslav Republic of Macedonia. December 2006.
aquifers thus, should be substituted by them here:66 (i) the San-dansky valley aquifer (No. 140) (shared by Bulgaria and Greece) and (ii) the Petrich valley aquifer (No. 141) (shared by the former Yugoslav Republic of Macedonia and Bulgaria).
According to Greece67 the Orvilos-Agistros/Gotze Delchev karstic aquifer (No. 142) is not hydraulically linked with the surface wa-ters of either Struma/Strymonas or Mesta/Nestos basins. In addi-tion, Bulgaria expresses uncertainty whether the aquifer should be considered as transboundary.68
284 | part iv
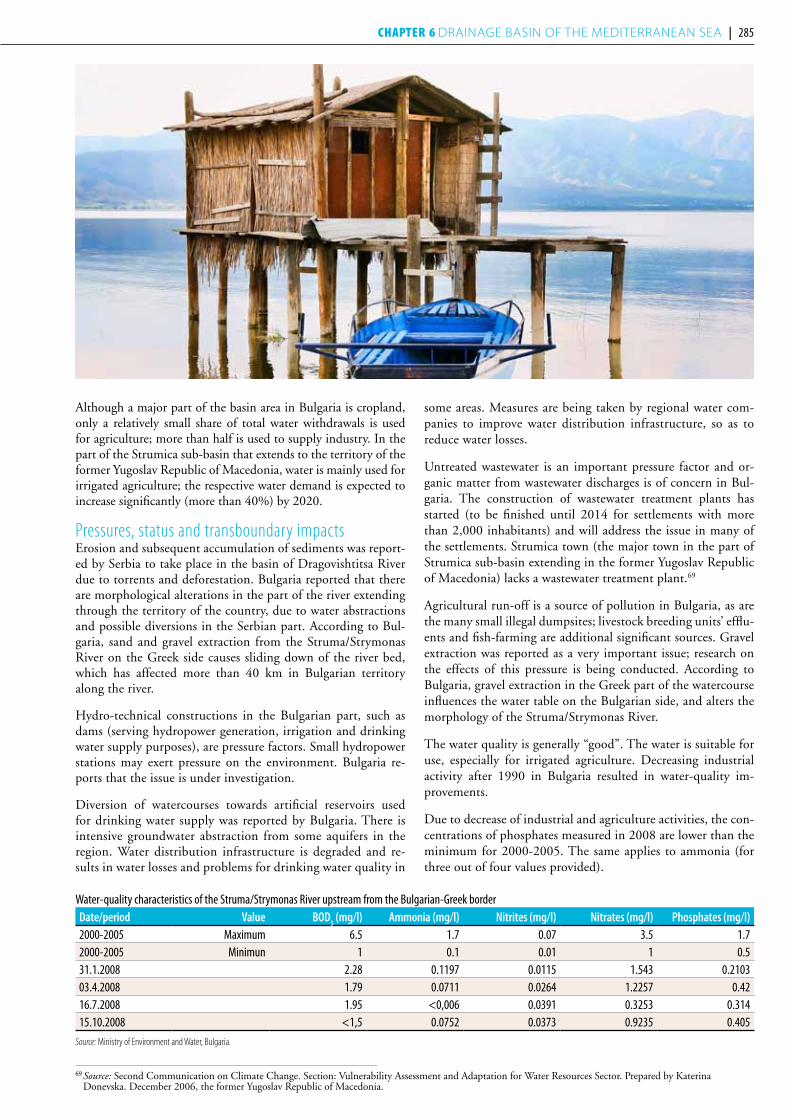
Although a major part of the basin area in Bulgaria is cropland, only a relatively small share of total water withdrawals is used for agriculture; more than half is used to supply industry. In the part of the Strumica sub-basin that extends to the territory of the former Yugoslav Republic of Macedonia, water is mainly used for irrigated agriculture; the respective water demand is expected to increase significantly (more than 40%) by 2020.
Pressures, status and transboundary impactsErosion and subsequent accumulation of sediments was report-ed by Serbia to take place in the basin of Dragovishtitsa River due to torrents and deforestation. Bulgaria reported that there are morphological alterations in the part of the river extending through the territory of the country, due to water abstractions and possible diversions in the Serbian part. According to Bul-garia, sand and gravel extraction from the Struma/Strymonas River on the Greek side causes sliding down of the river bed, which has affected more than 40 km in Bulgarian territory along the river.
Hydro-technical constructions in the Bulgarian part, such as dams (serving hydropower generation, irrigation and drinking water supply purposes), are pressure factors. Small hydropower stations may exert pressure on the environment. Bulgaria re-ports that the issue is under investigation.
Diversion of watercourses towards artificial reservoirs used for drinking water supply was reported by Bulgaria. There is intensive groundwater abstraction from some aquifers in the region. Water distribution infrastructure is degraded and re-sults in water losses and problems for drinking water quality in
some areas. Measures are being taken by regional water com-panies to improve water distribution infrastructure, so as to reduce water losses.
Untreated wastewater is an important pressure factor and or-ganic matter from wastewater discharges is of concern in Bul-garia. The construction of wastewater treatment plants has started (to be finished until 2014 for settlements with more than 2,000 inhabitants) and will address the issue in many of the settlements. Strumica town (the major town in the part of Strumica sub-basin extending in the former Yugoslav Republic of Macedonia) lacks a wastewater treatment plant.69
Agricultural run-off is a source of pollution in Bulgaria, as are the many small illegal dumpsites; livestock breeding units’ efflu-ents and fish-farming are additional significant sources. Gravel extraction was reported as a very important issue; research on the effects of this pressure is being conducted. According to Bulgaria, gravel extraction in the Greek part of the watercourse influences the water table on the Bulgarian side, and alters the morphology of the Struma/Strymonas River.
The water quality is generally “good”. The water is suitable for use, especially for irrigated agriculture. Decreasing industrial activity after 1990 in Bulgaria resulted in water-quality im-provements.
Due to decrease of industrial and agriculture activities, the con-centrations of phosphates measured in 2008 are lower than the minimum for 2000-2005. The same applies to ammonia (for three out of four values provided).
Water-quality characteristics of the Struma/Strymonas River upstream from the Bulgarian-Greek border Date/period value BoD
5 (mg/l) Ammonia (mg/l) nitrites (mg/l) nitrates (mg/l) phosphates (mg/l)
2000-2005 Maximum 6.5 1.7 0.07 3.5 1.72000-2005 Minimun 1 0.1 0.01 1 0.531.1.2008 2.28 0.1197 0.0115 1.543 0.210303.4.2008 1.79 0.0711 0.0264 1.2257 0.4216.7.2008 1.95 <0,006 0.0391 0.3253 0.31415.10.2008 <1,5 0.0752 0.0373 0.9235 0.405
Source: Ministry of Environment and Water, Bulgaria.
69 Source: Second Communication on Climate Change. Section: Vulnerability Assessment and Adaptation for Water Resources Sector. Prepared by Katerina Donevska. December 2006, the former Yugoslav Republic of Macedonia.
284 | part iv Chapter 6 DRAINAGE BASIN OF THE MEDITERRANEAN SEA | 285
Responses and trendsThe part of the Struma/Strymonas Basin that is within Bul-garia’s territory has been assigned to the West Aegean Basin Dis-trict, the part that is within Greece’s territory has been assigned to the Central Macedonia District, as well as to the Eastern Macedonia and Thrace Basin District. In Bulgaria, there is a management authority that has the primary responsibility for water resources management and a basin council (a consultative body) at the level of the river basin district. The RBMP for the West Aegean Basin District was prepared to cover the part of the basin falling within Bulgarian territory.
There is a monitoring station70 in Bulgaria, near the Bulgarian–Greek border. Monitoring programmes are being established in both countries in accordance to the WFD. Bulgaria reports that joint monitoring of the aquifers should be established.
The increase of tourism in the Bulgarian part is expected to result in increased water consumption needs.
Transboundary cooperationAccording to the agreement signed between Bulgaria and Greece in 1964, both countries are bound, inter alia, not to cause significant damage to each other, arising from the con-struction and operation of projects and installations along the valleys of the Struma/Strymonas, Mesta/Nestos, Arda/Ardas and Maritsa/Evros rivers. The agreement provides for exchange of information and data between parties for preventing floods, as well as an exchange of information concerning the installa-tions subject to the agreement.
According to the Agreement signed between the two countries in 1971, a Bulgarian-Greek Commission on cooperation in the field of electric energy and water use of the rivers flowing through their territories was set up. Bulgaria reports that the agreement is not active for the time being, and that discussions regarding its renewal and possible updating are ongoing. Final-ly, an Agreement was signed between the Ministry of Environ-ment and Water of the Republic of Bulgaria and the Ministry for the Environment, Physical Planning and Public Works of the Hellenic Republic in 2002 on Cooperation in the field of Environmental Protection.
In 2010, ministers responsible for water issues in Bulgaria and Greece stated in a joint declaration their political will to start a new dialogue with the aim to promote cooperation for the preservation and protection of shared water resources. As a re-sult, a joint Bulgarian-Greek Working Group on cooperation on water protection was established in May 2011. The joint Working Group will focus its work on: legislative issues linked to transposing the WFD and the Floods Directive; support to the implementation in both countries of the WFD, through RBMPs, and of the Floods Directive; implementation of the basin water management principle in both countries; moni-toring of water quantity, water resources assessment and flood early warning systems; and water management bodies and ad-ministrative structures.71
mesta/nestos river Basin72
The basin of the river Mesta/Nestos73 is shared by Bulgaria and Greece.
Basin of the Mesta/Nestos River Country Area in the country (km2) Country’s share (%)Bulgaria 2 785 49.9Greece 2 834 51.1Total 5 619
Hydrology and hydrogeologyThe river has its source in the Rila Mountains in the vicinity of Sofia (Bulgaria), and, flowing through Greece, ends in the North Aegean Sea. The basin has a pronounced mountainous character in its upper part, and a lowland character further downstream. The Dospat/Despatis74 is a major transboundary tributary; the river has its source in the Rodopy Mountains in the vicinity of Sarnitsa (Bulgaria), and flows into the Mesta/Nestos River in the territory of Greece.
Large parts of the basin in Bulgaria and Greece have been desig-nated as Natura 2000 sites.75 The Nestos delta, in Greece, is of great ecological importance, and has been designated as a Ramsar Site.
In Bulgaria, surface water resources are estimated to be 958 × 106 m3/year (average for 1961 – 2002), and groundwater resources are 91.8 × 10⁶ m3/year (average for 1980 – 2008). Total water resources per capita are estimated to be 8,188 m3/year (average 1980 –2008).
Bulgaria reported that global climate change over the last 20 years has resulted in an approximately 30% decrease in precipitation, and a subsequent decrease in water resources in the basin76; provi-sions to address the decrease of water resources will be included in the programme of measures of the RBMP. Bulgaria reports that a reduction of flow has been observed in the Mesta from the late 1930s to the early 2000s.
Major dams for hydropower generation and irrigation include those of Thisavros (built in 1997) and Platanovrisi (built in 1999) in Greece, and the Dospat Dam (on Dospat River – built in 1967) in Bulgaria.
Orvilos-Agistros/Gotze Delchev karstic aquifer (No. 142), shared by Bulgaria and Greece (presented in the assessment of the Struma/Strymonas River), extends to and is hydraulically linked with the surface water system of both Mesta/Nestos and Struma/Strymonas Rivers basins (as reported by Bulgaria)77. According to Greece, the shared aquifer is not hydraulically linked to the surface waters of either basin.
Pressures, status and responsesWhen last reported in the First Assessment, the water quality was “suitable for irrigation and water supply for other uses”. In the few years preceding the First Assessment, the quality of the Mesta had improved, as a result of reduced economic activities (including industrial), and the construction of small local waste-
70 Water quality in this station has been monitored since 2003; 20 basic physico-chemical parameters are being monitored.71 Source: Website of the Ministry of Environment and Water of Bulgaria (http://www.moew.government.bg).72 Based on information from Bulgaria; references related to Greece are based on information from the First Assessment.73 The river is known as Mesta in Bulgania and as Nestos in Greece.74 The river is known as Dospat as well as Dospatska in Bulgaria and as Despatis in Greece.75 In Bulgaria, these are West Rodopi, Dolna Mesta, Mesta River, Pirin National Park, Alibotush, and Rila National Park.76 No detailed information has been provided by Bulgaria on the spatial or temporal extent of the underlying observations on precipitation. However, the average
run-off was reported to be 1.5 × 10⁹ m3 for the period 1935-1970, and 0.958 × 10⁹ m3 for the period 1970-2005 at the border.77 Bulgaria expresses uncertainty as to whether Orvilos-Agistros/Gotze Delchev karstic aquifer should be considered as transboundary. See the section on the Struma/
Strymonas River basin where the aquifer is described.
286 | part iv

water treatment plants in Bulgaria. Values for a few water-quality determinands in the Mesta River downstream from the city of Hadzhidimovo are shown in Figure 2.
figuRe 2: Annual median concentrations (mg/l) of selected water quality determinands in the Mesta River downstream from the city of Hadzhidimovo78 in Bulgaria. In 2000 and 2005, data was available for twelve months, in 2008 for six
4 Tém
enos
3 Had
jidim
ovo
Disc
harg
e (m
3 s-1) (
loga
rithm
ic sc
ale)
537
31(M
esta
)
(Nes
tos)1
10
100
1000
5
45
QavQmaxQmin
Popu
lation
(in h
undr
ed th
ousa
nds)
0.0
0.5
1.0
1.5
2.0
Gree
ceBu
lgaria
0.2
1.4
LandScanTMCountry Information/other 1%
1%
Surface with little or no vegetation (<1%)Water bodies (<1%)Wetlands (<1%)
CultivatedForestGrassland/ShrublandUrban/Industrial areas
Others
15%
70%
13%
DiSChARgeS, popuLATion AnD LAnD CoveR in The meSTA/neSToS RiveR BASin
Source: UNEP/DEWA/GRID-Europe 2011.Note: The map in the assessment of the Struma/Strymonas should be referred to for the locations of the gauging stations.
Source: Ministry of Environment and Water, Bulgaria.
78 The monthly data values for 2000 and 2005 are shown in the First Assessment.79 In the framework of the project “Strengthening of monitoring network of the surface water” financed by Phare (EU Cross-Border Cooperation).
year 2004 2005 2008Ammonia Median 0.20 0.06 0.12
Average 0.34 0.07 18Minimum 0.00 0.00 0.02Maximum 1.70 0.14 0.47
Nitrites Median 0.03 0.01 0.02Average 0.03 0.01 0.02
Minimum 0.00 0.01 0.01Maximum 0.08 0.01 0.03
Nitrates Median 0.042 0.50 0.46Average 0.64 0.51 0.48
Minimum 0.02 0.06 0.27Maximum 2.30 1.00 0.74
Phosphates Median 0.30 0.14 0.29Average 0.27 0.18 0.27
Minimum 0.20 0.05 0.20Maximum 0.40 0.51 0.31
Hydro-technical constructions such as dams (serving hy-dropower generation, irrigation and drinking water supply purposes) and small hydropower stations in the Bulgarian part have caused hydromorphological alterations, and exert pressure on the environment. The diversion of watercourses towards reservoirs used for drinking water supply was re-ported by Bulgaria. There are water losses due to degraded water distribution infrastructure. Drinking water quality is of concern in some areas, but action to address related issues has been taken.
Total water withdrawal in Bulgaria, in 2006, was 9.473 ×10⁶ m3/year. 21% of total water withdrawal is used for agriculture, 49% for domestic, 14% for industry, and 17% for other uses. In addition, 133.909 ×10⁶ m3/year is used for hydropower pro-duction.
The increase of tourism in the area is followed results in in-creased water consumption needs.
Uncontrolled solid waste disposal in the Bulgarian part had resulted in water pollution, causing potential environmental problems, especially in times of heavy precipitation. Measures to address this issue are being taken: wastes from all eight mu-nicipalities in the river basin are now being collected; about 25 uncontrolled disposal sites were closed; most of them have already been rehabilitated.
Sand extraction is an issue of concern.
With regard to institutional arrangements for water manage-ment in the basin, the part extending through Bulgaria has been assigned to the West Aegean Basin District, while the part extending through Greece has been assigned to the East-ern Macedonia and Thrace Basin District. The RBMP for the West Aegean Basin District, in Bulgaria, covers the part of the basin falling within the country’s territory.
With regard to monitoring in Bulgaria, new monitoring pro-grammes are established in accordance to the WFD. An au-tomatic station on the Mesta/Nestos River was established in Bulgaria79 near the Bulgarian-Greek border to measure both water quality and quantity parameters.
1998 2000 2002 2004 2006 2008 2010
0.6
0.5
0.4
0.3
0.2
0.1
0
Ammonia Nitrites Nitrates X Phosphates
286 | part iv Chapter 6 DRAINAGE BASIN OF THE MEDITERRANEAN SEA | 287

Transboundary cooperationInformation on cooperation between Bulgaria and Greece is available in the assessment of the Struma/Strymonas River Basin.
According to the agreement that was concluded between Bul-garia and Greece in 1995 referring specifically to the Mesta/Nestos, Bulgaria is obliged to deliver to Greece 29% of the av-erage run-off of the river generated in the Bulgarian territory. According to Bulgaria — concerned by the observed reduction of run-off — the actualization of the basis for the calculation is overdue.
maritsa/evros/ meriÇ river Basin80
Bulgaria, Greece and Turkey share the basin of the Maritsa/Ev-ros/Meriç River.81
Basin of the Maritsa/Evros/Meriç River Country Area in the country (km2) Country’s share (%)Bulgaria 35 230 66
Maritsa sub-basin: 21 928 Tundzha sub-basin: 8 029
Arda sub-basin: 5 273Greece 3 685 7
Evros sub-basinArdas sub-basin
Turkey 14 560 27Total 53 475a
a According to information provided by Turkey, the total area of the basin is 54,206 km2.
Hydrology and hydrogeologyThe Maritsa/Evros/Meriç River is about 500 km long, has its source in the Rila Mountain (Bulgaria) and flows into the Aegean Sea. Major transboundary tributaries include the rivers Arda/Ardas82 (Bulgaria, Greece and Turkey), Tundzha/Tundja/Tunca83(Bulgaria, Turkey) and Biala/Erithropotamos84 (Bulgaria, Greece). The river Ergene is an important tributary, located in Turkey.
The basin has a mountainous character at its upper part; low mountains and plains cover the major part of the basin. The aver-age elevation is 100 m a.s.l.
The climatic and geomorphologic characteristics of the basin lead to specific run-off conditions, characterized among others by high inter-annual flow variability. Floods in all three sub-basins may cause severe damage in all three countries; among the most dis-astrous were the floods in 2005 (recurrence interval, 1,000 years), 2006, and November 2007.
Bulgaria reported that climate change has affected the basin over the last 20 years, resulting in an approximately 30% decrease in precipitation, and a subsequent decrease in water resources.85
Turkey reports that the Evros/Meriç is a transboundary alluvial aq-uifer between Turkey and Greece.86 It drains through the Meriç/Evros River that forms the border between Turkey and Greece. It is mainly used for irrigation, industry, and drinking water purposes in Turkey.
Topolovgrad Massif (No. 144), shared by Bulgaria and Turkey, is a karstic aquifer, with medium connections to surface waters of Tundzha/Tundja River sub-basin (see aquifer table under Tundzha/Tundja River).
Cooperation is necessary among the three countries to deline-
Water resources in the Maritsa/Evros/Meriç River basin Country Bulgariaa greece TurkeySurface water resources (× 106 m3/year) 6 950 N/A 8 330b
Groundwater resources (× 106 m3/year) 1 937 N/A 364c
Total water resources (× 106 m3/year) 8 887 n/A 8 694Total water resources per capita (m3/year) 5 242 n/A 8 414
a Information for the Bulgarian part of the basin: Maritsa/Evros/Meriç sub-basin: surface water resources 3 403 × 106 m3/year (1961-1998), groundwater resources 1 388 × 106 m3/year; Arda/Ardas sub-basin: surface water resources 2 290 × 106 m3/year, groundwater resources 157.8 × 10⁶ m3/year; Tundzha/Tundja/Tunca sub-basin: surface water resources 1 257 × 106 m3/year (1961-1998), groundwater resources 390.8 × 10⁶ m3/year.
b Data for 1986-2005. c Data for 1994-2000.
oReSTiADA/SviLengRAD-STAmBoLo/eDiRne AquifeR (no. 143)
Bulgariaa greece TurkeyType 3; Neogene lake and river alluvial sands, clayey sands, gravels, sandy clays and clays; dominant groundwater flow is from Bulgaria towards Turkey and Greece; strong links with surface water systems, with recharge from and discharge towards the rivers Arda/Ardas and Maritsa/Evros/Meriç. Area (km2) 712 450 N/AThickness: mean, max (m) 120, 170 120, 170 120, 170Groundwater uses and functions Groundwater is 25% of total use.
Drinking water supply, irrigation, industry, support ecosystems.
Groundwater is 25% of total use. >75% for irrigation and <25% for drinking
water supply, also support ecosystems.
Groundwater is 25% of total use.
a For Bulgaria, the tabled information only refers to the groundwater body identified according to the EU WFD in the porous Neogene formation of Svilengrad-Stambolo (national identification code: BG3G 000000 N 011). Bulgaria reports that in the RBMP, the following additional groundwater bodies, connected with Greece and Turkey, are specified: fissure groundwaters in Ivailovgrad massif (national code BG3G00PtPg2024, surface area 191 km2); fissure groundwaters in Svilengrad massif (national code BG3G0000Pg025, surface area 48 km2). The position of Greece and Turkey is not available on this matter.
80 Based on information provided by Bulgaria and Turkey, and the First Assessment. 81 The river is called Maritsa in Bulgaria, Evros in Greece and Meriç in Turkey.82 The river is called Arda in Bulgaria and Turkey, and Ardas in Greece.83 The river is called Tundzha and/or Tundja in Bulgaria and Tunca in Turkey.84 The river is called Biala in Bulgaria and Erithropotamos in Greece.85 Measures to improve hydrologic conditions (e.g. forestation), reduce water loses and increase water use efficiency are included in the program of measures of the
River Basin Management Plan in Bulgaria; the programme specifically refers to studies to investigate the impact of the climate changes as necessary. No detailed information has been provided by Bulgaria on the spatial or temporal extent of the underlying observations.
86 Based on information from Turkey; the position of Greece is not available. It is possible that Bulgaria is a riparian country (see the body text).
288 | part iv
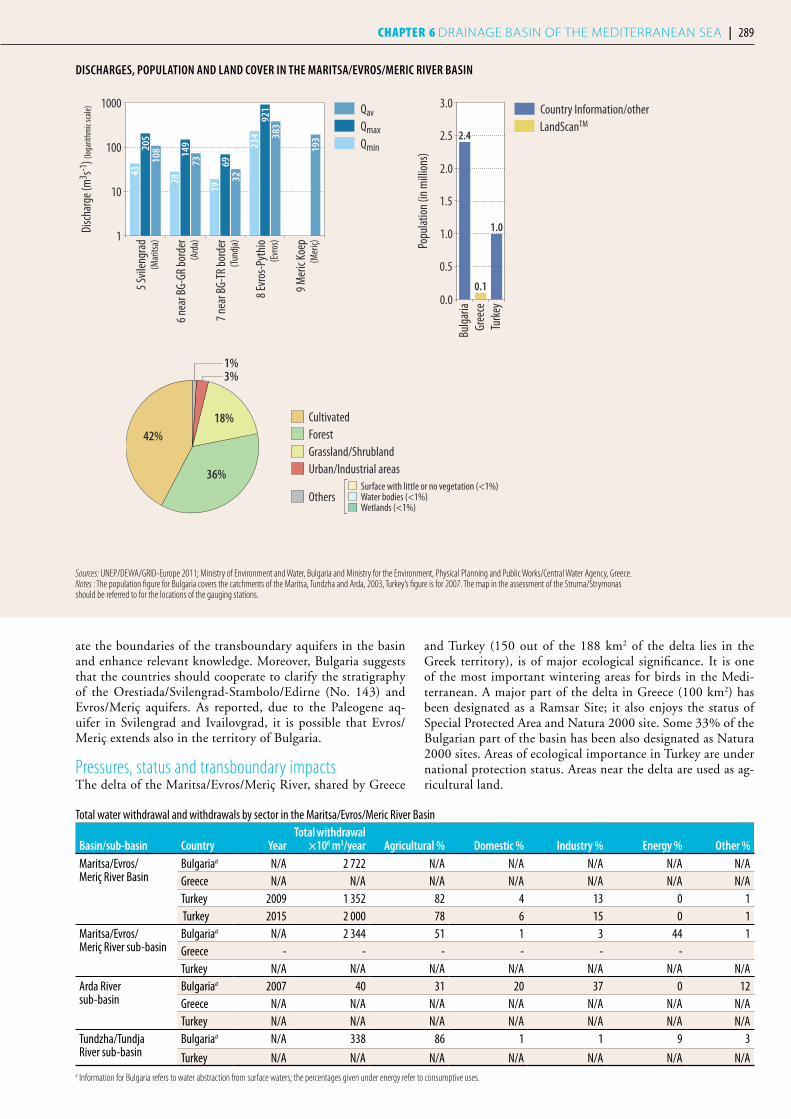
1000
100
10
1
9 Mer
ic Ko
ep
8 Evr
os-P
ythi
o
7 nea
r BG-
TR bo
rder
6 nea
r BG-
GR bo
rder
5 Svil
engr
ad
Disc
harg
e (m
3 s-1) (
loga
rithm
ic sc
ale)
149
73
(Mar
itsa)
(Ard
a)
(Tun
dja)
(Evr
os)
(Mer
iç)
6932
19
193
28
205
108
43
921
383
234
QavQmaxQmin
Popu
lation
(in m
illion
s)
0.0
0.5
1.0
1.5
2.0
2.5
3.0
Turke
yGr
eece
Bulga
ria
2.4
0.1
1.0
LandScanTMCountry Information/other
Sources: UNEP/DEWA/GRID-Europe 2011; Ministry of Environment and Water, Bulgaria and Ministry for the Environment, Physical Planning and Public Works/Central Water Agency, Greece.Notes : The population figure for Bulgaria covers the catchments of the Maritsa, Tundzha and Arda, 2003, Turkey’s figure is for 2007. The map in the assessment of the Struma/Strymonas should be referred to for the locations of the gauging stations.
DiSChARgeS, popuLATion AnD LAnD CoveR in The mARiTSA/evRoS/meRiC RiveR BASin
1%3%
Surface with little or no vegetation (<1%)Water bodies (<1%)Wetlands (<1%)
CultivatedForestGrassland/ShrublandUrban/Industrial areas
Others
42%
36%
18%
ate the boundaries of the transboundary aquifers in the basin and enhance relevant knowledge. Moreover, Bulgaria suggests that the countries should cooperate to clarify the stratigraphy of the Orestiada/Svilengrad-Stambolo/Edirne (No. 143) and Evros/Meriç aquifers. As reported, due to the Paleogene aq-uifer in Svilengrad and Ivailovgrad, it is possible that Evros/Meriç extends also in the territory of Bulgaria.
Pressures, status and transboundary impactsThe delta of the Maritsa/Evros/Meriç River, shared by Greece
and Turkey (150 out of the 188 km2 of the delta lies in the Greek territory), is of major ecological significance. It is one of the most important wintering areas for birds in the Medi-terranean. A major part of the delta in Greece (100 km2) has been designated as a Ramsar Site; it also enjoys the status of Special Protected Area and Natura 2000 site. Some 33% of the Bulgarian part of the basin has been also designated as Natura 2000 sites. Areas of ecological importance in Turkey are under national protection status. Areas near the delta are used as ag-ricultural land.
Total water withdrawal and withdrawals by sector in the Maritsa/Evros/Meric River Basin
Basin/sub-basin Country yearTotal withdrawal
×106 m3/year Agricultural % Domestic % industry % energy % other %Maritsa/Evros/ Meriç River Basin
Bulgariaa N/A 2 722 N/A N/A N/A N/A N/AGreece N/A N/A N/A N/A N/A N/A N/ATurkey 2009 1 352 82 4 13 0 1 Turkey 2015 2 000 78 6 15 0 1
Maritsa/Evros/ Meriç River sub-basin
Bulgariaa N/A 2 344 51 1 3 44 1Greece - - - - - -Turkey N/A N/A N/A N/A N/A N/A N/A
Arda River sub-basin
Bulgariaa 2007 40 31 20 37 0 12Greece N/A N/A N/A N/A N/A N/A N/ATurkey N/A N/A N/A N/A N/A N/A N/A
Tundzha/Tundja River sub-basin
Bulgariaa N/A 338 86 1 1 9 3
Turkey N/A N/A N/A N/A N/A N/A N/Aa Information for Bulgaria refers to water abstraction from surface waters; the percentages given under energy refer to consumptive uses.
288 | part iv Chapter 6 DRAINAGE BASIN OF THE MEDITERRANEAN SEA | 289
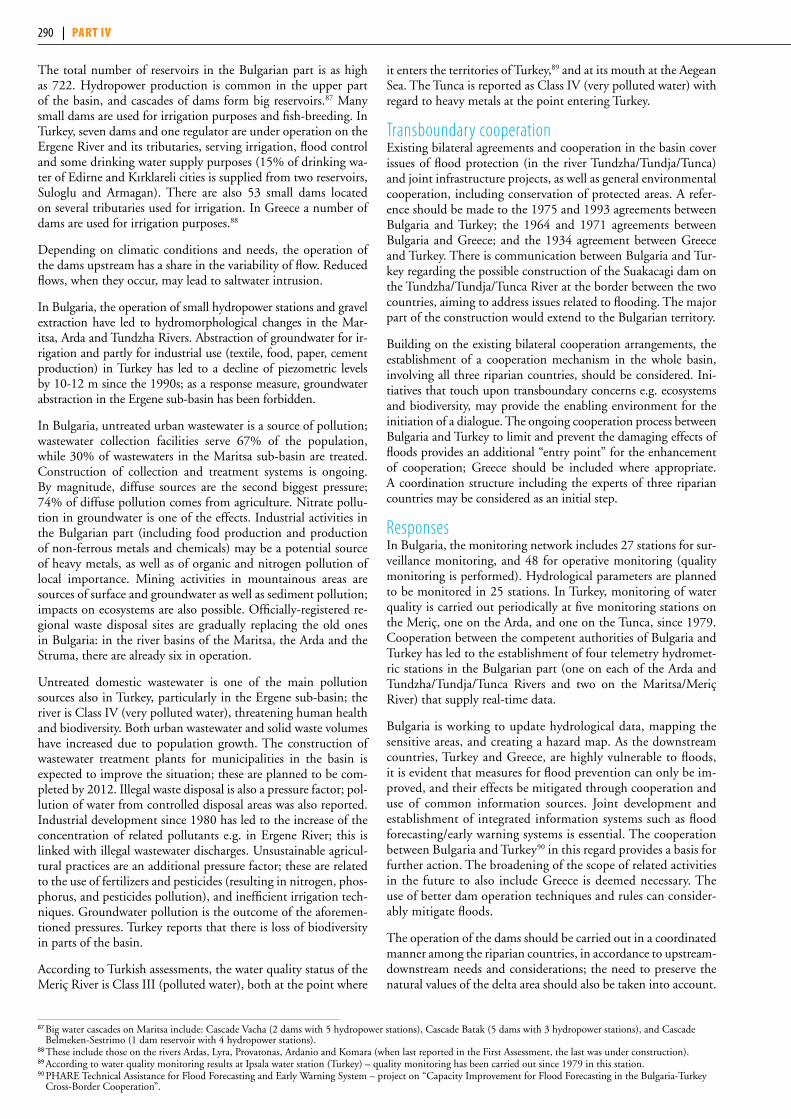
The total number of reservoirs in the Bulgarian part is as high as 722. Hydropower production is common in the upper part of the basin, and cascades of dams form big reservoirs.87 Many small dams are used for irrigation purposes and fish-breeding. In Turkey, seven dams and one regulator are under operation on the Ergene River and its tributaries, serving irrigation, flood control and some drinking water supply purposes (15% of drinking wa-ter of Edirne and Kırklareli cities is supplied from two reservoirs, Suloglu and Armagan). There are also 53 small dams located on several tributaries used for irrigation. In Greece a number of dams are used for irrigation purposes.88
Depending on climatic conditions and needs, the operation of the dams upstream has a share in the variability of flow. Reduced flows, when they occur, may lead to saltwater intrusion.
In Bulgaria, the operation of small hydropower stations and gravel extraction have led to hydromorphological changes in the Mar-itsa, Arda and Tundzha Rivers. Abstraction of groundwater for ir-rigation and partly for industrial use (textile, food, paper, cement production) in Turkey has led to a decline of piezometric levels by 10-12 m since the 1990s; as a response measure, groundwater abstraction in the Ergene sub-basin has been forbidden.
In Bulgaria, untreated urban wastewater is a source of pollution; wastewater collection facilities serve 67% of the population, while 30% of wastewaters in the Maritsa sub-basin are treated. Construction of collection and treatment systems is ongoing. By magnitude, diffuse sources are the second biggest pressure; 74% of diffuse pollution comes from agriculture. Nitrate pollu-tion in groundwater is one of the effects. Industrial activities in the Bulgarian part (including food production and production of non-ferrous metals and chemicals) may be a potential source of heavy metals, as well as of organic and nitrogen pollution of local importance. Mining activities in mountainous areas are sources of surface and groundwater as well as sediment pollution; impacts on ecosystems are also possible. Officially-registered re-gional waste disposal sites are gradually replacing the old ones in Bulgaria: in the river basins of the Maritsa, the Arda and the Struma, there are already six in operation.
Untreated domestic wastewater is one of the main pollution sources also in Turkey, particularly in the Ergene sub-basin; the river is Class IV (very polluted water), threatening human health and biodiversity. Both urban wastewater and solid waste volumes have increased due to population growth. The construction of wastewater treatment plants for municipalities in the basin is expected to improve the situation; these are planned to be com-pleted by 2012. Illegal waste disposal is also a pressure factor; pol-lution of water from controlled disposal areas was also reported. Industrial development since 1980 has led to the increase of the concentration of related pollutants e.g. in Ergene River; this is linked with illegal wastewater discharges. Unsustainable agricul-tural practices are an additional pressure factor; these are related to the use of fertilizers and pesticides (resulting in nitrogen, phos-phorus, and pesticides pollution), and inefficient irrigation tech-niques. Groundwater pollution is the outcome of the aforemen-tioned pressures. Turkey reports that there is loss of biodiversity in parts of the basin.
According to Turkish assessments, the water quality status of the Meriç River is Class III (polluted water), both at the point where
it enters the territories of Turkey,89 and at its mouth at the Aegean Sea. The Tunca is reported as Class IV (very polluted water) with regard to heavy metals at the point entering Turkey.
Transboundary cooperation Existing bilateral agreements and cooperation in the basin cover issues of flood protection (in the river Tundzha/Tundja/Tunca) and joint infrastructure projects, as well as general environmental cooperation, including conservation of protected areas. A refer-ence should be made to the 1975 and 1993 agreements between Bulgaria and Turkey; the 1964 and 1971 agreements between Bulgaria and Greece; and the 1934 agreement between Greece and Turkey. There is communication between Bulgaria and Tur-key regarding the possible construction of the Suakacagi dam on the Tundzha/Tundja/Tunca River at the border between the two countries, aiming to address issues related to flooding. The major part of the construction would extend to the Bulgarian territory.
Building on the existing bilateral cooperation arrangements, the establishment of a cooperation mechanism in the whole basin, involving all three riparian countries, should be considered. Ini-tiatives that touch upon transboundary concerns e.g. ecosystems and biodiversity, may provide the enabling environment for the initiation of a dialogue. The ongoing cooperation process between Bulgaria and Turkey to limit and prevent the damaging effects of floods provides an additional “entry point” for the enhancement of cooperation; Greece should be included where appropriate. A coordination structure including the experts of three riparian countries may be considered as an initial step.
Responses In Bulgaria, the monitoring network includes 27 stations for sur-veillance monitoring, and 48 for operative monitoring (quality monitoring is performed). Hydrological parameters are planned to be monitored in 25 stations. In Turkey, monitoring of water quality is carried out periodically at five monitoring stations on the Meriç, one on the Arda, and one on the Tunca, since 1979. Cooperation between the competent authorities of Bulgaria and Turkey has led to the establishment of four telemetry hydromet-ric stations in the Bulgarian part (one on each of the Arda and Tundzha/Tundja/Tunca Rivers and two on the Maritsa/Meriç River) that supply real-time data.
Bulgaria is working to update hydrological data, mapping the sensitive areas, and creating a hazard map. As the downstream countries, Turkey and Greece, are highly vulnerable to floods, it is evident that measures for flood prevention can only be im-proved, and their effects be mitigated through cooperation and use of common information sources. Joint development and establishment of integrated information systems such as flood forecasting/early warning systems is essential. The cooperation between Bulgaria and Turkey90 in this regard provides a basis for further action. The broadening of the scope of related activities in the future to also include Greece is deemed necessary. The use of better dam operation techniques and rules can consider-ably mitigate floods.
The operation of the dams should be carried out in a coordinated manner among the riparian countries, in accordance to upstream-downstream needs and considerations; the need to preserve the natural values of the delta area should also be taken into account.
87 Big water cascades on Maritsa include: Cascade Vacha (2 dams with 5 hydropower stations), Cascade Batak (5 dams with 3 hydropower stations), and Cascade Belmeken-Sestrimo (1 dam reservoir with 4 hydropower stations).
88 These include those on the rivers Ardas, Lyra, Provatonas, Ardanio and Komara (when last reported in the First Assessment, the last was under construction).89 According to water quality monitoring results at Ipsala water station (Turkey) – quality monitoring has been carried out since 1979 in this station.90 PHARE Technical Assistance for Flood Forecasting and Early Warning System – project on “Capacity Improvement for Flood Forecasting in the Bulgaria-Turkey
Cross-Border Cooperation”.
290 | part iv

The implementation of good agricultural practices and the es-tablishment of buffer zones are response measures taken in Bul-garia to address diffuse pollution from agriculture. There is a need to restore the existing irrigation infrastructure.
In Turkey, the development plans for the Meriç-Ergene Basin integrate up to a point the development strategies in water-related sectors. There is no conjunctive management of surface water and groundwater. The Protection Action Plan for Meriç-Ergene Basin (2008) assesses the effects of development pro-jects and economic activities on the environment, and provides for a short, medium and long-term action plan in terms of wa-ter resource management. There is also a land use plan for the Meriç-Ergene basin.
The respective parts of the Maritsa/Evros basin are within the East Aegean Basin District in Bulgaria and the Eastern Mac-edonia and Thrace District in Greece; there is a management authority and a basin council in each of these Basin Districts.
An RBMP for the East Aegean Basin District (Bulgaria) was final-ized with the involvement of stakeholders. Water demand man-agement measures in Bulgaria include water abstraction control.
arda/ardas suB-Basin91
Bulgaria, Greece, and Turkey share the sub-basin of the river Arda/Ardas. The Arda/Ardas has its source in the Rodopi Moun-tains (Bulgaria) and discharges into the Meriç River. The Aterin-ska River is a tributary shared by Bulgaria and Greece.
The sub-basin has a pronounced mountainous character with an average elevation of 635 m a.s.l.
Pressures, impacts and responsesDams are common for the Arda/Ardas sub-basin; 100 are lo-cated in Bulgarian territory. The largest ones serve multiple purposes: energy production, irrigation, industrial and drink-ing water supply. Flow regulation is a pressure factor resulting in hydromorphological changes; the change in the water tem-perature due to the construction of the big dams has had an im-pact on the macrozoobenthos in the downstream section of the Arda/Ardas in Bulgaria. In Greece, a dam was built close to the border with Bulgaria to regulate discharge from the Ivailovgrad Dam (Bulgaria); water from the reservoir also covers irrigation needs.
Non-treated urban wastewater, waste disposal and animal hus-bandry are pressure factors in the Bulgarian part of the basin, having impacts of local importance on the ecosystem. Eutroph-ication has been observed in the reservoirs of the (large) dams Kardgali, Studen Kladenez and Ivailovgrad. Nitrogen and or-ganic pollution is expected to diminish since the sewerage sys-tem is being extended; it is now connecting 67% of the popula-tion. There are three new municipal wastewater plants, and a new one is under construction.
Mining activities have a local but important impact due to the presence of heavy metals in their discharges; five tailing ponds containing mining waste are potential sources of pollution. In-dustrial activities in the area are possible sources of heavy metals and organic pollution (impact of local importance).
There are nine waste disposal sites in the Bulgarian part; a re-gional disposal site is under construction.
91 Based on information from Bulgaria and Turkey. References to Greece are based on the First Assessment.
290 | part iv Chapter 6 DRAINAGE BASIN OF THE MEDITERRANEAN SEA | 291

TopoLovgRAD mASSif AquifeR (no. 144)93
Bulgariaa TurkeyType 2 (TR)/Type 1 (BG);94 Triassic and Jurassic karstic limestones, dolomites, marbles, schists, in a narrow synclinal structure with complicated, faulted block structure; medium links with surface water systems; dominant groundwater flow direction: Bulgaria from South to North. Area (km2) 315 (280a) N/AGroundwater uses and functions For drinking and household purposes.a
25 - 50% Drinking water supply, < 25% each for irrigation and livestock, maintaining baseflow
and springs and support of ecosystems.
N/A
Pressure factors Industry, industrial and household wastewaters, problems: impact of human activity on the chemical status of the groundwater body - waste landfill, mine, in the
future: possible qualitative risk, no quantitative risk.a
N/A
Groundwater management measures Wastewater treatment is needed.a
Other information Border length 24 km. Bulgaria expresses uncertainty as to whether the aquifer should be considered as transboundary.
Border length 24 km.
a After determination of groundwater bodies in conformity with the requirements of the WFD, Bulgaria suggest that the Topolovgrad aquifer corresponds to groundwater body “Karst water – Topolovgrad massif” (national code BG3G0000T12034).
92 Based on information from Bulgaria, Turkey and the First Assessment. 93 Based on information from the First Assessment. 94 Bulgaria’s doubt as to whether the aquifer is transboundary is due to the State border between Bulgaria and Turkey being located in an area where the aquifer
extends along the local watershed divide. Thus, groundwater flow is suspected not to cross the State border, but divide to the North in Bulgaria, and to the South in Turkey. It should be noted, however, that karstic aquifer flow systems are difficult to characterize, and the groundwater divide does not necessarily coincide with the topographic divide.
figuRe 3: Map of main dams in the Arda/Ardas and Tundja/Tundzha/Tunca Rivers
Source: Bulgaria.
(1) Koprinka Dam(2) Jdrebchevo Dam(3) Ivailovgrad Dam(4) Studen Kladnetz Dam(5) Kardjaali Dam(6) Suakacagi Dam (planned)
So�a
Plovdiv
Edrine
GreeceSea of
Marmara
Black Sea
TurkeyBulgaria
Ergene
Arda
Maritsa
Tun
dja
0 50 100 150 km
Aegean Sea
1 2
345
6
tundzha/tundja/tunCa suB-Basin92 Bulgaria and Turkey share the sub-basin of the Tundzha/Tundja/Tunca, which has its source in the Stara Planina Mountain (Bulgaria), and flows into the Meriç River. The Fishera River is a tributary shared by Bulgaria and Turkey.
Pressures, impacts and responsesThere are 264 dams located in the Bulgarian part. The larger dams/reservoirs serve multiple purposes: energy production, ir-rigation, industrial and drinking water supply. There are four hydropower stations, and three thermal power plants.
Eutrophication in the reservoirs of the large dams in Bulgaria as well as nitrate pollution of groundwater, in the middle part of the basin, has been observed. Among pollution sources, waste-
water discharge from municipalities and industry ranks in the first place, followed by diffuse pollution (78% from agricul-ture). Measures for the improvement of the situation are being taken, e.g. wastewater treatment plants are being constructed. The sewerage system currently serves 31% of the population in the Bulgarian part, while wastewater treatment plants treat 11% of the urban wastewaters. There are six waste disposal sites in the Bulgarian part.
292 | part iv
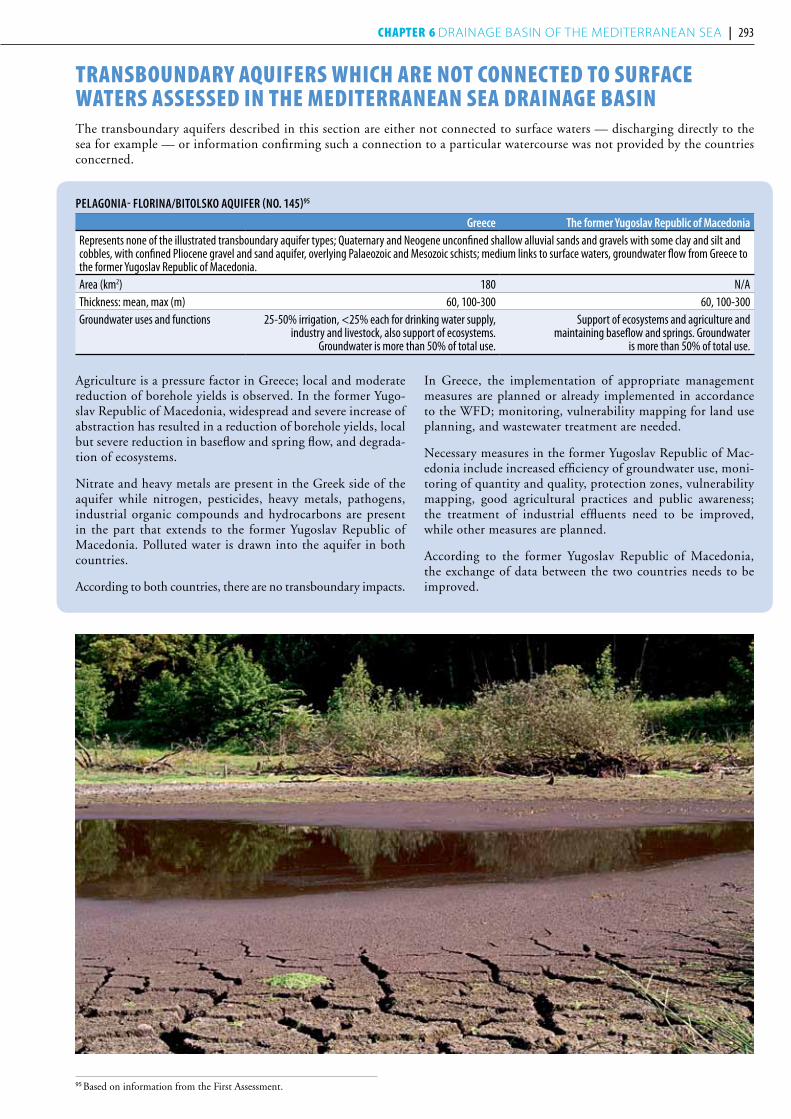
transBoundary aquifers whiCh are not ConneCted to surfaCe waters assessed in the mediterranean sea drainaGe Basin The transboundary aquifers described in this section are either not connected to surface waters — discharging directly to the sea for example — or information confirming such a connection to a particular watercourse was not provided by the countries concerned.
95 Based on information from the First Assessment.
peLAgoniA- fLoRinA/BiToLSko AquifeR (no. 145)95
greece The former yugoslav Republic of macedoniaRepresents none of the illustrated transboundary aquifer types; Quaternary and Neogene unconfined shallow alluvial sands and gravels with some clay and silt and cobbles, with confined Pliocene gravel and sand aquifer, overlying Palaeozoic and Mesozoic schists; medium links to surface waters, groundwater flow from Greece to the former Yugoslav Republic of Macedonia. Area (km2) 180 N/AThickness: mean, max (m) 60, 100-300 60, 100-300Groundwater uses and functions 25-50% irrigation, <25% each for drinking water supply,
industry and livestock, also support of ecosystems. Groundwater is more than 50% of total use.
Support of ecosystems and agriculture and maintaining baseflow and springs. Groundwater
is more than 50% of total use.
Agriculture is a pressure factor in Greece; local and moderate reduction of borehole yields is observed. In the former Yugo-slav Republic of Macedonia, widespread and severe increase of abstraction has resulted in a reduction of borehole yields, local but severe reduction in baseflow and spring flow, and degrada-tion of ecosystems.
Nitrate and heavy metals are present in the Greek side of the aquifer while nitrogen, pesticides, heavy metals, pathogens, industrial organic compounds and hydrocarbons are present in the part that extends to the former Yugoslav Republic of Macedonia. Polluted water is drawn into the aquifer in both countries.
According to both countries, there are no transboundary impacts.
In Greece, the implementation of appropriate management measures are planned or already implemented in accordance to the WFD; monitoring, vulnerability mapping for land use planning, and wastewater treatment are needed.
Necessary measures in the former Yugoslav Republic of Mac-edonia include increased efficiency of groundwater use, moni-toring of quantity and quality, protection zones, vulnerability mapping, good agricultural practices and public awareness; the treatment of industrial effluents need to be improved, while other measures are planned.
According to the former Yugoslav Republic of Macedonia, the exchange of data between the two countries needs to be improved.
292 | part iv Chapter 6 DRAINAGE BASIN OF THE MEDITERRANEAN SEA | 293
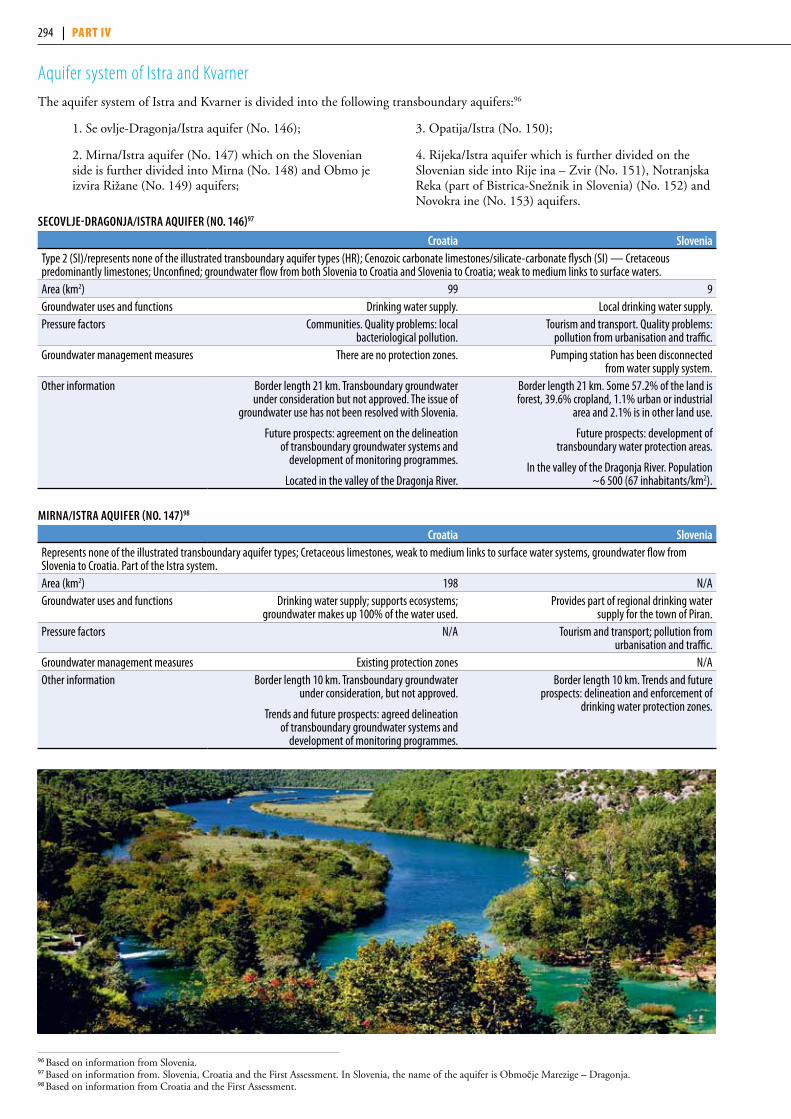
96 Based on information from Slovenia.97 Based on information from. Slovenia, Croatia and the First Assessment. In Slovenia, the name of the aquifer is Območje Marezige – Dragonja. 98 Based on information from Croatia and the First Assessment.
Aquifer system of Istra and KvarnerThe aquifer system of Istra and Kvarner is divided into the following transboundary aquifers:96
1. Sečovlje-Dragonja/Istra aquifer (No. 146);
2. Mirna/Istra aquifer (No. 147) which on the Slovenian side is further divided into Mirna (No. 148) and Območje izvira Rižane (No. 149) aquifers;
3. Opatija/Istra (No. 150);
4. Rijeka/Istra aquifer which is further divided on the Slovenian side into Riječina – Zvir (No. 151), Notranjska Reka (part of Bistrica-Snežnik in Slovenia) (No. 152) and Novokračine (No. 153) aquifers.
SeCovLje-DRAgonjA/iSTRA AquifeR (no. 146)97
Croatia SloveniaType 2 (SI)/represents none of the illustrated transboundary aquifer types (HR); Cenozoic carbonate limestones/silicate-carbonate flysch (SI) — Cretaceous predominantly limestones; Unconfined; groundwater flow from both Slovenia to Croatia and Slovenia to Croatia; weak to medium links to surface waters.Area (km2) 99 9Groundwater uses and functions Drinking water supply. Local drinking water supply. Pressure factors Communities. Quality problems: local
bacteriological pollution.Tourism and transport. Quality problems:
pollution from urbanisation and traffic.Groundwater management measures There are no protection zones. Pumping station has been disconnected
from water supply system.Other information Border length 21 km. Transboundary groundwater
under consideration but not approved. The issue of groundwater use has not been resolved with Slovenia.
Future prospects: agreement on the delineation of transboundary groundwater systems and
development of monitoring programmes.
Located in the valley of the Dragonja River.
Border length 21 km. Some 57.2% of the land is forest, 39.6% cropland, 1.1% urban or industrial
area and 2.1% is in other land use.
Future prospects: development of transboundary water protection areas.
In the valley of the Dragonja River. Population ~6 500 (67 inhabitants/km2).
miRnA/iSTRA AquifeR (no. 147)98
Croatia SloveniaRepresents none of the illustrated transboundary aquifer types; Cretaceous limestones, weak to medium links to surface water systems, groundwater flow from Slovenia to Croatia. Part of the Istra system.Area (km2) 198 N/AGroundwater uses and functions Drinking water supply; supports ecosystems;
groundwater makes up 100% of the water used.Provides part of regional drinking water
supply for the town of Piran.Pressure factors N/A Tourism and transport; pollution from
urbanisation and traffic.Groundwater management measures Existing protection zones N/AOther information Border length 10 km. Transboundary groundwater
under consideration, but not approved.
Trends and future prospects: agreed delineation of transboundary groundwater systems and
development of monitoring programmes.
Border length 10 km. Trends and future prospects: delineation and enforcement of
drinking water protection zones.
294 | part iv
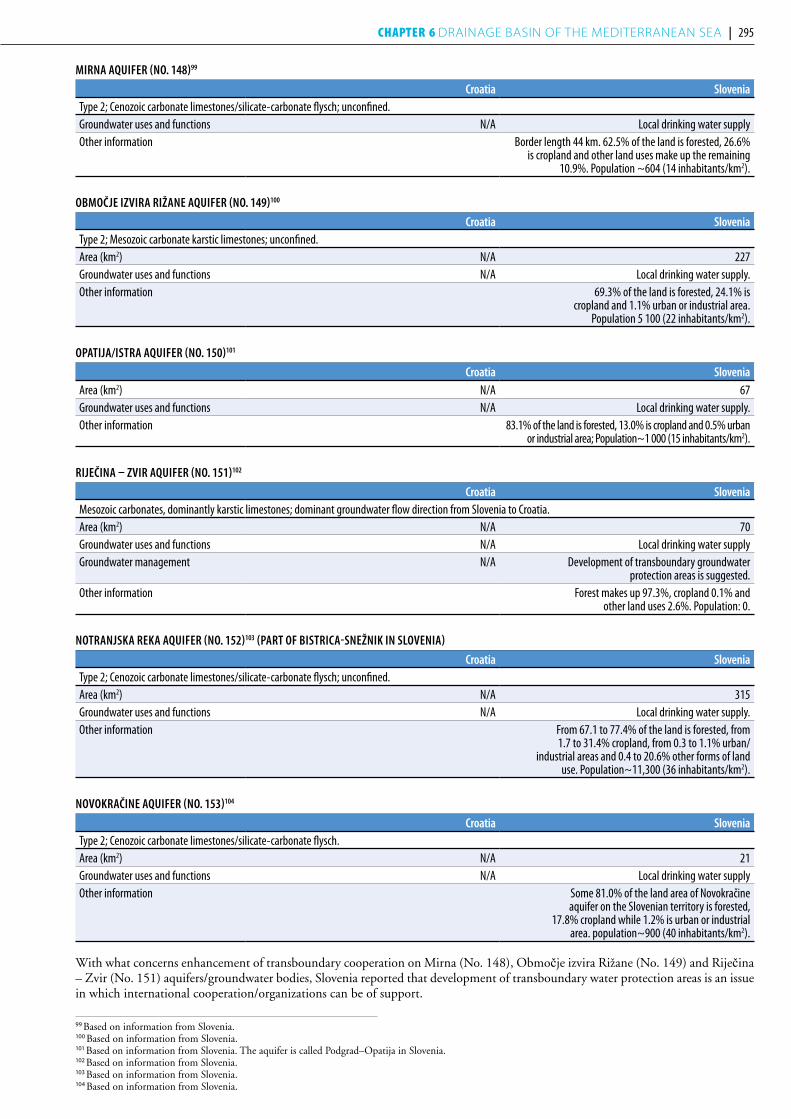
miRnA AquifeR (no. 148)99
Croatia SloveniaType 2; Cenozoic carbonate limestones/silicate-carbonate flysch; unconfined. Groundwater uses and functions N/A Local drinking water supplyOther information Border length 44 km. 62.5% of the land is forested, 26.6%
is cropland and other land uses make up the remaining 10.9%. Population ~604 (14 inhabitants/km2).
oBmoČje iZviRA RižAne AquifeR (no. 149)100
Croatia SloveniaType 2; Mesozoic carbonate karstic limestones; unconfined. Area (km2) N/A 227Groundwater uses and functions N/A Local drinking water supply.Other information 69.3% of the land is forested, 24.1% is
cropland and 1.1% urban or industrial area. Population 5 100 (22 inhabitants/km2).
opATijA/iSTRA AquifeR (no. 150)101
Croatia SloveniaArea (km2) N/A 67Groundwater uses and functions N/A Local drinking water supply.Other information 83.1% of the land is forested, 13.0% is cropland and 0.5% urban
or industrial area; Population~1 000 (15 inhabitants/km2).
RijeČinA – ZviR AquifeR (no. 151)102
Croatia SloveniaMesozoic carbonates, dominantly karstic limestones; dominant groundwater flow direction from Slovenia to Croatia.Area (km2) N/A 70Groundwater uses and functions N/A Local drinking water supplyGroundwater management N/A Development of transboundary groundwater
protection areas is suggested.Other information Forest makes up 97.3%, cropland 0.1% and
other land uses 2.6%. Population: 0.
noTRAnjSkA RekA AquifeR (no. 152)103 (pART of BiSTRiCA-Snežnik in SLoveniA)
Croatia SloveniaType 2; Cenozoic carbonate limestones/silicate-carbonate flysch; unconfined.Area (km2) N/A 315Groundwater uses and functions N/A Local drinking water supply.Other information From 67.1 to 77.4% of the land is forested, from
1.7 to 31.4% cropland, from 0.3 to 1.1% urban/industrial areas and 0.4 to 20.6% other forms of land
use. Population~11,300 (36 inhabitants/km2).
novokRAČine AquifeR (no. 153)104
Croatia SloveniaType 2; Cenozoic carbonate limestones/silicate-carbonate flysch. Area (km2) N/A 21Groundwater uses and functions N/A Local drinking water supplyOther information Some 81.0% of the land area of Novokračine
aquifer on the Slovenian territory is forested, 17.8% cropland while 1.2% is urban or industrial
area. population~900 (40 inhabitants/km2).
With what concerns enhancement of transboundary cooperation on Mirna (No. 148), Območje izvira Rižane (No. 149) and Riječina – Zvir (No. 151) aquifers/groundwater bodies, Slovenia reported that development of transboundary water protection areas is an issue in which international cooperation/organizations can be of support.
99 Based on information from Slovenia. 100 Based on information from Slovenia.101 Based on information from Slovenia. The aquifer is called Podgrad–Opatija in Slovenia.102 Based on information from Slovenia. 103 Based on information from Slovenia.104 Based on information from Slovenia.
294 | part iv Chapter 6 DRAINAGE BASIN OF THE MEDITERRANEAN SEA | 295

CeTinA AquifeR (no. 154)105
Croatia Bosnia and herzegovinaRepresents none of the illustrated transboundary aquifer types; Palaeozoic, Mesozoic and Cenozoic karstic limestones; in hydraulic connection with recent sediments; groundwater flow from Bosnia and Herzegovina to Croatia; strong links to surface water system.Area (km2) 587 2 650Thickness: mean, max (m) 500, 1 000 500, 1 000Groundwater uses and functions Groundwater covers 5% of the water used in
Croatian part. Drinking water supply; 95% of groundwater is used for hydropower production.
Up to 50% for hydroelectric power, smaller amounts for drinking water, irrigation, industry,
mining and livestock; also support of ecosystems and maintaining baseflow and springs.
Pressure factors Pressure from crop and animal production. Issues related to water quantity have resulted to widespread
but moderate degradation of ecosystems; polluted water is drawn into the aquifer. Transboundary
effect from sinkholes in Bosnia and Herzegovina.
Pressure from solid waste disposal, wastewater, agriculture and industry. Local and moderate nitrogen, pesticide,
heavy metal, pathogen, organic and hydrocarbon pollution have been detected. Issues related to water quantity
have resulted to widespread but moderate degradation of ecosystems; polluted water is drawn into the aquifer
sinkholes with transboundary effects in Croatia.Groundwater management measures Quantity and quality monitoring needs to be improved,
and so do abstraction control and protection zone systems. It is also necessary to improve protection of the upper catchment; while vulnerability mapping is planned, improved wastewater treatment is needed.
There are groundwater protection zones in Croatia; it is necessary to establish them in Bosnia and Herzegovina as well. Agreed delineation of transboundary groundwaters, and development of monitoring programmes are needed.
Other information Border length 70 km. Border length 70 km. Transboundary aquifer under consideration, but not approved. Includes the Glamočko-
Kupreško and other Poljes with very large springs.
DinARiC LiTToRAL (weST CoAST) AquifeR (no. 155)106
Croatia montenegroType 2; Jurassic and Cretaceous karstic limestones; weakly connected to surface water systems. Area (km2) N/A 200Thickness: mean, max (m) 500, >1 000 500, >1 000Groundwater uses and functions N/A Groundwater provides 100% of total water use. 25-
50% each for drinking water supply and industry, <25% each for irrigation and livestock.
Pressure factors N/A Abstraction of groundwater, widespread and severe saline water intrusion at the coastal area
has resulted in high salinity of groundwater.Groundwater management measures N/A Existing control of abstraction, efficiency of water use,
protection zones, agricultural practices, groundwater monitoring and public awareness need to be improved.
Other information According to existing data, no transboundary groundwater is recognized.
105 Based on information from Croatia and the First Assessment.106 Based on information from Croatia and the First Assessment.
296 | part iv

meTohijA AquifeR (no. 156)107
kosovo (un administered territory under un Security Council resolution 1244) montenegro
Type 1 (in ME)/4; Tertiary (Miocene) alluvial sediments (Kosovo), Triassic karstic limestones (ME); weak links to surface water systems.108
Area (km2) 1 000 300 - 400Thickness: mean, max (m) 100, 200 300, 800Groundwater uses and functions 25-50% for irrigation, <25% each for drinking water, industry
and livestock, maintaining baseflow and spring flow.
Groundwater is 20% of total water use.
>25% for drinking water, <25% each for irrigation, mining and industry.
Groundwater is 20% of total water use.Pressure factors Agriculture and local small industries. Pesticides and
industrial organic compounds in the groundwater.No pressures exerted on the aquifer.
Groundwater management measures Several management measures are needed. Several management measures are needed.Other information No assessment regarding the status of the
aquifer. No transboundary impacts.No transboundary impacts.
peSTeR AquifeR (no. 157)109
montenegro SerbiaType 2; Middle Triassic karstic limestones; weak links to surface water systems, dominant groundwater flow is towards the south-west from Serbia to Montenegro.Area (km2) >150 317Thickness: mean, max (m) 350, 1 000 350, 1 000Groundwater uses and functions <25% used for drinking water supply, also used
for livestock and for mining activities.75% for drinking water supply, <25% for industry and livestock. Supports ecosystems, maintains baseflow and springs. Naturally discharging water from springs is used for drinking water supply;
the volume of water used is less than the natural recharge.Pressure factors Domestic wastewater Local pressure from dewatering a coal mine. Lack of
wastewater collection and treatment facilities at rural settlements is a potential threat. Quality could be
endangered through sinkholes in Pester polje. Groundwater management measures Systematic quantity and quality monitoring and
vulnerability mapping for land use planning need to be established. Exchange of data
between the two countries is needed.
Systematic quantity and quality monitoring needs to be established. There is no need for intensive bilateral cooperation
for the management of the transboundary aquifer.
Other information Quality (water supply) and quantity of groundwater is good. Land use: 23.06% forest, 1.69% cropland,
75.06% grassland, 0.12% urban/industrial areas, 0.07% other forms (bare rocks). The area is inaccessible and sparsely populated. Main economic activity: animal
husbandry. Population 1 700 (6 inhabitants/km2).
koRAB/BiSTRA – STogovo AquifeR (no. 158)110
Albania The former yugoslav Republic of macedoniaType 1; Mesozoic and Paleozoic schists and flysch sediments, containing Triassic evaporites (anhydrite and gypsum) and Triassic and Jurassic karstic limestones; minor alluvial sediments with free (unconfined) groundwater; groundwater flow occurs in both directions, but more from the former Yugoslav Republic of Macedonia to Albania; weak links to surface waters. Area (km2) ~140 N/AThickness: mean, max (m) 500 – 700, >2 000 500 – 700, >2 000Groundwater uses and functions 25-50% for thermal spa, < 25% each for drinking, irrigation
and livestock; groundwater provides >90% of total supply.Drinking water, irrigation, mining; groundwater
provides >90% of total supply.Pressure factors Waste disposal, sanitation and sewer leakage. Moderate
pathogens occurrence locally; polluted water is drawn into the aquifer. Local and moderate degradation of ecosystems
is an issue related to the quantity of groundwater.
Groundwater abstraction and agriculture. Discharge of the springs has been reduced locally. There are
transboundary impacts related to groundwater quantity.
Groundwater management measures Measures needed: detailed hydrogeological and vulnerability mapping, delineation of protection zones, wastewater treatment
and public awareness campaigns. Enhanced cooperation, setting up of transboundary institutions and creation of a joint
programme for quantity and quality monitoring of the sulfur thermo-mineral springs are needed. Data are exchanged.
Improvements are needed in the monitoring of the aquifer and the protection zone system in place.
Other information Comparative study of the thermo-mineral springs of Albania and the former Yugoslav Republic of
Macedonia is needed. There are large fresh water karst springs issuing at high elevations.
There are transboundary impacts related to groundwater quantity. Transboundary
agreements covering this aquifer exist.
107 Based on the First Assessment.108 The uncertainty about which drainage basin, Adriatic or Black Sea, this aquifer belongs to has persisted since the First Assessment. 109 Based on information from Serbia and the First Assessment. 110 Based on the First Assessment.
296 | part iv Chapter 6 DRAINAGE BASIN OF THE MEDITERRANEAN SEA | 297
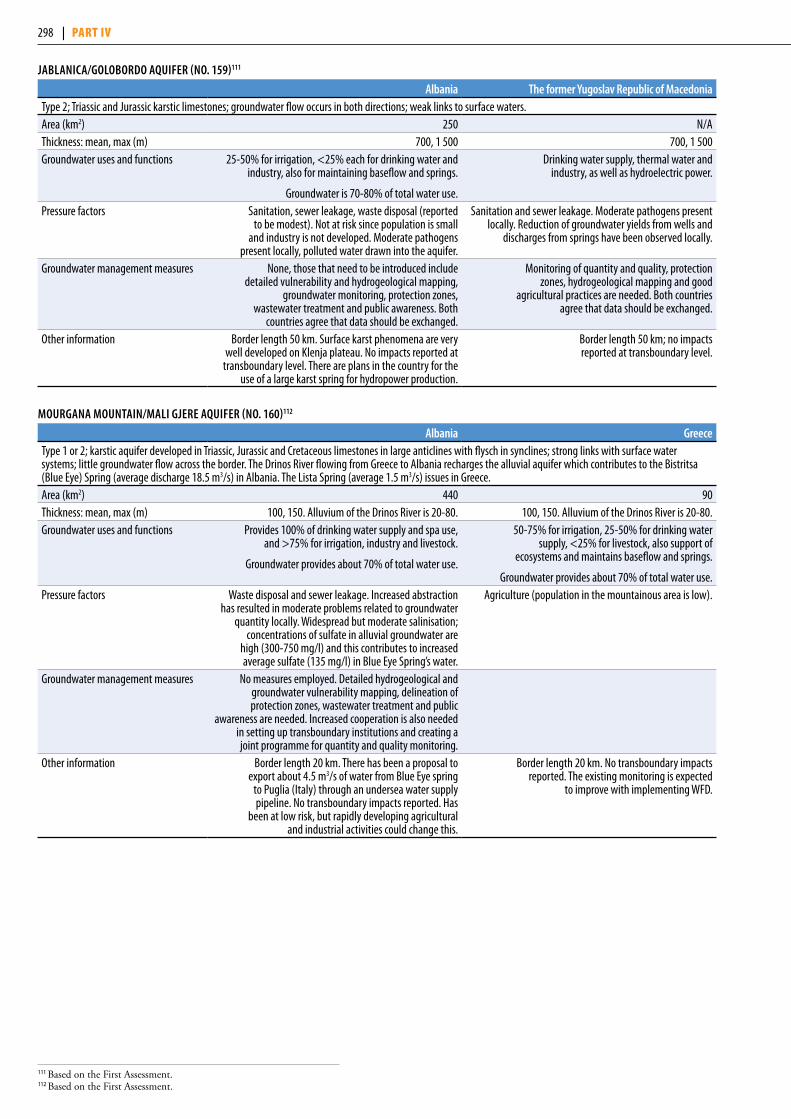
jABLAniCA/goLoBoRDo AquifeR (no. 159)111
Albania The former yugoslav Republic of macedoniaType 2; Triassic and Jurassic karstic limestones; groundwater flow occurs in both directions; weak links to surface waters.Area (km2) 250 N/AThickness: mean, max (m) 700, 1 500 700, 1 500Groundwater uses and functions 25-50% for irrigation, <25% each for drinking water and
industry, also for maintaining baseflow and springs.
Groundwater is 70-80% of total water use.
Drinking water supply, thermal water and industry, as well as hydroelectric power.
Pressure factors Sanitation, sewer leakage, waste disposal (reported to be modest). Not at risk since population is small
and industry is not developed. Moderate pathogens present locally, polluted water drawn into the aquifer.
Sanitation and sewer leakage. Moderate pathogens present locally. Reduction of groundwater yields from wells and
discharges from springs have been observed locally.
Groundwater management measures None, those that need to be introduced include detailed vulnerability and hydrogeological mapping,
groundwater monitoring, protection zones, wastewater treatment and public awareness. Both
countries agree that data should be exchanged.
Monitoring of quantity and quality, protection zones, hydrogeological mapping and good
agricultural practices are needed. Both countries agree that data should be exchanged.
Other information Border length 50 km. Surface karst phenomena are very well developed on Klenja plateau. No impacts reported at
transboundary level. There are plans in the country for the use of a large karst spring for hydropower production.
Border length 50 km; no impacts reported at transboundary level.
mouRgAnA mounTAin/mALi gjeRe AquifeR (no. 160)112
Albania greeceType 1 or 2; karstic aquifer developed in Triassic, Jurassic and Cretaceous limestones in large anticlines with flysch in synclines; strong links with surface water systems; little groundwater flow across the border. The Drinos River flowing from Greece to Albania recharges the alluvial aquifer which contributes to the Bistritsa (Blue Eye) Spring (average discharge 18.5 m3/s) in Albania. The Lista Spring (average 1.5 m3/s) issues in Greece. Area (km2) 440 90Thickness: mean, max (m) 100, 150. Alluvium of the Drinos River is 20-80. 100, 150. Alluvium of the Drinos River is 20-80.Groundwater uses and functions Provides 100% of drinking water supply and spa use,
and >75% for irrigation, industry and livestock.
Groundwater provides about 70% of total water use.
50-75% for irrigation, 25-50% for drinking water supply, <25% for livestock, also support of
ecosystems and maintains baseflow and springs.
Groundwater provides about 70% of total water use.Pressure factors Waste disposal and sewer leakage. Increased abstraction
has resulted in moderate problems related to groundwater quantity locally. Widespread but moderate salinisation;
concentrations of sulfate in alluvial groundwater are high (300-750 mg/l) and this contributes to increased average sulfate (135 mg/l) in Blue Eye Spring’s water.
Agriculture (population in the mountainous area is low).
Groundwater management measures No measures employed. Detailed hydrogeological and groundwater vulnerability mapping, delineation of protection zones, wastewater treatment and public
awareness are needed. Increased cooperation is also needed in setting up transboundary institutions and creating a joint programme for quantity and quality monitoring.
Other information Border length 20 km. There has been a proposal to export about 4.5 m3/s of water from Blue Eye spring
to Puglia (Italy) through an undersea water supply pipeline. No transboundary impacts reported. Has
been at low risk, but rapidly developing agricultural and industrial activities could change this.
Border length 20 km. No transboundary impacts reported. The existing monitoring is expected
to improve with implementing WFD.
111 Based on the First Assessment. 112 Based on the First Assessment.
298 | part iv

Chapter 7 Drainage basins of the north sea anD eastern atlantic
299
this chapter deals with the assessment of transboundary rivers, lakes and groundwaters, as well as selected ramsar sites or other wetlands of transboundary importance, which are located in the basins of the north sea and eastern atlantic.
Assessed transboundary waters in the drainage basins of the North Sea and Eastern Atlantic
Basin/sub-basin(s) Recipient Riparian countries Lakes in the basinTransboundary groundwaters
within the basinRamsar Sites/wetlands of
transboundary importanceGlama/Glomma North Sea NO, SEKlarälven North Sea NO, SEWiedau/Vidaa North Sea DK, DE Wiedau/Vidaa aquifer (DK, DE)
(includes Gotteskoog-Marchen (Ei 22), Gotteskoog-Altmoränengeest
(Ei 23) (DE), DK4.1.2.1.Hellevad, DK4.1.1.2.Hjerpsted, DK4.1.2.2.Kliplev,
DK4.1.1.1.Tinglev, DK4.1.2.4.Tinglev, DK4.1.3.1.Tinglev, DK4.1.2.3.Tonder(DK))
Wadden Sea (DK, DE, NL)
Elbe North Sea AT, CZ, DE, PL Lainsitz Area/Trebon Pan (AT, CZ), Cheb Pan, Decinsky Sneznik Dolni Krmenice
and Krimice Cretaceous, Upper Ploucnice Cretaceous, Glaciofluvial Sediments
in Frydlant Offspur, Police Pan and Hronov-Porici Cretaceous (CZ, DE)
Krkonoše/Karkonosze subalpine peatbogs (CZ, PL)
Ems North Sea DE, NL DE_GB_:37_01, 39_10 (DE, NL). NLGW:0001, 0008 (DE, NL), 2 – 5, 15,
101, 105, 109 – 113 (NL). DE_GB_3_: 01 – 20. DE_GB_36_01 – 05.
DE_GB_:37_02 – 03, 38_01 – 02. DE_GB_39_01– 09 (DE).
Wadden Sea (DK, DE, NL)
Rhine North Sea AT, BE, DE, FR, IT, LI, LU, NL, CH
Lake Constance DE_GB_3_:01, 04, 08, 09, 11 – 14, 19, 20. DE_GB_37_:01, 02. NLGW:0001, 0008, 109 (DE). Lower Lias Sandstone
of Hettange Luxembourg, confined non-mineralized Vosges sandstone (BE, FR), Pliocene of Haguenau and
the aquifer of Alsace (FR, DE, CH), unconfined Vosges sandstone, Lower Trias sanstone of Houiller Bassin (FR,
DE), Limestones and Jurassic marls of Jura Mountains and, Jurassic limestones
of Jura Mountains - BV Doubs and, Jurassic Limestones BV of Jougnena and Orbe (FR, CH), Sediments of Quaternary and Pliocene (FR, DE), Oberrheingraben
Mitte/Süd (FR, DE, CH), North-Germany/Netherlands (GE, NL), Hochrhein (GE, CH)
Upper Rhine (Rhin supérieur/Oberrhein) (FR, DE), Wadden
Sea (DK, DE, NL)
- Moselle Rhine BE, FR, DE, LU-- Saar Moselle FR, DE

Basin/sub-basin(s) Recipient Riparian countries Lakes in the basinTransboundary groundwaters
within the basinRamsar Sites/wetlands of
transboundary importanceMeuse North Sea BE, FR, DE, LU, NL Lower Lias Sandstones of Hettange
Luxembourg, confined non-mineralized Vosges sandstones (BE,
FR), Limestones of Avesnois (BE, FR), cks_0200_gwl_1 (BE, NL),
blks_1100_gwl_1s, blks_1100_gwl_2s (BE), Chalk du Valenciennois
(BE, FR), Brussels sands (BE), Chalks de la Haine (BE, FR), Landenian
sands (east) (BE), Schelde Basin Aquifer System (BE, FR, NL), Roerdal
Slenk System, Hard Rock (BE, NL), Venlo-Krefeld Aquifer(GE,NL)
Scheldt North Sea BE, FR, NL Limestones of Avesnois, Carboniferous Limestone of Roubaix-Tourcoing, Chalk
of Valenciennois, Chalks of Haine, Chalk of the valley of Deule, Chalks of Deûle
(BE, FR), Chalk of the valleys of Scarpe and Sensée (FR), Hard Rock (BE, FR, NL),
Brussels sands (BE), Landenian sands (east), Landenian sands of Flemish
Region (BE), Thanetian sands of Flemish Region, Sands of the valley of Haine, Landenian sands of Orchies (BE, FR),
Saline groundwater in shallow layers of sand, Fresh groundwater in shallow
layers of sand, Fresh groundwater in bay areas, Groundwater in deep layers of
sand (BE, NL), Bruxellien_Brusseliaan_5, Landenien_Landeniaan_3, Hardrock
of Brabant, Socle_Sokkel_:1, 2. Ypresien_leperiaan_4 (BE), cks_0200_
gwl_1 (BE, NL), cvs_0100_gwl_1, cvs_0160_gwl_3 (BE, FR), cvs_0400_
gwl_1, cvs_0800_gwl_3 (BE), blks_0600_gwl_1, blks_1100_gwl_
2s (BE). ss_1000_gwl_:1 (BE, FR), 2 (BE). ss_1300_gwl_:2 (BE), 1, 4 (BE,
FR). kps_0160_gwl_: 1 (BE, FR), 2 (BE), 3 (BE, NL). kps_0120_gwl_: 1, 2 (BE).
Bidasoa Eastern Atlantic FR, ES Bidasoa estuary/Txingudi (FR, ES)Miño/Minho Eastern Atlantic PT, ES Frieira Reservoir Alluvium of Minho/Bajo Miño
(U.H. 01.26) (PT, ES)Lima/Limia Eastern Atlantic PT, ESDouro Eastern Atlantic PT, ES Nave de Haver/Ciudad Rodrigo-
Salamanca (U.H.02–19) (PT, ES)Tejo/Tajo Eastern Atlantic PT, ES Cedillo Reservoir Toulóes/Moraleja (U.H.03–13) (PT, ES)Guadiana Eastern Atlantic PT, ES Miocene-Pliocene-Quatenary of
Elvas-Campo Maior/Vegas Bajas (U.H.04–09), Mourão-Ficalho (PT, ES)
Erne Eastern Atlantic IE, GB Lough Melvin IEGBNI_NB_G_:011, 012, 014, 019. IEGBNI_NW_G_:005, 009 – 014 (IE, GB), 015 (GB), 017, 021, 025 (IE, GB),
027 (GB), 028, 030 – 036, 039, 040, 044, 050, 063 (IE, GB). IE_NW_G_:
018, 042, 043, 045, 046 (IE), 047 (IE, GB), 061, 062, 067 – 073 (IE),
074 (IE, GB), 076 – 084, 086 – 092, 095 – 098. IE_NB_G_:013, 036 (IE).
Foyle Eastern Atlantic IE, GB IEGBNI_NW_G_:005, 010, 011, 014, 017, 044, 048, 050, 051, 059, 094 (IE, GB). IE_NW_G_: 018, 043, 045, 046 (IE) 047 (IE, GB), 049, 052, 054, 056,
058, 067 – 071, 073 (IE), 075 (IE, GB), 076 – 079, 082 – 087, 089 – 091 (IE).
Lough Foyle wetland (IE, GB)
Bann Eastern Atlantic IE, GB Lough Neagh IEGBNI_NB_G_:007, 011, 012, 014, 019. IEGBNI_NW_G_:025, 028, 063 (IE,
GB). IE_NB_G_:013, 015 – 018, 021 – 035, 037, 038. IE_NW_G_061 (IE).
Notes: The groundwaters in italics have not been assessed for the present publication.
300 | part IV

Glama/Glomma rIVer BasIn1
Norway and Sweden share the basin of the about 604-km long Glama/Glomma River2, as approximately 1% of the catchment lies within Sweden. The main watercourse Glama/Glomma, joined with the Lågen, the western tributary, runs from the Nor-wegian-Swedish highland areas to Oslofjord. Lake Aursunden and Lake Mjøsa are lakes in the basin.
Basin of the Glama/Glomma River Country Area in the country (km2) Country’s share (%)Norway 42 019 99Sweden 422 1
Total 42 441Source: Norwegian Water and Energy Directorate.
Hydrology and hydrogeologySome 70% of the catchment area is above 500 m a.s.l., and 20% above 1,000 m a.s.l. The surface water resources are estimated at 22 km3/year (as run-off ). There are more than 40 dams and 5 transfers of water between sub-basins in the watercourse.
The Glama/Glomma has experienced several major floods due to melting snow from Jotunheimen, Rondane and other mountain areas in Norway. In 1995, a combination of snow-melt and heavy rainfall caused extensive damage to infrastructure, buildings, and farm land along the water course.
Transboundary groundwaters are irrelevant water resources in the basin.
Pressures and statusThere are 5 Ramsar Sites and 2 national parks partly within the river basin. Some 32 % of the basin is protected against further hydropower development.
The total water withdrawal in the Norwegian part of the basin is 3.9 × 10⁶ m3/year, out of which 5% is for domestic use, and the rest is temporary reservoir storage for hydropower production3.
Within the river basin, there are more than 50 hydropower plants and more than 20 storage reservoirs. The hydropower stations on the rivers Glama/Glomma and Lågen cover about 9% of Nor-way’s electricity demand.
The total agricultural area in the basin, mainly located in the southern part, is about 3,500 km2. The lower part of the river was industrialized in the beginning of the 20th century, the main activities being pulp and paper industries, and a zinc smelter. To-day, one of the main industrial activities is a chromium-titanium plant situated close to the river mouth. There is also a large plant for waste incineration, and the pulp and chemical industry is still important in the community of Lower Glomma.
The risk analysis done in accordance with the WFD (2011) shows that approximately 30% of the water bodies are at risk of not achieving good ecological status in 2015. Some 33 % are possibly at risk, and the rest are of good status.
Rhine, Lobith, 1901-2007
Elbe, Neu-Darchau, 1874-2008
Glama, Langnes, 1901-2007
Douro, Regua, 1933-1969
Mino, Foz do Mouro, 1976-1989
Moselle, Cochem, 1900-2008
Guadiana, Pulo Do Lobo, 1946-1990
0 10 20 30 40 50 60 70 80km3
0 10 20 30 40 50 60 70 80km3
River, Station,Time series
70.289
22.339
21.549
Erne, Ballyshannon, 1973-1979
Ems, Versen, 1940-2009
Saar, Fremersdorf, 1952-2009
Klarälven, Nybergsund, 1981-2010
Vechte, Vechterweerd, 1978-1982
Scheldt, Kain, 1967-1980
River, Station,Time series
17.181
10.283
9.978
4.928
2.69
2.544
2.306
2.2
1.02
0.66
Long-term mean annual flow (km³) of rivers discharging to the North Sea and Eastern Atlantic
1 Based on information provided by Norway and the First Assessment.2 The river is known as Glama in Sweden and Glomma in Norway.3 Sources: Norwegian Water and Energy Directorate, the Glommens and Laagens Water Management Association.
Sources: Norwegian Water and Energy Directorate (Klarälven); Global Runoff Data Centre, Koblenz (all other rivers).
300 | part IV Chapter 7 Drainage basins of the north sea anD eastern atlantic | 301
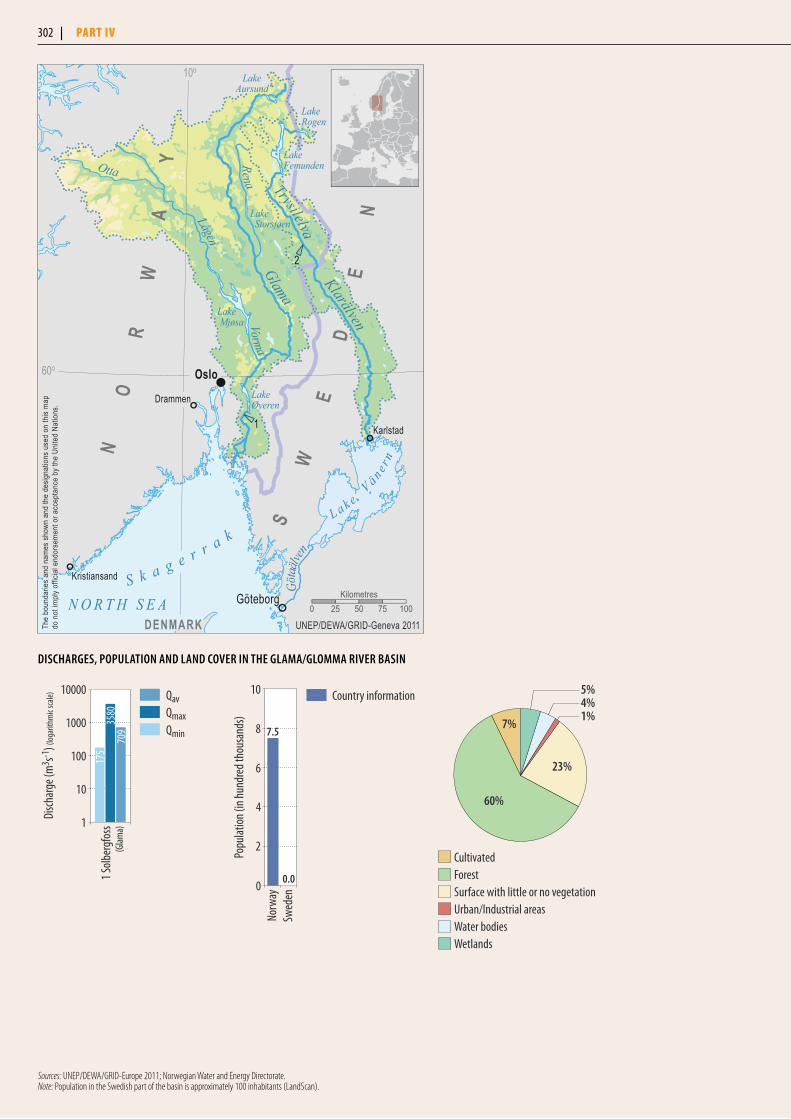
Sources: UNEP/DEWA/GRID-Europe 2011; Norwegian Water and Energy Directorate.Note: Population in the Swedish part of the basin is approximately 100 inhabitants (LandScan).
1 Sol
berg
foss
Disc
harg
e (m
3 s-1) (
loga
rithm
ic sc
ale)
3580
709
(Glam
a)1
10
100
1000
10000
175
QavQmaxQmin
Popu
latio
n (in
hun
dred
thou
sand
s)
0
2
4
6
8
10
Swed
enNo
rway
0.0
7.5
Country information
1%4%5%
CultivatedForestSurface with little or no vegetationUrban/Industrial areasWater bodiesWetlands
60%
23%
7%
DiSChARgeS, popuLATion AnD LAnD CoveR in The gLAmA/gLommA RiveR BASin
1
2
Oslo
Karlstad
Drammen
Göteborg
Kristiansand
Glama
LakeFemunden
LakeAursund
LakeRogen
TrysilelvaKlarälven
L a k e Vä n e r
n
Vorma
S k a g e r r a kRena
Otta
Götaä
lven
Lågen
Lake Mjøsa
N O R T H S E A
LakeØyeren
Lake Storsjøen
NO
RW
AY
SW
ED
EN
DENMARK
10o
60o
0 25 50 75 100Kilometres
UNEP/DEWA/GRID-Geneva 2011The
boun
darie
s an
d na
mes
sho
wn a
nd th
e de
signa
tions
use
d on
this
map
do n
ot im
ply
offic
ial e
ndor
sem
ent o
r acc
epta
nce
by th
e Un
ited
Natio
ns.
302 | part IV

The “Riverine inputs and direct discharges to Norwegian coastal waters – 2008” programme shows that the input of total organic carbon (TOC) is 109,124 tons from the Glama/Glomma in 2008 to the Skagerak area. The corresponding figures for total phosphorus is 543 tons, and for total nitrogen is 15,075 tons. This represents an increase in the concentrations of total nitrogen since 1990.
Transboundary cooperation and responsesTransboundary issues between Sweden and Norway are handled in accordance with the Water Convention (1992), and a Memo-randum of Understanding (2008) describing the implementa-tion of the WFD by the two countries.
Norway, not being an EU member State, voluntarily imple-mented the WFD in selected sub-districts across the country from 2007 until 2009, thus gaining experience in River Basin Management planning. River Basin Management Plans for the selected sub-districts were adopted by the County Councils in 2009, and approved by the national Government in June 2010. RBMPs covering the entire country are prepared from 2010 until 2015, synchronized with the time schedule of the second cycle of implementation in the EU.
TrendsMore precipitation is anticipated due to climate change, particu-larly in Western and Northern Norway. The projections from the RegClim research programme show that in the 2030–2050 pe-riod, around 20% more precipitation can be expected in autumn in these regions, compared to the period 1980–2000. In Eastern Norway, the increase in precipitation is expected to primarily oc-cur in winter. The temperature is expected to rise over the whole country, but mostly in winter and in Northern Norway.
The average wind velocity is expected to increase a little in most regions during the winter half-year. The frequency of storms causing great damage will probably rise somewhat, and will occur mostly along the coast of “Møre og Trøndelag” county.4
KlarälVen rIVer BasIn5
The almost 460-km long Klarälven River (“clear river” in Swed-ish) runs for almost 300 km on Swedish territory. The river be-gins with a number of streams flowing into Lake Femunden on the Norwegian side of the border. Some of these watercourses also come from Sweden, mainly from Lake Rogen in Härjedalen. The river flowing south from Lake Femunden is first called the Femundselva and later the Trysilelva. The river crosses the border, where it changes its name to Klarälven. It flows through northern Värmland, where it follows a valley towards the south. The river empties into Lake Vänern in Sweden, with a delta near Karlstad.
The Klarälven River has a basin area of about 7,800 km², of which 80% is covered with forests (76% of growing forest and 4% of cutting areas), 10% by wetlands, 6% by water bodies, 2% by cul-tivated area and 2% by grasslands/shrublands.
The surface water resources are estimated at 2.2 km3/year (as run-off, based on the Nybergsund gauging station some 25 km upstream from the Swedish-Norwegian border).
The river’s average discharge is 165 m3/s; the maximum meas-ured discharge was 1,650 m3/s. Spring floods are common, main-ly caused by run-off from the snowy mountains in the northern areas of the basin.
StatusThe Klarälven has clean and fresh water, suitable for bathing. The river is internationally recognized as an excellent sport fishing wa-tercourse. According to monitoring data from the river delta for the period 2003-2009, the river carried on average 53,000 tons of TOC, 66 tons of phosphorus and 1,800 tons of nitrogen per year.
The risk analysis done in accordance with the WFD (2011) in the Norwegian part of the basin shows that approximately 25% of the water bodies are at risk of not achieving good ecological status in 2015. Some 10% are possibly at risk, and the rest are of good status.
DiSChARgeS, popuLATion AnD LAnDCoveR in The KLARÄLven BASin
2 Nyb
ergs
und
Disc
harg
e (m
3 s-1) (
loga
rithm
ic sc
ale)
751
70(T
rysil
elva)1
10
100
1000
12
QavQmaxQmin
Popu
latio
n (in
ten t
hous
ands
)
0
2
4
6
8
10
Swed
enNo
rway
9.5
0.9
LandScanTM 1%1%4%
Cultivated (<1%)
Urban/Industrial areas (<1%)Surface with little or no vegetation (<1%)
ForestGrassland/ShrublandWater bodiesWetlands
Others
61%28%
6%
4 Source: Center for International Climate and Environmental Research (CICERO), Oslo. 5 Based on information provided by Norway and Sweden, and the First Assessment.
Sources: UNEP/DEWA/GRID-Europe 2011; Norwegian Water and Energy Directorate.
302 | part IV Chapter 7 Drainage basins of the north sea anD eastern atlantic | 303

The number of waters “at risk” is high for two reasons:6
(1) Many waters are acidified but treated with lime, which leads to ecological “good status”; the acidification is still there, however, thus the water bodies are “at risk”.
(2) About 60% of the watercourses have water flow changes caused by hydropower, and many of them are “at risk”; 70% of the lakes have lowered status or are “at risk” with respect to water level amplitude. This shows that the effects of hydro-power are clearly an issue.
ResponsesIn recent years, the lower parts of Klarälven and Karlstad have be-come a flood risk area. Karlstad is presently part of the Interreg project SAWA (Strategic Alliance for Integrated Water Manage-ment Actions), and works with a pilot programme within the EU Floods Directive. There is also a Swedish-Norwegian Interreg co-operation programme to promote salmon migration and ensure good ecological status in the whole transboundary river basin.
WIedau/VIdaa rIVer BasIn7
The Wiedau/Vidaa River8 is shared by Denmark and Germany (Schleswig-Holstein). It starts east of Tønder (Denmark) and flows to the west, through Ruttebüller Lake/Rudbøl Sø (shared by Germany and Denmark), discharging into the Wadden Sea at the German-Danish North Sea coast (see the assessment of the related Ramsar Site).
The Wiedau is a lowland and tidal river, with an average eleva-tion of only about 7 m a.s.l.
Basin of the Wiedau/Vidaa River Country Area in the country (km2) Country’s share (%)Denmark 1 080 80.5Germany 261 19.5
Total 1 341Sources: Ministry of Environment, Nature Protection and Nuclear Safety, Germany; LIFE Houting-project.
Hydrology and hydrogeologyThe Wiedau/Vidaa is highly controlled by weirs and gates to pro-tect it from tides and surges. The sluice at Højer town regulates the water exchange with the Wadden Sea. It discharges into the Wümme River, and finally into the North Sea.
In the past, the main parts of the watercourses in the basin were heavily modified through drainage, dredging and physical altera-tions. During the last decade, Denmark has completed a number of nature restoration projects, including the reconstruction of 27 smaller weirs to make them passable for migrating fish. Other projects brought 37 km of straightened, modified water stretches back to their original meandering state.
There is one transboundary aquifer (No. 161) in the Wiedau/Vidaa River Basin. In the German part, the aquifer is divided into two nationally defined groundwater bodies, Gotteskoog-Marchen and
6 Source: Karlstad County Administrative Board, Sweden.7 Based on information provide by Germany and the First Assessment. 8 The river is also known as the Vidå.
20 O
utflo
w W
adde
n Se
a
Disc
harg
e (m
3 s-1) (
loga
rithm
ic sc
ale)
1595
4
(Wied
au)1
10
100 QavQmaxQmin
Source: UNEP/DEWA/GRID-Europe 2011.
DiSChARgeS in The WieDAu/viDAA RiveR BASin
WieDAu/viDAA AquifeR (no. 161)
Denmark germanyType 3; ands and gravels (glacio-fluvial) of mostly Pleistocene, some Holocene age; groundwater flow direction from varies from north-northwest (groundwater flow toward the Wiedau/Vidaa river) to west-southwest (toward the North Sea); strong links with surface waters.Area (km2) 1 080 261Thickness: mean, max (m) 30, 100 20, 60Groundwater uses and functions The use of groundwater for agricultural irrigation
is substantial in the DK4.1.1.1.Tinglev and DK4.1.2.4.Tinglev groundwater bodies.
Groundwater supports ecosystems and maintain baseflow and springs.
Pressure factors Pollution from agriculture (mainly nitrate and pesticides) in DK4.1.1.1.Tinglev and DK4.1.1.2.Hjerpsted.
Natural/background pollution widespread and severe in Ei 22; pollution from agriculture
widespread and severe in Ei 23. Other information There are substantial amounts of Holocene and Pleistocene
sediments (more than 300 m) in parts of the basin, due to sedimentation in buried valley structures.
The aquifer occurs in the entire German part of the Wiedau/Vidaa River Basin; extent defined by the groundwater
bodies Ei 22 and Ei 23. The shallow aquifer is mostly recharged in the Pleistocene covered area (groundwater body Ei 23) in the hinterland of the coastal marsh. In the coastal area, the aquifer is covered by marshy sediments and recharge by precipitation is less (groundwater body
Ei 22). In the marshy part: upward groundwater flow and aquifer discharge in an artifical drainage system.
304 | part IV
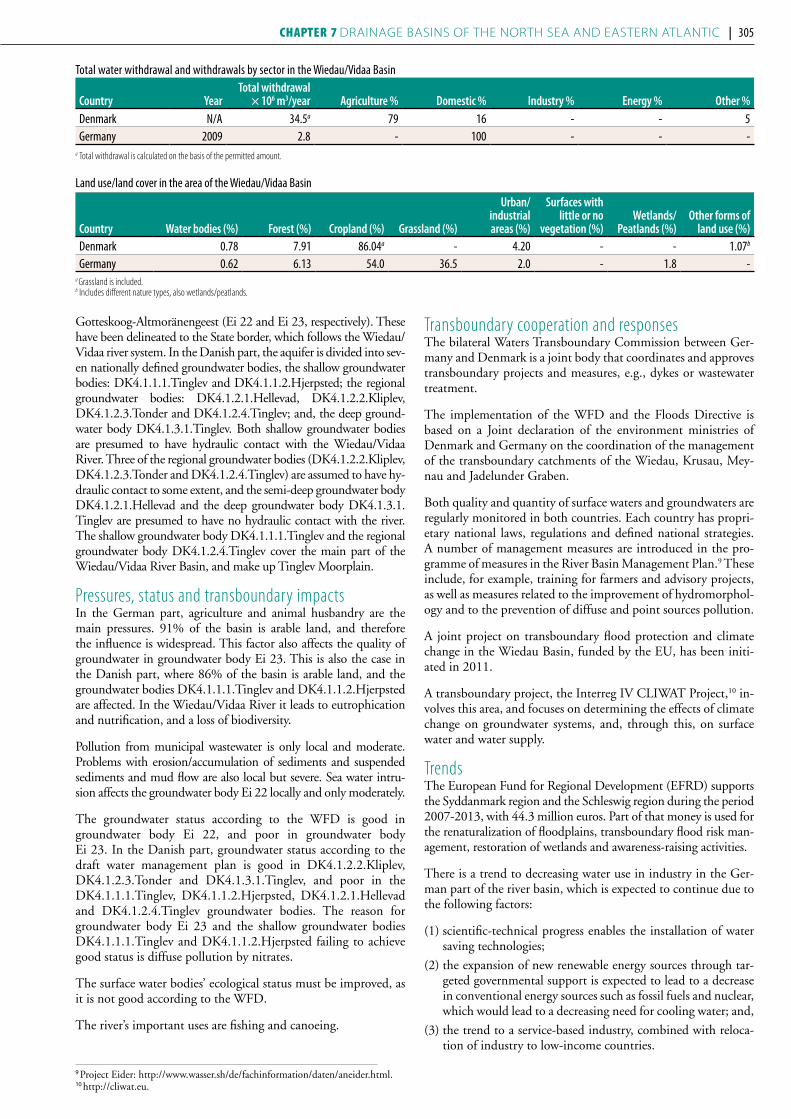
Gotteskoog-Altmoränengeest (Ei 22 and Ei 23, respectively). These have been delineated to the State border, which follows the Wiedau/Vidaa river system. In the Danish part, the aquifer is divided into sev-en nationally defined groundwater bodies, the shallow groundwater bodies: DK4.1.1.1.Tinglev and DK4.1.1.2.Hjerpsted; the regional groundwater bodies: DK4.1.2.1.Hellevad, DK4.1.2.2.Kliplev, DK4.1.2.3.Tonder and DK4.1.2.4.Tinglev; and, the deep ground-water body DK4.1.3.1.Tinglev. Both shallow groundwater bodies are presumed to have hydraulic contact with the Wiedau/Vidaa River. Three of the regional groundwater bodies (DK4.1.2.2.Kliplev, DK4.1.2.3.Tonder and DK4.1.2.4.Tinglev) are assumed to have hy-draulic contact to some extent, and the semi-deep groundwater body DK4.1.2.1.Hellevad and the deep groundwater body DK4.1.3.1. Tinglev are presumed to have no hydraulic contact with the river. The shallow groundwater body DK4.1.1.1.Tinglev and the regional groundwater body DK4.1.2.4.Tinglev cover the main part of the Wiedau/Vidaa River Basin, and make up Tinglev Moorplain.
Pressures, status and transboundary impactsIn the German part, agriculture and animal husbandry are the main pressures. 91% of the basin is arable land, and therefore the influence is widespread. This factor also affects the quality of groundwater in groundwater body Ei 23. This is also the case in the Danish part, where 86% of the basin is arable land, and the groundwater bodies DK4.1.1.1.Tinglev and DK4.1.1.2.Hjerpsted are affected. In the Wiedau/Vidaa River it leads to eutrophication and nutrification, and a loss of biodiversity.
Pollution from municipal wastewater is only local and moderate. Problems with erosion/accumulation of sediments and suspended sediments and mud flow are also local but severe. Sea water intru-sion affects the groundwater body Ei 22 locally and only moderately.
The groundwater status according to the WFD is good in groundwater body Ei 22, and poor in groundwater body Ei 23. In the Danish part, groundwater status according to the draft water management plan is good in DK4.1.2.2.Kliplev, DK4.1.2.3.Tonder and DK4.1.3.1.Tinglev, and poor in the DK4.1.1.1.Tinglev, DK4.1.1.2.Hjerpsted, DK4.1.2.1.Hellevad and DK4.1.2.4.Tinglev groundwater bodies. The reason for groundwater body Ei 23 and the shallow groundwater bodies DK4.1.1.1.Tinglev and DK4.1.1.2.Hjerpsted failing to achieve good status is diffuse pollution by nitrates.
The surface water bodies’ ecological status must be improved, as it is not good according to the WFD.
The river’s important uses are fishing and canoeing.
Transboundary cooperation and responsesThe bilateral Waters Transboundary Commission between Ger-many and Denmark is a joint body that coordinates and approves transboundary projects and measures, e.g., dykes or wastewater treatment.
The implementation of the WFD and the Floods Directive is based on a Joint declaration of the environment ministries of Denmark and Germany on the coordination of the management of the transboundary catchments of the Wiedau, Krusau, Mey-nau and Jadelunder Graben.
Both quality and quantity of surface waters and groundwaters are regularly monitored in both countries. Each country has propri-etary national laws, regulations and defined national strategies. A number of management measures are introduced in the pro-gramme of measures in the River Basin Management Plan.9 These include, for example, training for farmers and advisory projects, as well as measures related to the improvement of hydromorphol-ogy and to the prevention of diffuse and point sources pollution.
A joint project on transboundary flood protection and climate change in the Wiedau Basin, funded by the EU, has been initi-ated in 2011.
A transboundary project, the Interreg IV CLIWAT Project,10 in-volves this area, and focuses on determining the effects of climate change on groundwater systems, and, through this, on surface water and water supply.
TrendsThe European Fund for Regional Development (EFRD) supports the Syddanmark region and the Schleswig region during the period 2007-2013, with 44.3 million euros. Part of that money is used for the renaturalization of floodplains, transboundary flood risk man-agement, restoration of wetlands and awareness-raising activities.
There is a trend to decreasing water use in industry in the Ger-man part of the river basin, which is expected to continue due to the following factors:
(1) scientific-technical progress enables the installation of water saving technologies;
(2) the expansion of new renewable energy sources through tar-geted governmental support is expected to lead to a decrease in conventional energy sources such as fossil fuels and nuclear, which would lead to a decreasing need for cooling water; and,
(3) the trend to a service-based industry, combined with reloca-tion of industry to low-income countries.
Total water withdrawal and withdrawals by sector in the Wiedau/Vidaa Basin
Country YearTotal withdrawal
× 106 m3/year Agriculture % Domestic % industry % energy % other %Denmark N/A 34.5a 79 16 - - 5Germany 2009 2.8 - 100 - - -
a Total withdrawal is calculated on the basis of the permitted amount.
Land use/land cover in the area of the Wiedau/Vidaa Basin
Country Water bodies (%) forest (%) Cropland (%) grassland (%)
urban/industrial areas (%)
Surfaces with little or no
vegetation (%)Wetlands/
peatlands (%)other forms of
land use (%)Denmark 0.78 7.91 86.04a - 4.20 - - 1.07b
Germany 0.62 6.13 54.0 36.5 2.0 - 1.8 -a Grassland is included. b Includes different nature types, also wetlands/peatlands.
9 Project Eider: http://www.wasser.sh/de/fachinformation/daten/aneider.html. 10 http://cliwat.eu.
304 | part IV Chapter 7 Drainage basins of the north sea anD eastern atlantic | 305

Water pollution is expected to decrease, due to the decline in industry.
The utilization of fertilizers in agriculture in Germany is decreas-ing; this fact is supported by the following factors: the new agri-cultural policy of the EU; the increased demand for ecological ag-riculture; cost pressure for farmers; targeted fertilizer application by advanced technology; and stricter environmental obligations as well as their enforcement.
While areas used for agriculture are being reduced for renatu-ralization, areas foreseen for restoration of floodplains, for ex-ample, are now used for intensive cultivation of biomass, as the production of such raw material is increasing. This could lead to increased nitrification, increased use of pesticides due to mono-cultures, soil degradation, and erosion, causing negative effects on the surface water and groundwater status.
Climate change might cause a rise in temperature of around 2 °C until 2055, according to scenario studies. Winters are predicted to become more humid, and summers warmer. Higher tempera-tures will increase eutrophication, especially in lakes. Habitats may change. Restoration of water bodies and improving water retention in the area will mitigate climate change impacts.
elBe rIVer BasIn11
The Elbe River Basin extends between the territories of four EU member States: Austria, the Czech Republic, Germany and Po-land. The Elbe River originates in the Czech Republic, in the Krkonoše Mountains at a height of 1,386 m a.s.l., and empties into the North Sea at Cuxhaven, Germany. The total length of the stream is 1,094.3 km, with 727 km (66.4 %) in Germany and 367.3 km (33. 6 %) in the Czech Republic.
Elbe River Basin District Country Area in the country (km2) Country’s share (%)Czech Republic 49 933 33.6Germany 97 175 65.5Austria 921 0.6Poland 239 0.2
Total 148 268
Of the total Elbe Basin District area, approximately 50% is low-lands, lying below 200 m a.s.l. in elevation, and the main part is occupied by the Central German Lowland and the North Ger-man Lowland. Almost 30 % of the catchment area has an eleva-
tion higher than 400 m a.s.l.
No transboundary groundwater bodies have been designated in the Elbe River Basin. The State boundary between Germany and the Czech Republic in the basin predominantly follows the edge of the Krušné Hory Mountains. It is known that in the region of the Cheb Basin (Cheb/Vogtland) and in the Saxonian-Czech Cretaceous Basin (Elbe sandstone), groundwater flow crosses the State boundary. These bodies are monitored within the frame-work of a special monitoring system. There is a common hy-drogeological formation between the Czech Republic and Poland (the Polická Basin), but so far it has not been necessary to define it as a common transboundary groundwater body. Nevertheless, joint monitoring is also carried out.
Hydrology and hydrogeologyMore than 60% of the yearly run-off volume flows out during the winter hydrological half-year. The discharge pattern and the water levels in the Lower Elbe below the Geesthacht weir are in-fluenced by the tide. The hydrological regime is, to a great extent, influenced by the accumulation and melting of snow.
PressuresThe following are significant problems in water management in the Elbe River Basin District: (1) hydromorphological alterations to surface waters; (2) significant load of nutrients and other pol-lutants; and, (3) water abstractions and transfer.
The solutions for these are coordinated at international level.
The main types of pressures on surface waters are those caused by hydromorphological alterations, water flow regulation and dif-fuse source pollution. Loading from point sources of pollution is also significant. Water abstractions and other sources of pressure are of secondary importance.
The hydromorphological alterations of watercourses in the Elbe River Basin District are due to intensive modifications of the wa-tercourses through construction, in particular for ship transporta-
11 Based on information provided by the International Commission for the Protection of the Elbe River (ICPER), based on the Elbe River Basin District Management Plan.
figuRe 1: Main pressures on surface water bodies in the Elbe River Basin District (as percentage of the total number of pressures)
1.3%
0.8%
44.3%
43.8%
9.8% Point source pollution
Diffuse source pollution
Water abstraction and transfer
Water flow regulation and morphological alterations
Other impacts
306 | part IV
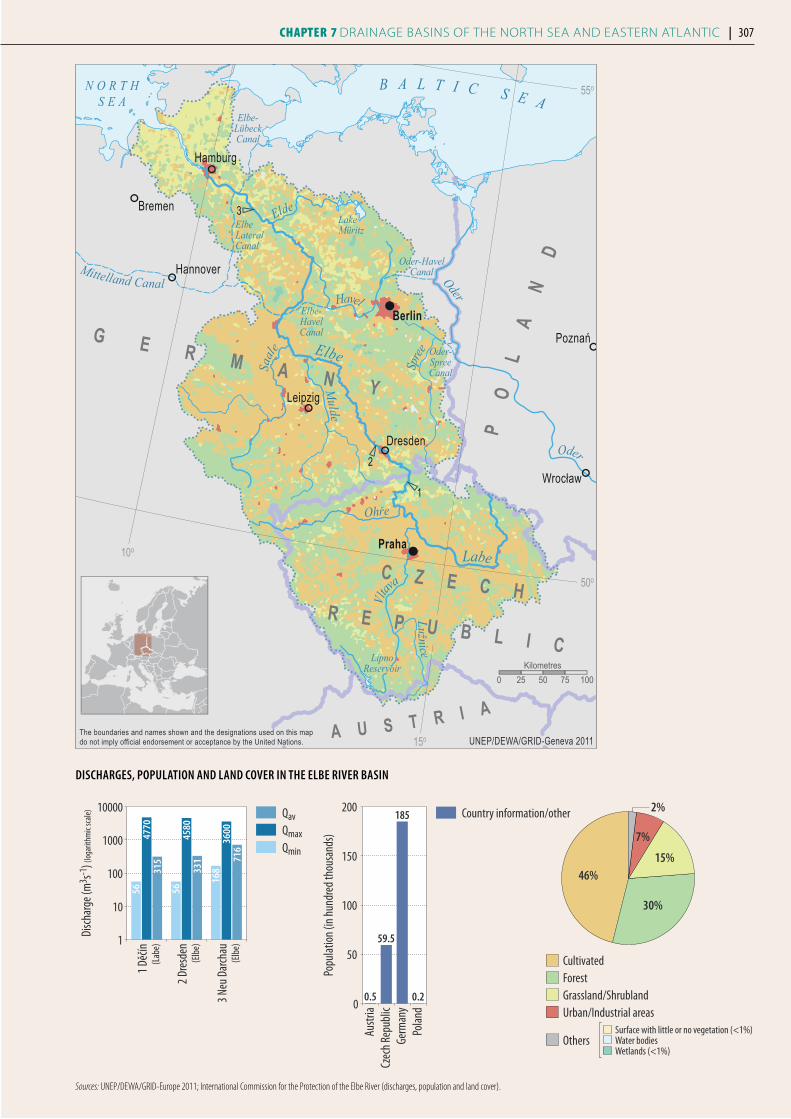
Sources: UNEP/DEWA/GRID-Europe 2011; International Commission for the Protection of the Elbe River (discharges, population and land cover).
1
2
3
Berlin
Praha
Hamburg
Bremen
Hannover
Leipzig
Dresden
Wrocław
Poznań
LakeMüritz
Oder-SpreeCanal
Oder-HavelCanal
Elbe
Labe
Havel
Spree
Ohře
Vltava
Oder
Mulde
Saale
Elde
Elbe-HavelCanal
LipnoReservoir
N O R T HS E A
B A L T I C S E A
Lužnice
Oder
Elbe-LübeckCanal
Mittelland Canal
ElbeLateralCanal
G E R M A N Y
C Z E C HR E P U B L I C
PO
LA
ND
A U S T R I A
50o
55o
15o
10o
0 25 50 75 100Kilometres
The boundaries and names shown and the designations used on this mapdo not imply official endorsement or acceptance by the United Nations. UNEP/DEWA/GRID-Geneva 2011
3 Neu
Dar
chau
2 Dre
sden
1 Děč
ín
Disc
harg
e (m
3 s-1) (
loga
rithm
ic sc
ale)
4770
315
56
4580
331
3600
(Lab
e)
(Elb
e)
(Elb
e)1
10
100
1000
10000
56
168
716
QavQmaxQmin
Popu
lation
(in h
undr
ed th
ousa
nds)
0
50
100
150
200
Polan
dGe
rman
yCz
ech R
epub
licAu
stria
59.5
185
0.5 0.2
Country information/other 2%
Surface with little or no vegetation (<1%)Water bodiesWetlands (<1%)
CultivatedForestGrassland/ShrublandUrban/Industrial areas
Others
46%
30%
15%
7%
DiSChARgeS, popuLATion AnD LAnD CoveR in The eLBe RiveR BASin
306 | part IV Chapter 7 Drainage basins of the north sea anD eastern atlantic | 307
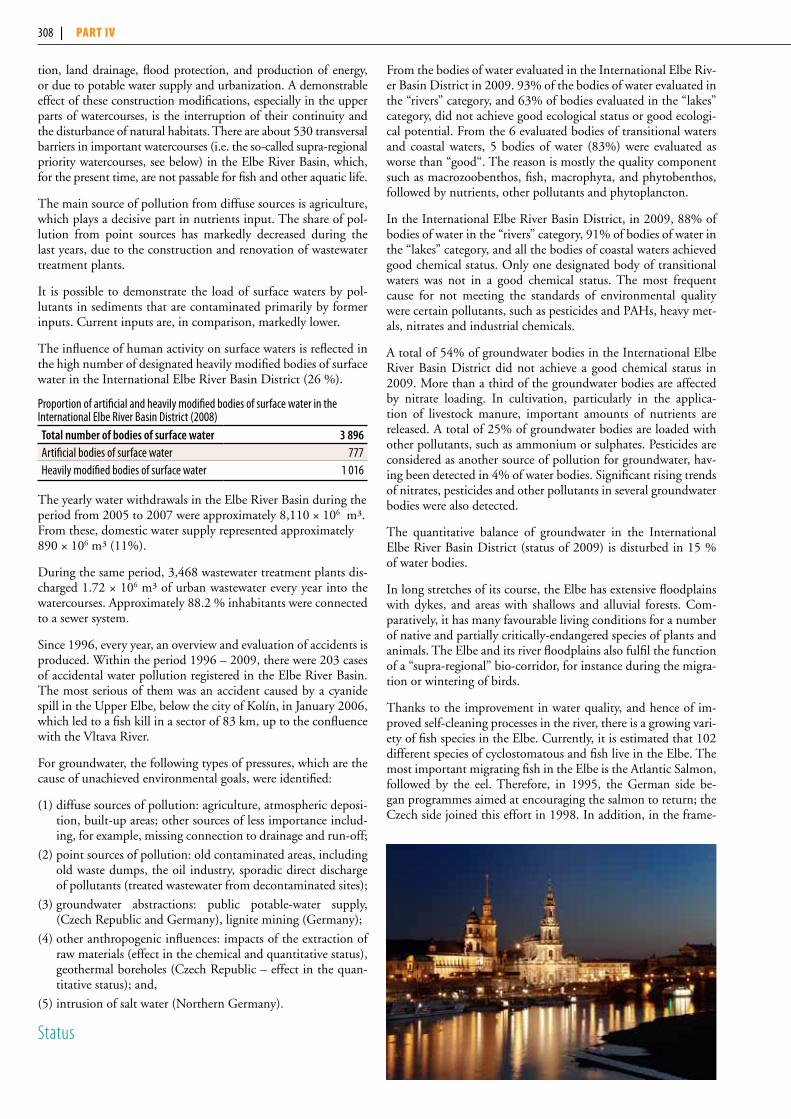
tion, land drainage, flood protection, and production of energy, or due to potable water supply and urbanization. A demonstrable effect of these construction modifications, especially in the upper parts of watercourses, is the interruption of their continuity and the disturbance of natural habitats. There are about 530 transversal barriers in important watercourses (i.e. the so-called supra-regional priority watercourses, see below) in the Elbe River Basin, which, for the present time, are not passable for fish and other aquatic life.
The main source of pollution from diffuse sources is agriculture, which plays a decisive part in nutrients input. The share of pol-lution from point sources has markedly decreased during the last years, due to the construction and renovation of wastewater treatment plants.
It is possible to demonstrate the load of surface waters by pol-lutants in sediments that are contaminated primarily by former inputs. Current inputs are, in comparison, markedly lower.
The influence of human activity on surface waters is reflected in the high number of designated heavily modified bodies of surface water in the International Elbe River Basin District (26 %).
Proportion of artificial and heavily modified bodies of surface water in the International Elbe River Basin District (2008) Total number of bodies of surface water 3 896Artificial bodies of surface water 777Heavily modified bodies of surface water 1 016
The yearly water withdrawals in the Elbe River Basin during the period from 2005 to 2007 were approximately 8,110 × 106 m³. From these, domestic water supply represented approximately 890 × 106 m³ (11%).
During the same period, 3,468 wastewater treatment plants dis-charged 1.72 × 10⁶ m³ of urban wastewater every year into the watercourses. Approximately 88.2 % inhabitants were connected to a sewer system.
Since 1996, every year, an overview and evaluation of accidents is produced. Within the period 1996 – 2009, there were 203 cases of accidental water pollution registered in the Elbe River Basin. The most serious of them was an accident caused by a cyanide spill in the Upper Elbe, below the city of Kolín, in January 2006, which led to a fish kill in a sector of 83 km, up to the confluence with the Vltava River.
For groundwater, the following types of pressures, which are the cause of unachieved environmental goals, were identified:
(1) diffuse sources of pollution: agriculture, atmospheric deposi-tion, built-up areas; other sources of less importance includ-ing, for example, missing connection to drainage and run-off;
(2) point sources of pollution: old contaminated areas, including old waste dumps, the oil industry, sporadic direct discharge of pollutants (treated wastewater from decontaminated sites);
(3) groundwater abstractions: public potable-water supply, (Czech Republic and Germany), lignite mining (Germany);
(4) other anthropogenic influences: impacts of the extraction of raw materials (effect in the chemical and quantitative status), geothermal boreholes (Czech Republic – effect in the quan-titative status); and,
(5) intrusion of salt water (Northern Germany).
Status
From the bodies of water evaluated in the International Elbe Riv-er Basin District in 2009. 93% of the bodies of water evaluated in the “rivers” category, and 63% of bodies evaluated in the “lakes” category, did not achieve good ecological status or good ecologi-cal potential. From the 6 evaluated bodies of transitional waters and coastal waters, 5 bodies of water (83%) were evaluated as worse than “good“. The reason is mostly the quality component such as macrozoobenthos, fish, macrophyta, and phytobenthos, followed by nutrients, other pollutants and phytoplancton.
In the International Elbe River Basin District, in 2009, 88% of bodies of water in the “rivers” category, 91% of bodies of water in the “lakes” category, and all the bodies of coastal waters achieved good chemical status. Only one designated body of transitional waters was not in a good chemical status. The most frequent cause for not meeting the standards of environmental quality were certain pollutants, such as pesticides and PAHs, heavy met-als, nitrates and industrial chemicals.
A total of 54% of groundwater bodies in the International Elbe River Basin District did not achieve a good chemical status in 2009. More than a third of the groundwater bodies are affected by nitrate loading. In cultivation, particularly in the applica-tion of livestock manure, important amounts of nutrients are released. A total of 25% of groundwater bodies are loaded with other pollutants, such as ammonium or sulphates. Pesticides are considered as another source of pollution for groundwater, hav-ing been detected in 4% of water bodies. Significant rising trends of nitrates, pesticides and other pollutants in several groundwater bodies were also detected.
The quantitative balance of groundwater in the International Elbe River Basin District (status of 2009) is disturbed in 15 % of water bodies.
In long stretches of its course, the Elbe has extensive floodplains with dykes, and areas with shallows and alluvial forests. Com-paratively, it has many favourable living conditions for a number of native and partially critically-endangered species of plants and animals. The Elbe and its river floodplains also fulfil the function of a “supra-regional” bio-corridor, for instance during the migra-tion or wintering of birds.
Thanks to the improvement in water quality, and hence of im-proved self-cleaning processes in the river, there is a growing vari-ety of fish species in the Elbe. Currently, it is estimated that 102 different species of cyclostomatous and fish live in the Elbe. The most important migrating fish in the Elbe is the Atlantic Salmon, followed by the eel. Therefore, in 1995, the German side be-gan programmes aimed at encouraging the salmon to return; the Czech side joined this effort in 1998. In addition, in the frame-
308 | part IV

work of the German National Action Plan for the resettlement of the Common Sturgeon in rivers. The Elbe was chosen as the first river for releasing fish stocks of sturgeons, during the years 2008 and 2009. Another new fish pass was built at the Geesthacht weir to enable the sturgeons to return to the spawning areas in the Elbe.
Transboundary cooperation and responsesThe States of the Elbe River Basin – Austria, the Czech Republic, Germany and Poland – agreed to mutually co-operate, within the International Commission for the Protection of the Elbe River (ICPER), in order to implement the WFD through the interna-tional co-ordination group (ICG).
They also agreed to draw up a joint river basin plan, according to the WFD – the International Elbe River Basin Management Plan – which was published in Czech and German in December 2009. It consists of a jointly prepared section with summarized information at international level, and of a section containing the plans developed at national level by the respective States.
“The International Elbe Warning and Alarm Plan” has been a unified system since 1991, enabling the transfer of information on the place, time and extent of accidental pollution of the waters in the Elbe River Basin. The main structure of the Plan is com-posed of five principal international warning centres. The Plan is updated on the basis of the latest knowledge and experience gained from previous accidents, and on the basis of the results of regular testing.
For the first RBMP, according to the WFD, watercourses of par-ticular importance for fish populations, and suitable for devel-opment due to their inter-connecting function, were identified. According to these criteria, the Elbe River and almost 40 tribu-taries were classified as of “supra-regional priority watercourses”. The tributaries, with a total length of approximately 3,650 km, include about 530 transversal barriers, which are so far impass-able for fish and other aquatic life. The objective is to achieve “ecological passability” on more than 150 transversal barriers by 2015. This will increase the total length of the tributary stretches that fish and other aquatic life can pass through, from the current 300 km, to almost 1,800 km, of which approximately 62 % will be connected with the North Sea.
With regard to the North Sea coastal waters, the nutrient load of nitrogen and phosphorus from the whole Elbe River Basin is planned to be gradually reduced by approximately 24% by the year 2027 through the following measures:
(1) to minimize excess nutrients when fertilizing agricultural land; and,
(2) to reduce soil surface run-off and washing out nitrates into groundwaters and surface waters by suitable cultivation of land, and by building protective riparian zones.
An important potential for reducing nitrogen and phosphorus inputs can be also seen in the modernization of municipal waste-water treatment plants and improving their efficiency, particu-larly in the Czech Republic.
In order to gradually reduce pollutant input by the year 2027, a sediment management concept will be developed for the whole Elbe River Basin District, including proposals for measures to handle sediments containing pollutants. The planned decontam-ination of the old contaminated areas as well as measures to re-duce point source pollution, should help to achieve a good status of waters. Other measures at national level have been proposed,
aimed at reaching a good status of waters. For surface waters, pri-ority is given to measures reducing hydromorphological effects. Among them are the following measures:
(1) to optimize the maintenance of and renew the passability of watercourses;
(2) to stimulate and enable the dynamic development of the wa-tercourses;
(3) to improve the habitats in the riparian zone (namely, develop-ment of forests);
(4) to improve the habitats in the development corridor of water-courses, including the development of fluvial plains;
(5) to revitalize the watercourses (namely, the stream bottom, variability of depths, the substratum);
(6) to improve habitats through modified watercourse routes, modifications of the bank and the stream bottom;
(7) to improve the status of sediments, eventually the manage-ment of sediments;
(8) to reconnect main watercourses in the basin to former small tributaries; and,
(9) to increase the number of shallow parts in the tidal stretch of the Elbe.
Among the most frequently considered measures to reduce the input of pollutants from point sources are:
(1) the connection of so far unconnected areas to urban wastewa-ter treatment plants;
(2) other measures to reduce the input of substances through dis-charged wastewaters and rain waters;
(3) optimization of the operations of urban wastewater treatment plants; and,
(4) reconstruction of urban wastewater treatment plants, with the purpose of reducing phosphorus inputs.
In 1993–2004, the International Commission for the Protection of the Elbe River (ICPER) has drawn up 10 recommendations to prevent accidents, increase the safety of technical equipment and mitigate the consequences of accidents, which became part of the legal framework of the Czech Republic and Germany. ICPER is also striving to create a stable “emergency profile” to trap oil contamination in the transboundary section of the Elbe.
A part of the surveillance monitoring of the Elbe River Basin, ac-cording to the WFD, is the “International Programme for the Elbe River Monitoring”. This programme includes 9 monitoring pro-files on the Elbe River (4 in the Czech Republic and 5 in Germa-ny), and 10 monitoring profiles on its important tributaries. The measurement results are made available on the ICPER12 web site.
TrendsIn the medium and long-term future, adaptation strategies to climate change will play a certain role when selecting and imple-menting measures. The first scientific results related to these im-pacts in the Elbe River Basin were taken into account to draw up the measures at the same time as the RBMP was being prepared.
Climate change impacts are difficult to assess. Depending on regions and the season, precipitation frequency and intensity is expected to change, which might lead to an increase in droughts and thus to a rise in water prices in the most affected areas. In the future process of planning measures, the effects of climate change will be taken into account.
12 www.ikse-mkol.org.
308 | part IV Chapter 7 Drainage basins of the north sea anD eastern atlantic | 309
KrKonoše/KarKonosze suBalpIne peatBoGs13 General description of the wetland These oligotrophic mountain-raised peatbogs of subarctic charac-ter are situated on granite bedrock on the summit plateaux of the Giant Mountains (The Sudetes – Krkonoše in Czech, Karkonosze in Polish). They are characterised by a mosaic of arctic and alpine features and the occurrence of many endangered and endemic plant and animal species, as well as plant associations.
The site is an exceptional bio-geographical island in Central Eu-rope, in which ancient subarctic phenomena are intermingled with more recent alpine ones. The system of ridge peat bogs developed under extreme climatic conditions within Central Europe. The bog surface has a rich relief, in the form of numerous hummocks, oblong ridges, trough-like hollows filled in with water, and per-manent pools. In the pools, a unique flora of algae is to be found.
The depth of the peat layer is highly variable (from several deci-metres to 2.8 metres), and the surface morphology is similar to the structure of northern mires, with bog-lake areas of up to 170 m2.
Interestingly, the wetland lies in the summit area of the west-east oriented mountain range (administratively divided by the Czech-Polish border), just on the divide of the discharge basins of the Baltic Sea (Oder River) and the North Sea (Elbe River). This means that the waters of this small Ramsar Site are drained into two different basins – peat bogs on the northern (Polish) slopes of the mountains drain into the Oder River Basin, peat bogs on the southern (mainly Czech) part into the Elbe River Basin.
The total area of the wetland is 250 ha only; the Czech part being 210 ha and the Polish part 40 ha.
Main wetland ecosystem services The wetland is situated in the headwaters of two rivers – the Elbe and the Upa. Ecosystem services include the storage and retention of water, flood control and erosion protection. Water from precipi-tation is accumulated in the raised peat bogs, and retained there by vegetation (especially Sphagnum mosses). Subsequently, water is drained by hundreds of very small, deeply meandering water bod-ies from the peat bogs. The outflow is relatively slow, partly pro-tecting downstream habitats from erosion and floods, especially in spring, when snow melts, as well as after heavy rainfall in summer.
Biodiversity values of the wetland areaThe most important element of the vegetation cover is the en-demic plant association of dwarf pines with the cloudberry, and several glacial relic plant associations.
It further harbours the endemic alga species Corcontochrysis nocti-vaga, as well as glacial relics, such as the Sudetan Lousewort, the Cloudberry, the Water Beetle, or the Field Vole.
Further, the site is of specific value in terms of biological diversity, as it harbours arctic and alpine plant and animal species simulta-neously. Three physiognomic units form the vegetation cover of the wetland – mosses, herbaceous plants and dwarf pines.
The shrub vegetation is formed by mosaic stands of the Swiss Alpine Pine, willows, and solitary individuals of the spruce and the Moun-tain Ash. Dominant and characteristic plant species of the wetland include moss species, the Leafy Liverwort, sedges, and other species
such as the Bog Rosemary, the Common Sundew, the Tufted Bul-rush, the Tussock Cottongrass, or the Sudetic Lousewort.
Noteable in terms of fauna are the following: dragonflies, moth, Carabid Beetles, and the Alpine Shrew. The area also serves as an important breeding site for several birds, especially the Red-spotted Bluethroat, the Ring Ouzel, the Scarlet Rosefinch, and the Water Pipit.
Pressure factors and transboundary impactsThere is a considerable impact of tourism in the wetland area, as this part of the mountains is visited by thousands of tourists per day during the peak seasons from June to September. Two his-torical and reconstructed mountain chalets at the border of the wetland and a network of hiking trails inside the wetland affect surrounding vegetation.
The impact of air pollution, noticed throughout the entire area of the Giant Mountains in the 1970–1990s, and resulting in par-ticular in a large-scale forest decline, has been reduced during the last two decades.
No impact of climate change on the hydrology of the area has been noted as yet. However, a probable impact of climate change on bird communities has been observed recently, as there is an increasing abundance of species preferring lower altitudes, such as warblers and the chiffchaff.
Transboundary wetland managementThe entire transboundary wetland area is protected under the following regulations and programmes:
(1) Czech Krkonoše National Park (part of the strictly protected core zone, where only “soft” tourism activities are allowed, e.g. hiking or cross-country skiing along fixed trails for visitors);
(2) Polish Karkonosze National Park (part of the strictly pro-tected core zone with the same regime as mentioned above);
(3) Bilateral Krkonoše/Karkonosze Biosphere Reserve (part of the core zone), under UNESCO’s Man and the Biosphere Programme;
(4) Natura 2000 sites on both sides of the border (both Special Protected Areas and Sites of Community Interest), based on the EU Habitats and Birds Directives;
(5) Important Bird Area in Europe under the BirdLife Interna-tional Programme; and,
(6) Transboundary Wetland of International Importance under the Ramsar Convention on Wetlands (designated officially in September 2009).
The area is managed by both the Krkonoše National Park and Karkonosze National Park Administrations, and no special staff is devoted directly to the Ramsar Site.
Management plans are ready and in use for both the national parks. They cover, inter alia, the management of wetland sites (including the Ramsar Site), in particular control of tourism and elimination of allochthonous plant species spreading along the hiking trails.
As regards transboundary cooperation, a joint Czech-Polish nature trail through the wetland area was prepared for visitors, and multi-lingual information booklets on the Krkonoše peatbogs are available.
13 Sources: Information Sheet on Ramsar Wetlands; Jenik J. Alpine vegetation of the Giant Mountains (Krkonoše Mountains), the snow mountains of Glatz and the Gesenk mountains (in Czech with a German summary). NCAV, Prague, 1961. Soukupova L., Kocianova M., Jenik J., Sekyra J. Arctic-alpine tundra in the Krkonose, the Sudetes. Opera Corcontica 32, 5-88. 1995.
310 | part IV
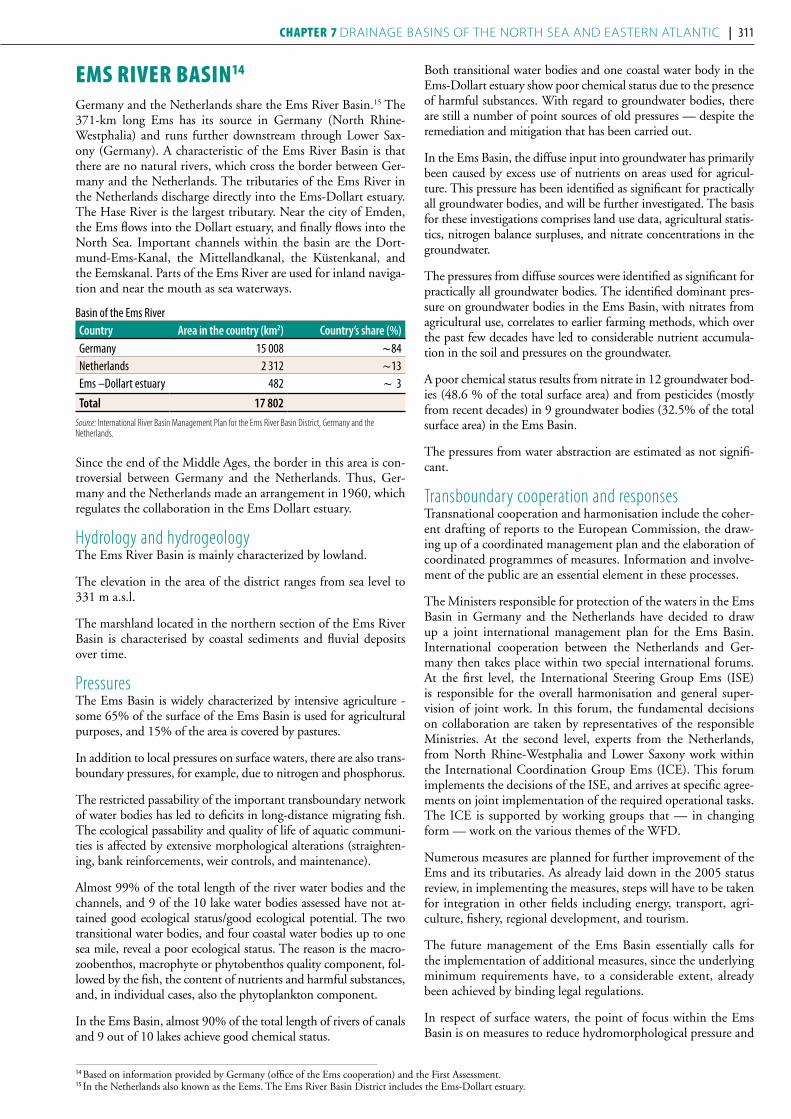
ems rIVer BasIn14
Germany and the Netherlands share the Ems River Basin.15 The 371-km long Ems has its source in Germany (North Rhine-Westphalia) and runs further downstream through Lower Sax-ony (Germany). A characteristic of the Ems River Basin is that there are no natural rivers, which cross the border between Ger-many and the Netherlands. The tributaries of the Ems River in the Netherlands discharge directly into the Ems-Dollart estuary. The Hase River is the largest tributary. Near the city of Emden, the Ems flows into the Dollart estuary, and finally flows into the North Sea. Important channels within the basin are the Dort-mund-Ems-Kanal, the Mittellandkanal, the Küstenkanal, and the Eemskanal. Parts of the Ems River are used for inland naviga-tion and near the mouth as sea waterways.
Basin of the Ems River Country Area in the country (km2) Country’s share (%)Germany 15 008 ~ 84Netherlands 2 312 ~13Ems –Dollart estuary 482 ~ 3Total 17 802
Source: International River Basin Management Plan for the Ems River Basin District, Germany and the Netherlands.
Since the end of the Middle Ages, the border in this area is con-troversial between Germany and the Netherlands. Thus, Ger-many and the Netherlands made an arrangement in 1960, which regulates the collaboration in the Ems Dollart estuary.
Hydrology and hydrogeologyThe Ems River Basin is mainly characterized by lowland.
The elevation in the area of the district ranges from sea level to 331 m a.s.l.
The marshland located in the northern section of the Ems River Basin is characterised by coastal sediments and fluvial deposits over time.
PressuresThe Ems Basin is widely characterized by intensive agriculture - some 65% of the surface of the Ems Basin is used for agricultural purposes, and 15% of the area is covered by pastures.
In addition to local pressures on surface waters, there are also trans-boundary pressures, for example, due to nitrogen and phosphorus.
The restricted passability of the important transboundary network of water bodies has led to deficits in long-distance migrating fish. The ecological passability and quality of life of aquatic communi-ties is affected by extensive morphological alterations (straighten-ing, bank reinforcements, weir controls, and maintenance).
Almost 99% of the total length of the river water bodies and the channels, and 9 of the 10 lake water bodies assessed have not at-tained good ecological status/good ecological potential. The two transitional water bodies, and four coastal water bodies up to one sea mile, reveal a poor ecological status. The reason is the macro-zoobenthos, macrophyte or phytobenthos quality component, fol-lowed by the fish, the content of nutrients and harmful substances, and, in individual cases, also the phytoplankton component.
In the Ems Basin, almost 90% of the total length of rivers of canals and 9 out of 10 lakes achieve good chemical status.
Both transitional water bodies and one coastal water body in the Ems-Dollart estuary show poor chemical status due to the presence of harmful substances. With regard to groundwater bodies, there are still a number of point sources of old pressures — despite the remediation and mitigation that has been carried out.
In the Ems Basin, the diffuse input into groundwater has primarily been caused by excess use of nutrients on areas used for agricul-ture. This pressure has been identified as significant for practically all groundwater bodies, and will be further investigated. The basis for these investigations comprises land use data, agricultural statis-tics, nitrogen balance surpluses, and nitrate concentrations in the groundwater.
The pressures from diffuse sources were identified as significant for practically all groundwater bodies. The identified dominant pres-sure on groundwater bodies in the Ems Basin, with nitrates from agricultural use, correlates to earlier farming methods, which over the past few decades have led to considerable nutrient accumula-tion in the soil and pressures on the groundwater.
A poor chemical status results from nitrate in 12 groundwater bod-ies (48.6 % of the total surface area) and from pesticides (mostly from recent decades) in 9 groundwater bodies (32.5% of the total surface area) in the Ems Basin.
The pressures from water abstraction are estimated as not signifi-cant.
Transboundary cooperation and responsesTransnational cooperation and harmonisation include the coher-ent drafting of reports to the European Commission, the draw-ing up of a coordinated management plan and the elaboration of coordinated programmes of measures. Information and involve-ment of the public are an essential element in these processes.
The Ministers responsible for protection of the waters in the Ems Basin in Germany and the Netherlands have decided to draw up a joint international management plan for the Ems Basin. International cooperation between the Netherlands and Ger-many then takes place within two special international forums. At the first level, the International Steering Group Ems (ISE) is responsible for the overall harmonisation and general super-vision of joint work. In this forum, the fundamental decisions on collaboration are taken by representatives of the responsible Ministries. At the second level, experts from the Netherlands, from North Rhine-Westphalia and Lower Saxony work within the International Coordination Group Ems (ICE). This forum implements the decisions of the ISE, and arrives at specific agree-ments on joint implementation of the required operational tasks. The ICE is supported by working groups that — in changing form — work on the various themes of the WFD.
Numerous measures are planned for further improvement of the Ems and its tributaries. As already laid down in the 2005 status review, in implementing the measures, steps will have to be taken for integration in other fields including energy, transport, agri-culture, fishery, regional development, and tourism.
The future management of the Ems Basin essentially calls for the implementation of additional measures, since the underlying minimum requirements have, to a considerable extent, already been achieved by binding legal regulations.
In respect of surface waters, the point of focus within the Ems Basin is on measures to reduce hydromorphological pressure and
14 Based on information provided by Germany (office of the Ems cooperation) and the First Assessment. 15 In the Netherlands also known as the Eems. The Ems River Basin District includes the Ems-Dollart estuary.
310 | part IV Chapter 7 Drainage basins of the north sea anD eastern atlantic | 311

1
11
10
9
4
3
25
7
8
612
13
15
14
16
17
18
19
20
Hamburg
Bremen
Stuttgart
München
KölnDüsseldorf
Essen Dortmund
Rotterdam
Frankfurtam Main
Amsterdam
Bruxelles
Luxembourg
VaduzBern
Duisburg
Hannover
Ramsar Sites1 Wadden Sea2 Rhin supérieur/Oberrhein
2
1
Alpen
rhein
Rhein
Rhin
Main
Mosel
le
Saar
Aare
DanubeCanaldu Rhône
au Rhin
Canal de laMarne au
Rhin
Meuse
IJsse
l
WaalNederrijn Vechte
LakeConstance
EmsSambre
Rur
Main-DonauCanal
Neckar
Nahe
Saône
Lahn
Ruhr
Sieg
Maas
Sauer
NO
RT
H S E A
Wiedau
A U S T R I A
NETHERLANDS
F R A N C E
LI
GE
RM
AN
Y
LU
B EL
G
IU
M
I T A L Y
S W I T Z E R L A N D
DENMARK
10o
5o
50o
55o
0 50 100 150Kilometres
The boundaries and names shown and the designations used on this mapdo not imply official endorsement or acceptance by the United Nations. UNEP/DEWA/GRID-Geneva 2011
Sources: UNEP/DEWA/GRID-Europe 2011; International River Basin Management Plan for the Ems River Basin District, Germany and the Netherlands.
19 Ve
rsen-
Weh
rdur
chsti
ch
Disc
harg
e (m
3 s-1) (
loga
rithm
ic sc
ale)
1200
80(E
ms)1
10
100
1000
10000
5
QavQmaxQmin
0.0
0.5
1.0
1.5
2.0
2.5
3.0
Neth
erlan
dsGe
rman
y
2.8
0.5
Popu
lation
(in m
illion
s)
Country information/otherLandScanTM
2%1%
Surface with little or no vegetation (<1%)Water bodies (<1%)
CultivatedForestGrassland/ShrublandUrban/Industrial areasWetlands
Others
62%10%
7%
18%
DiSChARgeS, popuLATion AnD LAnD CoveR in The emS RiveR BASin
312 | part IV

to recover passability. This includes such measures as structural improvement for crossing structures, barrages, bank strengthen-ing, and other civil engineering constructions. Further points of focus are measures to reduce pressures from diffuse and point sources of pollution. For groundwater, activities are concentrated above all on reducing pressure from diffuse sources.
Conceptual measures have been planned to provide support. Ad-visory measures contribute to reducing the discharges of nutri-ents and pesticides from diffuse sources. Promotion programmes (agricultural environmental measures) will help to reduce the transport of nutrients into waters. Educational measures, for ex-ample for crop maintenance, will also be deployed to improve morphological changes in water bodies.
In deciding these measures, one key element was the estimate of the expected effects and costs. Uncertainties relate as to whether the necessary measures could actually be implemented, or whether, as a result of unavoidable uses for which there was no alternative, technical problems or natural situations, the implementation of the measures would only be possible on a limited scale or not at all. Uncertainty also results from the fact that developments cannot be predicted sufficiently accurately through to 2015.
TrendsIn addition to long-term climate changes, annual extremes are predicted to increase in the Ems Basin. General predictions for extreme values have proven difficult, and assessing the effect re-quires an approach specific to the entire river basin. In the Ems Basin the following changes are assumed:
(1) increase in average air temperature;
(2) sea level rise;
(3) increase in precipitation in winter;
(4) reduced precipitation in summer;
(5) increase in precipitation events; and,
(6) increase of dry periods.
As of yet, confirmed evidence of these assumed changing trends, in particular for precipitation and precipitation extremes, is not available.
Changes in these factors have an immediate effect on essential elements of water management, for example on
(1) coastal protection — due to sea level rise — possible changes in, for example, storms;
(2) flood protection — due to changes in flood discharges, and the resultant change in damage risks (as with coastal protection);
(3) water supply — due to the changing groundwater situation;
(4) water protection — due to the changes in seasonal discharges and temperature ratios;
(5) development of water bodies — due to the change in their dynamics; and
(6) use of water bodies, including storage areas for raising water levels at low water, hydro-electrical use, navigability, and use of water for cooling and agriculture.
Among useful measures and options for action — despite the uncertainties related to climate change — are improved passabil-ity, the morphology of water bodies, and the reduction of heat pressure, which have positive effects on living conditions and the sustainability of ecosystems. With regard to groundwater, experi-ence has accrued with managing groundwater abstraction and infiltration, and, for example, measures for water retention and groundwater recharging can be developed.
Wadden sea16
General description of the wetland The Wadden Sea is a shallow sea of outstanding natural value, as it forms the largest coherent tidal flat ecosystem in the world, covering over 9,000 km2 (including ~7,500 km2 tidal area). It ex-tends for about 500 km along the North Sea coasts of Denmark, Germany and The Netherlands. It is a very dynamic ecosystem, which includes large areas of intertidal sand- and mudflats, partly estuarine, with sand banks, numerous islands, extensive areas of saltmarsh, dunes, heath, beaches and beach plains. The Wadden Sea itself can be divided into three ecological zones: the sublit-toral, eulittoral and supralittoral zone, according to their daily inundation regime by seawater. The sublittoral zone mainly in-cludes creeks and channels, while the eulittoral zone includes tidal flats which cover about two thirds of the tidal area and are characteristic of the Wadden Sea. The supralittoral zone, the re-gion above mean high tide levels, includes saltmarshes and dunes. Many important rivers such as the Elbe, Weser, Ems and IJssel, a sidearm of the Rhine River, drain into the Wadden Sea. The size of the catchment area is 231,000 km2.
Main wetland ecosystem services Hydrological values of the Wadden Sea include flood control, shoreline stabilization, and sediment retention. Due to its high productivity, the Wadden Sea is an essential nursing habitat for several fish species of the North Sea, is important for shrimp and
blue mussel fisheries, and crucial for bird migration. Some of the salt marshes are used for cattle and sheep grazing, and the surrounding areas are used mainly for agricultural purposes. In parts, intensive arable (wheat and rape) farming is practised. It is further used for sand, clay, shell, and gravel extraction, and the extraction of oil and gas. It is of outstanding scientific and edu-cational value, as it contains a great variety of landforms, habitat types, and plant and animal species. For the same reasons, it is used extensively for tourism and recreation purposes, with about 70 million overnight stays per year, and a turnover of 2.8–5.3 billion euros per year.
Cultural values of the wetland areaThe Wadden Sea landscape is an area of outstanding natural beauty, as well as of cultural, historical, and archaeological value. Because of the dynamic geomorphological history of the region, many archaeological remains of human settlements are present in the tidal flats. Historically preserved buildings such as lighthous-es and towers date back to the 13th century, and some settlement types, such as the Halligen in Schleswig Holstein, which are built on mounds, are unique.
Biodiversity values of the wetland areaThe Wadden Sea offers the full range of habitats typical of tidal flats, and thus plays a very important role in the protection of biological diversity. The Wadden Sea is of international impor-tance for birds which breed, moult and winter here, or which
16 http://www.waddensea-secretariat.org; Information Sheets on Ramsar Wetlands available at: http://www.wetlands.org/rsis/; The Wadden Sea-A shared nature area, H. Marencic, Common Wadden Sea Secretariat.
312 | part IV Chapter 7 Drainage basins of the north sea anD eastern atlantic | 313
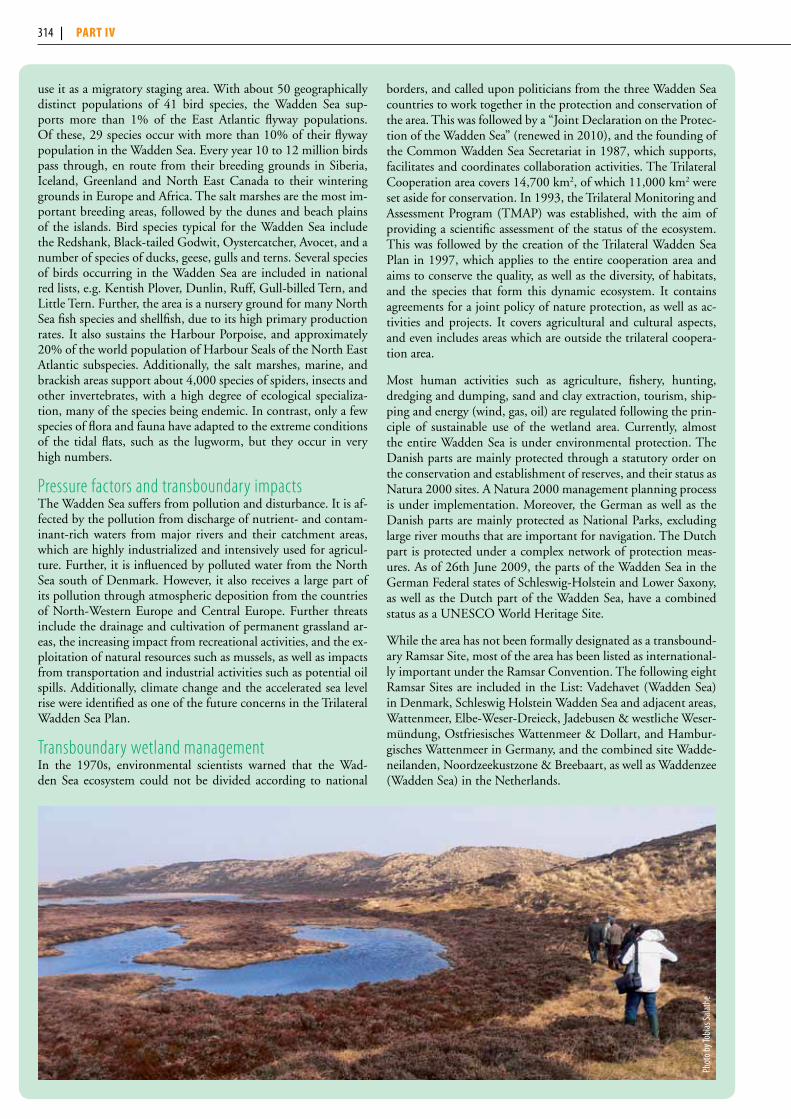
use it as a migratory staging area. With about 50 geographically distinct populations of 41 bird species, the Wadden Sea sup-ports more than 1% of the East Atlantic flyway populations. Of these, 29 species occur with more than 10% of their flyway population in the Wadden Sea. Every year 10 to 12 million birds pass through, en route from their breeding grounds in Siberia, Iceland, Greenland and North East Canada to their wintering grounds in Europe and Africa. The salt marshes are the most im-portant breeding areas, followed by the dunes and beach plains of the islands. Bird species typical for the Wadden Sea include the Redshank, Black-tailed Godwit, Oystercatcher, Avocet, and a number of species of ducks, geese, gulls and terns. Several species of birds occurring in the Wadden Sea are included in national red lists, e.g. Kentish Plover, Dunlin, Ruff, Gull-billed Tern, and Little Tern. Further, the area is a nursery ground for many North Sea fish species and shellfish, due to its high primary production rates. It also sustains the Harbour Porpoise, and approximately 20% of the world population of Harbour Seals of the North East Atlantic subspecies. Additionally, the salt marshes, marine, and brackish areas support about 4,000 species of spiders, insects and other invertebrates, with a high degree of ecological specializa-tion, many of the species being endemic. In contrast, only a few species of flora and fauna have adapted to the extreme conditions of the tidal flats, such as the lugworm, but they occur in very high numbers.
Pressure factors and transboundary impactsThe Wadden Sea suffers from pollution and disturbance. It is af-fected by the pollution from discharge of nutrient- and contam-inant-rich waters from major rivers and their catchment areas, which are highly industrialized and intensively used for agricul-ture. Further, it is influenced by polluted water from the North Sea south of Denmark. However, it also receives a large part of its pollution through atmospheric deposition from the countries of North-Western Europe and Central Europe. Further threats include the drainage and cultivation of permanent grassland ar-eas, the increasing impact from recreational activities, and the ex-ploitation of natural resources such as mussels, as well as impacts from transportation and industrial activities such as potential oil spills. Additionally, climate change and the accelerated sea level rise were identified as one of the future concerns in the Trilateral Wadden Sea Plan.
Transboundary wetland managementIn the 1970s, environmental scientists warned that the Wad-den Sea ecosystem could not be divided according to national
borders, and called upon politicians from the three Wadden Sea countries to work together in the protection and conservation of the area. This was followed by a “Joint Declaration on the Protec-tion of the Wadden Sea” (renewed in 2010), and the founding of the Common Wadden Sea Secretariat in 1987, which supports, facilitates and coordinates collaboration activities. The Trilateral Cooperation area covers 14,700 km2, of which 11,000 km2 were set aside for conservation. In 1993, the Trilateral Monitoring and Assessment Program (TMAP) was established, with the aim of providing a scientific assessment of the status of the ecosystem. This was followed by the creation of the Trilateral Wadden Sea Plan in 1997, which applies to the entire cooperation area and aims to conserve the quality, as well as the diversity, of habitats, and the species that form this dynamic ecosystem. It contains agreements for a joint policy of nature protection, as well as ac-tivities and projects. It covers agricultural and cultural aspects, and even includes areas which are outside the trilateral coopera-tion area.
Most human activities such as agriculture, fishery, hunting, dredging and dumping, sand and clay extraction, tourism, ship-ping and energy (wind, gas, oil) are regulated following the prin-ciple of sustainable use of the wetland area. Currently, almost the entire Wadden Sea is under environmental protection. The Danish parts are mainly protected through a statutory order on the conservation and establishment of reserves, and their status as Natura 2000 sites. A Natura 2000 management planning process is under implementation. Moreover, the German as well as the Danish parts are mainly protected as National Parks, excluding large river mouths that are important for navigation. The Dutch part is protected under a complex network of protection meas-ures. As of 26th June 2009, the parts of the Wadden Sea in the German Federal states of Schleswig-Holstein and Lower Saxony, as well as the Dutch part of the Wadden Sea, have a combined status as a UNESCO World Heritage Site.
While the area has not been formally designated as a transbound-ary Ramsar Site, most of the area has been listed as international-ly important under the Ramsar Convention. The following eight Ramsar Sites are included in the List: Vadehavet (Wadden Sea) in Denmark, Schleswig Holstein Wadden Sea and adjacent areas, Wattenmeer, Elbe-Weser-Dreieck, Jadebusen & westliche Weser-mündung, Ostfriesisches Wattenmeer & Dollart, and Hambur-gisches Wattenmeer in Germany, and the combined site Wadde-neilanden, Noordzeekustzone & Breebaart, as well as Waddenzee (Wadden Sea) in the Netherlands.
Phot
o by T
obias
Salat
he
314 | part IV
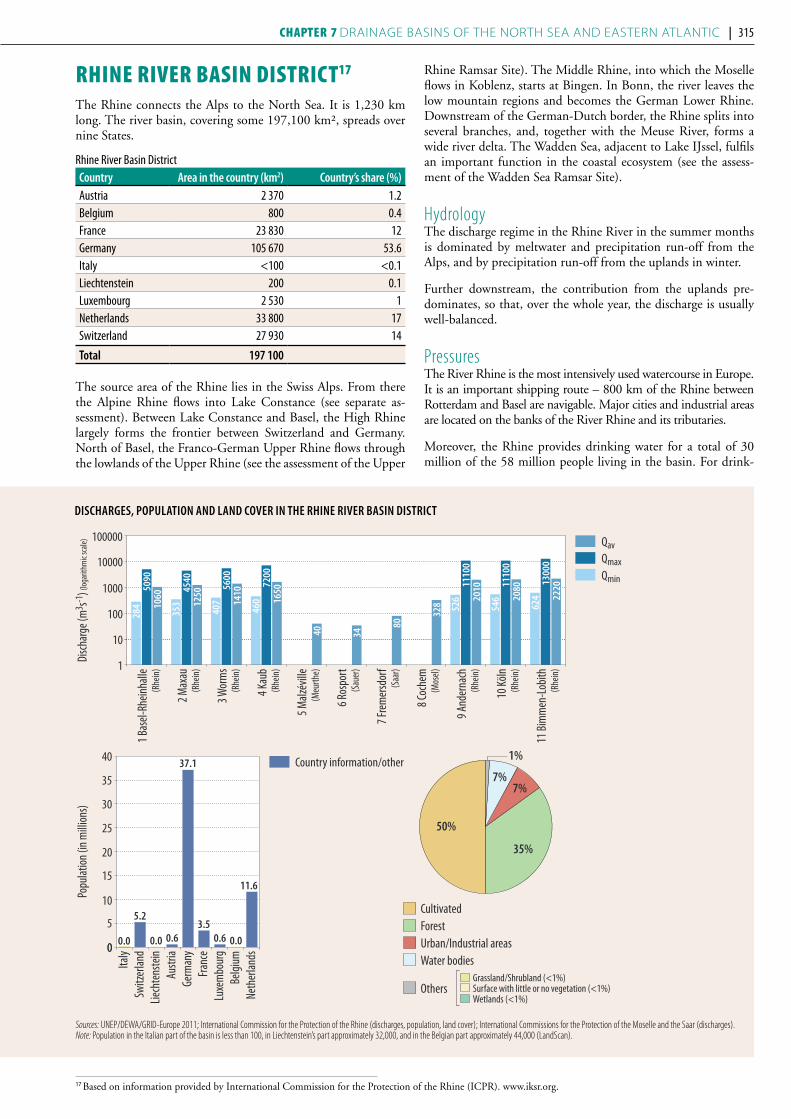
rhIne rIVer BasIn dIstrICt17
The Rhine connects the Alps to the North Sea. It is 1,230 km long. The river basin, covering some 197,100 km², spreads over nine States.
Rhine River Basin District Country Area in the country (km2) Country’s share (%)Austria 2 370 1.2Belgium 800 0.4France 23 830 12Germany 105 670 53.6Italy <100 <0.1Liechtenstein 200 0.1Luxembourg 2 530 1Netherlands 33 800 17Switzerland 27 930 14
Total 197 100
The source area of the Rhine lies in the Swiss Alps. From there the Alpine Rhine flows into Lake Constance (see separate as-sessment). Between Lake Constance and Basel, the High Rhine largely forms the frontier between Switzerland and Germany. North of Basel, the Franco-German Upper Rhine flows through the lowlands of the Upper Rhine (see the assessment of the Upper
Rhine Ramsar Site). The Middle Rhine, into which the Moselle flows in Koblenz, starts at Bingen. In Bonn, the river leaves the low mountain regions and becomes the German Lower Rhine. Downstream of the German-Dutch border, the Rhine splits into several branches, and, together with the Meuse River, forms a wide river delta. The Wadden Sea, adjacent to Lake IJssel, fulfils an important function in the coastal ecosystem (see the assess-ment of the Wadden Sea Ramsar Site).
Hydrology The discharge regime in the Rhine River in the summer months is dominated by meltwater and precipitation run-off from the Alps, and by precipitation run-off from the uplands in winter.
Further downstream, the contribution from the uplands pre-dominates, so that, over the whole year, the discharge is usually well-balanced.
PressuresThe River Rhine is the most intensively used watercourse in Europe. It is an important shipping route – 800 km of the Rhine between Rotterdam and Basel are navigable. Major cities and industrial areas are located on the banks of the River Rhine and its tributaries.
Moreover, the Rhine provides drinking water for a total of 30 million of the 58 million people living in the basin. For drink-
DiSChARgeS, popuLATion AnD LAnD CoveR in The Rhine RiveR BASin DiSTRiCT
11 Bi
mm
en-Lo
bith
10 Kö
ln
9 And
erna
ch
8 Coc
hem
7 Frem
ersd
orf
6 Ros
port
5 Malz
éville
4 Kau
b
3 Wor
ms
2 Max
au
1 Bas
el-Rh
einha
lle
Disch
arge (
m3 s-1
) (log
arith
mic
scale)
5090
1060
(Rhe
in)
(Rhe
in)
(Rhe
in)
(Rhe
in)
(Meu
rthe)
(Sau
er)
(Saa
r)
(Mos
el)
(Rhe
in)
(Rhe
in)
(Rhe
in)
1
10
10000
100
1000
100000
284
4540
1250
353
5600
1410
407
7200
1650
40 34
80
32846
0
1110
020
10
526
1110
020
80
546
1300
022
20
624
QavQmaxQmin
Popu
lation
(in m
illion
s)
0
5
0
10
15
20
25
30
35
40
Neth
erlan
dsBe
lgium
Luxe
mbo
urg
Franc
eGe
rman
yAu
stria
Liech
tens
tein
Switz
erlan
dIta
ly
0.0
5.2
0.0 0.63.5
0.6 0.0
11.6
37.1 Country information/other 1%
Grassland/Shrubland (<1%)Surface with little or no vegetation (<1%)Wetlands (<1%)
CultivatedForestUrban/Industrial areasWater bodies
Others
50%
35%
7%7%
17 Based on information provided by International Commission for the Protection of the Rhine (ICPR). www.iksr.org.
Sources: UNEP/DEWA/GRID-Europe 2011; International Commission for the Protection of the Rhine (discharges, population, land cover); International Commissions for the Protection of the Moselle and the Saar (discharges).Note: Population in the Italian part of the basin is less than 100, in Liechtenstein’s part approximately 32,000, and in the Belgian part approximately 44,000 (LandScan).
314 | part IV Chapter 7 Drainage basins of the north sea anD eastern atlantic | 315

ing water purposes, several large water treatment plants abstract raw water directly (Lake Constance) or via riverbank filtration, or abstract Rhine water filtered through the dunes.
The Rhine and a number of its tributaries contain sediments, some of which are considerably contaminated by industrial and mining activities in the past. As a result, during strong flooding or dredging activities, for navigation purposes for instance, re-mobilized sediments may cause temporary pollution.
Numerous hydraulic measures in the past have resulted in vast hydro-morphological modifications, which have greatly impact-ed the ecological function of the Rhine. These effects include, among others, the almost complete restriction of river dynam-ics, the loss of alluvial areas, the impoverishment of biological diversity, and obstacles to fish migration. In addition, rectifica-tion and riverbank stabilization have shortened the course of the river and, along longer sections, the construction of dikes cuts the floodplains off from river dynamics. As a result, today there is a deficiency of natural structural variety and of important struc-tural elements required for natural species diversity and intact ecosystems.
Downstream from Iffezheim (Upper Rhine) to the North Sea estuary, the Rhine flows freely without obstacles. For navigation purposes, hydropower generation, flood protection, and to slow down groundwater level decline (due to the deepening of the river bed), the water levels of the main stream of the Rhine upstream from Iffezheim are regulated, and numerous water constructions, such as sluices, barrages and dikes, have been built. Between the outlet of Lake Constance and Iffezheim, there are 21 barrages in the main stream, as well as bypasses serving the purpose of hydro-power generation which do not, or only to a limited extent, grant river continuity for fish, biota and sediments. Moreover, because of the Rhine regulation, flood risk has increased in the northern part of the Upper Rhine (downstream of Iffezheim). In the up-per reaches of the Rhine (Alps and their foothills), there are nu-merous reservoirs and barrages serving power generation; during power consumption peaks, hydropower plants often regulate the water supply according to the need for power supply (“hydrope-aking operation”). That means that flora and fauna are not only impacted by interference with river continuity, but also by the surge effects of hydropeaking operation.
Furthermore, there are more than 100 barrages (often combined with hydropower plants and shipping) with barrage locks in the Neckar, Main, Lahn and Moselle tributaries.
The marked mining activities in the Rhine Basin, particularly in the Moselle-Saar area, in the Ruhr area and the open-cast brown-coal mining areas along the left bank of the German Lower Rhine, are equally relevant. Even though mining activities have decreased considerably and will continue to do so, their effects still remain in many places.
Status and transboundary impactsAs a result of the investments of the States, municipalities and in-dustry in the basin area, notably into wastewater treatment, water quality has considerably improved. The effects of air-borne diffuse water body pollution or pollution eroded from the soil continue to be problematic. Phosphorus, and, above all nitrogen contents in excess affect the biological quality of water bodies, particularly in the marine environment (Dutch coast, Wadden Sea).
In the Rhine Basin, the following pollutants are locally or widely spread, in excess of the threshold values called environmental quality standards:
(1) heavy metals such as zinc and copper e.g. from buildings and roads, as well as cadmium;
(2) polychlorinated biphenyls (PCB), e.g. from transformers and hydraulic fluids, and polycyclic aromatic hydrocarbons (PAH), e.g. from combustion plants, and which are measured everywhere in the Rhine; and,
(3) bentazone, tributyltin, pentachlorobenzene, diurone, bromi-nated diphenylethers, hexachlorobutadien. These substances are, among others, plant protection agents, conservation agents or industrial chemicals.
In 12% of the water bodies of the main stream of the Rhine the chemical status is good; in 88% it is not good. In most cases, the cause is PAH concentration exceeding environmental quality standards.
On the whole, the quantitative groundwater status in the Rhine Basin can be said to be good, which means that there is no abstrac-tion in excess. Due to draining measures, the status of groundwater in the brown-coal mining area along the Rhine is bad.
Apart from certain groundwater bodies with a bad status, the chemical status of groundwater bodies is largely good. The rea-sons for the classification “bad status” are the nitrate pollution due to fertilization in agriculture and intensive livestock keeping as well as inputs of plant protection agents.
Biological inventories of the state of flora and fauna in the Rhine have been carried out, and were subsequently compared to earlier investigations. Improved river continuity, water quality and the protection of habitats have had an impact on the fauna of the Rhine. According to these inventories the fish species composi-tion in the Rhine is almost complete: 67 fish species were de-tected and all historically identified species except for the Atlantic Sturgeon have returned. The macrozoobenthos have recovered to 560 species; species which were extinct or considerably di-minished have returned, but many species are still absent. Some 36 water plant species (macrophytes) and 269 fixed diatom spe-cies (phytobenthos) have been inventoried in the Rhine. On the other hand, invasive species often spread at the expense of the in-digenous fauna. Apart from numerous invertebrate species, even some fish species, among others from the Black Sea area, have been detected.18
Responses In 2005, the most important management issues for the whole Rhine River Basin District have been defined in the management plan report according to the WFD:19
(1) “restoration”20 of biological river continuity, increased habitat diversity;
(2) reduction of diffuse inputs interfering with surface waters and groundwater (nutrients, pesticides, metals, dangerous substances from historical contamination and others);
(3) further reduction of classical pollution of industrial and mu-nicipal origins; and,
(4) harmonization of water uses (navigation, energy production, flood protection, regional land use planning and others) with environmental objectives.
18 Source: Summary report on the quality components phytoplankton, macrophytes/phytobenthos, macrozoobenthos, fish. ICPR, Report no. 168. 2009.19 Internationally Coordinated Management Plan for the Rhine International River Basin District of the Rhine, International Commission for the Protection of the
Rhine, December 2009.20 As far as possible, river continuity is to be restored.
316 | part IV

Migratory fish are at the same time pilot and indicator species for the living conditions of numerous other organisms.
As far as regards the Lake Constance Lake Trout. which is the in-dicator species for the region of the Alpine Rhine and Lake Con-stance, a separate Lake Trout Programme is being implemented.
The States in the Rhine catchment area strive to progressively restore river continuity in the main course of the Rhine as far as Basel, and in certain so-called “programme waters”.
The “Master Plan Migratory Fish Rhine” has been drafted with a view of achieving this target.21 In order to build a self-sustained stock of salmon and Lake Trout, the access to a maximum num-ber of identified spawning and juvenile habitats in the Rhine catchment must be restored, and these habitats must be revit-alised. Additionally, among others, the possibilities of upstream migration must be improved. On the whole, with these mea-sures, a total of more than 1,000 ha of spawning and juvenile habitats are supposed to be opened in the Rhine catchment area.
The most important fields of action in the main course of the Rhine and major tributaries will be to:
(1) improve fish migration at the Haringvliet sluices and at the closure embankment of Lake IJssel;
(2) construct fish passages at the two dams in the Upper Rhine upstream of Gambsheim (Strasbourg by 2015, work in Ger-stheim to begin before 2015 in order to open the way into the Elz-Dreisam system in the Black Forest);
(3) improve existing fish passages at four dams on the High Rhine, a new construction is planned for the Rheinau Dam; and,
(4) equip several big dams in the navigable tributaries Moselle (19), Main (6), Lahn (20), Neckar (3), with fish migration facilities.
In addition, several hundreds of individual measures will be im-plemented at smaller barrages in suitable tributaries where the largest spawning habitats are found.
Species diversity may be increased by increasing structural diversity in the riverbed and on the riverbanks. Water maintenance must be environmentally compatible. These measures will contribute towards opening up further habitats for the flora and fauna liv-ing in the water, on its banks and in the floodplains. By 2015,
various measures for opening up habitats and for increasing struc-tural diversity in the river will have been implemented along the main course of the Rhine, in the old bed of the Rhine, along the big navigable Moselle, Main, and Neckar tributaries and along the Lippe River, as well as in many smaller waters in the Rhine Basin.
To improve water quality, 96 % of the about 58 million people living in the Rhine River Basin District have so far been connect-ed to a wastewater treatment plant. Many big industrial plants or chemical parks (a considerable part of worldwide chemical production is located in the Rhine catchment area) have their own wastewater treatment plants, which are, at the very least, state-of-the-art facilities. As a result of considerable investment in the construction of wastewater treatment plants in all the States, point sources now contribute less often to classical pol-lutant contamination than in the past. The pollutant and nutri-ent contamination currently being observed is largely of diffuse origin. Agriculture and municipalities have already made efforts to reduce these discharges.
Mainly with a view to improve the marine environment, a reduction of the load of total nitrogen by 15% to 20% is targeted as a result of reduction at source. Measures already implemented will be taken into account. A reduction of input by 10 to 15% by the first cutoff year according to WFD, 2015, is considered to be achievable.
Generally, zinc and copper inputs are of diffuse origin. For some applications, environmentally friendly alternatives are imaginable (e.g., construction sector, car components, antifouling, treatment of animal’s hoofs). No further direct PCB inputs are known. For-mer PCB pollutions still exist in bottom sediments, and may be released during floods or dredging. These pollution sources must be rehabilitated to the extent possible. Since PAH mainly get into waters as diffuse air-borne pollution, no considerable improve-ment is expected by 2015 for this group of substances, and thus for the chemical status of the water bodies concerned.
Trends22
With climate change, winters are expected to become more hu-mid, while summers will presumably be drier. Regionally, the amount of precipitation falling in a short time may be great-er than today. Among other things, for the Rhine this means that run-off levels and water temperature may change. Climate change may impact flood protection, drinking water production, industrial activities, agriculture and nature. In the long run, the increase in temperature will lead to rising sea levels. Since 2007,
21 Master Plan Migratory Fish Rhine. ICPR, Report no. 179. 2010.22 Sources: Scenario studies for the discharge pattern of the River Rhine (forthcoming in 2011); Analysis of the state of knowledge on climate changes so far and on
the impact of climate change on the water regime in the Rhine watershed - Literature evaluation, available at www.iksr.org.
figuRe 2: Present ecological status or potential of the water bodies of the main course of the Rhine based on the number of water bodies
Source: Rhine River Basin Management Plan.
37% 14%
8%
4%
34%
0%4%
Good
Moderate
Poor
Bad
No data
No assessment required
316 | part IV Chapter 7 Drainage basins of the north sea anD eastern atlantic | 317

the ICPR is recording the impact of eventual climate change on the water balance and on water temperatures of the Rhine.
According to present knowledge, air temperature has risen by about 1 °C during the past 100 years, and precipitation in the Rhine Basin has increased. The glaciers of the Alps continue to retreat. There is a tendency towards more humid winters and dri-er summers, accordingly impacting water discharge. The Rhine water temperature has risen by about 1 °C to 2.5 °C, but it is also impacted by cooling water discharges.
Sustainable development of the river should be the basis for fu-ture policies for international rivers, which means the promotion of a balanced use of the river, respecting all interests and interest groups, now and in future. Precaution and prevention are the most important basic principles for river basin management.
During the years to come, the ICPR will work on harmonized ad-justment strategies with respect to floods and low water, water tem-perature, water quality, and ecology in the Rhine Basin. These strate-gies will be part of the second International Management Plan.
laKe ConstanCe23
Lake Constance, which belongs to the Rhine Basin, is the sec-ond largest pre-Alpine European lake, and serves as an important drinking water supply for 4 million people. A major tributary to Lake Constance is the Alpine Rhine, with its sub-basin in Italy, Switzerland, Liechtenstein and Austria.
The lake basin is situated in the Molasse basin of the northern Alpine foreland, and was mainly formed by water and ice activity during the last Quaternary glaciation period, more than 15,000 years ago. The lake basin area of about 11,000 km² (~20 times the lake surface) covers the territories of five European countries: Germany (28%); Switzerland, Liechtenstein and Italy (48%); and Austria (24%). With an area of 572 km2 and a total volume of 48.5 km3, Lake Constance lies 395 m a.s.l. Its two major parts are the Upper Lake Constance (472 km2, 47.6 km3, maximum depth 253 m, mean depth 101 m), shared by Germany, Austria and Switzer-land, and the Lower Lake Constance (62 km2, 0.8 km3, maximum depth 40 m, mean depth 13 m), shared by Germany and Swit-zerland. More than 75% of the water inflow originates from the Alps, mainly through the tributaries Alpine Rhine (Alpenrhein) and Bregenzerach. The lake has a water retention time of 4.3 years.
Status It is an intensively monitored hard-water lake with low-phos-phorus content. The Upper Lake is almost oligotrophic: phos-phorus levels <10 μg/l since 2005). Originally an oligotrophic water body, eutrophication started to threaten the lake in the late 1950s, and remarkably affected the species composition of the biota. Starting in the early 1980s, phosphorus concentrations strongly declined, and overall water quality improved. This was due to reduced nutrient loads (more than 4 billion euros have been invested to improve sewage treatment).
Phytoplankton succession typically shows a spring bloom, fol-lowed by the “clear water” phase, with very low phytoplankton abundance due to zooplankton grazing. Diatoms contribute up to 90% of the phytoplankton biovolume in spring. Phytoplank-ton, bacteria and crustaceans are the most important contribu-tors of biomass. During summer, zooplankton is the main food
source for most fish in Lake Constance. About 30 species of fish contribute to the fauna of Lake Constance. The dominant spe-cies are whitefish and perch, contributing to 90% of total com-mercial fishing yield (1,032 tons, annual mean for the period 1995–2004).
Transboundary cooperation and responses The countries bordering Lake Constance cooperate through the International Commission for the Protection of Lake Constance, in existence since 1959. As the lake is part of the Rhine River Basin, the Alpine Rhine-Lake Constance area of operation is one out of nine such areas in the basin.
Lake Constance is a designated Ramsar Site.
In recent times, the pressures of rising population figures and in-dustrial and agricultural activities may have deserved concern. To-day, some 60% of shore and shallow-water zones are characterized as deviating from the natural state, and therefore a main focus is on ecological improvement by shoreline restoration. For this purpose, the International Commission for Protection of Lake Constance has initiated a “Shore-water and Shallow-water Zone” action pro-gramme to restore natural shorelines step by step, on the basis of a renaturation guidance, jointly established in 2009. The biological quality of tributaries discharging into the lake varies from unpol-luted headwater rivers, to slightly polluted lower reaches. Hydro-morphological changes have been severe in these areas, as canali-zation and artificial riverbeds and banks are common. Recently, revitalization has been undertaken in the floodplains of the Alpine Rhine, and several other tributaries of Lake Constance.
With regard to the Lake Constance Trout and other migratory fish, the International Conference of Plenipotentiaries for Lake Constance fishery started a conservation programme in 2010, with the objective of protecting and increasing the trout popula-tion in the lake and its tributaries.
Trends Lake Constance is also facing climate change, with increasing winter temperatures and higher precipitation in the form of rain. The summers will be dryer and hotter, resulting in lower wa-ter levels and changes in the littoral zone. This climatic change might be accompanied by the appearance of an increasing num-ber of exotic species which may threaten indigenous biota.
23 Based on information in the Rhine River Basin District working area Alpine Rhine/Bodensee, International coordination of the management plans and programmes of measures in implementation of the WFD (2009) and the First Assessment.
318 | part IV
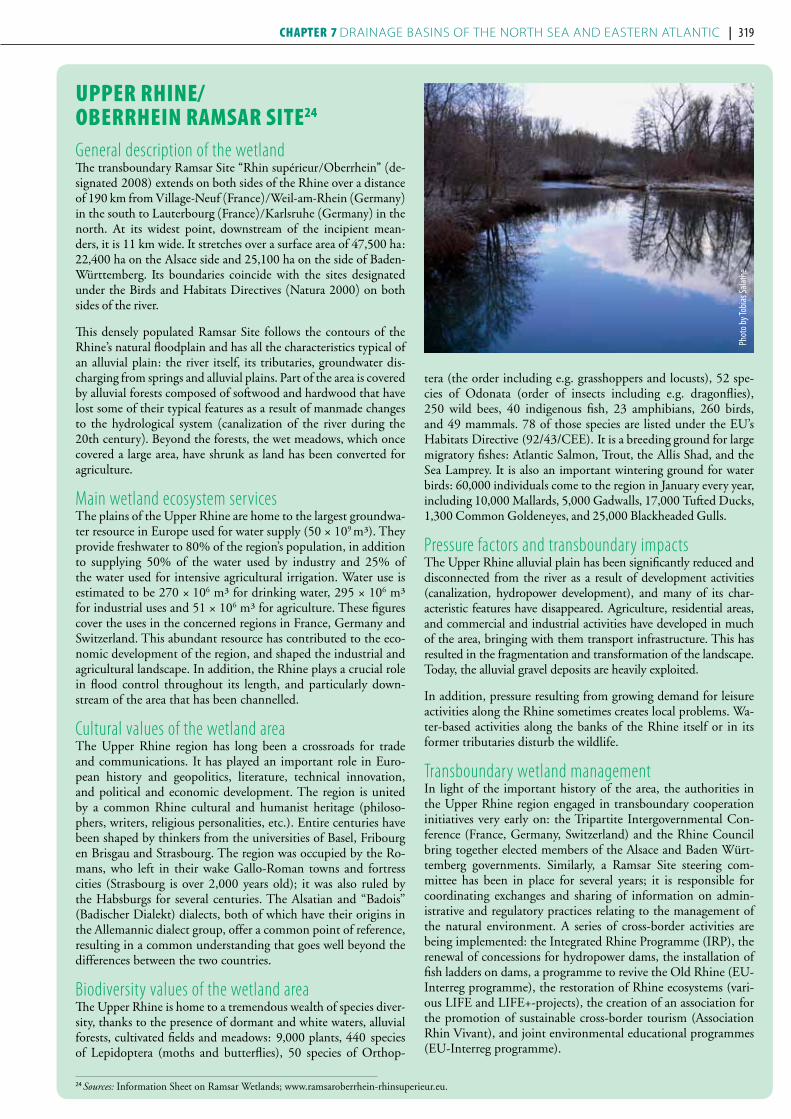
upper rhIne/ oBerrheIn ramsar sIte24
General description of the wetland The transboundary Ramsar Site “Rhin supérieur/Oberrhein” (de-signated 2008) extends on both sides of the Rhine over a distance of 190 km from Village-Neuf (France)/Weil-am-Rhein (Germany) in the south to Lauterbourg (France)/Karlsruhe (Germany) in the north. At its widest point, downstream of the incipient mean-ders, it is 11 km wide. It stretches over a surface area of 47,500 ha: 22,400 ha on the Alsace side and 25,100 ha on the side of Baden-Württemberg. Its boundaries coincide with the sites designated under the Birds and Habitats Directives (Natura 2000) on both sides of the river.
This densely populated Ramsar Site follows the contours of the Rhine’s natural floodplain and has all the characteristics typical of an alluvial plain: the river itself, its tributaries, groundwater dis-charging from springs and alluvial plains. Part of the area is covered by alluvial forests composed of softwood and hardwood that have lost some of their typical features as a result of manmade changes to the hydrological system (canalization of the river during the 20th century). Beyond the forests, the wet meadows, which once covered a large area, have shrunk as land has been converted for agriculture.
Main wetland ecosystem services The plains of the Upper Rhine are home to the largest groundwa-ter resource in Europe used for water supply (50 × 109 m³). They provide freshwater to 80% of the region’s population, in addition to supplying 50% of the water used by industry and 25% of the water used for intensive agricultural irrigation. Water use is estimated to be 270 × 106 m³ for drinking water, 295 × 106 m³ for industrial uses and 51 × 106 m³ for agriculture. These figures cover the uses in the concerned regions in France, Germany and Switzerland. This abundant resource has contributed to the eco-nomic development of the region, and shaped the industrial and agricultural landscape. In addition, the Rhine plays a crucial role in flood control throughout its length, and particularly down-stream of the area that has been channelled.
Cultural values of the wetland areaThe Upper Rhine region has long been a crossroads for trade and communications. It has played an important role in Euro-pean history and geopolitics, literature, technical innovation, and political and economic development. The region is united by a common Rhine cultural and humanist heritage (philoso-phers, writers, religious personalities, etc.). Entire centuries have been shaped by thinkers from the universities of Basel, Fribourg en Brisgau and Strasbourg. The region was occupied by the Ro-mans, who left in their wake Gallo-Roman towns and fortress cities (Strasbourg is over 2,000 years old); it was also ruled by the Habsburgs for several centuries. The Alsatian and “Badois” (Badischer Dialekt) dialects, both of which have their origins in the Allemannic dialect group, offer a common point of reference, resulting in a common understanding that goes well beyond the differences between the two countries.
Biodiversity values of the wetland areaThe Upper Rhine is home to a tremendous wealth of species diver-sity, thanks to the presence of dormant and white waters, alluvial forests, cultivated fields and meadows: 9,000 plants, 440 species of Lepidoptera (moths and butterflies), 50 species of Orthop-
tera (the order including e.g. grasshoppers and locusts), 52 spe-cies of Odonata (order of insects including e.g. dragonflies), 250 wild bees, 40 indigenous fish, 23 amphibians, 260 birds, and 49 mammals. 78 of those species are listed under the EU’s Habitats Directive (92/43/CEE). It is a breeding ground for large migratory fishes: Atlantic Salmon, Trout, the Allis Shad, and the Sea Lamprey. It is also an important wintering ground for water birds: 60,000 individuals come to the region in January every year, including 10,000 Mallards, 5,000 Gadwalls, 17,000 Tufted Ducks, 1,300 Common Goldeneyes, and 25,000 Blackheaded Gulls.
Pressure factors and transboundary impactsThe Upper Rhine alluvial plain has been significantly reduced and disconnected from the river as a result of development activities (canalization, hydropower development), and many of its char-acteristic features have disappeared. Agriculture, residential areas, and commercial and industrial activities have developed in much of the area, bringing with them transport infrastructure. This has resulted in the fragmentation and transformation of the landscape. Today, the alluvial gravel deposits are heavily exploited.
In addition, pressure resulting from growing demand for leisure activities along the Rhine sometimes creates local problems. Wa-ter-based activities along the banks of the Rhine itself or in its former tributaries disturb the wildlife.
Transboundary wetland managementIn light of the important history of the area, the authorities in the Upper Rhine region engaged in transboundary cooperation initiatives very early on: the Tripartite Intergovernmental Con-ference (France, Germany, Switzerland) and the Rhine Council bring together elected members of the Alsace and Baden Würt-temberg governments. Similarly, a Ramsar Site steering com-mittee has been in place for several years; it is responsible for coordinating exchanges and sharing of information on admin-istrative and regulatory practices relating to the management of the natural environment. A series of cross-border activities are being implemented: the Integrated Rhine Programme (IRP), the renewal of concessions for hydropower dams, the installation of fish ladders on dams, a programme to revive the Old Rhine (EU-Interreg programme), the restoration of Rhine ecosystems (vari-ous LIFE and LIFE+-projects), the creation of an association for the promotion of sustainable cross-border tourism (Association Rhin Vivant), and joint environmental educational programmes (EU-Interreg programme).
24 Sources: Information Sheet on Ramsar Wetlands; www.ramsaroberrhein-rhinsuperieur.eu.
Phot
o by T
obias
Salat
he
318 | part IV Chapter 7 Drainage basins of the north sea anD eastern atlantic | 319

moselle suB-BasIn and saar suB-BasIn25
The sub-basin of the Moselle and its largest tributary, the Saar, is one of nine sub-basins of the International Rhine River Ba-sin District and makes up about 15% of the district’s area. It is shared between France, Luxembourg, Germany (Saarland, Rhineland-Palatinate, North Rhine-Westphalia) and Belgium (Walloon Region).
Sub-basins of the Moselle and Saar Rivers Country Area in the country (km2) Country’s share (%)Belgium 767 2.7France 15 360 54.3Germany 9 637 34.1Luxembourg 2 521 8.9
Total 28 286
Hydrology and hydrogeology The Moselle originates in the Vosges region of France, and flows into the Rhine 520 km later in Koblenz (Germany). Its main tributaries are the Saar (length 227 km, sub-basin area 7,431 km2), the Sauer River (173 km, 4,234 km2) and the Meurthe River (161 km, 2,900 km2).
Precipitation in the sub-basin ranges from 600 mm/year in the middle and lower Moselle region to 1,800 mm/year in the Vosges (average for the whole basin is 900 mm/year). Taking into ac-count evapotranspiration, the average annual outflow (surface run-off and groundwater recharge) ranges between 550 mm/year in France and 335 mm/year in Saarland (Germany).
Some 600 water bodies have been identified according to the WFD, including around 30 that belong to two or three different countries. A large proportion of the watercourses in the sub-ba-sins of the Moselle and the Saar remain in a natural state (87%), despite extensive anthropogenic interventions, and only 13% are classified as heavily modified.
In the case of groundwater, variations in the definitions applied have led to country-specific differences in the quantity and size of groundwater bodies. Of the 71 groundwater bodies identified in total in the Moselle-Saar sub-basins, 26 are located in the vicinity of a border.
Pressures26
Around half of the area of the sub-basins is used for agricultural purposes, with equal shares of arable land and grassland. Vines are grown extensively on the slopes above the Moselle in Ger-many and Luxembourg, as well as along the Saar in Rhineland-Palatinate. Around one-third of the area is wooded.
The countries in the sub-basins carried out a joint analysis as a part of implemention of the WFD for the identification of the key transboundary problem areas, described here briefly.
Water use along the Moselle and Saar, coupled with local regional planning policy, is not always consistent with the environmental objectives of the WFD, particularly in the areas of navigation, energy generation and flood protection.
The biological continuity of the Moselle and Saar is not guar-anteed, which impairs fish migration. Common forms of pol-lution – particularly nutrients (nitrogen and phosphorus) – and diffuse discharges adversely affect the status of surface waters. Levels of pollution by hazardous substances remain too high in certain parts of the river basin. Groundwater quality is impaired by diffuse pollution (plant protection agents, nitrate, contami-nated sites and metals). The ecological equilibrium of the water is impaired by mining (coal and iron ore).
For many decades, the Moselle and the Saar have been developed into major shipping lanes along a large proportion of their length. This has significantly transformed the habitats of flora and fauna; in particular, the 28 locks on the Moselle and a further 6 on the Saar represent a major barrier to fish migration. These physical and biological changes also influence the oxygen balance, and hence the water quality.
So-called common pollutants, whether from point or diffuse sources, originate primarily from discharges from wastewater treatment plants and from agriculture.
25 Based on information provided by the International Commissions for the Protection of the Moselle and the Saar (ICPMS). 26 For details, please refer to the international Moselle and Saar River Basin Management Plan (2009) available at www.iksms-cipms.org.
1%
Surface with little or no vegetation (<1%)Water bodies (<1%)Wetlands (<1%)
CultivatedForestGrassland/ShrublandUrban/Industrial areas
Others
29%
41%
22%
7%
Sources: UNEP/DEWA/GRID-Europe 2011; International Commissions for the Protection of the Moselle and the Saar (data).
LAnD CoveR in The moSeLLe SuB-BASin AnD SAAR SuB-BASin
Number of wastewater treatment plants and annual discharges in the Moselle and Saar sub-basins:number of wastewater treatment plants Annual load (t)
State> 2 000
inhabitants> 10 000
inhabitants> 100 000
inhabitants Total CoD nitrogen totalphosphorus
totalBelgium, Walloon Region 1 1 0 2 76 27 3France 80 43 3 126 4 912 1 120 55Germany North Rhine- Westphalia 2 0 0 2 20 4.5 0.6Germany Rhineland- Palatinate 76 39 1 116 1 990 580 88Germany Saarland 30 29 2 61 4 900 1 427 142Luxembourg 28 9 1 38 3 501 1 209 104
320 | part IV

The following main pressures affect the groundwater and influ-ence its quality (ranked in order of importance):
(1) nitrate pollution;
(2) pollution with plant protection agents;
(3) chloride and sulphate; and,
(4) chlorinated solvents.
Pollution with heavy metals, polychlorinated biphenyls (PCB) and polycyclic aromatic hydrocarbons (PAH) has been detected across the entire area.
Chloride from anthropogenic discharges also continues to pose a major problem in the Moselle, downstream of the Meurthe. The lower reaches of this Moselle tributary are affected by salt discharges (or more precisely, calcium chloride discharges CaCl
2)
from the Lothringian salt industry (soda plants).
Mining activities, both coal and iron ore, have been closed down. Mining has permanently disturbed and altered the ecological equilibrium of surface waters and groundwater, causing a num-ber of cross-regional problems, which will need to be tackled in the long term.
The Saar in particular is affected by discharges of industrial wastewater from mining and from decommissioned mines, lead-ing to high concentrations of chloride and other priority sub-stances. Mining-related changes to the soil and subsoil, and the discontinuation of mining, directly impair the quality of ground-water in the iron ore and coal basin, which in turn affects the water supply to the population at local level.
Status and transboundary impactsThe assessment of the status (also the projected status for 2015) was carried out in close transboundary harmonisation and coor-dination between the riparian countries, particularly with regard to water bodies in the vicinity of national borders. Despite some differences in assessment methods, particularly with regard to biological aspects, harmonisation was facilitated through discus-sions between experts, and separately documented in the Inter-national River Basin Management Plan.
In the entire Moselle-Saar sub-basins, based on the data from surveillance monitoring (2007), only 118 surface water bodies out of a total of 620 or 19%, have a good status, that is, both the chemical status and ecological status are at least "good". This is due to both a bad chemical and ecological status, as only 261 water bodies (43%) have a good chemical status and 35% a good
ecological status. PAHs are primarily responsible for the bad chemical status, and exceed the environmental quality standards at many monitoring sites. If PAHs were disregarded, 85% of sur-face water bodies would be of good chemical status.
In terms of quantity, 97% of a total of 71 groundwater bod-ies have a good quantitative status. In qualitative terms, 65% of groundwater bodies have a good chemical status, while 35 % of groundwater bodies are classified as having a bad status due to diffuse pollution with nutrients (nitrate) and plant protection agents.
Transboundary cooperation and responsesThe countries sharing the sub-basins collaborate in the Interna-tional Commissions for the Protection of the Moselle and the Saar (ICPMS) to ensure the sustainable management of all the rivers in the sub-basins. This collaboration also serves to coor-dinate implementation of the WFD throughout the sub-basins, and the RBMP was drawn up documenting the implementation and its international coordination.27
In the Moselle-Saar sub-basins, the sometimes complex trans-boundary harmonisation of measures and programmes of mea-sures (such as the Moselle-Saar Action Programme 1990-2000) to ensure consistent approaches has the benefit of a long tradition under the umbrella of the ICPMS, supported by its permanent secretariat in Trier (Germany).
Close collaboration between the areas of water management, land use planning, agriculture and forestry makes it possible to develop measures related to water use that fulfill several objectives simultaneously.
The basic measures to improve the hydromorphology of water-courses and reduce pollution are derived from the relevant EU Directives and corresponding legislation of the member States. Technical modifications to the Moselle and Saar and many of their tributaries have considerably altered the aquatic living con-ditions. Measures to improve biological continuity essentially comprise the conversion or demolition of weirs and other obsta-cles to migration, the construction of fish ladders, guaranteeing the required minimum outflow, and improving habitats. To this end, the ICPMS drafted an inventory of biological continuity in the Moselle and Saar sub-basins in 2010.
The pressures from human settlements are to be reduced by a raft of measures on buildings, residential areas, wastewater collection systems and wastewater treatment plants. Improved rainwater management, achieved by building new residential areas with
27 For details, the Moselle and Saar River Basin Management Plan should be referred to.
Land use/land cover and selected anthropogenic pressures in the Moselle/Saar sub-basin
Country Belgium france germany LuxembourgTotal,
moselle/Saar
Region/StateWalloon
Region north Rhine-
WestphaliaRhineland-
palatina SaarlandSurface area (km2) 767 15 360 88 6 980 2 569 2 521 28 286Population: inhabitants x 1 000 38 1 981 4 855 1 066 399 4 343Communities 17 1 680 2 792 52 114 2 657Towns > 100 000 inhabitants 0 2 0 1 1 0 4Towns> 10 000 inhabitants 2 30 0 18 39 4 93Forested area 38% 30% 51% 46% 33% 35% 35%Agricultural grassland 40.8% 20% 43% 18% 15% 25% 20%Agricultural arable land 17% 27% 1% 19% 15% 24% 23%UGBNa/Livestock units (x 1 000) 60 400 5 215 75 150 961
a UGBN is the common unit used in France for comparison of loading from livestock. 1 UGBN is equal to 32 population equivalent (p.e.) in oxidizable organic matter and to 15 p.e. in nitrogen.
320 | part IV Chapter 7 Drainage basins of the north sea anD eastern atlantic | 321

separate sewer systems, and by the construction of storm water storage tanks in combined sewer systems, will help to further op-timise the purification level of wastewater treatment plants. Pub-lic education campaigns are being conducted to raise awareness of the problem of waste disposal via the sewer system.
Diffuse pollutants are predominantly due to agricultural prac-tices, but regional and local authorities and private individuals also contribute. One important measure is therefore to provide targeted advice to all user groups on good practices. Diffuse ag-ricultural pollution is also tackled by aiming at optimizing pro-duction factors and their sustainability, for example, through improving fertilizer management. Another objective is to avoid or reduce the discharge of nutrients and plant protection agents by means of sustainable land management through measures aimed at extensification of agriculture, extended crop rotation and intercropping, as well as soil cultivation measures, including environmentally sound soil management to prevent erosion and minimize run-off.
Measures to prevent discharges of plant protection agents from agricultural land into rivers have been jointly developed, outlined and evaluated with regard to their effectiveness by the water man-agement and agricultural authorities of all ICPMS Parties. Here too, measures are needed to advise and educate the relevant play-ers, including private consumers. Funding from the European Agricultural Fund for Rural Development (EAFRD) will be used to specifically encourage the introduction or retention of environmentally sound agricultural management and cultivation practices.
PAHs and PCBs are widespread in the Moselle and Saar rivers. Levels of PCB contaminations in suspended matter have been monitored since the early 1990s as part of the international ICPMS monitoring programme, and in 2004 a special monitor-
ing programme with regard to PCB in suspended matter and fish was devoted to this aspect.
It has become evident that it will not be possible to reduce PAH from diffuse sources sufficiently to meet the environmental qual-ity standards by the specified deadline. As these discharges are not solely a water management responsibility, and sometimes ex-tend far beyond the national framework, an EU-wide response is needed.
It is estimated that the coal mine workings will be flooded in the course of coming 10 years. Thereafter, groundwater levels and quality will need to be monitored by means of a suitable mon-itoring network. Initial expert reports on this issue have been commissioned. As a final decision on the future has yet to be reached, and a number of alternatives are still under discussion, it is not possible to predict exactly how the mine workings are to be flooded, and when long-term stability is likely to set in.
The monitoring networks for surface waters in place since the mid-1960s have been adapted in line with the requirements of the WFD, so as to obtain a coherent and comprehensive over-view of water body status. The international monitoring network of the ICPMS currently comprises some 50 monitoring sites. During the course of implementing the WFD, a monitoring net-work for groundwater comprising a total of 401 monitoring sites started operation.
TrendsDue to their chemical status, only 24% of surface water bodies will achieve a good status by 2015 through the implementation of the programmes of measures accompanying the 2010-2015 RBMP. However, the proportion of water bodies with a good ecological status will improve significantly, to 56.5 %. In the Mo-selle and Saar sub-basins, it is expected that 99 % of groundwater bodies will achieve a good quantitative status by 2015, and 75 % a good chemical status.
The rise in average air temperatures, the clearest indicator of cli-mate change, will have a tangible influence on the hydrological cycle. Surface waters and groundwater will be affected by changes in the precipitation and evaporation regime. Experts predict that in addition to the long-term changes in current average condi-tions, annual extremes will also increase. Changes and impacts are expected in key sub-aspects of water management.
The Interreg IV A project FLOW MS (Flood and Low Flow Management Moselle - Saar) was launched in early 2009 under the umbrella of the ICPMS. This 5-year project, with a budget of 3.4 million euros, is 50 % co-financed from ERDF28 funds. It aims to improve precautionary flood protection, to reduce the potential damage associated with flooding, and advance low flow management in the Moselle and the Saar sub-basins. Within this framework, the impacts of climate change on flooding and low flows will be investigated on a transboundary basis. The results of existing climate scenarios, and those currently under develop-ment, serve as the basis for analysis using available hydrological balance models (such as LARSIM).29
The ICPMS will continue to function as an international coor-dination platform for the implementation of the WFD and the Floods Directive of 2007. In this context, the ICPMS Flood Ac-tion Plan, which was adopted in 1998 and which outlines mea-sures up until 2020, will be converted into a flood risk manage-ment plan under the Floods Directive.
28 ERDF - European Regional Development Fund.29 LARSIM - Large Area Runoff Simulation Model (http://larsim.sourceforge.net/index.en.php).
322 | part IV

DiSChARgeS, popuLATion AnD LAnD CoveR in The meuSe RiveR BASin DiSTRiCT
18 K
eizer
svee
r
17 K
inro
oi
16 Ei
jsden
15 A
nden
ne
14 H
astiè
re
13 H
am-s
ur-M
euse
12 In
or
Disc
harg
e (m
3 s-1) (
loga
rithm
ic sc
ale)
280
60(M
euse
)
(Meu
se)
(Meu
se)
(Meu
se)
(Meu
se)
(Meu
se)
(Meu
se)1
10
1000
100
10000
7
841
168
25
896
157
22
1262
193
30
1824
234
15
1233
231
14
1549
313
28
QavQmaxQmin
Popu
lation
(in h
undr
ed th
ousa
nds)
0
5
10
15
20
25
30
35
40
Neth
erlan
dsLu
xem
bour
gGe
rman
yFra
nce
Belgi
um
26.1
6.7
19.9
0.4
35.0Country information/other
4%1%
Surface with little or no vegetation (<1%)Water bodies (<1%)Wetlands (<1%)
CultivatedForestGrassland/ShrublandUrban/Industrial areas
Others
22%
33%
40%
Sources: UNEP/DEWA/GRID-Europe 2011; Management Plan of the International River Basin District Meuse: Roof report. December 2009 (population data); International Meuse Commission (discharges).
meuse rIVer BasIn dIstrICt30
Belgium (the Flemish and Walloon regions), France, Germany, Luxembourg, and the Netherlands share the Meuse River Basin.31
The source of the 906-km long Meuse River is on the Langres plateau in France, at an elevation of 384 m a.s.l., in Chatelet-sur-Meuse. The Meuse River flows from its source through France, Belgium and the Netherlands, to the North Sea.
The most important tributaries of the Meuse — most of them transboundary — are the Chiers, Semois, Lesse, Samber, Ourthe, Roer, Swalm, Niers, Dommel and Mark.
The basin of the Meuse comprises a large number of aquifers. Many of these strata extend across borders.
Hydrology and hydrogeologyPeak run-off usually occurs in winter and spring. Summer and autumn are mainly characterized by longer periods of low flows.
The basin of the Meuse River can be divided into three sections, with differing geomorphologic and physical features and human impacts.
The first section, from the source to the city of Charleville-Mézières (France), is characterized by low-flow velocity, and low pressure from industry and municipalities.
Meuse River Basin District Area in the country/
region (km²)Country’s/
region’s share number of water
bodies “lakes”number of water
bodies ”rivers”Length of rivers
in kmnumber of
groundwater bodiesBelgium Flemish Region 1 596 4.6 3 17 272 10Belgium Walloon Region 12 300 35.8 12 245 4 934 21
France 8 919 26.0 5 152 3 363 13Germany 3 984 11.6 1 227 1 6212 32Luxembourg 65 0.2 0 3 15 1a
Netherlandsb 7 500 21.8 19 133 2 688 5Total 34 364 40 777 12 893 82
a The groundwater body of Luxembourg is included in, and managed as part of, the International River Basin District Rhine.Source: Management Plan of the International River Basin District Meuse: Roof report. December 2009.
30 Based on information provided by the International Meuse Commission with the following specific sources: International River District Meuse - Characteristics, review of the Environmental Impact of Human Activity, Economic Analysis of Water Use’, Roof report, March 2005; ‘International Meuse Commission: Report on the quality of the Meuse’, December 2004; ‘The International River District Meuse: a status assessment, November 2005; Management Plan of the International River Basin District of the Meuse’, Roof report, December 2009.
31 The International River Basin District Meuse (IRBD Meuse) is the management unit under the WFD, which includes its associated coastal waters (two coastal water bodies in the Netherlands).
322 | part IV Chapter 7 Drainage basins of the north sea anD eastern atlantic | 323

The second section, where the Semois, Lesse, Sambre and Ourthe rivers join the Meuse, stretches from Charleville-Mézières to Liège (Belgium). During periods of heavy precipitation, these tributaries contribute substantially to the flow of the Meuse, and may cause rapid water level rises. The sub-basins of these tribu-taries make up the principal natural value of this river section, and are especially important as spawning grounds and growth areas for rheophile fish (fish that prefer fast-moving water). A few small islands in the river and parts of the banks have remained in their natural condition, offering habitats for a variety of spe-cies of plant and animal life. The section has also many heavily urbanized and industrial sites, both along the main watercourse as well as along the Sambre tributary. Making the main course of the Meuse navigable involved major development.
The third section, a flood plain area, stretches from Liège to the mouth. This section is navigable, which limits the possibilities for a natural low-water channel, and severely reduces fluvial dynam-ics. This region is also characterized by dense population, inten-sive agriculture and many industries. Areas of great ecological value exist (e.g. woods, heather fields and marshlands), but their area has been reduced and they are widely dispersed. The north-western part offers an attractive and relatively open area that is sur rounded by urban harbour areas.
PressuresSome 8.8 million people live in the International River Basin District (IRBD) Meuse, and use water for drinking and domes-tic purposes, agriculture and industry, hydropower generation, navigation and recreation. The water of the Meuse also supports surrounding ecosystems, and is exported by pipelines and canals to provide drinking water to people living outside the basin.
A number of locks and dams were built in the river for naviga-tion purposes or protection against floods, leading to significant modifications of the natural character of the river in most of its sections.
Human impact has altered the natural hydromorphological and ecological conditions. The main driving forces for these alterations are urbanization, industrialization, agriculture, and navigation.
There are different types of pressures in the IRBD Meuse:
• emissions, losses and discharges of pollutants;
• sluices, weirs and dams (flood protection, navigation and hy-dropower generation);
• canalisation, artificial banks and dikes; and,
• water withdrawals (for canals, agriculture, industry and the production of drinking water).
These pressures result, sometimes individually, sometimes in combination, in the following potential or observed impacts and consequences:
for surface water:
• impairment of ecosystems, including terrestrial ecosystems that interact with the water;
• hampered circulation of fish;
• eutrophication, especially in the main course of the river and in coastal waters; and;
• potential risk for water uses.
for groundwater:
• influence on terrestrial ecosystems; and,
• potential risk for water uses.
For the French part of the river basin, agriculture is the main driving force.
In the Walloon Region (Belgium), in the more densely populated and industrialized sub-basins of the Vesdre Sambre and Meuse aval, urbanization is the major driving force. For the Semois and Lesse rivers, only smaller longitudinal obstacles are present, with no strong driving forces restricting restoration potentials.
In the German, Flemish and Dutch lowlands, urbanization and agriculture are the major causes to alterations in hydromorpho-logical characteristics. In the Dutch part of the Meuse River, most pressures derive from flood defence and shipping. Safety and flood control measures (e.g. delta works and the closure of the Haringvliet estuary in the Netherlands) in the 1970s were essential social measures, but deprived the area of tidal dynam-ics, resulting in a decreased ecological potential. For the smaller tributaries, especially in the Netherlands, agriculture remains a major driving force. In addition to the strongest estimated im-pact of longitudinal obstacles and changes in river discharge in the basin, local pressures on habitat quality can seriously affect the ecological integrity of the river.
There are important management issues in the Meuse River Ba-sin District that require multilateral coordination:
• hydromorphological changes (restoration of the natural char-acter and removal of barriers);
• water quality:
• usual pollutants (organic matter, indicated by COD, nitro-gen, phosphorus); and,
• others (heavy metals, micropollutants – particularly priority substances,32 copper, zinc, PCBs, other pesticides);
• water quantity:,
• high tide (prevention and protection against flooding);
• water shortage and sustainable management; and
• groundwater (qualitative factors: pollution by nitrates and pes-ticides).
Status and transboundary impactsThe table opposite shows a picture of the current status of the surface water bodies in the IRBD Meuse, and of the status ex-pected in 2015. The number of water bodies not of good status, and the parameters that are responsible for that status, are indi-cated for each State and Region.
There are problems in nearly all of the Meuse River Basin, due to groundwater pollution by nitrate from urban and agricultural sources, and by pesticides.
Owing to water draining from lignite extraction in the German part of the Meuse River Basin, some groundwater bodies have long been in a poor quantitative or qualitative status.
Transboundary cooperation and responses The monitoring programmes introduced by the Parties (pursu-ant to Article 8 of the WFD) concern both surface water and groundwater. The States and regions in 2005–2006 set up their surveillance monitoring programmes in parallel with each other.
32 Article 16 of the Water Framework Directive (2000/60/EC) sets out a "Strategy against pollution of water", outlining the steps to be taken. The list of priority substances established there (Annex X of the WFD) was later replaced by Annex II of the Directive on Priority Substances (Directive 2008/105/EC).
324 | part IV
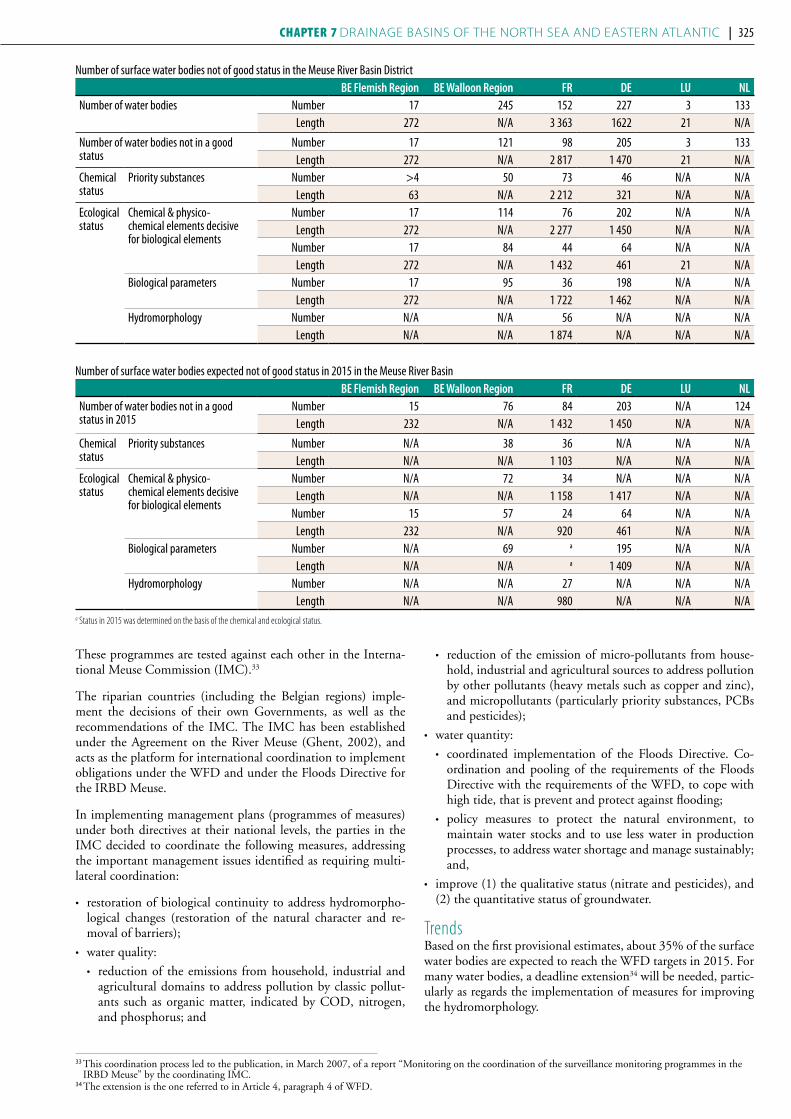
These programmes are tested against each other in the Interna-tional Meuse Commission (IMC).33
The riparian countries (including the Belgian regions) imple-ment the decisions of their own Governments, as well as the recommendations of the IMC. The IMC has been established under the Agreement on the River Meuse (Ghent, 2002), and acts as the platform for international coordination to implement obligations under the WFD and under the Floods Directive for the IRBD Meuse.
In implementing management plans (programmes of measures) under both directives at their national levels, the parties in the IMC decided to coordinate the following measures, addressing the important management issues identified as requiring multi-lateral coordination:
• restoration of biological continuity to address hydromorpho-logical changes (restoration of the natural character and re-moval of barriers);
• water quality:
• reduction of the emissions from household, industrial and agricultural domains to address pollution by classic pollut-ants such as organic matter, indicated by COD, nitrogen, and phosphorus; and
• reduction of the emission of micro-pollutants from house-hold, industrial and agricultural sources to address pollution by other pollutants (heavy metals such as copper and zinc), and micropollutants (particularly priority substances, PCBs and pesticides);
• water quantity:
• coordinated implementation of the Floods Directive. Co-ordination and pooling of the requirements of the Floods Directive with the requirements of the WFD, to cope with high tide, that is prevent and protect against flooding;
• policy measures to protect the natural environment, to maintain water stocks and to use less water in production processes, to address water shortage and manage sustainably; and,
• improve (1) the qualitative status (nitrate and pesticides), and (2) the quantitative status of groundwater.
TrendsBased on the first provisional estimates, about 35% of the surface water bodies are expected to reach the WFD targets in 2015. For many water bodies, a deadline extension34 will be needed, partic-ularly as regards the implementation of measures for improving the hydromorphology.
Number of surface water bodies not of good status in the Meuse River Basin District Be flemish Region Be Walloon Region fR De Lu nL
Number of water bodies Number 17 245 152 227 3 133Length 272 N/A 3 363 1622 21 N/A
Number of water bodies not in a good status
Number 17 121 98 205 3 133Length 272 N/A 2 817 1 470 21 N/A
Chemical status
Priority substances Number >4 50 73 46 N/A N/ALength 63 N/A 2 212 321 N/A N/A
Ecological status
Chemical & physico-chemical elements decisive for biological elements
Number 17 114 76 202 N/A N/ALength 272 N/A 2 277 1 450 N/A N/A
Number 17 84 44 64 N/A N/ALength 272 N/A 1 432 461 21 N/A
Biological parameters Number 17 95 36 198 N/A N/ALength 272 N/A 1 722 1 462 N/A N/A
Hydromorphology Number N/A N/A 56 N/A N/A N/ALength N/A N/A 1 874 N/A N/A N/A
Number of surface water bodies expected not of good status in 2015 in the Meuse River Basin Be flemish Region Be Walloon Region fR De Lu nL
Number of water bodies not in a good status in 2015
Number 15 76 84 203 N/A 124Length 232 N/A 1 432 1 450 N/A N/A
Chemical status
Priority substances Number N/A 38 36 N/A N/A N/ALength N/A N/A 1 103 N/A N/A N/A
Ecological status
Chemical & physico-chemical elements decisive for biological elements
Number N/A 72 34 N/A N/A N/ALength N/A N/A 1 158 1 417 N/A N/A
Number 15 57 24 64 N/A N/ALength 232 N/A 920 461 N/A N/A
Biological parameters Number N/A 69 a 195 N/A N/ALength N/A N/A a 1 409 N/A N/A
Hydromorphology Number N/A N/A 27 N/A N/A N/ALength N/A N/A 980 N/A N/A N/A
a Status in 2015 was determined on the basis of the chemical and ecological status.
33 This coordination process led to the publication, in March 2007, of a report “Monitoring on the coordination of the surveillance monitoring programmes in the IRBD Meuse” by the coordinating IMC.
34 The extension is the one referred to in Article 4, paragraph 4 of WFD.
324 | part IV Chapter 7 Drainage basins of the north sea anD eastern atlantic | 325

To attain the right status, deadline extensions beyond 2015 are pro-vided for most groundwater bodies polluted with nitrates and pesti-cides. This has to do with the long reaction periods for measures to take effect, and with the disproportionately high costs thereof.
For the quantitative problems owing to lignite extraction in the German part, the exemption rule pursuant to Article 4, para-graph 7 of the WFD shall apply.
The Interreg IVb project AMICE (Adaptation of the Meuse to the Impacts of Climate Evolutions) is being carried out in the Meuse Riv-er Basin. This project aims to define a common strategy for the Meuse River Basin for adapting to the consequences of climate change, and to develop measures for tackling these changes. With climate change, higher discharges and lower river drainage are predicted.
The IMC supports the AMICE project, and sees to a good ex-change of knowledge and information with the Hydrology and Inundation working group of the IMC.
The results of AMICE contribute also to the multilateral coor-dination of the implementation of the Floods Directive in the Meuse River Basin.
sCheldt rIVer BasIn35
The basin of the Scheldt River36 is shared by France, Belgium (Fed-eral Government and governments of the Flemish Region, Wal-loon Region and Brussels Region), and the Netherlands.
Scheldt River Basin District Country Area in the country (km2) Country’s share (%)Belgium, Walloon Region 3 770 10Belgium, Brussels Region 161 0.4Belgium, Flemish Region 11 991 33France 18 486 51Netherlands 2 008 6
Total 36 416
The International River Basin District (IRBD) of the Scheldt comprises two transboundary river basins, namely, the Scheldt (length 350 km) River Basin, and the Yser (length 80 km; basin area 1,749 km²) River Basin. The Yser Basin is shared by France and Belgium.
The main tributaries of the Scheldt are the Lys, Dender, Rupel, and Nete.
The elevation of the basin ranges from 2 m below sea level, along the southern coast of Schouwen (Prunje region), to 212 m above sea level in the Walloon Region (Anderlues). Because of this mainly flat relief, the rivers of the Scheldt IRBD are lowland riv-ers with wide valleys and slow current and discharge velocities.
Hydrology and hydrogeologyThe 350-km long Scheldt37 originates near the village of Gouy-Le-Catelet, in northern France. The Scheldt then flows through the Walloon Region, the Flemish Region and the Netherlands,
Surface water (rivers): target expected to be reached in 2015 in the Meuse River Basin District Be flemish Region Be Walloon Region france germany Luxembourg netherlands iRBD
Number of water bodies where the target is reached in 2015
2 196 72 24 2 9 278
Number of water bodies with deadline extension
15 76 80 196 1 124 492
Deadline extension owing to technical unfeasibility
15 N/A 75 171 1 118 -
Deadline extension owing to natural circumstances
0 N/A 13 48 0 24 -
Deadline extension owing to disproportionate costs
15 N/A 23 159 0 105 -
Number of water bodies with a less strict target
0 0 0 7 0 0 7
Note: The data for Walloon Region are provisional.
Groundwater: target expected to be reached in 2015 in the Meuse River Basin District Be flemish Region Be Walloon Region france germany Luxembourg netherlands iRBD
Number of water bodies where the target is reached in 2015
4 16 7 12 - 3 42
Number of water bodies with deadline extension
6 5 6 10 - 2 29
Deadline extension owing to technical unfeasibility
0 0 4 0 - 0 4
Deadline extension owing to natural circumstances
6 5 6 10 - 2 29
Deadline extension owing to disproportionate costs
6 4 2 3 - 0 15
Number of water bodies with a less strict target
0 0 0 10 - 0 10
Note: The data for the Walloon Region are provisional.
35 Based on information provided by the International Scheldt Commission. 36 The following adjacent river basins, together with the Scheldt River Basin, form the Scheldt River Basin District: Bruges Polders, Yser (IJzer), Aa, Boulonnais,
Canche, Authie, Somme and coastal waters. Of the adjacent basins, only the Yser (IJzer) and the coastal waters are internationally shared. 37 As far as Ghent, the river is called the ‘Bovenschelde’, between Ghent and Antwerp the ‘Zeeschelde’, and beyond Antwerp it is referred to as the ‘Westerschelde’.
The Zeeschelde and the Westerschelde form the Scheldt estuary.
326 | part IV

Sources: UNEP/DEWA/GRID-Europe 2011; International Scheldt Commission (discharge and population data).
1
2
3
Bruxelles
Antwerpen
Liège
Namur
Maastricht
Gent
Lille
Dunkerque
Brugge
Yser
IJze
r
Es
caut
Scheld
t
LysLei
e
Deûle
Scarpe Haine
Kleine NeteGrosse Nete
Dijle
Dyl
e
Demer
Rupel
Dender
N O R T H
S E A
Westerschelde
F R A N C E
B E L G I U M
N E T H E R L A N D S
50o
5o
0 20 40 60Kilometres
The boundaries and names shown and the designationsused on this map do not imply official endorsement oracceptance by the United Nations. UNEP/DEWA/GRID-Geneva 2011
1000
100
10
1
3 Sch
elle
2 Dein
ze
1 Bos
suit
Disc
harg
e (m
3 s-1) (
loga
rithm
ic sc
ale)
266
33
10
896
591
(Sch
eldt)
(Lys
)
(Sch
eldt)
2
33
121
QavQmaxQmin
Popu
lation
(in m
illion
s)
0
2
4
6
8
10
Neth
erlan
dsFra
nce
Belgi
um
7.8
4.6
0.5
Country information/other
Surface with little or no vegetation (<1%)Water bodies (<1%)Wetlands (<1%)
CultivatedForestGrassland/ShrublandUrban/Industrial areas
Others
1%
47%
14%
31%
7%
DiSChARgeS, popuLATion AnD LAnD CoveR in The SCheLDT RiveR BASin
326 | part IV Chapter 7 Drainage basins of the north sea anD eastern atlantic | 327

discharging into the North Sea at Vlissingen. Long stretches of the river are canalized: upstream of Ghent, over a 138 km stretch is canalized. On the Scheldt, as well as on its tributaries and the canals of the district, there are more than 250 weirs and locks.
The Scheldt estuary is approximately 160 km long. It and a num-ber of its tributaries downstream are subject to the tides: at Vliss-ingen, twice a day, more than 1 km³ water flows in and out of the river, while the annual river discharge is approximately 4 km³. The tidal range decreases from 3.86 m in Vlissingen towards Ghent to about 2 metres, where the tidal wave, at 160 km from the mouth, is stopped by the weirs in Gentbrugge.
The flow rate of the Scheldt varies greatly. In the period 1991-2002, the (estimated) average flow rate at Lillo (Belgian-Dutch border) was 161 m³/s. Peak flow rates are usually registered in winter (November-February). The wide and flat valleys in the Scheldt district suffer from numerous floods, especially in late winter, when the groundwater level is highest.
International coordination implied the comparison of 42 trans-boundary groundwater bodies out of a total of 67 in the IRBD. The comparable groundwater bodies were clustered into 22 cross-border aquifers. 14 out of the 22 aquifers are spread over 2 states or regions, and 8 are spread over 3 states of regions. 20 of the 42 contiguous groundwater bodies are mainly used for drinking water production, and cover 13 aquifers. International coordination was especially focused on three transboundary aq-uifers, for which clearly defined water management issues had been worked out in terms of cross-border relations:38
• The Carboniferous Limestone aquifer which covers parts of France, the Flemish Region and the Walloon Region, and where problems are mainly of a quantitative nature, with a pos-sible negative influence on the quality (impacts on sulfates and fluorine, possibly due to a rising groundwater level;
• The Brusseliaan aquifer, which covers parts of the Brussels Re-gion, the Flemish Region and the Walloon Region, and fea-tures increased or constantly increasing nitrate and pesticides contents; and,
• The Oligocene aquifer, which covers parts of the Netherlands and the Flemish Region; in its Flemish part problems are mainly of a quantitative nature.
PressuresShipping, urbanization and agriculture are the three main op-erational usages for which hydromorphological changes have been made to the course of the Scheldt River.
Major pressures in the Scheldt basin include those from domes-tic areas, industry, agriculture and transport.
On the basis of data from the year 2000 (or 2002 for the Flemish Region), it appears that the wastewater of 53% of the population is collected and treated in urban wastewater treatment plants.
In general, non-collective treatment takes place at the source of the domestic waste load. For nitrogen, suspended solids and phosphorus, the clusters with the highest domestic load corre-spond to the most populated areas: Zenne, Leie, Scheldt lower
figuRe 3: Evolution of the Scheldt flow rate at the flow meter stations in Bléharies, Rupelmonde, and Lillo for the period 1991–2002
38 These aquifers have not been assessed in the present publication.
Lillo Rupelmonde Bléharies
500
450
400
350
300
250
200
150
100
50
0
Flow
rate
(m3 /s
)
1991 1992 1993 1994 1995 1996 1997 1998 1999 2000 2001 2002
328 | part IV

course, Scheldt upper course and Dijle-Demer, which have fewer treatment plants than the other clusters. For a limited number of parameters, high loads are also registered in less pop-ulated areas. In certain clusters (such as Scheldt lower course, where 75% is connected), very high loads are observed due to a lack of tertiary processing in the treatment plants.
In addition to a high level of urbanization, the Scheldt IRBD is also characterized by a high level of industrialization, with a number of major industrial zones. The industrial sectors with the strongest presence are the food industry, and metallurgy. Other important sectors are the chemical industry and the tex-tile sector. The chemical sector is positioned in third place, with 14% of the number of companies, clearly less present than the first two sectors. Among European Pollutant Emission Register (EPER) companies, the chemical industry, with one third of all EPER companies, heads the list of the most important activities in the Scheldt district. Metallurgy comes second.
The largest emissions of macro-pollutants (nitrogen, phos-phorus, TOC), discharged by EPER companies in the Scheldt IRBD, are located in the clusters Leie, Scheldt lower course, Somme, and Scheldt middle course. The chemical and food in-dustries in the Scheldt district are those contributing most to the emissions of macro-pollutants by EPER companies.
Salt emissions (chlorides, cyanides and fluorides) are by far the most important in the Scheldt lower course. Chloride emis-sions are also very important in the Nete cluster, as are cyanide and fluoride emissions in the Aa cluster. Chloride emissions are mainly produced by the chemical sector (93%), cyanides by metallurgy (47%) and the materials sector (42%), fluorides by metallurgy (53%) and the chemical sector (46%).
Some 61% (22,077 km²) of the total area of the district is used for agricultural purposes. The agricultural activities in the dis-trict include both crop production (in the south), and livestock production (the main agricultural activity in the north).
On the basis of farming activity, the greatest load caused by ag-riculture is found in the Leie and Yser clusters (a lot of livestock and crop farming), Scheldt lower course (mostly livestock, also with crop farming), Scheldt upper course, Somme and Aa (mostly crop farming, also with livestock), Nete and Bruges Polders (mainly livestock breeding).
For more than a half of the hydrographical units (based on a still incomplete analysis), the sediment quality is deemed to have a highly adverse effect on the aquatic environment or on the use over a medium-sized to large area.
Because of the high level of urbanization of the Scheldt IRBD and the strong presence of agriculture, vast forest and nature areas have become scarce. Moreover, the remaining forest and nature areas are very fragmented. The number of wetlands and other nature areas is very small.
Regarding pressures on groundwaters, most pollution cases oc-cur in surface water, then spread to groundwater. In addition to the major diffuse pressures from agriculture (nitrate and bioc-ides), other pressures assumed as significant for groundwater are polluted sites. The most relevant pressures are direct groundwa-ter abstractions. Managed aquifer recharge — known also as artificial recharge — is of secondary importance at district level.
Annual groundwater abstraction quantities, overall and for the drinking water supply, per region in the Scheldt River Basin District
Country/partyAbstracted volume
(106 m3/year)
Abstracted amount for the drinking water
supply (106 m3/year)France 418 303Belgium, Walloon Region 175 137Belgium, Brussels Region 3.5 2.5Belgium, Flemish Region 218 115Netherlands 30 24
Total 844.5 581.5
The largest volume of groundwater is abstracted in France (es-pecially in the chalk strata), while, in proportion to the area, the abstractions are most intensive in the Walloon Region.
Status and transboundary impactsIn 1998, the International Scheldt Commission (ISC) had al-ready started a joint homogenous monitoring network for the Scheldt basin, which has proven a useful tool in following the evolution of water quality in the Scheldt, and is also helping with coordination between the Parties.
In the 10-year measuring period, the number of wastewater treat-ment plants in the Scheldt River Basin, as well as the reduction
Estimate of the intensity of the pressures of the relevant driving forces per cluster39 Cluster of hydrographical units population industry Agriculture Transport networks
Scheldt upper course ++++ +++ ++++ **Scheldt middle course +++ ++ ++ ***Scheldt lower course ++++ ++++ ++++ ***Nete ++ +++ ++++ **Zenne ++++ ++ ++ ***Dijle-Demer ++++ ++ ++ **Dender ++ ++ ++ **Leie ++++ +++ ++++ * *Bruges Polders ++ + ++++ **IJzer ++ + ++++ **Aa ++ ++++ ++++ **Channel coastal basins +++ ++ +++ *Somme +++ ++ ++++ *
Notes: from + to ++++: from low to very high pressure; for transport networks: * = of little importance, ** = only some indicators are higher, *** > IRBD average.
39 For the purposes of WFD Article 5 status report (analysis of pressures), a number of the river basins of the Scheldt IRBD is further divided into 31 hydrographical units and regrouped into 13 clusters.
328 | part IV Chapter 7 Drainage basins of the north sea anD eastern atlantic | 329

by those plants, have increased, and the plants’ average efficien-cy was improved, demonstrated by lower nitrogen and phos-phorus levels. The decontamination of industrial emissions has had a positive influence on oxygenation conditions.
The homogeneous monitoring network’s results reveal that the water quality characteristics in the area around Eswars (France) are improving. Little, however, has changed in the French-Belgian border region (Fresnes-Warcoing). The two main im-provements occurred in the downstream areas between Pottes (Walloon Region) and Schaar van Ouden Doel (Dutch-Flem-ish border). In the most downstream area, the Western Scheldt (Netherlands), less improvement is to be noted. The most strik-ing improvement is the increase in the concentration of oxygen, but nitrogen and total phosphorus concentrations have also de-creased considerably.
Amongst heavy metals, cadmium shows the strongest decrease, as is also the case, be it to a lesser degree, for copper and zinc. PAHs remain problematic in the river basin, but they mainly come from air pollution. Pesticides and herbicides show a rela-tive improvement. The concentrations of diuron and isopro-turon are high, mainly in winter.
Low lindane concentrations are still being registered, whereas atrazine and simazine are found to be below the detection limit.
ResponsesInternational co-ordination for the Scheldt is stipulated in the International Scheldt treaty (2002). The ISC has no supra-na-tional power; it serves as the platform for international coordi-nation on the IRBD level.
Bi- or trilateral issues are treated in the appropriated bi- or tri-lateral forums, as foreseen in the Scheldt Treaty. Consequently, the treaties, memoranda and agreements between the Flemish Region and the Netherlands concerning the policy and man-agement, deepening, nautical aspects, safety and nature of the Scheldt estuary, are a matter for the Vlaams Nederlandse Schelde Commissie (VNSC) or Flemish-Dutch Scheldt Commission.40 This cooperation has been formalized in the Treaty of 2005 on cooperation in policy and management in the Scheldt estuary. The VNSC replaces the Technical Scheldt Commission (1948).
Within the International Scheldt Commission, an operational Warning and Alarm System of the Scheldt River Basin District (WASS) has been active since 1998, and includes the proce-dures to be followed in case of possible cross-border pollution.
All Parties have proposed to spread out the implementation of measures defined with a view of the objectives of WFD on cer-
tain water bodies, for the sake of technical feasibility, ecological circumstances and disproportionate costs. Term extensions lead to more realistic programmes of measures.
The programmes of measures and monitoring of the status of waters, according to the WFD, are executed by each Party (as a member State of the EU) taking into account the results of the is-sues on which it has been agreed to coordinate at the IRBD level.
The ISC is responsible for coordination, involving as tasks, for example, the exchange of information between parties on prog-ress of the implemention of the programme of measures, an update of the database of measures (catalogue of measures), and its use of the catalogue as an instrument for comparison and coordination. Regarding the improvement of biodiversity and fish migration a “master plan on fish in the Scheldt river" is planned Concerning the WASS, an emergency exercise, a yearly workshop with the operators of the Central Warning Stations, and a database of notifications are planned.
Regarding the implementation of the Floods Directive, the ISC is designated as the platform for improving knowledge on interactions between flood from coastal waters and rivers, the definition of significant risk and significant increase of risk, as well as producing maps.
Due to the success of the Scaldit-project (2003–2005),41 the partners introduced a new Interreg IVB North-West Europe project42 in the Scheldt IRBD, which aims at finding the best available measures to improve the ecological status of surface water, sediments and groundwater. It includes the following activities:
• implementation and monitoring of a number of transnational river ecosystem development measures, and the elaboration of a transnational inventory on priority fish migration barriers;
• the transboundary monitoring of sediment loads, in order to feed a sediment delivery model and the construction of sedi-ment ponds;43
• the transboundary monitoring and modeling of two trans-boundary groundwater systems as a basis for a joint declara-tion on transboundary groundwater management;
• the development of a common set of indicators on the level of the Scheldt IRBD to assess the execution of programmes of measures, including costs, effects and benefits of measures; and,
• the dissemination of information on transboundary inte-grated water management in the Scheldt IRBD by means of events, website, newsletters, and information packages.
40 http://www.vnsc.eu/english/.41 The Scaldit (Scaldis Integrated Testing) project involved testing — as the only pilot and only complete IRBD — all the guidance documents developed by the
European Commission, in consultation with the member States, to support the implementation of the WFD. The results of the transnational description of the state of the aquatic environment were the first steps towards a common Scheldt River Basin Management Plan (2009).
42 http://www.scaldwin.org/scaldwin-2.43 In 2011, sediment ponds were constructed on the Molenbeek in Erpe-Mere and on the Vondelbeek.
Evaluation of the ecological status — in numbers of water bodies — of freshwater rivers in 2007 in the Scheldt River Basin District
Country/party Bad poor moderate good high no information
France 17 8 19 14 0 0Walloon Region 29 23 16 1 0 10Brussels 66 49 46 0 0 0Flemish 1 1 1 0 0 0Netherlands 0 0 1 0 0 0District 113 81 83 15 0 10
330 | part IV
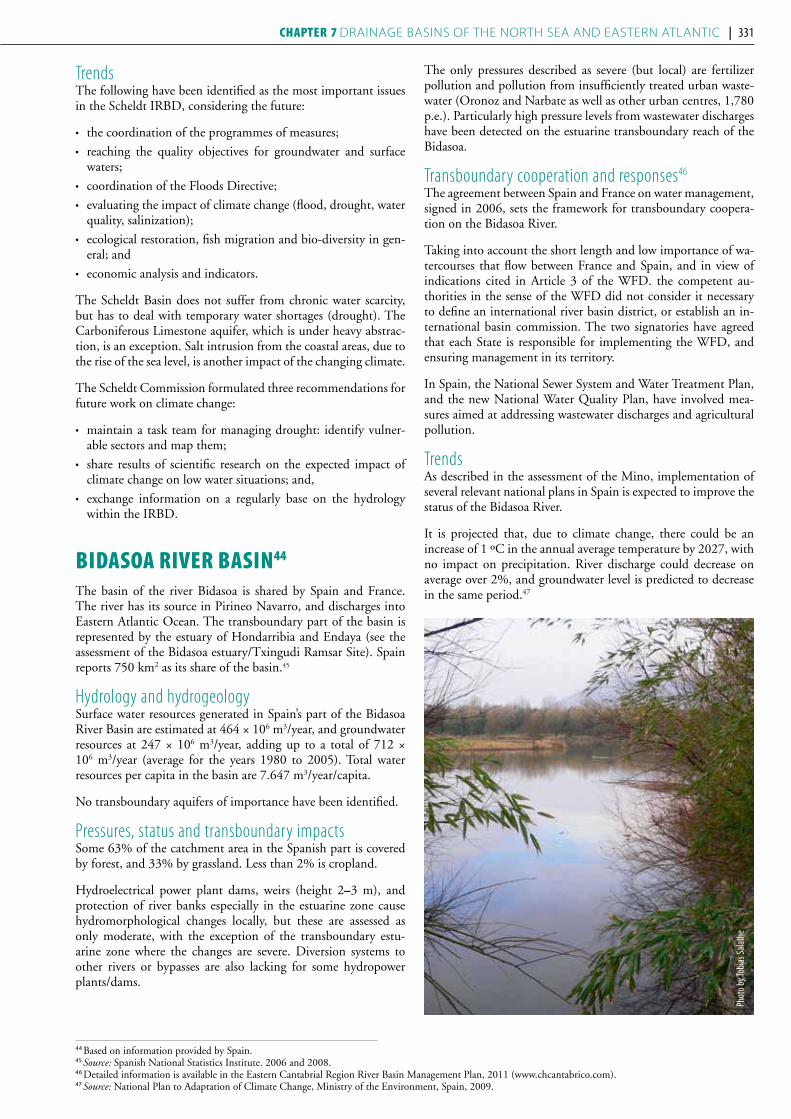
TrendsThe following have been identified as the most important issues in the Scheldt IRBD, considering the future:
• the coordination of the programmes of measures;
• reaching the quality objectives for groundwater and surface waters;
• coordination of the Floods Directive;
• evaluating the impact of climate change (flood, drought, water quality, salinization);
• ecological restoration, fish migration and bio-diversity in gen-eral; and
• economic analysis and indicators.
The Scheldt Basin does not suffer from chronic water scarcity, but has to deal with temporary water shortages (drought). The Carboniferous Limestone aquifer, which is under heavy abstrac-tion, is an exception. Salt intrusion from the coastal areas, due to the rise of the sea level, is another impact of the changing climate.
The Scheldt Commission formulated three recommendations for future work on climate change:
• maintain a task team for managing drought: identify vulner-able sectors and map them;
• share results of scientific research on the expected impact of climate change on low water situations; and,
• exchange information on a regularly base on the hydrology within the IRBD.
BIdasoa rIVer BasIn44
The basin of the river Bidasoa is shared by Spain and France. The river has its source in Pirineo Navarro, and discharges into Eastern Atlantic Ocean. The transboundary part of the basin is represented by the estuary of Hondarribia and Endaya (see the assessment of the Bidasoa estuary/Txingudi Ramsar Site). Spain reports 750 km2 as its share of the basin.45
Hydrology and hydrogeologySurface water resources generated in Spain’s part of the Bidasoa River Basin are estimated at 464 × 106 m3/year, and groundwater resources at 247 × 106 m3/year, adding up to a total of 712 × 106 m3/year (average for the years 1980 to 2005). Total water resources per capita in the basin are 7.647 m3/year/capita.
No transboundary aquifers of importance have been identified.
Pressures, status and transboundary impactsSome 63% of the catchment area in the Spanish part is covered by forest, and 33% by grassland. Less than 2% is cropland.
Hydroelectrical power plant dams, weirs (height 2–3 m), and protection of river banks especially in the estuarine zone cause hydromorphological changes locally, but these are assessed as only moderate, with the exception of the transboundary estu-arine zone where the changes are severe. Diversion systems to other rivers or bypasses are also lacking for some hydropower plants/dams.
The only pressures described as severe (but local) are fertilizer pollution and pollution from insufficiently treated urban waste-water (Oronoz and Narbate as well as other urban centres, 1,780 p.e.). Particularly high pressure levels from wastewater discharges have been detected on the estuarine transboundary reach of the Bidasoa.
Transboundary cooperation and responses46
The agreement between Spain and France on water management, signed in 2006, sets the framework for transboundary coopera-tion on the Bidasoa River.
Taking into account the short length and low importance of wa-tercourses that flow between France and Spain, and in view of indications cited in Article 3 of the WFD. the competent au-thorities in the sense of the WFD did not consider it necessary to define an international river basin district, or establish an in-ternational basin commission. The two signatories have agreed that each State is responsible for implementing the WFD, and ensuring management in its territory.
In Spain, the National Sewer System and Water Treatment Plan, and the new National Water Quality Plan, have involved mea-sures aimed at addressing wastewater discharges and agricultural pollution.
Trends As described in the assessment of the Mino, implementation of several relevant national plans in Spain is expected to improve the status of the Bidasoa River.
It is projected that, due to climate change, there could be an increase of 1 ºC in the annual average temperature by 2027, with no impact on precipitation. River discharge could decrease on average over 2%, and groundwater level is predicted to decrease in the same period.47
44 Based on information provided by Spain. 45 Source: Spanish National Statistics Institute. 2006 and 2008.46 Detailed information is available in the Eastern Cantabrial Region River Basin Management Plan, 2011 (www.chcantabrico.com).47 Source: National Plan to Adaptation of Climate Change, Ministry of the Environment, Spain, 2009.
Phot
o by T
obias
Salat
he
330 | part IV Chapter 7 Drainage basins of the north sea anD eastern atlantic | 331

48 Sources: www.euskadi.net/txingudi; www.txingudikopadurak.blogspot.com; www.cpie-littoral-basque.eu; www.abbadia.fr; Txingudi EKOETXEA; Basque government, Department for Environment, Spatial Planning, Agriculture and Fisheries, Biodiversity Directorate.
49 Ria is a coastal inlet formed when a river valley submerges partially.50 Data updated in 2010.51 Centres permanents d’initiatives pour l’environnement (CPIE) Littoral Basque and Conservatoire du Littoral.
BIdasoa estuary/txInGudI48
General description of the wetland The Bidasoa estuary (Txingudi) is located in a transboundary area between Spain and France. Administratively, it belongs to the mu-nicipalities of Irun and Hondarribia (Gipuzkoa, Basque Autono-mous Community), and Handaye (Aquitaine, Pyrénées Atlan-tiques). It is a coastal wetland, a system of estuaries and marshes in the fluvial-marine interface of the mouth of the River Bidasoa. The estuary is approximately 11 km long. The Ramsar Site cov-ers an area of 130.03 ha that are distributed as follows: Plaiaundi: 39.06 ha, Vega de Jaizubia: 61.68 ha, Bidasoa Islands: 29.29 ha. It holds eight habitats contained in Annex I of the Habitats Direc-tive, of which two are considered priorities (1150 Coastal lagoons and 91E0 Alluvial forests with Common Alder and Common Ash. There is one waterfowl species, the Aquatic Warbler, classified as Vulnerable by IUCN. Additionally, there are at least 15 threatened bird species included in different national catalogues (National Catalogue of Threatened Species, Red Book of Birds of Spain), and four breeding species included in the Basque Catalogue of Threat-ened Species: Little Ringed Plover, Water Rail, Reed-Warbler, and Little Grebe. There are also three fish species classified as endan-gered and/or vulnerable by the “Red Book of Continental Fish of Spain”: Atlantic Salmon, River Herring, and Sea Lamprey.
Main wetland ecosystem services The estuary is heavily populated (Irun, Hondarribia, and Hendaye together have a population of nearly 100,000), and has lost about 60% of its original surface due to human occupation. Given its strategic location, land use is mostly urban and industrial (housing, infrastructure, communication), which puts a strong pressure on the ecosystem. In addition, it is intensely used for recreation (mari-nas in Hondarribia and Hendaye), and less intensively for fishing.
Cultural values of the wetland areaTxingudi is a traditional transit area for the different civilizations that have occupied the territory. Due to its transboundary nature, the area has seen many wars, but it has been also the setting for other historic events as important as the signing of the Treaty of the Pyrenees, which established the borders between Spain and France. At present, it enjoys a high social recognition, due to its environmental value and its status as a restored wetland committed to conservation, and due to its high educational value, in particular among the local population. Educational work is mainly carried out in two visitor facilities focusing on nature conservation: Txin-gudi Ekoetxea (Plaiaundi, Irun, in the Ramsar Site) and Larretxea (Domaine d´Abbadia, Hendaye).
Biodiversity values of the wetland areaManagement by the Basque Government includes monitoring and evaluation of wildlife, habitats and processes (water quality, etc.).
The salt-tolerant vegetation stands out with small size herba-ceous formations, mostly grasses, reeds and sedges. In Txingudi, 46 significant flora species have been found, 33% of the species found in the Basque Country, of which 24 (37.5%) are consid-ered rare or very rare in the regional Catalogue of Flora. There is a prominent occurrence of Water Chickweed, Pyrenean scur-vygrass, Broadleaved Pepperweed, Yellow Loosestrife, Common Water Plantain, Eelgrass, Gibbous Duckweed, Softstem Bulrush and Many-stalked Spike-rush.
Some 86% of the vertebrate fauna of the rias49 is found in the estu-ary. Most individuals (67%) use it temporarily during the migra-tory seasons, and also for wintering.
Fish species that are rare in the Basque coastal systems can be found in the estuary, such as River Herring and Brown Trout. and some that are unique within the east Cantabrian riverbeds, such as At-lantic Salmon. The site is important for the reproduction of the Three-Spined Stickleback, a species included in the Basque Cata-logue of Threatened Species.
The Natterjack Toad is also present in the estuary and is included in the Basque Catalogue of Threatened Species.
Among mammals present in the area, the Southwestern Water Vole and European Polecat are noteworthy.
The area is a strategic migratory hotspot with an average of 175 bird species per year, and a cumulative total (1998–2010) of 254 species in the area of Plaiaundi-Jaitzubia. Gipuzkoa is also the ma-jor wintering place for waterfowl, and one of the most important wintering places in the Basque Country.
Txingudi regularly supports 1% of the individuals of the East At-lantic population of the Eurasian Spoonbill, with 120 individuals and an annual average occurrence of 1,078 specimens during au-tumn migration.50
Pressure factors and transboundary impactsThe main direct and indirect impacts are caused by human set-tlements and transformation of the land due to urban and indus-trial pressure (urban growth, transportation infrastructure, etc.). Its border location prompts major strategic projects for transportation of people and goods. There are also impacts from recreational use (sailing, rowing, fishing, etc.) as well as illegal fishing. Invasive spe-cies such as Nutria, Red Swamp Crayfish, Pampas Grass, and East-ern Baccharis pose a problem, but control programs are underway.
Transboundary wetland managementThe estuary as a whole belongs to the Natura 2000 Network, with areas designated as Special Protected Area (SPA) (Txingudi) and Site of Community Interest (SCI) (Txingudi-Bidasoa) in Spain, and SCI Baie de Chingoudy in France, lying adjacent to each other. The Ramsar Site (approximately 130 ha) roughly coincides with the SCI and SPA in Spain. In the early 1990s, the Special Plan of Txingudi was signed, the base for the rehabilitation of the enclave, and including projects Plaiaundi (1998) and Jaitzubia (2005), managed by the Basque Government. This Plan has yet to be completed; meanwhile, the management plan for the prospec-tive SPA Txingudi is in its approval phase. There is a cooperation agreement between the natural protected areas “Marismas de Tx-ingudi” (Basque government) and “Domaine d´Abbadia” (Basque Coast Permanent Centre for Environmental Initiatives) and “Con-servatoire du Littoral”,51 in terms of exchange and collaboration of management experiences. Their collaboration has been developing since 2001, when the Txingudi Ekoetxea (Environmental Edu-cation Centre associated with marshes) was established, covering different aspects. The main joint activities include environmental education and awareness-raising; celebration of anniversaries such as World Wetlands Day and World Day of Birds; and addition-ally, exchange of professional experiences between the two teams, which is very valuable.
332 | part IV
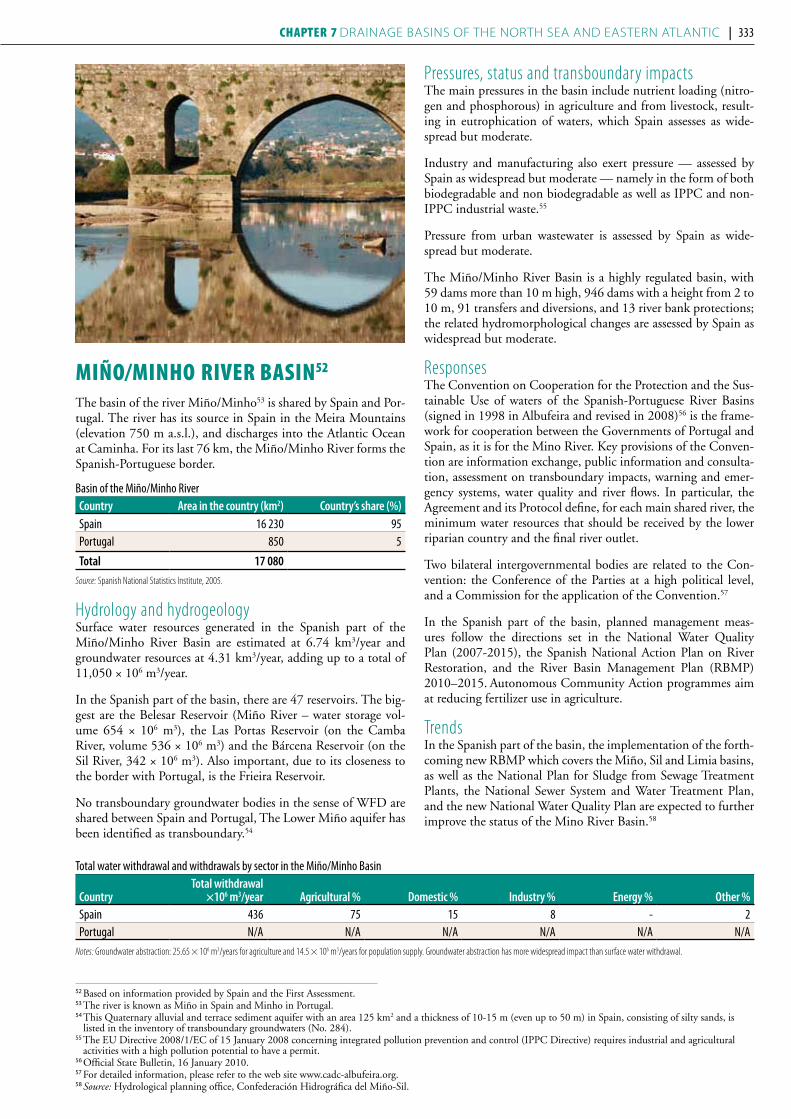
52 Based on information provided by Spain and the First Assessment. 53 The river is known as Miño in Spain and Minho in Portugal.54 This Quaternary alluvial and terrace sediment aquifer with an area 125 km2 and a thickness of 10-15 m (even up to 50 m) in Spain, consisting of silty sands, is
listed in the inventory of transboundary groundwaters (No. 284). 55 The EU Directive 2008/1/EC of 15 January 2008 concerning integrated pollution prevention and control (IPPC Directive) requires industrial and agricultural
activities with a high pollution potential to have a permit.56 Official State Bulletin, 16 January 2010.57 For detailed information, please refer to the web site www.cadc-albufeira.org.58 Source: Hydrological planning office, Confederación Hidrográfica del Miño-Sil.
mIño/mInho rIVer BasIn52
The basin of the river Miño/Minho53 is shared by Spain and Por-tugal. The river has its source in Spain in the Meira Mountains (elevation 750 m a.s.l.), and discharges into the Atlantic Ocean at Caminha. For its last 76 km, the Miño/Minho River forms the Spanish-Portuguese border.
Basin of the Miño/Minho River Country Area in the country (km2) Country’s share (%)Spain 16 230 95Portugal 850 5
Total 17 080Source: Spanish National Statistics Institute, 2005.
Hydrology and hydrogeologySurface water resources generated in the Spanish part of the Miño/Minho River Basin are estimated at 6.74 km3/year and groundwater resources at 4.31 km3/year, adding up to a total of 11,050 × 106 m3/year.
In the Spanish part of the basin, there are 47 reservoirs. The big-gest are the Belesar Reservoir (Miño River – water storage vol-ume 654 × 106 m3), the Las Portas Reservoir (on the Camba River, volume 536 × 106 m3) and the Bárcena Reservoir (on the Sil River, 342 × 106 m3). Also important, due to its closeness to the border with Portugal, is the Frieira Reservoir.
No transboundary groundwater bodies in the sense of WFD are shared between Spain and Portugal, The Lower Miño aquifer has been identified as transboundary.54
Pressures, status and transboundary impactsThe main pressures in the basin include nutrient loading (nitro-gen and phosphorous) in agriculture and from livestock, result-ing in eutrophication of waters, which Spain assesses as wide-spread but moderate.
Industry and manufacturing also exert pressure — assessed by Spain as widespread but moderate — namely in the form of both biodegradable and non biodegradable as well as IPPC and non-IPPC industrial waste.55
Pressure from urban wastewater is assessed by Spain as wide-spread but moderate.
The Miño/Minho River Basin is a highly regulated basin, with 59 dams more than 10 m high, 946 dams with a height from 2 to 10 m, 91 transfers and diversions, and 13 river bank protections; the related hydromorphological changes are assessed by Spain as widespread but moderate.
Responses The Convention on Cooperation for the Protection and the Sus-tainable Use of waters of the Spanish-Portuguese River Basins (signed in 1998 in Albufeira and revised in 2008)56 is the frame-work for cooperation between the Governments of Portugal and Spain, as it is for the Mino River. Key provisions of the Conven-tion are information exchange, public information and consulta-tion, assessment on transboundary impacts, warning and emer-gency systems, water quality and river flows. In particular, the Agreement and its Protocol define, for each main shared river, the minimum water resources that should be received by the lower riparian country and the final river outlet.
Two bilateral intergovernmental bodies are related to the Con-vention: the Conference of the Parties at a high political level, and a Commission for the application of the Convention.57
In the Spanish part of the basin, planned management meas-ures follow the directions set in the National Water Quality Plan (2007-2015), the Spanish National Action Plan on River Restoration, and the River Basin Management Plan (RBMP) 2010–2015. Autonomous Community Action programmes aim at reducing fertilizer use in agriculture.
Trends In the Spanish part of the basin, the implementation of the forth-coming new RBMP which covers the Miño, Sil and Limia basins, as well as the National Plan for Sludge from Sewage Treatment Plants, the National Sewer System and Water Treatment Plan, and the new National Water Quality Plan are expected to further improve the status of the Mino River Basin.58
Total water withdrawal and withdrawals by sector in the Miño/Minho Basin
CountryTotal withdrawal
×106 m3/year Agricultural % Domestic % industry % energy % other %Spain 436 75 15 8 - 2Portugal N/A N/A N/A N/A N/A N/A
Notes: Groundwater abstraction: 25.65 × 10⁶ m3/years for agriculture and 14.5 × 10⁶ m3/years for population supply. Groundwater abstraction has more widespread impact than surface water withdrawal.
332 | part IV Chapter 7 Drainage basins of the north sea anD eastern atlantic | 333
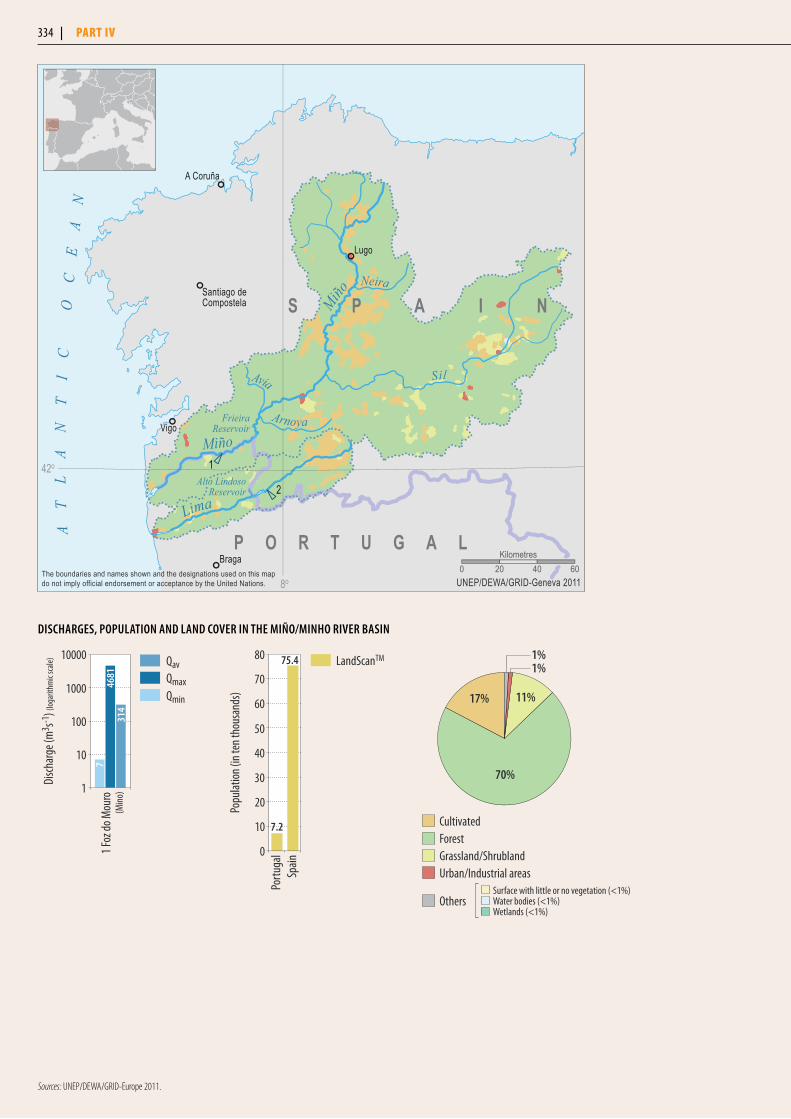
Sources: UNEP/DEWA/GRID-Europe 2011.
1 Foz
do M
ouro
Disc
harg
e (m
3 s-1) (
loga
rithm
ic sc
ale)
4681
314
(Min
o)1
10
100
1000
10000
7
QavQmaxQmin
0
10
20
30
40
50
60
70
80
Spain
Portu
gal
75.4
7.2
Popu
latio
n (in
ten t
hous
ands
)
LandScanTM1%1%
Surface with little or no vegetation (<1%)Water bodies (<1%)Wetlands (<1%)
CultivatedForestGrassland/ShrublandUrban/Industrial areas
Others
17%
70%
11%
DiSChARgeS, popuLATion AnD LAnD CoveR in The miño/minho RiveR BASin
1
2
Braga
Santiago deCompostela
Vigo
A Coruña
Lugo
Miño
Lima
AT
LA
NT
IC
O
CE
AN
FrieiraReservoir
Sil
Miño
Alto LindosoReservoir
Neira
Arnoya
Avia
P O R T U G A L
S P A I N
8o
42o
The boundaries and names shown and the designations used on this mapdo not imply official endorsement or acceptance by the United Nations. UNEP/DEWA/GRID-Geneva 2011
0 20 40 60Kilometres
334 | part IV
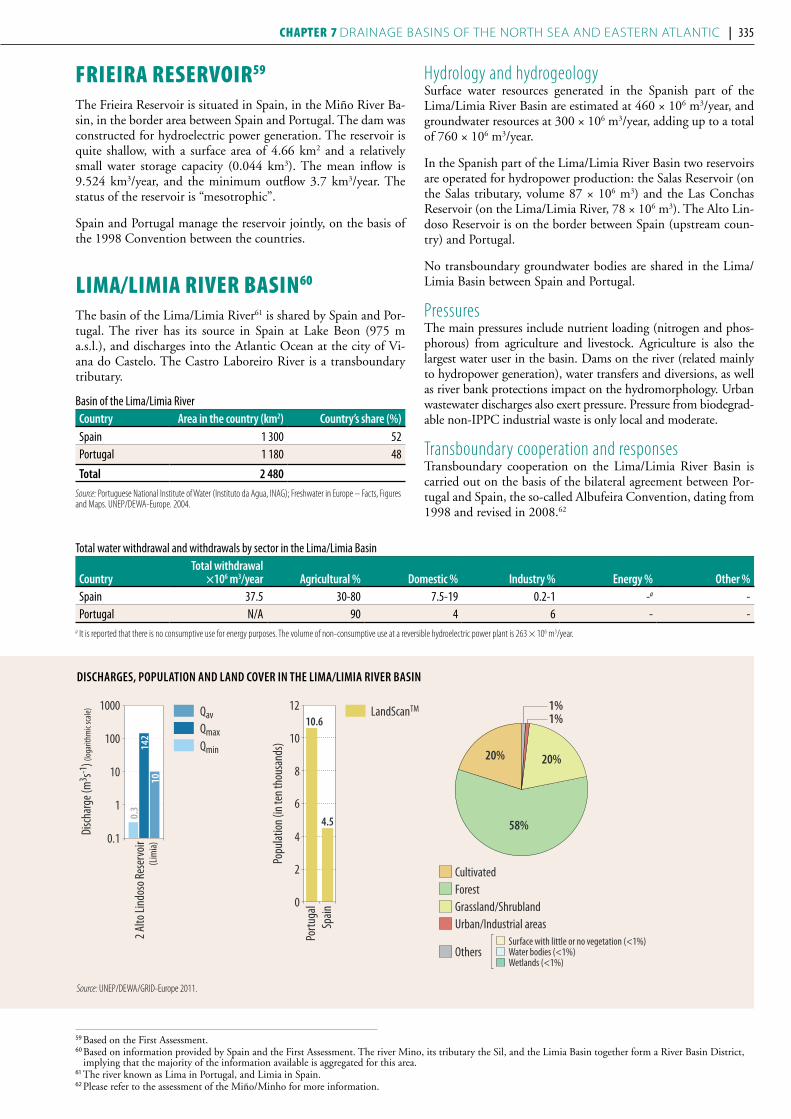
FrIeIra reserVoIr59
The Frieira Reservoir is situated in Spain, in the Miño River Ba-sin, in the border area between Spain and Portugal. The dam was constructed for hydroelectric power generation. The reservoir is quite shallow, with a surface area of 4.66 km2 and a relatively small water storage capacity (0.044 km3). The mean inflow is 9.524 km3/year, and the minimum outflow 3.7 km3/year. The status of the reservoir is “mesotrophic”.
Spain and Portugal manage the reservoir jointly, on the basis of the 1998 Convention between the countries.
lIma/lImIa rIVer BasIn60
The basin of the Lima/Limia River61 is shared by Spain and Por-tugal. The river has its source in Spain at Lake Beon (975 m a.s.l.), and discharges into the Atlantic Ocean at the city of Vi-ana do Castelo. The Castro Laboreiro River is a transboundary tributary.
Basin of the Lima/Limia River Country Area in the country (km2) Country’s share (%)Spain 1 300 52Portugal 1 180 48
Total 2 480Source: Portuguese National Institute of Water (Instituto da Agua, INAG); Freshwater in Europe – Facts, Figures and Maps. UNEP/DEWA-Europe. 2004.
Hydrology and hydrogeologySurface water resources generated in the Spanish part of the Lima/Limia River Basin are estimated at 460 × 106 m3/year, and groundwater resources at 300 × 106 m3/year, adding up to a total of 760 × 106 m3/year.
In the Spanish part of the Lima/Limia River Basin two reservoirs are operated for hydropower production: the Salas Reservoir (on the Salas tributary, volume 87 × 106 m3) and the Las Conchas Reservoir (on the Lima/Limia River, 78 × 106 m3). The Alto Lin-doso Reservoir is on the border between Spain (upstream coun-try) and Portugal.
No transboundary groundwater bodies are shared in the Lima/Limia Basin between Spain and Portugal.
PressuresThe main pressures include nutrient loading (nitrogen and phos-phorous) from agriculture and livestock. Agriculture is also the largest water user in the basin. Dams on the river (related mainly to hydropower generation), water transfers and diversions, as well as river bank protections impact on the hydromorphology. Urban wastewater discharges also exert pressure. Pressure from biodegrad-able non-IPPC industrial waste is only local and moderate.
Transboundary cooperation and responses Transboundary cooperation on the Lima/Limia River Basin is carried out on the basis of the bilateral agreement between Por-tugal and Spain, the so-called Albufeira Convention, dating from 1998 and revised in 2008.62
DiSChARgeS, popuLATion AnD LAnD CoveR in The LimA/LimiA RiveR BASin
0.1
1
10
100
1000
2 Alto
Lind
oso R
eser
voir
Disc
harg
e (m
3 s-1) (
loga
rithm
ic sc
ale)
142
10(L
imia)
0.3
QavQmaxQmin
0
2
4
6
8
10
12
Spain
Portu
gal
10.6
4.5
Popu
latio
n (in
ten t
hous
ands
)
LandScanTM1%1%
Surface with little or no vegetation (<1%)Water bodies (<1%)Wetlands (<1%)
CultivatedForestGrassland/ShrublandUrban/Industrial areas
Others
20%
58%
20%
59 Based on the First Assessment.60 Based on information provided by Spain and the First Assessment. The river Mino, its tributary the Sil, and the Limia Basin together form a River Basin District,
implying that the majority of the information available is aggregated for this area. 61 The river known as Lima in Portugal, and Limia in Spain. 62 Please refer to the assessment of the Miño/Minho for more information.
Source: UNEP/DEWA/GRID-Europe 2011.
Total water withdrawal and withdrawals by sector in the Lima/Limia Basin
CountryTotal withdrawal
×106 m3/year Agricultural % Domestic % industry % energy % other %Spain 37.5 30-80 7.5-19 0.2-1 -a -Portugal N/A 90 4 6 - -
a It is reported that there is no consumptive use for energy purposes. The volume of non-consumptive use at a reversible hydroelectric power plant is 263 × 106 m3/year.
334 | part IV Chapter 7 Drainage basins of the north sea anD eastern atlantic | 335
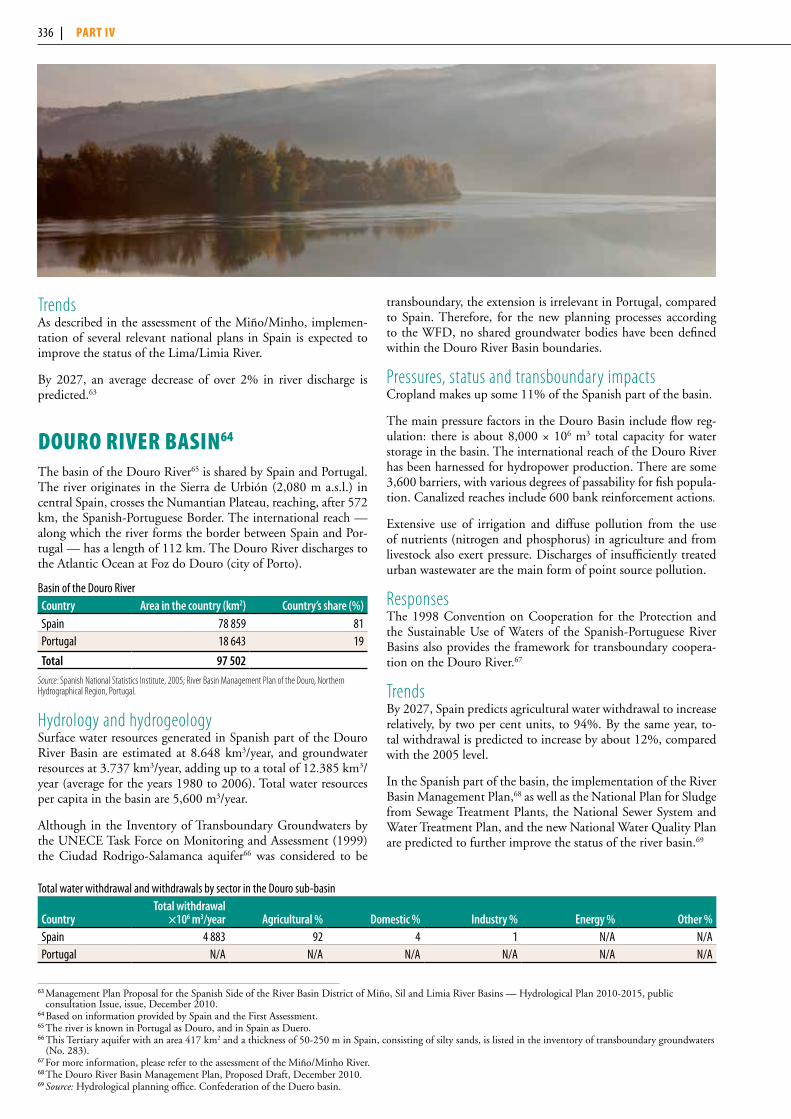
Trends As described in the assessment of the Miño/Minho, implemen-tation of several relevant national plans in Spain is expected to improve the status of the Lima/Limia River.
By 2027, an average decrease of over 2% in river discharge is predicted.63
douro rIVer BasIn64
The basin of the Douro River65 is shared by Spain and Portugal. The river originates in the Sierra de Urbión (2,080 m a.s.l.) in central Spain, crosses the Numantian Plateau, reaching, after 572 km, the Spanish-Portuguese Border. The international reach —along which the river forms the border between Spain and Por-tugal — has a length of 112 km. The Douro River discharges to the Atlantic Ocean at Foz do Douro (city of Porto).
Basin of the Douro River Country Area in the country (km2) Country’s share (%)Spain 78 859 81Portugal 18 643 19
Total 97 502Source: Spanish National Statistics Institute, 2005; River Basin Management Plan of the Douro, Northern Hydrographical Region, Portugal.
Hydrology and hydrogeologySurface water resources generated in Spanish part of the Douro River Basin are estimated at 8.648 km3/year, and groundwater resources at 3.737 km3/year, adding up to a total of 12.385 km3/year (average for the years 1980 to 2006). Total water resources per capita in the basin are 5,600 m3/year.
Although in the Inventory of Transboundary Groundwaters by the UNECE Task Force on Monitoring and Assessment (1999) the Ciudad Rodrigo-Salamanca aquifer66 was considered to be
transboundary, the extension is irrelevant in Portugal, compared to Spain. Therefore, for the new planning processes according to the WFD, no shared groundwater bodies have been defined within the Douro River Basin boundaries.
Pressures, status and transboundary impactsCropland makes up some 11% of the Spanish part of the basin.
The main pressure factors in the Douro Basin include flow reg-ulation: there is about 8,000 × 106 m3 total capacity for water storage in the basin. The international reach of the Douro River has been harnessed for hydropower production. There are some 3,600 barriers, with various degrees of passability for fish popula-tion. Canalized reaches include 600 bank reinforcement actions.
Extensive use of irrigation and diffuse pollution from the use of nutrients (nitrogen and phosphorus) in agriculture and from livestock also exert pressure. Discharges of insufficiently treated urban wastewater are the main form of point source pollution.
Responses The 1998 Convention on Cooperation for the Protection and the Sustainable Use of Waters of the Spanish-Portuguese River Basins also provides the framework for transboundary coopera-tion on the Douro River.67
Trends By 2027, Spain predicts agricultural water withdrawal to increase relatively, by two per cent units, to 94%. By the same year, to-tal withdrawal is predicted to increase by about 12%, compared with the 2005 level.
In the Spanish part of the basin, the implementation of the River Basin Management Plan,68 as well as the National Plan for Sludge from Sewage Treatment Plants, the National Sewer System and Water Treatment Plan, and the new National Water Quality Plan are predicted to further improve the status of the river basin.69
63 Management Plan Proposal for the Spanish Side of the River Basin District of Miño, Sil and Limia River Basins — Hydrological Plan 2010-2015, public consultation Issue, issue, December 2010.
64 Based on information provided by Spain and the First Assessment. 65 The river is known in Portugal as Douro, and in Spain as Duero.66 This Tertiary aquifer with an area 417 km2 and a thickness of 50-250 m in Spain, consisting of silty sands, is listed in the inventory of transboundary groundwaters
(No. 283).67 For more information, please refer to the assessment of the Miño/Minho River. 68 The Douro River Basin Management Plan, Proposed Draft, December 2010. 69 Source: Hydrological planning office. Confederation of the Duero basin.
Total water withdrawal and withdrawals by sector in the Douro sub-basin
CountryTotal withdrawal
×106 m3/year Agricultural % Domestic % industry % energy % other %Spain 4 883 92 4 1 N/A N/APortugal N/A N/A N/A N/A N/A N/A
336 | part IV

Sources: UNEP/DEWA/GRID-Europe 2011; Spanish National Statistics Institute, 2005.
1
Porto
Bilbao
Valladolid
Madrid
ATL A
NT I
C
OC
E AN B a y o f B i s c a y
Almendra Reservoir
RicobayoReservoir
Douro
Duero
MirandaReservoir
Adaj
a
Cega
Pisu
erga
Riaza
Esla
Tâmega
Tormes
Tua
Sabo
r
Agueda
PO
RT
UG
AL
SP
AI
N
40o
5o
The boundaries and names shown and the designations used on this mapdo not imply official endorsement or acceptance by the United Nations. UNEP/DEWA/GRID-Geneva 2011
0 25 50 75 100Kilometres
1 Sau
celle
Res
ervo
ir
Disc
harg
e (m
3 s-1) (
loga
rithm
ic sc
ale)
284
(Dou
ro)1
10
100
1000 QavQmaxQmin
0.0
0.5
1.0
1.5
2.0
2.5
Spain
Portu
gal
1.8
2.2
Popu
lation
(in m
illion
s)
Country information/other 1%
Urban/Industrial areas (<1%)Surface with little or no vegetation (<1%)
Water bodies (<1%)Wetlands (<1%)
CultivatedForestGrassland/Shrubland
Others
46%
20%
33%
DiSChARgeS, popuLATion AnD LAnD CoveR in The DouRo RiveR BASin
336 | part IV Chapter 7 Drainage basins of the north sea anD eastern atlantic | 337
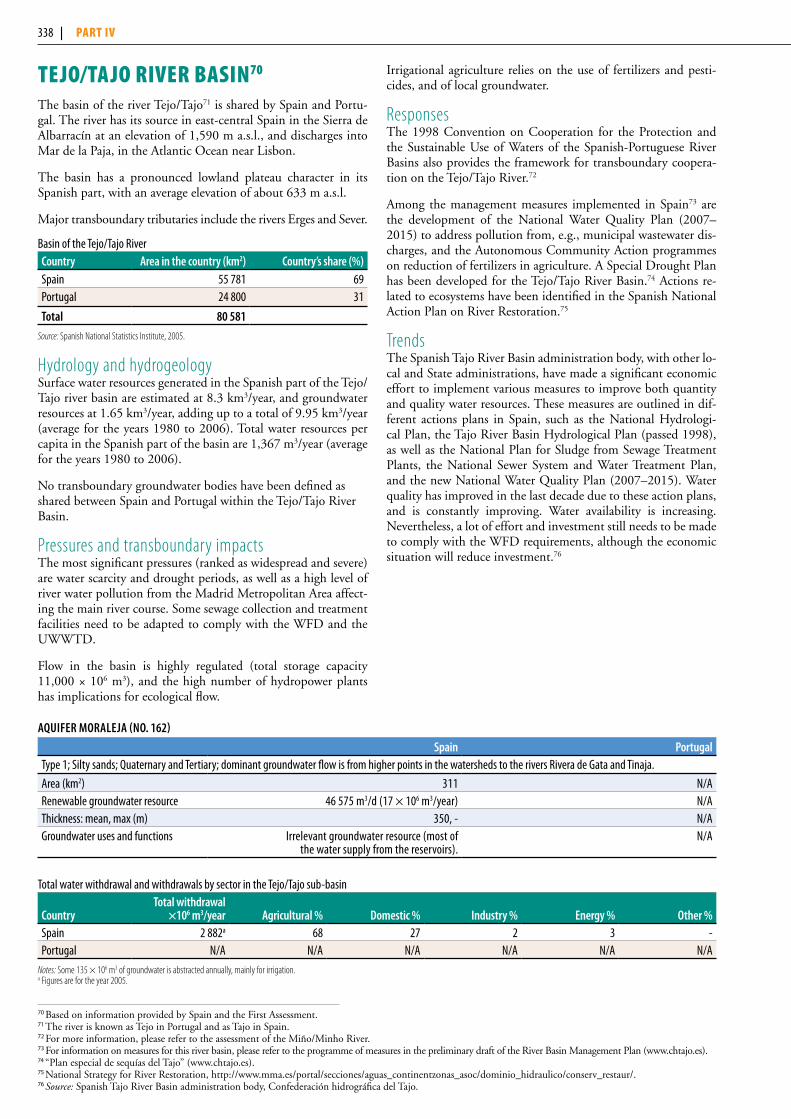
tejo/tajo rIVer BasIn70
The basin of the river Tejo/Tajo71 is shared by Spain and Portu-gal. The river has its source in east-central Spain in the Sierra de Albarracín at an elevation of 1,590 m a.s.l., and discharges into Mar de la Paja, in the Atlantic Ocean near Lisbon.
The basin has a pronounced lowland plateau character in its Spanish part, with an average elevation of about 633 m a.s.l.
Major transboundary tributaries include the rivers Erges and Sever.
Basin of the Tejo/Tajo River Country Area in the country (km2) Country’s share (%)Spain 55 781 69Portugal 24 800 31
Total 80 581Source: Spanish National Statistics Institute, 2005.
Hydrology and hydrogeologySurface water resources generated in the Spanish part of the Tejo/Tajo river basin are estimated at 8.3 km3/year, and groundwater resources at 1.65 km3/year, adding up to a total of 9.95 km3/year (average for the years 1980 to 2006). Total water resources per capita in the Spanish part of the basin are 1,367 m3/year (average for the years 1980 to 2006).
No transboundary groundwater bodies have been defined as shared between Spain and Portugal within the Tejo/Tajo River Basin.
Pressures and transboundary impactsThe most significant pressures (ranked as widespread and severe) are water scarcity and drought periods, as well as a high level of river water pollution from the Madrid Metropolitan Area affect-ing the main river course. Some sewage collection and treatment facilities need to be adapted to comply with the WFD and the UWWTD.
Flow in the basin is highly regulated (total storage capacity 11,000 × 106 m3), and the high number of hydropower plants has implications for ecological flow.
Irrigational agriculture relies on the use of fertilizers and pesti-cides, and of local groundwater.
Responses The 1998 Convention on Cooperation for the Protection and the Sustainable Use of Waters of the Spanish-Portuguese River Basins also provides the framework for transboundary coopera-tion on the Tejo/Tajo River.72
Among the management measures implemented in Spain73 are the development of the National Water Quality Plan (2007–2015) to address pollution from, e.g., municipal wastewater dis-charges, and the Autonomous Community Action programmes on reduction of fertilizers in agriculture. A Special Drought Plan has been developed for the Tejo/Tajo River Basin.74 Actions re-lated to ecosystems have been identified in the Spanish National Action Plan on River Restoration.75
Trends The Spanish Tajo River Basin administration body, with other lo-cal and State administrations, have made a significant economic effort to implement various measures to improve both quantity and quality water resources. These measures are outlined in dif-ferent actions plans in Spain, such as the National Hydrologi-cal Plan, the Tajo River Basin Hydrological Plan (passed 1998), as well as the National Plan for Sludge from Sewage Treatment Plants, the National Sewer System and Water Treatment Plan, and the new National Water Quality Plan (2007–2015). Water quality has improved in the last decade due to these action plans, and is constantly improving. Water availability is increasing. Nevertheless, a lot of effort and investment still needs to be made to comply with the WFD requirements, although the economic situation will reduce investment.76
AquifeR moRALejA (no. 162)
Spain portugalType 1; Silty sands; Quaternary and Tertiary; dominant groundwater flow is from higher points in the watersheds to the rivers Rivera de Gata and Tinaja.
Area (km2) 311 N/ARenewable groundwater resource 46 575 m3/d (17 × 106 m3/year) N/AThickness: mean, max (m) 350, - N/AGroundwater uses and functions Irrelevant groundwater resource (most of
the water supply from the reservoirs). N/A
Total water withdrawal and withdrawals by sector in the Tejo/Tajo sub-basin
CountryTotal withdrawal
×106 m3/year Agricultural % Domestic % industry % energy % other %Spain 2 882a 68 27 2 3 -Portugal N/A N/A N/A N/A N/A N/A
Notes: Some 135 × 106 m3 of groundwater is abstracted annually, mainly for irrigation.a Figures are for the year 2005.
70 Based on information provided by Spain and the First Assessment. 71 The river is known as Tejo in Portugal and as Tajo in Spain.72 For more information, please refer to the assessment of the Miño/Minho River. 73 For information on measures for this river basin, please refer to the programme of measures in the preliminary draft of the River Basin Management Plan (www.chtajo.es).74 “Plan especial de sequías del Tajo” (www.chtajo.es).75 National Strategy for River Restoration, http://www.mma.es/portal/secciones/aguas_continentzonas_asoc/dominio_hidraulico/conserv_restaur/.76 Source: Spanish Tajo River Basin administration body, Confederación hidrográfica del Tajo.
338 | part IV

Sources: UNEP/DEWA/GRID-Europe 2011; Spanish National Statistics Institute, 2005.
1
Lisboa
MadridSetúbal
Salamanca
Alcaláde Henares
AT L A
NT I C
OC E A N
Tejo
TajoValdecañasReservoir
AlcàntaraReservoir
EntrepeñasReservoir
BuendiaReservoir
Canal de Trasvase
CedilloReservoir
Zêzere
Alagón
AlbercheTiétar
Jara
ma
Guadiela
PO
RT
UG
AL S
PA
IN
40o
5oThe boundaries and names shown and the designations used on this mapdo not imply official endorsement or acceptance by the United Nations. UNEP/DEWA/GRID-Geneva 2011
0 50 100 150Kilometres
1 Ced
illo R
eser
voir
Disc
harg
e (m
3 s-1) (
loga
rithm
ic sc
ale)
226
(Tejo
)1
10
100
1000 QavQmaxQmin
0
1
2
3
4
5
6
7
8
Spain
Portu
gal
0.8
7.3
Popu
lation
(in m
illion
s)
Country information/otherLandScanTM
2%2%
Surface with little or no vegetation (<1%)Water bodies (<1%)Wetlands (<1%)
CultivatedForestGrassland/ShrublandUrban/Industrial areas
Others
30%
36%
30%
DiSChARgeS, popuLATion AnD LAnD CoveR in The Tejo/TAjo RiveR BASin
338 | part IV Chapter 7 Drainage basins of the north sea anD eastern atlantic | 339

CedIllo reserVoIr77
The Cedillo78 Reservoir in the Tejo/Tajo River Basin, constructed for hydropower, is located on the border between Spain and Por-tugal. The surface area of the reservoir is 14 km2 and the vol-ume is 0.260 km3, the mean inflow equals 10.265 km3 and the minimum outflow should not be lower than 2.7 km3. Most of the total basin area of the reservoir — 59,000 km2 — is in Spain (55,800 km2).
The main human activities in the proximity of the reservoir are livestock farming and hunting.
The reservoir has had a high, but highly variable mean concen-tration of phosphorus.
GuadIana rIVer BasIn79
The basin of the river Guadiana is shared by Spain and Portugal. The river has its source in Spain at Campo Montiel (1,150 m a.s.l.) and discharges into the Atlantic Ocean.
The rivers Gévora, Caya, Alcarrache, Ardila, Múrtigas and Chan-za are major transboundary tributaries.
The basin has a pronounced lowland character, with an average elevation of about 550 m a.s.l.
Basin of the Guadiana RiverCountry Area in the country (km2) Country’s share (%)Spain 55 527 83%Portugal 11 500 17%
Total 67 027Sources: Spanish National Statistics Institute, 2005; Portuguese National Water Plan. Instituto da Agua. 2002.
Hydrology and hydrogeologySurface water resources generated in the Spanish part of the Guadiana River Basin are estimated at 4,187 × 106 m3/year, and groundwater resources at 533 × 106 m3/year, adding up to a total of 4,791 × 106 m3/year. Total water resources per capita in the ba-sin are 3,298 m3/year/capita (average for the years 1980–2006).
In the Spanish part of the basin, groundwaters are mainly in karstified permeable aquifers, but there are also a few important aquifers in Quaternary and Tertiary unconsolidated aquifers. The Las Vegas Bajas aquifer is the only aquifer identified as trans-boundary in the Guadiana Basin.80 Since it is considered to be irrelevant for the current water resources planning process, no groundwater bodies have not been defined in the basin.
A total of 66 dams, with capacity exceeding a million m3, is locat-ed in the Spanish part of the Guadiana Basin. The total reservoir capacity is 9,436 × 106 m3.
The reservoir of the Alqueva Dam (operational since 2002) in Portugal is 82 km long, and has a surface area of 250 km2 (63 km2 in Spain). The reservoir’s total capacity is 4,150 × 106 m3 (useful capacity 3,150 × 106 m3). There are 9 other reservoirs with capacity exceeding 10 × 106 m3, with a total additional ca-pacity of 508 × 106 of m3.
PressuresPressures assessed in the Spanish part of the Guadiana Basin as widespread but moderate are hydromorphological changes in riv-ers due to urban areas and croplands, nitrate and phosphorus pollution by wastewater discharges, and diffuse pollution by fer-tilizers. Pressure factors ranked as local but severe include min-ing and quarrying, as well as intense rainfall events impacting on cities and cultivated areas. Severe problems are observed related to groundwater abstraction for agriculture use in the Upper Gua-diana River Basin. All other pressures, including those caused by contaminated sites, are judged as minor.
Responses and transboundary cooperationSaltwater coming up the estuary and suspended sediments/mud flows are addressed in the programme of measures through the application of ecological flows. Improvement of efficiency of ni-trogen application in agricultural production is also among the measures.
Transboundary cooperation on the Guadiana River Basin is car-ried out on the basis of the bilateral agreement, the so-called “Albufeira Convention”, dating from 1998, and its revision in 2008. Please refer to the assessment of the Miño/Minho for more information.
TrendsBy 2015, total withdrawal in the Spanish part of the basin is expected to decrease very slightly (0.4%) compared with the level of withdrawal in 2005. By 2021, withdrawal is predicted to have increased by 0.9%, compared with withdrawal in 2005. From 2005 to 2021, withdrawal for domestic use is predicted to in-crease by 9%, and for industrial use to increase by more than three times. In absolute terms, withdrawal for agriculture is pre-dicted to decrease in the same period, by 7.5%. Non-consump-tive use for hydropower is predicted to decrease.
The implementation of several relevant national plans in Spain — as described in the assessment of the Miño/Minho — is ex-pected to also improve the status of the Guadiana River.
Regarding climate change, an increase of 1 ºC in annual average temperature, and a 5% precipitation decrease is predicted by 2030. By 2060, the annual average temperature could increase by 2.5 ºC, accompanied by a decrease of 8% in precipitation. River discharge is predicted to decrease by 11% by 2030, and 17% by 2060. A de-crease of groundwater level is also predicted to result from climate change, as well as an increase in agricultural water withdrawal.81
Total water withdrawal and withdrawals by sector in the Guadiana Basin
Country YearTotal withdrawal
× 106 m3/year Agriculture % Domestic % industry % energy % other %Spain 2005 2 220a 88 9 1.9 -a
Portugal N/A N/A N/A N/A N/A N/A N/Aa No consumptive water use for energy related purposes is reported. The volume of non-consumptive use for hydropower is estimated at 2,293 × 106 m3/year.
77 Based on the First Assessment. 78 The reservoir is also known as Cedilho.79 Based on information provided by Spain, and the First Assessment.80 The Las Vegas Bajas aquifer (UH 04.09) was described as a transboundary aquifer in the Inventory of Transboundary Groundwaters by the UNECE Task Force on
Monitoring and Assessment (1999). This silty sand aquifer of Quaternary and Tertiary age which has an area of 325 km2 and a thickness of approximately 140 m in Spain is listed in the inventory (No. 282).
81 Comprehensive Assessment of the Impacts of Climate Change in Spain. Ministry of the Environment, 2005 (in Spanish).
340 | part IV
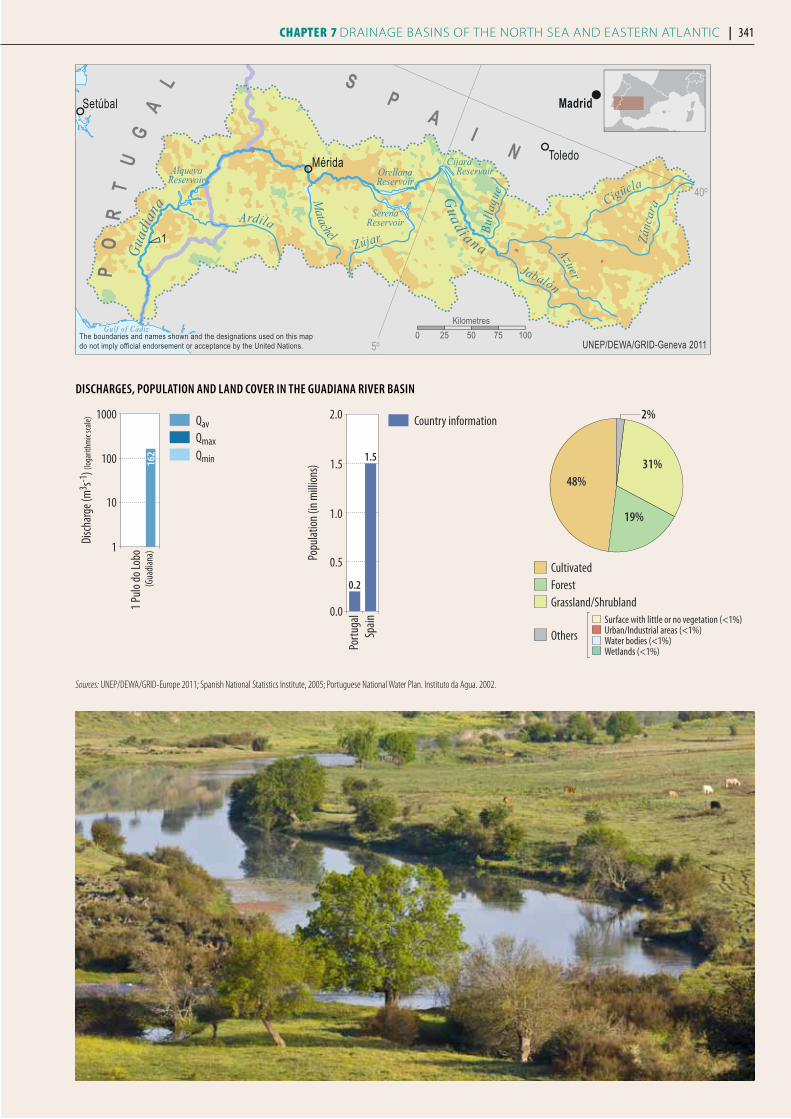
Sources: UNEP/DEWA/GRID-Europe 2011; Spanish National Statistics Institute, 2005; Portuguese National Water Plan. Instituto da Agua. 2002.
1
Setúbal
ToledoMérida
Madrid
Gulf of Cádiz
AlquevaReservoir
OrellanaReservoir
Cijara Reservoir
SerenaReservoir
Guad
iana
Guad i a na
Jabalón
Cigüela
Zánc
ara
AzuerArdila
Matachel
Zújar
Bulla
que
SP
AI
N
PO
RT
UG
AL
5o
40o
The boundaries and names shown and the designations used on this mapdo not imply official endorsement or acceptance by the United Nations.
0 25 50 75 100Kilometres
UNEP/DEWA/GRID-Geneva 2011
1 Pul
o do L
obo
Disc
harg
e (m
3 s-1) (
loga
rithm
ic sc
ale)
162
(Gua
dian
a)1
10
100
1000 QavQmaxQmin
0.0
0.5
1.0
1.5
2.0
Spain
Portu
gal
1.5
0.2
Popu
latio
n (in
mill
ions
)
Country information 2%
Urban/Industrial areas (<1%)Surface with little or no vegetation (<1%)
Water bodies (<1%)Wetlands (<1%)
CultivatedForestGrassland/Shrubland
Others
48%
19%
31%
DiSChARgeS, popuLATion AnD LAnD CoveR in The guADiAnA RiveR BASin
340 | part IV Chapter 7 Drainage basins of the north sea anD eastern atlantic | 341

erne rIVer BasIn82
The Erne River Basin is one of the two principal river basins within the North Western International River Basin District (RBD) that are shared between Ireland and Northern Ireland (a region of the United Kingdom), the other river basin being the Foyle. There is also a smaller shared river basin, Lough Melvin, that is fed by the County and Roogagh Rivers.
The 120 km-long Erne River,83 rises from Lough Gowna in Coun-ty Cavan (Ireland), and flows north-west through County Ferman-agh (Northern Ireland), where the river expands to form two large lakes, the Upper Lough Erne (16-km long), and the Lower Lough Erne (29-km long). The river exits Lower Lough Erne, flowing westwards through Ballyshannon in County Donegal (Ireland), and discharges into the Atlantic Ocean at Donegal Bay.
There are a number of fisheries along the Erne and its tributar-ies, and the Erne is very popular for trout fishing and boating. Hydroelectricity is produced along the 46 m drop in the river’s course between Belleek and Ballyshannon.
Basin of the Erne RiverCountry Area in the country (km2) Country’s share (%)UK, Northern Ireland 1 900 59Ireland 2 800 41
Total 4 700
Pressures84
Diffuse agricultural sources continue to be the main threat to the quality of Erne system, particularly phosphorus. Pollution from other diffuse sources (urban land use, transportation, unsewered single house dwellings, peat exploitation and forestry) also create pressure on the system. Discharges from point sources, such as urban wastewater treatment plants, stormwater overflows, sludge treatment, IPPC industries,85 and non-IPPC industries, add to this pressure.
Hydromorphological changes due to the level being artificially controlled to support hydroelectric power generation at Bally-shannon, along with reservoirs, water abstraction, channel altera-tions, agricultural enhancements, and flood defence also exert pressure on the Erne Basin.
Zebra mussels and other invasive alien species have continued to spread in the Erne system, especially in the lakes, and this is a cause for concern. Zebra mussels are known to impact on other biologi-cal elements, with unfavourable repercussions for water ecology.
StatusEutrophication due to phosphorus enrichment has been identi-fied as a problem resulting from diffuse pollution. With controls on agriculture and nutrient reduction at the larger wastewater treatment works, the situation has been improving.
Average nitrate values in the upper Erne catchment (Ireland) are rela-tively low, at an average of <0.8 mg N/l. The corresponding average concentrations at over 90 monitoring sites include mean phosphate values in the range 0.02 to 0.05 mg P/l, total ammonia in the range 0.04 – 0.10 mg N/l, and BOD in the 2.0 – 4.0 mg/l range.86
Annual mean nitrate values, which have been recorded for the Erne during the 1979-2006 study period, have slightly increased in the last few years of the study (2000-2006). Annual mean phosphate values have been slightly fluctuating over the study period, but mainly remained under “good status”.
Overall, in Ireland’s rivers, there was a slight decrease in the num-ber of channels classified as seriously polluted, when compared to the 2001–2003 period. A biological assessment of rivers in Ireland covering 456 km of river channel shows 50% of this to be unpolluted, 37.5% slightly polluted (primarily due to eutrophi-cation) and 11.9% moderately polluted, but no seriously pol-luted stretches were noted. This represents a deterioration com-pared with the 2004-2006 period, when 66% of 467 km of river channel monitored was satisfactory, 23% slightly polluted, 11% moderately polluted and 0.3% or 1.5km was seriously polluted.
Between the years 2004-2006, the biological status of the Erne channel was assessed to be mostly of good status, 25% moderate, some of poor status, and very little as bad.87
According to the UK classification, the ecological status of both the Upper and Lower Lough Erne was classified as of moder-ate ecological potential.88 The ecological status was affected by phosphorus levels and plant growth (macrophytes), and the man-agement of the levels to support hydropower and flood defense. Information on the general status of water bodies within the river basin district is covered by the information on the Foyle Basin.
Freshwater pearl mussels are present in some of the tributaries to the Upper and Lower Lough Erne, and these are subject to protection and an improvement programme to promote implan-tation of the mussels.
The North Western River Basin Management Plan (RBMP) as-sesses the majority of the rivers flowing into Lough Melvin at of good to high status, and Lough Melvin varies between good and moderate status. However, phosphorus levels pose a risk to its status as a mesotrophic lake, and it is considered to be in unfa-vourable status as a result.
Responses The Erne is monitored, and reports on the state of the environ-ment and water quality have been produced regularly. Ground-water monitoring networks have also been developed. Following the publication of the North Western RBMP, an action plan has been developed for the Lower Lough Erne sub-basin, and an ac-tion plan will be developed during 2011 for the Upper Lough Erne sub-basin. A further action plan for the Melvin and Arney sub-basin will be developed in 2012.
A bilateral flood-control scheme operates to manage the water level in the Upper and Lower Lough Erne lakes.
A catchment Management Plan has been developed for the Lough Melvin sub-basin, along with the North Western River Basin Management Plan. These will support actions to address the pressures within the basin.
TrendsRecent years have seen more intensive rainfall events occurring, and these pose a risk of flooding in the area. Management of
82 Based on information provided by Ireland, the Northern Ireland Environment Agency, and the First Assessment. 83 The river is also known as Ûrn. 84 A detailed assessment of pressures is available in the River Basin Management Plan for the North West International River Basin District (http://www.wfdireland.ie/docs/). 85 Industries that fall under the IPPC Directive. 86 Source: Water Quality in Ireland 2007-2009. Environmental Protection Agency, Ireland. 2010.87 Source: Water Quality in Ireland 2007-2009. Environmental Protection Agency, Ireland. 2010.88 Source: North Western International River Basin Management Plan Summary, December 2009.
342 | part IV

Source: UNEP/DEWA/GRID-Europe 2011.
1
2
Belfast
Londonderry
Dundalk
Ramsar SiteLough Foyle
Bann
LoughNeagh
Foyle
Finn
FaneErne
CastletownFlurry
Lower Lough Erne
Strule
N O R T H C H A N N E L
I R I S H
S E A
AT
LA
NT
I
C O
C E A N
Upper Lough Erne
DergMourne
Main
Blackw
ater
U N I T E D
N O R T H E R N I R E L A N D
I
RE
LA
N D
K I N G D O M
54o
55o
8o 6o
UNEP/DEWA/GRID-Geneva 2011The boundaries and names shown and the designations used on this mapdo not imply official endorsement or acceptance by the United Nations.
0 20 40 60Kilometres
Popu
latio
n (in
hun
dred
thou
sand
s)
0.0
0.2
0.4
0.6
1.0
0.8
Unite
d Kin
gdom
Irelan
d
0.6
0.8
LandScanTM 1%
Cultivated (<1%)
Urban/Industrial areas (<1%)Surface with little or no vegetation (<1%)
Wetlands (<1%)
ForestGrassland/ShrublandWater bodies
Others
24%
69%
6%
popuLATion AnD LAnD CoveR in The eRne RiveR BASin
Phot
o by T
obias
Salat
he
342 | part IV Chapter 7 Drainage basins of the north sea anD eastern atlantic | 343

popuLATion AnD LAnD CoveR in The foYLe RiveR BASin
Source: UNEP/DEWA/GRID-Europe 2011.
Popu
latio
n (in
hun
dred
thou
sand
s)
0.0
0.5
1.0
1.5
2.0
Unite
d Kin
gdom
Irelan
d
1.5
0.3
LandScanTM 1% 2%
Urban/Industrial areas (<1%)Surface with little or no vegetation (<1%)
Water bodies (<1%)Wetlands (<1%)
CultivatedForestGrassland/Shrubland
Others
40%57%
the levels within the Erne Basin are a critical factor, and need to be kept under review. It is also proposed to develop ecological modelling tools to assist with lake management. The action be-ing taken to manage waste in agriculture should assist in reducing phosphorus loads within the Erne River Basin.
louGh melVIn89
Lough Melvin is a unique and internationally-significant lake located in the counties of Leitrim (Ireland) and Fermanagh (Northern Ireland). It is described as “one of the few remaining natural post-glacial salmonid lakes in northwestern Europe”. The lake covers an area of 2.2 km2, and, as an oligo-mesotrophic (low-medium nutrient) lake, is renowned for its unique assemblage of fish species and diversity of flora and fauna. The lake is fed by a number of small rivers rising in County Leitrim and Sligo in Ireland that represent the majority of the catchment, and by the Roogagh River that rises in County Fermanagh (Northern Ireland). The river is drained by the River Drowes the flows west-wards through County Leitrim and Donegal and discharges into the Atlantic Ocean at Donegal Bay.90
Basin of the Lough MelvinCountry Area in the country (km2) Country’s share (%)UK, Northern Ireland 60 15Ireland 353 85
Total 413
PressuresThe health and status of the Lough Melvin is vulnerable to hu-man activities, particularly increases in phosphorus loadings from housing, forestry and agriculture. Currently, phosphorus concentrations in the lake have increased by over 40% in almost a decade, and monitoring indicates phosphorus loadings are con-tinuing to increase.
Foyle rIVer BasIn91
The North Western International River Basin District is shared by Ireland and Northern Ireland (a region of the United King-dom). The river basin district is bounded to the north and west by the Atlantic Ocean, to the east by the Neagh Bann International River Basin District, and to the south by the Shannon Interna-tional River Basin District. The Foyle River basin has its source in the Sperrins mountains in the County of Tyrone in Northern Ireland, where the River Strule is fed by a number of tributaries. This is joined by the river Derg that rises in County Donegal in Ireland, and further downstream by the Finn River that also has its source in County Donegal. After the confluence with the River Finn, the river is known as the Foyle River and is estuarine in nature as it flows through the city of Londonderry/Derry into Lough Foyle, which discharges into the Atlantic Ocean.
North Western River Basin DistrictCountry Area in the country (km2) Country’s share (%)UK, Northern Ireland 7 400 60Ireland 4 900 40
Total 12 300
The Foyle Basin and valley are fertile, and support intensive cattle, sheep, pig and arable farming. In the mountainous regions of the Foyle Basin there is coniferous forest and some sheep and cattle grazing. The Foyle River system is recognised as an important and popular fishery for Atlantic Salmon, and has protected status.
Pressures in the Foyle River Basin are principally due to diffuse agricultural sources and increased pressure from growing popula-tions to support industry and disposal of urban wastewater and water abstraction. There are also hydromorpological pressures due to water abstraction, agriculture enhancements and flood defense. Pressures in the estuary complex are described in the assessment of the Lough Foyle wetland area.
89 Based on information provided by the Northern Ireland Environment Agency.90 Source: Lough Melvin Catchment Management Plan, June 2008.91 Based on information provided by Ireland and the Northern Ireland Environment Agency, and on the First Assessment.
Phot
o by T
obias
Salat
he
344 | part IV

According to the UK classification, the chemical status of the Foyle for the period 2002-2005 was classified as good, and bio-logical status also as good.92 Ecological status under the WFD was assessed in Ireland, for 200 km of river channel, with 40% of high and good status, 18% moderate, 41% poor and 0.8% of bad status. This represents a deterioration compared with the 2004-2006 survey.93 Investigative monitoring targeted at sus-pected pollution from sheep dip and insecticides usage in forestry is being undertaken, with a view to reversing the observed decline in water quality.
Part of the River Foyle and its tributaries, situated in Northern Ireland, are included in an Area of Special Scientific Interest (ASSI). These areas are notable for the physical diversity, natural condition of the banks and channels, and for the richness and natural state of its plant and animal communities.94
According to the Groundwater Action Programme in the North-Western International River Basin District (IRBD) Management Plan, the quantitative, chemical and overall status of groundwa-ter is classified as good.
92 Source: Environment and Heritage Service (EHS), United Kingdom (http://www.ehnsi.gov.uk). 93 Source: Water Quality in Ireland 2007-2009. Environmental Protection Agency, Ireland. 2010. 94 Source: Northern Ireland Environment Agency. (http://www.doeni.gov.uk). 95 Sources: Information Sheet on Ramsar Wetlands; Loughs Agency (http://www.loughs-agency.org/site/).96 The watershed of the Lough covers an area of approximately 3,700 km2, and includes the three main rivers, namely Foyle, Faughan and Roe, as well as their
tributaries fanning out to the south and east.
louGh Foyle Wetland area In the Foyle BasIn95
General description of the wetland areaThe Lough Foyle wetland area is shared by the United Kingdom (Northern Ireland) and Ireland. Lough Foyle96 is a diverse estuarine wetland complex with a string of habitats both below high water and above, and a 26-km long inlet on the northern coast of Ireland. ”The Tuns” — a large submerged sandbank system — forms the northern boundary of the lough, the outer part of which has a more exposed character. The area belonging to Ireland in the West is made up of rocky shores, fishing villages with small harbours, small wood-lands, grassland for sheep and cattle grazing, and small tourist resorts with beaches and sheltered coves. In contrast, the Northern Ireland side is dominated by soft coast and low-lying hinterland, with larger agricultural holdings behind sea embankments. A large sand dune system in the North adds to the biodiversity value. The tidal up-per estuaries are set in extensive floodplain wetlands with reedbeds, fresh water and salt marshes, and embanked slob lands, especially on the Northern Ireland inner lough side. There are also many small (~1 km) direct inflows of streams from the hinterland, reflecting Ire-land’s high rainfall, which can have a major influence on the inner lough salinity and nutrient levels.
Main wetland ecosystem services The area is important for fishing, with mixed inshore sea fisher-ies, seasonal wild salmon fishing, and passive gear for lobster and crab. In the extensive intertidal area, periwinkles and cockles are gathered. Mussel bottom culture has boomed since its start in the 1990s, with fully mechanized dredgers used to bring in mussel seed, relay, and harvest. Apart from ferry traffic, recreational uses range from bathing and boating to wildlife watching and educational ‘tourism’. While large parts of the low-lying lands are embanked, there is still substantial flood retention value in the wetlands.
Cultural values of the wetland areaThere are historic settlements on the western shore of the lough, with shell middens and other archaeological features. Derry is one of Europe’s walled cities.
Biodiversity values of the wetland areaThe lough is a highly productive area. Due to geology, exposure, salinity, and current it offers a wide range of habitats, with rich mudflats, both rock and biogenic reefs, and seagrass beds, and is particularly rich in molluscs and fish – attributes which attract high numbers of wintering wild fowl and waders. Further, the River Foyle and its tributaries have the largest Atlantic Salmon population in Northern Ireland, including high genetic diversity.
Pressure factors and transboundary impactsSeveral pressure factors lead to the decline of shared natural re-sources within the Lough area. Water pollution from agriculture, industry and sewage impact the inner eutrophic lough. With re-gard to modern mollusc fisheries, in particular mussel bottom culture affects areas of native oyster beds through dredging and introduction of large quantities of seed mussels from the Irish Sea. Gigas oysters, now an invasive species, have been imported and have changed the local hydrology. Shellfish Herpes virus has been introduced, and is now affecting native oysters.
While new transport-related construction pressure is now on the decline, construction for green infrastructure — wind and water energy — is starting. In the immediate hinterland, fragmentation is caused by roads, flood defences, and housing developments. In terms of the entire river basin, agricultural intensification and wetland loss are pressures which are recently increasing again, caused by the rise in market prices for agricultural products. This comes on top of the European Commission’s Common Agricul-tural Policy payments for farmers, which are provided for land in good agricultural condition, but withheld for wetlands. This measure provides incentives to drain or fill in existing wetlands, especially as planning law is too weak. Further, there are control problems in terms of sand and gravel extraction from rivers and estuary. Additional pressures identified are water abstraction, the damming of rivers, peat harvesting and forestry. Finally, climate change, which is associated with an increased erosion risk of vul-nerable shores and rising sea levels, which may inundate low lying lands, is likely to cause further flood and erosion defence works.
Transboundary wetland managementThe River Foyle is a transboundary wetland and now designated a SAC under the EU Habitats Directive on both the Ireland and Northern Ireland sides, due to its abundance of salmon, as well as lamprey and otter. It is managed by the two responsible Govern-ments, local authorities, and the cross-border Lough Agency — with responsibility for fisheries — set up by agreement between the two states. Both Governments claim the lough up to the mean low water mark of the other. This is one of the reasons why there is no mechanism for designating the entire lough as Natura 2000/Ramsar Site, although much of the rim of the lough has been designated as an Area of Special Scientific Interest (ASSI) under UK regulation, an SPA, as well as a Ramsar Site.
Water quality monitoring of the Lough and its watershed and associated fish monitoring is carried out by the Lough Agency. The Lough is monitored for ecological status under the WFD by the Northern Ireland Environment Agency (NIEA) and sta-tus results — the inner Foyle water bodies are classified as being
344 | part IV Chapter 7 Drainage basins of the north sea anD eastern atlantic | 345

neaGh Bann rIVer BasIn dIstrICt98
The Neagh Bann International River Basin District (IRBD) cov-ers an area of around 6,000 km2 of Northern Ireland (a region of the United Kingdom), and drains 38% of the land area; a further 2,000 km2 is within Ireland. Most of the surface water collected by the river systems within the basin drains to Lough Neagh, the largest freshwater lake in the British Isles, before discharging into the Atlantic Ocean, north of the island via the Lower River Bann. Only a small portion of the River Basin District, at the southern end of the catchment, is shared with Ireland. This is principally the Blackwater River system that rises in County Fermanagh in Northern Ireland and flows eastward, skirting the border with County Monaghan in Ireland, before turning northwards to drain into Lough Neagh, in Northern Ireland. Smaller river ba-sins that are shared between the two countries at the southern end of the Neagh Bann River Basin District are the Castletown and Fane rivers, draining into the Irish Sea at Dundalk Bay.
Land around Lough Neagh (surface area 396 km2) is typified by improved pasture, but it also includes some important wetland habitats. The main land use around the Blackwater River Basin is improved grassland and arable horticulture, with fruit growing in the eastern part of the basin.
The Bann River Basin is important for salmon and eel fisheries.
Neagh Bann River Basin DistrictCountry Area in the country (km2) Country’s share (%)UK, Northern Ireland 5 740 72Ireland 2 200 28
Total 7 940
Basin of the Blackwater River Country Area in the country (km2) Country’s share (%)UK, Northern Ireland 1 100 67Ireland 550 33
Total 1 650Source: Working together: managing our shared waters. Neagh Bann IRBD. December 2008.
Hydrology and hydrogeologyThe average discharge of the Upper Bann (upstream from Lake Lough Neagh) is approximately 5.4 m3/s at the Dynes Bridge, and of the Lower Bann 92.1 m3/s at the Movanagher.99
Pressures and statusPressures in the Irish part of the Bann River Basin are principally the same as described in the assessment of the Erne River.
According to UK River Basin Management Plan status assess-ment (2009), the River Blackwater Local Management Area (LMA), which equates to the Blackwater River Basin in North-ern Ireland, had 12% of its water bodies of good status, 42% of moderate status (2% of these being heavily modified resulting in moderate ecological potential), 35% of poor status (6% of these being of poor ecological potential), and 12% of bad status (4% of these being of bad ecological potential).
This results in 88% of surface water bodies within the River Blackwater LMA in Northern Ireland being classified as of less than good status. Many of the rivers failed to achieve good status due to low levels of dissolved oxygen and elevated levels of phos-phorus. Invertebrates have also been heavily impacted.
There are a number of pressures that may prevent some waters reaching good quality. The main ones are considered to be:
• abstraction and flow regulation;
• diffuse and point source pollution;
• changes to morphology (physical habitat); and,
• invasive alien species.
According to the Environmental Protection Agency of Ireland, the waters in the portion of the Neagh Bann IRBD situated south of the border are the most polluted, and represent one of the most polluted regions in Ireland. The impact tends from slight pollution, mainly seen as eutrophication with an increasing trend to moderate, usually characterized by marked organic and severe eutrophication effects.
Between the years 2007-2009, the biological status of the Bann channel was assessed over 78 km of tributary river channel in Ire-land as follows: 40% high and good, 16% moderate, and 44% poor biological status.100 The main pressures on these rivers were municipal wastewater discharges and diffuse agricultural pollution.
The overall status of the Neagh Bann IRBD was assessed in 2008 by the UK and Ireland giving initial classification results; 23% of waters of good or better class, 71% of water bodies less than good, with the remaining 6% yet to be assessed.
According to the Groundwater Action Programme in the Neagh Bann IRBD in Ireland, quantitative status is classified mostly as good, and a small part (7 %) as poor. The chemical status of groundwater is classified as good and the overall status as good.
An action plan will be drawn up during 2011 for the River Black-water LMA, to address those water bodies that are of less than good status.
of moderate ecological status and the resulting programmes of measures (restoration by 2021) are included in the River Ba-sin Management Plan (RBMP) for the North-Western IRBD.97 The county councils on both sides also monitor selected pa-rameters such as bathing water quality and discharges where licensed permits have been granted. The Environmental Protec-tion Agency of Ireland (EPA) and Northern Ireland Environ-ment Agency monitor the larger integrated pollution licenses.
Existing protected areas urgently require management plans and measures, and implementation responsibilities need to be clarified.
While there is no climate change adaptation strategy for the lough, each Government is developing its own climate change strategies which include plans for green energy - wind, tidal and wave. Both have commissioned offshore energy SEAs.
97 Source: http://www.wfdireland.ie/docs/.98 Based on information provided by Ireland and the Northern Ireland Environment Agency, and on the First Assessment. 99 The discharge values are based on Marsh, T. J., Hannaford, J. (eds). UK Hydrometric Register. Hydrological data UK series. Centre for Ecology and Hydrology. 2008.100 Source: Water Quality in Ireland 2007–2009. Environmental Protection Agency, Ireland. 2010.
346 | part IV
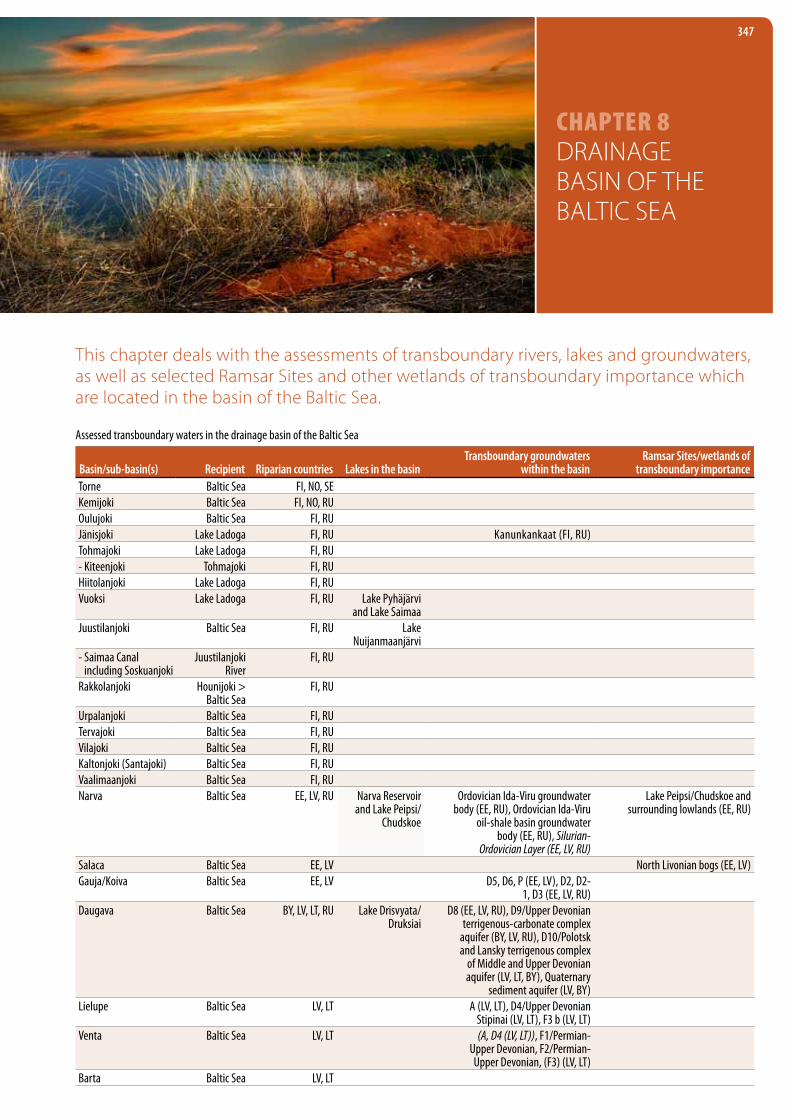
Chapter 8 Drainage basin of the baltic sea
347
this chapter deals with the assessments of transboundary rivers, lakes and groundwaters, as well as selected ramsar sites and other wetlands of transboundary importance which are located in the basin of the baltic sea.
Assessed transboundary waters in the drainage basin of the Baltic Sea
Basin/sub-basin(s) Recipient Riparian countries Lakes in the basinTransboundary groundwaters
within the basinRamsar Sites/wetlands of
transboundary importanceTorne Baltic Sea FI, NO, SEKemijoki Baltic Sea FI, NO, RUOulujoki Baltic Sea FI, RUJänisjoki Lake Ladoga FI, RU Kanunkankaat (FI, RU)Tohmajoki Lake Ladoga FI, RU- Kiteenjoki Tohmajoki FI, RUHiitolanjoki Lake Ladoga FI, RUVuoksi Lake Ladoga FI, RU Lake Pyhäjärvi
and Lake SaimaaJuustilanjoki Baltic Sea FI, RU Lake
Nuijanmaanjärvi- Saimaa Canal
including SoskuanjokiJuustilanjoki
RiverFI, RU
Rakkolanjoki Hounijoki > Baltic Sea
FI, RU
Urpalanjoki Baltic Sea FI, RUTervajoki Baltic Sea FI, RUVilajoki Baltic Sea FI, RUKaltonjoki (Santajoki) Baltic Sea FI, RUVaalimaanjoki Baltic Sea FI, RUNarva Baltic Sea EE, LV, RU Narva Reservoir
and Lake Peipsi/Chudskoe
Ordovician Ida-Viru groundwater body (EE, RU), Ordovician Ida-Viru
oil-shale basin groundwater body (EE, RU), Silurian-
Ordovician Layer (EE, LV, RU)
Lake Peipsi/Chudskoe and surrounding lowlands (EE, RU)
Salaca Baltic Sea EE, LV North Livonian bogs (EE, LV)Gauja/Koiva Baltic Sea EE, LV D5, D6, P (EE, LV), D2, D2-
1, D3 (EE, LV, RU)Daugava Baltic Sea BY, LV, LT, RU Lake Drisvyata/
DruksiaiD8 (EE, LV, RU), D9/Upper Devonian
terrigenous-carbonate complex aquifer (BY, LV, RU), D10/Polotsk and Lansky terrigenous complex
of Middle and Upper Devonian aquifer (LV, LT, BY), Quaternary
sediment aquifer (LV, BY)Lielupe Baltic Sea LV, LT A (LV, LT), D4/Upper Devonian
Stipinai (LV, LT), F3 b (LV, LT)Venta Baltic Sea LV, LT (A, D4 (LV, LT)), F1/Permian-
Upper Devonian, F2/Permian-Upper Devonian, (F3) (LV, LT)
Barta Baltic Sea LV, LT

Basin/sub-basin(s) Recipient Riparian countries Lakes in the basinTransboundary groundwaters
within the basinRamsar Sites/wetlands of
transboundary importanceSventoji Baltic Sea LV, LTNeman Baltic Sea BY, LV, LT, PL, RU Lake Galadus/
GalandusysAquifers in Quaternary deposits,
Oxfordian-Cenomanian carbonate-terrigenous aquifer (BY, LT),
Mazursko-Podlaski region aquifer (BY, LT, PL, RU), Upper Cretaceous (LT, RU)
Pregel Baltic Sea LT, PL, RUProhladnaja/Świeza Baltic Sea PL, RUVistula Baltic Sea BY, PL, SK, UA Lublin-Podlasie Region (PL, UA),
Quaternary alluvial aquifer (UA, PL), Middle Miocene terrigenous
carbonate aquifer (UA, PL), Cenonian-Turonian carbonate horizon (UA, PL)
- Bug Narew (Vistula) BY, PL, UA Bug (BY, PL), Alluvial Quaternary aquifer (BY, PL), Paleogene-
Neogene aquifer (BY, PL), Oxfordian-Cenomanian aquifer
(BY, PL), Cenonian-Turonian carbonate horizon (UA, PL)
Wetlands along Bug (BY, PL, UA)
- Dunajec Vistula PL, SK-- Poprad Dunajec PL, SKOder/Odra Baltic Sea CZ, DE, PL Miocene Sediments of Zitava Pan
(CZ, DE, PL), Kralik Ramp, Glacial Sediments of Zulov Hilly Country
and Zlata Hora Mountains, Fluvial and Glacial Sediments in the Opava
River Catchm. Area (CZ, PL), Lusatian Neisse (from the border of county
Saxonia to the mouth of river Oder)/Pomeranian Region (DE, PL)
Krkonoše/Karkonosze
Not connected to surface watersa
EE, RU Cambrian-Vendian Voronka, Ordovician-Cambrian (EE, RU)
Note: Transboundary groundwaters in italics are not assessed in the present publication.a The transboundary groundwaters indicated as not connected to surface waters either discharge directly into the sea, represent deep groundwaters, or their connection to a specific surface water course has not been confirmed by
the countries concerned.
Vistula, Tczew, 1900-1994
Vuoksi, Tainionkoski, 1847-2010
Kemijoki, Isohaara (near the mouth), 1911-2010
Oder, Gozdowice, 1900-1994
Daugava, Daugavpils, 1936-2009
Narva, Narva (hep), 1955-1991
0 15 10 15 20 25 30 35 40
km3
0 15 10 15 20 25 30 35 40
km3
River, Station,Time series
32.863
18.728
17.137
Oulujoki, Merikoski (near the mouth), 1950-2010
Bug, Wyszkow, 1920-1987
Venta, Kuldiga, 1978-2009
Dunajec, Nowy Sacz, 1945-1990
Lielupe, Mezotne, 2004-2009
Sventoji, Ukmerge, 1960-2009
River, Station,Time series
16.728
14.133
11.944
8.081
4.603
2.425
1.965
1.729
1.21
Long-term mean annual flow (km³) of rivers discharging to the Baltic Sea.
torne river Basin1
Finland, Norway and Sweden share the basin of the approximate-ly 470-km long Torne River.2 The river runs from the Norwegian mountains, through northern Sweden and the north-western parts of Finnish Lapland, to the Gulf of Bothnia (Baltic Sea). It begins at Lake Torneträsk (Norway), which is the largest lake in the river basin. The Torne River and its tributaries, Könkämäeno and Muonionjoki, form the border between Finland and Sweden for at least 520 km.
Basin of the Torne River Country Area in the country (km2) Country’s share (%)Norway 284 0.7Finland 14 480 36
Sweden 25 393 63.3
Total 40 157Source: Finnish Environment Institute (SYKE).
1 Source: Based on information provided by Finland and Sweden and the First Assessment.2 The river is also known as the Tornijoki and the Tornio.
Source: GRDC, Koblenz.
348 | part iv

Sources: UNEP/DEWA/GRID-Europe 2011; Finnish Building and Dwelling Register.Note: Population in the Norwegian part of the basin is less than 200 (LandScan).
1
2
3Oulu
Lulea
Rovaniemi
LakeOulujärvi
LakeTorneträsk
Torne
Oulujoki
Kemijo
ki
Torne
Kemijo
ki
LakeKemijärvi
PorttipahtaReservoir Lokka
ReservoirG
UL
F O
F B
OT
HN
I A
Muonio
Könkämäeno
Ounasjoki
Lainio
Lätäseno
Kitinen
LuiroF I N L A N D
RU
SS
IA
N
FE
DE
RA
TI
ON
NO R W A Y
S W E D E N
65o
25o 30o20o
UNEP/DEWA/GRID-Geneva 2011The boundaries and names shown and the designations used on this mapdo not imply official endorsement or acceptance by the United Nations.
0 50 100 150Kilometres
1 Kar
unki
Disc
harg
e (m
3 s-1) (
loga
rithm
ic sc
ale)
3179
430
(Torn
e)1
10
100
1000
10000
58
QavQmaxQmin
Popu
latio
n (in
ten
thou
sand
s)
0
1
2
3
4
5
Swed
enNo
rway
Finlan
d
3.9
0.0
4.1
Country information/otherLandScanTM
2%4%3%
Cultivated (<1%)
Urban/Industrial areas (<1%)Surface with little or no vegetation
ForestGrassland/ShrublandWater bodiesWetlands
59%32%
Others
DiSChARgeS, popuLATion AnD LAnD CoveR in The ToRne RiveR BASin
348 | part iv Chapter 8 Drainage basin of the baltic sea | 349

Hydrology and hydrogeologyIn the Finnish part of the basin, surface water resources are esti-mated at 13.56 km3/year (average for the years 1991 to 2005), and groundwater resources at 0.155 km3/year. These add up to a total of 13.72 m3/year, which equals 350,900 m3/year/capita.
There are two dams on the Torne’s tributaries: one on the Tengeliönjoki River (Finland) and the second on the Puostijoki River (Sweden).
Transboundary groundwaters are irrelevant water resources in the basin.
PressuresThe total water withdrawal in the Finnish part of the basin is 0.971 × 10⁶ m3/year (in 2007), and in the Swedish part 0.54 × 10⁶ m3/year (provided by public waterworks).
Pressures of local and moderate influence in the river basin are spring floods and ice jams, which can cause severe damages. Point sources and urban wastewater treatment plants cause the main nitrogen and phosphorus load. Hydropower generation is report-ed as pressure in both Finland and Sweden. There are three hy-dropower stations on the Finnish side and three regulated lakes in the Tengeliönjoki sub-basin. On the Swedish side, there are two hydropower stations in the Puostijoki River and one in the Torni-onjoki main channel in Pajala (the river has not, however, been dammed up). The main non-point pollution sources are — with the calculated nitrogen load for 2001-2006 in parentheses — for-estry (54,800 kg/year), scattered settlements and summer houses (36,600 kg/year), background pollution and wet deposition. The calculated nitrogen load from urban wastewater treatment plants is calculated to be 49,000 kg/year. Regarding phosphorus, 77% of the phosphorus transport is from natural background sources, and only 13% from anthropogenic sources — 10% originates from wet deposits.
The basin area is mainly forest (92% in Finland and some 60% in Sweden). There are 9 Natura 2000 areas (total surface area 5,962 km2), including relevant water areas. The main river chan-nel and nearly all tributaries are included in Natura 2000. There are three Ramsar Sites: Lätäsjoen-Hietajoen suot, Teuravuoma-Kivijärvenvuoma, and Kainuunkylän saaret.
Status and transboundary impacts The transboundary impact is currently insignificant, most of the nutrients transported to the rivers originate from the background and from non-point sources.
Pollution from municipal wastewater plants will be eliminated by their renovation by the end of 2015, according to the Programme of Measures.
Responses and transboundary cooperationIn addition to national legislation, the Water Protection Policy Out-lines to 2015 of Finland (approved in 2006) provides the framework and defines the basic principles and measures for improving water quality. The Finnish-Swedish Border River Commission plays a very important role in coordinating activities in the transboundary area of Torne River Basin. The main tasks of the Commission are the following: (1) to harmonize programmes, plans and measures that aim at reaching the status objectives and monitoring the status of the water environment, (2) plans for preventing damage caused by floods and other environmental damage, and (3) work concern-ing nature conservation plans. The Commission is the organization
confirming or rejecting plans or programmes for the river basin dis-trict. There are three members in the Commission from each State, one representing the State authority responsible for the water issues, one representing the municipalities and one representing business.
River Basin Management Plans for the Finnish and Swedish parts of the Torne River Basin for the years 2009-2015 were approved in December 2009 by the Finnish Government, and by the Both-nian Bay District Water Authority in Sweden. Water management work has been harmonized to some extent; including, for example, the division and status classification of the common water bod-ies. Joint measures and a joint summary of Finnish and Swedish RBMPs were produced and included in the plans. A joint forum for discussion and information sharing, "Torne River Water Parlia-ment", was established in order to share and get information from stakeholders and local people from both sides of the river.
The two Finnish-Swedish River Torne International Watershed projects (TRIWA I 2003-2006 and TRIWA II 2006-2008) have produced, for example, a common typology for surface waters, and a suggestion for a joint monitoring programme of the eco-logical status of surface water bodies and evaluation of related biological tools. Transboundary cooperation continues in the In-terreg “Forestry impact and water management in Torne River International River Basin” project (2011-2013).
TrendsIn the northern parts of Finland and Sweden, it is predicted that the climate change could result in an increase of 1.5–4.0 ºC in annual mean temperature, and a 4–12 % increase in annual pre-cipitation in the next 50 years. Changes in seasonal hydrological discharge are predicted to range from -5% to +10/+25%,3 de-pending on the area. In general, the frequency of spring floods may increase, and floods can cause, for example, overflows of tre-atment plants. Groundwater level may increase in winter time and decline in summer time.
The implementation of additional measures related to adaptation to climate change and its impact on water resources and water-dependent sectors has been started. The Flood Risk Management Plans for 2015-2020 will include different scenarios, and a vul-nerability assessment for the basin. Measures are being planned for specific sectors, to increase resilience and prevention and pre-paredness measures.
Currently the Torne is of high/good ecological and chemical sta-tus. The ongoing slow eutrophication process may cause changes in the future, especially in the biota of the river.
KemijoKi river Basin4
The major part of the Kemijoki River Basin is in Finland’s terri-tory; only very small parts of headwater areas are in the Russian Federation and in Norway. The Kemijoki River discharges into the Baltic Sea.
Basin of the Kemijoki River Country Area in the country (km2) Country’s share (%)Finland 49 467a 96.8Russian Federation 1 633 3.2
Norway 27 0.05
Total 51 127Sources: Lapland Regional Environment Centre, Finland
3 A larger precipitation increase is expected in the mountain areas in the western part. At least 25% increase is expected in most model scenarios according to Sweden.4 Based on information provided by Finland and the Russian Federation, and the First Assessment.
350 | part iv
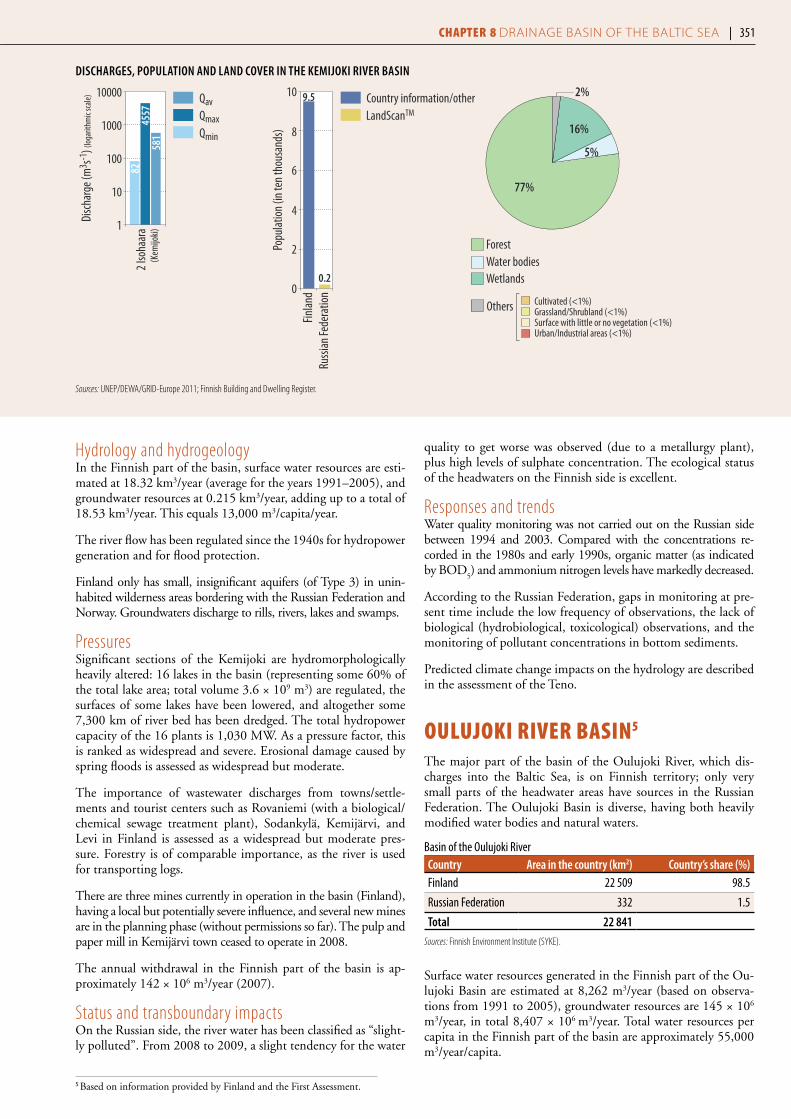
Hydrology and hydrogeologyIn the Finnish part of the basin, surface water resources are esti-mated at 18.32 km3/year (average for the years 1991–2005), and groundwater resources at 0.215 km3/year, adding up to a total of 18.53 km3/year. This equals 13,000 m3/capita/year.
The river flow has been regulated since the 1940s for hydropower generation and for flood protection.
Finland only has small, insignificant aquifers (of Type 3) in unin-habited wilderness areas bordering with the Russian Federation and Norway. Groundwaters discharge to rills, rivers, lakes and swamps.
PressuresSignificant sections of the Kemijoki are hydromorphologically heavily altered: 16 lakes in the basin (representing some 60% of the total lake area; total volume 3.6 × 10⁹ m3) are regulated, the surfaces of some lakes have been lowered, and altogether some 7,300 km of river bed has been dredged. The total hydropower capacity of the 16 plants is 1,030 MW. As a pressure factor, this is ranked as widespread and severe. Erosional damage caused by spring floods is assessed as widespread but moderate.
The importance of wastewater discharges from towns/settle-ments and tourist centers such as Rovaniemi (with a biological/chemical sewage treatment plant), Sodankylä, Kemijärvi, and Levi in Finland is assessed as a widespread but moderate pres-sure. Forestry is of comparable importance, as the river is used for transporting logs.
There are three mines currently in operation in the basin (Finland), having a local but potentially severe influence, and several new mines are in the planning phase (without permissions so far). The pulp and paper mill in Kemijärvi town ceased to operate in 2008.
The annual withdrawal in the Finnish part of the basin is ap-proximately 142 × 106 m3/year (2007).
Status and transboundary impactsOn the Russian side, the river water has been classified as “slight-ly polluted”. From 2008 to 2009, a slight tendency for the water
quality to get worse was observed (due to a metallurgy plant), plus high levels of sulphate concentration. The ecological status of the headwaters on the Finnish side is excellent.
Responses and trendsWater quality monitoring was not carried out on the Russian side between 1994 and 2003. Compared with the concentrations re-corded in the 1980s and early 1990s, organic matter (as indicated by BOD
5) and ammonium nitrogen levels have markedly decreased.
According to the Russian Federation, gaps in monitoring at pre-sent time include the low frequency of observations, the lack of biological (hydrobiological, toxicological) observations, and the monitoring of pollutant concentrations in bottom sediments.
Predicted climate change impacts on the hydrology are described in the assessment of the Teno.
oulujoKi river Basin5
The major part of the basin of the Oulujoki River, which dis-charges into the Baltic Sea, is on Finnish territory; only very small parts of the headwater areas have sources in the Russian Federation. The Oulujoki Basin is diverse, having both heavily modified water bodies and natural waters.
Basin of the Oulujoki River Country Area in the country (km2) Country’s share (%)Finland 22 509 98.5
Russian Federation 332 1.5
Total 22 841Sources: Finnish Environment Institute (SYKE).
Surface water resources generated in the Finnish part of the Ou-lujoki Basin are estimated at 8,262 m3/year (based on observa-tions from 1991 to 2005), groundwater resources are 145 × 106 m3/year, in total 8,407 × 106 m3/year. Total water resources per capita in the Finnish part of the basin are approximately 55,000 m3/year/capita.
5 Based on information provided by Finland and the First Assessment.
2 Iso
haar
a
Disch
arge
(m3 s-1
) (log
arith
mic
scale)
4557
581
(Kem
ijoki)
1
10
100
1000
10000
82
QavQmaxQmin
0
2
4
6
8
10
Russ
ian Fe
dera
tion
Finlan
d
9.5
0.2
Country information/otherLandScanTM
Popu
latio
n (in
ten
thou
sand
s)
2%
Cultivated (<1%)Grassland/Shrubland (<1%)
Urban/Industrial areas (<1%)Surface with little or no vegetation (<1%)
77%
5%
16%
ForestWater bodies
Others
Wetlands
DiSChARgeS, popuLATion AnD LAnD CoveR in The kemijoki RiveR BASin
Sources: UNEP/DEWA/GRID-Europe 2011; Finnish Building and Dwelling Register.
350 | part iv Chapter 8 Drainage basin of the baltic sea | 351

PressuresThe total withdrawal in the Finnish side of the basin is 145 × 106 m3/year.
Agriculture, which is concentrated on the lower reaches of the basin, has a major impact on water quality, with an estimated loading of some 60 tons per year of phosphorus and 813 tons per year of nitrogen in the Finnish part.
Forestry and, possibly locally, also peat production, have an im-pact on the ecology, especially in small upstream lakes and rivers.
A large pulp and paper mill located on Lake Oulujärvi had an impact on water quality and ecology in its vicinity, but its extent was reduced thanks to pollution control in the past decades and the mill ceased activities in 2009.
There are seventeen hydropower plants in the Finnish part of the river, which have significantly impacted the river system. One hy-dropower plant has a fish ladder. Some 1,700 km of the riverbed has been dredged for timber floating.
Status and transboundary impactsAccording to the ecological classification of the Oulujoki River system in 2009, the ecological status of the Oulujärvi Lake was good. Kiantajärvi and Ontojärvi Lakes in the upstream in the Finnish part, as well as Oulujoki River downstream from Lake Oulujärvi, have been classified as heavily modified water bodies.
At the Finnish-Russian border, the river is in a good status and there is no transboundary impact.
Responses The Finnish-Norwegian Commission on boundary water-courses operates on the basis of a bilateral agreement dating from 1980.
Trends According to Finland, a set of climate change scenarios suggests an increase of 2.3–3.7 ºC in annual mean temperature, and an 8–13% increase in annual precipitation in the forthcoming 50
years. The frequency of winter floods may increase, but that of spring floods may decrease. Moreover, annual run-off may de-crease due to increased evaporation in large lakes. Possibilities of heavy rain floods even in summer time may increase, especially in small river systems. Flooding can cause overflows in treatment plants or problems with water abstraction, affecting also water quality. Groundwater level may increase in winter, and decline in summer. Reduced groundwater recharge may cause oxygen de-pletion in small groundwater bodies, and consequently increased metal concentrations in groundwater (e.g., iron, manganese).
jänisjoKi river Basin6
Finland and the Russian Federation share the basin of the Jänis-joki River. The river originates in Finland and its final recipient in the Baltic Sea basin is Lake Ladogaf in the Russian Federation. The Juvanjoki tributary joins the Jänisjoki from the Russian side near the Finnish-Russian border.
Basin of the Jänisjoki River Country Area in the country (km2) Country’s share (%)Finland 1 988 51.5
Russian Federation 1 873 48.5
Total 3 861Sources: Finnish Environment Institute (SYKE).
Hydrology and hydrogeologyIn the Finnish part of the basin, surface water resources are esti-mated to amount to 520.3 × 10⁶ m3/year (average for the years 1991–2005), and groundwater resources to 21.39 × 10⁶ m3/year, adding up to a total of 541.7 × 10⁶ m3/year (or about 97,000 per/capita/year). In the Russian part, the surface water resources are estimated at 1,320 × 106 m3/year (of which transboundary flow is estimated to be 680 × 106 m3/year).
The discharge of the river fluctuates considerably. During low precipitation seasons, water levels can be very low. The discharge figures for the decade from 1991 to 2000 indicate an increase
DiSChARgeS, popuLATion AnD LAnD CoveR in The ouLujoki RiveR BASin
Sources: UNEP/DEWA/GRID-Europe 2011; Finnish Building and Dwelling Register.Note: Population in the Russian part of the basin is less than 200 (LandScan).
3 Mer
ikosk
i
Disch
arge
(m3 s-1
) (log
arith
mic
scale)
262
(Oulu
joki)1
10
100
1000 QavQmaxQmin
848
25
0
5
10
15
20
Russ
ian Fe
dera
tion
Finlan
d
15.3
0.0
Country information/otherLandScanTM
Popu
latio
n (in
ten t
hous
ands
)
2% 1%
2%
Grassland/Shrubland (<1%)Surface with little or no vegetation (<1%)
73%
12%
10%
CultivatedForestUrban/Industrial areas
Others
Water bodiesWetlands
6 Based on information provided by Finland and the Russian Federation, and the First Assessment.
352 | part iv

2
1
3
4
St. Petersburg
Vyborg
Bay of V
yborg
Vuoksi
Hiitolanjoki
KiteenjokiTohmajoki
Jänisjoki
LakeSaimaa
LakePyhäjärvi
LakeJänisjärvi
LakeNuijamaanjärvi
La
ke
L
ad
og
a
Kotajoki
1 Vaalimaanjoki2 Urpalanjoki3 Kaltonjoki4 Vilajoki5 Tervajoki6 Hounijoki7 Rakkolanjoki8 Mustajoki9 Saimaa Canal10 Soskuanjoki11 Juustilanjoki
1
2
3
45
6
7
8
910
G U L F O F F I N L A N D
11
R U S S I A N
F E D E R A T I O N
F I N L A N D
60o
30o UNEP/DEWA/GRID-Geneva 2011The boundaries and names shown and the designations used on this mapdo not imply official endorsement or acceptance by the United Nations.
0 10 20 30 40 50Kilometres
Sources: UNEP/DEWA/GRID-Europe 2011; Long-term data on the status and resources of surface waters, Vol.1 Issue. 5, Gidrometizdat, Leningrad. 1986. Finnish Building and Dwelling Register.
352 | part iv Chapter 8 Drainage basin of the baltic sea | 353
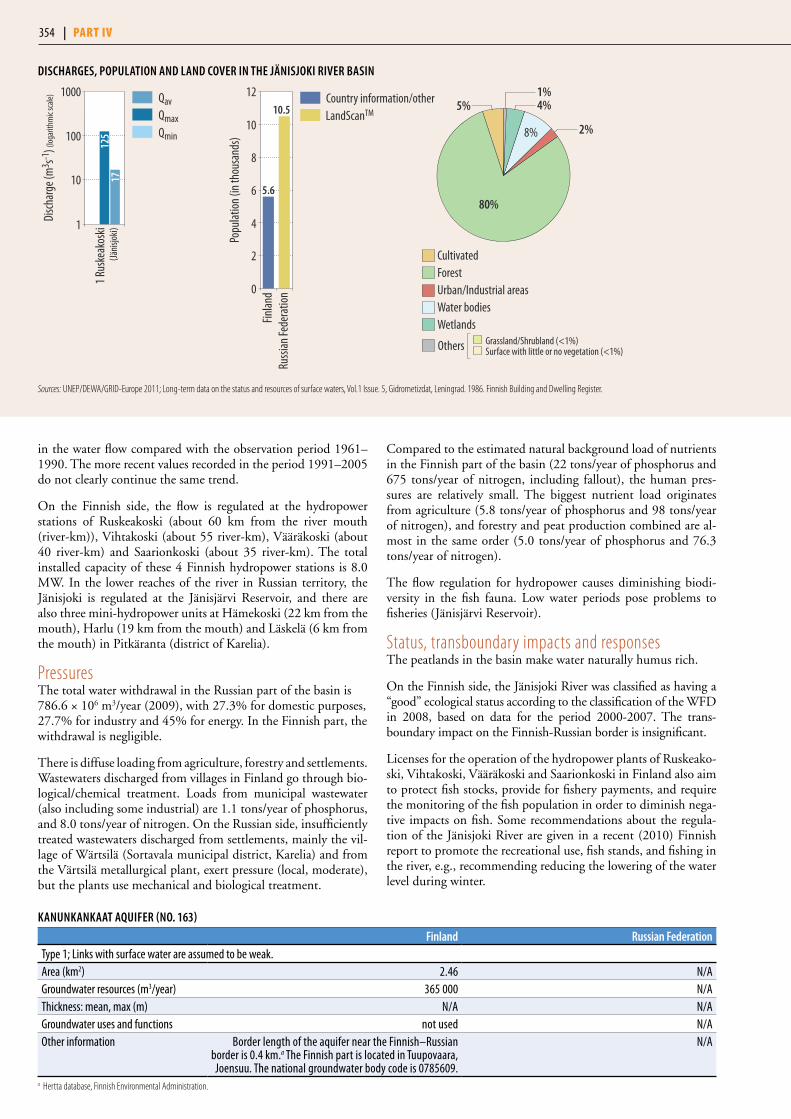
in the water flow compared with the observation period 1961–1990. The more recent values recorded in the period 1991–2005 do not clearly continue the same trend.
On the Finnish side, the flow is regulated at the hydropower stations of Ruskeakoski (about 60 km from the river mouth (river-km)), Vihtakoski (about 55 river-km), Vääräkoski (about 40 river-km) and Saarionkoski (about 35 river-km). The total installed capacity of these 4 Finnish hydropower stations is 8.0 MW. In the lower reaches of the river in Russian territory, the Jänisjoki is regulated at the Jänisjärvi Reservoir, and there are also three mini-hydropower units at Hämekoski (22 km from the mouth), Harlu (19 km from the mouth) and Läskelä (6 km from the mouth) in Pitkäranta (district of Karelia).
Pressures The total water withdrawal in the Russian part of the basin is 786.6 × 10⁶ m3/year (2009), with 27.3% for domestic purposes, 27.7% for industry and 45% for energy. In the Finnish part, the withdrawal is negligible.
There is diffuse loading from agriculture, forestry and settlements. Wastewaters discharged from villages in Finland go through bio-logical/chemical treatment. Loads from municipal wastewater (also including some industrial) are 1.1 tons/year of phosphorus, and 8.0 tons/year of nitrogen. On the Russian side, insufficiently treated wastewaters discharged from settlements, mainly the vil-lage of Wärtsilä (Sortavala municipal district, Karelia) and from the Värtsilä metallurgical plant, exert pressure (local, moderate), but the plants use mechanical and biological treatment.
Compared to the estimated natural background load of nutrients in the Finnish part of the basin (22 tons/year of phosphorus and 675 tons/year of nitrogen, including fallout), the human pres-sures are relatively small. The biggest nutrient load originates from agriculture (5.8 tons/year of phosphorus and 98 tons/year of nitrogen), and forestry and peat production combined are al-most in the same order (5.0 tons/year of phosphorus and 76.3 tons/year of nitrogen).
The flow regulation for hydropower causes diminishing biodi-versity in the fish fauna. Low water periods pose problems to fisheries (Jänisjärvi Reservoir).
Status, transboundary impacts and responsesThe peatlands in the basin make water naturally humus rich.
On the Finnish side, the Jänisjoki River was classified as having a “good” ecological status according to the classification of the WFD in 2008, based on data for the period 2000-2007. The trans-boundary impact on the Finnish-Russian border is insignificant.
Licenses for the operation of the hydropower plants of Ruskeako-ski, Vihtakoski, Vääräkoski and Saarionkoski in Finland also aim to protect fish stocks, provide for fishery payments, and require the monitoring of the fish population in order to diminish nega-tive impacts on fish. Some recommendations about the regula-tion of the Jänisjoki River are given in a recent (2010) Finnish report to promote the recreational use, fish stands, and fishing in the river, e.g., recommending reducing the lowering of the water level during winter.
DiSChARgeS, popuLATion AnD LAnD CoveR in The jäniSjoki RiveR BASin
Sources: UNEP/DEWA/GRID-Europe 2011; Long-term data on the status and resources of surface waters, Vol.1 Issue. 5, Gidrometizdat, Leningrad. 1986. Finnish Building and Dwelling Register.
1 Rus
keak
oski
Disch
arge
(m3 s-1
) (log
arith
mic
scale)
125
17(Jä
nisjok
i)1
10
100
1000 QavQmaxQmin
Popu
latio
n (in
thou
sand
s)
0
2
4
6
8
10
12
Russ
ian Fe
dera
tion
Finlan
d
10.5
5.6
Country information/otherLandScanTM
5%1%4%
2%
Grassland/Shrubland (<1%)Surface with little or no vegetation (<1%)
80%
8%
CultivatedForestUrban/Industrial areasWater bodiesWetlands
Others
kAnunkAnkAAT AquifeR (no. 163)
finland Russian federationType 1; Links with surface water are assumed to be weak.Area (km2) 2.46 N/AGroundwater resources (m3/year) 365 000 N/AThickness: mean, max (m) N/A N/AGroundwater uses and functions not used N/AOther information Border length of the aquifer near the Finnish–Russian
border is 0.4 km.a The Finnish part is located in Tuupovaara, Joensuu. The national groundwater body code is 0785609.
N/A
a Hertta database, Finnish Environmental Administration.
354 | part iv

In addition to regular surface water quality monitoring, benthic invertebrate fauna, phytobenthos and fish fauna are monitored in Finland, and water levels in the two regulated lakes. On the Russian side, the water quality monitoring is only oriented to-wards surveying the water abstractions for the water supply in Harlu, and surveying potential pollution downstream from the Värtsilä metallurgical plant. Discharges are continuously moni-tored at the Finnish power stations. Among the reported gaps in monitoring transboundary waters in Finland are the need for more intensive monitoring of biota for several rivers and lakes according to the WFD, and the extension of monitoring of water quality and biota to some additional small rivers and lakes with water surface area exceeding 50 ha (44 in the basin), but this is subject to sufficiency of national monitoring resources.
The Jänisjoki River is covered by the 1964 agreement on “fron-tier watercourses” between the riparian countries, and by the work of the Joint Commission operating on that basis.
TrendsA set of climate change scenarios developed in Finland suggests an increase of 2.3–3.7 ºC in annual mean temperature, and an 8–13 % increase in annual precipitation in the forthcoming 50 years. Winter floods may occur more frequently, but spring floods may decrease. Annual run-off is predicted to decrease due to increased evaporation in large lakes. The possibility of heavy rain floods is expected to increase, especially in small river systems.
KiteenjoKi and tohmajoKi river Basins7
Finland and the Russian Federation share the basin of the Kiteen-joki and Tohmajoki rivers. The Kiteenjoki River (length 80 km) originates from Lake Kiteenjärvi, flows via Lake Hyypii and Lake Lautakko (Finland) into the transboundary Lake Kangasjärvi, and then in the Russian Federation though several lakes (Lake Hympölänjärvi, Lake Karmalanjärvi) into the Tohmajoki River,
close to where it runs into Lake Ladoga. The 74-km long Tohma-joki River discharges from Lake Tohmajärvi, and runs through the small, transboundary Lake Rämeenjärvi and the small Rus-sian Pälkjärvi and Ruokojärvi Lakes to Lake Ladoga in the Rus-sian Federation.
Basin of the Kiteenjoki and Tohmajoki Rivers Country Area in the country (km2) Country’s share (%)Finland 759.8 48
Russian Federation 834.8 52
Total 1 594
Sources: Finnish Environment Institute (SYKE).
Surface water resources generated in the Finnish part of Kiteen-joki and Tohmajoki Basins are estimated at 113.5 × 10⁶ m3/year (1991 to 2005), groundwater resources are 25.57 × 10⁶ m3/year, in total 139.1 × 10⁶ m3/year. This makes total water resources per capita in the basin amount to about 14,000 m3/year/capita.
PressuresWater withdrawal in the Finnish part of the basin is negligible.
There is diffuse pollution from agriculture and forestry. A small dairy is situated near Lake Hyypii, but its wastewaters are used as sprinkler irrigation for agricultural fields during the growing season. According to nutrient load estimates, only agriculture is of the same order as the natural background of phosphorus, and even for agriculture the nitrogen load is substantially lower than the natural background. The nutrient loads from settlements, industries, forestry and peat production are quantified as minor.
Lake Tohmajärvi, the outflow of the Tohmajoki River, receives wastewater from the sewage treatment plant of the Tohmajärvi municipality. In the Kiteenjoki River Basin, the wastewater treat-ment plant of Kitee discharges its waters into Lake Kiteenjärvi. In the Russian part of the basin, discharges of insufficiently treat-ed wastewaters are a pressure factor. Mechanical and biological treatment is applied.
DiSChARgeS AnD popuLATion in The TohmAjoki RiveR BASin
Sources: UNEP/DEWA/GRID-Europe 2011; Kiteenjoki Source: Surface water resources in the USSR ", Volume 2, Part 1, Leningrad, Gidrometizdat, 1972; Tohmajoki : Long-term data on the regime and resources of surface water, Leningrad, Gidrometizdat, 1986; Finnish Building and Dwelling Register (population data).
Popu
latio
n (in
thou
sand
s)
0
4
8
12
16
Russ
ian Fe
dera
tion
Finlan
d
14.3
10.0
Country information/otherLandScanTM
2 Kon
tturi
Disch
arge
(m3 s-1
) (log
arith
mic
scale)
415
0.8
(Kite
enjok
i)0.1
1
10
100 QavQmaxQmin
7 Based on information provide by Finland and the Russian Federation, and the First Assessment.
354 | part iv Chapter 8 Drainage basin of the baltic sea | 355
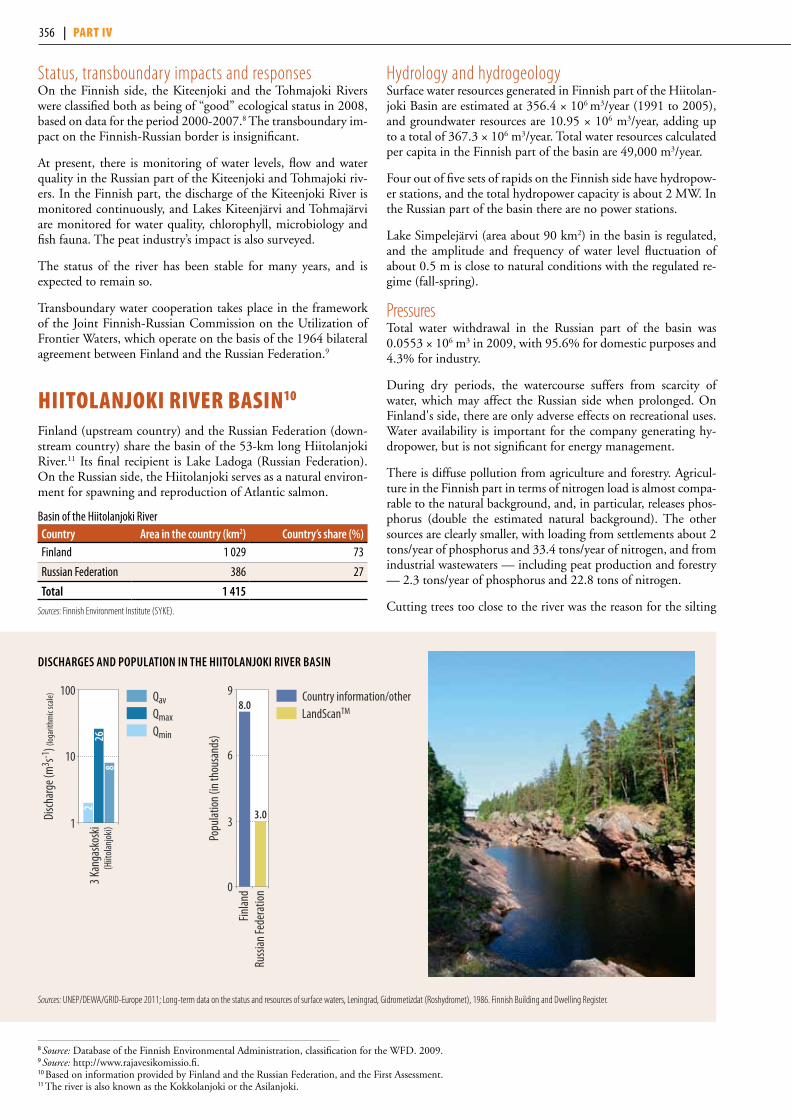
Status, transboundary impacts and responsesOn the Finnish side, the Kiteenjoki and the Tohmajoki Rivers were classified both as being of “good” ecological status in 2008, based on data for the period 2000-2007.8 The transboundary im-pact on the Finnish-Russian border is insignificant.
At present, there is monitoring of water levels, flow and water quality in the Russian part of the Kiteenjoki and Tohmajoki riv-ers. In the Finnish part, the discharge of the Kiteenjoki River is monitored continuously, and Lakes Kiteenjärvi and Tohmajärvi are monitored for water quality, chlorophyll, microbiology and fish fauna. The peat industry’s impact is also surveyed.
The status of the river has been stable for many years, and is expected to remain so.
Transboundary water cooperation takes place in the framework of the Joint Finnish-Russian Commission on the Utilization of Frontier Waters, which operate on the basis of the 1964 bilateral agreement between Finland and the Russian Federation.9
hiitolanjoKi river Basin10
Finland (upstream country) and the Russian Federation (down-stream country) share the basin of the 53-km long Hiitolanjoki River.11 Its final recipient is Lake Ladoga (Russian Federation). On the Russian side, the Hiitolanjoki serves as a natural environ-ment for spawning and reproduction of Atlantic salmon.
Basin of the Hiitolanjoki River Country Area in the country (km2) Country’s share (%)Finland 1 029 73
Russian Federation 386 27
Total 1 415Sources: Finnish Environment Institute (SYKE).
Hydrology and hydrogeologySurface water resources generated in Finnish part of the Hiitolan-joki Basin are estimated at 356.4 × 10⁶ m3/year (1991 to 2005), and groundwater resources are 10.95 × 10⁶ m3/year, adding up to a total of 367.3 × 10⁶ m3/year. Total water resources calculated per capita in the Finnish part of the basin are 49,000 m3/year.
Four out of five sets of rapids on the Finnish side have hydropow-er stations, and the total hydropower capacity is about 2 MW. In the Russian part of the basin there are no power stations.
Lake Simpelejärvi (area about 90 km2) in the basin is regulated, and the amplitude and frequency of water level fluctuation of about 0.5 m is close to natural conditions with the regulated re-gime (fall-spring).
PressuresTotal water withdrawal in the Russian part of the basin was 0.0553 × 10⁶ m3 in 2009, with 95.6% for domestic purposes and 4.3% for industry.
During dry periods, the watercourse suffers from scarcity of water, which may affect the Russian side when prolonged. On Finland's side, there are only adverse effects on recreational uses. Water availability is important for the company generating hy-dropower, but is not significant for energy management.
There is diffuse pollution from agriculture and forestry. Agricul-ture in the Finnish part in terms of nitrogen load is almost compa-rable to the natural background, and, in particular, releases phos-phorus (double the estimated natural background). The other sources are clearly smaller, with loading from settlements about 2 tons/year of phosphorus and 33.4 tons/year of nitrogen, and from industrial wastewaters — including peat production and forestry — 2.3 tons/year of phosphorus and 22.8 tons of nitrogen.
Cutting trees too close to the river was the reason for the silting
DiSChARgeS AnD popuLATion in The hiiToLAnjoki RiveR BASin
Sources: UNEP/DEWA/GRID-Europe 2011; Long-term data on the status and resources of surface waters, Leningrad, Gidrometizdat (Roshydromet), 1986. Finnish Building and Dwelling Register.
8 Source: Database of the Finnish Environmental Administration, classification for the WFD. 2009. 9 Source: http://www.rajavesikomissio.fi.10 Based on information provided by Finland and the Russian Federation, and the First Assessment.11 The river is also known as the Kokkolanjoki or the Asilanjoki.
3 Kan
gask
oski
Disch
arge
(m3 s-1
) (log
arith
mic
scale)
826
2
(Hiit
olanjo
ki)
1
10
100 QavQmaxQmin
Popu
latio
n (in
thou
sand
s)
0
3
6
9
Russ
ian Fe
dera
tion
Finlan
d
8.0
3.0
Country information/otherLandScanTM
356 | part iv
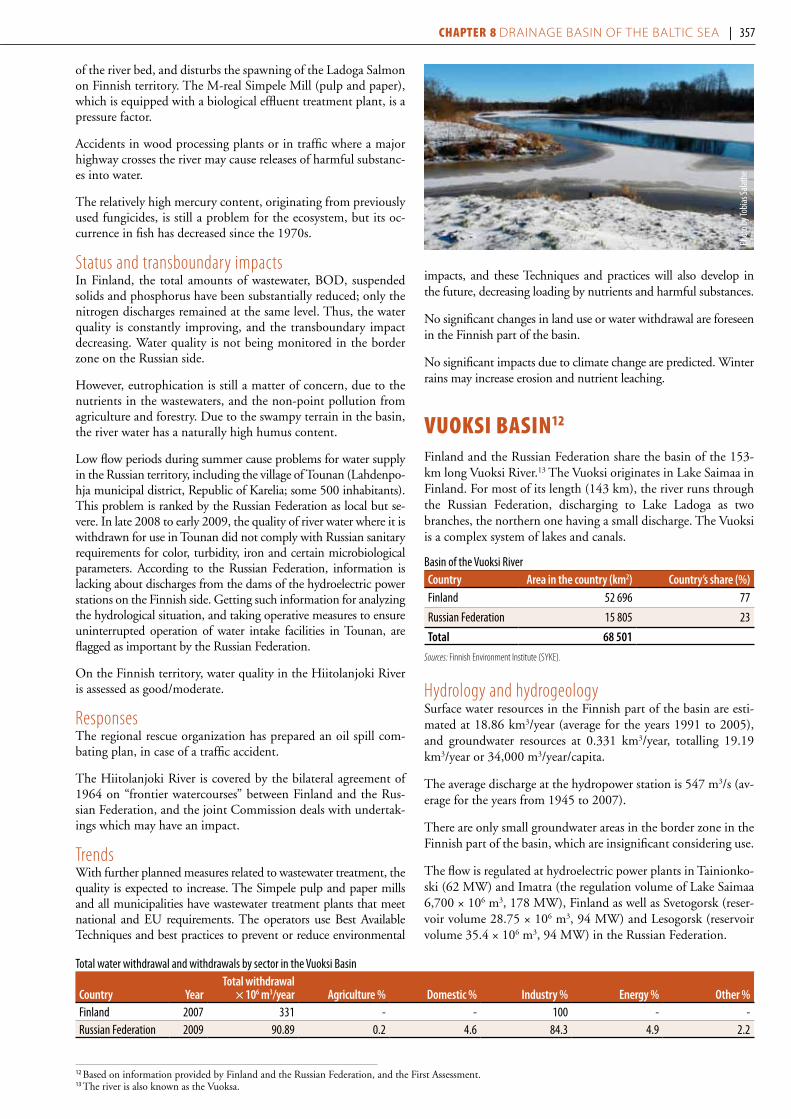
of the river bed, and disturbs the spawning of the Ladoga Salmon on Finnish territory. The M-real Simpele Mill (pulp and paper), which is equipped with a biologi cal effluent treatment plant, is a pressure factor.
Accidents in wood processing plants or in traffic where a major highway crosses the river may cause releases of harmful substanc-es into water.
The relatively high mercury content, originating from previ ously used fungicides, is still a problem for the ecosystem, but its oc-currence in fish has decreased since the 1970s.
Status and transboundary impacts In Finland, the total amounts of wastewater, BOD, suspended solids and phosphorus have been substantially reduced; only the nitrogen discharges remained at the same level. Thus, the water quality is constantly improving, and the transboundary impact decreasing. Water quality is not being monitored in the border zone on the Russian side.
However, eutrophication is still a matter of concern, due to the nutrients in the wastewaters, and the non-point pollution from agriculture and forestry. Due to the swampy terrain in the basin, the river water has a naturally high humus content.
Low flow periods during summer cause problems for water supply in the Russian territory, including the village of Tounan (Lahdenpo-hja municipal district, Republic of Karelia; some 500 inhabitants). This problem is ranked by the Russian Federation as local but se-vere. In late 2008 to early 2009, the quality of river water where it is withdrawn for use in Tounan did not comply with Russian sanitary requirements for color, turbidity, iron and certain microbiological parameters. According to the Russian Federation, information is lacking about discharges from the dams of the hydroelectric power stations on the Finnish side. Getting such information for analyzing the hydrological situation, and taking operative measures to ensure uninterrupted operation of water intake facilities in Tounan, are flagged as important by the Russian Federation.
On the Finnish territory, water quality in the Hiitolanjoki River is assessed as good/moderate.
Responses The regional rescue organization has prepared an oil spill com-bating plan, in case of a traffic accident.
The Hiitolanjoki River is covered by the bilateral agreement of 1964 on “frontier watercourses” between Finland and the Rus-sian Federation, and the joint Commission deals with undertak-ings which may have an impact.
Trends With further planned measures related to wastewater treatment, the quality is expected to increase. The Simpele pulp and paper mills and all municipalities have wastewater treatment plants that meet national and EU requirements. The operators use Best Available Techniques and best practices to prevent or reduce environmental
impacts, and these Techniques and practices will also develop in the future, decreasing loading by nutrients and harmful substances.
No significant changes in land use or water withdrawal are foreseen in the Finnish part of the basin.
No significant impacts due to climate change are predicted. Winter rains may increase erosion and nutrient leaching.
vuoKsi Basin12
Finland and the Russian Federation share the basin of the 153-km long Vuoksi River.13 The Vuoksi originates in Lake Saimaa in Finland. For most of its length (143 km), the river runs through the Russian Federation, discharging to Lake Ladoga as two branches, the northern one having a small discharge. The Vuoksi is a complex system of lakes and canals.
Basin of the Vuoksi River Country Area in the country (km2) Country’s share (%)Finland 52 696 77
Russian Federation 15 805 23
Total 68 501
Sources: Finnish Environment Institute (SYKE).
Hydrology and hydrogeologySurface water resources in the Finnish part of the basin are esti-mated at 18.86 km3/year (average for the years 1991 to 2005), and groundwater resources at 0.331 km3/year, totalling 19.19 km3/year or 34,000 m3/year/capita.
The average discharge at the hydropower station is 547 m3/s (av-erage for the years from 1945 to 2007).
There are only small groundwater areas in the border zone in the Finnish part of the basin, which are insignificant considering use.
The flow is regulated at hydroelectric power plants in Tainionko-ski (62 MW) and Imatra (the regulation volume of Lake Saimaa 6,700 × 106 m3, 178 MW), Finland as well as Svetogorsk (reser-voir volume 28.75 × 10⁶ m3, 94 MW) and Lesogorsk (reservoir volume 35.4 × 10⁶ m3, 94 MW) in the Russian Federation.
12 Based on information provided by Finland and the Russian Federation, and the First Assessment.13 The river is also known as the Vuoksa.
Total water withdrawal and withdrawals by sector in the Vuoksi Basin
Country YearTotal withdrawal
× 106 m3/year Agriculture % Domestic % industry % energy % other %Finland 2007 331 - - 100 - -Russian Federation 2009 90.89 0.2 4.6 84.3 4.9 2.2
Phot
o by T
obias
Salat
he
356 | part iv Chapter 8 Drainage basin of the baltic sea | 357

PressuresEven though wastewater discharges from industry have decreased, they are still a pressure factor, ranked widespread and severe by the Russian Federation. The industrial facilities discharging into the Vuoksi in Finland are the pulp and paper mills of Stora Enso Oy Imatra, Metsä-Botnia Oy Joutseno and UMP Kaukas. All these have wastewater treatment plants; the latter two biologi-
cal plants. The wastewaters discharged from the Imatra Steel Oy steel plant are also treated. The nutrient load from industries in Finland is estimated at 27 tons/year of phosphorus, and 413 tons/year of nitrogen. Peat production and forestry add another 3.9 tons/year of phosphorus, and 57.2 tons/year of nitrogen.
Urban wastewaters from the cities of Imatra and Joutseno are
figuRe 1: Ecological status of surface waters in the Vuoksi Basin and nutrient loads (nitrogen and phosphorus) by source
National border
Catchment area
HighGoodModeratePoorBadNo data
0 10050Kilometres
© National land survey of Finland license no 7/MML/11
Nutrient loads by source
AgricultureForestry and peat production DepositionNatural washoutMunicipalities and scattered settlementIndustry
21% 4%
16% 21%
11%
28% 14%
2%
37% 23%
8%
16%
Ecological status of the surface waters
Phosphorus load 98 t/a Nitrogen load 2 580 t/a
DiSChARgeS, popuLATion AnD LAnD CoveR in The vuokSi BASin
Sources: UNEP/DEWA/GRID-Europe 2011; Finnish Building and Dwelling Register.
4 Tain
ionko
ski
Disch
arge
(m3 s-1
) (log
arith
mic
scale)
1160
584
(Vuo
ksi)1
10
100
1000
1000022
0QavQmaxQmin
0
1
2
3
4
5
6
Russ
ian Fe
dera
tion
Finlan
d
5.6
0.9
Country information/otherLandScanTM
Popu
latio
n (in
hun
dred
thou
sand
s)
5% 3%
3%
1%
Grassland/Shrubland (<1%)Surface with little or no vegetation (<1%)
70%
18%
CultivatedForestUrban/Industrial areas
Others
Water bodiesWetlands
Source: Finnish Environment Institute (SYKE), and the Centres for Development, Transport and the Environment of South-East Finland, South Savo, North Savo and North Karelia.
358 | part iv

1970 1975 1980 1985 1990 1995 2000 2005 2010
1970 1975 1980 1985 1990 1995 2000 2005 2010
1970 1975 1980 1985 1990 1995 2000 2005 2010
20
15
10
5
0
1200
1000
800
400
200
0
35
30
25
20
15
10
5
0
discharged to the river as treated. Nutrient load from settlements and other urban sources in Finland is estimated to be about 10.8 tons/year of phosphorus, and some 212.2 tons/year of nitrogen. In the city of Svetogorsk on the Russian side, household waste-waters are discharged through the biological treatment plant of the pulp and paper mill.
Nutrient load from agriculture in the Finnish part of the basin is estimated to be 21 tons/year of phosphorus, and 52 tons/year of nitrogen. Agriculture is extremely limited; cropland makes up less than 6% of the Finnish territory within the basin.
Shore areas are affected by flow regulation for hydropower generation.
Status and transboundary impactsMost of the water-quality problems in Finnish territory arise in the southern part of the river basin, in Lake Saimaa and in the outlet of the river basin. However, in 2009, 46% of the Vuoksi River was classified as “good”, and 43% as "excellent". The situ-
ation is reported to be stable, and even improving. On the Rus-sian side, the Vuoksi River was classified in 2009 according to the Russian classification system as “conditionally clean” in the upstream part, as “slightly polluted” further downstream in the southern and northern branches, and as “polluted” close to the mouth of northern branch (at 0.8 river-km).
In terms of organic matter, improvement of water quality from the levels in the 1970s to 1980s is indicated by a decrease of chemical oxygen demand in mid-1990s. The reason for this is improved effectiveness of wastewater treatment in Finland. After 2005, the production of pulp and paper factories increased, and together with it the loading, but not as much proportionally. Ni-trogen concentration has not varied significantly, even though it was at a slightly higher level in the 1980s and in the early 1990s. The phosphorus concentration decreased markedly in the latter half of the 1990s, and has since remained consistently at the same level (figure 2 below).
figuRe 2: Trends of selected determinands (chemical oxygen demand, COD; total nitrogen, N and total phosphorus, P) from 1970 to 2010 in the Vuoksi River in Finland
CODMn
mg/l moving average of 6 samples
Total P µg/l moving average of 6 samples
Total N µg/l moving average of 6 samples
358 | part iv Chapter 8 Drainage basin of the baltic sea | 359
ResponsesFinland strives to ensure that measures set out in the Water Framework Directive are implemented in transboundary river basins shared with the Russian Federation, including the Vuoksi.
A preparedness plan for oil spills in Lake Saimaa along the wa-terway through the Saimaa Canal connecting Finland-Russian waterways has been prepared as co-operative effort between the rescue departments in Finland and the Russian Federation.
The Discharge Rule of Lake Saimaa and the Vuoksi River (agree-ment of 1989), developed by the Joint Finnish-Russian Commis-sion on the Utilization of Frontier Waters, makes it possible to change discharge volumes rapidly and flexibly. Its implementa-tion is supervised by the Commission, to which the Parties re-port on implementation, discuss implications and, in some cases, agree on compensation.14
TrendsIn the Finnish part, increasing water use for recreation and the grow-ing number of holiday homes exert pressure on water resources.
In the Vuoksi area, several scenarios predict that the mean tem-perature will rise by 3-4 degrees, and yearly precipitation by 10-25 % by 2071-2100, relative to 1971-2000. The changes would be the greatest for the winter season. Thus, winter floods are ex-pected to become more severe in the Vuoksi Basin. Also extreme run-off events are projected to be more frequent. The timing of run-off will also change: maximum water levels in Lake Saimaa will be reached in March and April, instead of June and July as at present. The discharge of the Vuoksi River is likely to increase by 3-27%.
laKe pyhäjärvi15
Lake Pyhäjärvi in Karelia is part of the Vuoksi Basin. It is valuable for fishing, recreation, research and nature protection.
Basin of the Lake Pyhäjärvi Country Area in the country (km2) Country’s share (%)Finland 207 83Russian Federation 41 17Sub-total, lake surface area only
248
Finland 804 79Russian Federation 215 21Total 1019
There are anthropogenic pressures in the Finnish part (see the assessment of the Vuoksi), but the Russian part is in an almost natural state. In the Finnish part of the catchment area of the lake, the population is 2,800 (approximately 14 inhabitants/km2). The estimated nutrient load has been decreasing due to the closure of several sources, resulting in improvement in the status of the lake, indicated, for example, by a slight decrease in chlo-rophyll. During the recent very rainy years, surface water run-off from the adjacent areas slightly increased nutrient and chloro-phyll concentrations, and decreased water transparency (Secchi depth). Moreover, low nutrient status and low humus concentra-
tion make the lake vulnerable to nutrient loading. In 2008, the ecological status of Lake Pyhäjärvi is "excellent" according to the requirements of the WFD.
laKe saimaa16
The basin of Lake Saimaa is shared between Finland and the Rus-sian Federation.17
Lake Saimaa is used a lot for recreational activities and has the only, and very endangered, population of Saimaa ringed seal.
Basin of the Lake Saimaa Country Area in the country (km2) Country’s share (%)Finland 51 896 85
Russian Federation 9 158 15
Total 61 054Notes: These figures are for the catchment area of the whole Lake Saimaa water system.
The main nutrient load in Finland comes from diffuse sources, agriculture and forestry in particular. In the southernmost part of the lake, the pulp and paper industry impact on water qual-ity (see the assessment of the Vuoksi for details), even though improved wastewater treatment has substantially improved water quality in the area during the last two decades. The population in the catchment area of the whole Lake Saimaa water system that is Finnish territory is 564,000 (or 11 inhabitants/km2).
The ecological status of Lake Saimaa, according to the WFD, is “excellent”.
juustilanjoKi river Basin18
Finland and the Russian Federation share the basin of the Juusti-lanjoki River, which has its source in Lappee, Finland, runs through Lake Nuijamaanjärvi into Lake Juustila (Bol’shoye Zve-tochnoye) in the Russian Federation, and discharges to the bay of Vyborg (Baltic Sea). On the Finnish side, the Juustilanjoki Ba-sin includes the Mustajoki River, the catchment of the Kärkjärvi River, and part of the Saimaa Canal,19 including the Soskuanjoki River.
Basin of the Juustilanjoki River Country Area in the country (km2) Country’s share (%)Finland 178 60
Russian Federation 118 40
Total 296Source: The Joint Finnish-Russian Commission on the Utilization of Frontier Waters.
Hydrology and hydrogeologySurface water resources generated in the Finnish part of the Juusti-lanjoki Basin are estimated at 25.2 × 10⁶ m3/year, and groundwa-ter resources are 0.18 × 10⁶ m3/year, making up a total of 25.4 × 10⁶ m3/year (5,200 m3/year/capita). The average discharge of the Mustajoki River is 0.8 m3/s and of the Kärkisillanoja River 0.2 m3/s (determined by random measurements).
14 River basin commissions and other institutions for transboundary water cooperation, UNECE. 2009.15 Based on information provided by Finland and the First Assessment. 16 Based on information provided by Finland and the First Assessment. 17 As explained in the First Assessment, it is not clear which ones of the some 120 sub-basins on the same water level are included in Lake Saimaa. In many cases,
“Lake Saimaa” only refers to Lake Southern Saimaa (386 km2), a smaller part of the entire Lake Saimaa system/Lake Greater Saimaa (4,400 km2). 18 Based on information provided by Finland and the Russian Federation, as well as the First Assessment. 19 The Saimaa Canal and the Soskuanjoki River were identified as transboundary in the First Assessment.
360 | part iv
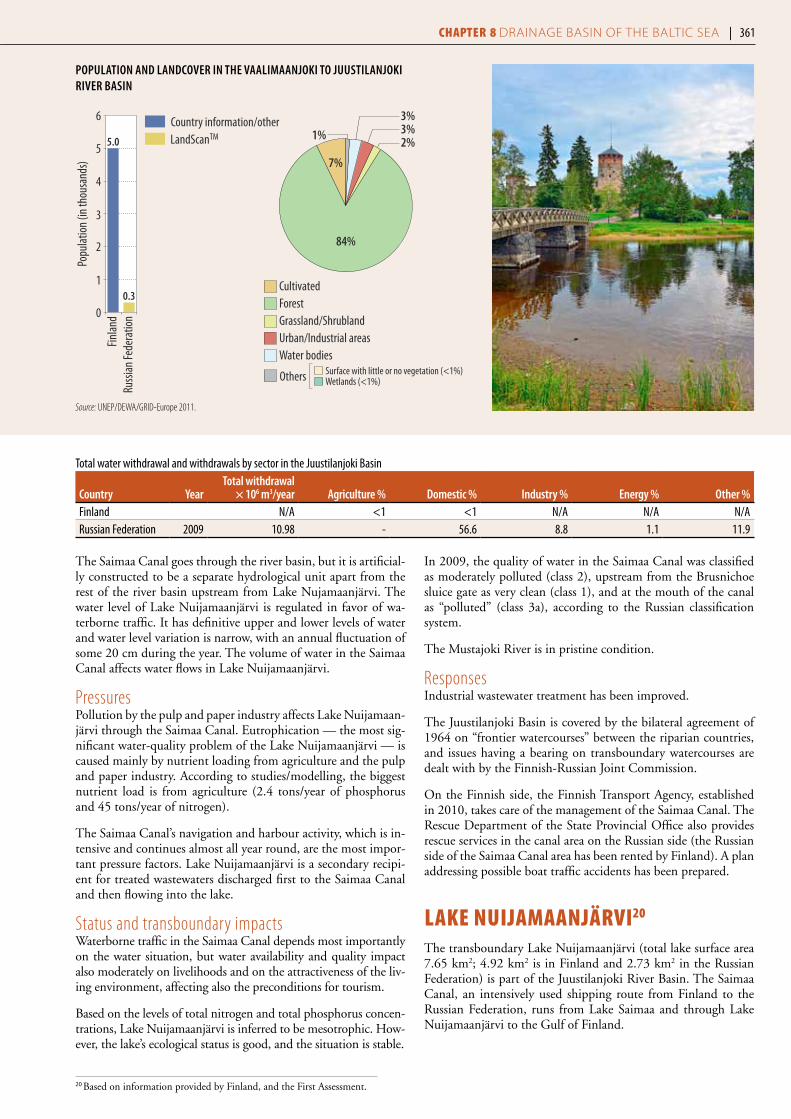
The Saimaa Canal goes through the river basin, but it is artificial-ly constructed to be a separate hydrological unit apart from the rest of the river basin upstream from Lake Nujamaanjärvi. The water level of Lake Nuijamaanjärvi is regulated in favor of wa-terborne traffic. It has definitive upper and lower levels of water and water level variation is narrow, with an annual fluctuation of some 20 cm during the year. The volume of water in the Saimaa Canal affects water flows in Lake Nuijamaanjärvi.
PressuresPollution by the pulp and paper industry affects Lake Nuijamaan-järvi through the Saimaa Canal. Eutrophication — the most sig-nificant water-quality problem of the Lake Nuijamaanjärvi — is caused mainly by nutrient loading from agriculture and the pulp and paper industry. According to studies/modelling, the biggest nutrient load is from agriculture (2.4 tons/year of phosphorus and 45 tons/year of nitrogen).
The Saimaa Canal’s navigation and harbour activity, which is in-tensive and continues almost all year round, are the most impor-tant pressure factors. Lake Nuijamaanjärvi is a secondary recipi-ent for treated wastewaters discharged first to the Saimaa Canal and then flowing into the lake.
Status and transboundary impacts Waterborne traffic in the Saimaa Canal depends most importantly on the water situation, but water availability and quality impact also moderately on livelihoods and on the attractiveness of the liv-ing environment, affecting also the preconditions for tourism.
Based on the levels of total nitrogen and total phosphorus concen-trations, Lake Nuijamaanjärvi is inferred to be mesotrophic. How-ever, the lake’s ecological status is good, and the situation is stable.
In 2009, the quality of water in the Saimaa Canal was classified as moderately polluted (class 2), upstream from the Brusnichoe sluice gate as very clean (class 1), and at the mouth of the canal as “polluted” (class 3a), according to the Russian classification system.
The Mustajoki River is in pristine condition.
Responses Industrial wastewater treatment has been improved.
The Juustilanjoki Basin is covered by the bilateral agreement of 1964 on “frontier watercourses” between the riparian countries, and issues having a bearing on transboundary watercourses are dealt with by the Finnish-Russian Joint Commission.
On the Finnish side, the Finnish Transport Agency, established in 2010, takes care of the management of the Saimaa Canal. The Rescue Department of the State Provincial Office also provides rescue services in the canal area on the Russian side (the Russian side of the Saimaa Canal area has been rented by Finland). A plan addressing possible boat traffic accidents has been prepared.
laKe nuijamaanjärvi20 The transboundary Lake Nuijamaanjärvi (total lake surface area 7.65 km2; 4.92 km2 is in Finland and 2.73 km2 in the Russian Federation) is part of the Juustilanjoki River Basin. The Saimaa Canal, an intensively used shipping route from Finland to the Russian Federation, runs from Lake Saimaa and through Lake Nuijamaanjärvi to the Gulf of Finland.
20 Based on information provided by Finland, and the First Assessment.
Popu
latio
n (in
thou
sand
s)
0
1
2
3
4
5
6Ru
ssian
Fede
ratio
nFin
land
0.3
5.0
Country information/otherLandScanTM 1%
3%3%2%
7%
84%
Surface with little or no vegetation (<1%)Wetlands (<1%)
CultivatedForestGrassland/ShrublandUrban/Industrial areasWater bodies
Others
popuLATion AnD LAnDCoveR in The vAALimAAnjoki To juuSTiLAnjoki RiveR BASin
Source: UNEP/DEWA/GRID-Europe 2011.
Total water withdrawal and withdrawals by sector in the Juustilanjoki Basin
Country YearTotal withdrawal
× 106 m3/year Agriculture % Domestic % industry % energy % other %Finland N/A <1 <1 N/A N/A N/ARussian Federation 2009 10.98 - 56.6 8.8 1.1 11.9
360 | part iv Chapter 8 Drainage basin of the baltic sea | 361
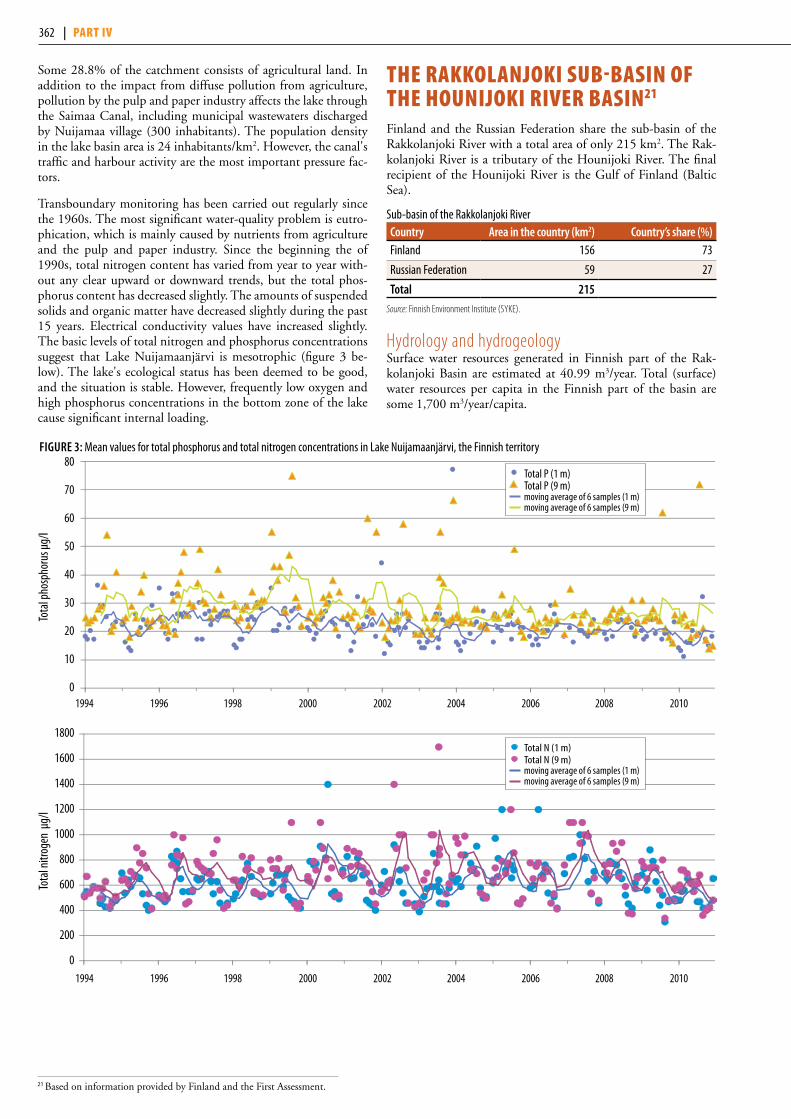
Some 28.8% of the catchment consists of agricultural land. In addition to the impact from diffuse pollution from agriculture, pollution by the pulp and paper industry affects the lake through the Saimaa Canal, including municipal wastewaters discharged by Nuijamaa village (300 inhabitants). The population density in the lake basin area is 24 inhabitants/km2. However, the canal's traffic and harbour activity are the most important pressure fac-tors.
Transboundary monitoring has been carried out regularly since the 1960s. The most significant water-quality problem is eutro-phication, which is mainly caused by nutrients from agriculture and the pulp and paper industry. Since the beginning the of 1990s, total nitrogen content has varied from year to year with-out any clear upward or downward trends, but the total phos-phorus content has decreased slightly. The amounts of suspended solids and organic matter have decreased slightly during the past 15 years. Electrical conductivity values have increased slightly. The basic levels of total nitrogen and phosphorus concentrations suggest that Lake Nuijamaanjärvi is mesotrophic (figure 3 be-low). The lake's ecological status has been deemed to be good, and the situation is stable. However, frequently low oxygen and high phosphorus concentrations in the bottom zone of the lake cause significant internal loading.
the raKKolanjoKi suB-Basin of the hounijoKi river Basin21
Finland and the Russian Federation share the sub-basin of the Rakkolanjoki River with a total area of only 215 km2. The Rak-kolanjoki River is a tributary of the Hounijoki River. The final recipient of the Hounijoki River is the Gulf of Finland (Baltic Sea).
Sub-basin of the Rakkolanjoki River Country Area in the country (km2) Country’s share (%)Finland 156 73
Russian Federation 59 27
Total 215Source: Finnish Environment Institute (SYKE).
Hydrology and hydrogeologySurface water resources generated in Finnish part of the Rak-kolanjoki Basin are estimated at 40.99 m3/year. Total (surface) water resources per capita in the Finnish part of the basin are some 1,700 m3/year/capita.
figuRe 3: Mean values for total phosphorus and total nitrogen concentrations in Lake Nuijamaanjärvi, the Finnish territory
21 Based on information provided by Finland and the First Assessment.
1994 1996 1998 2000 2002 2004 2006 2008 2010
1994 1996 1998 2000 2002 2004 2006 2008 2010
80
70
60
50
40
30
20
10
0
1800
1600
1400
1200
1000
800
600
400
200
0
Tota
l pho
spho
rus μ
g/l
Tota
l nitr
ogen
μg/
l
Total P (1 m) Total P (9 m) moving average of 6 samples (1 m) moving average of 6 samples (9 m)
Total N (1 m) Total N (9 m)
moving average of 6 samples (1 m) moving average of 6 samples (9 m)
362 | part iv

PressuresThe internal load of Lake Haapajärvi contributes to the pres-sures; this load originates from nutrients, which have been ac-cumulated during a long period of time.
Natural leaching (15 to 20% of the nutrient/pollution load), agriculture (20%–40%) and the limestone industry (Nordkalk Oyj, Lappeenranta) are among the pressure factors in the Finn-ish part of the sub-basin. The main pollution sources on Finn-ish territory are treated wastewaters from the town Lappeenranta (40%–60%).
Status and transboundary impacts There is significant eutrophication in the river, which is mainly caused by wastewater discharges and agriculture. The poor water quality is due to the big overall pollution load compared to the small flow of the watercourse. There is a sig nificant transbound-ary impact. Wastewater treatment has improved over the years, but control measures are needed. The quality of the environment impacts on the conditions for tourist industry.
Responses and trendsObjectives for decreasing diffuse pollution have been set in the River Basin Management Plan. The discharge arrangement and situation may change if the conditions for the new wastewater permit for the city of Lappeenranta change.
The Joint Finnish–Russian Commission has emphasized the need for more effective protection measures, in addition to which, it will take time to improve the long-lasting situation of poor water quality.
urpalanjoKi Basin22
Finland and the Russian Federation share the basin of the 15-km long Urpalanjoki River.23 The Urpalanjoki River flows from Lake Suuri-Urpalo (Finland) to the Russian Federation and discharges into the Gulf of Finland (Baltic Sea).
Basin of the Urpalanjoki River Country Area in the country (km2) Country’s share (%)Finland 467 84
Russian Federation 90 16
Total 557Source: Finnish Environment Institute (SYKE).
Hydrology and hydrogeologySurface water resources generated in the Finnish part of the Ur-palanjoki Basin are estimated at 114.4 × 10⁶ m3/year, and ground-water resources at 0.8 × 10⁶ m3/year, adding up to a total of 115.2 × 10⁶ m3/year. Total water resources per capita in the Finnish part of the basin are approximately 29,000 m3/year.
There are no significant aquifers in the border zone.
In the river basin, the Joutsenkoski and Urpalonjärvi dams regulate the water flow. Altogether, there are also 11 drowned weirs.
PressuresTotal water withdrawal in the Russian side of the basin is 0.040 × 10⁶ m3/year; 84.8% of which is used for domestic purposes, and 3.8% for industry.
Agriculture is the most important pressure factor in the Urpalan-joki Basin (loading in Finland estimated at 4 tons/year of phos-phorus and 75 tons/year of nitrogen), causing significant eutro-phication locally. Wastewater discharges from the municipality of Luumäki in Finland also contribute to eutrophication locally, but the impact does not extend over the border. In Luumäki, the sewage treatment plant of Taavetti has biological/chemical treat-ment, and the one in Jurvala is not operational.
Nutrient load from settlements and other urban sources in the Finnish part is estimated at 0.9 tons/year of phosphorus, and 18.3 tons/year of nitrogen. The nutrient load from peat produc-tion and forestry is minor.
Water availability in the Finnish part of the basin mainly has an impact on the attractiveness of living conditions, on the benefits of small hydropower plant owners, and on the potential for tourism.
Disch
arge
(m3 s-1
) (log
arith
mic
scale)
17
0.2
(Rak
kolan
joki)0.1
1
10 QavQmaxQmin
Bord
er FI
-RU
(wat
ersh
ed m
odell
ing)
Popu
latio
n (in
thou
sand
s)
0
5
10
15
20
25
30
Russ
ian Fe
dera
tion
Finlan
d
24.0
1.3
Country information/otherLandScanTM
DiSChARgeS AnD popuLATion in The RAkkoLAnjoki SuB-BASin
Sources: UNEP/DEWA/GRID-Europe 2011. Finnish Building and Dwelling Register.
22 Based on information provided by Finland and the First Assessment. 23 The river is also known as the Serga.
362 | part iv Chapter 8 Drainage basin of the baltic sea | 363

Status and transboundary impacts In 2009, water in the border section in the Russian Federation fell into the "very polluted" quality class of the Russian classification (class 3b, value 2.52) and water in the 2-km section from the river’s mouth was classified as "polluted” (quality class 3a, value 2.65).
During 2009, low pH values observed in the river (down to 6.0 with an average of 6.4), but the oxygen regime was satisfactory. The occurrence of organic substances, demonstrated by COD
Cr,
is characteristic of the river. Nutrient concentrations in river wa-ter ranged in the Russian part in 2009 from 0.66 to 1.9 mg/l for total nitrogen, and 33–123 µg/l for total phosphorus. Iron, man-ganese and copper (slightly) exceeded the MACs in 2009, both in the border section and close to the river’s mouth.
Responses and trendsThe riverbed is reported to have been dredged in the Finnish part, resulting in some structural changes.The management com-pany of municipal housing in the Vyborg district has made a con-tract for a sewage treatment facility in the village of Torfyanovka, where wastewaters are discharged to the Urpalanjoki River.
The Joint Finnish-Russian Commission also handles all kinds of measures, which may have a transboundary impact, on the Ur-palanjoki River.
No changes are foreseen in water withdrawal on the Finnish side. Foreseeable changes are not expected from climate change either.
saimaa Canal, inCluding the sosKuanjoKi river24
The artificially constructed Saimaa Canal connects Lake Saimaa in Finland though Lake Nuijamaanjärvi at the border to the Bal-tic Sea. The canal originates in Finland and passes through to the Russian Federation.
The Soskuanjoki River is a very small, partly artificially modified river originating from the eastern side of the Saimaa Canal and
flowing to the Russia Federation (Juustilanjoki River).
The river basin has an area of 174 km2; 112 km2 of which on the Finnish side and 62 km2 on the Russian side. The annual discharge of the Saimaa Canal is 0.03 km3 and of the Soskuan-joki River 0.006 km3. Over half of the basin area is forestry land, about third is agricultural lands and about 3 % is covered by hu-man settlements; peatlands present 8 % of the basin area. There are eight canal locks, three of which are on the Finnish and five on the Russian side of the border.
Water quality is monitored on a regular basis in the territory of Finland. Diffuse pollution from agriculture and peat production are main pressure factors causing pollution in the area. Nutrient concentrations decreased in the 1990s but electric conductivity and pH have been on increase.
Water in the Soskuanjoki River is quite dark and rich in nutrients and humus. The oxygen concentration in the river is good. Pollution originates from agriculture and peat production, and eutrophication is the most serious water-quality problem. During low discharge sea-son, lack of water is a minor problem in the Soskuanjoki River.
The water in the Saimaa Canal is slightly rich in humus and nutrients. The oxygen concentration is good. The Saimaa Canal is not exposed to diffuse pollution. On the side of Lake Saimaa, there is a moderate impact due to diluted wastewaters from pulp and paper industry, which pass through the locks to the canal. A salt storage (NaCl) is situated on the shore of the canal causing, adding to the salt water load. Thanks to water protection acts that relate to pulp and paper industry, the quality of the water has been improving since the mid-1990s.
tervajoKi, vilajoKi, KaltonjoKi (santajoKi) and vaalimaanjoKi river Basins25
The Tervajoki, Vilajoki, Kaltonjoki (Santajoki) and Vaalimaan-joki rivers are small rivers flowing from Finland to the Russian
DiSChARgeS AnD popuLATion in The uRpALAnjoki BASin
Sources: UNEP/DEWA/GRID-Europe 2011; Finnish Building and Dwelling Register.
Bord
er FI
-RU
(wat
ersh
ed m
odell
ing)
Disch
arge
(m3 s-1
) (log
arith
mic
scale)
4(U
rpala
njoki)
1
10
100 QavQmaxQmin
Popu
latio
n (in
thou
sand
s)
0
1
2
3
4
5
Russ
ian Fe
dera
tion
Finlan
d
0.4
4.0
Country information/otherLandScanTM
24 Based on information provided by Finland. 25 Based on information provided by Finland.
364 | part iv

Federation, discharging into the Bay of Vyborg in the Baltic Sea (discharges respectively: 0.03; 0.08; 0.03 and 0.12 km3/year).
The basin area of the Tervajoki River is 204 km2 and almost equally shared by the two countries. The basin area of the Vila-joki River is 344 km2, covering parts of Finland (73.4%) and Russia (26.6%). In the Finnish part of both of the basins, there are several lakes and a few regulated reservoir dams.
The Kaltonjoki (Santajoki) River originates from Lake Ottajärvi in Finland, but most of the 187 km2 basin area is situated in Russia (65.2%). The basin area of the Vaalimaanjoki River is 245 km2, mostly situated in Finland (97.4%) On the Finnish side of the border, there are some old water and saw-mill structures, which are no longer in use.
The basins of these rivers are mostly covered by forests/forestry land (80–84%). Agricultural lands cover 8-13%, and human settlements about 1%. 11-14% of the basin areas are peatlands. On the Finnish side of the border, there are a few regulated reservoir dams.
The water in the rivers is rich in nutrients and humus, and oxygen levels are mostly good. Pollution originates mainly from diffuse sources such as agriculture and forestry, but the load has decreased over time. In comparison, point source pollution is insignificant. There are no serious water quantity problems; during the low dis-charge season, water scarcity is a slight problem. Eutrophication and keeping it under control is a problem at least in the Kaltonjoki (Santajoki) and Vaalimaanjoki rivers. The overall status of the riv-ers vary from moderate to good, and has remained quite stable.
The Tervajoki, Vilajoki and Kaltonjoki (Santajoki) rivers are nowadays close to a natural state, and all the rivers have recrea-
tional importance. Sea Trout rises to the Tervajoki River on the Russian side and reproduces in the tributaries of the Tervajoki River. On the Finnish side of Vilajoki River, there is a reproduc-ing trout population; it is also possible that Sea Trout can rise from the sea to the river. On the Russian side of the Kaltonjoki (Santajoki) River, sea trout reproduces naturally. Baltic Whitefish rises regularly to the lower parts of the Vaalimaanjoki River, and trout also appear occasionally.
narva river Basin26
Estonia, Latvia and the Russian Federation share the basin of the 77-km long Narva River. Lake Peipsi/Chudskoe27 and the Narva Reservoir (built from 1955 to 1956) in the basin are transbound-ary, shared by Estonia and the Russian Federation. Lake Peipsi/Chudskoei is the fourth largest lake in Europe in terms of surface area, and at the same time it is largest transboundary lake in Eu-rope. The Plyussa River is a tributary of the Narva in the Russian Federation.
The basin is in flat terrain, with an average elevation of 163 m a.s.l.
Basin of the Narva River Country Area in the country (km2) Country’s share (%)Estonia 17 000 30
Latvia 3 100 6
Russian Federation 36 100 64
Total 56 200Source: Finnish Environment Institute (SYKE).
26 Based on information provided by Estonia and the Russian Federation, and the First Assessment. 27 The lake is known as Lake Peipsi in Estonia and Lake Chudskoe in the Russian Federation. It consists of two lakes connected by a straight is reflected in names
“Peipsi-Pihkva” (in Estonia) and Pskovsko-Chudskoe (in Russian).
oRDoviCiAn iDA-viRu gRounDwATeR BoDY (no. 164)
estonia Russian federationType 3; Limestones and dolomites of Ordovician formations; the 30 m thick upper part consists of limestones and dolomites, strongly karsted and fissured at places; groundwater flow direction is from Estonia to Russia north of the Narva Reservoir, and from Russia to Estonia at the south of the Narva Reservoir; strong link with the Narva River.Area (km2) 2 129 N/ARenewable groundwater resource (m3/d) 600 000 N/AThickness: mean, max (m) 75, 150 N/AGroundwater uses and functions Mainly used for drinking water. N/APressure factors The aquifer is influenced by water consumption both
in Estonia and in Russia. Ammonium, sodium, chloride and other element concentrations are naturally high.
N/A
Other information Border length 30.7 km. Crosses the national border in Ida-Viru County. Population ∼271 700 (127 inhabitants/km2).
N/A
oRDoviCiAn iDA-viRu oiL-ShALe BASin gRounDwATeR BoDY (no. 165)
estonia Russian federationType 3; Silurian and Ordovician limestones and dolomites; groundwater flow direction is from Estonia to Russia north of the Narva Reservoir, and from Russia to Estonia at the south of the Narva Reservoir; strong link with the Narva River.Area (km2) 1 175 N/ARenewable groundwater resource (m3/d) 500 000 N/AThickness: mean, max (m) 75, 150 N/AGroundwater uses and functions Unusable as a source of water supply (polluted),
endangers the water of other groundwater bodies.N/A
Pressure factors 50–90% of the stock is being pumped out in oil shale mining. After the closure of oil shale mines, the
groundwater body may have an impact on other water intakes. Rising of water table will cause bogs to expand.
N/A
Other information Border length 33.4 km. Chemical status is poor. Population 230 700 (196 inhabitants/km2)
364 | part iv Chapter 8 Drainage basin of the baltic sea | 365
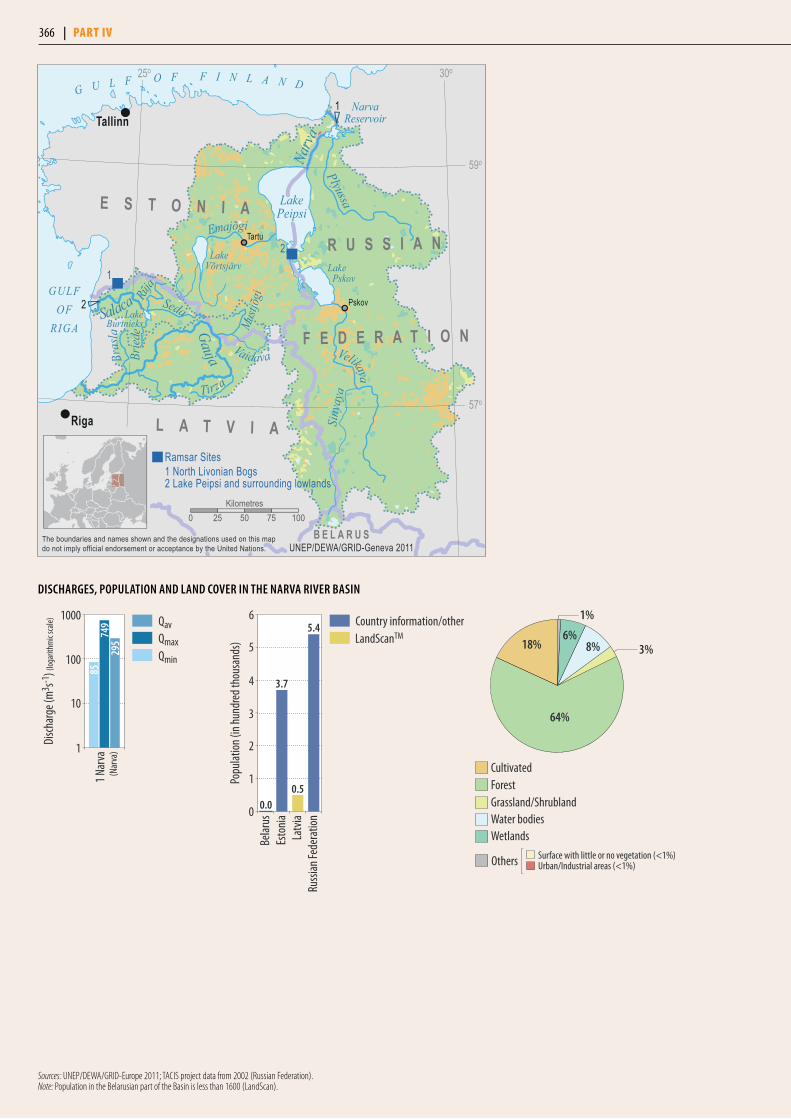
2
1
Riga
Tallinn
Pskov
Tartu
Ramsar Sites1 North Livonian Bogs2 Lake Peipsi and surrounding lowlands
2
1
SalacaGULF
OFRIGA
G U L F O F F I N L A N D
LakeBurtnieks
Rūja
Seda
GaujaBras
la
Tirza
Mustj
õgi
LakePeipsi
Lake Pskov
NarvaReservoir
Narv
a
VaidavaBried
e
Plyussa
Velikaya
Siny
aya
Emajõgi
LakeVõrtsjärv
E S T O N I A
L A T V I A
R U S S I A N
F E D E R A T I O N
B E L A R U S
59o
57o
25o 30o
UNEP/DEWA/GRID-Geneva 2011The boundaries and names shown and the designations used on this mapdo not imply official endorsement or acceptance by the United Nations.
0 25 50 75 100Kilometres
Sources: UNEP/DEWA/GRID-Europe 2011; TACIS project data from 2002 (Russian Federation).Note: Population in the Belarusian part of the Basin is less than 1600 (LandScan).
1 Nar
va
Disch
arge
(m3 s-1
) (log
arith
mic
scale)
749
295
(Nar
va)1
10
100
1000 QavQmaxQmin
85
Popu
latio
n (in
hun
dred
thou
sand
s)
0
1
2
3
4
5
6
Russ
ian Fe
dera
tion
Latv
iaEs
toni
aBe
larus
0.0
3.7
0.5
5.4 Country information/otherLandScanTM
1%
3%
Urban/Industrial areas (<1%)Surface with little or no vegetation (<1%)
18%
64%
8%6%
CultivatedForestGrassland/Shrubland
Others
Water bodiesWetlands
DiSChARgeS, popuLATion AnD LAnD CoveR in The nARvA RiveR BASin
366 | part iv
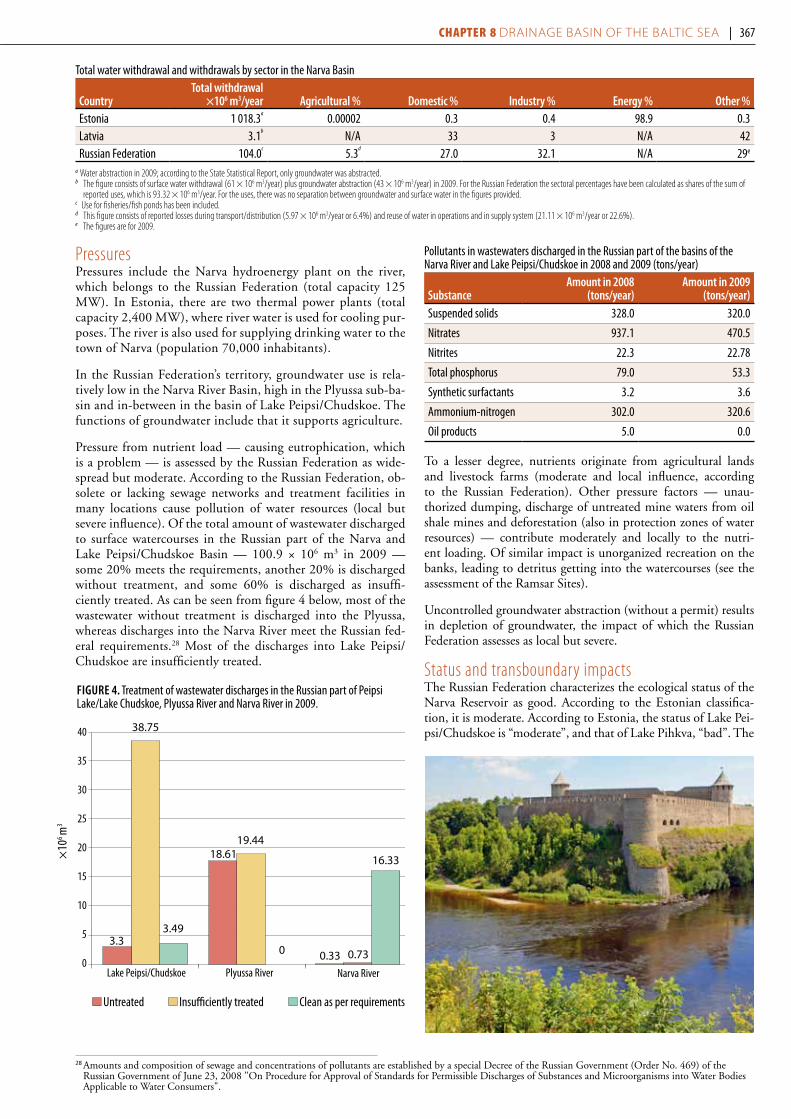
PressuresPressures include the Narva hydroenergy plant on the river, which belongs to the Russian Federation (total capacity 125 MW). In Estonia, there are two thermal power plants (total capacity 2,400 MW), where river water is used for cooling pur-poses. The river is also used for supplying drinking water to the town of Narva (population 70,000 inhabitants).
In the Russian Federation’s territory, groundwater use is rela-tively low in the Narva River Basin, high in the Plyussa sub-ba-sin and in-between in the basin of Lake Peipsi/Chudskoe. The functions of groundwater include that it supports agriculture.
Pressure from nutrient load — causing eutrophication, which is a problem — is assessed by the Russian Federation as wide-spread but moderate. According to the Russian Federation, ob-solete or lacking sewage networks and treatment facilities in many locations cause pollution of water resources (local but severe influence). Of the total amount of wastewater discharged to surface watercourses in the Russian part of the Narva and Lake Peipsi/Chudskoe Basin — 100.9 × 10⁶ m3 in 2009 — some 20% meets the requirements, another 20% is discharged without treatment, and some 60% is discharged as insuffi-ciently treated. As can be seen from figure 4 below, most of the wastewater without treatment is discharged into the Plyussa, whereas discharges into the Narva River meet the Russian fed-eral requirements.28 Most of the discharges into Lake Peipsi/Chudskoe are insufficiently treated.
Pollutants in wastewaters discharged in the Russian part of the basins of the Narva River and Lake Peipsi/Chudskoe in 2008 and 2009 (tons/year)
SubstanceAmount in 2008
(tons/year)Amount in 2009
(tons/year)Suspended solids 328.0 320.0
Nitrates 937.1 470.5
Nitrites 22.3 22.78
Total phosphorus 79.0 53.3
Synthetic surfactants 3.2 3.6
Ammonium-nitrogen 302.0 320.6
Oil products 5.0 0.0
To a lesser degree, nutrients originate from agricultural lands and livestock farms (moderate and local influence, according to the Russian Federation). Other pressure factors — unau-thorized dumping, discharge of untreated mine waters from oil shale mines and deforestation (also in protection zones of water resources) — contribute moderately and locally to the nutri-ent loading. Of similar impact is unorganized recreation on the banks, leading to detritus getting into the watercourses (see the assessment of the Ramsar Sites).
Uncontrolled groundwater abstraction (without a permit) results in depletion of groundwater, the impact of which the Russian Federation assesses as local but severe.
Status and transboundary impactsThe Russian Federation characterizes the ecological status of the Narva Reservoir as good. According to the Estonian classifica-tion, it is moderate. According to Estonia, the status of Lake Pei-psi/Chudskoe is “moderate”, and that of Lake Pihkva, “bad”. The
28 Amounts and composition of sewage and concentrations of pollutants are established by a special Decree of the Russian Government (Order No. 469) of the Russian Government of June 23, 2008 "On Procedure for Approval of Standards for Permissible Discharges of Substances and Microorganisms into Water Bodies Applicable to Water Consumers".
Total water withdrawal and withdrawals by sector in the Narva Basin
CountryTotal withdrawal
×106 m3/year Agricultural % Domestic % industry % energy % other %Estonia 1 018.3
a0.00002 0.3 0.4 98.9 0.3
Latvia 3.1b
N/A 33 3 N/A 42Russian Federation 104.0
c5.3
d27.0 32.1 N/A 29e
a Water abstraction in 2009; according to the State Statistical Report, only groundwater was abstracted.b The figure consists of surface water withdrawal (61 × 106 m3/year) plus groundwater abstraction (43 × 106 m3/year) in 2009. For the Russian Federation the sectoral percentages have been calculated as shares of the sum of
reported uses, which is 93.32 × 10⁶ m3/year. For the uses, there was no separation between groundwater and surface water in the figures provided.c Use for fisheries/fish ponds has been included.d This figure consists of reported losses during transport/distribution (5.97 × 10⁶ m3/year or 6.4%) and reuse of water in operations and in supply system (21.11 × 10⁶ m3/year or 22.6%). e The figures are for 2009.
figuRe 4. Treatment of wastewater discharges in the Russian part of Peipsi Lake/Lake Chudskoe, Plyussa River and Narva River in 2009.
40
35
30
25
20
15
10
5
0
3.3
38.75
3.49
18.6119.44
0
16.33
0.33
Lake Peipsi/Chudskoe Plyussa River Narva River
0.73
Untreated Insufficiently treated Clean as per requirements
×10
6 m
3
366 | part iv Chapter 8 Drainage basin of the baltic sea | 367
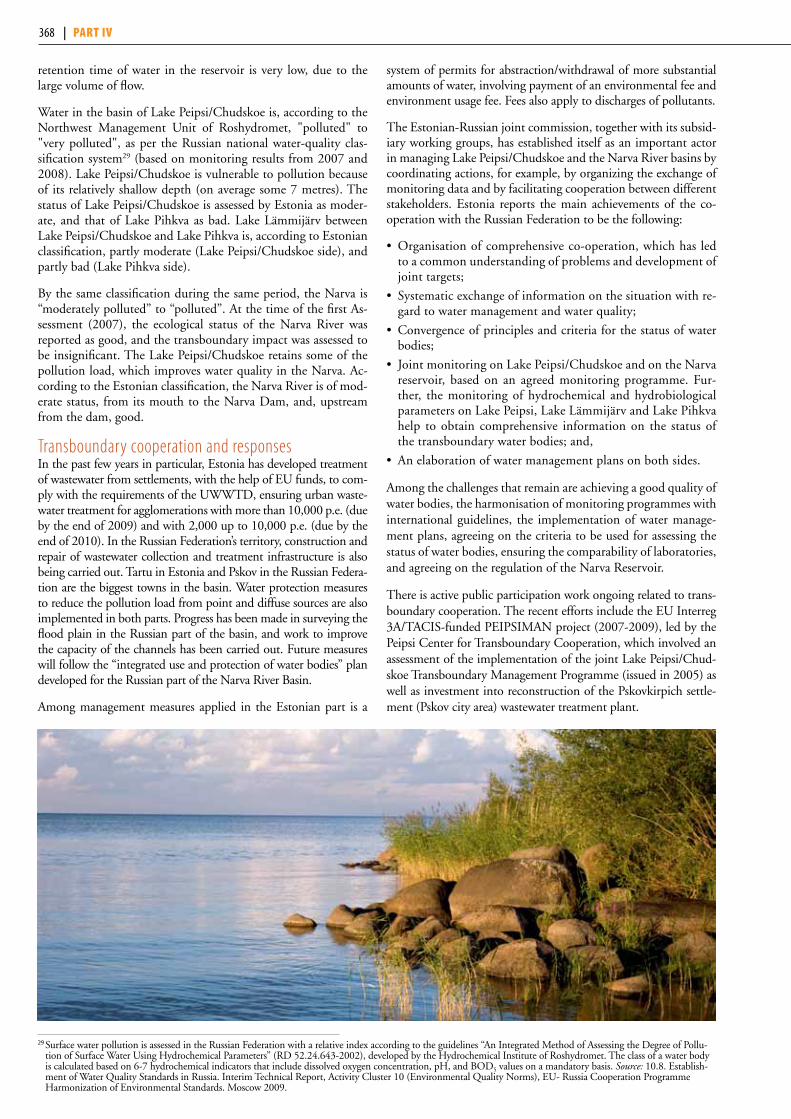
retention time of water in the reservoir is very low, due to the large volume of flow.
Water in the basin of Lake Peipsi/Chudskoe is, according to the Northwest Management Unit of Roshydromet, "polluted" to "very polluted", as per the Russian national water-quality clas-sification system29 (based on monitoring results from 2007 and 2008). Lake Peipsi/Chudskoe is vulnerable to pollution because of its relatively shallow depth (on average some 7 metres). The status of Lake Peipsi/Chudskoe is assessed by Estonia as moder-ate, and that of Lake Pihkva as bad. Lake Lämmijärv between Lake Peipsi/Chudskoe and Lake Pihkva is, according to Estonian classification, partly moderate (Lake Peipsi/Chudskoe side), and partly bad (Lake Pihkva side).
By the same classification during the same period, the Narva is “moderately polluted” to “polluted”. At the time of the first As-sessment (2007), the ecological status of the Narva River was reported as good, and the transboundary impact was assessed to be insignificant. The Lake Peipsi/Chudskoe retains some of the pollution load, which improves water quality in the Narva. Ac-cording to the Estonian classification, the Narva River is of mod-erate status, from its mouth to the Narva Dam, and, upstream from the dam, good.
Transboundary cooperation and responsesIn the past few years in particular, Estonia has developed treatment of wastewater from settlements, with the help of EU funds, to com-ply with the requirements of the UWWTD, ensuring urban waste-water treatment for agglomerations with more than 10,000 p.e. (due by the end of 2009) and with 2,000 up to 10,000 p.e. (due by the end of 2010). In the Russian Federation’s territory, construction and repair of wastewater collection and treatment infrastructure is also being carried out. Tartu in Estonia and Pskov in the Russian Federa-tion are the biggest towns in the basin. Water protection measures to reduce the pollution load from point and diffuse sources are also implemented in both parts. Progress has been made in surveying the flood plain in the Russian part of the basin, and work to improve the capacity of the channels has been carried out. Future measures will follow the “integrated use and protection of water bodies” plan developed for the Russian part of the Narva River Basin.
Among management measures applied in the Estonian part is a
system of permits for abstraction/withdrawal of more substantial amounts of water, involving payment of an environmental fee and environment usage fee. Fees also apply to discharges of pollutants.
The Estonian-Russian joint commission, together with its subsid-iary working groups, has established itself as an important actor in managing Lake Peipsi/Chudskoe and the Narva River basins by coordinating actions, for example, by organizing the exchange of monitoring data and by facilitating cooperation between different stakeholders. Estonia reports the main achievements of the co-operation with the Russian Federation to be the following:
• Organisationofcomprehensiveco-operation,whichhasledto a common understanding of problems and development of joint targets;
• Systematicexchangeofinformationonthesituationwithre-gard to water management and water quality;
• Convergenceofprinciplesandcriteriaforthestatusofwaterbodies;
• JointmonitoringonLakePeipsi/ChudskoeandontheNarvareservoir, based on an agreed monitoring programme. Fur-ther, the monitoring of hydrochemical and hydrobiological parameters on Lake Peipsi, Lake Lämmijärv and Lake Pihkva help to obtain comprehensive information on the status of the transboundary water bodies; and,
• Anelaborationofwatermanagementplansonbothsides.
Among the challenges that remain are achieving a good quality of water bodies, the harmonisation of monitoring programmes with international guidelines, the implementation of water manage-ment plans, agreeing on the criteria to be used for assessing the status of water bodies, ensuring the comparability of laboratories, and agreeing on the regulation of the Narva Reservoir.
There is active public participation work ongoing related to trans-boundary cooperation. The recent efforts include the EU Interreg 3A/TACIS-funded PEIPSIMAN project (2007-2009), led by the Peipsi Center for Transboundary Cooperation, which involved an assessment of the implementation of the joint Lake Peipsi/Chud-skoe Transboundary Management Programme (issued in 2005) as well as investment into reconstruction of the Pskovkirpich settle-ment (Pskov city area) wastewater treatment plant.
29 Surface water pollution is assessed in the Russian Federation with a relative index according to the guidelines “An Integrated Method of Assessing the Degree of Pollu-tion of Surface Water Using Hydrochemical Parameters” (RD 52.24.643-2002), developed by the Hydrochemical Institute of Roshydromet. The class of a water body is calculated based on 6-7 hydrochemical indicators that include dissolved oxygen concentration, pH, and BOD5 values on a mandatory basis. Source: 10.8. Establish-ment of Water Quality Standards in Russia. Interim Technical Report, Activity Cluster 10 (Environmental Quality Norms), EU- Russia Cooperation Programme Harmonization of Environmental Standards. Moscow 2009.
368 | part iv

laKe peipsi/ChudsKoe and surrounding lowlands30
General description of the wetland areaEstonia and the Russian Federation, which share Lake Peipsi/Chudskoe, have designated Ramsar Sites covering vast wilderness areas on the western and south-eastern shores of the lake. These include the deltas of the two largest rivers discharging into the lake: Emajõgi in Estonia and Velikaya in Russia, different types of mires, rivers and small lakes, as well as the adjacent shores and waters of Lake Peipsi/Chudskoe. The Estonian site also includes the largest island on Lake Peipsi/Chudskoe: Piirissaar.
Main wetland ecosystem services The wetlands of both Ramsar Sites are extremely important for the hydrology and water quality of Lake Peipsi/Chudskoe. They provide water storage and natural purification, sediment filtration, natural flood control (acting as floodplains during spring floods), and regulation of surface water and groundwater flow. Other most important ecosystem services include sustaining biodiversity, car-bon storage (in large peatlands) and balancing the local climate.
The principal activities of the local population are fishing, farming, forest cutting (in the Russian Federation), berry and mushroom picking, and small-scale hunting. In terms of fish, Lake Peipsi/Chudskoe is known to be one of the best-stocked lakes in Europe. Both Ramsar Sites contribute to this reputation, as they contain important spawning sites. The Russian site is noted to be impor-tant in maintaining the numbers of game bird and mammal species on a larger area along the eastern shore of Lake Peipsi/Chudskoe.
There are good opportunities for outdoor recreation and eco-tourism, although on the Russian side these activities, which are important for the local economy, are still to be developed.
Cultural values of the wetland areaTraditional land-use, fishery and architecture are preserved on both sides of the border. A mixture of Estonian and Russian cul-tures occurs on Piirissaar Island, where the population forms one of the most compact communities of Old Believers. On the Rus-sian side there are many old churches, archaeological monuments and historical sites.
Biodiversity values of the wetland areaBeing an integral complex of different types of peatland (fens, tran-sitional bogs, bogs), rivers and lakes (including the shallow waters of Lake Peipsi/Chudskoe), reedbeds and swamp forests in both sites are good representatives of large mosaic wetland complexes charac-teristic of the Boreal bio-geographical region, and include a number of habitats as well as animal and plant species of European concern.
The sites are internationally important as stopovers for migrating waterfowl and as breeding areas for many waterbirds and mam-mals; they are also important for Moulting Waterfowl. The huge wetland complex is a perfect habitat for birds of prey including the globally threatened Greater Spotted Eagle, as well as for wolf, Brown Bear, lynx, otter and beaver.
Pressure factors and transboundary impactsOn the Estonian side, the intensification of tourist and cargo traffic
in the river Emajõgi - Lake Peipsi/Chudskoe region and intensive fishing in Emajõgi delta are potential threats. A decrease in tradi-tional land use (onion-growing, mowing of the floodplain and fen meadows) is a threat for several rare species of amphibians and birds.
On the Russian side, the unfavourable social and economic situ-ation since the beginning of 1990s has led to an increased use of biological resources, including illegal fishing, hunting, and for-est cutting, and uncontrolled berry picking. The situation has improved, but illegal activities still remain a problem. Another serious threat is the disturbance to wildlife caused by people and motorboats. Other threats include the decrease of agricultural ar-eas, fires and burning of grasslands, and littering. The possible impacts by alien invasive species (Racoon Dog, American Mink, muskrat) need to be studied and better understood.
Lake Peipsi/Chudskoe is becoming more eutrophic, a particu-larly rapid process in its southern basin. The pollution of the Velikaya and Emajõgi rivers is partly to blame; other water pol-lution comes from agricultural areas. Nevertheless, the recent re-structuring of the economy in Estonia, and the diminished use of agrochemicals in Estonia and the Russian Federation, have triggered positive trends in the environmental situation. Due to the construction of several new sewage treatment facilities, the water quality in the rivers flowing into Lake Peipsi/Chudskoe has remarkably improved.
Transboundary wetland managementThe Estonian Ramsar Site Emajõe Suursoo Mire and Piirissaar Is-land (32,600 ha) includes the Emajõe Suursoo Landscape Reserve (18,130 ha), the Piirissaar Zoological-Botanical Reserve (755 ha) and the Limited Conservation Area of the Emajõe Delta Region (11,310 ha). The establishment of the National Park, covering approximately 35,000 ha and including all mentioned protected areas, is under way. The Russian Ramsar Site Pskovsko-Chudskaya Lowland (93,600 ha) includes the Federal Zoological Reserve Remdovsky (74,712 ha) and several regional protected areas. Both Estonian and Russian wetlands have been identified as Important Bird Areas, and the Estonian as a Natura 2000 site. Despite the fact that the Ramsar Sites and pro-tected areas do not cover the entire Lake Peipsi/Chudskoe wetland area, their presence on both sides of the national border undoubtedly has great effect for the protection of the habitats of rare and threat-ened species, especially for migratory species and those having large individual territories.
Transboundary cooperation is implemented through an Estonian-Russian Joint Commission, formed in 1998. The Peipsi Center for Transboundary Cooperation is working actively to promote bal-anced development in the entire region. The management plan for the Pskovsko-Chudskaya Lowland was prepared in 2001–2003 within the Russian-Danish project, with the participation of experts from neighbouring Estonian Ramsar Site (its provisions regarding nature conservation, the sustainable use of natural resources, and international cooperation mainly remain to be implemented). In joint wetland management on site level, the first major steps were made in 2006–2007, when the Estonian Fund for Nature carried out a project on transboundary management of nature reserves in the Lake Peipsi/Chudskoe area (including Emajõe Suursoo Mire and Remdovsky), with the aim of establishing contacts and a good basis for further cooperation and action.
30 Sources: Information Sheets on Ramsar Wetlands (RIS); Haberman, J., Timm, T., Raukas, A. (eds). Peipsi (in Estonian). Eesti Loodusfoto, Tartu. 2008; Kuus, A., Kalamees, A. (eds). Important Bird Areas of European Union Importance in Estonia. Estonian Ornithological Society, Tartu. 2003; Pihu, E., Haberman, J. (eds). Lake Peipsi. Flora and Fauna. Sulemees Publishers, Tartu. 2001; van Eerden, M., Bos, V., van Hulst (eds). In the mirror of a lake. Peipsi and Ijsselmeer for mutual reference. Centre of Water Management, Rijkwaterstaat. Lelystad. 2007; Musatov V.Yu., Fetisov S.A, Compl. Management Plan for the Lake Chudskoe/Pskovskoe Ramsar Site (2004-2008). Pskov, 2003; Konechnaya G.Yu., Musatov V.Yu., Fetisov S.A. Brief history and bibliographic references of scientific papers with information on the Ramsar site “Pskovsko- Chudskaya Lowland”: published in 1996-2006. Nature of the Pskov Land. Saint Petersburg. 2007. Issue 24, 3-55. (in Russian); Musatov V.Yu., and others. Comments and practical advice on implementation of the Management Plan for the Lake Chudskoe/Pskovskoe Ramsar Site (in Russian). Pskov. 2003; Musatov V. Yu., Fetisov S.A. (eds). Ramsar site “Pskovsko-Chudskaya Lowland” (in Russian). The Pskov Federal Protected Areas, issue 2. Pskov. 2006.
368 | part iv Chapter 8 Drainage basin of the baltic sea | 369
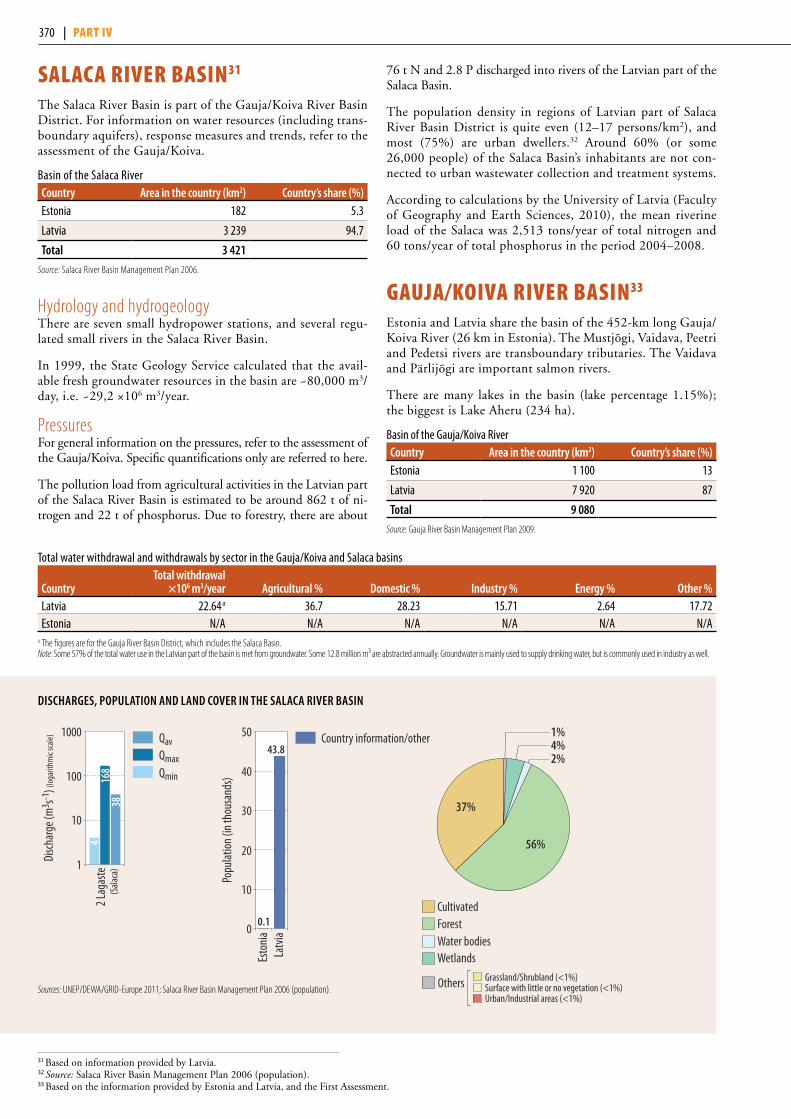
salaCa river Basin31
The Salaca River Basin is part of the Gauja/Koiva River Basin District. For information on water resources (including trans-boundary aquifers), response measures and trends, refer to the assessment of the Gauja/Koiva.
Basin of the Salaca River Country Area in the country (km2) Country’s share (%)Estonia 182 5.3
Latvia 3 239 94.7
Total 3 421Source: Salaca River Basin Management Plan 2006.
Hydrology and hydrogeologyThere are seven small hydropower stations, and several regu-lated small rivers in the Salaca River Basin.
In 1999, the State Geology Service calculated that the avail-able fresh groundwater resources in the basin are ~80,000 m3/day, i.e. ~29,2 ×10⁶ m3/year.
PressuresFor general information on the pressures, refer to the assessment of the Gauja/Koiva. Specific quantifications only are referred to here.
The pollution load from agricultural activities in the Latvian part of the Salaca River Basin is estimated to be around 862 t of ni-trogen and 22 t of phosphorus. Due to forestry, there are about
76 t N and 2.8 P discharged into rivers of the Latvian part of the Salaca Basin.
The population density in regions of Latvian part of Salaca River Basin District is quite even (12–17 persons/km2), and most (75%) are urban dwellers.32 Around 60% (or some 26,000 people) of the Salaca Basin’s inhabitants are not con-nected to urban wastewater collection and treatment systems.
According to calculations by the University of Latvia (Faculty of Geography and Earth Sciences, 2010), the mean riverine load of the Salaca was 2,513 tons/year of total nitrogen and 60 tons/year of total phosphorus in the period 2004–2008.
gauja/Koiva river Basin33
Estonia and Latvia share the basin of the 452-km long Gauja/Koiva River (26 km in Estonia). The Mustjõgi, Vaidava, Peetri and Pedetsi rivers are transboundary tributaries. The Vaidava and Pärlijõgi are important salmon rivers.
There are many lakes in the basin (lake percentage 1.15%); the biggest is Lake Aheru (234 ha).
Basin of the Gauja/Koiva River Country Area in the country (km2) Country’s share (%)Estonia 1 100 13
Latvia 7 920 87
Total 9 080Source: Gauja River Basin Management Plan 2009.
DiSChARgeS, popuLATion AnD LAnD CoveR in The SALACA RiveR BASin
Sources: UNEP/DEWA/GRID-Europe 2011; Salaca River Basin Management Plan 2006 (population).
31 Based on information provided by Latvia. 32 Source: Salaca River Basin Management Plan 2006 (population).33 Based on the information provided by Estonia and Latvia, and the First Assessment.
2 Lag
aste
Disch
arge
(m3 s-1
) (log
arith
mic
scale)
168
38(S
alaca
)1
10
100
1000 QavQmaxQmin
4
Popu
latio
n (in
thou
sand
s)
0
10
20
30
40
50
Latv
iaEs
toni
a
43.8
0.1
Country information/other
Others
Wetlands
2%4%1%
Grassland/Shrubland (<1%)
Urban/Industrial areas (<1%)Surface with little or no vegetation (<1%)
37%
56%
CultivatedForestWater bodies
Total water withdrawal and withdrawals by sector in the Gauja/Koiva and Salaca basins
CountryTotal withdrawal
×106 m3/year Agricultural % Domestic % industry % energy % other %Latvia 22.64 a 36.7 28.23 15.71 2.64 17.72Estonia N/A N/A N/A N/A N/A N/A
a The figures are for the Gauja River Basin District, which includes the Salaca Basin.Note: Some 57% of the total water use in the Latvian part of the basin is met from groundwater. Some 12.8 million m³ are abstracted annually. Groundwater is mainly used to supply drinking water, but is commonly used in industry as well.
370 | part iv

north livonian Bogs34
General description of the wetland areaThis large mire area spreads across the border between Estonia and Latvia, and comprises natural open plateau-like raised bogs with extensive hollow35 and pool36 systems, stripes of transitional mires, dystrophic lakes and forested mineral islands. The mires are surrounded by forests and semi-natural agricultural areas. The wetland complex belongs mainly to the Salaca River Basin, though there is partial discharge into the Rannametsa River dis-charging into the Gulf of Riga and into the Reiu River, which belongs to the Pärnu River Basin. The area is included in the international Ramsar network of wetlands.
Main wetland ecosystem services The following ecosystem services are the most important in the area: biodiversity maintenance, water storage, local climate bal-ance, greenhouse gas and carbon capture, and, in marginal parts, flood control.
In particular, the marginal parts of the mires are used for berry picking, fishing and hunting. This is a valuable site for outdoor recreation and nature tourism, including bird watching. The site is a “stepping stone” in the regional transboundary tourism de-velopment scheme.
Cultural values of the wetland areaThe mire complex was historically a natural border between two nations belonging to different language groups, the Esto-nian (Finno-Ugrian) and Latvian (Baltic) groups. The area shows traces of their interaction and mutual influence. Mineral islands in the peatland complex which were difficult to access were tra-ditionally used as hide and refuge areas during disasters and mili-tary events. Several historical artifacts – offering trees and sacred areas – are located on the wetland margins. In previous centuries, “frozen roads” that crossed mires were used for cross-border com-munications.
Biodiversity values of the wetland areaThe wetlands on the Estonian and Latvian side of the border form one of the largest and least disturbed peatland area in the Baltic region. The area harbours representative examples of habi-tats listed in Annex I of the EU Habitats Directive characteris-tic for the Boreal biogeographical region, including active raised bogs, transition mires and quaking bogs, bog woodland, Fennos-candian deciduous swamp woods, and natural dystrophic lakes.
Located on the main Eastern Baltic flyway, the wetland provides an important resting place for migratory birds, e.g. up to 40,000 – 50,000 White-fronted Geese and Bean Geese, and up to 1,000 cranes, stop over here. It is an important breeding site for rare and vulnerable bird species. Noteworthy mammals include species that need vast and/or untouched forest and bog areas, e.g. large carni-vores (wolf, lynx, Brown Bear), ungulates (elk), Pine Marten, and Flying Squirrel. A total of 60 species listed in the EU Habitats and Birds Directives are recorded in this transboundary area.
Pressure factors and transboundary impactsA dense system of drainage ditches located next to the mire com-plex is the overriding cause for the drainage of the mire lag zone, both on the Latvian and Estonian side, and for increasing for-est growth on former open mire areas. Timber harvesting in the vicinity of the Ramsar Sites leads to the fragmentation of forest habitats; soil erosion from clear-cut areas causes increased silta-tion in the drainage basin, and deteriorates water quality. The decrease of the local human population due to a lack of employ-ment possibilities is followed by a decrease of open areas, which latter are essential for maintaining grassland diversity and as mi-grating bird resting areas.
Transboundary wetland managementThe raised bogs on both sides of the border are Ramsar Sites: the Nigula Nature Reserve (6,398 ha) and the Sookuninga Nature Reserve (5,869 ha) in Estonia, and the Ziemelu purvi (5,318 ha; Biosphere Reserve) in Latvia. In 2007, the North Livonian Trans-boundary Ramsar Site was established. The wetlands are identified as Important Bird Areas and Natura 2000 sites, as well as an Inter-national Level Core Area in the Pan European Ecological Network.
There is a strong transboundary cooperation at the site level. A master plan for the Transboundary Ramsar Site and its surround-ings has been elaborated with a coordinated monitoring pro-gramme (including the joint use of remote sensing data), as well as information exchange on species diversity and factors possibly having impact on the other side of the Ramsar Site. To restore the natural hydrology and maintain the integrity of the raised bog ecosystem, wetland drainage ditches were closed on the Estonian side. There is also good cooperation in organizing joint public events, fieldwork and game management, as well as sharing re-search and monitoring buildings and equipment.
34 Sources: Latest Information Sheets on Ramsar Wetlands (RIS), available at the Ramsar Sites Information Service: Integrated Wetland and Forest Management in the Transborder Area of North-Livonia (Estonia-Latvia). - PIN/MATRA project. 2003-2006. (http://www.north-livonia.org); Tuned management and monitoring of the transboundary protected areas in North-Livonia as a support for local development. - European Union Community Initiative "Baltic Sea Region Interreg III B Neighbourhood Programme" project. 2006-2007. (http://wetlivonia.north-livonia.org); Leivits, Agu. Transboundary protected areas: Experiences from Estonia; In: Hedden-Dunkhorst, B. Engels, B., Schmid, G., Aliyev, I. (eds) The Role of Biodiversity for Sustainable Development in the Southern Caucasus Region: Azerbaijan - Progress and Perspectives. Report of the Expert Meeting held in Baku, Azerbaijan 22-23 May 2006. NATO Programme on Science of Peace and Security Report No. 278. Bonn, 39- 42. 2006; Leivits Agu, and others. Cooperative management of the North Livonian Transboundary Ramsar Site. In: Nature Conservation beyond 2010, Tallinn, 17-18.Seilis, Valērijs 2010; Zingstra Henk, and others. Master plan for North Livonia; Wetland Protection and Rural Development in the Transboundary Area of Latvia and Estonia, Wageningen International, the Netherlands. 2006. URL: http://www.north-livonia.org/report/MP-North-Livonia.pdf.
35 A “hollow” is a peatbog feature, often 5 cm below to 5 cm above the water table, covered mainly by sphagnum mosses and some cyperaceous plants. 36 A “pool” is a peatbog feature, a permanently water-filled basin, often with some vegetation at the edges.
Phot
o by T
obias
Salat
he
370 | part iv Chapter 8 Drainage basin of the baltic sea | 371

Hydrology and hydrogeologySurface water resources generated in the Latvian part of the River Basin District comprising the basins of the Gauja/Koiva and the Salaca rivers are estimated at 2,199×106 m3/year, and groundwater resources in the Gauja/Koiva Basin are ~110–113 ×106 m3/year.37 There are 43 small hydropower sta-tions, and 20 water bodies with regulated small rivers in the Latvian part of the Gauja/Koiva River Basin. In the Estonian part, there are 21 dams on rivers (most of them older than 25 years), and one is used for hydropower generation.
A small part of groundwater body D4 (No. 176) is located in the Gauja/Koiva River Basin (for the assessment, see the Lielupe Basin), and does not stretch to Estonian territory.
Pressures Iron, sulphate, ammonium, manganese and other pollutant concentrations are naturally high, requiring groundwater to be pre-treated before use as drinking water.
There are no big industrial enterprises in the basin. Agricul-ture and forestry are the main economic activities, and peat production may also impact water quality. Agricultural lands cover around 37% of the Gauja/Koiva River Basin, and the impact of pollution from agriculture is assessed as widespread but moderate.
According to the estimation for 2006, 470 t nitrogen and 27 t
phosphorus have been discharged into the water bodies from agriculture in Estonian territory. According to the estimations for 2006, some 1,928 t nitrogen and 55 t phosphorus have been discharged from agriculture, which corresponds to 62% and 26% of total anthropogenic nitrogen and phosphorus load, respectively, in the Latvian territory of the river basin The largest nitrogen load originates from cropland (1,006 t), and significant nitrogen and phosphorus loads come from ma-nure storage sites (~900 t and ~40 t, respectively). Draining agricultural land also intensifies the release of nutrients in the Latvian part, and causes a negative hydromorphological impact on the water environment. The diffuse pollution from the many farms in the sub-basins of the Peetri and Pärlijõgi rivers is unlike-ly to significantly affect the fish fauna of these rivers. Fish-farms with an annual growth of more than 1 tons affect the water body status locally, but potentially severely in Estonia.
According to estimates in Latvia, some 640 t nitrogen and 26 t phosphorus originated from forestry in 2006 (clear cutting, drainage, etc.), which is 20% and 12%, respectively, of the total anthropogenic load in the territory of the Gauja/Koiva River Ba-sin. The forest drainage systems that have been constructed lead to negative hydromorphological impact.
There are around 200 urban wastewater discharge points in the Latvian part of the river basin, influencing the quality of the water bodies significantly, in particular that of the Gauja/Koiva River, between the towns of Valmiera and Sigulda. According to
37 Estimate of the Latvian State Geology Service in 1999.38 Based on information from Latvia. This groundwater body is designated in Latvian territory only.
popuLATion AnD LAnD CoveR in The gAujA/koivA RiveR BASin
Sources: UNEP/DEWA/GRID-Europe 2011; Gauja River Basin Management Plan 2009. Note: For Estonia the data are for 2003.
Popu
latio
n (in
ten t
hous
ands
)
0
5
10
15
25
20
Latv
iaEs
toni
a
20.0
0.7
Country information/other 1%3%1%
Grassland/Shrubland (<1%)
Urban/Industrial areas (<1%)Surface with little or no vegetation (<1%)
37%
58%
CultivatedForestWater bodies
Others
Wetlands
gRounDwATeR BoDY D5 (no. 166)38
Latvia estoniaThe groundwater body consists of several aquifers. Thickness: mean, max (m) Varies for different aquifers, 235 N/AGroundwater uses and functions Some of the aquifers are used for drinking
water. Groundwaters support also surface ecosystems and feed watercourses.
Groundwater supports agriculture.
Other information Maximum depth from the ground surface is 253 m.
372 | part iv

gRounDwATeR BoDY D6 (no. 167)39
Latvia estoniaThis groundwater body consists of several aquifers.Thickness: mean, max (m) Varies for different aquifers, 435 N/AGroundwater uses and functions Some of the aquifers are used for abstraction
of drinking water. Groundwaters support also surface ecosystems and feed watercourses.
Groundwater supports agriculture.
Other information Maximum depth from the ground surface is ~400 m.
gRounDwATeR BoDY p (no. 168)40
Latvia estoniaThis groundwater body consists of several aquifers. Groundwater uses and functions Drinking water in some towns and parishes. Groundwater supports agriculture.Other information Location quite deep below the surface (50 – 330 m)
offers some protection against impact from the surface.
miDDLe-LoweR-DevoniAn gRounDwATeR BoDY (D2-1) (no. 169)
estonia Latvia and the Russian federationType 2; Devonian sandstones; groundwater flow direction from Estonia to Latvia and Russia, in certain areas from Latvia to Estonia; medium link with the Gauja/Koiva River.Area (km2) 13 102 N/AThickness: mean, max (m) 40, 150 N/AGroundwater uses and functions One of South Estonia's most abundant sources
of groundwater. Bigger central water intakes located in Põlva, Elva and Tartu.
N/A
Other information 46.3 km (Estonian Latvian border) and 101,9 km (Estonian Russian border). Population ~615 800 (47
inhabitants/km2). 10–20% of the stock in use. Only in Tartu is the groundwater regime significantly influenced
by water abstraction. Good chemical status.
miDDLe-DevoniAn gRounDwATeR BoDY (D2) (no. 170)
estonia Latvia and RussiaType 2; Middle Devonian sandstones and aleurolites; groundwater flow direction from Estonia to Russia and Latvia in southeast Estonia, from Latvia to Estonia in southeast Estonia; medium link with the Gauja/Koiva River.Area (km2) 447 N/ARenewable groundwater resource (m3/d) 50 000 N/AThickness: mean, max (m) 50, 100 N/ANumber of inhabitants 17 433 N/APopulation density 39 N/AGroundwater uses and functions Groundwater is mainly used for abstraction
of drinking water (98 774 m3/year). N/A
Other information Border lengths 191.3 km (Estonian-Latvian border) and 233.2 km (Estonian-Russian border).
Low vulnerability and good chemical status.
uppeR-DevoniAn gRounDwATeR BoDY (D3) (no. 171)
estonia Latvia and RussiaType 2; Upper Devonian karsted and fissured dolomites and limestones; groundwater flow direction from Estonia to Latvia and Russia, in certain areas from Latvia to Estonia; medium link with the Gauja/Koiva River.Area (km2) 1 330 N/ARenewable groundwater resource (m3/d) 50 000 N/AThickness: mean, max (m) 20, 30 N/AGroundwater uses and functions Groundwater is mainly used for abstraction
of drinking water (21 594 m3/year).N/A
Other information Border lengths: 75.8 km (Estonian Latvian border), 63.1 km (Estonian Russian border);
Population ~45 200 (34 inhabitants/km2). Low vulnerability and good chemical status.
39 Based on information provided by Latvia. This groundwater body is designated in Latvian territory only. 40 Based on information provided by Latvia. This groundwater body is designated in Latvian territory only.
372 | part iv Chapter 8 Drainage basin of the baltic sea | 373
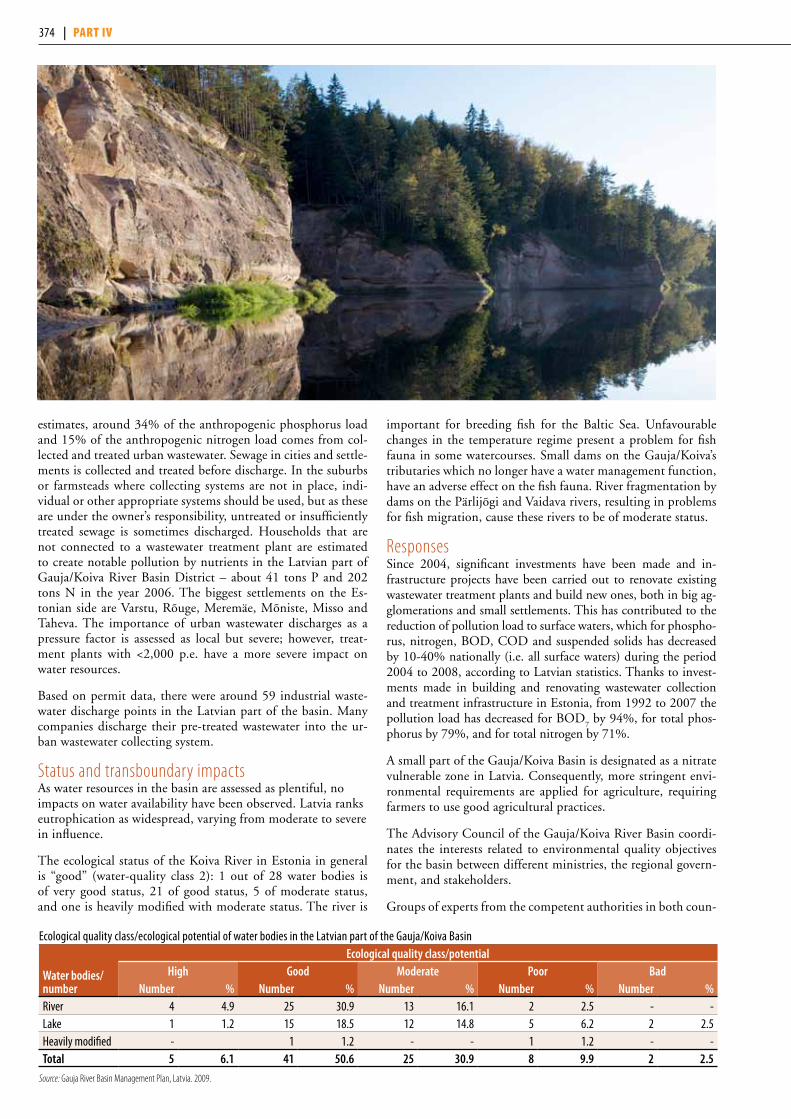
estimates, around 34% of the anthropogenic phosphorus load and 15% of the anthropogenic nitrogen load comes from col-lected and treated urban wastewater. Sewage in cities and settle-ments is collected and treated before discharge. In the suburbs or farmsteads where collecting systems are not in place, indi-vidual or other appropriate systems should be used, but as these are under the owner’s responsibility, untreated or insufficiently treated sewage is sometimes discharged. Households that are not connected to a wastewater treatment plant are estimated to create notable pollution by nutrients in the Latvian part of Gauja/Koiva River Basin District – about 41 tons P and 202 tons N in the year 2006. The biggest settlements on the Es-tonian side are Varstu, Rõuge, Meremäe, Mõniste, Misso and Taheva. The importance of urban wastewater discharges as a pressure factor is assessed as local but severe; however, treat-ment plants with <2,000 p.e. have a more severe impact on water resources.
Based on permit data, there were around 59 industrial waste-water discharge points in the Latvian part of the basin. Many companies discharge their pre-treated wastewater into the ur-ban wastewater collecting system.
Status and transboundary impactsAs water resources in the basin are assessed as plentiful, no impacts on water availability have been observed. Latvia ranks eutrophication as widespread, varying from moderate to severe in influence.
The ecological status of the Koiva River in Estonia in general is “good” (water-quality class 2): 1 out of 28 water bodies is of very good status, 21 of good status, 5 of moderate status, and one is heavily modified with moderate status. The river is
important for breeding fish for the Baltic Sea. Unfavourable changes in the temperature regime present a problem for fish fauna in some watercourses. Small dams on the Gauja/Koiva’s tributaries which no longer have a water management function, have an adverse effect on the fish fauna. River fragmentation by dams on the Pärlijõgi and Vaidava rivers, resulting in problems for fish migration, cause these rivers to be of moderate status.
Responses Since 2004, significant investments have been made and in-frastructure projects have been carried out to renovate existing wastewater treatment plants and build new ones, both in big ag-glomerations and small settlements. This has contributed to the reduction of pollution load to surface waters, which for phospho-rus, nitrogen, BOD, COD and suspended solids has decreased by 10-40% nationally (i.e. all surface waters) during the period 2004 to 2008, according to Latvian statistics. Thanks to invest-ments made in building and renovating wastewater collection and treatment infrastructure in Estonia, from 1992 to 2007 the pollution load has decreased for BOD
7 by 94%, for total phos-
phorus by 79%, and for total nitrogen by 71%.
A small part of the Gauja/Koiva Basin is designated as a nitrate vulnerable zone in Latvia. Consequently, more stringent envi-ronmental requirements are applied for agriculture, requiring farmers to use good agricultural practices.
The Advisory Council of the Gauja/Koiva River Basin coordi-nates the interests related to environmental quality objectives for the basin between different ministries, the regional govern-ment, and stakeholders.
Groups of experts from the competent authorities in both coun-
Ecological quality class/ecological potential of water bodies in the Latvian part of the Gauja/Koiva Basin
water bodies/number
ecological quality class/potential high good moderate poor Bad
number % number % number % number % number %River 4 4.9 25 30.9 13 16.1 2 2.5 - -Lake 1 1.2 15 18.5 12 14.8 5 6.2 2 2.5Heavily modified - 1 1.2 - - 1 1.2 - -Total 5 6.1 41 50.6 25 30.9 8 9.9 2 2.5
Source: Gauja River Basin Management Plan, Latvia. 2009.
374 | part iv

tries, established on the basis of a bilateral agreement between Latvia and Estonia (2003), meet regularly to exchange informa-tion and to coordinate issues important for the development of the River Basin Management Plans. All parties regard this cooperation as beneficial and satisfactory.
Trends According to the Koiva/Gauja RBMP agriculture has an ever-growing adverse impact on water bodies. Latvia’s Envi-ronmental Protection Law (adopted in 2006/2007) is reported as a means in place for the integration of water management issues in instruments related to other sectors. Latvia’s National Development Plan 2007-2013 includes such water management objectives as the development of water service infrastructure, the reduction of environment pollution, and the sustainable use of water resources. The National Environmental Action Plan for Estonia (2007-2013) defines long-term development trends for maintaining the good status of the natural environment (includ-ing of waters). The population in the Estonian territory is ex-pected to remain stable until 2015.
The Gauja/Koiva is a part of the KALME project (2006-2009) aimed at investigating how climate change can potentially in-fluence water resources in Latvia. Current predicted impacts of climate change on water resources in Latvia are summarized in the assessment of the Daugava.
daugava river Basin41
Belarus, Latvia, the Russian Federation and Lithuania share the basin of the 1,020-km long Daugava42 River. The Daugava has
its source in the Valdai Hills in the Russian Federation, and dis-charges into the Gulf of Riga in the Baltic Sea.
The Usvyacha, the Kasplya (Belarus, the Russian Federation) and the Disna (Belarus, Lithuania) are transboundary tributaries.
Basin of the Daugava River Country Area in the country (km2) Country’s share (%)Belarus 33 200a 47.9
Latvia 24 700 35.7
Russian Federation 9 500 13.7
Lithuania 1 871 2.7
Total 69 271a The population data is from 2009. Source (country shares): Belarus — Blue treasure Belarus: Encyclopedia. Minsk, 2007. Other countries — United Nations World Water Development Report, first edition, 2003. Total area — Working Group on the Western Dvina Basin, operating under the joint Russian-Belarusian commission. Also source for population data.
Hydrology and hydrogeologySurface water resources in the Latvian part of the basin are estimated to amount to some 20.268 km3/year. Groundwater resources are estimated at 0.186 km3/year. The total water re-sources, 20.454 km3/year, equals 14,929 m3/year/capita in the Latvian part.
In the Belarussian part, surface water resources are estimated at approximately 6.8 km3/year, and groundwater resources at 2.69 km3/year, adding up to a total of 9.49 km3/year.
Groundwater body D4 (No. 176) (in Latvia) is partly located within the Daugava Basin, but as it borders with Lithuania in the Lielupe Basin, it is assessed as part of the Lielupe Basin.
41 Based on information provided by Belarus, Latvia, Lithuania and the Russian Federation as well as the First Assessment. 42 The river is also known as Dauguva and Western Dvina (Zapadnaya Dvina).43 Based on information from Latvia. Corresponds spatially with aquifer “Sventoji-Arunula” (No. 66) of the Inventory of Transboundary Groundwaters by the
UNECE Task Force on Monitoring and Assessment (1999), with Latvia and Lithuania as the riparian countries, but later identified as “Sventoji-Arunula/Sventosios-Upninky.
44 Based on information from Latvia and Belarus. Corresponds spatially with aquifer “Sventoji-Arunula” (No. 66) of the Inventory of Transboundary Groundwaters by the UNECE Task Force on Monitoring and Assessment (1999), with Latvia and Lithuania as the riparian countries, but later identified as “Sventoji-Arunula/Sventosios-Upninky.
D10/poLoTSk AnD LAnSkY TeRRigenouS CompLex of miDDLe AnD uppeR DevoniAn AquifeR (no. 172)43
Latvia Lithuania BelarusType 4; sand, sandstone and siltstone of Middle and Upper Devonian age; weakly linked with surface water. Area (km2) N/A 753 N/AThickness: mean, max (m) N/A 150 100 –150, 200Groundwater uses and functions
N/A Public and individual drinking water supply.
Groundwater is mainly use for drinking and household water.
Other information Border lengths ~55 km LT-LV, 15 km with LT-BY Correspond to Upper – Middle Devonian (LT 001004500).
Transboundary aquifers are not being monitored. A gradual development
of a network of observation wells for transboundary groundwater is
planned from 2011 to 2015.
D9/uppeR DevoniAn TeRRigenouS-CARBonATe CompLex AquifeR (no. 173)44
Latvia Russian federation BelarusType 4; limestone, sandstone, marl of Devonian age; weakly linked with surface water. Thickness: mean, max (m) - , 325 N/A 100–150, 190Groundwater uses and functions
N/A N/A Groundwater is mainly use for drinking and household water.
Other information Transboundary aquifers are not being monitored. A gradual development
of a network of observation wells for transboundary groundwater is planned
from 2011 to 2015.
374 | part iv Chapter 8 Drainage basin of the baltic sea | 375

7
56
1
4
2
3
8
9
10
Vitsyebsk
Riga
Vilnius
Venta
Barta
Daugava
Lielupe MēmeleMūša
LakeDrisvyaty
BA
LT
IC
SE
A GULFOF RIGA
Nemunėlis
Dysna
Dvin
a
Zapa
dn
aya
Mezha
Kasplya
Drysa
Peded
ze
Lake LubanaAiviekste
Svento
ji
L A T V I A
B E L A R U S
R U S S I A N
F E D E R A T I O N
ESTONIA
L I T H U A N I A
25o
30o
55o
UNEP/DEWA/GRID-Geneva 2011The boundaries and names shown and the designations used on this mapdo not imply official endorsement or acceptance by the United Nations.
0 50 100 150 200Kilometres
Sources: UNEP/DEWA/GRID-Europe 2011; State Water Cadastre. Annual data on mode and surface water resources for 2008, vol. 3, National Weather Service, Minsk, 2009 (gauging station Vitebsk). and Source: Latvian Environment, Geology and Meteorology Centre (gauging station at Riga hydropower). Daugava River Basin Management Plan, 2009 (data for 2006).
10 Ri
ga
9 Vite
bsk
8 Veli
zh
Disch
arge
(m3 s-1
) (log
arith
mic
scale)
113
44
14
3320
227
2916
(Dau
gava
)
(Dau
gava
)
(Dau
gava
)1
10
100
1000
10000
20
636
QavQmaxQmin
Popu
latio
n (in
hun
dred
thou
sand
s)
0
3
6
9
12
15
Russ
ian Fe
dera
tion
Lithu
ania
Latv
iaBe
larus
13.7
0.6
10.4
2.0
Country information/otherLandScanTM
1%2%3%
22%
62%
10%
Urban/Industrial areas (<1%)Surface with little or no vegetation (<1%)
CultivatedForestGrassland/Shrubland
Others
Water bodiesWetlands
DiSChARgeS, popuLATion AnD LAnD CoveR in The DAugAvA RiveR BASin
376 | part iv

Pressures and transboundary impactsIn the russian part, the main pressures are urbanization, indus-trial production, agriculture, and, to a lesser degree, recreation, with the following as typical pollutants: ammonia-nitrogen, pe-troleum products, suspended substances, and organic substances.
According to 2006 estimates, the nitrogen load in the Latvian part of Daugava River Basin District was some 3,800 tons/year, and the phosphorus load some 120 tons/year from agricultural activi-ties, which is 47% and 18% of the total anthropogenic pressure.47 According to calculations made by the University of Latvia (Fac-ulty of Geography and Earth Sciences, 2010), in the period 2004 – 2008, the mean riverine load of the Daugava from all sources was 34,722 tons/year of total nitrogen, and 1,717 tons/year of total phosphorus. Most of the agricultural nitrogen load is from cropland and manure storage sites, and phosphorus from manure storage and grassland. The draining of agricultural land has inten-sified nutrient emissions. Some pollution of shallow groundwater by nutrients occurs in Latvia, but it is not neither widespread nor intense in the Daugava Basin. The impact of agriculture is as-sessed by Latvia and Belarus as widespread, but moderate. Nutri-ents have accumulated over the years in the reservoirs.
Latvia ranks the impact of the discharge of insufficiently treated municipal wastewater as widespread but moderate, Belarus as lo-cal but severe. Latvia estimates that 31% of the anthropogenic phosphorus load and 10% of the anthropogenic nitrogen load comes from collected and treated urban wastewater. A lack of treatment is a problem, especially in suburbs and farming areas. In 2006, some 25% of urban wastewater discharges (total discharges
32.7 × 10⁶ m3) in the Latvian part were not in line with national requirements. Forestry is a minor contributor; it is the source of some 8 to 15% of the nutrient load, based on 2006 figures.
In the Belarusian part, 103 × 106 m3 of wastewater was discharged to the Daugava in 2009, out of which Belarus reported 79 × 106 m3 to have been treated according to established standards.
Many companies discharge their industrial wastewaters into the urban wastewater collection system. The main industries in the Latvian part are food processing, wood processing, textile manu-facturing, power industry, and engineering and pharmaceutical industries; in the Belarusian part, the food processing and pet-rochemical industries. In the Latvian and Belarusian parts, the discharge of industrial wastewaters is considered severe in im-pact, but the scale varies from local to widespread. The Luko-molskaya Power Plant in Belarus is one source affecting water quality through wastewater discharges. According to Latvia, the pollution loads in 2006 for selected substances discharged with wastewater (both municipal and industrial wastewaters) in the Latvian part of the Daugava Basin were as follows: 1,933 tons of suspended solids, 1,182 tons BOD, 6,338 tons COD, 2263 tons nitrogen, 277 tons phosphorus and 12 tons of oil products.
The impact of some 136 old industrial and municipal dump sites — now closed or with planned remediation — is considered lo-cal, ranging from moderate to severe. Of local but severe influence are contaminated sites (125 contaminated and 1,065 potentially contaminated), many of which are a legacy from the Soviet Army, which are being gradually investigated and remediation is planned.
gRounDwATeR BoDY D8 (no. 174)45
Latvia Russian federation estoniaThis groundwater body consists of several aquifers, including the following Quaternary multi-aquifer systems: Pliavinias-Amulas and Arukila-Amata. Thickness: mean, max (m) -, 475 N/A N/AGroundwater uses and functions All aquifers are used for abstraction
of drinking water to some degree.N/A N/A
Other information The aquifers occur up to 400 m below the surface.
quATeRnARY SeDimenT AquifeR (no. 175)46
Latvia BelarusSand and gravel, sandy loam of Quaternary age; strongly linked with surface water. Thickness: mean, max (m) N/A 10–15, 95Groundwater uses and functions N/A Groundwater is mainly used for drinking
and household water.Other information Transboundary aquifers are not being monitored. A
gradual development of a network of observation wells for transboundary groundwater is planned from 2011 to 2015.
Total water withdrawal and withdrawals by sector in the Daugava Basin
Country YearTotal withdrawal
× 106 m3/year Agriculture % Domestic % industry % energy % other %Belarus 2000-2009a 197.5 15.6 39.7 37.7 6.5 0.5Latviab 2006 145.643 27.1 55.2 1.3 3.5 6.1Russian Federationc 2008 0.56 9.1 67.2 12.8 - 10.9Lithuania 2009 3.35 76 16 8 - -
a The withdrawal figure is an average for 2000-2009.b In the Latvian part of the basin, 36% of the total use is met from groundwater. Some 55.6 × 10⁶ m3/year of groundwater is abstracted, and 90.2 × 10⁶ m3/year of surface water is withdrawn.c Of the total withdrawal, 0.03 × 10⁶ m3/year is surface water, and 0.53 × 10⁶ m3/year is groundwater.
45 Based on information from Latvia. This groundwater body is designated in the Latvian territory only. Corresponds spatially with aquifer “Sventoji-Arunula” (No. 66) of the Inventory of Transboundary Groundwaters by the UNECE Task Force on Monitoring and Assessment (1999), with Latvia and Lithuania as the riparian countries, but later identified as “Sventoji-Arunula/Sventosios-Upninky.”
46 Based on information from Belarus.47 These figures are substantially lower than what was reported in the First Assessment as the results of the “Daugavas Project” (a bilateral Latvian-Swedish project),
which Latvia suspects to be a slight overestimation.
376 | part iv Chapter 8 Drainage basin of the baltic sea | 377

The impact of hydromorphological changes ranges from moder-ate to severe according to Latvia, but remains local. In the Latvi-an part, there are three big hydropower stations — Ķegums (total capacity 264 MW), Plavinu (869 MW) and Riga (402 MW) — and 44 small ones (capacities ranging from 11 kW up to 1,000 kW); the Riga harbour, 25 polders and a large number of regu-lated small rivers are also located in the basin. 2 lakes and 13 river water bodies within the basin in Latvia are classified as heavily modified water bodies. On its territory, Belarus plans to build several hydroelectric plants.
In some parts of the basin on Latvian territory, spring floods and naturally-occurring iron and sulphate in groundwater (due to which pre-treatment is required) have a widespread impact. The need for iron removal has also widespread implications in the Belarusian part.
Latvia assesses the transboundary impact in the form of pollution load as widespread, with about 70% of both nitrogen and phos-phorus load to the Daugava coming from outside its borders.48 Pollution sources in the Russian part of the basin cause trans-boundary impact on downstream Belarus by increased concen-trations of iron, zinc compounds and manganese.
StatusThe chemical status of the river in the Belarussian part dur-ing the past five years has remained "stable"; improvements in water quality relate to petroleum products, ammonia nitrogen, inorganic phosphorus and total phosphorus. According to the classification of water resources adopted in Belarus, some 21% of the waters in the basin are classified as "clean", 74% as "rela-tively clean" and almost 5% as "moderately polluted".49
Responses and transboundary cooperationA small part of the Daugava River Basin in Latvia is designated as a nitrate vulnerable zone where more stringent environmental requirements for agriculture should be applied. In practice, this indicates that farmers are required to construct manure storages, elaborate fertilisation plans, and comply with related require-ments. The other measures applied to reduce nutrient pollution include setting up protected belts around water bodies where the application of fertilizers and herbicides is prohibited (planned), requiring permits for polluting activities, and applying the Natu-ral Resources Tax system to the emission of polluting substances.
Latvia reports that, thanks to the reconstruction of water sup-ply systems in recent years, water losses in the supply system de-creased by 26-41% from 2004 to 2009. According to Latvian national statistics, the pollution load (phosphorus, nitrogen, BOD, COD and suspended solids) in surface waters decreased by 10-40% during 2004 to 2008. Treatment facilities have also been built or reconstructed in Belarus, the construction of a col-lector in Braslav on the Druyka River has stopped the discharge of wastewater to Lake Boloyso. Among other measures taken by Belarus is the establishment of water protection zones around water bodies, with limitations to economic and other activities.
The Advisory Council of the Daugava River Basin coordinates, in the Latvian part, the interests of Government institutions (in-cluding 5 ministries), regional governments, non-governmental organizations, entrepreneurs and other stakeholder groups, in or-der to achieve environmental quality in the Daugava River Basin.
On the basis of a technical protocol on the joint management
of the Daugava, Lielupe and Venta River Basin Districts, signed by Latvian and Lithuanian Ministers of the Environment, ex-pert groups consisting of competent authorities in both countries meet regularly to exchange information and to coordinate issues related to River Basin Management Plans.
A draft of an Agreement on Cooperation in the Field of Use and Pro-tection of Water Resources in the Zapadnaya Dvina/Daugava River Basin exists, involving Belarus, Latvia and the Russian Federation, but its ratification is reported to hardly have advanced since 2004.
TrendsThe land use/land cover situation in the Latvian part of the basin is expected to remain very stable, with no change in agricultural land area and only minor change in forest cover. Due to the pop-ularity of some areas in the Latvian part for recreational use, some water-quality deterioration may occur because of that pressure.
Further improvements of existing wastewater treatment plants and the construction of new ones is expected in Latvia, given the continued implementation of UWWTD. Specific objec-tives related to the development of water service infrastructure — but also to water management and the reduction of envi-ronmental pollution — are specified in Latvia’s National De-velopment Plan 2007-2013. The number of inhabitants in the Latvian part of the Daugava River Basin District is predicted to decrease by 6% - 7%, but in Latgale region by 9-11%. Popula-tion growth is only expected in and around Rīga.50
Flood management is expected to improve in Latvia thanks to the implementation of the EU Floods Directive and available EU funds for flood protection measures.
According to observations, in some areas in Latvia, the average amount of precipitation has increased in January, February and March, but decreased in September.
Compared with the 1961-1990 reference period, the annual sum of precipitation is predicted to increase by 4–11% in the 2070–2100 period in Latvia. Monthly precipitation is pre-dicted to increase in winter (December - February) and in the beginning of summer (May, June), but to decrease in summer (July - September). The number of days with intensive precipi-tation is predicted to increase by 20 – 100 (more than 10 mm in twenty-four hours). Due to climate change, periods without precipitation - more than 5 days long - are expected to occur more frequently in Latvia.
The potential influence of climate change on lakes and rivers in Latvia, as well as on coastal waters has been investigated through
48 For comparison, during the First Assessment (2007), it was reported that about 50% of the measured nutrient load originated from Latvia. The above-mentioned calculations, performed by the University of Latvia, state that 67% of the N
tot and 74% of P
tot Daugava riverine load comes from outside Latvia.
49 Source: Key figures for sanitation 2000-2009 in the basin of the Daugava (actual water consumption and sewage discharge in the Republic of Belarus). 50 Source: Daugava River Basin Management Plan, 2009 (approved).
378 | part iv

the KALME research project (2006-2009), which also aimed at preparing proposals related to adaptation. Among the recom-mended adaptation measures are, for example, the creation of buffer strips in the vicinity of water bodies, the construction of sedimentation basins/artificial wetlands in melioration ditches, and the avoidance of clear cutting.
Average annual discharge is predicted to decrease due to an in-crease in the average air temperature and higher evapotranspira-tion. Discharges in winter are expected to increase considerably, with earlier spring flooding and reduced flood peaks.
laKe drisvyata/druKsiai51
Lake Drisvyata/Druksiai is a transboundary lake shared between Belarus and Lithuania. The area of the lake is 44.5 km2. The catchment area is 604/62152 km2.
Lake Drisvyata/Druksiai is very susceptible to anthropogenic im-pact, which until recently also included thermal pollution from the Ignalina nuclear power plant in Lithuania, which was closed at the end of 2009 (the lake was used as a cooling reservoir).
lielupe river Basin53
The basin of the Lielupe is shared by Latvia and Lithuania. The Lielupe River originates in Latvia at the confluence of two trans-boundary rivers: the 157-km long Musa River and the 199-km long Nemunelis River (or the Memele). It discharges into the Baltic Sea. The Musa has its source in the Tyrelis bog (Lithuania) and the Memele River in the Aukstaitija heights west of the town of Rokiškis (Lithuania). There are numerous other small tributar-ies of the Lielupe River, originating in Lithuania.
Basin of the Lielupe River Country Area in the country (km2) Country’s share (%)Latvia 2 155
Lithuania 1 892
nemunelis sub-total
4 047
Latvia 166
Lithuania 5 297
musa sub-total 5 463
Latvia 8 662 49.2
Lithuania 8 938 50.8
Total 17 600
Source: Lielupe River Basin Management plan 2009.
Hydrology and hydrogeologyThe surface water resources generated in the Latvian part of the Lielupe Basin are estimated at 1,844 × 106 m3/year, and the groundwater resources at 63.34 × 10⁶ m3/year, adding up to a total of 1,907 × 106 m3/year.
PressuresAgricultural lands cover a significant part of the Lielupe River Basin (around 52% in the Latvian part), and their share is even larger in the Lithuanian part. According to observations in 2006, some 2,461t of nitrogen and 66t of phosphorus were discharged from agriculture, corresponding respectively to 73% and 37% of the total anthropogenic nitrogen and phosphorus loads in the Latvian territory of the Lielupe Basin. In the some parts of the river basin, pollution of shallow groundwater due to intensive agricultural activities has been detected. Nutrients released from forestry are local and moderate in influence, accounting for, re-
51 Based on information provided by Belarus and the First Assessment. 52 The catchment area is 604 km2 according to Belarus and 621 km2 according to Lithuania. 53 Based on information provided by Latvia, Lithuania and on the First Assessment. 54 Based on information from Latvia. This groundwater body is designated for the needs of River Basin Management Plans in the Latvian territory only.55 Based on information from Latvia. This groundwater body is designated for the needs of River Basin Management Plans in the Latvian territory only. The areas of
the groundwater bodies are not coordinated between Latvia and Lithuania.
gRounDwATeR BoDY D4/uppeR DevoniAn STipinAi (LT002003400) (no. 176) AnD uppeR – miDDLe DevoniAn (LT001003400) (no. 177)54
Latvia LithuaniaHalf of the D4 groundwater body is located in the Daugava River Basin District, the other is in the Lielupe River Basin District. Only the part in the Lielupe River Basin District borders with Lithuania. This groundwater body consists of several aquifers, including the following multi – aquifer systems: Quaternary; Pliavinias-Amulas; Arukila – Amata. Area (km2) 1 879 (Upper Devonian Stipinai), 4 448
(Upper-Middle Devonian)Thickness: mean, max (m) 110, 322 20 (Upper Devonian Stipinai), 140 (Upper-Middle Devonian)Groundwater uses and functions Drinking water. Public and individual drinking water supply.Other information A small part of groundwater body D4 has a
poor chemical status due to seawater intrusion. Subsequently groundwater abstraction was reduced
and groundwater levels gradually restored. The aquifers lie up to 180–190 m below the ground surface.
Border length ~17 km (Upper Devonian Stipinai), ~190 km (Upper-Middle Devonian). Groundwater in some wellfields of
Upper Devonian Stipinai aquifer has high amount of sulphates of natural origin. National codes: Upper Devonian Stipinai
(LT002003400) and Upper -Middle Devonian (LT001003400).
gRounDwATeR BoDY f3 (no. 178)55
Latvia LithuaniaThis groundwater body includes several aquifers, some are transboundary. Area (km2) N/A 1063Thickness: mean, max (m) N/A 40Groundwater uses and functions Used for drinking water and for technical needs. Public and individual drinking water supply.Other information The maximum depth is ~ 135 m from the ground surface.
Population density 36 inhabitants/km2 (average for the Lielupe RBD).”
Good quantitative and chemical status; corresponds to Permian-Upper Devonian (LT003003400).
378 | part iv Chapter 8 Drainage basin of the baltic sea | 379

spectively, some 12% of the total nitrogen and 8% of the total phosphorus loads in the Latvian part (2006 estimates).
There are around 172 urban wastewater discharge points in the Latvian part of the river basin, significantly influencing the qual-ity of four water bodies (out of 45). Some 28% of anthropogenic phosphorus load and 8% of anthropogenic nitrogen load is esti-mated to come from collected and treated urban wastewater. In the suburbs or farmsteads without wastewater collecting systems, individual or other appropriate systems should be used, but this is subject to the responsibility of private owners. Many compa-nies use the urban sewer network for their discharges, but there are around 40 industrial wastewater discharge points in the basin. Some leaks of untreated wastewater may occur from deteriorat-ing sewage collecting systems.
Naturally high iron, sulphate and other element concentrations make pre-treatment of groundwater, if used as a source of drink-ing water, widely needed.
There are 18 small hydropower stations and 29 water bodies with regulated small rivers in the basin, which cause hydromorpholog-ical changes of local extent. Other pressure factors of local impact in the Latvian part of the basin are landfills (two for municipal and one for hazardous waste), and contaminated sites. Recon-struction of these landfills according to national and EU require-ments is expected to reduce possible pollution. There are some 56 closed industrial and municipal dump sites, the remediation of which is either completed or foreseen. There are some 32 con-taminated and 462 potentially contaminated sites in the Latvian part of the basin which are being assessed for remediation.
gRounDwATeR BoDY A (no. 179)56
Latvia LithuaniaThis groundwater body includes several aquifers, some are transboundary.Area (km2) 508Thickness: mean, max (m) -, 350 >200Groundwater uses and functions Used for drinking water and for technical needs. Public and individual drinking water supply.Other information Its maximum depths are ~ 470 m from the ground surface.
Population density 36 inhabitants/km2 (average for the Lielupe RBD).
This aquifer is considered as being at risk due to high content of natural sulphates, which
could increase because of groundwater abstraction. Therefore, operational groundwater monitoring
is necessary. This aquifer partly corresponds to Upper – Middle Devonian aquifer in Joniškis GWB (LT LT0010023400), but the boundaries currently
do not match at the border between the States.
DiSChARgeS, popuLATion AnD LAnD CoveR in The LieLupe RiveR BASin
Sources: UNEP/DEWA/GRID-Europe 2011; Lielupe River Basin Management plan 2009 (population). Note: The map in the assessment of the Daugava should be referred to for the locations of the gauging stations.
7 Mez
otne
6 Pan
emun
is
5 Salo
ciai
Disch
arge
(m3 s-1
) (log
arith
mic
scale)
8320
123
(Mūš
a)
(Nem
unėli
s)
(Liel
upe)
QavQmaxQmin
2
722
102
9
0.1
1
100
10
1000
0.2
Popu
latio
n (in
hun
dred
thou
sand
s)0
1
2
3
4
5
Lithu
ania
Latv
ia
3.2
3.9
Country information/other 1%1%2%
51%34%
11%
Surface with little or no vegetation (<1%)Water bodies (<1%)
CultivatedForestGrassland/Shrubland
Others
Urban/Industrial areasWetlands
Total water withdrawal and withdrawals by sector in the Lielupe Basin
CountryTotal withdrawal
×106 m3/year Agricultural % Domestic % industry % energy % other %
Latvia 15.28 6.26 45.61 25.27 8.92 13.93Lithuania 10.66a 2 62 19 2 15
Note: The figures for Latvia are from 2008. Groundwater is broadly used for drinking water in the Latvian part but it is also used in industry: about 80% of total water use is groundwater (some 16.9 million m3 abstracted annually).a The data for Lithuania is from 2009.
56 Based on information from Latvia. This groundwater body is designated for the needs of River Basin Management Plans in the Latvian territory only. The areas of the groundwater bodies are not coordinated between Latvia and Lithuania.
380 | part iv
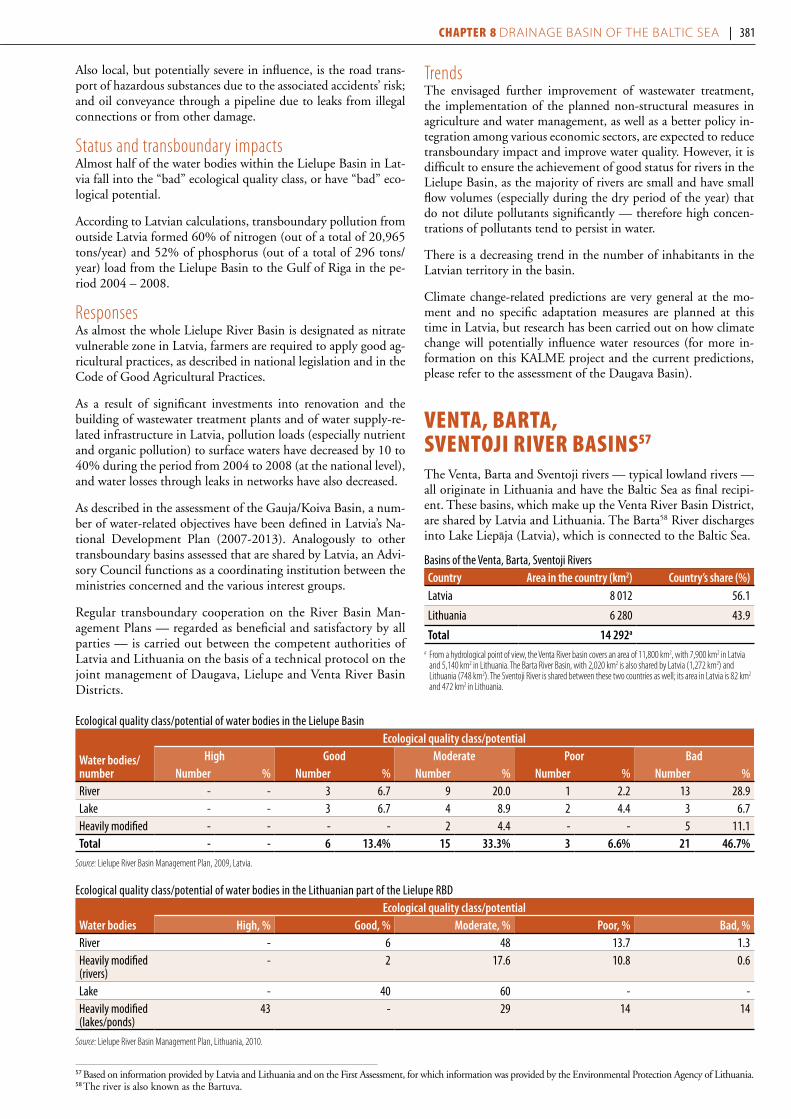
Also local, but potentially severe in influence, is the road trans-port of hazardous substances due to the associated accidents’ risk; and oil conveyance through a pipeline due to leaks from illegal connections or from other damage.
Status and transboundary impacts Almost half of the water bodies within the Lielupe Basin in Lat-via fall into the “bad” ecological quality class, or have “bad” eco-logical potential.
According to Latvian calculations, transboundary pollution from outside Latvia formed 60% of nitrogen (out of a total of 20,965 tons/year) and 52% of phosphorus (out of a total of 296 tons/year) load from the Lielupe Basin to the Gulf of Riga in the pe-riod 2004 – 2008.
Responses As almost the whole Lielupe River Basin is designated as nitrate vulnerable zone in Latvia, farmers are required to apply good ag-ricultural practices, as described in national legislation and in the Code of Good Agricultural Practices.
As a result of significant investments into renovation and the building of wastewater treatment plants and of water supply-re-lated infrastructure in Latvia, pollution loads (especially nutrient and organic pollution) to surface waters have decreased by 10 to 40% during the period from 2004 to 2008 (at the national level), and water losses through leaks in networks have also decreased.
As described in the assessment of the Gauja/Koiva Basin, a num-ber of water-related objectives have been defined in Latvia’s Na-tional Development Plan (2007-2013). Analogously to other transboundary basins assessed that are shared by Latvia, an Advi-sory Council functions as a coordinating institution between the ministries concerned and the various interest groups.
Regular transboundary cooperation on the River Basin Man-agement Plans — regarded as beneficial and satisfactory by all parties — is carried out between the competent authorities of Latvia and Lithuania on the basis of a technical protocol on the joint management of Daugava, Lielupe and Venta River Basin Districts.
Trends The envisaged further improvement of wastewater treatment, the implementation of the planned non-structural measures in agriculture and water management, as well as a better policy in-tegration among various economic sectors, are expected to reduce transboundary impact and improve water quality. However, it is difficult to ensure the achievement of good status for rivers in the Lielupe Basin, as the majority of rivers are small and have small flow volumes (especially during the dry period of the year) that do not dilute pollutants significantly — therefore high concen-trations of pollutants tend to persist in water.
There is a decreasing trend in the number of inhabitants in the Latvian territory in the basin.
Climate change-related predictions are very general at the mo-ment and no specific adaptation measures are planned at this time in Latvia, but research has been carried out on how climate change will potentially influence water resources (for more in-formation on this KALME project and the current predictions, please refer to the assessment of the Daugava Basin).
venta, Barta, sventoji river Basins57
The Venta, Barta and Sventoji rivers — typical lowland rivers — all originate in Lithuania and have the Baltic Sea as final recipi-ent. These basins, which make up the Venta River Basin District, are shared by Latvia and Lithuania. The Barta58 River discharges into Lake Liepāja (Latvia), which is connected to the Baltic Sea.
Basins of the Venta, Barta, Sventoji Rivers Country Area in the country (km2) Country’s share (%)Latvia 8 012 56.1
Lithuania 6 280 43.9
Total 14 292a
a From a hydrological point of view, the Venta River basin covers an area of 11,800 km2, with 7,900 km2 in Latvia and 5,140 km2 in Lithuania. The Barta River Basin, with 2,020 km2 is also shared by Latvia (1,272 km2) and Lithuania (748 km2). The Sventoji River is shared between these two countries as well; its area in Latvia is 82 km2 and 472 km2 in Lithuania.
57 Based on information provided by Latvia and Lithuania and on the First Assessment, for which information was provided by the Environmental Protection Agency of Lithuania. 58 The river is also known as the Bartuva.
Ecological quality class/potential of water bodies in the Lielupe Basin
water bodies/number
ecological quality class/potential high good moderate poor Bad
number % number % number % number % number %River - - 3 6.7 9 20.0 1 2.2 13 28.9Lake - - 3 6.7 4 8.9 2 4.4 3 6.7Heavily modified - - - - 2 4.4 - - 5 11.1Total - - 6 13.4% 15 33.3% 3 6.6% 21 46.7%
Source: Lielupe River Basin Management Plan, 2009, Latvia.
Ecological quality class/potential of water bodies in the Lithuanian part of the Lielupe RBD
water bodiesecological quality class/potential
high, % good, % moderate, % poor, % Bad, %River - 6 48 13.7 1.3Heavily modified (rivers)
- 2 17.6 10.8 0.6
Lake - 40 60 - -Heavily modified (lakes/ponds)
43 - 29 14 14
Source: Lielupe River Basin Management Plan, Lithuania, 2010.
380 | part iv Chapter 8 Drainage basin of the baltic sea | 381
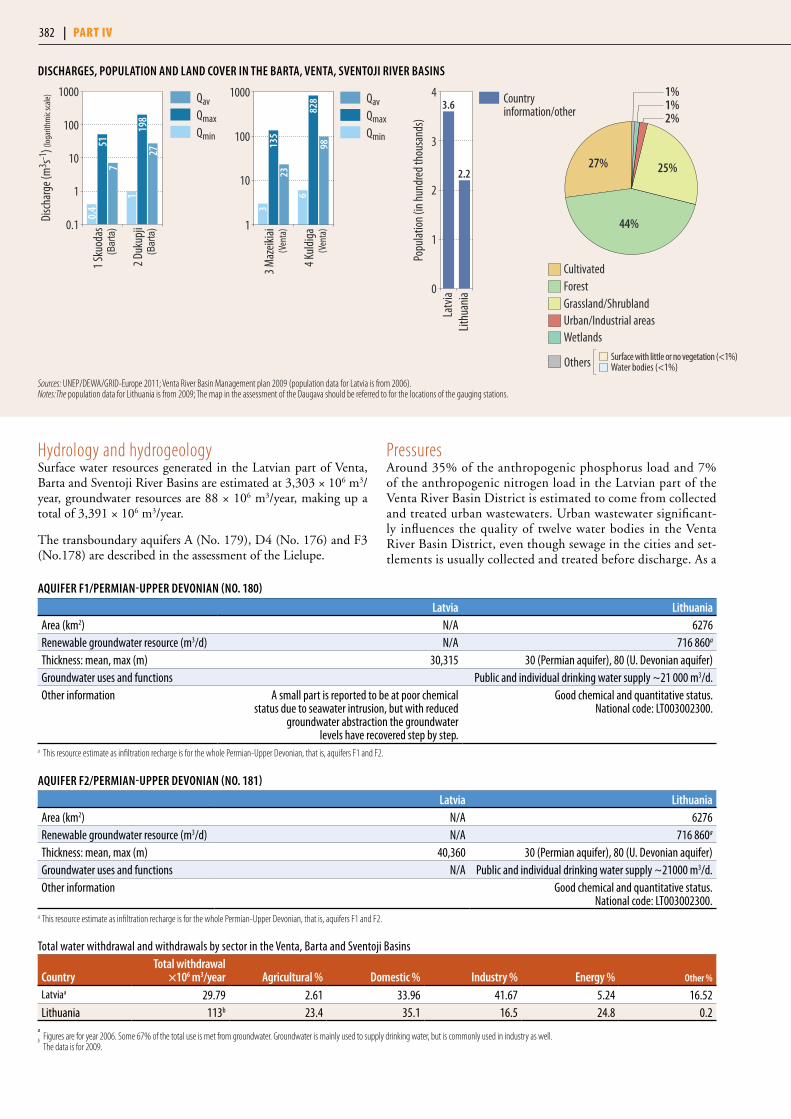
Hydrology and hydrogeologySurface water resources generated in the Latvian part of Venta, Barta and Sventoji River Basins are estimated at 3,303 × 106 m3/year, groundwater resources are 88 × 106 m3/year, making up a total of 3,391 × 106 m3/year.
The transboundary aquifers A (No. 179), D4 (No. 176) and F3 (No.178) are described in the assessment of the Lielupe.
PressuresAround 35% of the anthropogenic phosphorus load and 7% of the anthropogenic nitrogen load in the Latvian part of the Venta River Basin District is estimated to come from collected and treated urban wastewaters. Urban wastewater significant-ly influences the quality of twelve water bodies in the Venta River Basin District, even though sewage in the cities and set-tlements is usually collected and treated before discharge. As a
DiSChARgeS, popuLATion AnD LAnD CoveR in The BARTA, venTA, SvenToji RiveR BASinS
Sources: UNEP/DEWA/GRID-Europe 2011; Venta River Basin Management plan 2009 (population data for Latvia is from 2006). Notes:The population data for Lithuania is from 2009; The map in the assessment of the Daugava should be referred to for the locations of the gauging stations.
2 Duk
upji
1 Sku
odas
Disch
arge
(m3 s-1
) (log
arith
mic
scale)
517
198
27
(Bar
ta)
(Bar
ta)
0.1
1
100
10
1000
1
QavQmaxQmin
0.4
Popu
latio
n (in
hun
dred
thou
sand
s)
0
1
2
3
4
Lithu
ania
Latv
ia
3.6
2.2
Country information/other 2%
1%1%
27%
44%
25%
Water bodies (<1%)Surface with little or no vegetation (<1%)
CultivatedForestGrassland/Shrubland
Others
Urban/Industrial areasWetlands
AquifeR f1/peRmiAn-uppeR DevoniAn (no. 180)
Latvia LithuaniaArea (km2) N/A 6276Renewable groundwater resource (m3/d) N/A 716 860a
Thickness: mean, max (m) 30,315 30 (Permian aquifer), 80 (U. Devonian aquifer)Groundwater uses and functions Public and individual drinking water supply ~21 000 m3/d.Other information A small part is reported to be at poor chemical
status due to seawater intrusion, but with reduced groundwater abstraction the groundwater
levels have recovered step by step.
Good chemical and quantitative status. National code: LT003002300.
a This resource estimate as infiltration recharge is for the whole Permian-Upper Devonian, that is, aquifers F1 and F2.
AquifeR f2/peRmiAn-uppeR DevoniAn (no. 181)
Latvia LithuaniaArea (km2) N/A 6276Renewable groundwater resource (m3/d) N/A 716 860a
Thickness: mean, max (m) 40,360 30 (Permian aquifer), 80 (U. Devonian aquifer)Groundwater uses and functions N/A Public and individual drinking water supply ~21000 m3/d.Other information Good chemical and quantitative status.
National code: LT003002300.a This resource estimate as infiltration recharge is for the whole Permian-Upper Devonian, that is, aquifers F1 and F2.
Total water withdrawal and withdrawals by sector in the Venta, Barta and Sventoji Basins
CountryTotal withdrawal
×106 m3/year Agricultural % Domestic % industry % energy % other %
Latviaa 29.79 2.61 33.96 41.67 5.24 16.52Lithuania 113b 23.4 35.1 16.5 24.8 0.2
a Figures are for year 2006. Some 67% of the total use is met from groundwater. Groundwater is mainly used to supply drinking water, but is commonly used in industry as well.b The data is for 2009.
4 Kul
diga
3 Maz
eikiai
Disc
harg
e (m
3 s-1) (
loga
rithm
ic sc
ale)
135
23
828
98
(Ven
ta)
(Ven
ta)1
10
100
1000 QavQmaxQmin
3
6
382 | part iv
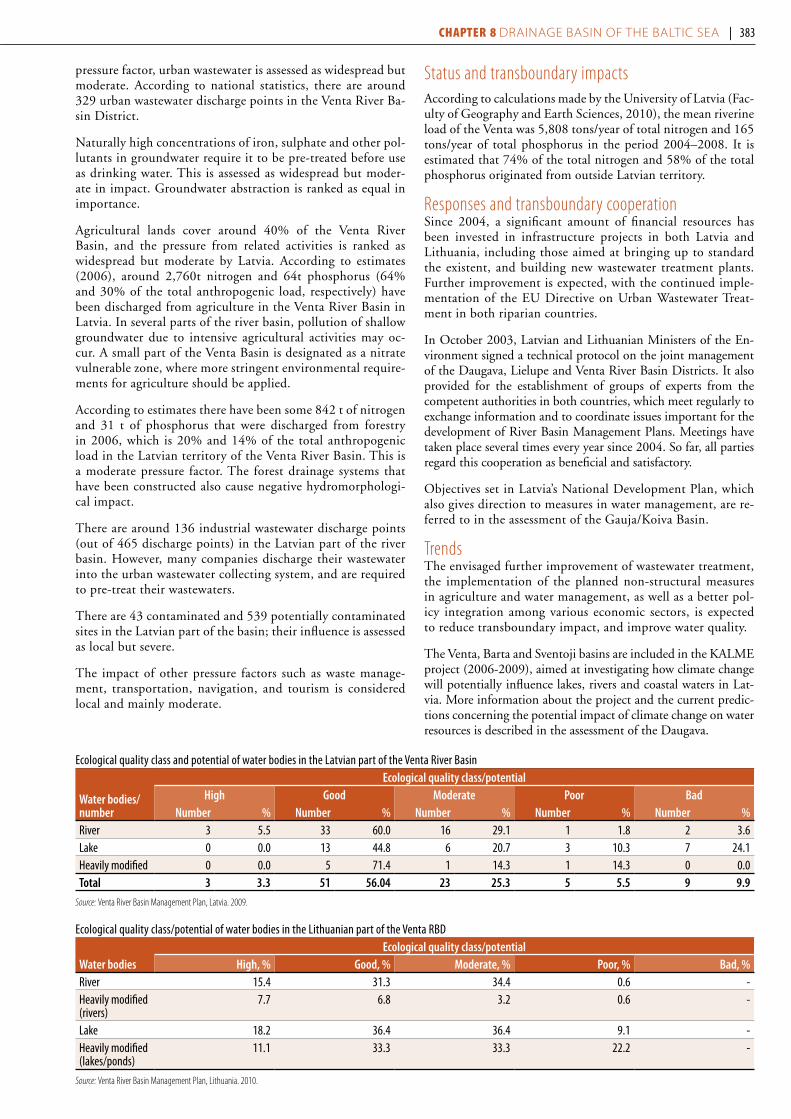
pressure factor, urban wastewater is assessed as widespread but moderate. According to national statistics, there are around 329 urban wastewater discharge points in the Venta River Ba-sin District.
Naturally high concentrations of iron, sulphate and other pol-lutants in groundwater require it to be pre-treated before use as drinking water. This is assessed as widespread but moder-ate in impact. Groundwater abstraction is ranked as equal in importance.
Agricultural lands cover around 40% of the Venta River Basin, and the pressure from related activities is ranked as widespread but moderate by Latvia. According to estimates (2006), around 2,760t nitrogen and 64t phosphorus (64% and 30% of the total anthropogenic load, respectively) have been discharged from agriculture in the Venta River Basin in Latvia. In several parts of the river basin, pollution of shallow groundwater due to intensive agricultural activities may oc-cur. A small part of the Venta Basin is designated as a nitrate vulnerable zone, where more stringent environmental require-ments for agriculture should be applied.
According to estimates there have been some 842 t of nitrogen and 31 t of phosphorus that were discharged from forestry in 2006, which is 20% and 14% of the total anthropogenic load in the Latvian territory of the Venta River Basin. This is a moderate pressure factor. The forest drainage systems that have been constructed also cause negative hydromorphologi-cal impact.
There are around 136 industrial wastewater discharge points (out of 465 discharge points) in the Latvian part of the river basin. However, many companies discharge their wastewater into the urban wastewater collecting system, and are required to pre-treat their wastewaters.
There are 43 contaminated and 539 potentially contaminated sites in the Latvian part of the basin; their influence is assessed as local but severe.
The impact of other pressure factors such as waste manage-ment, transportation, navigation, and tourism is considered local and mainly moderate.
Status and transboundary impactsAccording to calculations made by the University of Latvia (Fac-ulty of Geography and Earth Sciences, 2010), the mean riverine load of the Venta was 5,808 tons/year of total nitrogen and 165 tons/year of total phosphorus in the period 2004–2008. It is estimated that 74% of the total nitrogen and 58% of the total phosphorus originated from outside Latvian territory.
Responses and transboundary cooperationSince 2004, a significant amount of financial resources has been invested in infrastructure projects in both Latvia and Lithuania, including those aimed at bringing up to standard the existent, and building new wastewater treatment plants. Further improvement is expected, with the continued imple-mentation of the EU Directive on Urban Wastewater Treat-ment in both riparian countries.
In October 2003, Latvian and Lithuanian Ministers of the En-vironment signed a technical protocol on the joint management of the Daugava, Lielupe and Venta River Basin Districts. It also provided for the establishment of groups of experts from the competent authorities in both countries, which meet regularly to exchange information and to coordinate issues important for the development of River Basin Management Plans. Meetings have taken place several times every year since 2004. So far, all parties regard this cooperation as beneficial and satisfactory.
Objectives set in Latvia’s National Development Plan, which also gives direction to measures in water management, are re-ferred to in the assessment of the Gauja/Koiva Basin.
Trends The envisaged further improvement of wastewater treatment, the implementation of the planned non-structural measures in agriculture and water management, as well as a better pol-icy integration among various economic sectors, is expected to reduce transboundary impact, and improve water quality.
The Venta, Barta and Sventoji basins are included in the KALME project (2006-2009), aimed at investigating how climate change will potentially influence lakes, rivers and coastal waters in Lat-via. More information about the project and the current predic-tions concerning the potential impact of climate change on water resources is described in the assessment of the Daugava.
Ecological quality class and potential of water bodies in the Latvian part of the Venta River Basin
water bodies/number
ecological quality class/potential high good moderate poor Bad
number % number % number % number % number %River 3 5.5 33 60.0 16 29.1 1 1.8 2 3.6Lake 0 0.0 13 44.8 6 20.7 3 10.3 7 24.1Heavily modified 0 0.0 5 71.4 1 14.3 1 14.3 0 0.0Total 3 3.3 51 56.04 23 25.3 5 5.5 9 9.9
Source: Venta River Basin Management Plan, Latvia. 2009.
Ecological quality class/potential of water bodies in the Lithuanian part of the Venta RBD
water bodiesecological quality class/potential
high, % good, % moderate, % poor, % Bad, %River 15.4 31.3 34.4 0.6 -Heavily modified (rivers)
7.7 6.8 3.2 0.6 -
Lake 18.2 36.4 36.4 9.1 -Heavily modified (lakes/ponds)
11.1 33.3 33.3 22.2 -
Source: Venta River Basin Management Plan, Lithuania. 2010.
382 | part iv Chapter 8 Drainage basin of the baltic sea | 383

neman river Basin59
The basin of the Neman River60 is shared by Belarus, Latvia, Lithuania, Poland and the Russian Federation (Kaliningrad Oblast). The Neman River has its source in Belarus (Verkhnij Nemanec settlement), and discharges into the Baltic Sea. Ma-jor transboundary tributaries to the Neman include the Merkys (shared by Belarus and Lithuania; 203 km long), the Neris/Vilija (Belarus, Latvia and Lithuania; 510 km) and the Sesupe (Lithu-ania, Poland, Russian Federation; 298 km).
Lake Galadus,61 a transboundary lake shared by Lithuania and Poland, is part of the Neman River Basin District. In the Riv-er Basin District in Lithuania, there are 48 reservoirs (>1.5 km length and >0.5 km2 area), and 224 lakes (>0.5 km2 area). The basin has a pronounced lowland character.
Basin of the Neman River Country Area in the country (km2) Country’s share (%)Lithuania 46 695 47.7
Belarus 45 395 46.4
Russian Federationa 3 132 3.2
Poland 2 544 2.6
Latvia 98 0.1
Total 97 864a Kaliningrad oblast
Hydrology and hydrogeologyThe river is not regulated in the territory of the Russian Federation.
Aquifers in the basin — also transboundary — occur in Quater-nary sediments as well as in Jurassic (Oxfordian) and Cretaceous (Cenomanian) carbonate-terrigenous formations.
Surface water resources in the Belarusian part of the basin are es-timated at 8.9 km3/year, and groundwater resources at 4.94 km3/
year, adding up to a total of 13.84 km3/year.
In the Russian part (Kaliningrad oblast), surface water re-sources are estimated at 19.7 km3/year, of which some 0.6 km3/year is estimated to be formed in the territory of the Rus-sian Federation.62
In the Polish part of the Neman River Basin District, annual surface water resources are estimated at 0.473 km3. Available groundwater resources are estimated at 0.219 km3/year.
PressuresAgriculture significantly influences the status of water bodies in the Neman Basin, especially in the sub-basins of the Sesupe and Nevezis rivers. Its importance as a pressure factor, according to Belarus, is local but severe. Chemicals are transported to the river from agri-cultural facilities, and pond fisheries are a major source of pollution.
A substantial part of point source pollution comes from industry. Industry in Lithuania is mainly located in Alytus, Kaunas and Vilnius; in Belarus mainly around Grodno (assessed as local and moderate by Belarus). The dominating industrial sectors are food and beverages production, wood and wood products, textiles, chemicals and chemical products, metal products, equipment and furniture production.
The greatest human-induced pressures from urban wastewater discharges in the Belarusian part occur on the Neris River down-stream from Smorgon, and on the Neman River downstream from Grodno, Mostov and Stolbtsy (assessed as local but severe). The main pollutants are suspended solids, phosphates, BOD5
, ammonium-nitrogen, petroleum products and total iron. In the Russian part of the basin, urban wastewater discharges from Sovetsk into the Neman River and from Krasnoznamensk to its tributary – the Sesupe River. The Russian Federation estimates that the total volume of industrial wastewater discharged into the Neman is about 5.25 × 10⁶ m3/year, but licences to discharge have been issued only for a volume of 2.86 × 10⁶ m3/year. The
AquifeRS in quATeRnARY DepoSiTS ShAReD BY BeLARuS AnD LiThuAniA (no. 182)
Belarus LithuaniaType 2; sands, gravels, sandy loams of Quaternary age; groundwater flow direction from Belarus to Lithuania; strong links with surface waters. Area (km2) ~2 500Thickness: mean, max (m) 50-100, 120 10-20, 30 (same for both aquifers)Groundwater uses and functions N/A Primary aquifers for public and individual
drinking water supply.Other information Border length ~500 km. Two main intramorainic aquifers
are defined – Medininkai-Zemaitija and Zemaitija – Dainava corresponds to groundwater body LT005001100.
oxfoRDiAn-CenomAniAn CARBonATe-TeRRigenouS AquifeR (no. 183)
Belarus LithuaniaType 2; sands and sandstones of Jurassic (Oxfordian) and Cretaceous (Cenomanian) age; groundwater flow direction from Belarus to Lithuania; weak links with surface waters. Area (km2) N/A ~6 000Thickness: mean, max (m) 50-100, 120 10-20, 80Groundwater uses and functions N/A Secondary aquifer for public and
individual drinking water supply.Other information Border length ~420 km.
59 Based on information provided by Belarus, Lithuania and the Russian Federation, and the First Assessment.60 The river is also known as the Nemunas. Following the provisions of the Water Framework Directive, the basins of the Neman and Pregel form one River Basin
District, the Neman River Basin District, in Lithuania.61 The lake is also known as Lake Galadusys.62 Source: The main hydrological characteristics, Volume 4, Issue 3, Gidrometeoizdat, 1974.
384 | part iv

mAzuRSko-poDLASki Region AquifeR (no. 184)
poland Lithuania Belarus Russian federationBorder length (km) 320 90 N/A N/AArea (km2) 2 500 (shallow
groundwater), 7 000 (deep groundwater, 1 650
(alluvial groundwater)
N/A N/A
Thickness: mean, max (m) 10-20 10-20
N/A N/A
Groundwater uses and functions Drinking water, agriculture. Primary aquifers for public and individual
drinking water supply.
N/A N/A
Other information Agriculture is a potential pollution source.
Two main intramorainic aquifers are defined –
Grūda-Žemaitija and Medininkai-Zemaitija
uppeR CReTACeouS AquifeR (no. 185): uppeR CReTACeouS in Age
Lithuania Russian federationArea (km2) ~5000 N/AThickness: mean, max (m) 60-100 N/AGroundwater uses and functions Primary aquifer for public and individual
drinking water supply.N/A
Other information Border length 200 km. Pressure factors include industry, households, landfills and urban areas;
corresponds to groundwater body LT 004001100.
Total water withdrawal and withdrawals by sector in the Neman Basin
CountryTotal withdrawal
×106 m3/year Agricultural % Domestic % industry % energy % other %
Lithuania 2 629.7 55.3 22.6 16.2 0.1 5.8Belarus 412.6 15.6 68.0 15.1 0.2 1.1Russian Federation 12.07a 1.3 44.8 53.9 - -Polandb 6.4 - 78 22 - -
a Figures are for 2009. Some 5.92 × 10⁶ m3/year of surface water from the Neman is being used for industrial purposes. Total abstraction of groundwater in the Russian part of the basin is 6.15 × 10⁶ m3/year, with 87.6% used for household water, 9.8% for industry and 2.6% for agriculture.
b Withdrawal of groundwater only; according to available data there is no major withdrawal of surface water in the Neman River Basin in Poland.
384 | part iv Chapter 8 Drainage basin of the baltic sea | 385
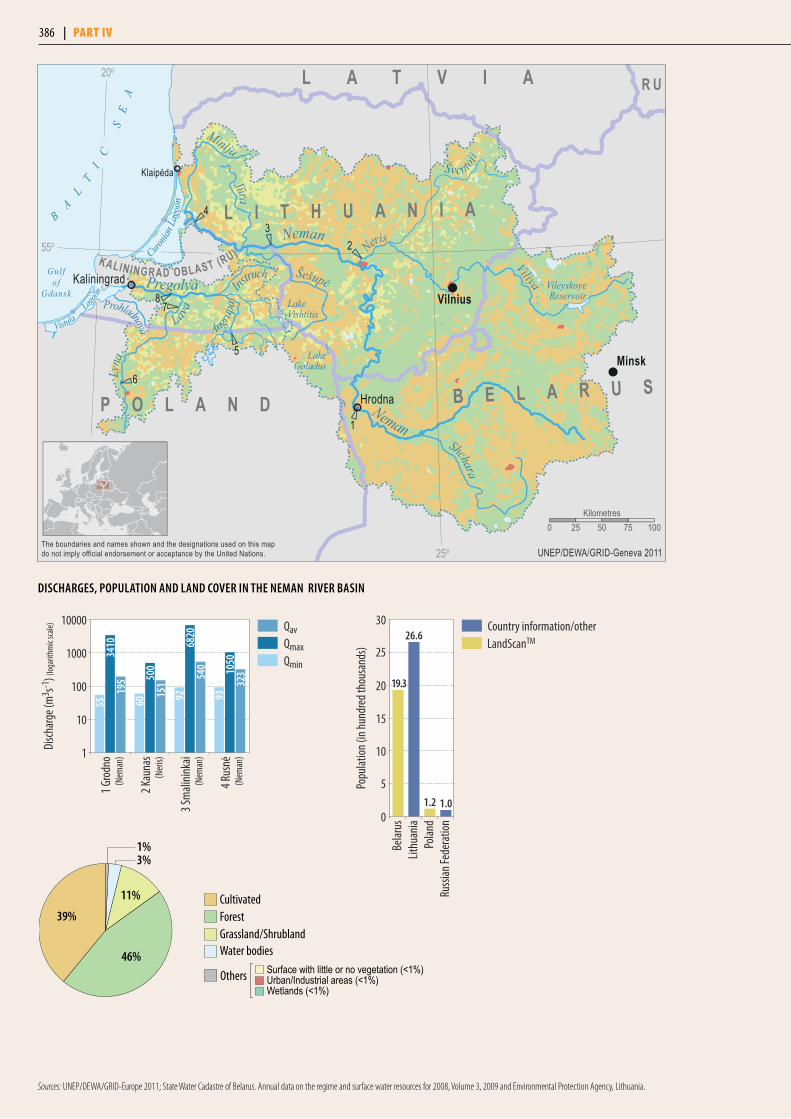
Sources: UNEP/DEWA/GRID-Europe 2011; State Water Cadastre of Belarus. Annual data on the regime and surface water resources for 2008, Volume 3, 2009 and Environmental Protection Agency, Lithuania.
1
23
4
6
87
5
KaliningradVilnius
Minsk
Hrodna
Klaipėda
B
AL
TI
C
SE
A
Lagoo
n
Curonia
n Lag
oon
Gul fof
GdanskProhladnaya
Pregolya Instruch
Angrapa
Lava
Lyna
Neman
Neman
LakeGaladus
VileyskoyeReservoir
Neris
Viliya
LakeVishtitis
Jūra
Minija
Shchara
Šešupė
Šventoji
Vistula
L A T V I A
L I T H U A N I A
B E L A R U SP O L A N D
R U
KALININGRAD OBLAST (RU)
20o
25o
55o
UNEP/DEWA/GRID-Geneva 2011The boundaries and names shown and the designations used on this mapdo not imply official endorsement or acceptance by the United Nations.
0 25 50 75 100Kilometres
4 Rus
nė
3 Sm
alinin
kai
2 Kau
nas
1 Gro
dno
Disch
arge
(m3 s-1
) (log
arith
mic
scale)
3410
195
55
6820
540 10
50
(Nem
an)
(Ner
is)
(Nem
an)
(Nem
an)1
10
100
1000
10000
92
323
QavQmaxQmin
93
500
151
60
Popu
latio
n (in
hun
dred
thou
sand
s)
0
5
10
15
20
25
30
Russ
ian Fe
dera
tion
Polan
dLit
huan
iaBe
larus
26.6
1.2
19.3
1.0
Country information/otherLandScanTM
3%1%
Urban/Industrial areas (<1%)Surface with little or no vegetation (<1%)
Wetlands (<1%)
39%
46%
11%
Others
Water bodies
CultivatedForestGrassland/Shrubland
DiSChARgeS, popuLATion AnD LAnD CoveR in The nemAn RiveR BASin
386 | part iv

Russian Federation assesses the impact of discharges of both ur-ban and industrial wastewaters as widespread and severe.
Iron and manganese concentrations are naturally elevated in groundwater, as is fluorine, to a lesser degree. The impact of this factor is assessed as widespread but moderate by Belarus.
Urban areas cover only some 1% of the Polish part of the river basin (mainly around Suwalki, the largest city in the region, with a population of approximately 71,000 inhabitants). About 74 % of the population is served by municipal wastewater treat-ment (5 large plants providing biological treatment). Due to on-going modernisation, the share of wastewater volume treat-ed with improved nutrients removal is increasing. However, a diffuse load from the scattered settlements not served by public networks remains a matter of concern, as well as agriculture and tourism.
Status and transboundary impactsThe results of observations show, over recent years, an improve-ment in the quality of surface waters in the basin of the Neman with regard to the concentration of priority pollutants. In the tributaries of the Neman, shared by Poland and Belarus, the levels of most priority pollutants also decreased. The chemical status of rivers in the basin has remained "stable" over the past five years, according to monitoring by Belarus. According to the Belarusian classification of water resources, 3.2% of water bodies are characterized as "clean", 93.6% as "relatively clean" and 3.2% as "moderately polluted".
According to the Centre for Hydrometeorology and Monitor-ing of Kaliningrad, Russian Federation, the water quality of the Neman upstream from the city of Neman got worse, as indicat-ed by the shift from the “moderately polluted” (2) category to “polluted” (3A), but in past years, quality seems to have fluctu-ated. A reverse change in water quality was observed above and below the town of Sovetsk, where water quality moved to the “polluted” (3A; in 2009) category, from “very polluted” (3B) and “dirty” (4A) in 2008, respectively, in the Russian water-quality classification. The water quality of the Sesupe (at the monitoring station Dolgoe) has also changed for better from “very polluted” (3B) in 2007 to “polluted” in 2008 and 2009.
According to recent monitoring data (assessed by the Inspec-tion for Environmental Protection), the status of surface wa-ters in the Polish part of the Neman River Basin District varies generally from moderate to good, both in terms of biological and physicochemical parameters. The quantitative and chemi-cal status of groundwaters is good.
Concentrations of specific pollutants in the Neman, 1.5 km downstream from the town of Sovetsk, Russian Federation, measured during the period 1993–2009
Determinand (unit)
number of measurements
Average value
minimum value
maximum value
COD (mg/l) 192 47 14.04 81.1
BOD5 (mg/l) 192 4.77 2.6 9.6
N-NH4 (mg/l) 192 0.66 0.034 3.34
N-NO2 (mg/l) 191 0.032 0.004 0.147
Phosphates (mg/l) 79 0.112 0.045 0.292
Mercury (µg/l) 28 0.015 0 0.087
Transboundary cooperation and responsesUnder the 2003 Agreement on Cooperation in the field of monitoring and the exchange of data on the state of trans-boundary water bodies, there is a monthly exchange of data on the hydrological and hydrochemical regime between the hy-drometeorology and environmental monitoring services (at the local Kaliningrad oblast level and Russian federal level on one hand; and the Lithuanian environmental authorities, on the other). Information about the monitoring programme (plans of monitoring, parameters, frequency, timetable of water sam-ples, maps of monitoring stations, etc.) is exchanged annually.
The Division of Water Resources in Kaliningrad oblast also participates in the bilateral exchange of information on ground-water abstraction volumes, wastewater discharges and loading of pollutants in the basin of the Neman River and the lagoon according to Russian federal statistics. A representative of the Centre for Hydrometeorology and Monitoring of Kaliningrad participates — as an expert of the Commission on the Environ-ment of the Russian-Lithuanian Council for long-term cooper-ation between regional and local authorities in the Kaliningrad oblast and in Lithuania — in the annual meetings held in the framework of the Council.
Groundwater monitoring of transboundary aquifers was ini-tiated in 2010, based on a bilateral agreement between the Lithuanian Geological Survey and the Kaliningrad Agency of Mineral Resources. Since 1994, groundwater monitoring in the transboundary area between Lithuania and Poland has been carried out jointly by the Lithuanian Geological Survey and the Polish Geological Institute.
figuRe 5: Trend in the concentrations of chemical oxygen demand (COD, blue) and biochemical oxygen demand (BOD
5, red) in the Neman, 1.5 km downstream from
the town of Sovetsk, Russian Federation, measured during the period 1993–2009
BOD 5 (
mg/
l)
COD
(mg/
l)
figuRe 6. Trend in the concentrations of ammonium-nitrogen (N-NH4, blue),
total iron (Fe, violet), nitrate-nitrogen (N-NO2, red) and phosphates (green) in
the Neman, 1.5 km downstream from the town of Sovetsk, Russian Federation, measured during the period 1993–200.
N-NH
4, Fe (
mg/
l)
N-NO
2 , pho
spha
tes (
mg/
l)
CODBOD5
N-NO2
N-NH4
Total iron Phosphates
386 | part iv Chapter 8 Drainage basin of the baltic sea | 387

Protective zones have been established around water bodies in Belarus to limit economic and other activities, and to reduce their impact.
To tackle the negative impact of wastewater discharges, waste-water treatment facilities have been built and reconstructed in Belarus. The volume of wastewater discharged to the Neman in Belarus has decreased from 157 × 106 m3 in 2001 to 128 × 106 m3 in 2009. In recent years, 85–90% of wastewater has been treated according to the standards. There is no joint monitoring of transboundary groundwaters. Belarus considers the current groundwater monitoring network not to be sufficiently informa-tive, and a network of monitoring wells for observing the state of transboundary groundwater is planned to be developed gradually from 2011-2015 in the framework of the “National Environ-mental Monitoring System” State Programme of Belarus.
According to the Russian Federation, there is room for develop-ment in monitoring, as the current list of monitored pollutants is limited; there is a lack of biological (hydrobiological, toxicology) observations; also a lack of monitoring pollutants in bottom sedi-ments; and a joint, harmonized monitoring programme for the transboundary watercourses is needed that meets the legislative requirements of the riparian countries.
laKe galadus/galandusys63
Lake Galadus/Galandusys (total surface area 7.37 km2, out of which 5.6 km2 is in Poland and 1.7 km2 in Lithuania) lies in the Podlasie region in Poland, and in the western part of the Lithu-anian Lake District.
Some 60% of the lake basin is agricultural land, and agriculture is causing euthrophication of the lake. Its current status can be
considered as “mesotrophic”, which corresponds to water-quality class 2 of the Polish classification. About 1,800 people live in over a dozen villages in the area, making the population density about 20 people/km2. The lake is used for recreational fishing, and there are also recreation residential plots around the lake.
pregel river Basin64
The basin of the Pregel65 River is shared by Poland, Lithuania and the Russian Federation. The river has its source in Poland and dis-charges into the Baltic Sea. The Pregel River has two transbound-ary tributaries, which have their sources in Poland: the 263.7 km long Lava River66 and the 139.9 km long Wegorapa (or Angerapp) River. The Pissa River is a transboundary tributary (98-km long).
The basin has a pronounced lowland character.
Basin of the Pregel River Country Area in the country (km2) Country’s share (%)Lithuania 65 0.4
Poland 7 520 53.6
Russian Federation 7 100 46
Total 14 685Sources: Environmental Protection Agency, Lithuania; National Water Management Authority, Poland; Hydrological study, Baltic Region, Volume 4, Gidrometeoizdat, 1963.
Hydrology and hydrogeology67
The plain area downstream is flooded annually in spring. During storm surges from the sea, the flow in the mouth of Pregel de-creases or ceases, and, the river water flows into the Vistula Lagoon.
The water resources in the Russian part of the basin are estimated at 2.9 km3/year (average for 1901 to 1980), out of which 1.52 km3/year is run-off from neighbouring countries.68
At 54 km from the mouth of the river, the flow of the Lava River is regulated by the Pravdinskaya hydropower station.
The available resources of groundwater in the Polish part of the basin are estimated at 0.463 km3/year, while the use does not exceed 10%.
PressuresIn the sub-basin of the Lava River, sewage discharge mainly originates from the municipal wastewater treatment plant at Olsztyn, with an amount of 32,600 m3/d. Other, smaller municipal discharges origi-nate at Pravdinsk (in the Russian part), Bartoszyce (3,400 m3/d), Lidzbark Warminski (2,720 m3/d), Dobre Miasto (1,500 m3/d), Stawigud (750 m3/d), Sepopol (150 m3/d), Tolek (130 m3/d), and, in the Russian part, at Znamensk. The discharge of municipal sew-age to the Pregel in the Russian part of the basin mainly originates from Gvardeysk, Tshernjahovsk and Kaliningrad cities. There are discharges to the tributaries from the Ozersk (to the Wegorapa) and the Gusev (the Pissa). Industrial wastewaters are discharged from the dairy production plant at Lidzbark Warminski (1,470 m3/d). The discharge of industrial wastewater in Kaliningrad oblast (Russian Federation) amounts to 7.9 million cubic meters in a year.
Shipping is a pressure factor mainly in the mouth of the river. Seawater periodically introduces secondary pollution to the river.
63 Based on the First Assessment. 64 Based on information provided by the Russian Federation and the First Assessment. 65 The river is also known as Preglius and Pregolya. Following the provisions of the WFD, the basin of the Pregel is a part of the Neman River Basin District in Lithuania.66 The tributary is known as the Lyna River in Poland.67 Source for the hydrological data from the Russian gauging stations: State Water Cadastre. Long-term data on the mode and surface water resources. Basins of the
Kaliningrad region, Volume 1, Issue 4, Gidrometeoizdat, 1988. 68 State Water Cadastre, Basins of the Kaliningrad region. Volume 1, Issue 4, Gidrometeoizdat, 1988.
388 | part iv

Status and transboundary impactsThe status of the once-polluted Lava River is improving, but that of the Wegorapa (Angerapp) is still poor, at least in some parts of the river, but improving in the Polish part.69 According to the Russian water-quality classification system,70 water of the Lava upstream from the Znamensk was classified every year from 2007 to 2009 as “very polluted”. The water of the Wegorapa at Berenstovo (classifi-
cation value ranged from 3.33 to 3.46) and the Pissa at Zilionyi Bor (decreased from 3.86 to 3.31 during this period) was also ranked in the same class. The water quality of the Pregel at Tsernyahovsk (3.72–3.86) was “very polluted” during that period, but at Kalin-ingrad (1 km from the river’s mouth) it was clearly worse, falling in the “extremely polluted” Russian quality class, with the value rang-ing from 5.36 to 7.25. There is a great anthropogenic load on the Pregel, especially in the part close to the mouth of the river.
69 In 2009,only one parameter in one monitoring point did not reach “moderate” status level. 70 Data provided by the Russian Federal State Agency “Kaliningrad Centre for Hydrometeorology and Environmental Monitoring”.
Total water withdrawal and withdrawals by sector in the Pregel Basin
CountryTotal withdrawal
×106 m3/year Agricultural % Domestic % industry % energy % other %Poland 49.8a 31 56.6 12 - -Russian Federation 85.19b 1 68 9 5 17
a The withdrawal figure and percentages are for 2009. Out of 28.2 × 10⁶ m3/year for domestic users (drinking and households), only 0.1× 10⁶ m3/year comes from surface waters. Out of 6.1 × 10⁶ m3/year for industrial users, more than half (3.3 × 10⁶ m3/year) comes from surface waters.
b The withdrawal figure and percentages are for 2009. Surface water withdrawal is reported to be 52.9 × 10⁶ m3/year (35.1 × 10⁶ m3/year for drinking and household water, 11× 106 m3/year for industry and 6.8 × 10⁶ m3/year for other uses), and groundwater abstraction 31.6 × 10⁶ m3/year (18.6 × 10⁶ m3/year for drinking and household water, 0.8 for × 106 m3/year for agriculture, and 11.2 × 10⁶ m3/year for industry).
Water quality in the Lava
DeterminandsAverage concentration in Stopki, poland in monitoring
year 2009 (monitoring point near state border)a
Results of single sampling (19 november 2007) by the reservoir of the pravdinskaya hydropower station no. 3 in the Russian federation (56 km of the river Lava, 9 km from the border of poland)b
Total suspended solids in mg/l 31.0N-NH4 in mg/l 0.3 0.3N-NO2 in mg/l 0.034Total nitrogen in mg/l 5.29 2.5Total phosphorus in mg/l 0.187 0.2CODCr in mg O2/l - 31CODMn in mg O2/l 9.1BOD5 in mg O2/l 3.7 1.79Copper in mg/l 0.003 0.02Phenols in mg/l <0.005 0.21Oil products in mg/l 0.13 0.01Suspended solids
a Inspection for Environmental Protection, Voivodship Inspectorate in Olsztyn, 2010.b Russian Federal State Agency “Baltvodhoz”.
8 Gva
rdeis
k
7 Rod
niki
6 Buk
wald
5 Mied
unisk
i
Disch
arge
(m3 s-1
) (log
arith
mic
scale)
5112
155
35
(Ang
rapa
)
(Łyna
)
(Lava
)
(Pre
golya
)1
10
100
1000 QavQmaxQmin
3
10
6442
19
143
84
28
Popu
latio
n (in
ten
thou
sand
s)
0
20
40
60
80
100
Russ
ian Fe
dera
tion
Polan
dLit
huan
ia
0.1
51.7
78.1
Country information/otherLandScanTM
2%1%
Urban/Industrial areas (<1%)Surface with little or no vegetation (<1%)
Wetlands (<1%)
33%
37%
27%
CultivatedForestGrassland/Shrubland
Others
Water bodies
DiSChARgeS, popuLATion AnD LAnD CoveR in The pRegeL RiveR BASin
Source: UNEP/DEWA/GRID-Europe 2011.Note: The map in the assessment of the Neman should be referred to for the locations of the gauging stations.
388 | part iv Chapter 8 Drainage basin of the baltic sea | 389

According to recent monitoring data (assessed by the Inspec-tion for Environmental Protection), the status of surface wa-ters in the Polish part of Pregel River Basin District varies from poor/moderate to good, both in terms of biological and phys-icochemical parameters.
ResponsesThere are no monitoring points yet at the boundary on the Russian side, and no information exchange between the coun-tries takes currently takes place. The Russian Federation is planning to establish monitoring stations on its transboundary water bodies.
Insufficient financing for investments/structural measures is re-ported to be a constraint in the Russian part of the basin.
prohladnaja/ Świeza river Basin71
The basin of the 65-km long river Prohladnaja/Świeza72 is shared by Poland and the Russian Federation. The river has its source in Kaliningrad oblast in the Russian Federation, and discharg-es into the Baltic Sea. The Prohjadnaja/Świeza has two major transboundary tributaries originating in Poland: the 42 km long Kornevka/Stradyk73 and 33 km long Rezvaja/Bezleda,74 as well as other small streams.
The basin is in a plain, bordered by floodplain wetlands in the downstream part.
Basin of the Prohladnaja/Świeza River Country Area in the country (km2) Country’s share (%)Russian Federation 1 006 86.0
Poland 164 14.0
Total 1 170
PressuresIn the Russian part, municipal wastewaters from the town of Bagrationovsk and from several villages (Dolgorukov, Jushniy, Vladimirov and Ushakovo), as well as some 7,000 m3 of indus-trial wastewaters, are discharged into the river. In the Polish part of the basin, 93% of the population is not served by public sewerage networks. Surges from the sea affect water quality in the mouth of the river.
Water quality as average concentrations of selected determinands in the Bezleda River in Lejdy, Poland in 2009Determinands Average concentrationChlorophyll a in µg/l 12.6
O2 dissolved in mg/l 6.5
BOD5 in mg O
2/l 2.1
TOC in mg/l 24
N-NH4 in mg/l 0.93
N-NO3 in mg/l 2.5
Total nitrogen in mg/l 4.43
Total phosphorus in mg/l 0.212
Assessment of ecological status ModerateSource: Inspection for Environmental Protection, Voivodship Inspectorate in Olsztyn, 2010.
ResponsesIn the Russian part, there are no monitoring stations, and no information exchange on the river takes place. Only water users are monitored locally.
Water quality in the Wegorapa Determinands Average concentration in mieduniszki, poland in monitoring year 2009 Chlorophyll a in µg/l 3.9Total suspended solids in mg/l 12.0O2 dissolved in mg/l 6.4BOD
5 in mg O2/l 2.6
TOC in mg/l 13.8N-NH
4 in mg/l 0.18
N-NO3 in mg/l 2.51
Total nitrogen in mg/l 3.82Total phosphorus in mg/l 0.130Assessment of ecological status GoodAssessment of chemical status Good
Source: Inspection for Environmental Protection, Voivodship Inspectorate in Olsztyn, 2010.
71 Based on information provided by Poland and the Russian Federation. 72 The river is known as Prohladnaja in the Russian Federation, and as Świeza in Poland. 73 The river is known as Kornevka in the Russian Federation, and as Stradyk in Poland.74 The river is known as Rezvaja in the Russian Federation, and as Bezleda in Poland.
Total water withdrawal and withdrawals by sector in the Prohladnaja/Świeza Basin
Country YearTotal withdrawal
× 106 m3/year Agriculture % Domestic % industry % energy % other %Russian Federationa 2009 1.229 0.3 73.9 12.6 - 13.5Poland N/A N/A N/A N/A N/A N/A N/A
a The figure is groundwater abstraction only. According to the Russian Federation, there is no surface water withdrawal for use.
390 | part iv

vistula river Basin75 Belarus, Poland, Slovakia and Ukraine share the basin of the Vis-tula, which discharges to the Gulf of Gdansk in the Baltic Sea.
The Bug River is the most important transboundary tributary to the Vistula. The Poprad and Dunajec rivers, with their sub-basins shared by Poland and Slovakia, as well as the San76 River, are smaller transboundary tributaries to the Vistula.
The total surface area of the Vistula Basin is 194,424 km2, and 87% of it is in Poland (168,700 km2).77
Hydrology and hydrogeologySurface water resources in the Slovakian part of the Vistula Basin are estimated at 0.815 km3/year (average for 1961 to 2000), which equals 3,995 m3/year/capita (as surface water resources only).
The groundwater resources in the Ukrainian part of the basin are estimated at about 0.855 km3/year, including the Bug sub-basin. More than 80% of the resources are in Cretaceous forma-tions, about 10% in Devonian, and minor amounts in Neogene and Quaternary formations.
In 2009, the total surface water outflow from the Polish part of Vistula River Basin reached 25.7 km3. Available groundwater resources in the Polish part of the Vistula River Basin District (including not only the Bug River, but also several smaller rivers discharging directly into the Baltic Sea) are estimated at 8,041 ×106 m3/day.
PressuresIn the Polish part of the Vistula River Basin, the following pres-sures are of concern: uncontrolled discharges of wastewater from households not served by sewerage systems, nitrates from arable land, hydromorphological changes, landfills, discharge of saline waters from mining, uncontrolled uptake of sand and gravel, and over-abstraction of water (mainly groundwater).
Karstification78 and flooding are natural “problems” judged as minor. Natural riverbeds have to be restored due to the effects of the mining and chemical industries, now no longer operat-ing. Sulfide-bearing wasterock remaining in closed mines is a pressure factor of local but potentially severe influence in the Ukrainian part. Among the more widespread (but moderate) pressures in the Ukrainian part are: illegal dumping along wa-tercourses, risks from pipelines and transport, as well as tree felling. Decline in the population of crustaceans in the aquatic ecosystems has been observed.
A large share of wastewater treatment facilities is not function-ing effectively and is in need of repair, causing local but po-
tentially severe impacts from discharges. The Ukrainian part of the basin of the San River is characterized by a high content of organic substances, ammonia, sulfate, total iron and petro-leum compounds. In recent years, in the Shklo River (in the San sub-basin, crossing the border) there is a steady tendency for quality to deteriorate, with increase in nutrients concentra-tion, associated with an increase in discharges of untreated sew-age. The town of Yavorov in Ukraine has virtually no working sewage treatment plant. Sulfur compounds and salinity are also elevated in the Shklo River due to the polluted waters of the flooded Javorovski mine.
Pressure factors in the Dunajec and Bug sub-basins are de-scribed in the respective sub-basin assessments.
Status and responsesOut of more than 3,100 surface water bodies in the Vistula Ba-sin (including the Bug) in Poland, 652 are at risk of not achiev-ing good status until 2015, and 18 out of 90 groundwater bod-ies are at similar risk.
Total water withdrawal and withdrawals by sector in the Vistula Basin
Country YearTotal withdrawal
×106 m3/year Agricultural % Domestic % industry % energy % other %Belarus N/A N/A N/A N/A N/A N/APoland 2009 6 061.6a 11 19 70Slovakia 2007 9.84b 1.8 64.5 26.2 0 7.6Ukraine 2009 81.8c 16.3 68.0 11.5 3.8
a Source: Environment 2010. Central Statistical Office, Poland. 2010. No separate data for energy production (included in industry). Out of 1,156.4 × 106 m3/year for domestic users (drinking and households) approx. half 512.6× 10⁶ m3/year comes from surface waters. Out of 4,240 × 106 m3/year for industrial users, the majority (4,080.4 × 106 m3/year) comes from surface waters.
b No significant changes are expected before 2015.c The figure includes groundwater abstraction only. “Other” is groundwater abstracted without actual use. (Geoinform, Ukraine).
75 Based on information provided by Poland, Slovakia, Ukraine, and the First Assessment. 76 The river is known as the Syan in Ukraine.77 Including the delta, the area of the basin is 199,813 km2.78 Commonly, for example, land subsidence relates to the dissolution of limestone upon karstification.
390 | part iv Chapter 8 Drainage basin of the baltic sea | 391

3
4
56
2
1
Vilnius
Warszawa
Lviv
Kraków
Lódz
Kaliningrad
Poznań
Ramsar SiteWetlands along Bug
LakeSniardwy
Vistula
Bug
Vistu
la
Duna
jec
Gulf ofGdansk
BydgoszczCanal
AugustówCanal
Dnieper-BugCanal
Poprad
Pilica
Nida
Wieprz
Drweca
Wisl
oka
San
Narew
Brda
NemanP O L A N D
KALININGRAD OBLAST (RU)L I T H U A N I A
B E L A R U S
U K R A I N ES L O V A K I A
C Z E C HR E P U B L I C
25o
50o
20o
The boundaries and names shown and the designations used on this mapdo not imply official endorsement or acceptance by the United Nations. UNEP/DEWA/GRID-Geneva 2011
0 50 100 150Kilometres
6 Fra
nkop
ol
5 Vys
okoe
4 Strz
yzow
3 Lito
vish
2 Pop
rad-
Chm
elnica
1 Cer
veny
Klas
tor
Disc
harg
e (m
3 s-1) (
loga
rithm
ic sc
ale)
1363
30(D
unaje
c)
(Pop
rad)
(Bug
)
(Bug
)
(Pul
va)
(Bug
)0.1
1
10
1000
100
10000 QavQmaxQmin
0.7
917
16
2
237
33
7
41
1
119
Popu
latio
n (in
mill
ions
)
0
5
10
15
20
25
Ukra
ine
Slova
kiaPo
land
Belar
us
21.9
0.20.6 1.3
Country information/otherLandScanTM
1%
1%1%
Surface with little or no vegetation (<1%)Wetlands (<1%)
CultivatedForestGrassland/ShrublandUrban/Industrial areasWater bodies
49%
31%
17%
Others
DiSChARgeS, popuLATion AnD LAnD CoveR in The viSTuLA RiveR BASin
Sources: UNEP/DEWA/GRID-Europe 2011; Water Research Institute, Slovakia.
392 | part iv

On the status and measures in the Slovakian part, please refer to the assessment of the Dunajec and Poprad sub-basins.
Work on predicting impacts of climate variability and change is also at an early stage in Ukraine, as described for the Siret River. Scenarios for regional climate change until 2030 have been developed.
Transboundary cooperationThe Polish-Ukrainian Transboundary Waters Commission fa-cilitates the implementation of the bilateral agreement on co-operation in the field of water management in frontier waters, signed in 1996. In addition, the Plenipotentiaries of Belarus and Ukraine act as a joint body under the bilateral agreement concerning joint use and protection of transboundary waters, signed in 2001. These joint institutions coordinate the work of the ad hoc working groups, including those on planning the use of border waters and flood protection.
At the transboundary level, sampling on the Ukrainian and Pol-ish sides is carried out in accordance with the countries’ own monitoring programmes, using bilaterally-agreed indicators. Information is exchanged quarterly, as well as during meetings of the Polish-Ukrainian Transboundary Waters Commission. In the framework of the State Target Ecological Programme of Monitoring the Environment, Ukraine plans to optimize the monitoring network for surface waters, and to establish a Cen-ter for Monitoring of Transboundary Watercourses.
There is no coordinating body covering the whole basin, and a co-herent legal framework for transboundary cooperation is lacking.
A single agreement to be signed between the riparian countries for cooperation on the protection and sustainable development of the Vistula basin is called for, covering both surface water and groundwater, and providing for the protection, preserva-tion and management of water, biological resources and aquatic ecosystems.
Bug suB-Basin79
Belarus, Poland and Ukraine share the sub-basin of the Bug River.80
The 772-km long Bug has its source in the L’viv region (Ukraine).
The river forms part of the border between Ukraine and Poland, passes along the Polish-Belarussian border, flows within Poland, and empties into the Narew River, a tributary of the Vistula (actu-ally Zegrzynskie Lake, a man-made water reservoir).
The Bug has three transboundary tributaries: the Solokija and Rata (Poland-Ukraine), and the Muhavetsa/Muchawiec (Poland-Belarus). The Bug is connected through the Dnieper-Bug Canal and the Muhavets and Pina rivers with the Pripyat River, and is connected through the Narew River with the Neman Basin.
The mean elevation of the basin is, in the Ukrainian part, 252 m a.s.l., and in the Belarusian part about 140-150 m a.s.l. The biggest agglomerations in the basin are: L’viv (Ukraine, 760,000 inhabitants), Brest (Belarus, 300,000 inhabitants) and Chelm (Poland, 69,000 inhabitants).
Sub-basin of the Bug RiverCountry Area in the country (km2) Country’s share (%)Belarus 10 400 25.4Poland 19 400 47.3Ukraine 11 205 27.3Total 41 005
Source: Water Research Institute, Bratislava; National Water Management Authority, Poland; Ukraine.
Hydrology and hydrogeologyIn an average year, the surface water resources in the Ukrainian part of the Bug Basin are estimated to amount to 1.31 km3/year. The groundwater resources in the Ukrainian part are esti-mated at 0.805 km3/year. The total equals approximately 990 m3/capita/year. In the Belarusian part, surface water resources are estimated at 1.4 km3/year, and the groundwater resources at 0.51 km3/year. The total water resources (1.91 km3/year) equal about 3,470 m3/capita/year.
In 2006, the total outflow from the river basin was estimated at 3.776 km3, of which 1.396 km3 originated in Poland, 1.1 km3 in Belarus and 1.28 km3 in Ukraine.
The main hydrogeological formation in the basin is the Polish-Lithuanian artesian basin, the northern and central parts of which contain significant groundwater reserves.
79 Based on information provided by Belarus, Poland and Ukraine, and the First Assessment.80 The river is also known as the Western Bug.81 Based on information from the Inventory of Transboundary Groundwaters by the UNECE Task Force on Monitoring and Assessment (1999).82 Based on information provided by Belarus.
Bug AquifeR (no. 186)81
Belarus polandArea (km2) 8 500 (shallow and deep groundwater),
400 (alluvial groundwater).N/A
Groundwater uses and functions Drinking water, irrigation, industry. N/APressure factors Pressure factors include industry,
households, agriculture, landfills.N/A
Other information Border length 162 km.
ALLuviAL quATeRnARY AquifeR ShAReD BY BeLARuS AnD poLAnD (no. 187)82
Belarus polandType 3; sands, sand-gravel deposits and sandy loam of Quaternary age; groundwater flow direction from Belarus to Poland; strong links with surface waters. Area (km2) 10 N/AThickness: mean, max (m) 10−20, 60 N/A
392 | part iv Chapter 8 Drainage basin of the baltic sea | 393
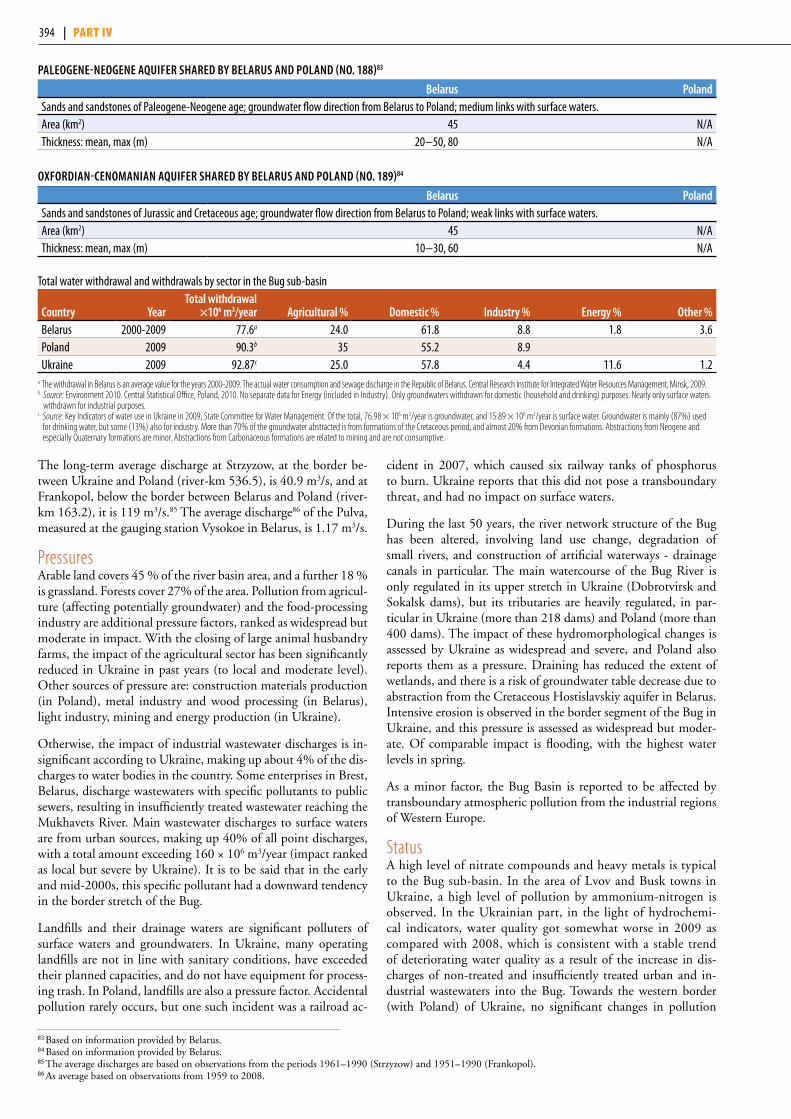
The long-term average discharge at Strzyzow, at the border be-tween Ukraine and Poland (river-km 536.5), is 40.9 m3/s, and at Frankopol, below the border between Belarus and Poland (river-km 163.2), it is 119 m3/s.85 The average discharge86 of the Pulva, measured at the gauging station Vysokoe in Belarus, is 1.17 m3/s.
PressuresArable land covers 45 % of the river basin area, and a further 18 % is grassland. Forests cover 27% of the area. Pollution from agricul-ture (affecting potentially groundwater) and the food-processing industry are additional pressure factors, ranked as widespread but moderate in impact. With the closing of large animal husbandry farms, the impact of the agricultural sector has been significantly reduced in Ukraine in past years (to local and moderate level). Other sources of pressure are: construction materials production (in Poland), metal industry and wood processing (in Belarus), light industry, mining and energy production (in Ukraine).
Otherwise, the impact of industrial wastewater discharges is in-significant according to Ukraine, making up about 4% of the dis-charges to water bodies in the country. Some enterprises in Brest, Belarus, discharge wastewaters with specific pollutants to public sewers, resulting in insufficiently treated wastewater reaching the Mukhavets River. Main wastewater discharges to surface waters are from urban sources, making up 40% of all point discharges, with a total amount exceeding 160 × 106 m3/year (impact ranked as local but severe by Ukraine). It is to be said that in the early and mid-2000s, this specific pollutant had a downward tendency in the border stretch of the Bug.
Landfills and their drainage waters are significant polluters of surface waters and groundwaters. In Ukraine, many operating landfills are not in line with sanitary conditions, have exceeded their planned capacities, and do not have equipment for process-ing trash. In Poland, landfills are also a pressure factor. Accidental pollution rarely occurs, but one such incident was a railroad ac-
cident in 2007, which caused six railway tanks of phosphorus to burn. Ukraine reports that this did not pose a transboundary threat, and had no impact on surface waters.
During the last 50 years, the river network structure of the Bug has been altered, involving land use change, degradation of small rivers, and construction of artificial waterways - drainage canals in particular. The main watercourse of the Bug River is only regulated in its upper stretch in Ukraine (Dobrotvirsk and Sokalsk dams), but its tributaries are heavily regulated, in par-ticular in Ukraine (more than 218 dams) and Poland (more than 400 dams). The impact of these hydromorphological changes is assessed by Ukraine as widespread and severe, and Poland also reports them as a pressure. Draining has reduced the extent of wetlands, and there is a risk of groundwater table decrease due to abstraction from the Cretaceous Hostislavskiy aquifer in Belarus. Intensive erosion is observed in the border segment of the Bug in Ukraine, and this pressure is assessed as widespread but moder-ate. Of comparable impact is flooding, with the highest water levels in spring.
As a minor factor, the Bug Basin is reported to be affected by transboundary atmospheric pollution from the industrial regions of Western Europe.
StatusA high level of nitrate compounds and heavy metals is typical to the Bug sub-basin. In the area of Lvov and Busk towns in Ukraine, a high level of pollution by ammonium-nitrogen is observed. In the Ukrainian part, in the light of hydrochemi-cal indicators, water quality got somewhat worse in 2009 as compared with 2008, which is consistent with a stable trend of deteriorating water quality as a result of the increase in dis-charges of non-treated and insufficiently treated urban and in-dustrial wastewaters into the Bug. Towards the western border (with Poland) of Ukraine, no significant changes in pollution
pALeogene-neogene AquifeR ShAReD BY BeLARuS AnD poLAnD (no. 188)83
Belarus polandSands and sandstones of Paleogene-Neogene age; groundwater flow direction from Belarus to Poland; medium links with surface waters. Area (km2) 45 N/AThickness: mean, max (m) 20−50, 80 N/A
oxfoRDiAn-CenomAniAn AquifeR ShAReD BY BeLARuS AnD poLAnD (no. 189)84
Belarus polandSands and sandstones of Jurassic and Cretaceous age; groundwater flow direction from Belarus to Poland; weak links with surface waters. Area (km2) 45 N/AThickness: mean, max (m) 10−30, 60 N/A
Total water withdrawal and withdrawals by sector in the Bug sub-basin
Country YearTotal withdrawal
×106 m3/year Agricultural % Domestic % industry % energy % other %Belarus 2000-2009 77.6a 24.0 61.8 8.8 1.8 3.6Poland 2009 90.3b 35 55.2 8.9Ukraine 2009 92.87c 25.0 57.8 4.4 11.6 1.2
a The withdrawal in Belarus is an average value for the years 2000-2009. The actual water consumption and sewage discharge in the Republic of Belarus. Central Research Institute for Integrated Water Resources Management, Minsk, 2009.b Source: Environment 2010. Central Statistical Office, Poland, 2010. No separate data for Energy (included in Industry). Only groundwaters withdrawn for domestic (household and drinking) purposes. Nearly only surface waters
withdrawn for industrial purposes.c Source: Key Indicators of water use in Ukraine in 2009, State Committee for Water Management. Of the total, 76.98 × 10⁶ m3/year is groundwater, and 15.89 × 10⁶ m3/year is surface water. Groundwater is mainly (87%) used
for drinking water, but some (13%) also for industry. More than 70% of the groundwater abstracted is from formations of the Cretaceous period, and almost 20% from Devonian formations. Abstractions from Neogene and especially Quaternary formations are minor. Abstractions from Carbonaceous formations are related to mining and are not consumptive.
83 Based on information provided by Belarus.84 Based on information provided by Belarus.85 The average discharges are based on observations from the periods 1961–1990 (Strzyzow) and 1951–1990 (Frankopol). 86 As average based on observations from 1959 to 2008.
394 | part iv
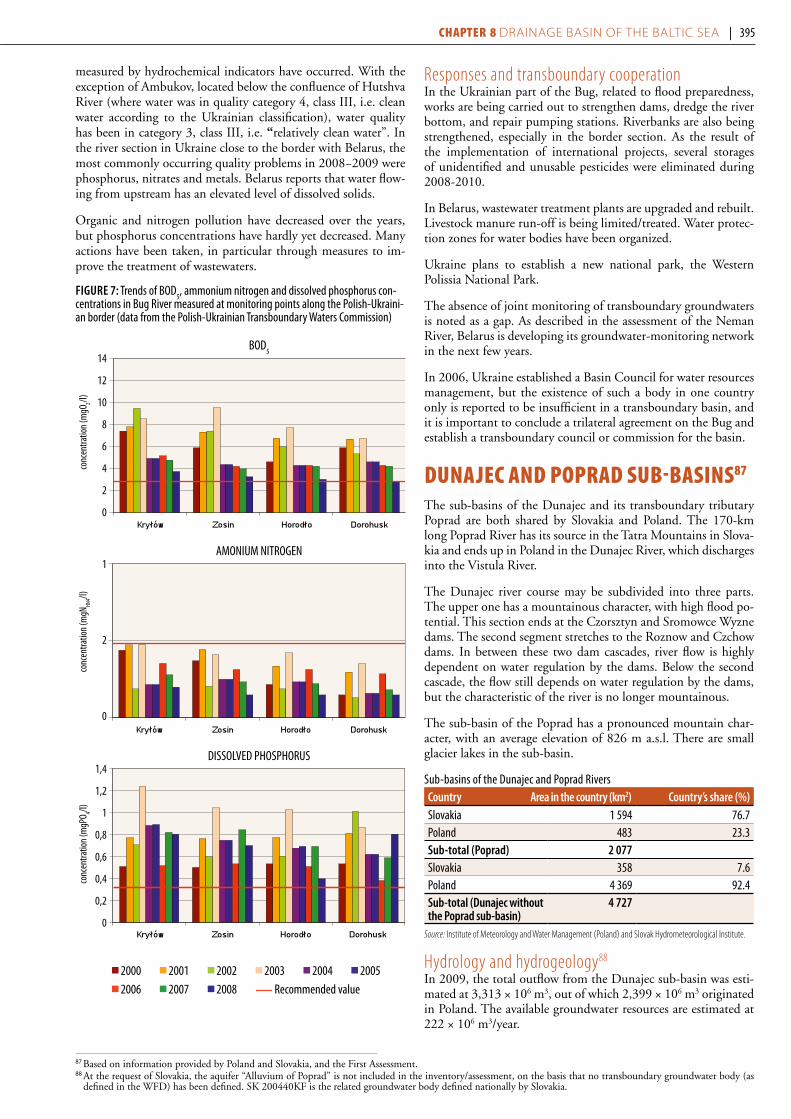
measured by hydrochemical indicators have occurred. With the exception of Ambukov, located below the confluence of Hutshva River (where water was in quality category 4, class III, i.e. clean water according to the Ukrainian classification), water quality has been in category 3, class III, i.e. “relatively clean water”. In the river section in Ukraine close to the border with Belarus, the most commonly occurring quality problems in 2008−2009 were phosphorus, nitrates and metals. Belarus reports that water flow-ing from upstream has an elevated level of dissolved solids.
Organic and nitrogen pollution have decreased over the years, but phosphorus concentrations have hardly yet decreased. Many actions have been taken, in particular through measures to im-prove the treatment of wastewaters.
figuRe 7: Trends of BOD5, ammonium nitrogen and dissolved phosphorus con-
centrations in Bug River measured at monitoring points along the Polish-Ukraini-an border (data from the Polish-Ukrainian Transboundary Waters Commission)
Responses and transboundary cooperationIn the Ukrainian part of the Bug, related to flood preparedness, works are being carried out to strengthen dams, dredge the river bottom, and repair pumping stations. Riverbanks are also being strengthened, especially in the border section. As the result of the implementation of international projects, several storages of unidentified and unusable pesticides were eliminated during 2008-2010.
In Belarus, wastewater treatment plants are upgraded and rebuilt. Livestock manure run-off is being limited/treated. Water protec-tion zones for water bodies have been organized.
Ukraine plans to establish a new national park, the Western Polissia National Park.
The absence of joint monitoring of transboundary groundwaters is noted as a gap. As described in the assessment of the Neman River, Belarus is developing its groundwater-monitoring network in the next few years.
In 2006, Ukraine established a Basin Council for water resources management, but the existence of such a body in one country only is reported to be insufficient in a transboundary basin, and it is important to conclude a trilateral agreement on the Bug and establish a transboundary council or commission for the basin.
dunajeC and poprad suB-Basins87
The sub-basins of the Dunajec and its transboundary tributary Poprad are both shared by Slovakia and Poland. The 170-km long Poprad River has its source in the Tatra Mountains in Slova-kia and ends up in Poland in the Dunajec River, which discharges into the Vistula River.
The Dunajec river course may be subdivided into three parts. The upper one has a mountainous character, with high flood po-tential. This section ends at the Czorsztyn and Sromowce Wyzne dams. The second segment stretches to the Roznow and Czchow dams. In between these two dam cascades, river flow is highly dependent on water regulation by the dams. Below the second cascade, the flow still depends on water regulation by the dams, but the characteristic of the river is no longer mountainous.
The sub-basin of the Poprad has a pronounced mountain char-acter, with an average elevation of 826 m a.s.l. There are small glacier lakes in the sub-basin.
Sub-basins of the Dunajec and Poprad RiversCountry Area in the country (km2) Country’s share (%)Slovakia 1 594 76.7Poland 483 23.3Sub-total (poprad) 2 077Slovakia 358 7.6Poland 4 369 92.4Sub-total (Dunajec without the poprad sub-basin)
4 727
Source: Institute of Meteorology and Water Management (Poland) and Slovak Hydrometeorological Institute.
Hydrology and hydrogeology88 In 2009, the total outflow from the Dunajec sub-basin was esti-mated at 3,313 × 106 m3, out of which 2,399 × 106 m3 originated in Poland. The available groundwater resources are estimated at 222 × 106 m3/year.
87 Based on information provided by Poland and Slovakia, and the First Assessment.88 At the request of Slovakia, the aquifer “Alluvium of Poprad” is not included in the inventory/assessment, on the basis that no transboundary groundwater body (as
defined in the WFD) has been defined. SK 200440KF is the related groundwater body defined nationally by Slovakia.
DISSOLVED PHOSPHORUS
BOD5
AMONIUM NITROGEN
14
12
10
8
6
4
2
0
1,4
1,2
1
0,8
0,6
0,4
0,2
0
1
2
0
conc
entra
tion
(mgO
2/l)
conc
entra
tion
(mgN
HN4/l)
co
ncen
tratio
n (m
gPO 4/l)
2000 2001 2002 2003 2004 2005 2006 2007 2008 Recommended value
394 | part iv Chapter 8 Drainage basin of the baltic sea | 395
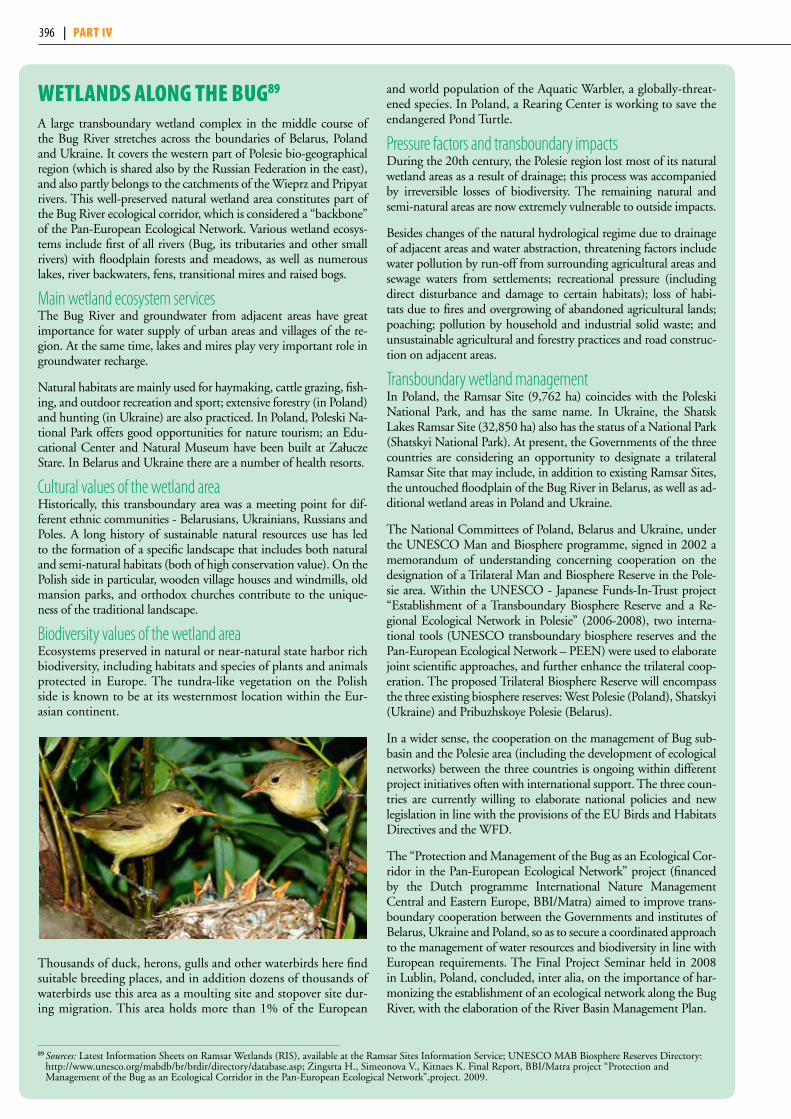
wetlands along the Bug89
A large transboundary wetland complex in the middle course of the Bug River stretches across the boundaries of Belarus, Poland and Ukraine. It covers the western part of Polesie bio-geographical region (which is shared also by the Russian Federation in the east), and also partly belongs to the catchments of the Wieprz and Pripyat rivers. This well-preserved natural wetland area constitutes part of the Bug River ecological corridor, which is considered a “backbone” of the Pan-European Ecological Network. Various wetland ecosys-tems include first of all rivers (Bug, its tributaries and other small rivers) with floodplain forests and meadows, as well as numerous lakes, river backwaters, fens, transitional mires and raised bogs.
Main wetland ecosystem services The Bug River and groundwater from adjacent areas have great importance for water supply of urban areas and villages of the re-gion. At the same time, lakes and mires play very important role in groundwater recharge.
Natural habitats are mainly used for haymaking, cattle grazing, fish-ing, and outdoor recreation and sport; extensive forestry (in Poland) and hunting (in Ukraine) are also practiced. In Poland, Poleski Na-tional Park offers good opportunities for nature tourism; an Edu-cational Center and Natural Museum have been built at Załucze Stare. In Belarus and Ukraine there are a number of health resorts.
Cultural values of the wetland areaHistorically, this transboundary area was a meeting point for dif-ferent ethnic communities - Belarusians, Ukrainians, Russians and Poles. A long history of sustainable natural resources use has led to the formation of a specific landscape that includes both natural and semi-natural habitats (both of high conservation value). On the Polish side in particular, wooden village houses and windmills, old mansion parks, and orthodox churches contribute to the unique-ness of the traditional landscape.
Biodiversity values of the wetland areaEcosystems preserved in natural or near-natural state harbor rich biodiversity, including habitats and species of plants and animals protected in Europe. The tundra-like vegetation on the Polish side is known to be at its westernmost location within the Eur-asian continent.
Thousands of duck, herons, gulls and other waterbirds here find suitable breeding places, and in addition dozens of thousands of waterbirds use this area as a moulting site and stopover site dur-ing migration. This area holds more than 1% of the European
and world population of the Aquatic Warbler, a globally-threat-ened species. In Poland, a Rearing Center is working to save the endangered Pond Turtle.
Pressure factors and transboundary impactsDuring the 20th century, the Polesie region lost most of its natural wetland areas as a result of drainage; this process was accompanied by irreversible losses of biodiversity. The remaining natural and semi-natural areas are now extremely vulnerable to outside impacts.
Besides changes of the natural hydrological regime due to drainage of adjacent areas and water abstraction, threatening factors include water pollution by run-off from surrounding agricultural areas and sewage waters from settlements; recreational pressure (including direct disturbance and damage to certain habitats); loss of habi-tats due to fires and overgrowing of abandoned agricultural lands; poaching; pollution by household and industrial solid waste; and unsustainable agricultural and forestry practices and road construc-tion on adjacent areas.
Transboundary wetland managementIn Poland, the Ramsar Site (9,762 ha) coincides with the Poleski National Park, and has the same name. In Ukraine, the Shatsk Lakes Ramsar Site (32,850 ha) also has the status of a National Park (Shatskyi National Park). At present, the Governments of the three countries are considering an opportunity to designate a trilateral Ramsar Site that may include, in addition to existing Ramsar Sites, the untouched floodplain of the Bug River in Belarus, as well as ad-ditional wetland areas in Poland and Ukraine.
The National Committees of Poland, Belarus and Ukraine, under the UNESCO Man and Biosphere programme, signed in 2002 a memorandum of understanding concerning cooperation on the designation of a Trilateral Man and Biosphere Reserve in the Pole-sie area. Within the UNESCO - Japanese Funds-In-Trust project “Establishment of a Transboundary Biosphere Reserve and a Re-gional Ecological Network in Polesie” (2006-2008), two interna-tional tools (UNESCO transboundary biosphere reserves and the Pan-European Ecological Network – PEEN) were used to elaborate joint scientific approaches, and further enhance the trilateral coop-eration. The proposed Trilateral Biosphere Reserve will encompass the three existing biosphere reserves: West Polesie (Poland), Shatskyi (Ukraine) and Pribuzhskoye Polesie (Belarus).
In a wider sense, the cooperation on the management of Bug sub-basin and the Polesie area (including the development of ecological networks) between the three countries is ongoing within different project initiatives often with international support. The three coun-tries are currently willing to elaborate national policies and new legislation in line with the provisions of the EU Birds and Habitats Directives and the WFD.
The “Protection and Management of the Bug as an Ecological Cor-ridor in the Pan-European Ecological Network” project (financed by the Dutch programme International Nature Management Central and Eastern Europe, BBI/Matra) aimed to improve trans-boundary cooperation between the Governments and institutes of Belarus, Ukraine and Poland, so as to secure a coordinated approach to the management of water resources and biodiversity in line with European requirements. The Final Project Seminar held in 2008 in Lublin, Poland, concluded, inter alia, on the importance of har-monizing the establishment of an ecological network along the Bug River, with the elaboration of the River Basin Management Plan.
89 Sources: Latest Information Sheets on Ramsar Wetlands (RIS), available at the Ramsar Sites Information Service; UNESCO MAB Biosphere Reserves Directory: http://www.unesco.org/mabdb/br/brdir/directory/database.asp; Zingsrta H., Simeonova V., Kitnaes K. Final Report, BBI/Matra project “Protection and Management of the Bug as an Ecological Corridor in the Pan-European Ecological Network”,project. 2009.
396 | part iv
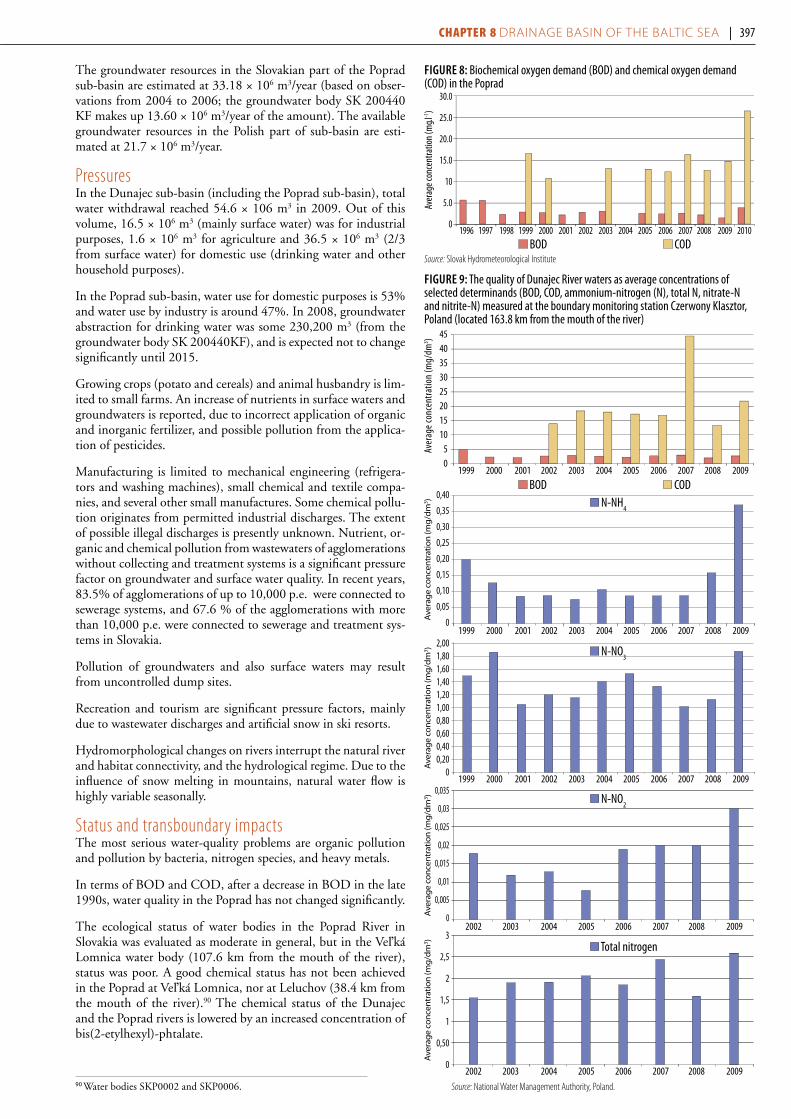
1999 2000 2001 2002 2003 2004 2005 2006 2007 2008 2009
0,40
0,35
0,30
0,25
0,20
0,15
0,10
0,05
0
1999 2000 2001 2002 2003 2004 2005 2006 2007 2008 2009
2,001,801,601,401,201,000,800,600,400,20
0
The groundwater resources in the Slovakian part of the Poprad sub-basin are estimated at 33.18 × 10⁶ m3/year (based on obser-vations from 2004 to 2006; the groundwater body SK 200440 KF makes up 13.60 × 10⁶ m3/year of the amount). The available groundwater resources in the Polish part of sub-basin are esti-mated at 21.7 × 10⁶ m3/year.
PressuresIn the Dunajec sub-basin (including the Poprad sub-basin), total water withdrawal reached 54.6 × 10⁶ m3 in 2009. Out of this volume, 16.5 × 10⁶ m3 (mainly surface water) was for industrial purposes, 1.6 × 10⁶ m3 for agriculture and 36.5 × 10⁶ m3 (2/3 from surface water) for domestic use (drinking water and other household purposes).
In the Poprad sub-basin, water use for domestic purposes is 53% and water use by industry is around 47%. In 2008, groundwater abstraction for drinking water was some 230,200 m3 (from the groundwater body SK 200440KF), and is expected not to change significantly until 2015.
Growing crops (potato and cereals) and animal husbandry is lim-ited to small farms. An increase of nutrients in surface waters and groundwaters is reported, due to incorrect application of organic and inorganic fertilizer, and possible pollution from the applica-tion of pesticides.
Manufacturing is limited to mechanical engineering (refrigera-tors and washing machines), small chemical and textile compa-nies, and several other small manufactures. Some chemical pollu-tion originates from permitted industrial discharges. The extent of possible illegal discharges is presently unknown. Nutrient, or-ganic and chemical pollution from wastewaters of agglomerations without collecting and treatment systems is a significant pressure factor on groundwater and surface water quality. In recent years, 83.5% of agglomerations of up to 10,000 p.e. were connected to sewerage systems, and 67.6 % of the agglomerations with more than 10,000 p.e. were connected to sewerage and treatment sys-tems in Slovakia.
Pollution of groundwaters and also surface waters may result from uncontrolled dump sites.
Recreation and tourism are significant pressure factors, mainly due to wastewater discharges and artificial snow in ski resorts.
Hydromorphological changes on rivers interrupt the natural river and habitat connectivity, and the hydrological regime. Due to the influence of snow melting in mountains, natural water flow is highly variable seasonally.
Status and transboundary impacts The most serious water-quality problems are organic pollution and pollution by bacteria, nitrogen species, and heavy metals.
In terms of BOD and COD, after a decrease in BOD in the late 1990s, water quality in the Poprad has not changed significantly.
The ecological status of water bodies in the Poprad River in Slovakia was evaluated as moderate in general, but in the Veľká Lomnica water body (107.6 km from the mouth of the river), status was poor. A good chemical status has not been achieved in the Poprad at Veľká Lomnica, nor at Leluchov (38.4 km from the mouth of the river).90 The chemical status of the Dunajec and the Poprad rivers is lowered by an increased concentration of bis(2-etylhexyl)-phtalate.
90 Water bodies SKP0002 and SKP0006.
BOD COD1996 1997 1998 1999 2000 2001 2002 2003 2004 2005 2006 2007 2008 2009 2010
30.0
25.0
20.0
15.0
10
5.0
0
Aver
age c
once
ntra
tion
(mg.l
-1)
BOD COD N-NH
4
N-NO3
2002 2003 2004 2005 2006 2007 2008 2009
0,035
0,03
0,025
0,02
0,015
0,01
0,005
0
N-NO2
2002 2003 2004 2005 2006 2007 2008 2009
3
2,5
2
1,5
1
0,50
0
Total nitrogen
1999 2000 2001 2002 2003 2004 2005 2006 2007 2008 2009
4540353025201510
50
figuRe 8: Biochemical oxygen demand (BOD) and chemical oxygen demand (COD) in the Poprad
figuRe 9: The quality of Dunajec River waters as average concentrations of selected determinands (BOD, COD, ammonium-nitrogen (N), total N, nitrate-N and nitrite-N) measured at the boundary monitoring station Czerwony Klasztor, Poland (located 163.8 km from the mouth of the river)
Source: Slovak Hydrometeorological Institute
Source: National Water Management Authority, Poland.
396 | part iv Chapter 8 Drainage basin of the baltic sea | 397
Hydromorphological changes in the Poprad River at the border section are insignificant according to Slovakia, but significant in the Dunajec River (border section) due to the regulated flow at the downstream drinking water reservoir built in the Polish ter-ritory.
Responses Cooperation on transboundary waters is realized through the Slovak-Poland bilateral Commission and three subsidiary work-ing groups, on the basis of the 1997 agreement. The composition of the working groups and their scope of work is currently being revised.
Recently agreed transboundary actions between Slovakia and Poland include, in general, joint measurements, data harmonisa-tion, data exchange and experience exchange, and joint projects. Joint monitoring of water quantity and quality is carried out sev-eral times per year. Data are also reported to the Slovak-Poland Commission. A proposal has been submitted for a European re-gional development project to set up an information system for the transboundary region, which would be used to support the implementation of the EU Floods Directive and the WFD.
Trends The ecological status and chemical status of the transboundary sections of the Dunajec and Poprad rivers are expected to im-prove due to the realization of basic and supplementary measures as defined in the RBMP, based on the requirements of the WFD in both riparian countries (to be implemented by 2015).
However, a good ecological and chemical status in the Poprad River is not expected to be reached by 2015; the main reason being the high cost of realization of measures, especially of hy-dromorphological and supplementary measures in small agglom-erations. Measures will therefore be gradually implemented up to 2025. In some water bodies in the Dunajec sub-basin, the achievement of good ecological status is also envisaged for a more distant time horizon, beyond 2015.
It is expected that climate change in the sub-basins will not sig-nificantly impact on the surface water status, but this has not been predicted in detail. The National Climate Programme of Slovakia aims to study the impacts of climate change on the eco-logical and chemical status of surface waters.
oder/odra river Basin91
The Oder/Odra River originates in the Oder Mountains (eleva-tion 632 m a.s.l.) in the south-western part of the Central Su-detes. With a length of 855 km, the Odra is the sixth-largest tributary of the Baltic Sea.
Basin of the Oder/Odra River Country Area in the country (km2) Country’s share (%)Czech Republic 7 278 5.9Germany 9 602 7.7Poland 107 169 86.4Total 124 049
Of the largest tributaries of the Odra, the Lusatian Neisse, the Opava, and the Olza are transboundary rivers.
The Warta River, the largest tributary (mean discharge of 224 m³/s; sub-basin area of 54,000 km²), supplies approximately 40% of the Odra’s longstanding mean flow.
Hydrology and hydrogeology Some 2,574 surface water bodies of all categories (2,147 rivers, 423 lakes, transitional waters, coastal waters) have been estab-lished within the entire International Odra River Basin District92
(IORBD).
Within the whole IORBD, 227 surface water bodies are con-sidered to be artificial, and 694 water bodies heavily modified.93
The area of the IORBD predominantly contains groundwater bodies that are found in unconsolidated deposits; those in solid rock can be found only in the south.
Altogether, 103 groundwater bodies have been established within the area of the IORBD.
There are differences in the size of the established areas of groundwater bodies within the IORBD. The average area size of the established groundwater bodies varies: in Poland it is ap-proximately 1,793 km2, in the Czech Republic 812 km2, and in Germany around 413 km2. This variation is due to the ag-gregation procedure of the groundwater bodies. Transboundary groundwater bodies have not been determined.
Pressures The following significant problems in water management within the area of the IORBD have been identified with the analysis of the anthropogenic impact, and the International Commission for the Protection of the Oder River is coordinating the response on the international level:
(1) the hydromorphological alteration of flowing waters due to, for example, river developments or bed-straightening, as well as watercourse maintenance, hindering reaching ecologi-cal quality objectives for biological quality elements, disturb-ing the habitats of fish as well as other water organisms in their migration areas;
(2) structures across rivers constructed for energy production, flood protection and flow regulation, for example, disturb the linear continuity of watercourses. Moreover, they disturb the flow, the natural sedimentary regime and the transport of de-bris;
(3) significant pollution of surface waters with nutrients and hazardous substances from point and diffuse pollution sources that prevents obtaining good water quality within the IORBD;
(4) pressure due to the reduction of the natural flow, resulting from water intake and transfer.
In addition, some other significant issues of basin-wide character include: (1) ecological improvement of the morphological struc-ture of water-courses within small areas; (2) integrated treatment of water and land ecosystems that are dependant on them; (3) adapting the level of wastewater treatment for environmental purposes; (4) effects of operational and out of operation lignite strip mines; (5) use of groundwater; (6) pollution of groundwater with nutrients and pesticides; (7) point pollution of groundwa-ters from landfills and from mining; and, (8) flood protection.
91 Based on information provided by the International Commission for the Protection of the Odra River against Pollution.92 The entire area of the International Odra River Basin District (IORBD) amounts to 124,049 km2, including 5,009 km2 of transitional waters and coastal waters of
the Szczecin Lagoon, along with the sub-basin of that lagoon, the eastern part of Usedom, and the western part of the Wolin islands; of which 3,804 km2 is located in Germany and 1,205 km2 in Poland.
93 These have been defined according to an annex to the WFD.
398 | part iv
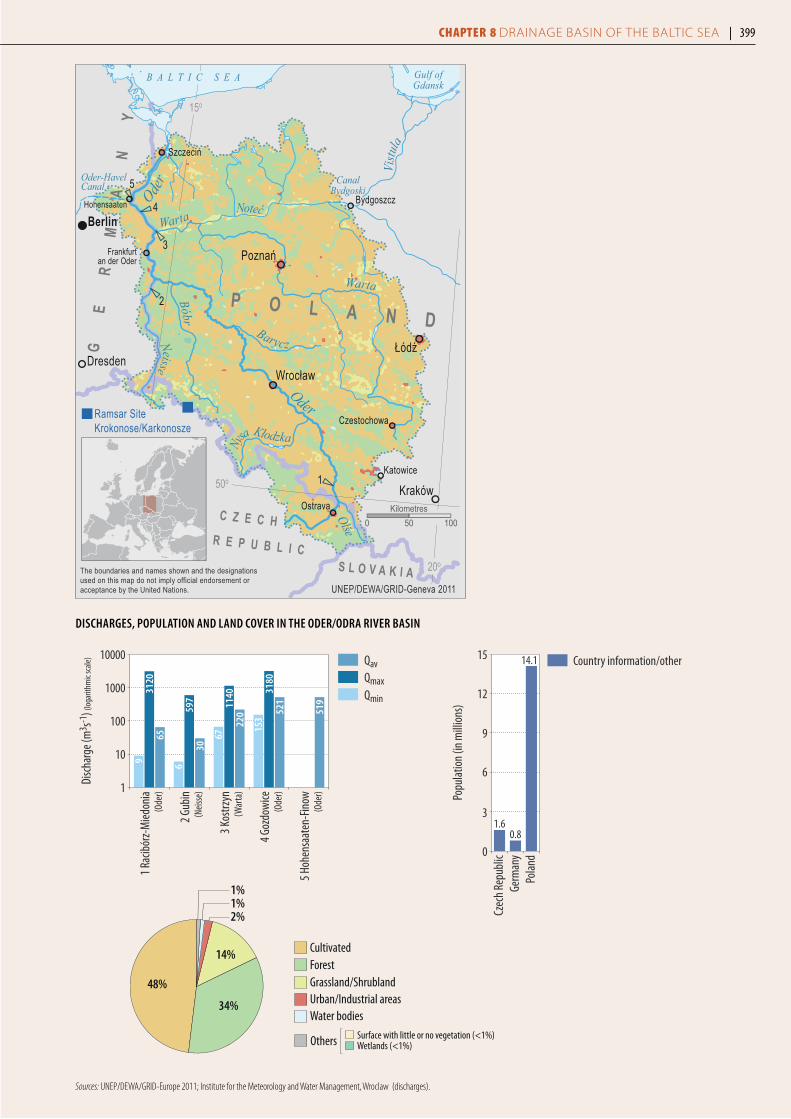
1
2
3
4
5
Berlin
DresdenWrocław
Poznań
Łódź
Kraków
Frankfurtan der Oder
Szczecin
Hohensaaten
Katowice
Ostrava
Czestochowa
Bydgoszcz
Ramsar SiteKrokonose/Karkonosze
B A L T I C S E A Gulf ofGdansk
Oder-HavelCanal Canal
Bydgoski
Oder
Oder
Neisse
Olse
Bóbr
Barycz
NotećNy
sa Kłodzka
Warta
Warta
Vistu
la
P O L A N D
C Z E C H R E P U B L I C
GE
RM
AN
Y
S L O V A K I A
50o
15o
20oThe boundaries and names shown and the designationsused on this map do not imply official endorsement oracceptance by the United Nations. UNEP/DEWA/GRID-Geneva 2011
0 50 100Kilometres
1
10
100
1000
10000
5 Hoh
ensa
aten
-Fin
ow
4 Goz
dow
ice
3 Kos
trzyn
2 Gub
in
1 Rac
ibór
z-M
iedon
ia
Disc
harg
e (m
3 s-1) (
loga
rithm
ic sc
ale)
3120
65
597
30
(Ode
r)
(Neis
se)
(War
ta)
(Ode
r)
(Ode
r)
QavQmaxQmin
9
1140
220
67
3180
521
153
519
6
Popu
latio
n (in
mill
ions
)
0
3
6
9
12
15
Polan
dGe
rman
yCz
ech
Repu
blic
1.60.8
14.1 Country information/other
DiSChARgeS, popuLATion AnD LAnD CoveR in The oDeR/oDRA RiveR BASin
1%1%2%
48%
34%
14%
Wetlands (<1%)Surface with little or no vegetation (<1%)
CultivatedForestGrassland/Shrubland
Others
Urban/Industrial areasWater bodies
Sources: UNEP/DEWA/GRID-Europe 2011; Institute for the Meteorology and Water Management, Wroclaw (discharges).
398 | part iv Chapter 8 Drainage basin of the baltic sea | 399
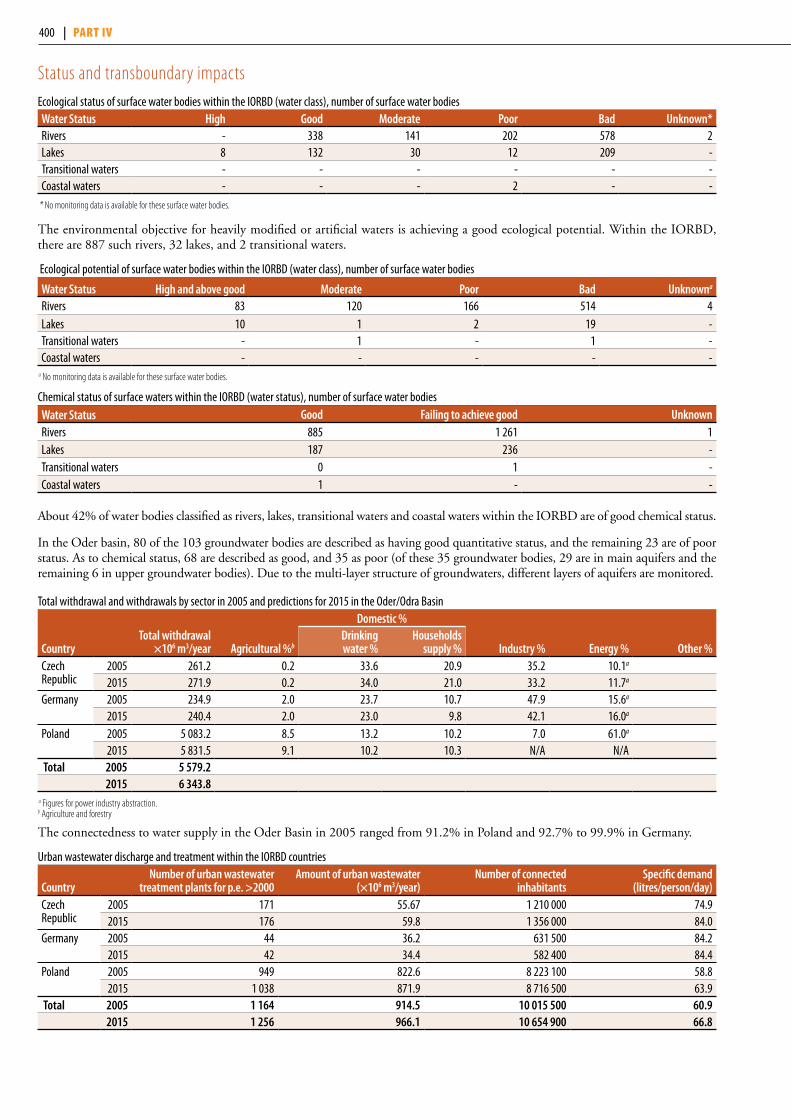
Status and transboundary impacts Ecological status of surface water bodies within the IORBD (water class), number of surface water bodieswater Status high good moderate poor Bad unknown*Rivers - 338 141 202 578 2Lakes 8 132 30 12 209 -Transitional waters - - - - - -Coastal waters - - - 2 - -
* No monitoring data is available for these surface water bodies.
The environmental objective for heavily modified or artificial waters is achieving a good ecological potential. Within the IORBD, there are 887 such rivers, 32 lakes, and 2 transitional waters.
Ecological potential of surface water bodies within the IORBD (water class), number of surface water bodies
water Status high and above good moderate poor Bad unknowna
Rivers 83 120 166 514 4Lakes 10 1 2 19 -Transitional waters - 1 - 1 -Coastal waters - - - - -
a No monitoring data is available for these surface water bodies.
Chemical status of surface waters within the IORBD (water status), number of surface water bodies water Status good failing to achieve good unknownRivers 885 1 261 1Lakes 187 236 -Transitional waters 0 1 -Coastal waters 1 - -
About 42% of water bodies classified as rivers, lakes, transitional waters and coastal waters within the IORBD are of good chemical status.
In the Oder basin, 80 of the 103 groundwater bodies are described as having good quantitative status, and the remaining 23 are of poor status. As to chemical status, 68 are described as good, and 35 as poor (of these 35 groundwater bodies, 29 are in main aquifers and the remaining 6 in upper groundwater bodies). Due to the multi-layer structure of groundwaters, different layers of aquifers are monitored.
Total withdrawal and withdrawals by sector in 2005 and predictions for 2015 in the Oder/Odra Basin
CountryTotal withdrawal
×106 m3/year Agricultural %b
Domestic %
industry % energy % other %Drinking water %
households supply %
Czech Republic
2005 261.2 0.2 33.6 20.9 35.2 10.1a
2015 271.9 0.2 34.0 21.0 33.2 11.7a
Germany 2005 234.9 2.0 23.7 10.7 47.9 15.6a
2015 240.4 2.0 23.0 9.8 42.1 16.0a
Poland 2005 5 083.2 8.5 13.2 10.2 7.0 61.0a
2015 5 831.5 9.1 10.2 10.3 N/A N/A Total 2005 5 579.2
2015 6 343.8 a Figures for power industry abstraction. b Agriculture and forestry
The connectedness to water supply in the Oder Basin in 2005 ranged from 91.2% in Poland and 92.7% to 99.9% in Germany.
Urban wastewater discharge and treatment within the IORBD countries
Countrynumber of urban wastewater
treatment plants for p.e. >2000Amount of urban wastewater
(×106 m3/year)number of connected
inhabitantsSpecific demand
(litres/person/day)Czech Republic
2005 171 55.67 1 210 000 74.92015 176 59.8 1 356 000 84.0
Germany 2005 44 36.2 631 500 84.22015 42 34.4 582 400 84.4
Poland 2005 949 822.6 8 223 100 58.82015 1 038 871.9 8 716 500 63.9
Total 2005 1 164 914.5 10 015 500 60.92015 1 256 966.1 10 654 900 66.8
400 | part iv
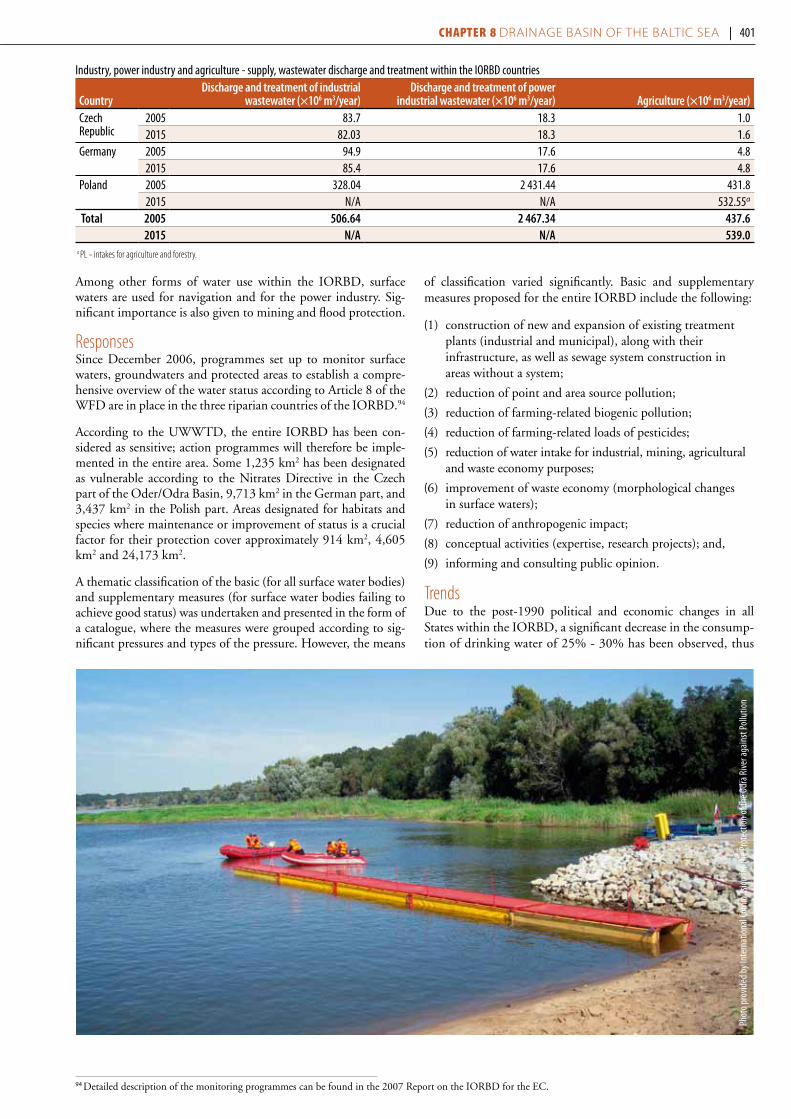
Industry, power industry and agriculture - supply, wastewater discharge and treatment within the IORBD countries
CountryDischarge and treatment of industrial
wastewater (×106 m3/year) Discharge and treatment of power
industrial wastewater (×106 m3/year) Agriculture (×106 m3/year)Czech Republic
2005 83.7 18.3 1.02015 82.03 18.3 1.6
Germany 2005 94.9 17.6 4.82015 85.4 17.6 4.8
Poland 2005 328.04 2 431.44 431.82015 N/A N/A 532.55a
Total 2005 506.64 2 467.34 437.62015 n/A n/A 539.0
a PL - intakes for agriculture and forestry.
Among other forms of water use within the IORBD, surface waters are used for navigation and for the power industry. Sig-nificant importance is also given to mining and flood protection.
Responses Since December 2006, programmes set up to monitor surface waters, groundwaters and protected areas to establish a compre-hensive overview of the water status according to Article 8 of the WFD are in place in the three riparian countries of the IORBD.94
According to the UWWTD, the entire IORBD has been con-sidered as sensitive; action programmes will therefore be imple-mented in the entire area. Some 1,235 km2 has been designated as vulnerable according to the Nitrates Directive in the Czech part of the Oder/Odra Basin, 9,713 km2 in the German part, and 3,437 km2 in the Polish part. Areas designated for habitats and species where maintenance or improvement of status is a crucial factor for their protection cover approximately 914 km2, 4,605 km2 and 24,173 km2.
A thematic classification of the basic (for all surface water bodies) and supplementary measures (for surface water bodies failing to achieve good status) was undertaken and presented in the form of a catalogue, where the measures were grouped according to sig-nificant pressures and types of the pressure. However, the means
of classification varied significantly. Basic and supplementary measures proposed for the entire IORBD include the following:
(1) construction of new and expansion of existing treatment plants (industrial and municipal), along with their infrastructure, as well as sewage system construction in areas without a system;
(2) reduction of point and area source pollution;
(3) reduction of farming-related biogenic pollution;
(4) reduction of farming-related loads of pesticides;
(5) reduction of water intake for industrial, mining, agricultural and waste economy purposes;
(6) improvement of waste economy (morphological changes in surface waters);
(7) reduction of anthropogenic impact;
(8) conceptual activities (expertise, research projects); and,
(9) informing and consulting public opinion.
TrendsDue to the post-1990 political and economic changes in all States within the IORBD, a significant decrease in the consump-tion of drinking water of 25% - 30% has been observed, thus
94 Detailed description of the monitoring programmes can be found in the 2007 Report on the IORBD for the EC.
Phot
o pro
vided
by I
nter
natio
nal C
omm
issio
n fo
r the
Pro
tect
ion
of th
e Odr
a Rive
r aga
inst
Pollu
tion
400 | part iv Chapter 8 Drainage basin of the baltic sea | 401
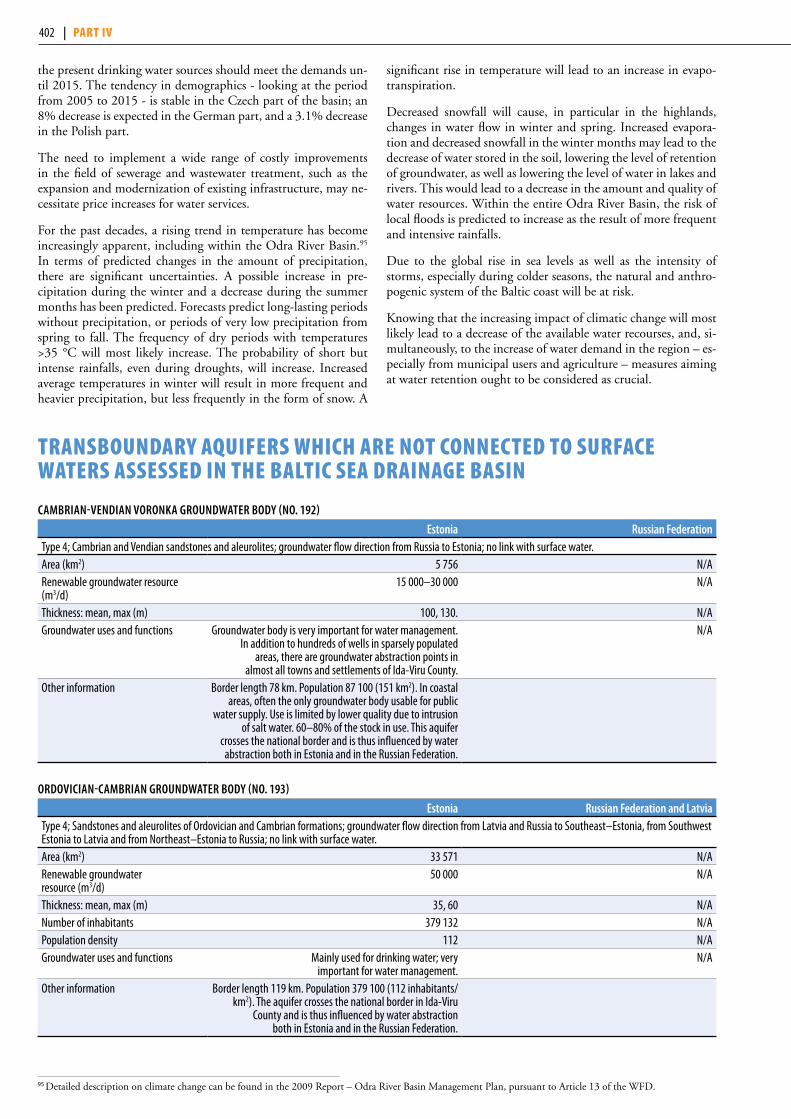
the present drinking water sources should meet the demands un-til 2015. The tendency in demographics - looking at the period from 2005 to 2015 - is stable in the Czech part of the basin; an 8% decrease is expected in the German part, and a 3.1% decrease in the Polish part.
The need to implement a wide range of costly improvements in the field of sewerage and wastewater treatment, such as the expansion and modernization of existing infrastructure, may ne-cessitate price increases for water services.
For the past decades, a rising trend in temperature has become increasingly apparent, including within the Odra River Basin.95
In terms of predicted changes in the amount of precipitation, there are significant uncertainties. A possible increase in pre-cipitation during the winter and a decrease during the summer months has been predicted. Forecasts predict long-lasting periods without precipitation, or periods of very low precipitation from spring to fall. The frequency of dry periods with temperatures >35 °C will most likely increase. The probability of short but intense rainfalls, even during droughts, will increase. Increased average temperatures in winter will result in more frequent and heavier precipitation, but less frequently in the form of snow. A
significant rise in temperature will lead to an increase in evapo-transpiration.
Decreased snowfall will cause, in particular in the highlands, changes in water flow in winter and spring. Increased evapora-tion and decreased snowfall in the winter months may lead to the decrease of water stored in the soil, lowering the level of retention of groundwater, as well as lowering the level of water in lakes and rivers. This would lead to a decrease in the amount and quality of water resources. Within the entire Odra River Basin, the risk of local floods is predicted to increase as the result of more frequent and intensive rainfalls.
Due to the global rise in sea levels as well as the intensity of storms, especially during colder seasons, the natural and anthro-pogenic system of the Baltic coast will be at risk.
Knowing that the increasing impact of climatic change will most likely lead to a decrease of the available water recourses, and, si-multaneously, to the increase of water demand in the region – es-pecially from municipal users and agriculture – measures aiming at water retention ought to be considered as crucial.
transBoundary aquifers whiCh are not ConneCted to surfaCe waters assessed in the BaltiC sea drainage Basin
CAmBRiAn-venDiAn voRonkA gRounDwATeR BoDY (no. 192)
estonia Russian federationType 4; Cambrian and Vendian sandstones and aleurolites; groundwater flow direction from Russia to Estonia; no link with surface water.Area (km2) 5 756 N/ARenewable groundwater resource (m3/d)
15 000–30 000 N/A
Thickness: mean, max (m) 100, 130. N/AGroundwater uses and functions Groundwater body is very important for water management.
In addition to hundreds of wells in sparsely populated areas, there are groundwater abstraction points in
almost all towns and settlements of Ida-Viru County.
N/A
Other information Border length 78 km. Population 87 100 (151 km2). In coastal areas, often the only groundwater body usable for public
water supply. Use is limited by lower quality due to intrusion of salt water. 60–80% of the stock in use. This aquifer
crosses the national border and is thus influenced by water abstraction both in Estonia and in the Russian Federation.
oRDoviCiAn-CAmBRiAn gRounDwATeR BoDY (no. 193)
estonia Russian federation and LatviaType 4; Sandstones and aleurolites of Ordovician and Cambrian formations; groundwater flow direction from Latvia and Russia to Southeast–Estonia, from Southwest Estonia to Latvia and from Northeast–Estonia to Russia; no link with surface water.Area (km2) 33 571 N/ARenewable groundwater resource (m3/d)
50 000 N/A
Thickness: mean, max (m) 35, 60 N/ANumber of inhabitants 379 132 N/APopulation density 112 N/AGroundwater uses and functions Mainly used for drinking water; very
important for water management.N/A
Other information Border length 119 km. Population 379 100 (112 inhabitants/km2). The aquifer crosses the national border in Ida-Viru
County and is thus influenced by water abstraction both in Estonia and in the Russian Federation.
95 Detailed description on climate change can be found in the 2009 Report – Odra River Basin Management Plan, pursuant to Article 13 of the WFD.
402 | part iv
Annex I | 403
Annexes
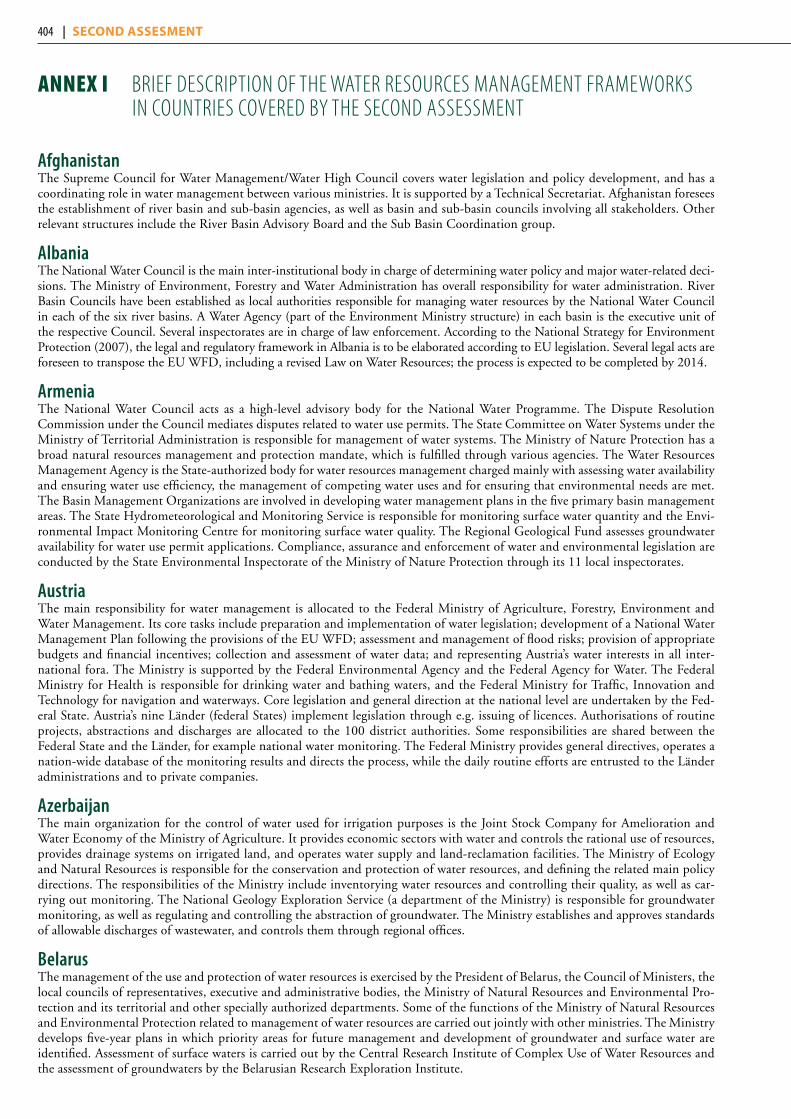
404 | Second ASSeSment
Annex I Brief description of the water resources management frameworks in countries covered By the second assessment
AfghanistanThe Supreme Council for Water Management/Water High Council covers water legislation and policy development, and has a coordinating role in water management between various ministries. It is supported by a Technical Secretariat. Afghanistan foresees the establishment of river basin and sub-basin agencies, as well as basin and sub-basin councils involving all stakeholders. Other relevant structures include the River Basin Advisory Board and the Sub Basin Coordination group.
AlbaniaThe National Water Council is the main inter-institutional body in charge of determining water policy and major water-related deci-sions. The Ministry of Environment, Forestry and Water Administration has overall responsibility for water administration. River Basin Councils have been established as local authorities responsible for managing water resources by the National Water Council in each of the six river basins. A Water Agency (part of the Environment Ministry structure) in each basin is the executive unit of the respective Council. Several inspectorates are in charge of law enforcement. According to the National Strategy for Environment Protection (2007), the legal and regulatory framework in Albania is to be elaborated according to EU legislation. Several legal acts are foreseen to transpose the EU WFD, including a revised Law on Water Resources; the process is expected to be completed by 2014.
ArmeniaThe National Water Council acts as a high-level advisory body for the National Water Programme. The Dispute Resolution Commission under the Council mediates disputes related to water use permits. The State Committee on Water Systems under the Ministry of Territorial Administration is responsible for management of water systems. The Ministry of Nature Protection has a broad natural resources management and protection mandate, which is fulfilled through various agencies. The Water Resources Management Agency is the State-authorized body for water resources management charged mainly with assessing water availability and ensuring water use efficiency, the management of competing water uses and for ensuring that environmental needs are met. The Basin Management Organizations are involved in developing water management plans in the five primary basin management areas. The State Hydrometeorological and Monitoring Service is responsible for monitoring surface water quantity and the Envi-ronmental Impact Monitoring Centre for monitoring surface water quality. The Regional Geological Fund assesses groundwater availability for water use permit applications. Compliance, assurance and enforcement of water and environmental legislation are conducted by the State Environmental Inspectorate of the Ministry of Nature Protection through its 11 local inspectorates.
AustriaThe main responsibility for water management is allocated to the Federal Ministry of Agriculture, Forestry, Environment and Water Management. Its core tasks include preparation and implementation of water legislation; development of a National Water Management Plan following the provisions of the EU WFD; assessment and management of flood risks; provision of appropriate budgets and financial incentives; collection and assessment of water data; and representing Austria’s water interests in all inter-national fora. The Ministry is supported by the Federal Environmental Agency and the Federal Agency for Water. The Federal Ministry for Health is responsible for drinking water and bathing waters, and the Federal Ministry for Traffic, Innovation and Technology for navigation and waterways. Core legislation and general direction at the national level are undertaken by the Fed-eral State. Austria’s nine Länder (federal States) implement legislation through e.g. issuing of licences. Authorisations of routine projects, abstractions and discharges are allocated to the 100 district authorities. Some responsibilities are shared between the Federal State and the Länder, for example national water monitoring. The Federal Ministry provides general directives, operates a nation-wide database of the monitoring results and directs the process, while the daily routine efforts are entrusted to the Länder administrations and to private companies.
AzerbaijanThe main organization for the control of water used for irrigation purposes is the Joint Stock Company for Amelioration and Water Economy of the Ministry of Agriculture. It provides economic sectors with water and controls the rational use of resources, provides drainage systems on irrigated land, and operates water supply and land-reclamation facilities. The Ministry of Ecology and Natural Resources is responsible for the conservation and protection of water resources, and defining the related main policy directions. The responsibilities of the Ministry include inventorying water resources and controlling their quality, as well as car-rying out monitoring. The National Geology Exploration Service (a department of the Ministry) is responsible for groundwater monitoring, as well as regulating and controlling the abstraction of groundwater. The Ministry establishes and approves standards of allowable discharges of wastewater, and controls them through regional offices.
BelarusThe management of the use and protection of water resources is exercised by the President of Belarus, the Council of Ministers, the local councils of representatives, executive and administrative bodies, the Ministry of Natural Resources and Environmental Pro-tection and its territorial and other specially authorized departments. Some of the functions of the Ministry of Natural Resources and Environmental Protection related to management of water resources are carried out jointly with other ministries. The Ministry develops five-year plans in which priority areas for future management and development of groundwater and surface water are identified. Assessment of surface waters is carried out by the Central Research Institute of Complex Use of Water Resources and the assessment of groundwaters by the Belarusian Research Exploration Institute.
Annex I | 405
BelgiumIn Belgium, the federal and regional environmental competences are exclusive, equivalent material competences, without any hierarchy. For the exercise of these competences in the implementation of international water policy, the necessary internal co-ordination is established on two levels: 1) from a broad international perspective, the treaties on the transboundary basins of the Scheldt and Meuse were concluded by the Federal State and the three regions; and 2) for regular and systematic internal Belgian coordination of the environmental policy, there is a consultative body, the Coordination Committee International Environmental Policy. The Committee was established by a cooperation agreement between the Federal State, the Flemish Region, the Walloon Region and the Brussels Capital Region in 1995. The secretary and presidency of the Committee is being held by the Federal State. The Committee has established several technical working groups. The Steering Group Water (presided by the Flemish Region, i.e. the Flemish Environment Agency) is the consultative body that is in charge of the necessary coordination between the different competent authorities in Belgium.
Bosnia and HerzegovinaBosnia and Herzegovina is politically decentralized and comprises two governing Entities, the Federation of Bosnia and Herze-govina and the Republika Srpska, with Brčko District as a de facto third entity. The State of Bosnia and Herzegovina is the central authority, but has only limited and specific powers with regard to the water sector and environmental protection: the Ministry of Foreign Trade and Economic Relations has water-related competencies at the level of Bosnia and Herzegovina. The two Enti-ties and the Brčko District have relevant political, administrative and legal jurisdiction in their own territories. Furthermore, the Federation of Bosnia and Herzegovina is divided into 10 Cantons which have their own authorities (ministries) with competences in the water sector, including adoption of their own relevant laws. This complex administrative structure results in a number of different institutions in charge of water management issues and increases the need for coordination at the national level. The on-going reform of the water sector has led to the adoption of new water legislation. The water laws of the two Entities are to great extent harmonized, and transpose the EU WFD. Most of the needed by-laws are pending; full implementation of the Directive is expected by 2018. According to the new Water Laws, Entity Ministers (Federal Ministry of Agriculture, Water Management and Forestry in the Federation and Ministry of Agriculture, Forestry and Water Management in the Republika Srpska) are responsible for the preparation of Entity strategies for water management. The four River Basin District Agencies are in charge of water man-agement and monitoring, as well as the preparation of water management plans (by 2012).
BulgariaThe main institutions responsible for the management of water resources at the national level are the Council of Ministers and the Ministry of Environment and Water. The competent authority for adopting a national strategy on management and development of the water sector is the National Assembly. The Council of Ministers adopts national programmes in the sphere of protection and sustainable use of waters. The Ministry implements State policy regarding water management. It is the responsible institution for the implementation of the EU WFD, coordinating activities at the national level. It also supports the Council of Ministers, elabo-rating national programmes and providing advice for its decisions on issues within the scope of the Water Law (which transposes the EU WFD). Four Basin Directorates have been established as regional bodies of the Ministry competent for the implementation of the EU WFD in each of the four Basin Districts. Basin Councils (consultative bodies having a multi-stakeholder make-up) have been set up in each Basin District.
ChinaThe Ministry of Water Resources is mainly responsible for hydropower development, i.e., construction and management of (large) hydropower projects. The Ministry of Environmental Protection organizes, among other policies, the development of various environmental protection standards, criteria and technical norms. It develops plans for pollution prevention and control in key regions and river basins, as well as environmental protection plans for drinking water source areas. The Ministry also develops the emission control system and a pollutant discharge licence system for major pollutants, and supervises their implementation. The Ministry of Land and Resources supervises hydrogeological exploration and assessment, as well as monitoring and prevention of the over-abstraction and contamination of groundwater. The Ministry of Foreign Affairs is responsible for issues related to trans-boundary waters.
CroatiaThe institutions responsible for the management of water resources include the Croatian Parliament, the National Water Council and the Ministry of Regional Development, Forestry and Water Management (via its Directorate for Water Management Policy and International Projects). Other bodies are the national administration, local and regional self-government units as well as “Croatian Waters” (Hrvatske Vode), a legal entity for water management at the national level. Water management legislation has been partly harmonized with EU standards and the requirements of the EU WFD. The Water Act (2010) and the Water Manage-ment Financing Act define the legal framework of water management in Croatia. The long-term strategic document in the field of water management is the Water Management Strategy (Master Plan — 2008). This Strategy is harmonized with other sectoral strategies, and generally complies with the requirements set out in the EU WFD.
Czech RepublicThe Ministry of the Environment and the Ministry of Agriculture share key water responsibilities and are also the competent authorities responsible for the implementation of EU WFD and other EU directives. The Ministry of the Environment is respon-sible for protection and control of quality and quantity of surface and groundwater, management of drinking water resources and natural water accumulation protected areas, for flood protection and for international cooperation in water protection. The Czech Hydrometeorological Institute and the Czech Environmental Inspectorate are subordinated institutions to the Ministry of the
406 | Second ASSeSment
Environment. The Ministry of Agriculture is the central authority with regard to the use of water, administering most watercourses (which it undertakes via the 5 River Basin Authorities), and for public water supply and sanitation systems (operated by private companies). The Ministry of Agriculture has also competence of the highest water administrative authority (appeal authority in water permissions). The Ministry of Health is responsible for drinking and bathing water quality. The Ministry of Transport car-ries out the activities of a water regulating authority in matters concerning navigation. Municipal and regional authorities issue permissions for water use and disposal, wastewater discharge etc.
DenmarkThe local authorities (municipalities) are responsible for the management and the protection of water resources, i.e. rivers, lakes, coastal waters and groundwaters. The Nature Agency (a national Agency under the Danish Ministry of the Environment) is re-sponsible for overall water planning including the preparation of River Basin Management Plans and Programmes of Measures ac-cording to the EU WFD. In addition, each municipality develops a local Action Plan that transposes into practice the programme of measures covering its territory. Water monitoring is the responsibility of the Ministry of the Environment.
EstoniaWater resources management is coordinated by the Ministry of the Environment, which has the responsibility of assuring and preserving the quality of water resources (both groundwater and surface water). River basin-specific organization for water man-agement has been initiated. In the Ministry, the Water Department coordinates preparation and implementation of the water management plans. The Water Department is also responsible for the development of water infrastructures; elimination of residual pollution; agricultural water protection; protection of groundwater and surface water; and administration of transboundary water bodies. The responsibility for the development of water infrastructure involves coordination of support provided by the EU and the State to local governments and water companies to bring the water and wastewater infrastructure into accordance with the requirements of the EU Urban Wastewater Treatment Directive. The Environmental Board under the Ministry has a main office and six regional offices. The regional offices deal with practical tasks, such as issuing permits for such special uses of water as dis-charges into waterbodies, groundwater abstraction, or surface water withdrawal. The Estonian Environment Information Centre under the Ministry stores information on water and also maintains the environmental register.
FinlandThe Ministry of the Environment is in charge of water protection and environmental policies. The Ministry sets targets for water protection, develops environmental legislation, and oversees international cooperation. Moreover, it steers the regional Centres for Economic Development, Transport and the Environment, and the Finnish Environment Institute (SYKE) on those issues. The Ministry of Agriculture and Forestry also steers the regional Centres and SYKE on issues concerning management of water resources, including, for example, water service, dam safety, flood risk management, management and restoration of waters, and regulation of river systems. SYKE supports water protection and water resources management through multidisciplinary research and development, and through collecting information, and developing assessment tools and sustainable solutions. SYKE is also responsible for the monitoring and assessment of the status of surface and groundwater bodies. Finland’s 15 Centres for Economic Development, Transport and the Environment implement water protection and management measures and supervise the enforce-ment of legislation in their respective areas. Finland’s six Regional State Administrative Agencies deal with permits issued under the Water Act and the Environment Protection Act. Municipal environmental authorities promote and supervise environmental protection on the local level, and also issue environmental permits needed by smaller plants and facilities.
FranceThe State regulates relations between the different water stakeholders, and establishes the broad lines of national water policy. The State has authority over the availability of water resources. The Water Department of the Ministry in charge of Ecology coordinates water-related State work. The National Office for Water and Aquatic Environments supports it in this task. France is divided into eight River Basin Districts, which correspond to seven French rivers, and an island (Corsica). There are also five other River Basin Districts in France’s overseas departments and territories. The prefect (representing the State) is the competent authority in each River Basin District. In each River Basin District, the Basin Committee is the consultation forum for all relevant stakeholders and the Water Agency, and also draws up water management plans. Water Agencies are independent public bodies which collect taxes from water users based on the quantity of pollution discharged and volumes of water abstracted. They contribute to the financing of collective interest schemes for water resource development, combating pollution and rehabilitating aquatic environments, by providing local districts, private actors and farmers with funding. Local districts are the basic legal structure responsible for drink-ing water and wastewater treatment services.
GeorgiaThere is an ongoing reform of the environment and water sectors which might deeply affect the current institutional setting. State management and protection of surface water resources, as well as State control and the creation of a common monitoring system, is the prerogative of the Ministry of Environment Protection. The Ministry defines State policy in the sphere of pro-tection and use of water resources, ensuring the protection of water bodies; setting thresholds of pollutants in effluent waters; developing legislation; and maintaining records of water use. Monitoring surface water — both quantity and quality — is the responsibility of the National Environmental Agency within the Ministry of Environment Protection. The Ministry of Energy and Natural Resources issues licences for groundwater abstraction and shares the responsibility for water supply and wastewater development with the Ministry of Regional Development and Infrastructure. The United Water Supply Company of Georgia, under the Ministry, develops water supply projects. The Ministry of Labour, Public Health and Social Safety develops quality indicators of the state of the environment, including setting standards and technical regulations for drinking water safety, in-vestigates and controls infectious diseases, and takes preventive measures against epidemics. The authorities of the autonomous

Annex I | 407
republics (within the limits of their competence) are responsible for the protection and use of water resources on their relevant territories.
GermanyThe Federal Ministry for the Environment, Nature Conservation and Nuclear Safety addresses fundamental issues relating to water resources management and transboundary cooperation. It also transposes EU regulations on water protection, protection of the marine environment, and river basin conventions on transboundary waterbodies. Subsidiary authorities, such as the Federal Envi-ronment Agency, support the Ministry in its task through its main legislative competences. In addition, the Federal Ministry for Food, Agriculture and Consumer Protection is in charge of water management aspects in the rural sector. The Federal Ministry of Health is responsible for drinking water supply, the Federal Transport, Building and Urban Development Ministry is responsible for waterways. The Länder (federal States) are essentially responsible for enforcing the provisions relating to water, including the federal laws, and also have legislative competences. The Länder generally have a three-level administrative structure, with min-istries, district offices and lower water authorities. Water supply and sewage disposal, including technical advice, monitoring of waters and water use, especially wastewater discharges, are responsibilities of the local authorities/municipalities. As an example of permanent cooperation, monitoring of groundwater and surface water quality is an important task of the administrative authori-ties for water resources management in the Länder, while the Federal Government is the competent point of contact for the EU on this matter.
GreeceThe Special Secretariat for Water of the Ministry of Environment, Energy and Climate Change is responsible for defining national water policy and coordinating the activities of the Regional Water Directorates. Each of the 13 regional directorates is responsible for the implementation of the EU WFD and the protection and management of the river basins that are assigned to it. The Re-gional Water Councils are regional consultative bodies (having a multi-stakeholder make-up), while the National Water Council is the equivalent body at the country level. The National Water Committee, consisting of six ministers, is a policy body.
HungaryThe Ministry of Rural Development is the central governing body for rural development, including the environment, nature protection and water affairs. The Ministry coordinates policy, management and regulatory tasks in these fields, including meteorology. The Ministry’s responsibilities include international cooperation at both bilateral and multilateral levels. The Deputy State Secretary for Water Affairs coordinates water-related tasks. Responsibilities include river basin management, wa-ter resources management, protection of surface and groundwater, flood defence and monitoring tasks. The Ministry of Rural Development is the competent authority for the implementation of the EU WFD and for other water-related directives. The Ministry’s regional authorities are the ten Regional Inspectorates for Environment, Nature and Water, which are responsible for the first degree of permits and for water quality monitoring. Coordination and legal supervision is carried out by the National Inspectorate for Environment, Nature and Water. Water management activities are carried out by the 12 Regional Directorates for Environmental and Water Management, and coordinated at the national level by the Central Directorate for Water and Environment.
IrelandThe Department of the Environment, Community and Local Government’s mission is to pursue sustainable development. This includes protecting and improving water resources and the quality of drinking water, consistent with the EU WFD. A total of eight River Basin Districts form the administrative areas for coordinated implementation of the EU WFD. The Department is also responsible for developing and implementing policy and legislation in the fields of water and wastewater services. Investment by the State in water services infrastructure is channelled through the Water Services Investment Programme for major public schemes and the Rural Water Programme for smaller schemes and private supplies with responsibility devolved to the relevant local authorities. The Environmental Protection Agency (EPA) is a statutory body responsible for protecting the environment in Ireland. It regulates and polices activities that have the potential to cause pollution. The agency issues licences to local authorities for wastewater discharges, conducts environmental audits and inspections of EPA licensed facilities, oversees the environmental responsibilities of the local authorities, prosecutes breaches of environmental legislation, monitors the quality and quantity of waters, and produces independent reports to inform decision-making by national and local Government.
Islamic Republic of IranThe Iran Water Resources Management Company, under the responsibility of the Water Affairs Deputy of the Ministry of Energy, organizes, directs and provides support (technical, engineering, legal, financial and administrative) to its subsidiary companies for identification, study, development and conservation of water resources, as well as for exploitation of hydropower and opera-tion of related systems. The Company also acts as an agency of the Ministry of Energy to enforce the laws and regulations related to water, including the management, monitoring and assessment of water resources. It also prepares input to the preparation of strategies, policies and long- and medium-term plans in the water sector for the Ministry. It directs and supervises the study and implementation of projects on water supply and transfer, irrigation and drainage networks, dam stability and safety, river and bank engineering, flood control, artificial recharge and hydropower generation, as well as directing and supervising the operation of the related installations and structures. The Department of the Environment sets environmental standards.
ItalyThe Ministry of Environment, Land and Sea has the overall responsibility for water resources management. Other concerned ministries include the Ministry for Agriculture, Food and Forest Policies, and the Ministry for Infrastructure and Transport. The
408 | Second ASSeSment
Major Basin Authorities are entrusted with planning responsibilities, reflecting river basin as the basic unit within which all regu-latory actions concerning water resource management, water pollution control and soil protection are coordinated. Major Basin Authorities are cooperative bodies at an intermediate level between the national and regional where representatives of both levels are represented. Municipal utilities are aggregated into Optimal Territorial Areas, which are responsible for the management and supply of water services such as wastewater treatment, sanitation and drinking water provision. Optimal Territorial Areas also draft Optimal Territory Plans, analyse the availability of water resources, and plan for their current and future use. Basin authorities have the responsibility of verifying that the Optimal Territory Plan is coherent with basin plans and objectives. The River District Authorities have the task of producing river basin management plans. Other competences related to the implementation of the EU WFD are shared between national authorities, local authorities and River District Authorities.
KazakhstanThe Committee for Water Resources of the Ministry of Agriculture is the national body responsible for the use and protection of water resources. It delivers approvals and permits for the use of surface water and groundwater resources. It is also responsible for the management of the water network. Through the eight River Basin Organizations, which have an advisory mandate, its work is extended to basin level management. The Ministry of Environment Protection issues permits and monitors surface water. The national hydrometeorological institute, Kazhydromet, monitors both water quantity and quality. The Territorial Environmen-tal Protection Offices oversee environmental inspection and ensure the monitoring of wastewater discharges at the oblast level. Through the Committee on Geology and Mineral Resources Use, the Ministry of Energy and Mineral Resources is responsible for monitoring groundwater, including its quality. The Ministry of Health monitors access to drinking water and its quality. The Ministry of Emergencies responds to floods, droughts and protects water bodies from accidental pollution. It also deals with the issues of security and safety of hydraulic works.
KyrgyzstanThe National Council on Water was established in 2006, headed by the Prime Minister and comprising the heads of all ministries and departments, as well as the governors of all the regions, to coordinate the activities of ministries and other State bodies related to management of water resources, their use and protection. In addition, the Council’s tasks include development of a proposal for the boundaries of major basins; the preparation of the National Water Strategy for the approval of the President; the preparation of draft laws; and the supervision of the activities of the water administration at national level. In June 2010, the Government es-tablished the Committee of Water Resources and Land Reclamation, which will be engaged in the management of water resources in the country — planning, management and ensuring compliance with the legislation. Five Basin Water Management authorities are to be established. The Committee replaced the former Department of Water Resources.
LatviaWater resources management is the responsibility of the Ministry of Environmental Protection and Regional Development and its subordinated institutions: the State Environmental Service and the Latvian Environment, Geology and Meteorology Centre. The Ministry develops policy documents and legislation in the field of groundwater and surface water management and protection, controls the enforcement of EU directives concerning water management and protection, and collaborates with other relevant ministries and environmental institutions. The Ministry also participates in the EU working groups and processes in this area, and coordinates cooperation with neighbouring countries on transboundary river basins. The State Environmental Service exercises control over the use of natural resources (including water resources) and issues permits, licences, technical requirements and other administrative acts that lay down conditions for the use of natural resources (including water abstraction and discharge of waste-water). The Latvian Environment, Geology and Meteorology Centre mainly organizes State environmental monitoring, evaluates and stores gathered information and also explores and evaluates water resources (groundwater and surface water). The Centre and the Ministry, together, are responsible for planning and implementation of river basin management. An advisory council has been established for each of the four River Basin Districts, which are all international.
LithuaniaThe Lithuanian Environmental Protection Agency is responsible for overall coordination and preparation of River Basin Manage-ment Plans, as well as for reporting to the European Commission. The monitoring, characterization and classification of ground-waters, as well as pressures and impacts analysis is carried out by the Geological Service under the Ministry of Environment. The Hydrometeorological Service under the Ministry of Environment deals with hydrological monitoring and forecasts. The regula-tion of abstractions and controls of emissions and priority substances is an obligation of the Regional Environmental Protection Departments under the Ministry of Environment. Abstractions are monitored by abstracting entities following the programme approved by the Geological Service. The Regional Departments are also responsible for the implementation of the programmes of measures and, together with the Geological Service, for ensuring compliance with the rules prohibiting discharges of pollutants to groundwater. Prior regulation of discharges is ensured by the Regional Departments by means of permits. It is a shared respon-sibility of municipalities and the Ministry of Health to monitor the status of bathing waters. Monitoring in areas designated as nutrient-sensitive areas is a task of the Environmental Protection Agency.
LuxembourgThe Water Management Administration reports to the Ministry for Home Affairs and the Greater Region and is responsible for water protection and management. The main duties of the Water Management Administration cover in particular sewage, drink-ing water, surface water and groundwater protection, hydrology, fisheries, river restoration and flood risk management, as well as the transposition into national law and regulation of EU legislation on water and its implementation.
Annex I | 409
MongoliaThe Water Authority, under the Ministry of Nature, Environment and Tourism, is in charge of water resources management deal-ing with all water related issues. The Ministry of Food, Agriculture and Light Industry is responsible for water for livestock and irrigation.
MontenegroThe main institutions in charge of water management at the central level are the Ministry of Agriculture and Rural Development (water use and protection at the national level), with its subordinate Directorate for Waters as the executive agency; the Ministry of Sustainable Development and Tourism, which has competences related to the overall policy for environmental protection with authority, inter alia, in strategic integration and strategic processes related to the environment, bilateral/international coopera-tion, including coordinating implementation of projects financed by international organizations and implementation of regional/international conventions; and the National Water Council, a consultative body. Two Water Basin Districts have been established for the Black Sea and the Adriatic Sea. Much authority over environmental policy is vested in the regional offices of the differ-ent ministries. Montenegro has partly harmonized the Law on Waters with the principles of the EU WFD. According to the law, a long-term national water management programme is to be elaborated in the Water Master Plan of Montenegro. The Law on Water Management Financing Act, adopted in 2008, marks a step forward towards full implementation of EU WFD provisions. According to the National Strategy for Sustainable Development, water management principles are implemented in line with the principles of the EU WFD.
NetherlandsAt the State level, the Ministry of Infrastructure and the Environment is responsible for formulating water policy and legislation in general, supervises the implementation of water management by the other bodies, and is responsible for the management of “national” water bodies, i.e. the larger rivers, lakes and sea, and some weirs, dams and dikes. The 12 provinces are responsible for developing water policy at provincial level, within the national framework. They are also responsible for supervising the water boards, and have a broader task in spatial planning. The 25 water boards, which are the oldest democratic institutions in the Neth-erlands, have as their core task the operational management of the water system. This includes drainage of urban and rural areas, water quantity, and water quality including wastewater treatment and management of dikes and dams. The water boards are in some cases given responsibilities related to road and waterway management. The 418 municipalities are responsible for operational water management.
NorwayThe Ministry of the Environment is the central competent authority under the EU WFD, and is responsible for water quality and biodiversity, while the Ministry of Petroleum and Energy is responsible for the general management of watercourses and the quantity of water. Drinking water management is the responsibility of the Ministry of Health. The most relevant ministries and agencies cooperate in guiding regional authorities in their work under the EU WFD. Eleven county municipalities are appointed as regional competent authorities under the Directive. The 11 water regions are subdivided into about 120 water areas, wherein the municipalities cooperate to solve water issues in shared watercourses and coastal areas.
PolandThe National Water Management Authority — under the Ministry of the Environment — is a central Government administration authority responsible for the management and use of water, both surface and groundwaters. Its main duties include the development of river basin management plans (together with a programme of measures); programming, planning and supervising the implementa-tion of tasks related to maintenance of water and water infrastructure, and appropriate investment projects as well as supervision of the State Hydrological and Meteorological Service and the State Hydrogeological Service. It also supervises the seven Regional Water Management Boards (Authorities). Permanent advisory councils are established both at national and regional levels. The Inspection for Environmental Protection monitors and provides information on the state of the water resources. The Ministry of Agriculture and Rural Development is responsible for surface waters regarded as especially important for agriculture, the Ministry of Infrastructure for navigation, the Ministry of the Interior and Administration for natural disaster response, and the Ministry of Health for drinking and bathing waters. Permits for water use are issued at the voivodship and local levels.
Republic of MoldovaThe Ministry of Environment is responsible for the management of environment protection activities and implementation/en-forcement of all relevant laws, resolutions, programmes and standards. In addition to the division responsible for the management of water resources, the Ministry structure comprises the State Environmental Inspectorate, the State Hydrometeorological Service, the State Geological Agency, and the Agency “Apele Moldovei”. The Ministry of Healthcare is responsible for human health and a safe sanitary/epidemiological situation. The Ministry’s structure comprises the National Centre of Public Health, which exercises control over the sanitary and epidemiological status of the environment, including monitoring surface water and groundwater quality where drinking water is extracted and effluents are discharged. The Centre has a network of local public health centres covering all administrative districts. Local self-governance bodies are responsible for the implementation of environmental laws and regulations. Within the scope of their competence, these bodies develop and approve the resource use limits and emission/discharge limit values, and supervise/coordinate the development and operation of wastewater treatment facilities in their respec-tive jurisdictions.

410 | Second ASSeSment
RomaniaThe Ministry of Environment and Forests has overall responsibility for water resources management, including river basin man-agement, water resources management, protection of surface and groundwaters, flood defence and monitoring tasks. The Ministry is also the competent authority for the implementation of the EU WFD and for other water-related directives. The National Administration “Apele Romane”, under the coordination of the Ministry, is in charge of the implementation of the water man-agement strategy. A Department for River Management Plans at national level, and Bureaux for River Basin Management Plans in each of its 11 river basin branches in the country, have been created to this end. An Inter-ministerial Commission of Waters, including representatives of ministries, central authorities and Apele Romane, has been established to coordinate work under the EU WFD and to implement water-related directives.
Russian Federation The Ministry of Natural Resources and the Environment is the federal executive authority in public policy and legal regulation related to study, use and protection of water bodies. The Federal Water Resources Agency implements the water resources manage-ment policy. Through the 15 territorial Basin Management Authorities affiliated with the Agency, the basin principle is applied in water management. Their responsibilities include the territorial redistribution of surface water run-off, establishing operation regimes for reservoirs, carrying out protective work against adverse impacts of water, setting limits for withdrawals and wastewa-ter discharges, defining acceptable impact on water bodies, maintaining the State water register, hydrotechnical works, as well as permitting the use of water bodies. The plans on complex use and protection of water bodies, currently developed at basin level by the Federal Agency, will be the main tool for water management. Roshydromet carries out monitoring of surface water quality and hydrological indicators. Rosnedra monitors groundwater quality. State control and supervision over the use and protection of water bodies is exercised by Rosprirodnadzor. Rosvodresursy, Roshydromet, Rosnedra and Rosprirodnadzor are under the author-ity of the Ministry.
SerbiaActivities related to water management fall under the jurisdiction of the Directorate for Water of the Ministry of Agriculture, Trade, Forestry and Water Management. In addition, the Ministry of Environment, Mining and Spatial Planning and some other institutions, ministries and institutes (such as the National Council for Sustainable Development, the Ministry of Health, Serbian Environmental Protection Agency and the Hydro-meteorological Institute) have specific roles in various aspects of water manage-ment. “Serbian Waters” (a public water management company or JVP, “Srbija vode”) implements water management activities. The Provincial Secretariat of Agriculture, Water Management, and Forestry of Vojvodina Province and the JVP “Vode Vojvodine” have water management responsibilities in the territory of Vojvodina Province. Analogously, the respective provincial Secretariat, Water administration and JVP “Beogradvode” have water management responsibilities in the territory of the capital city. A long-term strategic document, the Water Master Plan, was adopted by the Government in 2002. The new Law on Waters, harmonized with EU legislation, was passed in 2010.
SlovakiaThe Ministry of Environment is a central body of the State administration responsible for the development and protection of the environment, including water management, protection of water quality and quantity and its reasonable use, flood protection and fisheries (except aquaculture and sea fishing). The Water Section is an organizational body of the Ministry comprising the follow-ing departments: the Department of State Administration in the Water Section; the Department of Water Policy; and the Depart-ment of River Basin Management and Flood Protection. The Ministry of Environment manages two State-owned enterprises, the Slovak Water Management Enterprise and the Water Management Construction Enterprise, as well as two Government-subsidized organizations: the Water Research Institute Bratislava and the Slovak Hydrometeorological Institute. The Ministry of Environ-ment coordinates and manages the activities of the Slovak Environmental Inspectorate, regional environmental authorities (eight), local environmental authorities (46 offices) and municipalities in the field of water, public water supply and wastewater, fisheries and flood protection. Other relevant organizations include the Slovak Environmental Agency, and the State Geological Institute of Dionýz Štúr.
SloveniaWater management is the responsibility of the Ministry of the Environment and Spatial Planning. Tasks are delegated to depart-ments within the Ministry, to the Environmental Agency and to the Inspectorate for the Environment and Spatial Planning. Expert assignments are carried out by the Institute for Water (for surface waters) and the Geologic Survey (for groundwaters).
SpainThe Ministry of Environmental and Rural and Marine Affairs is the national authority for the management of water resources. The Ministry performs this function through the General Directorate of Water, which is responsible for the development of the National Water Management Plan, the regulations on the Basin Management Plans, and coordination with sectoral plans; the information system of water resources; the coordination of emergency plans; inspection and safety control of water infrastructure; the establishment of criteria for the conservation of aquifers; and promotion of water treatment, reuse and saving. The National Water Council is the top advisory authority with water planning functions, which consists mainly of mandatory reporting on the draft National Water Plan and Basin Management Plans. River Basin District Authorities manage water resources at basin level and are responsible for the management of public water. They are in charge of planning, constructing and operating major water infrastructure; elaborating Basin Management Plans; setting water quality targets, as well as monitoring and enforcing them; granting permits to use water and related inspecting; undertaking hydrological studies; and also provide advisory services. The municipalities provide (or regulate when the private sector participates in service provision) drinking water supply, drainage and
Annex I | 411
treatment. Water quality management is performed by different administrations — state, local or central — depending on whether it is an intra- or inter-community basin.
SwedenThe Ministry of the Environment has the ultimate responsibility for the implementation of the EU WFD. The national authorities — the Swedish Environmental Protection Agency and the Geological Survey of Sweden — guide the River Basin District Authori-ties, for example by developing regulations and guidelines. The water management responsibilities of the Swedish Environmental Protection Agency were transferred as of July 2011 to a new authority, the Swedish Agency for Marine and Water Management. Sweden is divided into five water districts. One County Administrative Board in each district is appointed River Basin District Authority and coordinates the work in the district. The Government has appointed a Water District Board for each water district, made up of experts from different fields, that makes decisions on the authority’s various fields of responsibility. Municipalities and County Administrative Boards carry out most of the operative work on local and regional levels. The Swedish Institute for Com-municable Disease Control is responsible for work related to bathing waters, and the National Food Administration is responsible for drinking water.
SwitzerlandAt federal level, the Federal Office for the Environment is responsible for water protection, flood control and water management in general. It is also responsible for the national monitoring network (surface water and groundwater, quality and quantity). In a shared responsibility with the Cantons, the Federal Office for the Environment coordinates monitoring activities and operates a nation-wide database. The Federal Office of Energy is responsible for the aspects related to hydropower policy. The Cantons (or in some Cantons the communes or districts) grant concessions for the exploitation of water resources. The Federal Office of Public Health is in charge of aspects related to drinking water standards and hygienic aspects of the water resources (bathing waters). Core tasks at federal level are to prepare national water legislation and strategies, to oversee implementation, to provide directives to assist and facilitate implementation, and to provide subsidies for certain tasks. With respect to legislation, the Confederation sets principles on the use of water resources and develops decrees and regulations on water conservation/protection and hydraulic engineering/flood control and the security of dams. The Cantons are sovereign over their water resources and are responsible for their management. For transboundary waters, the Confederation is responsible and represents Switzerland in the international river commissions.
TajikistanThe Ministry of Land Reclamation and Water Resources is the main authority responsible for water issues, conducting policy for irrigated land reclamation, and taking decisions on the use and protection of water resources, construction of water facilities, rural water supply and irrigation. The Ministry develops and implements long-term and short-term State programmes related to central irrigation and drainage systems, canal construction and maintenance, reservoirs and rural water supply. It also keeps track of the use and protection of water resources, sets standards, limits water use and maintains the State water inventory (water cadastre). The State-owned “Tajikobdehot”, the leading supplier of water, sanitation, irrigation, and drainage in rural areas, is also under the Ministry. The State Committee of Environmental Protection, reformed in 2008, includes the Control of Use and Protection of Water Resources Unit and the Department of State Ecological Expertise. The Department is involved in water management activities such as validation of environmental impact assessments. The State Administration for Hydrometeorology (Tajikhydromet) under the Committee on Environmental Protection is the key organization responsible for environmental monitoring in Tajikistan. The Main Department of Geology under the Government (Tajikgeology) carries out monitoring of groundwater levels.
The former Yugoslav Republic of MacedoniaThe Ministry for Environment and Physical Planning is in charge of formulating and implementing environmental policy, and is the coordinating body for sustainable development issues. Water management is undertaken at the basin level, but responsibilities are still fragmented. The new Law on Waters (2008), which transposes the EU WFD, transferred competencies on water resource management from the Ministry of Agriculture, Forestry and Water Economy to the Ministry for Environment and Physical Plan-ning. Basin management authorities, the State Environment Inspectorate and other bodies under the Ministry are responsible for law enforcement. Other ministries and bodies also have direct or indirect competences on water resources, as well as natural resources and environmental management.
TurkeyThe State Planning Organization under the Prime Minister is the strategic organization guiding economic and social development through Five-Year Development Plans. International relations on transboundary water resources are in the purview of the Prime Minister’s Office and the Ministry of Foreign Affairs. The Ministry of Environment and Forest has overall responsibility for the protection and conservation of the environment and natural resources. Under the Ministry, the General Directorate of State Hy-draulic Works plays a leading role in water resource development. With its central organization and headquarters in the capital, it is organized around the 25 major river basins in the country, with Regional Directorates responsible for preparing master plans for the respective basins and for implementing water resources development plans. The General Directorate of the Electrical Power Resources Survey and Development Administration, under the Ministry of Energy and Natural Resource, conducts hydrological surveys, research and studies for assessing hydropower potential in the river basins. The General Directorate of the Bank of Prov-inces, under the Ministry of Public Works and Resettlement, assists municipalities in financing and constructing infrastructure for water supply, sewerage and wastewater treatment. The Ministry of Health is responsible for determining quality standards for drinking water and other water use, monitoring these standards and preparing legislation in these areas. The Ministry of Agricul-ture and Rural Affairs has responsibilities related to policy for development of irrigation as a part of agricultural policy and rural

412 | Second ASSeSment
development. At the provincial and local level, municipalities and Province Special Administrations under the Ministry of Interior have responsibilities in providing water supply and wastewater facilities.
Turkmenistan1
The Cabinet of Ministers approves the main parameters and programmes related to water resources development; defines and regulates both the delegation of water management and nature protection functions and the control over the distribution and use of water resources; and regulates and supervises transboundary cooperation with neighbouring countries. The Ministry of Water Resources is the main Government agency in the field of management of water resources, responsible for water intakes, bigger canals, water mains of common use and reservoirs. Welayat (oblast) water management departments include maintenance, construction and monitoring departments. There are water management departments also at etrap (district) level. The Institute Turkmensuvylymtaslama within the Ministry of Water Resources is responsible, among others, for scientific and research activities, project design and development, specific monitoring. The Institute also develops measures for the rational use and protection of water resources, as well as the prevention of the deterioration of water quality or the pollution of water. The Ministry of Nature Protection is one of the agencies implementing State policy and intersectoral control in the field of environment protection and the use of natural resources. According to its regulations, the Ministry is responsible for the overall control over remedial actions and protection of ecosystems, prevention of deterioration of surface and groundwater resources, monitoring of environmental media and natural resources. Both the Ministry of Water Resources and the Ministry of Nature Protection have subsidiary offices in the regions.
UkraineThe State management of water resources use and protection is under the responsibility of the Cabinet of Ministers of Ukraine, special authorized executive bodies, and local authorities. The Ministry of Environment and Natural Resources is the main central executive authority responsible for sustainable use, restoration and protection of water resources. It carries out a common policy, implements IWRM and organizes State water monitoring. The State Agency of Water Resources is in charge of implementing national policies on water management and land reclamation, activities on harmful effects’ prevention and mitigation of their consequences. The activities of the Agency are coordinated by the Cabinet of Ministers through the Minister of Environment and Natural Resources. To ensure IWRM, Basin Management Authorities and River Basin Councils have been established in Ukraine. Governance is carried out according to the basin principle on the basis of international, State, targeted and regional programmes on water use and protection and water resources restoration.
United KingdomThe Government has set up a number of technical working groups to ensure the EU WFD is implemented as consistently as appropriate within the devolved administrations. The Technical Advisory Group is a partnership of the environment and conser-vation agencies. The responsible bodies in Northern Ireland (the Department of Environment, the Department of Agriculture and Rural Development, the Department of Culture Arts and Leisure, and the Department for Regional Development), and the responsible bodies in Ireland, are coordinating their water management actions through a North South Working Group on Water Quality. This group is supported by the North South Technical Advisory Group. A cross border Implementation Group, including the Northern Ireland Environment Agency, Donegal County Council and Monaghan County Council, was established to help the coordination of implementation of measures in the shared waters. River Basin Districts serve as the administrative areas for coordinated water management.
UzbekistanState water resources management at the national level is carried out by the Cabinet of Ministers through the Ministry of Agricul-ture and Water Management, the State Committee for Nature Protection, the State Committee on Geology and Mineral Resources and State local authorities. The responsibility for national water use and protection is shared by corresponding local authorities at the regional and district levels. The Ministry of Agriculture and Water Management is the body responsible for water resources management. It plays a key role in implementing State policy on water management and use, and coordinates the work of the water management bodies. The main tasks of the Ministry include, for example, the development of policy in the agricultural and water resources sector; the introduction and development of new technologies; the coordination of the activities of commer-cial service enterprises and organizations; investments in irrigation and drainage systems; and the development of policies and procedures for basin organizations. The basin administrations of irrigation systems are regional bodies under the Ministry. The State Committee on Irrigation and Drainage coordinates irrigation and drainage activities, and is responsible for the control and improvement of surface water use and compliance with legislation on nature protection. Uzhydromet monitors the hydrological regime and water quality of surface watercourses.
1 Source: “Assessment of Water Sector in Turkmenistan”, UNDP Turkmenistan, Ashgabat, February 2010.

Annex II | 413
Annex II existing agreements related to the management of transBoundary waters in the unece region
FRESHwATERS AGREEMENTS
Countrieswaters/basins concerned1 Title and related joint body
Signed (S) - Entry into force (E)
ES, PT Limia/Lima, Miño/Minho, Douro/Duero, Tejo/Tajo, Guadiana
Convention on Cooperation for the Protection and the Sustainable Use of Waters of the Spanish/Portuguese River Basins (Albufeira Convention). The Convention and its additional Protocol define for each main shared river the minimum discharge to the downstream country.
The Agreement and its additional Protocol were revised in 2008.
1998 (S)2000 (E)Revised in 2008
ES, FR Bidasoa Administrative Agreement between Spain and France on Water Management. The Coordination Committee operating on this basis is chaired by the ministries responsible for environment in France and Spain and co-chaired by the French and Spanish Water Directors.
2006
BE, FR, NL Scheldt The 1994 Treaty on the Protection of the Scheldt sets up the International Commission for the Protection of the Scheldt.
In 2002, the new Scheldt Treaty was signed in Ghent to meet the obligation to multilaterally coordinate in accordance with the EU WFD. The new Scheldt treaty also provides a new name for the commission: International Scheldt Commission (ISC).
1994 (S) 2002 (S)
BE, NL Scheldt estuary A separate set of memoranda and agreements between the Flemish Region and the Netherlands for policy and management related to the deepening, shipping, safety and nature of the Scheldt estuary are implemented by the Vlaams Nederlandse Schelde Commissie. Cooperation was formalised in the Treaty of December 2005 on cooperation and management in the Scheldt estuary.
2005
BE, FR, DE, LU, NL
Meuse The International Convention on the Meuse provides the basis for the International Meuse Commission.
The Convention replaces the Treaty of 1994 among BE, FR and NL, in order to involve all countries in the basin inter alia to implement the WFD.
2002 (S)2006 (E)
Moselle: FR, DE, LU
Saar: FR, DE
Moselle and Saar The Protocol between the Governments of the Federal Republic of Germany and the French Republic on the constitution of the International Commission for the Protection of the Saar against pollution and the Protocol between the Governments of the Federal Republic of Germany, the French Republic and the Grand Duchy of Luxembourg on the constitution of the International Commission for the Protection of the Mosel against pollution are the basis of the International Commissions for the Protection of Mosel and Saar Against Pollution (ICPMS).
1961 (S)1962 (E)
FR, DE, LU, NL, CH, EU
Rhine The Convention on the Protection of the Rhine is the basis for the International Commission for the Protection of the Rhine (ICPR).
The Convention signed in 1999 replaces the Treaty of Bern signed in 1963 as well as the Chemical Convention of 1976. The cooperation with the Coordinating Committee Rhine in which all States of the Rhine catchment are represented is subject to separate Rules of Procedure and Financial Regulations.
1999 (S)2003 (E)
FR, CH Lake Geneva The Convention between the Swiss Federal Council and the Government of the French Republic on the Protection of Geneva Lake Against Pollution sets up the International Commission for the Protection of the Waters in Geneva Lake (CIPEL).
1962 (S)1963 (E)
FR, CH Lake Geneva Agreement between France and Switzerland concerning the Intervention of Bodies in charge of Fighting against Accidental Water Pollution by Hydrocarbons or Other Substances Capable of Altering the Water.
1977 (S and E)
FR, CH Genevese aquifer An arrangement for 30 years between the State of Geneva and Haute-Savoie was signed in 1978.
A new agreement relating to the use, protection, recharge and monitoring of Franco-Swiss Genevese groundwater was signed between, on the one hand, the communes of the greater Annemasse region, the Genevese communes and the commune of Viry and, on the other hand, the Republic and Canton of Geneva, in 2007. This new agreement succeeded that of 1978 and entered into force on 1 January 2008 for 30 years.
1978
2007 (S)2008 (E)
1 When not specified, the agreement covers all transboundary waters shared by the Parties.
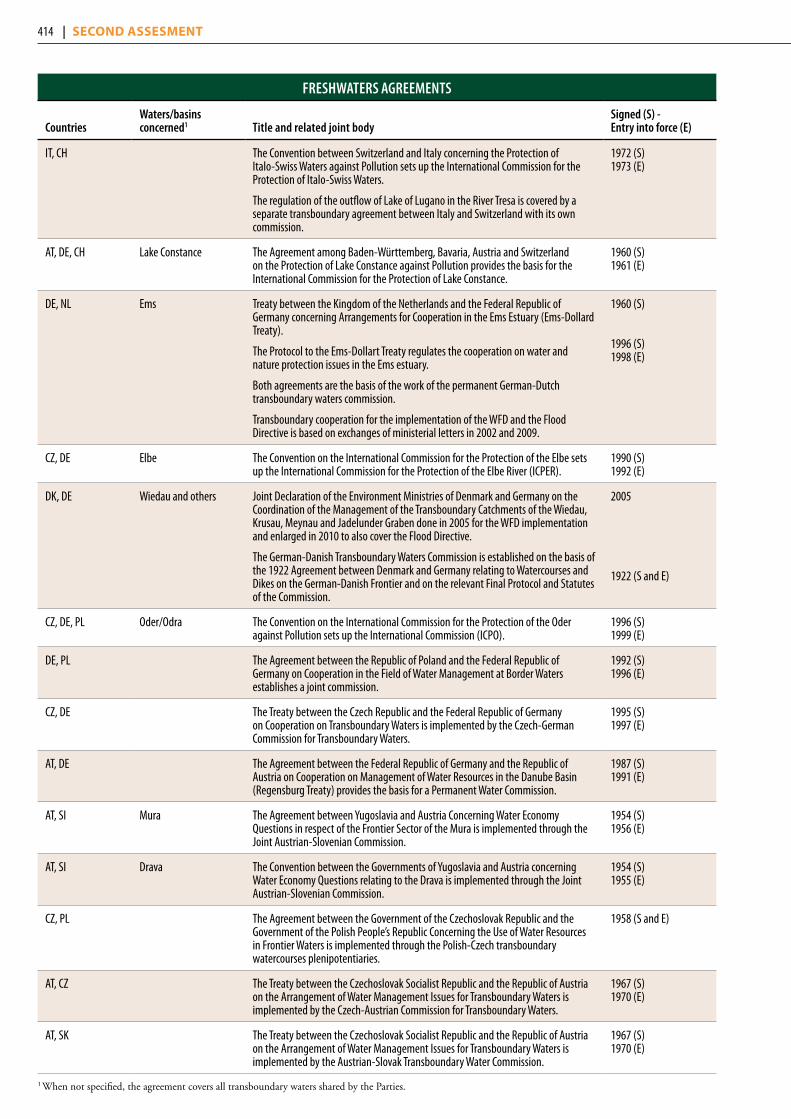
414 | Second ASSeSment
FRESHwATERS AGREEMENTS
Countrieswaters/basins concerned1 Title and related joint body
Signed (S) - Entry into force (E)
IT, CH The Convention between Switzerland and Italy concerning the Protection of Italo-Swiss Waters against Pollution sets up the International Commission for the Protection of Italo-Swiss Waters.
The regulation of the outflow of Lake of Lugano in the River Tresa is covered by a separate transboundary agreement between Italy and Switzerland with its own commission.
1972 (S)1973 (E)
AT, DE, CH Lake Constance The Agreement among Baden-Württemberg, Bavaria, Austria and Switzerland on the Protection of Lake Constance against Pollution provides the basis for the International Commission for the Protection of Lake Constance.
1960 (S)1961 (E)
DE, NL Ems Treaty between the Kingdom of the Netherlands and the Federal Republic of Germany concerning Arrangements for Cooperation in the Ems Estuary (Ems-Dollard Treaty).
The Protocol to the Ems-Dollart Treaty regulates the cooperation on water and nature protection issues in the Ems estuary.
Both agreements are the basis of the work of the permanent German-Dutch transboundary waters commission.
Transboundary cooperation for the implementation of the WFD and the Flood Directive is based on exchanges of ministerial letters in 2002 and 2009.
1960 (S)
1996 (S)1998 (E)
CZ, DE Elbe The Convention on the International Commission for the Protection of the Elbe sets up the International Commission for the Protection of the Elbe River (ICPER).
1990 (S)1992 (E)
DK, DE Wiedau and others Joint Declaration of the Environment Ministries of Denmark and Germany on the Coordination of the Management of the Transboundary Catchments of the Wiedau, Krusau, Meynau and Jadelunder Graben done in 2005 for the WFD implementation and enlarged in 2010 to also cover the Flood Directive.
The German-Danish Transboundary Waters Commission is established on the basis of the 1922 Agreement between Denmark and Germany relating to Watercourses and Dikes on the German-Danish Frontier and on the relevant Final Protocol and Statutes of the Commission.
2005
1922 (S and E)
CZ, DE, PL Oder/Odra The Convention on the International Commission for the Protection of the Oder against Pollution sets up the International Commission (ICPO).
1996 (S)1999 (E)
DE, PL The Agreement between the Republic of Poland and the Federal Republic of Germany on Cooperation in the Field of Water Management at Border Waters establishes a joint commission.
1992 (S)1996 (E)
CZ, DE The Treaty between the Czech Republic and the Federal Republic of Germany on Cooperation on Transboundary Waters is implemented by the Czech-German Commission for Transboundary Waters.
1995 (S)1997 (E)
AT, DE The Agreement between the Federal Republic of Germany and the Republic of Austria on Cooperation on Management of Water Resources in the Danube Basin (Regensburg Treaty) provides the basis for a Permanent Water Commission.
1987 (S)1991 (E)
AT, SI Mura The Agreement between Yugoslavia and Austria Concerning Water Economy Questions in respect of the Frontier Sector of the Mura is implemented through the Joint Austrian-Slovenian Commission.
1954 (S)1956 (E)
AT, SI Drava The Convention between the Governments of Yugoslavia and Austria concerning Water Economy Questions relating to the Drava is implemented through the Joint Austrian-Slovenian Commission.
1954 (S)1955 (E)
CZ, PL The Agreement between the Government of the Czechoslovak Republic and the Government of the Polish People’s Republic Concerning the Use of Water Resources in Frontier Waters is implemented through the Polish-Czech transboundary watercourses plenipotentiaries.
1958 (S and E)
AT, CZ The Treaty between the Czechoslovak Socialist Republic and the Republic of Austria on the Arrangement of Water Management Issues for Transboundary Waters is implemented by the Czech-Austrian Commission for Transboundary Waters.
1967 (S)1970 (E)
AT, SK The Treaty between the Czechoslovak Socialist Republic and the Republic of Austria on the Arrangement of Water Management Issues for Transboundary Waters is implemented by the Austrian-Slovak Transboundary Water Commission.
1967 (S)1970 (E)
1 When not specified, the agreement covers all transboundary waters shared by the Parties.
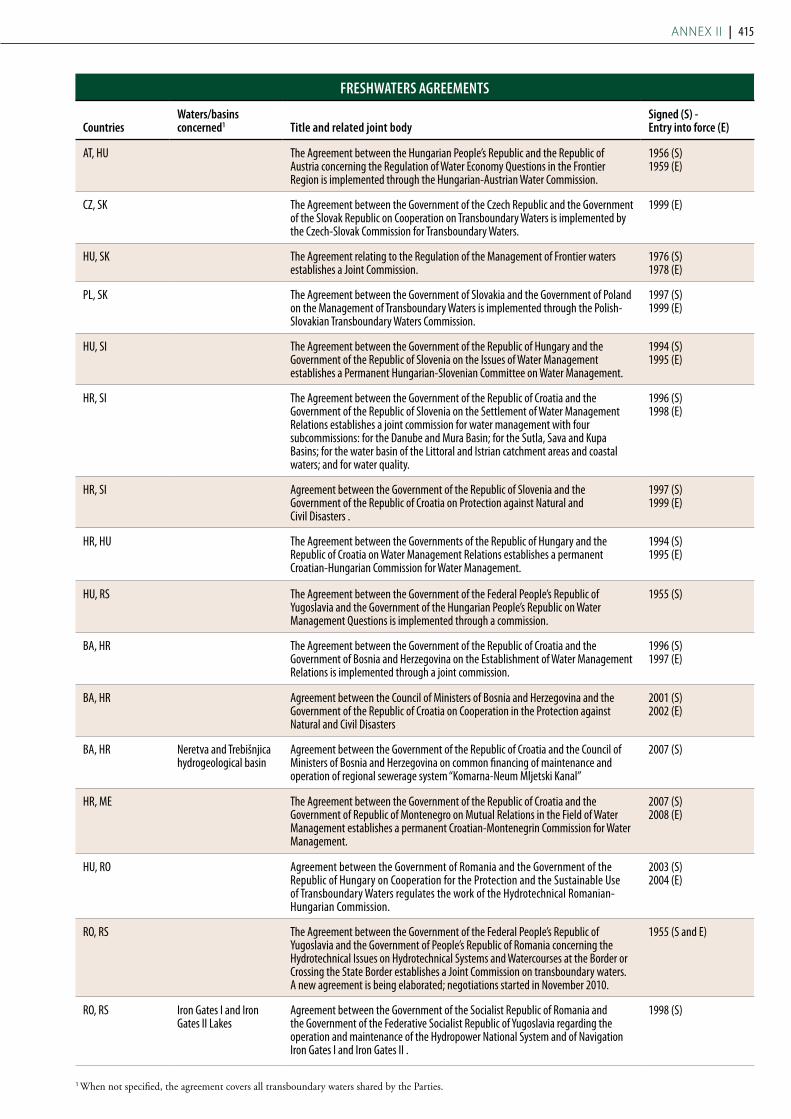
Annex II | 415
FRESHwATERS AGREEMENTS
Countrieswaters/basins concerned1 Title and related joint body
Signed (S) - Entry into force (E)
AT, HU The Agreement between the Hungarian People’s Republic and the Republic of Austria concerning the Regulation of Water Economy Questions in the Frontier Region is implemented through the Hungarian-Austrian Water Commission.
1956 (S) 1959 (E)
CZ, SK The Agreement between the Government of the Czech Republic and the Government of the Slovak Republic on Cooperation on Transboundary Waters is implemented by the Czech-Slovak Commission for Transboundary Waters.
1999 (E)
HU, SK The Agreement relating to the Regulation of the Management of Frontier waters establishes a Joint Commission.
1976 (S)1978 (E)
PL, SK The Agreement between the Government of Slovakia and the Government of Poland on the Management of Transboundary Waters is implemented through the Polish-Slovakian Transboundary Waters Commission.
1997 (S)1999 (E)
HU, SI The Agreement between the Government of the Republic of Hungary and the Government of the Republic of Slovenia on the Issues of Water Management establishes a Permanent Hungarian-Slovenian Committee on Water Management.
1994 (S) 1995 (E)
HR, SI The Agreement between the Government of the Republic of Croatia and the Government of the Republic of Slovenia on the Settlement of Water Management Relations establishes a joint commission for water management with four subcommissions: for the Danube and Mura Basin; for the Sutla, Sava and Kupa Basins; for the water basin of the Littoral and Istrian catchment areas and coastal waters; and for water quality.
1996 (S) 1998 (E)
HR, SI Agreement between the Government of the Republic of Slovenia and the Government of the Republic of Croatia on Protection against Natural and Civil Disasters .
1997 (S) 1999 (E)
HR, HU The Agreement between the Governments of the Republic of Hungary and the Republic of Croatia on Water Management Relations establishes a permanent Croatian-Hungarian Commission for Water Management.
1994 (S) 1995 (E)
HU, RS The Agreement between the Government of the Federal People’s Republic of Yugoslavia and the Government of the Hungarian People’s Republic on Water Management Questions is implemented through a commission.
1955 (S)
BA, HR The Agreement between the Government of the Republic of Croatia and the Government of Bosnia and Herzegovina on the Establishment of Water Management Relations is implemented through a joint commission.
1996 (S) 1997 (E)
BA, HR Agreement between the Council of Ministers of Bosnia and Herzegovina and the Government of the Republic of Croatia on Cooperation in the Protection against Natural and Civil Disasters
2001 (S)2002 (E)
BA, HR Neretva and Trebišnjica hydrogeological basin
Agreement between the Government of the Republic of Croatia and the Council of Ministers of Bosnia and Herzegovina on common financing of maintenance and operation of regional sewerage system “Komarna-Neum Mljetski Kanal”
2007 (S)
HR, ME The Agreement between the Government of the Republic of Croatia and the Government of Republic of Montenegro on Mutual Relations in the Field of Water Management establishes a permanent Croatian-Montenegrin Commission for Water Management.
2007 (S)2008 (E)
HU, RO Agreement between the Government of Romania and the Government of the Republic of Hungary on Cooperation for the Protection and the Sustainable Use of Transboundary Waters regulates the work of the Hydrotechnical Romanian-Hungarian Commission.
2003 (S) 2004 (E)
RO, RS The Agreement between the Government of the Federal People’s Republic of Yugoslavia and the Government of People’s Republic of Romania concerning the Hydrotechnical Issues on Hydrotechnical Systems and Watercourses at the Border or Crossing the State Border establishes a Joint Commission on transboundary waters. A new agreement is being elaborated; negotiations started in November 2010.
1955 (S and E)
RO, RS Iron Gates I and Iron Gates II Lakes
Agreement between the Government of the Socialist Republic of Romania and the Government of the Federative Socialist Republic of Yugoslavia regarding the operation and maintenance of the Hydropower National System and of Navigation Iron Gates I and Iron Gates II .
1998 (S)
1 When not specified, the agreement covers all transboundary waters shared by the Parties.

416 | Second ASSeSment
FRESHwATERS AGREEMENTS
Countrieswaters/basins concerned1 Title and related joint body
Signed (S) - Entry into force (E)
BG, RO Agreement between the Ministry of Environment and Water of Bulgaria and the Ministry of Environment of Romania for Cooperation in the Field of Water Resources Management. Three working groups have been set up, regarding: (i) River Basin Management; (ii) the Danube drainage basin; (iii) the Black Sea drainage basin.
2004 (S) 2005 (E)
BG, RS Timok River Agreement regarding the shared border. According to it, the border would stay unchanged irrespective of possible changes in the Timok riverbed’s position.
1954 (S)
BG, RS Timok River Agreement between Yugoslavia and Bulgaria, regarding a partial change of the frontier between the two parties; the natural course of Timok should have been shortened from about 17.5 to 10 km. The agreement has not been implemented.
1961 (S)
BG, RS The Agreement concerning Water Economy Questions between the Government of the Federal People’s Republic of Yugoslavia and the Government of the People’s Republic of Bulgaria established a joint commission but activities stopped in 1982.
1958 (S)1959 (E)
BA, HR, RS, SI Sava The Framework Agreement on the Sava River Basin establishes the International Sava River Basin Commission (ISRBC).
2002 (S) 2004 (E)
BA, HR, RS, SI Sava Protocol on the Prevention of Water Pollution caused by Navigation to the Framework Agreement on the Sava River Basin.
2009 (S)
BA, HR, RS, SI Sava Protocol on Flood Protection to the Framework Agreement on the Sava River Basin.
2010 (S)
AT, BA, BG, HR, CZ, DE, HU, MD, ME, RO, RS, SK, SI, UA, EU
Danube The Convention on Co-operation for the Protection and Sustainable Use of the River Danube establishes the International Commission for the Protection of the Danube River (ICPDR).
1994 (S) 1998 (E)
AL, ME Drin River, Skadar/Shkoder Lake, Buna/Bojana River
Protocol on Cooperation on Water Management . 2003 (S)
AL, ME Skadar/Shkoder Lake Memorandum of Understanding for Cooperation in the Field of Environment Protection and Sustainable Development Principle Implementation signed between the Ministry of Environment of the Republic of Albania and the Ministry of Environment and Physical Planning of the Republic of Montenegro. Expired on May 2008.
2003 (S)
AL, ME Skadar/Shkoder Lake Agreement between the Ministry of Tourism and Environment of Montenegro and Ministry of Environment, Forestry and Water Administration of the Republic of Albania for the Protection and Sustainable Development of the Skadar/Shkoder Lake establishes the Skadar/Shkoder Lake Commission.
2008 (S)
AL, MK The Agreement between the Government of the Federal People’s Republic of Yugoslavia and the Government of the People’s Republic of Albania concerning Water Economy Questions set up a Joint Water Economy Commission that stopped being operational soon after its establishment.
1956 (S) 1957 (E)
AL, MK Ohrid Lake The Agreement for the Protection and Sustainable Development of Lake Ohrid and its Watershed establishes the Lake Ohrid Watershed Committee.
2004 (S) 2005 (E)
AL,GR, MK, EU Prespa Lakes Agreement between Albania, the former Yugoslav Republic of Macedonia, Greece and the European Commission on the Protection and Sustainable Development of the Prespa Park Area.
2010 (S)
AL, GR Agreement between Albania and Greece on the establishment of the permanent Greek-Albanian Commission on transboundary freshwater issues
2005 (E)
GR, MK Vardar/Axios, Doiran Lake, Prespa Lakes
The Agreement between the Federal People’s Republic of Yugoslavia and the Kingdom of Greece concerning Hydro-economic Questions provides for the establishment of a permanent Hydro economic Commission.
1959 (S) 1960 (E)
BG, GR Struma/Strymonas, Mesta/Nestos, Arda/Ardas, Maritsa/Evros/Meriç Rivers
Agreement on Cooperation between the People’s Republic of Bulgaria and the Kingdom of Greece Concerning the Utilization of the Waters of the Rivers Crossing the Two Countries.
1964 (S and E)
1 When not specified, the agreement covers all transboundary waters shared by the Parties.

Annex II | 417
FRESHwATERS AGREEMENTS
Countrieswaters/basins concerned1 Title and related joint body
Signed (S) - Entry into force (E)
BG, GR Struma/Strymonas, Mesta/Nestos, Arda/Ardas, Maritsa/Evros/Meriç Rivers
Agreement for the Establishment of the Greek-Bulgarian Committee for Cooperation in the Fields of Electric Energy and the Utilization of the Waters of the Rivers Crossing the Two Countries that was assigned to follow up the application of the 1964 agreement.
1971 (S)
BG, GR Mesta/Nestos River The Agreement between the Government of the Hellenic Republic and the Government of the Republic of Bulgaria for the Waters of the River Mesta/Nestos sets up a Commission with the task to monitor and control the implementation of the agreement and to settle any eventual disagreements between the parties.
1995 (S) 1996 (E)
BG, GR Agreement between the Ministry of Environment and Water of the Republic of Bulgaria and the Ministry for the Environment, Physical Planning and Public Works of the Hellenic Republic on Cooperation in the Field of Environmental Protection.
2002 (S) 2005 (E)
GR, TR Maritsa/Evros/Meriç River
Agreement concerning the Control of Hydraulic Works on Both Banks of the Evros/Meriç River.
1934 (S)
GR, TR Maritsa/Evros/ Meriç River
Agreement related to the construction of flood control measures. 1955 (S)
GR, TR Maritsa/Evros/Meriç River
Protocol on the Rehabilitation of the Meriç River Basin Forming the Significant Part of Turkish-Greek Border in Thrace.
1963 (S)
GR, TR Maritsa/Evros/Meriç and Arda/Ardas Rivers
Memorandum of Understanding Concerning Cooperation on Environmental Protection.
2001 (S)
BG, TR Maritsa/Evros/Meriç, Arda/Ardas and Tundzha/Tundja/Tunca Rivers
The Agreement between the Republic of Turkey and the People’s Republic of Bulgaria concerning Cooperation in the Use of the Waters of Rivers Flowing through the Territory of Both Countries established a Joint Commission authorized to settle any disputes which might have arisen.
1968 (S and E)
BG, TR Maritsa/Evros/Meriç, Arda/Ardas and Tundzha/Tundja/ Tunca Rivers
Agreement between the Government of the Republic of Turkey and the Government of the People’s Republic of Bulgaria on Long Term Economic, Technical, Industrial and Scientific Cooperation.
1975 (S)
BG, TR Tundzha/Tundja/ Tunca River
Agreement on Assistance and Cooperation in the Field of Water for Reducing the Negative Effects of the Drought of 1993.
1993 (S)
BG, TR Rezovska/Multudere Agreement between the Republic of Bulgaria and the Republic of Turkey on Determination of the Boundary in the Mouth Area of the Rezovska/Multudere River and Delimitation of the Maritime Areas between the Two States in the Black Sea.
1997 (S) 1998 (E)
BG, TR Maritsa/Evros/Meriç River
Protocol signed between the General Directorate of State Hydraulic Works of Turkey and the National Institute of Meteorology and Hydrology of Bulgaria for the installation, operation and maintenance of a flow observation telemetry station on the Maritsa River in Svilengrad, Bulgaria.
2002 (S)
NO, SE Convention between Norway and Sweden on Certain Questions relating to the Law on Watercourses.
A Memorandum of Understanding for the implementation of the WFD was signed in 2008.
1929 (S)1931 (E)
FI, SE The Agreement between Finland and Sweden concerning Frontier Rivers is implemented through the Finnish-Swedish Commission.
1971 (S)1972 (E)Revised in 2010
FI, NO Näätämö, Gandvik River; Garsjöen, Kjerringvatn and Förstevannene Lakes
Agreement Between the Governments of Finland and Norway on the Transfer from the Course of the Näätämö/Neiden River to the Course of the Gandvik River of Water from the Garsjöen, Kjerringvatn and Förstevannene Lakes.
1951 (S and E)
FI, NO Näätämö Agreement Concerning Fishing in the Neiden (Näätämö) River. 1977 (S)
FI, NO Agreement on a Finnish-Norwegian Commission on Boundary Watercourses. 1980 (S)
FI, NO, RU Lake Inari Agreement Between the Government of the Union of Soviet Socialist Republics, the Government of Norway and the Government of Finland Concerning the Regulation of Lake Inari by Means of the Kaitakoski Hydro-electric Power Station and Dam.
1959 (S)
1 When not specified, the agreement covers all transboundary waters shared by the Parties.

418 | Second ASSeSment
FRESHwATERS AGREEMENTS
Countrieswaters/basins concerned1 Title and related joint body
Signed (S) - Entry into force (E)
NO, RU Paatsjoki/Pasvik Agreement between Norway and the Union of Soviet Socialist Republics on the Utilization of Water Power on the Pasvik River.
1957 (S)
NO, RU Jakobselv, Paatsjoki/Pasvik
Agreement Regulating the Fishing and Conserving the Fish Stocks in the Grense Jakob River (Voriema) and Pasvik River (Paatsjoki).
1971 (S)
NO, RU Borisoglebsk Reservoir, Paatsjoki/Pasvik
Agreement Between the Government of the Kingdom of Norway and the Government of the Union of Soviet Socialist Republics Concerning Water Abstraction by Norway from the Upper Reservoir of the Borisoglebsk Hydropower Plant at the Transboundary River Pasvik.
1976 (S)
FI, RU Agreement Between the Republic of Finland and the Union of Soviet Socialist Republics concerning Frontier Water Courses. The Joint Finnish-Russian Commission started operating in 1966 on the basis of the Agreement.
1964 (S)
FI, RU Lake Saimaa and the Vuoksi River
Agreement between the Government of the Republic of Finland and the Government of the Union of Soviet Socialist Republics on the Rules of Regulating the Lake Saimaa and the Vuoksi River.
1989
FI, RU Lake Inari Protocol Between the Government of Finland and the Government of the Union of Soviet Socialist Republics on the Participation of Soviet Organizations in Pisciculture Measures in Order to Preserve the Fish Stocks in Lake Inari.
1983 (S)
EE, RU Lake Peipsi/Chudskoe, Lake Lämmijärv/Teoploye and Lake Pihkva/Pskovskoye
The Agreement between the Government of the Republic of Estonia and the Government of the Russian Federation concerning Cooperation on the Conservation and Use of Fishing Stocks in Lake Peipsi/Chudskoe, Lake Lämmijärv/Teoploye and Lake Pihkva/Pskovskoye resulted in the establishment of a joint fishery regime for the lakes.
1994
EE, RU Lake Peipsi, Lake Lämmijärv, Lake Pihkva, Narva River, Narva Reservoir
The Agreement between the Government of the Republic of Estonia and the Government of the Russian Federation Concerning Cooperation in Protection and Rational Use of Transboundary Waters forms the basis for the Joint Commission.
1997 (S and E)
EE, LV Agreement between the Ministry of Environment of the Republic of Latvia and the Ministry of the Environment of the Republic of Estonia on Cooperation in the Protection and Sustainable use of Transboundary Watercourses.
2003 (S)
LV, LT Daugava, Lielupe and Venta
The Technical protocol signed by the Latvian and Lithuanian Ministers of the Environment on Joint Management of Daugava, Lielupe and Venta River Basin Districts is the basis for expert groups from the competent authorities in the countries to exchange and coordinate information.
2003 (S)
LT, RU Agreement between the Russian Federation and Lithuania on Cooperation in Environmental Protection.
1999
LT, RU Agreement between the Joint Research Centre of the Ministry of Environment of Lithuania and the Hydrometeorology Agency of Lithuania, on the one side, and the Kaliningrad Centre on Hydrometeorology and Environmental Monitoring, on the other, concerning Cooperation in Monitoring and Exchange of Data on Transboundary Waters.
2003
LT, PL Agreement between the Government of Republic of Poland and the Government of Republic of Lithuania on Cooperation in the Use and Protection of Transboundary Waters.
2005 (S)2008 (E)
BY, LT Agreement between the Ministry of Natural Resources and Environmental Protection of the Republic of Belarus and the Environmental Protection Ministry of the Republic of Lithuania on Cooperation in the Field of Environmental Protection
1995 (S and E)
BY, PL The Agreement on Cooperation between the Hydrometeorology Department of the Ministry of Natural Resources and Environmental Protection of the Republic of Belarus and the Institute of Hydrometeorology and Water Resources of Poland ensures regular exchange of hydrometeorology data and joint hydrometeorology activities.
2003
USSR (BY, LT, RU, UA), PL
Neman, Pregel, Vistula
Agreement between the Government of the Polish People’s Republic and the Government of the Union of Soviet Socialist Republics Concerning the Use of Water Resources in Frontier Waters
1964 (S)1965 (E)
1 When not specified, the agreement covers all transboundary waters shared by the Parties.
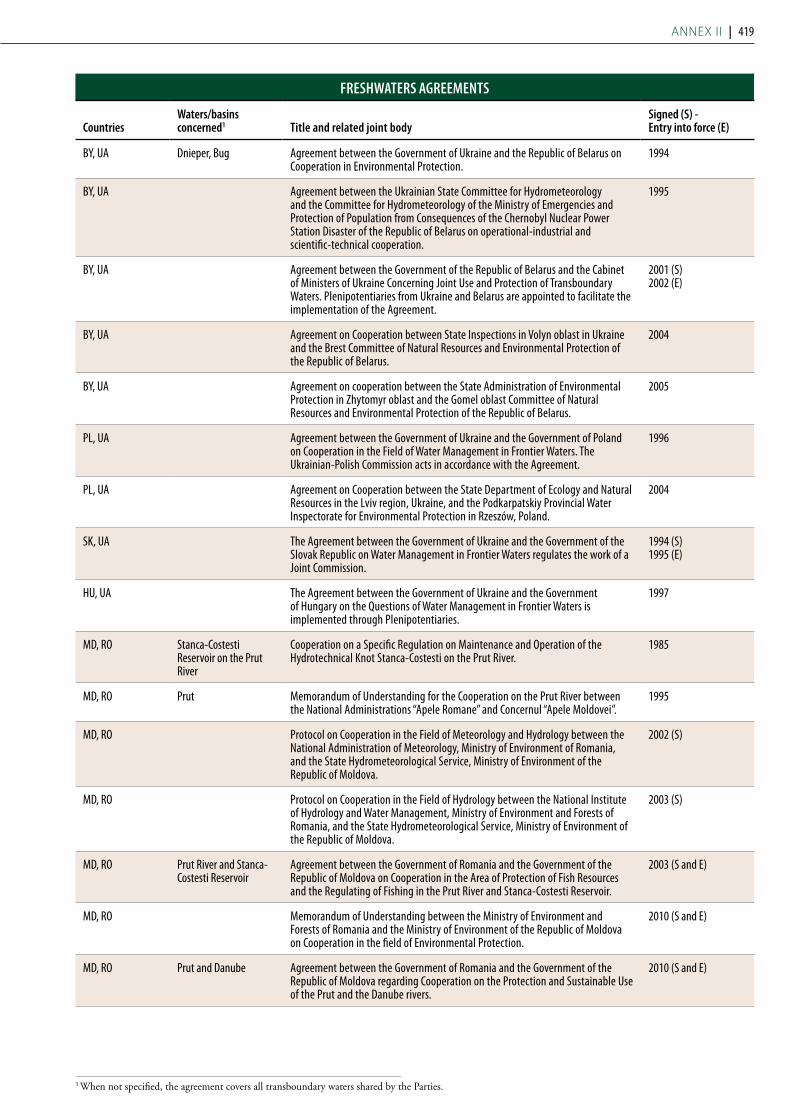
Annex II | 419
FRESHwATERS AGREEMENTS
Countrieswaters/basins concerned1 Title and related joint body
Signed (S) - Entry into force (E)
BY, UA Dnieper, Bug Agreement between the Government of Ukraine and the Republic of Belarus on Cooperation in Environmental Protection.
1994
BY, UA Agreement between the Ukrainian State Committee for Hydrometeorology and the Committee for Hydrometeorology of the Ministry of Emergencies and Protection of Population from Consequences of the Chernobyl Nuclear Power Station Disaster of the Republic of Belarus on operational-industrial and scientific-technical cooperation.
1995
BY, UA Agreement between the Government of the Republic of Belarus and the Cabinet of Ministers of Ukraine Concerning Joint Use and Protection of Transboundary Waters. Plenipotentiaries from Ukraine and Belarus are appointed to facilitate the implementation of the Agreement.
2001 (S)2002 (E)
BY, UA Agreement on Cooperation between State Inspections in Volyn oblast in Ukraine and the Brest Committee of Natural Resources and Environmental Protection of the Republic of Belarus.
2004
BY, UA Agreement on cooperation between the State Administration of Environmental Protection in Zhytomyr oblast and the Gomel oblast Committee of Natural Resources and Environmental Protection of the Republic of Belarus.
2005
PL, UA Agreement between the Government of Ukraine and the Government of Poland on Cooperation in the Field of Water Management in Frontier Waters. The Ukrainian-Polish Commission acts in accordance with the Agreement.
1996
PL, UA Agreement on Cooperation between the State Department of Ecology and Natural Resources in the Lviv region, Ukraine, and the Podkarpatskiy Provincial Water Inspectorate for Environmental Protection in Rzeszów, Poland.
2004
SK, UA The Agreement between the Government of Ukraine and the Government of the Slovak Republic on Water Management in Frontier Waters regulates the work of a Joint Commission.
1994 (S)1995 (E)
HU, UA The Agreement between the Government of Ukraine and the Government of Hungary on the Questions of Water Management in Frontier Waters is implemented through Plenipotentiaries.
1997
MD, RO Stanca-Costesti Reservoir on the Prut River
Cooperation on a Specific Regulation on Maintenance and Operation of the Hydrotechnical Knot Stanca-Costesti on the Prut River.
1985
MD, RO Prut Memorandum of Understanding for the Cooperation on the Prut River between the National Administrations “Apele Romane” and Concernul “Apele Moldovei”.
1995
MD, RO Protocol on Cooperation in the Field of Meteorology and Hydrology between the National Administration of Meteorology, Ministry of Environment of Romania, and the State Hydrometeorological Service, Ministry of Environment of the Republic of Moldova.
2002 (S)
MD, RO Protocol on Cooperation in the Field of Hydrology between the National Institute of Hydrology and Water Management, Ministry of Environment and Forests of Romania, and the State Hydrometeorological Service, Ministry of Environment of the Republic of Moldova.
2003 (S)
MD, RO Prut River and Stanca-Costesti Reservoir
Agreement between the Government of Romania and the Government of the Republic of Moldova on Cooperation in the Area of Protection of Fish Resources and the Regulating of Fishing in the Prut River and Stanca-Costesti Reservoir.
2003 (S and E)
MD, RO Memorandum of Understanding between the Ministry of Environment and Forests of Romania and the Ministry of Environment of the Republic of Moldova on Cooperation in the field of Environmental Protection.
2010 (S and E)
MD, RO Prut and Danube Agreement between the Government of Romania and the Government of the Republic of Moldova regarding Cooperation on the Protection and Sustainable Use of the Prut and the Danube rivers.
2010 (S and E)
1 When not specified, the agreement covers all transboundary waters shared by the Parties.
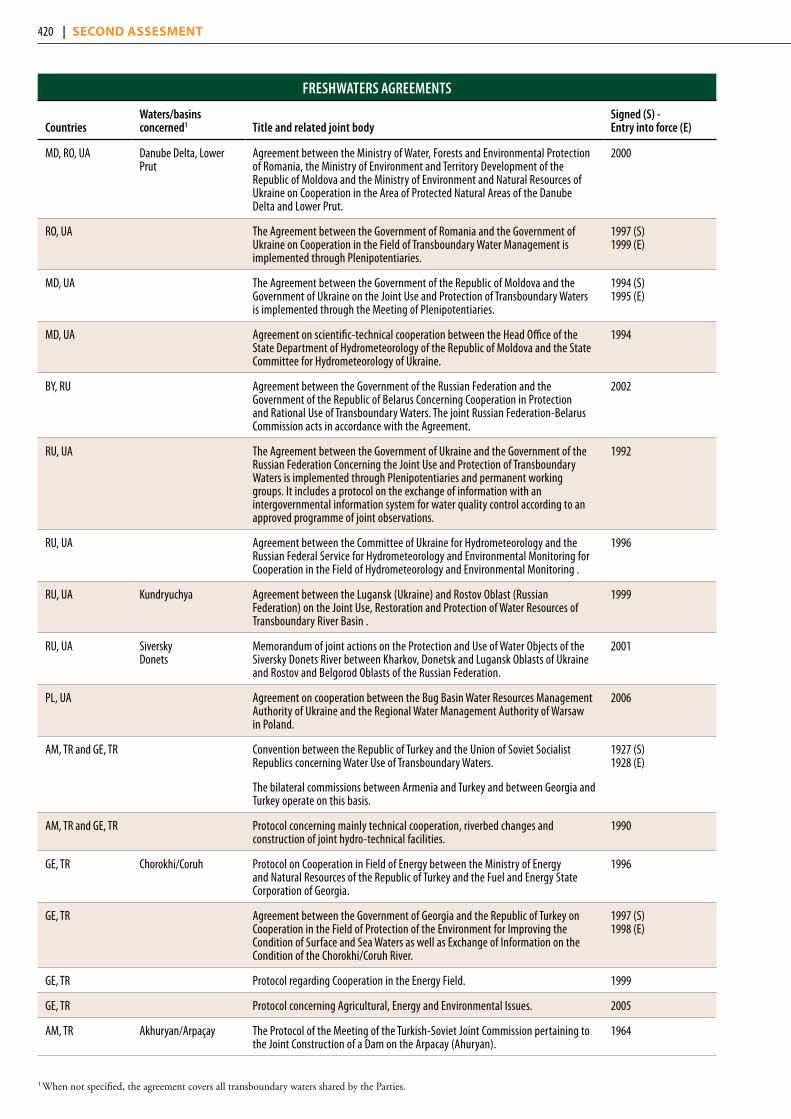
420 | Second ASSeSment
FRESHwATERS AGREEMENTS
Countrieswaters/basins concerned1 Title and related joint body
Signed (S) - Entry into force (E)
MD, RO, UA Danube Delta, Lower Prut
Agreement between the Ministry of Water, Forests and Environmental Protection of Romania, the Ministry of Environment and Territory Development of the Republic of Moldova and the Ministry of Environment and Natural Resources of Ukraine on Cooperation in the Area of Protected Natural Areas of the Danube Delta and Lower Prut.
2000
RO, UA The Agreement between the Government of Romania and the Government of Ukraine on Cooperation in the Field of Transboundary Water Management is implemented through Plenipotentiaries.
1997 (S)1999 (E)
MD, UA The Agreement between the Government of the Republic of Moldova and the Government of Ukraine on the Joint Use and Protection of Transboundary Waters is implemented through the Meeting of Plenipotentiaries.
1994 (S)1995 (E)
MD, UA Agreement on scientific-technical cooperation between the Head Office of the State Department of Hydrometeorology of the Republic of Moldova and the State Committee for Hydrometeorology of Ukraine.
1994
BY, RU Agreement between the Government of the Russian Federation and the Government of the Republic of Belarus Concerning Cooperation in Protection and Rational Use of Transboundary Waters. The joint Russian Federation-Belarus Commission acts in accordance with the Agreement.
2002
RU, UA The Agreement between the Government of Ukraine and the Government of the Russian Federation Concerning the Joint Use and Protection of Transboundary Waters is implemented through Plenipotentiaries and permanent working groups. It includes a protocol on the exchange of information with an intergovernmental information system for water quality control according to an approved programme of joint observations.
1992
RU, UA Agreement between the Committee of Ukraine for Hydrometeorology and the Russian Federal Service for Hydrometeorology and Environmental Monitoring for Cooperation in the Field of Hydrometeorology and Environmental Monitoring .
1996
RU, UA Kundryuchya Agreement between the Lugansk (Ukraine) and Rostov Oblast (Russian Federation) on the Joint Use, Restoration and Protection of Water Resources of Transboundary River Basin .
1999
RU, UA Siversky Donets
Memorandum of joint actions on the Protection and Use of Water Objects of the Siversky Donets River between Kharkov, Donetsk and Lugansk Oblasts of Ukraine and Rostov and Belgorod Oblasts of the Russian Federation.
2001
PL, UA Agreement on cooperation between the Bug Basin Water Resources Management Authority of Ukraine and the Regional Water Management Authority of Warsaw in Poland.
2006
AM, TR and GE, TR Convention between the Republic of Turkey and the Union of Soviet Socialist Republics concerning Water Use of Transboundary Waters.
The bilateral commissions between Armenia and Turkey and between Georgia and Turkey operate on this basis.
1927 (S)1928 (E)
AM, TR and GE, TR Protocol concerning mainly technical cooperation, riverbed changes and construction of joint hydro-technical facilities.
1990
GE, TR Chorokhi/Coruh Protocol on Cooperation in Field of Energy between the Ministry of Energy and Natural Resources of the Republic of Turkey and the Fuel and Energy State Corporation of Georgia.
1996
GE, TR Agreement between the Government of Georgia and the Republic of Turkey on Cooperation in the Field of Protection of the Environment for Improving the Condition of Surface and Sea Waters as well as Exchange of Information on the Condition of the Chorokhi/Coruh River.
1997 (S)1998 (E)
GE, TR Protocol regarding Cooperation in the Energy Field. 1999
GE, TR Protocol concerning Agricultural, Energy and Environmental Issues. 2005
AM, TR Akhuryan/Arpaçay The Protocol of the Meeting of the Turkish-Soviet Joint Commission pertaining to the Joint Construction of a Dam on the Arpacay (Ahuryan).
1964
1 When not specified, the agreement covers all transboundary waters shared by the Parties.

Annex II | 421
FRESHwATERS AGREEMENTS
Countrieswaters/basins concerned1 Title and related joint body
Signed (S) - Entry into force (E)
AM, TR Akhuryan/Arpaçay Cooperation Agreement between the Republic of Turkey and the Union of Soviet Socialist Republics on the Construction of a Dam on the Bordering Arpaçay (Ahuryan) River and the Constitution of a Dam Lake.
1975
AM, GE The Agreement between the Governments of Georgia and of the Republic of Armenia on Cooperation in Environmental Protection.
1997 (S)
AZ, GE Jandari Reservoir (on the Kura)
According to the agreement between the State Committee of Irrigation and Water Economy of the Azerbaijan Republic and the Department of Management of Melioration Systems of Georgia, a water volume of 70 x 106 m3 is annually delivered from Georgia to Jandari water reservoir.
1993
AZ, GE The Agreement between the Government of Georgia and the Government of Azerbaijan on Cooperation in Environmental Protection .
1997 (S and E)
AZ, GE Kura The Memorandum of Understanding between the Ministry of Environment of Georgia and the State Committee of Ecology and Nature Management of the Republic of Azerbaijan (currently the Ministry of Ecology) on Cooperation in the Development and Implementation of Pilot Projects for Monitoring and Assessment of the Status of the Kura River Basin.
1997
AZ, GE The Memorandum of Understanding between the Ministry of Ecology and Natural Resources of Azerbaijan and the Ministry of Environment Protection and Natural Resources of Georgia.
2007 (S)
AM, AZ Vorotan/Bargushad The Agreement between the Soviet Socialist Republic of Armenia and the Soviet Socialist Republic of Azerbaijan on the Joint Utilization of the Waters of the River Vorotan.
1974
AM, IR and AZ, IR Treaty between the Government of the Union of Soviet Socialist Republics and the Imperial Government of Iran concerning the Regime of the Soviet Iranian Frontier and the Procedure for the Settlement of Frontier Disputes and Incidents. The bilateral commissions between Armenia and the Islamic Republic of Iran and between Azerbaijan and the Islamic Republic of Iran act on this basis.
1957 (S)
TR, IR Sarisu/Sari Su and Karasu
The Protocol on the Joint utilization of the Waters of Sarısu and Karasu rivers. 1955 (S)
KZ, RU Agreement between the Government of the Russian Federation and the Government of the Republic of Kazakhstan Concerning the Joint Use and Protection of Transboundary Waters. The Joint Kazakh-Russian Commission operates on the basis of the agreement.
1992 (S and E)
IR, TM Tejen/Harirud Russo-Persian Treaty of Friendship between representatives of the Islamic Republic of Iran and the Union of Soviet Socialist Republics
1921
IR, TM Tejen/Harirud The Russo-Persian Treaty of Friendship Implementation Agreement includes provisions for the construction of a dam near Pol-e-Khatoon for using waters of the Tejen/Harirud River.
1926
IR, TM Tejen/Harirud, Dosti Reservoir
Agreement between the Government of the Soviet Union and the Government of the Islamic Republic of Iran for the Construction of Dosti Dam
1999
IR, TM Tejen/Harirud Agreement between the Government of Turkmenistan and the Government of the Islamic Republic of Iran on the Planning, Construction and Exploitation of the Common Water Diversion Facility on the River Tejen/Harirud in the area of the Shirdere Settlement. A joint coordinating commission operates on the basis of the agreement.
2007
KZ, KG, TJ, TM, UZ Aral Sea Basin The Agreement between the Republic of Kazakhstan, the Kyrgyz Republic, the Republic of Uzbekistan, the Republic of Tajikistan and Turkmenistan on Cooperation in Joint Management of Use and Protection of Water Resources of Interstate Sources establishes the Interstate Commission for Water Coordination of Central Asia.
1992
KZ, KG, TJ, TM, UZ Aral Sea Basin The Agreement on Joint Actions to Address the Problems of the Aral Sea and Sub-Aral Area, Environmental Rehabilitation and Socio-Economic Development of the Aral Region established the Intestate Council on the Problems of Aral Sea Basin (now absorbed by the International Fund for Saving the Aral Sea).
1993
TM, UZ Agreement between the Government of the Republic of Uzbekistan and the Government of Turkmenistan Concerning Cooperation on Water Management Issues.
1996
1 When not specified, the agreement covers all transboundary waters shared by the Parties.

422 | Second ASSeSment
FRESHwATERS AGREEMENTS
Countrieswaters/basins concerned1 Title and related joint body
Signed (S) - Entry into force (E)
KZ, KG, UZ Agreement between the Kyrgyz Republic, Republic of Kazakhstan and the Republic of Uzbekistan on the Use of Energy and Water Resources, Construction and Operation of Gas Pipelines in the Central Asian region.
1996
KZ, KG, UZ Agreement between the Government of the Republic of Kazakhstan, the Government of the Kyrgyz Republic and the Government of the Republic of Uzbekistan on Cooperation in the Area of Environment and Rational Nature Use.
1998
KZ, KG, TJ, UZ Syr Darya River Agreement between the Government of the Republic of Kazakhstan, the Government of Kyrgyz Republic, the Government of the Republic of Tajikistan, and the Government of the Republic of Uzbekistan Concerning Use of Water and Energy Resources in the Syr Darya River Basin.
1998
KZ, KG, TJ, UZ Aral Sea Basin Agreement between the Government of the Republic of Kazakhstan, the Government of the Kyrgyz Republic, the Government of the Republic of Tajikistan and the Government of the Republic of Uzbekistan Concerning Cooperation on Hydrometeorology.
1999
KZ, KG, TJ, TK, UZ Aral Sea Basin Agreement between the Government of the Republic of Kazakhstan, Government of the Kyrgyz Republic, Government of the Republic of Tajikistan, Government of Turkmenistan and Government of the Republic of Uzbekistan on the Status of the International Fund for Saving the Aral Sea (IFAS) and its organizations.
1999
KZ, KG Chu and Talas Agreement between the Government of the Republic of Kazakhstan and the Government of Kyrgyz Republic on the Use of Water Management Facilities of Intergovernmental Status on the Rivers Chu and Talas. A commission was established later on this basis.
2000
CN, KZ Agreement between the Government of the Republic of Kazakhstan and the Government of the People’s Republic of China Concerning Cooperation in Use and Protection of Transboundary Rivers. A joint commission operates on this basis.
2001
KZ, KG, TJ, TM, UZ Aral Sea Basin Framework Convention on Environmental Protection for Sustainable Development in Central Asia.
2006
CN, KZ Agreement between the Government of the Republic of Kazakhstan and the Government of the People’s Republic of China on the Protection of the Water Quality of Transboundary Rivers.
2011
CN, RU Amur and Ussuri/Wusuli Rivers
Agreement between the Government of the Russian Federation and the Government of the People’s Republic of China on Cooperation Concerning Protection, Regulation and Reproduction of Living Water Resources in Frontier Waters of the Rivers Amur and Ussuri. A mixed commission established earlier deals with related matters.
1994
CN, RU Agreement between the Government of the Russian Federation and the Government of the People’s Republic of China Concerning Guidance of Joint Economic Use of Separate Islands and Surrounding Water Areas in Frontier Rivers.
1997
CN, RU Argun/Hailaer Agreement between the Government of the Russian Federation and the Government of the People’s Republic of China on Cooperation related to the Protection of Water Quality and the Ecological Status of the Argun River
2006
CN, RU Agreement between the Government of the Russian Federation and the Government of the People’s Republic of China Concerning Rational Use and Protection of Transboundary Waters. A joint commission operates on this basis.
2008
MN, RU The Agreement between the Government of the Russian Federation and the Government of Mongolia on the Protection and Use of Transboundary Waters is implemented through Plenipotentiaries.
1995
1 When not specified, the agreement covers all transboundary waters shared by the Parties.
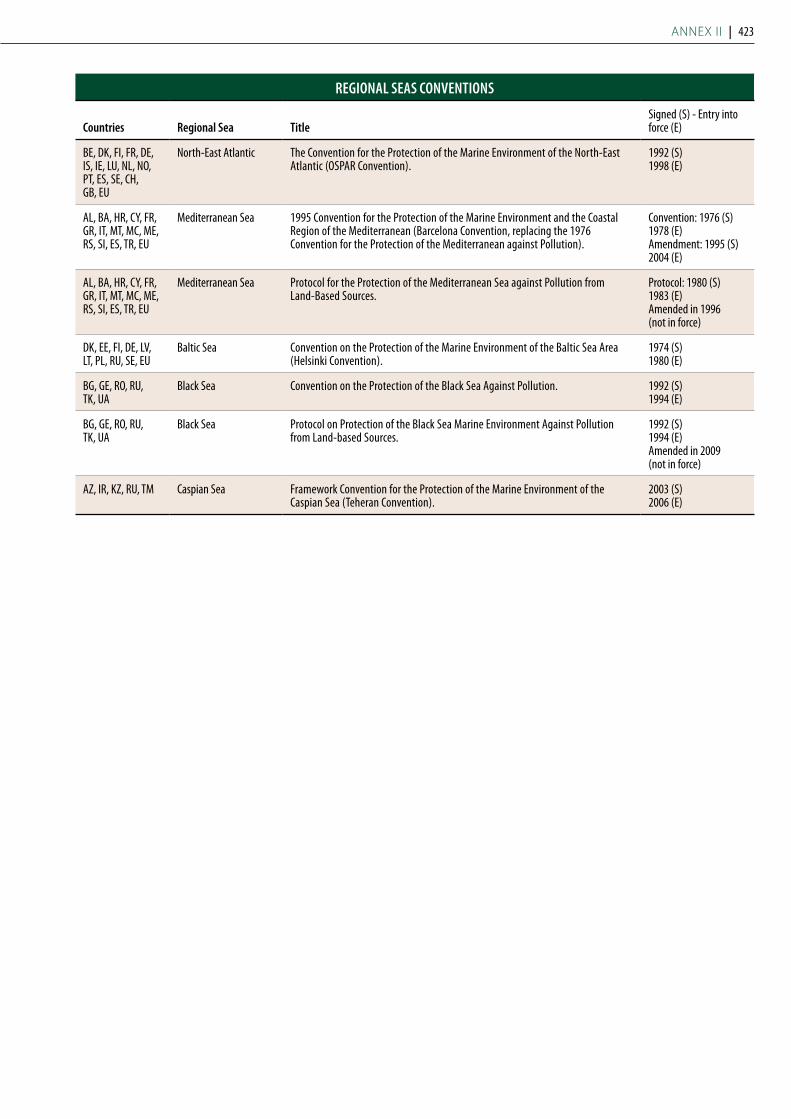
Annex II | 423
REGIoNAL SEAS CoNvENTIoNS
Countries Regional Sea Title Signed (S) - Entry into force (E)
BE, DK, FI, FR, DE, IS, IE, LU, NL, NO, PT, ES, SE, CH, GB, EU
North-East Atlantic The Convention for the Protection of the Marine Environment of the North-East Atlantic (OSPAR Convention).
1992 (S)1998 (E)
AL, BA, HR, CY, FR, GR, IT, MT, MC, ME, RS, SI, ES, TR, EU
Mediterranean Sea 1995 Convention for the Protection of the Marine Environment and the Coastal Region of the Mediterranean (Barcelona Convention, replacing the 1976 Convention for the Protection of the Mediterranean against Pollution).
Convention: 1976 (S)1978 (E)Amendment: 1995 (S)2004 (E)
AL, BA, HR, CY, FR, GR, IT, MT, MC, ME, RS, SI, ES, TR, EU
Mediterranean Sea Protocol for the Protection of the Mediterranean Sea against Pollution from Land-Based Sources.
Protocol: 1980 (S)1983 (E)Amended in 1996 (not in force)
DK, EE, FI, DE, LV, LT, PL, RU, SE, EU
Baltic Sea Convention on the Protection of the Marine Environment of the Baltic Sea Area (Helsinki Convention).
1974 (S)1980 (E)
BG, GE, RO, RU, TK, UA
Black Sea Convention on the Protection of the Black Sea Against Pollution. 1992 (S)1994 (E)
BG, GE, RO, RU, TK, UA
Black Sea Protocol on Protection of the Black Sea Marine Environment Against Pollution from Land-based Sources.
1992 (S)1994 (E)Amended in 2009 (not in force)
AZ, IR, KZ, RU, TM Caspian Sea Framework Convention for the Protection of the Marine Environment of the Caspian Sea (Teheran Convention).
2003 (S)2006 (E)

424 | Second ASSeSment
Annex III status of ratification of selected international agreements relevant to transBoundary water management
TreATy
CounTrIes
AF AL AM AT AZ BY BE BA BG CN HR CZ DK EE FI FR GE DE GR HU IR IE IT KZ KG
convention on the protection and use of transboundary watercourses and international lakes (helsinki, 1992)
N/A • • • • • • • N/A • • • • • • • • • N/A • •
protocol on water and health (to the unece water convention, london, 1999)
N/A • S • • • N/A • • S • • • S • S • N/A S
protocol on civil liability and compensation for damage caused by the transboundary effects of industrial accidents on transboundary waters (to the unece water convention and industrial accidents convention, kyiv, 2003)
N/A S S S S S N/A S S S S S R N/A
convention on environmental impact assessment in a transboundary context (espoo, 1991)
N/A • • • • • • • • N/A • • • • • • • • • N/A • • • •
protocol on strategic environmental assessment (to the environmental impact assessment convention, kyiv, 2003)
N/A • • • S S • N/A • • S • • S S • S • N/A S S
convention on the transboundary effects of industrial accidents (helsinki, 1992)
N/A • • • • • • • N/A • • • • • • • • • N/A • •
convention on access to information, public participation in decision-making and access to Justice in environmental matters (aarhus, 1998)
N/A • • • • • • • • N/A • • • • • • • • • • N/A S • • •
protocol on pollutant release and transfer registers (to the convention on public participation, kyiv, 2003)
N/A • • • • N/A • • • • • • • • N/A
convention on wetlands of international importance especially as waterfowl habitat (ramsar, 1971)
• • • • • • • • • • • • • • • • • • • • • • • •
Note: r = ratified, s = signatory, • = party. for the abbreviations of country names, please refer to the list of country codes.

Annex III | 425
TreATy
CounTrIes
Lv LT LU MK MD MN ME NL No PL PT Ro RU RS SK SI ES SE CH TJ TR TM UA GB UZ
convention on the protection and use of transboundary watercourses and international lakes (helsinki, 1992)
• • • • N/A • • • • • • • • • • • • • S •
protocol on water and health (to the unece water convention, london, 1999)
• • • • N/A • • S • • • • • S • • S
protocol on civil liability and compensation for damage caused by the transboundary effects of industrial accidents on transboundary waters (to the unece water convention and industrial accidents convention, kyiv, 2003)
S S S S N/A S S S S S S S
convention on environmental impact assessment in a transboundary context (espoo, 1991)
• • • • • N/A • • • • • • S • • • • • • • •
protocol on strategic environmental assessment (to the environmental impact assessment convention, kyiv, 2003)
S S • S N/A • • • S S • • • • • • S S
convention on the transboundary effects of industrial accidents (helsinki, 1992)
• • • • • N/A • • • • • • • • • • • • • •
convention on access to information, public participation in decision-making and access to Justice in environmental matters (aarhus, 1998)
• • • • • N/A • • • • • • • • • • • S • • • •
protocol on pollutant release and transfer registers (to the convention on public participation, kyiv, 2003)
• • • • • • • • • • • • • •
convention on wetlands of international importance especially as waterfowl habitat (ramsar, 1971)
• • • • • • • • • • • • • • • • • • • • • • • • •
Note: r = ratified, s = signatory, • = party. for the abbreviations of country names, please refer to the list of country codes.

426 | Second ASSeSment
AAggtelek aquifer 200Aghdarband aquifer 129A goundwater body 380Agstev/Agstafachai River 144Agstev-Akstafa/Tavush-
Tovuz aquifer 144Akhuryan/Arpaçay
Reservoir 154Akhuryan/Arpaçay River 154Aktaş Gölü Lake 149Alazan/Agrichay aquifer 143Alazani River 143Alluvial Quaternary aquifer shared
by Belarus and Poland 393
Almos-Vorzik aquifer 113Amur River 99Amu Darya River 108Anarjokka aquifer 88Andis-Koisu River 159Aoos River 279Aquifers in Quaternary
deposits shared by Belarus and Lithuania 384
Araks/Aras River 151Aral Sea 119Arda/Ardas River 291Argun River 101Argun River transboundary
floodplains 102Arpachay River 154Arpa River 155Arpi Lake Ramsar Site Wetlands
of Javakheti Region 150Assa River 124Astarachay River 198Atomske toplice aquifer 166Atrek/Atrak River 135Axios River 280Axios-Vardar aquifer 280Aydar Arnasay Lakes System 116
BBacka/Danube- Tisza
Interfluve aquifer 177 Bann River 346Baradla Cave System and
related wetlands 207Baranja/Drava East aquifer 194Bargushad River 155Barta River 381Béda-Karapancsa Ramsar Site 198Belene Islands Complex
Ramsar Site 181Beli Drim/Drini Bardhe
aquifer 270Bidasoa estuary 332Bidasoa River 331Bileća Reservoir/Bilećko Lake 270Bileko Lake aquifer 268Bitolsko aquifer 293Bistra – Stogovo aquifer 297 Bizeljsko/Sutla aquifer 216Boč aquifer 217Bodensee Lake 318
Bodrog aquifer 200Bohor aquifer 217Bolshoy Uzen River 163Bregana aquifer 216Bregana-Obrezje/Sava-
Samobor aquifer 216Brestovica groundwater body 264Bug aquifer 393Bug River 393Buir Lake and its surrounding
wetlands 102
CCahul River 232Cambrian-Vendian Voronka
groundwater body 402Cedillo Reservoir 340Cenomanian carbonate
terrigenous aquifer 239Cenomanian-terrigenous
aquifer 240Černeško-Libeliško aquifer 194Cerknica/Kupa aquifer 215Cetina aquifer 296Chatkal River 119Chirchik River 118Chorokhi/Coruh River 249Chu River 121Chu/Shu aquifer 121Chust-Pap aquifer 114Cogilnik River 232Constance Lake 318
DD4 goundwater body/
Upper Devonian Stipinai (LT002003400) 379
D5 goundwater body 372D6 goundwater body 373D8 goundwater body 377D9/Upper Devonian terrigenous-
carbonate complex aquifer 375D10/Polotsk and Lansky
terrigenous complex of Middle and Upper Devonian aquifer 375
Dalai Lake National Nature Reserve 102
Dalverzin aquifer 113Danube Delta Ramsar Site 180Danube River 167Daugava River 375Daurian wetlands in the
Argun sub-basin 102Debed aquifer 148Debed/Debeda River 147Dinaric Littoral (West
Coast) aquifer 296Djebrail aquifer 151Dnieper River 237Dniester River 234Dobrudja/Dobrogea Neogene
– Sarmatian aquifer 175Dobrudja/Dobrogea
Upper Jurassic – Lower Cretaceous aquifer 175
Dojran/Doirani Lake 281Dojran/Doirani Lake aquifer 282Dolinsko-Ravensko/
Mura aquifer 193Domica-Baradla Cave System
Ramsar Site 207Domica 207Donau-March-Thaya-Auen 184Douro River 336Drava-Danube confluence
Ramsar Sites 198Drava/Drava West aquifer 193Drava East aquifer 194Drava River 191Drava-Varazdin aquifer 192Drin River 270Drisvyaty/Druksiai Lake 379Dunajec River 395Dyje River 183
eEbro River 254Edirne aquifer 288Elancik River 243Elbe River 306Emajõe Suursoo Mire and
Piirissaar Island Ramsar Site 369Emosson Lake 260Ems River 311Erne River 342Ertis River 91Esil River 97Evros River 288
FF1/Permian-Upper
Devonian aquifer 382F2/Permian-Upper
Devonian aquifer 382F3 goundwater body 379Felsö-Tisza Ramsar Site 206Flood-plain marshes and
fishponds in the Araks/Aras River Valley 157
Floodplains of Morava-Dyje-Danube Confluence Trilateral Ramsar Site 184
Foyle River 344Frieira Reservoir 335
GGabirri aquifer 142Gabirri River 142Galadus/Galandusys Lake 388Ganyh River 143Gauja River 370Geneva Lake 258Geneva Lake wetland area 259Genevese aquifer 257Gevgelija/Axios-Vardar aquifer 280Glama/Glomma River 301Golobordo aquifer 298Gomishan Lagoon 137Goričko aquifer 195
Gornje Podunavlje Ramsar Site 198
Gotze Delchev aquifer 284Les Grangettes 259Grense Jakobselv aquifer 81Group of groundwater bodies
Günser Gebirge Umland 188Guadiana River 340Günstal aquifer 187
HHailaer River 99Hamburgisches Wattenmeer
Ramsar Site 314 Harirud River 129Herher, Malishkin and
Jermuk aquifers 154Hiitolanjoki River 356Hortobágy, Nagykunság, Bihar
northern part aquifer 200Hügelland Raab Ost
groundwater body 187Hügelland Rabnitz group of
groundwater bodies 188
IIbisha Island Ramsar Site 181Ili Delta – Balkhash Lake 128Ili River 126Impluvium d’Evian 259Inn River 182Iori aquifer 142Iori River 142Ipel/Ipoly River 189Ipoly völgy/Alúvium
Ipľa aquifer 190Irtysh River 91Ishim/Esil sub-basin 97Ishim River 97Iskovat-Pishkaran aquifer 114Isonzo River 262
JJablanica/Golobordo aquifer 254Jadebusen & westliche
Wesermündung Ramsar Site 314
Jakobselv River 81Janatabad aquifer 129Jandari Lake 149Jänisjoki River 352Jermuk aquifer 154Juustilanjoki River 360
KKafirnigan River 111Kagul River 232Kaltonjoki (Santajoki) River 364Kanunkankaat aquifer 354Kara Darya River 118Karasjok aquifer 88Karaozen River 163 Karatag/North-Surhandarya
aquifer 108
AlphAbeTICAl Index of rIvers, lAkes, groundwATers And rAmsAr sITes

Index of rIvers, lAkes, groundwAters And rAmsAr sItes | 427
Karat aquifer 129Karstwasser-Vorkommen
Karawanken/Karavanke aquifer 192
Kartal Lake Ramsar Site 181Kartsakhi Lake 149Kasansay aquifer 114Kemijoki River 350Khanka Lake 104Khanka Lake Ramsar Site 105Khanka Lake wetlands 105Khankaisky Zapovednik Strict
Scientific Nature Reserve 105Khor Virap Marsh 157Kiteenjoki River 355Klarälven River 303Kobariški stol aquifer 263Kočevje Goteniška gora
aquifer 215Kofarnihon aquifer 110Koiva River 370Kopacki rit Nature Park
Ramsar Site 198Korab/Bistra – Stogovo
aquifer 297Kot aquifer 196Krka aquifer 265Krka River 265Krkonoše/Karkonosze
subalpine peatbogs 310Krkonoská rašelinište
Ramsar Site 310Ktsia-Khrami aquifer 147 Ktsia-Khrami River 146Kuchurhan River 237Kučnica aquifer 195Kugurlui Lake Ramsar Site 181Kupa aquifer 215Kura aquifer 141Kura River 138Kyliiske Mouth Ramsar Site 181Körös – Crisuri holocene,
pleistocene transboundary aquifer 199
Körös-valley, Sárrét, shallow/Crişuri aquifer 200
LLac Léman 258Lac Léman wetland area 259Lafnitztal aquifer 187Lugano Lake 261Peipsi Lake and surrounding
lowlands 369Lech River 182Leninak-Shiraks aquifer 153Levajok-Valjok aquifer 88Lielupe River 379Lim aquifer 220Lima/Limia River 335Lough Foyle wetland area
in the Foyle Basin 345Lough Melvin Lake 344Lough Neagh Lake 346Lower Danube Green Corridor
and Delta Wetlands Ramsar Sites 180
Lower Prut Lakes Ramsar Site 181
MMachakhelisckali/
Macahel River 252Macva-Semberija aquifer 222Maggiore Lake 262Malishkin aquifer 154Malyi Uzen River 162Maritsa/Meric River 288Maylusu aquifer 113Mazursko-Podlashi
region aquifer 385Mesta/Nestos River 286Metohija aquifer 254Meuse River 323Middle-Devonian groundwater
body (D2) 373Middle-Lower-Devonian
groundwater body (D2-1) 373Middle Sarmantian
Pontian aquifer 229Mikri Prespa Lake 275Miño/Minho River 333Mirna aquifer 295Mirna/Istra aquifer 294Mius River 243Mokřady dolního Podyjí
Floodplains of Morava-Dyje-Danube Confluence Trilateral Ramsar Site 184
Moraleja aquifer 338Morava River 183Moravské luhy Floodplains
of Morava-Dyje-Danube Confluence Trilateral Ramsar Site 184
Moselle River 320Mourgana Mountain/Mali
Gjere aquifer 298Multudere River 167Mura aquifer 193Mura River 191Mura – Zala basin/Radgona
– Vaš aquifer 196Mures/Maros River 211Murgab River 129
nNakhichevan/Larijan and
Djebrail aquifer 151Narva River 365Naryn aquifer 114Naryn River 117Neagh Bann River Basin 346Neiden aquifer 86Neman River 384Nemechka/Vjosa-Pogoni
aquifer 279Neretva Right coast aquifer 267Neretva River 265Neretva/Trebišnjica Left
coast aquifer 268Nestos River 286Neusiedl Lake 179Nigula Nature Reserve (North
Livonian Bogs) 371Nisava River 224North and South Banat or North
and Mid Banat aquifer 201
Northeast Backa/Danube –Tisza Interfluve or Backa/Danube- Tisza Interfluve aquifer 177
Northern Bogs 371North-Kazakhstan aquifer 95North Livonian Bogs 371North-Surhandarya aquifer 108North Talas aquifer 123Notranjska Reka aquifer 295Novokračine aquifer 295Nuijamaanjärvi Lake 361Nyírség, keleti rész/Nyírség,
east margin aquifer 210Näätämö/Neiden River 86
OObmočje izvira Rižane aquifer 295Ob River 91Oder/Odra River 398Ohchu River 156Ohrid Lake 272Opatija/Istra aquifer 295Ordovician-Cambrian
groundwater body 402Ordovician Ida-Viru
groundwater body 365Ordovician Ida-Viru oil-shale
basin groundwater body 365Orestiada/Svilengrad-Stambolo/
Edirne aquifer 288Orlica aquifer 217Ormoz-Sredisce ob Drava/
Drava-Varazdin aquifer 192Orvilos-Agistros/Gotze
Delchev aquifer 284Osh-Aravan aquifer 113Osp-Boljunec groundwater
body 263Oxfordian-Cenomanian
aquifer shared by Belarus and Poland 394
Ostfriesisches Wattenmeer & Dollart Ramsar Site 314
Oxfordian-Cenomanian carbonate-terrigenous aquifer 384
Oulanka River 78Oulujoki River 351
PPaatsjoki/Pasvik River 82Paleogene-Neogene
terrigenous aquifer 239Pasvikeskeren aquifer 83Pasvik Nature Reserve 85Paleogene-Neogene aquifer shared
by Belarus and Poland 394Paleogene-Neogene
terrigenous aquifer 239Pelagonia- Florina/
Bitolsko aquifer 293Permian-Upper Devonian
aquifer/F1 382Permian-Upper Devonian
Aquifer/F2 382Pester aquifer 297Petrich valley aquifer 284P goundwater body 373
Pinkatal aquifer 187Pinkatal 2 aquifer 187Pleistocene-Holocene Mures/
Maros alluvial fan aquifer 211Pleševica/Una aquifer 219Poleski National Park 396Po River 260Poprad River 395Posavina I/Sava aquifer 218Potskhovi/Posof River 145Pre-Caspian aquifer 132Pregel River 388Preirtysh aquifer 93Prespa and Ohrid Lake
aquifer 273Prespa Lakes 273Prespa Park Wetlands
Lake Prespa 275Pretashkent aquifer 114Pripyat River 240Pripyat River Floodplains 242Prohladnaja River 390Prostyr 242Prut River 229Pskovsko-Chudskaya Lowland
Ramsar Site 369Psou aquifer 248Psou River 248Pyanj River 111Pyhäjärvi Lake 360
QQuaternary sediment aquifer 377
RRaab/Rába River 186Raabtal aquifer 187Rába Köszeg mountain
fractured aquifer 187Rába porous cold and thermal 187Rába shallow aquifer 186Rabeljski rudnik aquifer 262Rabnitzeinzugsgebiet Deep
groundwater body 187Rabnitztal aquifer 187Radgona – Vaš aquifer 196Radovica-Metlika/
Zumberak aquifer 215Rakkolanjoki River 362Razdolnaya River 106Reservoirs Iron Gate I and
Iron Gate II 178Rezovska River 167 Rhine River 315Rhin supérieur/Oberrhein –
Oberrhein/Rhin supérieur Transboundary Ramsar Site 319
Le Rhône genevois – Vallons de l’Allondon et de La Laire 259
Rhone River 254Riječina – Zvir aquifer 295Rives du Lac Léman 259Rogaška aquifer 217
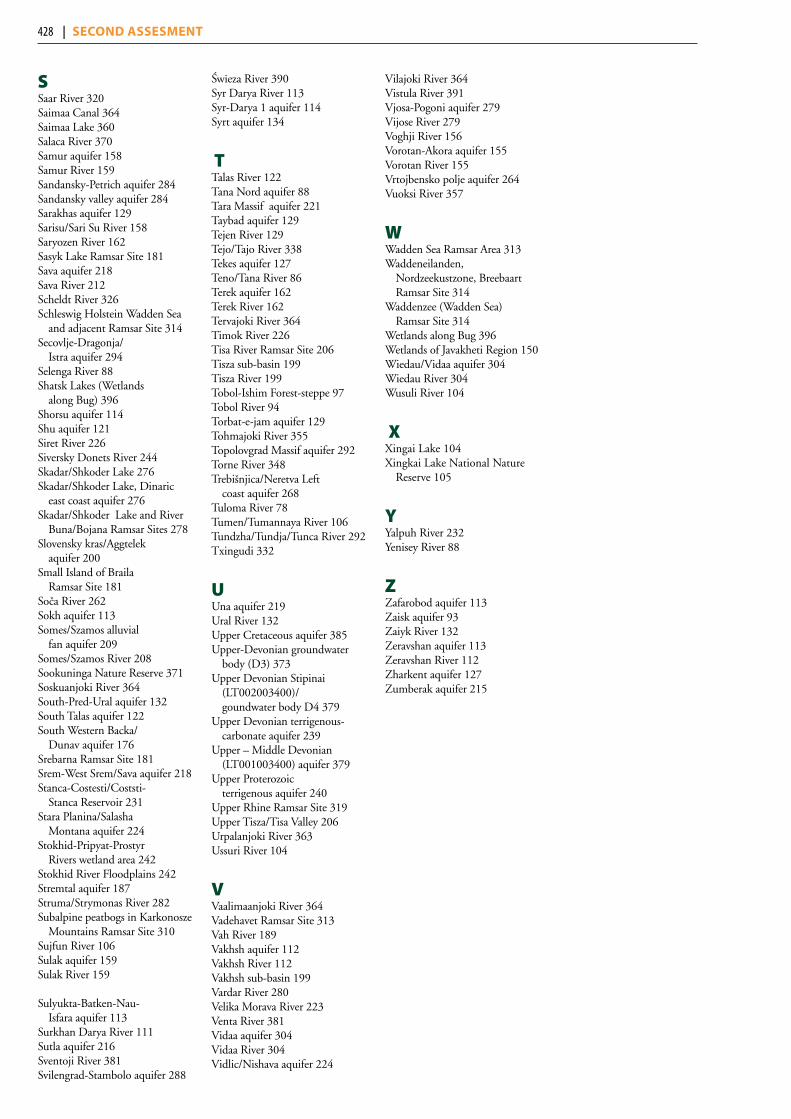
428 | Second ASSeSment
sSaar River 320Saimaa Canal 364Saimaa Lake 360Salaca River 370Samur aquifer 158Samur River 159Sandansky-Petrich aquifer 284Sandansky valley aquifer 284Sarakhas aquifer 129Sarisu/Sari Su River 158Saryozen River 162Sasyk Lake Ramsar Site 181Sava aquifer 218Sava River 212Scheldt River 326Schleswig Holstein Wadden Sea
and adjacent Ramsar Site 314Secovlje-Dragonja/
Istra aquifer 294Selenga River 88Shatsk Lakes (Wetlands
along Bug) 396Shorsu aquifer 114Shu aquifer 121Siret River 226Siversky Donets River 244Skadar/Shkoder Lake 276Skadar/Shkoder Lake, Dinaric
east coast aquifer 276Skadar/Shkoder Lake and River
Buna/Bojana Ramsar Sites 278Slovensky kras/Aggtelek
aquifer 200Small Island of Braila
Ramsar Site 181Soča River 262Sokh aquifer 113Somes/Szamos alluvial
fan aquifer 209Somes/Szamos River 208Sookuninga Nature Reserve 371Soskuanjoki River 364South-Pred-Ural aquifer 132South Talas aquifer 122South Western Backa/
Dunav aquifer 176Srebarna Ramsar Site 181Srem-West Srem/Sava aquifer 218Stanca-Costesti/Coststi-
Stanca Reservoir 231Stara Planina/Salasha
Montana aquifer 224Stokhid-Pripyat-Prostyr
Rivers wetland area 242Stokhid River Floodplains 242Stremtal aquifer 187Struma/Strymonas River 282Subalpine peatbogs in Karkonosze
Mountains Ramsar Site 310Sujfun River 106Sulak aquifer 159Sulak River 159
Sulyukta-Batken-Nau-Isfara aquifer 113
Surkhan Darya River 111Sutla aquifer 216Sventoji River 381Svilengrad-Stambolo aquifer 288
Świeza River 390Syr Darya River 113Syr-Darya 1 aquifer 114Syrt aquifer 134
TTalas River 122Tana Nord aquifer 88Tara Massif aquifer 221Taybad aquifer 129Tejen River 129Tejo/Tajo River 338Tekes aquifer 127Teno/Tana River 86Terek aquifer 162Terek River 162Tervajoki River 364Timok River 226Tisa River Ramsar Site 206Tisza sub-basin 199Tisza River 199Tobol-Ishim Forest-steppe 97Tobol River 94Torbat-e-jam aquifer 129Tohmajoki River 355Topolovgrad Massif aquifer 292Torne River 348Trebišnjica/Neretva Left
coast aquifer 268Tuloma River 78Tumen/Tumannaya River 106Tundzha/Tundja/Tunca River 292Txingudi 332
UUna aquifer 219 Ural River 132Upper Cretaceous aquifer 385Upper-Devonian groundwater
body (D3) 373Upper Devonian Stipinai
(LT002003400)/goundwater body D4 379
Upper Devonian terrigenous-carbonate aquifer 239
Upper – Middle Devonian (LT001003400) aquifer 379
Upper Proterozoic terrigenous aquifer 240
Upper Rhine Ramsar Site 319Upper Tisza/Tisa Valley 206Urpalanjoki River 363Ussuri River 104
VVaalimaanjoki River 364Vadehavet Ramsar Site 313Vah River 189Vakhsh aquifer 112Vakhsh River 112Vakhsh sub-basin 199Vardar River 280Velika Morava River 223Venta River 381Vidaa aquifer 304Vidaa River 304 Vidlic/Nishava aquifer 224
Vilajoki River 364Vistula River 391Vjosa-Pogoni aquifer 279 Vijose River 279 Voghji River 156Vorotan-Akora aquifer 155Vorotan River 155Vrtojbensko polje aquifer 264Vuoksi River 357
WWadden Sea Ramsar Area 313Waddeneilanden,
Nordzeekustzone, Breebaart Ramsar Site 314
Waddenzee (Wadden Sea) Ramsar Site 314
Wetlands along Bug 396Wetlands of Javakheti Region 150Wiedau/Vidaa aquifer 304Wiedau River 304Wusuli River 104
xXingai Lake 104Xingkai Lake National Nature
Reserve 105
YYalpuh River 232Yenisey River 88
ZZafarobod aquifer 113Zaisk aquifer 93Zaiyk River 132Zeravshan aquifer 113Zeravshan River 112Zharkent aquifer 127Zumberak aquifer 215


Photo creditsPhotos which do not include a credit acknowledgement were provided by Bigstock and Fotolia.
This publication might be reproduced in whole or in part and in any form for educational or non-profit purposes without special permission from the copyright holder, provided acknowledgement of the source is made. UNECE would appreciate receiving a copy of any publication that uses this publication as a source.
convention on the Protection and Use of transboundary Watercourses and international LakesEnvironment DivisionEconomic Commission for EuropePalais des Nations1211 Geneva 10SwitzerlandE-mail: [email protected]: www.unece.org/env/water
This publication is printed on 100 per cent recycled, chlorine-free paper.
Printed at United Nations, Genevaece/MP.WAt/33
United Nations publicationSales No E. 11.II.E.15
ISBN 978-92-1-117052-8
The Second Assessment of Transboundary Rivers, Lakes and Groundwaters is the most comprehensive, up-to-date overview of the status of transboundary waters in the European and Asian parts of the United Nations Economic Commission for Europe (UNECE) region. It has been prepared upon request by the Sixth “Environment for Europe” Ministerial Conference as an input for the Seventh Ministerial Conference, in September 2011 in Astana, Kazakhstan.
The Second Assessment covers more than 140 transboundary rivers, 25 transboundary lakes and about 200 transboundary groundwaters. Such transboundary waters are key for the economic, social and environmental development of their riparian countries. Their basins cover more than 40% of the European and Asian surface of the UNECE region and are home to about 460 million inhabitants — more than 50% of the European and Asian population of UNECE.
Utilizing data and information provided by national Governments and river commissions, maps, graphs and statistical data, the Second Assessment presents a broad analysis of transboundary water resources, pressure factors, quantity and quality status, and transboundary impacts, as well as responses and future trends. It also documents national and transboundary legal and institutional frameworks for water management and cooperation. Recognizing the threats from climate change, the Second Assessment seeks to provide a picture of the expected impacts on transboundary water resources, including the measures planned or in place to adapt to climate change. Finally, a major innovation of the Second Assessment is the specific attention devoted to ecological and biodiversity issues, through the assessment of 25 Ramsar Sites and other wetlands of transboundary importance.
The Second Assessment highlights regional differences, specificities and vulnerabilities. It shows that progress in water management and transboundary cooperation has been achieved by many countries, but also that problems still persist. It aims to inform, guide and spur further action by Governments, river basin organizations and international and non-governmental organizations to improve the status of transboundary waters and related ecosystems.
The Second Assessment is the product of a collective effort by Parties and non-Parties to the UNECE Convention on the Protection and Use of Transboundary Watercourses and International Lakes, including countries outside the UNECE region, and more than 250 experts were involved in its preparation and contributed data and information.
Second ASSeSSment of transboundary rivers, lakes and groundwaters
Copyright©United Nations, 2011 - All rights reserved
http://www.unece.org/env/water/