Hydrochemical appraisal of ice- and rock-glacier meltwater in the hyperarid Agua Negra drainage...
16
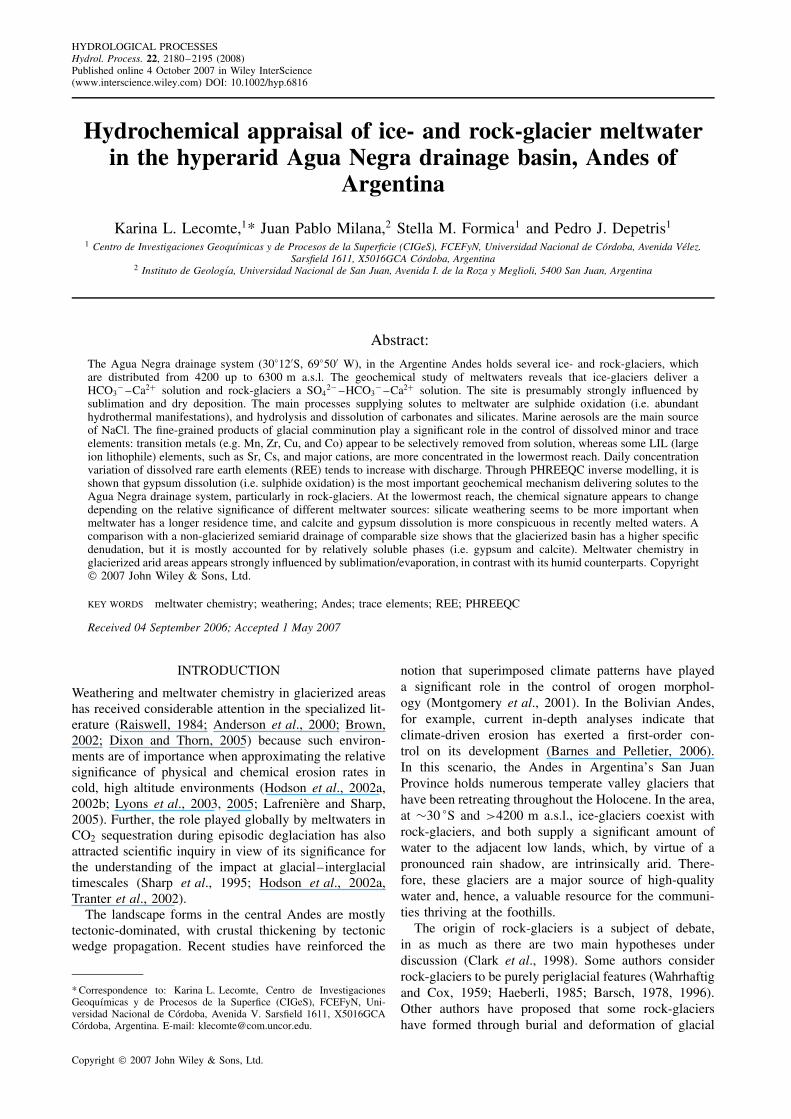
HYDROLOGICAL PROCESSES Hydrol. Process. 22, 2180–2195 (2008) Published online 4 October 2007 in Wiley InterScience (www.interscience.wiley.com) DOI: 10.1002/hyp.6816 Hydrochemical appraisal of ice- and rock-glacier meltwater in the hyperarid Agua Negra drainage basin, Andes of Argentina Karina L. Lecomte, 1 * Juan Pablo Milana, 2 Stella M. Formica 1 and Pedro J. Depetris 1 1 Centro de Investigaciones Geoqu´ ımicas y de Procesos de la Superficie (CIGeS), FCEFyN, Universidad Nacional de C´ ordoba, Avenida V´ elez. Sarsfield 1611, X5016GCA C´ ordoba, Argentina 2 Instituto de Geolog´ ıa, Universidad Nacional de San Juan, Avenida I. de la Roza y Meglioli, 5400 San Juan, Argentina Abstract: The Agua Negra drainage system (30 ° 12 0 S, 69 ° 50 0 W), in the Argentine Andes holds several ice- and rock-glaciers, which are distributed from 4200 up to 6300 m a.s.l. The geochemical study of meltwaters reveals that ice-glaciers deliver a HCO 3 –Ca 2C solution and rock-glaciers a SO 4 2 –HCO 3 –Ca 2C solution. The site is presumably strongly influenced by sublimation and dry deposition. The main processes supplying solutes to meltwater are sulphide oxidation (i.e. abundant hydrothermal manifestations), and hydrolysis and dissolution of carbonates and silicates. Marine aerosols are the main source of NaCl. The fine-grained products of glacial comminution play a significant role in the control of dissolved minor and trace elements: transition metals (e.g. Mn, Zr, Cu, and Co) appear to be selectively removed from solution, whereas some LIL (large ion lithophile) elements, such as Sr, Cs, and major cations, are more concentrated in the lowermost reach. Daily concentration variation of dissolved rare earth elements (REE) tends to increase with discharge. Through PHREEQC inverse modelling, it is shown that gypsum dissolution (i.e. sulphide oxidation) is the most important geochemical mechanism delivering solutes to the Agua Negra drainage system, particularly in rock-glaciers. At the lowermost reach, the chemical signature appears to change depending on the relative significance of different meltwater sources: silicate weathering seems to be more important when meltwater has a longer residence time, and calcite and gypsum dissolution is more conspicuous in recently melted waters. A comparison with a non-glacierized semiarid drainage of comparable size shows that the glacierized basin has a higher specific denudation, but it is mostly accounted for by relatively soluble phases (i.e. gypsum and calcite). Meltwater chemistry in glacierized arid areas appears strongly influenced by sublimation/evaporation, in contrast with its humid counterparts. Copyright 2007 John Wiley & Sons, Ltd. KEY WORDS meltwater chemistry; weathering; Andes; trace elements; REE; PHREEQC Received 04 September 2006; Accepted 1 May 2007 INTRODUCTION Weathering and meltwater chemistry in glacierized areas has received considerable attention in the specialized lit- erature (Raiswell, 1984; Anderson et al., 2000; Brown, 2002; Dixon and Thorn, 2005) because such environ- ments are of importance when approximating the relative significance of physical and chemical erosion rates in cold, high altitude environments (Hodson et al., 2002a, 2002b; Lyons et al., 2003, 2005; Lafreni` ere and Sharp, 2005). Further, the role played globally by meltwaters in CO 2 sequestration during episodic deglaciation has also attracted scientific inquiry in view of its significance for the understanding of the impact at glacial–interglacial timescales (Sharp et al., 1995; Hodson et al., 2002a, Tranter et al., 2002). The landscape forms in the central Andes are mostly tectonic-dominated, with crustal thickening by tectonic wedge propagation. Recent studies have reinforced the * Correspondence to: Karina L. Lecomte, Centro de Investigaciones Geoqu´ ımicas y de Procesos de la Superfice (CIGeS), FCEFyN, Uni- versidad Nacional de C´ ordoba, Avenida V. Sarsfield 1611, X5016GCA C´ ordoba, Argentina. E-mail: [email protected]. notion that superimposed climate patterns have played a significant role in the control of orogen morphol- ogy (Montgomery et al., 2001). In the Bolivian Andes, for example, current in-depth analyses indicate that climate-driven erosion has exerted a first-order con- trol on its development (Barnes and Pelletier, 2006). In this scenario, the Andes in Argentina’s San Juan Province holds numerous temperate valley glaciers that have been retreating throughout the Holocene. In the area, at ¾30 ° S and >4200 m a.s.l., ice-glaciers coexist with rock-glaciers, and both supply a significant amount of water to the adjacent low lands, which, by virtue of a pronounced rain shadow, are intrinsically arid. There- fore, these glaciers are a major source of high-quality water and, hence, a valuable resource for the communi- ties thriving at the foothills. The origin of rock-glaciers is a subject of debate, in as much as there are two main hypotheses under discussion (Clark et al., 1998). Some authors consider rock-glaciers to be purely periglacial features (Wahrhaftig and Cox, 1959; Haeberli, 1985; Barsch, 1978, 1996). Other authors have proposed that some rock-glaciers have formed through burial and deformation of glacial Copyright 2007 John Wiley & Sons, Ltd.
Transcript of Hydrochemical appraisal of ice- and rock-glacier meltwater in the hyperarid Agua Negra drainage...
HYDROLOGICAL PROCESSESHydrol. Process. 22, 2180–2195 (2008)Published online 4 October 2007 in Wiley InterScience(www.interscience.wiley.com) DOI: 10.1002/hyp.6816
Hydrochemical appraisal of ice- and rock-glacier meltwaterin the hyperarid Agua Negra drainage basin, Andes of
Argentina
Karina L. Lecomte,1* Juan Pablo Milana,2 Stella M. Formica1 and Pedro J. Depetris1
1 Centro de Investigaciones Geoquımicas y de Procesos de la Superficie (CIGeS), FCEFyN, Universidad Nacional de Cordoba, Avenida Velez.Sarsfield 1611, X5016GCA Cordoba, Argentina
2 Instituto de Geologıa, Universidad Nacional de San Juan, Avenida I. de la Roza y Meglioli, 5400 San Juan, Argentina
Abstract:
The Agua Negra drainage system (30°120S, 69°500 W), in the Argentine Andes holds several ice- and rock-glaciers, whichare distributed from 4200 up to 6300 m a.s.l. The geochemical study of meltwaters reveals that ice-glaciers deliver aHCO3
� –Ca2C solution and rock-glaciers a SO42� –HCO3
� –Ca2C solution. The site is presumably strongly influenced bysublimation and dry deposition. The main processes supplying solutes to meltwater are sulphide oxidation (i.e. abundanthydrothermal manifestations), and hydrolysis and dissolution of carbonates and silicates. Marine aerosols are the main sourceof NaCl. The fine-grained products of glacial comminution play a significant role in the control of dissolved minor and traceelements: transition metals (e.g. Mn, Zr, Cu, and Co) appear to be selectively removed from solution, whereas some LIL (largeion lithophile) elements, such as Sr, Cs, and major cations, are more concentrated in the lowermost reach. Daily concentrationvariation of dissolved rare earth elements (REE) tends to increase with discharge. Through PHREEQC inverse modelling, it isshown that gypsum dissolution (i.e. sulphide oxidation) is the most important geochemical mechanism delivering solutes to theAgua Negra drainage system, particularly in rock-glaciers. At the lowermost reach, the chemical signature appears to changedepending on the relative significance of different meltwater sources: silicate weathering seems to be more important whenmeltwater has a longer residence time, and calcite and gypsum dissolution is more conspicuous in recently melted waters. Acomparison with a non-glacierized semiarid drainage of comparable size shows that the glacierized basin has a higher specificdenudation, but it is mostly accounted for by relatively soluble phases (i.e. gypsum and calcite). Meltwater chemistry inglacierized arid areas appears strongly influenced by sublimation/evaporation, in contrast with its humid counterparts. Copyright 2007 John Wiley & Sons, Ltd.
KEY WORDS meltwater chemistry; weathering; Andes; trace elements; REE; PHREEQC
Received 04 September 2006; Accepted 1 May 2007
INTRODUCTION
Weathering and meltwater chemistry in glacierized areashas received considerable attention in the specialized lit-erature (Raiswell, 1984; Anderson et al., 2000; Brown,2002; Dixon and Thorn, 2005) because such environ-ments are of importance when approximating the relativesignificance of physical and chemical erosion rates incold, high altitude environments (Hodson et al., 2002a,2002b; Lyons et al., 2003, 2005; Lafreniere and Sharp,2005). Further, the role played globally by meltwaters inCO2 sequestration during episodic deglaciation has alsoattracted scientific inquiry in view of its significance forthe understanding of the impact at glacial–interglacialtimescales (Sharp et al., 1995; Hodson et al., 2002a,Tranter et al., 2002).
The landscape forms in the central Andes are mostlytectonic-dominated, with crustal thickening by tectonicwedge propagation. Recent studies have reinforced the
* Correspondence to: Karina L. Lecomte, Centro de InvestigacionesGeoquımicas y de Procesos de la Superfice (CIGeS), FCEFyN, Uni-versidad Nacional de Cordoba, Avenida V. Sarsfield 1611, X5016GCACordoba, Argentina. E-mail: [email protected].
notion that superimposed climate patterns have playeda significant role in the control of orogen morphol-ogy (Montgomery et al., 2001). In the Bolivian Andes,for example, current in-depth analyses indicate thatclimate-driven erosion has exerted a first-order con-trol on its development (Barnes and Pelletier, 2006).In this scenario, the Andes in Argentina’s San JuanProvince holds numerous temperate valley glaciers thathave been retreating throughout the Holocene. In the area,at ¾30 °S and >4200 m a.s.l., ice-glaciers coexist withrock-glaciers, and both supply a significant amount ofwater to the adjacent low lands, which, by virtue of apronounced rain shadow, are intrinsically arid. There-fore, these glaciers are a major source of high-qualitywater and, hence, a valuable resource for the communi-ties thriving at the foothills.
The origin of rock-glaciers is a subject of debate,in as much as there are two main hypotheses underdiscussion (Clark et al., 1998). Some authors considerrock-glaciers to be purely periglacial features (Wahrhaftigand Cox, 1959; Haeberli, 1985; Barsch, 1978, 1996).Other authors have proposed that some rock-glaciershave formed through burial and deformation of glacial
Copyright 2007 John Wiley & Sons, Ltd.

HYDROCHEMISTRY OF AGUA NEGRA DRAINAGE BASIN 2181
ice (Outcalt and Benedict, 1965; Corte, 1980; Whalleyand Martin, 1992; Hamilton and Whalley, 1995). In anycase, an active rock-glacier is widely used as a goodindicator of buried ice. This implies that such bodies havea complicated drainage system involving supraglacial andsubglacial melting (Thenthorey, 1992; Croce and Milana,2002b).
A number of investigations have been carried out inthe study area, mostly addressing physical and hydrolog-ical processes. Schrott (1991, 1996, 1998, 2002) studiedsolar radiation, soil temperature, and geomorphological–hydrological aspects in the permafrost. Barsch et al.(1994) presented some information on discharge vari-ability and sediment supply for the Agua Negra basin.Perucca and Carrizo (1998) studied natural hazards inthe Agua Negra highway. Leiva (1999, 2002) examinedspatial fluctuations of some Argentine glaciers, includingthe Agua Negra Glacier, and Milana and Maturano (1999)studied the structure of the Agua Negra Glacier throughseismic surveys and radio echo sounding. Croce andMilana (2002a, 2002b) reported on the internal structureand permafrost thickness of the El Paso and Dos Lenguasrock-glaciers. More recently, electrical tomography sur-veys have been carried out on El Paso, Dos Lenguas,
and Agua Negra rock-glaciers (Croce, 2006; Croce andMilana, 2006).The geochemistry of these Andean glaciershas received insufficient consideration in the specializedliterature.
In this paper it is intended to establish: (a) the prove-nance of solutes and the relative significance of eachsource; (b) the main rock weathering characteristicsunder conditions of extreme aridity; and (c) the identi-fication of processes that govern the downstream soluteevolution.
FIELD SITE
For this study, the upper catchments of the Agua Negrariver basin (¾240 km2) was selected, which is one of thebest known glaciated drainage basins in the arid to hyper-arid subtropical Andes. It is located in western Argentina(i.e. the Cuyo region), 30°120S and 69° 500W. The roadcrossing (R.N. 150) the Argentina–Chile internationalborder (the oceanic water divide) at a height of 4880 ma.s.l. (Figure 1), runs through the area, next to rock- andice-glaciers. The outfall of the studied drainage is locatedat Ojos de Agua, at 3350 m a.s.l. The basin extends uphill
Figure 1. Location map of Agua Negra drainage basin. Stiff diagrams at each sampling point are included as a guide to follow chemical evolution.Sampling sites are keyed in Table I
Copyright 2007 John Wiley & Sons, Ltd. Hydrol. Process. 22, 2180–2195 (2008)DOI: 10.1002/hyp

2182 K. L. LECOMTE ET AL.
to the summits of Cordillera de Olivares, reaching a max-imum height of 6266 m a.s.l.
The high Andes in the province of San Juan arecharacterized by arid to hyperarid conditions, withhigh solar radiation intensities throughout the year.Global solar radiation measured at heights of 4150and 4720 m reaches annual means of 20Ð6 MJ m�2 and22Ð3 MJ m�2, respectively (Schrott, 1996). Maximumtemperatures (¾22 °C) occur in February and minimum(¾ � 27 °C) in July. Relative humidity varies between16 and 80%. Above 4000 m a.s.l., annual precipitationoscillates between 100 and 350 mm, mostly as snowfall,and occurs almost exclusively during the (austral) wintermonths (Perucca and Carrizo, 1998).
The tundra biome dominates everywhere in the stud-ied area. The leading biological characteristics are thecomplete absence of trees and low biotic diversity, frost-moulded landscapes, and short growing seasons. Alsosignificant is the fact that energy and nutrients are storedmainly in the form of dead organic material. The plantsinclude tussock grasses, small-leafed shrubs (e.g. Stipasp., Prosopis sp.), and heaths. Most streams in the AguaNegra drainage basin are of the kryal type, since they aredirectly fed by glacial meltwater; other smaller catch-ments are of the rhithral type because they are fed bysnowmelt and occasional rainfall (Ward, 1994).
The geology of the basin is composed primarily ofphysically weathered andesites and other volcanic rocks(Choiyoi Group, Carboniferous–Permian), which are ontop of sandstones and mudstones of the Agua Negra Fm.(Carboniferous). There are minor proportions of asso-ciated acid volcanic (rhyolites) and pyroclastic rocks,whereas the basalts of the Olivares complex (Late Ter-tiary and Quaternary) crop out as thick dark layers inthe uppermost edge of the basin. Of some significanceare localized areas with hydrothermal alteration, whichexhibit a high proportion of sulphides that appear as red-dish patches. Ramos (1999) described the correspondingregional geology.
The outfall of the Agua Negra drainage basin is at thebase of what is probably the lowermost frontal moraineassociated with the Pleistocene Agua Negra Glacier. Thismoraine acted as a sediment-retaining dam that generateda several kilometre-long braid plain of highly permeablematerial.
Three main streams contribute to the main channel:the Pircas Negras; the San Lorenzo; and the Agua Negrastream itself (Figure 1).
(1) The Pircas Negras stream is fed by the largest ice-glacier in the area. A radio echo sounding survey ofthe Pircas Negras glacier showed that it is 200 m thickin the centre and has an ice volume 20 times largerthan the Agua Negra glacier (Milana and Maturano,1999). Moreover, the Pircas Negras Glacier is facingnorthwest and, therefore, it is more exposed to solarradiation and produces more meltwater than otherglaciers in the area. The Pircas Negras stream runsalong a 12 km channel before joining the Agua Negra
main stem (Figure 1). A representative sample of thisstream is M2 (Figure 1).
(2) The San Lorenzo stream is fed by meltwater inabout equal proportions from ice- and rock-glaciers. Arepresentative sample of this stream is M3 (Figure 1).
(3) The Agua Negra stream itself has, like the SanLorenzo, a mixed water supply. Each signal wassampled separately to characterize the mixing process.Representative samples for this stream are M6, M7,M8, M9 and M1 (Figure 1). Five main solute sourceswere identified for this stream:
Widespread snow penitentes (2 to 3 m high) thatdevelop seasonally due to intense snow-melting andsublimation. Meltwater usually enters the fractured rocksunderneath, whereas the largest snow patches develop asmall water stream at their base. A representative sampleis M5-snow (Figure 1).
The Agua Negra Glacier: this is a glacier withoutdebris cover (i.e. ice-glacier) located at the uppermostreaches of the Agua Negra drainage basin (M5-ice,Figure 1). The water usually does not reach the mainstream as it seeps through the frontal moraines; a pro-glacial pond collects glacier meltwater and dries upcompletely during winter (M6, Figure 1). This glacierproduces only supraglacial meltwater since it has beenrecognized—owing to its placement far above the 0 °Cannual isotherm—as a cold-based glacier (Milana andMaturano, 1999).
The Agua Negra rock-glacier: as indicated above, thisrock-glacier is formed directly downstream from thepro-glacial pond and therefore is fed mainly by glaciermeltwater. A representative sample is M7 (Figure 1).
The El Paso rock-glacier: this rock-glacier occupies theupper part of a small valley. It probably delivers the mostrepresentative chemical signal of rock-glacier meltwaterbecause there are few seasonal snow patches, and waterdrains directly at the foot of the rock-glacier terminaltalus. A representative sample is M4 (Figure 1).
The Dos Lenguas rock-glacier: this is the largest rock-glacier in the area. It causes partial blocking of the AguaNegra main stream and, hence, it was not possible tosample its meltwater discharge as it reaches the streamdirectly by subsurface intergranular flow. The samplingstrategy for this important rock-glacier was to obtain asample of the main stream a few metres upstream (M8)and downstream (M9) the intersection of the frontal taluswith the stream (Figure 1).
SAMPLING AND ANALYTICAL METHODOLOGY
During two field campaigns, surface water, ice, and snowsamples were collected to examine the differences in thechemistry of ice- and rock-glacier (permafrost) meltwa-ter. The first sampling was performed in March 2003, atthe beginning of the southern fall, when ice/snow-meltingwas somewhat suppressed and there was an impreciseconnection between meltwater discharge and total solute
Copyright 2007 John Wiley & Sons, Ltd. Hydrol. Process. 22, 2180–2195 (2008)DOI: 10.1002/hyp

HYDROCHEMISTRY OF AGUA NEGRA DRAINAGE BASIN 2183
production (i.e. electrical conductivity). At the time, theice-glacier meltwater contribution was probably decreas-ing. The second sampling took place in February 2004,during summer, and a clear relationship existed betweensolute/sediment production and meltwater discharge, thusindicating that ice-glacier melting processes were fullyoperational at the time. Discharge was estimated fromthe total suspended solids (TSS)–discharge relationshipcalculated by Barsch et al. (1994).
Sampling points were selected at the outfall of glaciers,wherever possible, and at the main Agua Negra stream(Figure 1). Samples are identified as 1Mx or 2Mx, iftaken during the first or second sampling, respectively; xis the sampling site. A series of samples was collectedover several hours at the lower drainage basin to analysethe daily evolution in total dissolved solids (TDS) andwater chemistry.
Water temperature, pH, electrical conductivity, andalkalinity were measured in situ. Alkalinity was measuredas CaCO3 with a 0Ð1600 N H2SO4 titration in unfilteredwater, until the end point. In this case, filtration was notperformed because it could modify the dissolved gasesconcentration in the sample (Eaton et al., 1995).
For subsequent determinations, samples were vacuum-filtered in the field with 0Ð22 µm pore size cellulose filters(HA-type, Millipore Corp, Bedford, MA 01730, USA)and divided into two aliquots. One aliquot was acidified(pH ³ 2) with concentrated and redistilled (½99Ð999%)HNO3 (Aldrich Chemical Co., Milwaukee, WI 53201,USA) for the analytical determination of major cations,minor, and trace elements by ICP-MS (Activation Lab-oratories Ltd., Ancaster, Ontario, Canada). The otheraliquot was stored in polyethylene bottles at 4 °C fordeterminations of anions by chemically suppressed ionchromatography with conductivity detection. The valid-ity of the results for major, minor, and trace elementswas carried out along with sample analysis, checkingwith NIST-1640 (Riverine Water Reference Materials forTrace Metals certified by the National Research Coun-cil of Canada) and SRLS-4 along with method blanks(Table II). Duplicate analyses for one sample (1M4) areshown in Tables II and III.
Chemical data were processed with AQUACHEM soft-ware (Waterloo Hydrogeologic, Inc., Waterloo, Ontario,Canada N2L 3L3). PHREEQC (Parkhurst, 1995) inputfiles were constructed using the AQUACHEM PHREEQCinterface. These programs were used to calculate chargebalance, TDS, and to simulate dissolution–precipitation of minerals by means of an inverse mod-elling approach. For this purpose, it is necessary to knowthe physical and chemical characteristics of an initialand a final solution, and also the reacting gas phasesand the minerals susceptible to weathering. The modelquantifies the processes of dissolution and/or precipita-tion that lead to the final solution chemistry. Applicationsusing PHREEQC in the analysis of geochemical data arecommon in the literature: Uliana and Sharp (2001) usedinverse modelling to study groundwater evolution; Eary
et al. (2003) assessed water quality changes in connec-tion with mining operations; and Lecomte et al. (2005)modelled geochemical dissolution-precipitation processesin semi-arid mountain rivers.
RESULTS AND DISCUSSION
Stream chemistry: major components
In glaciers, daily discharge variability is determinedby the energy received by the ice surface, which dependsmainly on the intensity of solar radiation, and by the sen-sible heat flux. Discharge maxima lag radiation maxima,depending on the season and gauge location. Summerobservations (November 1990 to April 1991) at the AguaNegra glacier showed a discharge mean ³0Ð35 m3 s�1
with peak discharges of ¾1Ð4 m3 s�1 at Ojos de Agua(M1) (Schrott, 2002). Downstream from this point, dis-charge decreases due to infiltration and evaporation. Dur-ing the same period, the suspended sediment transportrate was ¾0Ð057 T h�1 (¾4Ð4 g m�2 h�1) (Barsch et al.,1994). The summertime meltwater discharge at DosLenguas, which is the largest rock-glacier in the basin,fluctuates between 0Ð005 and 0Ð008 m3 s�1 (Schrott,2002).
Table I shows the main environmental types andphysicochemical characteristics, the concentration of dis-solved major components, and the charge balances deter-mined in the collected samples. Water samples areslightly acid to alkaline. Samples belonging to the March2003 campaign (first sampling) had a pH variation from¾6Ð4 (ice and snow) to ¾8Ð2 (at Ojos de Agua, 1M1). It isevident that pH increases downstream. During the secondsampling (February 2004), pH was more constant thanduring the first sampling, from ¾7Ð1 (El Paso rock-glaciermeltwater, 2M4) to ¾7Ð8 (Ojos de Agua, 2M1). Alkalin-ity, as HCO3
�, fluctuated in the upper reaches between3Ð6 mg L�1 (snow and glacial meltwater) and 36Ð6 mgL�1 at 1M7, in samples collected during the first fieldtrip. At Ojos de Agua (1M1), alkalinity varied between58Ð5 mg L�1 and 81Ð2 mg L�1 in the first sampling,and between 50Ð4 mg L�1, and 56Ð2 mg L�1 in watersamples collected in February 2004 (2M1). This pro-nounced variation between the upper and lower reacheswas also observed in water conductivity: 13 µS cm�1
(snow), 28Ð5 µS cm�1 (ice), 405 µS cm�1 during the firstsampling (1M1), and 479 µS cm�1 during the secondone (2M1). Recent investigations (Ginot et al., 2001 andreferences therein) have stressed the role played in thetropics and subtropics by high radiation, temperature andwindiness, and low relative humidity and snow accumu-lation rates, all factors that suggest that glaciochemicalrecords might be significantly affected by sublimation anddry deposition.
Figure 2a shows the daily summertime discharge varia-tion (modified from Barsch et al., 1994) measured duringthree days at Cuatro Mil (4000 m a.s.l.) and Kolibri(3150 m a.s.l.) gauge stations, which are upstream anddownstream, respectively, of Ojos de Agua (3350 m
Copyright 2007 John Wiley & Sons, Ltd. Hydrol. Process. 22, 2180–2195 (2008)DOI: 10.1002/hyp

2184 K. L. LECOMTE ET AL.
Tabl
eI.
Env
iron
men
t-ty
pes,
phys
icoc
hem
ical
char
acte
rist
ics,
conc
entr
atio
nof
diss
olve
dm
ajor
com
pone
nts,
and
char
geba
lanc
esde
term
ined
inth
eco
llec
ted
sam
ples
,at
Agu
aN
egra
drai
nage
basi
n
Sam
ple
Env
iron
men
tTy
pepH
Con
duct
ivit
y(µ
Scm
�1)
Tem
pera
ture
(°C
)C
a2CN
aCK
CM
g2CC
l�
(mg
L�1
)SO
42�
NO
3�
HC
O3
�H
4Si
O4
Cha
rge
bala
nce
(%)
1°Sa
mpl
ing
cam
paig
n1M
1-12
:00
mix
ed7Ð7
640
5Ð07Ð3
51Ð00
5Ð44
0Ð79
8Ð71
n.d.
n.d.
n.d.
61Ð37
17Ð84
—1M
1-13
:10
mix
ed8Ð2
536
8Ð08Ð2
52Ð40
5Ð57
0Ð85
8Ð76
1Ð75
105Ð5
03Ð3
981
Ð2518
Ð42�0
Ð301M
1-15
:00
mix
ed8Ð0
539
1Ð08Ð9
50Ð20
5Ð32
0Ð78
8Ð50
1Ð99
108Ð3
26Ð4
968
Ð5917
Ð44�1
Ð201M
1-17
:00
mix
ed8Ð0
638
6Ð07Ð7
50Ð60
5Ð55
0Ð86
8Ð49
2Ð76
110Ð6
95Ð4
866
Ð0317
Ð27�0
Ð901M
1-19
:00
mix
ed8Ð2
139
0Ð06Ð2
50Ð80
5Ð76
0Ð87
8Ð51
2Ð84
117Ð4
37Ð6
658
Ð6017
Ð88�1
Ð401M
1-20
:30
mix
ed7Ð9
337
1Ð0n.
d.49
Ð805Ð3
70Ð7
88Ð3
52Ð5
311
4Ð09
5Ð06
58Ð49
17Ð16
�0Ð90
1M2-
12:0
0ic
e-gl
acie
r7Ð9
814
9Ð9n.
d.17
Ð402Ð8
70Ð4
33Ð1
51Ð0
512
Ð433Ð3
158
Ð8012
Ð63�1
Ð601M
2-17
:00
ice-
glac
ier
8Ð12
149Ð0
n.d.
16Ð10
2Ð79
0Ð45
3Ð00
0Ð37
3Ð93
<0Ð6
265
Ð8512
Ð460Ð5
01M
3m
ixed
8Ð09
270Ð0
n.d.
34Ð20
3Ð90
0Ð51
8Ð24
2Ð00
91Ð15
<0Ð6
236
Ð6013
Ð440Ð3
01M
4ro
ck-g
laci
er7Ð7
011
4Ð70Ð8
13Ð90
1Ð97
0Ð33
1Ð41
0Ð49
16Ð91
<0Ð6
232
Ð187Ð6
90Ð6
01M
5-
snow
snow
6Ð45
13Ð0
n.d.
<0Ð7
00Ð8
80Ð6
20Ð0
50Ð6
7<
0Ð49
<0Ð6
23Ð6
0<
0Ð68
9Ð40
1M5
-ic
eic
e6Ð6
728
Ð5n.
d.1Ð4
50Ð5
30Ð4
20Ð0
50Ð7
0<
0Ð49
<0Ð6
24Ð9
0<
0Ð68
5Ð10
1M6
ice-
glac
ier
6Ð38
22Ð4
n.d.
1Ð08
0Ð14
0Ð03
0Ð08
0Ð28
<0Ð4
9<
0Ð62
3Ð58
<0Ð6
80Ð6
01M
7m
ixed
7Ð68
95Ð4
n.d.
12Ð40
1Ð83
0Ð25
1Ð50
0Ð91
9Ð45
5Ð62
36Ð56
6Ð16
�4Ð80
1M8
mix
ed7Ð9
131
1Ð0n.
d.40
Ð902Ð9
10Ð5
48Ð3
41Ð9
910
7Ð15
3Ð24
34Ð56
10Ð43
�0Ð70
1M9
mix
ed7Ð6
939
0Ð0n.
d.50
Ð803Ð4
20Ð5
810
Ð201Ð3
813
0Ð08
2Ð00
47Ð41
11Ð88
�0Ð20
2°Sa
mpl
ing
cam
paig
n2M
1-17
hsm
ixed
7Ð84
479Ð0
n.d.
60Ð76
6Ð82
1Ð25
13Ð90
2Ð89
166Ð6
56Ð2
456
Ð2414
Ð59�0
Ð802M
1-18
:50
hsm
ixed
7Ð65
412Ð0
n.d.
48Ð57
6Ð25
1Ð14
10Ð90
2Ð42
125Ð2
76Ð4
855
Ð8813
Ð41�1
Ð002M
1-21
hsm
ixed
7Ð82
351Ð0
n.d.
44Ð86
5Ð57
1Ð00
9Ð89
2Ð14
113Ð9
36Ð1
552
Ð5813
Ð03�1
Ð102M
1-23
hsm
ixed
7Ð65
307Ð0
n.d.
45Ð73
4Ð85
1Ð10
8Ð47
1Ð82
11Ð07
6Ð14
50Ð39
12Ð29
�1Ð10
2M2
ice-
glac
ier
7Ð55
118Ð0
n.d.
19Ð10
2Ð73
0Ð56
2Ð98
1Ð36
12Ð20
2Ð95
63Ð25
11Ð14
�1Ð20
2M4
rock
-gla
cier
7Ð13
113Ð0
1Ð817
Ð702Ð1
30Ð4
01Ð6
71Ð1
831
Ð272Ð7
926
Ð177Ð2
8�1
Ð502M
8m
ixed
7Ð39
246Ð0
12Ð8
34Ð16
2Ð52
0Ð50
7Ð01
1Ð63
78Ð33
2Ð24
43Ð55
8Ð45
�0Ð50
2M9
mix
ed7Ð4
928
9Ð013
Ð835
Ð112Ð9
30Ð5
68Ð7
01Ð5
484
Ð612Ð3
448
Ð199Ð1
7�0
Ð40B
lank
0Ð700
0Ð005
0Ð030
0Ð002
0Ð300
0Ð490
0Ð620
—0Ð6
80—
Copyright 2007 John Wiley & Sons, Ltd. Hydrol. Process. 22, 2180–2195 (2008)DOI: 10.1002/hyp

HYDROCHEMISTRY OF AGUA NEGRA DRAINAGE BASIN 2185
Dis
char
ge (
l/s)
600
400
200
06 12 18 24 6 12 18 24 6 12 18 24
Kolibri
Cuatro Mil
6
Time (hs)
25- 1- 91 26- 1- 91 27- 1- 91 28- 1- 91
1817 19 20 21 22 23
Tem
perature (°C)
Conductivity (µS cm-1)
Temperature (°C)
200
250
300
350
400
450
0
2
4
6
8
10
12
14
16
18
20
500
22
24
250
300
350
400
450
468
1012141618
Conductivity (µS cm-1)
Tem
pera
ture
°C
February 2004March 2003
Q=~650 l/sTSS=~170 mg/l
Q=~780 l/sTSS=~450 mg/l
Q=~870 l/sTSS=~930 mg/l
Q =~950 l/sTSS =~1600 mg/l
Time (hs)
Con
duct
ivity
(µS
cm
-1)
(a)
(b)
Figure 2. (a) Daily discharge variability at Cuatro Mil (4000 m a.s.l.) and Kolibri (3150 m a.s.l.) gauging stations. Modified from Barsch et al.(1994); (b) time-dependent evolution of water temperature and electrical conductivity at 2M1; measured TSS and estimated discharge are included.
Insert shows the scatter plot of conductivity and temperature at M1 (both samplings)
a.s.l.). The meltwater flow started increasing at mid-afternoon, reaching a maximum discharge at about mid-night.
A similar situation was observed during the secondsampling (Figure 2b): the discharge increase was accom-panied by a significant decrease in water temperature andelectrical conductivity. The temperature decline rate issteeper after 19 : 00, whereas water conductivity showsa variation that is probably connected with changes insolute sources. In contrast, TSS concentration increasedtenfold in response to a ¾50% discharge increase. Dis-charge is controlled by the ice melting rate and, therefore,conductivity and water temperature are discharge prox-ies. Hence, both variables show a significant non linearrelationship for the second sampling (Figure 2b, insert).The erratic association between conductivity and temper-ature during the first sampling reveals the absence of aclear discharge control (Figure 2b, insert).
It is interesting to analyze the system’s contrastinghydrological dynamics during the samplings (Table I)performed at Ojos de Agua (M1). During the first one(March 2003), there was no time-dependant trend in theconcentration of the more soluble components (e.g., NaC,
Ca2C, Mg2C, HCO3�, Cl�), whereas it became linearly
decreasing during the second sampling (February 2004).Likewise, silicon (as H4SiO4 in Table I) shows a signifi-cant variation in concentration without any trend duringthe ¾8 h sampling series performed during the first sam-pling but, in contrast, there is a significant correlationwith conductivity during the second sampling. Similarly,NO3
� also shows a decreasing concentration trend duringthe second sampling series, which is probably associatedwith an increased net biological uptake occurring duringsummer.
Stiff diagrams were used in Figure 1 to show the meanchemical composition at each sampling spot. It is appar-ent that there is a separation between SO4
2�-dominatedsamples and HCO3
�-dominated samples. Samples corre-sponding to the first group (SO4
2�-dominated) are 1M1,2M1, 1M8, 2M8, 1M9, 2M9, 1M3, and 2M4. All thesamples collected at the outfall of ice-glaciers belongto the HCO3
�-dominated water-type (1M2, 2M2, 1M5-ice, 1M5-snow, and 1M6); 1M7, has mixed sources, butbelongs to the HCO3
�-dominated water-type because theAgua Negra rock-glacier supplies less meltwater than theAgua Negra ice-glacier.
Copyright 2007 John Wiley & Sons, Ltd. Hydrol. Process. 22, 2180–2195 (2008)DOI: 10.1002/hyp

2186 K. L. LECOMTE ET AL.
80 20 20 80
20
80 80
20
20
80
20
80
Ca+2 Na+ + K+
Na + + K +
Cl-
SO42-
50
50
50
50
5050
M5-iceM5-snow
Upstream
Downstream
Ice-glacier meltwaterRock-glacier meltwaterMixed meltwater
Upstream
Downstream
HCO3- + CO3
2-
HC
O 3- +
CO 3
2-
Ca +2 + M
g +2SO
42-
+ C
l-
Mg+2
Figure 3. Piper diagram of Agua Negra basin water samples, showing the downstream chemical evolution (arrows). Environment-types are includedfor reference
Figure 3 shows a Piper diagram (Piper, 1944) that indi-cates that Agua Negra drainage basin waters were domi-nated by Ca2C and HCO3
�- in the uppermost, ice-glacier-fed streams. Downstream, SO4
2� became the dominantanion. In contrast, snow is of the NaC —KC —HCO3
�-type. Clearly, as the stream order and the influenceof rock-glaciers increases, water samples switch to theCa2C —SO4
2�-type. Agua Negra glacial runoff is a diluteCa2C —HCO3
� —SO42� solution, as is the case in most
glaciers throughout the world. The sum of cation equiva-lents ranges from ¾90 to ¾4500 µeq L�1, slightly higherthan the world range (from ¾10 to ¾3500 µeq L�1),with ionic values higher than other glacial runoff fromdifferent regions of the world. Moreover, with the excep-tion of Cl� and HCO3
�, which have lower values inAgua Negra, the concentrations of the remaining ions aresignificantly higher than the mean global glacial runoff(Tranter, 2005).
Figure 4 shows a scatterplot of the ratio Ca2C: Si ver-sus the ratio HCO3
�: SO42�. As has been observed in
other glaciers, Agua Negra meltwater has high Ca2C: Siratios and low HCO3
�: SO42� ratios in SO4
2�-dominatedwaters. In contrast, HCO3
�-dominated waters show alarger variation (higher HCO3
�: SO42� ratios) but also
are clearly separated from other non-glacierized, semi-arid mountainous streams (Lecomte, 2006). Because ofits fine-grain-size distribution and, hence, its increasedspecific surface area, glacial flour accelerates the hydroly-sis of carbonate and silicate species when in contact withice meltwater. In contrast, sulphide oxidation seems tobe a very important reaction in subglacial environments.Considering that ice-glaciers in the region are cold-based(Milana and Maturano, 1999), subglacial environmentsmostly occur in rock-glaciers, where there is a layer ofwet debris (Croce and Milana, 2002a). Thus, sulphide
oxidation becomes dominant in rock-glaciers (a debris-rich environment), where microbially-mediated reactionsinvolving sulphide oxidation take place when water isin contact with sulphide minerals in the comminutedbedrock:
4FeS2�s� C 16CaCO3�s� C 15O2�aq�
C 14H2O�aq� ) 16Ca2C�aq�
C 16HCO3��aq� C 4Fe�OH�3�s� C 8SO4
2��aq�
In this reaction, four moles of pyrite produce eightof sulphate. The protons resulting from the oxidationof pyrite drive further the dissolution of calcite, butthe net effect of the coupled reaction is to increasealkalinity. Moreover, in an oxygen-poor environment,
0
5
10
15
20
25
1 3 5 7 9 11 13 15
R2 = 0.88 (p < 0.05)
Ca+
2 : S
i
HCO3--dominated
Non-glacierized
SO42- -dominated
HCO3- : SO4
2-
Figure 4. Scatter plot of Ca2C : Si ratio versus HCO3� : SO4
2� ratiofor ice- and rock-glacier meltwater and for non-glacierized catchments
(Lecomte, 2006)
Copyright 2007 John Wiley & Sons, Ltd. Hydrol. Process. 22, 2180–2195 (2008)DOI: 10.1002/hyp

HYDROCHEMISTRY OF AGUA NEGRA DRAINAGE BASIN 2187
such as permafrost, the oxygen supply is limited to thatreleased from bubbles in the ice during regelation (i.e. theprocess of ice melting and refreezing as it flows aroundbedrock obstacles). It has been argued that under anoxicconditions, Fe (III), rather than O2, acts as an oxidizingagent (Tranter, 2005).
Figure 5a, b and c shows the theoretical stoichiometricrelationships between the ions of minerals such asanhydrite, calcite and halite. The significant correlationbetween Ca2C and SO4
2� (Figure 5a) and the coherenceof the resulting regression line with the theoreticalanhydrite dissolution indicates that gypsum is a majorsource for Ca2C. If we subtract the Ca2C accounted forby the dissolution of gypsum (or anhydrite) in HCO3
�-dominated samples, we still obtain some remnant Ca2C
that plots close to the theoretical dissolution line ofcalcite (Figure 5b). The relationship suggests, however,that there is still a third source for Ca2C (i.e. theincongruent dissolution of plagioclase) accounting forthe remainder. Likewise, Cl� is mainly contributedby meteoric precipitation, and NaC (Figure 5c) reachesconcentrations four times higher than the theoretical1 : 1 ratio. It follows then that there are other sourcesbesides halite from aerosols that supply dissolved NaC
to meltwater. All Cl� in meltwater is considered derivedfrom marine aerosols.
Figure 5d shows the molar relationship (corrected foratmospheric input) between Ca2C: NaC, andHCO3
� : NaC Ð NaC is used for normalization to mini-mize the effect of dilution and evaporation (Picouet et al.,2002). The graph discriminates SO4
2�-dominated sam-ples from HCO3
�-dominated ones that plot along theplagioclase theoretical dissolution lines.
The marine solute contribution—via the atmosphericpath—to meltwater and, hence, to stream chemistry wascalculated by means of Xa D Clriv �X/Cl�a, where Xa
is the atmospheric contribution of X in streamwater;Clriv is the Cl� concentration in the water, and �X/Cl�a
the element ratio normalized to Cl� in the atmosphere(seawater ratio) (Picouet et al., 2002). Therefore, theatmospheric contribution is insignificant for Ca2C, SO4
2�
and Mg2C (less than 5%, except in ice, snow and in verydiluted samples), is low for KC (variable, depending onthe sampling site) and it is significant for NaC, with anatmospheric contribution of approximately 30% in eachsample.
Minor and trace elements in meltwaters
Major ion concentrations in meltwaters have beenreported extensively in the specialized literature. The con-centrations of dissolved minor and trace elements, how-ever, have received limited attention in glacier-dominateddrainages (Mitchell et al., 2002). Table II shows the con-centration of dissolved minor and trace elements, exclud-ing the REE. The extended multielemental diagrams (orspidergrams) in Figure 6 show the concentration vari-ability in glacier meltwater and associated streams, afternormalization. Figure 6a was normalized to an ice and
0.1
1
10
100
0.1 1 10 100
Andesine
Ca2+ : Na+
Labradorite
Bytownite
HCO3--dominated samples
SO42--dominated samples
Ice and snow
HC
O3-
: Na+
0
20
40
60
80
100
0 50 100 150 200 250 300 350 400
1/4 theoretical halite dissolution
Na+ (µeq L-1)
Lower Agua Negra stream
y = 0.21x + 15.71R2 = 0.63 (p < 0.05)
Cl- (
µeq
L-1)
R2 = 0.87 (p < 0.05)
500
1000
1500
2000
2500
3000
3500
500 1000 1500 2000 2500 3000
Ca2+ (µeq L-1)
Theoretical anhydrite dissolution
SO42- -dominated samples
y = 1.05 x - 173SO
42- (
µeq
L-1)
Ca*2+ (µeq L-1)
0
200
400
600
800
1000
1200
0 200 400 600 800 1000
Theoretical calcite dissolutionHCO3
- -dominated samples
y = 1.52x - 15.48
R2 = 0.99 (p < 0.05)
HC
O3-
(µeq
L-1
)
(a)
(b)
(c)
(d)
Figure 5. Theoretical stoichiometric relationships (filled lines) betweenthe ions of (a) anhydrite; (b) calcite, CaŁ2C means Ca2C concentrationminus SO4
2� concentration; (c) halite, broken lines correspond to theobserved equivalent relationships; (d) molar ratio relationship (correctedfor atmospheric input) between Ca2C : NaC ratio, and HCO3
� : NaCratio. The lines correspond to the theoretical dissolution of plagioclase
(andesine, bytownite, and labradorite)
snow mean (samples M5-ice, and M5-snow), whereasFigure 6b was normalized to the upper continental crust(UCC) (Taylor and McLennan, 1985) in order to facilitatethe comparison with non-glacierized environments.
Copyright 2007 John Wiley & Sons, Ltd. Hydrol. Process. 22, 2180–2195 (2008)DOI: 10.1002/hyp

2188 K. L. LECOMTE ET AL.
1.10-2
1.10-1
1
1.101
1.102
1.103
Sam
ple /
(ice-
snow
)
Si Al Fe Ti Mn Ba Sr Zr Rb Zn V Cr Cu Y Li Ni Pb Ga Sc Th Co Hf Cs U As Mo Sb
Si Al Fe Ti Mn Ba Sr Zr Rb Zn V Cr Cu Y Li Ni Pb Ga Sc Th Co Hf Cs U As Mo Sb
Mean ice-snow below limit detection
Glaciers meltwater samples
Agua Negra stream samples
Non-glacierized stream samples
1.10-7
1.10-6
1.10-5
1.10-4
1.10-3
1.10-2
1.10-8
Sam
ple /
UC
C
(b)
(a)
Figure 6. (a) Ice-snow-normalized extended variability diagram (spidergram) for minor and trace elements in glacier meltwater; and (b) uppercontinental crust (UCC)-normalized samples of Agua Negra main stream and non-glacierized stream samples (Lecomte, 2006)
An inspection of the snow and ice-normalized spider-gram (Figure 6a) shows those elements that were moreconcentrated in meltwater samples than in ice and snow(e.g. Ba, Sr, V, Y, Li, Ga, U, Cs, As, Mo). Some ofthem are very soluble whereas others probably exhibita higher normalized concentration as a result of drydeposition. It also shows some elements that have ahigher concentration in ice or snow than in meltwater(ppmsample : ppmice�snow < 10�1), probably because theyare affected by sublimation. Furthermore, it is likely thatsuch elements are also partially removed from solution byadsorption when dilute meltwater contacted fine-grainedglacial flour. Notably, such elements are Mn, Zr, Zn, Cu,and Co, which are transition metals, with the exceptionof Zr.
Figure 6b shows the UCC-normalized extended vari-ability diagram for stream water samples collected alongthe system’s main stem, the Agua Negra stream. Fol-lowing the solubility of minerals, and also their abun-dance in the rock outcrops, the trace elements that inFigure 6b present the highest normalized concentrations(i.e. ppmsample : ppmUCC > 10�4) are Cr, Cu, Sr, Zn, Li,Cs, U, As, Mo, and Sb. A few of these elements (Sr, Cs)are soluble large cations, known as “large ion litophile” orLIL elements (ionic potential <40 nm�1), whereas oth-ers are transition metals and high-field strength (HFS)elements.
Those that exhibit ppmsample : ppmUCC < 10�6 at theAgua Negra stream are Al, Fe, Ti, Zr, Y, Ga, Th, and Hf.Most of these elements are very insoluble, and correspondto the HFS group, which are small, highly charged cations(ionic potential ½40 nm�1). All the remaining elementsfall within the 10�6 –10�4 concentration range. Figure 6bhas, added for comparison, the UCC-normalized extendeddiagram obtained for dissolved trace elements deter-mined in non-glacierized, semiarid, mountainous streams(catchment heights >1500 m a.s.l.), draining granites andgneisses in the Sierras Pampeanas of Cordoba (Argentina)(Pasquini et al., 2004; Lecomte, 2006). Besides someminor departures, the similarity among patterns sug-gests that concentrations in these mountainous environ-ments are governed by mineral solubility, with a proba-ble second-order control imposed by sorption processes(Gaillardet et al., 2005). Here again, the elements thatare more concentrated in snow and ice than in streamwater are from the transitional group, presenting a highaffinity for colloid particles. In the acid pH range, theseelements are more concentrated in solution, which is thecase for ice and snow (pH ³6Ð5), and as pH increases,these metals are adsorbed onto adsorbing surfaces (e.g.colloids, organic matter, clays) decreasing their con-centration in solution. Interestingly, these spidergramsappear to convey what would be the typical dissolved
Copyright 2007 John Wiley & Sons, Ltd. Hydrol. Process. 22, 2180–2195 (2008)DOI: 10.1002/hyp

HYDROCHEMISTRY OF AGUA NEGRA DRAINAGE BASIN 2189
Tabl
eII
.D
isso
lved
min
oran
dtr
ace
elem
ent
conc
entr
atio
ns(p
pb)
atth
eA
gua
Neg
radr
aina
geba
sin
Sam
ple
Al
FeT
iM
nB
aSr
Zr
Rb
Zn
VC
rC
uY
Li
Ni
PbG
aSc
Th
Co
Hf
Cs
UA
sM
oSb
Ge
1M1a
53Ð1
192Ð4
2Ð12Ð5
24Ð3
121Ð0
0Ð03
0Ð97
2Ð50
0Ð49
9Ð20
2Ð71
0Ð062
24Ð31
0Ð470
0Ð814
0Ð028
1Ð84
0Ð004
0Ð074
0Ð001
0Ð028
3Ð033
2Ð512
1Ð680
0Ð075
0Ð019
1M2b
39Ð3
58Ð7
1Ð61Ð4
20Ð2
64Ð8
0Ð02
0Ð82
2Ð71
0Ð37
<0Ð5
0Ð36
0Ð092
9Ð29
<0Ð3
0Ð398
0Ð027
1Ð28
0Ð002
<0Ð0
050Ð0
020Ð0
482Ð4
562Ð1
770Ð5
430Ð0
200Ð0
151M
325
Ð124
3Ð11Ð6
1Ð918
Ð776
Ð00Ð0
21Ð4
012
Ð690Ð9
9<
0Ð51Ð2
90Ð2
0414
Ð750Ð6
750Ð6
010Ð0
241Ð3
50Ð0
020Ð1
04<
0Ð001
0Ð702
1Ð331
2Ð924
0Ð662
0Ð052
0Ð021
1M4
31Ð7
57Ð3
1Ð11Ð0
5Ð040
Ð80Ð0
10Ð5
90Ð7
50Ð3
5<
0Ð50Ð5
60Ð0
614Ð3
8<
0Ð30Ð2
820Ð0
28<
1<
0Ð001
<0Ð0
05<
0Ð001
0Ð043
1Ð365
0Ð851
0Ð259
0Ð025
0Ð010
1M4
(2)
33Ð7
62Ð1
1Ð21Ð2
5Ð141
Ð30Ð0
10Ð6
12Ð2
10Ð3
8<
0Ð50Ð5
30Ð0
674Ð4
8<
0Ð30Ð3
540Ð0
26<
10Ð0
01<
0Ð005
<0Ð0
010Ð0
441Ð3
820Ð8
530Ð2
790Ð0
31<
0Ð01
1M5 s
now
28Ð2
16Ð6
1Ð26Ð0
1Ð31Ð3
0Ð05
0Ð57
12Ð78
<0Ð1
0<
0Ð54Ð7
00Ð0
35<
1<
0Ð30Ð4
26<
0Ð01
<1
0Ð002
0Ð076
0Ð002
0Ð009
0Ð008
0Ð099
<0Ð1
0Ð062
<0Ð0
11M
5 ice
30Ð2
16Ð3
1Ð219
Ð85Ð9
2Ð60Ð0
50Ð4
68Ð1
80Ð1
1<
0Ð53Ð7
70Ð0
26<
1<
0Ð30Ð2
090Ð0
11<
10Ð0
030Ð4
680Ð0
010Ð0
200Ð0
250Ð3
81<
0Ð10Ð0
65<
0Ð01
1M6
10Ð8
<10
0Ð83Ð0
1Ð53Ð2
<0Ð0
10Ð0
62Ð4
4<
0Ð10
<0Ð5
0Ð67
0Ð016
<1
<0Ð3
0Ð133
<0Ð0
1<
10Ð0
020Ð0
08<
0Ð001
<0Ð0
010Ð0
770Ð4
52<
0Ð10Ð0
23<
0Ð01
1M7
25Ð1
42Ð6
1Ð20Ð5
9Ð640
Ð80Ð0
10Ð3
5<
0Ð50Ð6
3<
0Ð50Ð3
20Ð0
484Ð7
2<
0Ð30Ð1
580Ð0
25<
1<
0Ð001
<0Ð0
050Ð0
010Ð0
221Ð7
891Ð9
611Ð2
160Ð0
58<
0Ð01
1M8
30Ð1
129Ð6
1Ð41Ð2
21Ð4
96Ð9
0Ð01
0Ð69
21Ð03
0Ð21
<0Ð5
0Ð88
0Ð053
13Ð36
<0Ð3
0Ð522
0Ð016
1Ð00
0Ð002
<0Ð0
05<
0Ð001
0Ð027
2Ð132
1Ð238
1Ð228
0Ð172
<0Ð0
11M
953
Ð125
9Ð51Ð4
10Ð2
22Ð1
110Ð8
0Ð01
1Ð08
4Ð55
<0Ð1
0<
0Ð50Ð5
10Ð0
7419
Ð120Ð5
221Ð1
960Ð0
121Ð1
00Ð0
010Ð8
06<
0Ð001
0Ð091
1Ð988
0Ð436
1Ð330
0Ð071
0Ð013
2M1c
28Ð0
33Ð7
1Ð11Ð2
21Ð6
114Ð9
<0Ð0
11Ð5
90Ð8
80Ð1
6<
0Ð50Ð5
40Ð0
4321
Ð630Ð6
040Ð0
630Ð0
261Ð1
00Ð0
02<
0Ð005
<0Ð0
010Ð1
212Ð3
591Ð6
111Ð6
050Ð0
780Ð0
112M
218
Ð8<
100Ð8
1Ð214
Ð048
Ð1<
0Ð01
0Ð92
0Ð80
0Ð30
<0Ð5
0Ð31
0Ð054
7Ð72
<0Ð3
0Ð071
0Ð032
<1
<0Ð0
01<
0Ð005
<0Ð0
010Ð0
622Ð2
702Ð1
670Ð4
080Ð0
22<
0Ð01
2M4
13Ð0
14Ð7
0Ð80Ð7
3Ð737
Ð9<
0Ð01
0Ð61
1Ð39
0Ð19
<0Ð5
0Ð38
0Ð031
4Ð31
<0Ð3
0Ð249
0Ð024
<1
<0Ð0
01<
0Ð005
<0Ð0
010Ð0
281Ð5
020Ð7
260Ð2
230Ð0
20<
0Ð01
2M8
52Ð8
18Ð8
0Ð527
Ð212
Ð969
Ð0<
0Ð01
0Ð68
0Ð83
<0Ð1
0<
0Ð50Ð2
60Ð0
409Ð4
10Ð4
830Ð0
850Ð0
15<
1<
0Ð001
0Ð157
<0Ð0
010Ð0
501Ð9
910Ð9
210Ð7
500Ð0
64<
0Ð01
2M9
57Ð1
32Ð8
0Ð617
Ð813
Ð377
Ð0<
0Ð01
0Ð84
1Ð24
<0Ð1
0<
0Ð50Ð2
10Ð0
4112
Ð65<
0Ð30Ð0
410Ð0
11<
1<
0Ð001
0Ð083
<0Ð0
010Ð0
672Ð3
090Ð9
270Ð8
440Ð0
68<
0Ð01
Bla
nk2
100Ð1
0Ð10Ð1
0Ð04
0Ð01
0Ð005
0Ð50Ð1
00Ð5
0Ð20Ð0
031
0Ð30Ð0
10Ð0
11
0Ð001
0Ð005
0Ð001
0Ð001
0Ð002
0Ð03
0Ð10Ð0
10Ð0
1
SLR
S-4
4592
1Ð53Ð2
11Ð4
28Ð8
0Ð08
1Ð59
0Ð90Ð3
1�0
Ð51Ð8
0Ð124
�10Ð7
0Ð1�0
Ð01�1
0Ð009
0Ð030
0Ð003
0Ð005
0Ð038
0Ð74
0Ð21
0Ð24
�0Ð01
NIS
T16
4049
471Ð0
110
160
130
0Ð17
2Ð10
48Ð3
12Ð3
39Ð4
84Ð0
0Ð248
5626
Ð237
Ð70Ð0
12
0Ð012
20Ð4
0Ð004
0Ð111
0Ð545
27Ð1
55Ð9
12Ð8
0Ð10
Exp
ecte
dVa
lues
SLR
S-4
5410
3—
3Ð412
26Ð3
——
0Ð90Ð3
0Ð31Ð8
——
0Ð67
0Ð09
——
—0Ð0
3—
—0Ð0
50Ð6
80Ð2
0Ð23
—
NIS
T16
4052
34—
122
148
124
—2
5312
Ð939
85—
50Ð7
27Ð4
27Ð9
——
—20
Ð3—
——
26Ð7
4713
Ð8—
am
ean
valu
e(n
D6)
;Łb
mea
nva
lue
(nD
2);
Łcm
ean
valu
e(n
D4)
Copyright 2007 John Wiley & Sons, Ltd. Hydrol. Process. 22, 2180–2195 (2008)DOI: 10.1002/hyp

2190 K. L. LECOMTE ET AL.
signature of small and pristine basins in high moun-tains. The patterns of high-altitude glacial, hyperarid andsedimentary–volcanic catchments are remarkably similarto those obtained for mountainous rivers in granite- andgneiss-dominated semiarid catchments (Pasquini et al.,2004; Lecomte, 2006), included in Figure 6b for compari-son. The resemblance rests on the patterns of normalizedconcentrations and on the concentration range that, inboth instances, deviates between 10�2 and 103 from meansnow and ice concentrations.
The contrasting behavior—according to theenvironment—of each group of elements (LIL, HFS, andtransition metals) is presented by means of a set of boxand whiskers in Figure 7. Clearly, LIL elements are moreconcentrated in so-called mixed environments (i.e. ice-plus rock-glaciers); transition metals are more concen-trated in ice and snow, and HFS elements do not show aclear-cut pattern.
REE daily concentration variations in meltwater andstreams are remarkably flow-dependent. The concentra-tion range reaches almost two orders of magnitude; it issignificantly higher than the variation observed in othertrace elements (Tables II and III). In UCC-normalizedspidergrams (not shown), there is a slight pre-eminence ofmiddle REE (Sm to Dy) over heavy (Ho to Lu) and light(La to Nd) REE (Sholkovitz, 1995). Such predominanceis also evident in the spidergrams obtained for samplescollected in the non-glacierized mountainous landscape ofthe Sierras Pampeanas, in Argentina’s Cordoba Province(Pasquini et al., 2004; Lecomte, 2006). As a rule, dis-solved REE are more concentrated in granite-dominatedstreams and rivers of Cordoba than in Andean meltwater.
Samples collected at M1 show that the sum of REEconcentrations determined in the first sampling (March2003) was higher than that determined during the secondsampling (February 2004). Also, they showed a directrelationship (Figure 8a and b) with discharge (i.e. inverserelation with conductivity) that other trace elements (e.g.Cu, Ni, Pb) failed to show.
Another aspect worthy of attention is the conspicu-ous positive europium anomaly (Eu/EuŁ D EuN/�SmN ÐGdN�0Ð5, where the subscript N denotes normalization,and EuŁ is the expected Eu value for a smooth N-normalized REE pattern, e.g. McLennan, 1989), whichreached values of ¾3Ð8 and is absent in 1M5-snow.Eu/EuŁ is widely used in petrology, may be positive(enrichment) or negative (depletion), and results fromthe substitution of Sr by Eu in feldspars (notably in Ca-plagioclase). In this case, the dissolved Eu/EuŁ is a directconsequence of plagioclase weathering.
Likewise, the cerium anomaly (Ce/CeŁ D Ce/�LaN ÐPrN�0Ð5 where CeŁ is the expected Ce value for asmooth N-normalized REE pattern, McLennan, 1989)occurs in response to the oxidation of Ce3C to Ce4C
and its subsequent precipitation from solution as CeO2
(Brookins, 1989). Therefore, the negative Ce/CeŁ inmeltwater samples (between 0Ð23 and 0Ð96 except in1M5-snow and in 2M4) is determined by its removal fromsolution as CeO2 (Brookins, 1989). The two anomalies
Ice and snow Ice-glacier meltwater
Rock-glacier meltwater Mixed
0
2
4
6
8
10
12
14
0
20
40
60
0
500
1000
1500
2000
Σ LI
L el
emen
ts (
µg L
-1)
Σ tr
ansi
tiona
l ele
men
ts (
µg L
-1)
Σ H
FS
ele
men
ts (
µg L
-1)
(a)
(b)
(c)
Figure 7. Box and whiskers plot for each set of samples (ice and snow,rock-glacier and ice-glacier meltwater, and mixed environments). Theboxes correspond to the total (sum) concentration of (a) LIL elements(K, Rb, Sr, Ba, Cs); (b) transition metals (V, Mn, Co, Ni, Cu, Zn, Cr);and (c) HFS elements (Zr, Ti, U, Pb, Th, Y, REE, Sc, Hf, Nb). Blackdots correspond to mean values, box indicates 25% and 75% percentile
and bars show 95% and 5% range. Asterisks correspond to outliers
exhibit contrasting behavior: as the sum of dissolved REEconcentrations increases, the anomalies tend to disappear,Ce/CeŁ tends to become less negative and Eu/EuŁ lesspositive (Figure 8c). This behavior is interpreted as aconsequence of changing solute sources with increasingdischarge.
The �Ge:Si�diss. ratio was measured in 12 meltwaterand stream samples of the Agua Negra drainage basin andan arithmetic meanšs.d. of 1Ð48 š 0Ð272 pmol µmol�1
was found, which is higher than the ratios determinedby Chillrud et al. (1994) in Tronador Glacier meltwater(Rıo Negro, Argentina), close to the average continentalcrustal ratio (Ge : Si ³1Ð4). Clearly, the high �Ge:Si�diss.
ratio for the Agua Negra glacierized drainage faithfully
Copyright 2007 John Wiley & Sons, Ltd. Hydrol. Process. 22, 2180–2195 (2008)DOI: 10.1002/hyp

HYDROCHEMISTRY OF AGUA NEGRA DRAINAGE BASIN 2191
Table III. Dissolved REE concentrations (ppb)
Sample La Ce Pr Nd Sm Eu Gd Tb Dy Ho Er Yb
M1-12 : 00 0Ð053 0Ð093 0Ð013 0Ð042 0Ð009 0Ð003 0Ð008 0Ð001 0Ð005 0Ð001 0Ð002 0Ð002M1-13 : 10 0Ð219 0Ð446 0Ð052 0Ð194 0Ð044 0Ð011 0Ð038 0Ð005 0Ð021 0Ð004 0Ð010 0Ð007M1-15 : 00 0Ð020 0Ð031 0Ð004 0Ð015 0Ð002 0Ð002 0Ð003 <0Ð001 0Ð003 0Ð001 <0Ð001 0Ð001M1-17 : 00 0Ð012 0Ð014 0Ð003 0Ð009 0Ð003 0Ð002 0Ð001 <0Ð001 0Ð002 <0Ð001 0Ð001 0Ð001M1-19 : 00 0Ð058 0Ð107 0Ð013 0Ð050 0Ð010 0Ð005 0Ð007 0Ð001 0Ð005 0Ð001 0Ð002 0Ð003M1-20 : 30 0Ð021 0Ð035 0Ð006 0Ð022 0Ð006 0Ð002 0Ð004 <0Ð001 0Ð003 <0Ð001 0Ð002 0Ð002M2-12 : 00 0Ð022 0Ð031 0Ð005 0Ð020 0Ð003 0Ð003 0Ð003 <0Ð001 0Ð004 <0Ð001 0Ð003 0Ð003M2-17 : 00 0Ð128 0Ð199 0Ð033 0Ð119 0Ð026 0Ð006 0Ð023 0Ð003 0Ð011 0Ð002 0Ð005 0Ð0031M3 0Ð062 0Ð049 0Ð014 0Ð054 0Ð015 0Ð004 0Ð014 0Ð002 0Ð009 0Ð003 0Ð006 0Ð0051M4 0Ð031 0Ð050 0Ð008 0Ð036 0Ð005 0Ð001 0Ð007 <0Ð001 0Ð004 <0Ð001 0Ð002 0Ð0011M4 duplicate 0Ð033 0Ð055 0Ð009 0Ð028 0Ð008 0Ð002 0Ð008 <0Ð001 0Ð005 0Ð001 0Ð003 0Ð0011M5 - snow 0Ð030 0Ð127 0Ð008 0Ð031 0Ð010 0Ð002 0Ð009 0Ð001 0Ð006 0Ð001 0Ð002 0Ð0021M5 - ice 0Ð028 0Ð060 0Ð007 0Ð028 0Ð008 0Ð002 0Ð006 <0Ð001 0Ð004 <0Ð001 0Ð002 0Ð0021M6 0Ð031 0Ð056 0Ð008 0Ð033 0Ð008 0Ð002 0Ð006 <0Ð001 0Ð002 <0Ð001 <0Ð001 0Ð0011M7 0Ð024 0Ð026 0Ð006 0Ð022 0Ð006 0Ð002 0Ð004 <0Ð001 0Ð004 <0Ð001 0Ð002 0Ð0021M8 0Ð045 0Ð062 0Ð010 0Ð035 0Ð005 0Ð003 0Ð005 <0Ð001 0Ð004 0Ð001 0Ð002 0Ð0021M9 0Ð060 0Ð104 0Ð015 0Ð058 0Ð015 0Ð005 0Ð014 0Ð002 0Ð009 0Ð001 0Ð003 0Ð0022M1-17 hs 0Ð021 0Ð010 0Ð005 0Ð028 <0Ð001 0Ð004 0Ð001 <0Ð001 0Ð004 0Ð001 <0Ð001 0Ð0032M1-18 : 50 hs 0Ð019 0Ð015 0Ð004 0Ð016 <0Ð001 0Ð003 0Ð003 <0Ð001 0Ð001 <0Ð001 0Ð001 0Ð0012M1-21 hs 0Ð024 0Ð035 0Ð006 0Ð018 <0Ð001 0Ð002 0Ð005 <0Ð001 0Ð001 0Ð001 0Ð002 0Ð0022M1-23 hs 0Ð072 0Ð141 0Ð019 0Ð064 0Ð012 0Ð003 0Ð013 0Ð002 0Ð009 0Ð002 0Ð004 0Ð0022M2 0Ð026 0Ð036 0Ð007 0Ð025 <0Ð001 0Ð002 0Ð007 <0Ð001 0Ð002 0Ð001 0Ð003 0Ð0032M4 0Ð034 0Ð168 0Ð010 0Ð036 <0Ð001 <0Ð001 0Ð007 <0Ð001 0Ð002 <0Ð001 <0Ð001 <0Ð0012M8 0Ð019 0Ð023 0Ð004 0Ð014 <0Ð001 0Ð002 0Ð001 <0Ð001 0Ð002 0Ð001 0Ð002 0Ð0022M9 0Ð019 0Ð025 0Ð005 0Ð012 <0Ð001 0Ð002 0Ð003 <0Ð001 0Ð003 <0Ð001 0Ð001 0Ð003
Tm and Lu concentrations are below detection limit (i.e. blank D 0.001).
reflects the ratios in primary minerals and, as pointed outby Chillrud et al. (1994), there are no indications thatGe preferentially sorbs on fresh surfaces, such as thoseprovided by Fe(OH)3.
Weathering intensity through PHREEQC inversemodelling
In order to assess solute contributions originating indifferent parts of the drainage basin, weathering reac-tions in the Agua Negra drainage basin were simulated bymeans of the PHREEQC computer program (Parkhurst,1995). The relatively small size of the basin and uni-form lithology were factors that promoted a successfuloutcome of the modelling exercise.
Models were built using samples collected during bothfield trips. Figure 9 shows schematically the three streamreaches that were modelled with the PHREEQC code,and their respective length. Weathering processes werequantified as shown in Figure 9a, b, and c.
The contributing phases are salt dissolution (carbonate,halite, and gypsum), silicate incongruent dissolution(muscovite and andesine), the formation of clay minerals(kaolinite and illite), and the involvement of CO2. Theparticipating solid phases were selected following themost abundant rocks and by inspecting the clay mineralstability diagrams. It must be noted that gypsum is aproxy for the sulphate generated by sulphide oxidation,as shown above in the corresponding chemical equation.
The total sum of dissolved and precipitated speciesthat, according to the models, take part in the weatheringprocesses is about 10�3 mol L�1. In each modelled reach,the downstream rate fluctuates between 8 ð 10�2 and
6 ð 10�3 mmol L�1 km�1 and is clearly higher in theuppermost catchments (i.e. M6 to M8, Figure 9a), wherethe dominant process is gypsum dissolution as a directconsequence of sulphide oxidation. Also important in theuppermost glacierized catchments is the loss of CO2 tothe atmosphere:
Corg�s� C H2O�liq� C O2�aq� , CO2�aq� C H2O�liq�
According to the model (Figure 9a), CO2 degassingtriggers calcite precipitation in the upper catchments.
In the second reach (M8 to M9, Figure 9b, i.e. thecontribution of the Dos Lenguas rock-glacier) there is acontrasting difference between the two samplings: duringthe first one, with restricted meltwater production, car-bonation dominates over other geochemical processes,whereas during the second sampling, with ample melt-water provision, silicate and gypsum dissolution (i.e. sul-phide oxidation) becomes more important (Figure 9b).This suggests that the controls on glacial meltwater geo-chemistry in the rock-glacier switch over from calcitedissolution (due to high PCO2) to silicate and gypsumdissolution (sulphide oxidation) as meltwater evolves.However, the magnitude of moles transferred from sil-icate weathering, along with the production of illite ismore important during the first sampling. This difference(i.e. higher silicate dissolution) may be the result of shift-ing meltwater residence times.
The models obtained for the third reach (M9 toM1, Figure 9c) show clearly that solute production issignificantly higher when glaciers are in the activemelting process (the second sampling). Further, CO2 is
Copyright 2007 John Wiley & Sons, Ltd. Hydrol. Process. 22, 2180–2195 (2008)DOI: 10.1002/hyp

2192 K. L. LECOMTE ET AL.
R2 = 0.69 (p < 0.05)
0 2.10-4 4.10-4 6.10-4 8.10-4 1.10-3
Eu/Eu*Ce/Ce*
Ano
mal
y va
lue
0
1
2
3
4
Σ REE (mg L-1)
R2 = 0.55 (p < 0.05)
370
380
390
400
410
Con
duct
ivity
(µS
cm
-1)
Con
duct
ivity
(µS
cm
-1)
0
2.10-4
4.10-4
6.10-4
8.10-4
1.10-3
Conductivity (µS cm-1)
ΣREE (mg L-1)
0
100
200
300
400
500
600
0
1.10-4
2.10-4
3.10-4
4.10-4
Σ R
EE
(mg L
-1)Time (hrs)
Σ R
EE
(mg L
-1)11 13 15 17 19 21 23
1.2.10-3
5
Conductivity (µS cm-1)ΣREE (mg L-1)
(a)
(b)
(c)
Figure 8. (a) and (b) Time-dependent variation of REE and conduc-tivity (as proxy for discharge) at 1M1 and 2M1, respectively; and(c) scatterplot of Eu/EuŁ and Ce/CeŁ versus REE. The broken line
corresponds to the absence of anomaly
no longer subjected to degassing—as it occurred in theuppermost catchment—and appears to play an active rolein ongoing chemical reactions.
A direct comparison (Figure 10a) of the total inversemodel for the Agua Negra drainage basin (1M6 to1M1) with similar results obtained in a non-glacierizedmountainous catchment (Lecomte et al., 2005) withexposed granite and gneiss, shows that, in terms ofan area-normalized approach, sulphide oxidation andCO2 consumption account for most of the total of4 ð 10�2 mmol L�1 km�2 transferred in the glacierizedarea, whereas silicate hydrolysis and dissolution are themost conspicuous processes in the non-glacierized basin,reaching a total of 9 ð 10�3 mmol L�1 km�2 of trans-ferred moles.
Figure 10b shows that in relative terms, and consid-ering dissolved phases only, sulphide oxidation is byfar the most significant solute provider in the glacier-ized environment, contrasting with the role played bysilicate hydrolysis and dissolution in a representative non-glacierized catchment of the Sierras Pampeanas.
M8 to M9
1° sampling (March 2003)2° sampling (February 2004)
0
1.10-3
8.10-4
6.10-4
4.10-4
2.10-4
-2.10-4
-4.10-4
mol
L-1
3.10-4
2.10-4
1.10-4
0
-1.10-4
-2.10-4
mol
L-1
0
7.10-5
6.10-5
5.10-5
3.10-6
2.10-6
1.10-6
-1.10-6
-5.10-6
-6.10-6
mol
L-1
1M6 to 1M8
Calcite
M9 to M1
M6 M8 M9 M1
19.2 km3.2 km
28.6 km
(a)
(b)
(c)
Halite Sulphide
oxidation
K-mica Andesine Kaolinite Illite CO2
Figure 9. Transferred moles (mol L�1) of each phase in: (a) uppermostcatchment; (b) Dos Lenguas rock-glacier; and (c) lowermost catchment.A schematic diagram is included with the length of the stream reaches
analysed in each model using the PHREEQC code
CONCLUDING COMMENTS
Several ice- and rock-glaciers with dissimilar ice masscoexist at the Agua Negra drainage basin, in the Argen-tine Andes. The area was sampled on two occasions: first,when meltwater discharge was subsiding (i.e. beginningof the southern fall); and, second, when meltwater waspeaking, during the southern summertime. In the firstinstance, the supraglacial meltwater (surface melt) con-tribution was decreasing and during the second one, thesubglacial contribution was fully operational. The asso-ciation between meltwater volume and total dissolved orsuspended solids was discernible in the latter but wasunclear during the former. In both sampling instances,serial sampling was restricted to the drainage basin outfalland, hence, it was difficult to separate the geochemicaleffects of all the intervening ice- and rock-glaciers.
Copyright 2007 John Wiley & Sons, Ltd. Hydrol. Process. 22, 2180–2195 (2008)DOI: 10.1002/hyp

HYDROCHEMISTRY OF AGUA NEGRA DRAINAGE BASIN 2193
-5.10-3
0
5.10-3
1.10-2
2.0.10-2
Calcite Halite/Biotite
Sulphideoxidation
K-mica Plagioclase Kaolinite Illite CO2
mm
ol L
-1 K
m-2
0
10
20
30
40
50
60
70
80
90
Calcite Silicates
% m
ol L
-1
Glacierized meltwaterNon glacierized water
2.5.10-2
Sulphideoxidation
(a)
(b)
Figure 10. (a) Area-normalized comparison of the total inverse model for the Agua Negra drainage basin (1M6 to 1M1) with a non-glacierizedmountainous catchment (Lecomte et al., 2005); and (b) relative significance of gypsum, calcite and silicate dissolution/weathering in glacierized
(Agua Negra drainage) and non-glacierized (Lecomte et al., 2005) catchments
Meltwaters in ice-glaciers basically have a HCO3� —
Ca2C composition whereas rock-glaciers have a SO42� —
HCO3� —Ca2C major solute composition. There is
a clear hydrochemical distinction between the twoglacier types, surely associated with the different rockdebris : meltwater ratios. As determined for many otherworld glaciers (Tranter, 2005), the main solute-producingprocesses are, in decreasing order of importance, sul-phide oxidation, and carbonate and silicate hydrolysis.The source of Cl�, and to a lesser extent of NaC, appearsto be marine aerosols from the Pacific Ocean (up to 30%of NaC in each sample). The study of post-depositionalprocesses at Co. Tapado Glacier, in the Chilean Andes(roughly at the same latitude as Agua Negra Glacier),has shown that dry deposition and sublimation (1Ð9 mmwater equivalent d�1) determine a concentration enhance-ment in snow and ice of irreversibly deposited chemicalspecies (Ginot et al., 2001). It is most likely that suchenrichment, in these mid-latitude glaciers, is not only lim-ited to major components but it also includes minor andtrace elements.
Examination of the dynamics of minor and traceelement concentrations was undertaken by clustering
the elements into LIL elements (e.g. Cs, Rb, Sr), HFSelements (e.g. Ti, Zr, Hf), and transition metals (e.g. Cu,Ni, Co). Analysis showed that LILs are more abundantin the lowermost reach (i.e. the combined effect of ice-C rock-glaciers). HFS elements are more abundant inboth mixed environments and in rock-glaciers, whereastransition metals are more abundant in ice and snow.Fine-grain-size rock flour scavenges transitional elementsin solution as soon as they make contact with each other.
At the lowermost reach, the sum of dissolved REEconcentrations correlates positively with meltwater dis-charge and, hence, decreases with increasing total dis-solved solids. When there is a clear association withmeltwater discharge, as during the summer sampling, dis-solved REE increase with suspended solids concentration.It seems that in this environment, REE are mobilizedand flushed-out by meltwater, and the prevailing physic-ochemical conditions are not favorable to implement thescavenging from solution. It is interesting to point out thatboth Eu/EuŁ and Ce/CeŁ tend to disappear as the REEincreases (and discharge also increases). This seems to bethe consequence of varying meltwater sources throughoutthe cycle.
Copyright 2007 John Wiley & Sons, Ltd. Hydrol. Process. 22, 2180–2195 (2008)DOI: 10.1002/hyp

2194 K. L. LECOMTE ET AL.
The use of the PHREEQC computer code to simulatethe interaction of different phases in glacial weather-ing, produced the following results: (a) significant CO2
degassing appears to occur only in the upper catchments,where ice- and rock-glaciers coexist; (b) the Dos LenguasGlacier is one of the largest rock-glaciers in the drainagebasin and shows at least two modes of operation: dom-inant calcite dissolution and CO2 consumption duringearly fall, and sulphide oxidation and silicate dissolu-tion (along with CO2 consumption) during high melt-water flow (summer); (c) in the overall picture for theAgua Negra drainage basin, sulphide oxidation/gypsumdissolution (¾2Ð0 ð 10�2 mmol L�1 km�2), and CO2
consumption (¾0Ð85 ð 10�2 mmol L�1 km�2) are themost important intervening phases in the Agua NegraGlacier environment; and, finally, (d) comparison witha mountainous semiarid drainage of comparable sizein the granite- and gneiss-dominated Sierras Pampeanas(Cordoba, Argentina) shows that the glacierized areareaches a higher specific denudation, 80% of which isaccounted for by sulphide oxidation C calcite dissolu-tion. A similar proportion was determined for silicates inthe semiarid range of central Argentina.
The geochemical characteristics of a typical glacierizeddrainage basin in the arid to hyperarid Andes of Argentinahave been studied. Initial conclusions provide support forthe idea that there are significant geochemical differenceswith the humid counterparts, which basically stem fromthe higher sublimation/evaporation rate in the former.Additional research would improve current knowledgeof the differences between the two glacier types.
ACKNOWLEDGEMENTS
We wish to acknowledge the continued support ofArgentina’s CONICET (PIP 5947) and FONCYT (PICT25594), and CICITCA from Universidad Nacional de SanJuan (Argentina). We are grateful to E.L. Piovano, D.M.Gaiero, and R. Morilla for their helpful assistance in thefield, during the first sampling trip. We are grateful totwo anonymous reviewers for helpful comments that ledto an improvement of the original manuscript.
REFERENCES
Anderson SP, Drever, JI, Frost CD, Holden P. 2000. Chemical weather-ing in the foreland of a retreating glacier. Geochimica et CosmochimicaActa 64: 1173–1189.
Barnes JB, Pelletier JD. 2006. Latitudinal variation of denudation in theevolution of the Bolivian Andes. American Journal of Science 306:1–31.
Barsch D. 1978. Active rock glaciers as indicators for discontinuousAlpine permafrost. An example from the Swiss Alps. ThirdInternational Conference on Permafrost, Vol. 1: 348–353.
Barsch D. 1996. Rock Glaciers. Springer-Verlag: Berlin; 331.Barsch D, Happoldt H, Mausbacher R, Schrott L, Schukraft G. 1994.
Discharge and fluvial sediment transport in a semi-arid high mountaincatchment, Agua Negra, San Juan, Argentina. In Dynamics andGemorphology of Mountain Rivers, Ergenzinger P, Schmidt KH (eds).Springer-Verlag: Berlin; 213–224.
Brookins DG. 1989. Aqueous geochemistry of rare earth elements. InReviews in Mineralogy. Geochemistry and Mineralogy of Rare Earth
Elements , Lippin BR, GA McKay (eds). Mineralogical Society ofAmerica: Washington, DC.
Brown GH. 2002. Glacier meltwater hydrochemistry. Applied Geochem-istry 17: 855–883.
Chillrud SN, Pedrozo FL, Temporetti PF, Planas HF, Froelich PN. 1994.Chemical weathering of phosphate and germanium in glacial meltwaterstreams: Effects of subglacial pyrite oxidation. Limnology andOceanography 39: 1130–1140.
Clark DH, Steig EJ, Potter N, Jr, Gillespie AR. 1998. Genetic variabilityof Rock Glaciers. Geografiska Annaler 80: 175–182.
Corte AE. 1980. Glaciers and glaciolithic systems of the Central Andes.In World Glacier Inventory , Muller F, Scherler K (eds). IAHS-AISH:Wallingford; 11–24.
Croce, F. A 2006. Estudio Geofısico e Importancia Hıdrica en GlaciaresCubiertos y de Roca del Arroyo Agua Negra. Doctoral thesis,Universidad Nacional de San Juan (Argentina).
Croce FA, Milana JP. 2002a. Internal structure and behavior of a RockGlacier in the arid Andes of Argentina. Permafrost and PeriglacialProcesses 13: 289–299.
Croce FA, Milana JP. 2002b. Estudio de la capa activa, el permafrost yla hidrologıa del glaciar de rocas El Paso, Agua Negra, San Juan. XVCongreso Geologico Argentino, Calafate.
Croce FA, Milana JP. 2006. Electrical Tomography applied to image the3D extent of the permafrost of three different rock glaciers of the aridAndes of Argentina. Geophysical Research Abstracts 8: 3–26.
Dixon JC, Thorn CE. 2005. Chemical weathering and landscapedevelopment in mid-latitude alpine environments. Gemorphology 67:127–145.
Eary LE, Runnels DD, Esposito KJ. 2003. Geochemical control songround water composition at the Cripple Creek Mining District, CrippleCreek, Colorado. Applied Geochemistry 18: 1–24.
Eaton AD, Clesceri LS, Greenberg AE. 1995. Standard Methods forthe Examination of Water and Wastewater. 19th Edition. AmericanPublic Health Association, American Water Works Association, WaterEnvironment Federation: Washington, DC; 1108.
Gaillardet J, Viers, J, Dupre B. 2005. Trace elements in river waters.In Surface and Ground Water, Weathering, and Soils , Drever JI (ed)Elsevier: Amsterdam; 225–272.
Ginot PCh, Kull M, Schwikowski U, Schotterer HW, Gaggeler . 2001.Effects of postdepositional processes on snow composition ofa subtropical glacier (Cerro Tapado, Chilean Andes). JournalGeophysical Research 106: 32,375–32,386.
Haeberli W. 1985. Creep of mountain permafrost: internal structureand flow of alpine rock glaciers. Mitteilungen der Versuchsantalt furWasserbau, Hydrologie und Glaziologie 77: 1–142.
Hamilton SJ, Whalley WB. 1995. Rock glacier nomenclature: A re-assessment. Geomorphology 14: 73–80.
Hodson A, Porter, P Lowe A, Mumford P. 2002a. Chemical denudationand silicate weathering in Himalayan glacier basins: Batura Glacier,Pakistan. Journal of Hydrology 262: 193–208.
Hodson A, Tranter M, Gurnell A, Clark M, Hagen JO. 2002b. Thehydrochemistry of Bayelva, a high Artic proglacial stream in Svalbard.Journal of Hydrology 257: 91–114.
Lafreniere MJ, Sharp MJ. 2005. A comparison of solute fluxes andsources from glacial and non-glacial catchments over contrasting meltseasons. Hydrological Processes 19: 2991–3012.
Lecomte KL. 2006. Control geomorfologico en la geoquımica de rıosde montana, Sierras Pampeanas, Provincia de Cordoba, RepublicaArgentina. Doctoral thesis, Universidad Nacional de Cordoba: Cordoba(Argentina); 279.
Lecomte KL, Pasquini AI, Depetris PJ. 2005. Mineral Weathering ina Semiarid Mountain River: Its assessment through PHREEQCinversemodelling. Aquatic Geochemistry 11: 173–194.
Leiva JC. 1999. Recent fluctuations of the Argentinian glaciers. Globaland Planetary Change 22: 169–177.
Leiva JC. 2002. La situacion actual de los glaciares andinos. InIANIGLIA, 30 anos de Investigacion Basica y Aplicada en CienciasAmbientales . Trombotto D, Villalba R (eds). IANIGLIA: Mendoza;181–185.
Lyons WB, Welch KA, Fountain AG, Dana GL, Vaughn BH, McK-night DM. 2003. Surface glaciochemistry of Taylor Valley, southernVictoria Land, Antarctica and its relationship to stream chemistry.Hydrological Processes 17: 115–130.
Lyons WB, Carey AE, Hicks DM, Nezat CA. 2005. Chemical weath-ering in high-sediment-yielding watersheds, New Zeland. Journal ofGeophysical Research 110: 1–11.
McLennan SM. 1989. Rare earth elements in sedimentary rocks:Influence of provenance and sedimentary processes. In Geochemistry
Copyright 2007 John Wiley & Sons, Ltd. Hydrol. Process. 22, 2180–2195 (2008)DOI: 10.1002/hyp
HYDROCHEMISTRY OF AGUA NEGRA DRAINAGE BASIN 2195
and Mineralogy of Rare Earth Elements , Lipin BP, McKay GA (eds).Mineralogical Society of America: Washington, DC; 169–200.
Milana JP, Maturano A. 1999. Application of radio echo sounding atthe arid Andes of Argentina: the Agua Negra Glacier. Global andPlanetary Change 22: 179–191.
Mitchell A, Brown, GH, Fuge, R. 2002. Minor and trace element exportfrom a glacierized Alpine headwater catchment (Haut Glacier d’Arolla,Switzerland). Hydrological Processes 15: 3499–3524.
Montgomery DR, Balco G, Willett SD. 2001. Climate, tectonic, and themorphology of the Andes. Geology 29: 579–582.
Outcalt SE, Benedict JB. 1965. Photointerpretation of two types of rockglaciers in the Colorado Front Range, USA. Journal of Glaciology 5:849–856.
Parkhurst DL. 1995. User’s guide to PHREEQC- a computer program forspeciation, reaction-path, advective-transport and inverse geochemicalcalculations. United States Geological Survey Water ResourcesInvestigations Report 95–4227; 143.
Pasquini AI, Lecomte KL, Depetris PJ. 2004. Geoquımica de rıos demontana en las Sierras pampeanas: II. El rıo Los Reartes, Sierrade Comechingones, provincia de Cordoba, Argentina. Revista de laAsociacion Geologica Argentina 59(1): 129–140.
Perucca JC, Carrizo MM. 1998. Riesgos Naturales en la ruta de AguaNegra. Actas X Congreso Latinoamericano de Geologıa y VI CongresoNacional de Geologıa Economica, 1: 379–384.
Picouet C, Dupre B, Orange D, Valladon M. 2002. Major and traceelement geochemistry in the upper Niger river (Mali): physical andchemical weathering rates and CO2 consumption. Chemical Geology185: 93–124.
Piper AM. 1944. A graphic procedure in the geochemical interpretationof water analyses. Transactions of the American Geophysical Union25: 914–923.
Raiswell R. 1984. Chemical models of solute acquisition in glacialmeltwater. Journal of Glaciology 30: 49–57.
Ramos VA. 1999. Las provincias geologicas del territorio argentino.In Geologıa Argentina, Caminos R (ed). SEGEMAR: Buenos Aires;41–96.
Schrott L. 1991. Global solar radiation, soil temperature and permafrostin the central Andes, Argentina: a progress report. Permafrost andPeriglacial Processes 2: 59–66.
Schrott L. 1996. Some geomorphological-hydrological aspects ofrock glaciers in the Andes (San Juan, Argentina). Zeitung furGeomorphologie 104: 161–173.
Schrott L. 1998. The hydrological significance of high mountainpermafrost and its relation to solar radiation. A case study in the highAndes of San Juan, Argentina. Bamberger Geographische Schriften 15:71–84.
Schrott L. 2002. Hidrologıa del permafrost de montana y su relacioncon la radiacion solar. Estudio de una cuenca colectora en AguaNegra, altos Andes de San Juan, Argentina. In IANIGLIA, 30anos de Investigacion Basica y Aplicada en Ciencias Ambientales.Trombotto D, Villalba R (eds). IANIGLIA: Mendoza; 83–87.
Sharp M, Skidmore M, Tranter M, Brown, GH. 1995. Rates of chemicaldenudation and CO2 drawdown in a glacier-covered alpine catchment.Geology 23(1): 71–74.
Sholkovitz E. 1995. The aquatic chemistry of rare earth elements in riversand estuaries. Aquatic Geochemistry 1: 1–34.
Taylor SR, McLennan SM. 1985. The Continental Crust: Its Compositionand Evolution. Blackwell Scientific: Oxford; 312.
Thenthorey G. 1992. Perennial neves and hydrology of rock glaciers.Permafrost and Periglacial Processes 3: 247–252.
Tranter M. 2005. Geochemical weathering in glacial and proglacialenvironments. In Surface and Ground Water, Weathering, and Soils,Drever JI (ed.) Elsevier: Amsterdam; 189–205.
Tranter M, Huybrechts P, Munhoven G, Sharp MJ, Brown GH, Jones IW,Hudson AJ, Hodgkins R, Wadham JL. 2002. Direct effect of ice-sheeton terrestrial bicarbonate, sulphate and base cation fluxes during thelast glacial cycle: minimal impact on atmospheric CO2 concentrations.Chemical Geology 190: 33–44.
Uliana MM, Sharp JM. 2001. Tracing regional flow paths to majorsprings in Trans-Pecos Texas using geochemical data and geochemicalmodels. Chemical Geology 179: 53–72.
Ward JV. 1994. Ecology of alpine streams. Freshwater Biology 32:277–294.
Wahrhaftig C, Cox A. 1959. Rock glaciers in the Alaska Range.Geological Society of America Bulletin 70: 383–436.
Whalley WB, Martin HE. 1992. Rock glaciers: II-models andmechanisms. Progress in Physical Geography 16: 127–186.
Copyright 2007 John Wiley & Sons, Ltd. Hydrol. Process. 22, 2180–2195 (2008)DOI: 10.1002/hyp