Hydrochemical characteristics of irrigation return flow in semi-arid regions of Iran
14
This article was downloaded by: [Eindhoven Technical University] On: 12 August 2013, At: 02:15 Publisher: Taylor & Francis Informa Ltd Registered in England and Wales Registered Number: 1072954 Registered office: Mortimer House, 37-41 Mortimer Street, London W1T 3JH, UK Hydrological Sciences Journal Publication details, including instructions for authors and subscription information: http://www.tandfonline.com/loi/thsj20 Hydrochemical characteristics of irrigation return flow in semi-arid regions of Iran H. Jafari a , E. Raeisi a , E. Hoehn b & M. Zare a a Shiraz University, College of Sciences, Department of Earth Sciences, Shiraz, Iran, 71454, Iran b Swiss Federal Institute for Water Resources and Water Pollution Control (EAWAG), CH-8600, Dübendorf, Switzerland Published online: 20 Jan 2012. To cite this article: H. Jafari , E. Raeisi , E. Hoehn & M. Zare (2012) Hydrochemical characteristics of irrigation return flow in semi-arid regions of Iran, Hydrological Sciences Journal, 57:1, 173-185, DOI: 10.1080/02626667.2011.636365 To link to this article: http://dx.doi.org/10.1080/02626667.2011.636365 PLEASE SCROLL DOWN FOR ARTICLE Taylor & Francis makes every effort to ensure the accuracy of all the information (the “Content”) contained in the publications on our platform. However, Taylor & Francis, our agents, and our licensors make no representations or warranties whatsoever as to the accuracy, completeness, or suitability for any purpose of the Content. Any opinions and views expressed in this publication are the opinions and views of the authors, and are not the views of or endorsed by Taylor & Francis. The accuracy of the Content should not be relied upon and should be independently verified with primary sources of information. Taylor and Francis shall not be liable for any losses, actions, claims, proceedings, demands, costs, expenses, damages, and other liabilities whatsoever or howsoever caused arising directly or indirectly in connection with, in relation to or arising out of the use of the Content. This article may be used for research, teaching, and private study purposes. Any substantial or systematic reproduction, redistribution, reselling, loan, sub-licensing, systematic supply, or distribution in any form to anyone is expressly forbidden. Terms & Conditions of access and use can be found at http:// www.tandfonline.com/page/terms-and-conditions
-
Upload
independent -
Category
Documents
-
view
0 -
download
0
Transcript of Hydrochemical characteristics of irrigation return flow in semi-arid regions of Iran
This article was downloaded by: [Eindhoven Technical University]On: 12 August 2013, At: 02:15Publisher: Taylor & FrancisInforma Ltd Registered in England and Wales Registered Number: 1072954 Registered office: Mortimer House,37-41 Mortimer Street, London W1T 3JH, UK
Hydrological Sciences JournalPublication details, including instructions for authors and subscription information:http://www.tandfonline.com/loi/thsj20
Hydrochemical characteristics of irrigation return flowin semi-arid regions of IranH. Jafari a , E. Raeisi a , E. Hoehn b & M. Zare aa Shiraz University, College of Sciences, Department of Earth Sciences, Shiraz, Iran, 71454,Iranb Swiss Federal Institute for Water Resources and Water Pollution Control (EAWAG),CH-8600, Dübendorf, SwitzerlandPublished online: 20 Jan 2012.
To cite this article: H. Jafari , E. Raeisi , E. Hoehn & M. Zare (2012) Hydrochemical characteristics of irrigation return flow insemi-arid regions of Iran, Hydrological Sciences Journal, 57:1, 173-185, DOI: 10.1080/02626667.2011.636365
To link to this article: http://dx.doi.org/10.1080/02626667.2011.636365
PLEASE SCROLL DOWN FOR ARTICLE
Taylor & Francis makes every effort to ensure the accuracy of all the information (the “Content”) containedin the publications on our platform. However, Taylor & Francis, our agents, and our licensors make norepresentations or warranties whatsoever as to the accuracy, completeness, or suitability for any purpose of theContent. Any opinions and views expressed in this publication are the opinions and views of the authors, andare not the views of or endorsed by Taylor & Francis. The accuracy of the Content should not be relied upon andshould be independently verified with primary sources of information. Taylor and Francis shall not be liable forany losses, actions, claims, proceedings, demands, costs, expenses, damages, and other liabilities whatsoeveror howsoever caused arising directly or indirectly in connection with, in relation to or arising out of the use ofthe Content.
This article may be used for research, teaching, and private study purposes. Any substantial or systematicreproduction, redistribution, reselling, loan, sub-licensing, systematic supply, or distribution in anyform to anyone is expressly forbidden. Terms & Conditions of access and use can be found at http://www.tandfonline.com/page/terms-and-conditions
173Hydrological Sciences Journal – Journal des Sciences Hydrologiques, 57(1) 2012
Hydrochemical characteristics of irrigation return flow in semi-aridregions of Iran
H. Jafari1, E. Raeisi1, E. Hoehn2 and M. Zare1
1Shiraz University, College of Sciences, Department of Earth Sciences, Shiraz, Iran, 71454 [email protected] Federal Institute for Water Resources and Water Pollution Control (EAWAG), CH-8600 Dübendorf, [email protected]
Received 2 December 2010; accepted 7 June 2011; open for discussion until 1 July 2012
Editor Z.W. Kundzewicz
Citation Jafari, H., Raeisi, E., Hoehn, E. and Zare, M., 2012. Hydrochemical characteristics of irrigation return flow in semi-aridregions of Iran. Hydrological Sciences Journal, 57 (1), 173–185.
Abstract The study area is located on the Harat plain, in the central region of Iran. Four local-soil filled, free-drainage lysimeters were installed in wheat and barley farms operating under traditional farm managementpractices. The volume, electrical conductivity (EC), nitrate and major ions of the applied irrigation water andirrigation return flow (IRF) were measured during the growing season. The total dissolved solids (TDS) of IRFincreased three to five times compared to that of the applied water. This enhancement was the same as for thechloride ion ratio, indicating the major impact of evapotranspiration in IRF salinity enhancement. Geochemicalmodelling using PHREEQCI confirmed the significant role of evapotranspiration and the minor effects of pro-cesses such as calcite precipitation, gypsum dissolution, fertilizer nitrification and ion exchange on the values ofthe IRF TDS. Time variations of EC were functions of the type of flow (preferential or matrix), lithology and soiltype. The controlling parameters of the nitrate time series were the frequent applications of N fertilizer and thenitrification process. The annual N loads (NO3-N) of IRF varied from 22 to 195 kg ha-1. These variations weredue to the different N loads in the applied water, the amount of fertilizer, soil texture, N uptake and volume of IRF.The annual salt loads of IRF were mainly controlled by the volume of IRF.
Key words irrigation return flow; lysimeter; nitrate; N load; salt load; semi-arid; water quality; traditional farming; Iran
Caractéristiques hydrochimiques des débits de colature dans les régions semi-arides de l’IranRésumé La zone d’étude est située sur la plaine de Harat, dans la région centrale de l’Iran. Quatre lysimètres àdrainage libre remplis de sol local ont été installés sur des exploitations agricoles produisant du blé et de l’orgeselon des pratiques traditionnelles. Le volume, la conductivité électrique (CE), les nitrates et les ions majeursde l’eau d’irrigation appliquée et du débit de colature (DC) ont été mesurés pendant la saison de croissance.Les matières totales dissoutes (MTD) du DC ont augmenté de trois à cinq fois par rapport à celles de l’eauappliquée. Cette augmentation a été la même que pour le rapport de l’ion chlorure, indiquant l’impact majeur del’évapotranspiration dans l’augmentation de la salinité du DC. La modélisation géochimique utilisant PHREEQCIa confirmé le rôle important de l’évapotranspiration et les effets secondaires de processus tels que la précipitationde la calcite, la dissolution du gypse, la nitrification des engrais et les échanges d’ions sur les valeurs des MTDdu DC. Les variations temporelles de la CE étaient fonctions du type de débit (préférentiel ou matriciel), de lalithologie et du type de sol. Les paramètres contrôlant la série chronologique des nitrates étaient les applicationsfréquentes d’engrais azotés et le processus de nitrification. Les charges annuelles en N (NO3-N) du DC ont variéde 22 à 195 kg ha-1. Ces variations étaient dues aux charges en N différentes dans l’eau appliquée, à la quantitéd’engrais, à la texture du sol, à l’absorption de l’azote et au volume du DC. Les charges annuelles en sel du DCsont principalement contrôlées par le volume du DC.
Mots clefs débit de colature; lysimètre; nitrate; charge en N; charge en sel; semi-aride; qualité de l’eau; agriculturetraditionnelle; Iran
ISSN 0262-6667 print/ISSN 2150-3435 online© 2011 IAHS Presshttp://dx.doi.org/10.1080/02626667.2011.636365http://www.tandfonline.com
Dow
nloa
ded
by [
Ein
dhov
en T
echn
ical
Uni
vers
ity]
at 0
2:15
12
Aug
ust 2
013

174 H. Jafari et al.
INTRODUCTION
“Irrigation return flow (IRF) is defined as the excessof irrigation water that is not evapotranspirated orevacuated by direct surface drainage, and whichreturns to an aquifer” (Dewandel et al. 2007). It isconsidered to be a major non-point (diffuse) contribu-tor to the pollution of surface and groundwater bodies(Aragues and Tanji 2003). Irrigation, which is theprimary use for water in arid and semi-arid regions,increases the salinity of IRF to three to ten times thatof the applied water (Todd and Mays 2005). Typicalsalt loading values in IRFs from irrigated agriculturein arid areas vary from 2000 to 20 000 kg ha-1 year-1
(Aragues and Tanji 2003).The primary fertilizers are compounds of nitro-
gen, phosphorus and potassium. Phosphorus andpotassium are readily adsorbed onto soil particles andseldom constitute a pollution problem. But nitrogenin solution is only partially used by plants or adsorbedby the soils. Although nitrate (NO3
-) is generally notthe major form of N added to agricultural fields, itis usually the major form of N (other than dissolvedatmospheric N2) in agricultural recharge (Böhlke2002). Nitrate is the most abundant form of nitro-gen and, because of its high mobility and persistence,becomes a primary groundwater pollutant in agricul-tural regions (Ling and El-Kadi 1998, Onsoy et al.2005). IRF nitrate loading is highly variable, becauseit is a function of the irrigation and drainage sys-tems, soil characteristics, crop management systemand climatic conditions (Causape et al. 2004). Typicalvalues of nitrate loading (NO3-N) found in IRF mayvary from 20 kg ha-1 year-1 in well-managed irrigatedsystems, to more than 200 kg ha-1 year-1 in poorlymanaged irrigated systems (Cavero et al. 2003).
Several studies (Hamilton and Helsel 1995,Keating et al. 1996, Zhang et al. 1996, Laegreidet al. 1999) indicate that agricultural practices haveresulted in nitrate contamination of groundwaterwith concentrations in aquifers commonly exceedingthe drinking-water maximum contaminant level of10 mg/L as N (USEPA 2009) or 50 mg/L as NO3
-
(EC 1998).Solute loading to groundwater in agricultural
systems has often been estimated by collection andanalysis of soil pore water, monitoring of drain-tile effluent, lysimeter studies, and mass-balancecomputations. Only lysimeters permit a directdetermination of the water percolating through a soilprofile and the type and amount of solutes (Meisner
et al. 2008). Lysimeters offer good possibilities forconducting experiments that have control over allwater percolating through the soil profile and carry-ing contaminants, such as nitrate (Bergström 1990).They are used extensively in field research aroundthe world to estimate evapotranspiration, but mea-surements of the IRF hydrochemical data, especiallyunder traditional farm conditions, are limited.
During the three last decades, synthetic fertilizerconsumption has increased dramatically in Iran. Thishas resulted in nitrate contamination of groundwaterwith concentrations in some aquifers exceeding thedrinking-maximum contaminant level (Jalali 2005,2009). Nitrate leaching was estimated using a simu-lation model in wheat fields of Gorgan province innortheast Iran. It showed considerable amounts ofnitrate leaching (Zeinali et al. 2009).
Irrigation return flow was measured by severallysimeters in wheat and barley fields on Harat plain(central Iran) under the farmers’ traditional man-agement practices (Jafari 2010, Jafari et al. 2012).Annual IRFs and irrigation return flow coefficients(IRFC, percent ratio of IRF to applied water) rangedfrom 2.7 to 265 mm and 0.4 to 30.1%, respectively.These variations were functions of excess appliedwater, border length, management and soil texture.There is no direct measurement of hydrochemicalproperties of IRF in arable areas of Iran. Therefore,these lysimeters were used to measure the salt loads,nitrate concentrations and EC of IRF under the actualtraditional management practices of the farmer.
STUDY AREA DESCRIPTION
The Harat plain is located in Yazd Province, in thecentral region of Iran (Fig. 1). The climate is semi-aridwith average an annual precipitation and temperatureof 110 mm and 18◦C, respectively. The total cultivatedarea is 131 km2 and the main crops are wheat andbarley (52 km2), pistachio and almond (50 km2), corn(7 km2), alfalfa (6 km2) and apricot (3 km2).
The sources of water in the Harat plain are137 wells, three springs and 38 qanats (a qanat is anunderground gallery dug out within the alluvium totransfer water from the aquifer to the ground surface)with total annual discharges of 44, 12 and 21 hm3,respectively. Ninety five percent of the groundwateris used for irrigation. The depth to water table in thisaquifer is about 100 m in the west, decreasing to 5 min the northeast. The overexploitation of groundwater
Dow
nloa
ded
by [
Ein
dhov
en T
echn
ical
Uni
vers
ity]
at 0
2:15
12
Aug
ust 2
013
Hydrochemical characteristics of irrigation return flow in semi-arid regions of Iran 175
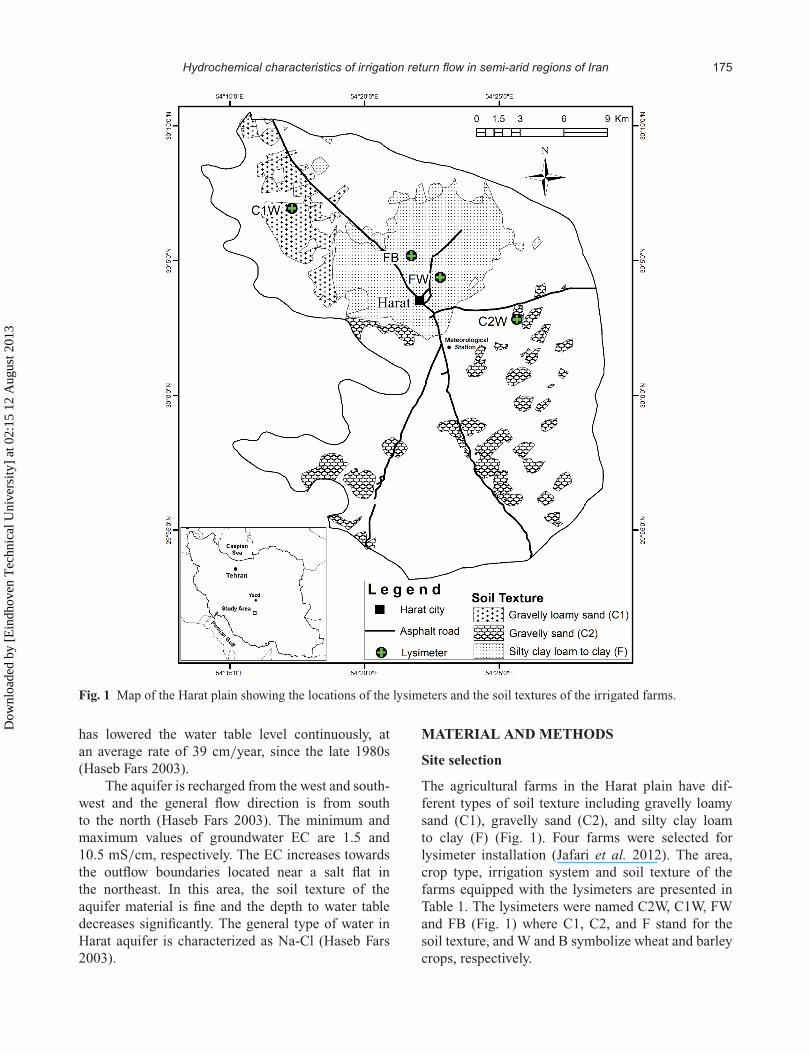
Fig. 1 Map of the Harat plain showing the locations of the lysimeters and the soil textures of the irrigated farms.
has lowered the water table level continuously, atan average rate of 39 cm/year, since the late 1980s(Haseb Fars 2003).
The aquifer is recharged from the west and south-west and the general flow direction is from southto the north (Haseb Fars 2003). The minimum andmaximum values of groundwater EC are 1.5 and10.5 mS/cm, respectively. The EC increases towardsthe outflow boundaries located near a salt flat inthe northeast. In this area, the soil texture of theaquifer material is fine and the depth to water tabledecreases significantly. The general type of water inHarat aquifer is characterized as Na-Cl (Haseb Fars2003).
MATERIAL AND METHODS
Site selection
The agricultural farms in the Harat plain have dif-ferent types of soil texture including gravelly loamysand (C1), gravelly sand (C2), and silty clay loamto clay (F) (Fig. 1). Four farms were selected forlysimeter installation (Jafari et al. 2012). The area,crop type, irrigation system and soil texture of thefarms equipped with the lysimeters are presented inTable 1. The lysimeters were named C2W, C1W, FWand FB (Fig. 1) where C1, C2, and F stand for thesoil texture, and W and B symbolize wheat and barleycrops, respectively.
Dow
nloa
ded
by [
Ein
dhov
en T
echn
ical
Uni
vers
ity]
at 0
2:15
12
Aug
ust 2
013
176 H. Jafari et al.
Table 1 Characteristics of the farms used for lysimeter installation.
Experimentalfarm
Area (m2) Crop type Irrigationsystem
Soil properties∗ Texture† Zone
Gravel Sand Silt Clay
C2W 6800 Wheat Border 56.2 39.2 2.5 2.1 GS C2C1W 40157 Wheat Border 45.6 46.3 7.4 0.7 GLS C1FW 18765 Wheat Border 0 28.7 29.8 41.5 C FFB 2349 Barley Border 0 19.8 41.16 39.04 SiCL F
∗ Particle size distribution as % of total soil mass.† GS: gravelly sand; C: clay; GLS: gravelly loamy sand; SiCL: silty clay loam.
Lysimeter design, installation and operation
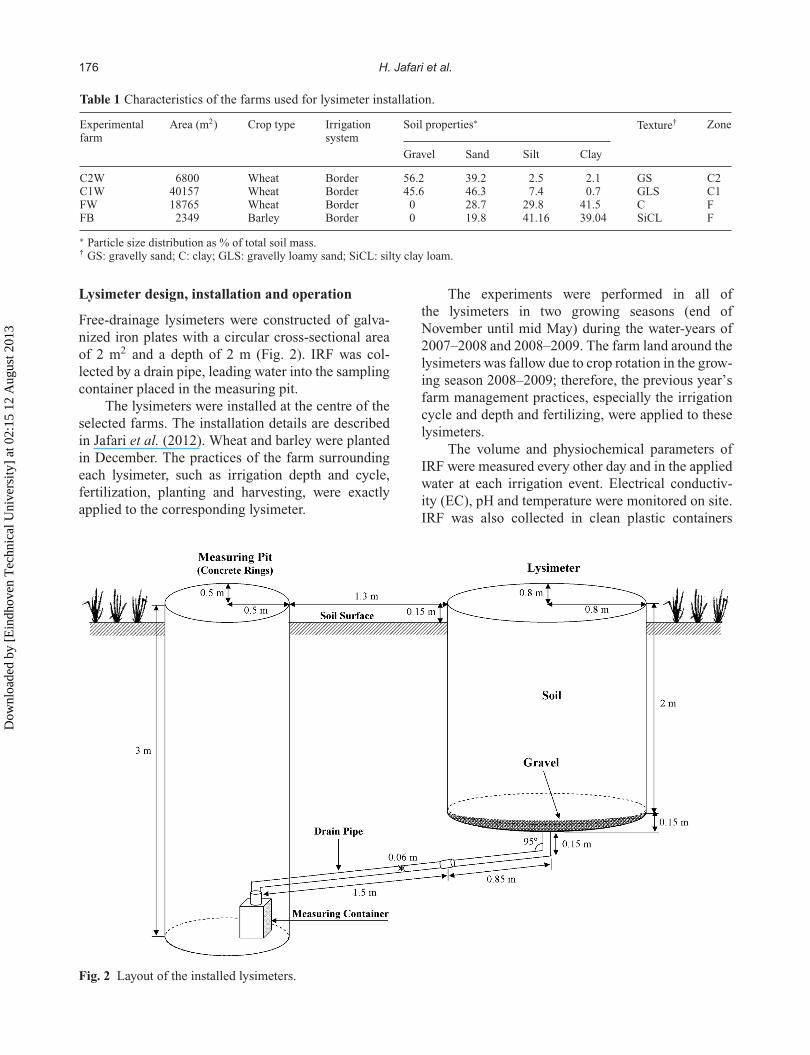
Free-drainage lysimeters were constructed of galva-nized iron plates with a circular cross-sectional areaof 2 m2 and a depth of 2 m (Fig. 2). IRF was col-lected by a drain pipe, leading water into the samplingcontainer placed in the measuring pit.
The lysimeters were installed at the centre of theselected farms. The installation details are describedin Jafari et al. (2012). Wheat and barley were plantedin December. The practices of the farm surroundingeach lysimeter, such as irrigation depth and cycle,fertilization, planting and harvesting, were exactlyapplied to the corresponding lysimeter.
The experiments were performed in all ofthe lysimeters in two growing seasons (end ofNovember until mid May) during the water-years of2007–2008 and 2008–2009. The farm land around thelysimeters was fallow due to crop rotation in the grow-ing season 2008–2009; therefore, the previous year’sfarm management practices, especially the irrigationcycle and depth and fertilizing, were applied to theselysimeters.
The volume and physiochemical parameters ofIRF were measured every other day and in the appliedwater at each irrigation event. Electrical conductiv-ity (EC), pH and temperature were monitored on site.IRF was also collected in clean plastic containers
Fig. 2 Layout of the installed lysimeters.
Dow
nloa
ded
by [
Ein
dhov
en T
echn
ical
Uni
vers
ity]
at 0
2:15
12
Aug
ust 2
013

Hydrochemical characteristics of irrigation return flow in semi-arid regions of Iran 177
and refrigerated at 4◦C until the samples were takento the laboratory for measuring nitrate and majorions. Nitrate concentration was determined by thecadmium reduction method using spectrophotometry.Major ions (HCO3
-, Cl-, SO42-, Na+, K+, Ca2+ and
Mg2+) were measured when sharp variations in ECwere detected (at least once per month). Calcium andmagnesium were measured by titration with EDTA,using Murexide and Eriochrom Black-T as indicators.Sodium and potassium concentrations were deter-mined by flame photometry. Chloride and sulphatewere measured by the Mohr and turbidity methods,respectively. Bicarbonate was determined by titrationwith HCl using methyl orange as the indicator.
The IRFC was calculated by dividing the IRF bythe volume of water applied to the each lysimeter.In this study, the applied water is calculated asthe summation of the irrigation and precipitation.Precipitation data from the Harat meteorological sta-tion were used for all of the lysimeters. The annualprecipitation of the hydrological years (starting20 September) of 2007–2008 and 2008–2009 were18.7 and 74.9 mm, respectively. The rainfall mainlyoccurred during late autumn, winter and early spring.
The fertilizers used on the farms and relatedlysimeters included urea, ammonium nitrate, diammo-nium phosphate, ammonium phosphate and potassiumsulphate. The amounts of N fertilizer applied tolysimeters C2W, C1W, FW and FB were 125, 161,136 and 238 kg ha-1 year-1, respectively.
Salt and nitrogen (NO3-N) loads
Total dissolved solids, or TDS, a measure of all inor-ganic and organic substances dissolved in a liquid,was measured in nine samples of irrigated water and17 samples of IRF by evaporating the samples at105◦C. The relationships between TDS (g/L) and EC(mS/cm) are as follows:
Irrigation water:TDS = 0.77EC − 0.25
R2 = 0.99, n = 9
IRF:TDS = 0.93EC − 0.44
R2 = 0.98, n = 17
The EC of all irrigated water and IRF samples wasconverted into TDS using the above equations. Saltloads were calculated as the product of volume of
irrigation or IRF and TDS on the same day. Theseloads were integrated over the growing season toobtain the annual load.
The N loads of irrigated water and IRF werecalculated as the product of the volume of irriga-tion or IRF and the NO3-N concentrations and wereintegrated over the cropping season to obtain theannual load. The only soluble form of nitrogen inwater considered was nitrate. Other forms of N werenot determined because they are generally negligiblecompared with nitrate (Kengni et al. 1994).
In this study, the concentration coefficient byevapotranspiration (CET) is defined as the ratio ofchloride concentration in the IRF to that in irriga-tion water. Chloride is a conservative ion; it is neitherremoved or supplied significantly by interaction withrocks, nor precipitated as salt until very high salini-ties are reached (Drever 1988). In addition, chlorideis not present in the composition of the applied fertil-izers and amendments. Plants exclude chloride duringwater uptake (Huang and Pang 2010); therefore, CET
can be used to evaluate the evapotranspiration effects.The role of evapotranspiration and other pro-
cesses in the IRF TDS was estimated by a hydrogeo-chemical inverse model developed using PHREEQCI(Parkhurst and Appelo 1999). Assuming the aver-age water chemistry of the applied irrigation waterand IRF as the starting and ending water compo-sitions, the inverse model calculates the moles ofminerals and gases (phases) that must enter or leavesolution to account for the differences in the composi-tion. Reactants (phases) considered were H2O, calcite,halite, gypsum, N-fertilizer, Ca/Na2 and Mg/Na2
cation exchanges, as well as gaseous CO2 and O2. TheH2O was forced into a precipitative state to simulateevapotranspiration.
RESULTS AND DISCUSSION
During lysimeter installation, site conditions (soil,vegetation, etc.) are inevitably disturbed, and, to getback to a stable state, a minimum of one year afterestablishment is needed to obtain accurate waterchemistry data (Adam 2005). The studies showed thatnitrate concentration was very low during the firstyear and varied with no consistent or logical pat-tern relative to the following year. This was probablydue to the disturbance of the site conditions, espe-cially changes in soil biota during the installation ofthe lysimeters. Therefore, the second year’s data aremore representative and only they are discussed in thispaper.
Dow
nloa
ded
by [
Ein
dhov
en T
echn
ical
Uni
vers
ity]
at 0
2:15
12
Aug
ust 2
013
178 H. Jafari et al.
Major ions
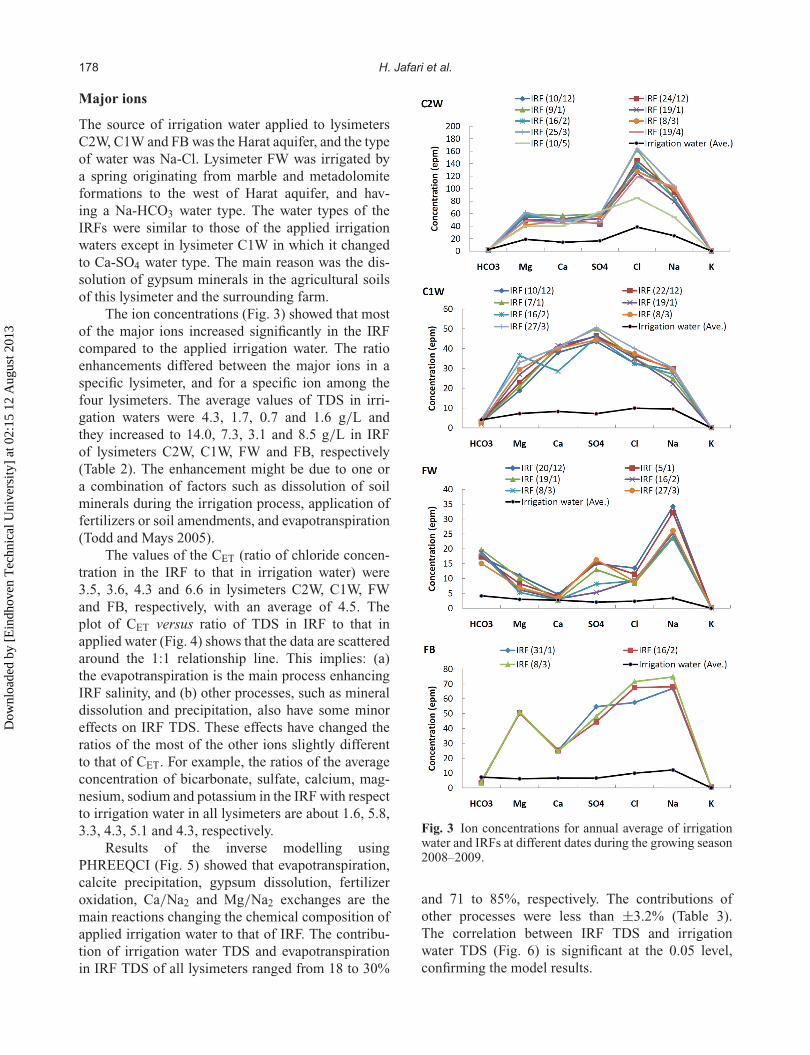
The source of irrigation water applied to lysimetersC2W, C1W and FB was the Harat aquifer, and the typeof water was Na-Cl. Lysimeter FW was irrigated bya spring originating from marble and metadolomiteformations to the west of Harat aquifer, and hav-ing a Na-HCO3 water type. The water types of theIRFs were similar to those of the applied irrigationwaters except in lysimeter C1W in which it changedto Ca-SO4 water type. The main reason was the dis-solution of gypsum minerals in the agricultural soilsof this lysimeter and the surrounding farm.
The ion concentrations (Fig. 3) showed that mostof the major ions increased significantly in the IRFcompared to the applied irrigation water. The ratioenhancements differed between the major ions in aspecific lysimeter, and for a specific ion among thefour lysimeters. The average values of TDS in irri-gation waters were 4.3, 1.7, 0.7 and 1.6 g/L andthey increased to 14.0, 7.3, 3.1 and 8.5 g/L in IRFof lysimeters C2W, C1W, FW and FB, respectively(Table 2). The enhancement might be due to one ora combination of factors such as dissolution of soilminerals during the irrigation process, application offertilizers or soil amendments, and evapotranspiration(Todd and Mays 2005).
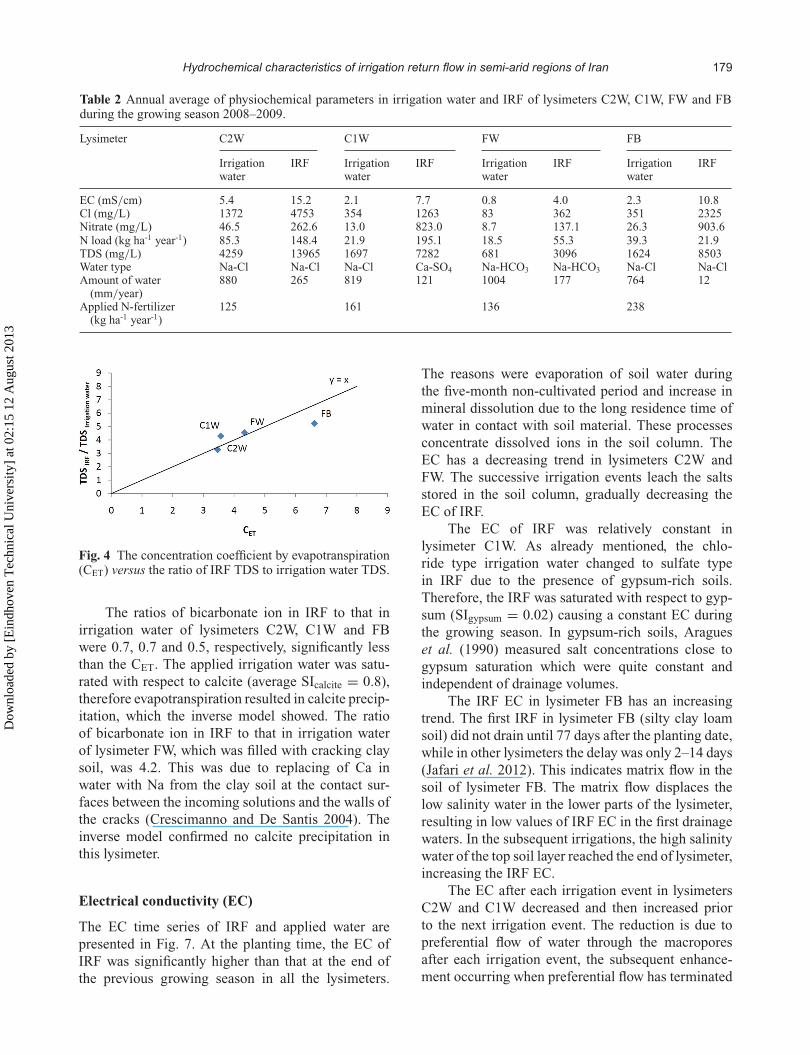
The values of the CET (ratio of chloride concen-tration in the IRF to that in irrigation water) were3.5, 3.6, 4.3 and 6.6 in lysimeters C2W, C1W, FWand FB, respectively, with an average of 4.5. Theplot of CET versus ratio of TDS in IRF to that inapplied water (Fig. 4) shows that the data are scatteredaround the 1:1 relationship line. This implies: (a)the evapotranspiration is the main process enhancingIRF salinity, and (b) other processes, such as mineraldissolution and precipitation, also have some minoreffects on IRF TDS. These effects have changed theratios of the most of the other ions slightly differentto that of CET. For example, the ratios of the averageconcentration of bicarbonate, sulfate, calcium, mag-nesium, sodium and potassium in the IRF with respectto irrigation water in all lysimeters are about 1.6, 5.8,3.3, 4.3, 5.1 and 4.3, respectively.
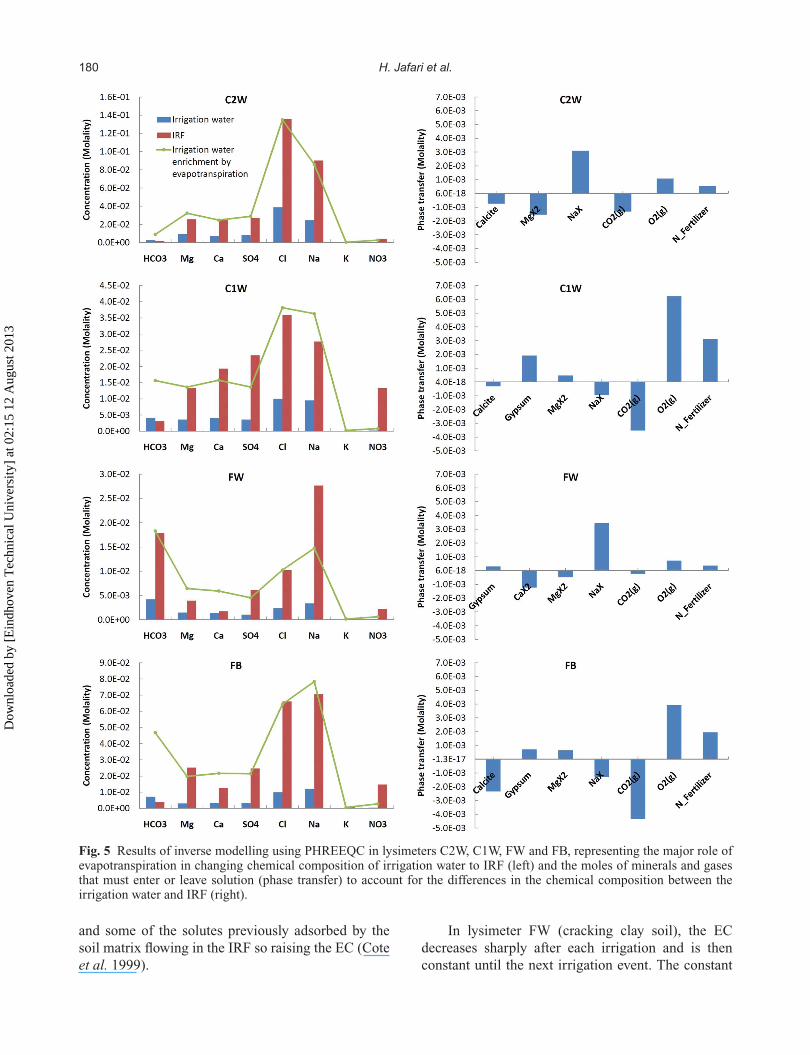
Results of the inverse modelling usingPHREEQCI (Fig. 5) showed that evapotranspiration,calcite precipitation, gypsum dissolution, fertilizeroxidation, Ca/Na2 and Mg/Na2 exchanges are themain reactions changing the chemical composition ofapplied irrigation water to that of IRF. The contribu-tion of irrigation water TDS and evapotranspirationin IRF TDS of all lysimeters ranged from 18 to 30%
Fig. 3 Ion concentrations for annual average of irrigationwater and IRFs at different dates during the growing season2008–2009.
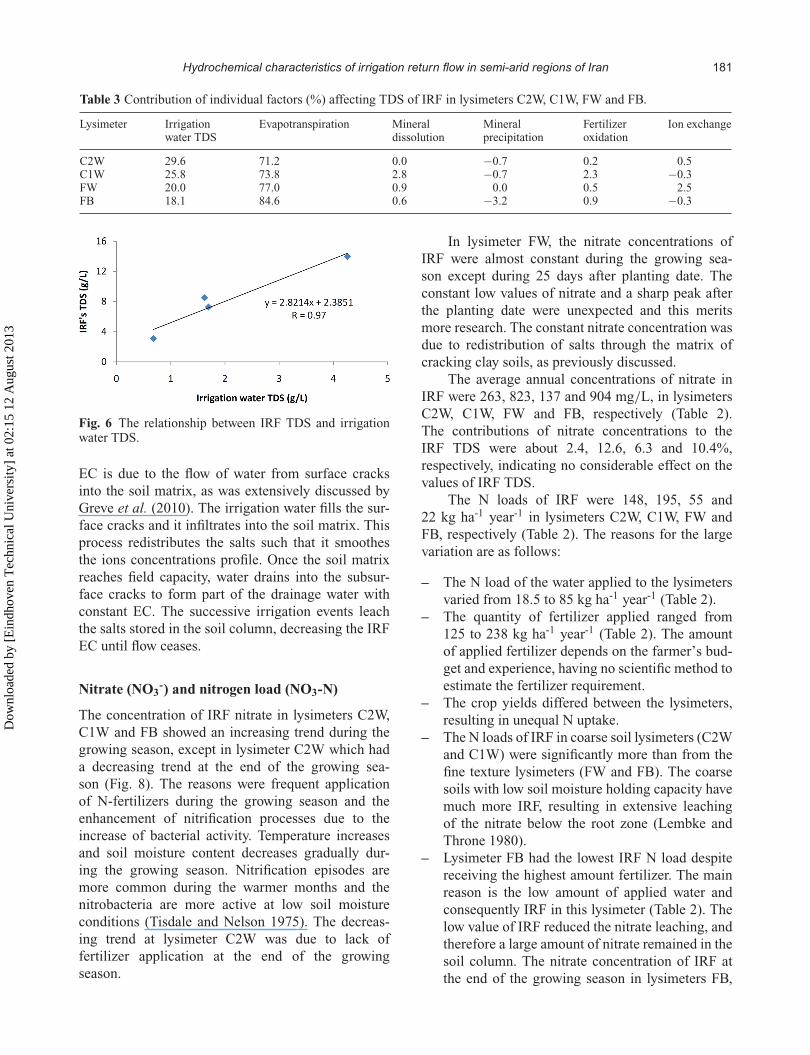
and 71 to 85%, respectively. The contributions ofother processes were less than ±3.2% (Table 3).The correlation between IRF TDS and irrigationwater TDS (Fig. 6) is significant at the 0.05 level,confirming the model results.
Dow
nloa
ded
by [
Ein
dhov
en T
echn
ical
Uni
vers
ity]
at 0
2:15
12
Aug
ust 2
013
Hydrochemical characteristics of irrigation return flow in semi-arid regions of Iran 179
Table 2 Annual average of physiochemical parameters in irrigation water and IRF of lysimeters C2W, C1W, FW and FBduring the growing season 2008–2009.
Lysimeter C2W C1W FW FB
Irrigationwater
IRF Irrigationwater
IRF Irrigationwater
IRF Irrigationwater
IRF
EC (mS/cm) 5.4 15.2 2.1 7.7 0.8 4.0 2.3 10.8Cl (mg/L) 1372 4753 354 1263 83 362 351 2325Nitrate (mg/L) 46.5 262.6 13.0 823.0 8.7 137.1 26.3 903.6N load (kg ha-1 year-1) 85.3 148.4 21.9 195.1 18.5 55.3 39.3 21.9TDS (mg/L) 4259 13965 1697 7282 681 3096 1624 8503Water type Na-Cl Na-Cl Na-Cl Ca-SO4 Na-HCO3 Na-HCO3 Na-Cl Na-ClAmount of water
(mm/year)880 265 819 121 1004 177 764 12
Applied N-fertilizer(kg ha-1 year-1)
125 161 136 238
Fig. 4 The concentration coefficient by evapotranspiration(CET) versus the ratio of IRF TDS to irrigation water TDS.
The ratios of bicarbonate ion in IRF to that inirrigation water of lysimeters C2W, C1W and FBwere 0.7, 0.7 and 0.5, respectively, significantly lessthan the CET. The applied irrigation water was satu-rated with respect to calcite (average SIcalcite = 0.8),therefore evapotranspiration resulted in calcite precip-itation, which the inverse model showed. The ratioof bicarbonate ion in IRF to that in irrigation waterof lysimeter FW, which was filled with cracking claysoil, was 4.2. This was due to replacing of Ca inwater with Na from the clay soil at the contact sur-faces between the incoming solutions and the walls ofthe cracks (Crescimanno and De Santis 2004). Theinverse model confirmed no calcite precipitation inthis lysimeter.
Electrical conductivity (EC)
The EC time series of IRF and applied water arepresented in Fig. 7. At the planting time, the EC ofIRF was significantly higher than that at the end ofthe previous growing season in all the lysimeters.
The reasons were evaporation of soil water duringthe five-month non-cultivated period and increase inmineral dissolution due to the long residence time ofwater in contact with soil material. These processesconcentrate dissolved ions in the soil column. TheEC has a decreasing trend in lysimeters C2W andFW. The successive irrigation events leach the saltsstored in the soil column, gradually decreasing theEC of IRF.
The EC of IRF was relatively constant inlysimeter C1W. As already mentioned, the chlo-ride type irrigation water changed to sulfate typein IRF due to the presence of gypsum-rich soils.Therefore, the IRF was saturated with respect to gyp-sum (SIgypsum = 0.02) causing a constant EC duringthe growing season. In gypsum-rich soils, Aragueset al. (1990) measured salt concentrations close togypsum saturation which were quite constant andindependent of drainage volumes.
The IRF EC in lysimeter FB has an increasingtrend. The first IRF in lysimeter FB (silty clay loamsoil) did not drain until 77 days after the planting date,while in other lysimeters the delay was only 2–14 days(Jafari et al. 2012). This indicates matrix flow in thesoil of lysimeter FB. The matrix flow displaces thelow salinity water in the lower parts of the lysimeter,resulting in low values of IRF EC in the first drainagewaters. In the subsequent irrigations, the high salinitywater of the top soil layer reached the end of lysimeter,increasing the IRF EC.
The EC after each irrigation event in lysimetersC2W and C1W decreased and then increased priorto the next irrigation event. The reduction is due topreferential flow of water through the macroporesafter each irrigation event, the subsequent enhance-ment occurring when preferential flow has terminated
Dow
nloa
ded
by [
Ein
dhov
en T
echn
ical
Uni
vers
ity]
at 0
2:15
12
Aug
ust 2
013
180 H. Jafari et al.
Fig. 5 Results of inverse modelling using PHREEQC in lysimeters C2W, C1W, FW and FB, representing the major role ofevapotranspiration in changing chemical composition of irrigation water to IRF (left) and the moles of minerals and gasesthat must enter or leave solution (phase transfer) to account for the differences in the chemical composition between theirrigation water and IRF (right).
and some of the solutes previously adsorbed by thesoil matrix flowing in the IRF so raising the EC (Coteet al. 1999).
In lysimeter FW (cracking clay soil), the ECdecreases sharply after each irrigation and is thenconstant until the next irrigation event. The constant
Dow
nloa
ded
by [
Ein
dhov
en T
echn
ical
Uni
vers
ity]
at 0
2:15
12
Aug
ust 2
013
Hydrochemical characteristics of irrigation return flow in semi-arid regions of Iran 181
Table 3 Contribution of individual factors (%) affecting TDS of IRF in lysimeters C2W, C1W, FW and FB.
Lysimeter Irrigationwater TDS
Evapotranspiration Mineraldissolution
Mineralprecipitation
Fertilizeroxidation
Ion exchange
C2W 29.6 71.2 0.0 −0.7 0.2 0.5C1W 25.8 73.8 2.8 −0.7 2.3 −0.3FW 20.0 77.0 0.9 0.0 0.5 2.5FB 18.1 84.6 0.6 −3.2 0.9 −0.3
Fig. 6 The relationship between IRF TDS and irrigationwater TDS.
EC is due to the flow of water from surface cracksinto the soil matrix, as was extensively discussed byGreve et al. (2010). The irrigation water fills the sur-face cracks and it infiltrates into the soil matrix. Thisprocess redistributes the salts such that it smoothesthe ions concentrations profile. Once the soil matrixreaches field capacity, water drains into the subsur-face cracks to form part of the drainage water withconstant EC. The successive irrigation events leachthe salts stored in the soil column, decreasing the IRFEC until flow ceases.
Nitrate (NO3-) and nitrogen load (NO3-N)
The concentration of IRF nitrate in lysimeters C2W,C1W and FB showed an increasing trend during thegrowing season, except in lysimeter C2W which hada decreasing trend at the end of the growing sea-son (Fig. 8). The reasons were frequent applicationof N-fertilizers during the growing season and theenhancement of nitrification processes due to theincrease of bacterial activity. Temperature increasesand soil moisture content decreases gradually dur-ing the growing season. Nitrification episodes aremore common during the warmer months and thenitrobacteria are more active at low soil moistureconditions (Tisdale and Nelson 1975). The decreas-ing trend at lysimeter C2W was due to lack offertilizer application at the end of the growingseason.
In lysimeter FW, the nitrate concentrations ofIRF were almost constant during the growing sea-son except during 25 days after planting date. Theconstant low values of nitrate and a sharp peak afterthe planting date were unexpected and this meritsmore research. The constant nitrate concentration wasdue to redistribution of salts through the matrix ofcracking clay soils, as previously discussed.
The average annual concentrations of nitrate inIRF were 263, 823, 137 and 904 mg/L, in lysimetersC2W, C1W, FW and FB, respectively (Table 2).The contributions of nitrate concentrations to theIRF TDS were about 2.4, 12.6, 6.3 and 10.4%,respectively, indicating no considerable effect on thevalues of IRF TDS.
The N loads of IRF were 148, 195, 55 and22 kg ha-1 year-1 in lysimeters C2W, C1W, FW andFB, respectively (Table 2). The reasons for the largevariation are as follows:
– The N load of the water applied to the lysimetersvaried from 18.5 to 85 kg ha-1 year-1 (Table 2).
– The quantity of fertilizer applied ranged from125 to 238 kg ha-1 year-1 (Table 2). The amountof applied fertilizer depends on the farmer’s bud-get and experience, having no scientific method toestimate the fertilizer requirement.
– The crop yields differed between the lysimeters,resulting in unequal N uptake.
– The N loads of IRF in coarse soil lysimeters (C2Wand C1W) were significantly more than from thefine texture lysimeters (FW and FB). The coarsesoils with low soil moisture holding capacity havemuch more IRF, resulting in extensive leachingof the nitrate below the root zone (Lembke andThrone 1980).
– Lysimeter FB had the lowest IRF N load despitereceiving the highest amount fertilizer. The mainreason is the low amount of applied water andconsequently IRF in this lysimeter (Table 2). Thelow value of IRF reduced the nitrate leaching, andtherefore a large amount of nitrate remained in thesoil column. The nitrate concentration of IRF atthe end of the growing season in lysimeters FB,
Dow
nloa
ded
by [
Ein
dhov
en T
echn
ical
Uni
vers
ity]
at 0
2:15
12
Aug
ust 2
013

182 H. Jafari et al.
Fig. 7 Electrical conductivity (EC) time series of appliedwater and IRF for lysimeters C2W, C1W, FW and FBduring the growing season 2008–2009.
C2W and FW were 1200, 200 and 150 mg/L,respectively (Fig. 8), confirming the high storageof N in the soil column of lysimeter FB.
– Lysimeter C1W had the maximum annual IRF Nload, and it was more than the total N input in theapplied irrigation water and fertilizer (Table 2).The main reason may be high release of nitrate
Fig. 8 Time series of nitrate concentration in applied waterand IRF of lysimeters C2W, C1W, FW and FB during thegrowing season 2008–2009.
from organic matter and ammonium fertilizersdue to the effects of gypsum on nitrification.Beneficial effects of gypsum on N mineraliza-tion in soils are thought to be due to stimulationof microorganism activity and/or neutralizationof toxic salts thereby creating a more favourablehabitat (Singh and Taneja 1977).
The percentages of total N inputs (summation ofN load of applied water and fertilizers) lost via IRFwere 71, 100, 36 and 8% in lysimeters C2W, C1W,FW and FB, respectively. The high loss of N sug-gests the need for better management of irrigation
Dow
nloa
ded
by [
Ein
dhov
en T
echn
ical
Uni
vers
ity]
at 0
2:15
12
Aug
ust 2
013
Hydrochemical characteristics of irrigation return flow in semi-arid regions of Iran 183
and fertilization practices, from both economic andenvironmental perspectives.
Salt load
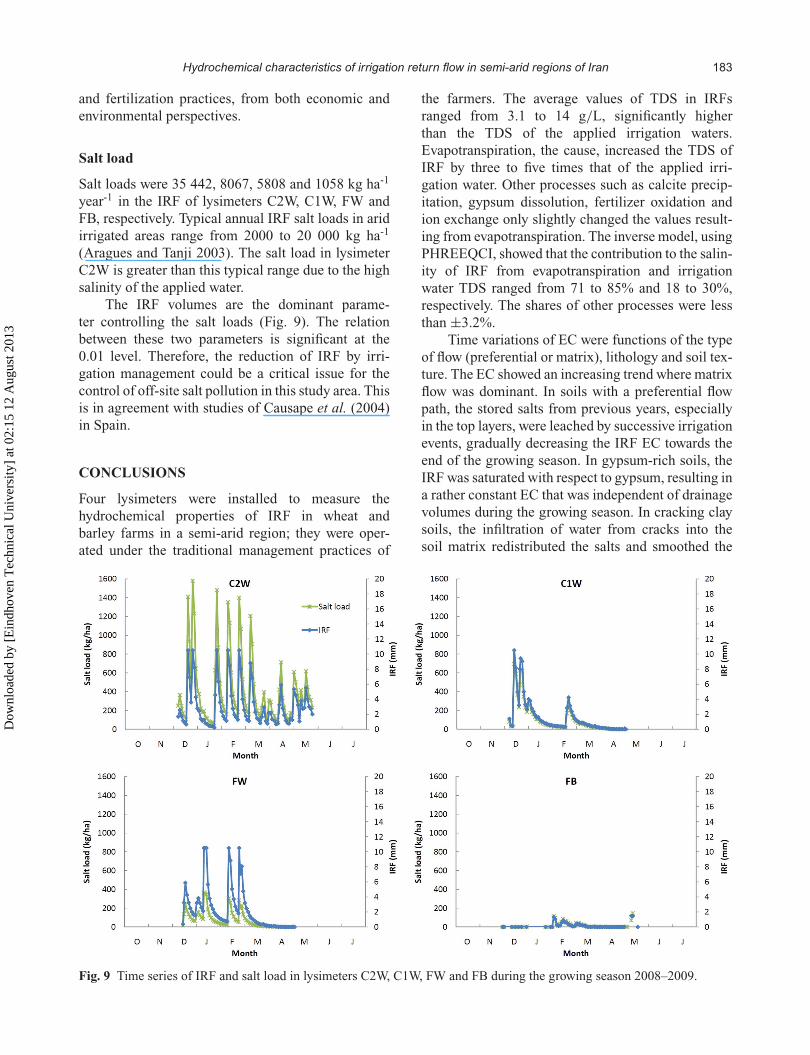
Salt loads were 35 442, 8067, 5808 and 1058 kg ha-1
year-1 in the IRF of lysimeters C2W, C1W, FW andFB, respectively. Typical annual IRF salt loads in aridirrigated areas range from 2000 to 20 000 kg ha-1
(Aragues and Tanji 2003). The salt load in lysimeterC2W is greater than this typical range due to the highsalinity of the applied water.
The IRF volumes are the dominant parame-ter controlling the salt loads (Fig. 9). The relationbetween these two parameters is significant at the0.01 level. Therefore, the reduction of IRF by irri-gation management could be a critical issue for thecontrol of off-site salt pollution in this study area. Thisis in agreement with studies of Causape et al. (2004)in Spain.
CONCLUSIONS
Four lysimeters were installed to measure thehydrochemical properties of IRF in wheat andbarley farms in a semi-arid region; they were oper-ated under the traditional management practices of
the farmers. The average values of TDS in IRFsranged from 3.1 to 14 g/L, significantly higherthan the TDS of the applied irrigation waters.Evapotranspiration, the cause, increased the TDS ofIRF by three to five times that of the applied irri-gation water. Other processes such as calcite precip-itation, gypsum dissolution, fertilizer oxidation andion exchange only slightly changed the values result-ing from evapotranspiration. The inverse model, usingPHREEQCI, showed that the contribution to the salin-ity of IRF from evapotranspiration and irrigationwater TDS ranged from 71 to 85% and 18 to 30%,respectively. The shares of other processes were lessthan ±3.2%.
Time variations of EC were functions of the typeof flow (preferential or matrix), lithology and soil tex-ture. The EC showed an increasing trend where matrixflow was dominant. In soils with a preferential flowpath, the stored salts from previous years, especiallyin the top layers, were leached by successive irrigationevents, gradually decreasing the IRF EC towards theend of the growing season. In gypsum-rich soils, theIRF was saturated with respect to gypsum, resulting ina rather constant EC that was independent of drainagevolumes during the growing season. In cracking claysoils, the infiltration of water from cracks into thesoil matrix redistributed the salts and smoothed the
Fig. 9 Time series of IRF and salt load in lysimeters C2W, C1W, FW and FB during the growing season 2008–2009.
Dow
nloa
ded
by [
Ein
dhov
en T
echn
ical
Uni
vers
ity]
at 0
2:15
12
Aug
ust 2
013

184 H. Jafari et al.
ion concentrations in the soil profile, generating aconstant EC of the IRF.
The nitrate time series indicated a generalincreasing trend towards the end of the growing sea-son. The reasons were the frequent application ofN-fertilizers and the enhancement of the nitrificationprocess due to the increase in bacterial activity. Thegradual temperature enhancement and soil moisturereduction accelerated bacterial activity towards theend of the growing season.
The IRF N-loads varied from 22 to 195 kg ha-1
year-1. These extensive variations were due to thecombination of factors such as different N-loads inthe applied irrigation water, the amounts of fertil-izer applied, the soil texture, the N-uptake by theplants, and the volume of IRF. On average, 55%of the N applied by irrigation and fertilization waslost by IRF, and ultimately transferred to the Harataquifer. The high percentages of N loss indicatemismanagement in agricultural practices, resultingin pollution of groundwater and economic losses.Optimization of fertilizer type, application rate andtiming, and increasing irrigation efficiency are recom-mended for sustainable development of agriculture inthe region. Annual salt loads in the IRF varied from1058 to 35442 kg ha-1 year-1. Salt loads were domi-nantly controlled by the volume of IRF, indicating theimportance of irrigation management to control saltpollution.
Acknowledgement The authors would like toacknowledge the financial support of Yazd RegionalWater Authority and Shiraz University for continuoussupport.
REFERENCES
Adam, M., 2005. Identification of discrepencies on water quantity andquality data according to lysimeter types. 11. GumpensteinerLysimetertagung.
Aragues, R. and Tanji, K.K., 2003. Water quality of irrigation returnflows. In: Encyclopedia of water science. Marcel Dekker Inc.,502–506.
Aragues, R., Tanji, K.K., Quilez, D. and Faci, J., 1990. Conceptualirrigation project hydrosalinity model. Agricultural salin-ity assessment and management. New York: ASCE, ASCEManuals and Reports on Engineering Practice no. 71.
Bergström, L., 1990. Use of lysimeters to estimate leaching ofpesticides in agricultural soils. Environmental Pollution, 67,325–347.
Böhlke, J.K., 2002. Groundwater recharge and agricultural contami-nation. Hydrogeology Journal 10, 153–179.
Causape, J., Quilez, D. and Aragues, R., 2004. Assessment of irriga-tion and environmental quality at the hydrological basin level(II) salt and nitrate loads in irrigation return flow. AgriculturalWater Management, 70, 211–228.
Cavero, J., Beltran, A. and Aragues, R., 2003. Nitrate exported in thedrainage water of two sprinkler irrigated watershed. Journal ofEnvironment Quality, 32, 916–926.
Cote, C.M., Bristow, K.L. and Ross, P.J., 1999. Quantifying the influ-ence of intra-aggregate concentration gradients on solute trans-port. Soil Science Society of America Journal, 63, 759–767.
Crescimanno, G. and De Santis, A., 2004. Bypass flow, salinizationand sodication in a cracking clay soil. Geoderma, 121, 307–21.
Dewandel, B., Ganolfi, J.M., de Condappa, D. and Ahmad, S., 2007.An efficient methodology for estimating irrigation return flowcoefficients of irrigated crops at watershed and seasonal scale.Hydrological Processes, 22, 1700–1712.
Drever, J.I., 1988. The geochemistry of natural waters. Second edi-tion. New Jersey: Prentice Hall.
EC (European Community), 1998. Council directive 98/83/EC o nthe quality of water intended for human consumption. OfficialJournal of the European Communities.
Greve, A., Andersen, M.S. and Acworth, R.I., 2010. Investigationsof soil cracking and preferential flow in a weighing lysimeterfilled with cracking clay soil. Journal of Hydrology, 393 (1–2),105–113.
Hamilton, P.A. and Helsel, D.R., 1995. Effects of agriculture ongroundwater quality in five regions of the United States. GroundWater, 33, 217–226.
Haseb Fars, 2003. Groundwater studies of Harat region and model-ing, Part 2: Geology and hydrogeology, Haseb Fars ConsultingEngineering Company Report [in Farsi].
Huang, T. and Pang, Z., 2010. Estimating groundwater recharge fol-lowing land-use change using chloride mass balance of soilprofiles: a case study at Guyuan and Xifeng in the LoessPlateau of China. Hydrogeology Journal, doi:10.1007/s10040-010-0643-8.
Jafari, H., 2010. Physiochemical characteristics of irrigation returnflow in a semi-arid agricultural region, Iran. Thesis (PhD),Department of Earth Sciences, Shiraz University. Shiraz, Iran.
Jafari, H., Raeisi, E., Zare, M. and Kamgar Haghighi, A.A., 2012.Time series analysis of irrigation return flow in a semi-arid agri-cultural region, Iran. Archives of Agronomy and Soil Science(Arch. Acker. Pfl. Boden), (in press).
Jalali, M., 2005. Nitrates leaching from agricultural land in Hamadan,western Iran. Agriculture, Ecosystems, Environment, 110,210–218.
Jalali, M., 2009. Geochemistry characterization of groundwater inan agricultural area of Razan, Hamadan, Iran. EnvironmentalGeology, 56, 1479–1488.
Keating, B.A. et al., 1996. Leaching of nutrients and pesticides toQueensland groundwaters. In: H.M. Hunter, A.G. Eyles andG.E. Rayment, eds., Downstream effects of land-use. Brisbane:Department of Natural Resources, 151–163.
Kengni, L. et al., 1994. Field measurements of water and nitrogenlosses under irrigated maize. Journal of Hydrology 162, 23–46.
Laegreid, M., Bockman, O.C. and Kaarstad, O., 1999. Agriculture,fertilizers and environment. Wallingford: CAB Internationaland Oslo: Norsk Hydro ASA.
Lembke, W.D. and Thorne, M.D., 1980. Nitrate leaching and irri-gated corn production with organic and inorganic fertilizers onsandy soil. Transactions of the American Society of AgriculturalEngineers, 23, 1153–1156.
Ling, G. and El-Kadi, A.I., 1998. A lumped parameter model fornitrogen transformation in the vadose zone. Water ResourcesResearch, 34, 203–212.
Meisner, R., Rupp, H. and Seyfarth, M., 2008. Advances in outdoorlysimeter techniques. Water, Air and Soil Pollution: Focus, 8,217–225.
Onsoy, Y.S., Harter, T., Ginn, T.R. and Horwath, W.R., 2005. Spatialvariability and transport of nitrate in a deep alluvial vadosezone. Vadose Zone Journal, 4, 41–54.
Dow
nloa
ded
by [
Ein
dhov
en T
echn
ical
Uni
vers
ity]
at 0
2:15
12
Aug
ust 2
013
Hydrochemical characteristics of irrigation return flow in semi-arid regions of Iran 185
Parkhurst, D.L. and Appelo, C.A.J., 1999. User’s guide toPHREEQC (version 2)—a computer program for specia-tion, batch-reaction, one-dimensional transport, and inversegeochemical calculations. US Geological Survey WaterResources Investigations Report, 99-4259.
Singh, B.R. and Taneja, S.N., 1977. Effects of gypsum on min-eral nitrogen status in alkaline soils. Plant Soil, 48 (2),315–321.
Tisdale, S.L. and Nelson, W.L., 1975. Soil fertility and fertilizers.Second edition. New York: Macmillan.
Todd, D.K. and Mays, L.W., 2005. Groundwater hydrology. Thirdedition. New York: John Wiley and Sons, Inc.
USEPA (US Environmental Protection Agency), 2009. National pri-mary drinking water regulations. EPA 816-F-09-0004.
Zhang, W.L., Tian, Z.X. and Li, X.Q., 1996. Nitrate pollutionof groundwater in northern China. Agriculture, Ecosystems,Environment, 59 (3), 223–231.
Zeinali, E., Soltani, A., Galeshi, S. and Movahedi Naeeni, S.A.R.,2009. Estimate of nitrate leaching from wheat fields in Gorgan,of Iran. Research Journal Environmental Science, 3 (6),645–655.
Dow
nloa
ded
by [
Ein
dhov
en T
echn
ical
Uni
vers
ity]
at 0
2:15
12
Aug
ust 2
013