Measuring irrigation performance in Africa
52
IFPRI Discussion Paper 00894 September 2009 Measuring Irrigation Performance in Africa Mark Svendsen Mandy Ewing Siwa Msangi Environment and Production Technology Division
-
Upload
independent -
Category
Documents
-
view
3 -
download
0
Transcript of Measuring irrigation performance in Africa

IFPRI Discussion Paper 00894
September 2009
Measuring Irrigation Performance in Africa
Mark Svendsen Mandy Ewing Siwa Msangi
Environment and Production Technology Division

INTERNATIONAL FOOD POLICY RESEARCH INSTITUTE The International Food Policy Research Institute (IFPRI) was established in 1975. IFPRI is one of 15 agricultural research centers that receive principal funding from governments, private foundations, and international and regional organizations, most of which are members of the Consultative Group on International Agricultural Research (CGIAR).
FINANCIAL CONTRIBUTORS AND PARTNERS IFPRI’s research, capacity strengthening, and communications work is made possible by its financial contributors and partners. IFPRI gratefully acknowledges generous unrestricted funding from Australia, Canada, China, Denmark, Finland, France, Germany, India, Ireland, Italy, Japan, the Netherlands, Norway, the Philippines, Sweden, Switzerland, the United Kingdom, the United States, and the World Bank.
AUTHORS Mark Svendsen External Consultant, Environment and Production Technology Division Email: [email protected] Mandy Ewing, International Food Policy Research Institute Research Analyst, Environment and Production Technology Division Email: [email protected] Siwa Msangi, International Food Policy Research Institute Senior Research Fellow, Environment and Production Technology Division Email: [email protected]
Notices 1 Effective January 2007, the Discussion Paper series within each division and the Director General’s Office of IFPRI were merged into one IFPRI–wide Discussion Paper series. The new series begins with number 00689, reflecting the prior publication of 688 discussion papers within the dispersed series. The earlier series are available on IFPRI’s website at www.ifpri.org/pubs/otherpubs.htm#dp. 2 IFPRI Discussion Papers contain preliminary material and research results. They have not been subject to formal external reviews managed by IFPRI’s Publications Review Committee but have been reviewed by at least one internal and/or external reviewer. They are circulated in order to stimulate discussion and critical comment.
Copyright 2008 International Food Policy Research Institute. All rights reserved. Sections of this material may be reproduced for personal and not-for-profit use without the express written permission of but with acknowledgment to IFPRI. To reproduce the material contained herein for profit or commercial use requires express written permission. To obtain permission, contact the Communications Division at [email protected].

iii
Contents
Acknowledgments v
Abstract vi
1. Introduction 1
2. Indicators 12
3. Summary and Conclusions 39
References 41

iv
LIST OF TABLES
Table 1. Basic descriptive features of Africa and the world. 4
Table 2. Irrigated area. 5
Table 3. Size of full/partial irrigation schemes, reporting countries. 7
Table 4. Agro-ecological zones of Africa 10
Table 5. Institutional framework indicators. 13
Table 6. Water resource utilization indicators. 15
Table 7. Irrigation area indicators. 19
Table 8. Irrigation technology indicators 23
Table 9. Two indicators of agricultural productivity 26
Table 9. Two indicators of agricultural productivity 28
Table 10. Ratio of irrigated and rainfed yields for selected crops in selected countries 29
Table 11. Crop water productivity for irrigated and rainfed crops in kg/m3 (1999–2001 average) 31
Table 12. Poverty and food security 36
List of Figures
Figure 1. Basic monitoring framework. 2

v
ACKNOWLEDGMENTS
Parts of this paper form part of a background paper that was prepared by IFPRI for the World Bank Africa Infrastructure Country Diagnostic and the authors acknowledge the support provided by that project, which made this paper possible. We also gratefully acknowledge the research support of Joseph Green, Puja Jawahar, and Daniel Hawes, whose work provided critical data and analysis that are discussed in this paper and very useful inputs by Mark Rosegrant and Claudia Ringler.

vi
ABSTRACT
The paper develops indicators to look at the performance of the irrigation sector in Sub-Saharan Africa, where demand for food is high and irrigation has a proven potential to boost levels of agricultural productivity. By looking at six indicator categories—institutional framework, water resource use, irrigation area, irrigation technology, agricultural productivity, and poverty and food security—we assess the potential for improving performance in the agricultural food security sector through increasing irrigation sector investments. The indicators on water resource use indicate ample room for further development of the resource. The share of cultivated area equipped for irrigation in Africa is about a third of the world average and just one-sixth of the value for Asia. The low coverage of irrigation technology and the slow rate of growth in coverage clearly represent a lost opportunity for Africa and a tremendous potential for future investment and policy effort. Finally, African countries produce 38 percent of their crops (by value) from approximately 7 percent of their cultivated land on which water is managed, which again suggests that additional investment in irrigation would pay large benefits. The disproportionate contribution to agricultural production of Africa’s small irrigated area suggests that returns on additional investment in irrigation would be high, both in terms of greater food security for the continent and greater production of export-quality agricultural goods.
Keywords: Africa; irrigation performance; agricultural production; water resources

1
1. INTRODUCTION
Continued concern over food security in Africa and a persistent agricultural productivity lag behind other regions have refocused attention on the importance of key investments in the African agricultural sector. Irrigation is an investment that has been promoted persistently by donors, research analysts, and scientists within the international agricultural development community to address that lag. At the same time, irrigation is only one of the productivity-improving capital investments and technological inputs that are deficient in Africa. Others include fertilizer, advanced seed delivery systems, postharvest processing facilities, and access to markets. Irrigation stands out strongly among these, however, because of its role in stabilizing yields in the face of climatic variability, which has increased notably in recent times and is projected to increase further under almost all future climate change scenarios. In addition, much of Africa is expected to experience reduced annual precipitation, which would, along with higher temperatures, enhance the potential productivity-enhancing effects of irrigation.
This paper attempts to collect sector performance indicators to permit cross-country benchmarking and analysis of irrigation sector performance over time for Africa. Indicators are identified and a baseline is provided against which future improvements in infrastructure services can be measured, making it possible to monitor achievements resulting from increased financial flows. The water resource and irrigation sector is defined to include water storage and water distribution infrastructure and includes both large-scale public and small-scale private and communal investments.
Conceptual Framework Although terminology sometimes varies among different organizations, the concepts involved in the hierarchy extending from goals to indicators, and the purpose of each, are fairly standard (Figure 1) At the upper level, a goal presents a broad statement of what an activity hopes to achieve. At the next level, objectives are specific, measurable, appropriate, realistic, and time-bound statements describing in greater detail what the activity defined by the goal hopes to achieve. Objectives do not say how something will be done, only what is to be accomplished. Indicators are variables used to measure achievement of an objective. They are directly related to the objective, measurable, and neutral, in that they do not contain judgments about particular values of the indicator at any given time. They simply provide a way to measure change. That change can then be evaluated against targets established separately for the various indicators. It should be noted that any targets set will be subject to creep as a result of changes induced by global warming, and such exogenous influences will have to be accounted for in any subsequent evaluation based on these indicators.

2
Figure 1. Basic monitoring framework.
It is important that indicators are variables that can change in response to the external interventions. They cannot be static parameters; nor can they be variables not reasonably expected to respond to the intervention.
To use indicators to measure change, it is necessary to know their beginning values, since they usually are non-zero prior to the intervention. In addition to identifying an appropriate set of indicators, this paper also establishes baseline values for those indicators that will allow changes in their values to be assessed.
The overarching goal of irrigation infrastructure and water resource investments in Africa is to reduce hunger and poverty by raising the productivity of agriculture. To achieve this goal, various sectors must play a role, formulating specific objectives. These relate to institutions, the water resource, technology, productivity, and poverty and food security. These topical areas form the framework for the indicators selected for use in the paper.
Although indicators for the higher level of goals and the lower level of activities are also sometimes specified and measured, the current exercise is an indicative one that relates to a general program concept and not to a particular project or specific activities. Consideration of indicators is thus restricted to the intermediate level of an assumed set of objectives for the program.
Methodology In this paper, we assess six thematic areas of importance for tracking irrigation expansion in Africa:
• Institutional framework—by which we try and capture certain key qualitative characteristics of the organization and governance of water and irrigation within the country
• Water resource utilization—where we describe the overall patterns of water usage and water’s availability and distribution within the country
• Irrigated area—an indicator that captures the extent of investment in irrigation
• Irrigation technology—which helps to differentiate between the various types of irrigation and how various countries have been equipped

3
• Agricultural productivity—which is a first-order measure of irrigation performance in agriculture and of the variation of rainfed and irrigated yields across countries
• Poverty and food security—which tries to address the linkage between performance of the agricultural sector and the wider agricultural economy on human welfare indicators
Most of the indicators were drawn from Food and Agriculture Organization (FAO) global databases; data were also drawn from World Bank and IFPRI data sources, although the IFPRI data were used only where constructing useful thematically related indicators from the global databases was impossible. Although a good deal of the data is quantitative, some important information is qualitative, such as the data on the institutional characteristics of the irrigation sector. The performance indicators were selected to provide comprehensive coverage of important aspects of the water resource system and irrigation performance, constrained by data availability and a concern for parsimony. Information on data sources appears in the source notes to the tables.
Despite best efforts, there are gaps in the range of useful performance indicators in the paper. In particular, data on institutional characteristics, such as the pricing of water, are not available. Because it was deemed important to cover the countries in the paper consistently, the subset of indicators selected was restricted to those that could be obtained for comparison across all or nearly all African countries.
Africa in Context The most recent comprehensive water resource and irrigation data of the 53 African countries are from the 2005 AQUASTAT survey conducted by FAO. The final report, titled “Irrigation in Africa in Figures,” provides a general summary of the survey findings and should be referred to for in-depth context. Table 1 presents basic descriptive features of Africa compared with the world for variables concerning water and agriculture. Both Sub-Saharan Africa and Africa as a whole have around one hectare (ha) of cultivated land per person; however, Africa—especially Sub-Saharan Africa—has a much higher population density than the world average (81 inhabitants per square kilometer [km2] in Sub-Saharan Africa versus the world average of 47 inhabitants per km2). Moreover, internal renewable water availability per hectare of land is less than two-thirds of global availability, reflecting both regional scarcity and the transboundary nature of water flows in the region.
A striking difference between Africa and the world as a whole is that African countries withdraw less than half as much water per capita as does the world in general (241 cubic meters per year [m3/year] compared with 599 m3/year). This reflects the fact that African countries irrigate only about 6 percent of their collective cropland, compared with a world average of about 18 percent.
In summary, African countries have less renewable water per unit area and a higher population density than the world as a whole. They have a higher percentage of the population engaged in agriculture (more than half the economically active population) with a slightly smaller average farm size (a little more than one hectare per agricultural worker). They withdraw only a quarter as much water for human uses as does the world as a whole, and the irrigated share of their cropland is less than one-fourth of the world average.

4
Table 1. Basic descriptive features of Africa and the world.
V ar iable Unit W or ld A fr ica Sub-Sahar an A fr ica
Total area 1,000 ha 13,442,788 3,030,967 2,455,678
Cultivated area (2003) 1,000 ha 1,541,488 225,284 197,189
- % of total area % 11 7 8
- per inhabitant ha 0.24 0.25 0.27 - per econ. active person engaged in
agriculture ha 1.16 1.07 1.02
Total population (2005) 1,000 inhab 6,464,452 887,965 732,836
Population density inhab/km2 47 78 81
Rural population as % of total population % 51 60 62
Econ. active population engaged in agriculture % 21 56 —
Precipitation
km3/year 101,736 20,380 19,830 mm/year 1,169 1,045 1,136
Internally renewable water resources km3/year 43,744 5,570 5,463
- per inhabitant m3/year 6,859 6,273 7,455
Total water withdrawals km3/year 3,818 214 120
- agricultural km3/year 2,661 184 105
- % of total water withdrawal % 70 86 87
- domestic km3/year 380 21 13
- % of total water withdrawal % 10 10 11
- industrial km3/year 777 9 4
- % of total water withdrawal % 20 4 3
- in % of renewable water resources % 9 4 2
- per inhabitant m3/year 599 241 163
Irrigation (total area equipped) 1,000 ha 277,285 13,416 7,117
% of cultivated area % 18 6 4
Sources: FAO AQUASTAT database, accessed November 19, 2007 (FAO 2007a), and FAO (2005). Notes: Sub-Saharan Africa includes South Africa. Some or all data missing for British Indian Ocean Territories, Equatorial Guinea, Mayotte, Saint Helena, Seychelles, and Western Sahara. If more than half of the observations were empty, then values were not calculated.
African hydrology is notable for its steep gradients in moisture availability both in the region and in individual countries, particularly in the Sudano-Sahelian and East African regions. As a result, moisture regimes change quickly over fairly short distances, and countrywide averages of moisture conditions mask considerable diversity. Another implication of the steep rainfall gradients is that the regions where rainfall contours are very close together are particularly vulnerable to changes in rainfall resulting from global warming, since changes here are likely to be more extreme.
Irrigated area in Sub-Saharan Africa totals a bit more than 7 million hectares, and about twice that when including northern Africa; individual country areas range from almost none in Lesotho to nearly 3 million hectares, nearly a fifth of the total for Africa, in Egypt. Irrigated areas and the share of the potential developed for individual countries are shown in Table 2.

5
Irrigation potentials, as reported by the FAO (2005) and AQUASTAT databases, reflect area measures reported by individual countries and do not follow a uniform definition. At a minimum, the potential encompasses land resources suitable for irrigation. But it may also reflect water availability or geographical constraints such as distance, slope, land suitability, and other environmental considerations. In all cases, however, the potential includes all land currently under water management (FAO 2005).
Tables 1 and 2 refer only to areas equipped for irrigation and do not incorporate other forms of agricultural water management like non-equipped cultivated wetlands and inland valley bottoms or non-equipped flood recession cropping areas and small-scale peri-urban irrigated agriculture. Getting more information and insights on the performance of those systems will be very important for the development of irrigated agriculture in Africa. Equally important, approximately 20 percent of the area equipped with irrigation is not operational at any one point in time, on average in Africa. Those areas need to be located and constraints to operation in them need to be identified.
Table 2. Irrigated area.
C ountr y I r r igated ar ea (ha) Shar e of ir r igation potential (% )
Algeria 569,418 112 Angola 80,000 2 Benin 12,258 4 Botswana 1,439 11 Burkina Faso 25,000 15 Burundi 21,430 10 Cameroon 25,654 9 Cape Verde 2,780 89 Central African Republic 135 0 Chad 30,273 9 Comoros 130 43 Congo, Dem. Rep. 72,750 15 Congo, Rep. of 2,000 1 Côte d'Ivoire 10,500 0 Djibouti 1,012 42 Egypt 3,422,178 77 Equatorial Guinea — — Eritrea 21,590 12 Ethiopia 289,530 11 Gabon 4,450 1 Gambia, The 2,149 3 Ghana 30,900 2 Guinea 94,914 18 Guinea-Bissau 22,558 8 Kenya 103,203 29 Lesotho 2,637 21

6
Table 2. (Continued) Country Irrigated area (ha) Share of irrigation potential (%) Liberia 2,100 0 Libya 470,000 1175 Madagascar 1,086,291 72 Malawi 56,390 35 Mali 235,791 42 Mauritania 45,012 18 Mauritius 21,222 64 Morocco 1,484,160 89 Mozambique 118,120 4 Namibia 7,573 16 Niger 73,663 27 Nigeria 293,117 13 Rwanda 8,500 5 Sao Tome and Principe 9,700 91 Senegal 119,680 29 Seychelles 260 26 Sierra Leone 29,360 4 Somalia 200,000 83 South Africa 1,498,000 100 Sudan 1,863,000 67 Swaziland 49,843 53 Tanzania 184,330 9 Togo 7,300 4 Tunisia 394,000 70 Uganda 9,150 10 Zambia 155,912 30 Zimbabwe 173,513 47
Source: FAO AQUASTAT database, accessed November 19, 2007 (FAO 2007a).
Irrigated area can be classified by the size of the scheme—small, medium, and large (Table 3). Due to differing criteria for this classification, however, comparisons across countries are difficult. In general, the majority of irrigated area comes from large-scale schemes, with the exceptions of Madagascar and Senegal.

7
Table 3. Size of full/partial irrigation schemes, reporting countries.
C ountr y Y ear Size of scheme C r iter ia (ha) A r ea (ha) T otal ar ea under full/par tial
contr ol (ha)
Algeria 2001 M <500 363,508
513,368 L >500 149,860
Benin 2002
S <50 1,723
10,973 M 50–100 1,328 L >100 7,922
Burkina Faso 2001 S <1,000 8,215
18,600 L >1,000 10,385
Burundi 2000
S <50 800
6,960 M 50–100 500 L >100 5,660
Cameroon 2000
S <20 650
22,450 M 20–200 7,300 L >200 14,500
Chad 2002 S <100 6,538
30,273 L >100 23,915
Congo, Dem. Rep. 1995
S <100 1,480
10,000 M 100–1,000 220 L >1,000 8,300
Cote d'Ivoire 1994 S <1,000 11,750
47,750 L >1,000 36,000
Ethiopia 2001 S <200 191,827
289,530 L >200 97,703
Guinea 2001 S <50 7798
20,386 L >50 125,880
Guinea-Bissau 1996 S <1 661
8,562 M >5 7,901
Kenya 2003
S 5–1,000 48,048
103,203 M 0.5–5,950 427,000 L 213–6,200 12,458
Lesotho 2003 S <100 175
2,637 L >100 2,462
Madagascar 2000
S <200 800,000
1,086,291 M 200–2,500 179,641 L >2500 106,650
Mali 2000
S <100 23,068
97,499 M 100–1000 2,000 L >1000 72,431
Mauritania 2004
S <40 13,655
45,012 M 40–100 16,536 L >100 14,821

8
Table 3. (Continued)
C ountr y Y ear Size of scheme C r iter ia (ha) A r ea (ha) T otal ar ea under full/par tial
contr ol (ha)
Mauritius 2002
S <2 4,548
21,222 M 2–40 328 L >40 16,346
Morocco 2004
S n/a 441,430
1,458,160 M n/a 334,130 L n/a 682,600
Mozambique 2001
S <50 6,389
118,120 M 50–500 19,647 L >500 92,084
Niger 2005 L >25 13,663 13,663
Senegal 2002 S <50 63,000
102,180 L >50 39,180 Seychelles 2003 M 2–70 260 260
Sudan 2000
S <100,000 443,070
1,730,970 M
100,000–500,000 417,150
L >500,000 870,750
Swaziland 2002
S <50 6,419
49,843 M 50–500 10,000 L >500 33,424
Tanzania 2002
S <50 5,533
184,330 M 50–500 71,212 L >500 107,243
Tunisia 2000
S <50 165,000
367,000 M 50–200 79,000 L >200 123,000
Uganda 1998
S <50 100
5,580 M 50–500 680 L >500 4,800
Zambia 2002
S n/a 11,000
55,387 M n/a 7,372 L n/a 37,015
Zimbabwe 1999 S n/a 81,575
173,513 L n/a 91,938
Source: FAO (2005). Notes: In Kenya only, the criteria used to delineate size groupings correspond to the range of sizes under various control regimes: small refers to the range of schemes that smallholders control; medium refers to the range of schemes that are under private commercial control; and large refers to the range of schemes implemented by the National Irrigation Board. “n/a” = no size criteria are available.

9
Agro-ecological Zone Framework The particular characteristics and disposition of irrigation within subregions of the continent take on different characteristics and functions that are suited to the peculiarities of their environment, and that have been adapted to both the socioeconomic conditions and the realities of the agro-ecological zones in which they are found. As a result, it is useful to present the FAO subregional classifications to describe the various agro-ecological environments found within the continent. These are summarized in Table 4.
Using these classifications, we can discuss the particular characteristics of irrigation potential and purpose in the relevant regions of Africa more easily and can relate them to the irrigation potential and outcomes that are found within those regions.
Northern Region
The region inhabited north of the Saharan desert includes five countries, each with access to the Mediterranean coast: Morocco, Algeria, Tunisia, Libya, and Egypt. The countries constitute the second largest region in Africa in terms of land area, accounting for 19 percent of total area in Africa. In terms of cultivable area, however, the northern region has the least amount of area when compared with other mainland regions (the Indian Ocean island region technically has the least). The relatively low availability of cultivable land reflects the level of precipitation in the region, which ranges from 750 millimeters in the extreme northwest of Morocco to nearly zero millimeters in the south of Egypt (FAO 2005).
Sudano-Sahelian Region
The characteristics of this region are largely dominated by Sudan, which covers 29 percent of the area and has employed traditional irrigation systems for a very long time—prior to the installation of modern storage and diversion schemes adopted in the early 20th century (FAO 1986). The Sudan has traditionally used irrigation for sustaining its cotton crop and has fairly large irrigation systems that draw most of its water (up to 95 percent) from the Nile, with a small fraction coming from groundwater or other sources. The climate of this region is generally dry, and the country itself has the lowest density of people on the continent—on the order of 13 inhabitants/km2 (FAO 2005).
Other countries in this region with significant water diversions for irrigation are those in the Senegal River basin or in other large river basins (Lake Chad basin). These countries are characterized by some nomadic pastoralism, but they also grow and irrigate cereals, including rice, as well as millet and sorghum. Although extensive irrigation and large projects have not reached beyond the Sudan, successful schemes on a significant scale have given sustenance to food and cash crops. A number of the countries in the region are landlocked, including Burkina Faso, Chad, Mali, and Niger.

10
Table 4. Agro-ecological zones of Africa
R egion C ountr ies in zone
Northern Algeria, Egypt, Libya, Morocco, Tunisia
Sudano-Sahelian Burkina Faso, Cape Verde, Chad, Djibouti, Eritrea, The Gambia, Mali, Mauritania, Niger, Senegal, Somalia, Sudan
Eastern Burundi, Ethiopia, Kenya, Tanzania, Uganda, Rwanda
Gulf of Guinea Benin, Côte d’Ivoire, Ghana, Guinea, Guinea-Bissau, Liberia, Nigeria, Sierra Leone, Togo
Central Angola, Cameroon, Central African Republic, Congo (Rep. of), Dem. Rep. of Congo, Equatorial Guinea, Gabon, Sao Tome and Principe
Southern Botswana, Lesotho, Malawi, Mozambique, Namibia, South Africa, Swaziland, Zambia, Zimbabwe
Indian Ocean Islands Comoros, Madagascar, Mauritius, Seychelles
Source: FAO (2005).
Eastern Africa Region
Of the six countries in this region (Ethiopia, Kenya, Rwanda, Uganda, Tanzania, and Burundi), four are landlocked; only Kenya and Tanzania have access to the sea. On average, 37 percent of the total arable area is actually under production, with large areas in the arid zones (which makes up 70 percent of Kenya’s total area, for example) being unusable for agriculture and only marginally usable for livestock. While parts of this region, especially near the inland lakes (such as Victoria), are relatively fertile and well watered, many other parts are of a more fragile agro-ecology.
Given the diverse climate and terrain, irrigation has played an important part in boosting the agricultural performance of cash crops in Ethiopia and Kenya, although the vast majority of the food crops grown in these countries are rainfed.
Gulf of Guinea Region
Nigeria accounts for 44 percent of the total area (2.1 million km2) of this region. Bordered by the Atlantic Ocean to the south and the Sudano-Sahelian region to the north, there is a considerable degree of climatic variation along the north-south axis of all the countries within this region—from the wet and tropical in the south to the dry Sudan in the north. Given this, precipitation varies significantly between the north and the south, which makes country-level averages somewhat misleading when trying to gauge the extent to which agricultural areas are served by climate-driven water resources. The variation of rainfall within a country such as Benin, for example, is just over 1,000 millimeters per year, and the evapotranspiration of crops also increases considerably (almost quadrupling from 1,500 millimeters per year in the south of Togo to northern Nigeria). This creates a varied scope for irrigation within this region, with some areas experiencing much more severe water stress than others.
Central Africa Region
Relative to the previous three regions, this area of Africa is relatively well supplied with water resources, although there is variation from tropical dry or wet environments to the equatorial. Of the population that lives within all the eight countries covered by this region, 56 percent live within the Democratic Republic of Congo. The region also has fairly low population densities when compared with other regions of Africa (going as low as five inhabitants per km2 in Gabon). This region typifies the general imbalance of groundwater resources that exists within Africa, as most groundwater resides in the Congo Basin, with relatively high levels of precipitation and relatively low levels of irrigation demand, compared with other agricultural regions within Africa (Giordano 2005).

11
Southern Africa Region
This region contains some prominent desert areas but is also bordered by oceans to the west, south, and east—which provide a moderating influence to coastal areas—and has close to Mediterranean conditions in areas like the Cape of Good Hope. The inland areas vary from scrub-desert terrains to more moderate environments at higher altitudes, as well as tropical and subtropical areas elsewhere. Given the wide north-to-south transept of this region, there is a wide variety of precipitation and water availability, from the more humid areas like Malawi to the drier climes of Namibia. The agro-ecological conditions, and crop evapotranspiration, as a result, also see a wide variation from moist regions like Mozambique, which has favorable areas for sugarcane and other tropical agriculture, to other areas like South Africa, which are better suited for dryland agriculture—especially in the absence of irrigation.
Indian Ocean Islands
The single island of Madagascar represents 99 percent of the area that would fall into this classification (including that of Comoros, Mauritius, and Seychelles). Even across the island of Madagascar itself conditions vary from that of semi-arid to tropical humid, which gives it a variety of growing conditions for agriculture. Madagascar also has a relatively low population density (34 inhabitants/km2) compared with some of the other smaller islands (some of which exceed 400 inhabitants/km2). Compared with the rest of these islands, Madagascar also dominates in terms of cultivated area in the region (3.8 million hectares).

12
2. INDICATORS
Institutional Framework A country’s institutional framework specifies the location of investment planning and implementation responsibilities; designates the managing entity, or set of entities, for irrigation system operations; defines regulatory authorities; specifies revenue assessment and collection procedures; establishes dispute resolution processes; and assigns responsibility for allocating and protecting water rights.
However, no database consolidates this information for the countries of Africa. Moreover, from a performance assessment point of view, it is often difficult to specify in the abstract what desirable changes in the institutional framework would look like. That is to say, it is difficult to specify an “ideal” or “preferred” institutional framework without considering a particular country context and taking into account the characteristics of that context.
Nevertheless, some broadly accepted principles provide a standard for judging the desirability of particular institutional configurations. These principles change from time to time as experience accumulates, as conditions change globally, and as the focus of the development community shifts. Currently, some widely accepted principles of good water resource development and management are the following:
• Integrated water resource planning
• A closed financing loop, from service user to service provider
• Beneficiaries sharing in the costs of irrigation development
• Separating water resource management functions from sector management
• Farmers’ involvement, and especially women farmers’ involvement, in irrigation management
• Organizing irrigation along hydrologic boundaries
• Secure water rights
In contrast to these values or principles, specific institutional configurations are often indeterminate, meaning that it is impossible to make abstract normative judgments about important considerations, such as
• how large irrigation management units should be;
• which particular system of water rights is best;
• how much regulation should be imposed on irrigation service providers;
• how much decision-making authority should be lodged at a given level; and
• whether a river basin management organization with command and control authority is always necessary.

13
Table 5. Institutional framework indicators.
C ountr y W ater policy?**
Specialized agency for basin-level
management?
Dedicated ir r igation infr astr uctur e
development entity?
E mpower ment of W ater User A ssociations?
I r r igation str ategy?**
I r r igation action
plan?**
Algeria Yes No Yes No Yes No Angola Ongoing No No No Ongoing No Benin Yes No No Yes No No Botswana Yes No No No No No Burkina Faso Yes No No Yes Yes Yes Burundi Ongoing No No No No Yes Cameroon** Yes No No Yes Yes Yes Cape Verde Ongoing No No No No No Central African Republic Yes No No No No Yes Chad Yes No No Yes No No Comoros Yes No No No No Yes Congo, Dem. Rep. Yes No No No No No Congo, Rep. of Yes No Yes Yes No Yes Cote d'Ivoire Yes No No No Yes Yes Djibouti Yes No Yes No No Yes Egypt** Yes Yes Yes Early stage Yes Yes Equatorial Guinea No No No No No Yes Eritrea No No No No No No Ethiopia** Yes Yes Yes Yes Yes Yes Gabon Ongoing No No No No No Gambia, The No No No Yes No No Ghana Yes No No No Yes No Guinea Yes No No Yes Ongoing Ongoing Guinea-Bissau Yes No Yes Yes No No Kenya Yes Yes No Yes No No Lesotho Yes No No Yes No No Liberia No No No No No No Libya** Yes No No No Yes Yes Madagascar Yes Yes No Yes Yes Yes Malawi** Yes No No Yes Yes No Mali Yes Yes No No Yes Yes Mauritania Yes Yes Yes Yes Yes Yes Mauritius Yes No Yes Yes No No Morocco Yes Yes Yes Yes Yes Yes

14
Table 5. (Continued)
C ountr y W ater policy?**
Specialized agency for basin-level
management?
Dedicated ir r igation infr astr uctur e
development entity?
E mpower ment of W ater User A ssociations?
I r r igation str ategy?**
I r r igation action
plan?**
Mozambique** Yes Yes No No No No Namibia** Yes No No Yes No No Niger Yes Yes No Yes No No Nigeria** Yes Yes No Yes Yes Yes Rwanda Yes No No No No No Sao Tome and Principe No No No No No No Senegal Yes Yes No Yes No No Seychelles Yes No Yes No No No Sierra Leone No No Yes No No No Somalia No No No No No No South Africa Yes Yes Yes Yes Yes Yes Sudan** Yes No No Yes Yes Yes Swaziland** Yes No No No No No Tanzania** Yes Yes Yes Yes Yes No Togo Ongoing No No No No Yes Tunisia Yes No Yes Yes Yes Yes Uganda** Yes No Yes Yes No No Zambia** Yes No No No Yes Yes Zimbabwe Yes No Yes No No No
Sources: The country responses for each of the questions and countries marked with double asterisks (**) are from the unpublished report of a workshop organized by World Bank Water and Food Group in Ouagadougou, Burkina Faso, March 2007. All other answers are interpreted from country profiles in FAO (2005).
This is not to say that we have no knowledge that would help us to make such choices, but rather that the right configuration in a particular country, and the correct pathway to reach that configuration, is country and time specific. This makes it very difficult to define a set of regionwide indicators that can be used to measure “progress” in institutional change resulting from an irrigation investment program.
Nevertheless, an interim set of indicators was formed based on a workshop in Ouagadougou organized by the World Bank Water and Food Group in March 2007, which produced some useful information relating to institutional characteristics in a sample of countries. Participants from 28 African countries attended and were queried about the development of water and irrigation policies, as well as irrigation action plans (Table 5). This information was expanded to all countries in Africa using the survey of institutional frameworks for irrigation development found in country profiles from the AQUASTAT survey of Africa (FAO 2005). In addition to those asked at the workshop, three additional questions were formulated that attempt to demonstrate the level of specialization and decentralization that is found in the management of irrigation resources in each country (see Table 5, questions 2–4). Again, these questions are not based on a sound theoretical model that links certain institutional arrangements with sound outcomes. For example, a “yes” value across the table is not a sufficient condition for good irrigation performance outcome—as likely Ethiopia, Mauritania, South Africa, and Tanzania make up a varied group in terms of sector performance despite receiving the same responses. Another limitation of

15
these questions is that they convey neither the length of time over which these institutional characteristics have held nor their specific quality (except for a few responses shown, such as “early stage” and “ongoing”). Finally, some responses might be reflections of reforms pushed by donors that may not reflect a change in the paradigm of water management within the country—or that might be so in the future but haven’t yet taken hold. Therefore, at the moment, all we can note is whether certain elements are “in place” that might at least provide a starting point for good sector performance in the future—even if we cannot tie it to concrete outcomes in the past (as observed in data).
So additional effort is needed to think through the question of whether it is possible to specify a set of reliable indicators that would measure progress in the evolution of national water-related institutional frameworks in Africa, and if so, what those indicators would be.
Water Resource Utilization This section identifies indicators that help us assess the impact of increased investments in irrigation. It also documents the current utilization and reliability of water resources for agriculture in African countries as a basis for future assessments of change.
Irrigation investment can be expected to do several things: It may expand the area under irrigation and increase the amount of water used in irrigated agriculture. It may also make supply more reliable by providing increased storage of surface water in reservoirs. This in turn may benefit other water-using sectors as well as agriculture. Like surface water reservoirs, groundwater aquifers may also serve to buffer fluctuations in the supply of irrigation water. The four indicators selected to measure changes in this area are described below. Indicator values for Africa as well as comparable values for other national groupings are shown in Table 6.
Table 6. Water resource utilization indicators.
C ountr y
T otal water withdr awals
as % of T A R W R
T otal agr icultur al
water withdr awals as % of T A R W R
T otal dam capacity /
total sur face water (% )
T otal dam capacity
(m3/capita)
G r oundwater development
(abstr action as % of r echar ge)
Algeria 52.0 33.8 59.2 183 170.6 Angola 0.2 0.1 5.0 280 0.0 Benin 0.5 0.2 0.2 6 — Botswana 1.6 0.7 3.6 215 4.5 Burkina Faso 6.2 5.5 63.8 370 — Burundi 2.3 1.8 — 0 — Cameroon 0.3 0.3 5.5 925 — Cape Verde 7.3 6.7 — — — Central African Republic 0.0 0.0 — 0 — Chad 0.5 0.4 — — 0.9 Comoros 0.8 0.4 — 0 — Congo, Dem. Rep. 0.0 0.0 — n/a — Congo, Rep. of 0.0 0.0 0.0 2 0.0 Côte d'Ivoire 1.1 0.7 48.7 679 —

16
Table 6. (Continued)
C ountr y
T otal water withdr awals
as % of T A R W R
T otal agr icultur al
water withdr awals as % of T A R W R
T otal dam capacity /
total sur face water (% )
T otal dam capacity
(m3/capita)
G r oundwater development
(abstr action as % of r echar ge)
Djibouti 6.3 1.0 — 0 Egypt 117.2 101.2 301.8 2,283 407.7 Equatorial Guinea 0.4 0.0 — 0 — Eritrea 9.2 8.7 1.6 21 — Ethiopia 5.1 4.7 3.2 47 — Gabon 0.1 0.0 0.2 159 0.0 Gambia, The 0.4 0.3 — 0 — Ghana 1.8 1.2 286.1 6,802 — Guinea 0.7 0.6 1.0 200 — Guinea-Bissau 0.6 0.5 — 0 — Kenya 9.0 7.2 13.7 124 15.0 Lesotho 1.7 0.3 93.3 1,569 3.0 Liberia 0.0 0.0 — 0 — Libya 721.0 597.3 385.0 66 528.6 Madagascar 4.4 4.2 0.1 27 8.7 Malawi 5.8 4.7 0.2 3 2.5 Mali 6.5 5.9 17.0 1,007 0.5 Mauritania 14.9 13.2 8.0 290 293.3 Mauritius 26.4 17.8 5.0 75 14.9 Morocco 43.4 38.0 84.7 511 29.8 Mozambique 0.3 0.3 30.3 3,307 0.2 Namibia 1.7 1.2 4.5 349 6.7 Niger 6.5 6.2 0.3 8 5.2 Nigeria 2.8 1.9 15.8 339 — Rwanda 2.9 2.0 — — — Sao Tome and Principe 0.3 — 1.8 248 — Senegal 5.6 5.2 4.3 151 3.3 Seychelles — — — 12 — Sierra Leone 0.2 0.2 0.2 40 0.0 Somalia 22.4 22.3 — 0 9.1 South Africa 25.0 15.7 59.3 629 59.3 Sudan 57.8 55.9 14.1 251 4.0 Swaziland 23.1 22.3 15.2 567 — Tanzania 5.7 5.1 4.8 109 0.4

17
Table 6. (Continued)
C ountr y
T otal water withdr awals
as % of T A R W R
T otal agr icultur al
water withdr awals as % of T A R W R
T otal dam capacity /
total sur face water (% )
T otal dam capacity
(m3/capita)
G r oundwater development
(abstr action as % of r echar ge)
Togo 1.1 0.5 19.0 278 — Tunisia 57.5 47.1 85.2 253 39.2 Uganda 0.5 0.2 — — — Zambia 1.7 1.3 100.8 9,599 0.4 Zimbabwe 21.0 16.6 735.7 7,917 7.8 Northern 267.5 218.6 203.8 540 306.7 Sudano-Sahelian 22.8 21.8 9.7 270 38.1 Eastern 5.6 4.9 5.5 78 3.1 Gulf of Guinea 1.7 1.2 47.1 1,049 0.0 Central 0.1 0.1 1.7 156 0.0 Southern 9.2 6.2 99.0 2,999 17.8 Indian Ocean Islands 4.5 4.2 0.1 27 8.7 SSA average 1.5 1.3 11.2 838 17.5 Africa average 3.8 3.3 14.6 780 72.9 Asia average 19.4 15.8 12.0 870 — World average 7.4 5.2 7.6 1,031 —
Sources: Columns 1–4, FAO AQUASTAT database November 12, 2007 (FAO 2007a)[Perhaps it would be best to identify the date you accessed the database (as you did in Table 1.1) and to give the parenthetical citation--i.e., FAO 2007a)]; column 5, Global Groundwater Information System (GGIS), v. 23 (2004), accessed at www.igrac.nl. Notes: Total water withdrawals = water withdrawn for agriculture, domestic, and industrial purposes. TARWR = total actual renewable water resources, the sum of internal and external renewable water resources, taking into consideration the quantity of flow reserved for upstream and downstream countries through formal agreements or treaties and reduction of flow due to upstream consumption. Dam capacity = total cumulative capacity of large dams expressed as theoretical initial capacity, without adjustment for silting or other changes over time. Total surface water = TARWR less groundwater. Weighted averages are calculated by dividing the sum of the numerator by the sum of the denominator. Agro-ecological zone averages are weighted by country area. Africa average does not include Western Sahara and island countries not in the study. — = data not readily available.
Total Water Withdrawals
Total water withdrawals for all uses as a percentage of the total renewable water resources of the country considers both ground and surface water, and total renewable water resources include inflows from upstream riparian countries and deduct obligated outflows to downstream riparian environments. The indicator thus shows the fraction of the renewable water resources of the country that is presently being withdrawn for human use.
Total water withdrawals across the region are very low, averaging just 3.8 percent of available supply. The northern countries of Libya, Egypt, Morocco, and Tunisia dwarf all other countries in this regard. In Sub-Saharan Africa, South Africa with its large commercial irrigation sector, urban conglomerations, and well-developed industrial base and Sudan with its vast Gezira scheme stand out.1
1 Throughout the analysis we have weighted the averages in the indicator tables in order to account for the large share of the
sector represented by countries in the northern region, Sudan, South Africa, and Madagascar, among other outliers.

18
By contrast, total withdrawals in Asia comprise almost one-fifth of available water (19.4 percent). The world average (7.4 percent) is nearly double the level for Africa.
Water resource investments should increase the value of this indicator, particularly if investments are directed at irrigation, since irrigation usually consumes the lion’s share of withdrawals. At the same time, investments in water-storage and large-scale conveyance facilities can also provide the basis for increased withdrawals for municipal and industrial water supplies.
Obviously if values of this indicator become very large, severe environmental damage would be expected. Moreover because countrywide averages subsume wide diversity, local-level assessments are obviously required as well. The generally low values of this indicator suggest, however, scope for additional withdrawals to support rural livelihoods, food security, and economic growth.
Agricultural Water Withdrawals
This indicator measures the amount of water withdrawn for agricultural uses as a percentage of total renewable water resources. This value will always be less than the value for the total water withdrawal indicator, since that indicator also includes municipal and industrial use. This indicator value should rise strongly and directly in response to investments in irrigation development.
The picture for agricultural withdrawals is similar to that for total withdrawals, with Egypt, Libya, and Sudan again standing out dramatically from a low overall average. Low agricultural withdrawals in the humid central Africa region are understandable given the wider scope in the region for rainfed agriculture.
The Asian value of this indicator is five times that of Africa; the world value is one-third greater.
Storage Capacity
Storage smoothes variability in river discharges and gives managers greater control over allocating water among different sectors and users and with different temporal rainfall patterns. This indicator is the ratio of total reservoir capacity in the country to the total renewable annual surface water resource. It measures the amount of surface water available to the country that can be stored for later use. The average for Africa is about 15 percent of average annual discharge. For comparison, dams in the Colorado River Basin in the United States help store about 400 percent of the Colorado’s average annual discharge. The storage ratio will obviously respond directly to investments that create new storage. Another good indicator of reliability of water supply would be a ratio of high flow to low flow in the river throughout the year. Unfortunately, data are not readily available to compute this indicator.
The reservoir capacity ratio of the region is actually higher than the average for either Asia or the world as a whole. Capacity, though, is concentrated in few countries—Egypt, Ghana, Libya, Zambia, Lesotho, South Africa, and Zimbabwe—when reckoned as a share of available surface water. In some cases, Zambia and Lesotho for example, this capacity is used largely for hydropower generation as shown by the relatively small fraction of the water resource withdrawn for agriculture in these countries. The lack of storage in the Central African region, which has considerable hydropower potential, results from the relative abundance of supply, relatively low population density, and densely forested and difficult terrain. Note that of the 25 largest rivers in the world, only three are situated in Africa. Similar trends between the countries are shown by calculating total dam capacity per person, with Ghana, Zimbabwe, and Zambia dominating the shares. The quality of data reported in the FAO AQUASTAT database suggests further reviews of storage data.
Groundwater Abstraction
This indicator measures the amount of groundwater pumped as a percentage of total renewable groundwater in the country. Data in this column are somewhat sparse because only a little over half of the countries report values. With the exception of northern Africa, Mauritania, and South Africa, all the values are very small and therefore suggest potential for much greater development. Shallow groundwater
19
aquifers are good water sources for individual and small community irrigation systems; where such types of irrigation development are targeted, this indicator is expected to increase.
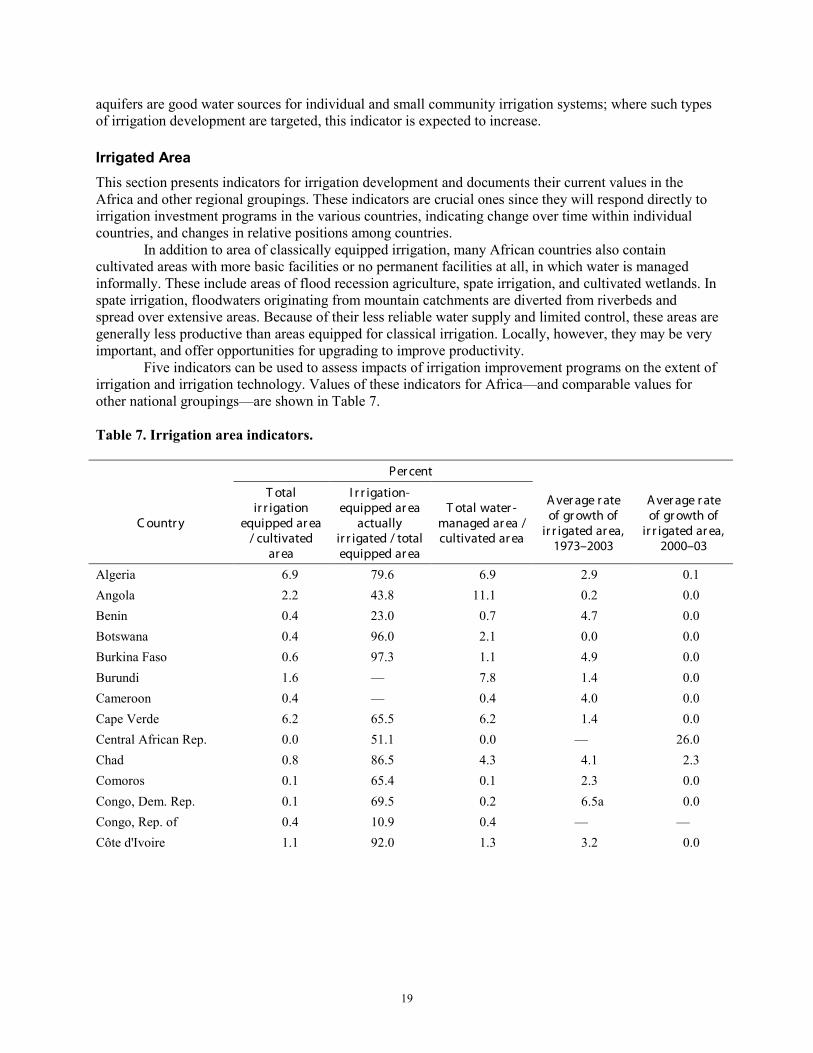
Irrigated Area This section presents indicators for irrigation development and documents their current values in the Africa and other regional groupings. These indicators are crucial ones since they will respond directly to irrigation investment programs in the various countries, indicating change over time within individual countries, and changes in relative positions among countries.
In addition to area of classically equipped irrigation, many African countries also contain cultivated areas with more basic facilities or no permanent facilities at all, in which water is managed informally. These include areas of flood recession agriculture, spate irrigation, and cultivated wetlands. In spate irrigation, floodwaters originating from mountain catchments are diverted from riverbeds and spread over extensive areas. Because of their less reliable water supply and limited control, these areas are generally less productive than areas equipped for classical irrigation. Locally, however, they may be very important, and offer opportunities for upgrading to improve productivity.
Five indicators can be used to assess impacts of irrigation improvement programs on the extent of irrigation and irrigation technology. Values of these indicators for Africa—and comparable values for other national groupings—are shown in Table 7.
Table 7. Irrigation area indicators.
Per cent
C ountr y
T otal ir r igation
equipped ar ea / cultivated
ar ea
I r r igation-equipped ar ea
actually ir r igated / total equipped ar ea
T otal water - managed ar ea / cultivated ar ea
A ver age r ate of gr owth of
ir r igated ar ea, 1973–2003
A ver age r ate of gr owth of
ir r igated ar ea, 2000–03
Algeria 6.9 79.6 6.9 2.9 0.1 Angola 2.2 43.8 11.1 0.2 0.0 Benin 0.4 23.0 0.7 4.7 0.0 Botswana 0.4 96.0 2.1 0.0 0.0 Burkina Faso 0.6 97.3 1.1 4.9 0.0 Burundi 1.6 — 7.8 1.4 0.0 Cameroon 0.4 — 0.4 4.0 0.0 Cape Verde 6.2 65.5 6.2 1.4 0.0 Central African Rep. 0.0 51.1 0.0 — 26.0 Chad 0.8 86.5 4.3 4.1 2.3 Comoros 0.1 65.4 0.1 2.3 0.0 Congo, Dem. Rep. 0.1 69.5 0.2 6.5a 0.0 Congo, Rep. of 0.4 10.9 0.4 — — Côte d'Ivoire 1.1 92.0 1.3 3.2 0.0

20
Table 7. (Continued)
Per cent
C ountr y
T otal ir r igation
equipped ar ea / cultivated
ar ea
I r r igation-equipped ar ea
actually ir r igated / total equipped ar ea
T otal water - managed ar ea / cultivated ar ea
A ver age r ate of gr owth of
ir r igated ar ea, 1973–2003
A ver age r ate of gr owth of
ir r igated ar ea, 2000–03
Djibouti 101.2 38.3 101.2 0.0 0.0 Egypt 97.2 94.9 97.2 0.6 1.3 Equatorial Guinea — — — — — Eritrea 3.4 62.5 3.4 — 0.0 Ethiopia 2.7 — — 0.0b 0.0 Gabon 0.9 — 0.9 1.9 0.0 Gambia, The 0.6 50.3 4.3 2.3 0.0 Ghana 0.5 90.3 0.5 2.4 0.0 Guinea 5.1 100.0 5.1 2.2 0.0 Guinea-Bissau 4.1 100.0 9.4 1.3 0.0 Kenya 2.0 94.2 2.1 3.4 5.8 Lesotho 0.8 2.5 0.8 3.7 0.0 Liberia 0.3 — 3.3 1.4 0.0 Libya 22.5 67.2 22.5 3.1 0.0 Madagascar 30.6 99.5 30.9 3.5 0.0 Malawi 2.3 47.7 4.8 6.3 0.6 Mali 4.9 74.6 6.1 4.7 0.0 Mauritania 8.8 50.7 21.2 1.7 0.0 Mauritius 20.0 98.0 20.0 1.3 3.2 Morocco 15.8 97.6 15.8 1.2 0.0 Mozambique 2.7 33.9 2.4 4.4 0.0 Namibia 0.9 81.1 1.2 2.3 0.0 Niger 1.6 89.1 1.9 4.8 0.0 Nigeria 0.9 74.7 3.0 1.2 3.1 Rwanda 0.6 — 7.4 2.7 0.0 Sao Tome and Principe 17.3 — 17.3 0.0 0.0 Senegal 4.8 57.7 6.0 1.4 3.3 Seychelles 4.3 76.9 4.3 — — Sierra Leone 4.3 — 22.8 3.7 0.0 Somalia 14.5 32.5 14.5 2.3 0.0 South Africa 9.5 100.0 9.5 1.3 0.0 Sudan 11.2 42.9 11.2 0.4 0.0 Swaziland 26.0 90.0 26.0 0.7 0.0 Tanzania 3.6 — 3.6 4.6 2.3

21
Table 7. (Continued)
Per cent
C ountr y
T otal ir r igation
equipped ar ea / cultivated
ar ea
I r r igation-equipped ar ea
actually ir r igated / total equipped ar ea
T otal water - managed ar ea / cultivated ar ea
A ver age r ate of gr owth of
ir r igated ar ea, 1973–2003
A ver age r ate of gr owth of
ir r igated ar ea, 2000–03
Togo 0.3 85.6 0.3 6.7 0.0 Tunisia 8.1 99.7 8.1 2.3 0.0 Uganda 0.1 64.5 0.8 2.7 0.0 Zambia 2.9 100.0 4.8 8.1 3.7 Zimbabwe 5.2 71.4 5.8 3.6 0.0 Northern 28.1 80.4 28.1 2.4 0.3 Sudano-Sahelian 6.9 63.3 9.2 2.7 0.4 Eastern 2.6 24.0 1.8 2.4 1.9 Gulf of Guinea 1.5 73.5 3.3 2.2 1.4 Central 0.7 47.5 2.8 0.5 3.0 Southern 4.2 80.7 4.8 3.2 0.6 Indian Ocean Islands 30.4 99.4 30.7 3.5 0.0 SSA average 3.5 71 4.5 2.3 1.3 Africa average 5.8 81.6 6.7 2.3 1.1 Asia average 33.6 66.9 34.3 2.6c — World average 17.7 92.4 17.6 — —
Sources: Columns 1 and 3: cultivated areas are 2002 data from AQUASTAT (2005); columns 2 and 3: latest available data from FAO AQUASTAT database accessed November 13, 2007 (FAO 2007a); columns 4 and 5: calculated by author using ResourceSTAT database accessed November 13, 2007 (FAO 2007b). Notes: Irrigation-equipped area includes full-control, equipped-lowland, and spate irrigation. It does not include non-equipped cultivated wetlands, inland valley bottoms, or non-equipped flood-recession cropping areas. Total water-managed area is the sum of the total area equipped for irrigation and other forms of non-equipped agricultural water management. The FAO uses irrigated area and irrigation-equipped area interchangeably. Averages not calculated for regional comparisons due to limited data access. Agro-ecological zone averages weighted by country area. Africa average does not include Western Sahara and island countries not in study. a Data available from 1976. b Data available from 1993. c Average for Asia is from the years 1962–1998, calculated by Barker and Molle (2004), using FAO data. — = data not readily available.
Irrigation technology definitions and types are from FAO (2005). Full/partial irrigation is the sum of surface, sprinkler, and localized irrigation. Localized irrigation is a low-pressure technique in which water is piped and applied to each plant as a small discharge. The main categories of localized irrigation are drip irrigation, spray or micro-sprinkler irrigation, and bubbler irrigation. Other terms used to refer to localized irrigation include micro-irrigation, trickle irrigation, daily flow irrigation, drop irrigation, sip irrigation, and diurnal irrigation. Sprinkler irrigation simulates rainfall by moving water through a pipe under pressure and discharging it with sprinkler nozzles. These systems are also known as overhead irrigation systems.
Surface irrigation, which uses gravity to move water across fields, can be subdivided into three categories: furrow, borderstrip, and basin irrigation. This classification does not refer to the method of

22
bringing water to the fields, which can be done with pumping systems or by manually applying water to fields from buckets.
In order to better understand the dynamics of irrigation expansion and growth, and to better appreciate the speed, extent, and nature of irrigation investments, we look at the following characteristics, within the available data:
Irrigation-Equipped Area
This indicator measures the share of total cultivated area that is equipped with irrigation facilities. As shown, only 10 countries in Africa rise to double digits. Overall, only 5.8 percent of the cultivated area in Africa is equipped for irrigation, compared with 33.6 percent in Asia and 17.7 percent for the world as a whole.
Irrigation-Equipped Area Actually Irrigated
The share of the area equipped for irrigation that is actually irrigated spans a huge range in Africa. Lower values reflect facilities that have deteriorated since construction and are no longer usable, areas in which water supply is insufficient to irrigate the entire area, and areas in which deficient management keeps available water from reaching the entire area. Overall, the average utilization rate is 71 percent in Sub-Saharan Africa and 82 percent in Africa, compared with a similar but slightly lower 67 percent in Asia.
Total Water-Managed Area
This indicator measures the share of water-managed area relative to total cultivated area. This is a broader measure than irrigation-equipped area and includes the less formal ways employed to manage water. Using this indicator raises the share of water-managed area in Africa from 5.8 percent to 6.7 percent. Although this change in the average is relatively modest, it is still significant. In some individual countries, however, the impact is far more dramatic. For example, in Rwanda, while just 0.6 percent of the cultivated area is irrigated using full or partial water control, the value rises to 7.4 percent when informal water-control practices are included. Similar changes are seen in Chad, Nigeria, Uganda, and Zambia, among others. Outside Africa, such informal water management practices are relatively less important.
Average Growth Rate
Two indicators were calculated here. The first is the average rate of expansion of irrigated area over the past 30 years. It will respond to increased investment, but slowly because of its large historical inertia. The other is the rate of expansion over a recent four-year period. This indicator will be much more responsive to investments in new irrigation. The longer-term annual rate of growth averages 2.3 percent in both Sub-Saharan Africa and Africa as a whole, though many countries show much more rapid expansion over this period. Interestingly, the recent short-term rate is only about half of this longer-term rate. This suggests a slowing of irrigation development in recent years—so much so that nearly three-fourths of African countries show a zero rate of recent area expansion. A handful of countries (Central African Republic, Kenya, Mauritius, Nigeria, Senegal, and Zambia), however, show recent growth rates of greater than 3 percent per year.
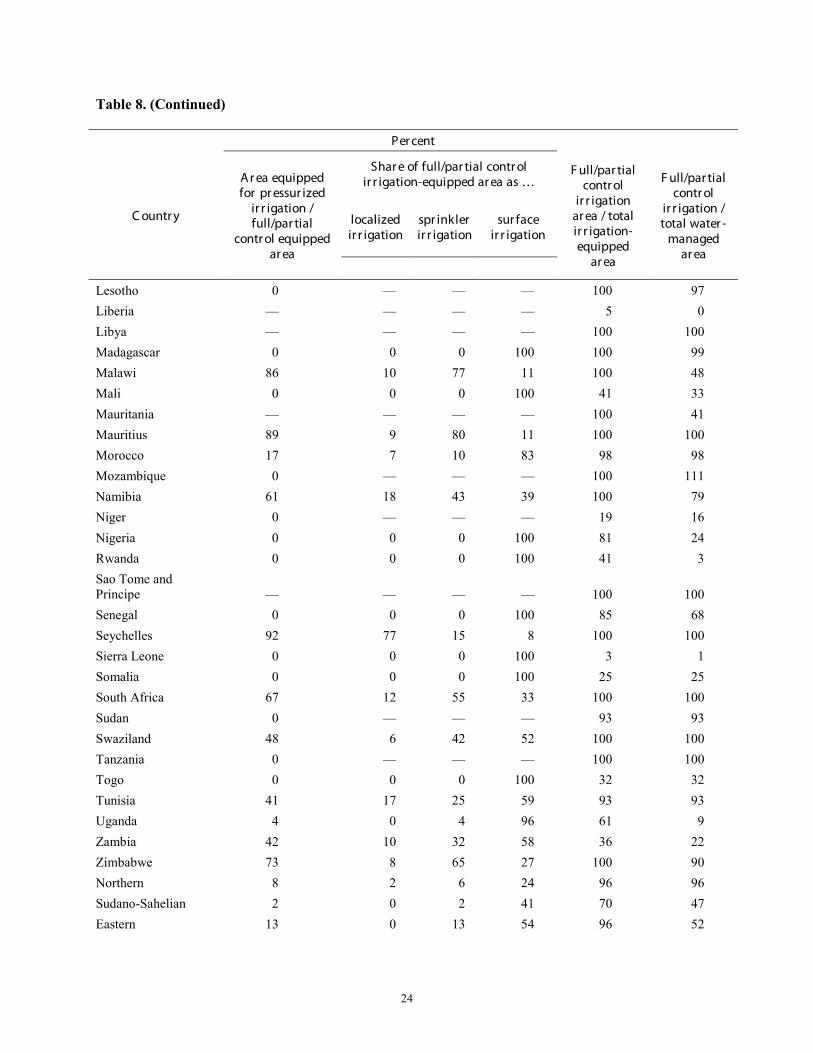
Irrigation Technology Irrigation investment in new systems will expand irrigated area, while rehabilitation can be expected to increase the utilization of existing irrigation facilities. Modernizing existing systems may facilitate private investment in more efficient and productive water application technologies, such as sprinkler and drip irrigation. Irrigation investments may also be targeted directly at increasing the use of pressurized irrigation technology by strengthening production and marketing systems for such equipment. Of course,

23
private investment in such technology also responds to market access for higher-value crops and opportunities resulting from complementary investment, such as transportation. These influences need to be separated in judging impacts.
Important indicators for irrigation technology include the shares of localized, sprinkler, and surface irrigation in total equipped area, the share of equipped irrigated area over total water-managed area, and the area equipped for pressurized irrigation. These indicators are presented in Table 8.
Table 8. Irrigation technology indicators
Per cent
C ountr y
A r ea equipped for pr essur ized
ir r igation / full/par tial
contr ol equipped ar ea
Shar e of full/par tial contr ol ir r igation-equipped ar ea as …
F ull/par tial contr ol
ir r igation ar ea / total ir r igation-equipped
ar ea
F ull/par tial contr ol
ir r igation / total water -
managed ar ea
localized ir r igation
spr inkler ir r igation
sur face ir r igation
Algeria 8 — 8 — 90 90 Angola — — — — 100 20 Benin 54 12 42 46 90 57 Botswana 81 19 62 15 100 18 Burkina Faso 21 0 21 79 74 40 Burundi 0 0 0 100 32 7 Cameroon 24 0 24 76 88 88 Cape Verde 7 7 — — 100 100 Central African Republic — — — — 100 21 Chad 12 0 12 88 100 19 Comoros — — — — 100 100 Congo, Dem. Rep. 0 0 0 100 95 74 Congo, Rep. of 0 0 0 100 11 11 Côte d'Ivoire 75 0 75 25 66 54 Djibouti — — — — 100 100 Egypt 11 6 5 89 100 100 Equatorial Guinea — — — — — — Eritrea 0 0 0 100 19 19 Ethiopia 2 0 2 98 100 — Gabon — — — — 71 71 Gambia, The 0 0 0 100 100 14 Ghana 20 0 20 80 100 100 Guinea 2 1 1 98 21 21 Guinea-Bissau 0 0 0 100 38 16 Kenya 62 2 60 38 100 94
24
Table 8. (Continued)
Per cent
C ountr y
A r ea equipped for pr essur ized
ir r igation / full/par tial
contr ol equipped ar ea
Shar e of full/par tial contr ol ir r igation-equipped ar ea as …
F ull/par tial contr ol
ir r igation ar ea / total ir r igation-equipped
ar ea
F ull/par tial contr ol
ir r igation / total water -
managed ar ea
localized ir r igation
spr inkler ir r igation
sur face ir r igation
Lesotho 0 — — — 100 97 Liberia — — — — 5 0 Libya — — — — 100 100 Madagascar 0 0 0 100 100 99 Malawi 86 10 77 11 100 48 Mali 0 0 0 100 41 33 Mauritania — — — — 100 41 Mauritius 89 9 80 11 100 100 Morocco 17 7 10 83 98 98 Mozambique 0 — — — 100 111 Namibia 61 18 43 39 100 79 Niger 0 — — — 19 16 Nigeria 0 0 0 100 81 24 Rwanda 0 0 0 100 41 3 Sao Tome and Principe — — — — 100 100 Senegal 0 0 0 100 85 68 Seychelles 92 77 15 8 100 100 Sierra Leone 0 0 0 100 3 1 Somalia 0 0 0 100 25 25 South Africa 67 12 55 33 100 100 Sudan 0 — — — 93 93 Swaziland 48 6 42 52 100 100 Tanzania 0 — — — 100 100 Togo 0 0 0 100 32 32 Tunisia 41 17 25 59 93 93 Uganda 4 0 4 96 61 9 Zambia 42 10 32 58 36 22 Zimbabwe 73 8 65 27 100 90 Northern 8 2 6 24 96 96 Sudano-Sahelian 2 0 2 41 70 47 Eastern 13 0 13 54 96 52

25
Table 8. (Continued)
Per cent
C ountr y
A r ea equipped for pr essur ized ir r igation / full/par tial
contr ol equipped ar ea
Shar e of full/par tial contr ol ir r igation-equipped ar ea as …
F ull/par tial contr ol
ir r igation ar ea / total ir r igation-equipped
ar ea
F ull/par tial contr ol
ir r igation / total water -
managed ar ea
Gulf of Guinea 17 1 16 78 66 37 Central 2 0 2 57 89 52 Southern 53 11 42 29 90 74 Indian Ocean Islands 0 0 0 99 100 99 SSA average 22 2 14 30 92 71 Africa average 18 5 12 54 95 83 Asia average 2 0 2 79 96 94 World average 12 1 10 70 96 94
Sources: Latest available data from FAO AQUASTAT database accessed November 13, 2007 (FAO 2007a).[ Perhaps it would be best to identify the date you accessed the database (as you did in Table 1.1) and to give the parenthetical citation--i.e., FAO 2007a)] Notes: Full/partial irrigation includes localized, sprinkler, and surface irrigation. Total irrigation-equipped area includes areas equipped for full/partial control irrigation, equipped lowland areas, and areas equipped for spate irrigation. The aggregate value for total equipped irrigated area reported by FAO is not equal to the sum of the area for each irrigation technology type owing to differing survey years and missing data. Agricultural water management is the sum of the total area equipped for irrigation and other non-equipped areas, including wetlands and flood recession cropping. Pressurized includes localized and sprinkler only. Agro-ecological zone averages weighted by country area. Africa average does not include Western Sahara and island countries not in study. — = data not readily available.
On-farm pressurized irrigation technologies—sprinkler and micro-irrigation—have the potential to reduce water use while increasing productivity and, for horticultural crops, improving product quality. On this score, Africa and Sub-Saharan Africa rate very well. On average, 18 percent of classically equipped irrigation area in Africa is equipped with pressurized irrigation equipment, compared with just 2 percent in Asia, and 12 percent in the world at large. This very promising feature has potential for expansion. This is based on published data, but given a lot of small-scale/small-reservoir irrigation is unreported, the actual share is likely to be somewhat lower.
2.5 Agricultural Productivity The ultimate purpose of investing in agricultural water control is to improve human well-being, and the path to that goal runs through agricultural productivity. For the purposes of this study, agricultural productivity associated with different farming systems is indicated by value of production to allow aggregation over different types of crops. Productivity, of course, responds to a variety of influences beyond irrigation, and so changes in these indicators must be considered along with other information that might indicate the relative contributions of these other factors. Nevertheless, examining their changes over time provides a quick way of assessing overall impact and sets the stage for periodic, more detailed analysis.
We selected a pair of indicators that reflect the effect of irrigation investments on productivity (Table 9). In addition, we show some descriptive data on the comparative yields of rainfed and irrigated

26
crops in different countries (Table 10) and crop water productivity estimates for selected rainfed and irrigated crops (Table 11).
Irrigated Output
This indicator takes the ratio of total value of irrigated output to total value of crop agricultural output for each country (Table 9). It shows the share of crop agricultural production in each country that is derived from irrigated agriculture. For Africa, over both cash and food crops, irrigation accounts for 38 percent of the value of agricultural production. This is on par with the value usually attributed to the world as a whole (around 40 percent). It is interesting to compare this Africa share, however, with that of the share of cultivated area in which water is managed from Table 7, which is 6.7 percent. This suggests that the 6.7 percent of cultivated land on which water is managed produces almost 38 percent of crop agricultural value in these countries, a ratio of about 6 to 1. The comparable ratio for the world as a whole is around 2 to 1. This suggests a huge impact stemming from water control in Africa. Improving the quality of both formal and informal irrigation would be expected to raise this value further. Table 9. Two indicators of agricultural productivity
C ountr y V alue of ir r igated output as shar e
of total agr icultur al output (per cent)
R atio of value of ir r igated output to r ain-fed output
Algeria 66.1 1.95 Angola 12.3 0.14 Benin — — Botswana 16.6 0.20 Burkina Faso 9.1 0.10 Burundi 9.1 0.10 Cameroon 9.4 0.10 Cape Verde — — Central African Republic — 0.00 Chad — — Comoros — — Congo, Dem. Rep. 0.1 0.00 Congo, Rep. of — — Côte d'Ivoire 3.8 0.04 Djibouti — — Egypt 100.0 — Equatorial Guinea — — Eritrea 32.3 0.48 Ethiopia — — Gabon 40.9 0.69 Gambia, The 1.2 0.01 Ghana 0.4 0.00 Guinea 12.0 0.14 Guinea-Bissau — —

27
Table 9. (Continued)
C ountr y V alue of ir r igated output as shar e
of total agr icultur al output (per cent)
R atio of value of ir r igated output to r ain-fed output
Kenya 9.5 0.10 Lesotho — — Liberia 6.9 0.07 Libya 87.1 6.76 Madagascar — — Malawi 8.7 0.10 Mali 10.0 0.11 Mauritania 54.8 1.21 Mauritius — — Morocco 70.7 2.42 Mozambique 4.8 0.05 Namibia — — Niger — — Nigeria 4.4 0.05 Rwanda 5.3 0.06 Sao Tome and Principe — — Senegal 16.5 0.20 Seychelles — — Sierra Leone 21.6 0.28 Somalia 74.3 2.89 South Africa — — Sudan 69.8 2.31 Swaziland 71.6 2.52 Tanzania 10.0 0.11 Togo 3.7 0.04 Tunisia 53.0 1.13 Uganda 0.5 0.00 Zambia 28.2 0.39 Zimbabwe 25.9 0.35 Northern 86.2 1.31 Sudano-Sahelian 58.3 1.91 Eastern 5.0 0.06 Gulf of Guinea 6.3 0.07 Central 7.3 0.09 Southern 6.6 0.13
28
Table 9. (Continued)
C ountr y V alue of ir r igated output as shar e
of total agr icultur al output (per cent)
R atio of value of ir r igated output to r ain-fed output
Indian Ocean Islands 0.0 0.00 Sub-Saharan Africa 24.5 0.75 Africa average 37.7 0.61
Sources: FAO (2003); price data are world price values for year 2000 from IMPACT-WATER (Rosegrant et al. 2008). Notes: Egypt has no rainfed production; CAR, Rep. of Congo, and Mauritius have no irrigated production; 0 = no irrigated production; agro-ecological zone averages are weighted by irrigated area; Africa averages are calculated by dividing the sum of the numerator by the sum of the denominator. — = data not readily available.
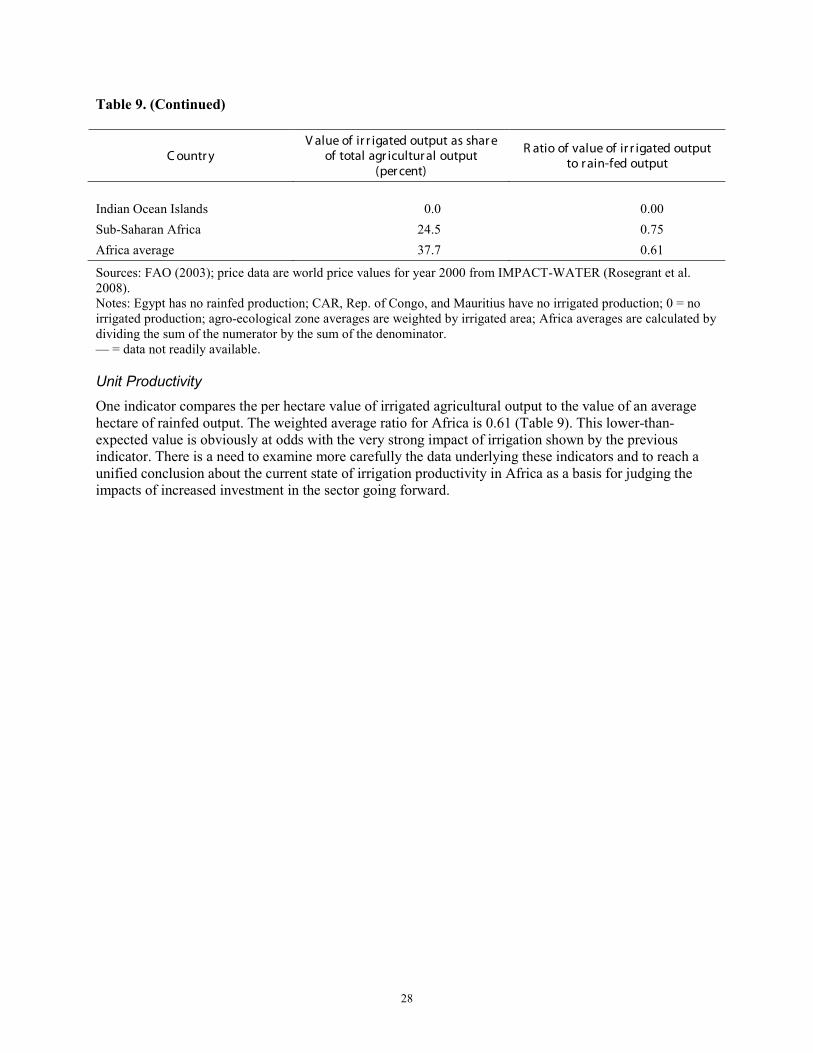
Unit Productivity
One indicator compares the per hectare value of irrigated agricultural output to the value of an average hectare of rainfed output. The weighted average ratio for Africa is 0.61 (Table 9). This lower-than-expected value is obviously at odds with the very strong impact of irrigation shown by the previous indicator. There is a need to examine more carefully the data underlying these indicators and to reach a unified conclusion about the current state of irrigation productivity in Africa as a basis for judging the impacts of increased investment in the sector going forward.

29
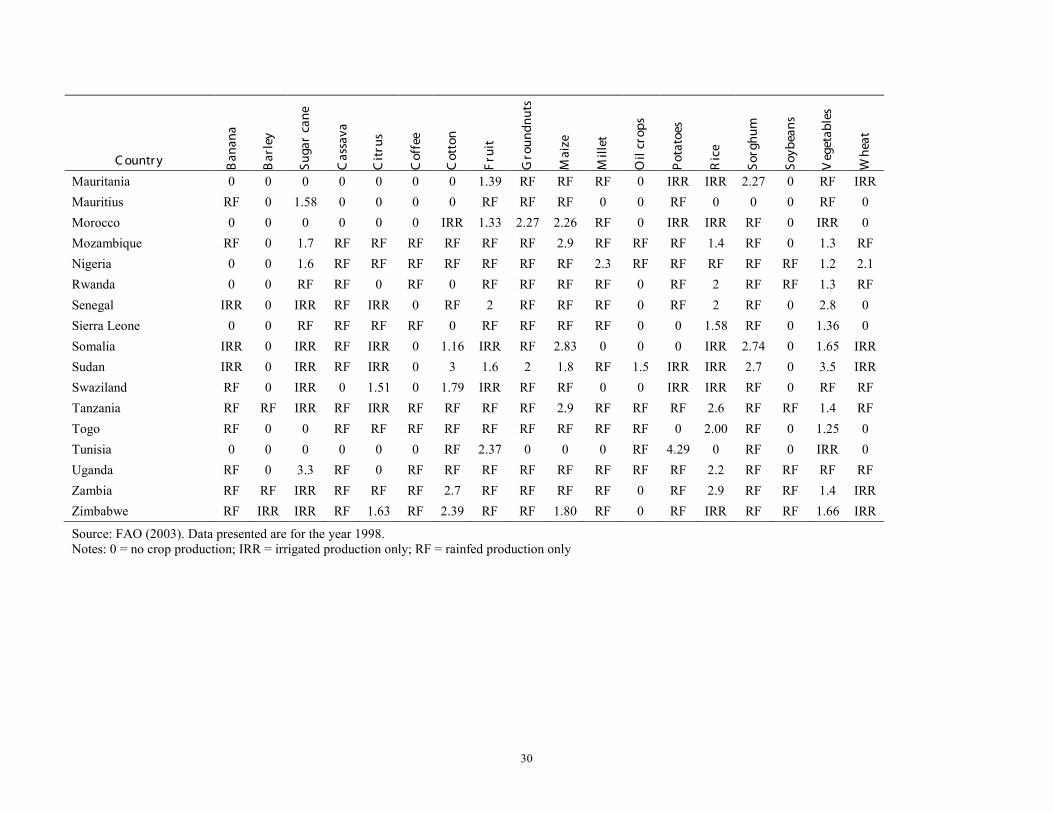
Table 10. Ratio of irrigated and rainfed yields for selected crops in selected countries
C ountr y Ban
ana
Bar
ley
Suga
r ca
ne
Cas
sava
Cit
rus
Cof
fee
Cot
ton
Fru
it
Gro
undn
uts
Mai
ze
Mill
et
Oil
crop
s
Pot
atoe
s
Ric
e
Sorg
hum
Soyb
eans
Veg
etab
les
Whe
at
Algeria 0 0 0 0 IRR 0 0 2.42 RF IRR 0 RF 0 IRR IRR 0 2.69 0 Angola RF 0 IRR RF 0 RF RF RF RF RF RF 0 RF 1.41 0 0 1.86 RF Botswana 0 0 0 0 IRR 0 IRR RF RF RF RF 0 0 0 RF 0 RF RF Burkina Faso 0 0 IRR RF 0 0 RF 1.5 RF RF RF RF RF 3.1 RF RF 1.6 0 Burundi 0 0 IRR RF 0 RF RF RF RF 1.27 RF 0 RF 0 1.37 0 1.63 RF Cameroon RF 0 RF RF 0 RF RF RF RF RF RF 0 RF 2.4 0 RF 1.4 RF Central African Republic RF 0 0 RF 0 0 RF 0 RF RF RF 0 RF RF RF 0 0 0 Congo, Dem. Rep. RF 0 RF RF RF RF RF RF RF RF RF 0 RF 3.5 RF RF RF RF Congo, Rep. of RF 0 0 RF 0 0 0 0 RF RF 0 0 RF RF 0 0 0 0 Côte d'Ivoire RF 0 IRR RF RF RF RF 0 RF RF RF RF RF 2.7 RF RF 1.3 0 Egypt IRR 0 0 0 IRR 0 IRR 0 IRR IRR 0 IRR IRR IRR IRR IRR IRR 0 Equatorial Guinea RF 0 0 RF 0 0 0 0 RF 0 0 0 0 0 0 0 0 0 Eritrea 0 RF 0 0 0 0 0 IRR RF 2.83 IRR 0 IRR 0 2.76 0 1.62 0 Gabon 0 0 0 RF 0 0 0 IRR 1.71 RF 0 0 0 0 0 0 IRR 0 Gambia, The 0 0 0 0 0 0 0 RF 0 RF 0 0 0 0 RF 0 RF 0 Ghana RF 0 RF RF RF RF RF RF RF RF RF RF 0 1.7 RF 0 RF 0 Guinea RF 0 RF RF RF RF RF RF RF RF RF 0 0 2.45 RF 0 1.85 0 Guinea-Bissau RF 0 0 RF 0 0 RF 0 RF RF RF 0 0 2.45 RF 0 0 0 Kenya RF RF 2.3 RF 1.7 1 RF RF RF RF RF RF RF IRR RF 0 1.2 RF Lesotho 0 RF 0 0 0 0 0 RF 0 RF 0 0 0 0 RF 0 RF RF Liberia RF 0 RF RF RF RF 0 RF RF 0 0 0 0 RF 0 RF 1.34 0 Libya 0 0 0 0 IRR 0 0 3.61 IRR IRR 0 3.25 IRR 0 0 0 1.91 2.12 Malawi RF 0 IRR RF RF RF RF RF RF RF RF RF RF 2.2 RF 0 1.8 RF Mali 0 0 IRR RF 0 0 RF RF 1.59 RF 2.48 RF 0 2.14 2.58 0 2.34 IRR
30
C ountr y Ban
ana
Bar
ley
Suga
r ca
ne
Cas
sava
Cit
rus
Cof
fee
Cot
ton
Fru
it
Gro
undn
uts
Mai
ze
Mill
et
Oil
crop
s
Pot
atoe
s
Ric
e
Sorg
hum
Soyb
eans
Veg
etab
les
Whe
at
Mauritania 0 0 0 0 0 0 0 1.39 RF RF RF 0 IRR IRR 2.27 0 RF IRR Mauritius RF 0 1.58 0 0 0 0 RF RF RF 0 0 RF 0 0 0 RF 0 Morocco 0 0 0 0 0 0 IRR 1.33 2.27 2.26 RF 0 IRR IRR RF 0 IRR 0 Mozambique RF 0 1.7 RF RF RF RF RF RF 2.9 RF RF RF 1.4 RF 0 1.3 RF Nigeria 0 0 1.6 RF RF RF RF RF RF RF 2.3 RF RF RF RF RF 1.2 2.1 Rwanda 0 0 RF RF 0 RF 0 RF RF RF RF 0 RF 2 RF RF 1.3 RF Senegal IRR 0 IRR RF IRR 0 RF 2 RF RF RF 0 RF 2 RF 0 2.8 0 Sierra Leone 0 0 RF RF RF RF 0 RF RF RF RF 0 0 1.58 RF 0 1.36 0 Somalia IRR 0 IRR RF IRR 0 1.16 IRR RF 2.83 0 0 0 IRR 2.74 0 1.65 IRR Sudan IRR 0 IRR RF IRR 0 3 1.6 2 1.8 RF 1.5 IRR IRR 2.7 0 3.5 IRR Swaziland RF 0 IRR 0 1.51 0 1.79 IRR RF RF 0 0 IRR IRR RF 0 RF RF Tanzania RF RF IRR RF IRR RF RF RF RF 2.9 RF RF RF 2.6 RF RF 1.4 RF Togo RF 0 0 RF RF RF RF RF RF RF RF RF 0 2.00 RF 0 1.25 0 Tunisia 0 0 0 0 0 0 RF 2.37 0 0 0 RF 4.29 0 RF 0 IRR 0 Uganda RF 0 3.3 RF 0 RF RF RF RF RF RF RF RF 2.2 RF RF RF RF Zambia RF RF IRR RF RF RF 2.7 RF RF RF RF 0 RF 2.9 RF RF 1.4 IRR Zimbabwe RF IRR IRR RF 1.63 RF 2.39 RF RF 1.80 RF 0 RF IRR RF RF 1.66 IRR
Source: FAO (2003). Data presented are for the year 1998. Notes: 0 = no crop production; IRR = irrigated production only; RF = rainfed production only

31
Table 11. Crop water productivity for irrigated and rainfed crops in kg/m3 (1999–2001 average)
C ountr y W
heat
Mai
ze
Oth
er g
rain
Pot
ato
Swee
t pea
Ric
e
Soyb
ean
Veg
etab
les
Subt
rop.
fr
uit
Tem
p. fr
uit
Suga
r ca
ne
Suga
r be
et
Mill
et
Sorg
hum
Chi
ckpe
a
Pig
eon
pea
Gro
und
nut
Cot
ton
Cas
sava
Algeria Rainfed 0.49 1.38 0.62 4.83 — 0.98 — 2.68 3.70 2.75 — — — 2.56 0.26 — 0.57 0.11 — Irrigated 1.71 1.43 0.63 8.64 — 0.21 — 5.74 3.88 3.01 — — — 2.75 0.28 — 0.60 0.12 —
Angola Rainfed 0.87 0.14 — 0.64 1.00 0.09 — 1.56 2.86 — 5.04 — 0.20 — — — 0.11 0.13 1.73 Irrigated 0.47 — — 0.80 1.16 0.11 — 2.46 3.01 — 4.20 — — — — — 0.12 0.15 —
Benin Rainfed — 0.28 — 4.18 2.30 0.20 0.16 4.60 0.28 — 4.46 — 0.22 0.25 — — 0.24 0.11 2.20 Irrigated — — — 1.68 — 0.27 0.20 — — — 3.60 — — — — — — — —
Botswana Rainfed 1.59 0.04 — — — — — 1.55 1.48 — — — 0.06 0.05 — — 0.26 0.25 2.57 Irrigated 0.58 — — — — — — 1.45 1.44 — — — — — — — 0.25 0.24 —
Burkina Faso Rainfed — 0.38 — 12.93 1.98 0.23 0.23 1.67 1.27 — 15.17 — 0.17 0.21 — — 0.22 0.11 0.52 Irrigated — — — 1.92 1.66 0.49 0.24 2.62 1.63 — 9.41 — — — — — — — —
Burundi Rainfed 0.19 0.27 — 0.53 1.53 0.36 0.20 3.78 2.20 — 6.35 — 0.39 0.47 — 0.34 0.28 0.13 1.92 Irrigated 0.17 0.33 — 0.67 — 0.44 0.25 4.60 — — 6.80 — 0.39 0.48 — 0.34 0.28 0.13 —
Cameroon Rainfed 0.26 0.65 — 1.74 1.46 0.24 0.15 0.73 1.69 1.11 1.05 — 0.29 0.34 — — 0.22 0.13 1.94 Irrigated 0.35 — — 1.61 — 0.52 0.18 0.92 — 1.43 — — — — — — — — —
Central African Republic
Rainfed — 0.31 — 0.59 1.74 0.17 — 2.14 1.10 — 0.80 — 0.26 0.25 — — 0.28 0.07 0.75
Irrigated — — — 0.80 — — — 2.43 — — — — — — — — — — —
Chad Rainfed 0.48 0.24 — 2.60 2.52 0.35 — 0.87 1.48 — 26.66 — 0.16 0.24 — — 0.34 0.08 3.63 Irrigated 0.31 — — 1.43 — 0.36 — 0.77 1.21 — 7.83 — — — — — — — —
Congo, Dem. Rep.
Rainfed — 0.21 — 1.84 1.20 0.09 — 2.00 2.26 — 3.56 — — — — — 0.19 — 2.03 Irrigated — — — 2.49 — 0.10 — — — — 4.92 — — — — — — — —
Congo, Rep. of
Rainfed 0.31 0.20 0.17 0.98 1.27 0.09 0.15 0.86 1.74 — 4.34 — 0.19 0.20 — — 0.23 0.04 1.80 Irrigated 0.31 — 0.23 1.20 — 0.10 0.15 — — — — — — — — — — — —
Côte d'Ivoire Rainfed — 0.27 — — 1.68 0.25 0.26 1.73 1.46 — 5.89 — 0.23 0.16 — — 0.30 0.17 0.74 Irrigated — — — — — 0.61 0.34 2.25 — — 6.20 — — 0.20 — — — — —

32
C ountr y
Whe
at
Mai
ze
Oth
er g
rain
Pot
ato
Swee
t pea
Ric
e
Soyb
ean
Veg
etab
les
Subt
rop.
fr
uit
Tem
p. fr
uit
Suga
r ca
ne
Suga
r be
et
Mill
et
Sorg
hum
Chi
ckpe
a
Pig
eon
pea
Gro
und
nut
Cot
ton
Cas
sava
Djibouti Rainfed — 1.51 — — — — — 6.16 1.02 — — — — — — — — — — Irrigated — 0.53 — — — — — 2.31 0.38 — — — — — — — — — —
Egypt Rainfed — 38.97 10.40 111.40 123.87 33.41 16.48 101.66 87.30 67.89 262.45 230.34 — 26.96 8.56 — 14.83 4.54 141.90 Irrigated 2.16 3.21 1.18 9.16 10.06 0.94 0.71 11.46 9.92 7.73 12.39 26.19 — 3.07 0.97 — 1.69 0.52 —
Equatorial Guinea
Rainfed — — — — 0.60 — — — — — — — — — — — — — 0.72 Irrigated — — — — 0.78 — — — — — — — — — — — — — —
Eritrea Rainfed 0.62 0.36 0.42 16.82 — — — 1.16 6.25 — — — 0.18 0.34 0.19 — 0.46 — 1.57 Irrigated 0.31 0.46 — 2.78 — — — 0.90 4.01 — — — — 0.44 0.12 — 0.29 — —
Ethiopia Rainfed 0.30 0.46 0.29 3.39 1.98 — 1.54 0.87 1.72 0.69 14.10 — 0.26 0.36 0.25 — 0.20 0.09 1.83 Irrigated — 0.48 — 1.92 1.29 — 1.03 0.97 1.77 0.74 9.25 — — 0.38 0.27 — 0.22 0.10 —
Gabon Rainfed — 0.45 — — 1.61 0.26 0.31 1.92 1.62 — 4.72 — — — — — 0.31 — 1.24 Irrigated — — — — — 0.29 0.34 2.51 — — 5.73 — — — — — 0.53 — —
Gambia, The Rainfed — 0.34 — — — 0.25 — 1.17 1.10 — — — 0.27 0.33 — — 0.28 0.04 0.56 Irrigated — — — — — 0.36 — 1.36 1.34 — — — — — — — — 0.04 —
Ghana Rainfed — 0.36 0.19 — 2.18 0.23 — 1.47 2.41 — 2.56 — 0.24 0.28 — — 0.31 0.12 2.26 Irrigated — — 0.26 — — 0.34 — — — — 2.49 — — — — — — — —
Guinea Rainfed — 0.25 — — 1.31 0.13 — 0.79 1.21 — 4.58 — 0.21 0.19 — — 0.33 0.16 1.09 Irrigated — — — — 1.58 0.30 — 1.46 — — 4.30 — 0.28 0.25 — — — 0.20 —
Guinea-Bissau
Rainfed — 0.23 — — — 0.12 — 1.22 1.02 — 2.98 — 0.22 0.21 — — 0.30 0.09 1.52 Irrigated — 0.30 — — — 0.14 — 1.64 1.31 — 2.39 — 0.28 0.27 — — 0.39 0.11 —
Kenya Rainfed 0.59 0.65 0.81 3.52 3.92 0.95 — 4.36 4.16 1.30 11.46 — 0.22 0.32 0.16 0.17 0.66 0.04 3.11 Irrigated — — 0.68 — 2.39 0.50 — 3.35 3.54 1.11 11.27 — — — 0.13 — 0.56 0.04 —
Lesotho Rainfed 0.57 0.21 0.12 3.94 — — — 1.59 1.13 — — — — 0.28 — — — — — Irrigated — — 0.15 4.85 — — — 1.88 1.37 — — — — — — — — — —
Liberia Rainfed — — — — 1.98 0.13 0.11 1.41 1.71 — 0.84 — — — — — 0.20 — 1.42 Irrigated — — — — — — — 1.89 — — — — — — — — — — —

33
C ountr y
Whe
at
Mai
ze
Oth
er g
rain
Pot
ato
Swee
t pea
Ric
e
Soyb
ean
Veg
etab
les
Subt
rop.
fr
uit
Tem
p. fr
uit
Suga
r ca
ne
Suga
r be
et
Mill
et
Sorg
hum
Chi
ckpe
a
Pig
eon
pea
Gro
und
nut
Cot
ton
Cas
sava
Libya Rainfed 0.77 1.27 0.63 23.70 — — — 4.29 10.37 9.86 — — 1.32 — 1.42 — 2.17 — — Irrigated 0.36 0.52 0.34 8.50 — — — 3.27 5.53 5.44 — — 0.70 — 0.80 — 1.16 — —
Madagascar Rainfed 0.60 0.16 — 1.00 0.96 0.22 0.24 1.90 1.17 0.58 3.01 — — 0.10 — — 0.16 0.13 1.40 Irrigated 0.60 0.21 — 1.28 1.22 0.25 0.29 2.22 1.54 0.77 3.50 — — 0.13 — — 0.21 0.17 —
Malawi Rainfed 0.54 0.35 — 2.56 — 0.16 — 2.00 1.33 — 12.59 — 0.15 0.18 0.11 0.17 0.20 0.05 2.68 Irrigated 0.24 — — — — 0.33 — 3.58 — — 10.53 — 0.19 — — — — 0.07 —
Mali Rainfed 0.60 0.37 — — 2.97 0.33 — 1.38 4.14 — 16.83 — 0.19 0.23 — — 0.23 0.12 19.65 Irrigated 0.50 0.33 — — 2.37 0.34 — 2.49 4.30 — 6.61 — 0.37 0.46 — — 0.28 — —
Mauritania Rainfed 0.45 0.30 0.43 103.61 1.21 1.16 — 8.57 0.81 — — — 0.16 0.21 — — 0.36 — — Irrigated 0.27 0.20 0.33 1.38 0.43 0.52 — 6.26 0.60 — — — 0.12 0.26 — — 0.26 — —
Morocco Rainfed 0.32 0.13 0.31 8.53 6.55 5.43 1.73 2.74 6.30 4.73 22.41 34.81 0.78 0.36 0.22 — 0.93 0.62 — Irrigated 0.73 0.20 0.29 7.44 5.55 0.72 0.31 2.65 6.08 4.94 9.98 26.77 0.76 0.35 0.21 — 1.55 0.60 —
Mozambique Rainfed 0.46 0.21 — 2.30 1.30 0.12 — 1.26 1.38 — 1.72 — 0.14 0.20 — — 0.16 0.04 1.19 Irrigated 0.27 0.55 — 2.77 1.56 0.13 — 1.52 1.64 — 1.79 — — — — — — — —
Namibia Rainfed 9.57 0.26 — — — — — 1.49 2.28 0.32 — — 0.09 0.11 — — 0.15 0.14 3.06 Irrigated 2.36 0.24 — — — — — 1.50 2.19 0.31 — — — 0.11 — — 0.15 0.14 —
Niger Rainfed 0.58 0.23 — 123.51 5.86 0.59 — 5.22 1.90 — 15.98 — 0.16 0.09 — — 0.15 0.69 7.95 Irrigated 0.35 0.17 — 2.06 4.24 0.57 — 4.00 1.52 — 4.09 — — 0.06 — — 0.20 0.55 —
Nigeria Rainfed 1.55 0.26 — 1.30 1.75 0.19 0.15 0.92 1.16 — 3.04 — 0.21 0.22 — — 0.21 0.06 1.88 Irrigated 0.74 0.58 — 1.40 — 0.37 — 1.01 — — 2.70 — — — — — — — —
Rwanda Rainfed 0.17 0.21 — 2.15 1.42 0.28 0.14 2.07 2.31 — 4.66 — 0.30 0.34 — — 0.23 — 1.21 Irrigated — — — — — 0.50 — 2.03 — — 5.11 — — — — — 0.00 — —
Senegal Rainfed — 0.24 — 489.10 3.16 0.27 — 2.49 3.54 — 19.87 — 0.27 0.31 — — 0.41 0.14 1.09 Irrigated — 0.27 — 11.33 2.38 0.34 — 4.37 3.24 — 13.32 — — — — — — 0.12 —
Sierra Leone Rainfed — 0.26 — — 0.58 0.11 — 1.86 1.48 — 5.27 — 0.26 0.28 — — 0.25 — 1.14 Irrigated — 0.34 — — 0.60 0.18 — 2.52 — — 6.05 — 0.35 0.36 — — — — —

34
C ountr y
Whe
at
Mai
ze
Oth
er g
rain
Pot
ato
Swee
t pea
Ric
e
Soyb
ean
Veg
etab
les
Subt
rop.
fr
uit
Tem
p. fr
uit
Suga
r ca
ne
Suga
r be
et
Mill
et
Sorg
hum
Chi
ckpe
a
Pig
eon
pea
Gro
und
nut
Cot
ton
Cas
sava
Somalia Rainfed 0.25 0.36 — — 11.81 — — — — — 12.36 — — 0.22 — — 0.65 — 7.03 Irrigated 0.09 0.37 — — 3.12 — — — — — 3.64 — — 0.16 — — 0.24 — —
South Africa Rainfed 2.71 0.86 0.62 27.43 3.42 1.58 0.89 8.67 10.68 7.55 13.83 — 0.32 1.53 — — 0.91 0.27 — Irrigated 1.78 0.74 0.58 17.80 2.13 0.70 0.68 8.30 9.76 7.10 9.08 — 0.29 1.40 — — 0.84 0.26 —
Sudan Rainfed 0.59 0.18 — 17.52 0.75 0.30 — 1.62 3.07 — 18.20 — 0.07 0.20 0.56 — 0.19 0.07 0.61 Irrigated 0.40 0.19 — 1.85 0.50 0.15 — 3.65 2.58 — 6.32 — 0.06 0.33 0.49 — 0.24 0.13 —
Swaziland Rainfed 0.52 0.34 — 0.45 0.40 0.58 — 2.02 1.95 — 15.31 — — 0.13 — — 0.22 0.05 — Irrigated 0.47 0.39 — 0.49 0.44 0.58 — 2.38 2.42 — 13.09 — — 0.16 — — 0.26 0.07 —
Tanzania Rainfed 0.72 0.38 0.92 1.59 0.39 0.17 0.07 2.71 1.48 2.45 11.19 — 0.44 0.47 0.18 0.33 0.30 0.09 2.01 Irrigated 0.39 0.92 0.80 — — 0.38 0.09 2.56 1.31 2.14 9.29 — — — 0.15 — — — —
Togo Rainfed — 0.30 — — 2.18 0.22 — 1.42 1.90 — — — 0.15 0.24 — — 0.16 0.11 1.10 Irrigated — — — — — 0.38 — 1.77 — — — — — — — — — — —
Tunisia Rainfed 0.93 — 0.72 5.66 — — — 1.37 6.15 3.50 — 23.76 — 0.24 0.48 — — 0.58 — Irrigated 1.56 — — 12.46 — — — 1.08 5.05 2.93 — 29.65 — 0.20 0.41 — — 0.48 —
Uganda Rainfed 0.31 0.45 — 1.93 1.16 0.22 0.33 1.71 1.69 — 1.36 — 0.42 0.40 0.14 0.28 0.20 0.02 3.03 Irrigated 0.35 — — — — 0.36 — — — — 3.35 — — — 0.16 — — — —
Zambia Rainfed 4.50 0.34 0.22 1.67 2.73 0.10 0.38 1.71 1.53 — 14.02 — 0.20 0.19 — — 0.11 0.10 1.17 Irrigated 1.82 — 0.29 2.06 3.36 0.25 0.48 2.42 2.02 — 11.08 — — 0.25 — — — 0.28 —
Zimbabwe Rainfed 4.44 0.30 1.30 3.45 0.47 0.31 0.53 1.79 1.34 1.57 18.61 — 0.07 0.17 — — 0.17 0.07 1.07 Irrigated 1.74 0.48 1.54 3.67 0.50 0.31 0.59 2.66 1.66 1.87 12.17 — 0.08 0.20 — — — 0.15 —
Source: IFPRI IMPACT-WATER simulations (Rosegrant et al. 2008). Notes: — = data not available.

35
A second indicator presents irrigated and rainfed crop water productivity for selected crops for African countries (Table 11). Productivity is measured as kilograms of output produced compared to cubic meters of water used, either from irrigation or precipitation. While irrigated productivity (which also includes precipitation) is generally higher, final outcomes depend on the particular rainfall of the year and location.
Comparative Crop Yields
Although the data are too sparse to use as a comprehensive set of indicators, the data shown in Table 10 shed light on the question of rainfed versus agricultural productivity. As seen, the yield ratios in the table generally range between about 1.5 and 3.0, suggesting that irrigated yields are typically one and one-half to three times those of rainfed crops. For the two important crops (rice and vegetables) grown in a majority of the countries for which data are available, simple average values of the yield ratios in the reporting countries are 1.5 for both rice and vegetables. These indicative values are intermediate to the ones discussed in the two previous sections.
Poverty and Food Security Irrigation investments must ultimately be designed to reduce poverty and improve food security for rural populations. In addition, through forward and backward linkages, agricultural growth can affect the entire economy, reducing poverty in the nation as a whole.
Four indicators are presented here to assess the impacts on poverty and food security (Table 12). Because of the comprehensive nature of these indictors and the various other factors that influence them, it would typically be necessary to disaggregate them regionally, focusing on areas in which major irrigation investments were planned. In response to sustained major investments, however, the national averages could be expected to respond as well.
National Poverty Headcount Ratio
This indicator measures the share of the population with incomes falling below the national poverty line. Its average for Sub-Saharan Africa is 51 percent (Table 12). This compares with 17 percent in East Asia and the Pacific and 40 percent in South Asia, and 25 percent for the world as a whole. This indicator would respond to rising incomes throughout the economy as irrigation investment increases agricultural productivity and stimulates economic growth.
Rural Poverty Headcount Ratio
This indicator is similar to the previous one, except that it considers only the rural population and uses a separate, usually lower, poverty line linked to costs in rural areas. Due to the wide range of reporting years for this indicator, however, average values are not calculated. This indicator would respond to the irrigation-induced increase in farm incomes, to employment created by expanded agricultural areas and shifts to more labor-intensive crops, and to growth in rural areas stimulated by forward and backward linkages to input suppliers and output processors.
Economically Active Population in Agriculture
This indicator measures the share of the working population engaged in agriculture in a country. Values shown span a huge range, from 8 percent in South Africa to 90 percent in Rwanda. On average, 54 percent of the economically active population in Africa is engaged in agriculture, compared with 28 percent in Asia and 22 percent for the world as a whole. This indicator might be expected to rise locally in response to irrigation investments, but to decline over the longer term as the structure of the economy changed and industrial and service sectors employed a larger share of the workforce. As in the case of all the indicators, targets would have to be set locally in cognizance of local conditions and goals.

36
Caloric Intake
This indicator, caloric intake per capita, measures nutritional status. It should respond to increased food production by subsistence producers and increased rural incomes more broadly, stimulated by irrigation-led agricultural growth. The average caloric intake over the period 2003 to 2005 for Africa is 2,364 kilocalories(kcal)/capita/day, about the same as South Asia and 13 percent below the world average. Table 12. Poverty and food security
C ountr y
Pover ty head-count
r atio at national pover ty line (% )
R ur al pover ty
head-count
r atio at r ur al
pover ty line (% )
E conomi-cally active
population in agr icultur e
(% )
C alor ic intake / capita
(kcal/capita/
day)
A gr icul-tur al value added
(% G DP)
A nnual gr owth
in agr icul-
tur al value added
(% )
A gr icul-tur al value added per
wor ker (constant 2000 US$)
Algeria 23 30 23 3,100 8 — 2,219 Angola — — 71 1,880 8 10 196 Benin 29 33 50 2,290 32 — 536 Botswana — — 44 2,200 2 -1 367 Burkina Faso 46 52 92 2,620 32 3 179 Burundi 68 65 90 1,630 35 — 64 Cameroon 40 50 55 2,230 20 3 677 Cape Verde — — 20 2,380 9 4 1,510 Central African Republic — — 69 1,900 56 3 384
Chad 64 67 71 1,980 21 3 225 Comoros — — 72 1,800 51 -10 436 Congo, Dem. Rep. — — 61 1,500 46 3 149 Congo, Rep. of — — 37 2,330 5 — — Côte d'Ivoire — — 45 2,520 23 1 817 Djibouti — — 77 2,170 4 4 65 Egypt 17 23 31 3,320 15 3 2,128 Equatorial Guinea — — 68 — 3 1 1,198 Eritrea 53 — 76 1,530 23 5 63 Ethiopia 44 45 81 1,810 47 11 162 Gabon — — 33 2,760 5 2 1,663 Gambia, The 61 63 78 2,140 33 5 243 Ghana 29 39 56 2,690 37 6 332 Guinea 40 — 82 2,540 20 4 193 Guinea-Bissau 66 — 82 2,050 60 6 246 Kenya 52 53 74 2,040 27 5 345 Lesotho 68 54 38 2,430 17 2 412 Liberia — — 65 2,010 66 — — Libya — — 5 3,020 — — —

37
Table 12. (Continued)
C ountr y
Pover ty head-count
r atio at national pover ty line (% )
R ur al pover ty
head-count
r atio at r ur al
pover ty line (% )
E conomi-cally active
population in agr icultur e
(% )
C alor ic intake / capita
(kcal/capita/
day)
A gr icul-tur al value added
(% G DP)
A nnual gr owth
in agr icul-
tur al value added
(% )
A gr icul-tur al value added per
wor ker (constant 2000 US$)
Madagascar 71 77 72 2,010 28 2 175 Malawi 65 67 81 2,130 33 12 109 Mali 64 76 79 2,570 37 6 244 Mauritania 46 61 52 2,790 24 12 356 Mauritius — — 10 2,880 6 -4 5,338 Morocco 19 27 33 3,190 13 23 1,657 Mozambique 54 55 80 2,070 27 9 157 Namibia — — 38 2,290 12 -1 1,134 Niger 63 66 87 2,140 40 6 157 Nigeria 34 36 30 2,600 23 — 1,025 Rwanda 60 66 90 1,940 42 0 217 Sao Tome and Principe — — 62 2,600 17 — —
Senegal 33 40 72 2,150 17 -3 227 Seychelles — — 77 2,380 3 5 433 Sierra Leone 70 79 60 1,910 46 — — Somalia — — 69 — — — — South Africa — — 8 2,900 3 -13 2,636 Sudan — — 57 2,290 34 7 666 Swaziland 69 75 32 2,320 11 2 1,275 Tanzania 36 39 79 2,010 46 4 306 Togo 32 — 57 2,020 44 — 353 Tunisia 8 14 23 3,280 12 3 2,686 Uganda 38 42 78 2,380 33 5 235 Zambia 68 78 67 1,890 23 2 211 Zimbabwe 35 48 60 2,040 19 — 205 Northern 17 24 28 3,232 12 6 2,008 Sudano-Sahelian 32 34 71 2,118 28 4 340 Eastern 45 47 80 1,972 40 7 232 Gulf of Guinea 31 31 39 2,540 27 1 814 Central 7 9 61 1,743 34 4 276 Southern 30 33 43 2,421 15 -2 1,248

38
Table 12. (Continued)
C ountr y
Pover ty head-count
r atio at national pover ty line (% )
R ur al pover ty
head-count
r atio at r ur al
pover ty line (% )
E conomi-cally active
population in agr icultur e
(% )
C alor ic intake / capita
(kcal/capita/
day)
A gr icul-tur al value added
(% G DP)
A nnual gr owth
in agr icul-
tur al value added
(% )
A gr icul-tur al value added per
wor ker (constant 2000 US$)
Indian Ocean Islands 64 69 68 2,055 27 1 495
SSA average 51 — 59 2,192 30 3 575 Africa average — — 54 2,364 27 3 812 East Asia and Pacific 17 — — 2,665 13 5 465
South Asia 40 — — 2,392 19 3 417 Asia average — — 28 — — — — World average 25 — 22 2,713 3 3 941
Sources: Columns 1 and 2: latest available data from World Development Indicators (World Bank 2008), with the exception of the averages for SSA, East Asia, the Pacific, South Asia, and the World, which are from the PovcalNet database accessed November 20, 2007 (PovCalNet 2007) using the default poverty line of $38.00 per month at the 2005 purchasing power parity (the $1.25-a-day line); column 3: AQUASTAT (2005); column 4: FAOSTAT data accessed April 12, 2008 (FAO 2008)for the years 2003–2005; columns 5 and 7: World Development Indicators (World Bank 2008) for year 2005; column 6: World Development Indicators (World Bank 2008) for year 2006. Notes: The rural poverty rate is the percentage of the rural population living below the national rural poverty line. Averages for columns 1 and 2 are not calculated using World Bank (2008) data due to the variation in years reported. The averages for column 2 are not given in the PovcalNet database. Agro-ecological zone averages are weighted by population. — = data not available.
Agricultural Value Added
Three indicators were calculated here. The first is the share of GDP generated through agricultural production. This indicator responds to increased investment and—holding other sector growth constant—should increase as productivity rises. In the long term, however, this indicator will decrease as backward and forward linkages bring growth to industrialized sectors of the economy. This trend should also be observed in the annual growth of agricultural value added, which for Africa for the year 2006 was on par with the world average. Finally, the average value added per worker can be expected to increase under sustained investment. For the year 2005, the average for Africa was $812 per worker, which is close to the world average; however, there are a few outliers in this category, namely, northern African countries, Mauritius, and South Africa, which all have higher value added per worker.

39
3. SUMMARY AND CONCLUSIONS
The World Bank and other donors are planning a significant increase in irrigation investment levels in Africa. This paper identifies and defines a set of indicators to measure the effect of such increases and establishes baseline values for the indicators. The paper also compares baseline values for Africa with values of the same indicators from other country groupings to illustrate the relative position. The paper develops indicators in six categories—institutional framework, water resource utilization, irrigation area, irrigation technology, agricultural productivity, and poverty and food security. In all cases, we have selected indicators that could reasonably be expected to respond in some way to increased irrigation sector investment, allowing the impacts of the investment program to be monitored and assessed.
From our analysis, we see that African countries are characterized by having less renewable water per unit area and a higher population density than the world as a whole. A higher percentage of their populations are engaged in agriculture, and farm size is slightly smaller than average—slightly more than one hectare per agricultural worker. Strikingly, African countries, on average, withdraw less than half as much water for human use as does the world as a whole, and the irrigated share of their cropland is less than one-third of the world average. Total water withdrawals and agricultural withdrawals in Africa are but a fraction of those prevailing in Asia and in the world as a whole. Both are expected to rise as a result of increased irrigation investment. Surface water storage capacity in Africa, as a share of average river discharge, is on par with the global average. This storage is very unevenly distributed, however, and much of it is used solely for hydropower generation. Although groundwater utilization in northern African countries remains high, average groundwater utilization in Sub-Saharan Africa is less than 20 percent of renewable supplies. Groundwater is a resource particularly well suited for small-scale irrigation and for multiple-use systems.
The share of cultivated area equipped for irrigation in Africa is about one-third of the equipped share in the world as a whole and less than one-fifth of the value for Asia. Utilization rates of installed capacity are comparable in Africa and Asia. A remarkably high percentage of irrigated land in Africa employs pressurized water application, though the great bulk of that area is in Malawi, Zimbabwe, and South Africa. Rates of irrigation expansion in Africa are low over the past 30 years and extremely low for a recent three-year period, averaging just 1.1 percent. However, some investment increase has been observed since 2005.
In terms of how irrigation affects the performance of the agricultural sector, aggregate data show that irrigated agriculture produces 38 percent of the crop agricultural value in Africa from less than 6.7 percent of cultivated land. In a somewhat contradictory result, however, unit productivity values show an output advantage for irrigated agriculture that is considerably smaller. Irrigated to rainfed crop yield ratios generally run between 1.5 and 3.0. More analysis of the larger-scale impacts of irrigation relative to rainfed crop production is required.
Poverty incidence in Africa is considerably higher than in Asia and the world at large, and Africa contains a large number of so-called “ultra-poor.” Almost twice as much of the economically active population is engaged in agriculture in Africa than in Asia. Whether rural employment generation is an objective in a particular setting (determining whether this indicator would come into play) must be decided on a case-by-case basis. Calorie availability per capita is on par with South Asia, yet lower than East Asia and the Pacific, and 20 percent below the world average, providing ample room for targeting improvement.
The impact indicators and baseline values developed in this paper were selected to form a comprehensive and coherent set, given constraints imposed by data availability. The various FAO databases provide a very useful primary source of time series information for populating many of the hydrologic and agricultural indicators. World Bank investment programs in specific African countries could be very useful vehicles for refining the quality and coverage of these data, and such sector work should be included in country irrigation investment programs. The data collected should honor the FAO variable definitions so that new information will augment and be consistent with existing data.

40
An area that requires particular attention is that of comparative rainfed and irrigated agricultural yields and aggregate output. Another area of uncertainty is that of per hectare irrigation investment costs across different regions and farming systems. There have been recent improvements in this kind of data, but the African continent remains largely understudied in this respect compared with South and Southeast Asia.
A final important gap relates to irrigation institutions. A coherent framework of concepts, variables, and indicators is needed in order to assess changes in this area. To support such a framework, a database of policies, laws, charging data, and other information is required to populate institutional indicators and allow changes to be measured. Most potential investors expect institutional frameworks to improve as investments increase. But the expected changes do not form a clear pattern or exhibit a linear progression. It is thus difficult to imagine and assess impacts on institutions in a generic way. At the same time, data characterizing sector institutions are scarce and fragmented. Additional effort is clearly required to conceptualize expected favorable institutional changes and establish a regionwide information base that could be used to populate a set of indicators, once defined.

41
REFERENCES
Barker R., and F. Molle. 2004. Evolution of irrigation in South and Southeast Asia. Comprehensive assessment of water management in agriculture. Research report no. 5. Colombo: International Water Management Institute.
Food and Agriculture Organization of the United Nations (FAO). 1986. African agriculture: The next 25 years. Annex IV: Irrigation and water control. ARC/86/3. Rome: FAO.
Food and Agriculture Organization of the United Nations (FAO). 2003. World agriculture: Towards 2015/2030—An FAO perspective. J. Bruinsma, ed. London and Rome: Earthscan and FAO; as well as unpublished material underlying the report.
Food and Agriculture Organization of the United Nations (FAO). 2005. Irrigation in Africa in figures. AQUASTAT Survey 2005. K. Frenken, ed. Rome: FAO Land and Water Development Division.
Food and Agriculture Organization of the United Nations (FAO). 2007a. AQUASTAT database. http://www.fao.org/nr/water/aquastat/data/query/index.html
Food and Agriculture Organization of the United Nations (FAO). 2007b. ResourceSTAT database. http://faostat.fao.org/site/377/default.aspx
Food and Agriculture Organization of the United Nations (FAO). 2008. FAO STAT. http://faostat.fao.org/
Giordano, M. 2005. Agricultural groundwater use in Sub-Saharan Africa: What do we know and where should we go? Water Policy 7: 613–26.
Global Groundwater Information System (GGIS) database. (2004). International Groundwater Resources Assessment Center (IGRAC). http://igrac.nitg.tno.nl/
PovCalNet. 2008. PovcalNet Online Poverty Analysis Tool. http://go.worldbank.org/NT2A1XUWP0
Rosegrant, Mark W., C. Ringler, S. Msangi, T.B. Sulser, T. Zhu, and S.A. Cline. 2008. International Model for Policy Analysis of Agricultural Commodities and Trade (IMPACT): Model Description. Washington, D. C.: International Food Policy Research Institute (IFPRI) 42 pages. http://www.ifpri.org/sites/default/files/IMPACTwater.pdf
World Bank. 2008. World Development Indicators 2008. Washington, DC: World Bank.

42
RECENT IFPRI DISCUSSION PAPERS
For earlier discussion papers, please go to www.ifpri.org/pubs/pubs.htm#dp. All discussion papers can be downloaded free of charge.
893. Managing future oil revenues in Ghana: An assessment of alternative allocation options. Clemens Breisinger, Xinshen Diao, Rainer Schweickert, and Manfred Wiebelt, 2009.
892. Impact of water user associations on agricultural productivity in Chile. Nancy McCarthy and Tim Essam, 2009.
891. China’s growth and the agricultural exports of southern Africa. Nelson Villoria, Thomas Hertel, and Alejandro Nin-Pratt, 2009.
890. The impact of climate variability and change on economic growth and poverty in Zambia. James Thurlow, Tingju Zhu, and Xinshen Diao, 2009.
889. Navigating the perfect storm: Reflections on the food, energy, and financial crises. Derek Headey, Sangeetha Malaiyandi, and Shenggen Fan, 2009.
888. How important is a regional free trade area for southern Africa? Potential impacts and structural constraints. Alejandro Nin Pratt, Xinshen Diao, and Yonas Bahta, 2009.
887. Determinant of smallholder farmer labor allocation decisions in Uganda. Fred Bagamba, Kees Burger, and Arie Kuyvenhoven, 2009.
886. The potential cost of a failed Doha Round. Antoine Bouët and David Laborde, 2009.
885. Mapping South African farming sector vulnerability to climate change and variability: A subnational assessment. Glwadys Aymone Gbetibouo and Claudia Ringler, 2009.
884. How does food price increase affect Ugandan households? An augmented multimarket approach. John M. Ulimwengu and Racha Ramadan, 2009.
883. Linking urban consumers and rural farmers in India: A comparison of traditional and modern food supply chains. Bart Minten, Thomas Reardon, and Anneleen Vandeplas, 2009.
882. Promising Approaches to Address the Needs of Poor Female Farmers: Resources, Constraints, and Interventions. Agnes R. Quisumbing and Lauren Pandolfelli, 2009.
881. Natural Disasters, Self-Insurance, and Human Capital Investment: Evidence from Bangladesh, Ethiopia, and Malawi. Futoshi Yamauchi, Yisehac Yohannes, and Agnes Quisumbing, 2009.
880. Risks, ex-ante actions, and public assistance: Impacts of natural disasters on child schooling in Bangladesh, Ethiopia, and Malawi. Futoshi Yamauchi, Yisehac Yohannes, and Agnes Quisumbing, 2009.
879. Measuring child labor: Comparisons between hours data and subjective measures. Andrew Dillon, 2009.
878. The effects of political reservations for women on local governance and rural service provision: Survey evidence from Karnataka. Katharina Raabe, Madhushree Sekher, and Regina Birner, 2009.
877. Why is the Doha development agenda failing? And what can be Done? A computable general equilibrium-game theoretical approach. Antoine Bouët and David Laborde, 2009.
876. Priorities for realizing the potential to increase agricultural productivity and growth in Western and Central Africa. Alejandro Nin-Pratt, Michael Johnson, Eduardo Magalhaes, Xinshen Diao, Liang You, and Jordan Chamberlin, 2009.
875. Rethinking China’s underurbanization: An evaluation of Its county-to-city upgrading policy. Shenggen Fan, Lixing Li, and Xiaobo Zhang, 2009.


INTERNATIONAL FOOD POLICY RESEARCH INSTITUTE
www.ifpri.org
IFPRI HEADQUARTERS
2033 K Street, NW Washington, DC 20006-1002 USA Tel.: +1-202-862-5600 Fax: +1-202-467-4439 Email: [email protected]
IFPRI ADDIS ABABA
P. O. Box 5689 Addis Ababa, Ethiopia Tel.: +251 11 6463215 Fax: +251 11 6462927 Email: [email protected]
IFPRI NEW DELHI
CG Block, NASC Complex, PUSA New Delhi 110-012 India Tel.: 91 11 2584-6565 Fax: 91 11 2584-8008 / 2584-6572 Email: [email protected]