Communal Irrigation Systems Component - PIDS
310
DISCUSSION PAPER SERIES NO. 2020-02 MARCH 2020 Assessing the Resurgent Irrigation Development Program of the Philippines – Communal Irrigation Systems Component Roger A. Luyun Jr. and Dulce D. Elazegui The PIDS Discussion Paper Series constitutes studies that are preliminary and subject to further revisions. They are being circulated in a limited number of copies only for purposes of soliciting comments and suggestions for further refinements. The studies under the Series are unedited and unreviewed. The views and opinions expressed are those of the author(s) and do not necessarily reflect those of the Institute. Not for quotation without permission from the author(s) and the Institute. CONTACT US: RESEARCH INFORMATION DEPARTMENT Philippine Institute for Development Studies 18th Floor, Three Cyberpod Centris - North Tower EDSA corner Quezon Avenue, Quezon City, Philippines [email protected] (+632) 8877-4000 https://www.pids.gov.ph
-
Upload
khangminh22 -
Category
Documents
-
view
1 -
download
0
Transcript of Communal Irrigation Systems Component - PIDS
DISCUSSION PAPER SERIES NO. 2020-02
MARCH 2020
Assessing the Resurgent Irrigation Development Program of the Philippines – Communal Irrigation Systems Component
Roger A. Luyun Jr. and Dulce D. Elazegui
The PIDS Discussion Paper Series constitutes studies that are preliminary and subject to further revisions. They are being circulated in a limited number of copies only for purposes of soliciting comments and suggestions for further refinements. The studies under the Series are unedited and unreviewed. The views and opinions expressed are those of the author(s) and do not necessarily reflect those of the Institute. Not for quotation without permission from the author(s) and the Institute.
CONTACT US:RESEARCH INFORMATION DEPARTMENTPhilippine Institute for Development Studies
18th Floor, Three Cyberpod Centris - North Tower EDSA corner Quezon Avenue, Quezon City, Philippines
[email protected](+632) 8877-4000 https://www.pids.gov.ph
Assessing the Resurgent Irrigation Development Program of the Philippines—Communal Irrigation Systems Component
Roger A. Luyun Jr. Dulce D. Elazegui
PHILIPPINE INSTITUTE FOR DEVELOPMENT STUDIES
March 2020
i
Abstract
The project aims to evaluate the effectiveness and efficiency of the government's irrigation
program with focus on the technical, physical, and institutional aspects of performance of
communal irrigation systems (CIS). Cycle 1 involved the assessment of 66 communal irrigation
systems (CIS) from 11 provinces in Luzon, while Cycle 2 covered 12 CIS from 4 provinces in
the Visayas, and 12 CIS from 4 provinces in Mindanao. Provinces were selected based on the
total FUSA served by CIS, while the selection of sample CIS per province were based on size
category of service areas: small (50 ha and below), medium (between 50 and 100 ha), and large
(above 100 ha). They were then characterized based on water source, type of extraction/
distribution technology (gravity, pump), FUSA, operational status and cropping intensity.
Primary and secondary data were collected. Key informant interviews (KII) of the RIO or IMO
Managers, as well as other key actors such as NIA-IDOs and the IA President, were conducted
using a structured questionnaire. Focus group discussions with IA officers/ members were
likewise carried out. Walkthroughs to gauge the physical conditions of the systems were
conducted in 2 of the 6 selected CIS from the 11 provinces in Luzon for a total of 22, and in
all the 24 CIS selected in Visayas and Mindanao.
Majority of the selected CIS are gravity systems except in some provinces where there are more
pump irrigation systems. Water sources of the CIS are lakes, rivers, creeks, springs, runoff and
ground water. While some rivers tapped have adequate flows for irrigation even during the dry
seasons, unreliable water supply is a major problem for majority of the CIS who tap water from
less dependable small rivers and creeks, or rely on springs and runoff. In most of the CIS
visited, farmers resort to conjunctive use of STWs with their CIS especially during long dry
periods. Many CIS where found to be in slope greater that 3%, and as such, it is recommended
to include all areas within 8% slope, minus the built-up and other protected areas as potential
irrigable areas. The presence of a dependable surface water source and a good shallow aquifer,
as well as the soil type and its suitability to different type of crops, should also be used as major
criteria for irrigation development.
On the problem of water supply sources, there should be a concerted and united effort on the
part of concerned government agencies like NWRB, NIA, BSWM, and the academe to identify
potential sites for diversion dams and storage reservoirs. The estimation of dependable (low)
water supply and flood (high) discharges for rivers is very important. As such, the shelved
proposal for the institution of the National Water Resources Management Office under the
Office of the President should be revived and reformulated. The institution of Water Resources
Centers in selected state colleges and universities (SCUs), who can continuously gather,
analyze and manage water resources data would be significant in building hydrologic database.
All accumulated water resources data should be housed in a database center within the
proposed super body.
There are a host of technical problems that confronts the IAs and the performance of their CIS.
Most run-of-the-river type dams are old, and some with sediments almost at the crest level.
Damaged sluice and intake gates are usually replaced with wooden flashboards, sand bags or
stones, and defective lifting mechanisms are either left open or fitted with chain blocks.
Sedimentation due to catchment denudation, mining, lahar, among others, is a major problem
decreasing dam storage potential and canal carrying capacity. A positive aspect is that most
CIS have concrete-lined main canals and laterals, and their conditions depend on the IA O&M
and cleanup mechanisms. At any rate, sediment discharge estimation should be a prerequisite
ii
in feasibility studies and provision of silt control devices should be included in the design for
sediment laden rivers.
Control structures include simple cross regulators, check gates, drop structures, division boxes
and farm turnouts most of which uses wooden flashboards for water level control. Most service
roads are in bad conditions with some dams accessible only by walking or by motorcycles. As
in most irrigation systems, flow measurements are not conducted and there are no specific
drainage canals at the CIS leading to flooding problems in some systems during the rainy
season. Water distribution is usually from paddy to paddy, with few farm ditches contributing
to large application losses.
Rehabilitation works have been performed through NIA’s technical assistance and mostly done
to correct damaged dams and headworks, lining of canals, and dredging of sediments. With the
recent availability of low-cost HDPE pipes, the feasibility of using these materials for
subsurface conveyance of irrigation to the fields, should be looked into.
Most IAs believe that they receive adequate water at the right time though frequent delays and
inequitable flow distribution still abound. The IAs also generally rate their systems high in
terms of water delivery, flexibility, reliability and equitability, and themselves in terms of water
distribution and canal maintenance, indicating the high relative impact of NIA to the farmers.
There is no distinct pattern based on size of FUSA on the performance of CIS and functionality
of IAs. Crucial is the capacity of each IA to harness its organizational capacity to build human,
financial, social capital, thus, the need for continuous capacity building. CIS development
remains dependent on government (i.e., NIA) assistance and the planned management transfer
to LGUs based on AFMA is rarely implemented, if at all. Problems of sustainability of
irrigation infrastructure loom due to persistent environmental problems (watershed
degradation, siltation, extreme climate-related events). IAs apparently have none or limited
role in watershed management but these can serve as partners in watershed management
programs. The role of IDOs is very crucial but even with a heavy workload they are not getting
adequate incentives (e.g. security of tenure and other benefits. Most often, IDOs are hired on
job order basis with salaries drawn from CIS project budget.
All of the IAs interviewed were grateful for the FISA since they are relieved from paying the
cost of their CIS. The IAs continued to collect fees from their members for their O&M,
referring to them as irrigation management fee (IMF) or association service charge (ASC).
However, some IA members are reluctant to pay any fee citing the implementation of FISA.
IA’s concerns in O&M and inadequate funds are persistent. FISA declared that O&M cost shall
be provided by the national government. Therefore, there should be clear guidelines or
provisions on this. FISA maintains the significant role of NIA in providing technical support
to IAs and in building IAs’ capacity to sustain their functionality. Thus, linkage between NIA
and IAs should be sustained.
Keywords: communal irrigation systems, technical assessment, institutional assessment,
Free Irrigation Service Act
iii
Table of Contents
1. Introduction……………………………………………………………………………… 1 1.1. Rationale…………………………………………………………………………….. 1 1.2. Objectives……………………………………………………………………………. 2 2. Conceptual Framework………………………………………………………………... 3 3. Review of Literature……………………………………………………………………. 5 3.1. Status of Communal Irrigation Systems………………………………………….. 5 3.2. Communal Irrigation Systems Development…………………………………….. 7 3.3. Rehabilitation………………………………………………………………………... 10 4. Methodology…………………………………………………………………………….. 12 4.1. Analytical Tools and Approach……………………………………………………. 12 4.2. Sources of Data……………………………………………………………………... 13 5. Major Policy Reform for Communal Irrigation Systems………………………… 14 5.1. Republic Act No. 10969 – Free Irrigation Service Act…………………………... 14 5.2. NIA Memorandum Circular No. 13, series of 2017 – Guidelines on Free Irrigation Service…………………………………………….. 14 5.3. NIA Memorandum Circular No. 68, series of 2017 – Amendment to MC #13 S. 2017 RE: Guidelines on Free Irrigation Service……………………. 15 6. Communal Irrigation Systems at the IMO Level…………………………………... 16 6.1. Firmed-up Service Area……………………………………………………………. 16 6.2. Type of Technology and Operational Status…………………………………….. 30 6.3. Cropping Intensity………………………………………………………………….. 30 6.4. Yield………………………………………………………………………………….. 32 6.5. Functionality of Communal Irrigators’ Associations……………………………... 33 6.6. Deployment of Institutional Development Officers………………………………. 35 6.7. Cost Payment Schemes……………………………………………………………. 36 7. Results of Technical Survey of Selected Communal Irrigation Systems…….. 37 7.1. Sources of Water……………………………………………………………………. 43 7.2. Water Delivery Performance………………………………………………………. 47 7.3. Water Management Practices……………………………………………………... 49 7.4. Sedimentation Problems…………………………………………………………… 50 7.5. Silt Control Devices…………………………………………………………………. 53 7.6. Technical or Hardware Design Considerations………………………………….. 56 8. Results of the Survey of Selected Communal Irrigators’ Associations……… 63 8.1. Size of Irrigators’ Associations and Tenure Status of Members……………….. 63 8.2. Firmed-up Service Area and Type of Technology………………………………. 64 8.3. Water Permit and Registration with the Securities and Exchange Commission…………………………………………………………………………. 66 8.4. Cropping Season……………………………………………………………………. 68 8.5. Firmed-up Service Area, Area Actually Irrigated, and Cropping Intensity……. 70 8.6. Palay Yield…………………………………………………………………………… 72 8.7. Cost Payment Schemes……………………………………………………………. 74 8.8. IAs’ Perception on FISA……………………………………………………………. 77 8.9. Collection Efficiency………………………………………………………………… 78 8.10. Financial Status of Viability of IAs……………………………………………….. 80 8.11. Pump Usage……………………………………………………………………….. 87

iv
9. Success Indicators of IAs…………………………………………………………….. 88 9.1. Functionality of Irrigators’ Associations…………………………………………. 88 9.2. Examples of Good Practices……………………………………………………... 93 9.3. Assistance Received by Irrigators’ Associations………………………………. 95 9.4. Problems Encountered by Irrigators’ Association……………………………… 96 10. Emerging Issues and Concerns……………………………………………………… 100 11. Conclusions and Recommendations ……………………………………………... 101 12. Members of the CIS Team…………………………………………………………….. 106 13. Bibliography……………………………………………………………………………... 106 14. Glossary of Terms……………………………………………………………………… 109 15. List of Acronyms……………………………………………………………………….. 111 16. Annexes………………………………………………………………………………….. 113 16.1A. Highlights of Interviews with IA Officials and Members and
Walkthroughs of the Sample Communal Irrigation Systems in Luzon…….. 113 16.1B. Highlights of Interviews with IA Officials and Members and
Walkthroughs of the Sample Communal Irrigation Systems in Visayas…... 182 16.1C. Highlights of Interviews with IA Officials and Members and
Walkthroughs of the Sample Communal Irrigation Systems in Mindanao… 207 16.2A. Location of the Communal Irrigation Systems in Luzon
based on Slope Map……………………………………………………………. 241 16.2B. Location of the Communal Irrigation Systems in Visayas and Mindanao
based on Slope Map……………………………………………………………. 252 16.3A. Location of the Communal Irrigation Systems in Luzon
based on Groundwater Potential Map………………………………………… 257 16.3B. Location of the Communal Irrigation Systems in Visayas and Mindanao
based on Groundwater Potential Map………………………………………… 269 16.4A. Location of the Communal Irrigation Systems in Luzon
based on Soil Erosion Map…………………………………………………….. 274 16.4B. Location of the Communal Irrigation Systems in Visayas and Mindanao
based on Soil Erosion Map…………………………………………………….. 286 16.5. Revised Focus Group Discussion Questionnaire……………………………. 291 List of Tables Table 1. Status of irrigation development in the Philippines as of Dec. 31, 2017…………. 6 Table 2. Generated and rehabilitated areas by NIA from 2006-2013……………………….. 12 Table 3a. Communal irrigation systems by sample provinces (IMOs) in Luzon…………… 17 Table 3b. Communal irrigation systems by sample provinces (IMOs) in Visayas…………. 19 Table 3c. Communal irrigation systems by sample provinces (IMOs) in Mindanao………. 20 Table 4. Frequency distribution of CIS by size of FUSA and technology type in all the sample irrigation management offices…………………………………………… 28 Table 5. Average cropping intensity of the CIS from different IMOs visited………………... 31 Table 6. Number of CIS based on cropping intensity brackets under wet and dry seasons for all the IMOs visited……………………………………………………… 32 Table 7. Average palay yield in all the selected irrigation management offices…………… 32
v
Table 8. Average functionality rating of the communal irrigators’ associations in all the sample IMOs………………………………………………………………… 34 Table 9. Deployment of institutional development officers (IDOs) to CIS In all the sample IMOs………………………………………………………………… 36 Table 10. Cost payment schemes of irrigators associations in the selected IMOs………... 37 Table 11a. Profile of the 66 selected CIS in Luzon…………………………………………… 38 Table 11b. Profile of the 12 selected CIS in Visayas…………………………………………. 41 Table 11c. Profile of the 12 selected CIS in Mindanao……………………………………….. 42 Table 12. Water delivery performance indices in all the IMOs visited………………………. 48 Table 13. Water management practices in all the IMOs visited……………………………... 49 Table 14. Silt and seepage levels in the canal of CIS for each IMOs………………………. 52 Table 15. Condition of the cross regulators in all IMOs visited………………………………. 59 Table 16. Water delivery service performance of CIS in all IMOS visited………………….. 61 Table 17. Performance on water distribution, maintenance of canals, and maintenance of control structures in all the IMOs visited…………………………. 62 Table 18. Number of members of IAs and tenure status of members In all provinces visited………………………………………………………………… 64 Table 19. Frequency distribution of the sample CIS by FUSA and type of technology in all selected provinces………………………………………………… 65 Table 20. Frequency distribution of CIS by number of barangays covered in all selected provinces…………………………………………………………………. 66 Table 21. Frequency distribution of CIS IAs with water permit in all
selected provinces…………………………………………………………………….. 67 Table 22. Frequency distribution of IAs in all selected provinces that registered with the Securities and Exchange Commission and the start of operation of the CIS…... 68 Table 23a. Cropping calendar of the 66 sample IAs in 11 provinces in Luzon…………….. 69 Table 23b. Cropping calendar of the 12 sample IAs in 4 selected provinces
in Visayas……………………………………………………………………………. 70 Table 23c. Cropping calendar of the 12 sample IAs in 4 selected provinces
in Mindanao………………………………………………………………………….. 70 Table 24. Average FUSA, average area actually irrigated during wet and dry season, and cropping intensity for all sample IAs in all selected provinces……………… 71 Table 25. Average cropping intensity by size of FUSA of all sample IAs in the selected provinces…………………………………………………………………….. 72 Table 26. Frequency distribution of the sample CIS by rice yield in all
selected provinces…………………………………………………………………….. 73 Table 27. Frequency distribution of the rice yields during wet and dry seasons
according to FUSA of the sample CIS in all selected provinces…………………. 74 Table 28. Cost payment schemes of all sample IAs in all selected provinces……………... 75 Table 29. Average amount of loan for all sample IAs in all selected provinces……………. 76 Table 30. Average amounts of loan by FUSA size of sample IAs in the
selected provinces…………………………………………………………………….. 76 Table 31. Frequency distribution on the effects of the implementation of FISA to the sample IAs in the selected provinces in Visayas and Mindanao………………… 77 Table 32. Frequency distribution of collection efficiency of all sample IAs in the selected provinces…………………………………………………………………….. 78 Table 33. Frequency distribution of collection efficiency by FUSA of all sample IAs
in the selected provinces……………………………………………………………... 79 Table 34. Average income, expenditures and viability of all sample IAs in the selected provinces…………………………………………………………………….. 81 Table 35. Average income, expenditures and viability of all sample IAs by FUSA size……………………………………………………………………………… 82 Table 36. Frequency distribution of all sample IAs by viability ratio in the
selected provinces…………………………………………………………………….. 82
vi
Table 37. Frequency of sample IAs by viability ratio and size of FUSA…………………….. 83 Table 38a. Average production cost and return per ha of the 66 sample IAs in 11 selected provinces in Luzon…………………………………………………….. 84 Table 38b. Average production cost and returns per ha of the 12 sample IAs in 4 selected provinces in Visayas……………………………………………………. 84 Table 38c. Average production cost and returns per ha of the 12 sample IAs in 4 selected provinces in Mindanao…………………………………………………. 85 Table 39. Frequency distribution of sample IAs by functionality rating in all selected provinces…………………………………………………………………….. 89 Table 40a. Average rating of the individual indicators for IAs’ functionality rating in 11 selected provinces in Luzon………………………………………………………... 90 Table 40b. Average rating of the individual indicators for IAs’ functionality rating in 4 selected provinces in Visayas……………………………………………………… 90 Table 40c. Average rating of the individual indicators for IAs’ functionality rating in 4 selected provinces in Mindanao……………………………………………………. 91 Table 41a. Self-rating by IAs of their financial strength in 11 selected provinces
in Luzon………………………………………………………………………………. 91 Table 41b. Self-rating by IAs of their financial strength in 4 selected provinces
in Visayas…………………………………………………………………………….. 92 Table 41c. Self-rating by IAs of their financial strength in 4 selected provinces
in Mindanao…………………………………………………………………………... 92 Table 42. Problems/issues reported by the sample IAs in the selected provinces………... 97 Table 43. Frequency distribution of coping strategies of IAs during dry spell in all selected provinces…………………………………………………………………….. 98 Table 44. Frequency distribution of sample IAs by suggestions to address their
concerns……………………………………………………………………………….. 99 List of Figures Figure 1. Conceptual framework of rapid appraisal procedure (RAP) and MASSCOTE…. 4 Figure 2. CIS Performance (FUSA, Irrigated Area and Cropping Intensity) of
Ilocos Norte from 2005-2014………………………………………………………… 21 Figure 3. CIS Performance of Pangasinan from 2005-2014…………………………………. 21 Figure 4. CIS Performance of Benguet from 2005-2014……………………………………... 21 Figure 5. CIS Performance of Isabela from 2005-2014………………………………………. 22 Figure 6. CIS Performance of Cagayan-Batanes from 2005-2014………………………….. 22 Figure 7. CIS Performance of Nueva Vizcaya from 2005-2014……………………………... 22 Figure 8. CIS Performance of Bulacan-Aurora-Nueva Ecija from 2005-2014……………… 23 Figure 9. CIS Performance of Pampanga-Bataan from 2005-2014…………………………. 23 Figure 10. CIS Performance of Camarines Sur from 2005-2014……………………………. 23 Figure 11. CIS Performance of Laguna-Rizal from 2005-2014……………………………… 24 Figure 12. CIS Performance of Occidental Mindoro from 2005-2014………………………. 24 Figure 13. CIS Performance of Bohol from 2014-2017………………………………………. 24 Figure 14. CIS Performance of Leyte from 2014-2017……………………………………….. 25 Figure 15. CIS Performance of Iloilo from 2014-2017………………………………………… 25 Figure 16. CIS Performance of Capiz from 2014-2017………………………………………. 25 Figure 17. CIS Performance of Davao del Sur from 2014-2017…………………………….. 26 Figure 18. CIS Performance of North Cotabato from 2014-2017……………………………. 26 Figure 19. CIS Performance of South Cotabato from 2014-2017…………………………… 26 Figure 20. CIS Performance of Bukidnon from 2014-2017…………………………………... 27 Figure 21a. Percent distribution of CIS by FUSA and province in the
11 selected IMOs in Luzon………………………………………………………... 29

vii
Figure 21b. Percent distribution of CIS by FUSA and province in the 4 selected IMOs in Visayas……………………………………………………….. 29
Figure 21c. Percent distribution of CIS by FUSA and province in the 4 selected IMOs in Mindanao…………………………………………………….. 30
Figure 22a. Percentage distribution of communal IAs by functionality rating and province in 11 sample IMOs in Luzon, 2014…………………………………… 34 Figure 22b. Percentage distribution of communal IAs by functionality rating and province in 4 sample IMOs in Visayas, 2017…………………………………… 35 Figure 22c. Percentage distribution of communal IAs by functionality rating and province in 4 sample IMOs in Mindanao, 2017………………………………… 35 Figure 23. Construction of silt excluder at the MaIRIS……………………………………….. 54 Figure 24. Sediment sampling and monitoring at MAIRIS…………………………………… 54 Figure 25. Settling basin at the Mlang RIS…………………………………………………….. 55 Figure 26. Clearing of the setting basin by combine manual and hydraulic Fludhing using the silt ejector during the fallow period………………………….. 55 Figure 27. Silt control device in Del Carmen CIS and LMT CIS……………………………... 56 Figure 28a. Current market price (₱/ha) of land reported by IAs in 11 selected provinces in Luzon………………………………………………………………….. 86 Figure 28b. Current market price (₱/ha) of land reported by IAs in 4 selected provinces in Visayas………………………………………………………………... 86 Figure 28c. Current market price (₱/ha) of land reported by IAs in 4 selected provinces in Mindanao……………………………………………………………… 86 Figure 29a. Rating by the sample IAs in Luzon on the assistance provided by the
National Irrigation Administration…………………………………………………. 95
Figure 29b. Rating by the sample IAs in Visayas on the assistance provided by the
National Irrigation Administration…………………………………………………. 96
Figure 29c. Rating by the sample IAs in Mindanao on the assistance provided by the
National Irrigation Administration…………………………………………………. 96
1Associate Professor and Head of the Land and Water Resources Division at the Institute of Agricultural Engineering, University of the Philippines Los Baños (UPLB) 2University Researcher at the Center for Strategic Planning and Policy Studies–College of Public Affairs and Development, UPLB
1
Assessing the Resurgent Irrigation Development Program of the Philippines—Communal irrigation systems component
Roger A. Luyun Jr1 and Dulce D. Elazegui2
1. Introduction 1.1. Rationale
Irrigation projects are important components of sustainable agricultural and rural development.
Irrigation enables farmers to exercise better control over their crop production environment.
On the average, irrigation increases crop yield up to about 60 percent of the potential or
optimum levels. Irrigation sector development in the Philippines has been a key policy
instrument in addressing rice insufficiency which the country has been experiencing especially
in times of high world prices, calamities and El Nino episodes. The most recent example is the
Department of Agriculture’s (DA) food staple sufficiency program (FSSP) which was
essentially irrigation for rice despite pronouncements of diversification and provision of other
support services in agriculture.
Irrigation development and management in the country has historically been the single biggest
item of public expenditure for agriculture, accounting for about a third of the total since the
1960’s. In the 1970s and early 1980s, as well as in recent years when world rice prices rose at
unprecedented levels, this ratio averaged at close to half of total public expenditures for
agriculture. Between 2011 to 2015, irrigation has taken up 31 to 46% of the budget of the
Department of Agriculture (DA). This heavy bias on irrigation investment as a tool for
addressing food insufficiency has been largely embraced by the recent administration with
massive increases in funding for irrigation in 2017 and 2018. Appropriations for irrigation rose
from ₱8 billion in 2008 to ₱24.4 billion in 2012. Over the next five years, funding for the
irrigation program averaged ₱25 billion a year.
The Philippine Development Plan 2017-22 aims at an irrigation area ratio of 65.07 percent by
2022, up from 57.33 percent in 2015, or an additional 233,700 ha of irrigated area over a six-
year period (corresponding to ₱70.2 billion at ₱300,000 development cost per ha) In view of
the importance of irrigation in terms of national budget allocation and its expected
contributions to agriculture and food self-sufficiency, it is only fitting to examine what is
exactly happening in this sector, where the money is going, what will be delivered and whether
the investments will increase productivity and be sustainable.
Many irrigation projects perform far below expectations primarily because of low water use
efficiency. Available information indicate irrigation water use efficiencies in the order of 30%
to 40% compared to design assumption overall efficiency of 50% or more. The end result is
low cropping intensity (less than 130% for Philippines) and very low unit area productivity
(David, 2003). A host of other issues and problems include unsuitable design philosophy and
criteria, cost of operation and maintenance, inadequate support services, and institutional and
governance issues. Sustainable irrigation development requires sound planning, design and
operation and maintenance of irrigation facilities and effective delivery of irrigated agriculture
support services and functions. Such services and functions include policy formulation and
2
adjustments to promote a favorable environment for the development of efficient and effective
irrigation facilities, agricultural and agro-industrial extension, capacity building at the
grassroots level, credit and marketing facilities and inputs supply and distribution.
1.2. Objectives The project aims to evaluate the effectiveness and efficiency of the government's irrigation
program. It will focus on the technical, physical, and institutional aspects of performance of
both national (NIS) and communal irrigation systems (CIS), and selected case studies.
Technical and institutional evaluation will be conducted along the stages of the project cycle,
namely: project identification; project preparation, appraisal, and selection; project
implementation; operations maintenance; and monitoring and evaluation.
To establish baseline information for and provide preliminary evaluation of investments in CIS,
this component of the project seeks to meet the following specific objectives:
a) Assess the performance of CIS based on field investigation covering the following systems:
i. In the Visayas, three (3) CIS each in Leyte, Capiz, Iloilo, Bohol, and if budget allows,
Negros Occidental;
ii. In Mindanao, three (3) CIS each in North Cotabato, South Cotabato, Davao del Sur,
Bukidnon, and if budget allows, Agusan del Norte.
b) Prepare a report on CIS evaluation that covers the following:
i. List of CIS under the Irrigation Management Offices (IMOs) and available data
including functionality survey results;
ii. Technical data (i.e. physical state, service area, irrigation efficiency, source of water,
access to and availability of water, year constructed and start of operations,
construction cost, rehabilitation cost, other major investments, yield, cropping
calendar, cropping intensity; and, where available, rainfall and other climatic data;
iii. Status of IAs (i.e. profile/institutional report of IAs, source of funding, financial
status/viability, program of works (POWs) for all available years, and communal
irrigation system performance (CISPER);
iv. Assistance provided by NIA and other agencies to IAs;
v. Where available, technical references including feasibility studies, technical
drawings, network maps will be obtained and reviewed covering technical
specifications, canal layout, location and functions of irrigation structures, and
irrigated and built-up areas;
vi. Status and current conditions of the main canal, selected secondary, and tertiary
canals;
vii. Socio-economic characteristics of farmer-members, institutional capacity of IA,
problems and constraints in managing the CIS by the IAs;
viii. Conduct walk-throughs and actual measurements for a subset of the sample CIS to
gauge the physical conditions of the systems;
• current vs. designed dam/reservoir capacity; length and efficiencies of lined
vs. unlined canals; legal and illegal turnouts, including functionality; for pump
systems: fully, partially operational, or non-operational pumps; among
others).
• identify, geo-tag and evaluate dam, water control, measuring and conveyance
structures;
3
ix. Characterize and evaluate the incidence of individual pump usage within or near the
selected CIS, in terms of effectiveness and cost, in relation to gravity irrigation users,
and;
c) With inputs from the socio-economist, integrate the findings of Cycle 1 and 2 into a single
assessment report. Where applicable, the assessment shall cover operational and institutional
factors related to construction and management of CIS. The report shall also include a set
of recommendations for project implementation and systems management for CIS.
d) Present the preliminary results in an internal Research Workshop at PIDS, and the final
paper at a public seminar organized by PIDS.
e) Discuss the problems/issues encountered by the IAs and farmers in relation to the operation
and management of the irrigation system, access to funds for rehabilitation (LGU, NIA,
other government agencies), access to production credit (including providers), technical
support from NIA, support services from the DA, and their access to water (quantity and
timeliness).
2. Conceptual Framework The CIS assessment will be based on the rapid appraisal procedure (RAP) of irrigation projects
by Burt and Styles (1999) and mapping systems and services for canal operation techniques
(MASSCOTE) of FAO (Renault et al. 2007). The procedure provides a holistic overview of
irrigation projects to show the factors affecting service delivery of irrigation systems (Figure
1). The framework maps the service to users taking into account the constraints, the
opportunities for water management improvement, and the costs. This mapping in turn serves
as an input in formulating strategies for water management service delivery, canal operation
and modernization.
The framework describes a rapid appraisal process that take into account the various hardware
design and management factors that affect service and correspondingly, the physical and
institutional constraints which include aspects of water supply and sources of water and
capacities of parties involved, availability and flexibility of funding, respectively.
Figure 1 shows some of the major inter-relationships which affect outputs from irrigation
projects/systems. The RAP builds knowledge on the constraints and opportunities that the
system management has to consider. Earlier applications in irrigation projects demonstrate that
RAP, if developed and conducted properly, is a valuable diagnostic tool for a process and
performance assessment. The RAP examines the hardware and processes used to convey and
distribute water internally to all levels within the project (from the source to the fields).
This study will be limited to the application of the RAP and not the entire MASSCOTE
approach because of the expected inadequate data. The RAP outputs include external and
internal indicators. External indicators examine inputs and outputs of the whole project/system
while internal indicators examine processes and hardware within the project/system. The
internal indicators identify key factors related to water control throughout a project/system.
They define level of water delivery service provided to users and examine specific hardware
and management techniques and processes used in the control and distribution of water. The
external indicators include ratios or percentages comparing project inputs and outputs to
describe performance, measures of forms of efficiencies related to budgets, water, yields, etc.

4
Some questions on water users’ association from MASSCOTE will be used in the assessment.
This includes IA items on land ownership, IA budget and expenditures, basis of water charges,
rating on IA’s enforcement of rules, and on financial strength.
Figure 1. Conceptual framework of rapid appraisal procedure (RAP) and MASSCOTE. Source: Burt and Styles (1999) and Renault et al. (2007).

5
3. Review of Literature 3.1. Status of Communal Irrigation Systems NIA defines an irrigation service area as an area with irrigation facilities. The NIA service
area refers to the target irrigable area during project development stage and should be
differentiated from the irrigation command area or the actual area irrigated. The three types of
irrigation are distinguished by its size, source of water, technology of water extraction and
distribution, and the nature of governance.
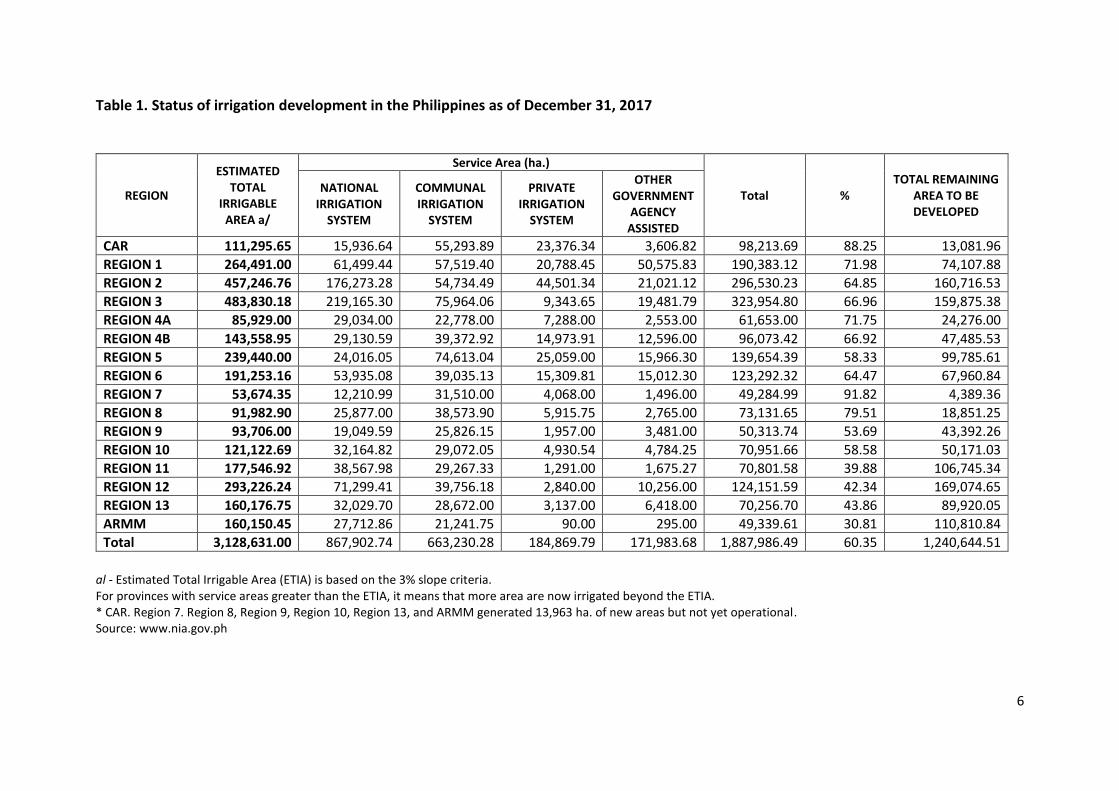
Irrigation development in the Philippines has attained over 60% of total irrigable area of 3.1
million ha. Communal irrigation system covered approximately 663 thousand hectares,
accounting for 35% of the total area served by irrigation systems in the country (Table 1).
Development of irrigation system lags in the Mindanao region considering the large irrigable
area, relative to Luzon and Visayas region.
Communal Irrigation Systems have service areas that are generally below 1,000 ha. At least
95% of CIS are gravity systems obtaining water from rivers or streams, though a few have been
given funding support for medium sized pumps to also abstract and distribute water from a
river. While most CIS are constructed by NIA, the IA is responsible for management and
maintenance of the system.
David (2003) noted that from the early 1970s through mid-1980s, the government invested
heavily in gravity irrigation systems development. In some years during this period, the
investment in irrigation facilities accounted for more than 10% of the national budget for
infrastructure. This heavy spending resulted in significant increase of the level of irrigation
development, peaking at about 33% in 1993. However, the level of irrigation development went
down to as low as 27% in 1994 and has been fluctuating from 27% to 30% since then.
The viability and effectiveness of an irrigation system depends on the design criteria used in
planning and development. For instance, field observations in Ilocos Norte revealed that design
shortcomings contributed to the poor operation and maintenance, and performance of gravity
irrigation systems. This includes include errors in estimating design floods and sediment loads
of rivers, lack of head control structures, ungated intake structures, and faulty design of farm
ditches. The rate of deterioration at 140,000 ha per year of both NIS and CIS between 1996
and 2004 casts doubt on the sustainability of irrigation systems in the country. Institutional and
policy reforms have to be effectively pursued (DA-UPLBFI 2007).
6
Table 1. Status of irrigation development in the Philippines as of December 31, 2017
REGION
ESTIMATED TOTAL
IRRIGABLE AREA a/
Service Area (ha.)
Total % TOTAL REMAINING
AREA TO BE DEVELOPED
NATIONAL IRRIGATION
SYSTEM
COMMUNAL IRRIGATION
SYSTEM
PRIVATE IRRIGATION
SYSTEM
OTHER GOVERNMENT
AGENCY ASSISTED
CAR 111,295.65 15,936.64 55,293.89 23,376.34 3,606.82 98,213.69 88.25 13,081.96
REGION 1 264,491.00 61,499.44 57,519.40 20,788.45 50,575.83 190,383.12 71.98 74,107.88
REGION 2 457,246.76 176,273.28 54,734.49 44,501.34 21,021.12 296,530.23 64.85 160,716.53
REGION 3 483,830.18 219,165.30 75,964.06 9,343.65 19,481.79 323,954.80 66.96 159,875.38
REGION 4A 85,929.00 29,034.00 22,778.00 7,288.00 2,553.00 61,653.00 71.75 24,276.00
REGION 4B 143,558.95 29,130.59 39,372.92 14,973.91 12,596.00 96,073.42 66.92 47,485.53
REGION 5 239,440.00 24,016.05 74,613.04 25,059.00 15,966.30 139,654.39 58.33 99,785.61
REGION 6 191,253.16 53,935.08 39,035.13 15,309.81 15,012.30 123,292.32 64.47 67,960.84
REGION 7 53,674.35 12,210.99 31,510.00 4,068.00 1,496.00 49,284.99 91.82 4,389.36
REGION 8 91,982.90 25,877.00 38,573.90 5,915.75 2,765.00 73,131.65 79.51 18,851.25
REGION 9 93,706.00 19,049.59 25,826.15 1,957.00 3,481.00 50,313.74 53.69 43,392.26
REGION 10 121,122.69 32,164.82 29,072.05 4,930.54 4,784.25 70,951.66 58.58 50,171.03
REGION 11 177,546.92 38,567.98 29,267.33 1,291.00 1,675.27 70,801.58 39.88 106,745.34
REGION 12 293,226.24 71,299.41 39,756.18 2,840.00 10,256.00 124,151.59 42.34 169,074.65
REGION 13 160,176.75 32,029.70 28,672.00 3,137.00 6,418.00 70,256.70 43.86 89,920.05
ARMM 160,150.45 27,712.86 21,241.75 90.00 295.00 49,339.61 30.81 110,810.84
Total 3,128,631.00 867,902.74 663,230.28 184,869.79 171,983.68 1,887,986.49 60.35 1,240,644.51
al - Estimated Total Irrigable Area (ETIA) is based on the 3% slope criteria. For provinces with service areas greater than the ETIA, it means that more area are now irrigated beyond the ETIA. * CAR. Region 7. Region 8, Region 9, Region 10, Region 13, and ARMM generated 13,963 ha. of new areas but not yet operational. Source: www.nia.gov.ph

7
In an earlier study (delos Reyes and Jopillo 1986), one important factor in the existence of more
functional canals and structures is the involvement of farmers in planning the irrigation system.
The interventions (e.g., organizational structure, leadership, and systems management) of NIA
in the irrigators’ associations yielded positive impacts such as higher productivity, stronger
associations, improved water distribution, and better compliance with government policy.
Government investments in irrigation suffer from numerous design, implementation, and
maintenance issues, including failure to take into account counter-factual and conjunctive
individual investments in irrigation. Political pressures, rent-seeking, and corruption perpetuate
technical and economic inefficiencies in the irrigation and water sector (Wade, 1982; Repetto,
1986; Araral, 2005; Huppert, 2013). Huppert (2013) notes that local and international
professionals in the water sector compete for the promotion or protection of their common
interests, and resort to rent-seeking. These professionals are in the bureaucracy, foreign lending
agencies, consulting firms, and even local and international academic institutions dependent
on the irrigation agencies and international donors for funding. In the Philippines as perhaps
elsewhere, politicians interfere in project selection, construction, and rehabilitation,
distribution of water, and staff appointments and promotions. This is not just due to concerns
for constituents, but because they are themselves are landowners, contractors, or can
manipulate the contracting process.
The poor performance of irrigation systems has been attributed to several factors including:
inadequate database for planning; inadequate institutional capacity and mechanisms for
development; design mistakes; poor quality of construction; inadequate and fragmented
support services for irrigated-agriculture; and complexity of operation including the socio-
economic and institutional management (David, 2003).
3.2. Communal Irrigation Systems Development CIS may be built with or without government assistance. While many CIS started as private
initiatives, they have now mostly received some government funding support for the cost of
rehabilitation and new construction. With the rising cost of investment in CIS, farmers are
increasingly seeking assistance from the government. During the period between 1955-1959,
the government completed 59 CIS serving 7,500 ha and after 20 years, there were more than
900 CIS government-assisted projects remarkably expanding irrigated area to more than
300,000 ha (World Bank 1982).
The increasing government assistance to CIS projects between the 1950s and 1980s was
disrupted by the economic crisis in 1983-1985. Budget allocation of ₱130M per annum for CIS
program was reduced to ₱80M. This again increased in 1987 (World Bank 1990). Foreign
financing of CIS projects came in the mid-1970 as a component of rural development projects.
The Asian Development Bank assistance to CIS (to serve 3,000 has) in conjunction with NIS
project was the Mindoro Rural Development Project in 1975 followed by a Samar Rural
Development Project.
CIDP1 implemented in 1982 was followed by another project in 1990 (World Bank 1992). NIA
obtained loans from the International Bank for Reconstruction and Development (IBRD) and
International Fund for Agriculture and Development (IFAD). The four project components
were construction and rehabilitation of CIS; development of Communal IAs; institutional
development of NIA on communal irrigation; and agricultural development planning. The
project also aimed to strengthen the capability of Provincial Irrigation Offices for CIS

8
development, operation and maintenance. NIA’s role was limited to financial and technical
assistance in the design and construction of the CIS and organizing and training of IAs. CIS
would be turned over to IAs who will own, operate and manage the system. They had to
amortize with no interest the chargeable cost (excluding roads, buildings, overhead) of the CIS
project.
The World Bank project was based on a participatory approach developed by NIA in 1976
under a Special Communal Irrigation Pilot Project. Farmers were organized into IAs and
registered with the Securities and Exchange Commission (SEC), and training was provided.
However, in later years, the IA’s financial capacity and skills were not adequate to meet the
major repairs needed which had to wait for NIA to source funds. The major weakness was in
the O&M function. Low equity and amortization collection efficiency was due to behavioral
factors. Before CIDP, all CIS projects were constructed by the government free of charge to
farmer beneficiaries. Until the early 1970s, funds for CIS came from appropriation to
Congressional representatives and were not required to be repaid (Word Bank 1990).
The second CIDP project also aimed at institutional strengthening for long-term sustainability
of the CISs. The devolution of CIS to LGU with the issuance of Local Government Code
slowed down the project but the government decided eventually to have NIA execute the
project. The agricultural support services component of the project also got support from
concerned LGUs and complemented by DA programs (World Bank 2000).
Between 1984 and 1988, NIA’s achievement for CIS averaged to 7,200 ha per year for new
construction and 19,200 ha per year for rehabilitation for a five-year total of 132,000 ha.
Locally funded projects have been subjected to political influence sometimes resulting in
substandard quality construction and cost control (World Bank 1990).
The construction and maintenance of CIS was devolved to LGUs pursuant to the Local
Government Code of 1991 (Republic Act 7160). Before the Code’s enactment, the NIA
implemented locally-funded CIS with budget allocation of ₱518 million through the GAA.
This fund was transferred to the LGUs in 1992 through their internal revenue allotment (IRA).
However, many LGUs had no capacity to undertake CIS projects and the construction and
rehabilitation of CIS had been stalled. For several years beginning 1994, the government has
to appropriate additional funds in the GAA including ₱320 million to complete the construction
of several new CIS to irrigate additional 2,500 ha, and the repair and rehabilitation of existing
CIS irrigating 5,000 ha.
Republic Act No. 8435, or the Agriculture and Fisheries Modernization Act (AFMA) of 1997
(Section 31) again emphasized the devolution of planning, design and management of CIS to
LGUs. It also mandated NIA to continue providing technical assistance to the LGUs even after
complete transfer of NIA’s assets and resources in relation to CIS to the LGU.
The average cost of this CIS construction and rehabilitation was over ₱42,000 per hectare.
Between 2001 and 2011, serviceable area of CIS slowly grew by 11% from 0.511 M ha to
0.566 M ha. Inocencio (2014) noted the increasing trends in investments in CIS from 1995 to
2010. One reason for this is that there are more areas that can be developed for CIS compared
to NIS
Average collection efficiency did not improve at around 40% level until 2014 when it rose to
60%. Collection efficiency presented here is the ratio of actual amortization collection (current

9
+ back) to the estimated amortization collectibles expressed in percent. Cost recovery in the
Philippines reportedly can never approach 100% because of the 50-year amortization period
without interest (World Bank 1982). This government policy favors irrigators. Repayments in
cash or in kind are valued at current market (NFA) price, and therefore roughly indexed to
inflation rate (World Bank 1982). Under the CIDP I, collection efficiency was about 50% for
new systems and 36% for rehabilitation. But nationwide collection was only at 6-7% of
obligations. NIA did not charge for O&M (World Bank 1990). With the enactment of Republic
Act No. 10969 or the Free Irrigation Service Act, the policy landscape drastically changed. All
farmers with landholdings of eight (8) hectares and below are exempted from paying irrigation
service fees (ISF). All unpaid ISF, all loans, past due accounts and the corresponding interests
and penalties, are also condoned and written off from the books of NIA.
Problems of sustainability of irrigation infrastructure include very optimistic benefit cost-
estimation during the planning stage of the project. For instance, the area estimated to be served
by the irrigation system is generally much larger than what is actually served. Projected yields
are also overestimated but water use efficiency declines over the years. Another cause is lack
of investments in recurrent costs associated with operation and maintenance (O&M) activities
once construction is completed (Ostrom 1992). Donors normally restrict their involvement to
design and construction and view O&M as a responsibility of the recipient of the system.
Routine maintenance is delayed until deterioration of the system is large enough to require
rehabilitation.
While O&M problems affect individual users, the challenge is distributing water to all sections
of the system. The persistent problem in water distribution is due not only to technical aspects
of the system but also due to institutional factors governing water allocation. These relate to
availability, reliability, predictability, manageability and equality. The first three relate to
water rights wherein the user expects to get water at a timely and predictable schedule.
Manageability refers to the combined control of users over quantity and timing of water
deliveries. Equality refers to sharing of benefits commensurate to fees paid and services
rendered. Achieving equality in distribution of water is difficult to achieve due to the
technology of irrigation system itself and existing socio-economic conditions. The ‘tail-end
syndrome’ indicates the positional advantage of upstream versus downstream due to
topographic and conveyance conditions. The unequal tenurial, social and political status leads
to differential access to water (Cruz 1982).
In compliance with the intent of the local government code, the national government has been
implementing irrigation development programs which involved LGUs. These included the
Poverty Alleviation Fund (PAF), Balikatan Sagip Patubig Program (BSPP), and the Southern
Philippines Irrigation Sector Project (SPISP). However, LGU’s accomplishment on CIS
development and management under the BSPP has been minimal.
The AFMA of 1997 also mandated that the DA, particularly through the NIA and the
Agricultural Training Institute (ATI) in collaboration with the Department of Finance (DOF)
and the Department of Interior and Local Government (DILG), shall conduct a capability
building program for the LGUs, including technical and financial assistance, logistical support,
and training, to enable LGUs to independently and successfully sustain the CIS. This task was
however not accomplished due to lack of coordinated efforts to improve technical capacity of
LGUs and lack of political will to implement the AFMA. Specifically, on the part of NIA, there
was also the lack of interest to fully implement the AFMA. There has really been limited
capacity-building for LGUs and IAs.
10
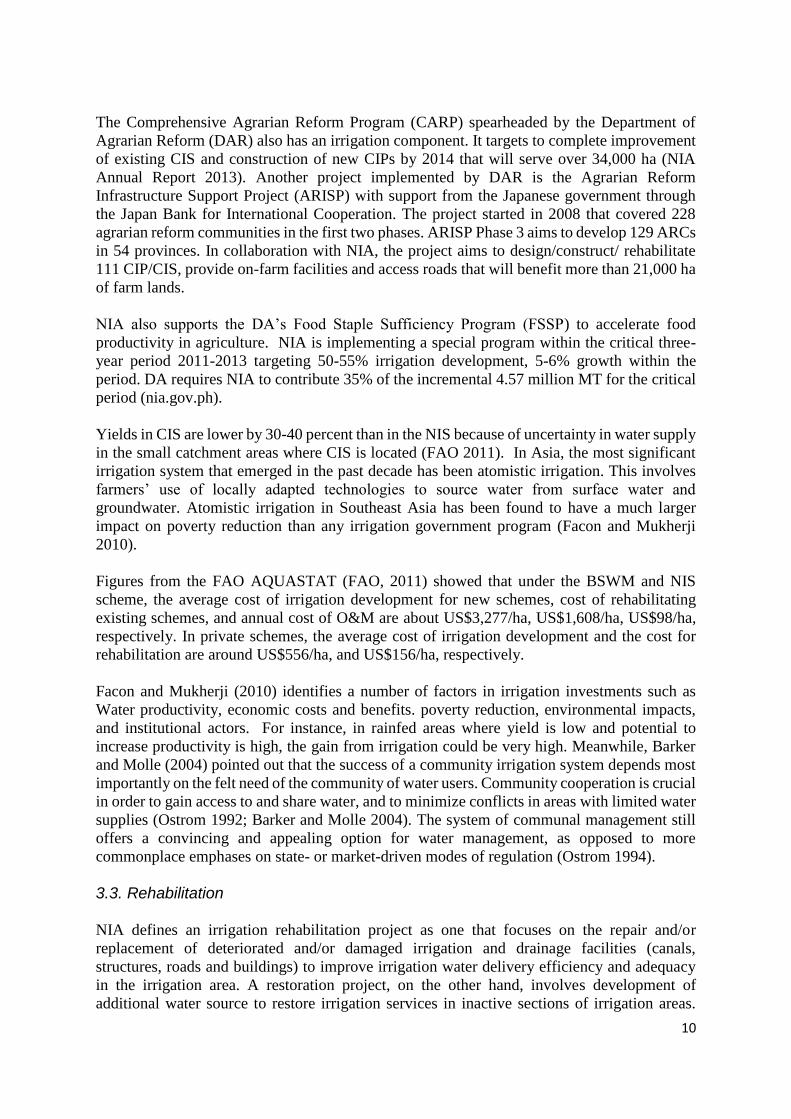
The Comprehensive Agrarian Reform Program (CARP) spearheaded by the Department of
Agrarian Reform (DAR) also has an irrigation component. It targets to complete improvement
of existing CIS and construction of new CIPs by 2014 that will serve over 34,000 ha (NIA
Annual Report 2013). Another project implemented by DAR is the Agrarian Reform
Infrastructure Support Project (ARISP) with support from the Japanese government through
the Japan Bank for International Cooperation. The project started in 2008 that covered 228
agrarian reform communities in the first two phases. ARISP Phase 3 aims to develop 129 ARCs
in 54 provinces. In collaboration with NIA, the project aims to design/construct/ rehabilitate
111 CIP/CIS, provide on-farm facilities and access roads that will benefit more than 21,000 ha
of farm lands.
NIA also supports the DA’s Food Staple Sufficiency Program (FSSP) to accelerate food
productivity in agriculture. NIA is implementing a special program within the critical three-
year period 2011-2013 targeting 50-55% irrigation development, 5-6% growth within the
period. DA requires NIA to contribute 35% of the incremental 4.57 million MT for the critical
period (nia.gov.ph).
Yields in CIS are lower by 30-40 percent than in the NIS because of uncertainty in water supply
in the small catchment areas where CIS is located (FAO 2011). In Asia, the most significant
irrigation system that emerged in the past decade has been atomistic irrigation. This involves
farmers’ use of locally adapted technologies to source water from surface water and
groundwater. Atomistic irrigation in Southeast Asia has been found to have a much larger
impact on poverty reduction than any irrigation government program (Facon and Mukherji
2010).
Figures from the FAO AQUASTAT (FAO, 2011) showed that under the BSWM and NIS
scheme, the average cost of irrigation development for new schemes, cost of rehabilitating
existing schemes, and annual cost of O&M are about US$3,277/ha, US$1,608/ha, US$98/ha,
respectively. In private schemes, the average cost of irrigation development and the cost for
rehabilitation are around US$556/ha, and US$156/ha, respectively.
Facon and Mukherji (2010) identifies a number of factors in irrigation investments such as
Water productivity, economic costs and benefits. poverty reduction, environmental impacts,
and institutional actors. For instance, in rainfed areas where yield is low and potential to
increase productivity is high, the gain from irrigation could be very high. Meanwhile, Barker
and Molle (2004) pointed out that the success of a community irrigation system depends most
importantly on the felt need of the community of water users. Community cooperation is crucial
in order to gain access to and share water, and to minimize conflicts in areas with limited water
supplies (Ostrom 1992; Barker and Molle 2004). The system of communal management still
offers a convincing and appealing option for water management, as opposed to more
commonplace emphases on state- or market-driven modes of regulation (Ostrom 1994).
3.3. Rehabilitation NIA defines an irrigation rehabilitation project as one that focuses on the repair and/or
replacement of deteriorated and/or damaged irrigation and drainage facilities (canals,
structures, roads and buildings) to improve irrigation water delivery efficiency and adequacy
in the irrigation area. A restoration project, on the other hand, involves development of
additional water source to restore irrigation services in inactive sections of irrigation areas.
11
According to key informants from NIA, new CIS project costs about ₱300,000/ha;
rehabilitation project cost about ₱60,000 to ₱80,000/ha; and restoration project cost about
₱100,000-120,000/ha.
It has been estimated that an average of 55,000 ha of CIS and NIS service areas must be
rehabilitated each year in order to maintain the same level of NIS and CIS development in the
late 1980s (David 2003). An average of about 70,000 ha per year must be rehabilitated or
renovated in order to maintain the same level of NIS and CIS development during the period
from 1992 to 1996. In a practical sense, the need for rehabilitation resulted from cumulative
operation and maintenance (O&M) neglect and design mistakes. Improvement in NIS and CIS
operation and maintenance will be more cost-effective than rehabilitation. Therefore, it is but
logical that the focus in the case of NIS and CIS under AFMA should not only be on
rehabilitation but also on improvement of O&M as well.
David (2003) also noted that due to the poor performance of NIS and CIS, the government
funds for irrigation since the late 1980s has mostly supported the rehabilitation of such systems.
However, conventional rehabilitation of restoring the irrigation infrastructure to its original
design without rectifying apparent unrealistic design considerations have not been very
effective.
David (2009) analyzed the impact of AFMA on the performance of canal irrigation systems
during the post-AFMA years from 1998 to 2004. The accomplishments in terms of new service
area generated and rehabilitated were 132,382 ha and 1,043,574 ha, respectively, for a total of
about 1,175,956 ha, or about 168,000 ha/yr. This amounted to a total irrigation service area
increase of only 62,000 ha, or about 9,000 ha/yr. This finding implies a rate of deterioration of
around 159,000 ha/yr, a significant increase from 70,000 ha/yr during the pre-AFMA years
from 1992-1996 earlier reported by David (2003). The total new area generated and
rehabilitated for the period was about 96% of the total service area at the end of 2004. David
(2009) showed that from 1995-2005 there was a very slow annual rate of increase of only about
10,000 ha in the actual NIS and CIS service areas despite massive efforts of rehabilitating an
average of 125,597 ha/yr and constructing new irrigation facilities at 19,285 ha/yr. For this
period the annual deterioration rate is about 134,000 ha/yr.
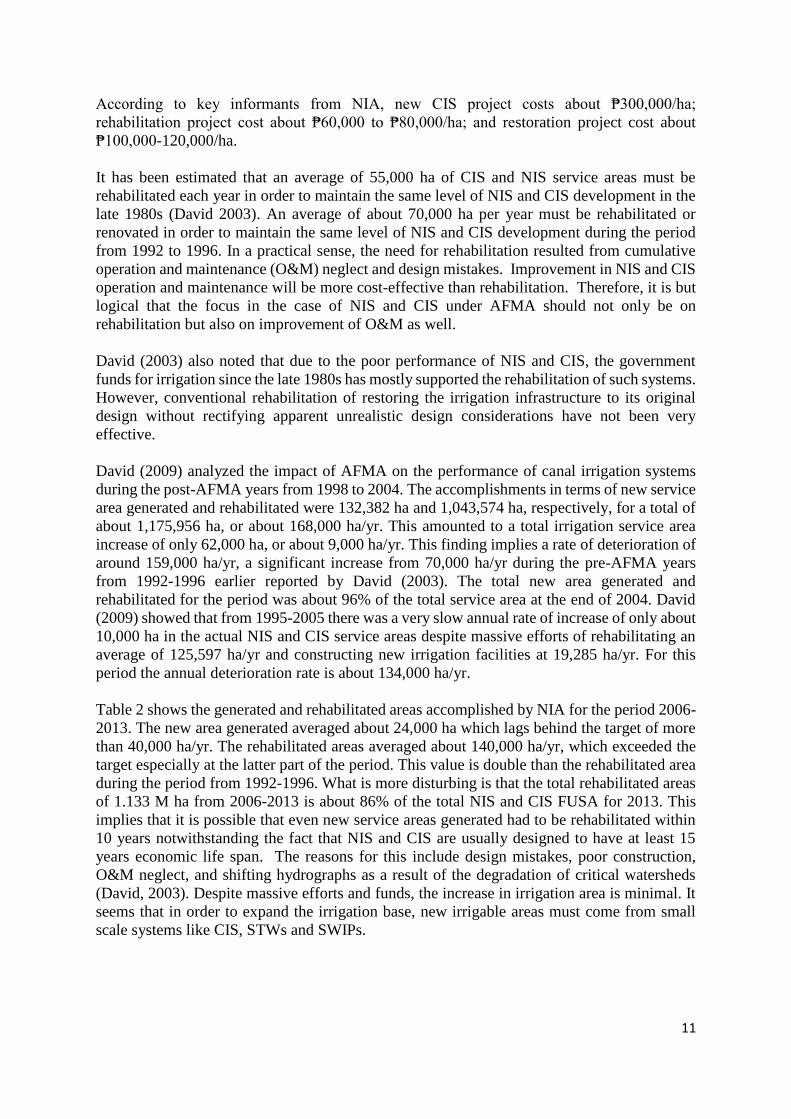
Table 2 shows the generated and rehabilitated areas accomplished by NIA for the period 2006-
2013. The new area generated averaged about 24,000 ha which lags behind the target of more
than 40,000 ha/yr. The rehabilitated areas averaged about 140,000 ha/yr, which exceeded the
target especially at the latter part of the period. This value is double than the rehabilitated area
during the period from 1992-1996. What is more disturbing is that the total rehabilitated areas
of 1.133 M ha from 2006-2013 is about 86% of the total NIS and CIS FUSA for 2013. This
implies that it is possible that even new service areas generated had to be rehabilitated within
10 years notwithstanding the fact that NIS and CIS are usually designed to have at least 15
years economic life span. The reasons for this include design mistakes, poor construction,
O&M neglect, and shifting hydrographs as a result of the degradation of critical watersheds
(David, 2003). Despite massive efforts and funds, the increase in irrigation area is minimal. It
seems that in order to expand the irrigation base, new irrigable areas must come from small
scale systems like CIS, STWs and SWIPs.
12
Table 2. Generated and Rehabilitated Areas by NIA from 2006-2013
Source: 2006-2013 NIA Annual
4. Methodology 4.1. Analytical Tools and Approach For the evaluation of performance of CIS, three (3) representative CIS were selected in each of
four (4) provinces selected in the Visayas, and another 3 CIS in each of 4 provinces selected in
Mindanao (see Annex 1). Based on the total irrigation service area per province, Leyte, Iloilo,
Capiz, and Bohol were selected for Visayas, and North Cotabato, South Cotabato, Davao del
Sur, and Bukidnon were selected for Mindanao. For each representative CIS, the research shall
include: 1) characterization of the current physical state of the CIS including its dams or
headworks and various control structures; 2) a more detailed assessment of CIS design
specifications, and engineering performance indicators; 3) evaluation of operation and
maintenance activities; 4) analysis of the nature, cost of repairs, restoration and rehabilitation;
5) assessment of the effectiveness of irrigators’ associations, and; 6) rapid appraisal of farmers’
opinion about the quality of the irrigation service and the reasons behind low ISF collection
rates. For the analysis, the results of this evaluation were combined with the evaluation already
made in Cycle 1 for Luzon CIS, except for item number 6 since the FISA has not been enacted
then.
Similar to Cycle 1, selection of CIS per province was based on size of firmed-up service areas
(FUSA) in hectares (ha) as follow: small (50 ha and below), medium (between 50 and 100 ha),
and large (above 100 ha) – considering one for each size category. Depending on groundwater
potential, at least one pump irrigation system (PIS) was also selected for the provinces
considered. Walkthroughs were conducted in all CIS per province.
Based on data from the NIA inventory of 2013 (Luzon) and 2017 (Visayas and Mindanao),
CIS have service areas that are generally below 1,000 ha (see Tables 3a to 3c). While many
CIS are constructed by National Irrigation Administration (NIA), the IA is responsible for
management and maintenance of the constructed system. The CIS are categorized into small
(50 ha and below), medium (51 to 100 ha) and large (above 100 ha) so as to capture possible
differences in characteristics. Over 70% of the CIS in the 10 provinces are small. The large and
medium sized systems are 15% and 14%, respectively. The 3 CIS which will be selected can
represent each of the sizes.
Year Generated Area (ha) Rehabilitated Area (ha)
Target Accomplishment Target Accomplishment
2006 22,639 8,989 53,071 57,088
2007 19,530 15,037 122,716 97,038
2008 22,562 13,481 92,230 87,305
2009 18,457 9,909 105,929 174,506
2010 12,989 6,603 248,565 196,075
2011 33,431 23,923 128,567 137,062
2012 100,994 55,500 112,370 206,897
2013 108,145 58,632 155,629 176,763
13
In addition to presentation of descriptive tables and historical trends based on secondary data,
a combination of the Geographic Information Systems (GIS) analysis technique were used.
Selected CIS were characterized based on the geographic distribution, hydrogeological and
agro-ecological conditions (rainfall patterns, aquifer characteristics, open water sources, soil
type, elevation, availability of gravity irrigation systems, etc.) and socio-economic factors that
affect demand for irrigation.
4.2. Sources of Data Secondary data were collected from the NIA Central Office, Regional Irrigation Offices
(RIOs), and Irrigation Management Offices (IMOs). These data include the list of all CIS under
each IMOs and all available data at system level including functionality survey results,
status/profile of IAs, source of funding, technical support and assistance from NIA and other
concerned agencies, program of works (POWs) for all available years, and communal irrigation
system performance (CISPER), among others. Technical data related to the CIS include
physical state, service area, source of water, access to and availability of water, year
constructed, construction cost, rehabilitation cost, other major investments, yield, cropping
calendar, cropping intensity, etc. Whenever available, feasibility studies, technical drawings,
network maps (irrigated and built-up areas), canal layouts, and other technical reports were
also obtained from the IMOs and NIA offices.
To complement secondary data and get deeper insights on the different aspects of development,
management, and operation and maintenance of the CIS system, key informant interviews (KII)
of the Regional Managers of the RIOs and Managers of IMOs, as well as other key actors, such
as NIA institutional development officers (IDOs) and IA Presidents, were conducted using a
structured questionnaire (see Annex 6). Focus group discussions with IA officers and farmer
beneficiaries were likewise carried out.
Walk-throughs and actual measurements were made for all the sample CIS in Visayas and
Mindanao to gauge the physical conditions of the systems. Walkthroughs on a subset of all
sample CIS was done in the Luzon Cycle. Assessment was done on key system
structures/facilities and their respective conditions (e.g., actual vs. designed reservoir capacity;
lengths and efficiencies of lined and unlined canals; presence of legal and illegal turnouts; and
for pumps: fully-, partially- or non-operational pumps; among others).
For CIS pumping water from water sources or where pumps are utilized within and in the
vicinity of selected CIS, the following was established: (a) technical description of the pump
system (engine, pump, pipes, discharge), (b) fund source, (c) pump irrigation technology and
practices used, (d) nature of usage, (e) operation of pump rental market (pump renting or
lending activities and terms of payment), (f) costs and returns, and (g) problems associated
with operation of irrigation pumps. The hydro-geologic characteristics of the area were also
taken from existing groundwater potential maps.
Findings from Cycle 1 of Project “Technical Evaluation of National and Communal Irrigation
Systems” were referenced particularly on the assessment of construction, operation and
management of CIS.

14
5. Major Policy Reform for Communal Irrigation Systems 5.1. Republic Act No. 10969 – Free Irrigation Service Act RA No. 10969, also known as the Free Irrigation Service Act, is a milestone in the policy
landscape for the Communal Irrigation System. It was passed in 2017 by the Senate and House
of Representatives and signed by the President in February 2, 2018.
Before the passage of the free irrigation Service Act, Communal irrigation systems, farmers
amortize the chargeable cost of the CIS for a period not exceeding 50 years without interest.
The O&M of the CIS is turned over to the IA upon project completion subject to a cost recovery
arrangement. With the Free Irrigation Service Act, all farmers with landholdings of eight (8)
hectares and below are exempted from paying irrigation service fees (ISF). It covers both
national irrigation systems (NIS) and communal irrigation systems (CIS) funded, constructed,
maintained and administered by the National Irrigation Administration (NIA) and other
government agencies, including those that have been turned over to irrigators associations
(IAs). All unpaid ISF, all loans, past due accounts and the corresponding interests and penalties
of exempt IAs to NIA, are also condoned and written off from the books of NIA.
In lieu of the ISF that are no longer billed from exempted farmers, the national government
shall provide the equivalent funds for the operation and maintenance (O&M) of CIS. NIA and
other government agencies shall provide technical assistance to IAs on the O&M of national
and communal irrigation systems and on farm enterprises management. NIA shall issue the
necessary guidelines on the collection and use of ISF, including unpaid ISF, of those not
exempted under this Act.
5.2. NIA Memorandum Circular No. 13, series of 2017 - Guidelines on Free Irrigation
Service The NIA Board of Directors through Resolution No. 8396-17 series of 2017 has approved the
Guidelines on Free Irrigation Service provided in NIA Memorandum Circular No. 13, series
of 2017. The guidelines pertinent to CIS include the following:
• Free irrigation service will commence on the first cropping season of Crop Year 2017.
Under the General Appropriations Act of 2017 or Republic Act 10924, an amount of ₱2
Billion was provided in the budget of the NIA as Irrigation Fee subsidy. However, fund
for 0 & M of CIS is not covered under GAA2017 subsidy. Thus, IAs should still collect
from their members the amount needed for the proper operation and upkeep of their
respective irrigation systems.
• NIA will stop collecting amortization and equity payments from farmers and/or IAs for
projects on CIS, small irrigation systems (SIS) pump irrigation systems (PIS), including
shallow tube wells (STWs), and small reservoir irrigation systems (SRIS). For projects with
local government units' (LGU) participation, the equity requirement from the concerned
LGU will be maintained.
• All back accounts or unpaid ISF, amortization and equity payments before the effectivity
of RA 10924 remain as liabilities of farmers and IAs. The collection of such liabilities shall
still be pursued by NIA in collaboration with the Office of the Solicitor General and Office
15
of the Government Corporate Counsel. The IAs may also be tapped by NIA in this
collection undertaking subject to terms and conditions agreed by both parties.
• Starting Fiscal Year 2018, NIA shall include in its annual proposal the total requirements
for Personal Services, MOOE, Capital Outlays for implementation of irrigation projects
and office operations, including incentives and remuneration to IAs in all types of irrigation
systems constructed, administered and/or assisted by NIA.
• IAs, as part of their internal policies, may collect additional amount from members on top
of the regular dues (membership fees, annual dues, capital buildup, etc.) to cover or
augment their O&M budget. Such collection must be approved by their respective General
Assemblies.
• O&M and management of CIS and pump irrigation systems shall be fully handed over to
their respective IAS.
• NIA shall continue to provide technical support in the planning, design, construction,
rehabilitation, restoration and O&M to the IAs as necessary. Moreover, the Agency will
continue to provide capacity building programs and trainings to sustain lA functionality.
• For NIS, the IAs will be compensated based on the length of canal section transferred to
them by NIA for maintenance. The equivalent of one (1) canal section shall be: lined canal
= 3.5 km of earth main or lateral canal; lined canal = 7.0 km of concreted main or lateral
canal. For each canal section, the lA, after satisfactorily complying with its maintenance
obligations stated in the contract, shall be paid Pl,750 per month for a maximum of six (6)
months in a year. For operations-related responsibilities, the IAs/Federation will be paid
P150/ha per cropping of irrigated and planted areas. The Guidelines, however do not
explicitly mention if this provision also applies to CIS.
5.3. NIA Memorandum Circular No. 68, series of 2017 – Amendment to MC #13 S.
2017 RE: Guidelines on Free Irrigation Service Through MC No. 68, series of 2017, the NIA Board of Directors amended the Guidelines under
MC 13 s. 2017 by deleting the following provision:
IAs, as part of their internal policies, may collect additional amount from members on top
of the regular dues (membership fees, annual dues, capital buildup, etc.) to cover or
augment their O& M budget. Such collection must be approved by their respective General
Assemblies.
This is to allow the IAs, independent and private organizations to tackle the matter themselves.
NIA has been receiving several complaints from farmers on the continued collection of certain
fees by officers of IAs despite the pronouncement of the national government that irrigation
service will be free starting 2017.
It should be noted that the Free irrigation Service Act still requires the equity payment for
projects with LGU participation. Again, the AFMA of 1997 provides for the devolution of CIS
to LGUs.

16
6. Communal Irrigation Systems at the IMO Level Based on 2017 NIA Annual Report, there are 9,196 CIS nationwide with a firmed-up service
area (FUSA) of 574,007 ha, or an average of 62.42 ha per CIS. In calendar year 2016-2017,
the total irrigated area in the CISs was 804,540 hectares equivalent to a cropping intensity of
124.08% based on service area or 140.16% based on FUSA.
This section presents information of CIS and IAs listed in the selected 11 IMOs in Luzon (1,606
CIS) covered in Cycle 1); 4 IMOs in Visayas (464 CIS); and 4 IMOs in Mindanao (176 CIS).
Findings were based on secondary data and key informant interviews of IMO officials and
staff.
Information on the CIS includes firmed-up service area, type of technology (gravity or pump),
operational status, and cropping intensity. The summary of CIS data for all the IMOs visited
are listed in Tables 3a to 3c for Luzon, Visayas and Mindanao. Figures 2 to 20 feature the
performance of all the CIS with time based on the FUSA, Irrigated Area (Wet and Dry Season)
and Cropping Intensity from 2005 to 2014 for the 11 Luzon provinces, and 2014 to 2017 for
the 4 Visayas and 4 Mindanao provinces.
Information on the communal irrigators’ associations includes functionality rating of the IAs,
and cost payment schemes (e.g., amortizing, 30% equity payment during the Cycle 1 and before
FISA was implemented).
6.1. Firmed-up Service Area In developing irrigation project, design area is estimated based on survey of the potential area
that can be irrigated and available water. Firmed-up service area (FUSA) is the actual service
area with irrigation facilities. Irrigated area may be equal to or less than FUSA depending on
adequacy of facilities and management. FUSA is usually lower than design area because it no
longer includes areas with higher elevation, convertible areas but which landowner does not
want to be converted, e.g., sugar land because of land reform.

17
Table 3a. Communal irrigation systems by sample provinces (IMOs) in Luzon
Item\Province Ilocos Norte Pangasinan Benguet Isabela Cagayan Nueva Vizcaya
No. of CIS % No. of CIS % No. of CIS % No. of CIS % No. of CIS % No. of CIS %
Size of FUSA
Small (<50 ha) 71 58.2 122 42.7 418 93.5 88 61.5 199 63.4 171 66.8
Medium (50-100 ha) 28 23 87 30.4 22 4.9 24 16.8 57 18.2 47 18.4
Large (>100 ha) 23 18.8 77 26.9 7 1.6 31 21.7 58 18.5 38 14.8
Type of Technology
Gravity 120 98.4 194 67.8 400 89.5 50 35 149 47.5 193 75.4
Pump 1 0.8 90 31.5 47 10.5 93 65 165 52.5 63 24.6
Reservoir 0 0 1 0 0 0 0 0 0 0 0 0
Others 1 0.8 1 0.34 0 0 0 0 0 0 0 0
Operational status
Totally non-operational 7 5.7 81 28.3 18 4 3 2.1 12 3.8 3 1.2
50% and below operational 15 12.3 104 36.4 29 6.5 11 7.7 28 8.9 11 4.3
Above 50% operational 107 87.7 182 63.6 400 89.5 129 90.2 274 87.3 242 94.5
FUSA (ha) 8,280.20 29,783.00 9,614.88 11,448 19,266 15,375.10
Operational (ha) 7,216.20 20,812.00 8,593.15 7,988 13,665 13,964.10
Operational (%) 87.2 69.9 89.4 69.8 70.9 90.8
Source: NIA data as of December 31, 2013

18
(Cont.) Table 3a. Communal irrigation systems by sample provinces (IMOs) in Luzon
Item\Province Nueva Ecija Pampanga Camarines Sur Laguna Occidental Mindoro
No. of CIS % No. of CIS % No. of CIS % No. of CIS % No. of CIS %
Size of FUSA
Small (<50 ha) 20 28.2 24 24 135 48.6 34 55.7 19 38.8
Medium (50-100 ha) 17 23.9 23 23 55 19.8 17 27.9 6 12.2
Large (>100 ha) 34 47.9 53 53 88 31.7 10 16.4 24 49
Type of Technology
Gravity 40 56.3 70 70 115 41.4 53 86.9 33 67.3
Pump 31 43.7 29 29 163 58.6 8 13.1 16 32.7
Reservoir 0 0 0 0 0 0 0 0 0 0
Others 0 0 1 1 0 0 0 0 0 0
Operational status
Totally non-operational 3 4.2 28 28 60 21.6 5 8.2 18 36.7
50% and below operational 8 11.3 51 51 31 11.2 4 6.6 0 0
Above 50% operational 63 88.7 49 49 187 67.3 52 85.2 31 63.3
FUSA (ha) 14,687.83 14,398.41 43,729.65 3,968.00 9,466.00
Operational (ha) 12,984.63 7,323.64 17,328.05 3,112.00 6,630.00
Operational (%) 88.4 50.9 39.6 78.4 70
Source: NIA data as of December 31, 2013
19
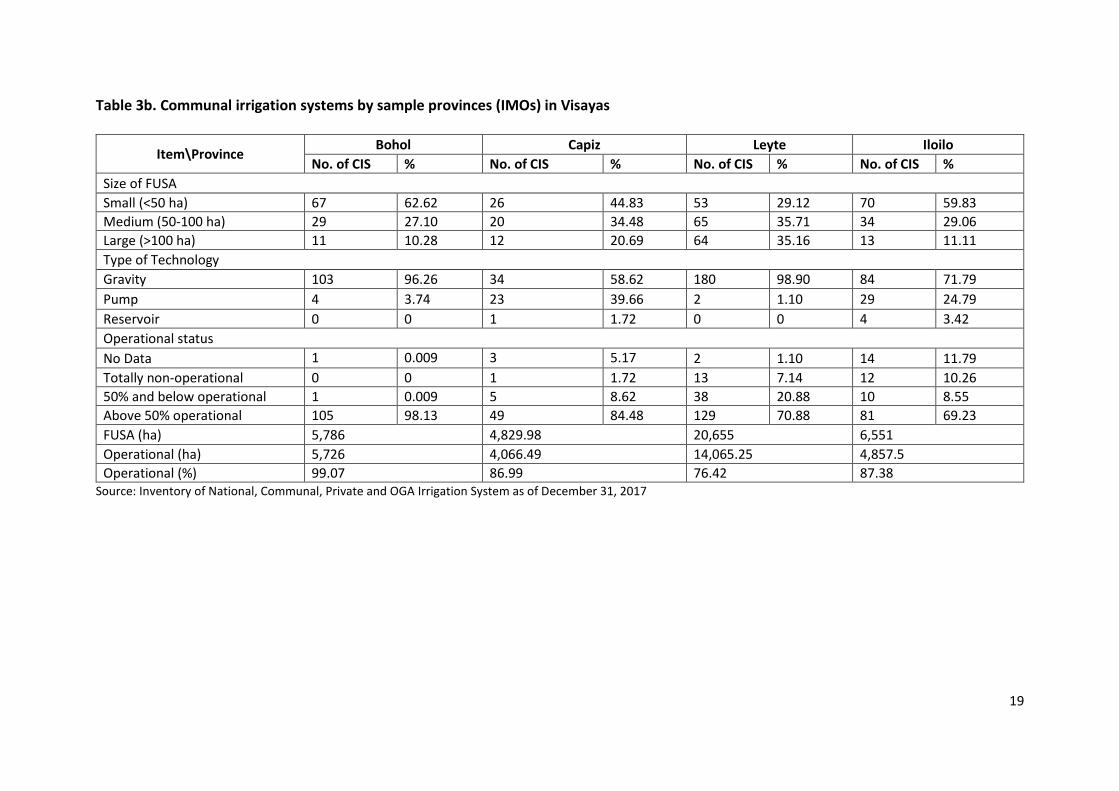
Table 3b. Communal irrigation systems by sample provinces (IMOs) in Visayas
Item\Province Bohol Capiz Leyte Iloilo
No. of CIS % No. of CIS % No. of CIS % No. of CIS %
Size of FUSA
Small (<50 ha) 67 62.62 26 44.83 53 29.12 70 59.83
Medium (50-100 ha) 29 27.10 20 34.48 65 35.71 34 29.06
Large (>100 ha) 11 10.28 12 20.69 64 35.16 13 11.11
Type of Technology
Gravity 103 96.26 34 58.62 180 98.90 84 71.79
Pump 4 3.74 23 39.66 2 1.10 29 24.79
Reservoir 0 0 1 1.72 0 0 4 3.42
Operational status
No Data 1 0.009 3 5.17 2 1.10 14 11.79
Totally non-operational 0 0 1 1.72 13 7.14 12 10.26
50% and below operational 1 0.009 5 8.62 38 20.88 10 8.55
Above 50% operational 105 98.13 49 84.48 129 70.88 81 69.23
FUSA (ha) 5,786 4,829.98 20,655 6,551
Operational (ha) 5,726 4,066.49 14,065.25 4,857.5
Operational (%) 99.07 86.99 76.42 87.38 Source: Inventory of National, Communal, Private and OGA Irrigation System as of December 31, 2017
20
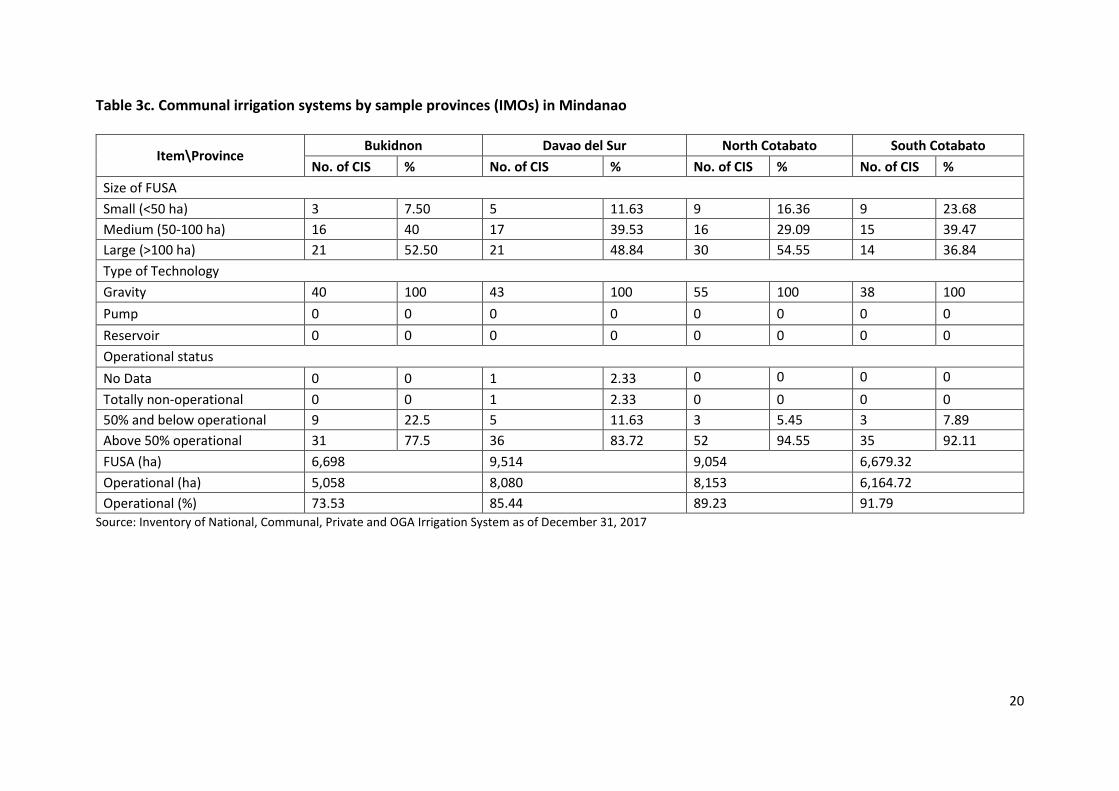
Table 3c. Communal irrigation systems by sample provinces (IMOs) in Mindanao
Item\Province Bukidnon Davao del Sur North Cotabato South Cotabato
No. of CIS % No. of CIS % No. of CIS % No. of CIS %
Size of FUSA
Small (<50 ha) 3 7.50 5 11.63 9 16.36 9 23.68
Medium (50-100 ha) 16 40 17 39.53 16 29.09 15 39.47
Large (>100 ha) 21 52.50 21 48.84 30 54.55 14 36.84
Type of Technology
Gravity 40 100 43 100 55 100 38 100
Pump 0 0 0 0 0 0 0 0
Reservoir 0 0 0 0 0 0 0 0
Operational status
No Data 0 0 1 2.33 0 0 0 0
Totally non-operational 0 0 1 2.33 0 0 0 0
50% and below operational 9 22.5 5 11.63 3 5.45 3 7.89
Above 50% operational 31 77.5 36 83.72 52 94.55 35 92.11
FUSA (ha) 6,698 9,514 9,054 6,679.32
Operational (ha) 5,058 8,080 8,153 6,164.72
Operational (%) 73.53 85.44 89.23 91.79 Source: Inventory of National, Communal, Private and OGA Irrigation System as of December 31, 2017

21
Figure 2. CIS Performance (FUSA, Irrigated Area and Cropping Intensity) of Ilocos Norte
from 2005-2014 Source: Seasonal Operational and Maintenance Report of Respective Irrigation Management Offices
Figure 3. CIS Performance of Pangasinan from 2005-2014 Source: Seasonal Operational and Maintenance Report of Respective Irrigation Management Offices
Figure 4. CIS Performance of Benguet from 2005-2014 Source: Seasonal Operational and Maintenance Report of Respective Irrigation Management Offices

22
Figure 5. CIS Performance of Isabela from 2005-2014 Source: Seasonal Operational and Maintenance Report of Respective Irrigation Management Offices
Figure 6. CIS Performance of Cagayan-Batanes from 2005-2014 Source: Seasonal Operational and Maintenance Report of Respective Irrigation Management Offices
Figure 7. CIS Performance of Nueva Vizcaya from 2005-2014 Source: Seasonal Operational and Maintenance Report of Respective Irrigation Management Offices

23
Figure 8. CIS Performance of Bulacan-Aurora-Nueva Ecija from 2005-2014 Source: Seasonal Operational and Maintenance Report of Respective Irrigation Management Offices
Figure 9. CIS Performance of Pampanga-Bataan from 2005-2014 Source: Seasonal Operational and Maintenance Report of Respective Irrigation Management Offices
Figure 10. CIS Performance of Camarines Sur from 2005-2014 Source: Seasonal Operational and Maintenance Report of Respective Irrigation Management Offices

24
Figure 11. CIS Performance of Laguna-Rizal from 2005-2014 Source: Seasonal Operational and Maintenance Report of Respective Irrigation Management Offices
Figure 12. CIS Performance of Occidental Mindoro from 2005-2014 Source: Seasonal Operational and Maintenance Report of Respective Irrigation Management Offices
Figure 13. CIS Performance of Bohol from 2014-2017 Source: Seasonal Operational and Maintenance Report of Respective Irrigation Management Offices

25
Figure 14. CIS Performance of Leyte from 2014-2017 Source: Seasonal Operational and Maintenance Report of Respective Irrigation Management Offices
Figure 15. CIS Performance of Iloilo from 2014-2017 Source: Seasonal Operational and Maintenance Report of Respective Irrigation Management Offices
Figure 16. CIS Performance of Capiz from 2014-2017 Source: Seasonal Operational and Maintenance Report of Respective Irrigation Management Offices
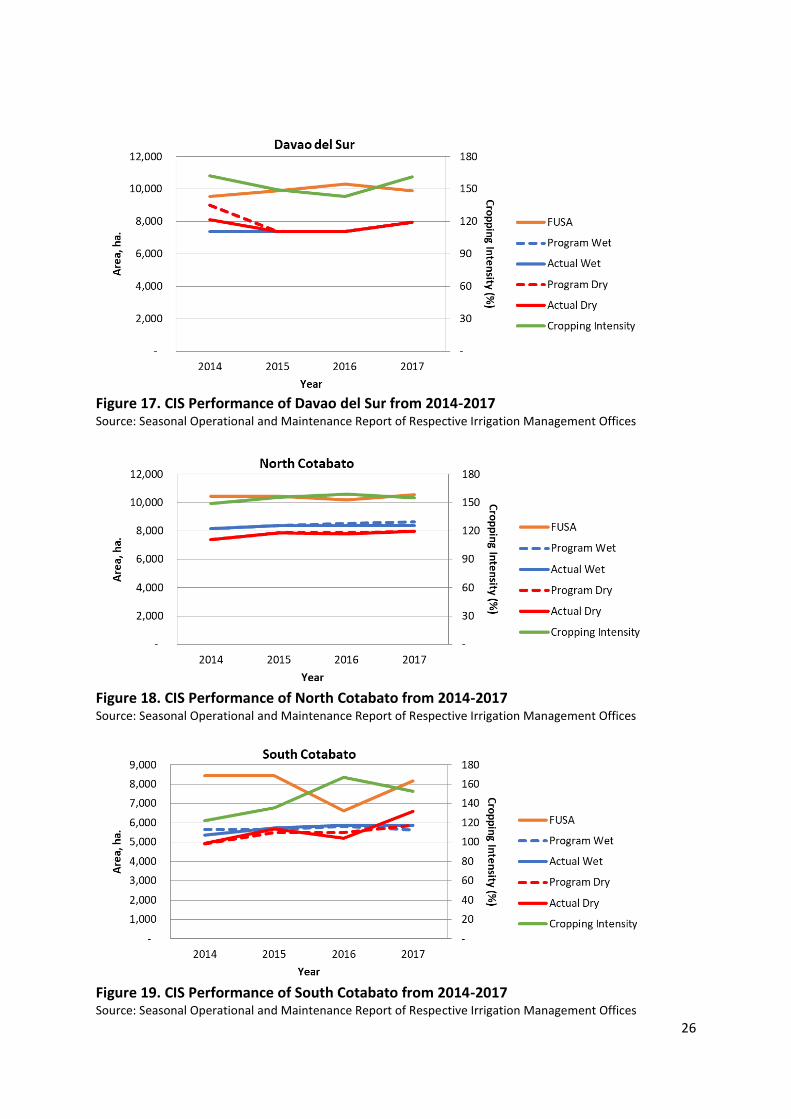
26
Figure 17. CIS Performance of Davao del Sur from 2014-2017 Source: Seasonal Operational and Maintenance Report of Respective Irrigation Management Offices
Figure 18. CIS Performance of North Cotabato from 2014-2017 Source: Seasonal Operational and Maintenance Report of Respective Irrigation Management Offices
Figure 19. CIS Performance of South Cotabato from 2014-2017 Source: Seasonal Operational and Maintenance Report of Respective Irrigation Management Offices

27
Figure 20. CIS Performance of Bukidnon from 2014-2017 Source: Seasonal Operational and Maintenance Report of Respective Irrigation Management Offices
Based on the time series profile from 2005 to 2014, the performance indicators from 2005-
2007 are somewhat erroneous or at the least have different basis than from 2008 onwards. This
issue would still have to be resolved with NIA. The FUSA for Benguet shows a steady increase
as well as the FUSA of Ilocos Norte, Pangasinan and Pangasinan. The FUSA of Region II
(Cagayan-Batanes, Isabela, Nueva Vizcaya), on the other hand, increased until 2012 when it
suddenly dipped to just above 2007 levels. Decrease in FUSA may be attributed to one or
combination of the following: conversion of CIS to NIS specifically the Visitacion IS in
Cagayan; some irrigation systems were under rehabilitation wherein the areas being
rehabilitated were not considered in the current FUSA; and also because of errors in reporting.
Overall, the FUSA for Luzon shows a decline from the 2005 to the 2014 level. The actual
service areas based on the individual interviews of the IA’s are more or less consistent with the
service areas reported. However, the field surveys showed otherwise, with limited water flow
or dried water sources, aside from the dilapidated structures, during the visit. The high dry
season areas probably could have been achieved with the use of STWs and LLP/OSPs for
supplemental irrigation, or the areas are planted with vegetables or other non-rice crops.
The CIS performance with time for Visayas and Mindanao were based on 2014 to 2017 data
only. A major decrease of about 2000 ha can be seen for Capiz from 2015 to 2016 possibly due
to land conversion although the cropping intensity doubled from 60 in 2015 to 130% in 2017.
The FUSA of South Cotabato also decreased from 2015 t0 2016 but recovered in 2017.
The wet and dry season areas for Benguet, Cagayan-Batanes, Isabela, Nueva Vizcaya, Laguna-
Rizal and Camarines Sur are almost identical, as well as the program and actual areas. For
Benguet, this is because the CIS are mostly small, and the mountain rivers and spring sources
never run out of water. For Laguna-Rizal, this is because of the abundant river sources with
high dependable flows even during the dry season. For Camarines Sur and Region II, however,
the field surveys showed otherwise. At the very least for Camarines Sur, the Type II (no
pronounced dry season) climate and the ubiquitous typhoons could help achieve this similarity
if the irrigation facilities are in good condition. The wet and dry areas for these regions show
gradual increase with time. For Region II, the wet and dry areas increased until 2011 then
drastically decreased by 2012, although the actual areas were almost the same as the program
area. For Laguna-Rizal, the wet and dry areas show a steady increase, but after 2010, the dry
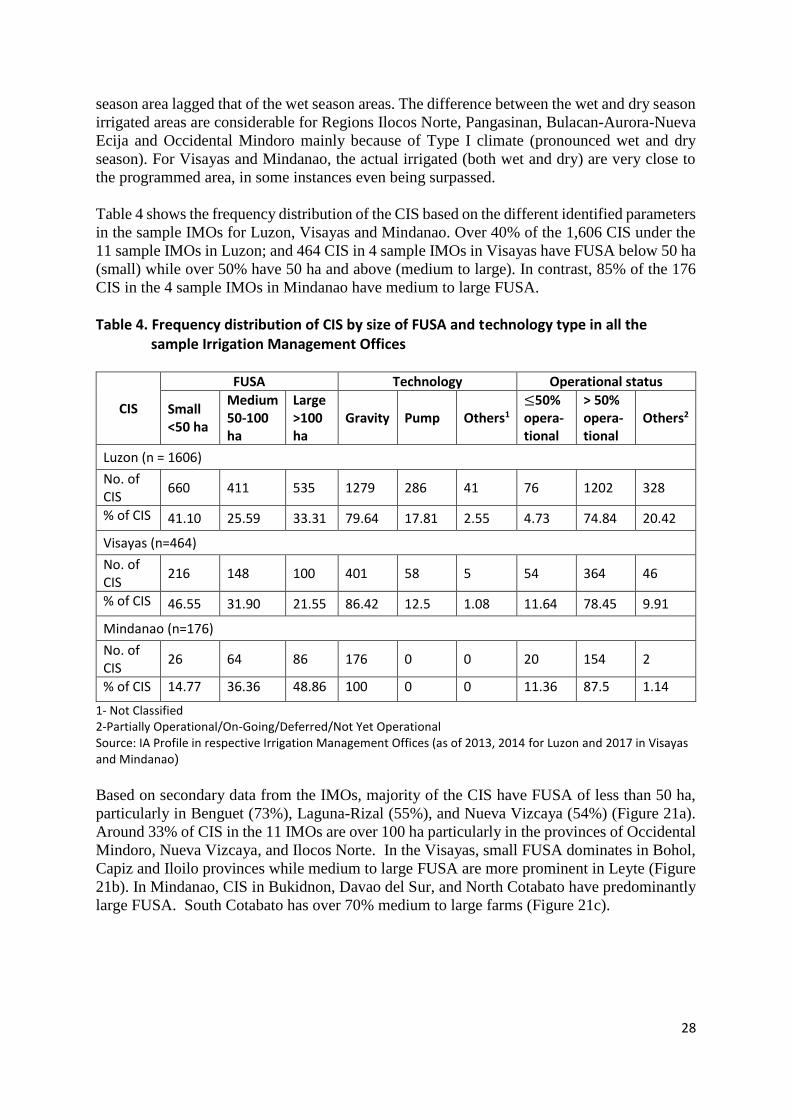
28
season area lagged that of the wet season areas. The difference between the wet and dry season
irrigated areas are considerable for Regions Ilocos Norte, Pangasinan, Bulacan-Aurora-Nueva
Ecija and Occidental Mindoro mainly because of Type I climate (pronounced wet and dry
season). For Visayas and Mindanao, the actual irrigated (both wet and dry) are very close to
the programmed area, in some instances even being surpassed.
Table 4 shows the frequency distribution of the CIS based on the different identified parameters
in the sample IMOs for Luzon, Visayas and Mindanao. Over 40% of the 1,606 CIS under the
11 sample IMOs in Luzon; and 464 CIS in 4 sample IMOs in Visayas have FUSA below 50 ha
(small) while over 50% have 50 ha and above (medium to large). In contrast, 85% of the 176
CIS in the 4 sample IMOs in Mindanao have medium to large FUSA. Table 4. Frequency distribution of CIS by size of FUSA and technology type in all the
sample Irrigation Management Offices
CIS
FUSA Technology Operational status
Small <50 ha
Medium 50-100 ha
Large >100 ha
Gravity Pump Others1 ≤50% opera-tional
> 50% opera-tional
Others2
Luzon (n = 1606)
No. of CIS
660 411 535 1279 286 41 76 1202 328
% of CIS 41.10 25.59 33.31 79.64 17.81 2.55 4.73 74.84 20.42
Visayas (n=464)
No. of CIS
216 148 100 401 58 5 54 364 46
% of CIS 46.55 31.90 21.55 86.42 12.5 1.08 11.64 78.45 9.91
Mindanao (n=176)
No. of CIS
26 64 86 176 0 0 20 154 2
% of CIS 14.77 36.36 48.86 100 0 0 11.36 87.5 1.14
1- Not Classified 2-Partially Operational/On-Going/Deferred/Not Yet Operational Source: IA Profile in respective Irrigation Management Offices (as of 2013, 2014 for Luzon and 2017 in Visayas and Mindanao)
Based on secondary data from the IMOs, majority of the CIS have FUSA of less than 50 ha,
particularly in Benguet (73%), Laguna-Rizal (55%), and Nueva Vizcaya (54%) (Figure 21a).
Around 33% of CIS in the 11 IMOs are over 100 ha particularly in the provinces of Occidental
Mindoro, Nueva Vizcaya, and Ilocos Norte. In the Visayas, small FUSA dominates in Bohol,
Capiz and Iloilo provinces while medium to large FUSA are more prominent in Leyte (Figure
21b). In Mindanao, CIS in Bukidnon, Davao del Sur, and North Cotabato have predominantly
large FUSA. South Cotabato has over 70% medium to large farms (Figure 21c).

29
Figure 21a. Percent distribution of CIS by firmed-up service area and province in the 11
selected IMOs in Luzon Source: IA Profile in respective Irrigation Management Offices (as of 2013, 2014)
Figure 21b. Percent distribution of CIS by firmed-up service area and province in the 4
selected IMOs in Visayas Source: IA Profile in respective Irrigation Management Offices (as of 2017)
0.00
10.00
20.00
30.00
40.00
50.00
60.00
70.00
Bohol Capiz Iloilo Leyte
Per
cen
tage
(%
)
Small Medium Large
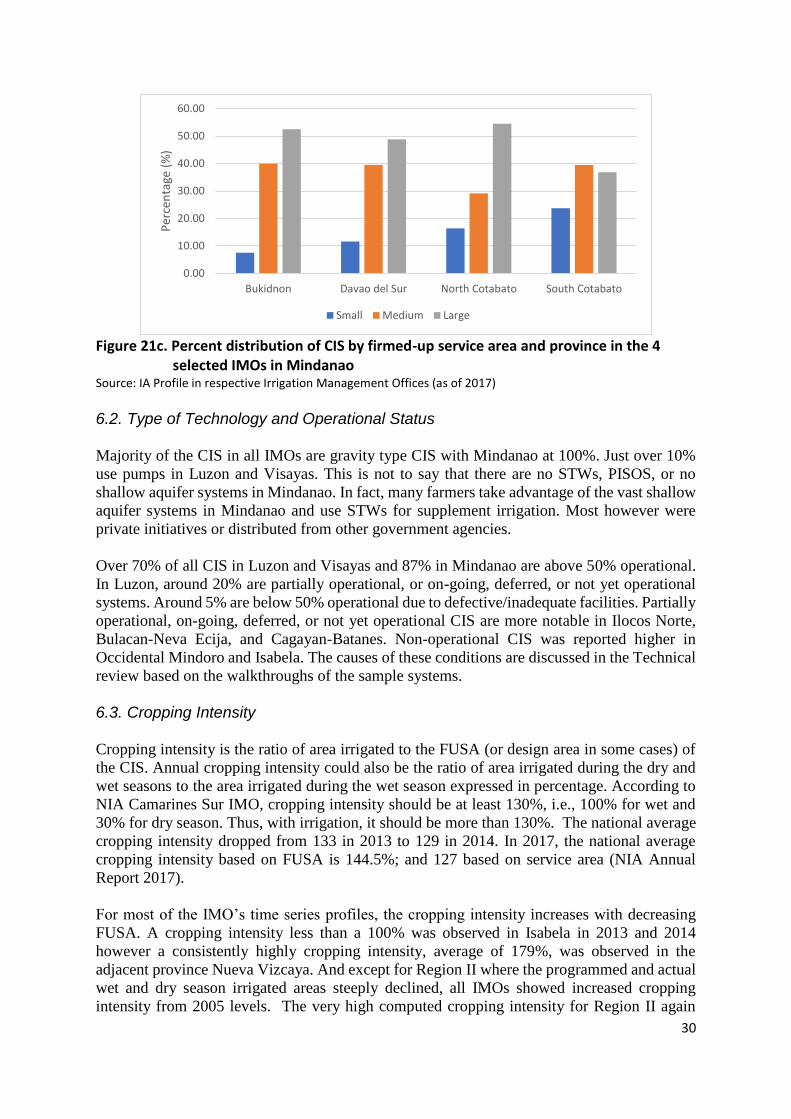
30
Figure 21c. Percent distribution of CIS by firmed-up service area and province in the 4
selected IMOs in Mindanao Source: IA Profile in respective Irrigation Management Offices (as of 2017)
6.2. Type of Technology and Operational Status Majority of the CIS in all IMOs are gravity type CIS with Mindanao at 100%. Just over 10%
use pumps in Luzon and Visayas. This is not to say that there are no STWs, PISOS, or no
shallow aquifer systems in Mindanao. In fact, many farmers take advantage of the vast shallow
aquifer systems in Mindanao and use STWs for supplement irrigation. Most however were
private initiatives or distributed from other government agencies.
Over 70% of all CIS in Luzon and Visayas and 87% in Mindanao are above 50% operational.
In Luzon, around 20% are partially operational, or on-going, deferred, or not yet operational
systems. Around 5% are below 50% operational due to defective/inadequate facilities. Partially
operational, on-going, deferred, or not yet operational CIS are more notable in Ilocos Norte,
Bulacan-Neva Ecija, and Cagayan-Batanes. Non-operational CIS was reported higher in
Occidental Mindoro and Isabela. The causes of these conditions are discussed in the Technical
review based on the walkthroughs of the sample systems.
6.3. Cropping Intensity Cropping intensity is the ratio of area irrigated to the FUSA (or design area in some cases) of
the CIS. Annual cropping intensity could also be the ratio of area irrigated during the dry and
wet seasons to the area irrigated during the wet season expressed in percentage. According to
NIA Camarines Sur IMO, cropping intensity should be at least 130%, i.e., 100% for wet and
30% for dry season. Thus, with irrigation, it should be more than 130%. The national average
cropping intensity dropped from 133 in 2013 to 129 in 2014. In 2017, the national average
cropping intensity based on FUSA is 144.5%; and 127 based on service area (NIA Annual
Report 2017).
For most of the IMO’s time series profiles, the cropping intensity increases with decreasing
FUSA. A cropping intensity less than a 100% was observed in Isabela in 2013 and 2014
however a consistently highly cropping intensity, average of 179%, was observed in the
adjacent province Nueva Vizcaya. And except for Region II where the programmed and actual
wet and dry season irrigated areas steeply declined, all IMOs showed increased cropping
intensity from 2005 levels. The very high computed cropping intensity for Region II again
0.00
10.00
20.00
30.00
40.00
50.00
60.00
Bukidnon Davao del Sur North Cotabato South Cotabato
Per
cen
tage
(%
)
Small Medium Large
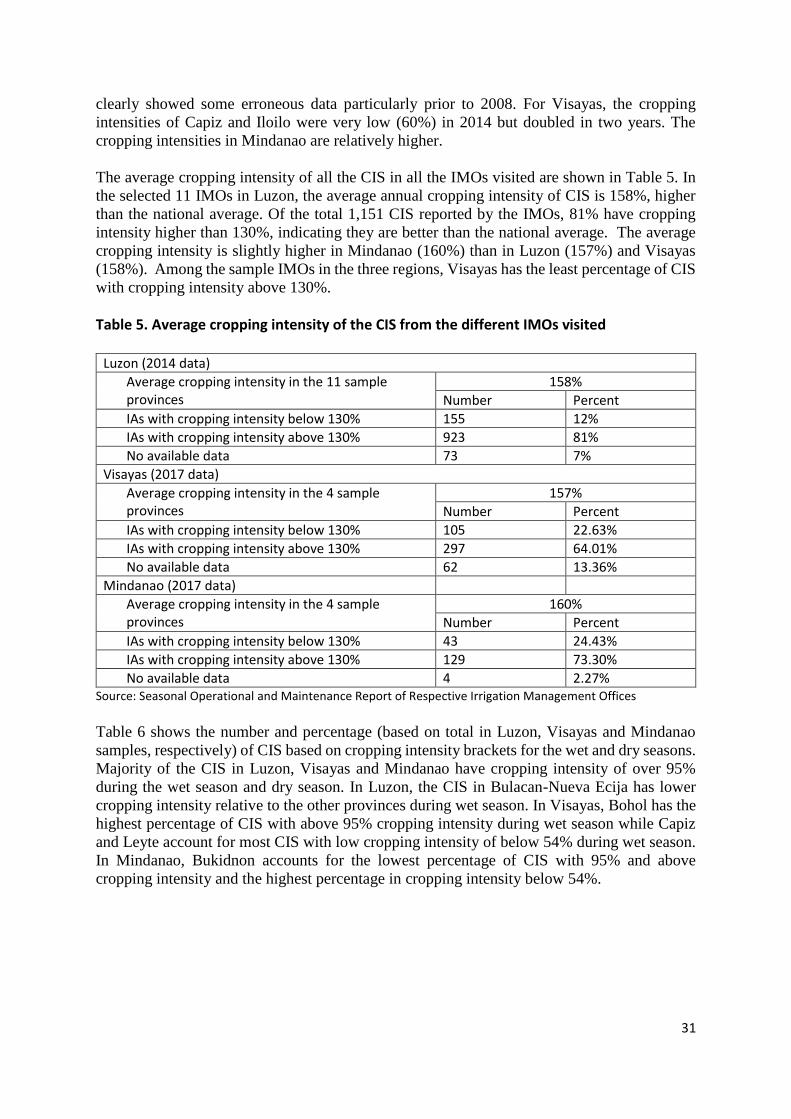
31
clearly showed some erroneous data particularly prior to 2008. For Visayas, the cropping
intensities of Capiz and Iloilo were very low (60%) in 2014 but doubled in two years. The
cropping intensities in Mindanao are relatively higher.
The average cropping intensity of all the CIS in all the IMOs visited are shown in Table 5. In
the selected 11 IMOs in Luzon, the average annual cropping intensity of CIS is 158%, higher
than the national average. Of the total 1,151 CIS reported by the IMOs, 81% have cropping
intensity higher than 130%, indicating they are better than the national average. The average
cropping intensity is slightly higher in Mindanao (160%) than in Luzon (157%) and Visayas
(158%). Among the sample IMOs in the three regions, Visayas has the least percentage of CIS
with cropping intensity above 130%.
Table 5. Average cropping intensity of the CIS from the different IMOs visited
Luzon (2014 data)
Average cropping intensity in the 11 sample provinces
158%
Number Percent
IAs with cropping intensity below 130% 155 12%
IAs with cropping intensity above 130% 923 81%
No available data 73 7%
Visayas (2017 data)
Average cropping intensity in the 4 sample provinces
157%
Number Percent
IAs with cropping intensity below 130% 105 22.63%
IAs with cropping intensity above 130% 297 64.01%
No available data 62 13.36%
Mindanao (2017 data)
Average cropping intensity in the 4 sample provinces
160%
Number Percent
IAs with cropping intensity below 130% 43 24.43%
IAs with cropping intensity above 130% 129 73.30%
No available data 4 2.27% Source: Seasonal Operational and Maintenance Report of Respective Irrigation Management Offices Table 6 shows the number and percentage (based on total in Luzon, Visayas and Mindanao
samples, respectively) of CIS based on cropping intensity brackets for the wet and dry seasons.
Majority of the CIS in Luzon, Visayas and Mindanao have cropping intensity of over 95%
during the wet season and dry season. In Luzon, the CIS in Bulacan-Nueva Ecija has lower
cropping intensity relative to the other provinces during wet season. In Visayas, Bohol has the
highest percentage of CIS with above 95% cropping intensity during wet season while Capiz
and Leyte account for most CIS with low cropping intensity of below 54% during wet season.
In Mindanao, Bukidnon accounts for the lowest percentage of CIS with 95% and above
cropping intensity and the highest percentage in cropping intensity below 54%.

32
Table 6. Number of CIS based on cropping intensity brackets under wet and dry seasons for all the IMOs visited
IMO
Wet season Dry season
No Data
<54% 55%
-69%
70% -79%
80% -94%
>95% No
Data <54%
55% -
69%
70% -
79%
80% -94%
>95%
Luzon (n=1151); 2014 data
No. 578 98 67 66 264 17 609 106 70 61 200 73
% 50.22 8.51 5.82 5.73 22.94 1.48 52.91 9.21 6.08 5.30 17.38 6.34
Visayas (n=464); 2017 data
No. 217 54 33 30 67 63 155 84 30 39 77 79
% 46.77 11.64 7.11 6.47 14.44 13.58 33.41 18.1 6.47 8.41 16.59 17.03
Mindanao (n=176); 2017 data
No. 92 18 9 23 31 3 85 18 14 19 34 6
% 52.27 10.23 5.11 13.07 17.61 1.70 48.30 10.23 7.95 10.8 19.32 3.41 Source: Seasonal Operational and Maintenance Report of Respective Irrigation Management Offices
6.4. Yield According to the KIIs, palay yield without irrigation is 50 cavans/ha; with irrigation, it should
range from 80 to 100 cavans/ha. Table 7 shows the average palay yield (cavans per hectare)
in all the selected IMOs. In the 11 IMOs in Luzon, the average yield ranged from 51 to 96
cavans/ha. The lowest yield is in Benguet for both wet and dry seasons at around 50 cavans. In
Visayas, lowest yield is in Iloilo and Leyte (Table 9b) while in Mindanao, lowest yield is in
North and South Cotabato (Table 9c). Davao del Sur has the highest yield over 100 cavans/ha
during both wet and dry seasons.
Table 7. Average palay yield in all the selected Irrigation Management Offices
IMO Cavans/Hectare
Wet Season Dry Season
Luzon (2014 data)
Pampanga-Bataan 87.26 71.34
Bulacan-Aurora-Nueva Ecija 72.20 95.51
Pangasinan 80.82 81.12
Ilocos Norte 78.33 79.03
Camarines Sur 83.68 79.65
Benguet 51.45 53.73
Nueva Vizcaya 88.00 88.00
Isabela 95.00 96.00
Cagayan-Batanes 91.00 89.00
Laguna no data 90.16
Occidental Mindoro 80.00 no data
Visayas (2017 data)
Bohol 91 103
Leyte 85 90

33
Iloilo 82 78
Capiz 97 97
Mindanao (2017 data)
Davao del Sur 100.77 124.41
South Cotabato 80.45 79.83
North Cotabato 88.72 77.69
Bukidnon 86.58 85.83
Source: Secondary data from respective IMOs
6.5. Functionality of Communal Irrigators’ Associations NIA (with the involvement of the IDO) assesses the functionality of IAs based on parameters
related to O&M performance, organization, financial, and organizational discipline. Results
of the annual or seasonal functionality survey are used in the search for outstanding IAs at the
provincial, regional and national level. This is a good motivation to the IAs and its members.
It also helps NIA in identifying appropriate strategies to enhance IA’s capabilities. The rating
is done through discussions/consultation with IAs.
Recently, indicators used in rating IA functionality included the following factors - O&M with
35% weight; financial, 26%; organization and organizational discipline, 29%; assistance
program/agri-support services/linkages (6%); and special features (4%). O&M indicators
include O&M planning and implementation, and performance such as annual cropping
intensity, irrigated area vs. programmed area, status of irrigation facilities and structures, yield,
and collection efficiency. Financial performance includes income generation and fund
utilization, and viability index. Organization and organizational discipline include information
on membership, meetings, recording/filing system; attendance in meetings and group work,
holding of regular elections, conflict resolution, and imposition of discipline. The overall score
indicates the following functionality rating: Outstanding – 95-100; Very satisfactory (VS) - 85-
94; Satisfactory (S) - 75-84; Fair - 65-74; Poor (P) - below 65.
Table 8 shows the average functionality rating of the CIS Irrigators’ Associations in all the
sample IMOs. Based on reports gathered from the IMOs, majority (around 76%) of the IAs in
the 11 sample IMOs in Luzon as well as in Visayas have satisfactory to very satisfactory
ratings. Around 19% of IAs in sample IMOs in both regions have fair to poor rating. In
Mindanao, over 16% of IAs in the sample IMOs are outstanding and over 14% have fair to
poor rating.
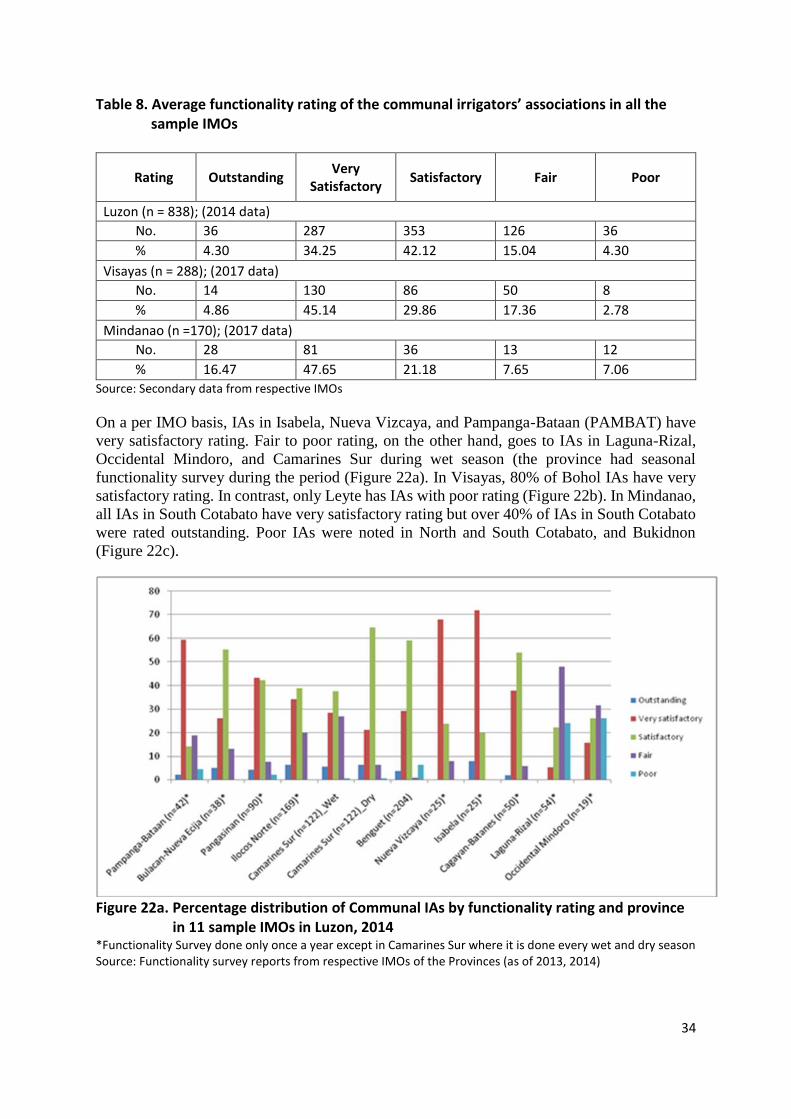
34
Table 8. Average functionality rating of the communal irrigators’ associations in all the sample IMOs
Rating Outstanding Very
Satisfactory Satisfactory Fair Poor
Luzon (n = 838); (2014 data)
No. 36 287 353 126 36
% 4.30 34.25 42.12 15.04 4.30
Visayas (n = 288); (2017 data)
No. 14 130 86 50 8
% 4.86 45.14 29.86 17.36 2.78
Mindanao (n =170); (2017 data)
No. 28 81 36 13 12
% 16.47 47.65 21.18 7.65 7.06
Source: Secondary data from respective IMOs
On a per IMO basis, IAs in Isabela, Nueva Vizcaya, and Pampanga-Bataan (PAMBAT) have
very satisfactory rating. Fair to poor rating, on the other hand, goes to IAs in Laguna-Rizal,
Occidental Mindoro, and Camarines Sur during wet season (the province had seasonal
functionality survey during the period (Figure 22a). In Visayas, 80% of Bohol IAs have very
satisfactory rating. In contrast, only Leyte has IAs with poor rating (Figure 22b). In Mindanao,
all IAs in South Cotabato have very satisfactory rating but over 40% of IAs in South Cotabato
were rated outstanding. Poor IAs were noted in North and South Cotabato, and Bukidnon
(Figure 22c).
Figure 22a. Percentage distribution of Communal IAs by functionality rating and province in 11 sample IMOs in Luzon, 2014 *Functionality Survey done only once a year except in Camarines Sur where it is done every wet and dry season Source: Functionality survey reports from respective IMOs of the Provinces (as of 2013, 2014)
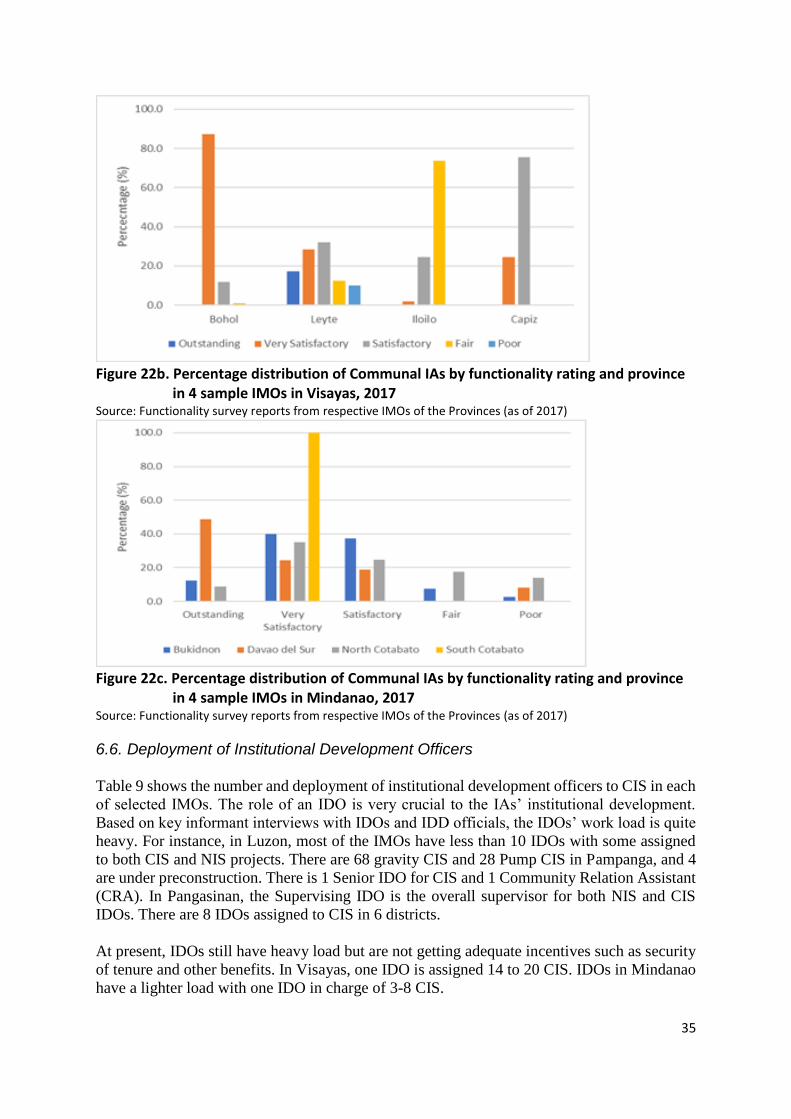
35
Figure 22b. Percentage distribution of Communal IAs by functionality rating and province in 4 sample IMOs in Visayas, 2017 Source: Functionality survey reports from respective IMOs of the Provinces (as of 2017)
Figure 22c. Percentage distribution of Communal IAs by functionality rating and province in 4 sample IMOs in Mindanao, 2017 Source: Functionality survey reports from respective IMOs of the Provinces (as of 2017)
6.6. Deployment of Institutional Development Officers Table 9 shows the number and deployment of institutional development officers to CIS in each
of selected IMOs. The role of an IDO is very crucial to the IAs’ institutional development.
Based on key informant interviews with IDOs and IDD officials, the IDOs’ work load is quite
heavy. For instance, in Luzon, most of the IMOs have less than 10 IDOs with some assigned
to both CIS and NIS projects. There are 68 gravity CIS and 28 Pump CIS in Pampanga, and 4
are under preconstruction. There is 1 Senior IDO for CIS and 1 Community Relation Assistant
(CRA). In Pangasinan, the Supervising IDO is the overall supervisor for both NIS and CIS
IDOs. There are 8 IDOs assigned to CIS in 6 districts.
At present, IDOs still have heavy load but are not getting adequate incentives such as security
of tenure and other benefits. In Visayas, one IDO is assigned 14 to 20 CIS. IDOs in Mindanao
have a lighter load with one IDO in charge of 3-8 CIS.
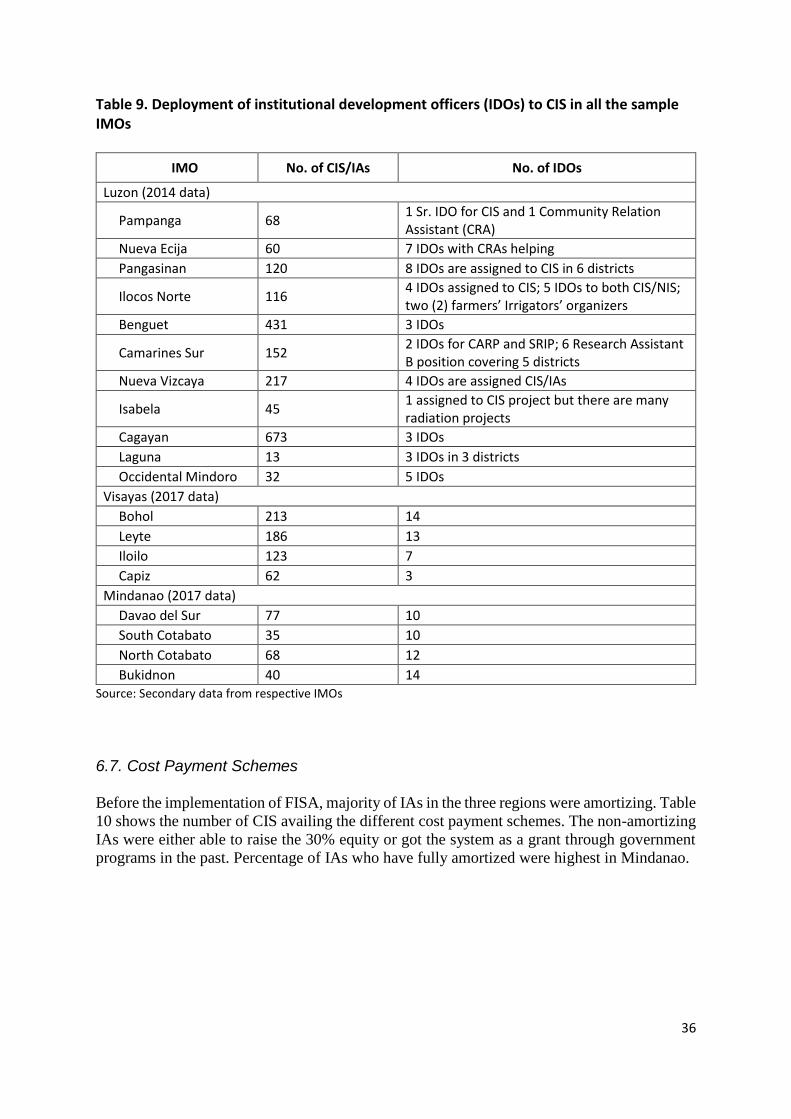
36
Table 9. Deployment of institutional development officers (IDOs) to CIS in all the sample IMOs
IMO No. of CIS/IAs No. of IDOs
Luzon (2014 data)
Pampanga 68 1 Sr. IDO for CIS and 1 Community Relation Assistant (CRA)
Nueva Ecija 60 7 IDOs with CRAs helping
Pangasinan 120 8 IDOs are assigned to CIS in 6 districts
Ilocos Norte 116 4 IDOs assigned to CIS; 5 IDOs to both CIS/NIS; two (2) farmers’ Irrigators’ organizers
Benguet 431 3 IDOs
Camarines Sur 152 2 IDOs for CARP and SRIP; 6 Research Assistant B position covering 5 districts
Nueva Vizcaya 217 4 IDOs are assigned CIS/IAs
Isabela 45 1 assigned to CIS project but there are many radiation projects
Cagayan 673 3 IDOs
Laguna 13 3 IDOs in 3 districts
Occidental Mindoro 32 5 IDOs
Visayas (2017 data)
Bohol 213 14
Leyte 186 13
Iloilo 123 7
Capiz 62 3
Mindanao (2017 data)
Davao del Sur 77 10
South Cotabato 35 10
North Cotabato 68 12
Bukidnon 40 14 Source: Secondary data from respective IMOs
6.7. Cost Payment Schemes Before the implementation of FISA, majority of IAs in the three regions were amortizing. Table
10 shows the number of CIS availing the different cost payment schemes. The non-amortizing
IAs were either able to raise the 30% equity or got the system as a grant through government
programs in the past. Percentage of IAs who have fully amortized were highest in Mindanao.
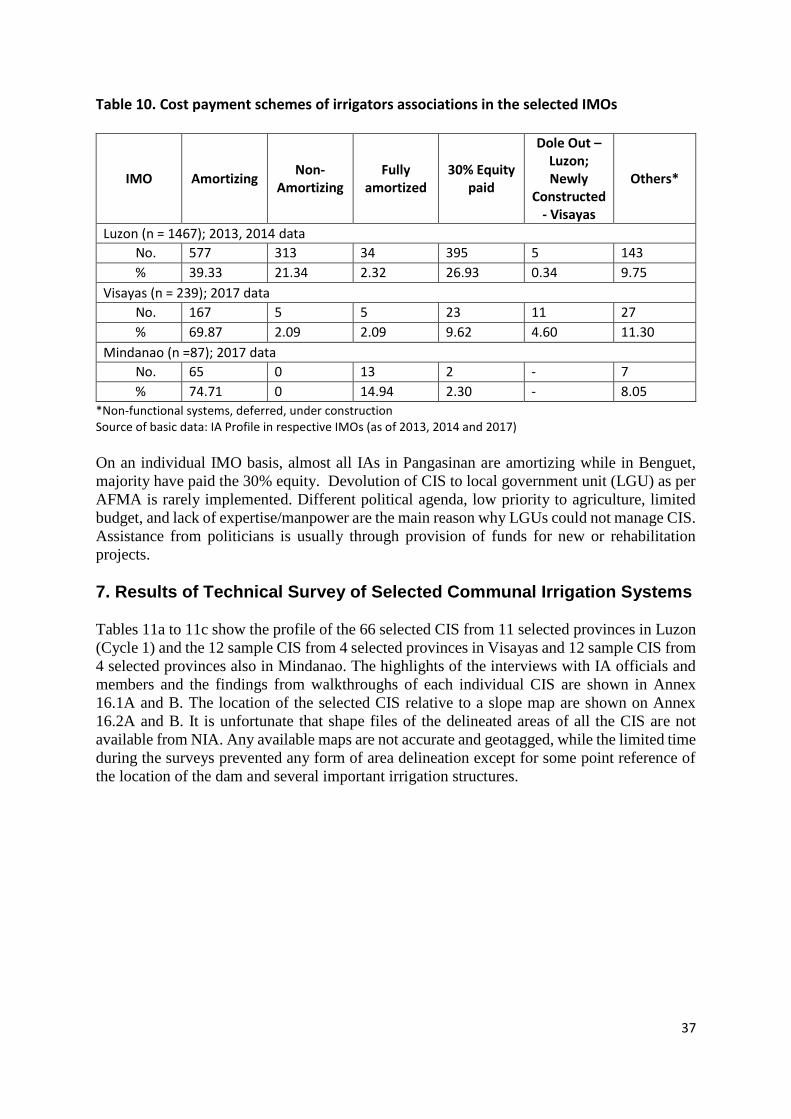
37
Table 10. Cost payment schemes of irrigators associations in the selected IMOs
IMO Amortizing Non-
Amortizing Fully
amortized 30% Equity
paid
Dole Out – Luzon; Newly
Constructed - Visayas
Others*
Luzon (n = 1467); 2013, 2014 data
No. 577 313 34 395 5 143
% 39.33 21.34 2.32 26.93 0.34 9.75
Visayas (n = 239); 2017 data
No. 167 5 5 23 11 27
% 69.87 2.09 2.09 9.62 4.60 11.30
Mindanao (n =87); 2017 data
No. 65 0 13 2 - 7
% 74.71 0 14.94 2.30 - 8.05
*Non-functional systems, deferred, under construction Source of basic data: IA Profile in respective IMOs (as of 2013, 2014 and 2017)
On an individual IMO basis, almost all IAs in Pangasinan are amortizing while in Benguet,
majority have paid the 30% equity. Devolution of CIS to local government unit (LGU) as per
AFMA is rarely implemented. Different political agenda, low priority to agriculture, limited
budget, and lack of expertise/manpower are the main reason why LGUs could not manage CIS.
Assistance from politicians is usually through provision of funds for new or rehabilitation
projects.
7. Results of Technical Survey of Selected Communal Irrigation Systems Tables 11a to 11c show the profile of the 66 selected CIS from 11 selected provinces in Luzon
(Cycle 1) and the 12 sample CIS from 4 selected provinces in Visayas and 12 sample CIS from
4 selected provinces also in Mindanao. The highlights of the interviews with IA officials and
members and the findings from walkthroughs of each individual CIS are shown in Annex
16.1A and B. The location of the selected CIS relative to a slope map are shown on Annex
16.2A and B. It is unfortunate that shape files of the delineated areas of all the CIS are not
available from NIA. Any available maps are not accurate and geotagged, while the limited time
during the surveys prevented any form of area delineation except for some point reference of
the location of the dam and several important irrigation structures.
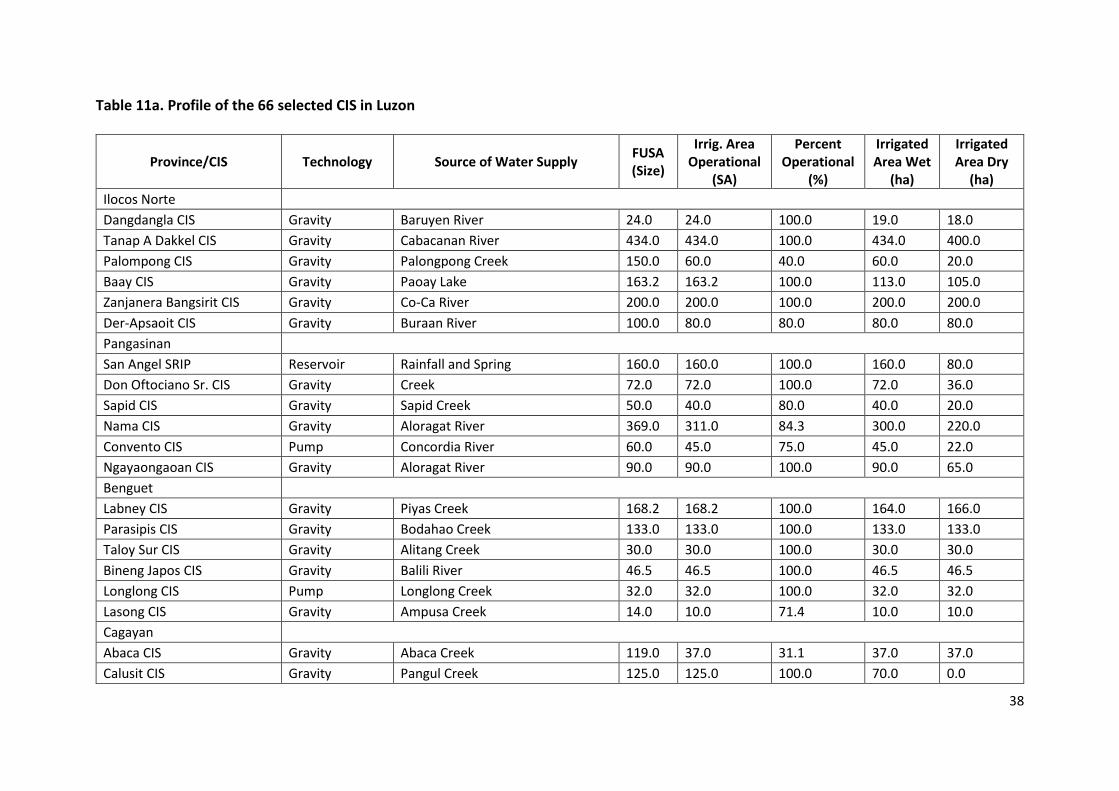
38
Table 11a. Profile of the 66 selected CIS in Luzon
Province/CIS Technology Source of Water Supply FUSA (Size)
Irrig. Area Operational
(SA)
Percent Operational
(%)
Irrigated Area Wet
(ha)
Irrigated Area Dry
(ha)
Ilocos Norte
Dangdangla CIS Gravity Baruyen River 24.0 24.0 100.0 19.0 18.0
Tanap A Dakkel CIS Gravity Cabacanan River 434.0 434.0 100.0 434.0 400.0
Palompong CIS Gravity Palongpong Creek 150.0 60.0 40.0 60.0 20.0
Baay CIS Gravity Paoay Lake 163.2 163.2 100.0 113.0 105.0
Zanjanera Bangsirit CIS Gravity Co-Ca River 200.0 200.0 100.0 200.0 200.0
Der-Apsaoit CIS Gravity Buraan River 100.0 80.0 80.0 80.0 80.0
Pangasinan
San Angel SRIP Reservoir Rainfall and Spring 160.0 160.0 100.0 160.0 80.0
Don Oftociano Sr. CIS Gravity Creek 72.0 72.0 100.0 72.0 36.0
Sapid CIS Gravity Sapid Creek 50.0 40.0 80.0 40.0 20.0
Nama CIS Gravity Aloragat River 369.0 311.0 84.3 300.0 220.0
Convento CIS Pump Concordia River 60.0 45.0 75.0 45.0 22.0
Ngayaongaoan CIS Gravity Aloragat River 90.0 90.0 100.0 90.0 65.0
Benguet
Labney CIS Gravity Piyas Creek 168.2 168.2 100.0 164.0 166.0
Parasipis CIS Gravity Bodahao Creek 133.0 133.0 100.0 133.0 133.0
Taloy Sur CIS Gravity Alitang Creek 30.0 30.0 100.0 30.0 30.0
Bineng Japos CIS Gravity Balili River 46.5 46.5 100.0 46.5 46.5
Longlong CIS Pump Longlong Creek 32.0 32.0 100.0 32.0 32.0
Lasong CIS Gravity Ampusa Creek 14.0 10.0 71.4 10.0 10.0
Cagayan
Abaca CIS Gravity Abaca Creek 119.0 37.0 31.1 37.0 37.0
Calusit CIS Gravity Pangul Creek 125.0 125.0 100.0 70.0 0.0

39
Province/CIS Technology Source of Water Supply FUSA (Size)
Irrig. Area Operational
(SA)
Percent Operational
(%)
Irrigated Area Wet
(ha)
Irrigated Area Dry
(ha)
Tappakan Baraccaoit CIS Pump Tappakan River 42.0 42.0 100.0 42.0 42.0
Gumarang CIS Gravity Gumarang Creek 98.0 98.0 100.0 0.0 0.0
Garab CIS Gravity Swip 160.0 105.0 65.6 105.0 105.0
Naddungan CIS Gravity Creek 120.0 90.0 75.0 90.0 90.0
Isabela
Viola CIS Pump Surface Runoff, Groundwater 550.0 550.0 100.0 550.0 550.0
Masipi West CIS Gravity Masipi Creek 70.0 70.0 100.0 70.0 70.0
Masipi East CIS Gravity Balasig River 62.0 62.0 100.0 62.0 62.0
Casilagan Ballacong CIS Gravity Bintacan River 175.0 155.0 88.6 155.0 155.0
Cumabao CIS Gravity Balasig River, Sinabuloan Creek 190.0 190.0 100.0 190.0 130.0
Cabaruan CIS Pump Surface Run-Off, Ground Water 96.0 50.0 52.1 50.0 26.0
Nueva Vizcaya
Lumannap Aurora CIS Gravity Angadanan River 110.0 105.0 95.5 110.0 110.0
Nangalisan-Paniki-Pieza CIS Gravity Lamut River 650.0 612.0 94.2 490.0 490.0
Magapuy CIS Gravity Magat River 40.0 40.0 100.0 40.0 40.0
Boliwao CIS Gravity Boliwao River 73.0 73.0 100.0 70.0 70.0
Paoac Barobbob CIS Gravity Bayombong Creek 336.0 336.0 100.0 336.0 336.0
Duruarog CIS Gravity Duruarog Creek 10.0 10.0 100.0 10.0 5.0
Nueva Ecija
Cordero CIS Gravity Groundwater 50.0 50.0 100.0 50.0 30.0
Inasan CIS Gravity Inasan River 110.0 110.0 100.0 110.0 80.0
Parang-Bugnan CIS Gravity Bugnan River 220.0 220.0 100.0 220.0 190.0
Sta. Lucia-Old CIS Gravity Malabog Creek 400.0 400.0 100.0 350.0 400.0
Macapulo Bongabon CIS Pump Creek 60.0 60.0 100.0 12.0 12.0
Tedtedtilingit CIS Gravity Bato Ferry 249.0 249.0 100.0 130.0 130.0
Pampanga
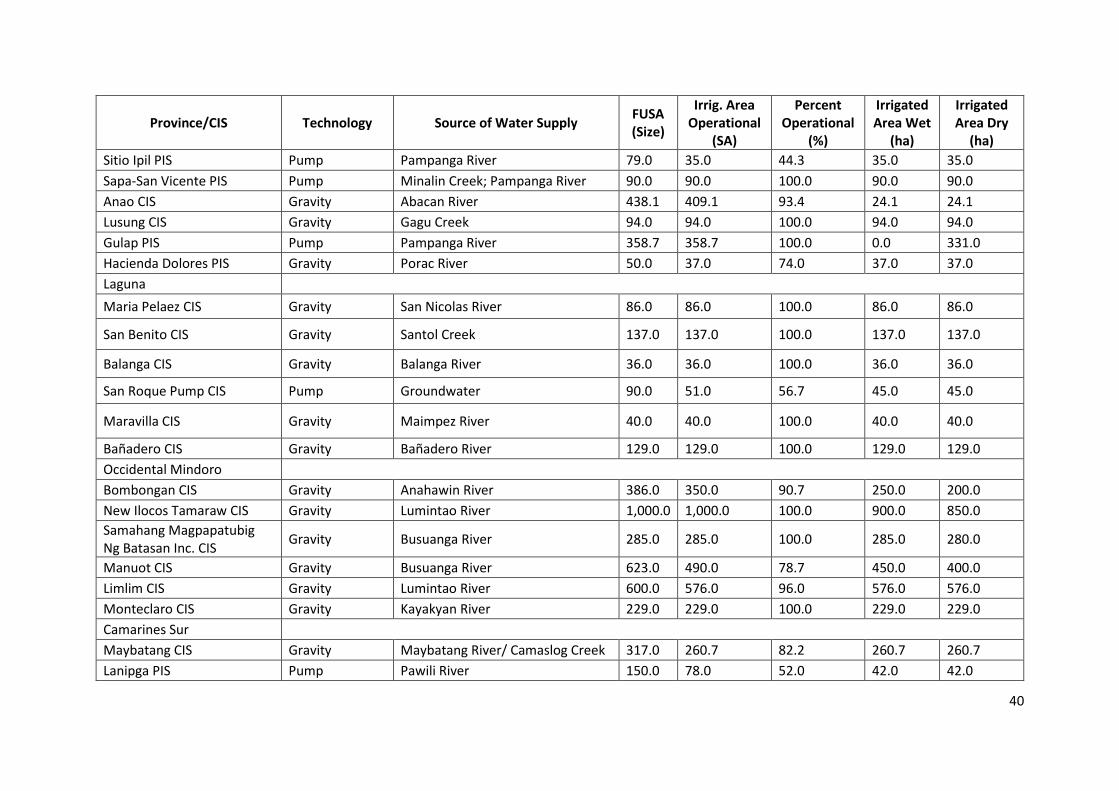
40
Province/CIS Technology Source of Water Supply FUSA (Size)
Irrig. Area Operational
(SA)
Percent Operational
(%)
Irrigated Area Wet
(ha)
Irrigated Area Dry
(ha)
Sitio Ipil PIS Pump Pampanga River 79.0 35.0 44.3 35.0 35.0
Sapa-San Vicente PIS Pump Minalin Creek; Pampanga River 90.0 90.0 100.0 90.0 90.0
Anao CIS Gravity Abacan River 438.1 409.1 93.4 24.1 24.1
Lusung CIS Gravity Gagu Creek 94.0 94.0 100.0 94.0 94.0
Gulap PIS Pump Pampanga River 358.7 358.7 100.0 0.0 331.0
Hacienda Dolores PIS Gravity Porac River 50.0 37.0 74.0 37.0 37.0
Laguna
Maria Pelaez CIS Gravity San Nicolas River 86.0 86.0 100.0 86.0 86.0
San Benito CIS Gravity Santol Creek 137.0 137.0 100.0 137.0 137.0
Balanga CIS Gravity Balanga River 36.0 36.0 100.0 36.0 36.0
San Roque Pump CIS Pump Groundwater 90.0 51.0 56.7 45.0 45.0
Maravilla CIS Gravity Maimpez River 40.0 40.0 100.0 40.0 40.0
Bañadero CIS Gravity Bañadero River 129.0 129.0 100.0 129.0 129.0
Occidental Mindoro
Bombongan CIS Gravity Anahawin River 386.0 350.0 90.7 250.0 200.0
New Ilocos Tamaraw CIS Gravity Lumintao River 1,000.0 1,000.0 100.0 900.0 850.0
Samahang Magpapatubig Ng Batasan Inc. CIS
Gravity Busuanga River 285.0 285.0 100.0 285.0 280.0
Manuot CIS Gravity Busuanga River 623.0 490.0 78.7 450.0 400.0
Limlim CIS Gravity Lumintao River 600.0 576.0 96.0 576.0 576.0
Monteclaro CIS Gravity Kayakyan River 229.0 229.0 100.0 229.0 229.0
Camarines Sur
Maybatang CIS Gravity Maybatang River/ Camaslog Creek 317.0 260.7 82.2 260.7 260.7
Lanipga PIS Pump Pawili River 150.0 78.0 52.0 42.0 42.0

41
Province/CIS Technology Source of Water Supply FUSA (Size)
Irrig. Area Operational
(SA)
Percent Operational
(%)
Irrigated Area Wet
(ha)
Irrigated Area Dry
(ha)
San Agustin-San Ramon PIS Pump Bicol River 586.0 419.0 71.5 419.0 419.0
Inansagan CIS Gravity Lagonoy River 50.0 50.0 100.0 33.0 33.0
Suha San Antonio CIS Gravity Cagmanaba Creek Kinakabikabihan Creek
100.0 100.0 100.0 100.0 100.0
Aslong CIS Gravity Aslong River 250.0 250.0 100.0 250.0 250.0
Source: FGD with IA officers/members and secondary data from respective IMO, 2015
Table 11b. Profile of the 12 selected CIS in Visayas
Province/CIS Technology Source of Water Supply FUSA (Size)
Irrig. Area Operational
(SA)
Percent Operational
(%)
Irrigated Area Wet
(ha)
Irrigated Area Dry
(ha)
Bohol
Gabayan CIS Gravity Gabayan River 290 290 100 290 250
Cambuyo CIP Gravity Aghuban Spring 100 100 100 100 75
Loboc Groundwater Pump Groundwater 20 20 100 20 5
Leyte
Tagbawto CIS Gravity Hilusig and Tagbawto Rivers 723 723 100 723 723
Sta. Elena CIS Gravity Kiloon Creek 112 112 100 112 112
Maljo CIS Gravity Taon-Taon River 46 46 100 46 46
Iloilo
Siwaragan CIS Gravity Siwaragan River 197 195 98.98 195 185
Tumagboc CIS Gravity Tumagbok River 65 65 100 65 45
Nalundan/ Particion CIP Pump Tangyan River 50 50 100 50 25
Capiz
Maayon CIP Gravity Maayon River 592 592 100 592 592
Salcedo CIS Gravity Mali-ao Creek 128 128 100 128 128
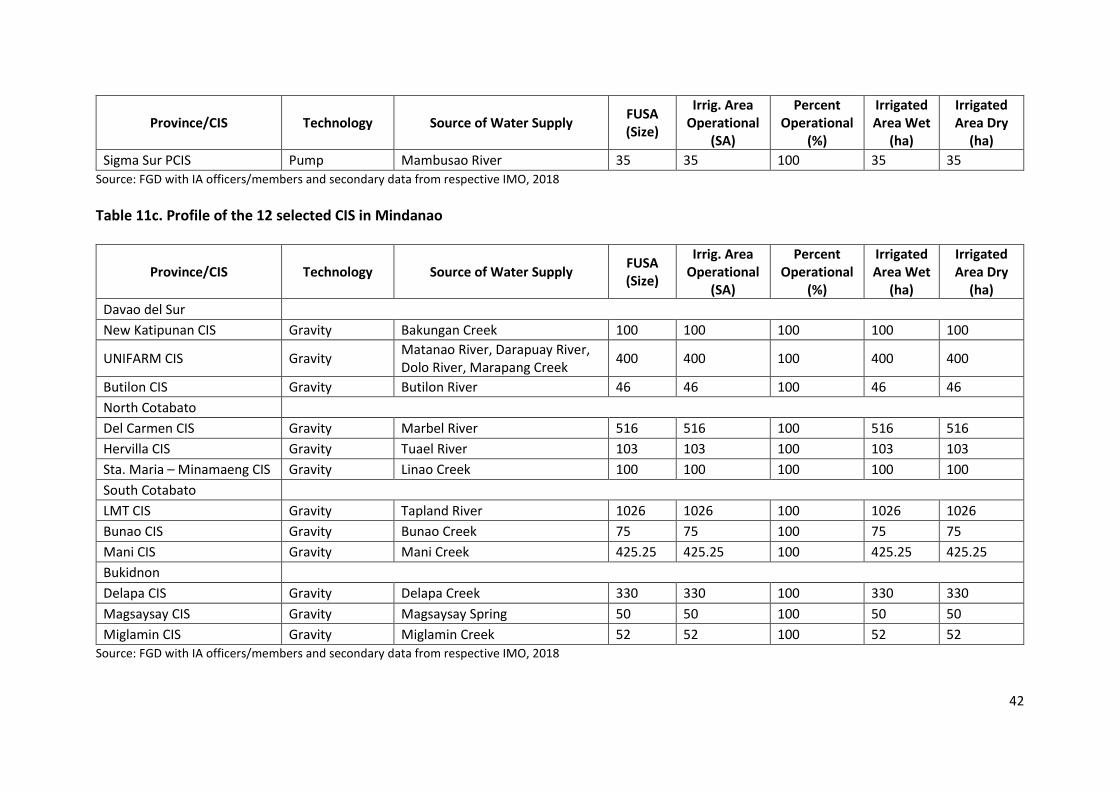
42
Province/CIS Technology Source of Water Supply FUSA (Size)
Irrig. Area Operational
(SA)
Percent Operational
(%)
Irrigated Area Wet
(ha)
Irrigated Area Dry
(ha)
Sigma Sur PCIS Pump Mambusao River 35 35 100 35 35
Source: FGD with IA officers/members and secondary data from respective IMO, 2018
Table 11c. Profile of the 12 selected CIS in Mindanao
Province/CIS Technology Source of Water Supply FUSA (Size)
Irrig. Area Operational
(SA)
Percent Operational
(%)
Irrigated Area Wet
(ha)
Irrigated Area Dry
(ha)
Davao del Sur
New Katipunan CIS Gravity Bakungan Creek 100 100 100 100 100
UNIFARM CIS Gravity Matanao River, Darapuay River, Dolo River, Marapang Creek
400 400 100 400 400
Butilon CIS Gravity Butilon River 46 46 100 46 46
North Cotabato
Del Carmen CIS Gravity Marbel River 516 516 100 516 516
Hervilla CIS Gravity Tuael River 103 103 100 103 103
Sta. Maria – Minamaeng CIS Gravity Linao Creek 100 100 100 100 100
South Cotabato
LMT CIS Gravity Tapland River 1026 1026 100 1026 1026
Bunao CIS Gravity Bunao Creek 75 75 100 75 75
Mani CIS Gravity Mani Creek 425.25 425.25 100 425.25 425.25
Bukidnon
Delapa CIS Gravity Delapa Creek 330 330 100 330 330
Magsaysay CIS Gravity Magsaysay Spring 50 50 100 50 50
Miglamin CIS Gravity Miglamin Creek 52 52 100 52 52
Source: FGD with IA officers/members and secondary data from respective IMO, 2018

43
The slope maps showed that some CIS are irrigating rice areas with slope greater than 3%,
particularly those areas outside large NIS like UPRIIS and MARIIS. In some cases, the CIS
are irrigating small patches of areas under 3% slope. The 3.1 M potential irrigable areas as
defined by NIA based on the 0-3% slope and 100 ha contiguous, are quite low and that there is
a vast potential for small scale irrigation development if there is a good surface water source
or a good aquifer present. This lends credence to a World Bank study which included areas up
to 8% slope increasing the irrigable areas to more than 6.1 M ha. These show that the basis for
the delineation of potential irrigable areas should be revisited.
7.1. Sources of Water One of the main reasons for the low performance of irrigation systems is the lack of water
during dry season. During the feasibility study, historical records of river discharge (low flows)
is subjected to hydrologic frequency analysis (HFA) and usually the 4 in 5 year low or 80%
dependable flow is used in the design. However, most of our river systems have not been
gauged since the 1980’s and the last published reference for major rivers is the Philippine Water
Resources Summary Data Volume 1: Streamflow and Lake or River Stage by the then National
Water Resources Council (now NWRB) in 1980. The last records stated in this reference is
December 31, 1970. It is only recently that monitoring of river flows on most rivers were
continued due to the floods and calamities that recently befell the country. In the absence of
data, engineers usually rely on empirical equations (e.g. Rational equation, and other site-
specific case studies), water balance methods or synthetic data generated using hydrologic
models (e.g. HEC-HMS, SWAT). The reliability of these methods should always be tested and
the results calibrated with actual data. Also, historical data may not reflect the actual condition
especially if the watershed and land use upstream have been modified.
The water source for the surveyed CIS include lakes, rivers, creeks, springs, groundwater and
runoff or a combination of one or more source. Rivers, creeks, and springs are the major sources
of irrigation water in Luzon. Groundwater is particularly used in Pampanga, Isabela, Laguna.
In the Visayas, only one sample CIS in Bohol use groundwater as additional source. For
Mindanao sample CIS, rivers are the only water source in Davao del Sur while the other
provinces have either springs or creeks as other sources. Except for some large rivers, there are
no historical records of the discharges of the river and creek sources for CIS. Historical flow
records or at least synthetically generated flow data should be included in the feasibility
analyses, but no such report have been furnished by the NIA for all the CIS visited.
Surface Sources
Paoay Lake in Ilocos Norte, which is the source of Baay CIS through a dike and intake tunnel
structure, is the only lake source for any of the CIS surveyed. No storage or water level records
are available for Paoay Lake.
Some rivers have adequate water supply with a dependable (low) flow that can sustain
irrigation on both wet and dry seasons. For Luzon, these rivers and the CIS drawing irrigation
water from them include: Pampanga (Sitio Ipil PIS; Gulap PIS), Porac (Hacienda Dolores PIS),
Inasan (Inasan CIS), Bugnan (Parang Bugnan CIS), Baruyen (Dangdangla CIS), Co-ca
(Zanjanera Bangsirit CIS), Maybatang (Maybatang CIS), Camaslog (Maybatang CIS), Aslong
(Aslong CIS), Magat (Magapuy CIS), Boliwao (Boliwao CIS), Angadanan (Aurora CIS),
Bintacan (Casilagan CIS), Bicol (San Ramon PIS), Pawili (Lanipga PIS), Lagonoy (Inansagan
CIS), San Nicolas (Maria Pelaez CIS), Maimpez (Maravilla CIS), Bañadero (Bañadero CIS)
and Busuanga (Samahang Magpapatubig Ng Batasan Inc. CIS; Manuot CIS) Rivers. In Visayas
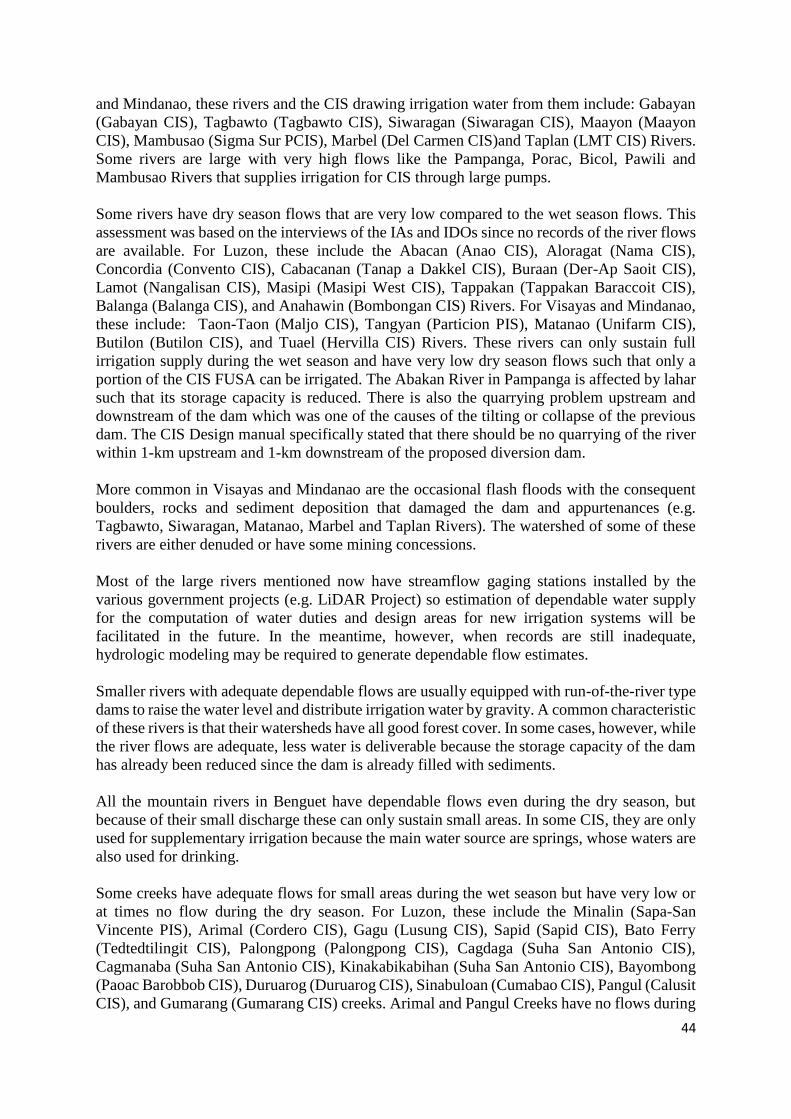
44
and Mindanao, these rivers and the CIS drawing irrigation water from them include: Gabayan
(Gabayan CIS), Tagbawto (Tagbawto CIS), Siwaragan (Siwaragan CIS), Maayon (Maayon
CIS), Mambusao (Sigma Sur PCIS), Marbel (Del Carmen CIS)and Taplan (LMT CIS) Rivers.
Some rivers are large with very high flows like the Pampanga, Porac, Bicol, Pawili and
Mambusao Rivers that supplies irrigation for CIS through large pumps.
Some rivers have dry season flows that are very low compared to the wet season flows. This
assessment was based on the interviews of the IAs and IDOs since no records of the river flows
are available. For Luzon, these include the Abacan (Anao CIS), Aloragat (Nama CIS),
Concordia (Convento CIS), Cabacanan (Tanap a Dakkel CIS), Buraan (Der-Ap Saoit CIS),
Lamot (Nangalisan CIS), Masipi (Masipi West CIS), Tappakan (Tappakan Baraccoit CIS),
Balanga (Balanga CIS), and Anahawin (Bombongan CIS) Rivers. For Visayas and Mindanao,
these include: Taon-Taon (Maljo CIS), Tangyan (Particion PIS), Matanao (Unifarm CIS),
Butilon (Butilon CIS), and Tuael (Hervilla CIS) Rivers. These rivers can only sustain full
irrigation supply during the wet season and have very low dry season flows such that only a
portion of the CIS FUSA can be irrigated. The Abakan River in Pampanga is affected by lahar
such that its storage capacity is reduced. There is also the quarrying problem upstream and
downstream of the dam which was one of the causes of the tilting or collapse of the previous
dam. The CIS Design manual specifically stated that there should be no quarrying of the river
within 1-km upstream and 1-km downstream of the proposed diversion dam.
More common in Visayas and Mindanao are the occasional flash floods with the consequent
boulders, rocks and sediment deposition that damaged the dam and appurtenances (e.g.
Tagbawto, Siwaragan, Matanao, Marbel and Taplan Rivers). The watershed of some of these
rivers are either denuded or have some mining concessions.
Most of the large rivers mentioned now have streamflow gaging stations installed by the
various government projects (e.g. LiDAR Project) so estimation of dependable water supply
for the computation of water duties and design areas for new irrigation systems will be
facilitated in the future. In the meantime, however, when records are still inadequate,
hydrologic modeling may be required to generate dependable flow estimates.
Smaller rivers with adequate dependable flows are usually equipped with run-of-the-river type
dams to raise the water level and distribute irrigation water by gravity. A common characteristic
of these rivers is that their watersheds have all good forest cover. In some cases, however, while
the river flows are adequate, less water is deliverable because the storage capacity of the dam
has already been reduced since the dam is already filled with sediments.
All the mountain rivers in Benguet have dependable flows even during the dry season, but
because of their small discharge these can only sustain small areas. In some CIS, they are only
used for supplementary irrigation because the main water source are springs, whose waters are
also used for drinking.
Some creeks have adequate flows for small areas during the wet season but have very low or
at times no flow during the dry season. For Luzon, these include the Minalin (Sapa-San
Vincente PIS), Arimal (Cordero CIS), Gagu (Lusung CIS), Sapid (Sapid CIS), Bato Ferry
(Tedtedtilingit CIS), Palongpong (Palongpong CIS), Cagdaga (Suha San Antonio CIS),
Cagmanaba (Suha San Antonio CIS), Kinakabikabihan (Suha San Antonio CIS), Bayombong
(Paoac Barobbob CIS), Duruarog (Duruarog CIS), Sinabuloan (Cumabao CIS), Pangul (Calusit
CIS), and Gumarang (Gumarang CIS) creeks. Arimal and Pangul Creeks have no flows during
45
the site visit, and the IAs said that the forest in the watershed are already denuded due to slash
and burn agriculture (kaingin). Even then the dry season flow of the creek is very low but
recently no water flows during the dry season. In the case of the Sapid creek, the operation of
a cement company upstream resulted to little or no water during the dry season. For Visayas
and Mindanao, these include Kiloon (Sta. Elena CIS), Mali-ao (Salcedo CIS), Bakungan
(Katipunan CIS), Linao (Sta. Maria-Minamaeng CIS), Bunao (Bunao CIS), Mani (Mani CIS),
Delapa (Delapa CIS) and Miglamin (Miglamin CIS) Creeks. During low flows when not
enough water enters the dam intake structures, the same rivers or creeks are sometimes used
directly as supplemental water sources using low-lift pumps or open-source pumps
(LLPs/OSPs).
Only 29 out of the 90 CIS visited, or about 32%, have rivers sources that were deemed capable
of providing irrigation even during dry seasons. Seven of these rivers are very large and provide
water for large NIS as well. If the CIS are sourced from these rivers, then dry season crops are
more or less assured of irrigation 80% of the time, and only siltation and hardware problems
are left to deal with. However, majority of the CIS are sourced from less dependable small
rivers and creeks, as well as springs and runoff (rainfall excess), which do not even have
historical records of flows to form as basis for sensible engineering designs. In these cases, the
source of water is a major problem. This is compounded by environmental problems such as
denuded watershed cover due to logging and kaingin, land use conversion, etc. Moreover, the
flow records show that even during the 1970’s, the minimum measured flows are way below
the mean daily discharge indicating that in some cases, even large rivers may not be able to
supply irrigation during the dry season, say 1 in 5 yrs (20% probability of non-exceedance).
This is expected to be much less at present.
Groundwater
The Philippines is blessed with about 5 million ha of shallow aquifers. Annex 16.3A and B
shows the groundwater potential for each province selected in the survey. Fairly extensive and
productive aquifers are present in parts of Isabela, Pampanga, Pangasinan, Ilocos Norte,
Laguna, Leyte, Iloilo, Davao del Sur, North and South Cotabato, while localized productive
aquifers are present in Cagayan and other parts of Isabela, Camarines Sur, Benguet, and
Occidental Mindoro, Bohol, Leyte, Iloilo, Capiz, Davao del Sur, North and South Cotabato.
For Benguet, the localized aquifers are the sources of springs. Bohol, on the other hand, have
many springs due to the Karst formations underlying the province. Nueva Vizcaya and Nueva
Ecija, particularly since the visited CIS are located at the outskirts of the Pampanga River
Basin, are without significant or limited pumpable groundwater.
While groundwater is usually tapped for irrigation by private initiatives using shallow
tubewells (STWs), NIA and other government agencies like DA, BSWM and DAR have
funded projects in support of STWs. Some CIS are directly irrigated by NIA funded STWs like
the Viola Estate CIS and Cabaruan CPIS both in Isabela, and San Roque PIS in Victoria,
Laguna. Viola Estate CIS is a collection of 134 units of STWs constructed by NIA and turned-
over for management to the ARBA multi-purpose cooperative. Cabaruan CPIS only consists
of 24 pump units, with each STW designed to irrigate a minimum of 3 ha. Tapping groundwater
using STWs is also one of the main modes for supplemental irrigation for the CIS during the
dry season including Don Oftociano and Cordero CIS, in which only 50% of FUSA is irrigated
during the dry season, Anao, Sapa-San Vicente, Lusung, Nama, Palongpong, Zanjanera
Bangsirit, Calusit, San Benito and Monteclaro CIS. There were no CIS using groundwater in
Mindanao and only Loboc CIS in Bohol is using groundwater for irrigation. However, several

46
farmers and IAs that have creeks as water sources have standby STWs which they used for
supplemental irrigation. In fact, the NIA IMO of North Cotabato maintain standby STWs which
they use only during periods of prolonged droughts.
While using STW pumps and engines may incur additional fuel costs, these are reliable water
sources even during intense drought periods or El Niño episodes, and farmers have control of
irrigation schedules and flows. The practice of supplementing gravity irrigation with
groundwater from STWs should be encouraged in areas underlain by good shallow aquifers,
especially if the surface water sources (i.e. creeks) have very low dependable flows during the
dry season.
Springs are the principal water sources of most CIS in Benguet, supplemented only by river
water when the flow becomes inadequate for their areas. Springs are also the sources of
irrigation water for Lusung PIS, San Angel CIS and Abaca CIS. Since the spring discharge are
usually low, they are supplemented by other sources like creeks for Lusung PIS and Abaca CIS
and runoff for San Angel CIS. Spring from solution channels on Karst formation (e.g.,
Ughuban spring in Bohol, and other springs in Maljo CIS in Leyte, and Sta. Maria-Minamaeng
CIS in North Cotabato) are also reliable sources for irrigation. While the Magsaysay CIS in
Bukidnon has a spring source, its discharge have already been drastically reduced and the
reservoir created by the spring is heavily silted.
Excess runoffs (rainfall excess) are also sometimes stored in reservoir or small water
impoundments for use in irrigation. These include: San Angel CIS, which is a reservoir type
that store runoff and water from two springs; Naddungan CIS, which impounds runoff in
support of the Naddungan creek; and Garab CIS, which is a small water impounding project.
A review of the river basin masterplans of the Cagayan, Pampanga, Pasig-Laguna and Bicol
River Basins were also conducted to determine development and management plans with
regards to increased irrigated agriculture and water supply sources in the river basin. All of
them projected an increase in irrigated areas, which are based potentially on the 3% slope
irrigable areas, and proposed several strategies, including watershed protection, due to the
consequent decline in water supply for all sectors. The Cagayan River Basin master plan
proposed 9 irrigation development and 5 irrigation rehabilitation schemes to fully develop the
lowlands. They have also proposed agricultural development schemes, water use management
strategies and climate change impact and adaptation strategies and actions in their Integrated
Water Resources Management (IWRM) Plan Framework. The Laguna de Bay master plan
suggested that the lake and its watershed be zoned into three main areas, the industrial,
watershed protection and shoreland zones in order to ensure the sustainability of the lake and
its resources, in response to a foreseen decline in water supply. The formulation of a water
resources utilization policy is suggested in light of the study to use Laguna Lake as potential
domestic water supply source. A groundwater management project was also proposed. The
Bicol River Basin master plan proposed to rehabilitate and develop watershed resources with
improved governance, including the establishment of water allocation mechanism and
considering the water needs of irrigated areas. The Pampanga River Basin master plan provided
more detailed study and specific action plans. The masterplan noted that there are 186
functional CISs with 37,100 ha of service area in the river basin, however, 95 systems with the
total service area of 16,830 ha are nonfunctional. Water shortage is also observed in many
paddy fields served by the existing NIS/CIS. They cited that the main reasons of water shortage
are: (a) the recent climate change causing unstable rainfall pattern; (b) the limited water
resource development; (c) the deterioration of irrigation facilities due to insufficient
47
maintenance; and (d) the lack of small-scale irrigation systems including water impounding
facilities, etc. The degradation of the watershed due to illegal logging and slash/burn
agriculture is deemed to be also one of the reasons of unstable water resource for irrigated
cultivation.
What is sorely missing are specific plans regarding the year on year increase in irrigated areas
based the dependable water supply of the rivers in the basin. In fact, only the Pampanga RB
master plan presented a study on channel flow capacity at different sections of the Pampanga
River, with an average flow of 2,569 m3/s and probable peak flood runoff discharge for a 5-yr
and 10-yr return period of 2,498 and 3,177 m3/s, respectively.
Recently, the River Basin Control Office of DENR (RBCO-DENR) have commissioned the
development and climate proofing of new river basin master plans for the 18 major river basins
and several clustered watersheds. The University of the Philippines Los Baños through the
College of Forestry and Natural Resources and other colleges were assigned six major river
basins namely Cagayan, Agno, Mindanao, Buayan-Malungon, Agus (Ranao) and Tagaloan
River Basins, as well as eight clustered watersheds in various regions of the country. These
Master Plans include assessment of the water supply and water demand from the agricultural,
domestic and industrial sectors, using water balance method. Hydrologic frequency analysis or
flood duration analysis were performed for areas with adequate streamflow data. Hydrologic
modeling, on the other hand, were performed for areas without or with limited streamflow data.
The latest PAGASA climate change projections were adapted. The water balance analysis
conducted in these river basin master plans would be a good starting point in the estimation of
water duties for new areas for irrigation development.
7.2. Water Delivery Performance After assessing the water supply sources, the IAs were asked during the KIIs to rank the water
delivery performance in their CIS based on flexibility, reliability and equitability (Table 12).
Flexibility, in this sense, refers to the ability of the CIS to deviate from an established irrigation
schedule. This is different from the Flexibility of water control structures, which is the ratio of
the change of discharge of the offtake to the rate of change of discharge of the continuing
supply canal. The average Flexibility Index was computed at 3.3 in Luzon and 3.7 in both
Visayas and Mindanao, indicating that the flexibility is quite high. The highest is 4 in Benguet,
Bohol, Capiz, Davao del Sur and North and South Cotabato, and the lowest is 1.5 in Nueva
Ecija. The lowest in Mindanao is in Bukidnon which is still 2.7. Most of the interviewed IAs
have defined schedules for water releases especially during the dry season when water is
limiting but are rather flexible during the wet season when water is more than sufficient. Some
IAs have strict rules and penalties for non-compliance or water stealing. Flexibility in larger IS
may be limited by the lack of control structures to divide or divert flows between zones.
Reliability is an expression of confidence by the irrigation system to deliver water as promised
(Murray-Rust and Snellen, 1993). It is also the degree to which the irrigation system conforms
to prior expectations of its users (Rao, 1993). The average score for Luzon based on the KII is
a high 3.5 but it is much higher at 3.7 in both Visayas and Mindanao, indicating reliable water
delivery. It should be noted that reliability is based on an expected or promised water delivery.
Some farmers are resigned to the fact that water is scarce during a certain dry period and they
will not receive water, so they usually find other water sources like STWs or LLPs. The almost
uniform rainfall distribution in Mindanao and the reliable water sources in both Visayas and
Mindanao are plus factors.
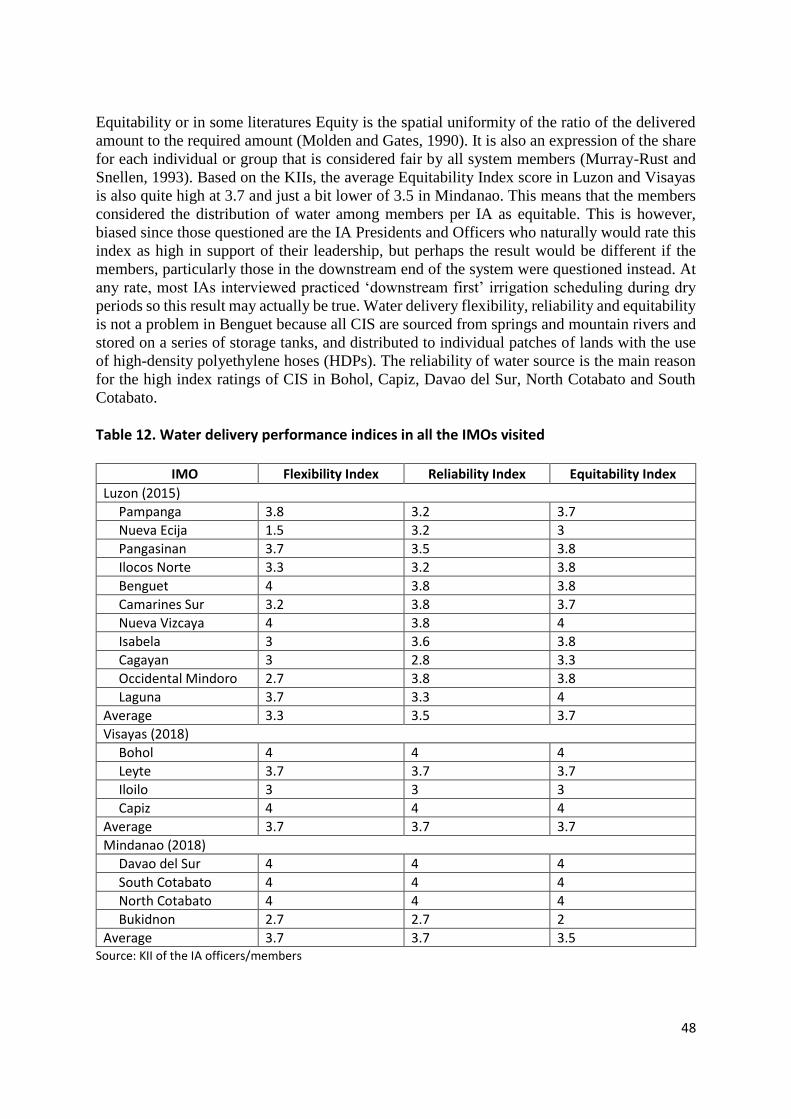
48
Equitability or in some literatures Equity is the spatial uniformity of the ratio of the delivered
amount to the required amount (Molden and Gates, 1990). It is also an expression of the share
for each individual or group that is considered fair by all system members (Murray-Rust and
Snellen, 1993). Based on the KIIs, the average Equitability Index score in Luzon and Visayas
is also quite high at 3.7 and just a bit lower of 3.5 in Mindanao. This means that the members
considered the distribution of water among members per IA as equitable. This is however,
biased since those questioned are the IA Presidents and Officers who naturally would rate this
index as high in support of their leadership, but perhaps the result would be different if the
members, particularly those in the downstream end of the system were questioned instead. At
any rate, most IAs interviewed practiced ‘downstream first’ irrigation scheduling during dry
periods so this result may actually be true. Water delivery flexibility, reliability and equitability
is not a problem in Benguet because all CIS are sourced from springs and mountain rivers and
stored on a series of storage tanks, and distributed to individual patches of lands with the use
of high-density polyethylene hoses (HDPs). The reliability of water source is the main reason
for the high index ratings of CIS in Bohol, Capiz, Davao del Sur, North Cotabato and South
Cotabato.
Table 12. Water delivery performance indices in all the IMOs visited
IMO Flexibility Index Reliability Index Equitability Index
Luzon (2015)
Pampanga 3.8 3.2 3.7
Nueva Ecija 1.5 3.2 3
Pangasinan 3.7 3.5 3.8
Ilocos Norte 3.3 3.2 3.8
Benguet 4 3.8 3.8
Camarines Sur 3.2 3.8 3.7
Nueva Vizcaya 4 3.8 4
Isabela 3 3.6 3.8
Cagayan 3 2.8 3.3
Occidental Mindoro 2.7 3.8 3.8
Laguna 3.7 3.3 4
Average 3.3 3.5 3.7
Visayas (2018)
Bohol 4 4 4
Leyte 3.7 3.7 3.7
Iloilo 3 3 3
Capiz 4 4 4
Average 3.7 3.7 3.7
Mindanao (2018)
Davao del Sur 4 4 4
South Cotabato 4 4 4
North Cotabato 4 4 4
Bukidnon 2.7 2.7 2
Average 3.7 3.7 3.5 Source: KII of the IA officers/members
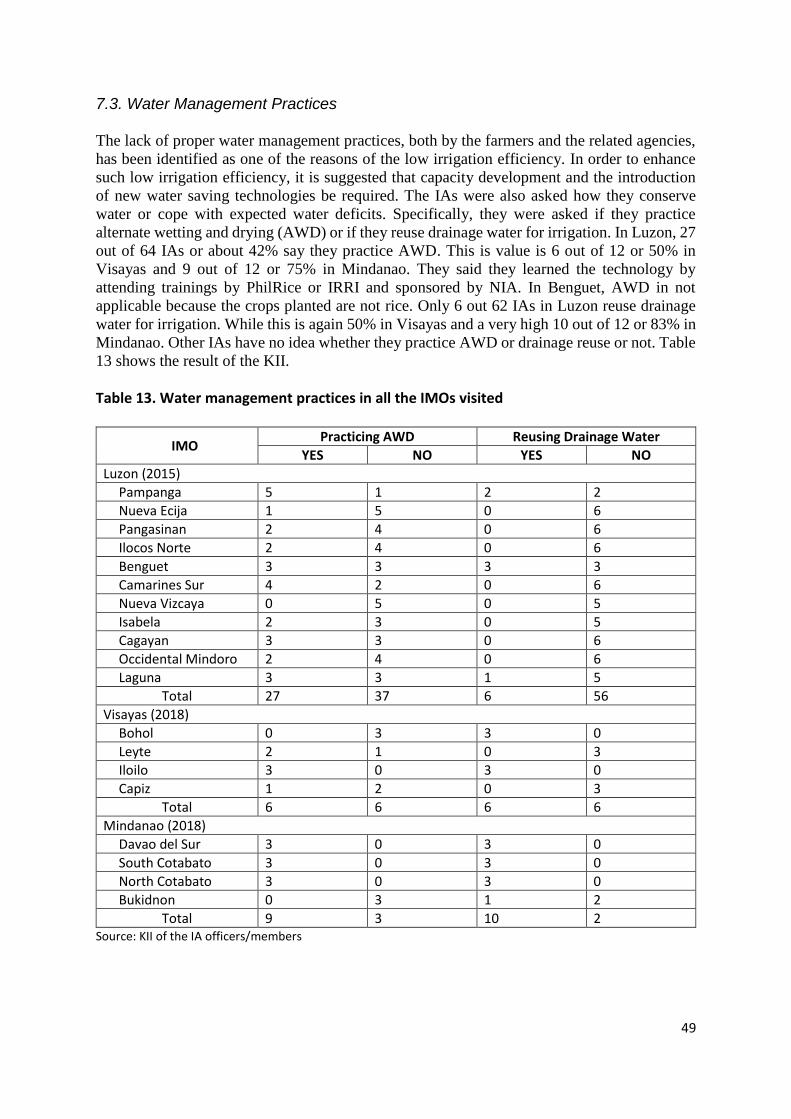
49
7.3. Water Management Practices The lack of proper water management practices, both by the farmers and the related agencies,
has been identified as one of the reasons of the low irrigation efficiency. In order to enhance
such low irrigation efficiency, it is suggested that capacity development and the introduction
of new water saving technologies be required. The IAs were also asked how they conserve
water or cope with expected water deficits. Specifically, they were asked if they practice
alternate wetting and drying (AWD) or if they reuse drainage water for irrigation. In Luzon, 27
out of 64 IAs or about 42% say they practice AWD. This is value is 6 out of 12 or 50% in
Visayas and 9 out of 12 or 75% in Mindanao. They said they learned the technology by
attending trainings by PhilRice or IRRI and sponsored by NIA. In Benguet, AWD in not
applicable because the crops planted are not rice. Only 6 out 62 IAs in Luzon reuse drainage
water for irrigation. While this is again 50% in Visayas and a very high 10 out of 12 or 83% in
Mindanao. Other IAs have no idea whether they practice AWD or drainage reuse or not. Table
13 shows the result of the KII.
Table 13. Water management practices in all the IMOs visited
IMO Practicing AWD Reusing Drainage Water
YES NO YES NO
Luzon (2015)
Pampanga 5 1 2 2
Nueva Ecija 1 5 0 6
Pangasinan 2 4 0 6
Ilocos Norte 2 4 0 6
Benguet 3 3 3 3
Camarines Sur 4 2 0 6
Nueva Vizcaya 0 5 0 5
Isabela 2 3 0 5
Cagayan 3 3 0 6
Occidental Mindoro 2 4 0 6
Laguna 3 3 1 5
Total 27 37 6 56
Visayas (2018)
Bohol 0 3 3 0
Leyte 2 1 0 3
Iloilo 3 0 3 0
Capiz 1 2 0 3
Total 6 6 6 6
Mindanao (2018)
Davao del Sur 3 0 3 0
South Cotabato 3 0 3 0
North Cotabato 3 0 3 0
Bukidnon 0 3 1 2
Total 9 3 10 2 Source: KII of the IA officers/members
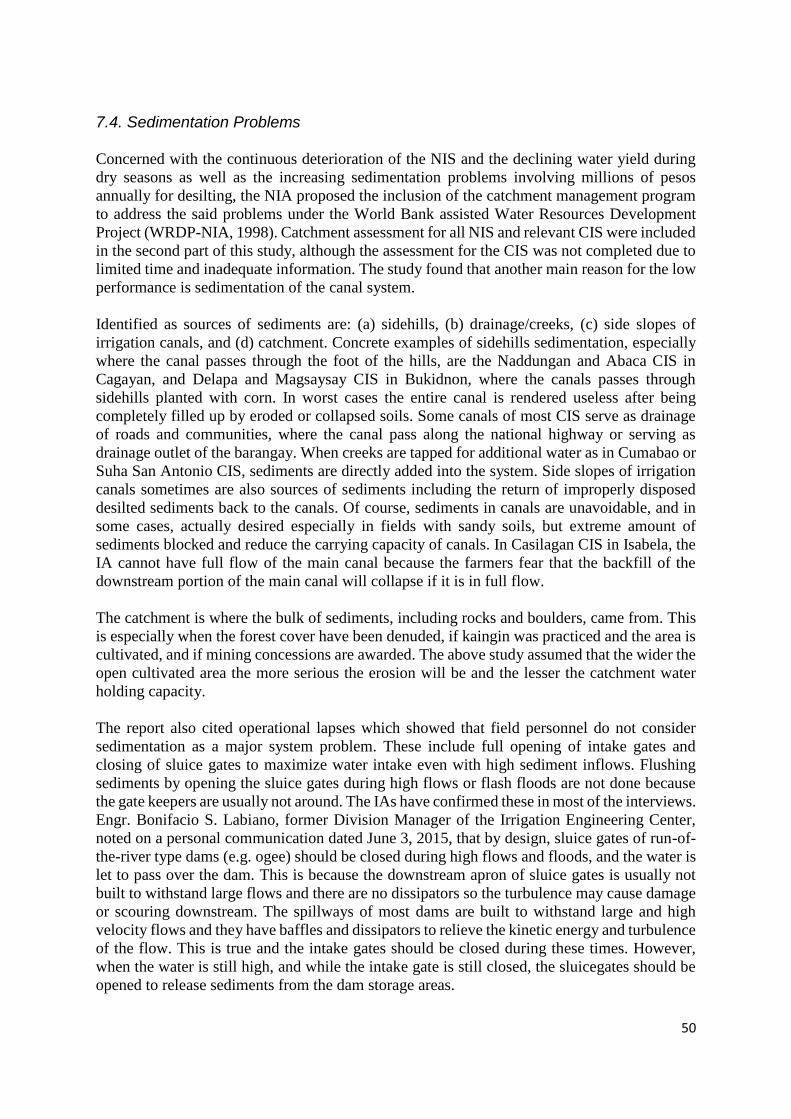
50
7.4. Sedimentation Problems Concerned with the continuous deterioration of the NIS and the declining water yield during
dry seasons as well as the increasing sedimentation problems involving millions of pesos
annually for desilting, the NIA proposed the inclusion of the catchment management program
to address the said problems under the World Bank assisted Water Resources Development
Project (WRDP-NIA, 1998). Catchment assessment for all NIS and relevant CIS were included
in the second part of this study, although the assessment for the CIS was not completed due to
limited time and inadequate information. The study found that another main reason for the low
performance is sedimentation of the canal system.
Identified as sources of sediments are: (a) sidehills, (b) drainage/creeks, (c) side slopes of
irrigation canals, and (d) catchment. Concrete examples of sidehills sedimentation, especially
where the canal passes through the foot of the hills, are the Naddungan and Abaca CIS in
Cagayan, and Delapa and Magsaysay CIS in Bukidnon, where the canals passes through
sidehills planted with corn. In worst cases the entire canal is rendered useless after being
completely filled up by eroded or collapsed soils. Some canals of most CIS serve as drainage
of roads and communities, where the canal pass along the national highway or serving as
drainage outlet of the barangay. When creeks are tapped for additional water as in Cumabao or
Suha San Antonio CIS, sediments are directly added into the system. Side slopes of irrigation
canals sometimes are also sources of sediments including the return of improperly disposed
desilted sediments back to the canals. Of course, sediments in canals are unavoidable, and in
some cases, actually desired especially in fields with sandy soils, but extreme amount of
sediments blocked and reduce the carrying capacity of canals. In Casilagan CIS in Isabela, the
IA cannot have full flow of the main canal because the farmers fear that the backfill of the
downstream portion of the main canal will collapse if it is in full flow.
The catchment is where the bulk of sediments, including rocks and boulders, came from. This
is especially when the forest cover have been denuded, if kaingin was practiced and the area is
cultivated, and if mining concessions are awarded. The above study assumed that the wider the
open cultivated area the more serious the erosion will be and the lesser the catchment water
holding capacity.
The report also cited operational lapses which showed that field personnel do not consider
sedimentation as a major system problem. These include full opening of intake gates and
closing of sluice gates to maximize water intake even with high sediment inflows. Flushing
sediments by opening the sluice gates during high flows or flash floods are not done because
the gate keepers are usually not around. The IAs have confirmed these in most of the interviews.
Engr. Bonifacio S. Labiano, former Division Manager of the Irrigation Engineering Center,
noted on a personal communication dated June 3, 2015, that by design, sluice gates of run-of-
the-river type dams (e.g. ogee) should be closed during high flows and floods, and the water is
let to pass over the dam. This is because the downstream apron of sluice gates is usually not
built to withstand large flows and there are no dissipators so the turbulence may cause damage
or scouring downstream. The spillways of most dams are built to withstand large and high
velocity flows and they have baffles and dissipators to relieve the kinetic energy and turbulence
of the flow. This is true and the intake gates should be closed during these times. However,
when the water is still high, and while the intake gate is still closed, the sluicegates should be
opened to release sediments from the dam storage areas.

51
Defective lifting mechanisms or replacing steel sluice gates permanently by flashboard or
stones maximizes water inflow into the system but also effectively increases sediment inflows.
In the surveyed CIS, Anao, Inasan, Parag-Bugnan, Ngayaongaon, Der-Ap Saoit, Zanjanera
Bangsirit, Boliwao, Casilagan and Batasan CIS have either broken or defective sluice gates,
head gates, intake gates or all of them. In Sta. Elena CIS in Leyte, the steel sluice gates were
not even installed, so the IAs have to use flashboard from coco lumber. In some of them, the
broken gates are permanently replaced by flashboards. The purpose of the wingwalls is to divert
sediment flow from the dam storage area to the sluice gates. The sluice gates are opened or
closed not only to control water level at the dam but also to flush out unwanted sediments and
prevent it from entering the intake gates into the system. The intake gates are elevated above
the sluice openings so that sediments moving at the bed will not enter the intake gates. If the
sluice gates are always closed, then the purpose is defeated and more sediments are either
trapped upstream of the dam or flow into the canal system. In these cited CIS, the sediments
are almost at the crest of the dam, reducing its storage capacity.
Based on NIA studies, the sedimentation rate per area served/irrigated ranges from less than
0.8 to 61 tons/ha/yr. At 2000 rates, the costs would range from ₱1.0 to ₱483/ha/yr. These
represents only a small percentage of actual sedimentation in the system. In terms of catchment
size, the estimated erosion rate based by NIA on the volume of sediment extracted ranges from
0.03 to 6 tons/ha/yr.
Annex 16.4A and B shows the relative location of all the surveyed CIS based on the soil erosion
susceptibility maps. All of the CIS in Benguet are either under severe erosion or moderate
erosion. In Cagayan, the visited CIS are observed to be located in slight and moderate erosion
susceptible areas based on the maps. However, based on the walkthroughs (e.g. Naddungan
CIS), the uplands are already barren due to kaingin and most hills are planted to corn which
also contributes to high soil erosion. Isabela also fell under no apparent or slight erosion except
for Casilagan CIS (moderate erosion), but based on the walkthroughs and KII, siltation is a
major problem in the system. Camarines Sur and Ilocos Norte fall into slight to moderate
erosion areas and this is supported by observations during the field visits. Nueva Vizcaya
belongs to moderate to severe erosion areas which are consistent with the walkthroughs and
KII where denuded forests were pointed out to be the main cause. Pangasinan also fell under
moderate to severe erosion and the walkthroughs points to the case of Ngayao-ngaoan CIS as
an example, where sedimentation really affects their water delivery. Pampanga and Laguna fell
under no apparent erosion areas although the main cause of siltation in Pampanga is lahar. The
CIS in the Visayas and Mindanao mostly fell under no apparent, slight or moderate erosion
areas. However, the effects of reduced forest lands and presence of mining concessions in some
areas contribute heavily on the sedimentation and rocks/boulders deposition in the dam areas
of some CIS (e.g. LMT, Unifarm, Del Carmen CIS). Road construction near the dam site of
Tagbawto CIS in Iloilo, led to the accumulation of rock and sediments on the dam and siltation
on the canals. The IAs are hoping that the contractor would rehabilitate the system once road
construction is finished.
The Pampanga RB master plan estimated that of the lahar produced by the Mt. Pinatubo
eruption in 1991, there still remains a volume of about 900 MCM in the upper reaches of the
river basin, from which the sediment continues to flow to the downstream river stretches. The
current sediment runoff volume into the river channels is estimated at about four times of those
before eruption of Mt. Pinatubo. A substantial part of these sediment runoff would accumulate
in the river channel causing reduction of the channel flow capacity, unless certain
countermeasures are taken such as river dredging and reforestation to reduce the sediment
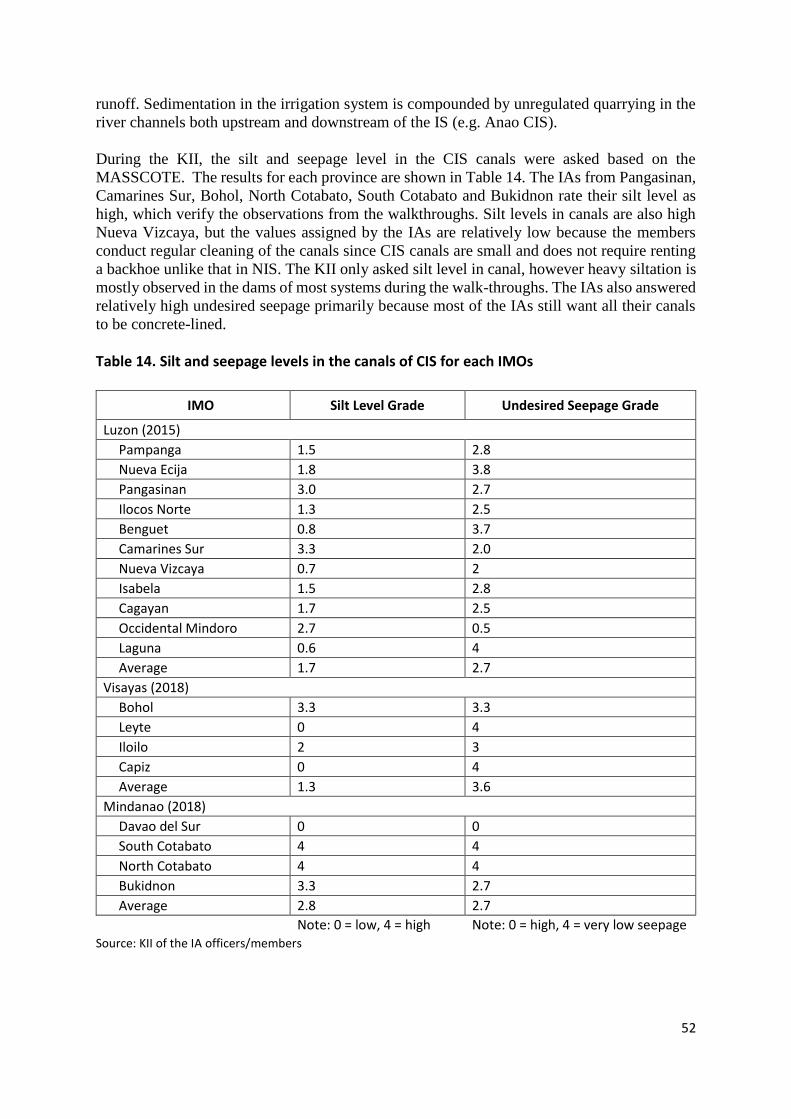
52
runoff. Sedimentation in the irrigation system is compounded by unregulated quarrying in the
river channels both upstream and downstream of the IS (e.g. Anao CIS).
During the KII, the silt and seepage level in the CIS canals were asked based on the
MASSCOTE. The results for each province are shown in Table 14. The IAs from Pangasinan,
Camarines Sur, Bohol, North Cotabato, South Cotabato and Bukidnon rate their silt level as
high, which verify the observations from the walkthroughs. Silt levels in canals are also high
Nueva Vizcaya, but the values assigned by the IAs are relatively low because the members
conduct regular cleaning of the canals since CIS canals are small and does not require renting
a backhoe unlike that in NIS. The KII only asked silt level in canal, however heavy siltation is
mostly observed in the dams of most systems during the walk-throughs. The IAs also answered
relatively high undesired seepage primarily because most of the IAs still want all their canals
to be concrete-lined.
Table 14. Silt and seepage levels in the canals of CIS for each IMOs
IMO Silt Level Grade Undesired Seepage Grade
Luzon (2015)
Pampanga 1.5 2.8
Nueva Ecija 1.8 3.8
Pangasinan 3.0 2.7
Ilocos Norte 1.3 2.5
Benguet 0.8 3.7
Camarines Sur 3.3 2.0
Nueva Vizcaya 0.7 2
Isabela 1.5 2.8
Cagayan 1.7 2.5
Occidental Mindoro 2.7 0.5
Laguna 0.6 4
Average 1.7 2.7
Visayas (2018)
Bohol 3.3 3.3
Leyte 0 4
Iloilo 2 3
Capiz 0 4
Average 1.3 3.6
Mindanao (2018)
Davao del Sur 0 0
South Cotabato 4 4
North Cotabato 4 4
Bukidnon 3.3 2.7
Average 2.8 2.7
Note: 0 = low, 4 = high Note: 0 = high, 4 = very low seepage Source: KII of the IA officers/members

53
7.5. Silt Control Devices Sediment transported by a stream can be divided into bed load and suspended load. Bed load
are usually large particles that moves by rolling or sliding along the channel bed in almost
constant contact with the bed. Suspended load are usually fine sand particles that are suspended
by the turbulence of the flow away from the bed. In terms of grain size, there are wash loads
which are usually clay and silt that are transported uniformly throughout the flow.
The provision of silt control devices is not included in the CIS design manual of NIA.
Estimation of sediment load discharge as a proportion of the total discharge of a river is not
even conducted during the project feasibility phase. However, several silt control devices were
encountered during the field visits, but all are in Mindanao. This is quite understandable since
the catchment management program of the WRDP (1998) was piloted in Mindanao. This
project conducted rehabilitation works on several NIS, focusing on modification of diversion
works, construction of silt excluder as well as sediment monitoring. An example of
rehabilitation works conducted under the WRDP are those at the Malasila River Irrigation
System (MalRIS) in North Cotabato. It was envisioned that with the provision of silt excluder
(Figure 23) the settling of sediments in main canal and laterals would be minimized. Sediment
sampling and monitoring was also conducted at the Malasila River and the main canal (Figure
24). This include discharge measurement, silt and sand sampling, bed load sampling and silt
monitoring at the main canal. Another is the provision of a settling basin and silt ejector at the
Mlang RIS also in North Cotabato. A settling basin (Figure 25) is an oversized section of the
canal where flow velocities can be reduced to a level low enough to allow the suspended
particles to settle. During fallow period, clearing of the settling basin is carried out by combined
manual and hydraulic flushing using the silt ejector (Figure 26). Examples of silt control
devices in Del Carmen CIS (Marbel River in N. Cotabato) and LMT CIS (Taplan River, N.
Cotabato) both in Mindanao are shown in Figure 27. These are installed under the IAs own
initiatives with technical help from NIA.
The study at the MALRIS pointed out that silt excluder reduced the intrusion of sediment (sand)
in the main canal. The provision of settling basin in the main canal of Mlang RIS reduced the
rehabilitation costs on a yearly basis, specifically, on dredging activities or canal de-silting.
These silt control devices, and a host of many others (e.g. King’s silt vanes, Gibb’s groyne,
curved wing with silt vanes, silt platforms, vortex tube sand trap and sloping sill sand screen)
can be used to reduce or flush out silts from the canal and the river itself. However, if large bed
loads, including rocks and boulders are present upstream, the use of Sabo dams may be
employed. But the more important measure is to promote a community-based project in
cooperation with local DENR (MENRO, PENRO) to protect and conserve the watershed area.
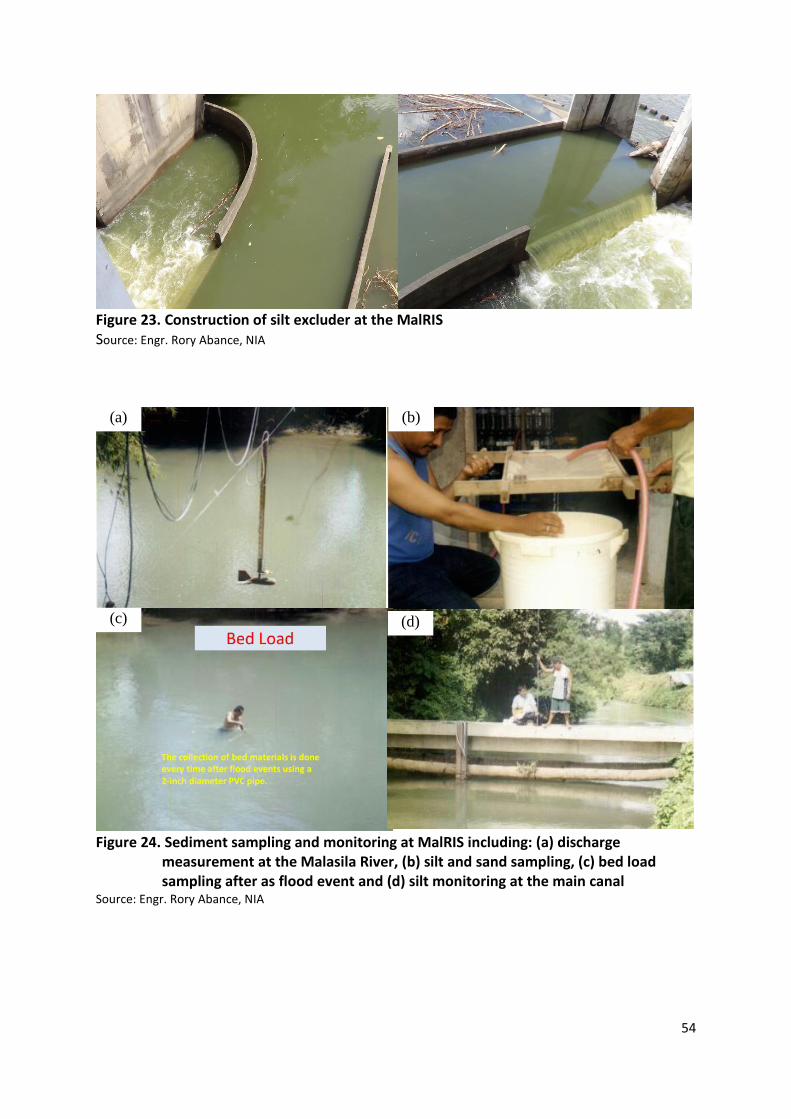
54
Figure 23. Construction of silt excluder at the MalRIS Source: Engr. Rory Abance, NIA
Figure 24. Sediment sampling and monitoring at MalRIS including: (a) discharge measurement at the Malasila River, (b) silt and sand sampling, (c) bed load sampling after as flood event and (d) silt monitoring at the main canal Source: Engr. Rory Abance, NIA
(a) (b)
(c) (d)
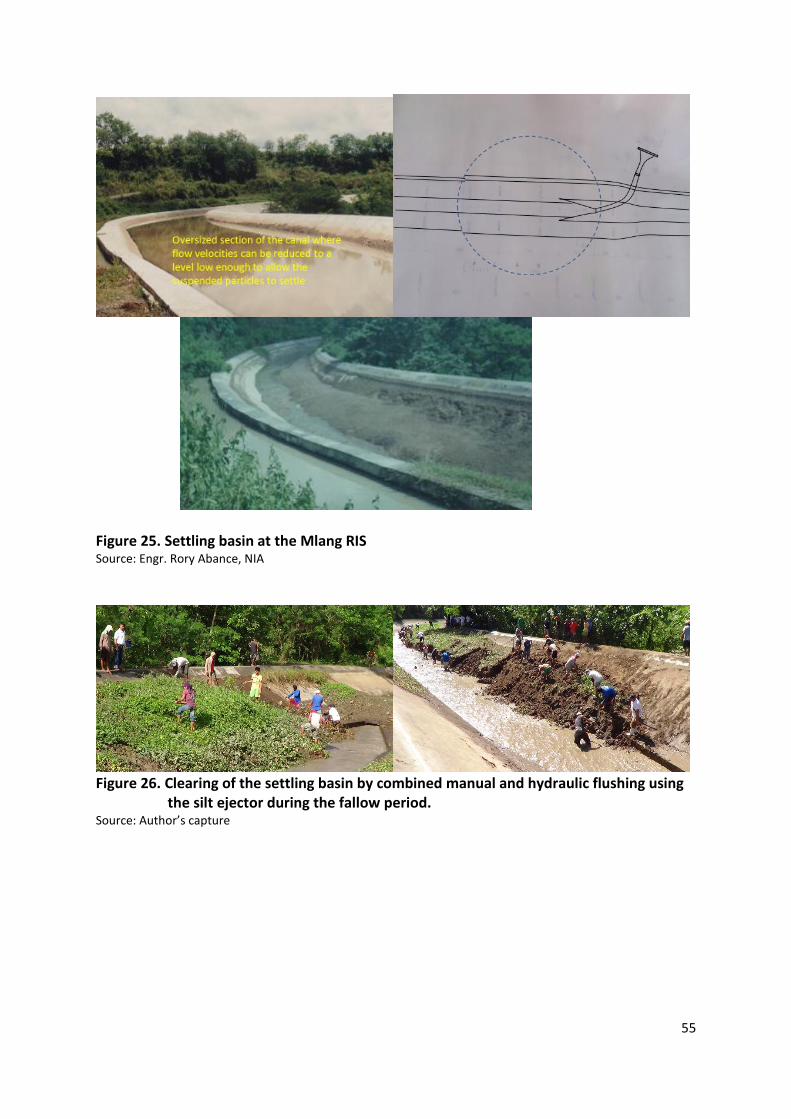
55
Figure 25. Settling basin at the Mlang RIS Source: Engr. Rory Abance, NIA
Figure 26. Clearing of the settling basin by combined manual and hydraulic flushing using
the silt ejector during the fallow period. Source: Author’s capture
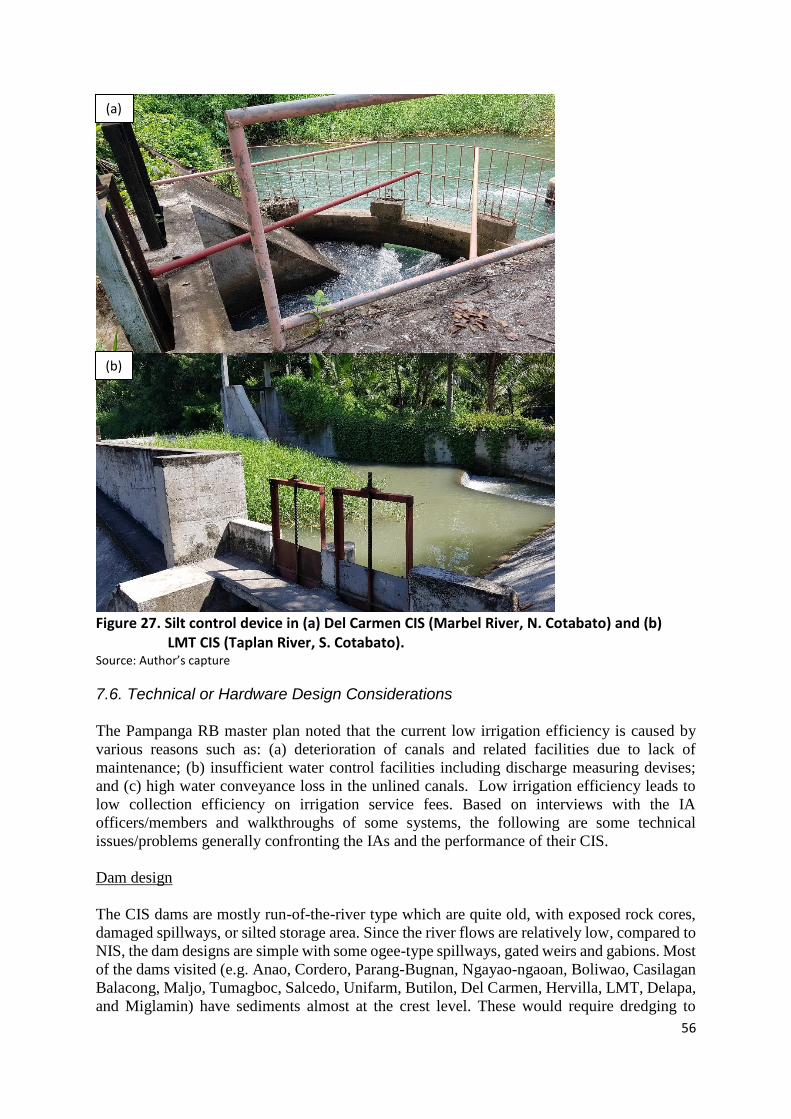
56
Figure 27. Silt control device in (a) Del Carmen CIS (Marbel River, N. Cotabato) and (b)
LMT CIS (Taplan River, S. Cotabato). Source: Author’s capture
7.6. Technical or Hardware Design Considerations The Pampanga RB master plan noted that the current low irrigation efficiency is caused by
various reasons such as: (a) deterioration of canals and related facilities due to lack of
maintenance; (b) insufficient water control facilities including discharge measuring devises;
and (c) high water conveyance loss in the unlined canals. Low irrigation efficiency leads to
low collection efficiency on irrigation service fees. Based on interviews with the IA
officers/members and walkthroughs of some systems, the following are some technical
issues/problems generally confronting the IAs and the performance of their CIS.
Dam design
The CIS dams are mostly run-of-the-river type which are quite old, with exposed rock cores,
damaged spillways, or silted storage area. Since the river flows are relatively low, compared to
NIS, the dam designs are simple with some ogee-type spillways, gated weirs and gabions. Most
of the dams visited (e.g. Anao, Cordero, Parang-Bugnan, Ngayao-ngaoan, Boliwao, Casilagan
Balacong, Maljo, Tumagboc, Salcedo, Unifarm, Butilon, Del Carmen, Hervilla, LMT, Delapa,
and Miglamin) have sediments almost at the crest level. These would require dredging to
(a)
(b)

57
increase the storage capacity of the dam and increase water available for irrigation. Large scale
silt problems that will require the use of backhoe needs the assistance of NIA and costs much.
The Anao dam (Annex A) needs major rehabilitation to prevent possible tilting or collapse.
Quarrying activities immediately downstream of the dam should be stopped so as not to
compromise the stability of the dam. It should be noted that the previous dam has already tilted
due to scouring at the downstream face of the dam and replaced by the current dam at a cost of
~₱ 70 M. During the visit, scouring at the downstream apron and damaged gabions were
already observed. The dam storage area is heavily silted, so the sluice gates remains close to
be able to divert water into the canals. Manual dredging of canals and selling the collected sand
are major sources of extra incomes for locals in North and South Cotabato (e.g. Del Carmen,
Unifarm and LMT CIS) but these pose no danger to the dam itself and are just tolerated.
The Cordero dam (Annex 16.1A) seems to be haphazardly designed and constructed. The dam
is made up of gabions and plastered with concrete here and there and cost ₱4.4 M including
the lined canals. It is now completely filled up with sediments almost at the dam crest level,
which the guide said occurred just after three heavy rainfall. Another heavy rain and the
sediments may overtop the dam. No such examples were encountered in the Visayas and
Mindanao surveys. The IA attributed this to kaingin operations at the mountain by the
indigenous people and illegal logging. In the last rainy season of 2014, water flow was not
stored in the dam but rather seeped underneath and at the side of the dam, prompting the IA to
comment that the dam is not properly designed. Some of the gabions of the dam itself and at
the embankments are already damaged and may cause the dam to collapse. The detailed
engineering design (DED) of the dam was requested to the NIA office to check the actual
design specifications. The dam needs to be replaced but if there are no water flowing in the
creek during the dry season, then it would be an exercise in futility. The watershed of the creek
needs reforestation and protection.
Another case is the reservoir dam of the San Angel SRIP (Annex B). It is an earth-filled dam
that stores water from runoff and two spring sources and designed to irrigate 160 ha but only
half of it (74 ha from the map) is irrigated during the dry season due to less rainfall and
diminished spring flow. The original project cost listed in a map acquired by the team was
₱12,808,800 but the approved firmed up estimate is ₱14,006,985.18. These probably are partial
costs only (maybe just the earth dam) because the project cost based on the same map was
₱79,100,000. The IA on the other hand said the project is worth ₱150 million. These differences
in costs will have to be resolved with NIA. The dam is deemed over-designed and too costly
for a relatively small area. This is just an initial thought pending the acquisition of the requested
detailed engineering design (DED) of the system. More details are included in Annex A. A
similar setup is the Magsaysay CIS in Bukidnon where water comes from Magsaysay spring
and excess rainfall. However, the dam cost is relatively much less and the CIS can still supply
the necessary irrigation to its intended FUSA.
Dam specifications should be based on historical records of low flows, which will be subjected
to hydrologic frequency analysis to determine 80% dependable flow. In the absence of these
data, empirical equations or water balance models may be used. In all the existing CIS with
large dam structures and all proposed CIS, the flow analysis used as basis for the dam design
and estimation of irrigable areas should be reviewed and thoroughly checked, to avoid white
elephant CIS with large structures and canal networks but without water for irrigation.
58
Sluice Gates and Intake Gates
The sluice gates are used to control the water level at the dam and also to flush out sediments
preventing it from entering the intake gates into the system. Intake gates, on the other hand,
controls the amount of water entering the system, and are positioned at a higher elevation
(provided with a sill) than the sluice opening to limit the entry of bed flow sediments. In
coordination with the opening of intake gates, water is being fed into the system at optimum
command (or head) with minimum sediment intake. Most of the sluice gates and intake gates
that are usually made of steel are now replaced with flashboards, sand bags or stones. In Sta.
Elena CIS (Leyte), the steel sluice gates were not even installed. In some relatively larger CIS,
the lifting mechanisms are defective or rather slow. The IAs in Visayas and Mindanao resort
to using second-hand or rented chain blocks to facilitate lifting and closing the gates. These
gates should be repaired or replaced to ensure proper control of the water and sediment intake.
If the sluice gates are not replaced and are always closed, then more sediments will be either
trapped upstream of the dam or enter into the system. If the intake gates are defective or are
always open, then sediment entry into the system as well as the occurrence of flooding in the
fields during high river flows cannot be avoided.
Canal Networks
Since CIS involves small FUSA, the dam is usually small run-of-the-river type, so there are
less infrastructure costs for the dam and more for canal linings and control structures. Most of
the CIS visited have lined main canals and some up to the laterals. In terms of the size and
capacity, main canals of CIS may be comparable to small laterals in NIS, and they are mostly
lined in CIS. The conditions of the lined and unlined canals depend primarily with the IA
themselves whether they have good O&M and cleanup activities. Siltation is a major problem
but usually, the IA can manage to clean the canals themselves. However, there are some cases
where rampant kaingin and planting of corn in sloping lands are the main cause of siltation and
these would require major policy/governance solutions. In canals passing through heavily
eroded sidehills, the IAs are requesting that these canals be covered or replaced with culverts.
Water Control Structures
Since the discharge capacity is just small, only simple structures are found in most CIS and
while some are well maintained, others have deteriorated and the control structures are not
functioning well or as originally intended. These include cross regulators, check gates, drop
structures, division boxes and farm turnouts. Cross regulators are found only in the main canals
of some large CIS and are composed of 2 or 3 steel gates of less than 1-m wide each. They are
used to raise the upstream water level in a canal above its natural level to enable water to flow
to the different canals branching from it. Check gates on small main canals and laterals are
more common. They regulate the flow towards offtakes. In most new CIS, the steel gates are
in good condition and the screws and turning wheels are still operating. In older and improperly
managed CIS, the gates are already damaged and replaced by wooden slabs or in some cases
none at all. The IAs were asked to rate the general condition, ease of operation and the presence
of a system of operation of their cross regulators.
Based on the KIIs, the cross regulators were generally considered to be in good condition in
Luzon, Visayas and Mindanao, based on scores of 3.1, 3.4 and 3.6, respectively. Moreover, the
cross regulators were generally considered as easy to operate. The IAs of Nueva Vizcaya rated

59
the lowest score for their regulators with a score of 1.7 in General Condition and 1.6 for Ease
of Operation. Out of 59 IAs in Luzon, 40 said that they have a system of operation for their
cross regulators. While all responded affirmatively in Visayas and Mindanao.
Drop structures are ubiquitous in most systems and are used to conduct water from a higher to
a lower elevation and to diffuse the force of the falling water; hence it is constructed on steeply
sloping land to prevent channel scouring and erosion. The inlet of the structure also serves as
a control to regulate the water depth in the canal upstream so they are often combined with
check gates and division boxes to minimize costs. Division boxes are rectangular structures
usually built along the main farm ditch to divide and distribute the flow to the supplementary
farm ditches. It is usually made of concrete with slots for wooden slabs, which serves as control
gates. The IAs said that the control of flow direction is done by the water master based on
agreed upon irrigation schedules. Turnouts serves as the outlet of water from a parent canal to
a smaller canal, or from a lateral to the main farm ditch. The density of farm turnouts depends
on the FUSA of the CIS and together with the check gates influences the flexibility and
efficiency of water delivery within the system. However, only four CIS were able to provide
maps of their CIS and some of the maps do not indicate the kind of structures present in the
system. Some CIS (e.g. Gulap, Parang-Bugnan, Boliwao, Cumabao, Gabayan, Del Carmen,
among others) have inverted siphons channeling water under road, rivers or creeks. Most of
these structures have been rehabilitated or de-silted already and some are still being requested
to be repaired. Elevated flumes can also be found in some CIS (e.g. Unifarm and the under-
designed one in Siwaragan CIS). The San Angel SRIP reservoir dam has a spillway to prevent
overtopping of the dam crest.
Table 15. Condition of the cross regulators in all IMOS visited
Province General
condition Ease of
Operation
Presence of Existing System of Operation
YES NO
Luzon (2015)
Pampanga 3.5 4 6 0
Nueva Ecija 3.3 3.8 3 3
Pangasinan 3.2 3.7 5 1
Ilocos Norte 2.8 2.3 3 3
Camarines Sur 3.5 3.7 5 1
Nueva Vizcaya 1.7 1.6 3 3
Benguet 4 3.5 3 0
Isabela 3 3.5 2 2
Cagayan 2.6 3.3 3 2
Occidental Mindoro 3.7 3 4 2
Laguna 2.8 3 3 2
Average/Total 3.1 3.2 40 19
Visayas (2018)
Bohol 3 4 3 0
Leyte 3.7 3.7 3 0
Iloilo 3 3 3 0
Capiz 4 4 3 0
Average/Total 3.4 3.7 12 0
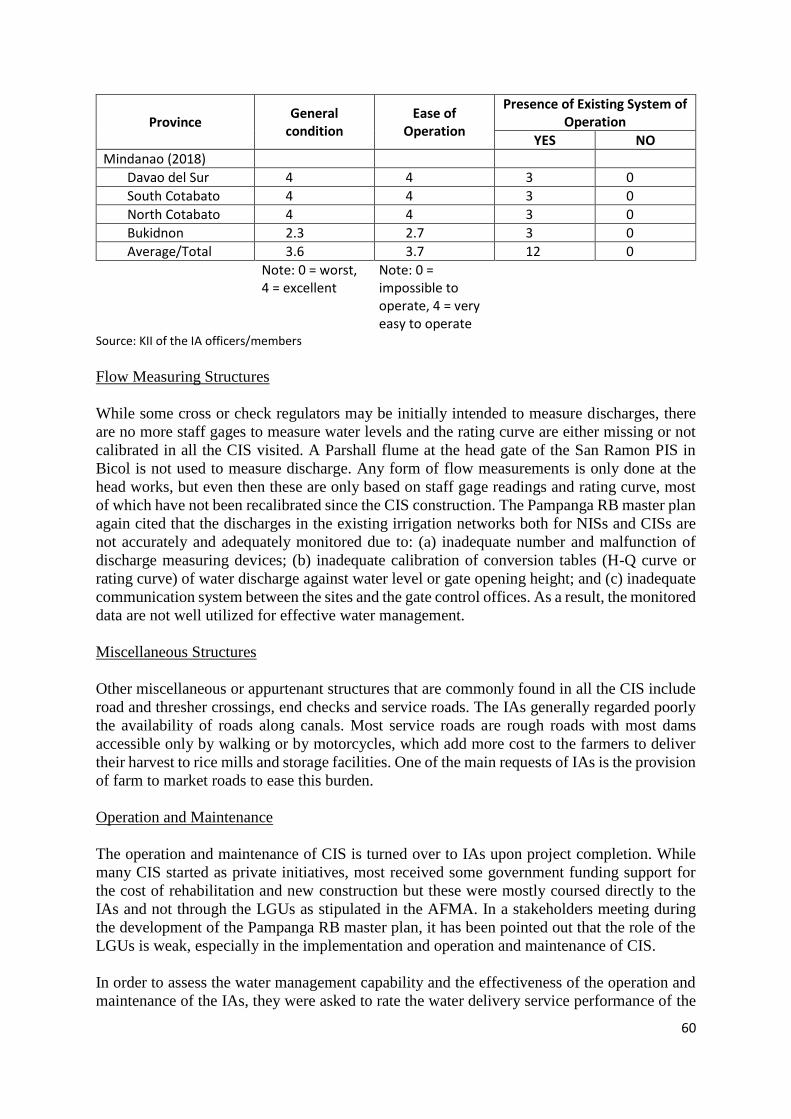
60
Province General
condition Ease of
Operation
Presence of Existing System of Operation
YES NO
Mindanao (2018)
Davao del Sur 4 4 3 0
South Cotabato 4 4 3 0
North Cotabato 4 4 3 0
Bukidnon 2.3 2.7 3 0
Average/Total 3.6 3.7 12 0
Note: 0 = worst, 4 = excellent
Note: 0 = impossible to operate, 4 = very easy to operate
Source: KII of the IA officers/members
Flow Measuring Structures
While some cross or check regulators may be initially intended to measure discharges, there
are no more staff gages to measure water levels and the rating curve are either missing or not
calibrated in all the CIS visited. A Parshall flume at the head gate of the San Ramon PIS in
Bicol is not used to measure discharge. Any form of flow measurements is only done at the
head works, but even then these are only based on staff gage readings and rating curve, most
of which have not been recalibrated since the CIS construction. The Pampanga RB master plan
again cited that the discharges in the existing irrigation networks both for NISs and CISs are
not accurately and adequately monitored due to: (a) inadequate number and malfunction of
discharge measuring devices; (b) inadequate calibration of conversion tables (H-Q curve or
rating curve) of water discharge against water level or gate opening height; and (c) inadequate
communication system between the sites and the gate control offices. As a result, the monitored
data are not well utilized for effective water management.
Miscellaneous Structures
Other miscellaneous or appurtenant structures that are commonly found in all the CIS include
road and thresher crossings, end checks and service roads. The IAs generally regarded poorly
the availability of roads along canals. Most service roads are rough roads with most dams
accessible only by walking or by motorcycles, which add more cost to the farmers to deliver
their harvest to rice mills and storage facilities. One of the main requests of IAs is the provision
of farm to market roads to ease this burden.
Operation and Maintenance
The operation and maintenance of CIS is turned over to IAs upon project completion. While
many CIS started as private initiatives, most received some government funding support for
the cost of rehabilitation and new construction but these were mostly coursed directly to the
IAs and not through the LGUs as stipulated in the AFMA. In a stakeholders meeting during
the development of the Pampanga RB master plan, it has been pointed out that the role of the
LGUs is weak, especially in the implementation and operation and maintenance of CIS.
In order to assess the water management capability and the effectiveness of the operation and
maintenance of the IAs, they were asked to rate the water delivery service performance of the
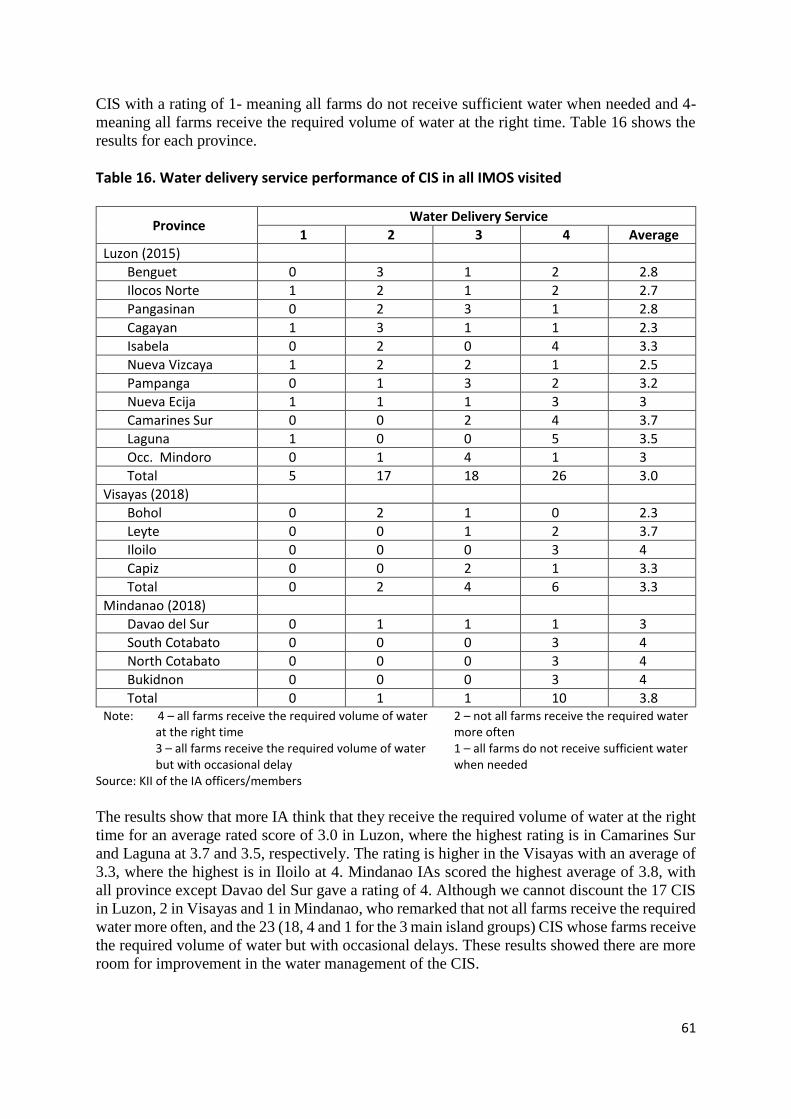
61
CIS with a rating of 1- meaning all farms do not receive sufficient water when needed and 4-
meaning all farms receive the required volume of water at the right time. Table 16 shows the
results for each province.
Table 16. Water delivery service performance of CIS in all IMOS visited
Province Water Delivery Service
1 2 3 4 Average
Luzon (2015)
Benguet 0 3 1 2 2.8
Ilocos Norte 1 2 1 2 2.7
Pangasinan 0 2 3 1 2.8
Cagayan 1 3 1 1 2.3
Isabela 0 2 0 4 3.3
Nueva Vizcaya 1 2 2 1 2.5
Pampanga 0 1 3 2 3.2
Nueva Ecija 1 1 1 3 3
Camarines Sur 0 0 2 4 3.7
Laguna 1 0 0 5 3.5
Occ. Mindoro 0 1 4 1 3
Total 5 17 18 26 3.0
Visayas (2018)
Bohol 0 2 1 0 2.3
Leyte 0 0 1 2 3.7
Iloilo 0 0 0 3 4
Capiz 0 0 2 1 3.3
Total 0 2 4 6 3.3
Mindanao (2018)
Davao del Sur 0 1 1 1 3
South Cotabato 0 0 0 3 4
North Cotabato 0 0 0 3 4
Bukidnon 0 0 0 3 4
Total 0 1 1 10 3.8 Note: 4 – all farms receive the required volume of water
at the right time 2 – not all farms receive the required water more often
3 – all farms receive the required volume of water but with occasional delay
1 – all farms do not receive sufficient water when needed
Source: KII of the IA officers/members
The results show that more IA think that they receive the required volume of water at the right
time for an average rated score of 3.0 in Luzon, where the highest rating is in Camarines Sur
and Laguna at 3.7 and 3.5, respectively. The rating is higher in the Visayas with an average of
3.3, where the highest is in Iloilo at 4. Mindanao IAs scored the highest average of 3.8, with
all province except Davao del Sur gave a rating of 4. Although we cannot discount the 17 CIS
in Luzon, 2 in Visayas and 1 in Mindanao, who remarked that not all farms receive the required
water more often, and the 23 (18, 4 and 1 for the 3 main island groups) CIS whose farms receive
the required volume of water but with occasional delays. These results showed there are more
room for improvement in the water management of the CIS.
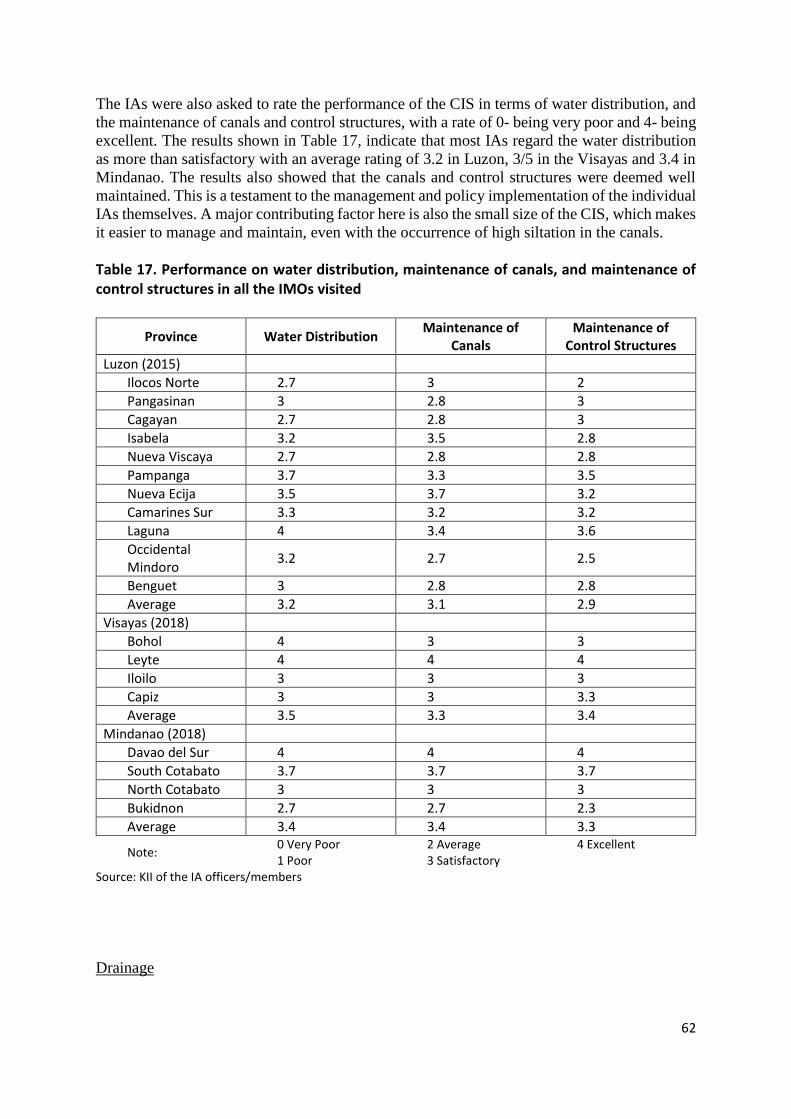
62
The IAs were also asked to rate the performance of the CIS in terms of water distribution, and
the maintenance of canals and control structures, with a rate of 0- being very poor and 4- being
excellent. The results shown in Table 17, indicate that most IAs regard the water distribution
as more than satisfactory with an average rating of 3.2 in Luzon, 3/5 in the Visayas and 3.4 in
Mindanao. The results also showed that the canals and control structures were deemed well
maintained. This is a testament to the management and policy implementation of the individual
IAs themselves. A major contributing factor here is also the small size of the CIS, which makes
it easier to manage and maintain, even with the occurrence of high siltation in the canals.
Table 17. Performance on water distribution, maintenance of canals, and maintenance of control structures in all the IMOs visited
Province Water Distribution Maintenance of
Canals Maintenance of
Control Structures
Luzon (2015)
Ilocos Norte 2.7 3 2
Pangasinan 3 2.8 3
Cagayan 2.7 2.8 3
Isabela 3.2 3.5 2.8
Nueva Viscaya 2.7 2.8 2.8
Pampanga 3.7 3.3 3.5
Nueva Ecija 3.5 3.7 3.2
Camarines Sur 3.3 3.2 3.2
Laguna 4 3.4 3.6
Occidental Mindoro
3.2 2.7 2.5
Benguet 3 2.8 2.8
Average 3.2 3.1 2.9
Visayas (2018)
Bohol 4 3 3
Leyte 4 4 4
Iloilo 3 3 3
Capiz 3 3 3.3
Average 3.5 3.3 3.4
Mindanao (2018)
Davao del Sur 4 4 4
South Cotabato 3.7 3.7 3.7
North Cotabato 3 3 3
Bukidnon 2.7 2.7 2.3
Average 3.4 3.4 3.3
Note: 0 Very Poor 1 Poor
2 Average 3 Satisfactory
4 Excellent
Source: KII of the IA officers/members
Drainage

63
There are no specific drainage canals at the CIS. Normally, the downstream farm ditches
receive the excess water from paddies, which is sometimes used to irrigate downstream areas.
In most systems, water distribution downstream is from paddy to paddy, without individual
farm ditch for each paddy. Again, the downstream canal serves as the drainage canal. These
are usually done to maximize areas devoted to planting. However, the absence of drainage
canals more often contributes to flooding or the longer time for flood recession.
Pumps
The main problem for CIS with pumps tapping water from rivers or creeks is that the pumping
units are quite old and need frequent repairs. There are usually no reserve pump sets if the main
unit breaks down, which causes delay in irrigation. The Sitio Ipil and Gulap PIS taps water
from the Pampanga River using large diameter (e.g. at least 10” – 16”) submersible or mixed
flow pumps, driven by 60-Hp electric motors or 80-90 Hp diesel engines. These engines are
very old and needs constant repairs, aside from the high fuel consumption and low efficiency.
There is also the problem of heavy siltation from the river which sometimes clogged the intake
pit and the pumps. The damaged submersible pump of the Particion PIS was replaced by a 6”
diameter centrifugal pump driven by a diesel engine loaned by NIA. The cost of operation
increased not because of the IA’s fault but due to faulty design and absence of safety
mechanism in the electrical wiring. Moreover, it was found that the awarded pump is only
second-hand where the contract stipulated brand new pump.
For STWs and LLPs, the commonly used pumps are 3”x 3” or 4”x 4” centrifugal pumps. They
are usually driven by 8-12 Hp water-cooled diesel engines, which are also used for threshers,
hand tractors and local transport (kuliglig). Depending on the water level and the capacity of
the shallow aquifer, each STW may be expected to irrigate from 3-5 ha of rice field depending
on soil type.
8. Results of Survey of Selected Communal Irrigators’ Associations This section present results of the survey of 66 sample IAs in 11 selected provinces in Luzon
in Cycle 1; and 12 sample IAs in both Visayas and Mindanao. Information includes profile of
the IAs, description of their CIS, performance in terms of yield and cropping intensity, and
functionality. Some highlights of IA interviews are in Annex 16.1A and B.
8.1. Size of Irrigators’ Associations and Tenure Status of Members
Table 18 shows the number of members and tenure status of all the IAs interviewed. The
average size of IA in Luzon is around 120 members, ranging from 62 (Benguet) to 206 (Ilocos
Norte). In terms of tenure status, 46% (Isabela) to 98% (Benguet) of the members are owner-
operators of the land they are tilling. Correspondingly, major portion of the service area of the
CIS are owned by the members. This is compliant to the CIS guideline that 60% of the potential
area should not be owned by only one landowner.
In Visayas, Capiz has the highest average number of members per IA with Iloilo, the lowest.
Majority of members are tenants or lessees. Only Bohol IAs provided data on percentage of
land by tenure status, i.e., 83% are owned by operators.

64
In Mindanao, Bukidnon has the lowest average number of members but all provinces have
majority of members as owner-operators. Only South Cotabato and Bukidnon IAs provided
data on land area by tenure status showing that a bigger portion is under owner-operator status.
Table 18. Number of members of IAs and tenure status of members in all provinces visited
Province Ave. no.
of members
% members by tenure status % land area by tenure Owner-
operator Tenant Lessee Others
Owner-operator
Tenant Lessee Others
Luzon (2015)
Pampanga 67.33 60.15 1.23 2.48 31.64 79.17 1.67 3.33 15.83
Nueva Ecija 105.33 64.76 50.48 - - 77.00 30.75 - -
Pangasinan 106 66.35 37.92 0.15 - 62.17 51.80 0.15 n/a
Ilocos Norte
206.67 55.74 48.06 - - 73.40 33.25 - -
Camarines Sur
199.50 49.50 12.00 42.50 5.83 54.20 18.33 20.80 11.67
Benguet 62.83 98.15 0.53 0.53 - 93.20 3.33 4.00 -
Nueva Vizcaya
151.83 53.64 49.66 17.88 - 53.67 35.00 20.75 -
Isabela 137.67 46.72 54.01 25.55 - 44.5 50.60 25.00 -
Cagayan 82.17 71.95 42.68 - - 68.33 47.5 - -
Laguna 64.17 46.87 68.75 3.64 15.36 25.40 72.60 3.67 7.00
Occidental Mindoro
143.17 73.43 46.15 - - 67.50 48.75 - -
Visayas (2018)
Bohol 238.33 50 53 - - 87 13.33 - -
Leyte 204.67 30 65 5 - - - - -
Iloilo 131 17 80 3.33 - - - - -
Capiz 340.67 32 36.67 31.67 - - - - -
Mindanao (2018)
Davao del Sur
162 86 3.33 11.11 - - - - -
North Cotabato
216.67 95 5 - - 89 10.7 - -
South Cotabato
260 73 26.67 - - - - - -
Bukidnon 85.67 77 17.33 5.56 - 68 7.5 10 - Note: There are multiple responses in some provinces since members are both owner-operators and tenants. Source FGD with IA officials/members
8.2. Firmed-up Service Area and Type of Technology
Table 19 shows the frequency distribution of all the sample CIS by FUSA and type of
technology. Around 51% of the 66 sample CIS in Luzon have FUSA over 100 ha on average.
Majority (83%) of the sample CIS are of the gravity-type (run-off the river) system, particularly
for large systems. CIS using pumps are in Pampanga, Camarines Sur, Nueva Ecija, Pangasinan,
Isabela, and Laguna. Average area served by pump CIS (170ha) is higher than that served by
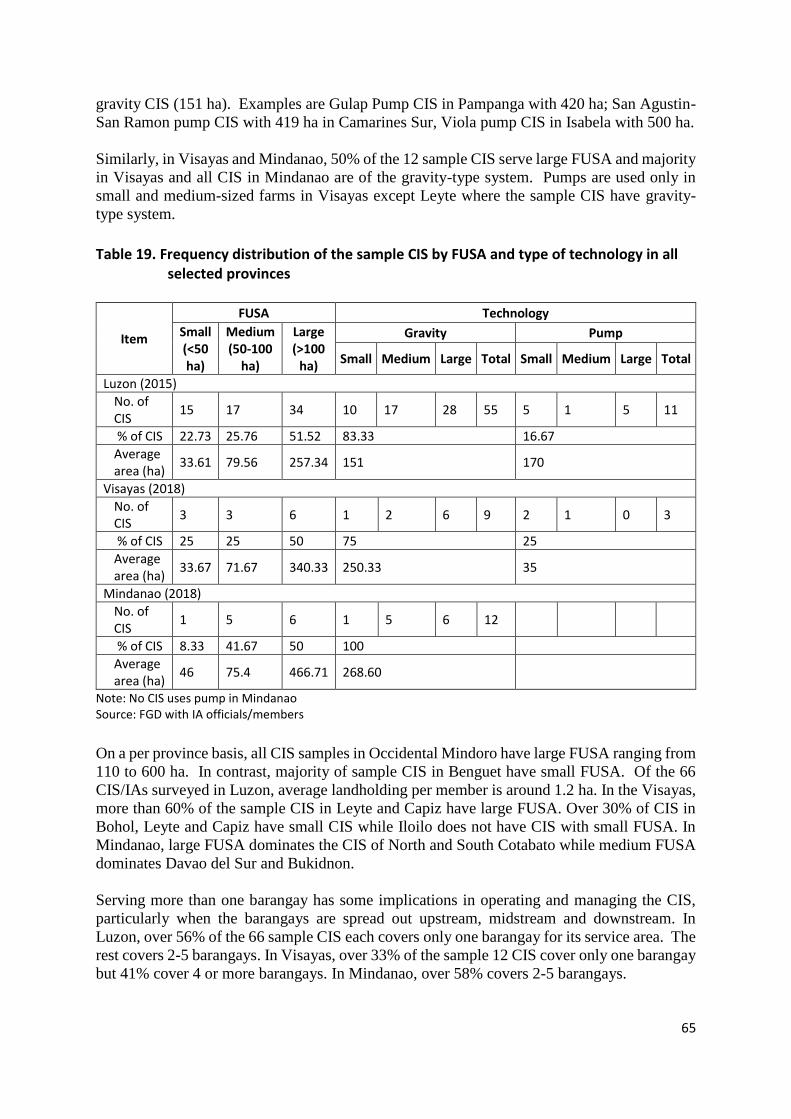
65
gravity CIS (151 ha). Examples are Gulap Pump CIS in Pampanga with 420 ha; San Agustin-
San Ramon pump CIS with 419 ha in Camarines Sur, Viola pump CIS in Isabela with 500 ha.
Similarly, in Visayas and Mindanao, 50% of the 12 sample CIS serve large FUSA and majority
in Visayas and all CIS in Mindanao are of the gravity-type system. Pumps are used only in
small and medium-sized farms in Visayas except Leyte where the sample CIS have gravity-
type system.
Table 19. Frequency distribution of the sample CIS by FUSA and type of technology in all
selected provinces
Item
FUSA Technology
Small (<50 ha)
Medium (50-100
ha)
Large (>100
ha)
Gravity Pump
Small Medium Large Total Small Medium Large Total
Luzon (2015)
No. of CIS
15 17 34 10 17 28 55 5 1 5 11
% of CIS 22.73 25.76 51.52 83.33 16.67
Average area (ha)
33.61 79.56 257.34 151 170
Visayas (2018)
No. of CIS
3 3 6 1 2 6 9 2 1 0 3
% of CIS 25 25 50 75 25
Average area (ha)
33.67 71.67 340.33 250.33 35
Mindanao (2018)
No. of CIS
1 5 6 1 5 6 12
% of CIS 8.33 41.67 50 100
Average area (ha)
46 75.4 466.71 268.60
Note: No CIS uses pump in Mindanao Source: FGD with IA officials/members
On a per province basis, all CIS samples in Occidental Mindoro have large FUSA ranging from
110 to 600 ha. In contrast, majority of sample CIS in Benguet have small FUSA. Of the 66
CIS/IAs surveyed in Luzon, average landholding per member is around 1.2 ha. In the Visayas,
more than 60% of the sample CIS in Leyte and Capiz have large FUSA. Over 30% of CIS in
Bohol, Leyte and Capiz have small CIS while Iloilo does not have CIS with small FUSA. In
Mindanao, large FUSA dominates the CIS of North and South Cotabato while medium FUSA
dominates Davao del Sur and Bukidnon.
Serving more than one barangay has some implications in operating and managing the CIS,
particularly when the barangays are spread out upstream, midstream and downstream. In
Luzon, over 56% of the 66 sample CIS each covers only one barangay for its service area. The
rest covers 2-5 barangays. In Visayas, over 33% of the sample 12 CIS cover only one barangay
but 41% cover 4 or more barangays. In Mindanao, over 58% covers 2-5 barangays.
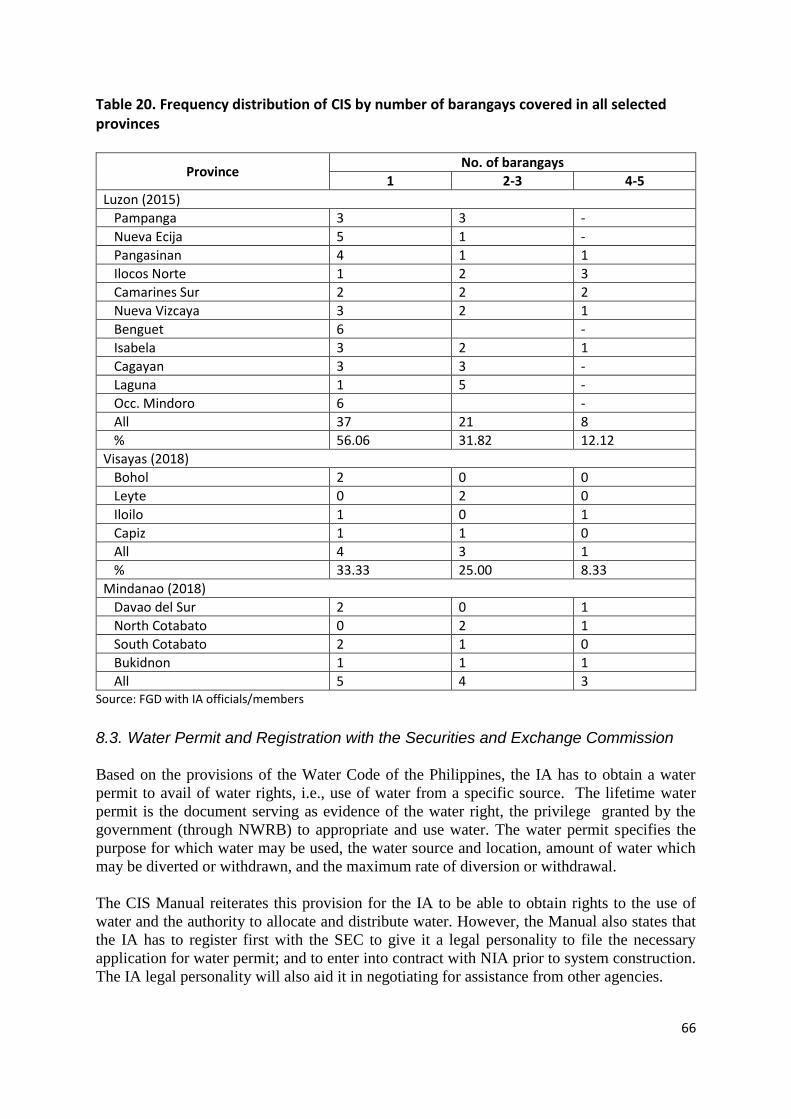
66
Table 20. Frequency distribution of CIS by number of barangays covered in all selected provinces
Province No. of barangays
1 2-3 4-5
Luzon (2015)
Pampanga 3 3 -
Nueva Ecija 5 1 -
Pangasinan 4 1 1
Ilocos Norte 1 2 3
Camarines Sur 2 2 2
Nueva Vizcaya 3 2 1
Benguet 6 -
Isabela 3 2 1
Cagayan 3 3 -
Laguna 1 5 -
Occ. Mindoro 6 -
All 37 21 8
% 56.06 31.82 12.12
Visayas (2018)
Bohol 2 0 0
Leyte 0 2 0
Iloilo 1 0 1
Capiz 1 1 0
All 4 3 1
% 33.33 25.00 8.33
Mindanao (2018)
Davao del Sur 2 0 1
North Cotabato 0 2 1
South Cotabato 2 1 0
Bukidnon 1 1 1
All 5 4 3 Source: FGD with IA officials/members
8.3. Water Permit and Registration with the Securities and Exchange Commission Based on the provisions of the Water Code of the Philippines, the IA has to obtain a water
permit to avail of water rights, i.e., use of water from a specific source. The lifetime water
permit is the document serving as evidence of the water right, the privilege granted by the
government (through NWRB) to appropriate and use water. The water permit specifies the
purpose for which water may be used, the water source and location, amount of water which
may be diverted or withdrawn, and the maximum rate of diversion or withdrawal.
The CIS Manual reiterates this provision for the IA to be able to obtain rights to the use of
water and the authority to allocate and distribute water. However, the Manual also states that
the IA has to register first with the SEC to give it a legal personality to file the necessary
application for water permit; and to enter into contract with NIA prior to system construction.
The IA legal personality will also aid it in negotiating for assistance from other agencies.
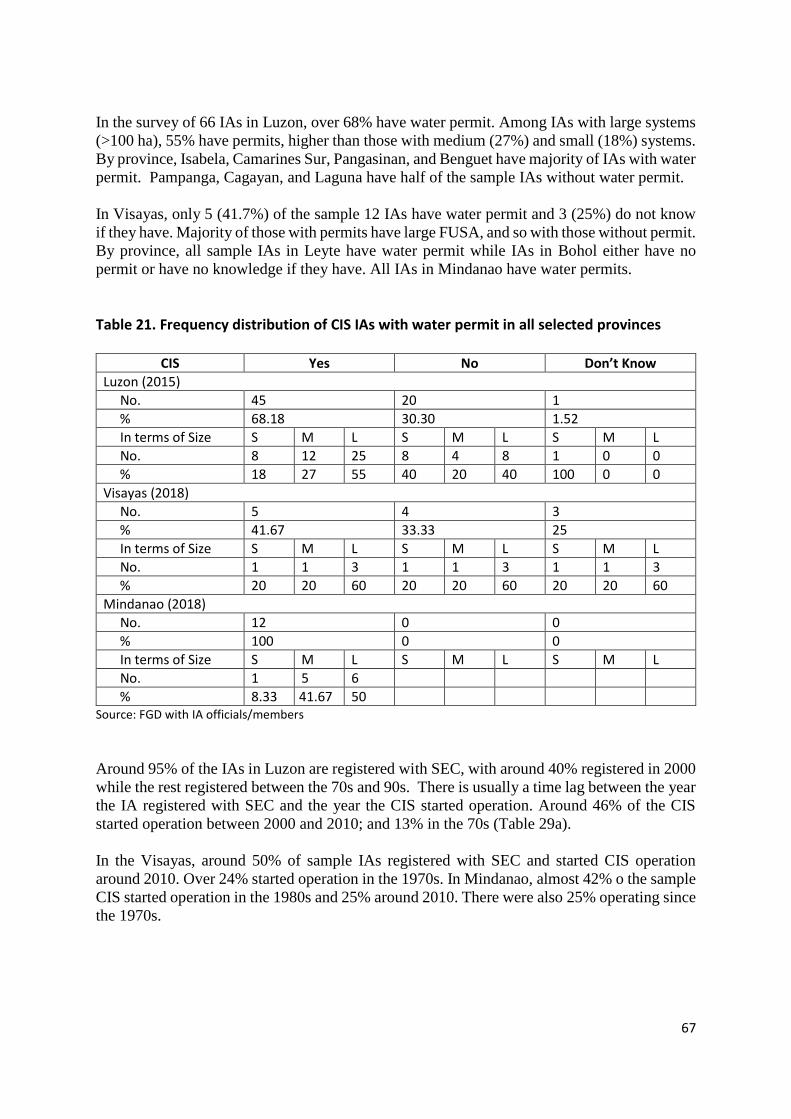
67
In the survey of 66 IAs in Luzon, over 68% have water permit. Among IAs with large systems
(>100 ha), 55% have permits, higher than those with medium (27%) and small (18%) systems.
By province, Isabela, Camarines Sur, Pangasinan, and Benguet have majority of IAs with water
permit. Pampanga, Cagayan, and Laguna have half of the sample IAs without water permit.
In Visayas, only 5 (41.7%) of the sample 12 IAs have water permit and 3 (25%) do not know
if they have. Majority of those with permits have large FUSA, and so with those without permit.
By province, all sample IAs in Leyte have water permit while IAs in Bohol either have no
permit or have no knowledge if they have. All IAs in Mindanao have water permits.
Table 21. Frequency distribution of CIS IAs with water permit in all selected provinces
CIS Yes No Don’t Know
Luzon (2015)
No. 45 20 1
% 68.18 30.30 1.52
In terms of Size S M L S M L S M L
No. 8 12 25 8 4 8 1 0 0
% 18 27 55 40 20 40 100 0 0
Visayas (2018)
No. 5 4 3
% 41.67 33.33 25
In terms of Size S M L S M L S M L
No. 1 1 3 1 1 3 1 1 3
% 20 20 60 20 20 60 20 20 60
Mindanao (2018)
No. 12 0 0
% 100 0 0
In terms of Size S M L S M L S M L
No. 1 5 6
% 8.33 41.67 50 Source: FGD with IA officials/members
Around 95% of the IAs in Luzon are registered with SEC, with around 40% registered in 2000
while the rest registered between the 70s and 90s. There is usually a time lag between the year
the IA registered with SEC and the year the CIS started operation. Around 46% of the CIS
started operation between 2000 and 2010; and 13% in the 70s (Table 29a).
In the Visayas, around 50% of sample IAs registered with SEC and started CIS operation
around 2010. Over 24% started operation in the 1970s. In Mindanao, almost 42% o the sample
CIS started operation in the 1980s and 25% around 2010. There were also 25% operating since
the 1970s.

68
Table 22. Frequency distribution of IAs in all selected provinces that registered with the Securities and Exchange Commission (SEC) and the start of operation of the CIS
Item
Year registered with SEC
Others* Before 1970
1970s 1980s 1990s 2000 2010 Total IAs
registered with SEC
Luzon (2015)
No. of IAs 3 9 14 10 27 63 3
% 4.55 13.64 21.21 15.15 40.91 95.46 4.54
CIS Started Operation
No. of IAs 3 6 13 15 16 16
% 4.55 9.09 19.69 22.72 24.24 24.24
Visayas (2018)
No. of IAs 0 0 1 1 1 7 10 2
% 0 0 8.33 8.33 8.33 58.33 83.33 16.67
CIS Started Operation
No. of IAs 1 2 2 0 1 6
% 8.33 16.67 16.67 0 8.33 50
Mindanao (2018)
No. of IAs 1 1 4 2 1 3 12
% 8.33 8.33 33.33 16.67 8.33 25 100
CIS Started Operation
No. of IAs 0 3 5 1 0 3
% 0 25 41.67 8.33 0 25 *Don’t know, Not registered Source: FGD with IA officials/members
8.4. Cropping Season In Luzon, IAs usually adopt two cropping seasons, referred to as wet and dry season. Wet
season starts in May to June while dry season starts in October to December. Some IAs do third
cropping between March and June. While rice is the main or sole crop planted in the wet season,
some IAs plant other crops such as corn, peanut, mung bean during the dry season thus reducing
the area planted to rice. In Benguet, vegetable production is whole year round (Table 23a).
In the Visayas, rice is also the dominant crop for both cropping seasons. Other crops planted
such as onion, watermelon and corn were only in Iloilo from October to January (Table 23b).
In Mindanao, also with rice as the dominant crop, only South Cotabato plant other crops such
as corn, banana and papaya (Table 23c).
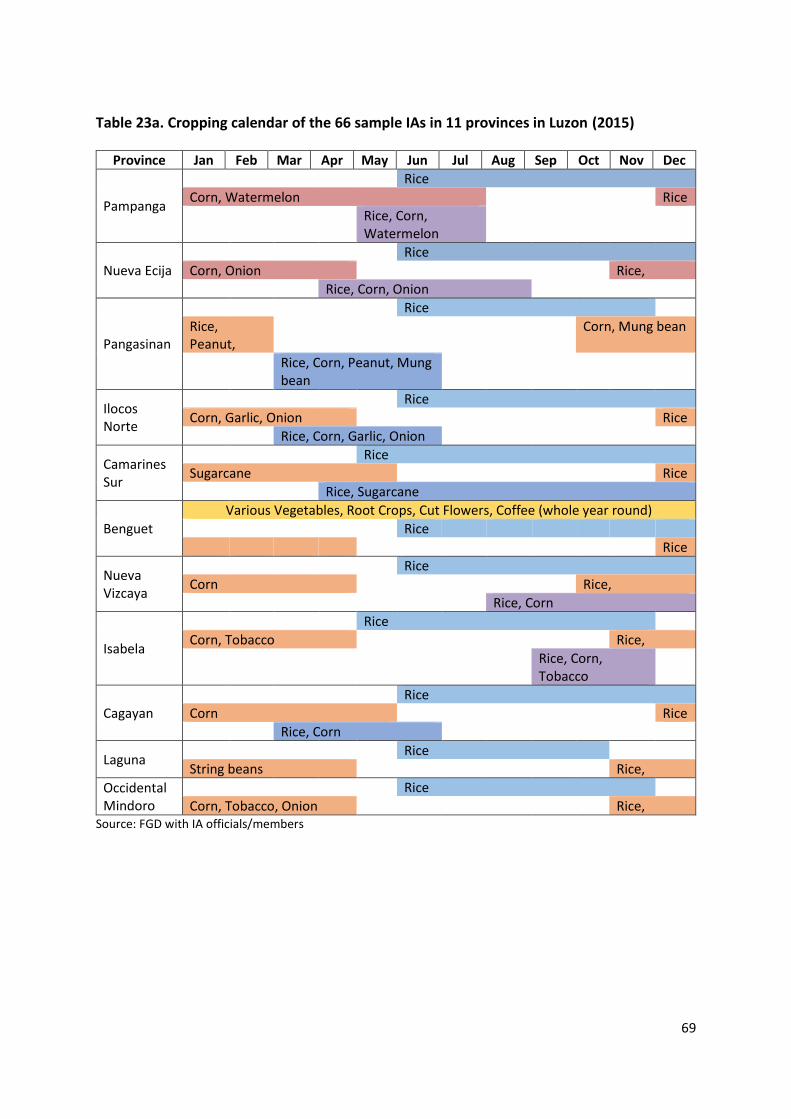
69
Table 23a. Cropping calendar of the 66 sample IAs in 11 provinces in Luzon (2015)
Province Jan Feb Mar Apr May Jun Jul Aug Sep Oct Nov Dec
Pampanga
Rice
Corn, Watermelon Rice
Rice, Corn, Watermelon
Nueva Ecija
Rice
Corn, Onion Rice,
Rice, Corn, Onion
Pangasinan
Rice
Rice, Peanut,
Corn, Mung bean
Rice, Corn, Peanut, Mung bean
Ilocos Norte
Rice
Corn, Garlic, Onion Rice
Rice, Corn, Garlic, Onion
Camarines Sur
Rice
Sugarcane Rice
Rice, Sugarcane
Benguet
Various Vegetables, Root Crops, Cut Flowers, Coffee (whole year round)
Rice
Rice
Nueva Vizcaya
Rice
Corn Rice,
Rice, Corn
Isabela
Rice
Corn, Tobacco Rice,
Rice, Corn, Tobacco
Cagayan
Rice
Corn Rice
Rice, Corn
Laguna Rice
String beans Rice,
Occidental Mindoro
Rice
Corn, Tobacco, Onion Rice, Source: FGD with IA officials/members
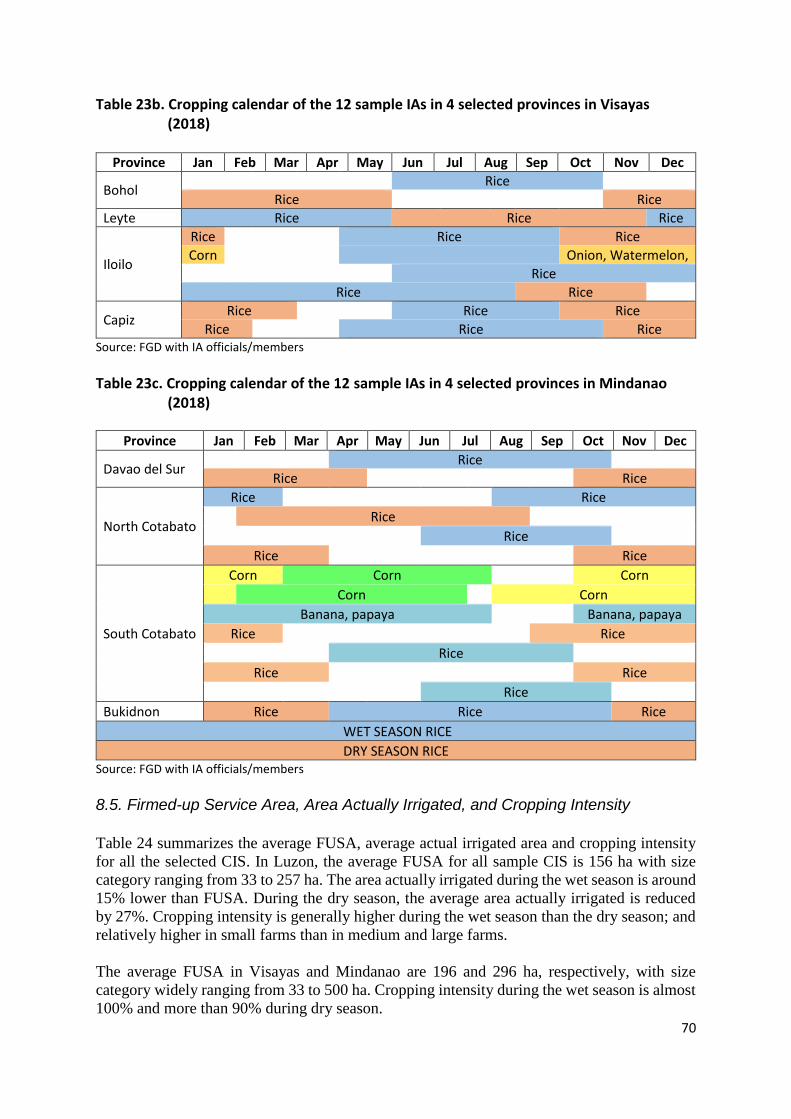
70
Table 23b. Cropping calendar of the 12 sample IAs in 4 selected provinces in Visayas (2018)
Province Jan Feb Mar Apr May Jun Jul Aug Sep Oct Nov Dec
Bohol Rice
Rice Rice
Leyte Rice Rice Rice
Iloilo
Rice Rice Rice
Corn Onion, Watermelon, Rice
Rice Rice
Capiz Rice Rice Rice
Rice Rice Rice Source: FGD with IA officials/members
Table 23c. Cropping calendar of the 12 sample IAs in 4 selected provinces in Mindanao (2018)
Province Jan Feb Mar Apr May Jun Jul Aug Sep Oct Nov Dec
Davao del Sur Rice
Rice Rice
North Cotabato
Rice Rice Rice
Rice
Rice Rice
South Cotabato
Corn Corn Corn Corn Corn
Banana, papaya Banana, papaya
Rice Rice Rice
Rice Rice Rice
Bukidnon Rice Rice Rice
WET SEASON RICE
DRY SEASON RICE Source: FGD with IA officials/members
8.5. Firmed-up Service Area, Area Actually Irrigated, and Cropping Intensity
Table 24 summarizes the average FUSA, average actual irrigated area and cropping intensity
for all the selected CIS. In Luzon, the average FUSA for all sample CIS is 156 ha with size
category ranging from 33 to 257 ha. The area actually irrigated during the wet season is around
15% lower than FUSA. During the dry season, the average area actually irrigated is reduced
by 27%. Cropping intensity is generally higher during the wet season than the dry season; and
relatively higher in small farms than in medium and large farms.
The average FUSA in Visayas and Mindanao are 196 and 296 ha, respectively, with size
category widely ranging from 33 to 500 ha. Cropping intensity during the wet season is almost
100% and more than 90% during dry season.
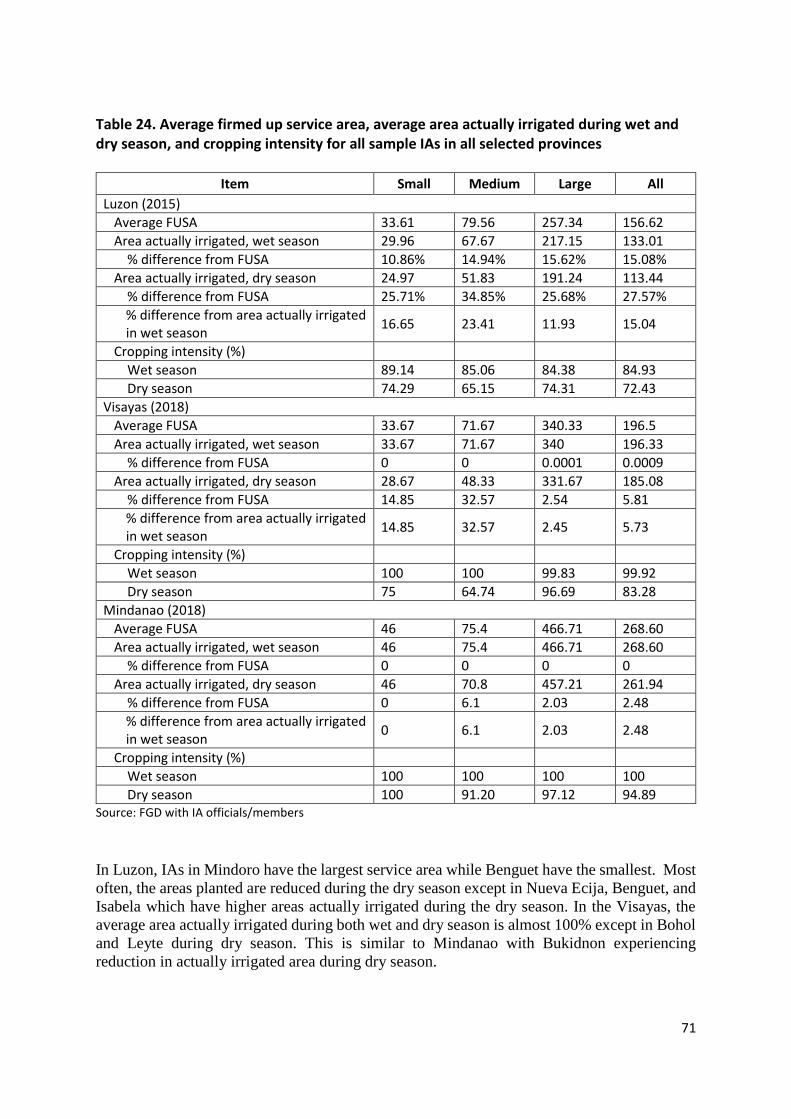
71
Table 24. Average firmed up service area, average area actually irrigated during wet and dry season, and cropping intensity for all sample IAs in all selected provinces
Item Small Medium Large All
Luzon (2015)
Average FUSA 33.61 79.56 257.34 156.62
Area actually irrigated, wet season 29.96 67.67 217.15 133.01
% difference from FUSA 10.86% 14.94% 15.62% 15.08%
Area actually irrigated, dry season 24.97 51.83 191.24 113.44
% difference from FUSA 25.71% 34.85% 25.68% 27.57%
% difference from area actually irrigated in wet season
16.65 23.41 11.93 15.04
Cropping intensity (%)
Wet season 89.14 85.06 84.38 84.93
Dry season 74.29 65.15 74.31 72.43
Visayas (2018)
Average FUSA 33.67 71.67 340.33 196.5
Area actually irrigated, wet season 33.67 71.67 340 196.33
% difference from FUSA 0 0 0.0001 0.0009
Area actually irrigated, dry season 28.67 48.33 331.67 185.08
% difference from FUSA 14.85 32.57 2.54 5.81
% difference from area actually irrigated in wet season
14.85 32.57 2.45 5.73
Cropping intensity (%)
Wet season 100 100 99.83 99.92
Dry season 75 64.74 96.69 83.28
Mindanao (2018)
Average FUSA 46 75.4 466.71 268.60
Area actually irrigated, wet season 46 75.4 466.71 268.60
% difference from FUSA 0 0 0 0
Area actually irrigated, dry season 46 70.8 457.21 261.94
% difference from FUSA 0 6.1 2.03 2.48
% difference from area actually irrigated in wet season
0 6.1 2.03 2.48
Cropping intensity (%)
Wet season 100 100 100 100
Dry season 100 91.20 97.12 94.89 Source: FGD with IA officials/members
In Luzon, IAs in Mindoro have the largest service area while Benguet have the smallest. Most
often, the areas planted are reduced during the dry season except in Nueva Ecija, Benguet, and
Isabela which have higher areas actually irrigated during the dry season. In the Visayas, the
average area actually irrigated during both wet and dry season is almost 100% except in Bohol
and Leyte during dry season. This is similar to Mindanao with Bukidnon experiencing
reduction in actually irrigated area during dry season.

72
Relative to FUSA, the cropping intensity of the sample IAs in the 11 provinces in Luzon ranged
from 108% (Isabela) to 190% (Occidental Mindoro). The average is 157%, higher than the
2014 national average of 129%. The average cropping intensity in the Visayas is a very high
183% with almost 200% for Leyte and Capiz. In Mindanao, the average cropping intensity is
an even higher 195% owing to almost 200% in Davao del Sur, North and South Cotabato. The
national average cropping intensity is around 140% (NIA Annual Report 2017).
Based on size of FUSA, there are more small irrigation systems (94%) in Luzon with cropping
intensity equal to or higher than 130% compared to medium and large systems. In contrast,
only one small CIS have cropping intensity lower than 130% in the Visayas and Mindanao.
Table 25. Average cropping intensity by size of firmed up service area of all sample IAs in the selected provinces
Item Small Medium Large All
No. % No. % No. % No. %
Luzon (2015)
Average cropping intensity (%)
177 155 157 157
No. of IAs w/ CI below 130%
1 5.88 2 12.5 5 15.15 8 12.12
No. of IAs w/CI equal to/above 130%
16 94.12 14 87.5 28 84.85 58 87.88
Total 17 16 33 66
Visayas (2018)
Average cropping intensity (%)
175 164.74 196.52 183.19
No. of IAs w/ CI below 130%
1 33.33 0 0 0 0 1 8.33
No. of IAs w/CI equal to/above 130%
2 66.67 3 100 6 100 11 91.67
Total 17 3 6 12
Mindanao (2018)
Average cropping intensity (%)
200 191.2 197.12 194.89
No. of IAs w/ CI below 130%
0 0 0 0 0 0 0 0
No. of IAs w/ CI equal to/above 130%
1 100 5 100 6 100 12 100
Total 1 5 6 12 Source: FGD with IA officials/members
8.6. Palay Yield
In Luzon, during wet season, majority (56%) of the IAs got a yield of 65-99 cavans/ha and
54% got more than 100 cavans/ha during the dry season. Nueva Ecija and Nueva Vizcaya have
majority of IAs getting more than 100 cavans during the wet season. On average, dry season
yield is higher than wet season yield by only nine cavans (Table 26). By province, Nueva Ecija
and Ilocos Norte have higher average yield during the wet season.

73
Table 26. Frequency distribution of the sample CIS by rice yield in all selected provinces
Province Wet season (cavans/ha) Dry season (cavans/ha)
≤40 41-64
65-99
100≥ Ave. ≤40 41-64
65-99
100≥ Ave.
Luzon (2015)
Pampanga 1 1 2 2 78.33 0 0 2 3 96.00
Nueva Ecija 0 0 2 4 103.33 0 0 2 1 95.00
Pangasinan 0 0 4 2 97.08 0 1 3 1 90.00
Ilocos Norte 0 0 3 3 116.25 0 1 2 2 115.5
Camarines Sur 0 0 5 1 83.75 0 0 5 1 91.25
Benguet: Rice Vegetables (kg/ha)
0 1 0 1 75.00 0 1 0 1 92.5
75,192.8
Nueva Vizcaya 0 0 2 4 89.33 0 0 2 4 97.17
Isabela 0 0 3 3 100.83 0 0 2 3 121.25
Cagayan 0 0 6 0 81.67 0 0 3 3 95.00
Laguna 0 0 5 1 75.83 0 0 1 5 99.17
Occidental Mindoro
0 0 3 3 102.50 0 0 0 6 112.83
No. of IAs 1 2 35 24 91.26
0 3 22 30 100.51
% 1.61 3.23 56.45 38.71 0.00 5.45 40.00 54.55
Visayas (2018)
Bohol 1 1 0 1 60 2 0 1 0 45
Leyte 0 0 0 3 150 0 0 1 2 124.33
Iloilo 0 0 2 1 91.67 0 0 3 0 76.67
Capiz 0 0 2 1 95 0 0 3 0 85
No. of IAs 1 1 4 6 99.17
2 0 8 2 82.75
% 8.33 8.33 33.33 50 16.67 0 66.67 16.67
Mindanao (2018)
Davao del Sur 1 0 0 2 102 0 1 1 1 89
North Cotabato
0 1 2 0 70.67 0 2 1 0 61.67
South Cotabato: Rice
0 0 2 0 85 0 0 2 0 81.25
HVC 1 3900 1 3700
Corn 1 1000 1 1000
Papaya (kg/wk) 1 1800 1 1800
Bukidnon 0 0 2 1 98.33 0 0 2 1 85
No. of IAs 1 1 6 3 89.36
0 3 6 2 79.05
% 9.10 9.10 54.55 27.27 0 27.27 54.55 18.18 Source: FGD with IA officials/members
Based on FUSA size of Luzon CIS samples, large CIS have higher average dry season yield
(105 cav/ha) than small and medium CIS (90 cav/ha). However, small CIS generates
consistently high yield at an average of 102 cav/ha in both wet and dry seasons (Table 27).
This indicates that small systems could adapt more easily with the cropping season than large
systems.

74
In the Visayas, CIS with large FUSA have the highest yield, but CIS with small FUSA have
higher yield than medium FUSA. Similarly, in Mindanao, majority of large FUSA have higher
yield particularly during wet season. Yield is relatively higher in Leyte and lowest in Bohol. In
Mindanao, yield is lowest in North Cotabato.
Table 27. Frequency distribution of the rice yields during wet and dry seasons according to firmed-up service area of the sample CIS in all selected provinces
FUSA Size
Wet season (cav/ha) Dry season (cav/ha)
No. of CIS Ave yield
No. of CIS Ave yield ≤40
41-64
65-99
100≥ ≤40 41-64
65-99
100≥
Luzon (2015)
Small 0 0 6 8 102.32 0 2 4 4 102.50
Medium 0 0 12 4 88.20 0 0 11 5 90.31
Large 1 2 17 12 87.95 0 1 7 21 105.45
No. of IAs
1 2 35 24 91.26
0 3 22 30 100.51
% 1.61 3.23 56.45 38.71 0.00 5.45 40.00 54.55
Visayas (2018)
Small 1 0 1 1 95 1 0 1 1 80
Medium 0 1 1 1 85 1 0 2 0 63.33
Large 0 0 2 4 108.33 0 0 5 1 93.83
No. of IAs
1 1 4 6 99.17
2 0 8 2 82.75
% 8.33 8.33 33.33 50 16.67 0 66.67 16.67
Mindanao (2018)
Small 0 1 0 0 60 0 1 0 0 50
Medium 0 0 2 2 95 0 1 2 1 77
Large 0 1 4 1 90.5 0 1 4 1 85.25
No. of IAs
0 2 6 3 89.36
0 3 6 2 79.05
% 0 18.18 54.55 27.27 0 27.27 54.55 18.18 Source: FGD with IA officials/members
8.7. Cost Payment Schemes
Despite the AFMA provision that CIS are to be devolved to LGUs, majority of IAs are
operating/managing their respective CIS. When the survey of IAs was conducted in Luzon,
FISA was not yet implemented. Majority of IAs have entered into the amortization scheme
except the IAs in Benguet and Ilocos Norte where most entered into the 30% equity scheme
(Table 28). Politicians and LGUs have reportedly supported the IAs by providing financial
assistance, e.g., raising equity for the CIS project. LGUs also have been involved in irrigation
development programs by providing financial support to IAs. One IA in Cagayan and
Occidental Mindoro got their CIS for free. In Visayas and Mindanao, around 83% of IAs were
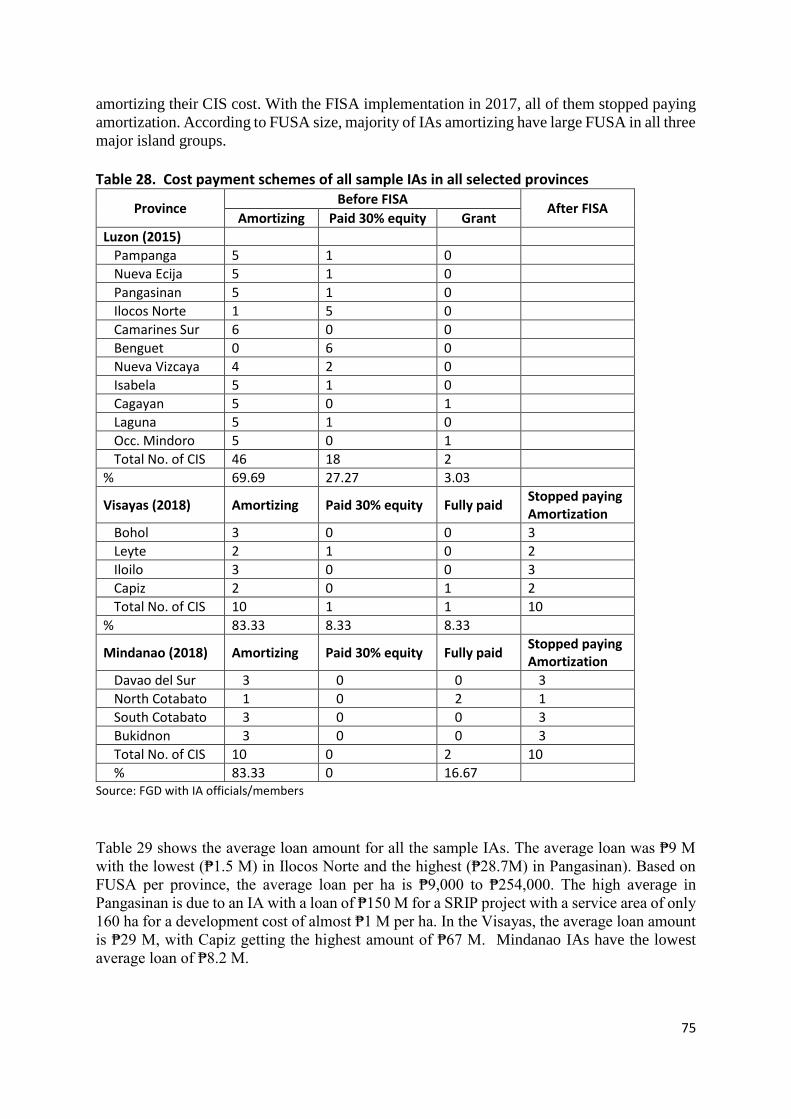
75
amortizing their CIS cost. With the FISA implementation in 2017, all of them stopped paying
amortization. According to FUSA size, majority of IAs amortizing have large FUSA in all three
major island groups.
Table 28. Cost payment schemes of all sample IAs in all selected provinces
Source: FGD with IA officials/members
Table 29 shows the average loan amount for all the sample IAs. The average loan was ₱9 M
with the lowest (₱1.5 M) in Ilocos Norte and the highest (₱28.7M) in Pangasinan). Based on
FUSA per province, the average loan per ha is ₱9,000 to ₱254,000. The high average in
Pangasinan is due to an IA with a loan of ₱150 M for a SRIP project with a service area of only
160 ha for a development cost of almost ₱1 M per ha. In the Visayas, the average loan amount
is ₱29 M, with Capiz getting the highest amount of ₱67 M. Mindanao IAs have the lowest
average loan of ₱8.2 M.
Province Before FISA
After FISA Amortizing Paid 30% equity Grant
Luzon (2015)
Pampanga 5 1 0
Nueva Ecija 5 1 0
Pangasinan 5 1 0
Ilocos Norte 1 5 0
Camarines Sur 6 0 0
Benguet 0 6 0
Nueva Vizcaya 4 2 0
Isabela 5 1 0
Cagayan 5 0 1
Laguna 5 1 0
Occ. Mindoro 5 0 1
Total No. of CIS 46 18 2
% 69.69 27.27 3.03
Visayas (2018) Amortizing Paid 30% equity Fully paid Stopped paying Amortization
Bohol 3 0 0 3
Leyte 2 1 0 2
Iloilo 3 0 0 3
Capiz 2 0 1 2
Total No. of CIS 10 1 1 10
% 83.33 8.33 8.33
Mindanao (2018) Amortizing Paid 30% equity Fully paid Stopped paying Amortization
Davao del Sur 3 0 0 3
North Cotabato 1 0 2 1
South Cotabato 3 0 0 3
Bukidnon 3 0 0 3
Total No. of CIS 10 0 2 10
% 83.33 0 16.67

76
Table 29. Average amount of loan for all sample IAs in all selected provinces
Province Amount of Loan (₱) FUSA Loan (₱)/ha
Luzon (2015)
Pampanga 1,625,000 149.00 10,906
Nueva Ecija 7,391,426 160.33 46,101
Pangasinan 28,735,086 113.00 254,293
Ilocos Norte 1,500,000 156.17 9,605
Camarines Sur 14,458,647 200.00 72,293
Nueva Vizcaya 4,170,238 198.00 21,062
Benguet - 67.00 -
Isabela 6,380,666 178.00 35,846
Cagayan 13,253,757 97.00 136,637
Laguna 3,466,519 105.00 33,014
Occ. Mindoro 10,066,666 300.00 33,556
All 9,104,800 156.68 58,111
Visayas (2018)
Bohol 7,182,933 136.67 81,993
Leyte 43,005,271 293.67 85,876
Iloilo 4,156,674 104 54,912
Capiz 67,743,670 251.67 123,737
All 29,387,307 196.5 86,698
Mindanao (2018)
Davao del Sur 5,265,340 182 65,811
North Cotabato 11,548,795 239.67 75,466
South Cotabato 14,888,219 508.75 46,222
Bukidnon 2,369,823 144 15,200
All 8,242,522 268.6 48,421 Source: Secondary data from respective IMOs
On average, IAs with small CIS expectedly have lower amount of loans than IAs with larger
systems. However, on per hectare basis, they have the highest loan while those with large
systems have the lowest (Table 30). The amount of loans in the provinces indicates the
financial obligation that IAs will be relieved of due to the provision of FISA.
Table 30. Average amounts of loan by FUSA size of sample IAs in the selected provinces
FUSA Size Amount of Loan (₱) Ave FUSA Loan (₱)/ha
Luzon (2015)
Small 3,636,635 33.61 108,201
Medium 5,275,752 79.56 66,312
Large 7,290,702 257.34 28,331
All 9,104,800 156.68 58,111
Visayas (2018)
Small 1,833,696.64 33.67 82,904.50
Medium 4,391,499.38 71.67 65,899.76
Large 51,069,748.35 340.33 98,362.82
All 29,387,307.41 196.5 86,698.65
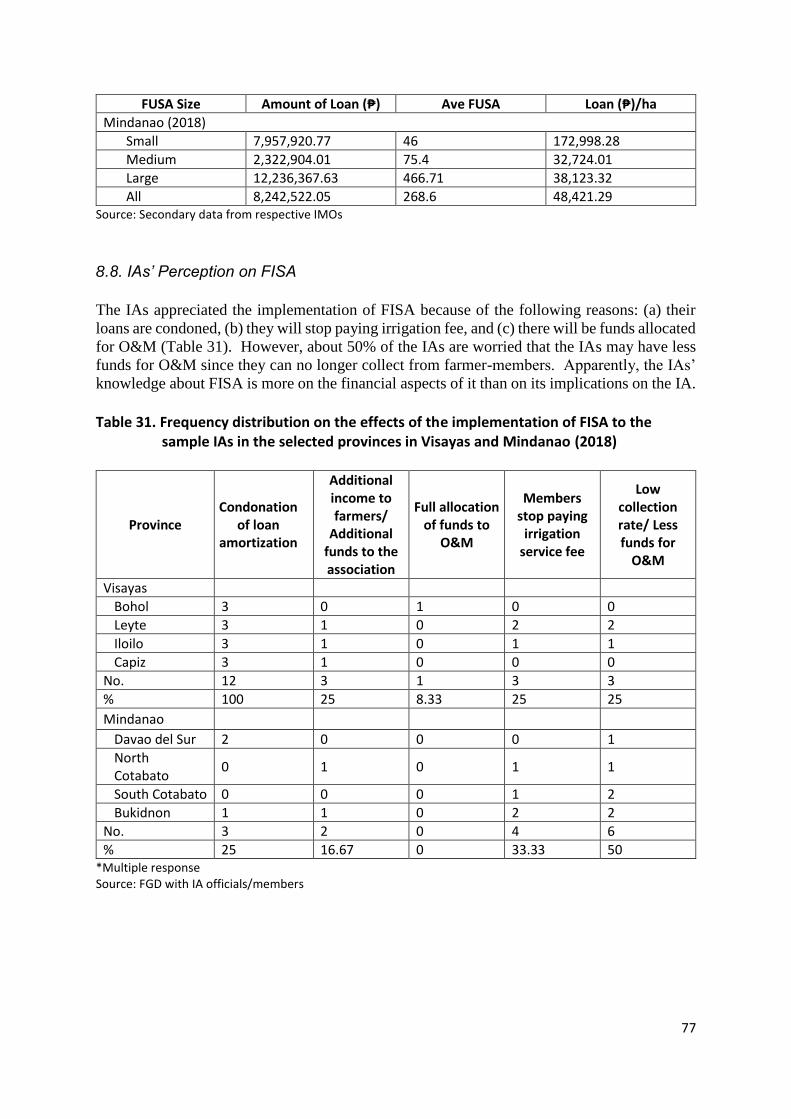
77
FUSA Size Amount of Loan (₱) Ave FUSA Loan (₱)/ha
Mindanao (2018)
Small 7,957,920.77 46 172,998.28
Medium 2,322,904.01 75.4 32,724.01
Large 12,236,367.63 466.71 38,123.32
All 8,242,522.05 268.6 48,421.29 Source: Secondary data from respective IMOs
8.8. IAs’ Perception on FISA
The IAs appreciated the implementation of FISA because of the following reasons: (a) their
loans are condoned, (b) they will stop paying irrigation fee, and (c) there will be funds allocated
for O&M (Table 31). However, about 50% of the IAs are worried that the IAs may have less
funds for O&M since they can no longer collect from farmer-members. Apparently, the IAs’
knowledge about FISA is more on the financial aspects of it than on its implications on the IA.
Table 31. Frequency distribution on the effects of the implementation of FISA to the sample IAs in the selected provinces in Visayas and Mindanao (2018)
Province Condonation
of loan amortization
Additional income to farmers/
Additional funds to the association
Full allocation of funds to
O&M
Members stop paying
irrigation service fee
Low collection rate/ Less funds for
O&M
Visayas
Bohol 3 0 1 0 0
Leyte 3 1 0 2 2
Iloilo 3 1 0 1 1
Capiz 3 1 0 0 0
No. 12 3 1 3 3
% 100 25 8.33 25 25
Mindanao
Davao del Sur 2 0 0 0 1
North Cotabato
0 1 0 1 1
South Cotabato 0 0 0 1 2
Bukidnon 1 1 0 2 2
No. 3 2 0 4 6
% 25 16.67 0 33.33 50 *Multiple response Source: FGD with IA officials/members

78
8.9. Collection Efficiency
Collection efficiency in this discussion refers to the IA’s percentage of actual collection out of
the target collectibles. Majority (30%) of IAs in Luzon were able to collect from members
80% and above the target collectibles (Table 32). This indicates a higher rate than the national
average of 61%.
With the passage of FISA in 2017, IAs in Visayas and Mindanao stopped paying amortization
but continued to collect fees, now usually referred to as irrigation management fee (IMF) or
association service charge (ASC) for the operation and maintenance of their respective
irrigation system. This ranged from ₱500/ha to ₱1,000/ha. In Visayas, 50% of the sample IAs
had a collection efficiency of 80% and above. However, 33% of the IAs had 54% and below.
In Mindanao, around 58% of IAs had a collection efficiency of 80% and above. However, 33%
of IAs had collection rate of 69% and below for the same reason cited in the Visayas.
Table 32. Frequency distribution of collection efficiency of all sample IAs in the selected provinces
Province 95% and
above 80%-94% 70%-79% 55%-69%
54% and below
Others*
Luzon (2015)
Pampanga 3 0 0 0 2 1
Nueva Ecija 1 0 1 0 3 1
Pangasinan 2 1 1 0 1 1
Ilocos Norte 1 0 1 0 0 4
Camarines Sur 2 2 0 2 0 0
Nueva Vizcaya 0 2 1 1 0 2
Benguet 0 0 0 0 0 6
Isabela 2 0 2 1 0 1
Cagayan 0 3 2 1 0 0
Laguna 2 1 2 0 0 1
Occ. Mindoro 2 1 0 3 0 0
Total No. of IAs 15 10 10 8 6 17
% 22.73 15.15 15.15 12.12 9.09 25.76
Visayas (2018)
Bohol 1 0 0 0 2
Leyte 1 1 0 0 1
Iloilo 2 0 1 0 0
Capiz 1 0 1 0 1
Total No. of IAs 5 1 2 0 4
% 41.67 8.33 16.67 0 33.33
Mindanao (2018) **
Davao del Sur 2 1 0 0 0 0
North Cotabato 0 2 0 0 0 1
South Cotabato 0 0 0 2 1 0
Bukidnon 0 2 0 0 1 0
Total No. of IAs 2 5 0 2 2 1
% 16.67 41.67 0 16.67 16.67 8.33 *Others refer to those not paying amortization **LGU assisted Source: FGD with IA officials/members

79
Based on size of FUSA, IAs with large systems represent 42% of IAs in Luzon that have 70%
and above collection efficiency. Small CIS represents 31% and medium, 26%, indicating they
are better than national average. But among IAs with 95% and higher collection efficiency,
both small and large CIS comprise both 40% (Table 33). Among IAs with below 54%
collection efficiency, 50% have large CIS, 33% have medium and 17% have small CIS,
indicating that small CIS are doing better in terms of collection.
In the Visayas, IAs with small FUSA have remarkably high collection efficiency while IAs
with medium to large FUSA have collection efficiencies of 54% and below. In Mindanao, IAs
with medium to large FUSA have high collection efficiencies. However, IAs with large FUSA
also equally represent those with low collection efficiency.
Table 33. Frequency distribution of collection efficiency by FUSA of all sample IAs in the selected provinces
FUSA Size 95% and
above 80%-94% 70%-79% 55%-69%
54% and below
Others*
Luzon (2015)
Small IAs 6 3 2 0 1 5
% of IAs 40 30 20 - 17 29
Medium IAs 3 4 2 2 2 3
% of IAs 20 40 20 25 33 18
Large IAs 6 3 6 6 3 9
% of IAs 40 30 60 75 50 53
All IAs 15 10 10 8 6 17
% 22.73 15.15 15.15 12.12 9.10 25.76
Visayas (2018)
Small IAs 3 0 0 0 0
% of IAs 60 0 0 0 0
Medium IAs 1 0 1 0 1
% of IAs 20 0 50 0 25
Large IAs 1 1 1 0 3
% of IAs 20 100 50 0 75
All IAs 5 1 2 0 4
% 41.67 8.33 16.67 0 33.33
Mindanao (2018)
Small IAs 0 1 0 0 0 0
% of IAs 0 20 0 0 0 0
Medium IAs 1 1 0 0 2 1
% of IAs 50 20 0 0 100 100
Large IAs 1 3 0 2 0 0
% of IAs 50 60 0 100 0 0
All IAs 2 5 0 2 2 1
% 16.67 41.67 0 16.67 16.67 8.33 *Others refer to those not collecting/paying amortization Source: FGD with IA officials/members
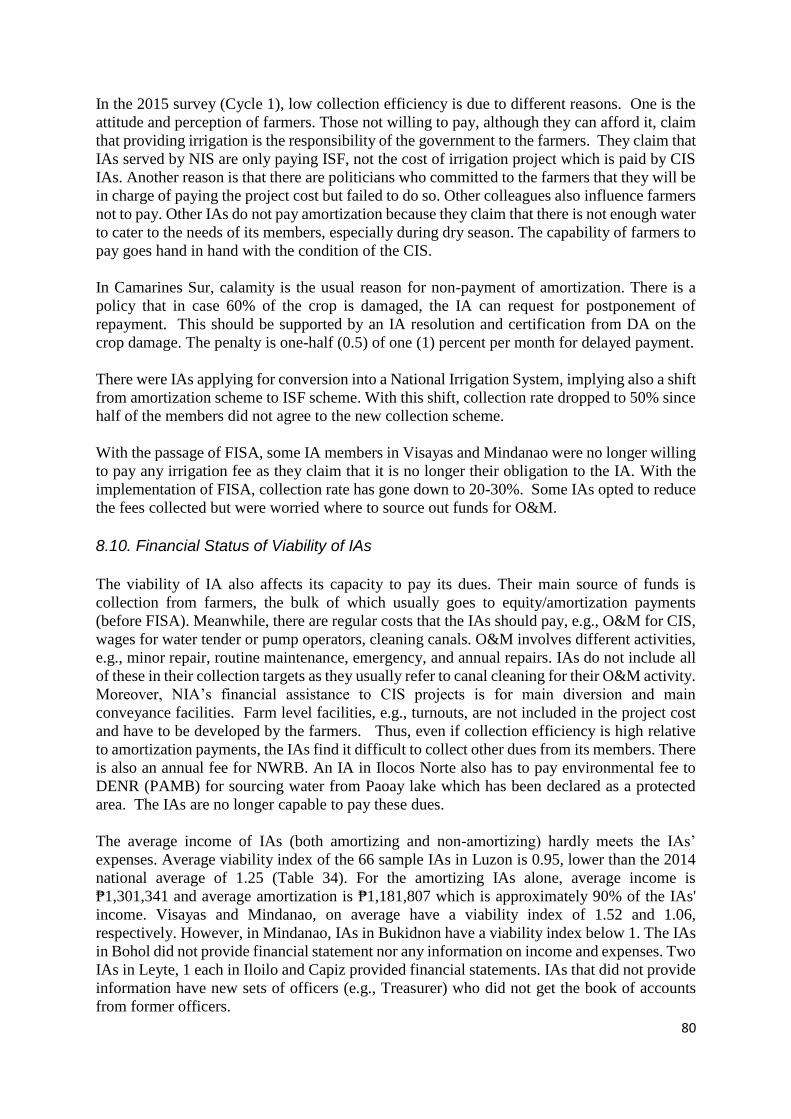
80
In the 2015 survey (Cycle 1), low collection efficiency is due to different reasons. One is the
attitude and perception of farmers. Those not willing to pay, although they can afford it, claim
that providing irrigation is the responsibility of the government to the farmers. They claim that
IAs served by NIS are only paying ISF, not the cost of irrigation project which is paid by CIS
IAs. Another reason is that there are politicians who committed to the farmers that they will be
in charge of paying the project cost but failed to do so. Other colleagues also influence farmers
not to pay. Other IAs do not pay amortization because they claim that there is not enough water
to cater to the needs of its members, especially during dry season. The capability of farmers to
pay goes hand in hand with the condition of the CIS.
In Camarines Sur, calamity is the usual reason for non-payment of amortization. There is a
policy that in case 60% of the crop is damaged, the IA can request for postponement of
repayment. This should be supported by an IA resolution and certification from DA on the
crop damage. The penalty is one-half (0.5) of one (1) percent per month for delayed payment.
There were IAs applying for conversion into a National Irrigation System, implying also a shift
from amortization scheme to ISF scheme. With this shift, collection rate dropped to 50% since
half of the members did not agree to the new collection scheme.
With the passage of FISA, some IA members in Visayas and Mindanao were no longer willing
to pay any irrigation fee as they claim that it is no longer their obligation to the IA. With the
implementation of FISA, collection rate has gone down to 20-30%. Some IAs opted to reduce
the fees collected but were worried where to source out funds for O&M.
8.10. Financial Status of Viability of IAs
The viability of IA also affects its capacity to pay its dues. Their main source of funds is
collection from farmers, the bulk of which usually goes to equity/amortization payments
(before FISA). Meanwhile, there are regular costs that the IAs should pay, e.g., O&M for CIS,
wages for water tender or pump operators, cleaning canals. O&M involves different activities,
e.g., minor repair, routine maintenance, emergency, and annual repairs. IAs do not include all
of these in their collection targets as they usually refer to canal cleaning for their O&M activity.
Moreover, NIA’s financial assistance to CIS projects is for main diversion and main
conveyance facilities. Farm level facilities, e.g., turnouts, are not included in the project cost
and have to be developed by the farmers. Thus, even if collection efficiency is high relative
to amortization payments, the IAs find it difficult to collect other dues from its members. There
is also an annual fee for NWRB. An IA in Ilocos Norte also has to pay environmental fee to
DENR (PAMB) for sourcing water from Paoay lake which has been declared as a protected
area. The IAs are no longer capable to pay these dues.
The average income of IAs (both amortizing and non-amortizing) hardly meets the IAs’
expenses. Average viability index of the 66 sample IAs in Luzon is 0.95, lower than the 2014
national average of 1.25 (Table 34). For the amortizing IAs alone, average income is
₱1,301,341 and average amortization is ₱1,181,807 which is approximately 90% of the IAs'
income. Visayas and Mindanao, on average have a viability index of 1.52 and 1.06,
respectively. However, in Mindanao, IAs in Bukidnon have a viability index below 1. The IAs
in Bohol did not provide financial statement nor any information on income and expenses. Two
IAs in Leyte, 1 each in Iloilo and Capiz provided financial statements. IAs that did not provide
information have new sets of officers (e.g., Treasurer) who did not get the book of accounts
from former officers.

81
Table 34. Average income, expenditures and viability of all sample IAs in the selected provinces
Province Average income Average expenses Viability index
(income/Expenses)
Luzon (2015 data)
Pampanga 1,525,499 1,595,831 0.74
Nueva Ecija 261,523 408,850 0.64
Pangasinan 277,914 297,158 0.91
Ilocos Norte 46,100 67,183 0.70
Camarines Sur 3,315,945 3,228,336 0.95
Nueva Vizcaya 239,575 258,241 0.95
Benguet 9,820 9,900 0.98
Isabela 358,389 369,105 0.81
Cagayan 146,983 270,066 0.76
Laguna 96,791 98,491 0.79
Occidental Mindoro 424,117 449,783 0.90
All 609,332 641,111 0.95
Visayas (2017 data)
Bohol - - -
Leyte 178,547 165,557.52 1.13
Iloilo 37,024 35,444 1.04
Capiz 49,313 17,920 2.75
All 110,857 96,119.76 1.52
Mindanao (2017 data)
Davao del Sur 518,199.13 434,954.14 1.13
North Cotabato 663,339.50 588,434.40 1.04
South Cotabato 369,597.90 315,559.26 1.13
Bukidnon 229,563.20 225,624.05 0.94
All 445,174.93 391,142.96 1.06 Source: FGD with IA officials/members and Financial Statements provided by the IAs Note: Income comes mainly from collection of fees from farmer-members; expenses cover mainly O&M activities such as cleaning canals, and wages for water tended/pump operators.
Based on size of FUSA, IAs with small systems in Luzon have lower viability index on average
than those with medium and large systems. In the Visayas, IAs with small and medium size
systems are equally viable but still large systems fare better. This suggests prioritizing the need
for improving financial management of IAs with small systems. In contrast, IAs with small
systems have higher viability index than medium and large systems (Table 35).
However, based on frequency distribution of the 66 IAs in Luzon, around 56% have a viability
index between one and two. The IAs (34%) with low viability suggests that the income of these
IAs is not enough to meet their expenditures (Table 36).
In Visayas, all (4) IAs that provided data have a viability index above 1. In Mindanao, 25% of
the 12 sample IAs have a viability index below 1 (Table 36).
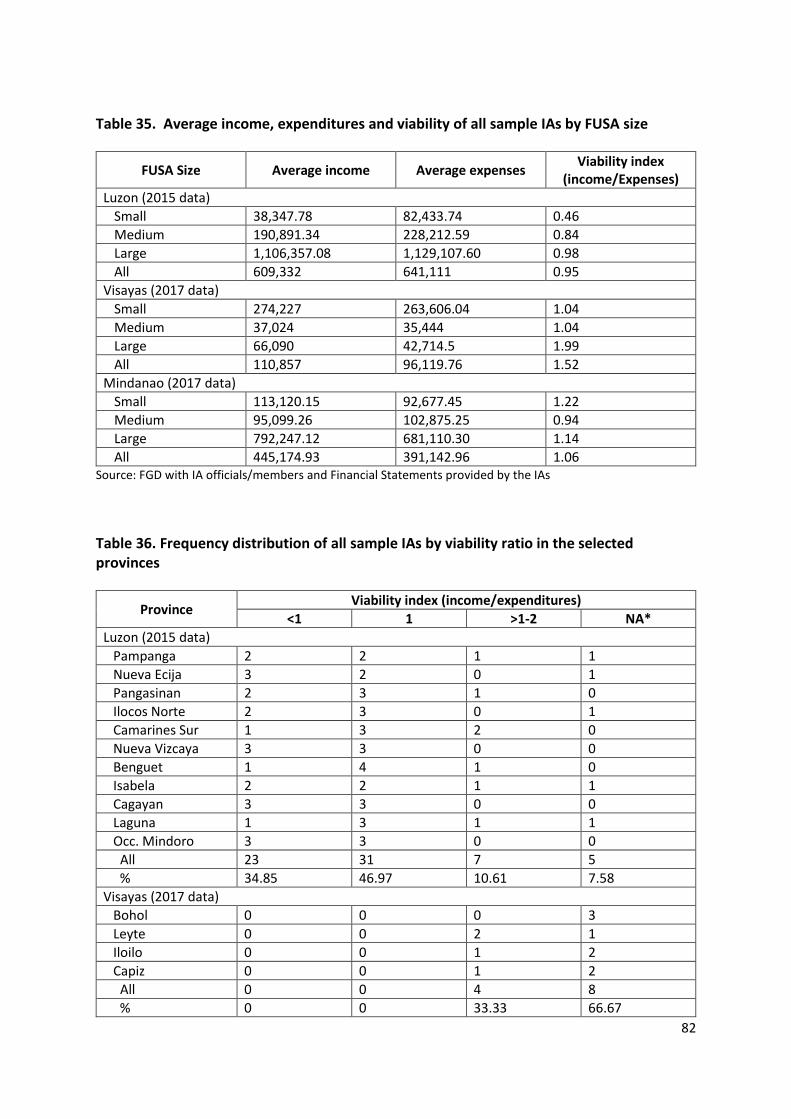
82
Table 35. Average income, expenditures and viability of all sample IAs by FUSA size
FUSA Size Average income Average expenses Viability index
(income/Expenses)
Luzon (2015 data)
Small 38,347.78 82,433.74 0.46
Medium 190,891.34 228,212.59 0.84
Large 1,106,357.08 1,129,107.60 0.98
All 609,332 641,111 0.95
Visayas (2017 data)
Small 274,227 263,606.04 1.04
Medium 37,024 35,444 1.04
Large 66,090 42,714.5 1.99
All 110,857 96,119.76 1.52
Mindanao (2017 data)
Small 113,120.15 92,677.45 1.22
Medium 95,099.26 102,875.25 0.94
Large 792,247.12 681,110.30 1.14
All 445,174.93 391,142.96 1.06 Source: FGD with IA officials/members and Financial Statements provided by the IAs
Table 36. Frequency distribution of all sample IAs by viability ratio in the selected provinces
Province Viability index (income/expenditures)
<1 1 >1-2 NA*
Luzon (2015 data)
Pampanga 2 2 1 1
Nueva Ecija 3 2 0 1
Pangasinan 2 3 1 0
Ilocos Norte 2 3 0 1
Camarines Sur 1 3 2 0
Nueva Vizcaya 3 3 0 0
Benguet 1 4 1 0
Isabela 2 2 1 1
Cagayan 3 3 0 0
Laguna 1 3 1 1
Occ. Mindoro 3 3 0 0
All 23 31 7 5
% 34.85 46.97 10.61 7.58
Visayas (2017 data)
Bohol 0 0 0 3
Leyte 0 0 2 1
Iloilo 0 0 1 2
Capiz 0 0 1 2
All 0 0 4 8
% 0 0 33.33 66.67
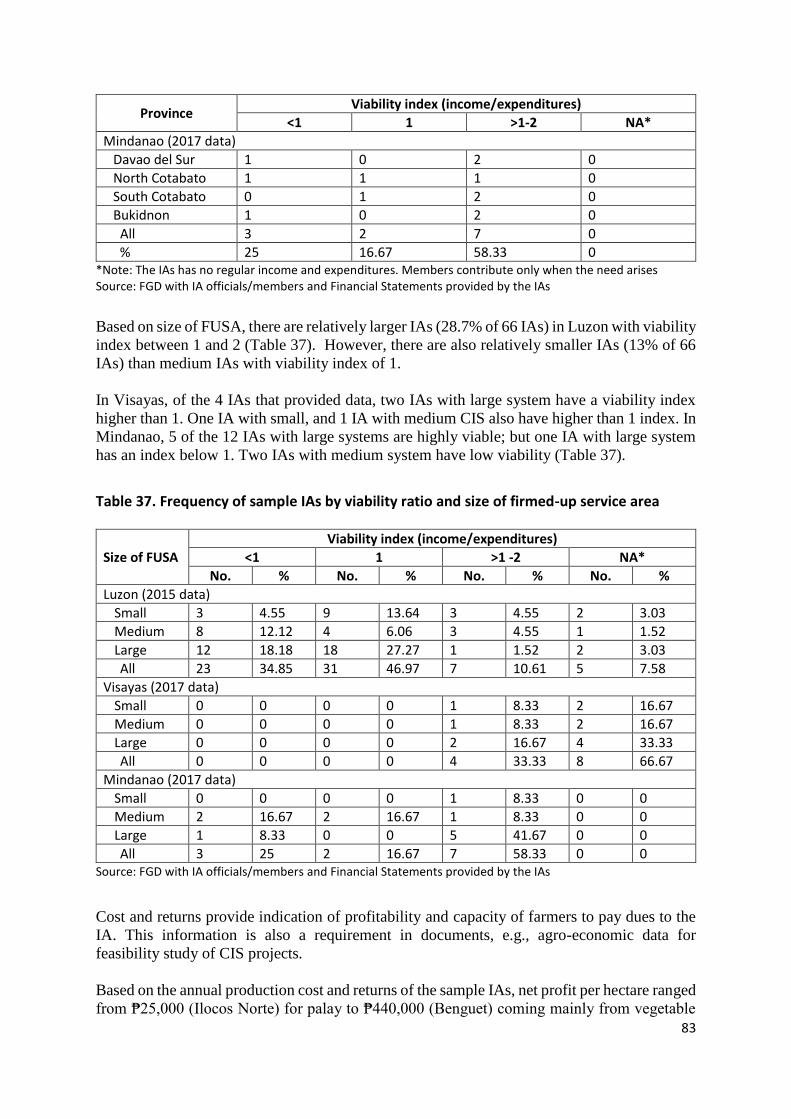
83
Province Viability index (income/expenditures)
<1 1 >1-2 NA*
Mindanao (2017 data)
Davao del Sur 1 0 2 0
North Cotabato 1 1 1 0
South Cotabato 0 1 2 0
Bukidnon 1 0 2 0
All 3 2 7 0
% 25 16.67 58.33 0 *Note: The IAs has no regular income and expenditures. Members contribute only when the need arises Source: FGD with IA officials/members and Financial Statements provided by the IAs
Based on size of FUSA, there are relatively larger IAs (28.7% of 66 IAs) in Luzon with viability
index between 1 and 2 (Table 37). However, there are also relatively smaller IAs (13% of 66
IAs) than medium IAs with viability index of 1.
In Visayas, of the 4 IAs that provided data, two IAs with large system have a viability index
higher than 1. One IA with small, and 1 IA with medium CIS also have higher than 1 index. In
Mindanao, 5 of the 12 IAs with large systems are highly viable; but one IA with large system
has an index below 1. Two IAs with medium system have low viability (Table 37).
Table 37. Frequency of sample IAs by viability ratio and size of firmed-up service area
Size of FUSA
Viability index (income/expenditures)
<1 1 >1 -2 NA*
No. % No. % No. % No. %
Luzon (2015 data)
Small 3 4.55 9 13.64 3 4.55 2 3.03
Medium 8 12.12 4 6.06 3 4.55 1 1.52
Large 12 18.18 18 27.27 1 1.52 2 3.03
All 23 34.85 31 46.97 7 10.61 5 7.58
Visayas (2017 data)
Small 0 0 0 0 1 8.33 2 16.67
Medium 0 0 0 0 1 8.33 2 16.67
Large 0 0 0 0 2 16.67 4 33.33
All 0 0 0 0 4 33.33 8 66.67
Mindanao (2017 data)
Small 0 0 0 0 1 8.33 0 0
Medium 2 16.67 2 16.67 1 8.33 0 0
Large 1 8.33 0 0 5 41.67 0 0
All 3 25 2 16.67 7 58.33 0 0 Source: FGD with IA officials/members and Financial Statements provided by the IAs
Cost and returns provide indication of profitability and capacity of farmers to pay dues to the
IA. This information is also a requirement in documents, e.g., agro-economic data for
feasibility study of CIS projects.
Based on the annual production cost and returns of the sample IAs, net profit per hectare ranged
from ₱25,000 (Ilocos Norte) for palay to ₱440,000 (Benguet) coming mainly from vegetable

84
production (Table 38a). For amortizing IAs, the annual instalment shall be the money value of
1.5 cavans (50kg/cavan) multiplied by the wet season actually benefitted area. At ₱17/kg of
palay, the money value of this will be ₱1,275 per hectare (assuming this is the actually
benefitted area). For an average FUSA of 156 ha, annual amortization at this rate will be
₱198,900. For 50 years, this will pay a loan of ₱9.9M, close to the average loan of the sample
IAs. In the Visayas, net profit is highest in Leyte and Capiz at around ₱58,000/ha. for two
cropping seasons. It is lowest in Iloilo at ₱34,000 due to reduced crop area and production
during the dry season (Table 38b). In Mindanao, net profit for two seasons is highest in North
Cotabato (over ₱115,000/ha) and lowest in South Cotabato at over ₱40,000 per ha (Table 38c).
Table 38a. Average production cost and returns per ha of the 66 sample IAs in 11 selected provinces in Luzon (2015)
Province Area Wet
Area Dry
Total Production
(kg)
Yield (kg/ha)
Total Production
cost /ha (₱)
Gross Profit/ha
(₱)
Net Profit/ha
(₱)
Luzon
Pampanga 112.5 50.60 857,736 5,258.96 42,417 109,937 67,519
Nueva Ecija 160.33 117.00 1,890,878 6,818.15 50,576 126,940 76,363
Pangasinan 107.83 107.40 791,048 3,675.36 28,109 81,072 52,962
Ilocos Norte
156.17 141.00 992,475 3,339.76 34,816 60,356 25,539
Camarines Sur
184.00 184.00 1,768,461 4,805.60 46,022 102,864 56,842
Nueva Vizcaya
179.17 151.33 1,614,865 4,886.13 37,152 87,157 50,004
Benguet 48.00 48.00 4,717,049 49,135.93 130,813 570,948 440,134
Isabela 100.00 87.50 919,123 4,901.99 33,176 84,754 51,577
Cagayan 67.33 63.17 586,967 4,497.83 36,403 88,778 52,375
Laguna 87.33 73.67 1,445,097 8,975.76 47,319 97,342 50,022
Occidental Mindoro
289.17 283.50 2,994,300 5,228.67 28,713 83,630 54,916
All 135.62 118.83 1,688,909 9,229.47 46,865 135,798 88,932 Source: FGD with IA officials/members
Table 38b. Average production cost and returns per ha of the 12 sample IAs in 4 selected provinces in the Visayas (2018)
Province Effective
Area Planted
Effective Area
Harvested
Total Production
(in kg)
Yield (kg/ha)
Total Production
cost/ha (₱)
Gross Profit/ha
(₱)
Net Profit/ha
(₱)
Wet season, palay
Bohol 136.67 128 475,117 2,320 20,000 39,800 19,800
Leyte 293.67 293.67 1,344,698 5,376 27,667 59,000 29,000
Iloilo 103.33 103.33 359,500 3,737 25,667 43,333 17,667
Capiz 251.67 251.67 989,950 4,140 18,333 43,333 28,333
All 196.33 194.17 792,316 3,893 22,917 45,218 23,218

85
Province Effective
Area Planted
Effective Area
Harvested
Total Production
(in kg)
Yield (kg/ha)
Total Production
cost/ha (₱)
Gross Profit/ha
(₱)
Net Profit/ha
(₱)
Dry season, palay
Bohol 110 97.67 319,400 2,320 26,667 44,200 17,533
Leyte 293.67 293.67 1,678,520 6,540 28,000 59,000 29,000
Iloilo 85 85 258,000 3,120 25,667 42,667 17,000
Capiz 251.67 251.67 938,750 3,740 19,000 48,333 29,333
All 185.08 182 798,668 3,930 24,833 47,600 22,691 Source: FGD with IA officials/members
Table 38c. Average production cost and returns per ha of the 12 sample IAs in 4 selected provinces in Mindanao (2018)
Province Effective
Area Planted
Effective Area
Harvested
Total Production
(in kg)
Yield (kg/ha)
Total Production cost/ha (₱)
Gross Profit/ha
(₱)
Net Profit/ha
(₱)
Wet season, palay
Davao del Sur
182 182 996,240 4,284 31,000 78,933 47,933
North Cotabato
221.67 221.67 614,586 2,968 22,833 78,311 55,311
South Cotabato
425.25 425.25 1,608,390 3,780 25,000 45,000 20,000
Bukidnon 142.33 142.33 514,360 4,130 29,167 64,333 36,000
All 242.81 242.81 933,394 3,790.5 27,000.00 66,644.2 39,811
Dry season, palay
Davao del Sur
182 182 932,400 3,738 31,000 52,500 21,667
North Cotabato
221.67 221.67 578,956 2,618 22,833 83,620 60,620
South Cotabato
425.25 425.25 1,608,390 3,780 25,000 45,000 20,000
Bukidnon 137.33 137.33 446,740 3,570 29,167 71,333 43,000
All 241.56 241.56 891,621.5 3,426.5 27,000.00 63,113.2 36,322
Dry Season, Corn
South Cotabato
25.75 10 10 (tons/yr)
25,000 131,541.8 106,542
Papaya
South Cotabato
45.75 27.5 1,800 (kg/wk)
150,000 650,000 200,000
Source: FGD with IA officials/members Note: Corn and Papaya (South Cotabato) are produced in different farm areas from those planted to Rice but
are irrigated by the CIS.
The market price of land may also be encouraging to farmers to sell their farms. Based on the
2015 survey in Luzon, Benguet has the highest average price of ₱18 million per hectare (M/ha).
Isabela and Ilocos Norte come next at over ₱12 M/ha and ₱8 M/ha, respectively (Figure 28a).
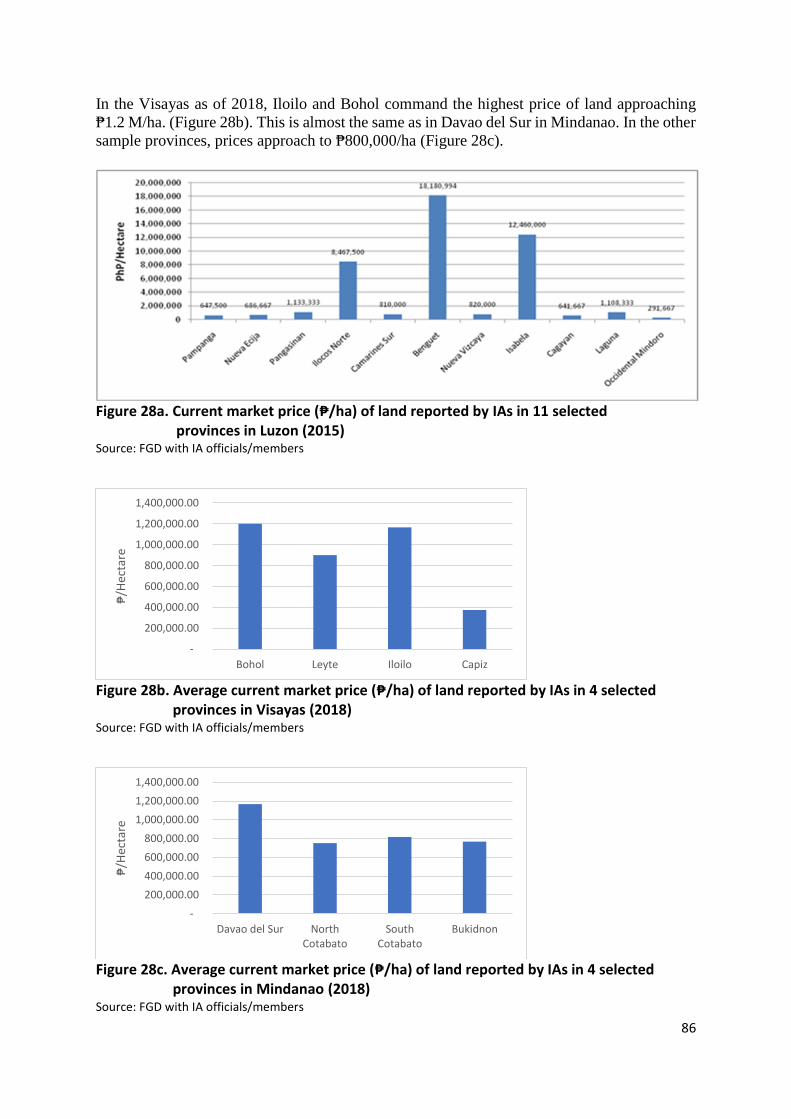
86
In the Visayas as of 2018, Iloilo and Bohol command the highest price of land approaching
₱1.2 M/ha. (Figure 28b). This is almost the same as in Davao del Sur in Mindanao. In the other
sample provinces, prices approach to ₱800,000/ha (Figure 28c).
Figure 28a. Current market price (₱/ha) of land reported by IAs in 11 selected provinces in Luzon (2015) Source: FGD with IA officials/members
Figure 28b. Average current market price (₱/ha) of land reported by IAs in 4 selected provinces in Visayas (2018) Source: FGD with IA officials/members
Figure 28c. Average current market price (₱/ha) of land reported by IAs in 4 selected provinces in Mindanao (2018) Source: FGD with IA officials/members
-
200,000.00
400,000.00
600,000.00
800,000.00
1,000,000.00
1,200,000.00
1,400,000.00
Bohol Leyte Iloilo Capiz
₱/H
ecta
re
-
200,000.00
400,000.00
600,000.00
800,000.00
1,000,000.00
1,200,000.00
1,400,000.00
Davao del Sur NorthCotabato
SouthCotabato
Bukidnon
₱/H
ecta
re

87
8.11. Pump Usage
As mentioned earlier, CIS using pumps serves around 18% of the total FUSA covered by the
66 sample irrigation systems in Luzon, and around 25% in Visayas, and none in Mindanao.
The pump CIS being referred to here are those systems tapping water from rivers or creeks
using either turbine or large centrifugal pumps and usually powered by large diesel engines.
Generally, these CIS are costlier to manage (operate and maintain) than gravity CIS. There are
also successful IAs managing pump CIS, being able to source support through institutional
networking. LGUs also provide financial assistance to IAs in establishing pump CIS.
Installation of shallow tube wells (STWs) is practiced as an alternative source when there are
many facilities that need to be repaired; and/or there is inadequacy of water supply such as in
the dry season. Pump systems are also common in some storage or diversion schemes to lift
water to irrigate areas on higher elevation, or pump groundwater to supplement available
supply from the river.
Problems with pump CIS include high cost of maintenance and fuel cost. Pump run by
electricity entails a cost of ₱0.5M for one season. In a Pampanga CIS, farmers pay 8-12
cavan/ha/season for use of the pump. In a Nueva Ecija CIS, a 65-75 Hp pump costing ₱5.4M
(as of 2013) can serve 50-60 ha. Fuel cost is ₱3,000/ha/cropping. Per IA policy on the use of
pump, the farmer has to replace the fuel used so that it’s always kept full tank. Farmers share
the cost of repair and maintenance.
In a Cagayan CIS, a 7-8Hp pump that can serve 3 ha costs ₱140,000. For 10-50 ha, deep well
is the alternative. Service fee is direct cost for amortization. Amortization is 10cav/ha/season;
for shallow water levels (lower head) where consumption is lower, it is 7.5 cav/ha; for higher
head, rate is 10cav/ha. For regular maintenance, fee is 0.5 cav/ha.
In the 11 selected provinces in Luzon, average yield from gravity CIS is higher than yield from
pump CIS by almost 10 cavans during wet season and by 13 cavans during dry season. Only
three provinces used pump during the dry season. Isabela has the highest average yield for
pump CIS with 94cav/ha during wet season and Pampanga with 96cav/ha during dry season.
Lowest yield during wet season is in Pampanga with 68cav/ha and during dry season in Isabela
at 70cav/ha.
In Loboc PIS in Bohol, the pump used electricity to store water to the two reservoirs. The
association paid electric bill amounting to ₱3,000 per month during cropping season. Members
paid ₱20 per cubic meter before but with the passage of FISA the cooperative decided to reduce
it to ₱15 per cubic meter.
In Particion CIS in Iloilo, the association found out that the pump provided by the contractor
was secondhand when the pump started to breakdown. It costs them ₱70,000 for the repair but
it is no longer operational. The NIA then provided them with a diesel-engine powered
centrifugal pump. The association used the pump 8hrs a day especially during dry season when
water from the river is scarce. Thirty to forty liters of gasoline can be consumed by the pump
engine per hectare increasing total production cost and decreasing net profit of the farmers.
Before the FISA, the association collected operation management fee of ₱10 per cavan for each
cropping season from each member but reduced to ₱5 per cavan with the passage of FISA.
88
In Sigma Sur PIS in Capiz, the pump provided by the NIA is operated a maximum of 14 hour
per day. Members of the association paid the operator a ₱30 per hour rate. The association
implement “no receipt, no water” and “first come, first serve basis” policy for the water
distribution and delivery. Members shouldered the fuel expense for the irrigation of their
respective rice fields. One hectare can be fully irrigated in 5 hrs with 3 liters/hr rate of gasoline
consumption.
In Visayas, only Leyte did not use pump. Average yield difference between gravity and pump
CIS is over 38cav/ha for wet season; and 26cav/ha for dry season. Pump CIS in Bohol has the
lowest yield (15-20 cav/ha). 9. Success Indicators of IAs According to key informants at the IMOs, success of IA is largely based on regular payment
of amortization, successful collection of ISF from IA members, and how active or functional
the IA is. ISF in the case of CIS used to include fees for IA amortization, O&M activities and
wages for water tender. With FISA, as earlier mentioned, IA collection is referred to as
irrigation management fee (IMF) or association service charge (ASC). But there are IA
members who are no longer willing to pay any fees. An IA is considered active if it sees to it
that the system is working well in order to meet expectations. Being active considers the
functionality indicators discussed below.
9.1. Functionality of Irrigators’ Associations
A sustained irrigation system is connected with functionality, a composite of financial, O&M,
organization and organizational discipline factors which later included assistance
program/linkage, and special features. O&M and financial conditions are interconnected and
could also affect the organization and organizational discipline. Financial viability indicates
that the IA’s income is sufficient to cover its expenditures and they can pay NIA its
amortization.
IAs differ in terms of organizational discipline and depends on the IA leadership. Some IAs
may be active in conducting regular meetings while others are not conducting meeting if the
IDO is not around. Active IAs also exert effort, e.g., seeking assistance from different sources,
to remedy problems with the system. The IA is non-functional if it has poor response to its
needs and non-active; O&M is only good in plan but not in implementation, e.g., cropping
calendar is not followed; facilities not maintained; collection of amortizations is a problem.
Based on the functionality reports of IMOs in Luzon, 51% of the sample IAs covered by the
study have very satisfactory (44%) to outstanding ratings (7%). Around 7% were rated fair
(Table 49a). In Visayas, around 7% were outstanding; and 42% were very satisfactory. Around
16% were fair. (Table 49b). Mindanao also has high functionality rating with almost 17%
outstanding and 42% very satisfactory. Only 8% were rated fair (Table 49c).
Considering size of FUSA, there are relatively more IAs with large systems in Luzon that are
rated very satisfactory to outstanding. In contrast, among IAs with fair rating, 40% are IAs
with small CIS. In Visayas, small and large systems are outstanding. Only the medium system
got a fair rating. In Mindanao, majority of large systems got outstanding or very satisfactory
rating. Only the medium system also got a fair rating.
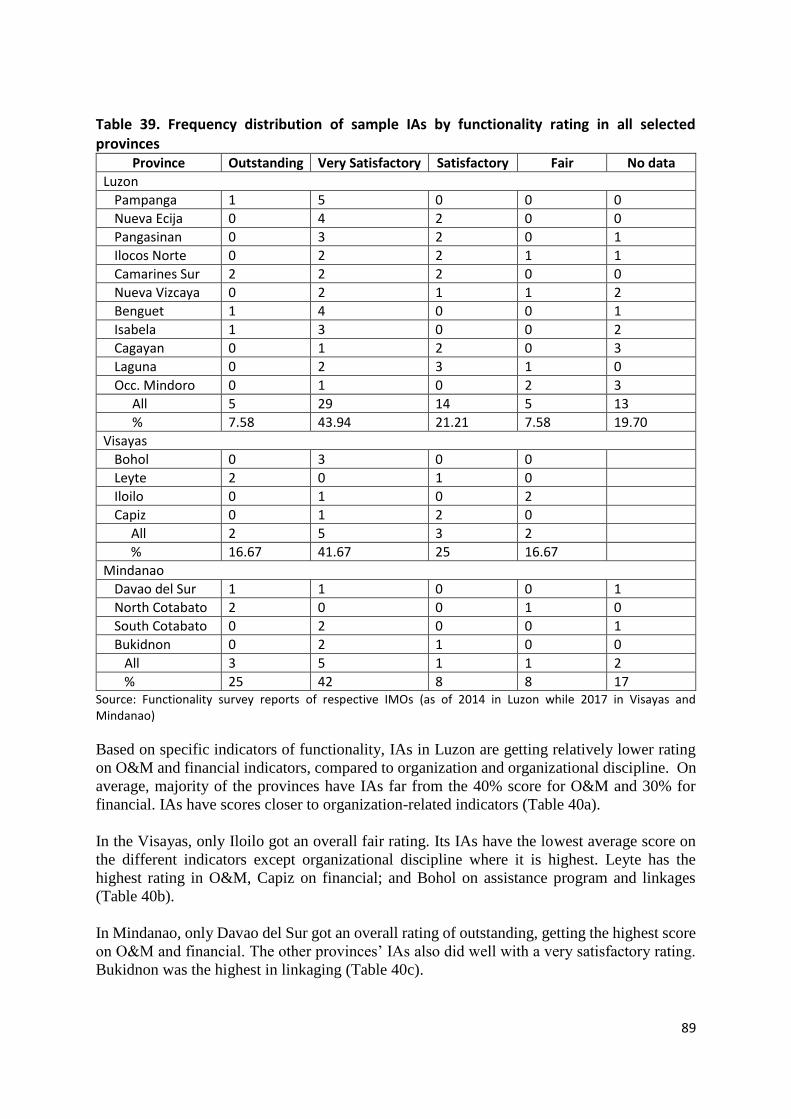
89
Table 39. Frequency distribution of sample IAs by functionality rating in all selected provinces
Province Outstanding Very Satisfactory Satisfactory Fair No data
Luzon
Pampanga 1 5 0 0 0
Nueva Ecija 0 4 2 0 0
Pangasinan 0 3 2 0 1
Ilocos Norte 0 2 2 1 1
Camarines Sur 2 2 2 0 0
Nueva Vizcaya 0 2 1 1 2
Benguet 1 4 0 0 1
Isabela 1 3 0 0 2
Cagayan 0 1 2 0 3
Laguna 0 2 3 1 0
Occ. Mindoro 0 1 0 2 3
All 5 29 14 5 13
% 7.58 43.94 21.21 7.58 19.70
Visayas
Bohol 0 3 0 0
Leyte 2 0 1 0
Iloilo 0 1 0 2
Capiz 0 1 2 0
All 2 5 3 2
% 16.67 41.67 25 16.67
Mindanao
Davao del Sur 1 1 0 0 1
North Cotabato 2 0 0 1 0
South Cotabato 0 2 0 0 1
Bukidnon 0 2 1 0 0
All 3 5 1 1 2
% 25 42 8 8 17 Source: Functionality survey reports of respective IMOs (as of 2014 in Luzon while 2017 in Visayas and Mindanao)
Based on specific indicators of functionality, IAs in Luzon are getting relatively lower rating
on O&M and financial indicators, compared to organization and organizational discipline. On
average, majority of the provinces have IAs far from the 40% score for O&M and 30% for
financial. IAs have scores closer to organization-related indicators (Table 40a).
In the Visayas, only Iloilo got an overall fair rating. Its IAs have the lowest average score on
the different indicators except organizational discipline where it is highest. Leyte has the
highest rating in O&M, Capiz on financial; and Bohol on assistance program and linkages
(Table 40b).
In Mindanao, only Davao del Sur got an overall rating of outstanding, getting the highest score
on O&M and financial. The other provinces’ IAs also did well with a very satisfactory rating.
Bukidnon was the highest in linkaging (Table 40c).

90
Table 40a. Average rating of the individual indicators for IAs’ functionality rating in 11 selected provinces in Luzon
Province O&M (40%)
Organiza-tion (15%)
Financial (30%)
Organization-al Discipline
(15%)
Average Scores in
add’l indicators
Final Rating (Total)
Final Rating (Adjective)
Pampanga 30.88 12.67 24.69 12.89 2.58 83.71 Satisfactory
Nueva Ecija 30.90 12.75 20.91 12.24 3.79 80.62 Satisfactory
Pangasinan 32.58 12.25 18.40 12.48 6.16 81.87 Satisfactory
Ilocos Norte
32.87 14.21 20.58 14.69 7.72 82.95 Satisfactory
Camarines Sur
29.45 13.37 19.67 13.71 3.25 79.42 Satisfactory
Benguet* - - - - - 83.51 Satisfactory
Nueva Vizcaya
34.60 12.85 22.10 12.39 3.76 85.69 Very Satisfactory
Isabela 35.47 13.03 21.09 12.67 2.79 87.83 Very Satisfactory
Cagayan 32.51 12.43 19.35 13.26 5.50 83.05 Satisfactory
Laguna 27.96 11.05 17.49 11.48 4.12 72.10 Fair
Occidental Mindoro
23.18 11.54 21.38 11.40 4.50 72.00 Fair
ALL 31.04 12.62 20.57 12.72 4.42 81.16 Satisfactory *Note: For the province of Benguet, only the final ratings are presented Source: Functionality survey reports of 11 IMOs (as of 2014)
Table 40b. Average rating of the individual indicators for IAs’ functionality rating in 4 selected provinces in Visayas
Province O&M (35%)
Financial (26%)
Organizational Discipline
(25%)
Assistance Program/ Linkages
(10%)
Special Features
(4%)
Final Rating (Total)
Final Rating
(Adjective)
Bohol 31.33 22 22.67 9 2.33 88.33 Very Satisfactory
Leyte 35.07 23.5 22.76 8.67 2.37 91.58 Very Satisfactory
Iloilo 28.4 17.12 23.53 4.4 0.35 73.8 Fair
Capiz 31.2 24.5 22.77 4.67 1.67 84.8 Satisfactory
ALL 31.5 21.78 22.93 6.68 1.68 84.63 Satisfactory Source: Functionality survey reports of 4 IMOs (as of 2017)
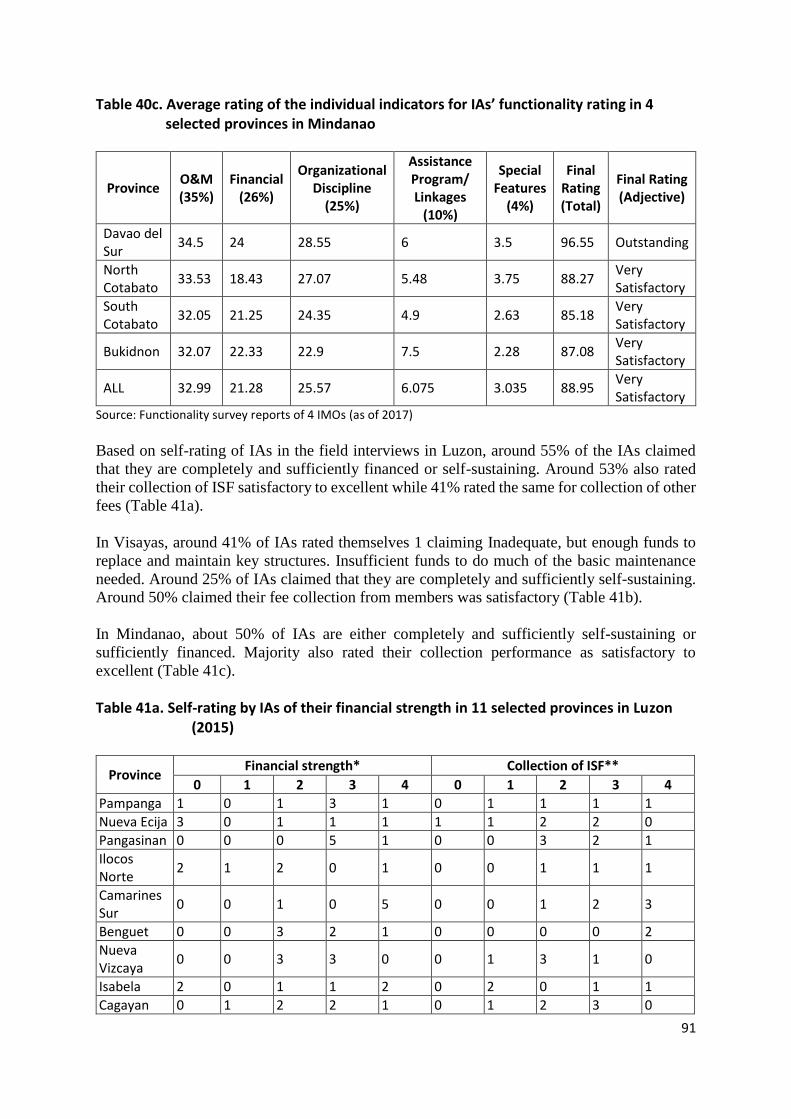
91
Table 40c. Average rating of the individual indicators for IAs’ functionality rating in 4 selected provinces in Mindanao
Province O&M (35%)
Financial (26%)
Organizational Discipline
(25%)
Assistance Program/ Linkages
(10%)
Special Features
(4%)
Final Rating (Total)
Final Rating (Adjective)
Davao del Sur
34.5 24 28.55 6 3.5 96.55 Outstanding
North Cotabato
33.53 18.43 27.07 5.48 3.75 88.27 Very Satisfactory
South Cotabato
32.05 21.25 24.35 4.9 2.63 85.18 Very Satisfactory
Bukidnon 32.07 22.33 22.9 7.5 2.28 87.08 Very Satisfactory
ALL 32.99 21.28 25.57 6.075 3.035 88.95 Very Satisfactory
Source: Functionality survey reports of 4 IMOs (as of 2017)
Based on self-rating of IAs in the field interviews in Luzon, around 55% of the IAs claimed
that they are completely and sufficiently financed or self-sustaining. Around 53% also rated
their collection of ISF satisfactory to excellent while 41% rated the same for collection of other
fees (Table 41a).
In Visayas, around 41% of IAs rated themselves 1 claiming Inadequate, but enough funds to
replace and maintain key structures. Insufficient funds to do much of the basic maintenance
needed. Around 25% of IAs claimed that they are completely and sufficiently self-sustaining.
Around 50% claimed their fee collection from members was satisfactory (Table 41b).
In Mindanao, about 50% of IAs are either completely and sufficiently self-sustaining or
sufficiently financed. Majority also rated their collection performance as satisfactory to
excellent (Table 41c).
Table 41a. Self-rating by IAs of their financial strength in 11 selected provinces in Luzon (2015)
Province Financial strength* Collection of ISF**
0 1 2 3 4 0 1 2 3 4
Pampanga 1 0 1 3 1 0 1 1 1 1
Nueva Ecija 3 0 1 1 1 1 1 2 2 0
Pangasinan 0 0 0 5 1 0 0 3 2 1
Ilocos Norte
2 1 2 0 1 0 0 1 1 1
Camarines Sur
0 0 1 0 5 0 0 1 2 3
Benguet 0 0 3 2 1 0 0 0 0 2
Nueva Vizcaya
0 0 3 3 0 0 1 3 1 0
Isabela 2 0 1 1 2 0 2 0 1 1
Cagayan 0 1 2 2 1 0 1 2 3 0
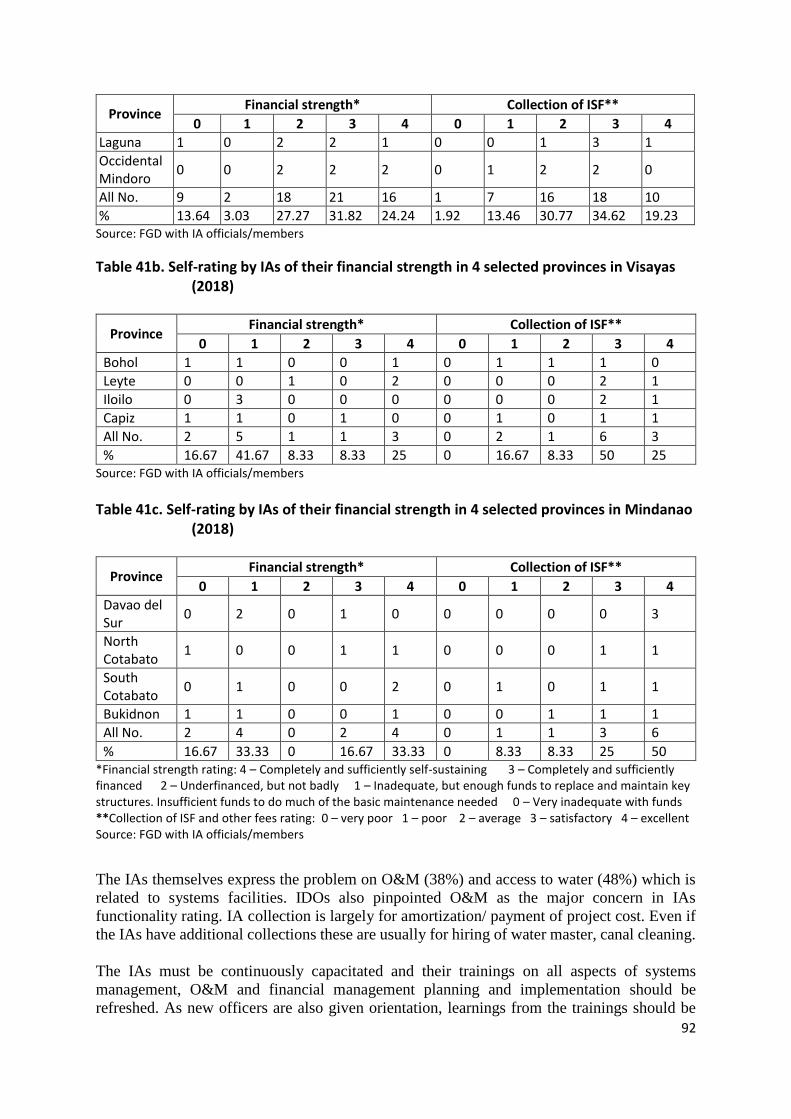
92
Province Financial strength* Collection of ISF**
0 1 2 3 4 0 1 2 3 4
Laguna 1 0 2 2 1 0 0 1 3 1
Occidental Mindoro
0 0 2 2 2 0 1 2 2 0
All No. 9 2 18 21 16 1 7 16 18 10
% 13.64 3.03 27.27 31.82 24.24 1.92 13.46 30.77 34.62 19.23 Source: FGD with IA officials/members
Table 41b. Self-rating by IAs of their financial strength in 4 selected provinces in Visayas (2018)
Province Financial strength* Collection of ISF**
0 1 2 3 4 0 1 2 3 4
Bohol 1 1 0 0 1 0 1 1 1 0
Leyte 0 0 1 0 2 0 0 0 2 1
Iloilo 0 3 0 0 0 0 0 0 2 1
Capiz 1 1 0 1 0 0 1 0 1 1
All No. 2 5 1 1 3 0 2 1 6 3
% 16.67 41.67 8.33 8.33 25 0 16.67 8.33 50 25 Source: FGD with IA officials/members
Table 41c. Self-rating by IAs of their financial strength in 4 selected provinces in Mindanao (2018)
Province Financial strength* Collection of ISF**
0 1 2 3 4 0 1 2 3 4
Davao del Sur
0 2 0 1 0 0 0 0 0 3
North Cotabato
1 0 0 1 1 0 0 0 1 1
South Cotabato
0 1 0 0 2 0 1 0 1 1
Bukidnon 1 1 0 0 1 0 0 1 1 1
All No. 2 4 0 2 4 0 1 1 3 6
% 16.67 33.33 0 16.67 33.33 0 8.33 8.33 25 50 *Financial strength rating: 4 – Completely and sufficiently self-sustaining 3 – Completely and sufficiently financed 2 – Underfinanced, but not badly 1 – Inadequate, but enough funds to replace and maintain key structures. Insufficient funds to do much of the basic maintenance needed 0 – Very inadequate with funds **Collection of ISF and other fees rating: 0 – very poor 1 – poor 2 – average 3 – satisfactory 4 – excellent Source: FGD with IA officials/members
The IAs themselves express the problem on O&M (38%) and access to water (48%) which is
related to systems facilities. IDOs also pinpointed O&M as the major concern in IAs
functionality rating. IA collection is largely for amortization/ payment of project cost. Even if
the IAs have additional collections these are usually for hiring of water master, canal cleaning.
The IAs must be continuously capacitated and their trainings on all aspects of systems
management, O&M and financial management planning and implementation should be
refreshed. As new officers are also given orientation, learnings from the trainings should be

93
shared with the IA members. Coordination across the IS sectors should be harnessed. There
also has to be a system to maintain the IAs’ functionality such as through regular monitoring
and review. At any rate, NIA is required by the GCG to conduct annual survey of its customers,
perhaps through this the sentiments, concerns of CIS IAs can be monitored.
9.2. Examples of Good Practices
The IAs that rated their performance high cited some good practices as follows:
• In Occ. Mindoro, resourcefulness of the IA president generated funds for the IA. She took
advantage of the incentive Balik Tangkilik (patronage refund) from selling to NFA through
the Cooperative Development Incentive Fund (CDIF). The incentive is ₱15 per cavan (50
kg) sold to NFA. This amount is distributed as follows - ₱3 goes to IA; ₱5 goes to actual
member of IA who sold to NFA, and ₱7 to coordinator (also an IA member) assigned by
IA to bring the palay to NFA. The IA President was able to comply with the NFA
requirement that the IA should have a certificate of good standing issued by SEC (which
also requires yearly FSS and GIS) and BIR certification of payment (tax). The IA President
reported that after receiving a grant for a CIS project, she was asked to pay tax. She clarified
this with BIR and found out that the IAs may apply for tax exemption. Because of her
dedication to the IA, she was able to produce the paper requirements to avail of this tax
exemption.
• In Occ. Mindoro, an IA, recognizing that it has no police power formed a Systems
Management Council which coordinated with the Barangay Council to adopt the IA policy
(e.g., water distribution) through a barangay resolution. Thus, if the IA member violates
the policy, the case can be elevated to the barangay level.
• An IA in Laguna is completely and sufficiently financed even 60% of the farms are
submerged in flood during rainy season and typhoon occurrence. Their high financial
viability may be attributed to their Rice Processing Center worth ₱12M given by DA in
2012, plus ₱1M operating capital, and ₱0.5M administrative funds. Likewise, the IA also
received funding from DA-CARP amounting to ₱3 M in 2015 for extension of their
irrigation canals.
• An IA in Benguet has a high attendance of members in quarterly meetings, general
assemblies, and trainings. By-laws were all implemented adequately. Violation of rules has
a fine of ₱200. All members are always able to pay their dues and the IA was named the
best IA in Benguet in 2013.
• In Laguna, every harvest, farmer gives one can of palay to the IA for its savings. Or if the
IA member has to pay ₱900 for amortization, the IA can add ₱100 in the collection.
• By-laws of an IA in Isabela are strictly implemented. A violation of a farmer-member
would cost him a fine amounting to ₱300 pesos for the first offense. A second offense
would cost the violator ₱500 and for the third time, the member’s membership would be
cancelled. The members of the board and the officers are also accountable for their
misbehavior. An absent to a meeting of an officer or BOD would result in a fine of ₱250
while consecutive absences will result in expulsion of the officer or BOD. There is also
perfect attendance of during trainings and seminars.
94
• In Camarines Sur, an IA (turned to multi-purpose cooperative) has a cropping intensity of
191% and was able to pay 100% of its yearly amortization. It was nominated to the Agri-
Pinoy Rice Achievers Award (CIS category) in 2013. It has earlier earned the NIA Gintong
Patubig Award. It was a beneficiary of various government programs such as DAR projects
on CARP-IC, and DA programs where they acquired flatbed dryer, rice processing center,
palay shed, and rice mill. The IA members have attended various seminars and training.
• In Camarines Sur, being late in IA meetings can cost the member ₱100 fine while an absent
official would have no honorarium for a month. The IA has also received one million pesos
from a Congressman and used the money to build a warehouse where the members of the
association can store their palay. The irrigators’ association has already eight awards.
• In Pampanga, by-laws have provisions for violation: first offense - ₱500; second offense –
no water delivery for the current season; third – dismemberment from the IA.
• In Laguna, 20% of the IA collection would be allotted for maintenance and operating
expenses of the system as well as the salaries of the collectors and gate keepers while the
rest would be allocated to the payment of the loan amortization. The Irrigators’ Association
has garnered a “Hall of Fame” award from the Land Bank of the Philippines.
• In Leyte, two IAs received recognition from NIA-R8 for being outstanding IA in 2017. The
collection rate of one IA is 100% with members paying on time receiving 5% discount
while the collector received 10% of the collection. Even before the passage of FISA, the
association was already fully paid on its financial obligation to NIA. Aside from association
service charge, the association also had other sources of income. They rented out their farm
equipment/machineries and sold certified seeds and commercial fertilizers to members and
non-members alike. They also strictly implement their by-laws particularly provisions on
water allocation and delivery: No water request, no water delivery. Violators were
penalized by ₱2,500 per hectare.
• When typhoon Yolanda hit Leyte, one of the irrigation systems was severely affected.
International organization like the International Labor Organization (ILO) provided
assistance to the IA through cash for work program and 100 m of lateral canal were lined
during the program. Excess money was used by the IA to purchase computer. The United
States Agency for International Development (USAID) also donated bodega, solar dryer
and the office of the association. They also received other farm equipment/machineries
from the Department of Agrarian Reform and the Italian government. Free seeds and
fertilizers were provided by the Department of Agriculture. The IA relied on other sources
of income like rentals of farm machineries including thresher, tractor and water pump, as
well as rentals of solar drier and storage. Sector leaders also waived their incentive in
collecting the irrigation fee in order to have adequate funds for the operation and
maintenance of the system.
• In Capiz, an IA implements “no receipt, no water” and “first come, first serve basis”
policies for water distribution and delivery, which they strictly implement earning a
collection rate of 100%. Members shoulder the fuel expense whenever they use the IA
pump for supplemental irrigation of their respective fields. The IA also received funding
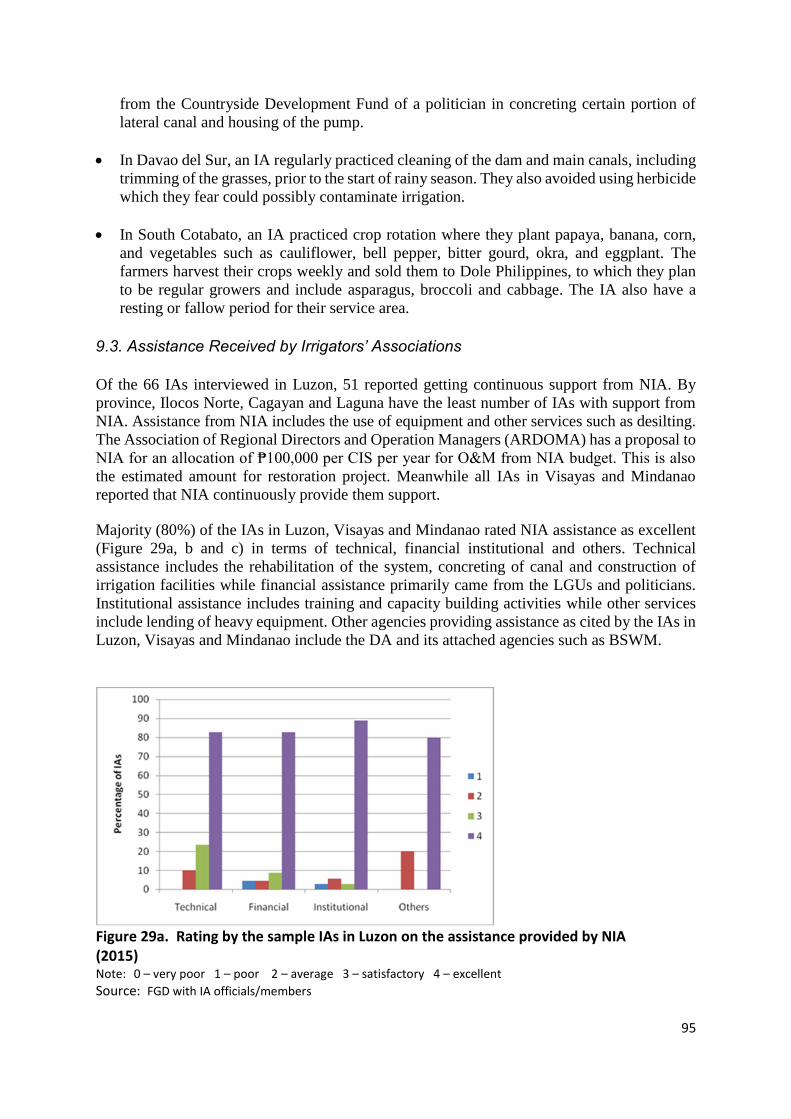
95
from the Countryside Development Fund of a politician in concreting certain portion of
lateral canal and housing of the pump.
• In Davao del Sur, an IA regularly practiced cleaning of the dam and main canals, including
trimming of the grasses, prior to the start of rainy season. They also avoided using herbicide
which they fear could possibly contaminate irrigation.
• In South Cotabato, an IA practiced crop rotation where they plant papaya, banana, corn,
and vegetables such as cauliflower, bell pepper, bitter gourd, okra, and eggplant. The
farmers harvest their crops weekly and sold them to Dole Philippines, to which they plan
to be regular growers and include asparagus, broccoli and cabbage. The IA also have a
resting or fallow period for their service area.
9.3. Assistance Received by Irrigators’ Associations
Of the 66 IAs interviewed in Luzon, 51 reported getting continuous support from NIA. By
province, Ilocos Norte, Cagayan and Laguna have the least number of IAs with support from
NIA. Assistance from NIA includes the use of equipment and other services such as desilting.
The Association of Regional Directors and Operation Managers (ARDOMA) has a proposal to
NIA for an allocation of ₱100,000 per CIS per year for O&M from NIA budget. This is also
the estimated amount for restoration project. Meanwhile all IAs in Visayas and Mindanao
reported that NIA continuously provide them support.
Majority (80%) of the IAs in Luzon, Visayas and Mindanao rated NIA assistance as excellent
(Figure 29a, b and c) in terms of technical, financial institutional and others. Technical
assistance includes the rehabilitation of the system, concreting of canal and construction of
irrigation facilities while financial assistance primarily came from the LGUs and politicians.
Institutional assistance includes training and capacity building activities while other services
include lending of heavy equipment. Other agencies providing assistance as cited by the IAs in
Luzon, Visayas and Mindanao include the DA and its attached agencies such as BSWM.
Figure 29a. Rating by the sample IAs in Luzon on the assistance provided by NIA (2015) Note: 0 – very poor 1 – poor 2 – average 3 – satisfactory 4 – excellent Source: FGD with IA officials/members

96
Figure 29b. Rating by the sample IAs in Visayas on the assistance provided by NIA (2018) Note: 0 – very poor 1 – poor 2 – average 3 – satisfactory 4 – excellent Source: FGD with IA officials/members
Figure 29c. Rating by the sample IAs in Mindanao on the assistance provided by NIA (2018) Note: 0 – very poor 1 – poor 2 – average 3 – satisfactory 4 – excellent Source: FGD with IA officials/members
9.4. Problems Encountered by Irrigators’ Association
Over 48% of the IAs in Luzon reported problems related to access to water in terms of quantity
and timeliness of delivery. This is related to the operation and management of the system as
well as access to funds needed for rehabilitation (Table 42). Similarly, in Visayas, access to
funds needed for rehabilitation was the issue raised by majority of IAs, followed by O&M. In
Mindanao, access to water and access to funds were equally important issue to the IAs. O&M
and access to credit were likewise aide by majority of IAs.
To supplement irrigation water supply particularly during dry spell, 34% of the IAs in Luzon
use shallow tube wells (STWs), low lift pumps (LLPs/OS), or deep wells, but the members
usually do this individually. IAs (25%) also adjust water scheduling or practice rotation in
0
10
20
30
40
50
60
70
80
90
100
Technical Institutional
Per
cen
tage
(%
)
1
2
3
4
0
10
20
30
40
50
60
70
80
90
100
Technical Institutional Others
Per
cen
tage
(%
) 1
2
3
4
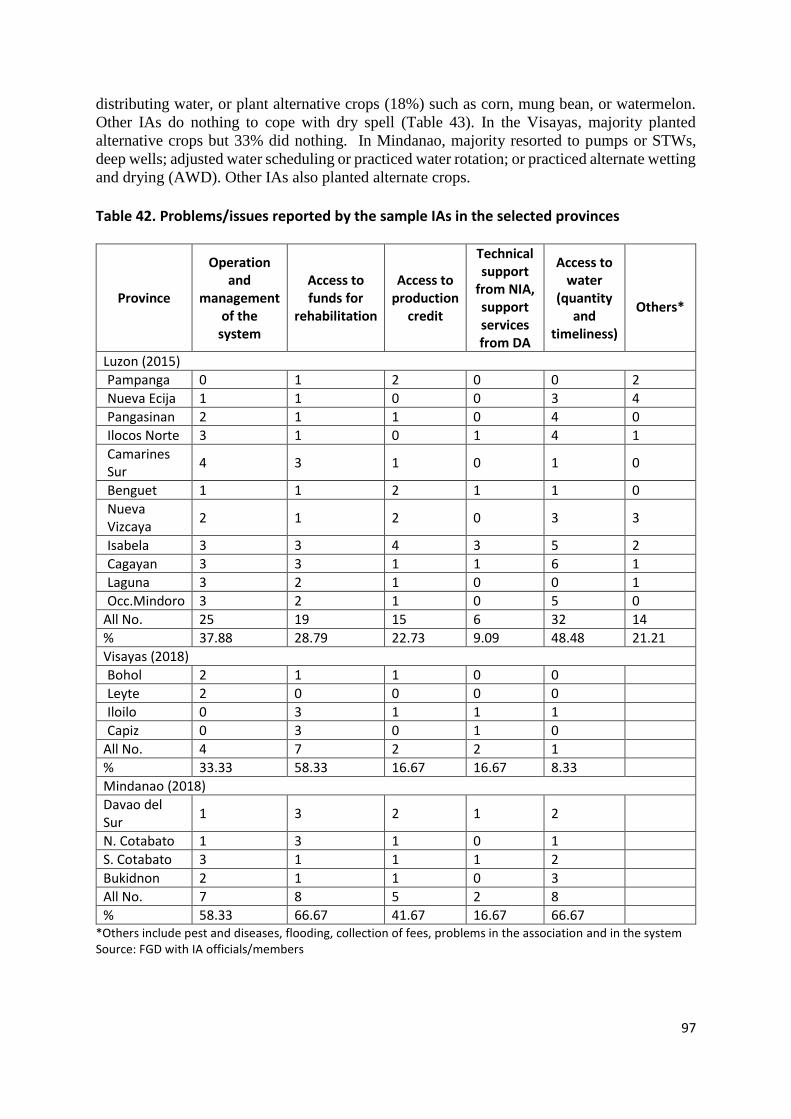
97
distributing water, or plant alternative crops (18%) such as corn, mung bean, or watermelon.
Other IAs do nothing to cope with dry spell (Table 43). In the Visayas, majority planted
alternative crops but 33% did nothing. In Mindanao, majority resorted to pumps or STWs,
deep wells; adjusted water scheduling or practiced water rotation; or practiced alternate wetting
and drying (AWD). Other IAs also planted alternate crops.
Table 42. Problems/issues reported by the sample IAs in the selected provinces
Province
Operation and
management of the
system
Access to funds for
rehabilitation
Access to production
credit
Technical support
from NIA, support services from DA
Access to water
(quantity and
timeliness)
Others*
Luzon (2015)
Pampanga 0 1 2 0 0 2
Nueva Ecija 1 1 0 0 3 4
Pangasinan 2 1 1 0 4 0
Ilocos Norte 3 1 0 1 4 1
Camarines Sur
4 3 1 0 1 0
Benguet 1 1 2 1 1 0
Nueva Vizcaya
2 1 2 0 3 3
Isabela 3 3 4 3 5 2
Cagayan 3 3 1 1 6 1
Laguna 3 2 1 0 0 1
Occ.Mindoro 3 2 1 0 5 0
All No. 25 19 15 6 32 14
% 37.88 28.79 22.73 9.09 48.48 21.21
Visayas (2018)
Bohol 2 1 1 0 0
Leyte 2 0 0 0 0
Iloilo 0 3 1 1 1
Capiz 0 3 0 1 0
All No. 4 7 2 2 1
% 33.33 58.33 16.67 16.67 8.33
Mindanao (2018)
Davao del Sur
1 3 2 1 2
N. Cotabato 1 3 1 0 1
S. Cotabato 3 1 1 1 2
Bukidnon 2 1 1 0 3
All No. 7 8 5 2 8
% 58.33 66.67 41.67 16.67 66.67 *Others include pest and diseases, flooding, collection of fees, problems in the association and in the system Source: FGD with IA officials/members
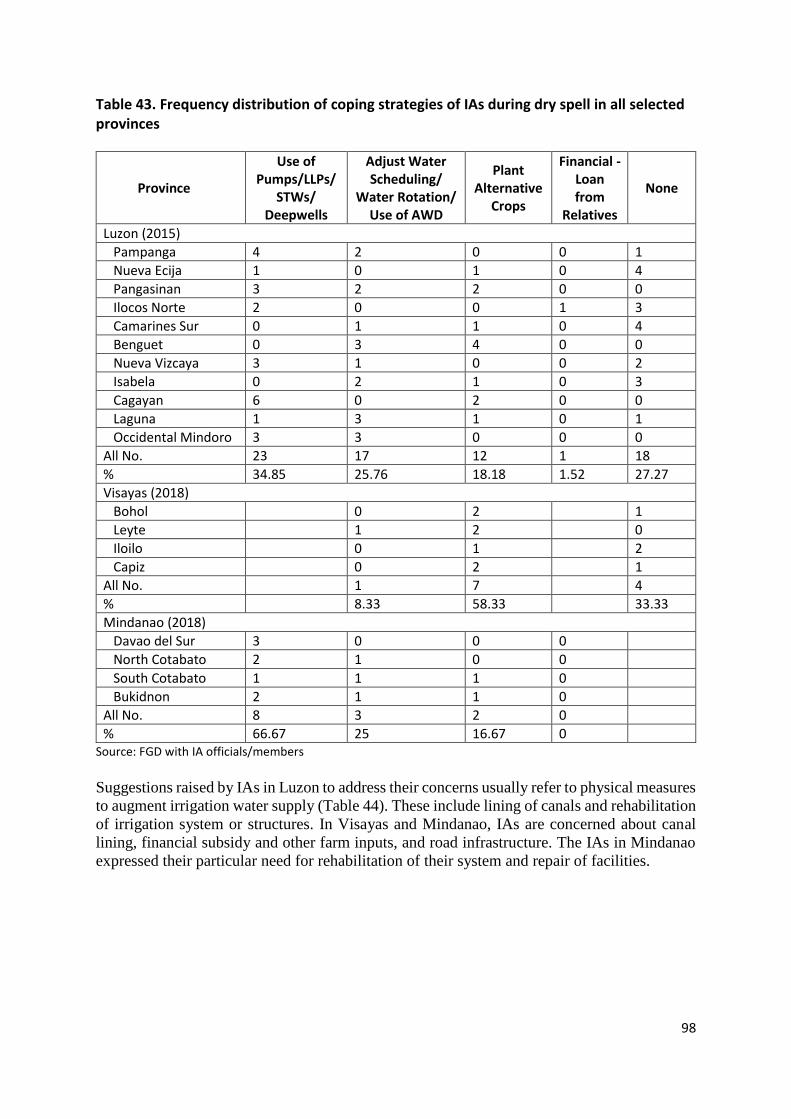
98
Table 43. Frequency distribution of coping strategies of IAs during dry spell in all selected provinces
Province
Use of Pumps/LLPs/
STWs/ Deepwells
Adjust Water Scheduling/
Water Rotation/ Use of AWD
Plant Alternative
Crops
Financial - Loan from
Relatives
None
Luzon (2015)
Pampanga 4 2 0 0 1
Nueva Ecija 1 0 1 0 4
Pangasinan 3 2 2 0 0
Ilocos Norte 2 0 0 1 3
Camarines Sur 0 1 1 0 4
Benguet 0 3 4 0 0
Nueva Vizcaya 3 1 0 0 2
Isabela 0 2 1 0 3
Cagayan 6 0 2 0 0
Laguna 1 3 1 0 1
Occidental Mindoro 3 3 0 0 0
All No. 23 17 12 1 18
% 34.85 25.76 18.18 1.52 27.27
Visayas (2018)
Bohol 0 2 1
Leyte 1 2 0
Iloilo 0 1 2
Capiz 0 2 1
All No. 1 7 4
% 8.33 58.33 33.33
Mindanao (2018)
Davao del Sur 3 0 0 0
North Cotabato 2 1 0 0
South Cotabato 1 1 1 0
Bukidnon 2 1 1 0
All No. 8 3 2 0
% 66.67 25 16.67 0 Source: FGD with IA officials/members
Suggestions raised by IAs in Luzon to address their concerns usually refer to physical measures
to augment irrigation water supply (Table 44). These include lining of canals and rehabilitation
of irrigation system or structures. In Visayas and Mindanao, IAs are concerned about canal
lining, financial subsidy and other farm inputs, and road infrastructure. The IAs in Mindanao
expressed their particular need for rehabilitation of their system and repair of facilities.

99
Table 44. Frequency distribution of sample IAs by suggestions to address their concerns
Province Additional
Pumps/ STWs
Construction of Steel Gates
Canal Lining
Financial Subsidy/
Farm Inputs/ Roads/
Siltation and
Dredging/ Providing
of Backhoe
Redesign/ Reroute/
Rehabilitate System/ Repair of
Structures
Soil Analysis
Luzon (2015)
Pampanga 1 0 3 2 0 4 0
Nueva Ecija
0 0 2 5 2 1 0
Pangasinan 0 0 3 1 1 1 0
Ilocos Norte
3 3 5 1 1 0 0
Camarines Sur
1 0 3 2 0 3 0
Benguet 0 0 0 2 0 5 0
Nueva Vizcaya
0 0 4 1 1 3 0
Isabela 1 0 3 1 1 5 0
Cagayan 3 0 4 0 2 1 1
Laguna 3 0 4 0 2 1 1
Occidental Mindoro
2 0 3 2 0 4 0
All No. 11 4 32 19 8 30 1
% 16.67 6.06 48.48 28.79 12.12 45.45 1.52
Visayas (2018)
Bohol 0 1 3 1 1 1 -
Leyte 0 0 2 1 0 0
Iloilo 1 0 2 3 0 2
Capiz 0 0 1 3 0 0
All No. 1 1 8 8 1 3
% 8.33 8.33 66.67 66.67 8.33 25
Mindanao (2018) Water Impounding
Trainings/ Seminars
Davao del Sur
1 0 1 3 0 1
North Cotabato
0 0 2 3 0 1
South Cotabato
0 0 1 3 1 1
Bukidnon 0 1 1 2 0 2
All No. 1 1 5 11 1 5
% 8.33 8.33 41.67 91.67 8.33 41.67 Source: FGD with IA officials/members

100
10. Emerging Issues and Concerns Based on interviews with the IA officers/members, the issues/problems relating to
organizational aspects generally confronting the IAs also affect the systems performance of the
CIS, and vice-versa. The following are some institutional issues that have to be considered or
addressed:
• CIS development remains dependent on government (i.e., NIA) assistance. CIS projects
were often in response to request/proposals/resolutions submitted by IAs, farmer
organizations, and LGUs to NIA (IMO) which, in turn, taps sources for funding. IAs’
awareness/knowledge, and institutional networking is crucial in enhancing CIS programs.
• Institutional development program of NIA for IAs where the role of IDO is very crucial
heavily relies on CIS project funding. IDOs have quite a heavy workload but are not getting
adequate incentives such as security of tenure and other benefits. Most often, IDOs are
hired on contractual/job order basis with salaries/wages drawn from CIS project budget.
The IDOs are most often the link between NIA and the IAs, thus if there is no CIS project,
this linkage would be affected.
• The passage of FISA relieves the IAs from paying the cost of their CIS. The sample IAs in
Visayas and Mindanao mostly stopped paying amortization but continued to collect fees
from their members for their CIS O&M. They now refer this collection to irrigation
management fee (IMF) or association service charge (ASC) ranging from ₱700 to
₱1,500/ha. The IAs have not received yet any subsidy (which is expected since CIS was
not covered in the 2017 GAA budget). However, there were IA members reluctant to pay
any fee citing the implementation of FISA.
• Ownership of CIS should be clarified. Before FISA, certificate of CIS ownership was
issued to the IA when it has fully paid the chargeable cost incurred in the construction of
the project. This implies that the CIS project is fully turned over to the IA. With FISA,
O&M and management of CIS shall be handed over to their respective IAs, referred to in
the past as physical turnover. In the case of new projects, another concern is to whom (IA
or NIA) should the water permit be issued.
• IA’s concerns in O&M and inadequate funds are persistent. FISA declared that O&M cost
shall be provided by the national government. Therefore, there should be clear guidelines
or provisions on this. For example, in the case of NIS, IA gets a compensation of Pl,750
per month for maintenance activities, based on canal section for a maximum of six (6)
months in a year. For operations-related responsibilities, the IAs/Federation will be paid
P150/ha per cropping of irrigated and planted areas.
• With the guideline that NIA shall continue to collect from IAs all back accounts or unpaid
ISF, amortization and equity payments before the effectivity of GAA 2017, key informants
reported some difficulty in collecting this from IAs.
• Problems of sustainability of irrigation infrastructure loom due to persistent environmental
problems (watershed degradation, siltation, extreme climate-related events). IAs apparently
have none or limited role in watershed management but these can serve as partners in
watershed management programs. For example, Irrigation committees may be formed
101
within sub/watershed management councils where IAs may express their concerns. This
again depends on the leadership of the IAs, social capital, the capability to establish
networks; and assistance to IAs in establishing linkages.
• Climate change poses challenges on dealing with either ‘too much’ or ‘too little’ water.
Management of agricultural water should incorporate the judicious use of water resources
and engineering measures.
• Devolution of CIS to LGU is rarely implemented because of the apparent lack of interest
of the LGU, low priority for agriculture/irrigation, or lack of capacity (financial, technical,
human resource) to operate and manage CIS. With FISA, the provision that the equity
requirement for CIS projects with LGU participation will be maintained with the concerned
LGU, may further dampen the interest of LGUs in engaging in CIS development.
• There is no distinct pattern based on size of FUSA on the performance of CIS and
functionality of IAs. Rather than size of the CIS service area, more crucial is the capacity
of each IA to harness its organizational capacity to build human, financial, social capital,
thus, the need for continuous capacity building. IAs would need to enhance its institutional
linkage to solicit support.
• FISA maintains the significant role of NIA in providing technical support to IAs and in
building IAs’ capacity to sustain their functionality. Thus, linkage between NIA and IAs
should be sustained.
11. Conclusions and Recommendations The study covered 66 CIS from 11 provinces (IMOs) in Luzon, 12 CIS from 4 provinces in the
Visayas and 12 CIS from 4 provinces in Mindanao. The selection considers the size of service
area, technology (gravity/pump), and operational status of CIS. Within this sample, at least two
CIS in Luzon, and all CIS selected in Visayas and Mindanao, were selected for actual
walkthroughs.
Majority of the CIS have run-of-the river type gravity irrigation systems except in Cagayan,
Isabela and Camarines Sur where more than 50% of the systems are pump irrigation systems.
There are no PIS selected in Leyte and no actual CIS using pumps in the selected provinces in
Mindanao. It was also found out that some CIS are in rice areas with slope greater than 3%,
particularly in areas outside large NIS like the UPRIIS and MARIIS. In Benguet, the slopes
were even greater than 50% but most of these irrigation systems are devoted to vegetables and
ornamentals. This information is quite useful since the expansion of the irrigation base may
come from these small patches of lands to be irrigated by small scale irrigation systems like
CIS, SWIPs and STWs. Related to this, there is a need to reevaluate the definition of potential
irrigable areas for new irrigation development areas, to include the assessment of water supply
sources, suitability of the soil to different crops, and comprehensive land use plans of the local
government units.
In as much as many CIS service areas are above 0-3% slope, it is recommended that all areas
within 8% slope minus the built-up and other protected areas can be considered as potential
irrigable area for CIS. A second but equally important criteria is the presence of a dependable

102
surface water source and a good shallow aquifer, which may be used as supplemental water
supply. A third criteria is soil texture and its suitability to different type of crops, which would
support crop diversification as provided in the recently signed Rice Tariffication law. Paddy
rice is most suitable on clayey soils where percolation losses are low. Sandy soils are not
recommended due to the high infiltration rate and percolation losses will be high.
One of the main reasons for the low performance of irrigation systems is the lack of water
during dry season. Sources of water of the CIS visited are: lakes, rivers, creeks, springs, ground
water, runoff or a combination of two or more of these sources. Some rivers are large and have
adequate flows that can irrigate crops even during the dry seasons, while some rivers have very
low dry season flows. Most creeks have adequate flows for small areas during wet season but
have very low or at times no flow during dry season. Only 29 of the 90 surveyed CIS (32%)
have river sources capable of providing irrigation during dry seasons. Seven of these rivers are
very large and provide water even for large NIS. However, unreliable water supply is a major
problem for majority of the CIS who tap water from less dependable small rivers and creeks,
as well as springs and runoff.
Watershed Management and environmental studies are important consideration in engineering
design and feasibility study of irrigation projects. The degradation of the watershed due to
human activities and other factors is deemed to be one of the reasons for the unstable water
resource for irrigation. In constructing new or rehabilitating old CIS, the water source should
be carefully assessed in terms of dependable flow, catchment conditions and sediment
discharges. Empirically derived flows should also be reviewed, with special consideration on
the effect of climate change. As much as possible, small creeks with dubious historical records
should be avoided as water source, or at the very least, an alternative source like groundwater
should be available.
On the problem of water supply sources, there should be a concerted and united effort on the
part of concerned government agencies like NWRB, NIA, BSWM, and the academe to identify
potential sites for diversion dams and storage reservoirs. A set of criteria for site selection
should be formulated and maps of potential sites should be generated. In rivers with high wet
season flows and low dry season dependable flows, construction of storage or reservoir dams
is a viable long-term solution to mitigate the problem of seasonal irrigation and help improve
the reliability of irrigation water supply, however, they should be economically,
environmentally, socially and technically feasible. For example, small dams with crest height
not exceeding 15 m would probably be more viable than large multipurpose dams, as they pose
less risks to the environment and ecosystem, and thus more socially acceptable.
The estimation of dependable (low) water supply and flood (high) discharges for rivers,
potentially viable for reservoir and/or diversion dams, is very important. Streamflow data
should be checked for consistency and reliability, including the effect of changing land use and
climate change on the inflow and flood hydrographs. Moreover, hydrologic data acquisition
and monitoring should be improved. Although, this is currently being done with the
coordinated efforts of Project NOAH (Nationwide Operational Assessment of Hazards) of the
Department of Science and Technology (DOST) and the Department of Public Works and
Highways (DPWH), this should be expanded to smaller rivers and creeks. Possible source of
baseline data are the River Basin Master Plans commissioned by the RBCO for the 18 major
river basins and other clustered watersheds. Most of these plans have water supply and water
demand projections using new climate change scenarios from PAGASA which can be useful
in identifying new potential sites for irrigation development.
103
There is also a need to delineate areas served by NIS and CIS, as well as those served by minor
irrigation systems (e.g. SWIP, SFR, STW). In line with this, we should identify areas where
surface water and groundwater sources are technically feasible. Recently, the BSWM started a
project aimed at identifying and delineating potential sites for small scale irrigation systems.
The Phil-LiDAR 2 Project 1 (Agricultural Resources Assessment using LiDAR and other RS
Data) of UP Diliman has also embarked on a nationwide endeavor to establish baseline
inventory of resources. This entails high resolution mapping of agricultural, aquaculture and
forest resources, as well as, establishing hydrologic datasets for flood modeling to generate risk
maps and early warning systems. These maps may be used to finally establish the total irrigable
areas in the country and help identify and zone areas where various modes of irrigation are
feasible. The hydrologic data may also be used to establish dependable flows for dam or
reservoir design and in the estimation of irrigation command area.
With the current NWRB setup, they have limited capability and manpower to do these. The
shelved proposal for the institution of the National Water Resources Management Office under
the Office of the President should be revived and reformulated. Whether this would be a
Department of Water Resources or a reinvigorated NWRB acting as a water super body under
the Office of the President, is up for debate based on different merits, but it has to be
conceptualized and established as soon as possible. The institution of Water Resources Centers
in selected state colleges and universities (SCUs), who can continuously gather, analyze and
manage water resources data would be significant in building hydrologic database. All
accumulated water resources data should be housed in a database center within the proposed
super body.
The practice of supplementing irrigation from surface sources with groundwater from STWs
should be encouraged especially for areas where the surface water sources (i.e., creeks) have
very low dependable discharges during the dry season and for areas underlain by good shallow
aquifers. In most of the CIS visited, farmers resort to the conjunctive use of surface water from
their CIS and groundwater from STWs. The size of the centrifugal pumps commonly used for
STWs and LLPs are 3”x 3” or 4”x 4”. They are usually driven by 8 – 12 Hp water-cooled diesel
engines. While using STW pumps and engines incurs additional fuel costs, they provide
reliable water source during intense drought periods or El Niño episodes. Moreover, farmers
have control of irrigation schedules and flows enabling some of them to increase cropping
intensity or diversify into other crops. Some NIA IMOs have already installed standby STWs
which they only use during periods of prolonged droughts. The practice of using STWs to
supplement irrigation from CIS should be encouraged even at the farmer’s own initiatives. This
is not only as a short-term solution to improve the cropping or irrigation intensity but also to
encourage crop diversification. NIA and DA is already reviving slowly their STW irrigation
plan. This is logical since groundwater are the last to be depleted water supply sources.
Sedimentation is one of the main problems that cause canal deterioration and decrease in water
yield during dry season. Lahar is the major source of sediments in some CIS in Pampanga.
Several operational lapses, including full opening of intake gates and closing of sluice gates to
maximize water intake during high sediment inflows also contribute to increased
sedimentation. Despite the high sedimentation rate, the IAs rated low silt level grade and
undesired seepage grade in their canals. These are because the IAs regularly conduct cleaning
of the canals since CIS canals are small and manageable compared to NIS. To reduce future
rehabilitation works due to desilting, provision of silt control devices, either on the head works
or on main or lateral canals, should be included in the design, especially for sediment laden
104
rivers or creeks. Estimation of sediment discharge should also be included in the feasibility
study, in light of the escalating erosion of our watersheds.
There are some technical issues/problems that generally confronts the IAs and the performance
of their CIS. Most run-of-the-river type dams are quite old, some with exposed rock cores,
damaged spillways, and with sediments almost at the crest level. Most of the sluice gates and
intake gates that are usually made of steel are now replaced with flashboards, sand bags or
stones and in some CIS, the lifting mechanisms are defective. These problems also contribute
to increased sedimentation. A positive aspect is that most CIS visited have concrete-lined main
canals and some up to the laterals. In general, the good conditions of the lined and unlined
canal networks are due to the IA themselves having good O&M and cleanup mechanisms. In
some cases, heavy siltation is experienced due to watershed degradation and mining
concessions, and in such cases major policy/governance solutions are required.
Cross regulators, check gates, drop structures, division boxes and farm turnouts are some of
the structures found in CIS visited. Some are well maintained, while others have deteriorated
and the control structures are not fully functional. Some cross or check regulators may be
initially intended to measure discharges, but there are no more staff gages to measure water
levels and the rating curve are either missing or not calibrated. Other miscellaneous or
appurtenant structures that are commonly found in all the CIS include road and thresher
crossings, end checks and service roads. Most service roads are in bad conditions with most
dams accessible only by walking or by motorcycles
In the case of rehabilitation work, existing systems must be checked for design shortcomings
and relate these to the operation and maintenance of such systems. The design shortcomings of
several dams, specifically the Anao CIS, Cordero CIS and San Angel SRIP should be reviewed
to avoid such mistakes in the future. These shortcomings included underestimation of flood
flows and sediment loads, inadequate provisions for sediment control and underestimation of
reservoir inflow and outflow hydrographs. Generally, the dams and control structures should
be properly maintained and repaired to ensure proper water control and distribution. The dam
storage area should be regularly cleared of sediments to increase storage capacity and thus
extend irrigation even with diminished river flows. This should be part of regular operation and
maintenance activities of the IAs. If heavy equipment is necessary, NIA should extend help to
the IAs.
As in most irrigation systems, there are no specific drainage canals at the CIS. Normally, the
downstream farm ditches receive the excess water from paddies, which is sometimes used to
irrigate downstream areas. Water distribution downstream is usually from paddy to paddy,
without individual farm ditch for each paddy, contributing to large application losses. This
factor should be taken into consideration in the design criteria to avoid gross underestimation
of on farm water losses, which in turn result to the over estimation of design service areas.
In CIS where the dry season flow cannot support anymore the dry season irrigation
requirements, the IA may consider crop diversification, like planting non-rice crops or crops
requiring less water, particularly in areas at the tail-end of the system. If rice is still preferred,
direct seeding should be considered to minimize water use from conventional land soaking and
land preparation. To address low irrigation efficiency, IA capacity development and the
introduction of new water saving technologies such as alternate wetting and drying (AWD)
should be promoted and/or sustained. Provision for rotational irrigation should also be

105
incorporated in the design of canal system, with more checks or control gates for more efficient
water distribution.
The operation and maintenance of CIS is turned over to IAs upon project completion. While
more IAs believe that they receive the required volume of water at the right time, there are still
frequent delays and inequitable flow distribution, which showed a need for improvement in the
water management of all the CIS. The IAs generally have high regards for their systems in
terms of water delivery, flexibility, reliability and equitability. Moreover, the IAs rated
themselves high in terms of water distribution, and the maintenance of canals and control
structures. These results indicate that the IAs are satisfied with their water delivery system.
While these results may be biased, they may also indicate the high relative impact of NIA to
the CIS farmers.
Common suggestions raised by IAs to address problems in their systems usually refer to
physical measures including lining of canals and rehabilitation of irrigation system or
structures. Generally, rehabilitation connotes lining of canals, but concreting of canals is
actually impractical if the soil is clayey. With the availability now of low-cost high-density
polyethylene pipes (HDPE), we believe that it is about time to look into the feasibility of using
these materials for subsurface canals instead of concreting open channels to convey irrigation
to the fields. The high initial cost may be offset by several factors including: (a) less O&M cost
due to less rubbish and sediments in the system, (b) more areas for planting (since the canal is
buried underground with risers to distribute water to farm ditches), (c) less costs for right of
way acquisitions, (d) less seepage and percolation losses, so higher conveyance efficiency and
more equitable water distribution, (e) easier water control in terms of command and flow, (f)
more applicable for sprinkler systems and crop diversification. Of course, aside from the high
initial costs, the pipes may be used as den or hiding place for rats which may cause clogging
problems. A more sophisticated trash rack or sediment control at the intake is also needed to
prevent clogging. Drain holes and repair vents are also needed at key locations in the systems,
which again increases the investment cost.
With regards to the Free Irrigation Service Act, further clarification on its implementation on
CIS is needed. This includes the following:
There should be clear guidelines on the provision of O&M cost by the national government,
such as in the case of NIS where IA gets some compensation based on O&M responsibilities.
There is also the need to address collection of from IAs all back accounts or unpaid ISF,
amortization and equity payments before the effectivity of GAA 2017. IAs believe their loans
are already condoned with the passage of FISA.
Guidelines on ownership of CIS should be clarified. Before FISA, there is a complete turnover
of CIS to the IA. With FISA, it is apparently management turnover. In the case of new projects,
another concern is to whom (IA or NIA) should the water permit be issued.
The policy on devolution of CIS to LGUs needs to be revisited as this is rarely taking place.
FISA may further dampen the interest of LGUs in engaging in CIS development as they are
still required to pay the equity requirement.
106
12. Members of the CIS Team Dr. Roger A. Luyun, Jr., CEAT, UPLB
Ms. Dulce D. Elazegui, CPAf, UPLB
Ms. Mae Marie Garcia, CEAT, UPLB
Mr. Francis John F. Faderogao, CPAf, UPLB
13. Bibliography Araral, E. 2005. Bureaucratic incentives, path dependence, and foreign aid: An empirical
institutional analysis of irrigation in the Philippines. Policy Sciences 38:131-157.
Burt, C. and S. Styles. 1998. Modern Water Control and Management Practices in Irrigation:
Impact on Performance. Report prepared for the World Bank Research Committee.
(October).
Cruz, M.C.J. 1983. Social and Institutional Factors in Differential Access to Canal irrigation:
A Study of Philippine Communal System, University of Wisconsin-Madison, PhD
thesis.
David, W.P. 2003. Averting the Water Crises in Agriculture: Policy and Program Framework
for Irrigation Development in the Philippines. University of the Philippines Press,
Diliman, Quezon City.
David, W.P. 2009. Impact of AFMA on irrigation and irrigated agriculture. Philipp Agric
Scientist 91 (3):315–328.
Department of Environment and Natural Resources, River Basin Control Office. 2012.
Formulation of Integrated Cagayan River Basin Management and Development Master
Plan. Final Report. Volume 2, Main Report.
FAO Aquastat. Philippines. 2011. Irrigation in Southern and Eastern Asia in figures –
AQUASTAT Survey – 2011
http://www.fao.org/nr/water/aquastat/countries_regions/PHL/PHL-CP_ eng.pdf
Facon, T. and A. Mukherji. 2010. Small-scale Irrigation: Is This the Future? Paper presented
at the Water Crisis and Choices, ADB and Partners Conference, ADB HQ, Manila,
Philippines, 11-15, October 2010.
Huppert, W. 2013. Viewpoint - Rent-Seeking in Agricultural Water Management: An
Internationally Neglected Core Dimension? Water Alternatives. 6(2): 265-276.
Japan International Cooperation Agency (JICA). 2011. The study on integrated water resources
management for poverty alleviation and economic development in the Pampanga river
basin in the Republic of The Philippines (Vol 2). National Water Resources Board.

107
Laguna Lake Development Authority. 1995. Laguna de Bay Master Plan. Final Report.
Molden, D.J. and Gates T.K. 1990. Performance measures for evaluation of irrigation-water
delivery systems. Journal of Irrigation and Drainage Engineering, Vol. 116, No.6,
November/ December. 804-823.
Murray-Rust, D. H., and W. B. Snellen. 1993. Irrigation system performance assessment and
diagnosis. (Jointly published by IIMI, ILRI, IHE), Colombo, Sri Lanka: International
Irrigation Management Institute.
National Irrigation Administration (NIA). 2013. Irrigation Development Milestone for
National and Communal Irrigation Systems and Projects.
NIA. Brochure on NIA’s support to the Food Staple Sufficiency Program (FSSP). Downloaded
from nia.gov.ph
National Water Resources Council (NWRC). 1980. Philippine Water Resources Summary
Data. Vol. 1. Streamflow and Lake or River Stage.
Orient Integrated Development Consultants Incorporated. 2014. Formulation of an Integrated
Bicol River Basin Management and Development Master Plan. Comprehensive Report
on Review of Literature (Revised).
Ostrom, E. 1994. Neither market nor state: Governance of common-pool resources in the
twenty-first century. IFPRI lecture series. Washington D.C.: International Food Policy
Research Institute. Downloaded from:
https://monoskop.org/images/d/d8/Ostrom_Elinor_Neither_Market_Nor_State_Gover
nance_of_Common-Pool_Resouces_in_the_21st_Century.pdf
Ostrom, E. 1992. Crafting institutions for self-governing irrigation systems. Institute for
Contemporary Studies, San Francisco.
Renault, D., Facon, T., Wahaj, R. 2007. Modernizing irrigation management – the
MASSCOTE approach. FAO Irrigation and Drainage Paper 63. FAO Rome.
Repetto, R. 1986. Skimming the water: Rent-seeking and the performance of public irrigation
systems. World Resources Institute Research Report No. 4. Washington, DC: World
Resources Institute
Republic Act No. 7160. Local Government Code of 1991. Official Gazette. Congress of the
Philippines. Republic of the Philippines.
Republic Act No. 8435. Agriculture and Fisheries Modernization Act of 1997. Official Gazette.
Congress of the Philippines. Republic of the Philippines.
Wade, R. 1982. The system of administrative and political corruption: Canal irrigation in South
India. Journal of Development Studies 18(3): 287-328. Barker R. and F Molle. 2004.
Irrigation Management in Rice-Based Cropping Systems: Issues and Challenges in
Southeast Asia, Downloaded from: ww.fftc.agnet.org/library.php?func=view&id=
20110722052543. Downloaded Oct 4, 2018.

108
World Bank. 1982. World Bank Staff Appraisal Report on the Philippines Communal Irrigation
Development Report. Report No. 3850-PH.
World Bank. 1990. World Bank Staff Appraisal Report for a Second Communal Irrigation
Development. Report No. 8724-PH.
World Bank.1992. Project Completion Report on the Philippines Communal Irrigation
Development Report. Report No. 11512.
World Bank. 1992. Implementation Completion Report for a Second Communal Irrigation
Development. Report No. 20214.
109
14. Glossary of Terms Communal irrigation systems (CIS) – small-scale irrigation system serving an area of less
than 1,000 hectares. CIS are usually run-off-the-river type dams designed and constructed by
the NIA with the participation of farmer-beneficiaries through the IAs.
Irrigators Association (lA) – an associations of irrigation water users organized and
developed by NlA at the various levels of an irrigation system (e.g. NIS, CIS) to include but
not limited to primary lAs, Council of lAs, Federation of lAs, Confederation of lAs, and
Irrigation Service Cooperatives (ISC).
lA Federation – an amalgamation of lAs within a lateral, stretch of main canal, or the entire
irrigation system serving as a centralized group but having internal autonomy in each IA.
Design service area – the estimated area covered within the jurisdiction of the irrigation
system or lA, as the case may be.
Firmed-up service area (FUSA) – the actual service area with irrigation facilities. FUSA is
usually lower than design area because it no longer includes areas with higher elevation,
convertible areas but which landowner does not want to be converted.
Cropping intensity – the ratio of area irrigated to the FUSA (or design area in some cases) of
the CIS. Annual cropping intensity could also be the ratio of area irrigated during the dry and
wet seasons to the area irrigated during the wet season expressed in percentage. According to
NIA (Camarines Sur IMO), cropping intensity should be 130%, i.e., 100% for wet and 30%
for dry season. Thus, with irrigation, it should be more than 130%.
Functionality Assessment – a systematic evaluation to establish an lA functionality in
organizational, O&M and financial aspects the result of which is used in determining the lA’s
readiness for irrigation management.
Operation (0) – the activities involved in diverting water from the source and conveying and
distributing it to the point of application in the farmers' fields. The principal tasks in operation
are 1) preparation of cropping calendar and schedule of farming activities, 2) measurement of
water requirements and supply, 3) conveyance and distribution of available water to headgates
of lateral canals, 4) distribution of water to turnouts, 5) application of water to farm plots, and
6) drainage of excess water from fields.
Maintenance (M) – the activities undertaken for keeping the irrigation system in good
operating condition at all times within the limitations of available resources to attain maximum
use and economic life of the system facilities. The principal tasks in maintenance are: 1)
routine maintenance that include removal of silt at flow measuring devices, clearing of floating
debris accumulated at the crests of proportioning and duckbill weirs, remedial repairs to
minimize leakage from control gates and check structures, remedial measures to prevent
overtopping of canal embankments, greasing or oiling of gates; and 2) periodic maintenance
that include cutting of vegetation from canal embankments, and reshaping and cleaning canal
prism.
110
Collection efficiency – the ratio of actual amortization collection (current account +back
account) to the estimated amortization collectibles expressed in percent. Current account is the
dues for the current year and back account refers to past dues (NIA reports).
Irrigation projects may be new, rehabilitation, improvement, or restoration projects (CIS
Manual).
New projects are proposed for areas without any or comparatively little irrigated area.
Rehabilitation projects are proposed to restore damaged or deteriorated facilities of existing
irrigation systems to their original condition without adding new works or increasing the
service area.
Improvement projects are for the purpose of adding new works for increasing service area or
increasing performance of existing systems.
111
15. List of Acronyms AFMA Agriculture and Fisheries Modernization Act
ASC Association Service Charge
BOT Board of Director
BOT Board of Trustee
CDA Cooperative Development Authority
CIS Communal Irrigation System
CI Cropping intensity
DA Department of Agriculture
DAR Department of Agrarian Reform
FGD Focus Group Discussion
FISA Free Irrigation Service Act
FUSA Firmed Up Service Area
GAA General Appropriations Act
GIS Geographic Information System
GOCC Government Owned and Controlled Corporations
IA Irrigators’ Association
ISF Irrigation Service Fee
IDD Institutional Development Division
IDO Institutional Development Officer
ILO International Labor Organization
IMO Irrigation Management Office
IMT Irrigation Management Transfer
IRR Implementing Rules and Regulations
ISF Irrigation Service Fee
KII Key Informant Interview
LGU Local Government Unit
LLP Low Lift Pump
MC Memorandum Circular
MOA Memorandum of Agreement
MOOE Maintenance and Other Operating Expenses
NGO Non-Government Organization
NIA National Irrigation Administration
NIS National Irrigation System
NWRB National Water Resources Board
PIS Pump irrigation system
O&M Operation and Management
OSP Open Source Pump
PD Presidential Decree
PIMO Provincial Irrigation Management Office
PO Peoples' Organization
POW Program of Work
PPP Public-Private Partnership
RA Republic Act
RIO Regional Irrigation Office
SA Service Area
SDD Small Diversion Dam
SEC Securities and Exchange Commission

112
SFR Small Farm Reservoir
SRIS Small Reservoir Irrigation System
SSIP Small Scale Irrigation Project
STW Shallow Tube Well
SWIP Small Water Impounding Project
SWISA Small Water Impounding System Association
TOR Terms of Reference
USAID United States Agency for International Development
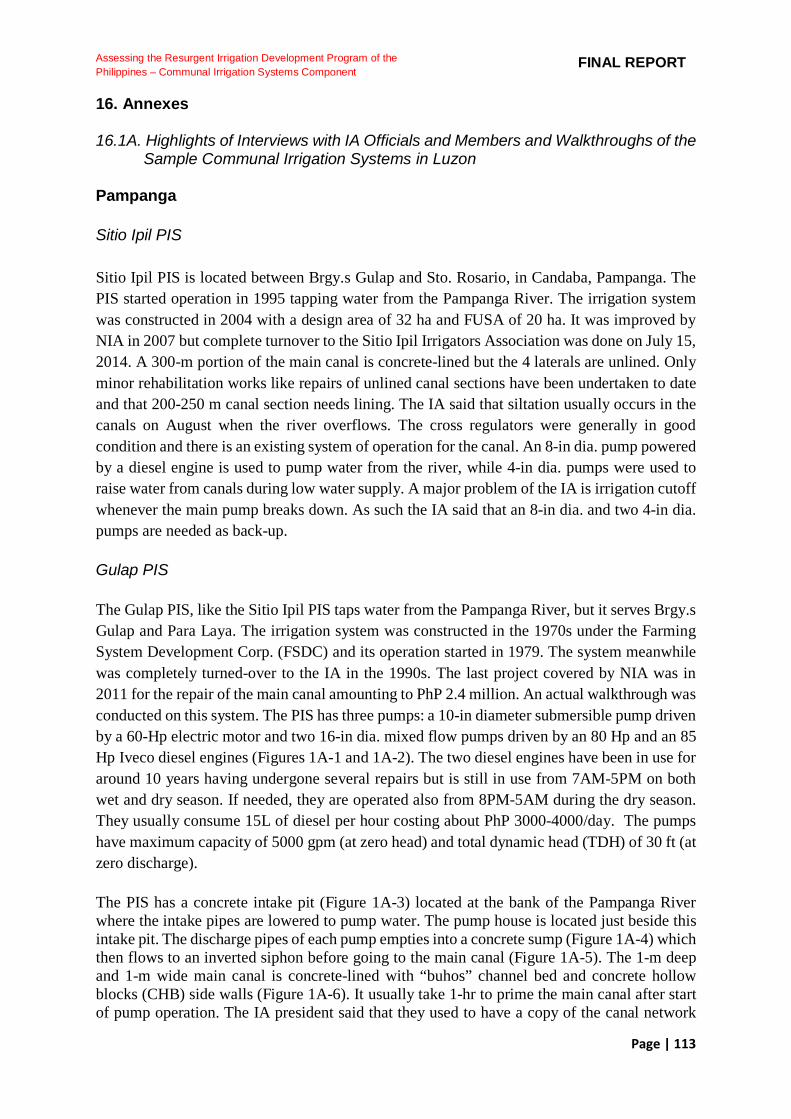
Page | 113
Assessing the Resurgent Irrigation Development Program of the
Philippines – Communal Irrigation Systems Component FINAL REPORT
16. Annexes 16.1A. Highlights of Interviews with IA Officials and Members and Walkthroughs of the Sample Communal Irrigation Systems in Luzon Pampanga
Sitio Ipil PIS Sitio Ipil PIS is located between Brgy.s Gulap and Sto. Rosario, in Candaba, Pampanga. The PIS started operation in 1995 tapping water from the Pampanga River. The irrigation system was constructed in 2004 with a design area of 32 ha and FUSA of 20 ha. It was improved by NIA in 2007 but complete turnover to the Sitio Ipil Irrigators Association was done on July 15, 2014. A 300-m portion of the main canal is concrete-lined but the 4 laterals are unlined. Only minor rehabilitation works like repairs of unlined canal sections have been undertaken to date and that 200-250 m canal section needs lining. The IA said that siltation usually occurs in the canals on August when the river overflows. The cross regulators were generally in good condition and there is an existing system of operation for the canal. An 8-in dia. pump powered by a diesel engine is used to pump water from the river, while 4-in dia. pumps were used to raise water from canals during low water supply. A major problem of the IA is irrigation cutoff whenever the main pump breaks down. As such the IA said that an 8-in dia. and two 4-in dia. pumps are needed as back-up.
Gulap PIS The Gulap PIS, like the Sitio Ipil PIS taps water from the Pampanga River, but it serves Brgy.s Gulap and Para Laya. The irrigation system was constructed in the 1970s under the Farming System Development Corp. (FSDC) and its operation started in 1979. The system meanwhile was completely turned-over to the IA in the 1990s. The last project covered by NIA was in 2011 for the repair of the main canal amounting to PhP 2.4 million. An actual walkthrough was conducted on this system. The PIS has three pumps: a 10-in diameter submersible pump driven by a 60-Hp electric motor and two 16-in dia. mixed flow pumps driven by an 80 Hp and an 85 Hp Iveco diesel engines (Figures 1A-1 and 1A-2). The two diesel engines have been in use for around 10 years having undergone several repairs but is still in use from 7AM-5PM on both wet and dry season. If needed, they are operated also from 8PM-5AM during the dry season. They usually consume 15L of diesel per hour costing about PhP 3000-4000/day. The pumps have maximum capacity of 5000 gpm (at zero head) and total dynamic head (TDH) of 30 ft (at zero discharge). The PIS has a concrete intake pit (Figure 1A-3) located at the bank of the Pampanga River where the intake pipes are lowered to pump water. The pump house is located just beside this intake pit. The discharge pipes of each pump empties into a concrete sump (Figure 1A-4) which then flows to an inverted siphon before going to the main canal (Figure 1A-5). The 1-m deep and 1-m wide main canal is concrete-lined with “buhos” channel bed and concrete hollow blocks (CHB) side walls (Figure 1A-6). It usually take 1-hr to prime the main canal after start of pump operation. The IA president said that they used to have a copy of the canal network

Page | 114
Assessing the Resurgent Irrigation Development Program of the
Philippines – Communal Irrigation Systems Component FINAL REPORT
map of the PIS but this was borrowed by an NGO and it has not been returned. The turnouts to distribute water to the laterals are usually through control gates made of wooden slabs. The laterals are unlined but the IAs are planning to and are actually requesting to the LGUs that the laterals be lined. Three water tenders are employed to implement irrigation schedules, manage water distribution and operate turnout gates. The main canal are well maintained and the control structures, consisting of slots for wooden slabs are functional, but some slabs are already old and needs replacement. There are several fishponds in the area growing tilapia with a different payment on a per hour basis. The IA stated that the main problem of the PIS is flooding when Pampanga River overflows during rainy season submerging the crops as well as causing siltation on the intake pit of the pumps. However, the main canal has little siltation during the time of visit, indicating good maintenance from the IAs. But there are also delinquent farmers who do not pay their ISFs, as well as farmers who are reportedly stealing water. Even if the water discharged by the pumps are high, some parts of the system gets low water supply due to the large FUSA. In order to solve this problem, NIA together with a planned resolution from the IA, plans to include the tail-end portion of the CIS to the Pampanga Delta irrigation system. The IA reportedly does not pay amortization. They also have not been paying water permit to the NWRB and are not renewing their SEC registration anymore. The IA suggests farm to market roads, as well as the cementing the rest of their main and lateral canals.
Figure 1A-1. The two 16” dia. mixed flow pumps (one is being repaired); at the foreground
is the 10” dia. pipe of the submersible pump Source: Author’s capture
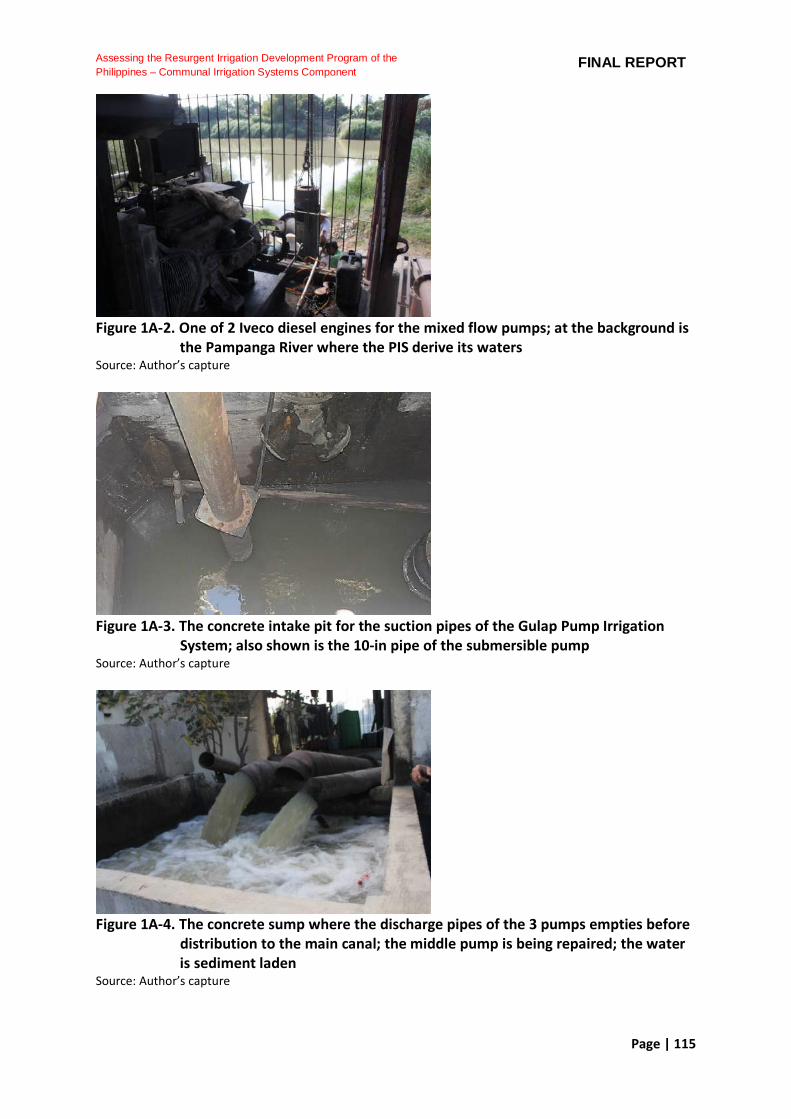
Page | 115
Assessing the Resurgent Irrigation Development Program of the
Philippines – Communal Irrigation Systems Component FINAL REPORT
Figure 1A-2. One of 2 Iveco diesel engines for the mixed flow pumps; at the background is
the Pampanga River where the PIS derive its waters Source: Author’s capture
Figure 1A-3. The concrete intake pit for the suction pipes of the Gulap Pump Irrigation
System; also shown is the 10-in pipe of the submersible pump Source: Author’s capture
Figure 1A-4. The concrete sump where the discharge pipes of the 3 pumps empties before
distribution to the main canal; the middle pump is being repaired; the water is sediment laden
Source: Author’s capture
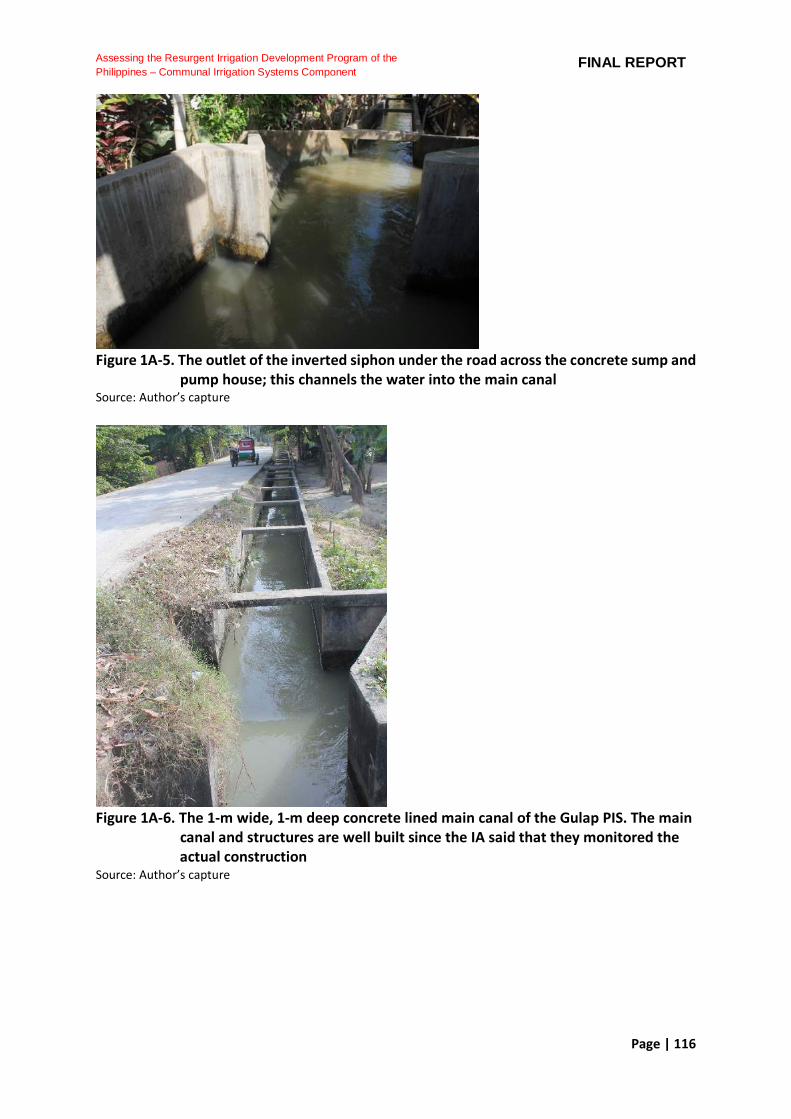
Page | 116
Assessing the Resurgent Irrigation Development Program of the
Philippines – Communal Irrigation Systems Component FINAL REPORT
Figure 1A-5. The outlet of the inverted siphon under the road across the concrete sump and
pump house; this channels the water into the main canal Source: Author’s capture
Figure 1A-6. The 1-m wide, 1-m deep concrete lined main canal of the Gulap PIS. The main
canal and structures are well built since the IA said that they monitored the actual construction Source: Author’s capture

Page | 117
Assessing the Resurgent Irrigation Development Program of the
Philippines – Communal Irrigation Systems Component FINAL REPORT
Figure 1A-7. (a) A typical control structure combining a turnout (using wooden slabs), a drop
and a road crossing; (b) one of several fishponds being served by the PIS; (c) a typical unlined lateral; (d) continuation of the concrete-lined main canal with control structure combining turnout (wooden slabs) and drop structure; (e) the end check of the main canal, from here on the canals are unlined.
Source: Author’s capture Sapa-San Vicente PIS Sapa-San Vicente PIS is located in Brgy. Sto. Nino, Sto. Tomas, Pampanga. The system was designed and constructed by NIA in 1990 but did not operate until year 2000. It was turned over by NIA to Sapa-San Vicente IA on May 16, 2013. The PIS takes water from the Minalin Creek which drains into the Pampanga River Delta. The design area is 20 ha and FUSA was estimated to be 15 ha. A quick walkthrough was conducted on the PIS. The system uses an 8-in dia. centrifugal pump driven by a 4DR5 diesel engine. Only minor repairs and maintenance
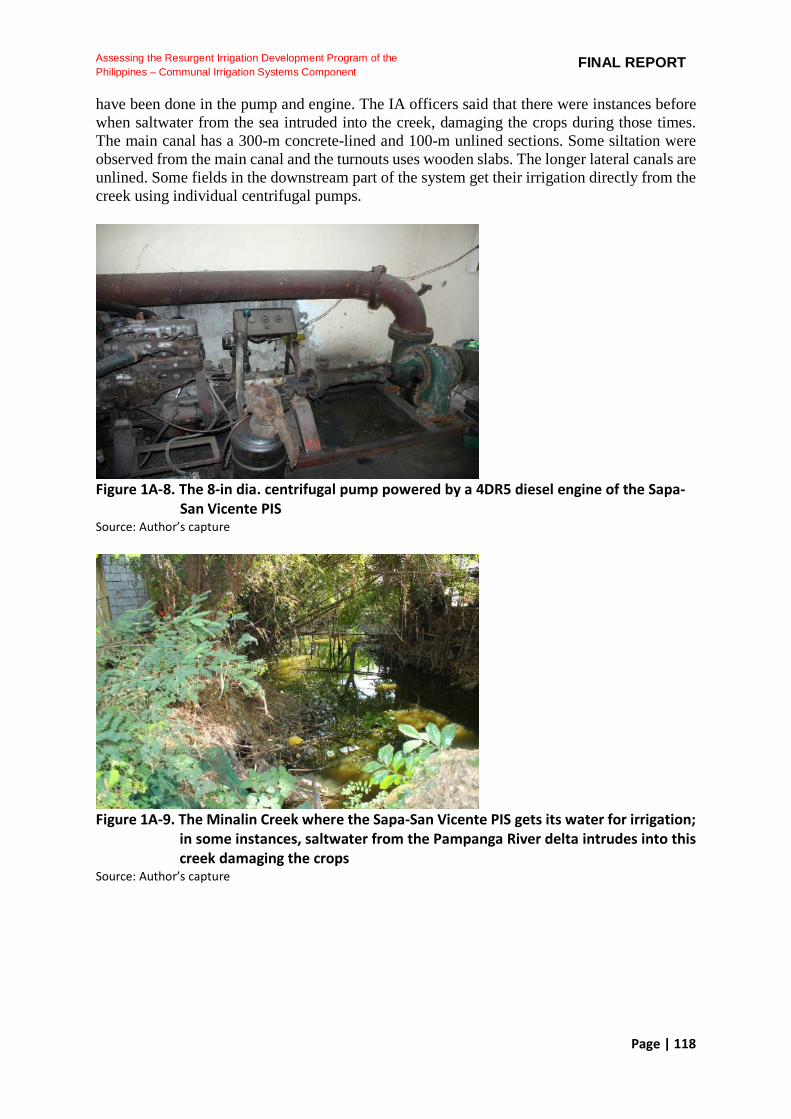
Page | 118
Assessing the Resurgent Irrigation Development Program of the
Philippines – Communal Irrigation Systems Component FINAL REPORT
have been done in the pump and engine. The IA officers said that there were instances before when saltwater from the sea intruded into the creek, damaging the crops during those times. The main canal has a 300-m concrete-lined and 100-m unlined sections. Some siltation were observed from the main canal and the turnouts uses wooden slabs. The longer lateral canals are unlined. Some fields in the downstream part of the system get their irrigation directly from the creek using individual centrifugal pumps.
Figure 1A-8. The 8-in dia. centrifugal pump powered by a 4DR5 diesel engine of the Sapa-
San Vicente PIS Source: Author’s capture
Figure 1A-9. The Minalin Creek where the Sapa-San Vicente PIS gets its water for irrigation;
in some instances, saltwater from the Pampanga River delta intrudes into this creek damaging the crops
Source: Author’s capture
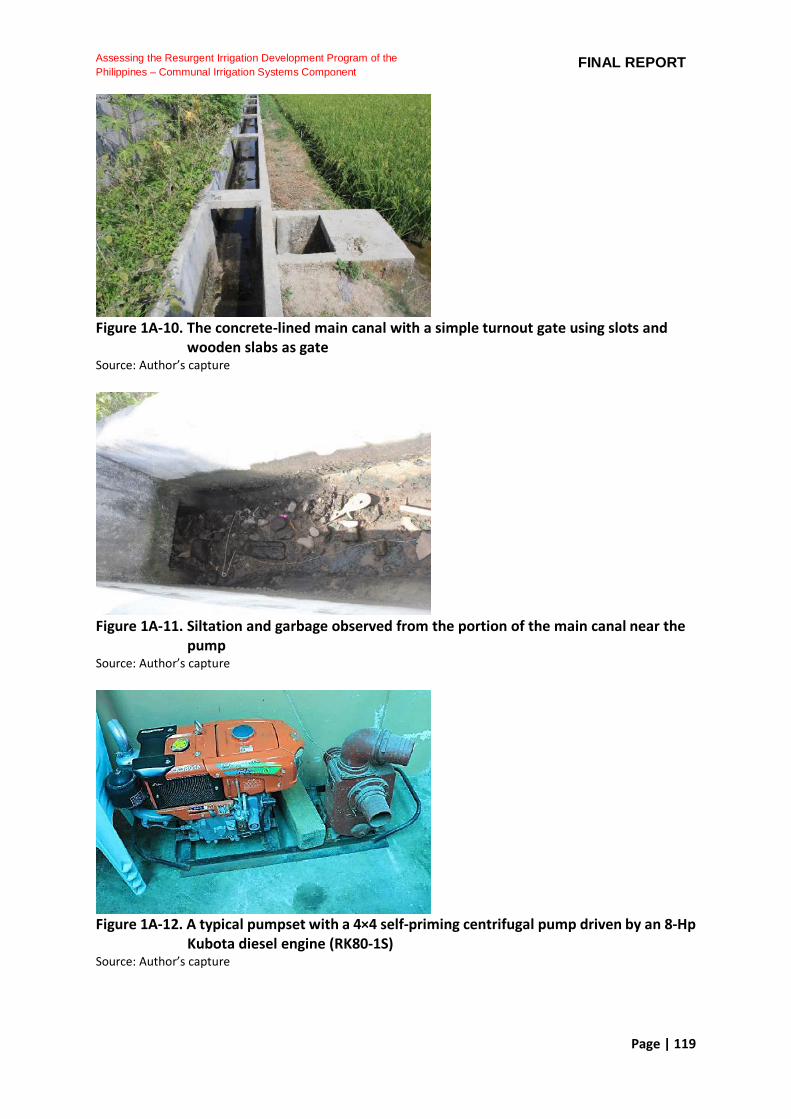
Page | 119
Assessing the Resurgent Irrigation Development Program of the
Philippines – Communal Irrigation Systems Component FINAL REPORT
Figure 1A-10. The concrete-lined main canal with a simple turnout gate using slots and
wooden slabs as gate Source: Author’s capture
Figure 1A-11. Siltation and garbage observed from the portion of the main canal near the
pump Source: Author’s capture
Figure 1A-12. A typical pumpset with a 4×4 self-priming centrifugal pump driven by an 8-Hp
Kubota diesel engine (RK80-1S) Source: Author’s capture
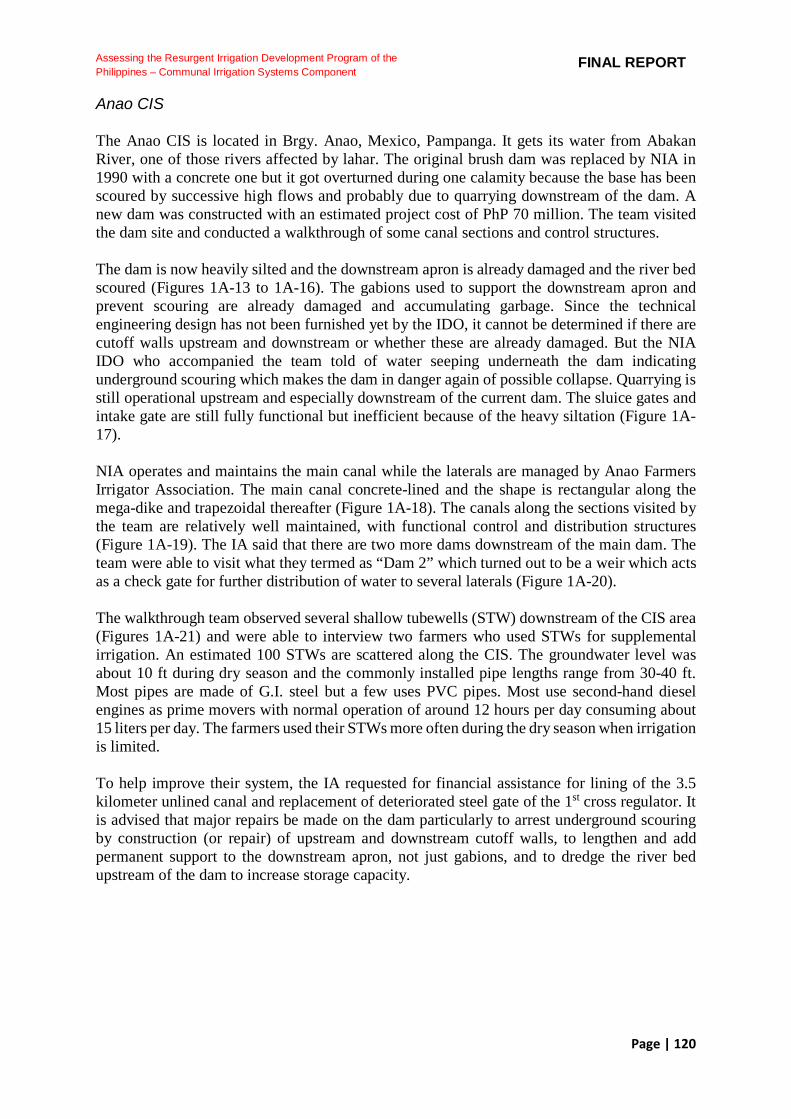
Page | 120
Assessing the Resurgent Irrigation Development Program of the
Philippines – Communal Irrigation Systems Component FINAL REPORT
Anao CIS The Anao CIS is located in Brgy. Anao, Mexico, Pampanga. It gets its water from Abakan River, one of those rivers affected by lahar. The original brush dam was replaced by NIA in 1990 with a concrete one but it got overturned during one calamity because the base has been scoured by successive high flows and probably due to quarrying downstream of the dam. A new dam was constructed with an estimated project cost of PhP 70 million. The team visited the dam site and conducted a walkthrough of some canal sections and control structures. The dam is now heavily silted and the downstream apron is already damaged and the river bed scoured (Figures 1A-13 to 1A-16). The gabions used to support the downstream apron and prevent scouring are already damaged and accumulating garbage. Since the technical engineering design has not been furnished yet by the IDO, it cannot be determined if there are cutoff walls upstream and downstream or whether these are already damaged. But the NIA IDO who accompanied the team told of water seeping underneath the dam indicating underground scouring which makes the dam in danger again of possible collapse. Quarrying is still operational upstream and especially downstream of the current dam. The sluice gates and intake gate are still fully functional but inefficient because of the heavy siltation (Figure 1A-17). NIA operates and maintains the main canal while the laterals are managed by Anao Farmers Irrigator Association. The main canal concrete-lined and the shape is rectangular along the mega-dike and trapezoidal thereafter (Figure 1A-18). The canals along the sections visited by the team are relatively well maintained, with functional control and distribution structures (Figure 1A-19). The IA said that there are two more dams downstream of the main dam. The team were able to visit what they termed as “Dam 2” which turned out to be a weir which acts as a check gate for further distribution of water to several laterals (Figure 1A-20). The walkthrough team observed several shallow tubewells (STW) downstream of the CIS area (Figures 1A-21) and were able to interview two farmers who used STWs for supplemental irrigation. An estimated 100 STWs are scattered along the CIS. The groundwater level was about 10 ft during dry season and the commonly installed pipe lengths range from 30-40 ft. Most pipes are made of G.I. steel but a few uses PVC pipes. Most use second-hand diesel engines as prime movers with normal operation of around 12 hours per day consuming about 15 liters per day. The farmers used their STWs more often during the dry season when irrigation is limited. To help improve their system, the IA requested for financial assistance for lining of the 3.5 kilometer unlined canal and replacement of deteriorated steel gate of the 1st cross regulator. It is advised that major repairs be made on the dam particularly to arrest underground scouring by construction (or repair) of upstream and downstream cutoff walls, to lengthen and add permanent support to the downstream apron, not just gabions, and to dredge the river bed upstream of the dam to increase storage capacity.
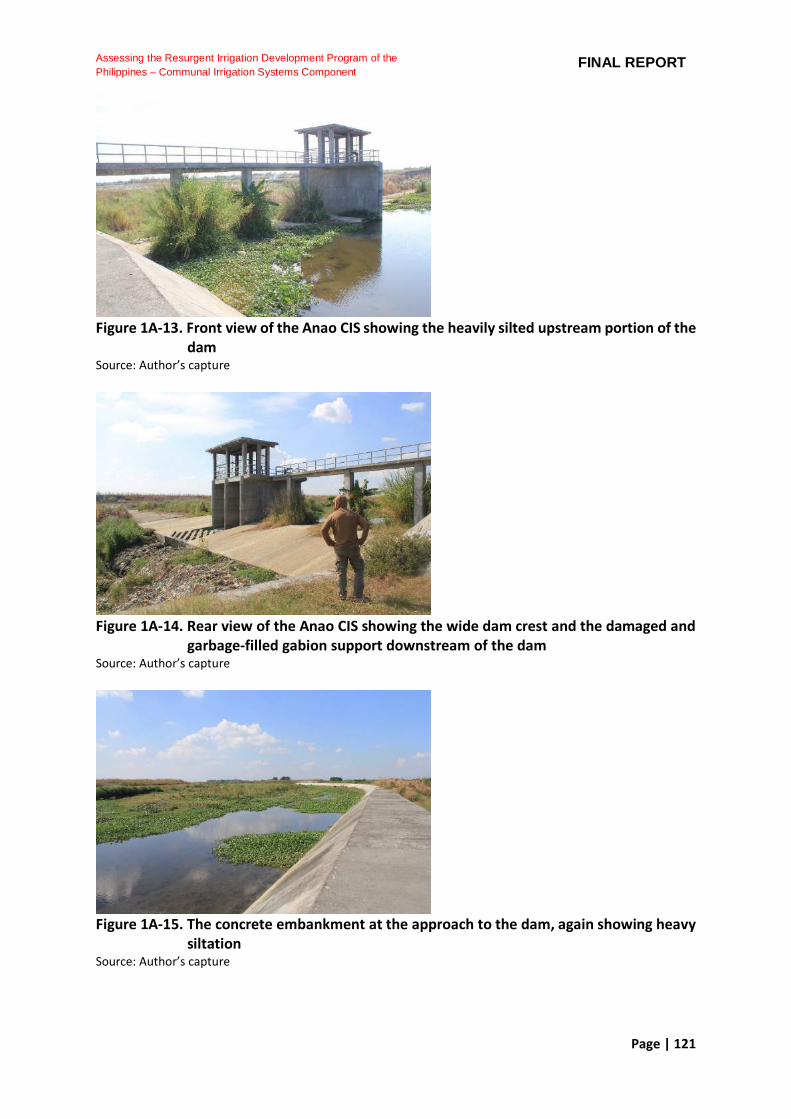
Page | 121
Assessing the Resurgent Irrigation Development Program of the
Philippines – Communal Irrigation Systems Component FINAL REPORT
Figure 1A-13. Front view of the Anao CIS showing the heavily silted upstream portion of the
dam Source: Author’s capture
Figure 1A-14. Rear view of the Anao CIS showing the wide dam crest and the damaged and
garbage-filled gabion support downstream of the dam Source: Author’s capture
Figure 1A-15. The concrete embankment at the approach to the dam, again showing heavy
siltation Source: Author’s capture
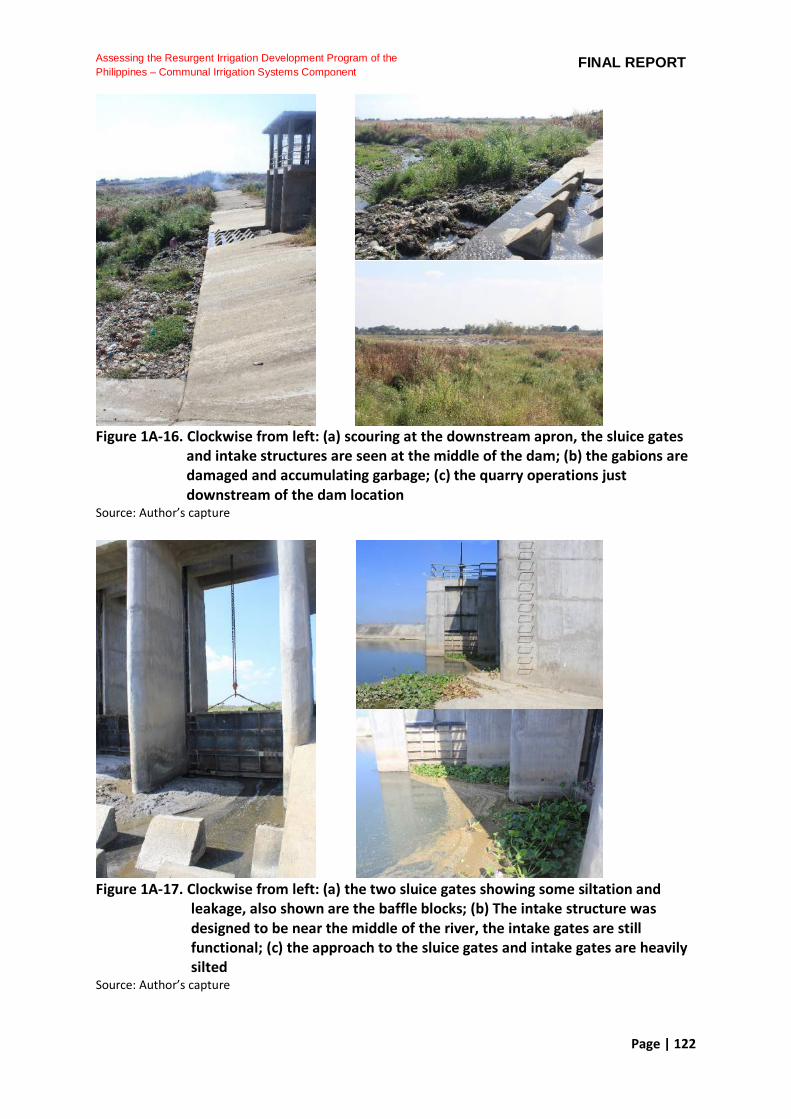
Page | 122
Assessing the Resurgent Irrigation Development Program of the
Philippines – Communal Irrigation Systems Component FINAL REPORT
Figure 1A-16. Clockwise from left: (a) scouring at the downstream apron, the sluice gates
and intake structures are seen at the middle of the dam; (b) the gabions are damaged and accumulating garbage; (c) the quarry operations just downstream of the dam location
Source: Author’s capture
Figure 1A-17. Clockwise from left: (a) the two sluice gates showing some siltation and
leakage, also shown are the baffle blocks; (b) The intake structure was designed to be near the middle of the river, the intake gates are still functional; (c) the approach to the sluice gates and intake gates are heavily silted
Source: Author’s capture

Page | 123
Assessing the Resurgent Irrigation Development Program of the
Philippines – Communal Irrigation Systems Component FINAL REPORT
Figure 1A-18. (a) Rectangular portion of the main canal parallel the mega-dike immediately
downstream of the dam; (b) trapezoidal portion of the main canal Source: Author’s capture
Figure 1A-19. (a) A check gate that serves as a turnout for distributing water to a secondary
lateral; (b) a flow dividing structure to a lined lateral; the control has slots for wooden slabs and combined with a shallow drop
Source: Author’s capture
Figure 1A-20. (a) The check gate which the IA refers to as “Dam 2” is used to increase the head at the main canal for distribution to secondary laterals; (b) one of the laterals (concrete-lined) served by the check gate Source: Author’s capture
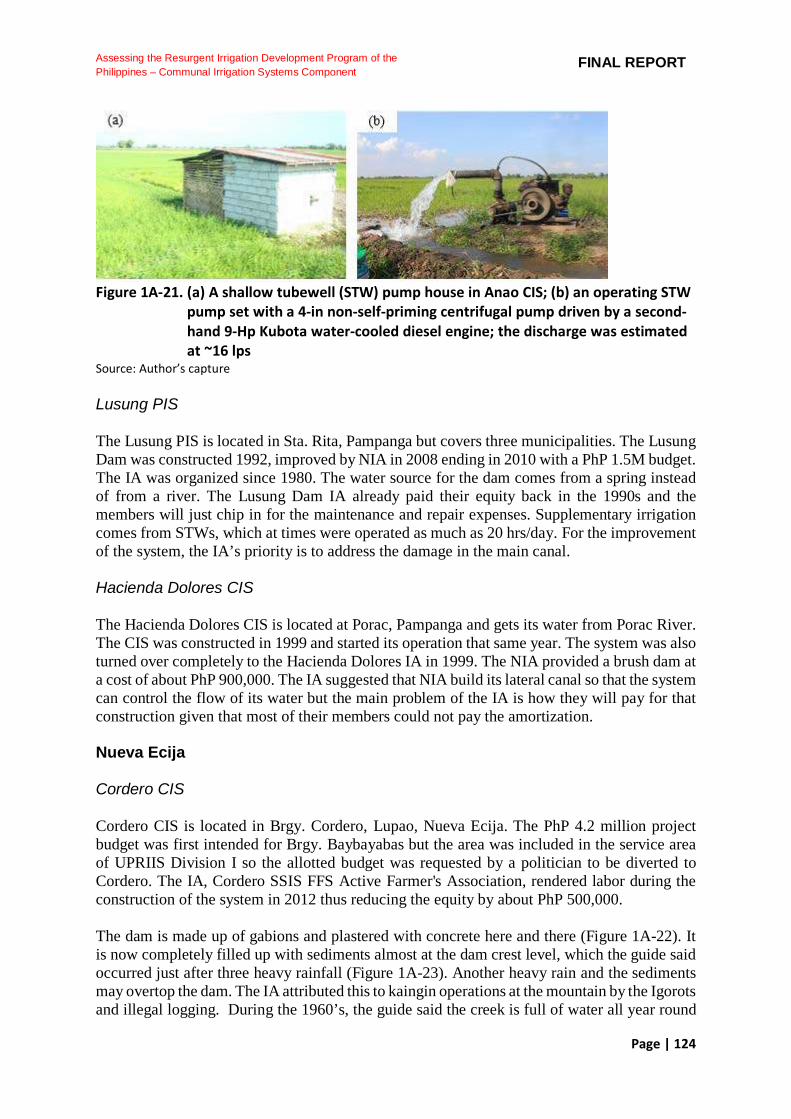
Page | 124
Assessing the Resurgent Irrigation Development Program of the
Philippines – Communal Irrigation Systems Component FINAL REPORT
Figure 1A-21. (a) A shallow tubewell (STW) pump house in Anao CIS; (b) an operating STW
pump set with a 4-in non-self-priming centrifugal pump driven by a second-hand 9-Hp Kubota water-cooled diesel engine; the discharge was estimated at ~16 lps
Source: Author’s capture Lusung PIS The Lusung PIS is located in Sta. Rita, Pampanga but covers three municipalities. The Lusung Dam was constructed 1992, improved by NIA in 2008 ending in 2010 with a PhP 1.5M budget. The IA was organized since 1980. The water source for the dam comes from a spring instead of from a river. The Lusung Dam IA already paid their equity back in the 1990s and the members will just chip in for the maintenance and repair expenses. Supplementary irrigation comes from STWs, which at times were operated as much as 20 hrs/day. For the improvement of the system, the IA’s priority is to address the damage in the main canal. Hacienda Dolores CIS The Hacienda Dolores CIS is located at Porac, Pampanga and gets its water from Porac River. The CIS was constructed in 1999 and started its operation that same year. The system was also turned over completely to the Hacienda Dolores IA in 1999. The NIA provided a brush dam at a cost of about PhP 900,000. The IA suggested that NIA build its lateral canal so that the system can control the flow of its water but the main problem of the IA is how they will pay for that construction given that most of their members could not pay the amortization. Nueva Ecija Cordero CIS Cordero CIS is located in Brgy. Cordero, Lupao, Nueva Ecija. The PhP 4.2 million project budget was first intended for Brgy. Baybayabas but the area was included in the service area of UPRIIS Division I so the allotted budget was requested by a politician to be diverted to Cordero. The IA, Cordero SSIS FFS Active Farmer's Association, rendered labor during the construction of the system in 2012 thus reducing the equity by about PhP 500,000. The dam is made up of gabions and plastered with concrete here and there (Figure 1A-22). It is now completely filled up with sediments almost at the dam crest level, which the guide said occurred just after three heavy rainfall (Figure 1A-23). Another heavy rain and the sediments may overtop the dam. The IA attributed this to kaingin operations at the mountain by the Igorots and illegal logging. During the 1960’s, the guide said the creek is full of water all year round
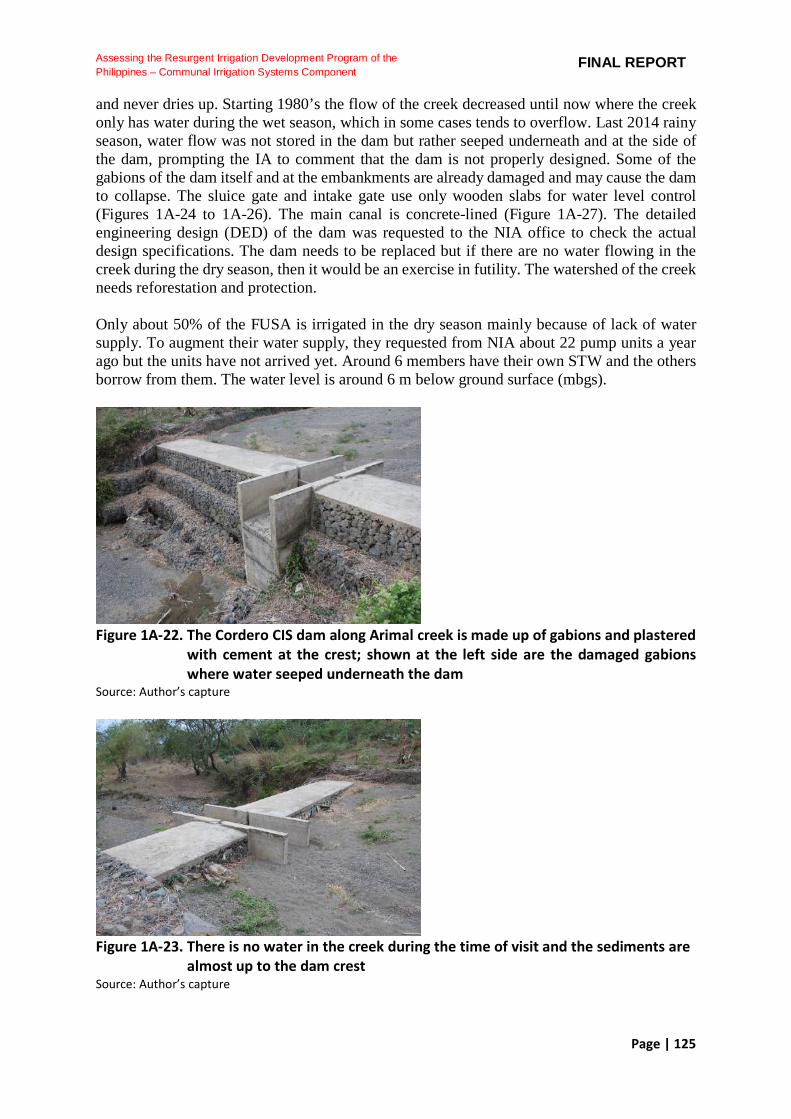
Page | 125
Assessing the Resurgent Irrigation Development Program of the
Philippines – Communal Irrigation Systems Component FINAL REPORT
and never dries up. Starting 1980’s the flow of the creek decreased until now where the creek only has water during the wet season, which in some cases tends to overflow. Last 2014 rainy season, water flow was not stored in the dam but rather seeped underneath and at the side of the dam, prompting the IA to comment that the dam is not properly designed. Some of the gabions of the dam itself and at the embankments are already damaged and may cause the dam to collapse. The sluice gate and intake gate use only wooden slabs for water level control (Figures 1A-24 to 1A-26). The main canal is concrete-lined (Figure 1A-27). The detailed engineering design (DED) of the dam was requested to the NIA office to check the actual design specifications. The dam needs to be replaced but if there are no water flowing in the creek during the dry season, then it would be an exercise in futility. The watershed of the creek needs reforestation and protection. Only about 50% of the FUSA is irrigated in the dry season mainly because of lack of water supply. To augment their water supply, they requested from NIA about 22 pump units a year ago but the units have not arrived yet. Around 6 members have their own STW and the others borrow from them. The water level is around 6 m below ground surface (mbgs).
Figure 1A-22. The Cordero CIS dam along Arimal creek is made up of gabions and plastered
with cement at the crest; shown at the left side are the damaged gabions where water seeped underneath the dam
Source: Author’s capture
Figure 1A-23. There is no water in the creek during the time of visit and the sediments are
almost up to the dam crest Source: Author’s capture

Page | 126
Assessing the Resurgent Irrigation Development Program of the
Philippines – Communal Irrigation Systems Component FINAL REPORT
Figure 1A-24. The intake gate upstream of the dam use wooden slabs as gates; the gabions
serving as side embankments of the dam are damaged; sand bags used to divert the depleting water last cropping are also shown
Source: Author’s capture
Figure 1A-25. The sluice gate is made of concrete with slots for wooden slabs serving as
gates; the background is the downstream portion of the dam Source: Author’s capture
Figure 1A-26. The intake structure with the slots for the wooden gates Source: Author’s capture
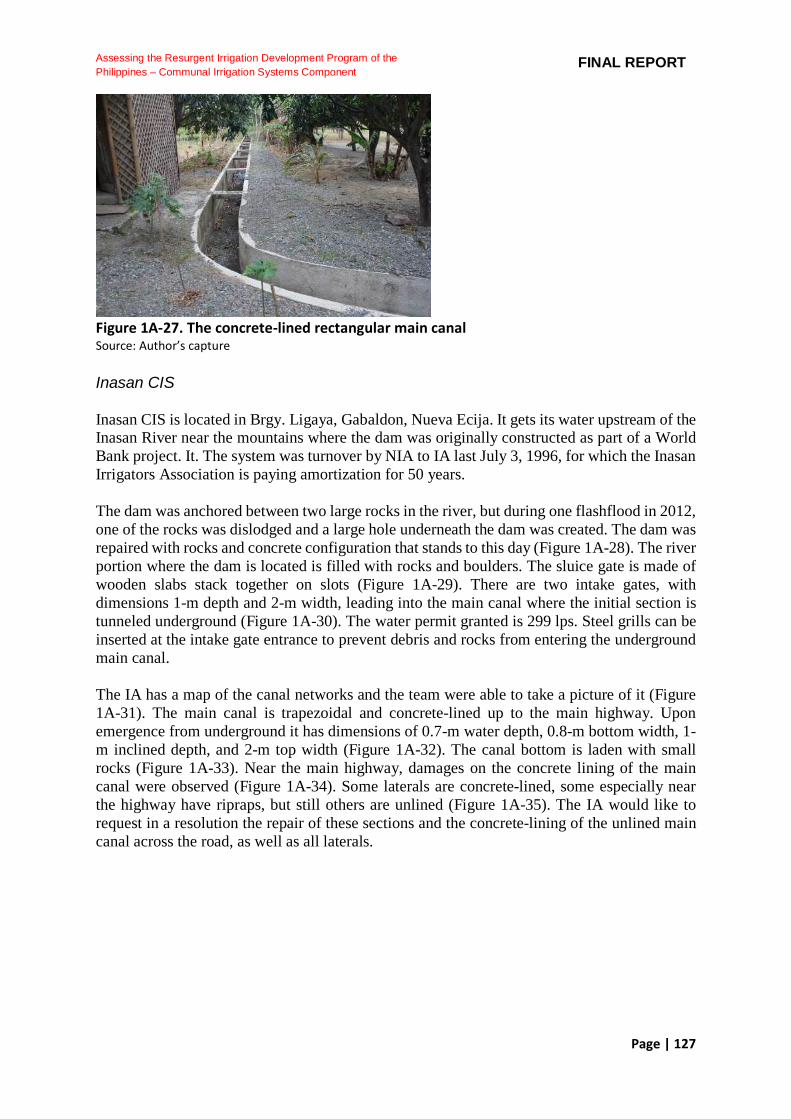
Page | 127
Assessing the Resurgent Irrigation Development Program of the
Philippines – Communal Irrigation Systems Component FINAL REPORT
Figure 1A-27. The concrete-lined rectangular main canal Source: Author’s capture Inasan CIS Inasan CIS is located in Brgy. Ligaya, Gabaldon, Nueva Ecija. It gets its water upstream of the Inasan River near the mountains where the dam was originally constructed as part of a World Bank project. It. The system was turnover by NIA to IA last July 3, 1996, for which the Inasan Irrigators Association is paying amortization for 50 years. The dam was anchored between two large rocks in the river, but during one flashflood in 2012, one of the rocks was dislodged and a large hole underneath the dam was created. The dam was repaired with rocks and concrete configuration that stands to this day (Figure 1A-28). The river portion where the dam is located is filled with rocks and boulders. The sluice gate is made of wooden slabs stack together on slots (Figure 1A-29). There are two intake gates, with dimensions 1-m depth and 2-m width, leading into the main canal where the initial section is tunneled underground (Figure 1A-30). The water permit granted is 299 lps. Steel grills can be inserted at the intake gate entrance to prevent debris and rocks from entering the underground main canal. The IA has a map of the canal networks and the team were able to take a picture of it (Figure 1A-31). The main canal is trapezoidal and concrete-lined up to the main highway. Upon emergence from underground it has dimensions of 0.7-m water depth, 0.8-m bottom width, 1- m inclined depth, and 2-m top width (Figure 1A-32). The canal bottom is laden with small rocks (Figure 1A-33). Near the main highway, damages on the concrete lining of the main canal were observed (Figure 1A-34). Some laterals are concrete-lined, some especially near the highway have ripraps, but still others are unlined (Figure 1A-35). The IA would like to request in a resolution the repair of these sections and the concrete-lining of the unlined main canal across the road, as well as all laterals.

Page | 128
Assessing the Resurgent Irrigation Development Program of the
Philippines – Communal Irrigation Systems Component FINAL REPORT
Figure 1A-28. Left: The Inasan CIS dam along the upstream of the Inasan River made of rock
and concrete; Right: boulders and rocks downstream of the dam Source: Author’s capture
Figure 1A-29. The sluice gate is made of wooden slabs stacked together in a slot serving as
water level control gate Source: Author’s capture
Figure 1A-30. The intake structure leading to the underground tunnel into the main canal Source: Author’s capture

Page | 129
Assessing the Resurgent Irrigation Development Program of the
Philippines – Communal Irrigation Systems Component FINAL REPORT
Figure 1A-31. The map of the Inasan CIS canal network Source: Author’s capture
Figure 1A-32. The main canal coming from the underground tunnel from the dam Source: Author’s capture
Figure 1A-33. The trapezoidal main canal; the canal bottom is filled with small rocks Source: Author’s capture
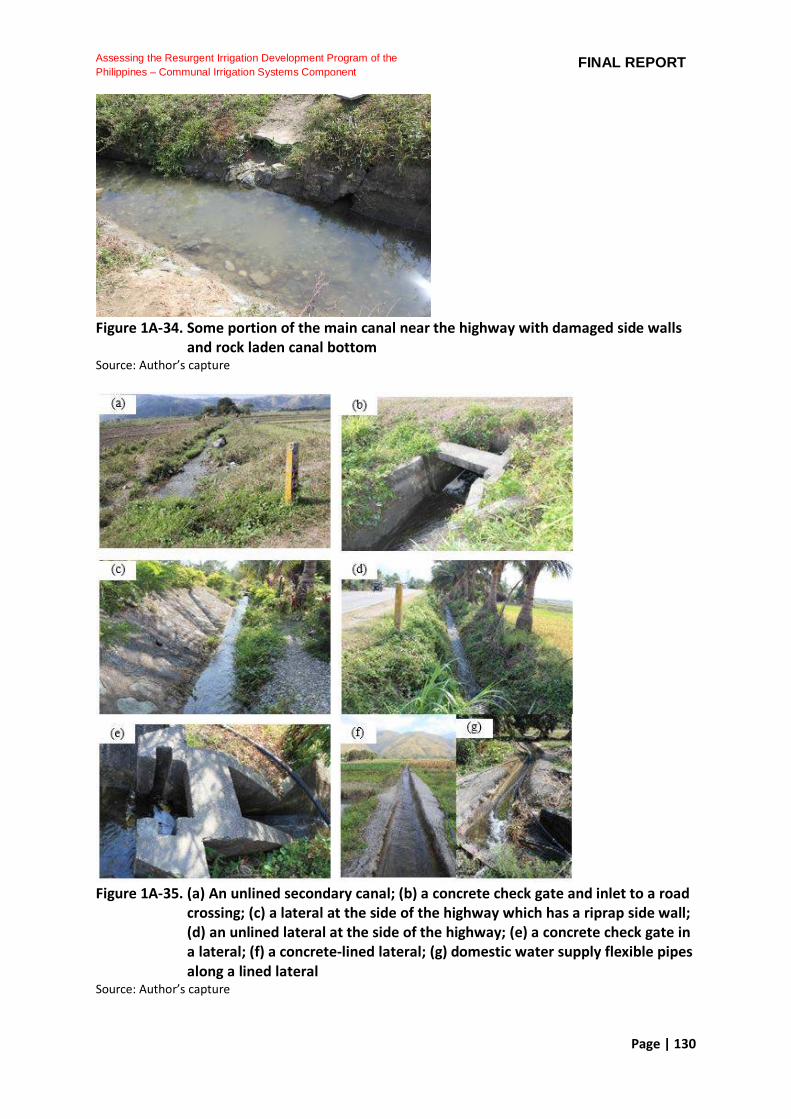
Page | 130
Assessing the Resurgent Irrigation Development Program of the
Philippines – Communal Irrigation Systems Component FINAL REPORT
Figure 1A-34. Some portion of the main canal near the highway with damaged side walls
and rock laden canal bottom Source: Author’s capture
Figure 1A-35. (a) An unlined secondary canal; (b) a concrete check gate and inlet to a road
crossing; (c) a lateral at the side of the highway which has a riprap side wall; (d) an unlined lateral at the side of the highway; (e) a concrete check gate in a lateral; (f) a concrete-lined lateral; (g) domestic water supply flexible pipes along a lined lateral
Source: Author’s capture
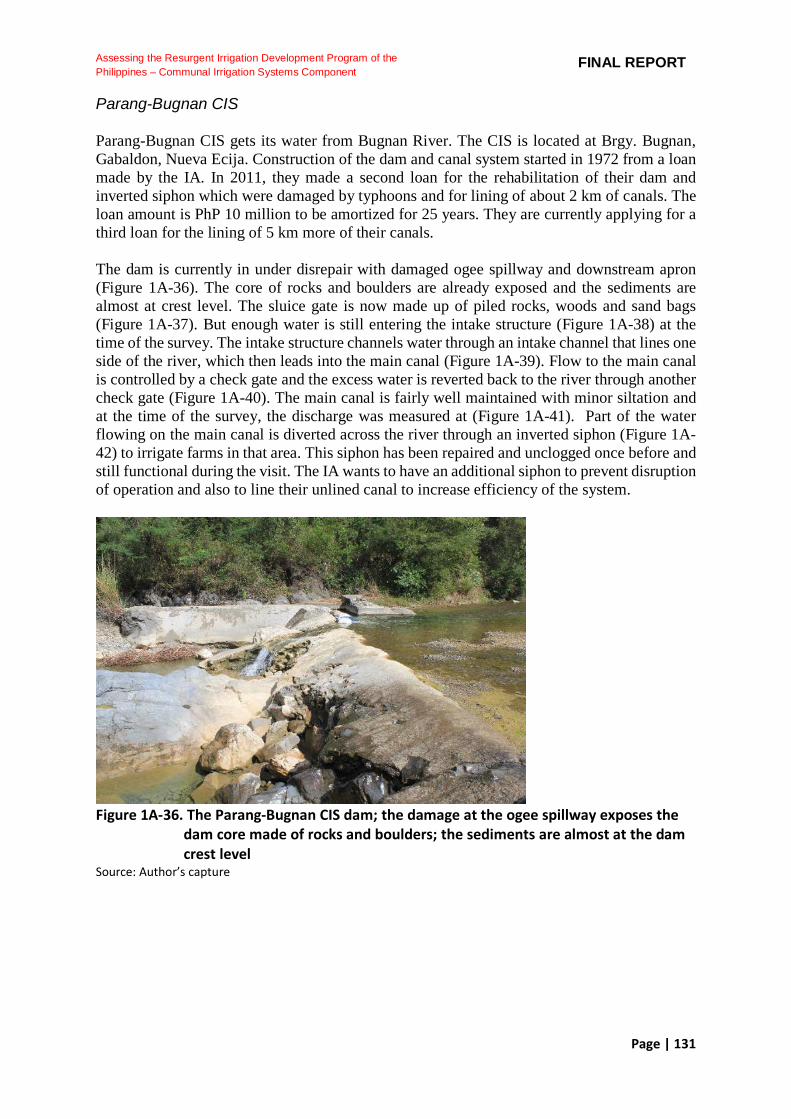
Page | 131
Assessing the Resurgent Irrigation Development Program of the
Philippines – Communal Irrigation Systems Component FINAL REPORT
Parang-Bugnan CIS Parang-Bugnan CIS gets its water from Bugnan River. The CIS is located at Brgy. Bugnan, Gabaldon, Nueva Ecija. Construction of the dam and canal system started in 1972 from a loan made by the IA. In 2011, they made a second loan for the rehabilitation of their dam and inverted siphon which were damaged by typhoons and for lining of about 2 km of canals. The loan amount is PhP 10 million to be amortized for 25 years. They are currently applying for a third loan for the lining of 5 km more of their canals.
The dam is currently in under disrepair with damaged ogee spillway and downstream apron (Figure 1A-36). The core of rocks and boulders are already exposed and the sediments are almost at crest level. The sluice gate is now made up of piled rocks, woods and sand bags (Figure 1A-37). But enough water is still entering the intake structure (Figure 1A-38) at the time of the survey. The intake structure channels water through an intake channel that lines one side of the river, which then leads into the main canal (Figure 1A-39). Flow to the main canal is controlled by a check gate and the excess water is reverted back to the river through another check gate (Figure 1A-40). The main canal is fairly well maintained with minor siltation and at the time of the survey, the discharge was measured at (Figure 1A-41). Part of the water flowing on the main canal is diverted across the river through an inverted siphon (Figure 1A-42) to irrigate farms in that area. This siphon has been repaired and unclogged once before and still functional during the visit. The IA wants to have an additional siphon to prevent disruption of operation and also to line their unlined canal to increase efficiency of the system.
Figure 1A-36. The Parang-Bugnan CIS dam; the damage at the ogee spillway exposes the
dam core made of rocks and boulders; the sediments are almost at the dam crest level
Source: Author’s capture

Page | 132
Assessing the Resurgent Irrigation Development Program of the
Philippines – Communal Irrigation Systems Component FINAL REPORT
Figure 1A-37. The damaged sluice gate now made up of piled wood, rocks and sand bags Source: Author’s capture
Figure 1A-38. The intake structure showing damaged concrete parts where water flow is
guided to the inlet by piles of sand bags Source: Author’s capture
Figure 1A-39. (a) Intake channel at the side of the river just after the dam; (b) continuation
of the intake channel; (c) the main canal just after the check gate Source: Author’s capture
(a) (b) (c)

Page | 133
Assessing the Resurgent Irrigation Development Program of the
Philippines – Communal Irrigation Systems Component FINAL REPORT
Figure 1A-40. (a) Check gate to control the flow to the main canal; (b) the gate at the top
controls the flow to the main canal while the left gate controls return flow to the river; (c) guide chute for excess water reverted back to the river
Source: Author’s capture
Figure 1A-41. Measuring discharge at the main canal during the walkthrough Source: Author’s capture
Figure 1A-42. (a) Outlet of the inverted siphon under the river; (b) the concrete-lined
lateral canal after the outlet of the inverted siphon used to distribute the water to Parang-Bugnan CIS area across the river
Source: Author’s capture
(a) (b) (c)
(a) (b)
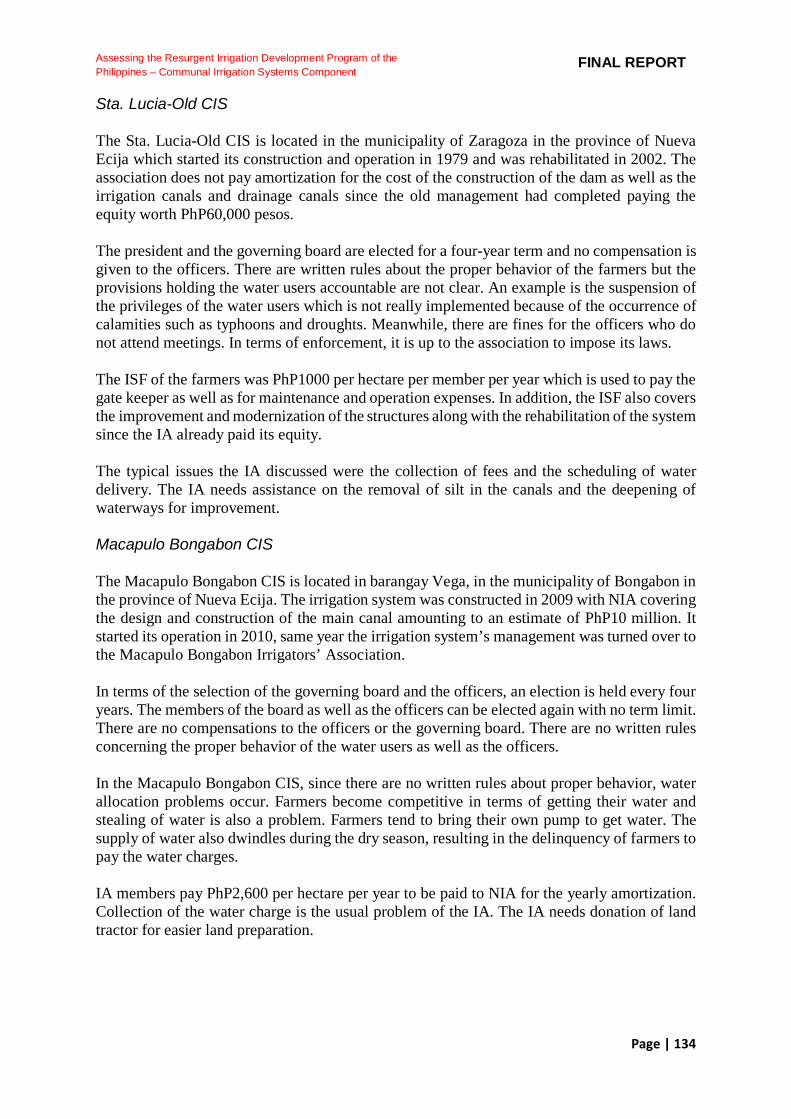
Page | 134
Assessing the Resurgent Irrigation Development Program of the
Philippines – Communal Irrigation Systems Component FINAL REPORT
Sta. Lucia-Old CIS The Sta. Lucia-Old CIS is located in the municipality of Zaragoza in the province of Nueva Ecija which started its construction and operation in 1979 and was rehabilitated in 2002. The association does not pay amortization for the cost of the construction of the dam as well as the irrigation canals and drainage canals since the old management had completed paying the equity worth PhP60,000 pesos. The president and the governing board are elected for a four-year term and no compensation is given to the officers. There are written rules about the proper behavior of the farmers but the provisions holding the water users accountable are not clear. An example is the suspension of the privileges of the water users which is not really implemented because of the occurrence of calamities such as typhoons and droughts. Meanwhile, there are fines for the officers who do not attend meetings. In terms of enforcement, it is up to the association to impose its laws. The ISF of the farmers was PhP1000 per hectare per member per year which is used to pay the gate keeper as well as for maintenance and operation expenses. In addition, the ISF also covers the improvement and modernization of the structures along with the rehabilitation of the system since the IA already paid its equity. The typical issues the IA discussed were the collection of fees and the scheduling of water delivery. The IA needs assistance on the removal of silt in the canals and the deepening of waterways for improvement. Macapulo Bongabon CIS The Macapulo Bongabon CIS is located in barangay Vega, in the municipality of Bongabon in the province of Nueva Ecija. The irrigation system was constructed in 2009 with NIA covering the design and construction of the main canal amounting to an estimate of PhP10 million. It started its operation in 2010, same year the irrigation system’s management was turned over to the Macapulo Bongabon Irrigators’ Association. In terms of the selection of the governing board and the officers, an election is held every four years. The members of the board as well as the officers can be elected again with no term limit. There are no compensations to the officers or the governing board. There are no written rules concerning the proper behavior of the water users as well as the officers. In the Macapulo Bongabon CIS, since there are no written rules about proper behavior, water allocation problems occur. Farmers become competitive in terms of getting their water and stealing of water is also a problem. Farmers tend to bring their own pump to get water. The supply of water also dwindles during the dry season, resulting in the delinquency of farmers to pay the water charges. IA members pay PhP2,600 per hectare per year to be paid to NIA for the yearly amortization. Collection of the water charge is the usual problem of the IA. The IA needs donation of land tractor for easier land preparation.

Page | 135
Assessing the Resurgent Irrigation Development Program of the
Philippines – Communal Irrigation Systems Component FINAL REPORT
Tedtedtilingit CIS The municipality of Laur in the province of Nueva Ecija is the home of the Tedtedtilingit CIS which provides irrigation to the three barangays of Siklong, San Fernando and San Vicente. The irrigation system was constructed and started functioning in the year 2010. The National Irrigation Administration constructed the dam and the main canal that costs about PhP5 million. The system was turned over to the Tedtedtilingit Irrigators’ Association in May 2011. Another PhP7 million was allocated for repair in 2013. The members elect the officers as well as the governing board and there is no term limit. The current president of the association has been president for seven years. There are no compensations or incentives for the officers. The association also has written rules about the proper behavior of both the water users and the officials and shall be given sanctions or penalties when they disobey. Since the irrigators’ association was not able to pay the PhP1.3 million-peso equity, they entered into the amortization scheme. The farmers pay PhP3,000 per year per hectare to cover the yearly amortization while an additional PhP100 pesos per member is also collected to cover additional expenses. The biggest problem of the IA is the collection of these fees. Pangasinan San Angel CIS San Angel CIS is a Small Reservoir Impounding Project located at Brgy. San Angel, Rosales, Pangasinan. It was constructed by NIA in March 2010 and finished in December 2011. The original project cost listed in a map acquired by the team was PhP 12,808,800 but the approved firmed up estimate is PhP 14,006,985.18. These probably are partial costs only (maybe just the earth dam) because the project cost based on the same map was PhP 79,100,000. The IA on the other hand said the project is worth PhP 150 million. These differences in costs will have to be resolved with NIA. The reservoir stores water from rainfall-runoff and two spring sources, one near the reservoir and one in Acop. The FUSA is 160 ha but only half of it (74 ha from the map) is irrigated during the dry season due to less rainfall and diminished spring flow. The dam crest is 13.5 m high, 120 m long and 6 m in width. It is most likely made of compacted soil and lined with boulders (Figures 1A-43 to 1A-44). The dam and reservoir, including the cost of course, is deemed pretty big for a 160-ha FUSA. The reservoir is shown in Figure 1A-45. The storage capacity is determined based on the water level (stage) measured from a concrete gage meter (Figure 1A-46). The IA did not have a stage-storage curve or rating curve of the reservoir. The spillway is made of concrete and has a hump in the middle for extra storage (Figure 1A-47). The box inlet is submerged underwater with the pipe passing under the dam and the outlet emerging on the downstream face of the dam (Figure 1A-48). The team was able to obtain a map of the proposed San Angel SRIP (Figure 1A-49). The main canal is divided into two branches. The left main canal is 1.798 km long and one lateral (Lat. A) 1.72 km long branch out of it. The right main canal is 1.214 km long with two laterals, Lat. A – 0.5169 km and Lat. A-1 – 0.982 km, branching out of it. The main canal and some laterals are concrete-lined but some damaged canals were observed during the visit which the IA said was due to the numerous trucks passing the area during the construction of the TPLEX. The map also listed a total of 90 control structures within the system including a combined siphon
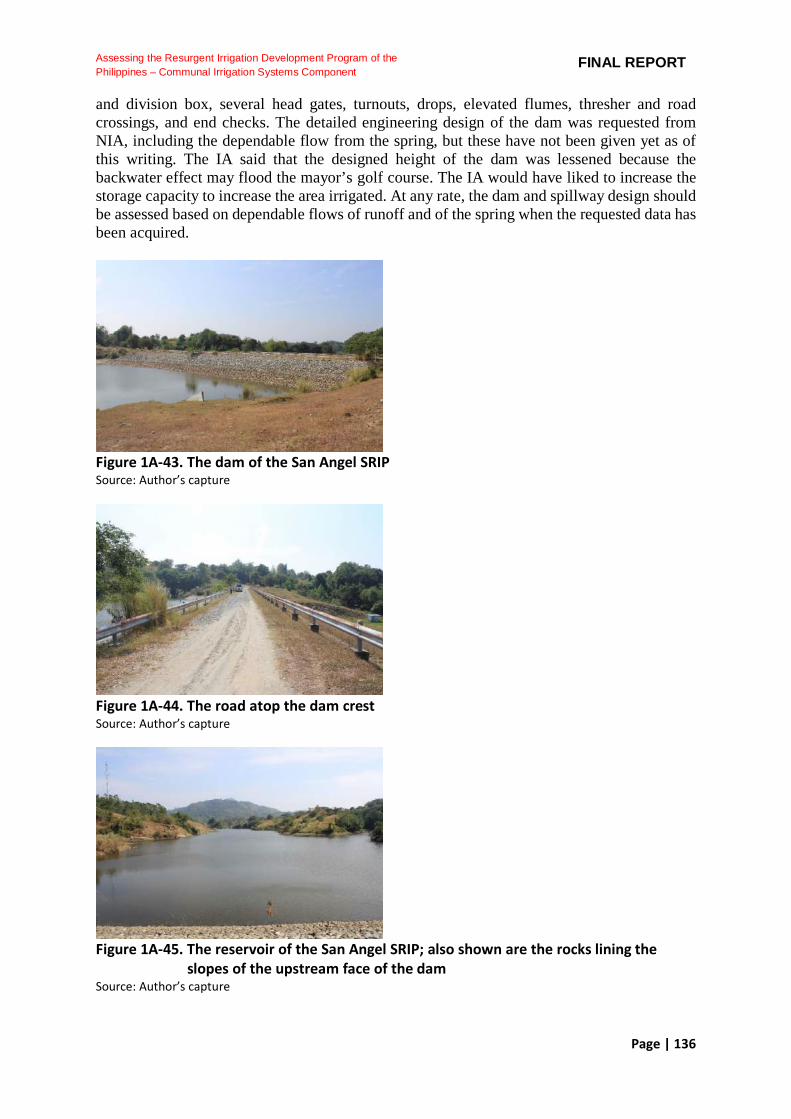
Page | 136
Assessing the Resurgent Irrigation Development Program of the
Philippines – Communal Irrigation Systems Component FINAL REPORT
and division box, several head gates, turnouts, drops, elevated flumes, thresher and road crossings, and end checks. The detailed engineering design of the dam was requested from NIA, including the dependable flow from the spring, but these have not been given yet as of this writing. The IA said that the designed height of the dam was lessened because the backwater effect may flood the mayor’s golf course. The IA would have liked to increase the storage capacity to increase the area irrigated. At any rate, the dam and spillway design should be assessed based on dependable flows of runoff and of the spring when the requested data has been acquired.
Figure 1A-43. The dam of the San Angel SRIP Source: Author’s capture
Figure 1A-44. The road atop the dam crest Source: Author’s capture
Figure 1A-45. The reservoir of the San Angel SRIP; also shown are the rocks lining the
slopes of the upstream face of the dam Source: Author’s capture
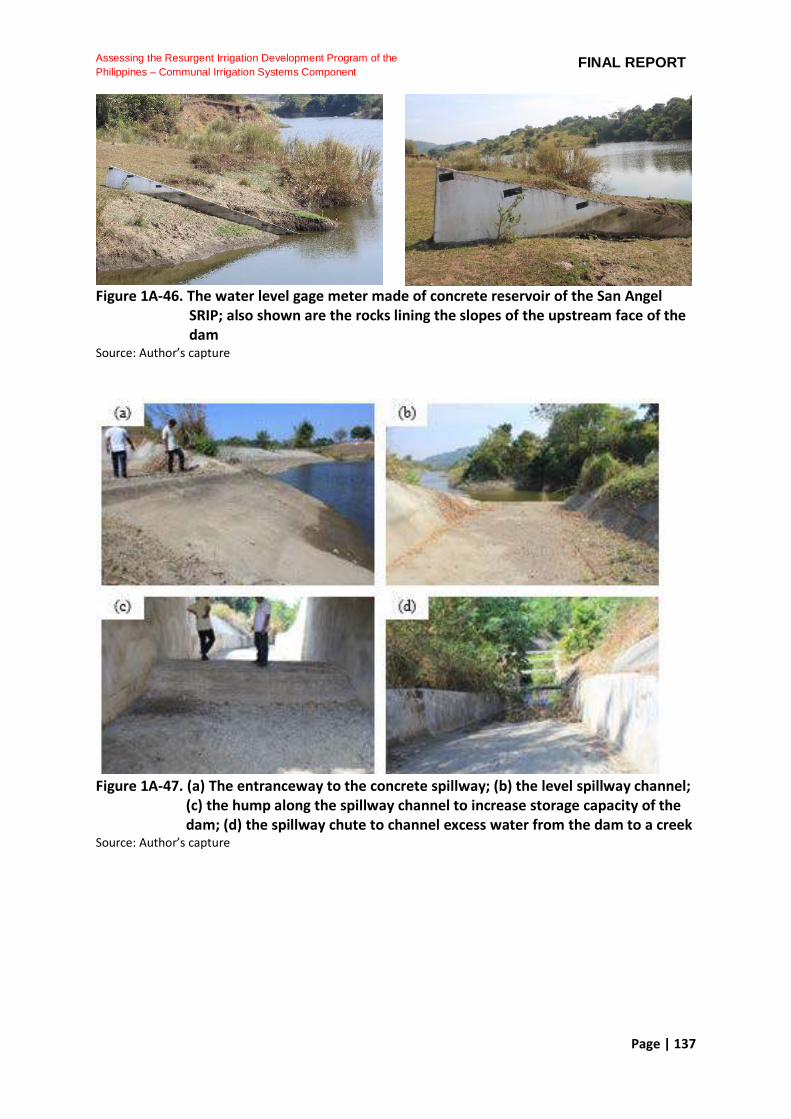
Page | 137
Assessing the Resurgent Irrigation Development Program of the
Philippines – Communal Irrigation Systems Component FINAL REPORT
Figure 1A-46. The water level gage meter made of concrete reservoir of the San Angel
SRIP; also shown are the rocks lining the slopes of the upstream face of the dam
Source: Author’s capture
Figure 1A-47. (a) The entranceway to the concrete spillway; (b) the level spillway channel;
(c) the hump along the spillway channel to increase storage capacity of the dam; (d) the spillway chute to channel excess water from the dam to a creek
Source: Author’s capture

Page | 138
Assessing the Resurgent Irrigation Development Program of the
Philippines – Communal Irrigation Systems Component FINAL REPORT
Figure 1A-48. (a) The outlet emerging at the downstream face of the dam, which is
covered with sod; (b) the outlet is housed in a concrete shed; shown also is the canal where the water leads to the main canals; (c) the outlet pipe emerging from the shed; (d) the canal leads to the combined siphon and division box which divides the flow to the left and right main canals
Source: Author’s capture
Figure 1A-49. The map of the San Angel SRIP showing canal layout, control structures, and
other physical descriptions Source: Author’s capture
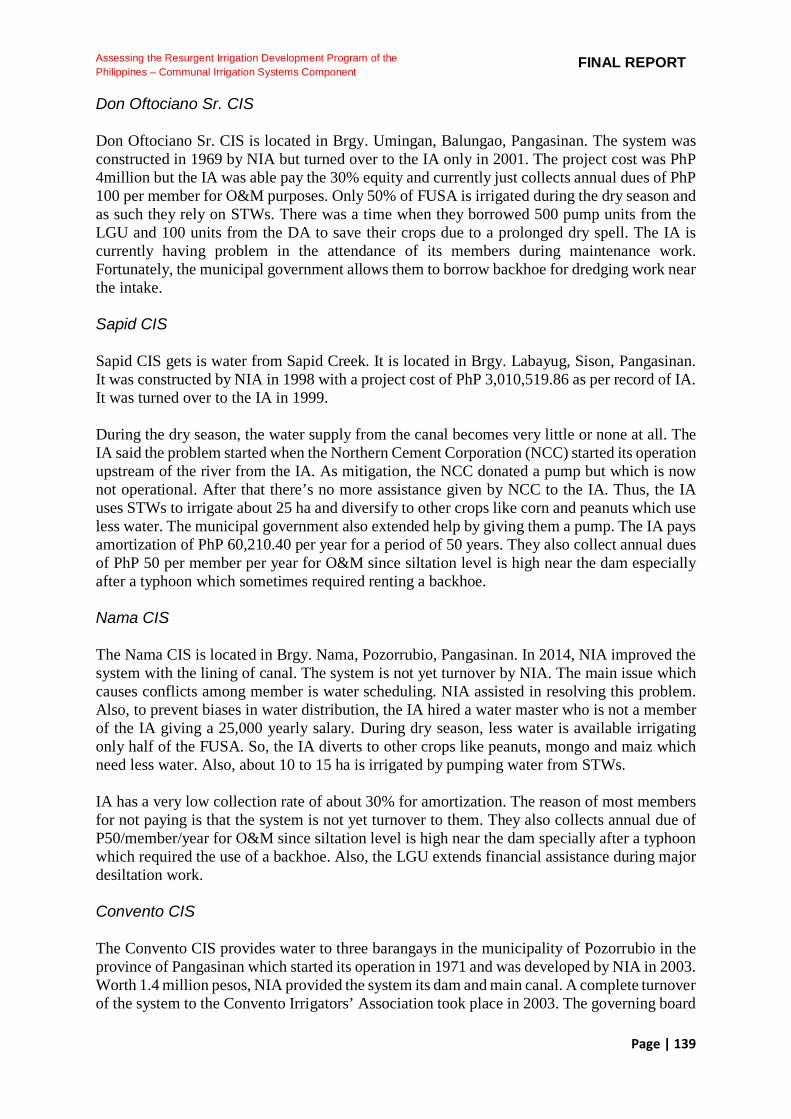
Page | 139
Assessing the Resurgent Irrigation Development Program of the
Philippines – Communal Irrigation Systems Component FINAL REPORT
Don Oftociano Sr. CIS Don Oftociano Sr. CIS is located in Brgy. Umingan, Balungao, Pangasinan. The system was constructed in 1969 by NIA but turned over to the IA only in 2001. The project cost was PhP 4million but the IA was able pay the 30% equity and currently just collects annual dues of PhP 100 per member for O&M purposes. Only 50% of FUSA is irrigated during the dry season and as such they rely on STWs. There was a time when they borrowed 500 pump units from the LGU and 100 units from the DA to save their crops due to a prolonged dry spell. The IA is currently having problem in the attendance of its members during maintenance work. Fortunately, the municipal government allows them to borrow backhoe for dredging work near the intake. Sapid CIS Sapid CIS gets is water from Sapid Creek. It is located in Brgy. Labayug, Sison, Pangasinan. It was constructed by NIA in 1998 with a project cost of PhP 3,010,519.86 as per record of IA. It was turned over to the IA in 1999.
During the dry season, the water supply from the canal becomes very little or none at all. The IA said the problem started when the Northern Cement Corporation (NCC) started its operation upstream of the river from the IA. As mitigation, the NCC donated a pump but which is now not operational. After that there’s no more assistance given by NCC to the IA. Thus, the IA uses STWs to irrigate about 25 ha and diversify to other crops like corn and peanuts which use less water. The municipal government also extended help by giving them a pump. The IA pays amortization of PhP 60,210.40 per year for a period of 50 years. They also collect annual dues of PhP 50 per member per year for O&M since siltation level is high near the dam especially after a typhoon which sometimes required renting a backhoe. Nama CIS The Nama CIS is located in Brgy. Nama, Pozorrubio, Pangasinan. In 2014, NIA improved the system with the lining of canal. The system is not yet turnover by NIA. The main issue which causes conflicts among member is water scheduling. NIA assisted in resolving this problem. Also, to prevent biases in water distribution, the IA hired a water master who is not a member of the IA giving a 25,000 yearly salary. During dry season, less water is available irrigating only half of the FUSA. So, the IA diverts to other crops like peanuts, mongo and maiz which need less water. Also, about 10 to 15 ha is irrigated by pumping water from STWs. IA has a very low collection rate of about 30% for amortization. The reason of most members for not paying is that the system is not yet turnover to them. They also collects annual due of P50/member/year for O&M since siltation level is high near the dam specially after a typhoon which required the use of a backhoe. Also, the LGU extends financial assistance during major desiltation work. Convento CIS The Convento CIS provides water to three barangays in the municipality of Pozorrubio in the province of Pangasinan which started its operation in 1971 and was developed by NIA in 2003. Worth 1.4 million pesos, NIA provided the system its dam and main canal. A complete turnover of the system to the Convento Irrigators’ Association took place in 2003. The governing board
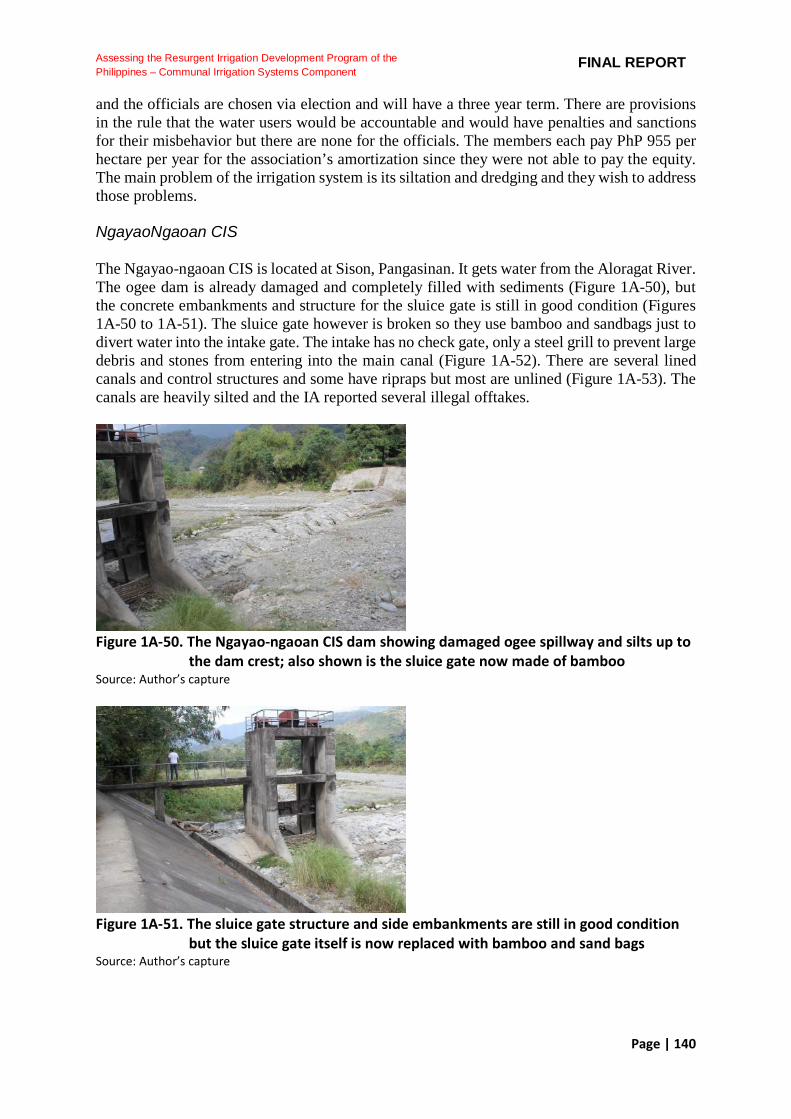
Page | 140
Assessing the Resurgent Irrigation Development Program of the
Philippines – Communal Irrigation Systems Component FINAL REPORT
and the officials are chosen via election and will have a three year term. There are provisions in the rule that the water users would be accountable and would have penalties and sanctions for their misbehavior but there are none for the officials. The members each pay PhP 955 per hectare per year for the association’s amortization since they were not able to pay the equity. The main problem of the irrigation system is its siltation and dredging and they wish to address those problems. NgayaoNgaoan CIS The Ngayao-ngaoan CIS is located at Sison, Pangasinan. It gets water from the Aloragat River. The ogee dam is already damaged and completely filled with sediments (Figure 1A-50), but the concrete embankments and structure for the sluice gate is still in good condition (Figures 1A-50 to 1A-51). The sluice gate however is broken so they use bamboo and sandbags just to divert water into the intake gate. The intake has no check gate, only a steel grill to prevent large debris and stones from entering into the main canal (Figure 1A-52). There are several lined canals and control structures and some have ripraps but most are unlined (Figure 1A-53). The canals are heavily silted and the IA reported several illegal offtakes.
Figure 1A-50. The Ngayao-ngaoan CIS dam showing damaged ogee spillway and silts up to
the dam crest; also shown is the sluice gate now made of bamboo Source: Author’s capture
Figure 1A-51. The sluice gate structure and side embankments are still in good condition
but the sluice gate itself is now replaced with bamboo and sand bags Source: Author’s capture
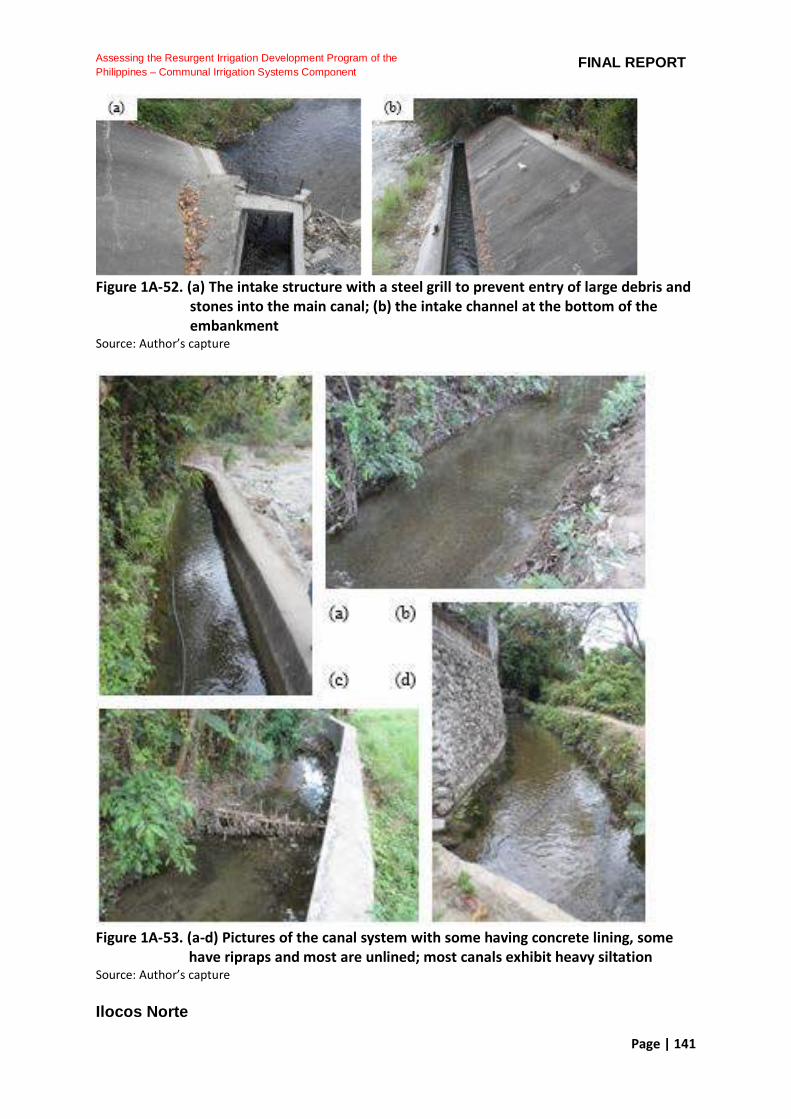
Page | 141
Assessing the Resurgent Irrigation Development Program of the
Philippines – Communal Irrigation Systems Component FINAL REPORT
Figure 1A-52. (a) The intake structure with a steel grill to prevent entry of large debris and
stones into the main canal; (b) the intake channel at the bottom of the embankment
Source: Author’s capture
Figure 1A-53. (a-d) Pictures of the canal system with some having concrete lining, some
have ripraps and most are unlined; most canals exhibit heavy siltation Source: Author’s capture Ilocos Norte
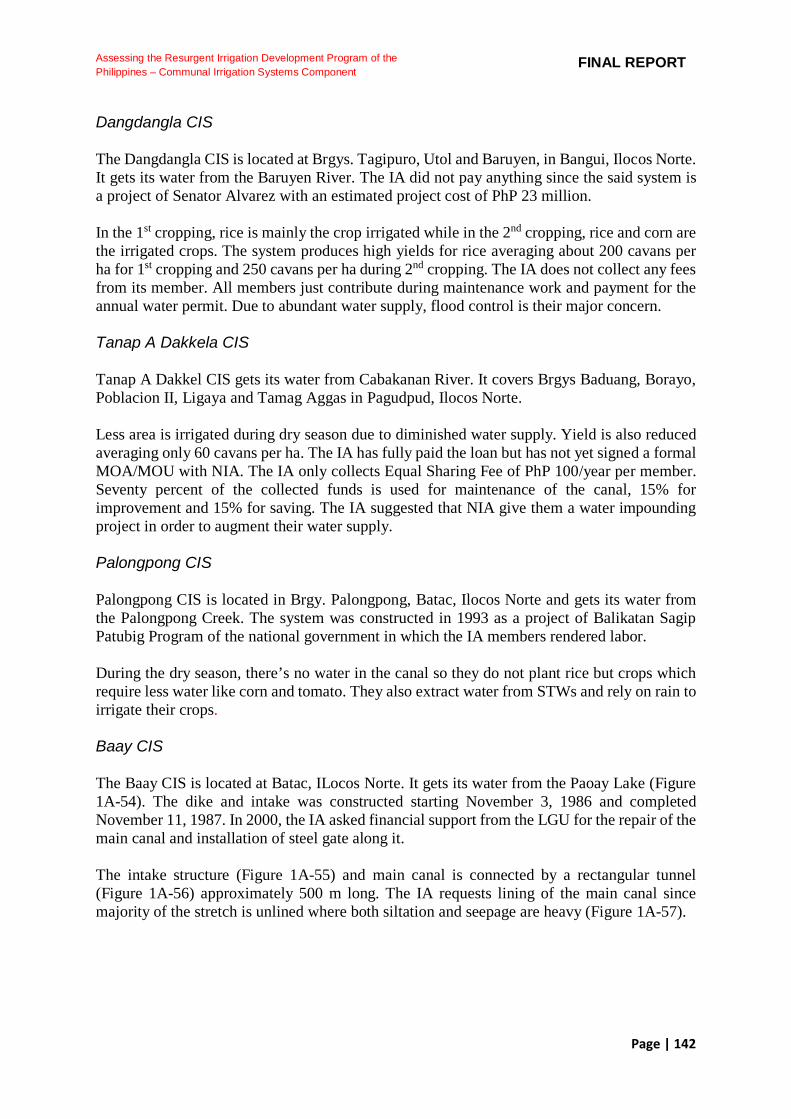
Page | 142
Assessing the Resurgent Irrigation Development Program of the
Philippines – Communal Irrigation Systems Component FINAL REPORT
Dangdangla CIS The Dangdangla CIS is located at Brgys. Tagipuro, Utol and Baruyen, in Bangui, Ilocos Norte. It gets its water from the Baruyen River. The IA did not pay anything since the said system is a project of Senator Alvarez with an estimated project cost of PhP 23 million. In the 1st cropping, rice is mainly the crop irrigated while in the 2nd cropping, rice and corn are the irrigated crops. The system produces high yields for rice averaging about 200 cavans per ha for 1st cropping and 250 cavans per ha during 2nd cropping. The IA does not collect any fees from its member. All members just contribute during maintenance work and payment for the annual water permit. Due to abundant water supply, flood control is their major concern. Tanap A Dakkela CIS Tanap A Dakkel CIS gets its water from Cabakanan River. It covers Brgys Baduang, Borayo, Poblacion II, Ligaya and Tamag Aggas in Pagudpud, Ilocos Norte. Less area is irrigated during dry season due to diminished water supply. Yield is also reduced averaging only 60 cavans per ha. The IA has fully paid the loan but has not yet signed a formal MOA/MOU with NIA. The IA only collects Equal Sharing Fee of PhP 100/year per member. Seventy percent of the collected funds is used for maintenance of the canal, 15% for improvement and 15% for saving. The IA suggested that NIA give them a water impounding project in order to augment their water supply. Palongpong CIS Palongpong CIS is located in Brgy. Palongpong, Batac, Ilocos Norte and gets its water from the Palongpong Creek. The system was constructed in 1993 as a project of Balikatan Sagip Patubig Program of the national government in which the IA members rendered labor. During the dry season, there’s no water in the canal so they do not plant rice but crops which require less water like corn and tomato. They also extract water from STWs and rely on rain to irrigate their crops. Baay CIS The Baay CIS is located at Batac, ILocos Norte. It gets its water from the Paoay Lake (Figure 1A-54). The dike and intake was constructed starting November 3, 1986 and completed November 11, 1987. In 2000, the IA asked financial support from the LGU for the repair of the main canal and installation of steel gate along it. The intake structure (Figure 1A-55) and main canal is connected by a rectangular tunnel (Figure 1A-56) approximately 500 m long. The IA requests lining of the main canal since majority of the stretch is unlined where both siltation and seepage are heavy (Figure 1A-57).

Page | 143
Assessing the Resurgent Irrigation Development Program of the
Philippines – Communal Irrigation Systems Component FINAL REPORT
Figure 1A-54. Paoay Lake where the Baay CIS gets its water Source: Author’s capture
Figure 1A-55. The Baay CIS intake structure Source: Author’s capture
Figure 1A-56. The end of the tunnel connecting the from intake and main canal Source: Author’s capture
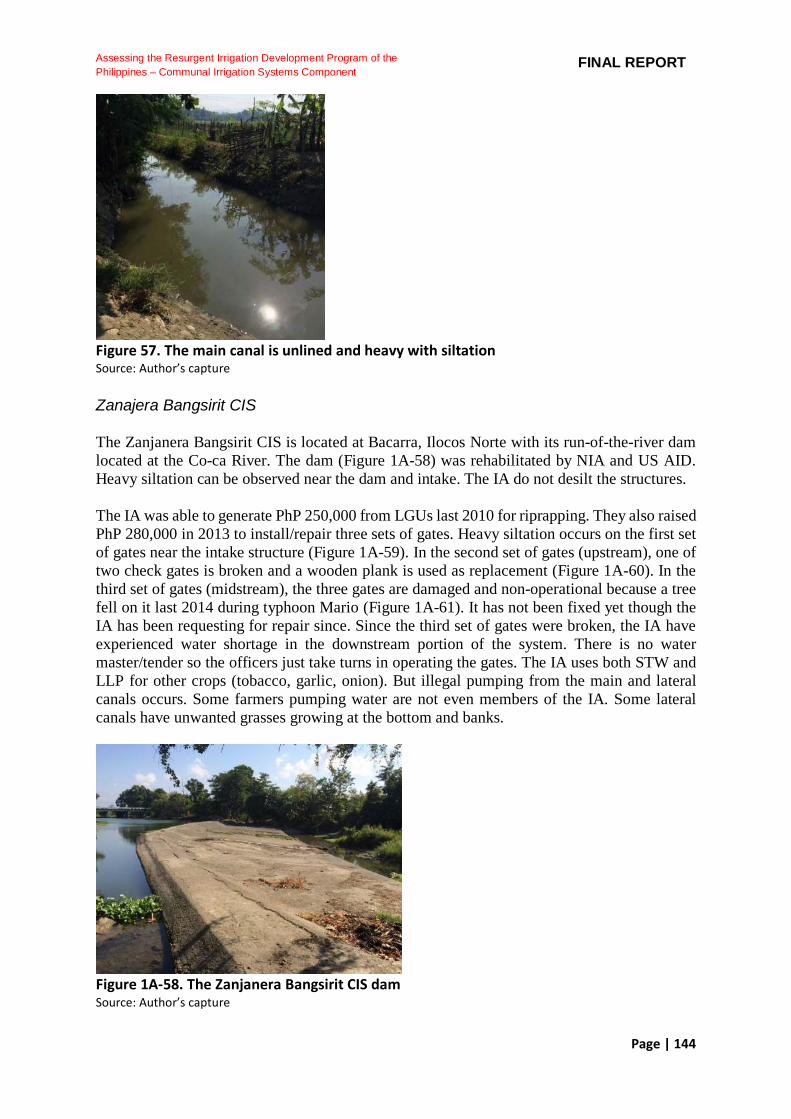
Page | 144
Assessing the Resurgent Irrigation Development Program of the
Philippines – Communal Irrigation Systems Component FINAL REPORT
Figure 57. The main canal is unlined and heavy with siltation Source: Author’s capture Zanajera Bangsirit CIS The Zanjanera Bangsirit CIS is located at Bacarra, Ilocos Norte with its run-of-the-river dam located at the Co-ca River. The dam (Figure 1A-58) was rehabilitated by NIA and US AID. Heavy siltation can be observed near the dam and intake. The IA do not desilt the structures. The IA was able to generate PhP 250,000 from LGUs last 2010 for riprapping. They also raised PhP 280,000 in 2013 to install/repair three sets of gates. Heavy siltation occurs on the first set of gates near the intake structure (Figure 1A-59). In the second set of gates (upstream), one of two check gates is broken and a wooden plank is used as replacement (Figure 1A-60). In the third set of gates (midstream), the three gates are damaged and non-operational because a tree fell on it last 2014 during typhoon Mario (Figure 1A-61). It has not been fixed yet though the IA has been requesting for repair since. Since the third set of gates were broken, the IA have experienced water shortage in the downstream portion of the system. There is no water master/tender so the officers just take turns in operating the gates. The IA uses both STW and LLP for other crops (tobacco, garlic, onion). But illegal pumping from the main and lateral canals occurs. Some farmers pumping water are not even members of the IA. Some lateral canals have unwanted grasses growing at the bottom and banks.
Figure 1A-58. The Zanjanera Bangsirit CIS dam Source: Author’s capture
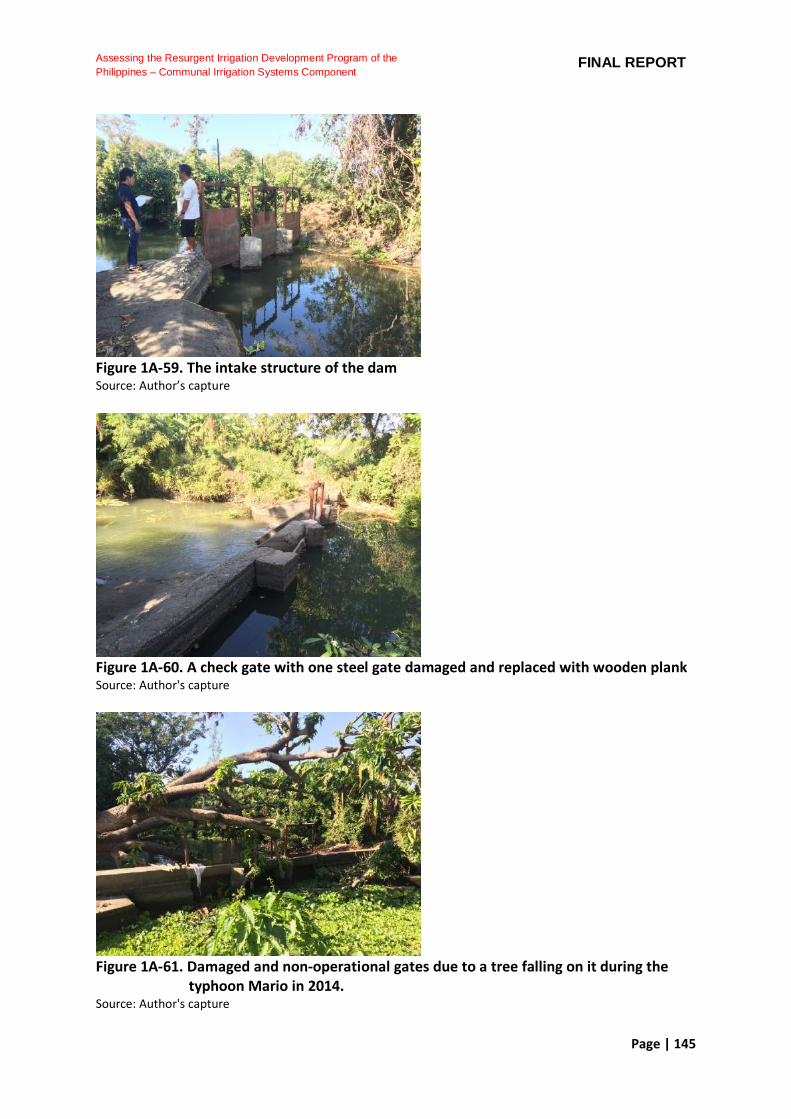
Page | 145
Assessing the Resurgent Irrigation Development Program of the
Philippines – Communal Irrigation Systems Component FINAL REPORT
Figure 1A-59. The intake structure of the dam Source: Author’s capture
Figure 1A-60. A check gate with one steel gate damaged and replaced with wooden plank Source: Author's capture
Figure 1A-61. Damaged and non-operational gates due to a tree falling on it during the
typhoon Mario in 2014. Source: Author's capture
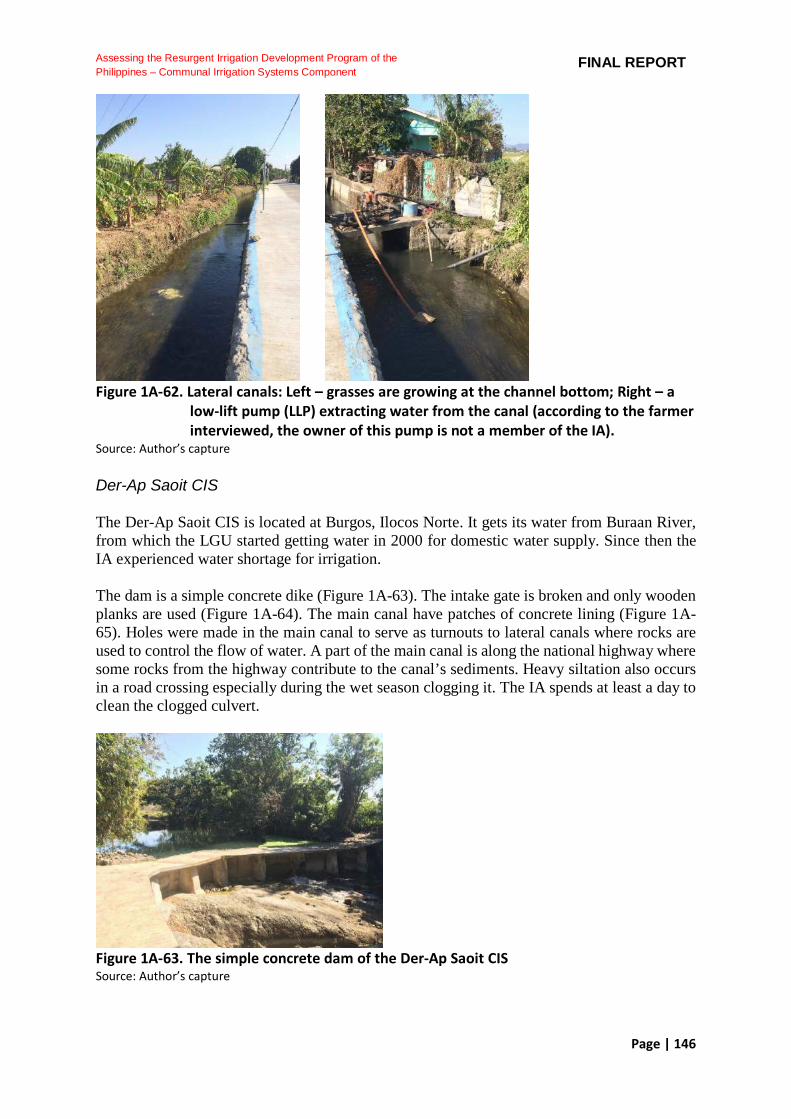
Page | 146
Assessing the Resurgent Irrigation Development Program of the
Philippines – Communal Irrigation Systems Component FINAL REPORT
Figure 1A-62. Lateral canals: Left – grasses are growing at the channel bottom; Right – a
low-lift pump (LLP) extracting water from the canal (according to the farmer interviewed, the owner of this pump is not a member of the IA).
Source: Author’s capture Der-Ap Saoit CIS The Der-Ap Saoit CIS is located at Burgos, Ilocos Norte. It gets its water from Buraan River, from which the LGU started getting water in 2000 for domestic water supply. Since then the IA experienced water shortage for irrigation. The dam is a simple concrete dike (Figure 1A-63). The intake gate is broken and only wooden planks are used (Figure 1A-64). The main canal have patches of concrete lining (Figure 1A-65). Holes were made in the main canal to serve as turnouts to lateral canals where rocks are used to control the flow of water. A part of the main canal is along the national highway where some rocks from the highway contribute to the canal’s sediments. Heavy siltation also occurs in a road crossing especially during the wet season clogging it. The IA spends at least a day to clean the clogged culvert.
Figure 1A-63. The simple concrete dam of the Der-Ap Saoit CIS Source: Author’s capture

Page | 147
Assessing the Resurgent Irrigation Development Program of the
Philippines – Communal Irrigation Systems Component FINAL REPORT
Figure 1A-64. The intake structure with no gate; wooden planks are placed to regulate the
flow of water Source: Author’s capture
Figure 1A-65. Concrete sections of the main canal upstream (left) and midstream (middle);
holes in the concrete canal serving as turnouts for distributing water to laterals; rocks are used to control the flow from the canal (right).
Source: Author’s capture Camarines Sur Maybatang CIS The Maybatang CIS is located at Brgy. San Antonio, Buhi, Camarines Sur and managed by the San Antonio Farmers’ Irrigators Multi-Purpose Cooperative. The system was constructed in the 1979 from a loan made by the IA with NIA. The CIS has two sources of water, the Maybatang River in Polangui, Albay and Camaslog River in Camarines Sur. For the months of February-June, the NWRB water permit granted to the IA from the Maybatang and Camaslog River are 191 lps and 27 lps, respectively. While for the months of July-January, the approved water rights are 277.5 lps and 82.30 lps, respectively. However, Lidot CIS, located in Polangui, Albay obtains water from the main canal of the Maybatang CIS decreasing the
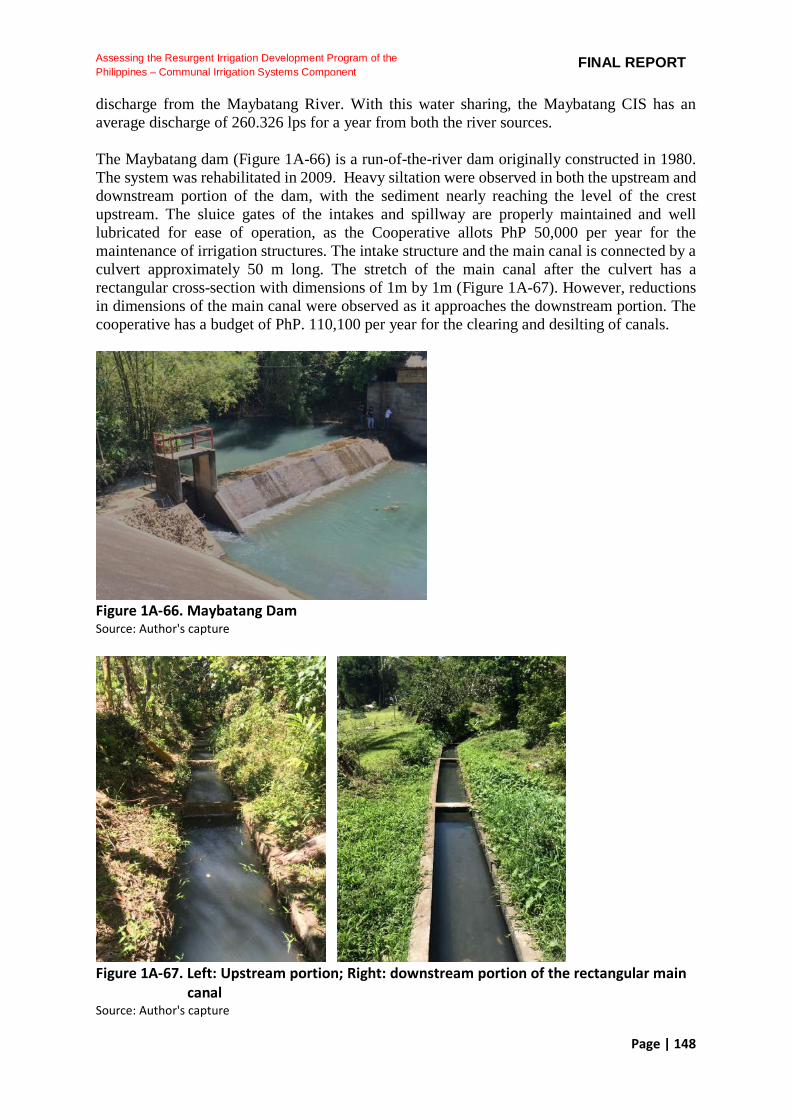
Page | 148
Assessing the Resurgent Irrigation Development Program of the
Philippines – Communal Irrigation Systems Component FINAL REPORT
discharge from the Maybatang River. With this water sharing, the Maybatang CIS has an average discharge of 260.326 lps for a year from both the river sources. The Maybatang dam (Figure 1A-66) is a run-of-the-river dam originally constructed in 1980. The system was rehabilitated in 2009. Heavy siltation were observed in both the upstream and downstream portion of the dam, with the sediment nearly reaching the level of the crest upstream. The sluice gates of the intakes and spillway are properly maintained and well lubricated for ease of operation, as the Cooperative allots PhP 50,000 per year for the maintenance of irrigation structures. The intake structure and the main canal is connected by a culvert approximately 50 m long. The stretch of the main canal after the culvert has a rectangular cross-section with dimensions of 1m by 1m (Figure 1A-67). However, reductions in dimensions of the main canal were observed as it approaches the downstream portion. The cooperative has a budget of PhP. 110,100 per year for the clearing and desilting of canals.
Figure 1A-66. Maybatang Dam Source: Author's capture
Figure 1A-67. Left: Upstream portion; Right: downstream portion of the rectangular main
canal Source: Author's capture
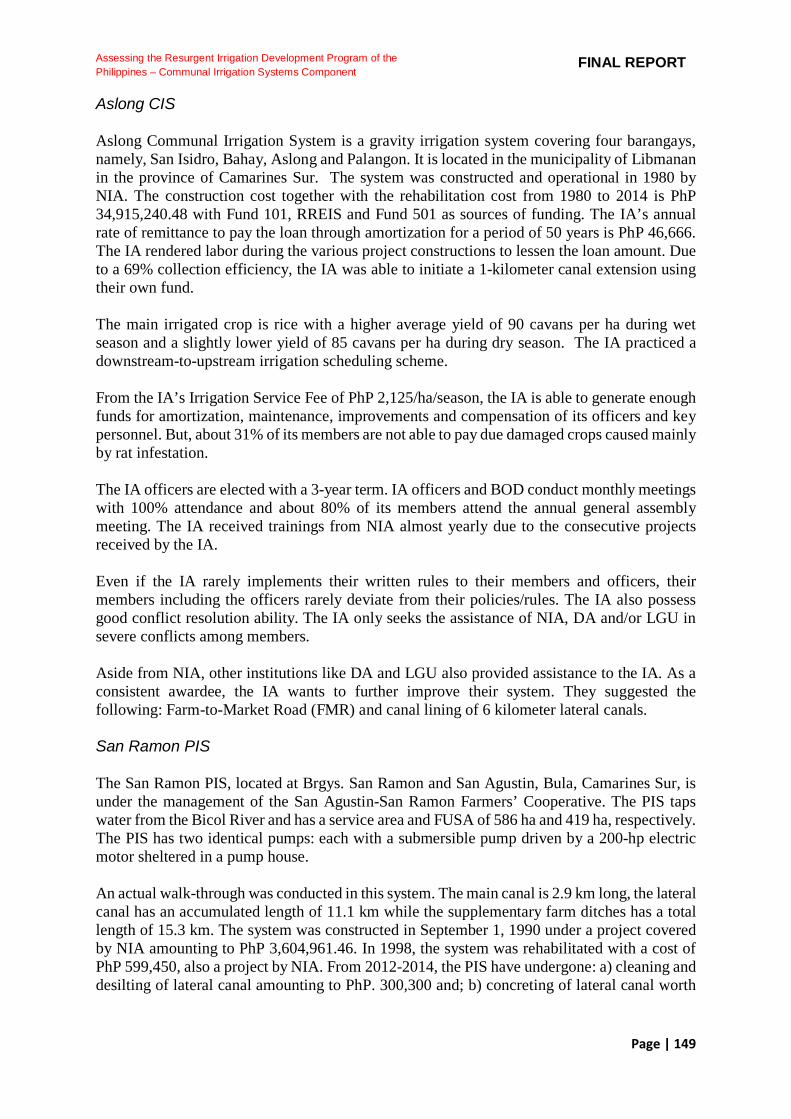
Page | 149
Assessing the Resurgent Irrigation Development Program of the
Philippines – Communal Irrigation Systems Component FINAL REPORT
Aslong CIS Aslong Communal Irrigation System is a gravity irrigation system covering four barangays, namely, San Isidro, Bahay, Aslong and Palangon. It is located in the municipality of Libmanan in the province of Camarines Sur. The system was constructed and operational in 1980 by NIA. The construction cost together with the rehabilitation cost from 1980 to 2014 is PhP 34,915,240.48 with Fund 101, RREIS and Fund 501 as sources of funding. The IA’s annual rate of remittance to pay the loan through amortization for a period of 50 years is PhP 46,666. The IA rendered labor during the various project constructions to lessen the loan amount. Due to a 69% collection efficiency, the IA was able to initiate a 1-kilometer canal extension using their own fund. The main irrigated crop is rice with a higher average yield of 90 cavans per ha during wet season and a slightly lower yield of 85 cavans per ha during dry season. The IA practiced a downstream-to-upstream irrigation scheduling scheme. From the IA’s Irrigation Service Fee of PhP 2,125/ha/season, the IA is able to generate enough funds for amortization, maintenance, improvements and compensation of its officers and key personnel. But, about 31% of its members are not able to pay due damaged crops caused mainly by rat infestation. The IA officers are elected with a 3-year term. IA officers and BOD conduct monthly meetings with 100% attendance and about 80% of its members attend the annual general assembly meeting. The IA received trainings from NIA almost yearly due to the consecutive projects received by the IA. Even if the IA rarely implements their written rules to their members and officers, their members including the officers rarely deviate from their policies/rules. The IA also possess good conflict resolution ability. The IA only seeks the assistance of NIA, DA and/or LGU in severe conflicts among members. Aside from NIA, other institutions like DA and LGU also provided assistance to the IA. As a consistent awardee, the IA wants to further improve their system. They suggested the following: Farm-to-Market Road (FMR) and canal lining of 6 kilometer lateral canals. San Ramon PIS The San Ramon PIS, located at Brgys. San Ramon and San Agustin, Bula, Camarines Sur, is under the management of the San Agustin-San Ramon Farmers’ Cooperative. The PIS taps water from the Bicol River and has a service area and FUSA of 586 ha and 419 ha, respectively. The PIS has two identical pumps: each with a submersible pump driven by a 200-hp electric motor sheltered in a pump house. An actual walk-through was conducted in this system. The main canal is 2.9 km long, the lateral canal has an accumulated length of 11.1 km while the supplementary farm ditches has a total length of 15.3 km. The system was constructed in September 1, 1990 under a project covered by NIA amounting to PhP 3,604,961.46. In 1998, the system was rehabilitated with a cost of PhP 599,450, also a project by NIA. From 2012-2014, the PIS have undergone: a) cleaning and desilting of lateral canal amounting to PhP. 300,300 and; b) concreting of lateral canal worth
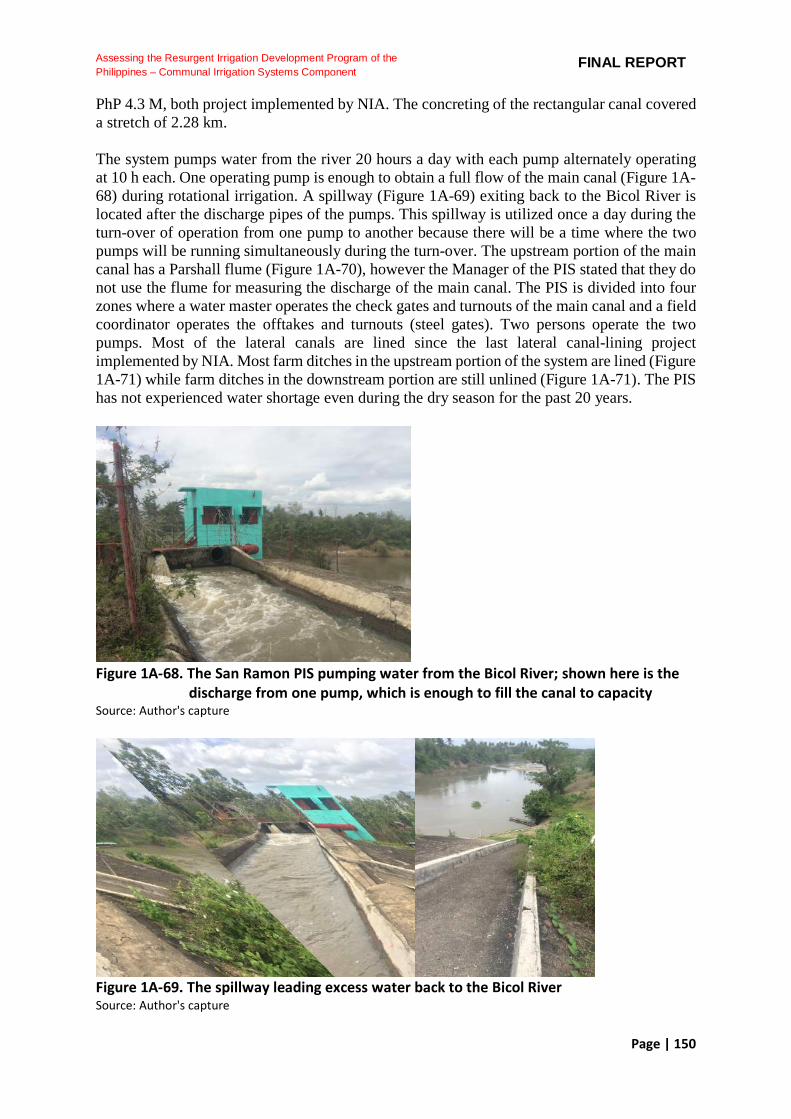
Page | 150
Assessing the Resurgent Irrigation Development Program of the
Philippines – Communal Irrigation Systems Component FINAL REPORT
PhP 4.3 M, both project implemented by NIA. The concreting of the rectangular canal covered a stretch of 2.28 km. The system pumps water from the river 20 hours a day with each pump alternately operating at 10 h each. One operating pump is enough to obtain a full flow of the main canal (Figure 1A-68) during rotational irrigation. A spillway (Figure 1A-69) exiting back to the Bicol River is located after the discharge pipes of the pumps. This spillway is utilized once a day during the turn-over of operation from one pump to another because there will be a time where the two pumps will be running simultaneously during the turn-over. The upstream portion of the main canal has a Parshall flume (Figure 1A-70), however the Manager of the PIS stated that they do not use the flume for measuring the discharge of the main canal. The PIS is divided into four zones where a water master operates the check gates and turnouts of the main canal and a field coordinator operates the offtakes and turnouts (steel gates). Two persons operate the two pumps. Most of the lateral canals are lined since the last lateral canal-lining project implemented by NIA. Most farm ditches in the upstream portion of the system are lined (Figure 1A-71) while farm ditches in the downstream portion are still unlined (Figure 1A-71). The PIS has not experienced water shortage even during the dry season for the past 20 years.
Figure 1A-68. The San Ramon PIS pumping water from the Bicol River; shown here is the
discharge from one pump, which is enough to fill the canal to capacity Source: Author's capture
Figure 1A-69. The spillway leading excess water back to the Bicol River Source: Author's capture
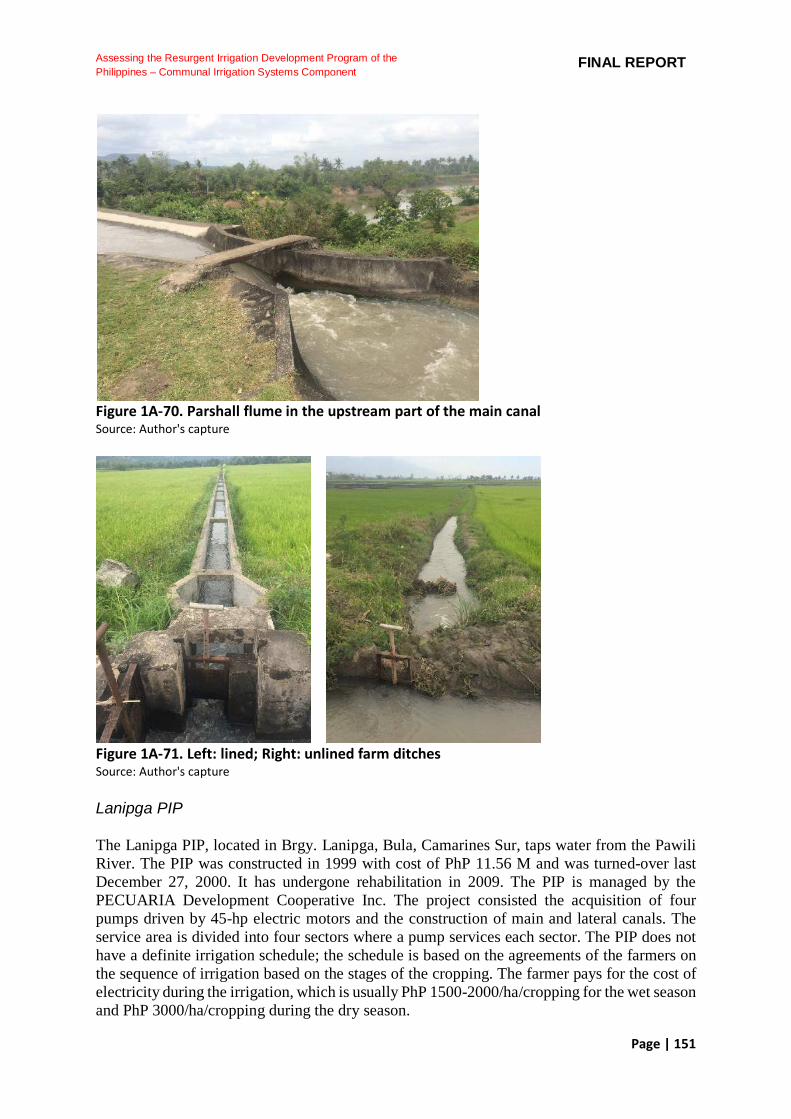
Page | 151
Assessing the Resurgent Irrigation Development Program of the
Philippines – Communal Irrigation Systems Component FINAL REPORT
Figure 1A-70. Parshall flume in the upstream part of the main canal Source: Author's capture
Figure 1A-71. Left: lined; Right: unlined farm ditches Source: Author's capture Lanipga PIP The Lanipga PIP, located in Brgy. Lanipga, Bula, Camarines Sur, taps water from the Pawili River. The PIP was constructed in 1999 with cost of PhP 11.56 M and was turned-over last December 27, 2000. It has undergone rehabilitation in 2009. The PIP is managed by the PECUARIA Development Cooperative Inc. The project consisted the acquisition of four pumps driven by 45-hp electric motors and the construction of main and lateral canals. The service area is divided into four sectors where a pump services each sector. The PIP does not have a definite irrigation schedule; the schedule is based on the agreements of the farmers on the sequence of irrigation based on the stages of the cropping. The farmer pays for the cost of electricity during the irrigation, which is usually PhP 1500-2000/ha/cropping for the wet season and PhP 3000/ha/cropping during the dry season.
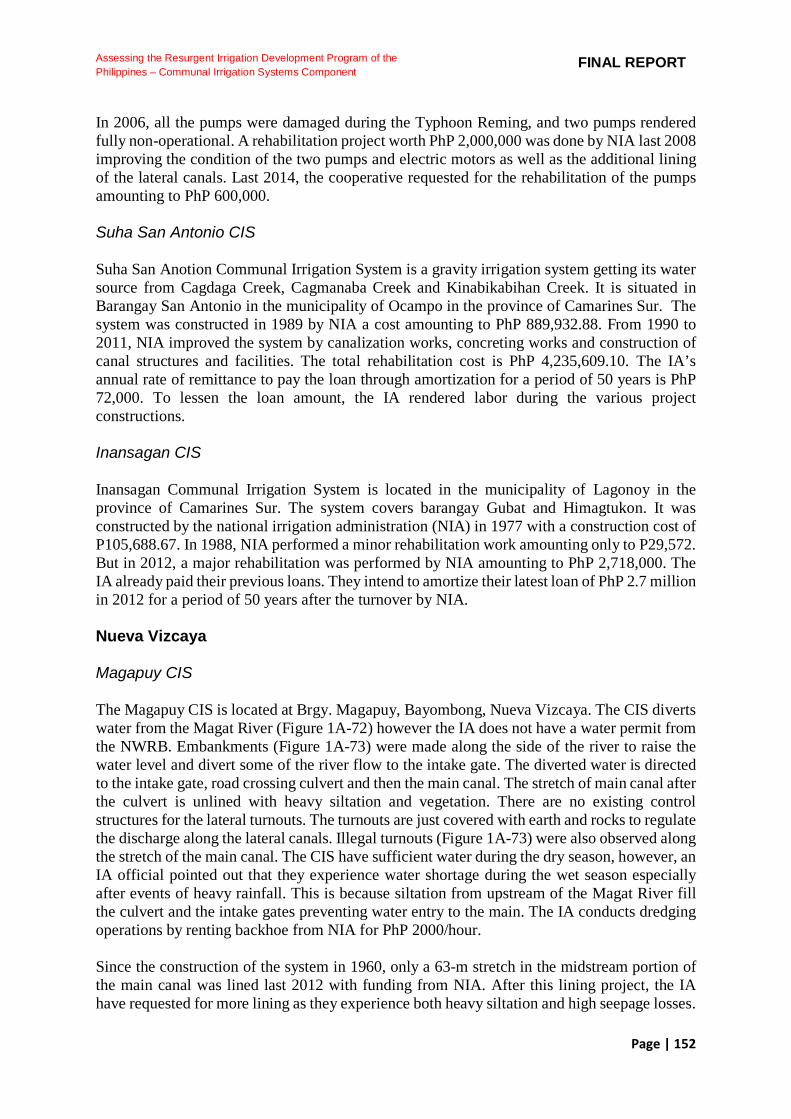
Page | 152
Assessing the Resurgent Irrigation Development Program of the
Philippines – Communal Irrigation Systems Component FINAL REPORT
In 2006, all the pumps were damaged during the Typhoon Reming, and two pumps rendered fully non-operational. A rehabilitation project worth PhP 2,000,000 was done by NIA last 2008 improving the condition of the two pumps and electric motors as well as the additional lining of the lateral canals. Last 2014, the cooperative requested for the rehabilitation of the pumps amounting to PhP 600,000. Suha San Antonio CIS Suha San Anotion Communal Irrigation System is a gravity irrigation system getting its water source from Cagdaga Creek, Cagmanaba Creek and Kinabikabihan Creek. It is situated in Barangay San Antonio in the municipality of Ocampo in the province of Camarines Sur. The system was constructed in 1989 by NIA a cost amounting to PhP 889,932.88. From 1990 to 2011, NIA improved the system by canalization works, concreting works and construction of canal structures and facilities. The total rehabilitation cost is PhP 4,235,609.10. The IA’s annual rate of remittance to pay the loan through amortization for a period of 50 years is PhP 72,000. To lessen the loan amount, the IA rendered labor during the various project constructions. Inansagan CIS Inansagan Communal Irrigation System is located in the municipality of Lagonoy in the province of Camarines Sur. The system covers barangay Gubat and Himagtukon. It was constructed by the national irrigation administration (NIA) in 1977 with a construction cost of P105,688.67. In 1988, NIA performed a minor rehabilitation work amounting only to P29,572. But in 2012, a major rehabilitation was performed by NIA amounting to PhP 2,718,000. The IA already paid their previous loans. They intend to amortize their latest loan of PhP 2.7 million in 2012 for a period of 50 years after the turnover by NIA.
Nueva Vizcaya Magapuy CIS The Magapuy CIS is located at Brgy. Magapuy, Bayombong, Nueva Vizcaya. The CIS diverts water from the Magat River (Figure 1A-72) however the IA does not have a water permit from the NWRB. Embankments (Figure 1A-73) were made along the side of the river to raise the water level and divert some of the river flow to the intake gate. The diverted water is directed to the intake gate, road crossing culvert and then the main canal. The stretch of main canal after the culvert is unlined with heavy siltation and vegetation. There are no existing control structures for the lateral turnouts. The turnouts are just covered with earth and rocks to regulate the discharge along the lateral canals. Illegal turnouts (Figure 1A-73) were also observed along the stretch of the main canal. The CIS have sufficient water during the dry season, however, an IA official pointed out that they experience water shortage during the wet season especially after events of heavy rainfall. This is because siltation from upstream of the Magat River fill the culvert and the intake gates preventing water entry to the main. The IA conducts dredging operations by renting backhoe from NIA for PhP 2000/hour. Since the construction of the system in 1960, only a 63-m stretch in the midstream portion of the main canal was lined last 2012 with funding from NIA. After this lining project, the IA have requested for more lining as they experience both heavy siltation and high seepage losses.

Page | 153
Assessing the Resurgent Irrigation Development Program of the
Philippines – Communal Irrigation Systems Component FINAL REPORT
In 2012 and 2013, NIA conducted rehabilitation projects amounting to PhP 461,000 and PhP 285,000 for canal lining of 50 m and 45 m stretch along the main canal, respectively. The rehabilitation project regained 22 ha and 40 ha of the service area, respectively. Excess water from the Magapuy CIS goes directly to the intake gate of a neighboring Latuyot CIS.
Figure 1A-72. Magat River and the diversion canal of the CIS (left bank) Source: Author's capture
Figure 1A-73. Left: unlined portion of the main canal; Right: lined portion of the main
canal with illegal turnout Source: Author's capture Boliwao CIS The Boliwao CIS is located at Brgy. Boliwao, Bayombong, Nueva Vizcaya. It diverts water from the Boliwao River and serves 73 hectares with 66 farmer beneficiaries. Siltation at the dam (Figure 1A-74) is nearly level with the dam crest. The downstream portion is also heavily silted, with islands already formed in the center of the river. The sluiceway (Figure 1A-74) currently has no gate hence water is constantly flowing through it, except for garbage which restricts the flow. According to an IA official, dredging operations have not yet been done on
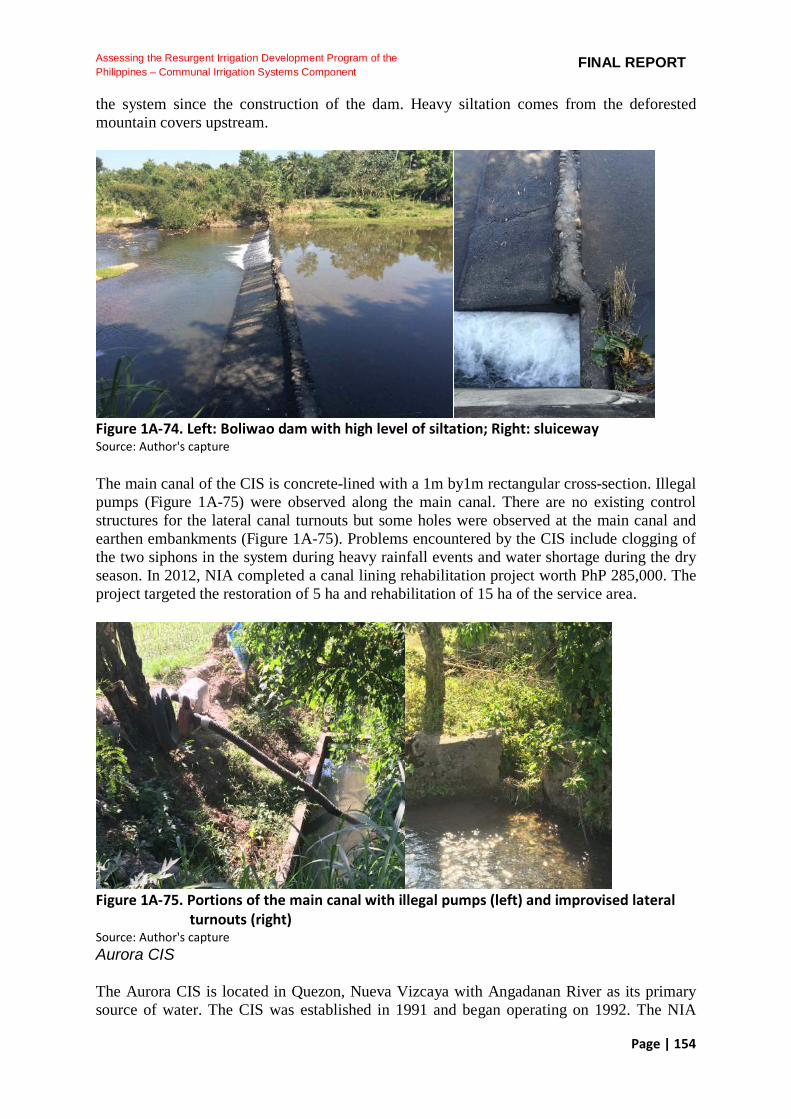
Page | 154
Assessing the Resurgent Irrigation Development Program of the
Philippines – Communal Irrigation Systems Component FINAL REPORT
the system since the construction of the dam. Heavy siltation comes from the deforested mountain covers upstream.
Figure 1A-74. Left: Boliwao dam with high level of siltation; Right: sluiceway Source: Author's capture The main canal of the CIS is concrete-lined with a 1m by1m rectangular cross-section. Illegal pumps (Figure 1A-75) were observed along the main canal. There are no existing control structures for the lateral canal turnouts but some holes were observed at the main canal and earthen embankments (Figure 1A-75). Problems encountered by the CIS include clogging of the two siphons in the system during heavy rainfall events and water shortage during the dry season. In 2012, NIA completed a canal lining rehabilitation project worth PhP 285,000. The project targeted the restoration of 5 ha and rehabilitation of 15 ha of the service area.
Figure 1A-75. Portions of the main canal with illegal pumps (left) and improvised lateral
turnouts (right) Source: Author's capture Aurora CIS The Aurora CIS is located in Quezon, Nueva Vizcaya with Angadanan River as its primary source of water. The CIS was established in 1991 and began operating on 1992. The NIA
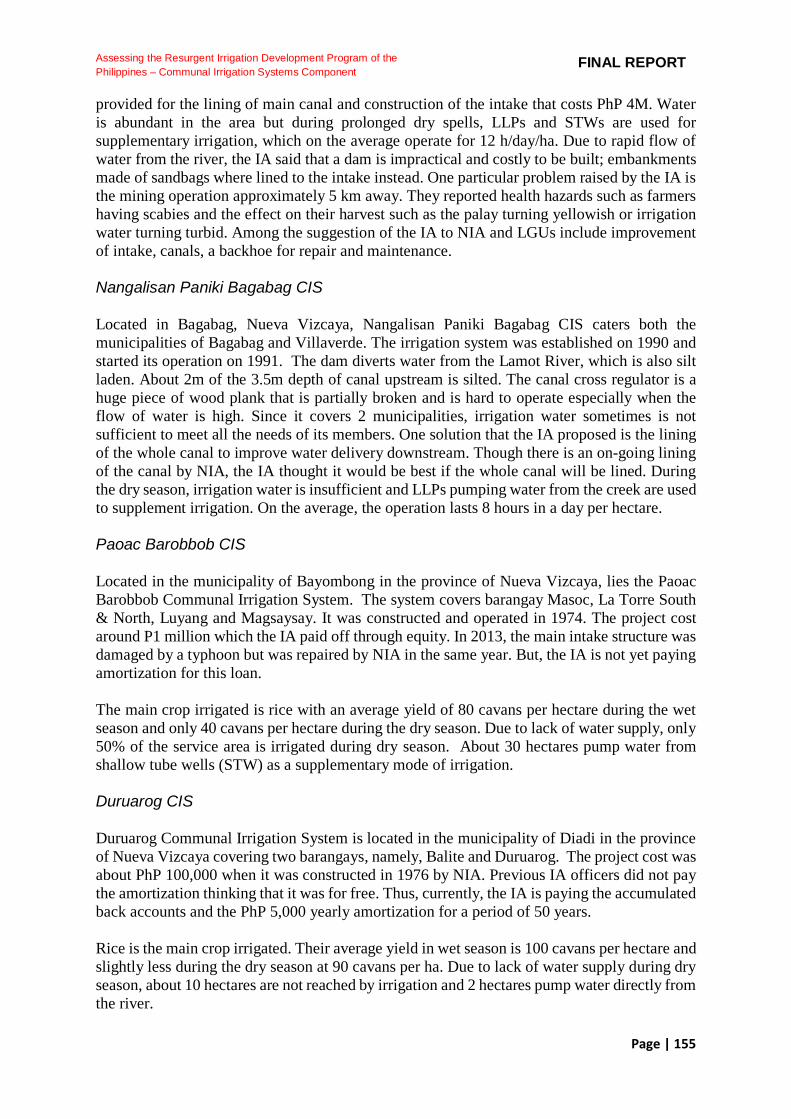
Page | 155
Assessing the Resurgent Irrigation Development Program of the
Philippines – Communal Irrigation Systems Component FINAL REPORT
provided for the lining of main canal and construction of the intake that costs PhP 4M. Water is abundant in the area but during prolonged dry spells, LLPs and STWs are used for supplementary irrigation, which on the average operate for 12 h/day/ha. Due to rapid flow of water from the river, the IA said that a dam is impractical and costly to be built; embankments made of sandbags where lined to the intake instead. One particular problem raised by the IA is the mining operation approximately 5 km away. They reported health hazards such as farmers having scabies and the effect on their harvest such as the palay turning yellowish or irrigation water turning turbid. Among the suggestion of the IA to NIA and LGUs include improvement of intake, canals, a backhoe for repair and maintenance. Nangalisan Paniki Bagabag CIS Located in Bagabag, Nueva Vizcaya, Nangalisan Paniki Bagabag CIS caters both the municipalities of Bagabag and Villaverde. The irrigation system was established on 1990 and started its operation on 1991. The dam diverts water from the Lamot River, which is also silt laden. About 2m of the 3.5m depth of canal upstream is silted. The canal cross regulator is a huge piece of wood plank that is partially broken and is hard to operate especially when the flow of water is high. Since it covers 2 municipalities, irrigation water sometimes is not sufficient to meet all the needs of its members. One solution that the IA proposed is the lining of the whole canal to improve water delivery downstream. Though there is an on-going lining of the canal by NIA, the IA thought it would be best if the whole canal will be lined. During the dry season, irrigation water is insufficient and LLPs pumping water from the creek are used to supplement irrigation. On the average, the operation lasts 8 hours in a day per hectare.
Paoac Barobbob CIS Located in the municipality of Bayombong in the province of Nueva Vizcaya, lies the Paoac Barobbob Communal Irrigation System. The system covers barangay Masoc, La Torre South & North, Luyang and Magsaysay. It was constructed and operated in 1974. The project cost around P1 million which the IA paid off through equity. In 2013, the main intake structure was damaged by a typhoon but was repaired by NIA in the same year. But, the IA is not yet paying amortization for this loan. The main crop irrigated is rice with an average yield of 80 cavans per hectare during the wet season and only 40 cavans per hectare during the dry season. Due to lack of water supply, only 50% of the service area is irrigated during dry season. About 30 hectares pump water from shallow tube wells (STW) as a supplementary mode of irrigation. Duruarog CIS Duruarog Communal Irrigation System is located in the municipality of Diadi in the province of Nueva Vizcaya covering two barangays, namely, Balite and Duruarog. The project cost was about PhP 100,000 when it was constructed in 1976 by NIA. Previous IA officers did not pay the amortization thinking that it was for free. Thus, currently, the IA is paying the accumulated back accounts and the PhP 5,000 yearly amortization for a period of 50 years. Rice is the main crop irrigated. Their average yield in wet season is 100 cavans per hectare and slightly less during the dry season at 90 cavans per ha. Due to lack of water supply during dry season, about 10 hectares are not reached by irrigation and 2 hectares pump water directly from the river.
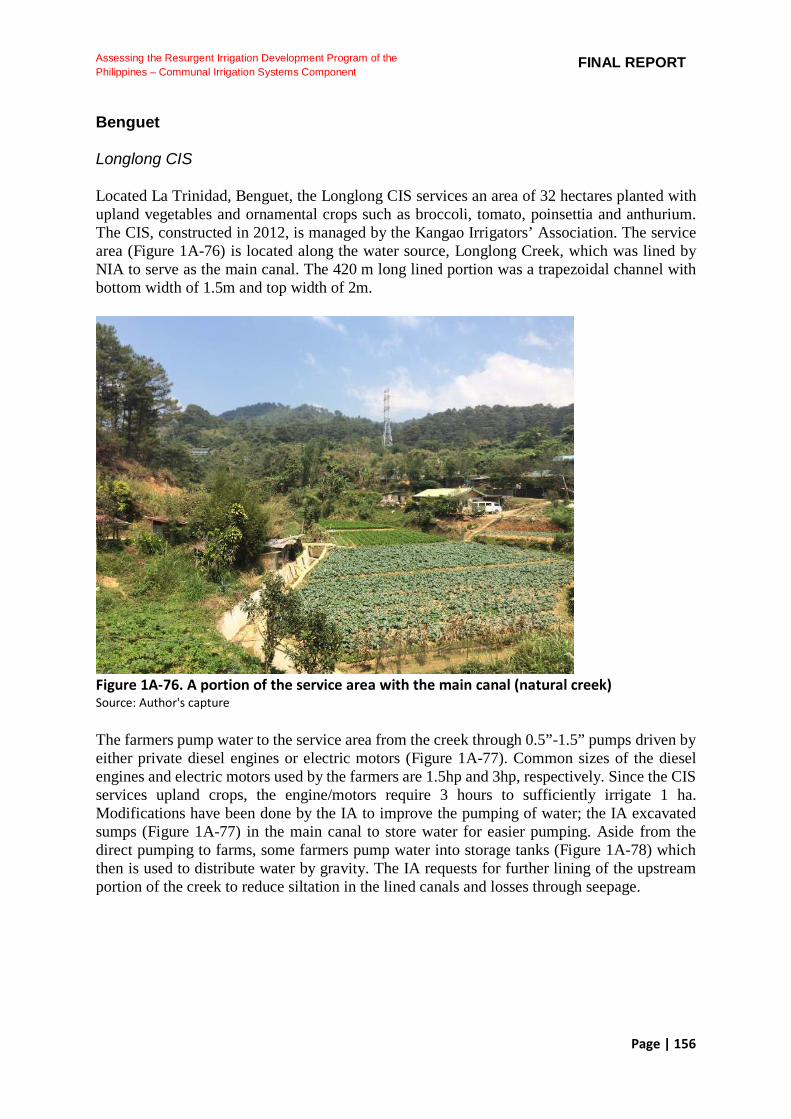
Page | 156
Assessing the Resurgent Irrigation Development Program of the
Philippines – Communal Irrigation Systems Component FINAL REPORT
Benguet Longlong CIS Located La Trinidad, Benguet, the Longlong CIS services an area of 32 hectares planted with upland vegetables and ornamental crops such as broccoli, tomato, poinsettia and anthurium. The CIS, constructed in 2012, is managed by the Kangao Irrigators’ Association. The service area (Figure 1A-76) is located along the water source, Longlong Creek, which was lined by NIA to serve as the main canal. The 420 m long lined portion was a trapezoidal channel with bottom width of 1.5m and top width of 2m.
Figure 1A-76. A portion of the service area with the main canal (natural creek) Source: Author's capture The farmers pump water to the service area from the creek through 0.5”-1.5” pumps driven by either private diesel engines or electric motors (Figure 1A-77). Common sizes of the diesel engines and electric motors used by the farmers are 1.5hp and 3hp, respectively. Since the CIS services upland crops, the engine/motors require 3 hours to sufficiently irrigate 1 ha. Modifications have been done by the IA to improve the pumping of water; the IA excavated sumps (Figure 1A-77) in the main canal to store water for easier pumping. Aside from the direct pumping to farms, some farmers pump water into storage tanks (Figure 1A-78) which then is used to distribute water by gravity. The IA requests for further lining of the upstream portion of the creek to reduce siltation in the lined canals and losses through seepage.
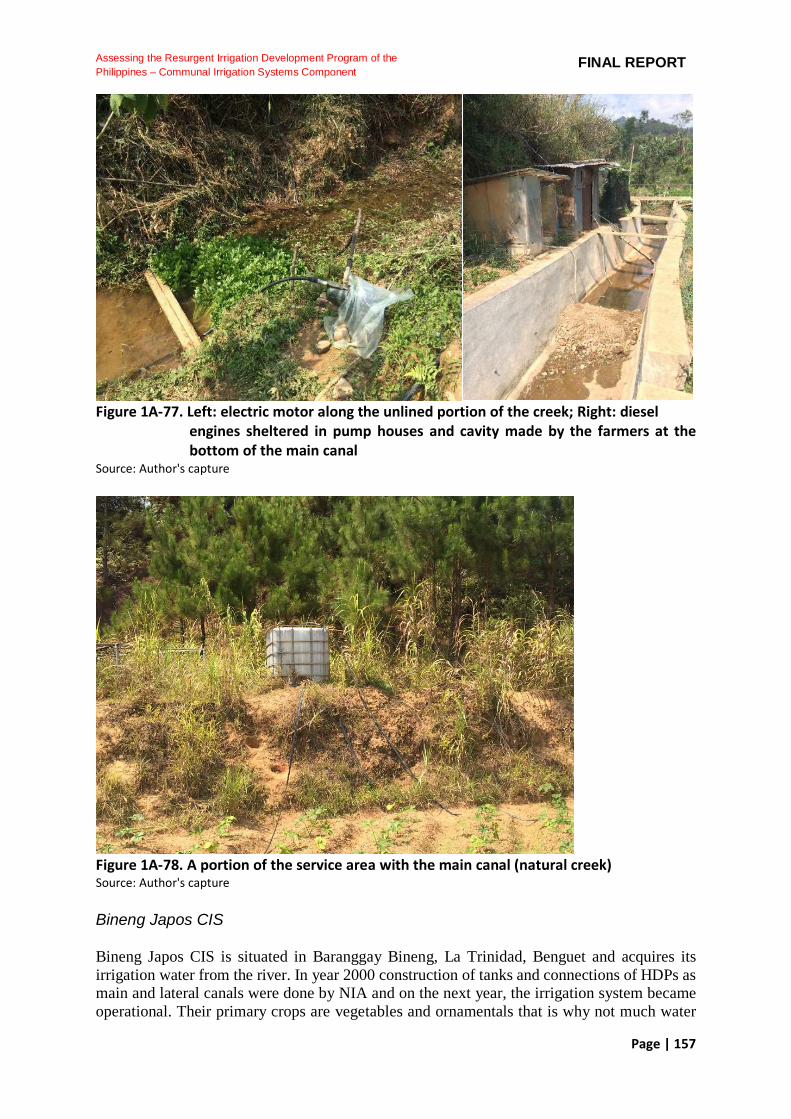
Page | 157
Assessing the Resurgent Irrigation Development Program of the
Philippines – Communal Irrigation Systems Component FINAL REPORT
Figure 1A-77. Left: electric motor along the unlined portion of the creek; Right: diesel
engines sheltered in pump houses and cavity made by the farmers at the bottom of the main canal
Source: Author's capture
Figure 1A-78. A portion of the service area with the main canal (natural creek) Source: Author's capture Bineng Japos CIS Bineng Japos CIS is situated in Baranggay Bineng, La Trinidad, Benguet and acquires its irrigation water from the river. In year 2000 construction of tanks and connections of HDPs as main and lateral canals were done by NIA and on the next year, the irrigation system became operational. Their primary crops are vegetables and ornamentals that is why not much water

Page | 158
Assessing the Resurgent Irrigation Development Program of the
Philippines – Communal Irrigation Systems Component FINAL REPORT
for irrigation is needed. There is not much problem raised in terms of the physical characteristics of the system aside from replacement of some HDPs that are leaking. Sufficiency of irrigation water is not a problem within the IS even in dry season so no mode of supplementary irrigation is done. The IA however suggested that additional lines of irrigation would be of help to improve the area to be planted. Lasong CIS Located in Tuba, Benguet, Lasong CIS gets it water from 2 rivers. The IS was established on 1980 and started operating on 1981. The CIS has two different intakes which were derived from two rivers that converge in a tank (Figure 1A-79). The original project was done in 1978 through the FSDC. The tank and upstream parts of the main canal were damaged during the 1990 earthquake when a fraction of the mountain collapsed. It was repaired in 1995 at a cost of PhP 563,346.4 through the GATT. Subsequent improvements conducted by the NIA include 0.72 km 3-in HDP and a 1.936 km ¾-in lateral worth PhP 1M in 2012 and 0.42 km 3-in HDP and 2.85 km ¾-in lateral worth PhP 1,085,187 in 2013. From the main concrete tank, water is then distributed to several concrete tanks (five 8x8x8 m and one 10x10x10) for storage and distribution to individual farms. The IA used furrow irrigation and sprinklers for irrigating rose plants. During the wet season, water from one river is diverted to an unlined canal to irrigate rice (Figure 1A-80). The IA suggested that NIA have the upstream part of their main canal lined so that water deliveries would be improved. Also, construction of tanks (Figure 1A-80) as water impounding structures in midstream would help them increase irrigation water for midstream and downstream during dry season.
Figure 1A-79. The main tank showing flow of water from the source and the distribution
pipes to the other tanks. Source: Author's capture
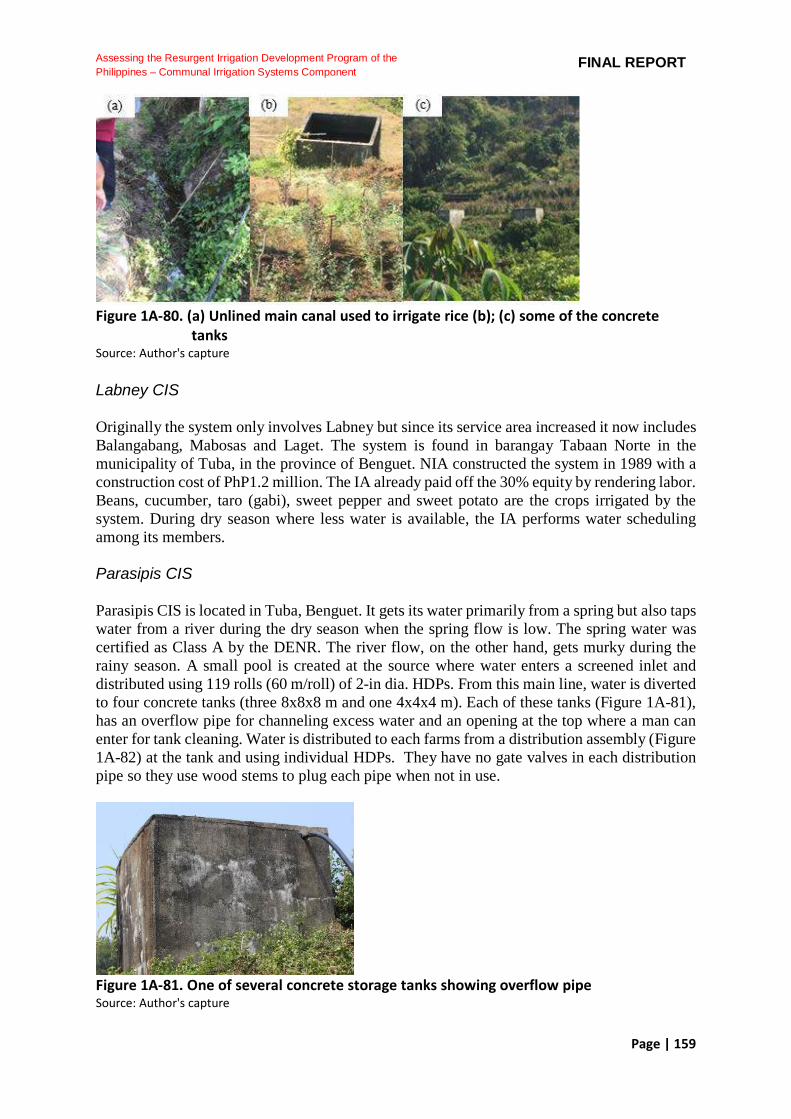
Page | 159
Assessing the Resurgent Irrigation Development Program of the
Philippines – Communal Irrigation Systems Component FINAL REPORT
Figure 1A-80. (a) Unlined main canal used to irrigate rice (b); (c) some of the concrete
tanks Source: Author's capture Labney CIS Originally the system only involves Labney but since its service area increased it now includes Balangabang, Mabosas and Laget. The system is found in barangay Tabaan Norte in the municipality of Tuba, in the province of Benguet. NIA constructed the system in 1989 with a construction cost of PhP1.2 million. The IA already paid off the 30% equity by rendering labor. Beans, cucumber, taro (gabi), sweet pepper and sweet potato are the crops irrigated by the system. During dry season where less water is available, the IA performs water scheduling among its members.
Parasipis CIS Parasipis CIS is located in Tuba, Benguet. It gets its water primarily from a spring but also taps water from a river during the dry season when the spring flow is low. The spring water was certified as Class A by the DENR. The river flow, on the other hand, gets murky during the rainy season. A small pool is created at the source where water enters a screened inlet and distributed using 119 rolls (60 m/roll) of 2-in dia. HDPs. From this main line, water is diverted to four concrete tanks (three 8x8x8 m and one 4x4x4 m). Each of these tanks (Figure 1A-81), has an overflow pipe for channeling excess water and an opening at the top where a man can enter for tank cleaning. Water is distributed to each farms from a distribution assembly (Figure 1A-82) at the tank and using individual HDPs. They have no gate valves in each distribution pipe so they use wood stems to plug each pipe when not in use.
Figure 1A-81. One of several concrete storage tanks showing overflow pipe Source: Author's capture
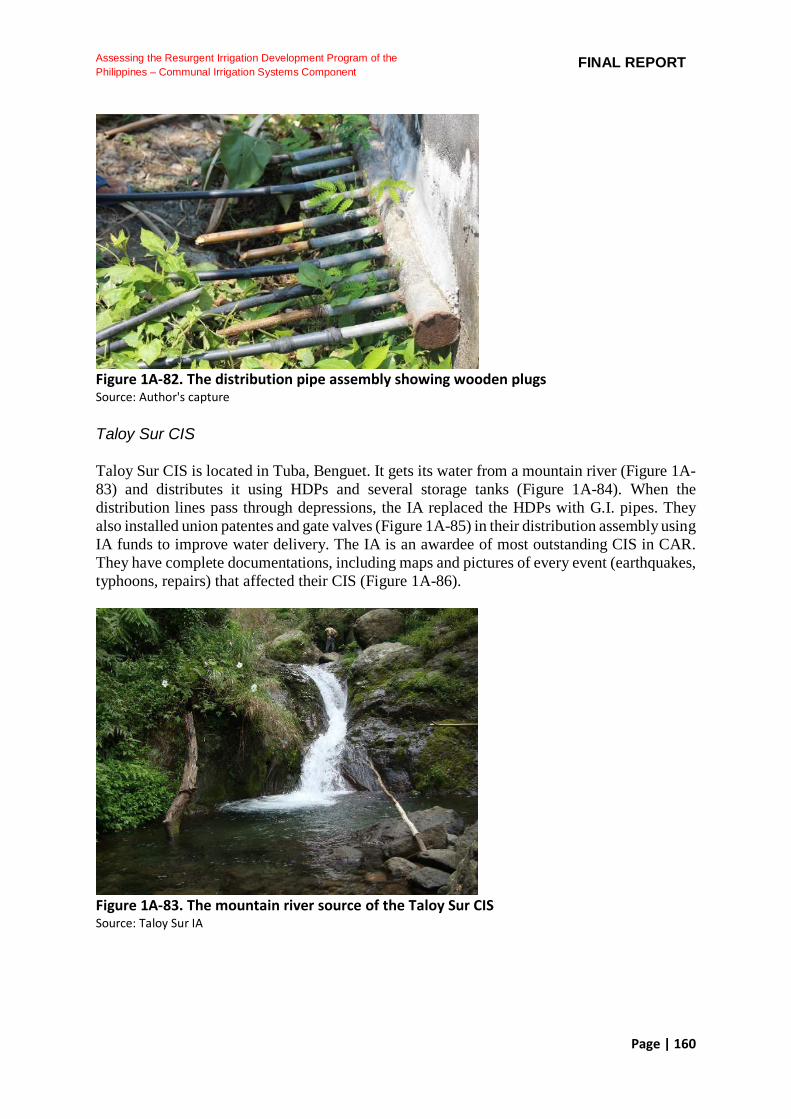
Page | 160
Assessing the Resurgent Irrigation Development Program of the
Philippines – Communal Irrigation Systems Component FINAL REPORT
Figure 1A-82. The distribution pipe assembly showing wooden plugs Source: Author's capture Taloy Sur CIS Taloy Sur CIS is located in Tuba, Benguet. It gets its water from a mountain river (Figure 1A-83) and distributes it using HDPs and several storage tanks (Figure 1A-84). When the distribution lines pass through depressions, the IA replaced the HDPs with G.I. pipes. They also installed union patentes and gate valves (Figure 1A-85) in their distribution assembly using IA funds to improve water delivery. The IA is an awardee of most outstanding CIS in CAR. They have complete documentations, including maps and pictures of every event (earthquakes, typhoons, repairs) that affected their CIS (Figure 1A-86).
Figure 1A-83. The mountain river source of the Taloy Sur CIS Source: Taloy Sur IA
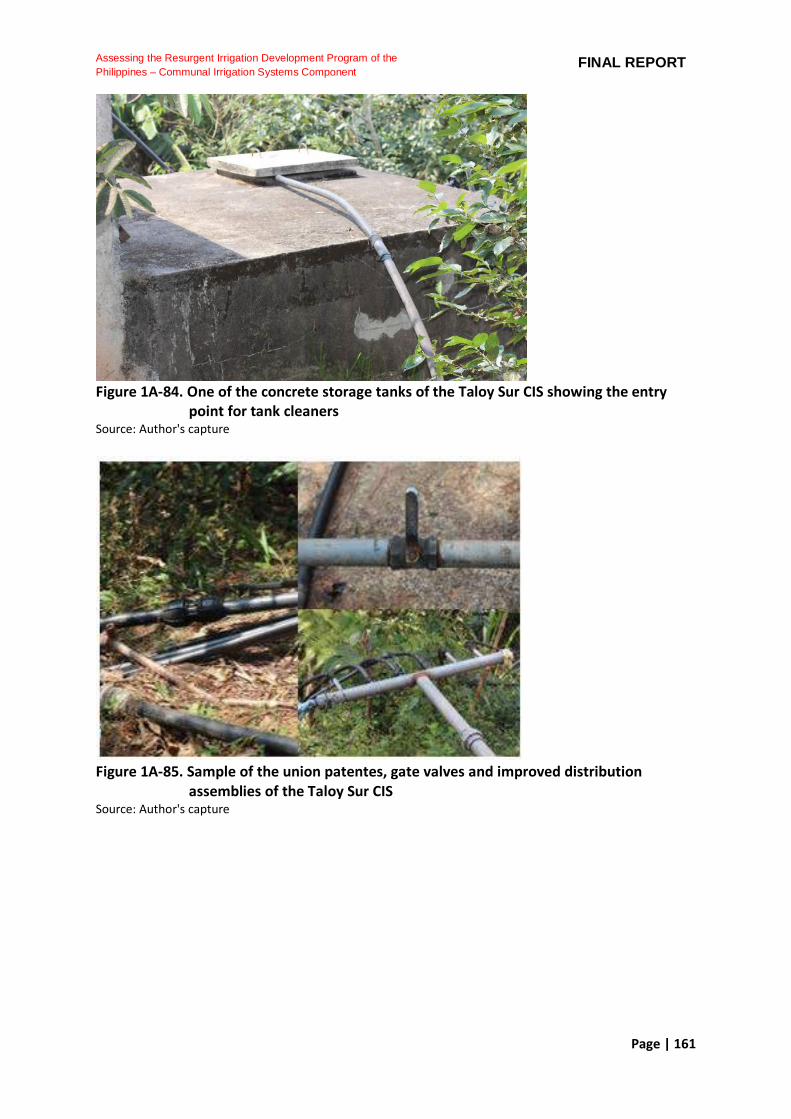
Page | 161
Assessing the Resurgent Irrigation Development Program of the
Philippines – Communal Irrigation Systems Component FINAL REPORT
Figure 1A-84. One of the concrete storage tanks of the Taloy Sur CIS showing the entry
point for tank cleaners Source: Author's capture
Figure 1A-85. Sample of the union patentes, gate valves and improved distribution
assemblies of the Taloy Sur CIS Source: Author's capture
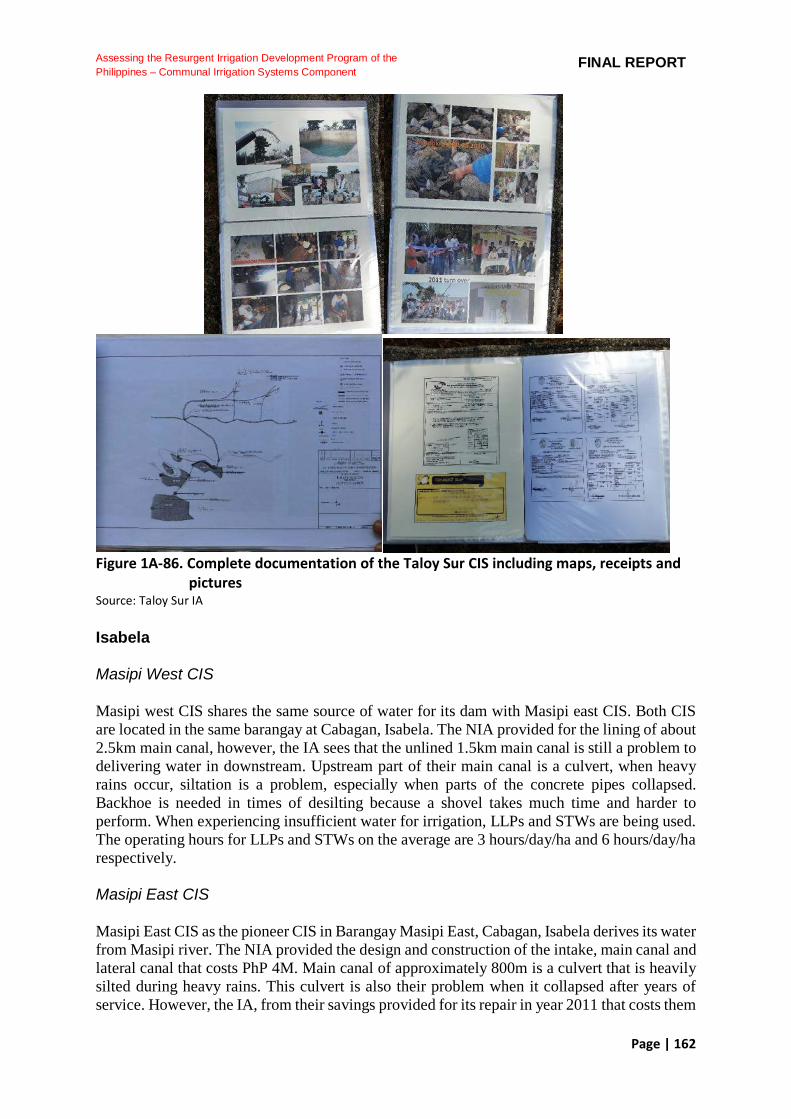
Page | 162
Assessing the Resurgent Irrigation Development Program of the
Philippines – Communal Irrigation Systems Component FINAL REPORT
Figure 1A-86. Complete documentation of the Taloy Sur CIS including maps, receipts and
pictures Source: Taloy Sur IA Isabela Masipi West CIS Masipi west CIS shares the same source of water for its dam with Masipi east CIS. Both CIS are located in the same barangay at Cabagan, Isabela. The NIA provided for the lining of about 2.5km main canal, however, the IA sees that the unlined 1.5km main canal is still a problem to delivering water in downstream. Upstream part of their main canal is a culvert, when heavy rains occur, siltation is a problem, especially when parts of the concrete pipes collapsed. Backhoe is needed in times of desilting because a shovel takes much time and harder to perform. When experiencing insufficient water for irrigation, LLPs and STWs are being used. The operating hours for LLPs and STWs on the average are 3 hours/day/ha and 6 hours/day/ha respectively. Masipi East CIS Masipi East CIS as the pioneer CIS in Barangay Masipi East, Cabagan, Isabela derives its water from Masipi river. The NIA provided the design and construction of the intake, main canal and lateral canal that costs PhP 4M. Main canal of approximately 800m is a culvert that is heavily silted during heavy rains. This culvert is also their problem when it collapsed after years of service. However, the IA, from their savings provided for its repair in year 2011 that costs them

Page | 163
Assessing the Resurgent Irrigation Development Program of the
Philippines – Communal Irrigation Systems Component FINAL REPORT
of about PhP 50,000. Lining of the whole canal and constructions of water impounding structures in midstream are what they were suggesting to NIA. Since nearby CIS is sharing the water source with them, irrigation water is sometimes insufficient especially in dry season, to cope with this problem, supplementary irrigation via LLPs are being used. An average of 24 hours/service/ha is the operating time of the pump. Casilagan Balacong CIS The Casiligan Balacong CIS derives its water from the Bintakan River and has a service area of 175 ha. The old dam (Figure 1A-87) was constructed in 1982 but it was damaged by two typhoons Goring and Iliang. The dam was repaired by NIA in 1996 but this include only the concreting of one side of the dam, construction of a new intake to replace the old one which was a siphon but was fully filled with rocks and sediments during the typhoons, and the dredging and lining of some canals. The dam is filled with sediments and the intake has no screen so the intake canal at the side of the river leading to the main canal is also filled with sediments (Figure 1A-88). The IA guide during the walkthrough said that the original depth of this intake canal may be about 2 man standing on top of another but is now about 3-ft deep. This intake canal was originally covered with concrete slabs but it was removed during one dredging operation and never put back again (Figure 1A-89). The intake canal leads to an intake gate then to a long underground culvert then to the main canal. The gates controlling water flowing to the main canal are still operational but the entry is filled with sediments (Figure 1A-90). The main canal is unlined and the only lateral which runs along the foothills is not only unlined (Figure 1A-91) but is constantly filled with silts from the hills. So the IA are requesting that their canals be lined and the lateral be covered to prevent siltation. There are 6 drops along the main canal.
Figure 1A-87. The old dam (top) and the repaired part (bottom); the old intake can be
seen in between the two Source: Author's capture

Page | 164
Assessing the Resurgent Irrigation Development Program of the
Philippines – Communal Irrigation Systems Component FINAL REPORT
Figure 1A-88. The intake at the side of the dam has no screens and are filled with
sediments Source: Author's capture
Figure 1A-89. The old intake siphon but was filled with sediments during the typhoons
Goring and Iliang Source: Author's capture
Figure 1A-90. The intake canal filled with sediments and the intake gate where the entry
way is also filled with sediments Source: Author's capture

Page | 165
Assessing the Resurgent Irrigation Development Program of the
Philippines – Communal Irrigation Systems Component FINAL REPORT
Figure 1A-91. The unlined main and lateral canal and one of the drop structure combined
with siphon Source: Author's capture Cumabao CIS Cumabao CIS is located at the municipality of Tumauini, Isabela. The CIS taps river from the Balasig River/Creek and services an area of 160 ha. It was granted a water permit of 240 lps. In 1999, the CIS undergone repair and rehabilitation with the project costing Php 2.3 M loaned from NIA. The project included: a.) repair of dam, b.) repair of two siphons, c.) repair of drainage culvert, and d.) re-excavation of canals (6.12 km). After four years, another rehabilitation project was conducted worth Php 3.127 M with similar work items: dam repair, canalization, canal structures and institutional development program. The ogee dam is 2-m high and crest width is 20 m. The IA reported under scouring so the upstream apron and cutoff wall was one those repaired during one rehabilitation roject. The sluiceway is made of flashboards but the intake gate is made of steel. The main canal is concrete-lined at 2.5 km and trapezoidal. Since the area is crisscrossed with the creek, the main canal passes through many culvert pipelines and siphons.
Viola Estate STW This CIS is a collection of 134 units of STWs constructed by NIA and turned-over for management to the ARBA multi-purpose cooperative. The CIS visited was the Santiago cooperative which manage only 45 STW units (Figure 1A-92). Each STW was designed to irrigate 3-ha and the location was based on a survey by NIA. For each STW, 9 m (1 ½ pipe) 4-in dia. PVC pipe was installed with the bottom 3 m perforated, but the total drill depth is around 25 m. The pipe was installed by hammering instead of gravel packing which is usual for NIA STWs. At the surface instead of the usual elbow, a tee was installed but plugged at one end. At the other end, a reducer is installed for a 3-in rubber hose. The STWs use 3x3 self-priming centrifugal pumps (NS-80) (Figure 1A-93). For repair of the packing seal, they use that of a 4x4 pump. The engines used include 7 Hp Yanmar, Mitsubishi and Kubota (Figure 1A-93) and they usually operate below half throttle setting. They only use clay covered with plastic for sealing leaks on pipes and connections.
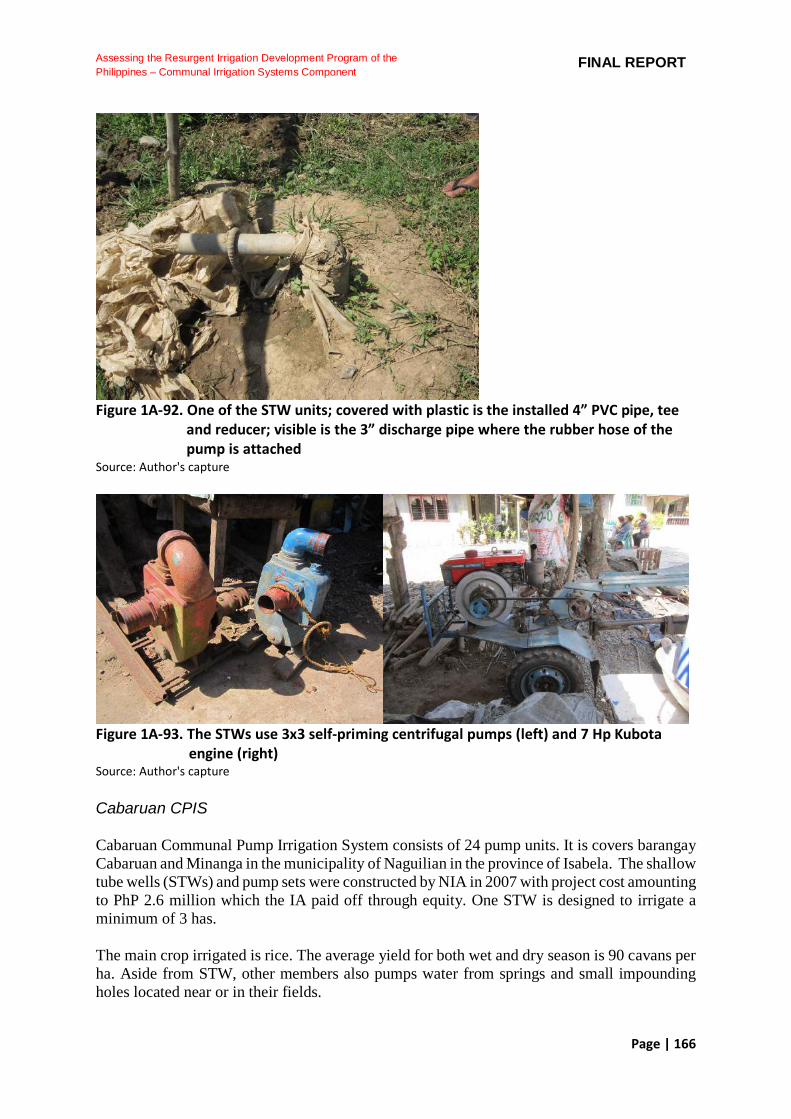
Page | 166
Assessing the Resurgent Irrigation Development Program of the
Philippines – Communal Irrigation Systems Component FINAL REPORT
Figure 1A-92. One of the STW units; covered with plastic is the installed 4” PVC pipe, tee
and reducer; visible is the 3” discharge pipe where the rubber hose of the pump is attached
Source: Author's capture
Figure 1A-93. The STWs use 3x3 self-priming centrifugal pumps (left) and 7 Hp Kubota
engine (right) Source: Author's capture Cabaruan CPIS Cabaruan Communal Pump Irrigation System consists of 24 pump units. It is covers barangay Cabaruan and Minanga in the municipality of Naguilian in the province of Isabela. The shallow tube wells (STWs) and pump sets were constructed by NIA in 2007 with project cost amounting to PhP 2.6 million which the IA paid off through equity. One STW is designed to irrigate a minimum of 3 has. The main crop irrigated is rice. The average yield for both wet and dry season is 90 cavans per ha. Aside from STW, other members also pumps water from springs and small impounding holes located near or in their fields.
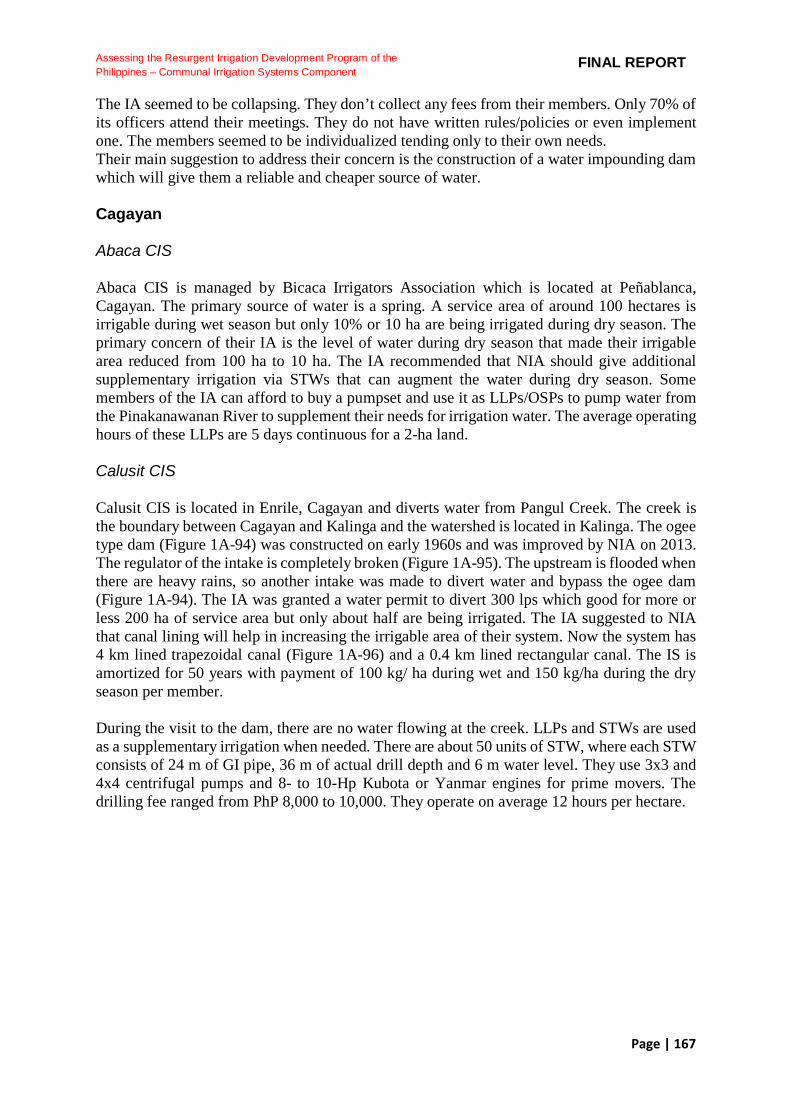
Page | 167
Assessing the Resurgent Irrigation Development Program of the
Philippines – Communal Irrigation Systems Component FINAL REPORT
The IA seemed to be collapsing. They don’t collect any fees from their members. Only 70% of its officers attend their meetings. They do not have written rules/policies or even implement one. The members seemed to be individualized tending only to their own needs. Their main suggestion to address their concern is the construction of a water impounding dam which will give them a reliable and cheaper source of water. Cagayan Abaca CIS Abaca CIS is managed by Bicaca Irrigators Association which is located at Peñablanca, Cagayan. The primary source of water is a spring. A service area of around 100 hectares is irrigable during wet season but only 10% or 10 ha are being irrigated during dry season. The primary concern of their IA is the level of water during dry season that made their irrigable area reduced from 100 ha to 10 ha. The IA recommended that NIA should give additional supplementary irrigation via STWs that can augment the water during dry season. Some members of the IA can afford to buy a pumpset and use it as LLPs/OSPs to pump water from the Pinakanawanan River to supplement their needs for irrigation water. The average operating hours of these LLPs are 5 days continuous for a 2-ha land. Calusit CIS Calusit CIS is located in Enrile, Cagayan and diverts water from Pangul Creek. The creek is the boundary between Cagayan and Kalinga and the watershed is located in Kalinga. The ogee type dam (Figure 1A-94) was constructed on early 1960s and was improved by NIA on 2013. The regulator of the intake is completely broken (Figure 1A-95). The upstream is flooded when there are heavy rains, so another intake was made to divert water and bypass the ogee dam (Figure 1A-94). The IA was granted a water permit to divert 300 lps which good for more or less 200 ha of service area but only about half are being irrigated. The IA suggested to NIA that canal lining will help in increasing the irrigable area of their system. Now the system has 4 km lined trapezoidal canal (Figure 1A-96) and a 0.4 km lined rectangular canal. The IS is amortized for 50 years with payment of 100 kg/ ha during wet and 150 kg/ha during the dry season per member. During the visit to the dam, there are no water flowing at the creek. LLPs and STWs are used as a supplementary irrigation when needed. There are about 50 units of STW, where each STW consists of 24 m of GI pipe, 36 m of actual drill depth and 6 m water level. They use 3x3 and 4x4 centrifugal pumps and 8- to 10-Hp Kubota or Yanmar engines for prime movers. The drilling fee ranged from PhP 8,000 to 10,000. They operate on average 12 hours per hectare.
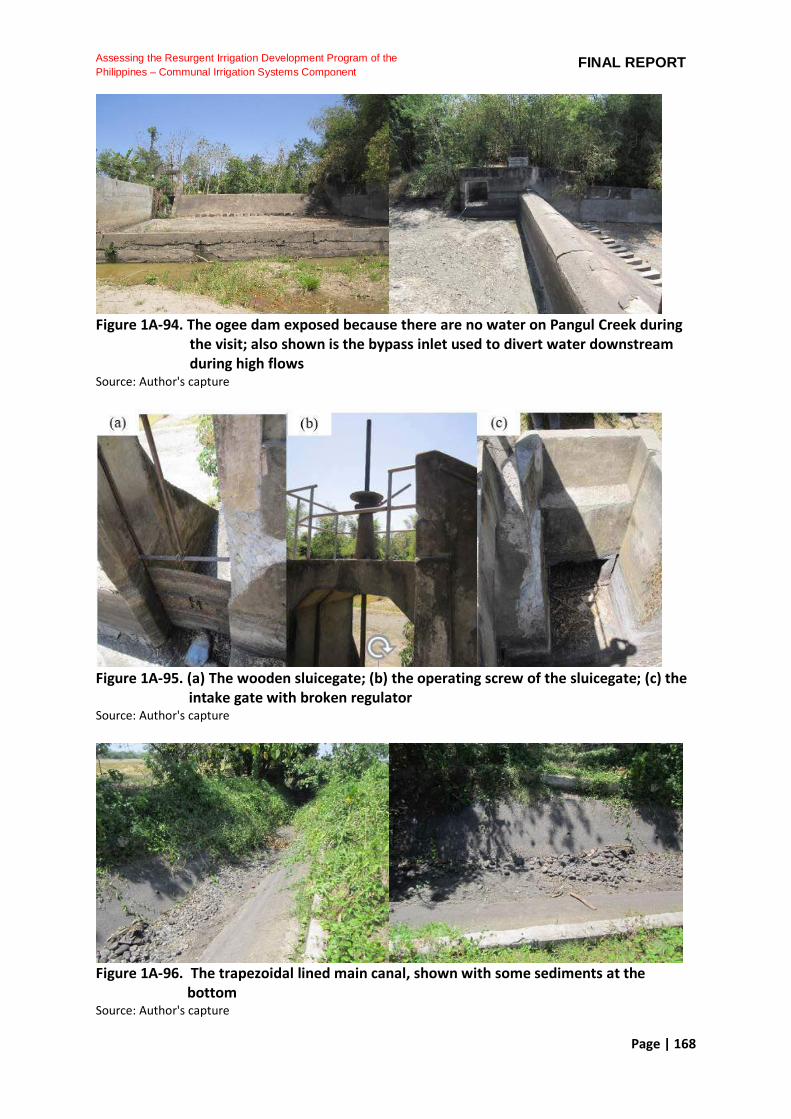
Page | 168
Assessing the Resurgent Irrigation Development Program of the
Philippines – Communal Irrigation Systems Component FINAL REPORT
Figure 1A-94. The ogee dam exposed because there are no water on Pangul Creek during
the visit; also shown is the bypass inlet used to divert water downstream during high flows
Source: Author's capture
Figure 1A-95. (a) The wooden sluicegate; (b) the operating screw of the sluicegate; (c) the
intake gate with broken regulator Source: Author's capture
Figure 1A-96. The trapezoidal lined main canal, shown with some sediments at the
bottom Source: Author's capture
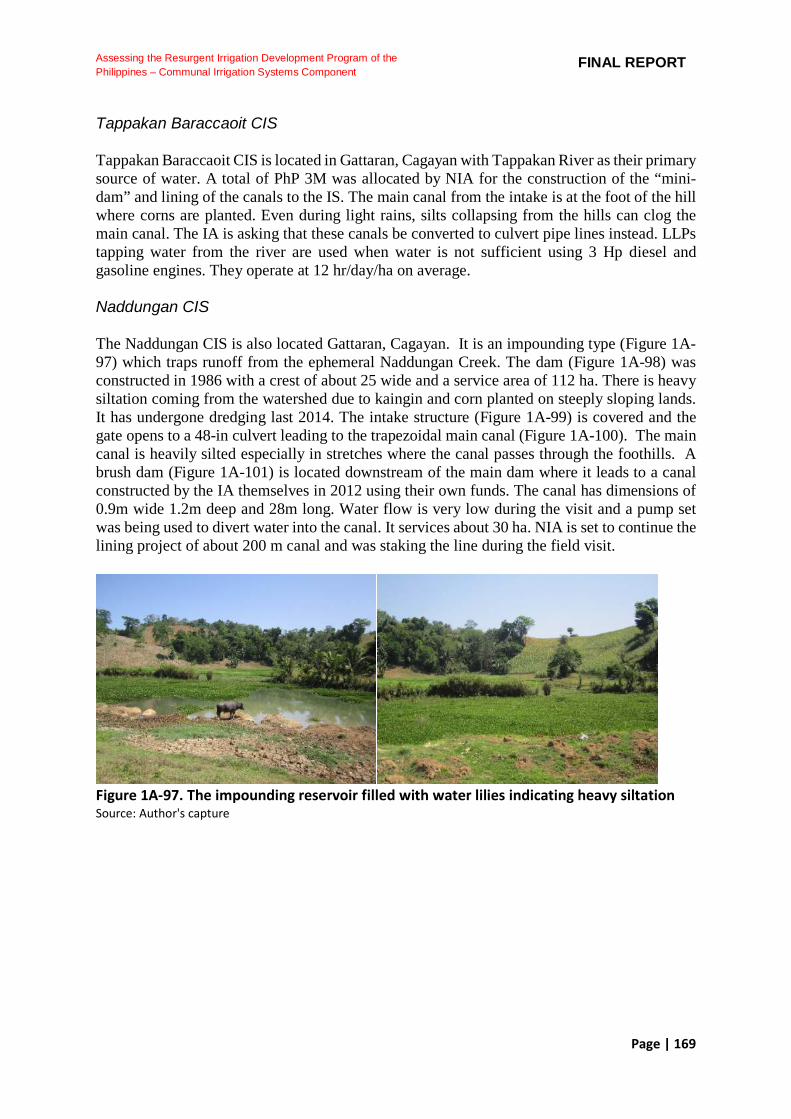
Page | 169
Assessing the Resurgent Irrigation Development Program of the
Philippines – Communal Irrigation Systems Component FINAL REPORT
Tappakan Baraccaoit CIS Tappakan Baraccaoit CIS is located in Gattaran, Cagayan with Tappakan River as their primary source of water. A total of PhP 3M was allocated by NIA for the construction of the “mini-dam” and lining of the canals to the IS. The main canal from the intake is at the foot of the hill where corns are planted. Even during light rains, silts collapsing from the hills can clog the main canal. The IA is asking that these canals be converted to culvert pipe lines instead. LLPs tapping water from the river are used when water is not sufficient using 3 Hp diesel and gasoline engines. They operate at 12 hr/day/ha on average.
Naddungan CIS The Naddungan CIS is also located Gattaran, Cagayan. It is an impounding type (Figure 1A-97) which traps runoff from the ephemeral Naddungan Creek. The dam (Figure 1A-98) was constructed in 1986 with a crest of about 25 wide and a service area of 112 ha. There is heavy siltation coming from the watershed due to kaingin and corn planted on steeply sloping lands. It has undergone dredging last 2014. The intake structure (Figure 1A-99) is covered and the gate opens to a 48-in culvert leading to the trapezoidal main canal (Figure 1A-100). The main canal is heavily silted especially in stretches where the canal passes through the foothills. A brush dam (Figure 1A-101) is located downstream of the main dam where it leads to a canal constructed by the IA themselves in 2012 using their own funds. The canal has dimensions of 0.9m wide 1.2m deep and 28m long. Water flow is very low during the visit and a pump set was being used to divert water into the canal. It services about 30 ha. NIA is set to continue the lining project of about 200 m canal and was staking the line during the field visit.
Figure 1A-97. The impounding reservoir filled with water lilies indicating heavy siltation Source: Author's capture
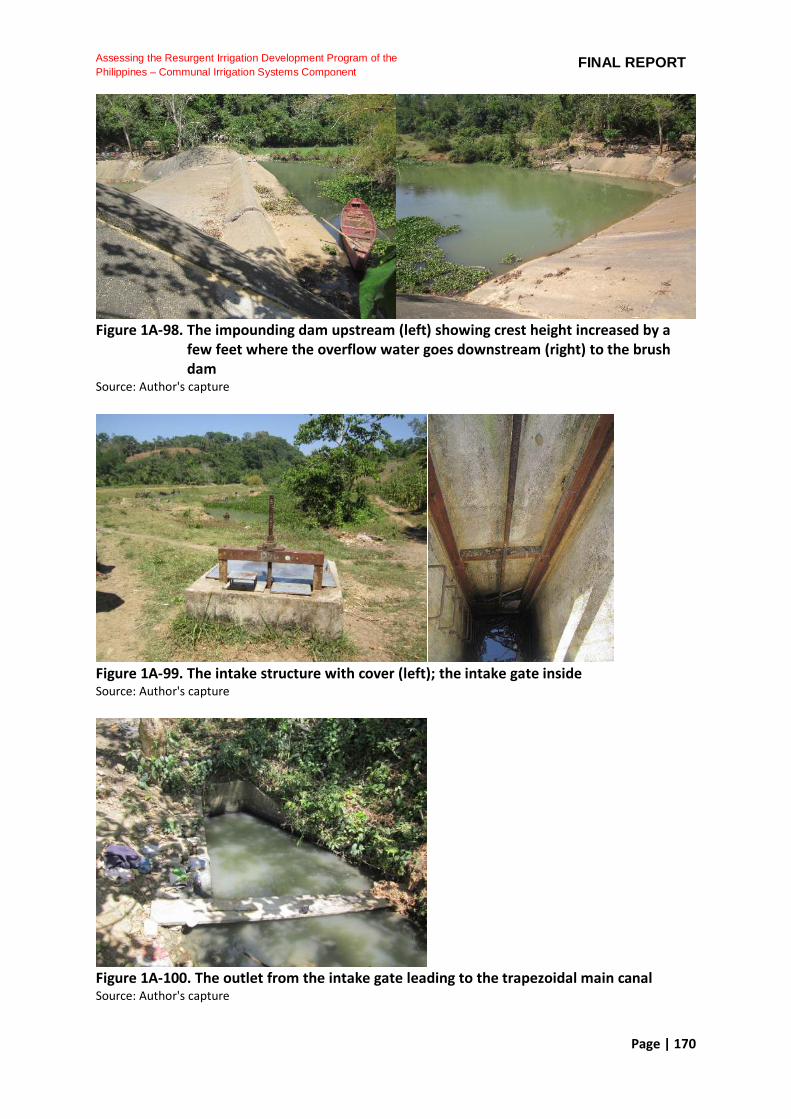
Page | 170
Assessing the Resurgent Irrigation Development Program of the
Philippines – Communal Irrigation Systems Component FINAL REPORT
Figure 1A-98. The impounding dam upstream (left) showing crest height increased by a
few feet where the overflow water goes downstream (right) to the brush dam
Source: Author's capture
Figure 1A-99. The intake structure with cover (left); the intake gate inside Source: Author's capture
Figure 1A-100. The outlet from the intake gate leading to the trapezoidal main canal Source: Author's capture
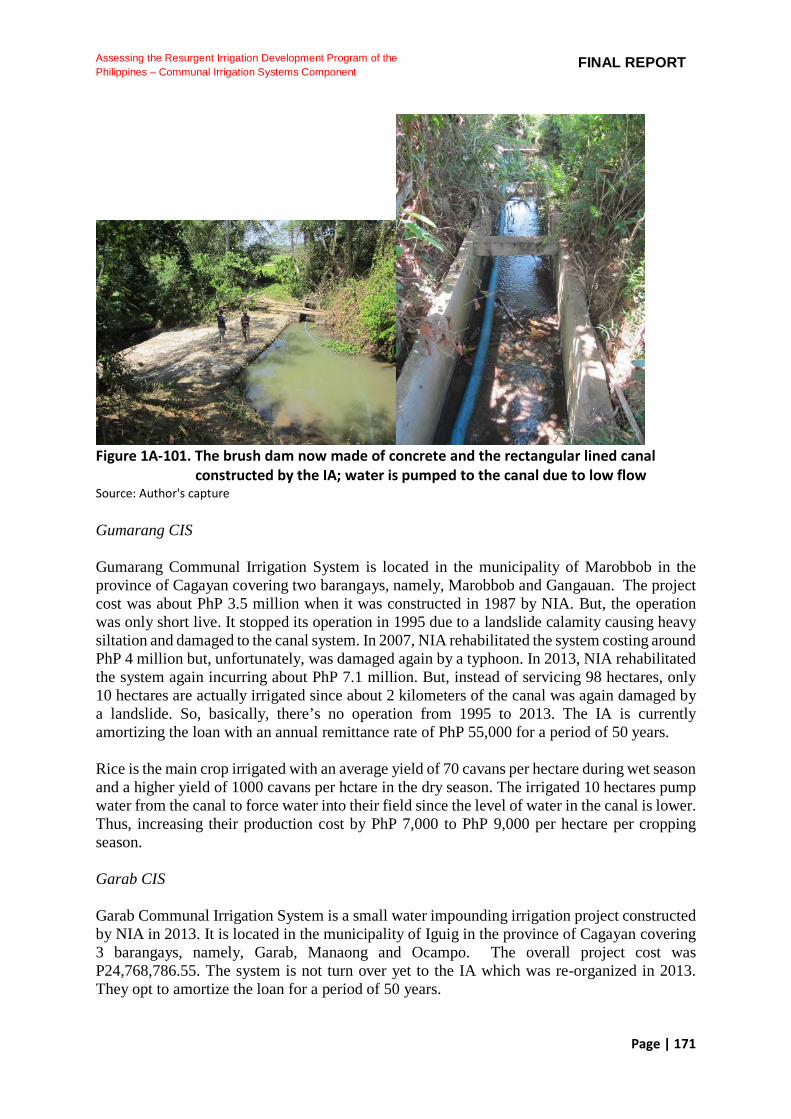
Page | 171
Assessing the Resurgent Irrigation Development Program of the
Philippines – Communal Irrigation Systems Component FINAL REPORT
Figure 1A-101. The brush dam now made of concrete and the rectangular lined canal
constructed by the IA; water is pumped to the canal due to low flow Source: Author's capture Gumarang CIS Gumarang Communal Irrigation System is located in the municipality of Marobbob in the province of Cagayan covering two barangays, namely, Marobbob and Gangauan. The project cost was about PhP 3.5 million when it was constructed in 1987 by NIA. But, the operation was only short live. It stopped its operation in 1995 due to a landslide calamity causing heavy siltation and damaged to the canal system. In 2007, NIA rehabilitated the system costing around PhP 4 million but, unfortunately, was damaged again by a typhoon. In 2013, NIA rehabilitated the system again incurring about PhP 7.1 million. But, instead of servicing 98 hectares, only 10 hectares are actually irrigated since about 2 kilometers of the canal was again damaged by a landslide. So, basically, there’s no operation from 1995 to 2013. The IA is currently amortizing the loan with an annual remittance rate of PhP 55,000 for a period of 50 years. Rice is the main crop irrigated with an average yield of 70 cavans per hectare during wet season and a higher yield of 1000 cavans per hctare in the dry season. The irrigated 10 hectares pump water from the canal to force water into their field since the level of water in the canal is lower. Thus, increasing their production cost by PhP 7,000 to PhP 9,000 per hectare per cropping season. Garab CIS Garab Communal Irrigation System is a small water impounding irrigation project constructed by NIA in 2013. It is located in the municipality of Iguig in the province of Cagayan covering 3 barangays, namely, Garab, Manaong and Ocampo. The overall project cost was P24,768,786.55. The system is not turn over yet to the IA which was re-organized in 2013. They opt to amortize the loan for a period of 50 years.
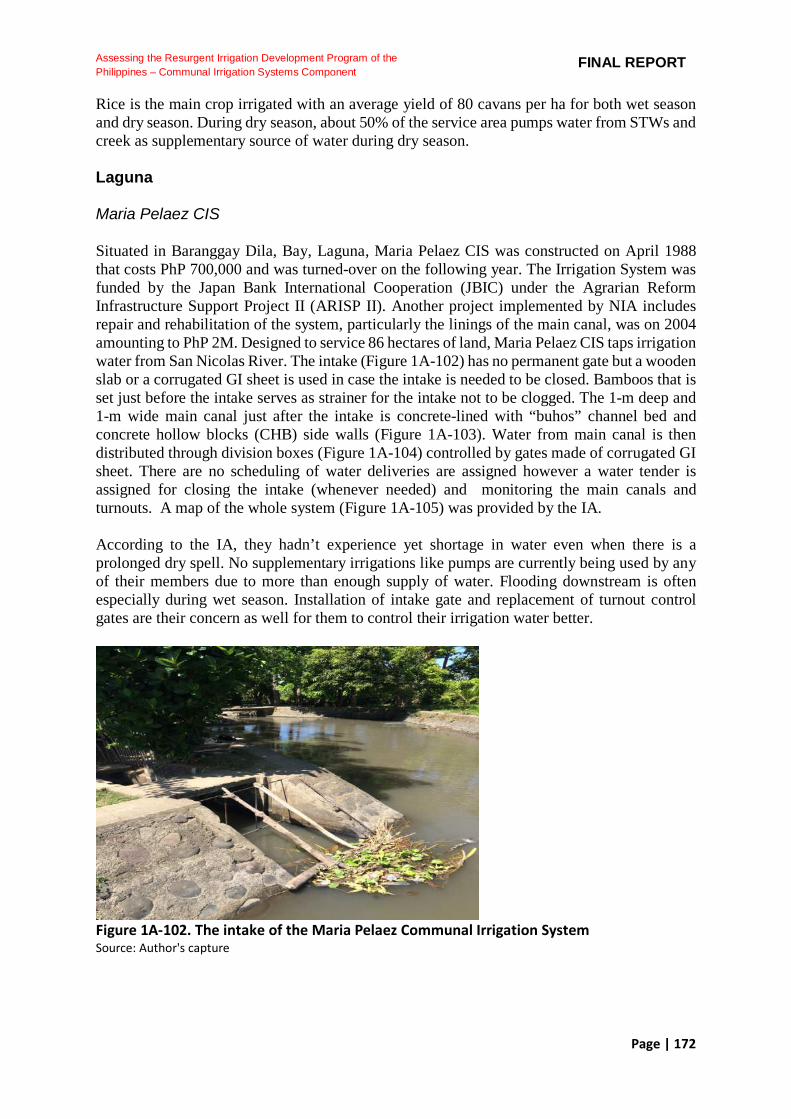
Page | 172
Assessing the Resurgent Irrigation Development Program of the
Philippines – Communal Irrigation Systems Component FINAL REPORT
Rice is the main crop irrigated with an average yield of 80 cavans per ha for both wet season and dry season. During dry season, about 50% of the service area pumps water from STWs and creek as supplementary source of water during dry season. Laguna Maria Pelaez CIS Situated in Baranggay Dila, Bay, Laguna, Maria Pelaez CIS was constructed on April 1988 that costs PhP 700,000 and was turned-over on the following year. The Irrigation System was funded by the Japan Bank International Cooperation (JBIC) under the Agrarian Reform Infrastructure Support Project II (ARISP II). Another project implemented by NIA includes repair and rehabilitation of the system, particularly the linings of the main canal, was on 2004 amounting to PhP 2M. Designed to service 86 hectares of land, Maria Pelaez CIS taps irrigation water from San Nicolas River. The intake (Figure 1A-102) has no permanent gate but a wooden slab or a corrugated GI sheet is used in case the intake is needed to be closed. Bamboos that is set just before the intake serves as strainer for the intake not to be clogged. The 1-m deep and 1-m wide main canal just after the intake is concrete-lined with “buhos” channel bed and concrete hollow blocks (CHB) side walls (Figure 1A-103). Water from main canal is then distributed through division boxes (Figure 1A-104) controlled by gates made of corrugated GI sheet. There are no scheduling of water deliveries are assigned however a water tender is assigned for closing the intake (whenever needed) and monitoring the main canals and turnouts. A map of the whole system (Figure 1A-105) was provided by the IA. According to the IA, they hadn’t experience yet shortage in water even when there is a prolonged dry spell. No supplementary irrigations like pumps are currently being used by any of their members due to more than enough supply of water. Flooding downstream is often especially during wet season. Installation of intake gate and replacement of turnout control gates are their concern as well for them to control their irrigation water better.
Figure 1A-102. The intake of the Maria Pelaez Communal Irrigation System Source: Author's capture
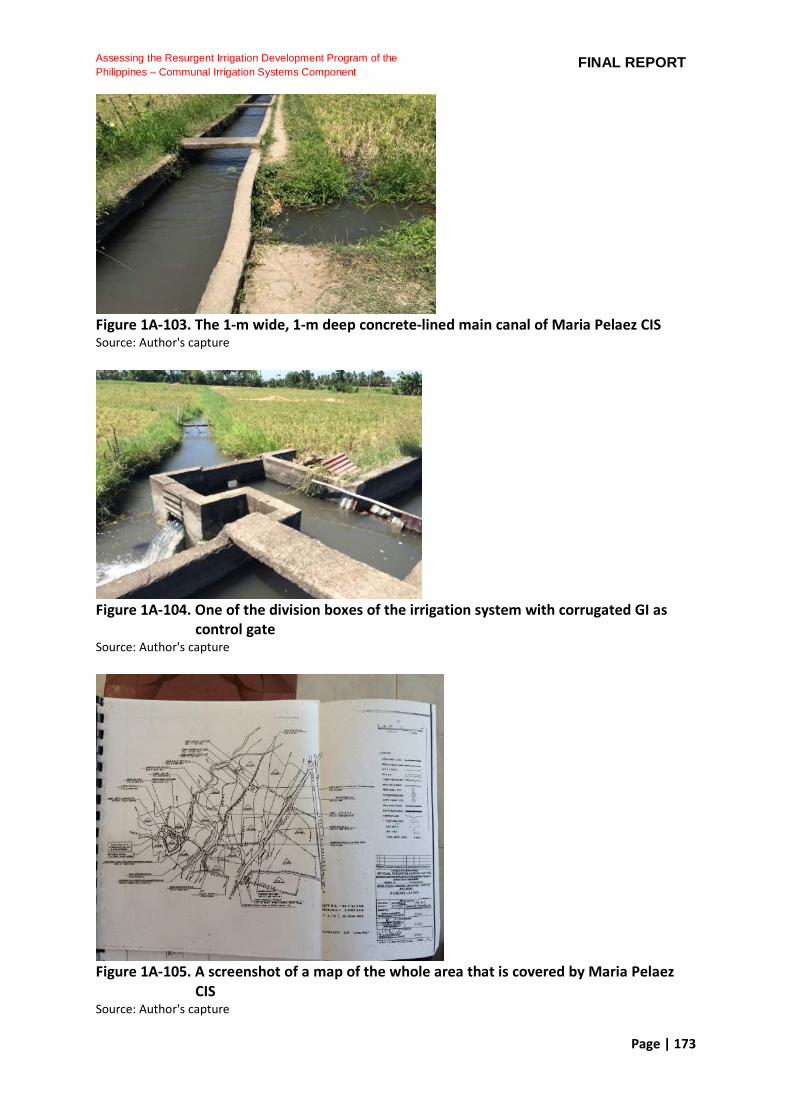
Page | 173
Assessing the Resurgent Irrigation Development Program of the
Philippines – Communal Irrigation Systems Component FINAL REPORT
Figure 1A-103. The 1-m wide, 1-m deep concrete-lined main canal of Maria Pelaez CIS Source: Author's capture
Figure 1A-104. One of the division boxes of the irrigation system with corrugated GI as
control gate Source: Author's capture
Figure 1A-105. A screenshot of a map of the whole area that is covered by Maria Pelaez
CIS Source: Author's capture
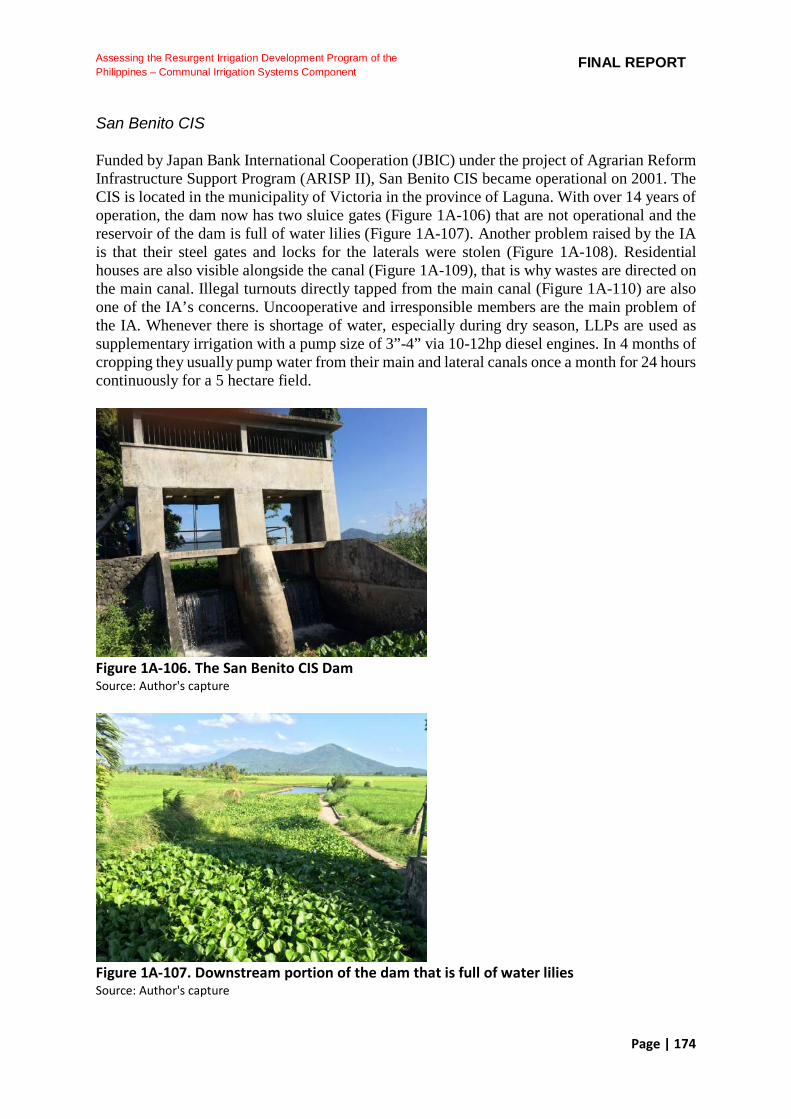
Page | 174
Assessing the Resurgent Irrigation Development Program of the
Philippines – Communal Irrigation Systems Component FINAL REPORT
San Benito CIS Funded by Japan Bank International Cooperation (JBIC) under the project of Agrarian Reform Infrastructure Support Program (ARISP II), San Benito CIS became operational on 2001. The CIS is located in the municipality of Victoria in the province of Laguna. With over 14 years of operation, the dam now has two sluice gates (Figure 1A-106) that are not operational and the reservoir of the dam is full of water lilies (Figure 1A-107). Another problem raised by the IA is that their steel gates and locks for the laterals were stolen (Figure 1A-108). Residential houses are also visible alongside the canal (Figure 1A-109), that is why wastes are directed on the main canal. Illegal turnouts directly tapped from the main canal (Figure 1A-110) are also one of the IA’s concerns. Uncooperative and irresponsible members are the main problem of the IA. Whenever there is shortage of water, especially during dry season, LLPs are used as supplementary irrigation with a pump size of 3”-4” via 10-12hp diesel engines. In 4 months of cropping they usually pump water from their main and lateral canals once a month for 24 hours continuously for a 5 hectare field.
Figure 1A-106. The San Benito CIS Dam Source: Author's capture
Figure 1A-107. Downstream portion of the dam that is full of water lilies Source: Author's capture

Page | 175
Assessing the Resurgent Irrigation Development Program of the
Philippines – Communal Irrigation Systems Component FINAL REPORT
Figure 1A-108. Lateral canal without gate and lock Source: Author's capture
Figure A1-109. A drainage outlet of a house alongside of the main canal Source: Author's capture
Figure 1A-110. Illegal turnouts directly tapped on main canal Source: Author's capture
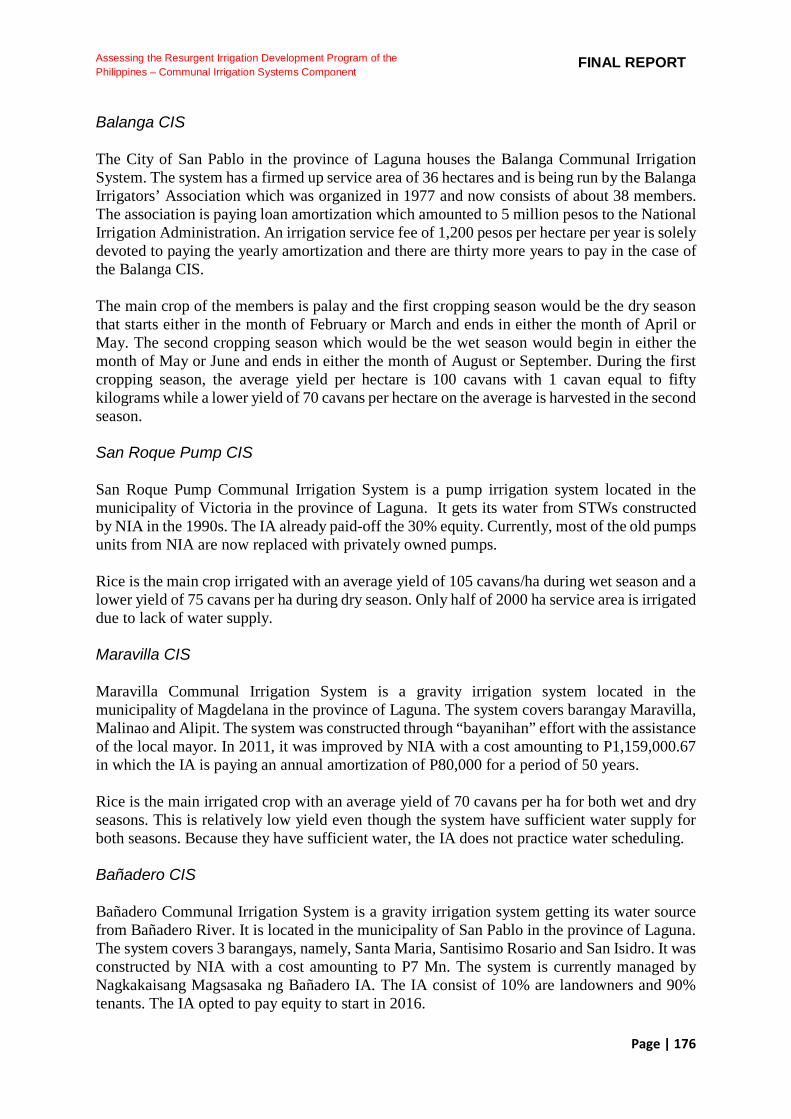
Page | 176
Assessing the Resurgent Irrigation Development Program of the
Philippines – Communal Irrigation Systems Component FINAL REPORT
Balanga CIS The City of San Pablo in the province of Laguna houses the Balanga Communal Irrigation System. The system has a firmed up service area of 36 hectares and is being run by the Balanga Irrigators’ Association which was organized in 1977 and now consists of about 38 members. The association is paying loan amortization which amounted to 5 million pesos to the National Irrigation Administration. An irrigation service fee of 1,200 pesos per hectare per year is solely devoted to paying the yearly amortization and there are thirty more years to pay in the case of the Balanga CIS. The main crop of the members is palay and the first cropping season would be the dry season that starts either in the month of February or March and ends in either the month of April or May. The second cropping season which would be the wet season would begin in either the month of May or June and ends in either the month of August or September. During the first cropping season, the average yield per hectare is 100 cavans with 1 cavan equal to fifty kilograms while a lower yield of 70 cavans per hectare on the average is harvested in the second season. San Roque Pump CIS San Roque Pump Communal Irrigation System is a pump irrigation system located in the municipality of Victoria in the province of Laguna. It gets its water from STWs constructed by NIA in the 1990s. The IA already paid-off the 30% equity. Currently, most of the old pumps units from NIA are now replaced with privately owned pumps. Rice is the main crop irrigated with an average yield of 105 cavans/ha during wet season and a lower yield of 75 cavans per ha during dry season. Only half of 2000 ha service area is irrigated due to lack of water supply. Maravilla CIS Maravilla Communal Irrigation System is a gravity irrigation system located in the municipality of Magdelana in the province of Laguna. The system covers barangay Maravilla, Malinao and Alipit. The system was constructed through “bayanihan” effort with the assistance of the local mayor. In 2011, it was improved by NIA with a cost amounting to P1,159,000.67 in which the IA is paying an annual amortization of P80,000 for a period of 50 years. Rice is the main irrigated crop with an average yield of 70 cavans per ha for both wet and dry seasons. This is relatively low yield even though the system have sufficient water supply for both seasons. Because they have sufficient water, the IA does not practice water scheduling. Bañadero CIS Bañadero Communal Irrigation System is a gravity irrigation system getting its water source from Bañadero River. It is located in the municipality of San Pablo in the province of Laguna. The system covers 3 barangays, namely, Santa Maria, Santisimo Rosario and San Isidro. It was constructed by NIA with a cost amounting to P7 Mn. The system is currently managed by Nagkakaisang Magsasaka ng Bañadero IA. The IA consist of 10% are landowners and 90% tenants. The IA opted to pay equity to start in 2016.
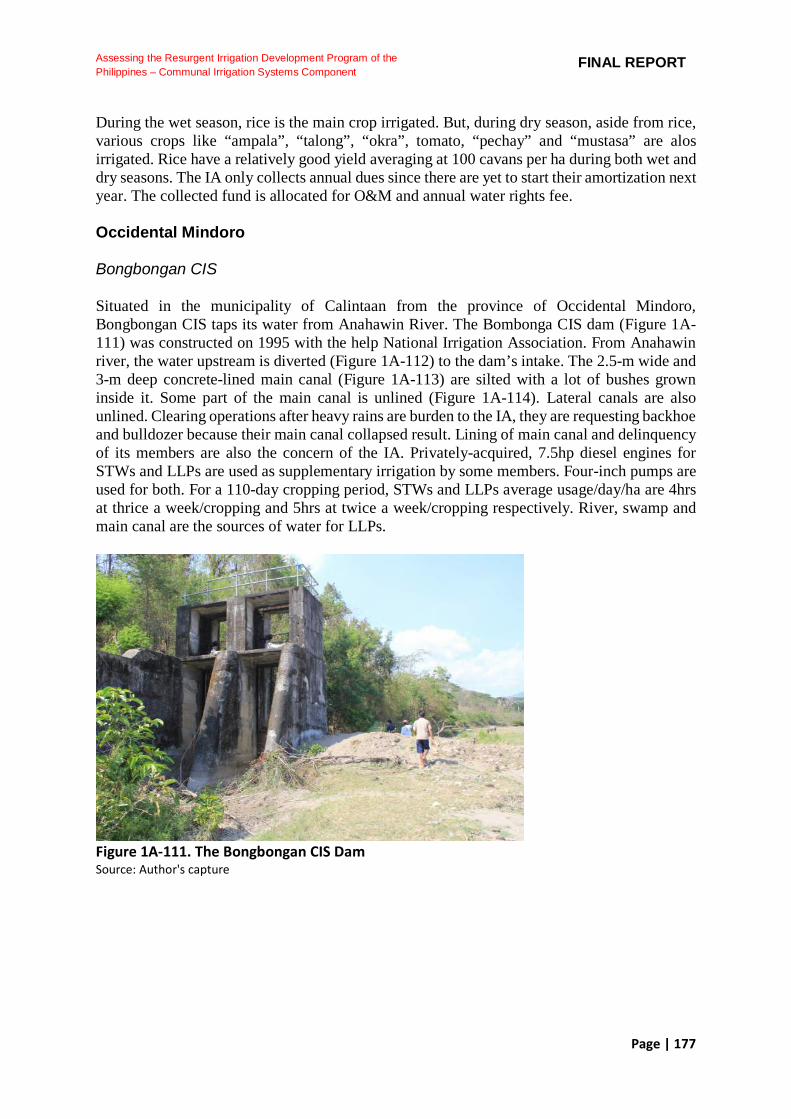
Page | 177
Assessing the Resurgent Irrigation Development Program of the
Philippines – Communal Irrigation Systems Component FINAL REPORT
During the wet season, rice is the main crop irrigated. But, during dry season, aside from rice, various crops like “ampala”, “talong”, “okra”, tomato, “pechay” and “mustasa” are alos irrigated. Rice have a relatively good yield averaging at 100 cavans per ha during both wet and dry seasons. The IA only collects annual dues since there are yet to start their amortization next year. The collected fund is allocated for O&M and annual water rights fee. Occidental Mindoro Bongbongan CIS Situated in the municipality of Calintaan from the province of Occidental Mindoro, Bongbongan CIS taps its water from Anahawin River. The Bombonga CIS dam (Figure 1A-111) was constructed on 1995 with the help National Irrigation Association. From Anahawin river, the water upstream is diverted (Figure 1A-112) to the dam’s intake. The 2.5-m wide and 3-m deep concrete-lined main canal (Figure 1A-113) are silted with a lot of bushes grown inside it. Some part of the main canal is unlined (Figure 1A-114). Lateral canals are also unlined. Clearing operations after heavy rains are burden to the IA, they are requesting backhoe and bulldozer because their main canal collapsed result. Lining of main canal and delinquency of its members are also the concern of the IA. Privately-acquired, 7.5hp diesel engines for STWs and LLPs are used as supplementary irrigation by some members. Four-inch pumps are used for both. For a 110-day cropping period, STWs and LLPs average usage/day/ha are 4hrs at thrice a week/cropping and 5hrs at twice a week/cropping respectively. River, swamp and main canal are the sources of water for LLPs.
Figure 1A-111. The Bongbongan CIS Dam Source: Author's capture

Page | 178
Assessing the Resurgent Irrigation Development Program of the
Philippines – Communal Irrigation Systems Component FINAL REPORT
Figure 1A-112. Water diverted from Anahawin River to the intake Source: Author's capture
Figure 1A-113. The 2.5-m wide and 3-m deep concrete-lined main canal Source: Author's capture
Figure 1A-114. Unlined main canal Source: Author's capture

Page | 179
Assessing the Resurgent Irrigation Development Program of the
Philippines – Communal Irrigation Systems Component FINAL REPORT
Batasan CIS Batasan CIS was established on early 1980s in San Jose, Occidental Mindoro. Having their first mini dam damaged (Figure 1A-115), the National Irrigation Association helped the Samahang Magpapatubig ng Batasan Incorporated Irrigator’s Association put up a new dam last 2014 (Figure 1A-116). With just months from its construction, two sluice gates are already broken (Figure 1A-116) and the other 3 gates are nearly broken. Diesel engines (Figure 1A-117) are used to operate the gates but since it was broken and costly, they rarely use them. Part of the main canal inspected was completely broken (Figure 1A-118) by typhoon Glenda that decreases their water delivery efficiency. The 1-m wide and 1-m deep lateral canal is well-maintained. The concern of the IA is the broken main canal and the lining of some lateral canal. Privately-acquired and DA-granted, 8hp diesel engines for STWs and LLPs are used as supplementary irrigation by some members. Four-inch and 3-4” are used for LLPs and STWs respectively. For a 110-day cropping period, STWs and LLPs average usage/day/ha are both 8hrs at twice a week/cropping. River and creek are the sources of water for LLPs.
Figure 1A-115. The former Batasan CIS dam that was broken Source: Author's capture
Figure 1A-116. The Batasan CIS dam that was only built last October 2014 Source: Author's capture

Page | 180
Assessing the Resurgent Irrigation Development Program of the
Philippines – Communal Irrigation Systems Component FINAL REPORT
Figure 1A-117. Diesel engines used to control the sluice gates Source: Author's capture
Figure 1A-118. Detached Main canal due to typhoon Glenda Source: Author's capture New Ilocos Tamaraw CIS Being one of the CIS in Barangay Poypoy, Calintaan, Occidental Mindoro, New Ilocos Tamaraw CIS, like Bongbongan CIS, taps its water from Anahawin River. Constructed in 1975, the CIS became operational on the same year. Privately-acquired and LGU-granted, 7hp diesel engines for STWs and LLPs are used as supplementary irrigation by some members. Four-inch pumps are used for both. For a 110-day cropping period, STWs and LLPs average usage/day/ha are both 6hrs at once a week/cropping. River, swamp and main canal are the sources of water for LLPs. Manuot CIS Manuot Communal Irrigation System is a gravity irrigation system located in municipality of Rizal in the province of Occidental Mindoro. The system gets its water source from Busuanga River. It was constructed by NIA in 1990 with a cost amounting to P6 Mn. The system is managed by Amaling Manuot IA with members who are all landowners. The IA opted to pay the 30% equity.
Page | 181
Assessing the Resurgent Irrigation Development Program of the
Philippines – Communal Irrigation Systems Component FINAL REPORT
Rice is the main crop irrigated with an average yield of 140 cavans/ha for both wet and dry seasons. During dry season, only 315 ha are irrigated out of the 535.15 has. This is mainly due to lack of water supply during dry season. To cope up from this problem, about 150 ha pump water from the STWs. Limlim CIS Limlim Communal Irrigation System is a gravity irrigation system located in municipality of Rizal in the province of Occidental Mindoro. The Barangay Rizal Rizal Occidental Mindoro IA is the one currently managing the system. The IA was not able to use the canal system constructed by NIA since it was damaged by a typhoon during its construction. They are still waiting for the completion of the project. Rice is the main crop irrigated with an average yield of 100 cavans/ha during wet season and 110 cavans per ha during dry season. Other crops like corn, tobacco, mongo, onion, peanut & sweet potato are also irrigated during wet and dry seasons. During dry season, about 76 ha pump from STWs due to lack of water supply. Monteclaro CIS Monteclaro Communal Irrigation System gets its water from Kayakyan River. It is a gravity irrigation system located in municipality of San Jose in the province of Occidental Mindoro. It was constructed by NIA in 1980 with a cost amounting to P1.2 Mn. NIA, then, improved the system in 2014 incurring a cost of P5 Mn. The IA is currently paying the yearly loan amortization of about P100,000. Rice is the main crop irrigated with an average yield of 100 cavans/ha during wet season and 125 cavans during dry season. Other crops like corn, onion and garlic are also irrigated during dry season. During dry season, about 50 has pumps from the river, canal and STWs as a mode of supplementary irrigation

Page | 182
Assessing the Resurgent Irrigation Development Program of the
Philippines – Communal Irrigation Systems Component FINAL REPORT
16.1B. Highlights of Interviews with IA Officials and Members and Walkthroughs of the Sample Communal Irrigation Systems in Visayas Bohol Gabayan CIS Gabayan CIS gets water from Gabayan river. The system has 290 ha firmed-up service area (FUSA) and covers 7 barangays namely Tubod, Anoling, Pagahat, La Union, San Isidro, Lungsudaan, Panadtaran, Buyoan and Poblacion, in the municipality of Candijay, Bohol Province. The system started its operation in 1982 and turned over by NIA to Candijay-Gabayan Irrigator’s Services Association on December 20, 1982. At present, the association has 350 farmer-members. IA officials and governing board are chosen by consensus among the members and have a 2-year term. They are not compensated for their positions. Only the collector from each sector received incentive of 15% of each total collection. The Local Government Unit (LGU) of Candijay took over in collecting irrigation service fee (ISF) but later turned-over to IA due to low collection rate. They also provided assistance in rehabilitating and desilting of lateral canals. Before the passage of Free Irrigation Service Act (FISA), the association allocated ₱50,000 per year for loan repayment from the ISF collected from the members. IA officials had a hard time collecting ISF as farmers argued that they did not receive irrigation from the canal. They have a balance of ₱12 M that was condoned by the implementation of FISA. Currently, the IA allocated the ISF for the operation and maintenance of the system. However, more farmers no longer pay the ISF. The dam (Figure 1B-1) was built in 1982 and is still fully operational with some rehabilitations done on the intake gate and several turnouts. About 4.5 km of the main canal and some portions of the lateral canals are lined (Figure 1B-2). There is minimal siltation observed although the inverted siphon passing underneath a creek was clogged preventing the conveyance of water from the main canal to about 40 ha downstream. The IAs wants NIA to use GI pipes to convey the water over the bridge instead to continue servicing water in the affected farms. The river has enough water to irrigate all the service area as long as there are no broken or nonoperational canals. Water flowing to Kanumantad falls comes from the dam so when the intake gate is fully opened, no water flows on the falls. Some farmers use pumps to supplement water from the system. Saline intrusion and sedimentation are also problems encountered by the farmers in the downstream sector. The IA suggests to complete concreting of canal lining and desilting of Gabayan river.
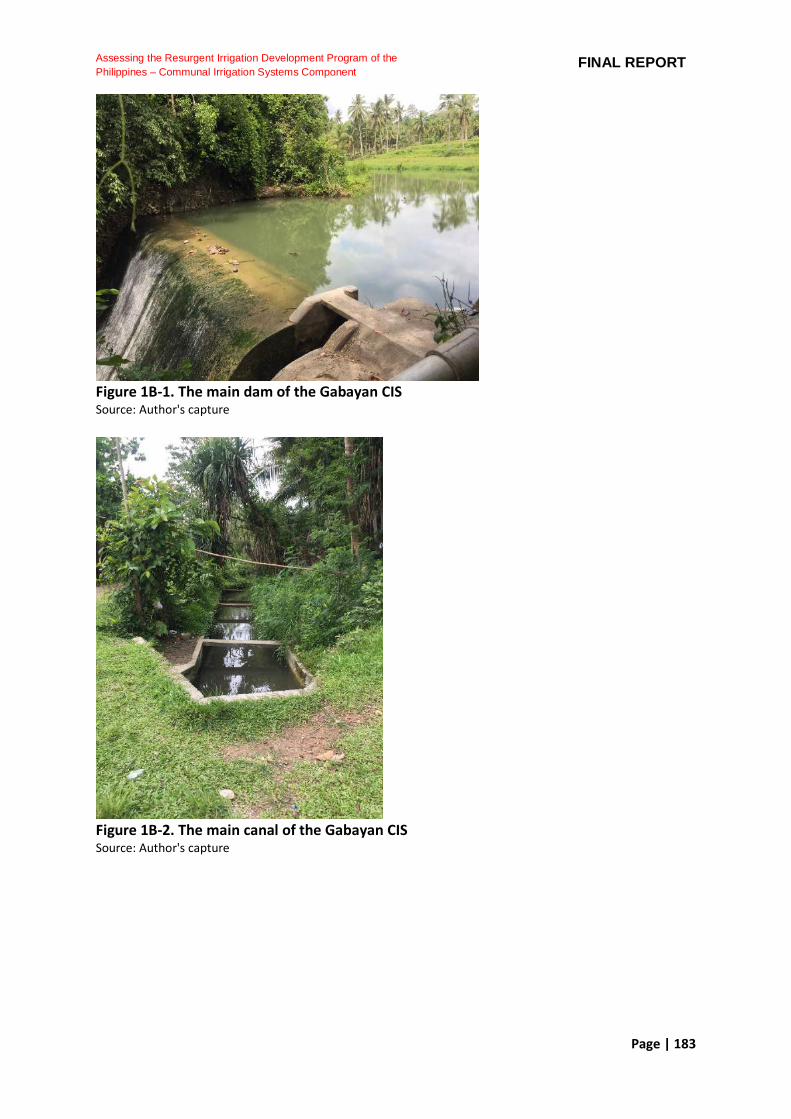
Page | 183
Assessing the Resurgent Irrigation Development Program of the
Philippines – Communal Irrigation Systems Component FINAL REPORT
Figure 1B-1. The main dam of the Gabayan CIS Source: Author's capture
Figure 1B-2. The main canal of the Gabayan CIS Source: Author's capture
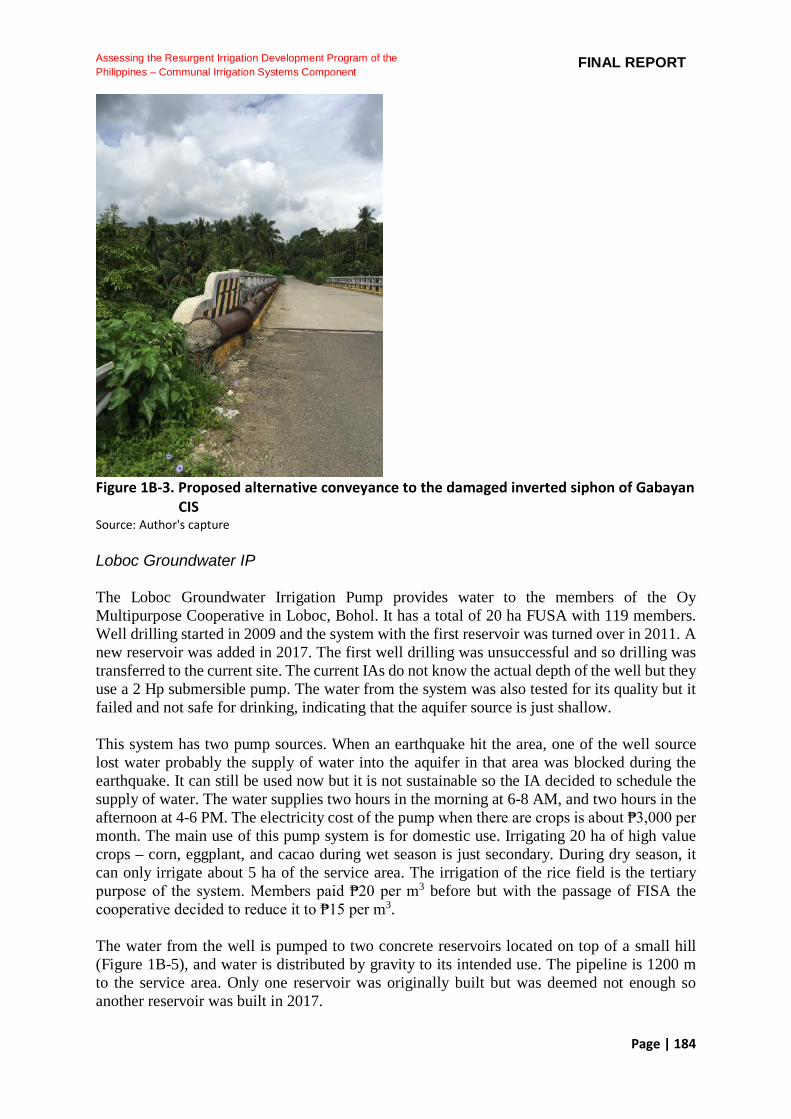
Page | 184
Assessing the Resurgent Irrigation Development Program of the
Philippines – Communal Irrigation Systems Component FINAL REPORT
Figure 1B-3. Proposed alternative conveyance to the damaged inverted siphon of Gabayan
CIS Source: Author's capture Loboc Groundwater IP The Loboc Groundwater Irrigation Pump provides water to the members of the Oy Multipurpose Cooperative in Loboc, Bohol. It has a total of 20 ha FUSA with 119 members. Well drilling started in 2009 and the system with the first reservoir was turned over in 2011. A new reservoir was added in 2017. The first well drilling was unsuccessful and so drilling was transferred to the current site. The current IAs do not know the actual depth of the well but they use a 2 Hp submersible pump. The water from the system was also tested for its quality but it failed and not safe for drinking, indicating that the aquifer source is just shallow. This system has two pump sources. When an earthquake hit the area, one of the well source lost water probably the supply of water into the aquifer in that area was blocked during the earthquake. It can still be used now but it is not sustainable so the IA decided to schedule the supply of water. The water supplies two hours in the morning at 6-8 AM, and two hours in the afternoon at 4-6 PM. The electricity cost of the pump when there are crops is about ₱3,000 per month. The main use of this pump system is for domestic use. Irrigating 20 ha of high value crops – corn, eggplant, and cacao during wet season is just secondary. During dry season, it can only irrigate about 5 ha of the service area. The irrigation of the rice field is the tertiary purpose of the system. Members paid ₱20 per m3 before but with the passage of FISA the cooperative decided to reduce it to ₱15 per m3. The water from the well is pumped to two concrete reservoirs located on top of a small hill (Figure 1B-5), and water is distributed by gravity to its intended use. The pipeline is 1200 m to the service area. Only one reservoir was originally built but was deemed not enough so another reservoir was built in 2017.
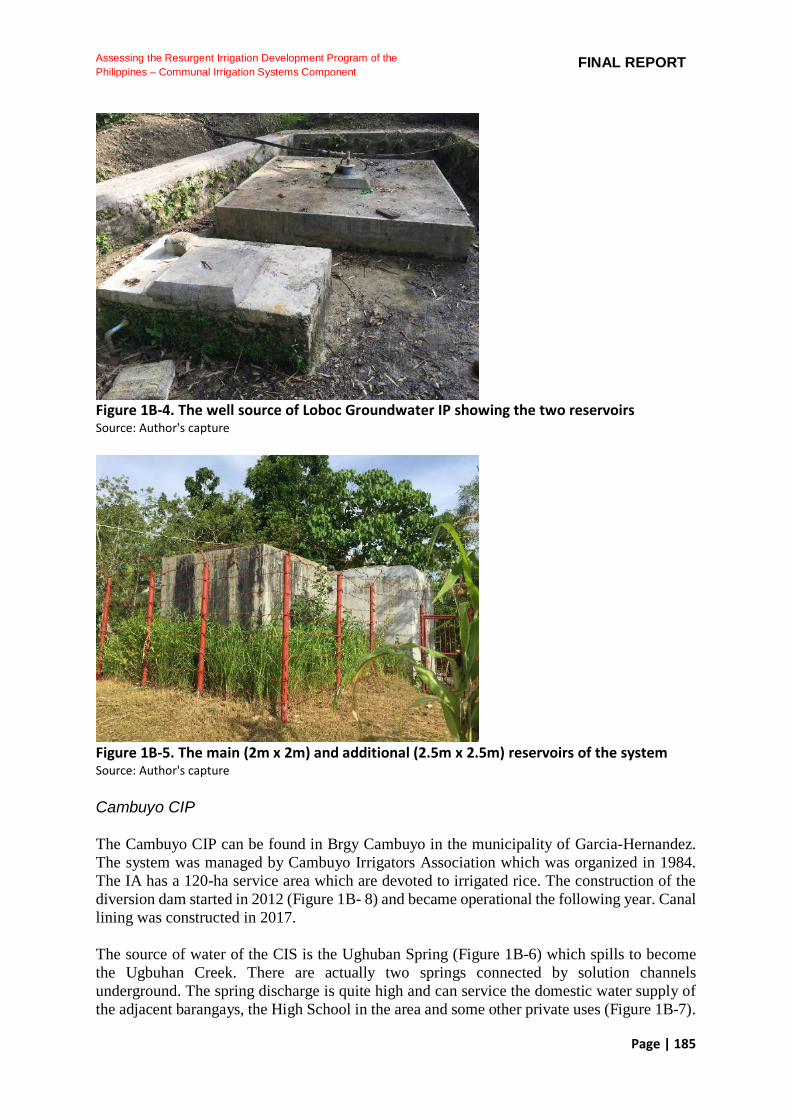
Page | 185
Assessing the Resurgent Irrigation Development Program of the
Philippines – Communal Irrigation Systems Component FINAL REPORT
Figure 1B-4. The well source of Loboc Groundwater IP showing the two reservoirs Source: Author's capture
Figure 1B-5. The main (2m x 2m) and additional (2.5m x 2.5m) reservoirs of the system Source: Author's capture Cambuyo CIP The Cambuyo CIP can be found in Brgy Cambuyo in the municipality of Garcia-Hernandez. The system was managed by Cambuyo Irrigators Association which was organized in 1984. The IA has a 120-ha service area which are devoted to irrigated rice. The construction of the diversion dam started in 2012 (Figure 1B- 8) and became operational the following year. Canal lining was constructed in 2017. The source of water of the CIS is the Ughuban Spring (Figure 1B-6) which spills to become the Ugbuhan Creek. There are actually two springs connected by solution channels underground. The spring discharge is quite high and can service the domestic water supply of the adjacent barangays, the High School in the area and some other private uses (Figure 1B-7).
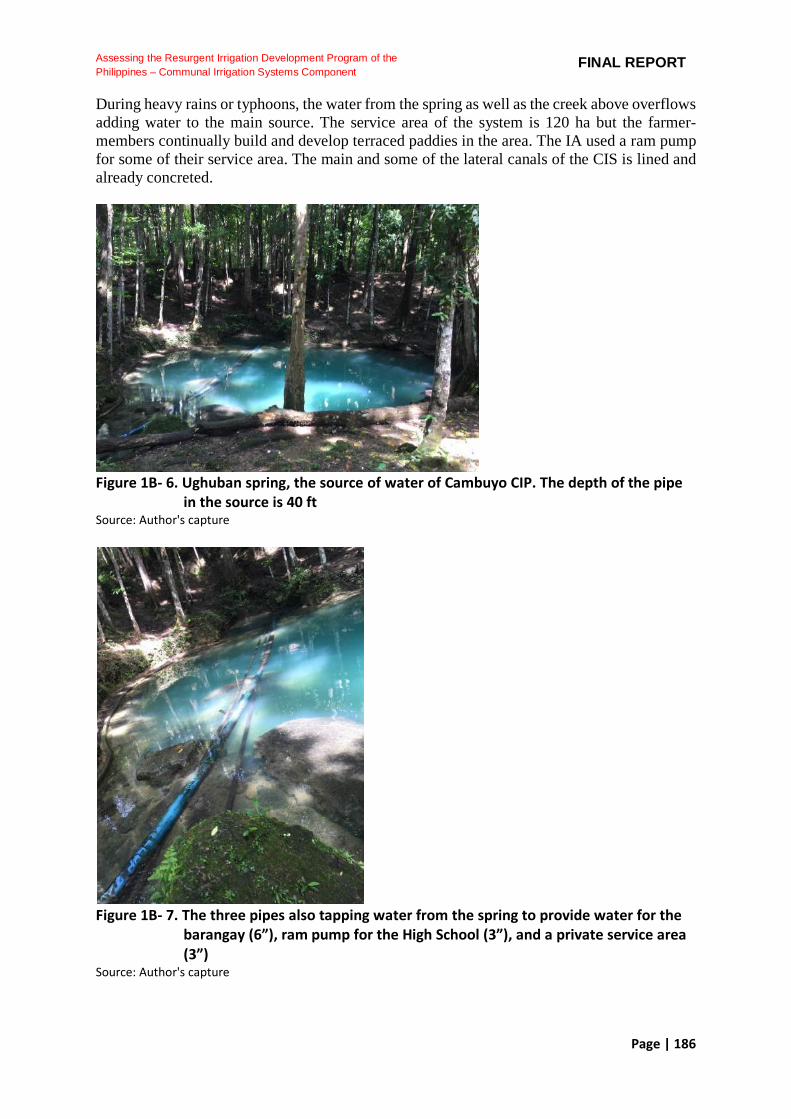
Page | 186
Assessing the Resurgent Irrigation Development Program of the
Philippines – Communal Irrigation Systems Component FINAL REPORT
During heavy rains or typhoons, the water from the spring as well as the creek above overflows adding water to the main source. The service area of the system is 120 ha but the farmer-members continually build and develop terraced paddies in the area. The IA used a ram pump for some of their service area. The main and some of the lateral canals of the CIS is lined and already concreted.
Figure 1B- 6. Ughuban spring, the source of water of Cambuyo CIP. The depth of the pipe
in the source is 40 ft Source: Author's capture
Figure 1B- 7. The three pipes also tapping water from the spring to provide water for the
barangay (6”), ram pump for the High School (3”), and a private service area (3”)
Source: Author's capture
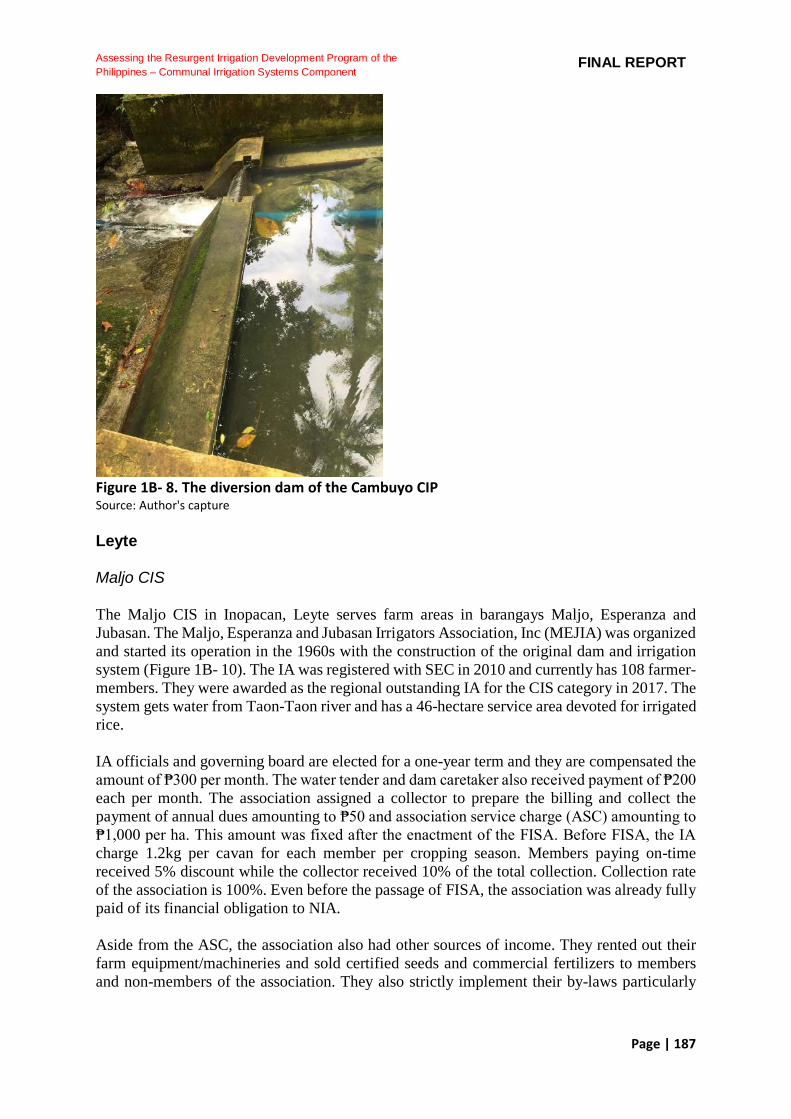
Page | 187
Assessing the Resurgent Irrigation Development Program of the
Philippines – Communal Irrigation Systems Component FINAL REPORT
Figure 1B- 8. The diversion dam of the Cambuyo CIP Source: Author's capture Leyte
Maljo CIS The Maljo CIS in Inopacan, Leyte serves farm areas in barangays Maljo, Esperanza and Jubasan. The Maljo, Esperanza and Jubasan Irrigators Association, Inc (MEJIA) was organized and started its operation in the 1960s with the construction of the original dam and irrigation system (Figure 1B- 10). The IA was registered with SEC in 2010 and currently has 108 farmer-members. They were awarded as the regional outstanding IA for the CIS category in 2017. The system gets water from Taon-Taon river and has a 46-hectare service area devoted for irrigated rice. IA officials and governing board are elected for a one-year term and they are compensated the amount of ₱300 per month. The water tender and dam caretaker also received payment of ₱200 each per month. The association assigned a collector to prepare the billing and collect the payment of annual dues amounting to ₱50 and association service charge (ASC) amounting to ₱1,000 per ha. This amount was fixed after the enactment of the FISA. Before FISA, the IA charge 1.2kg per cavan for each member per cropping season. Members paying on-time received 5% discount while the collector received 10% of the total collection. Collection rate of the association is 100%. Even before the passage of FISA, the association was already fully paid of its financial obligation to NIA. Aside from the ASC, the association also had other sources of income. They rented out their farm equipment/machineries and sold certified seeds and commercial fertilizers to members and non-members of the association. They also strictly implement their by-laws particularly

Page | 188
Assessing the Resurgent Irrigation Development Program of the
Philippines – Communal Irrigation Systems Component FINAL REPORT
provisions on water allocation and delivery. No water request, no water delivery. Violators will be penalized by ₱2,500 per hectare. The current dam was constructed in 2012 (Figure 1B- 9) upstream of the original dam and the new main canal was constructed along the original main canal, using the old concreted side walls as support. The dam has a duckbill-type weir to increase crest length and reduce backwater flow effect with increase in flow. This is necessary to prevent flooding in nearby farms during high water flows which frequently occur in the area. The association plans to extend the coverage of the service area to Brgy. Taon-Taon which will cover additional 15-20 ha with a proposal for a new diversion dam downstream. They currently use a temporary brush dam in the proposed site.
Figure 1B- 9. The new dam of the Maljo CIS constructed in 2012. It is a run-of-the-river
type dam with a duckbill crest Source: Author's capture
Figure 1B- 10. The original dam constructed in 1960 downstream of the new site. The main
canal of the new dam is seen on the right side Source: Author's capture
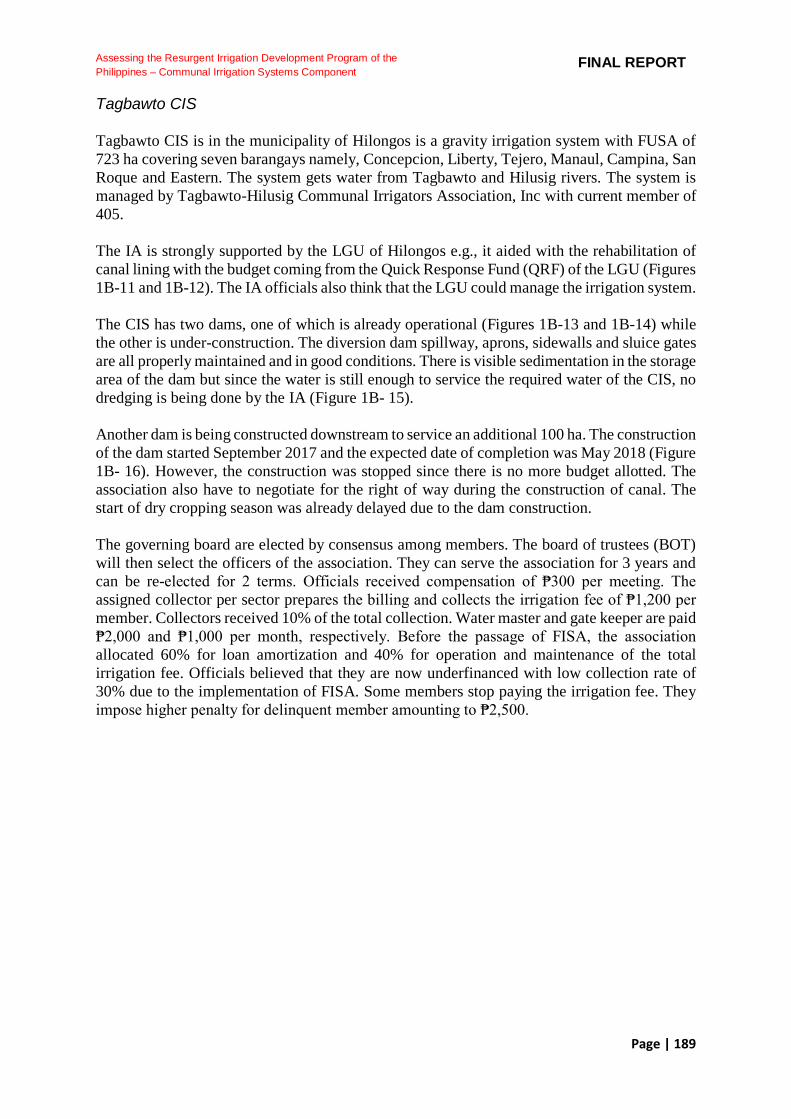
Page | 189
Assessing the Resurgent Irrigation Development Program of the
Philippines – Communal Irrigation Systems Component FINAL REPORT
Tagbawto CIS Tagbawto CIS is in the municipality of Hilongos is a gravity irrigation system with FUSA of 723 ha covering seven barangays namely, Concepcion, Liberty, Tejero, Manaul, Campina, San Roque and Eastern. The system gets water from Tagbawto and Hilusig rivers. The system is managed by Tagbawto-Hilusig Communal Irrigators Association, Inc with current member of 405. The IA is strongly supported by the LGU of Hilongos e.g., it aided with the rehabilitation of canal lining with the budget coming from the Quick Response Fund (QRF) of the LGU (Figures 1B-11 and 1B-12). The IA officials also think that the LGU could manage the irrigation system. The CIS has two dams, one of which is already operational (Figures 1B-13 and 1B-14) while the other is under-construction. The diversion dam spillway, aprons, sidewalls and sluice gates are all properly maintained and in good conditions. There is visible sedimentation in the storage area of the dam but since the water is still enough to service the required water of the CIS, no dredging is being done by the IA (Figure 1B- 15). Another dam is being constructed downstream to service an additional 100 ha. The construction of the dam started September 2017 and the expected date of completion was May 2018 (Figure 1B- 16). However, the construction was stopped since there is no more budget allotted. The association also have to negotiate for the right of way during the construction of canal. The start of dry cropping season was already delayed due to the dam construction. The governing board are elected by consensus among members. The board of trustees (BOT) will then select the officers of the association. They can serve the association for 3 years and can be re-elected for 2 terms. Officials received compensation of ₱300 per meeting. The assigned collector per sector prepares the billing and collects the irrigation fee of ₱1,200 per member. Collectors received 10% of the total collection. Water master and gate keeper are paid ₱2,000 and ₱1,000 per month, respectively. Before the passage of FISA, the association allocated 60% for loan amortization and 40% for operation and maintenance of the total irrigation fee. Officials believed that they are now underfinanced with low collection rate of 30% due to the implementation of FISA. Some members stop paying the irrigation fee. They impose higher penalty for delinquent member amounting to ₱2,500.
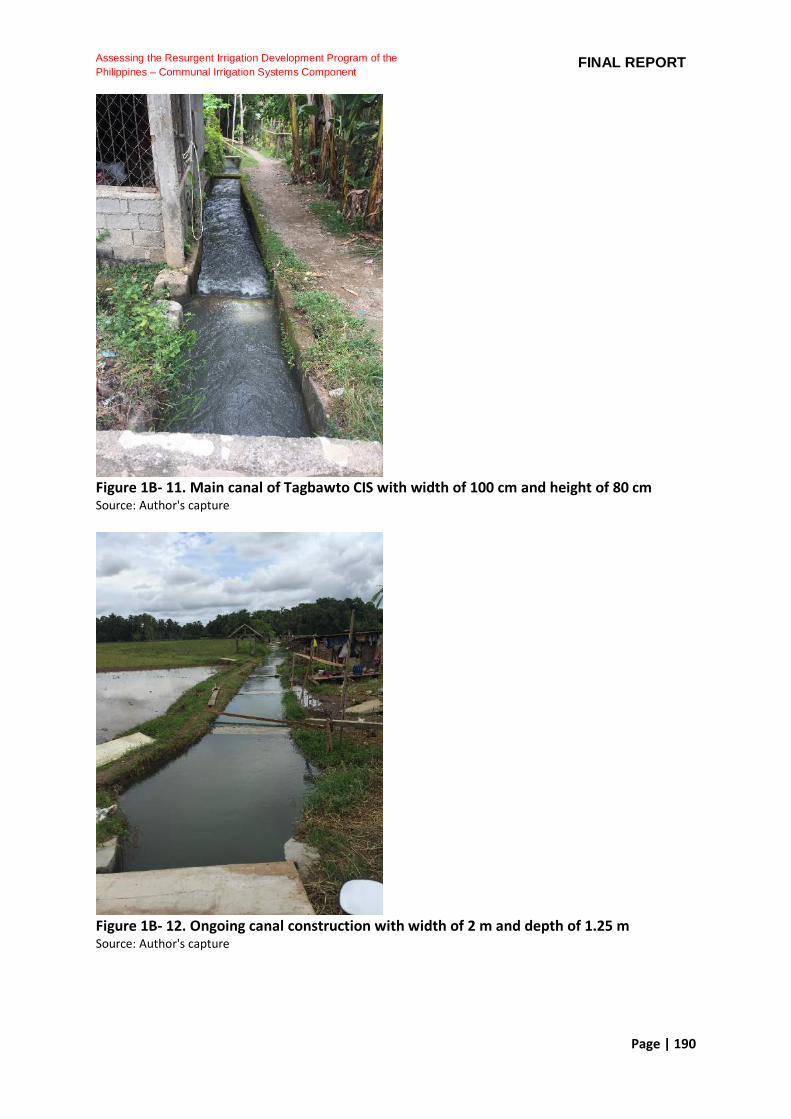
Page | 190
Assessing the Resurgent Irrigation Development Program of the
Philippines – Communal Irrigation Systems Component FINAL REPORT
Figure 1B- 11. Main canal of Tagbawto CIS with width of 100 cm and height of 80 cm Source: Author's capture
Figure 1B- 12. Ongoing canal construction with width of 2 m and depth of 1.25 m Source: Author's capture

Page | 191
Assessing the Resurgent Irrigation Development Program of the
Philippines – Communal Irrigation Systems Component FINAL REPORT
Figure 1B- 13. The diversion dam of Tagbawto CIS with a width of 100 m Source: Author's capture
Figure 1B- 14. Two steel gates of the dam which measured 1.5 m each Source: Author's capture

Page | 192
Assessing the Resurgent Irrigation Development Program of the
Philippines – Communal Irrigation Systems Component FINAL REPORT
Figure 1B- 15. Dam site showing that dredging is not practiced Source: Author's capture
Figure 1B- 16. Construction of the new dam Source: Author's capture Sta. Elena CIS The Sta. Elena CIS in Tanauan, Leyte provides water to the members of the Sta. Elena Irrigators Service Association which was organized on January 1, 1996. The IA get its water from Kiloon Creek. The system has a 112 ha FUSA and covers the barangays of Sta. Elena, Cabarasan-Guti and Guindadg-an. The original temporary brush dam was constructed in 1996, but the current dam was constructed in 2011 and became operational the following year. The dam is a buttress dam and is technically a reuse dam of a NIS upstream (Figure 1B- 17). The dam has no steel spillway gates provided so the IAs used planks made of coco lumber to hold and raise the water to canal level (Figure 1B- 19). New steel gates are said to be installed this July 2018. A wing wall of
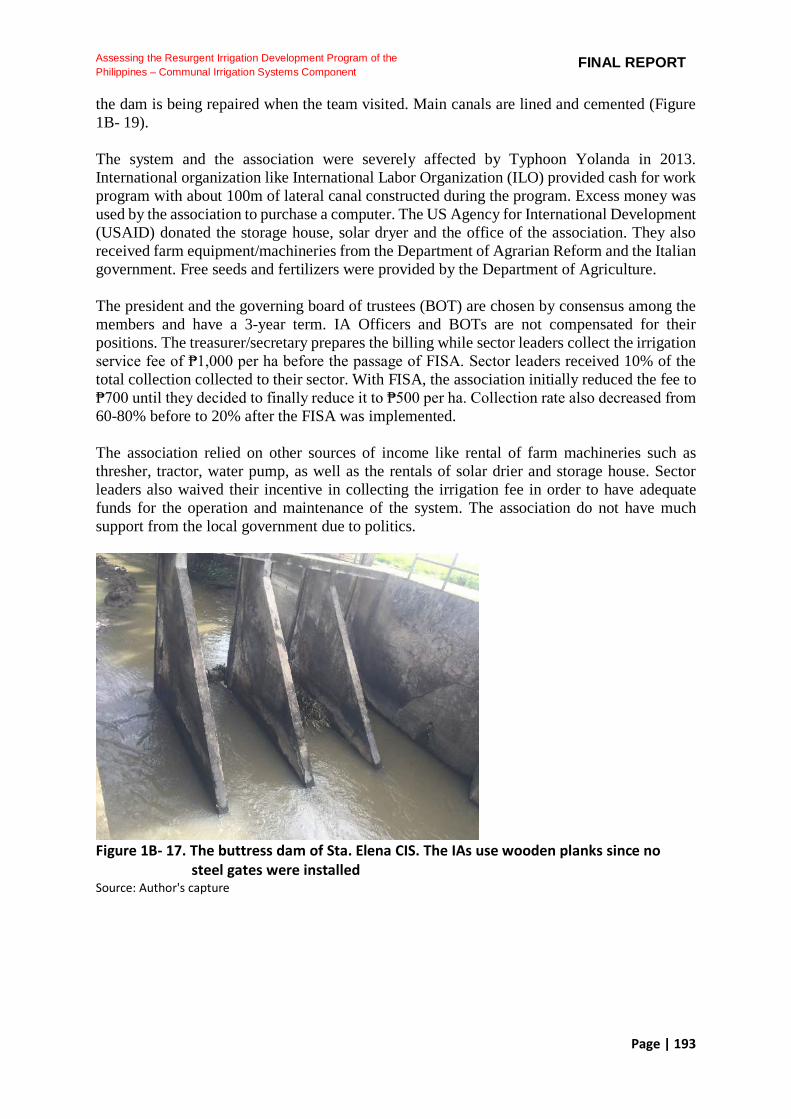
Page | 193
Assessing the Resurgent Irrigation Development Program of the
Philippines – Communal Irrigation Systems Component FINAL REPORT
the dam is being repaired when the team visited. Main canals are lined and cemented (Figure 1B- 19). The system and the association were severely affected by Typhoon Yolanda in 2013. International organization like International Labor Organization (ILO) provided cash for work program with about 100m of lateral canal constructed during the program. Excess money was used by the association to purchase a computer. The US Agency for International Development (USAID) donated the storage house, solar dryer and the office of the association. They also received farm equipment/machineries from the Department of Agrarian Reform and the Italian government. Free seeds and fertilizers were provided by the Department of Agriculture. The president and the governing board of trustees (BOT) are chosen by consensus among the members and have a 3-year term. IA Officers and BOTs are not compensated for their positions. The treasurer/secretary prepares the billing while sector leaders collect the irrigation service fee of ₱1,000 per ha before the passage of FISA. Sector leaders received 10% of the total collection collected to their sector. With FISA, the association initially reduced the fee to ₱700 until they decided to finally reduce it to ₱500 per ha. Collection rate also decreased from 60-80% before to 20% after the FISA was implemented. The association relied on other sources of income like rental of farm machineries such as thresher, tractor, water pump, as well as the rentals of solar drier and storage house. Sector leaders also waived their incentive in collecting the irrigation fee in order to have adequate funds for the operation and maintenance of the system. The association do not have much support from the local government due to politics.
Figure 1B- 17. The buttress dam of Sta. Elena CIS. The IAs use wooden planks since no
steel gates were installed Source: Author's capture

Page | 194
Assessing the Resurgent Irrigation Development Program of the
Philippines – Communal Irrigation Systems Component FINAL REPORT
Figure 1B- 18. Intake of Sta. Elena CIS going to the main canal Source: Author's capture
Figure 1B- 19. Main canal of Sta. Elena CIS Source: Author's capture

Page | 195
Assessing the Resurgent Irrigation Development Program of the
Philippines – Communal Irrigation Systems Component FINAL REPORT
Iloilo
Particion PIS Particion Pump Irrigation System is located in the municipality of Guimbal. The system has a 50 ha FUSA and managed by the Particion Pump Irrigators’ Association, Inc. The IA was organized in the 1970’s with a current member of 34. The CIS pumps water from Igcocolo Creek (Tangyan River) and was built in 2013. The main canal and some laterals are lined with a few remaining earthen canals. The original submersible pump was a 35 Hp Ebara pump powered by 3-phase electricity. The system even has its own transformer. Unfortunately, it was later found out that there were no conductors or circuit breaker to prevent damage from power surges, so the wires and the pump were damaged in 2015 and is currently nonoperational. The association paid ₱70,000 for repair and also later found out that the unit provided to them by the contractor was second-hand. They can also no longer locate the contractor. As remedy, the NIA provided a diesel-engine submersible pump to the IA. The association used the pump 8 hours a day especially during dry season when water from the river is scarce. This resulted to higher fuel cost increasing total production cost and decreasing net profit of the farmers. The association already prepared a resolution for the rehabilitation of the system. The governing board are elected by consensus among members. The board of trustees (BOT) will then select the officers of the association. They can serve the association for 2 years and can be re-elected for 2 terms. Officials are not compensated in their position. Before the FISA, the treasurer or BOT collects operation management fee of ₱10 per cavan for each cropping season from each member. Collection rate is 100% of which 25% is allocated to O&M and 75% for loan amortization. With the passage of FISA, the association reduced the management fee to ₱5 per cavan. Officials are worried that some members will stop paying management fee so the O&M budget was reduced.

Page | 196
Assessing the Resurgent Irrigation Development Program of the
Philippines – Communal Irrigation Systems Component FINAL REPORT
Figure 1B- 20. Main canal of the CIS Source: Author's capture
Figure 1B- 21. The 10” pipe connected to the original pump that delivers water to the
main canal Source: Author's capture
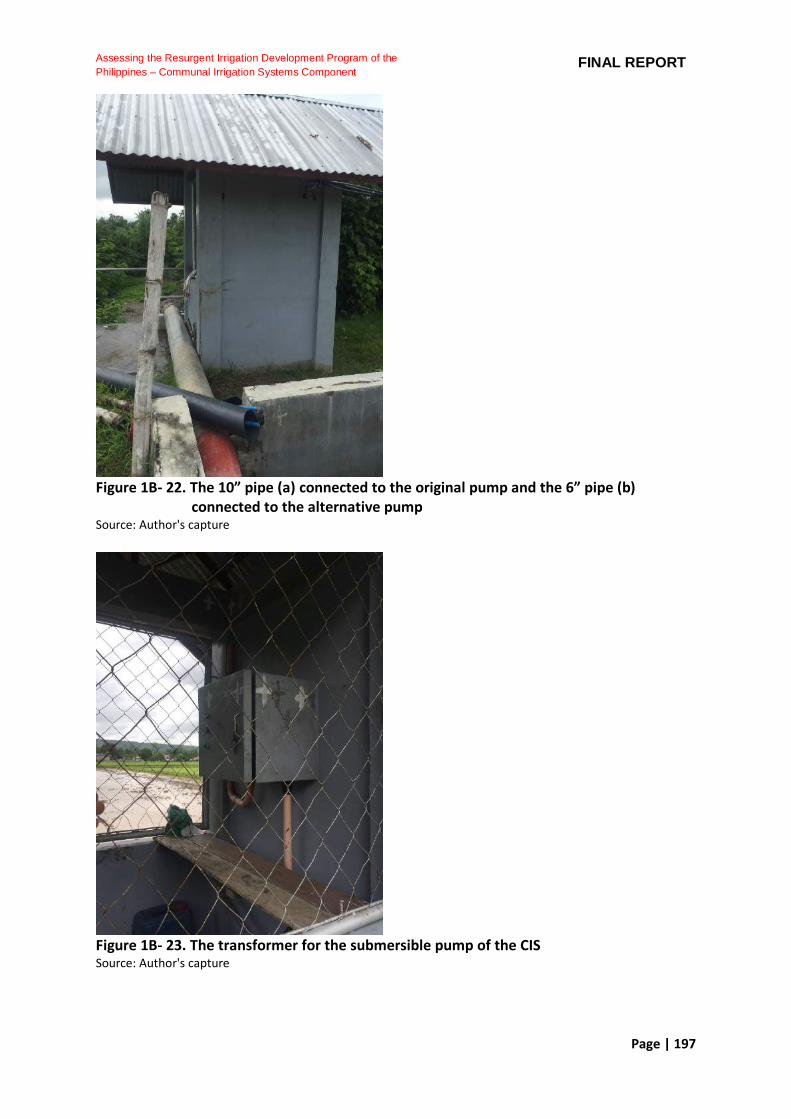
Page | 197
Assessing the Resurgent Irrigation Development Program of the
Philippines – Communal Irrigation Systems Component FINAL REPORT
Figure 1B- 22. The 10” pipe (a) connected to the original pump and the 6” pipe (b)
connected to the alternative pump Source: Author's capture
Figure 1B- 23. The transformer for the submersible pump of the CIS Source: Author's capture
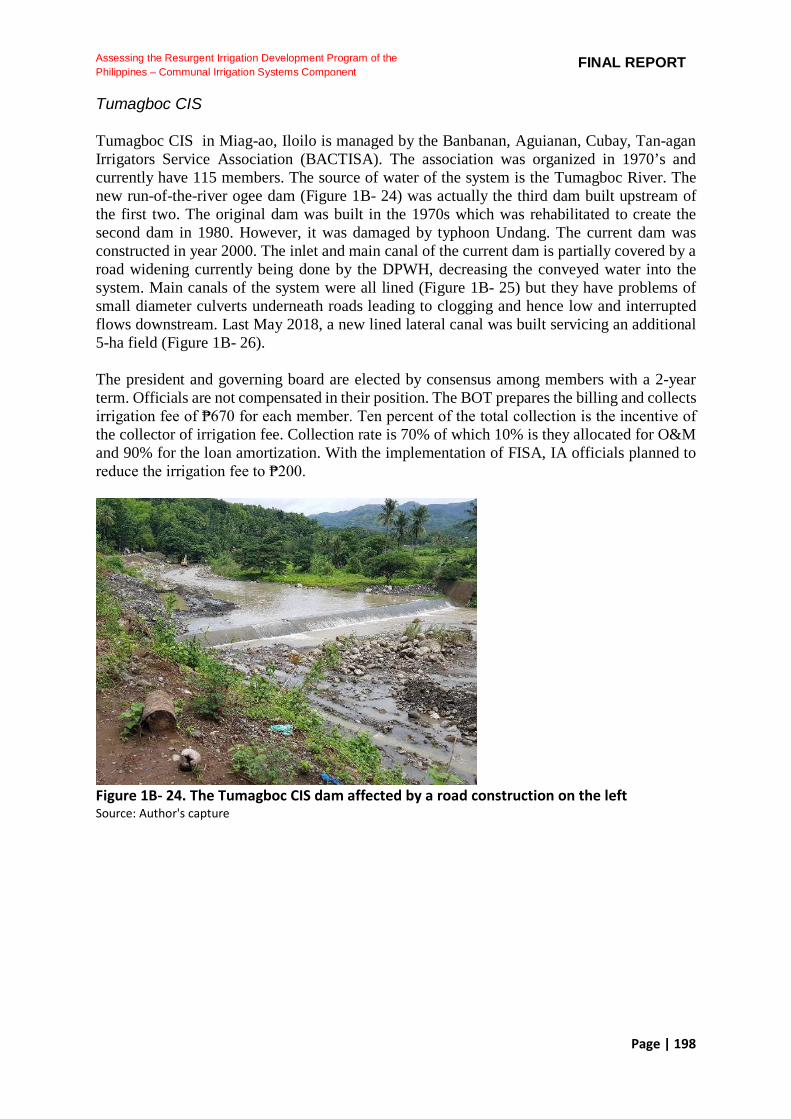
Page | 198
Assessing the Resurgent Irrigation Development Program of the
Philippines – Communal Irrigation Systems Component FINAL REPORT
Tumagboc CIS Tumagboc CIS in Miag-ao, Iloilo is managed by the Banbanan, Aguianan, Cubay, Tan-agan Irrigators Service Association (BACTISA). The association was organized in 1970’s and currently have 115 members. The source of water of the system is the Tumagboc River. The new run-of-the-river ogee dam (Figure 1B- 24) was actually the third dam built upstream of the first two. The original dam was built in the 1970s which was rehabilitated to create the second dam in 1980. However, it was damaged by typhoon Undang. The current dam was constructed in year 2000. The inlet and main canal of the current dam is partially covered by a road widening currently being done by the DPWH, decreasing the conveyed water into the system. Main canals of the system were all lined (Figure 1B- 25) but they have problems of small diameter culverts underneath roads leading to clogging and hence low and interrupted flows downstream. Last May 2018, a new lined lateral canal was built servicing an additional 5-ha field (Figure 1B- 26). The president and governing board are elected by consensus among members with a 2-year term. Officials are not compensated in their position. The BOT prepares the billing and collects irrigation fee of ₱670 for each member. Ten percent of the total collection is the incentive of the collector of irrigation fee. Collection rate is 70% of which 10% is they allocated for O&M and 90% for the loan amortization. With the implementation of FISA, IA officials planned to reduce the irrigation fee to ₱200.
Figure 1B- 24. The Tumagboc CIS dam affected by a road construction on the left Source: Author's capture
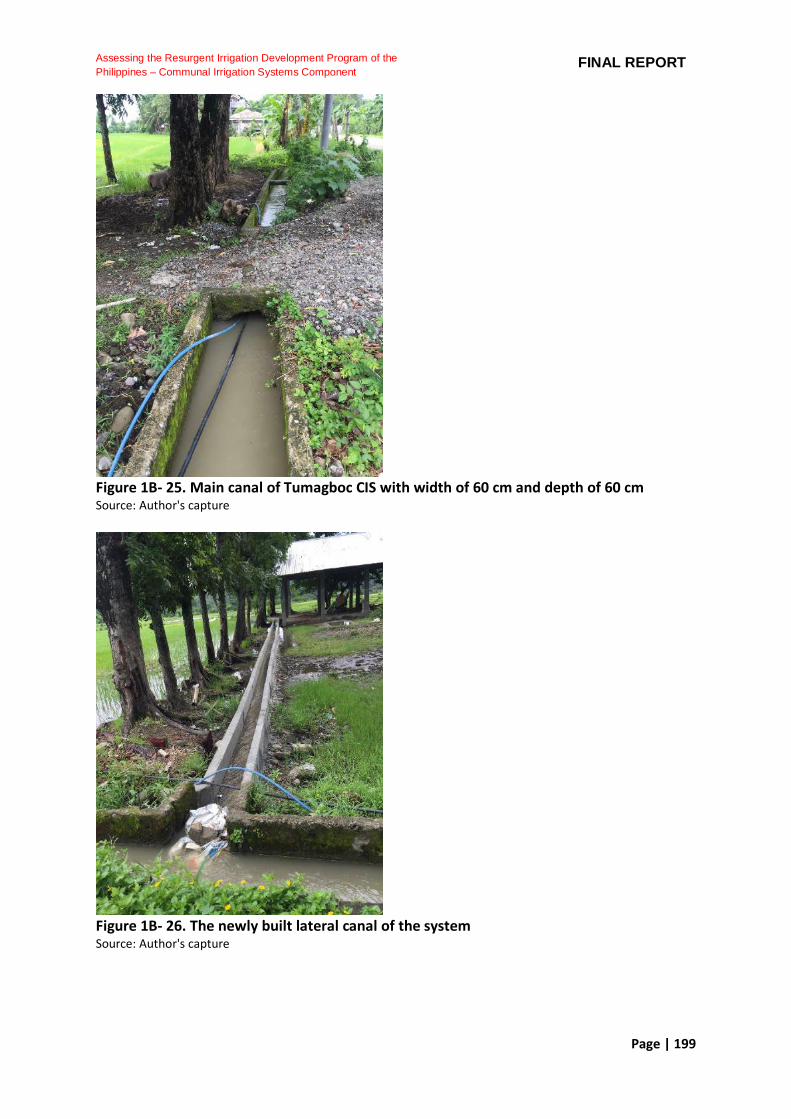
Page | 199
Assessing the Resurgent Irrigation Development Program of the
Philippines – Communal Irrigation Systems Component FINAL REPORT
Figure 1B- 25. Main canal of Tumagboc CIS with width of 60 cm and depth of 60 cm Source: Author's capture
Figure 1B- 26. The newly built lateral canal of the system Source: Author's capture
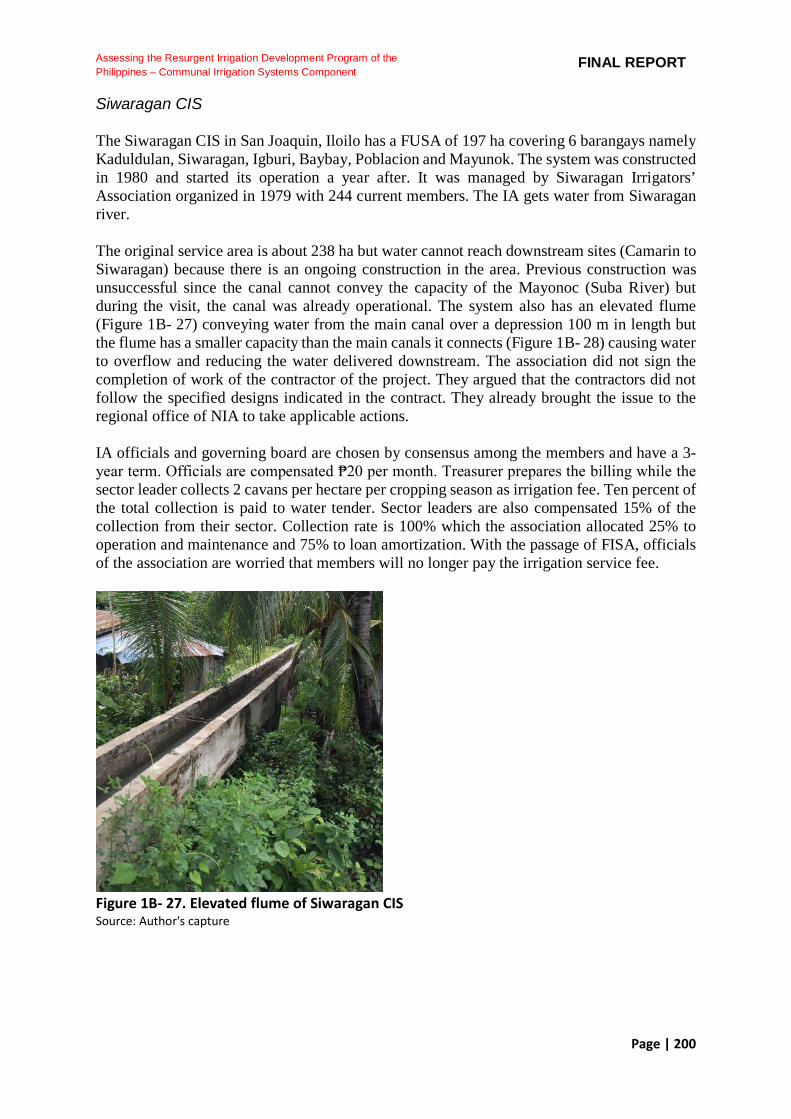
Page | 200
Assessing the Resurgent Irrigation Development Program of the
Philippines – Communal Irrigation Systems Component FINAL REPORT
Siwaragan CIS The Siwaragan CIS in San Joaquin, Iloilo has a FUSA of 197 ha covering 6 barangays namely Kaduldulan, Siwaragan, Igburi, Baybay, Poblacion and Mayunok. The system was constructed in 1980 and started its operation a year after. It was managed by Siwaragan Irrigators’ Association organized in 1979 with 244 current members. The IA gets water from Siwaragan river. The original service area is about 238 ha but water cannot reach downstream sites (Camarin to Siwaragan) because there is an ongoing construction in the area. Previous construction was unsuccessful since the canal cannot convey the capacity of the Mayonoc (Suba River) but during the visit, the canal was already operational. The system also has an elevated flume (Figure 1B- 27) conveying water from the main canal over a depression 100 m in length but the flume has a smaller capacity than the main canals it connects (Figure 1B- 28) causing water to overflow and reducing the water delivered downstream. The association did not sign the completion of work of the contractor of the project. They argued that the contractors did not follow the specified designs indicated in the contract. They already brought the issue to the regional office of NIA to take applicable actions. IA officials and governing board are chosen by consensus among the members and have a 3-year term. Officials are compensated ₱20 per month. Treasurer prepares the billing while the sector leader collects 2 cavans per hectare per cropping season as irrigation fee. Ten percent of the total collection is paid to water tender. Sector leaders are also compensated 15% of the collection from their sector. Collection rate is 100% which the association allocated 25% to operation and maintenance and 75% to loan amortization. With the passage of FISA, officials of the association are worried that members will no longer pay the irrigation service fee.
Figure 1B- 27. Elevated flume of Siwaragan CIS Source: Author's capture
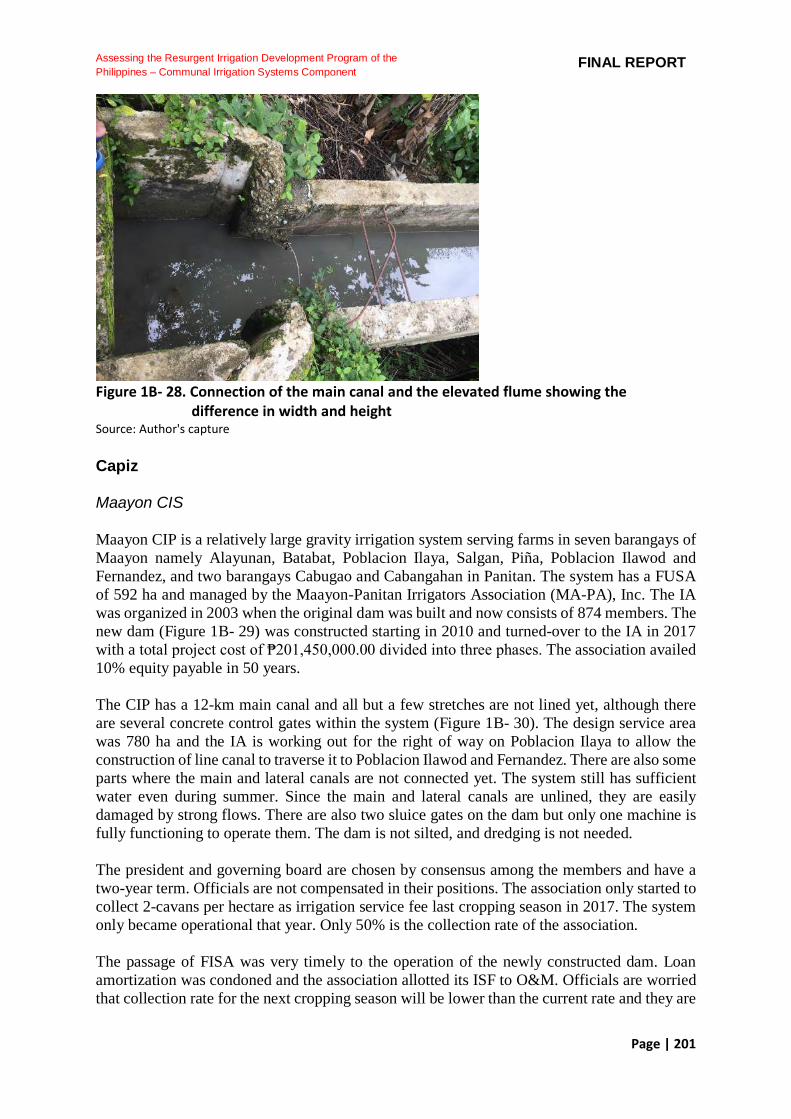
Page | 201
Assessing the Resurgent Irrigation Development Program of the
Philippines – Communal Irrigation Systems Component FINAL REPORT
Figure 1B- 28. Connection of the main canal and the elevated flume showing the
difference in width and height Source: Author's capture Capiz Maayon CIS Maayon CIP is a relatively large gravity irrigation system serving farms in seven barangays of Maayon namely Alayunan, Batabat, Poblacion Ilaya, Salgan, Piña, Poblacion Ilawod and Fernandez, and two barangays Cabugao and Cabangahan in Panitan. The system has a FUSA of 592 ha and managed by the Maayon-Panitan Irrigators Association (MA-PA), Inc. The IA was organized in 2003 when the original dam was built and now consists of 874 members. The new dam (Figure 1B- 29) was constructed starting in 2010 and turned-over to the IA in 2017 with a total project cost of ₱201,450,000.00 divided into three phases. The association availed 10% equity payable in 50 years. The CIP has a 12-km main canal and all but a few stretches are not lined yet, although there are several concrete control gates within the system (Figure 1B- 30). The design service area was 780 ha and the IA is working out for the right of way on Poblacion Ilaya to allow the construction of line canal to traverse it to Poblacion Ilawod and Fernandez. There are also some parts where the main and lateral canals are not connected yet. The system still has sufficient water even during summer. Since the main and lateral canals are unlined, they are easily damaged by strong flows. There are also two sluice gates on the dam but only one machine is fully functioning to operate them. The dam is not silted, and dredging is not needed. The president and governing board are chosen by consensus among the members and have a two-year term. Officials are not compensated in their positions. The association only started to collect 2-cavans per hectare as irrigation service fee last cropping season in 2017. The system only became operational that year. Only 50% is the collection rate of the association. The passage of FISA was very timely to the operation of the newly constructed dam. Loan amortization was condoned and the association allotted its ISF to O&M. Officials are worried that collection rate for the next cropping season will be lower than the current rate and they are

Page | 202
Assessing the Resurgent Irrigation Development Program of the
Philippines – Communal Irrigation Systems Component FINAL REPORT
contemplating on implementing a fix-rate of ₱1,000 per ha this coming season upon approval of its members. The association will request to NIA the concreting of the main and lateral canals. Officials of the association admitted lack of support from the local government unit.
Figure 1B- 29. The dam of Maayon CIS Source: Author's capture
Figure 1B- 30. The unlined main (left) and lateral (right) canal with some control structure Source: Author's capture Salcedo CIS Salcedo CIS in the municipality of Dumarao is managed by the Salcedo-Cubi-Pob. Ilawod IA, Inc. The water source is the Maliaw Creek and serves 128 ha covering Barangays Salcedo, Cubi and Poblacion Ilawod. The dam was constructed in 1972 through Farm System
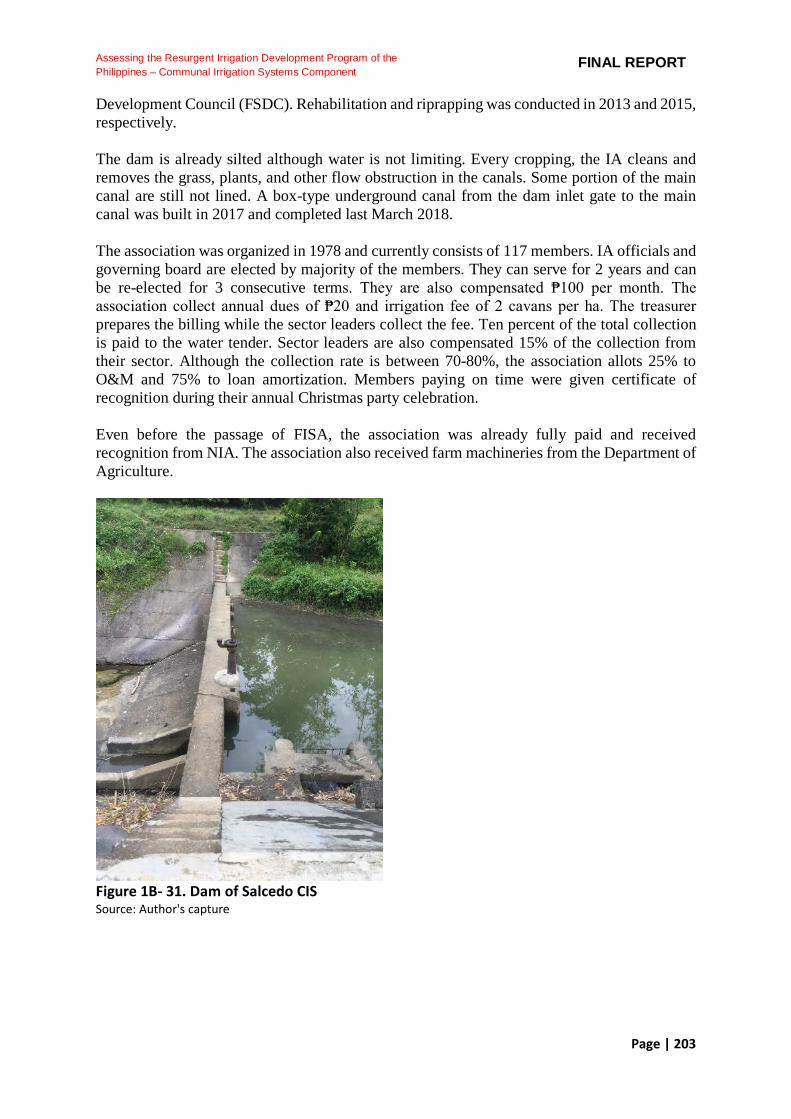
Page | 203
Assessing the Resurgent Irrigation Development Program of the
Philippines – Communal Irrigation Systems Component FINAL REPORT
Development Council (FSDC). Rehabilitation and riprapping was conducted in 2013 and 2015, respectively. The dam is already silted although water is not limiting. Every cropping, the IA cleans and removes the grass, plants, and other flow obstruction in the canals. Some portion of the main canal are still not lined. A box-type underground canal from the dam inlet gate to the main canal was built in 2017 and completed last March 2018. The association was organized in 1978 and currently consists of 117 members. IA officials and governing board are elected by majority of the members. They can serve for 2 years and can be re-elected for 3 consecutive terms. They are also compensated ₱100 per month. The association collect annual dues of ₱20 and irrigation fee of 2 cavans per ha. The treasurer prepares the billing while the sector leaders collect the fee. Ten percent of the total collection is paid to the water tender. Sector leaders are also compensated 15% of the collection from their sector. Although the collection rate is between 70-80%, the association allots 25% to O&M and 75% to loan amortization. Members paying on time were given certificate of recognition during their annual Christmas party celebration. Even before the passage of FISA, the association was already fully paid and received recognition from NIA. The association also received farm machineries from the Department of Agriculture.
Figure 1B- 31. Dam of Salcedo CIS Source: Author's capture
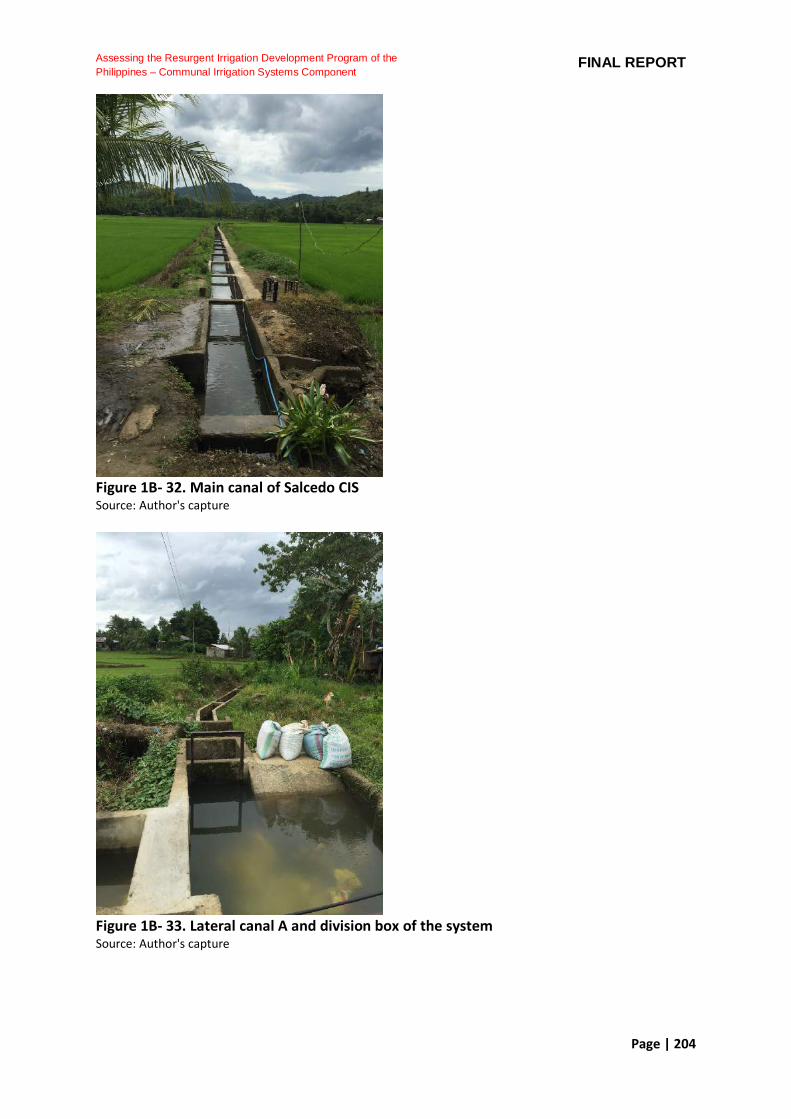
Page | 204
Assessing the Resurgent Irrigation Development Program of the
Philippines – Communal Irrigation Systems Component FINAL REPORT
Figure 1B- 32. Main canal of Salcedo CIS Source: Author's capture
Figure 1B- 33. Lateral canal A and division box of the system Source: Author's capture
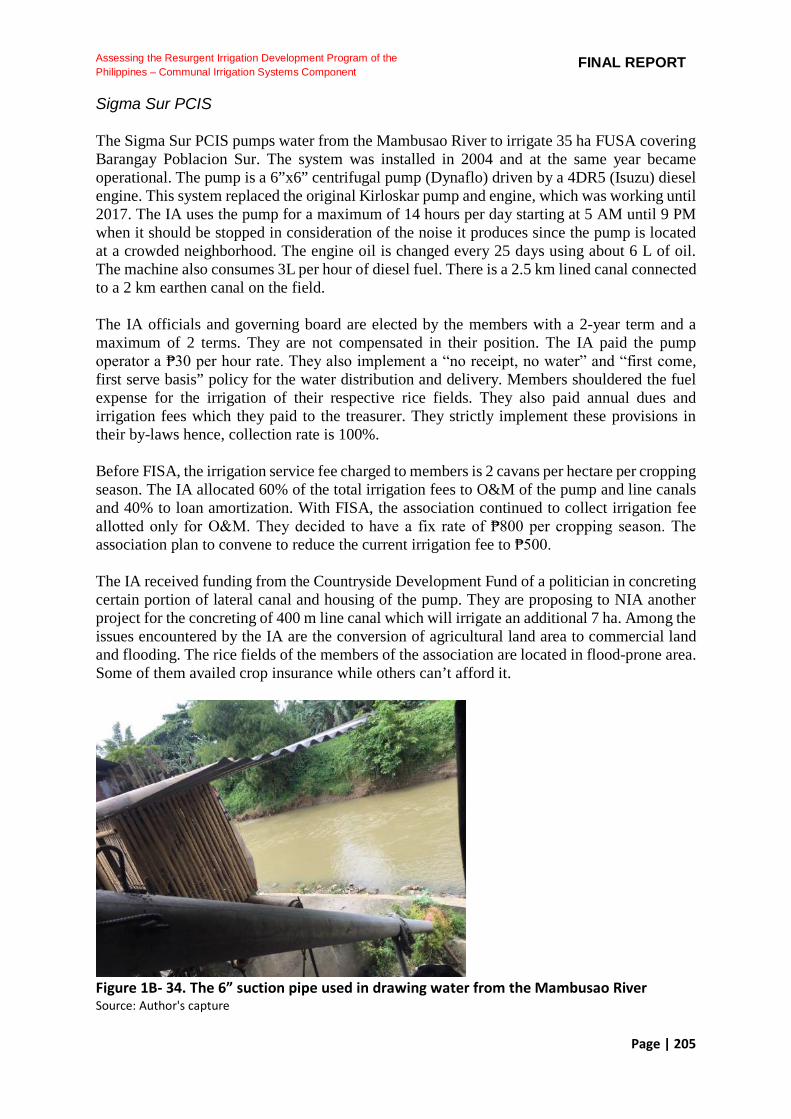
Page | 205
Assessing the Resurgent Irrigation Development Program of the
Philippines – Communal Irrigation Systems Component FINAL REPORT
Sigma Sur PCIS The Sigma Sur PCIS pumps water from the Mambusao River to irrigate 35 ha FUSA covering Barangay Poblacion Sur. The system was installed in 2004 and at the same year became operational. The pump is a 6”x6” centrifugal pump (Dynaflo) driven by a 4DR5 (Isuzu) diesel engine. This system replaced the original Kirloskar pump and engine, which was working until 2017. The IA uses the pump for a maximum of 14 hours per day starting at 5 AM until 9 PM when it should be stopped in consideration of the noise it produces since the pump is located at a crowded neighborhood. The engine oil is changed every 25 days using about 6 L of oil. The machine also consumes 3L per hour of diesel fuel. There is a 2.5 km lined canal connected to a 2 km earthen canal on the field. The IA officials and governing board are elected by the members with a 2-year term and a maximum of 2 terms. They are not compensated in their position. The IA paid the pump operator a ₱30 per hour rate. They also implement a “no receipt, no water” and “first come, first serve basis” policy for the water distribution and delivery. Members shouldered the fuel expense for the irrigation of their respective rice fields. They also paid annual dues and irrigation fees which they paid to the treasurer. They strictly implement these provisions in their by-laws hence, collection rate is 100%. Before FISA, the irrigation service fee charged to members is 2 cavans per hectare per cropping season. The IA allocated 60% of the total irrigation fees to O&M of the pump and line canals and 40% to loan amortization. With FISA, the association continued to collect irrigation fee allotted only for O&M. They decided to have a fix rate of ₱800 per cropping season. The association plan to convene to reduce the current irrigation fee to ₱500. The IA received funding from the Countryside Development Fund of a politician in concreting certain portion of lateral canal and housing of the pump. They are proposing to NIA another project for the concreting of 400 m line canal which will irrigate an additional 7 ha. Among the issues encountered by the IA are the conversion of agricultural land area to commercial land and flooding. The rice fields of the members of the association are located in flood-prone area. Some of them availed crop insurance while others can’t afford it.
Figure 1B- 34. The 6” suction pipe used in drawing water from the Mambusao River Source: Author's capture
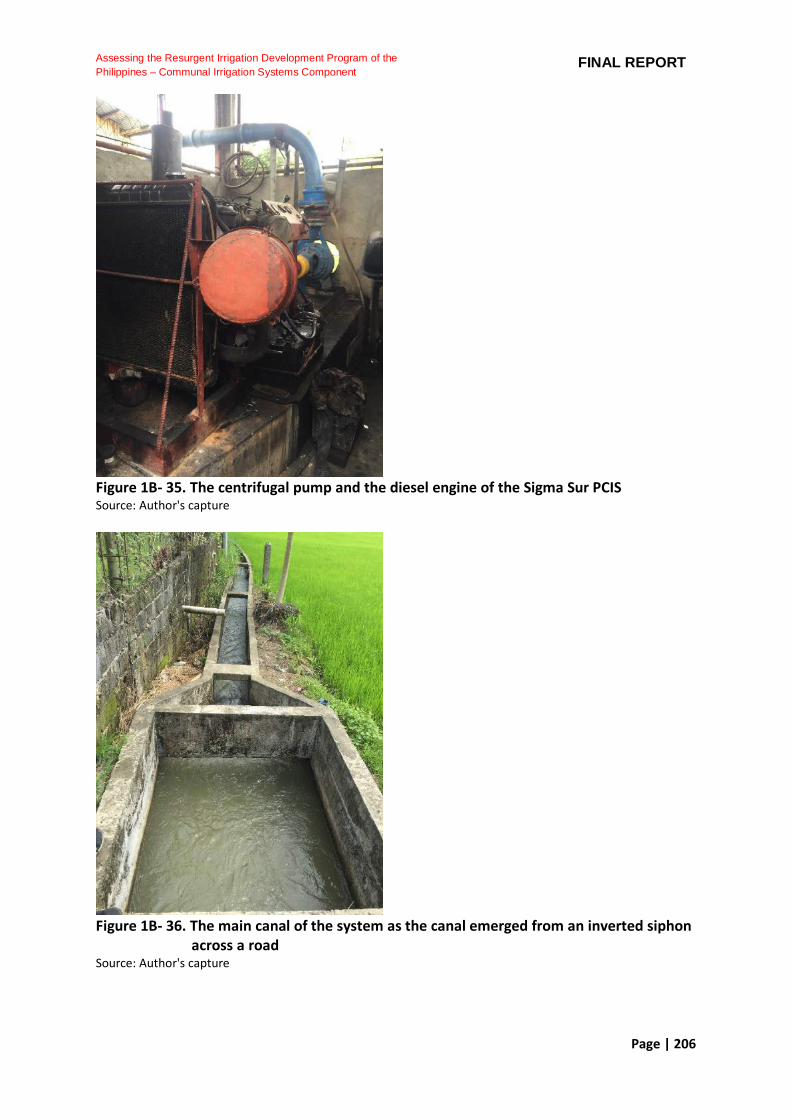
Page | 206
Assessing the Resurgent Irrigation Development Program of the
Philippines – Communal Irrigation Systems Component FINAL REPORT
Figure 1B- 35. The centrifugal pump and the diesel engine of the Sigma Sur PCIS Source: Author's capture
Figure 1B- 36. The main canal of the system as the canal emerged from an inverted siphon
across a road Source: Author's capture
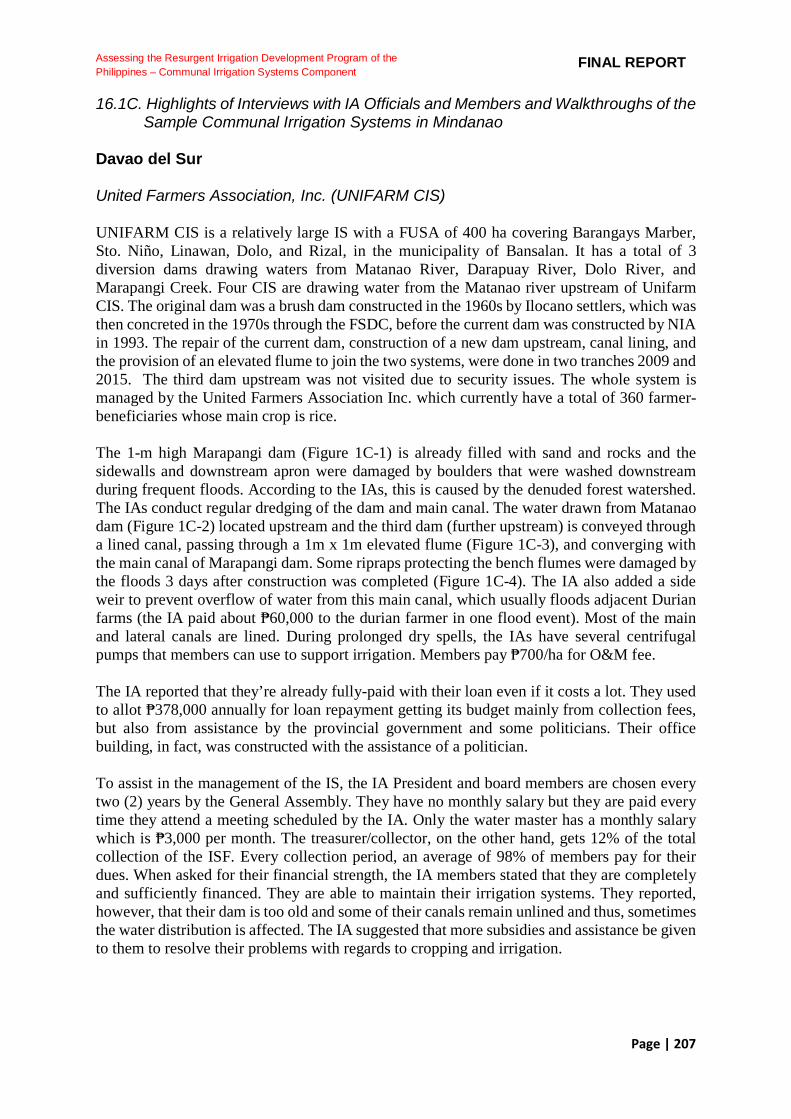
Page | 207
Assessing the Resurgent Irrigation Development Program of the
Philippines – Communal Irrigation Systems Component FINAL REPORT
16.1C. Highlights of Interviews with IA Officials and Members and Walkthroughs of the Sample Communal Irrigation Systems in Mindanao Davao del Sur United Farmers Association, Inc. (UNIFARM CIS) UNIFARM CIS is a relatively large IS with a FUSA of 400 ha covering Barangays Marber, Sto. Niño, Linawan, Dolo, and Rizal, in the municipality of Bansalan. It has a total of 3 diversion dams drawing waters from Matanao River, Darapuay River, Dolo River, and Marapangi Creek. Four CIS are drawing water from the Matanao river upstream of Unifarm CIS. The original dam was a brush dam constructed in the 1960s by Ilocano settlers, which was then concreted in the 1970s through the FSDC, before the current dam was constructed by NIA in 1993. The repair of the current dam, construction of a new dam upstream, canal lining, and the provision of an elevated flume to join the two systems, were done in two tranches 2009 and 2015. The third dam upstream was not visited due to security issues. The whole system is managed by the United Farmers Association Inc. which currently have a total of 360 farmer-beneficiaries whose main crop is rice. The 1-m high Marapangi dam (Figure 1C-1) is already filled with sand and rocks and the sidewalls and downstream apron were damaged by boulders that were washed downstream during frequent floods. According to the IAs, this is caused by the denuded forest watershed. The IAs conduct regular dredging of the dam and main canal. The water drawn from Matanao dam (Figure 1C-2) located upstream and the third dam (further upstream) is conveyed through a lined canal, passing through a 1m x 1m elevated flume (Figure 1C-3), and converging with the main canal of Marapangi dam. Some ripraps protecting the bench flumes were damaged by the floods 3 days after construction was completed (Figure 1C-4). The IA also added a side weir to prevent overflow of water from this main canal, which usually floods adjacent Durian farms (the IA paid about ₱60,000 to the durian farmer in one flood event). Most of the main and lateral canals are lined. During prolonged dry spells, the IAs have several centrifugal pumps that members can use to support irrigation. Members pay ₱700/ha for O&M fee. The IA reported that they’re already fully-paid with their loan even if it costs a lot. They used to allot ₱378,000 annually for loan repayment getting its budget mainly from collection fees, but also from assistance by the provincial government and some politicians. Their office building, in fact, was constructed with the assistance of a politician. To assist in the management of the IS, the IA President and board members are chosen every two (2) years by the General Assembly. They have no monthly salary but they are paid every time they attend a meeting scheduled by the IA. Only the water master has a monthly salary which is ₱3,000 per month. The treasurer/collector, on the other hand, gets 12% of the total collection of the ISF. Every collection period, an average of 98% of members pay for their dues. When asked for their financial strength, the IA members stated that they are completely and sufficiently financed. They are able to maintain their irrigation systems. They reported, however, that their dam is too old and some of their canals remain unlined and thus, sometimes the water distribution is affected. The IA suggested that more subsidies and assistance be given to them to resolve their problems with regards to cropping and irrigation.
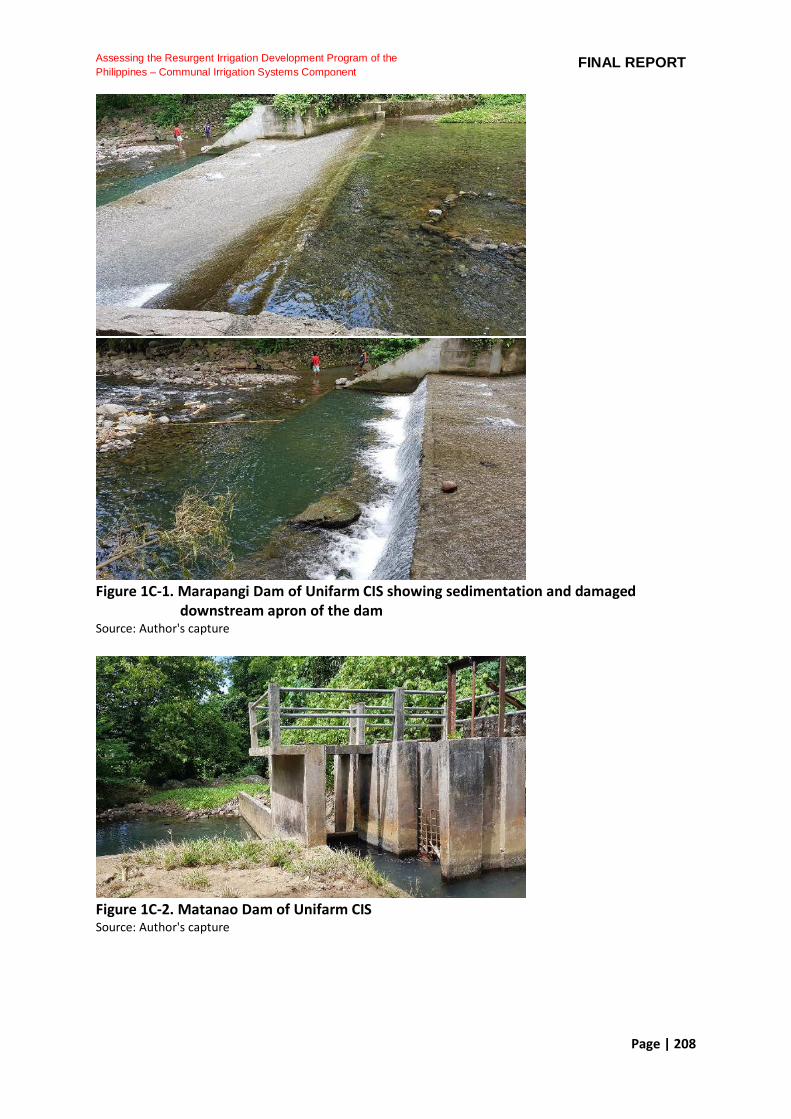
Page | 208
Assessing the Resurgent Irrigation Development Program of the
Philippines – Communal Irrigation Systems Component FINAL REPORT
Figure 1C-1. Marapangi Dam of Unifarm CIS showing sedimentation and damaged
downstream apron of the dam Source: Author's capture
Figure 1C-2. Matanao Dam of Unifarm CIS Source: Author's capture

Page | 209
Assessing the Resurgent Irrigation Development Program of the
Philippines – Communal Irrigation Systems Component FINAL REPORT
Figure 1C-3. Elevated flume from Matanao dam Source: Author's capture
Figure 1C-4. Riprap of bench flume damaged by floods Source: Author's capture New Katipunan CIS The New Katipunan CIS has a 100 ha FUSA in Barangay New Katipunan, Matanao, Davao del Sur. The CIS draws water from Bacungan Creek and Sapa Maloni. Even during summer, water in the dam does not dry up but there are areas that cannot be irrigated so the IA pumps water from Balatukan and Blucon Rivers. The dam (Figure 1C-5) was built in 1979 and started operation a year after. After completion of the project, however, problems emerged including no steels and unstable trapezoidal canals. Many parts of the main canal are still unlined and there is a broken section in the lined part (Figure 1C-6). The system was turned over to the IA in 1990. It is managed by Latale New Katipunan IA and at present have 81 rice farmer-beneficiaries. The IA practiced cleaning of the dam every before flooding season. Some parts of the dam are still deep and some parts are filled with sediments, though dredging is not practiced. Cleaning of the main canals and trimming of the grasses are done every May to June. The IA avoids the use of herbicide since the soil will erode into the canals. The IA owns non-self-priming pumps with ratings of 8 hp, 10 hp, and 12 hp (Figure 1C-7).
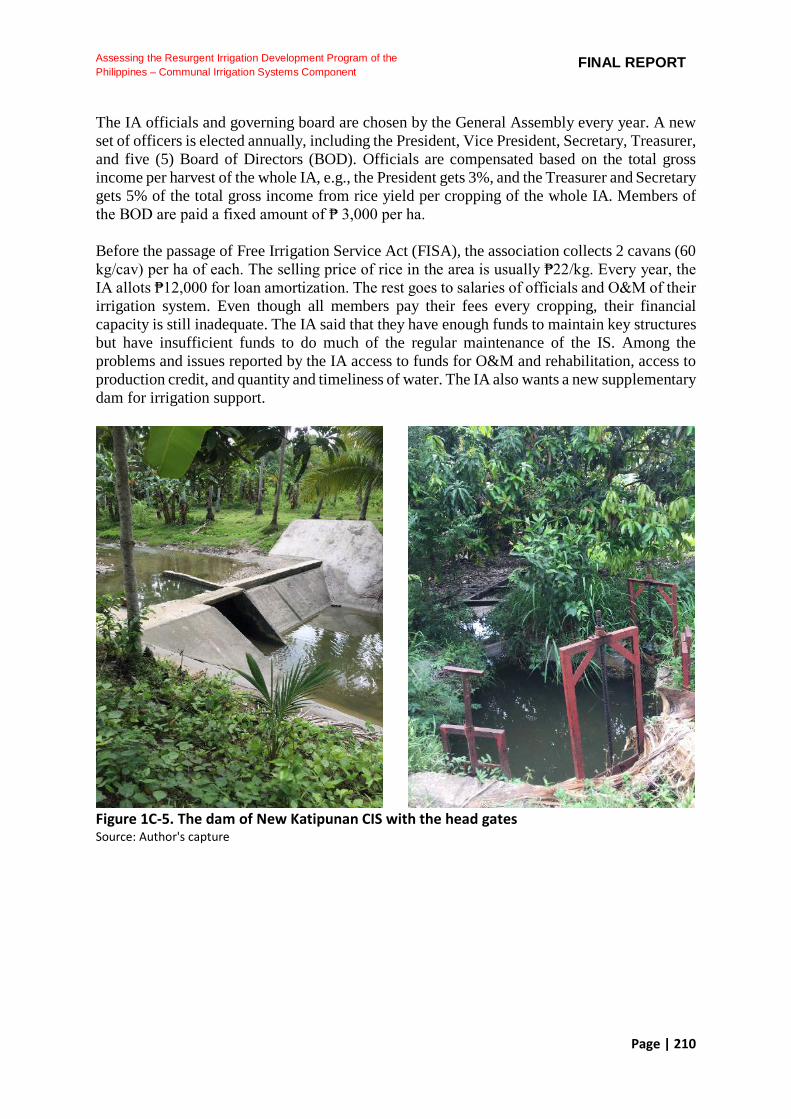
Page | 210
Assessing the Resurgent Irrigation Development Program of the
Philippines – Communal Irrigation Systems Component FINAL REPORT
The IA officials and governing board are chosen by the General Assembly every year. A new set of officers is elected annually, including the President, Vice President, Secretary, Treasurer, and five (5) Board of Directors (BOD). Officials are compensated based on the total gross income per harvest of the whole IA, e.g., the President gets 3%, and the Treasurer and Secretary gets 5% of the total gross income from rice yield per cropping of the whole IA. Members of the BOD are paid a fixed amount of ₱ 3,000 per ha. Before the passage of Free Irrigation Service Act (FISA), the association collects 2 cavans (60 kg/cav) per ha of each. The selling price of rice in the area is usually ₱22/kg. Every year, the IA allots ₱12,000 for loan amortization. The rest goes to salaries of officials and O&M of their irrigation system. Even though all members pay their fees every cropping, their financial capacity is still inadequate. The IA said that they have enough funds to maintain key structures but have insufficient funds to do much of the regular maintenance of the IS. Among the problems and issues reported by the IA access to funds for O&M and rehabilitation, access to production credit, and quantity and timeliness of water. The IA also wants a new supplementary dam for irrigation support.
Figure 1C-5. The dam of New Katipunan CIS with the head gates Source: Author's capture
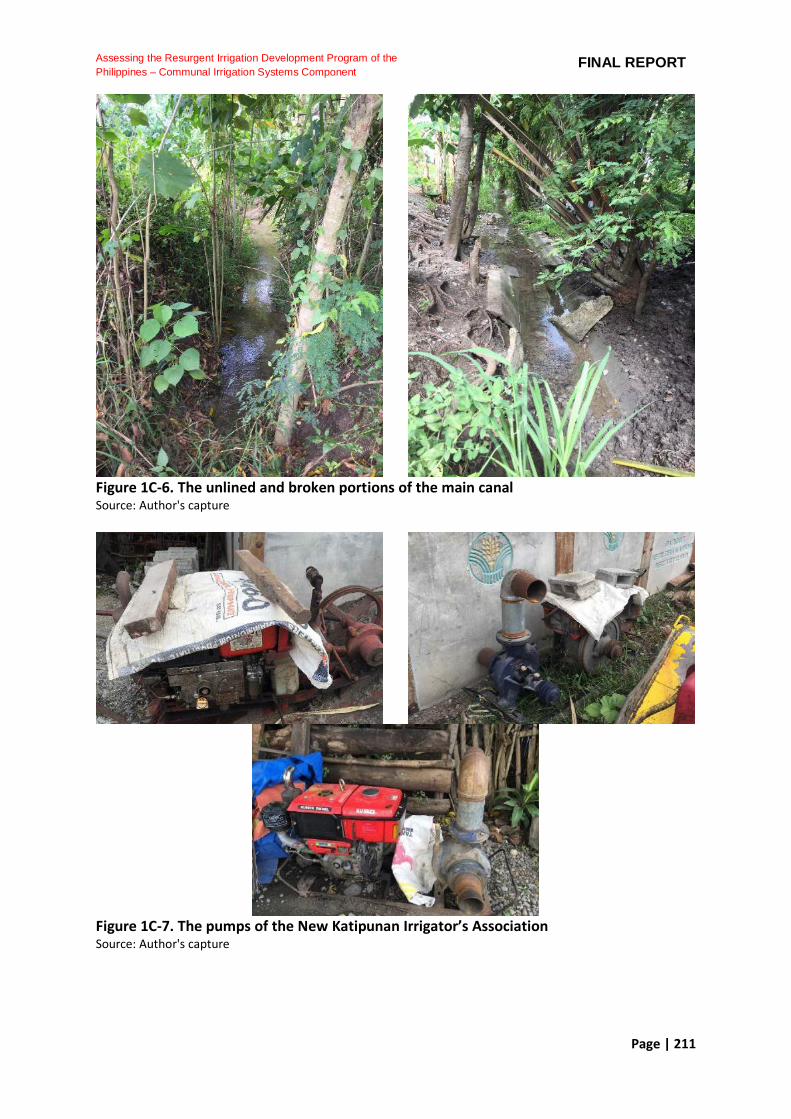
Page | 211
Assessing the Resurgent Irrigation Development Program of the
Philippines – Communal Irrigation Systems Component FINAL REPORT
Figure 1C-6. The unlined and broken portions of the main canal Source: Author's capture
Figure 1C-7. The pumps of the New Katipunan Irrigator’s Association Source: Author's capture

Page | 212
Assessing the Resurgent Irrigation Development Program of the
Philippines – Communal Irrigation Systems Component FINAL REPORT
Butilon CIS Butilon CIS, in Magsaysay, Davao del Sur, draws its waters from Butilon Creek and serving a FUSA of 40 ha, covering Barangay Cabasagan. The CIS is managed by Butilon IA, Inc. with 45 rice farmer beneficiaries as of July 2018. The water delivered is not sufficient even in the rainy season though the dam does not dry up completely during summer season. The IA rents a pump for ₱100.00/hr. When there is too much rain during the rainy season, water on the dam overflows flooding the area near the dam. The watershed is said to be already denuded with the creek carrying much floating debris and causing siltation in the dam. The old dam, built through FSDC in the 1980’s, was an ogee-type dam with a wooden plank serving as the gate. After the rehabilitation in 2013, the buttress dam with a sluice gate was constructed (Figure 1C-8), the upstream and downstream apron and side walls were extended, the spillway and intake were repaired, additional concrete lining of 4 km of canal, and a rest area for the water master above the dam was added. The rehabilitation cost a little less than ₱8 M, and complete turn-over to the IA was done in 2015. The previous screw-type sluice gate was then replaced by the IA with a chain block for faster lifting costing them ₱4500. The main canal (Figure 1C-9) is lined but the lateral canals of the system are still earthen. The President and other IA officials as well as the governing board, are elected every year by the General Assembly. All IA officials are not compensated because they considered the work as public service. Before the passage of the FISA, the IA collects 150kg/ha/season from members. Annually, ₱75,000 is allocated for loan repayment/amortization. Only around 80%, however, are able to regularly pay their dues and the percentage goes even lower if harvest is lean. About ₱1000/ha per season is collected for O&M of the system. With regards to their financial capacity, the IA members said that they are underfinanced and they recently created a resolution seeking assistance from NIA. Common problems stated by the IA include access to funds for rehabilitation, access to production credit, and insufficient water. The IA requested lining of canals, water pumps, provision of subsidies (fertilizer and seeds), and financial assistance from NIA to resolve their problems.
Figure 1C-8. The dam of Butilon CIS with the extended apron and side wall Source: Author's capture
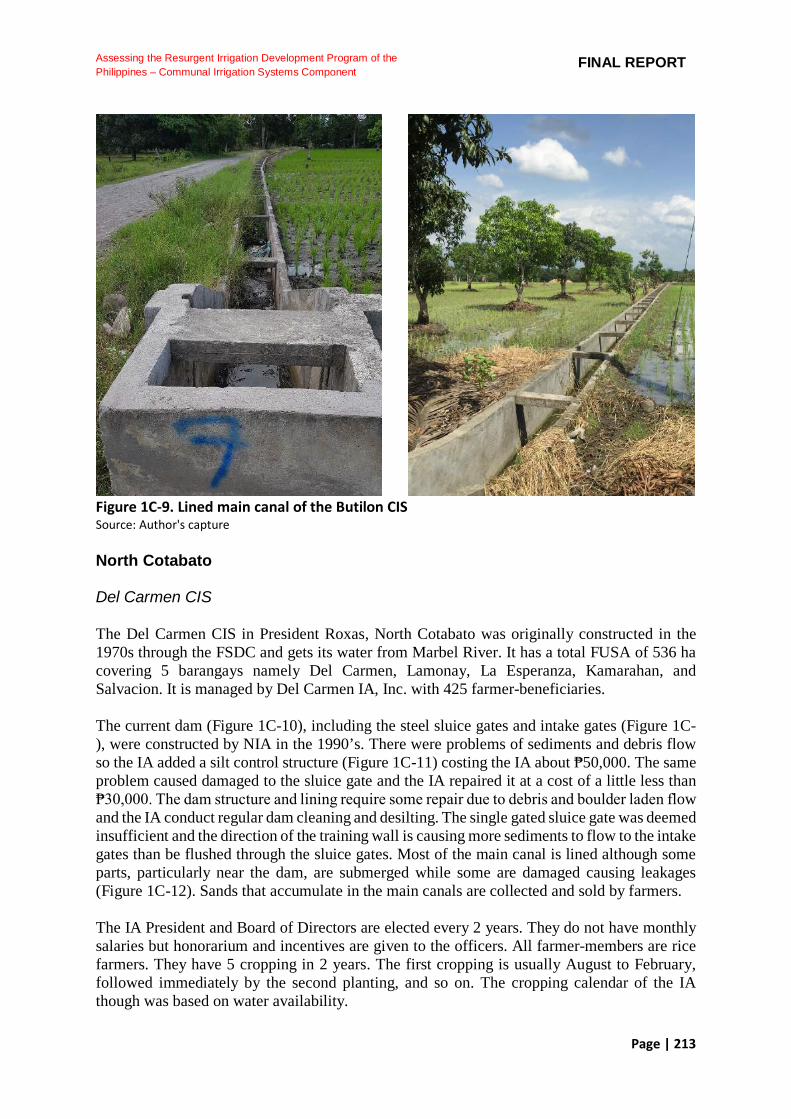
Page | 213
Assessing the Resurgent Irrigation Development Program of the
Philippines – Communal Irrigation Systems Component FINAL REPORT
Figure 1C-9. Lined main canal of the Butilon CIS Source: Author's capture North Cotabato Del Carmen CIS The Del Carmen CIS in President Roxas, North Cotabato was originally constructed in the 1970s through the FSDC and gets its water from Marbel River. It has a total FUSA of 536 ha covering 5 barangays namely Del Carmen, Lamonay, La Esperanza, Kamarahan, and Salvacion. It is managed by Del Carmen IA, Inc. with 425 farmer-beneficiaries. The current dam (Figure 1C-10), including the steel sluice gates and intake gates (Figure 1C-), were constructed by NIA in the 1990’s. There were problems of sediments and debris flow so the IA added a silt control structure (Figure 1C-11) costing the IA about ₱50,000. The same problem caused damaged to the sluice gate and the IA repaired it at a cost of a little less than ₱30,000. The dam structure and lining require some repair due to debris and boulder laden flow and the IA conduct regular dam cleaning and desilting. The single gated sluice gate was deemed insufficient and the direction of the training wall is causing more sediments to flow to the intake gates than be flushed through the sluice gates. Most of the main canal is lined although some parts, particularly near the dam, are submerged while some are damaged causing leakages (Figure 1C-12). Sands that accumulate in the main canals are collected and sold by farmers. The IA President and Board of Directors are elected every 2 years. They do not have monthly salaries but honorarium and incentives are given to the officers. All farmer-members are rice farmers. They have 5 cropping in 2 years. The first cropping is usually August to February, followed immediately by the second planting, and so on. The cropping calendar of the IA though was based on water availability.
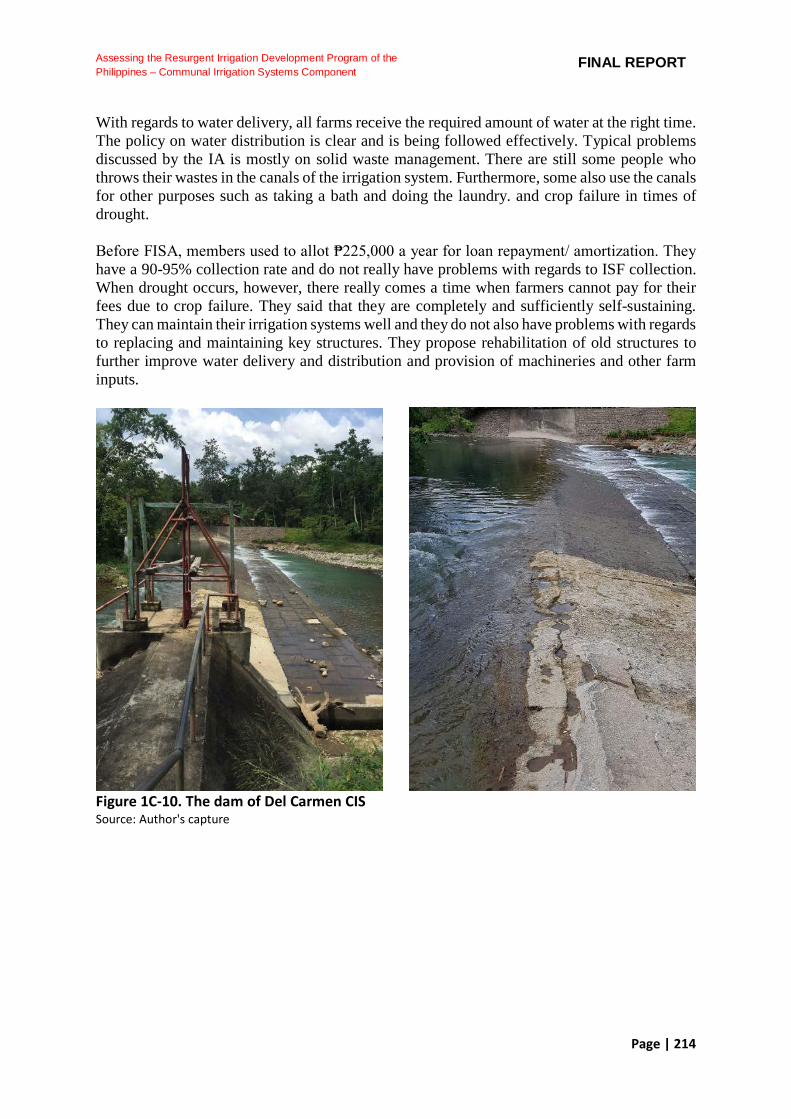
Page | 214
Assessing the Resurgent Irrigation Development Program of the
Philippines – Communal Irrigation Systems Component FINAL REPORT
With regards to water delivery, all farms receive the required amount of water at the right time. The policy on water distribution is clear and is being followed effectively. Typical problems discussed by the IA is mostly on solid waste management. There are still some people who throws their wastes in the canals of the irrigation system. Furthermore, some also use the canals for other purposes such as taking a bath and doing the laundry. and crop failure in times of drought. Before FISA, members used to allot ₱225,000 a year for loan repayment/ amortization. They have a 90-95% collection rate and do not really have problems with regards to ISF collection. When drought occurs, however, there really comes a time when farmers cannot pay for their fees due to crop failure. They said that they are completely and sufficiently self-sustaining. They can maintain their irrigation systems well and they do not also have problems with regards to replacing and maintaining key structures. They propose rehabilitation of old structures to further improve water delivery and distribution and provision of machineries and other farm inputs.
Figure 1C-10. The dam of Del Carmen CIS Source: Author's capture
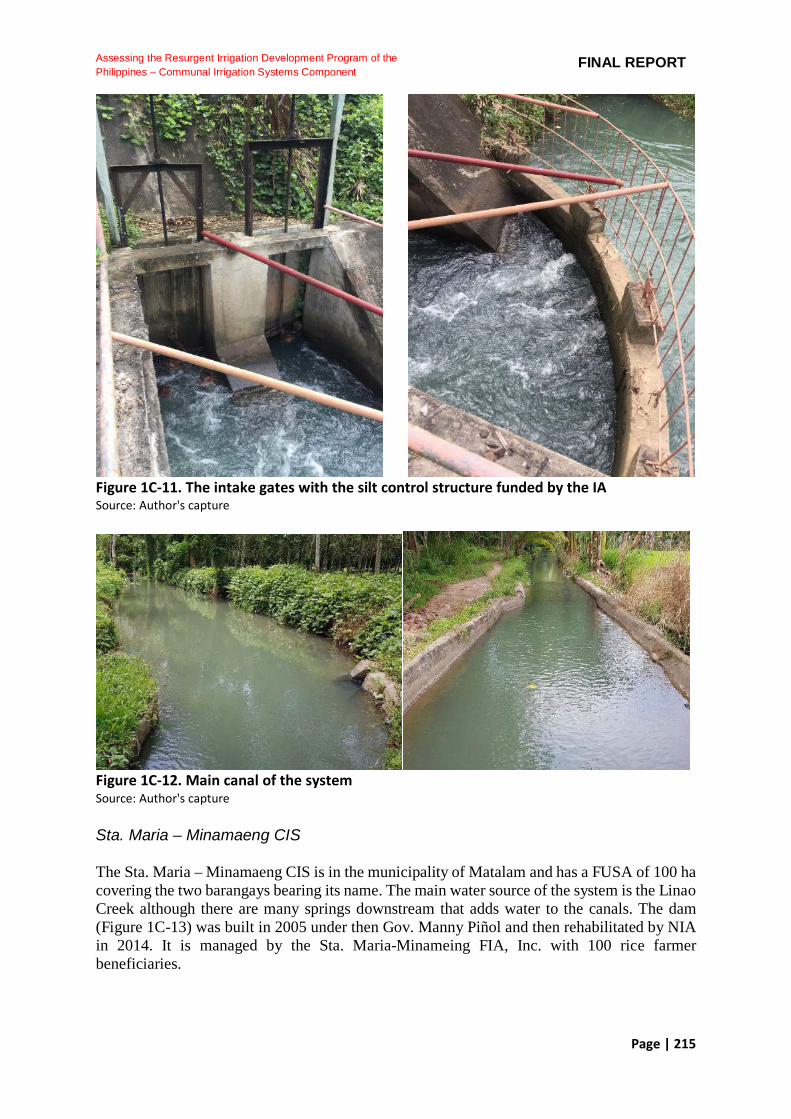
Page | 215
Assessing the Resurgent Irrigation Development Program of the
Philippines – Communal Irrigation Systems Component FINAL REPORT
Figure 1C-11. The intake gates with the silt control structure funded by the IA Source: Author's capture
Figure 1C-12. Main canal of the system Source: Author's capture Sta. Maria – Minamaeng CIS The Sta. Maria – Minamaeng CIS is in the municipality of Matalam and has a FUSA of 100 ha covering the two barangays bearing its name. The main water source of the system is the Linao Creek although there are many springs downstream that adds water to the canals. The dam (Figure 1C-13) was built in 2005 under then Gov. Manny Piñol and then rehabilitated by NIA in 2014. It is managed by the Sta. Maria-Minameing FIA, Inc. with 100 rice farmer beneficiaries.
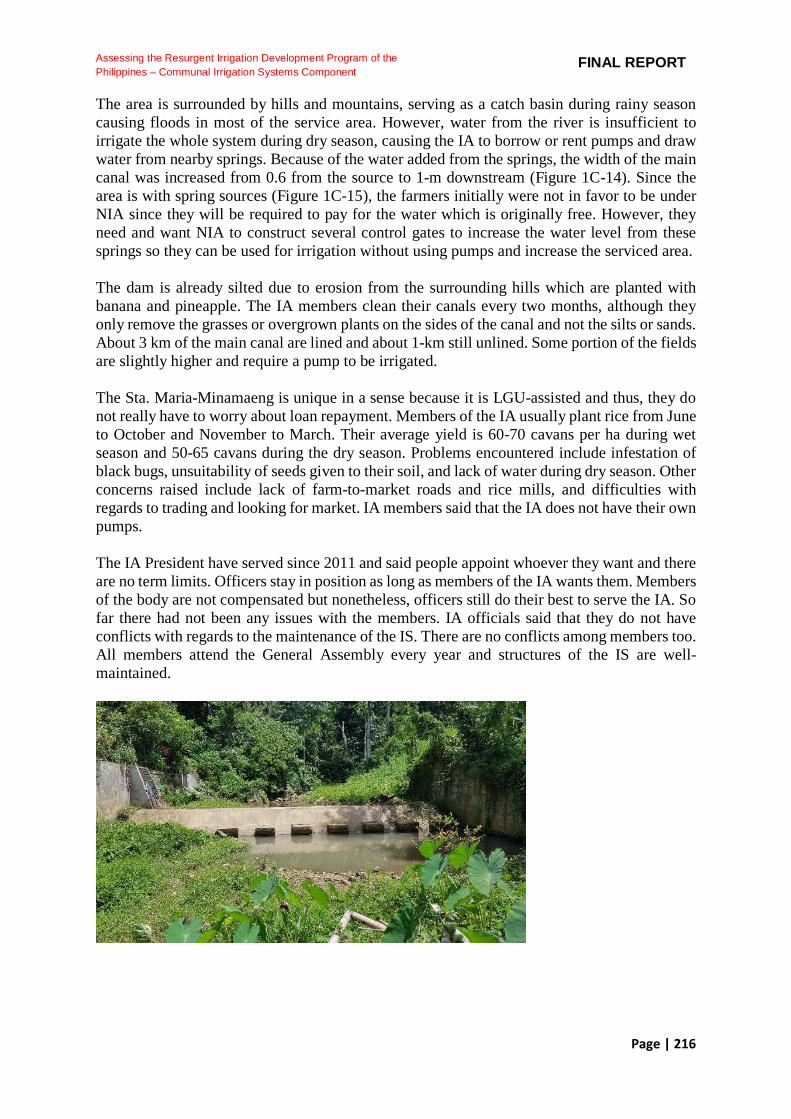
Page | 216
Assessing the Resurgent Irrigation Development Program of the
Philippines – Communal Irrigation Systems Component FINAL REPORT
The area is surrounded by hills and mountains, serving as a catch basin during rainy season causing floods in most of the service area. However, water from the river is insufficient to irrigate the whole system during dry season, causing the IA to borrow or rent pumps and draw water from nearby springs. Because of the water added from the springs, the width of the main canal was increased from 0.6 from the source to 1-m downstream (Figure 1C-14). Since the area is with spring sources (Figure 1C-15), the farmers initially were not in favor to be under NIA since they will be required to pay for the water which is originally free. However, they need and want NIA to construct several control gates to increase the water level from these springs so they can be used for irrigation without using pumps and increase the serviced area. The dam is already silted due to erosion from the surrounding hills which are planted with banana and pineapple. The IA members clean their canals every two months, although they only remove the grasses or overgrown plants on the sides of the canal and not the silts or sands. About 3 km of the main canal are lined and about 1-km still unlined. Some portion of the fields are slightly higher and require a pump to be irrigated. The Sta. Maria-Minamaeng is unique in a sense because it is LGU-assisted and thus, they do not really have to worry about loan repayment. Members of the IA usually plant rice from June to October and November to March. Their average yield is 60-70 cavans per ha during wet season and 50-65 cavans during the dry season. Problems encountered include infestation of black bugs, unsuitability of seeds given to their soil, and lack of water during dry season. Other concerns raised include lack of farm-to-market roads and rice mills, and difficulties with regards to trading and looking for market. IA members said that the IA does not have their own pumps. The IA President have served since 2011 and said people appoint whoever they want and there are no term limits. Officers stay in position as long as members of the IA wants them. Members of the body are not compensated but nonetheless, officers still do their best to serve the IA. So far there had not been any issues with the members. IA officials said that they do not have conflicts with regards to the maintenance of the IS. There are no conflicts among members too. All members attend the General Assembly every year and structures of the IS are well-maintained.
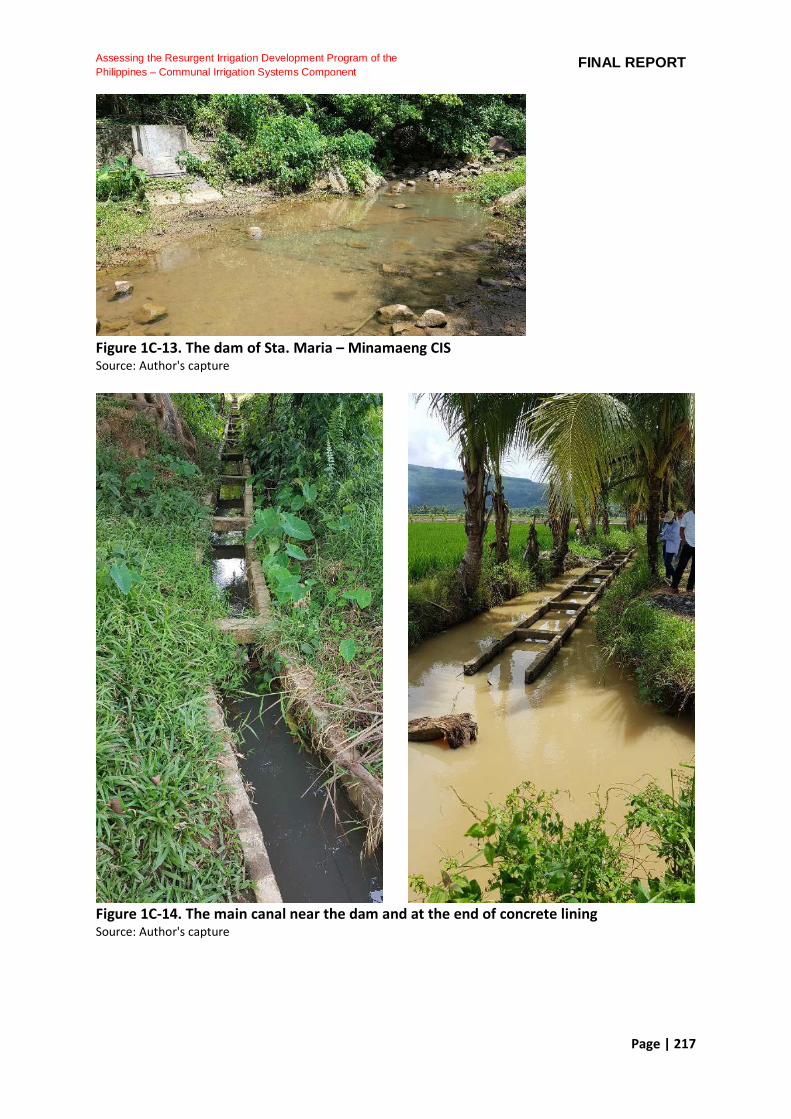
Page | 217
Assessing the Resurgent Irrigation Development Program of the
Philippines – Communal Irrigation Systems Component FINAL REPORT
Figure 1C-13. The dam of Sta. Maria – Minamaeng CIS Source: Author's capture
Figure 1C-14. The main canal near the dam and at the end of concrete lining Source: Author's capture

Page | 218
Assessing the Resurgent Irrigation Development Program of the
Philippines – Communal Irrigation Systems Component FINAL REPORT
Figure 1C-15. One of several spring sources downstream Source: Author's capture
Figure 1C-16. Where the IA pumps water to reach the other side of the field Source: Author's capture
Figure 1C-17. The proposed site of the IA office Source: Author's capture
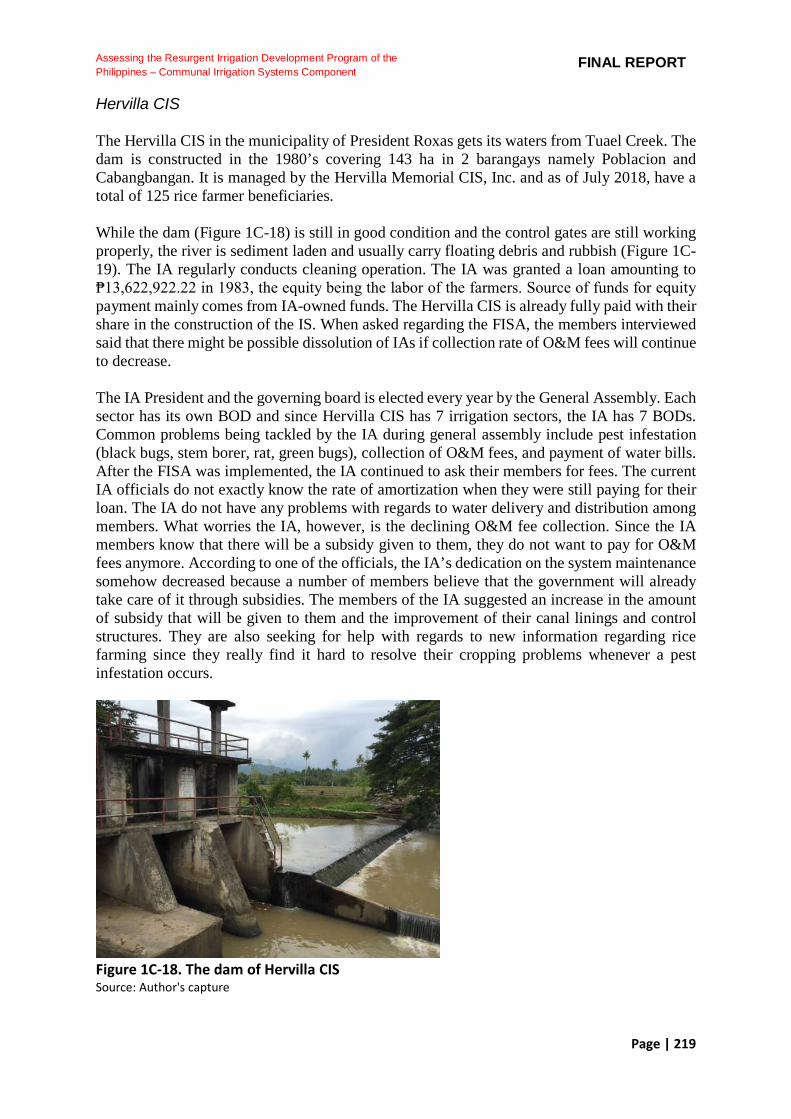
Page | 219
Assessing the Resurgent Irrigation Development Program of the
Philippines – Communal Irrigation Systems Component FINAL REPORT
Hervilla CIS The Hervilla CIS in the municipality of President Roxas gets its waters from Tuael Creek. The dam is constructed in the 1980’s covering 143 ha in 2 barangays namely Poblacion and Cabangbangan. It is managed by the Hervilla Memorial CIS, Inc. and as of July 2018, have a total of 125 rice farmer beneficiaries. While the dam (Figure 1C-18) is still in good condition and the control gates are still working properly, the river is sediment laden and usually carry floating debris and rubbish (Figure 1C-19). The IA regularly conducts cleaning operation. The IA was granted a loan amounting to ₱13,622,922.22 in 1983, the equity being the labor of the farmers. Source of funds for equity payment mainly comes from IA-owned funds. The Hervilla CIS is already fully paid with their share in the construction of the IS. When asked regarding the FISA, the members interviewed said that there might be possible dissolution of IAs if collection rate of O&M fees will continue to decrease. The IA President and the governing board is elected every year by the General Assembly. Each sector has its own BOD and since Hervilla CIS has 7 irrigation sectors, the IA has 7 BODs. Common problems being tackled by the IA during general assembly include pest infestation (black bugs, stem borer, rat, green bugs), collection of O&M fees, and payment of water bills. After the FISA was implemented, the IA continued to ask their members for fees. The current IA officials do not exactly know the rate of amortization when they were still paying for their loan. The IA do not have any problems with regards to water delivery and distribution among members. What worries the IA, however, is the declining O&M fee collection. Since the IA members know that there will be a subsidy given to them, they do not want to pay for O&M fees anymore. According to one of the officials, the IA’s dedication on the system maintenance somehow decreased because a number of members believe that the government will already take care of it through subsidies. The members of the IA suggested an increase in the amount of subsidy that will be given to them and the improvement of their canal linings and control structures. They are also seeking for help with regards to new information regarding rice farming since they really find it hard to resolve their cropping problems whenever a pest infestation occurs.
Figure 1C-18. The dam of Hervilla CIS Source: Author's capture

Page | 220
Assessing the Resurgent Irrigation Development Program of the
Philippines – Communal Irrigation Systems Component FINAL REPORT
Figure 1C-19. The sluice gate of the dam Source: Author's capture
Figure 1C-20. The main canal and division box to divide flow from to different zones Source: Author's capture

Page | 221
Assessing the Resurgent Irrigation Development Program of the
Philippines – Communal Irrigation Systems Component FINAL REPORT
Figure 1C-21. Main canal of the system after the culvert road crossing Source: Author's capture South Cotabato LMT (Liberty-Magtana-Tampakan) CIS LMT CIS, in the municipality of Tampakan, South Cotabato draws water from Taplan River and has a total FUSA of 1,026 ha covering 4 barangays. They were granted water rights for 750 lps from May-December. The CIS is managed by the Tampakan Irrigators Service Development Association (TISDA) with a total of 322 farmer-beneficiaries. The IA said that the dam was originally built in the 1950’s through the FSDC, then rehabilitated by NIA in 1976, and was turned over in 1978. The previous dam is ogee-type but was redesigned by NIA to its current dam where the river flow was diverted. The dam (Figure 1C-22) is full of rocks and boulders because of a mining concession in the watershed and quarry upstream. The IA sought the help of NIA to design a sediment control structure (Figure 1C-23), which the IA funded at a cost of ₱25,000. The IA also replaced the rusted steel intake gates. The IA already obtained a permit to use backhoe for dredging, which they always do to prevent the river from flowing back to its original course. The permit is for 1000 m3 of rocks and boulders. River flow is reduced by 25% during summer according to the IA. Starting 2003, several rehabilitation works have already been done to the system with a total program cost of ₱36 M as of June 16, 2010, ₱33 M of which is direct cost. These include 900-km lined main and lateral canals funded by NIA and a 7-km lined main canal funded by DAR. Only 3 km of the lateral canal are unlined. There are 2 reuse dams downstream also constructed. The IA president wishes to rehabilitate the main canals since it is already silted. The turnouts of the system are also made of wood planks since there are no more steel gates. They have schedules for main canal cleaning. The farmers plants rice, corn, banana, and high value crops such as papaya, pineapple, coconut, and banana. The area devoted to high value crops is more than 120 ha. The IA also provides irrigation water for Global Company which manages around 256 ha planted to banana, coconut and pineapple. They are paid ₱780,000 per year by Global Company. They are not exempted

Page | 222
Assessing the Resurgent Irrigation Development Program of the
Philippines – Communal Irrigation Systems Component FINAL REPORT
from the free irrigation policy and they used this fund for equity payment on top of their own funds. The cropping calendar followed by the members were finalized with the help of the IDOs from NIA, and is different from that of Global Co. Because of the different water requirements for each crop, payment of irrigation service varies from one user to another. The rates are ₱780/ha per cropping for rice, ₱500/ha per flushing for corn, and ₱2,000/ha per flushing for papaya, banana, and guava. The President and governing board are chosen every 2 years by the General Assembly. Every of the 11 sectors or irrigation zones have their own BOD. The President, Vice-President and Board members/kaka leaders/sector leaders are being paid ₱1,000 per month, while the water tenders and gatekeepers are paid ₱2,500/month. Despite the expenses, the IA believes that they are still completely and sufficiently self-sustaining, essentially because of the Global Company. During General Assembly, the typical issues being discussed by the IA include O&M collection from individual farmers (they do not have a problem with regards to asking Global Company for its share), waste management, and machinery needs. There was a time when a conflict occurred between water users. Those who tapped water illegally where called for a meeting/dialogue and was immediately resolved. The officers of the IA said that cooperation is very important.
Figure 1C-22. The dam of LMT CIS filled with sediments Source: Author's capture

Page | 223
Assessing the Resurgent Irrigation Development Program of the
Philippines – Communal Irrigation Systems Component FINAL REPORT
Figure 1C-23. The silt control structure and intake gate Source: Author's capture
Figure 1C-24. Main canal of the system Source: Author's capture
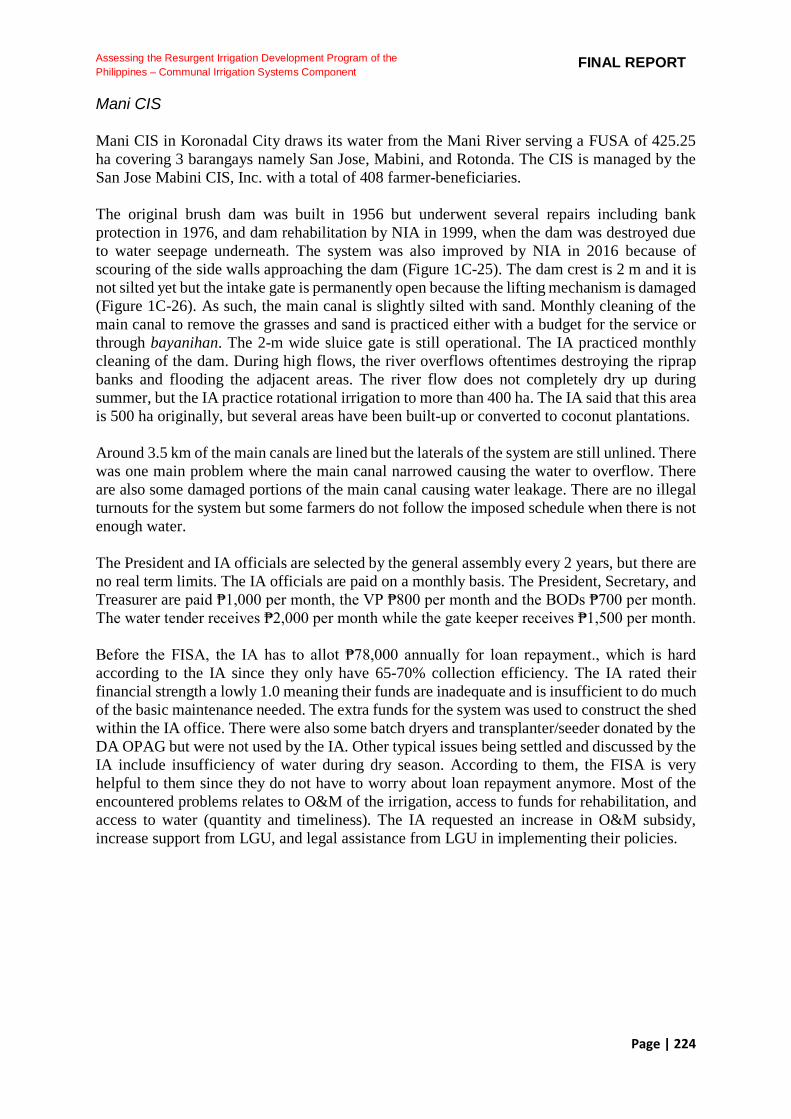
Page | 224
Assessing the Resurgent Irrigation Development Program of the
Philippines – Communal Irrigation Systems Component FINAL REPORT
Mani CIS Mani CIS in Koronadal City draws its water from the Mani River serving a FUSA of 425.25 ha covering 3 barangays namely San Jose, Mabini, and Rotonda. The CIS is managed by the San Jose Mabini CIS, Inc. with a total of 408 farmer-beneficiaries. The original brush dam was built in 1956 but underwent several repairs including bank protection in 1976, and dam rehabilitation by NIA in 1999, when the dam was destroyed due to water seepage underneath. The system was also improved by NIA in 2016 because of scouring of the side walls approaching the dam (Figure 1C-25). The dam crest is 2 m and it is not silted yet but the intake gate is permanently open because the lifting mechanism is damaged (Figure 1C-26). As such, the main canal is slightly silted with sand. Monthly cleaning of the main canal to remove the grasses and sand is practiced either with a budget for the service or through bayanihan. The 2-m wide sluice gate is still operational. The IA practiced monthly cleaning of the dam. During high flows, the river overflows oftentimes destroying the riprap banks and flooding the adjacent areas. The river flow does not completely dry up during summer, but the IA practice rotational irrigation to more than 400 ha. The IA said that this area is 500 ha originally, but several areas have been built-up or converted to coconut plantations. Around 3.5 km of the main canals are lined but the laterals of the system are still unlined. There was one main problem where the main canal narrowed causing the water to overflow. There are also some damaged portions of the main canal causing water leakage. There are no illegal turnouts for the system but some farmers do not follow the imposed schedule when there is not enough water. The President and IA officials are selected by the general assembly every 2 years, but there are no real term limits. The IA officials are paid on a monthly basis. The President, Secretary, and Treasurer are paid ₱1,000 per month, the VP ₱800 per month and the BODs ₱700 per month. The water tender receives ₱2,000 per month while the gate keeper receives ₱1,500 per month. Before the FISA, the IA has to allot ₱78,000 annually for loan repayment., which is hard according to the IA since they only have 65-70% collection efficiency. The IA rated their financial strength a lowly 1.0 meaning their funds are inadequate and is insufficient to do much of the basic maintenance needed. The extra funds for the system was used to construct the shed within the IA office. There were also some batch dryers and transplanter/seeder donated by the DA OPAG but were not used by the IA. Other typical issues being settled and discussed by the IA include insufficiency of water during dry season. According to them, the FISA is very helpful to them since they do not have to worry about loan repayment anymore. Most of the encountered problems relates to O&M of the irrigation, access to funds for rehabilitation, and access to water (quantity and timeliness). The IA requested an increase in O&M subsidy, increase support from LGU, and legal assistance from LGU in implementing their policies.
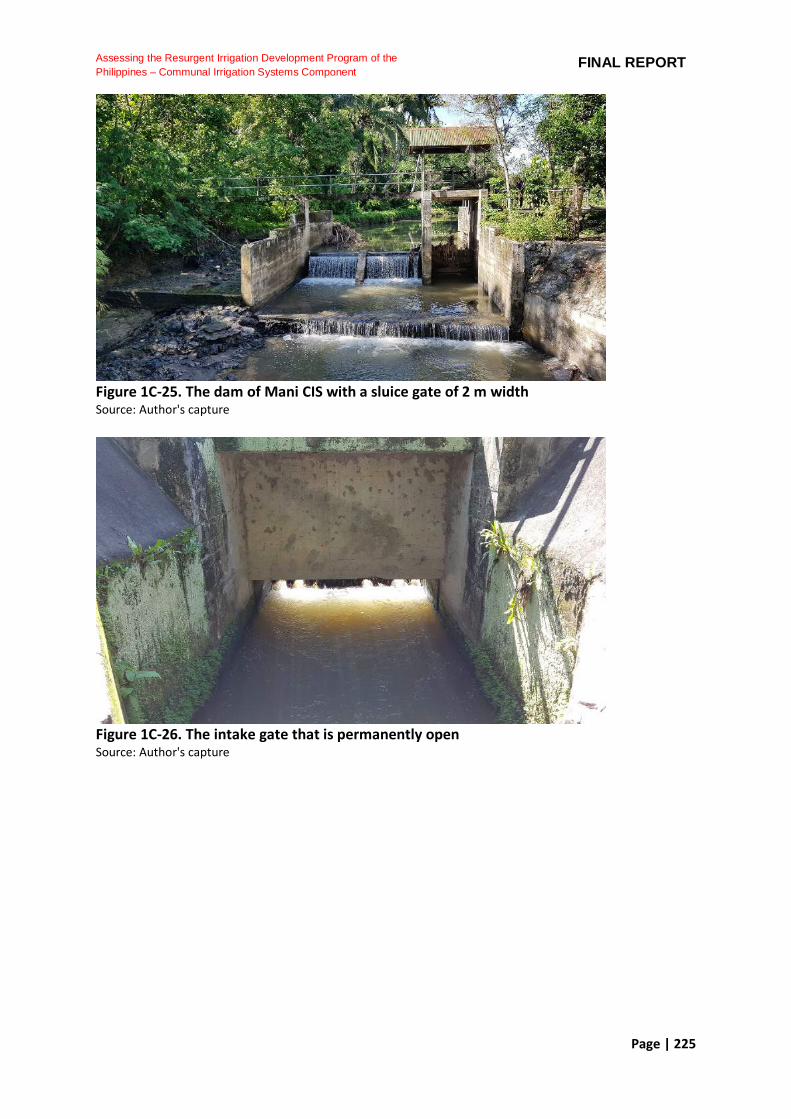
Page | 225
Assessing the Resurgent Irrigation Development Program of the
Philippines – Communal Irrigation Systems Component FINAL REPORT
Figure 1C-25. The dam of Mani CIS with a sluice gate of 2 m width Source: Author's capture
Figure 1C-26. The intake gate that is permanently open Source: Author's capture
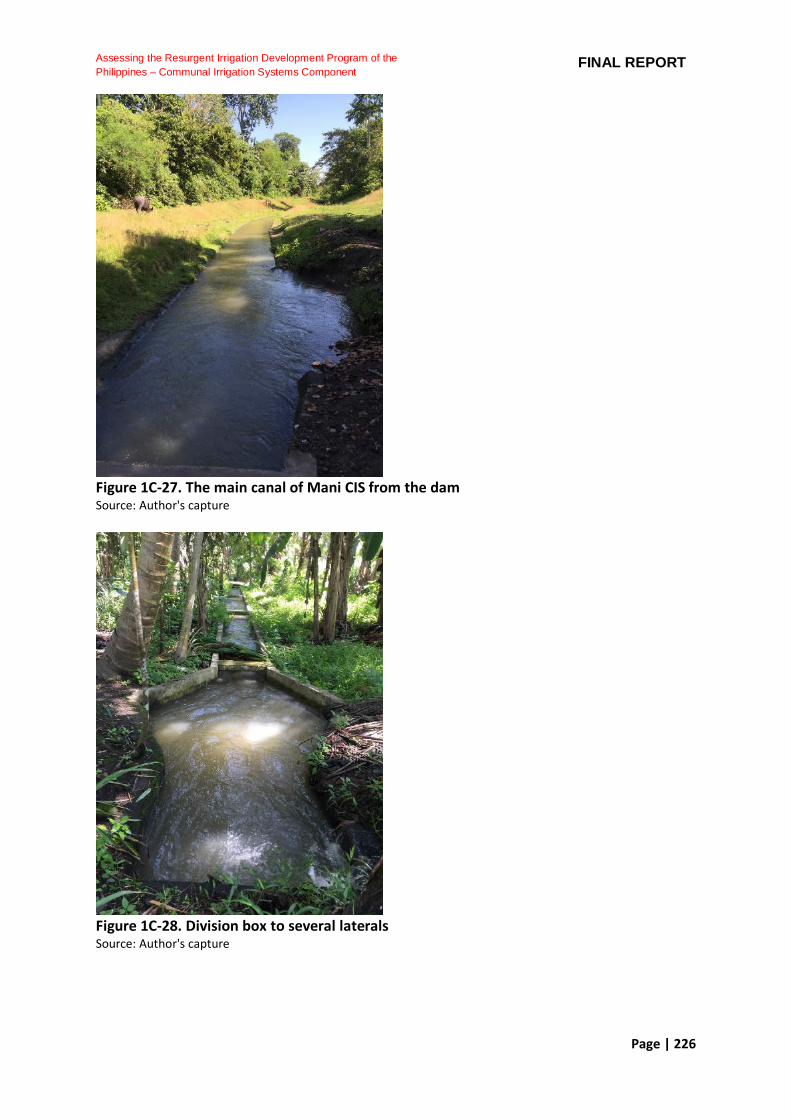
Page | 226
Assessing the Resurgent Irrigation Development Program of the
Philippines – Communal Irrigation Systems Component FINAL REPORT
Figure 1C-27. The main canal of Mani CIS from the dam Source: Author's capture
Figure 1C-28. Division box to several laterals Source: Author's capture
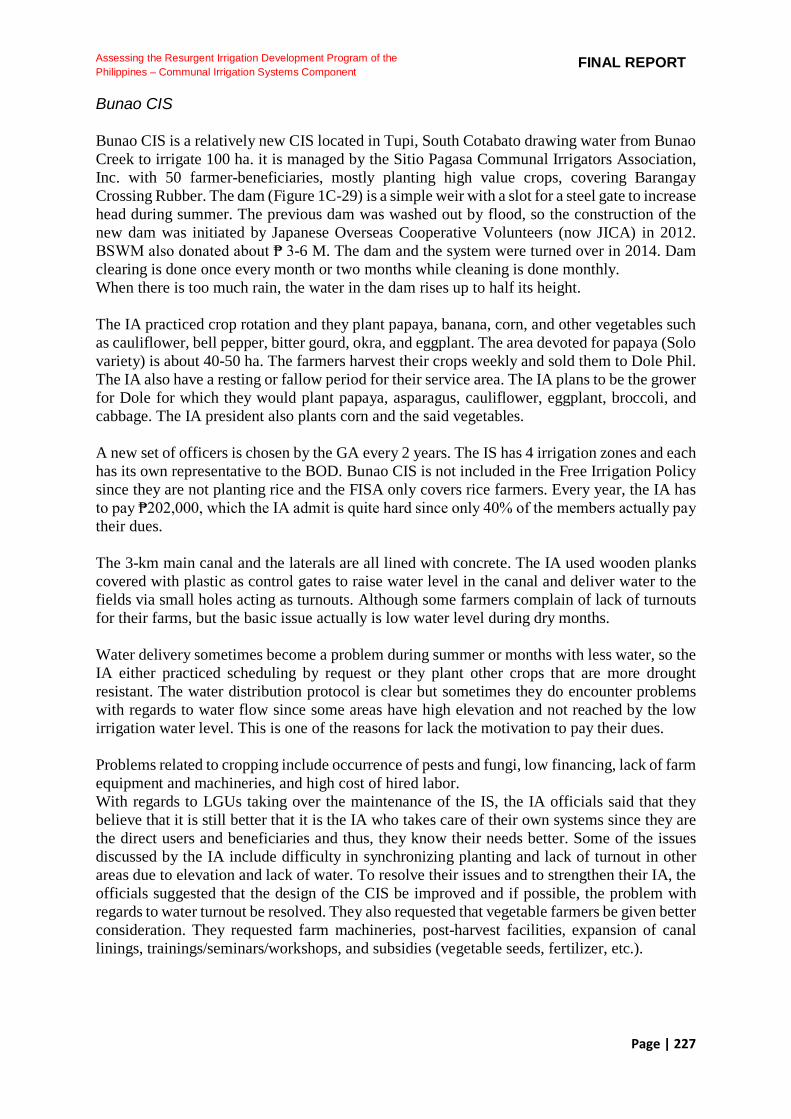
Page | 227
Assessing the Resurgent Irrigation Development Program of the
Philippines – Communal Irrigation Systems Component FINAL REPORT
Bunao CIS Bunao CIS is a relatively new CIS located in Tupi, South Cotabato drawing water from Bunao Creek to irrigate 100 ha. it is managed by the Sitio Pagasa Communal Irrigators Association, Inc. with 50 farmer-beneficiaries, mostly planting high value crops, covering Barangay Crossing Rubber. The dam (Figure 1C-29) is a simple weir with a slot for a steel gate to increase head during summer. The previous dam was washed out by flood, so the construction of the new dam was initiated by Japanese Overseas Cooperative Volunteers (now JICA) in 2012. BSWM also donated about ₱ 3-6 M. The dam and the system were turned over in 2014. Dam clearing is done once every month or two months while cleaning is done monthly. When there is too much rain, the water in the dam rises up to half its height. The IA practiced crop rotation and they plant papaya, banana, corn, and other vegetables such as cauliflower, bell pepper, bitter gourd, okra, and eggplant. The area devoted for papaya (Solo variety) is about 40-50 ha. The farmers harvest their crops weekly and sold them to Dole Phil. The IA also have a resting or fallow period for their service area. The IA plans to be the grower for Dole for which they would plant papaya, asparagus, cauliflower, eggplant, broccoli, and cabbage. The IA president also plants corn and the said vegetables. A new set of officers is chosen by the GA every 2 years. The IS has 4 irrigation zones and each has its own representative to the BOD. Bunao CIS is not included in the Free Irrigation Policy since they are not planting rice and the FISA only covers rice farmers. Every year, the IA has to pay ₱202,000, which the IA admit is quite hard since only 40% of the members actually pay their dues. The 3-km main canal and the laterals are all lined with concrete. The IA used wooden planks covered with plastic as control gates to raise water level in the canal and deliver water to the fields via small holes acting as turnouts. Although some farmers complain of lack of turnouts for their farms, but the basic issue actually is low water level during dry months. Water delivery sometimes become a problem during summer or months with less water, so the IA either practiced scheduling by request or they plant other crops that are more drought resistant. The water distribution protocol is clear but sometimes they do encounter problems with regards to water flow since some areas have high elevation and not reached by the low irrigation water level. This is one of the reasons for lack the motivation to pay their dues. Problems related to cropping include occurrence of pests and fungi, low financing, lack of farm equipment and machineries, and high cost of hired labor. With regards to LGUs taking over the maintenance of the IS, the IA officials said that they believe that it is still better that it is the IA who takes care of their own systems since they are the direct users and beneficiaries and thus, they know their needs better. Some of the issues discussed by the IA include difficulty in synchronizing planting and lack of turnout in other areas due to elevation and lack of water. To resolve their issues and to strengthen their IA, the officials suggested that the design of the CIS be improved and if possible, the problem with regards to water turnout be resolved. They also requested that vegetable farmers be given better consideration. They requested farm machineries, post-harvest facilities, expansion of canal linings, trainings/seminars/workshops, and subsidies (vegetable seeds, fertilizer, etc.).
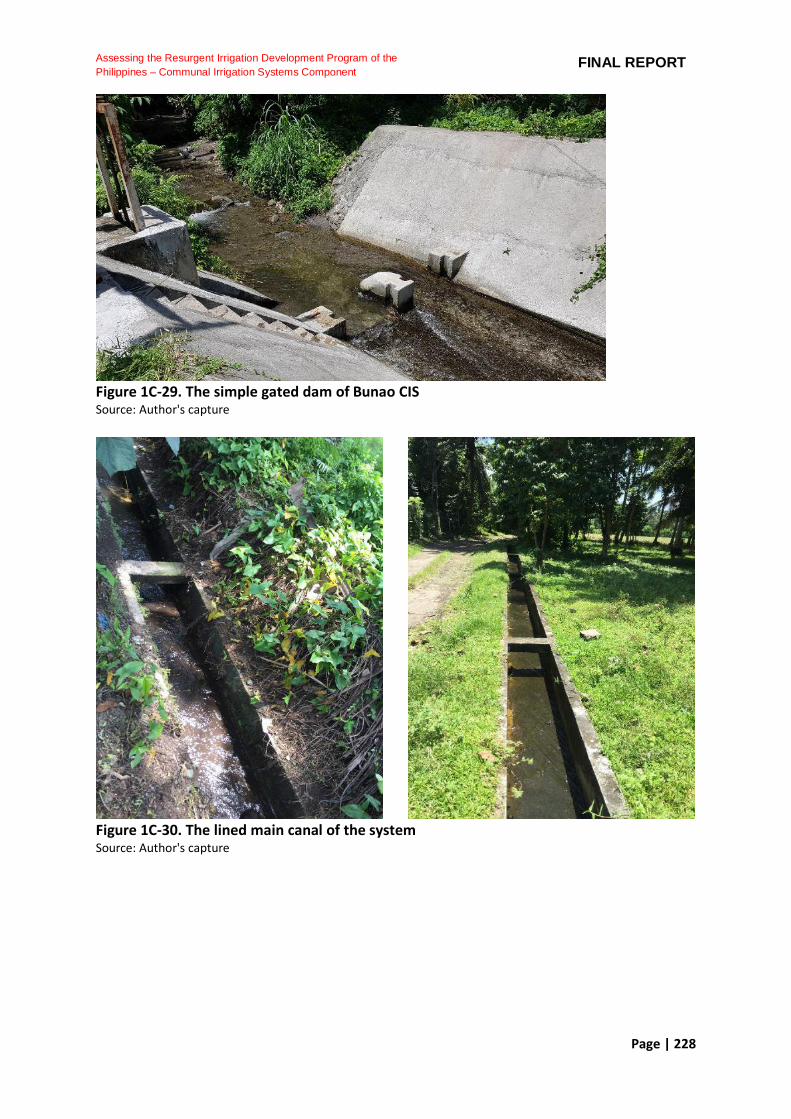
Page | 228
Assessing the Resurgent Irrigation Development Program of the
Philippines – Communal Irrigation Systems Component FINAL REPORT
Figure 1C-29. The simple gated dam of Bunao CIS Source: Author's capture
Figure 1C-30. The lined main canal of the system Source: Author's capture

Page | 229
Assessing the Resurgent Irrigation Development Program of the
Philippines – Communal Irrigation Systems Component FINAL REPORT
Figure 1C-31. Simple hole turnout and improvised gate Source: Author's capture Bukidnon Delapa CIS The Delapa CIS in the municipality of Quezon in Bukidnon gets its water from the Delapa Creek. There is also a spring that adds water downstream. The CIS has a FUSA of 330 ha and the system can water all of these during wet season but only 273 ha during the dry season. The CIS is managed by the DMSIA Dilapa Mibantang Sta.Cruz CIA, Inc. with a total of 200 rice farmer beneficiaries. The original dam was built in 1975 through the FSDC and the previous gates were made of wood. The dam was 4-ft deep before but was filled with rocks and boulders starting 2003. It was replaced by NIA in 2013 with a new dam (Figure 1C-32), including steel sluice gates and intake gates on both sides, and lined canals. Last 2017, the dam was damaged due to typhoon Vinta and the dam storage is again filled with rocks and boulders. The downstream apron of the dam is also damaged with scoured concrete lining and exposed steel frames (Figure 1C-33). The lifting mechanisms of the gates were replaced with secondhand chain blocks bought by the IA at ₱6,000 for the 5-ton capacity and ₱5,000 for the 3 tonners. The river does not dry up during summer, but there are areas which cannot be irrigated so the farmers or IA used pumps for irrigation. The IA has a pump given by DA, other members have their own pumps as well. During rainy season, the water in the dam overflows. The IA’s request for a backhoe from the local government of Quezon was already approved, but no schedule is finalized yet to dredge the dam. There are corn and banana plantation on the mountains where the river flows causing much of the erosion and sediments in the dam. The local water district

Page | 230
Assessing the Resurgent Irrigation Development Program of the
Philippines – Communal Irrigation Systems Component FINAL REPORT
also gets water from river upstream near the mountain decreasing the flow towards the dam to lessen. About 6 km of the main canal is lined leaving only about 2.5 km unlined. The lateral canals of the system are also lined. Most of the control gates in the canals have no steel gates but are fitted only with wood slabs to increase water levels. The main canal is already silted, so the IA remove the accumulated sand when the intake gates are closed. Portions of the main canal were also rehabilitated by NIA because water overflow in these parts. There is one dam keeper and three water tenders, one for each of the three irrigation zones, A, B, and C. There are box culverts in the intake of the three zones. Zone A services more than 100 ha while Zones B and C services more than 300 ha so the main canals of Zones B and C are larger than the main canal of Zone A. The lateral canal of Zone C has a 500-m length bench flume downstream and instead of having drops, chutes are used by the system. The crops planted in the service area of the system is hybrid rice 150. The IA practiced regular cleaning every three months including the clearing of the grasses. During the wet season, all farms receive the required water at the right time. For the dry season, however, occasional delays occur. There is a clear policy on the water distribution scheme. Delapa CIS has two intake gates and main canals. The first one goes to Zone A and the second one goes to Zone B (upstream) and Zone C (downstream). If water will be limited, 60% of the available water will go to Zone A, and the remaining 40% is distributed to Zone B and Zone C. Decisions on water allocation is made by the respective water tenders of each zone with coordination to the IA President. In deciding water delivery schedule, data used include water availability and demand for water of every zone. The General Assembly elects a new governing board every 3 years. For every sector, 2 representatives are chosen, a zone leader and a sector leader. With 3 zones, the IA have a total of 6 BODs. Each zone also has their own water tender and sector President, among whom the President of the whole IA will be chosen. Similar with the BOD, the term of the President is 3 years. The IA members interviewed cannot remember the amount of ISF collected since they were newly elected. With FISA implementation, the IA collects 100 kg/ha per cropping. Because of the FISA, they said they were able to focus more on O&M. They are hoping, however, that the amount of subsidy increases. Other issues discussed by the IA include solid waste management, limited water, and canal linings. The IA also requested to have water impounding to resolve their concerns.

Page | 231
Assessing the Resurgent Irrigation Development Program of the
Philippines – Communal Irrigation Systems Component FINAL REPORT
Figure 1C-32. The dam of Delapa CIS Source: Author's capture
Figure 1C-33. The damaged downstream apron of the dam Source: Author's capture
Figure 1C-34. The left sluice gate and intake gate of the dam Source: Author's capture

Page | 232
Assessing the Resurgent Irrigation Development Program of the
Philippines – Communal Irrigation Systems Component FINAL REPORT
Figure 1C-35. Trapezoidal main canal of the system Source: Author's capture Magsaysay CIS The Magsaysay CIS in the municipality of Maramag, Bukidnon draws its water from the Magsaysay Spring which fills into a reservoir created by a dam. The dam was built in 1987 to collect the spring flow and rainfall and now served a total FUSA of 60 ha rice farms owned by 27 beneficiaries. When the dam was proposed, it was supposed to service 300-400 ha of area based on the water supply assessment but when it was built and operational, it only serviced 100 ha. The dam has two intake gates leading to the right and left main canals. One of the main reasons for the low FUSA is the damaged right main canal near the dam, where after irrigating just about 10 ha, water from the canal just spills to the creek and could not serve several hundred hectares downstream. The reservoir is now also heavily silted as indicated by the abundance of water lilies. The spring discharge has now decreased said the IA and during summer, there are areas which cannot be irrigated. Farmers do not have pumps to use for supplementary irrigation. During rainy season, the area does not flood and excess water only flows through the dam. There are two water tenders for the system. Canal cleaning is done once or twice a month, previously through bayanihan but now they pay for the service. Magsaysay IA manages Magsaysay CIS. The President and the governing board are elected by the General Assembly every 2 years. The President receives ₱100 per month while the BOD receives ₱50 a month. Before FISA, the IA collects ₱ 1,125 per ha per cropping from its members. They set aside a budget every year for NWRB payment, SEC registration, salaries of officials, loan repayment, and collector incentives. All remaining money from collection goes to O&M. After FISA, the IA continued collecting fees for the sustained management of
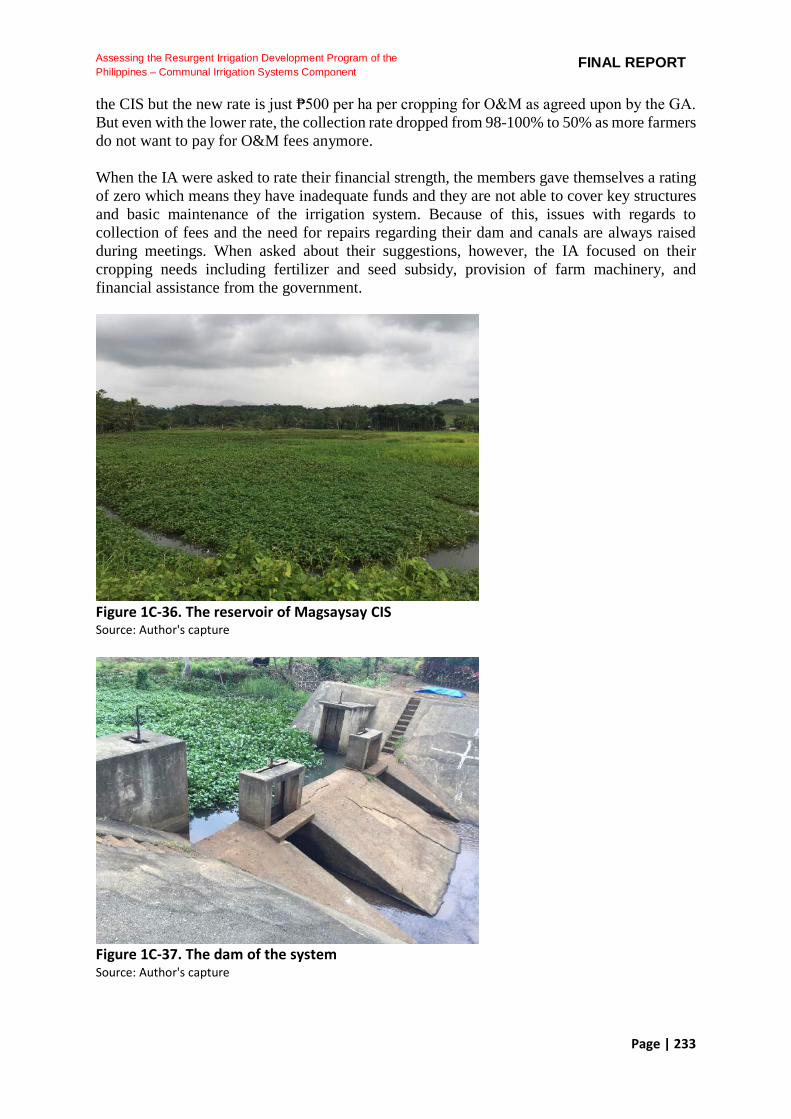
Page | 233
Assessing the Resurgent Irrigation Development Program of the
Philippines – Communal Irrigation Systems Component FINAL REPORT
the CIS but the new rate is just ₱500 per ha per cropping for O&M as agreed upon by the GA. But even with the lower rate, the collection rate dropped from 98-100% to 50% as more farmers do not want to pay for O&M fees anymore. When the IA were asked to rate their financial strength, the members gave themselves a rating of zero which means they have inadequate funds and they are not able to cover key structures and basic maintenance of the irrigation system. Because of this, issues with regards to collection of fees and the need for repairs regarding their dam and canals are always raised during meetings. When asked about their suggestions, however, the IA focused on their cropping needs including fertilizer and seed subsidy, provision of farm machinery, and financial assistance from the government.
Figure 1C-36. The reservoir of Magsaysay CIS Source: Author's capture
Figure 1C-37. The dam of the system Source: Author's capture
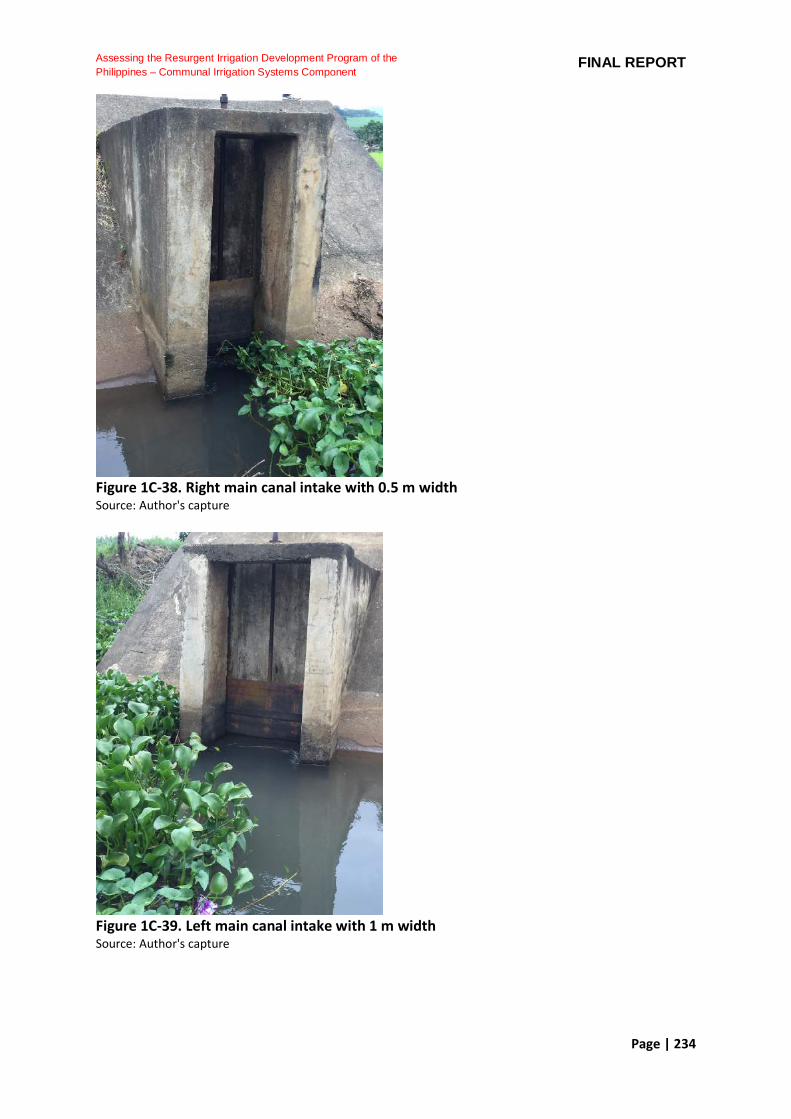
Page | 234
Assessing the Resurgent Irrigation Development Program of the
Philippines – Communal Irrigation Systems Component FINAL REPORT
Figure 1C-38. Right main canal intake with 0.5 m width Source: Author's capture
Figure 1C-39. Left main canal intake with 1 m width Source: Author's capture
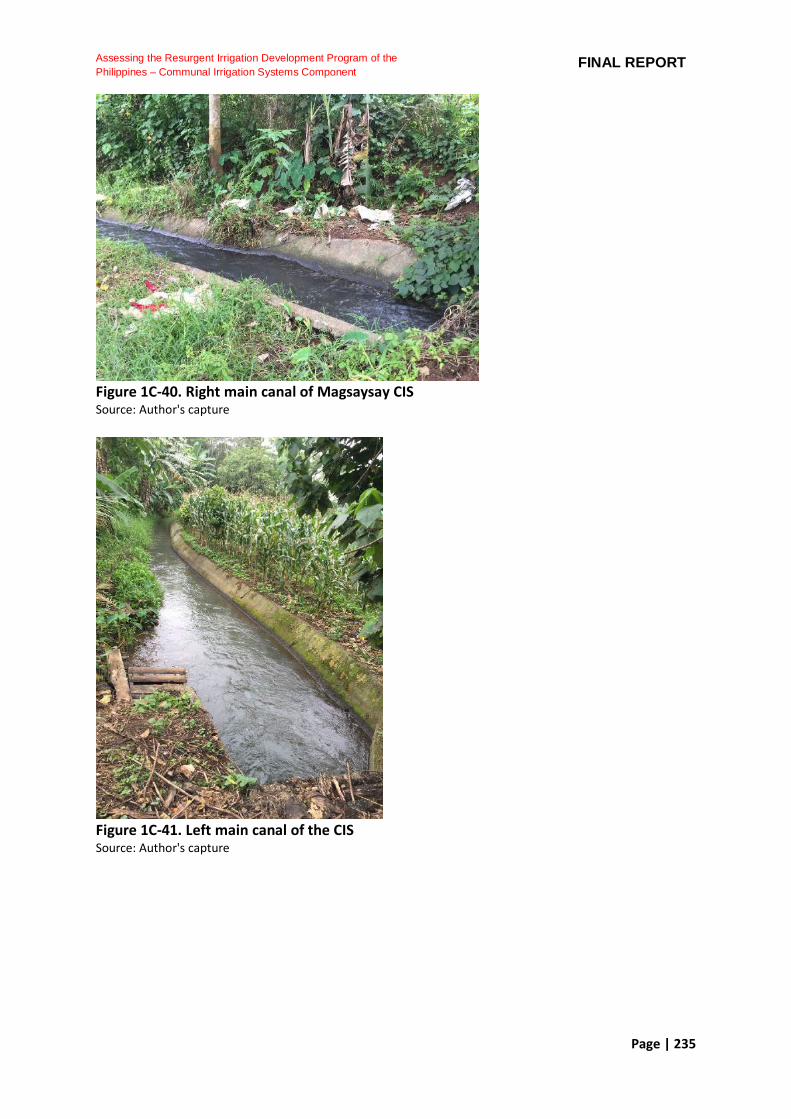
Page | 235
Assessing the Resurgent Irrigation Development Program of the
Philippines – Communal Irrigation Systems Component FINAL REPORT
Figure 1C-40. Right main canal of Magsaysay CIS Source: Author's capture
Figure 1C-41. Left main canal of the CIS Source: Author's capture

Page | 236
Assessing the Resurgent Irrigation Development Program of the
Philippines – Communal Irrigation Systems Component FINAL REPORT
Figure 1C-42. Lateral canal which waters only 10 ha of field Source: Author's capture
Figure 1C-43. Lateral canal which is broken and no controls Source: Author's capture
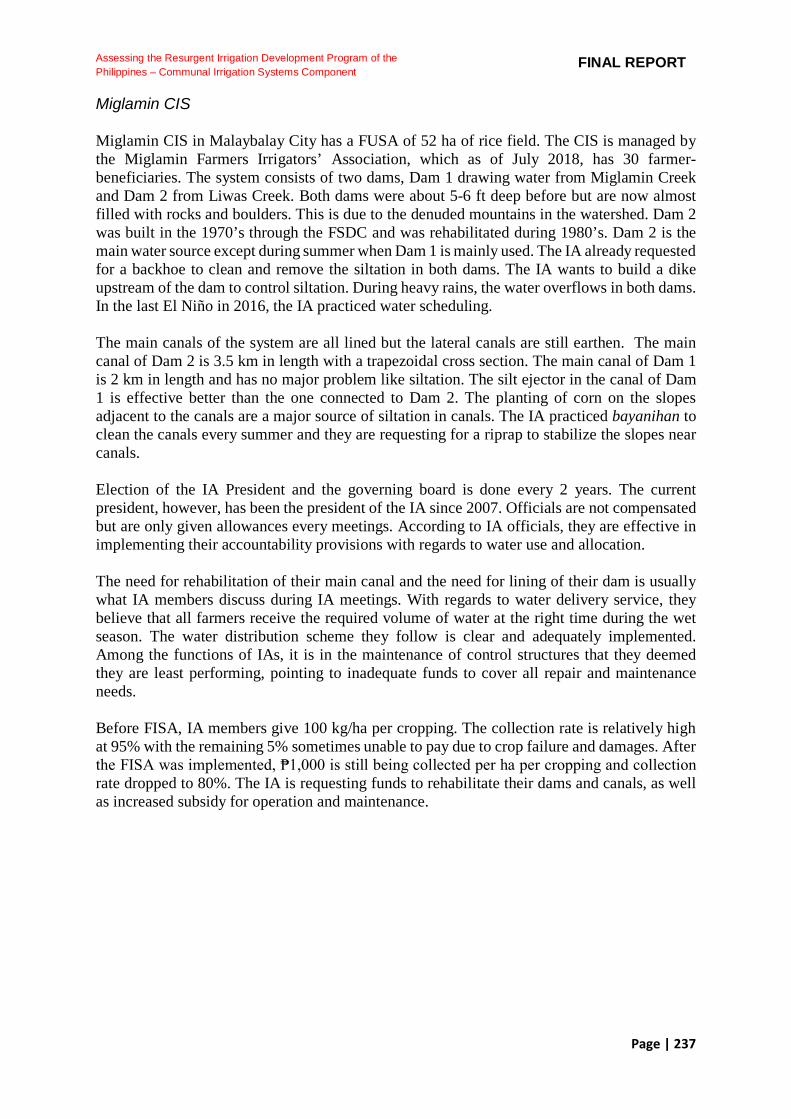
Page | 237
Assessing the Resurgent Irrigation Development Program of the
Philippines – Communal Irrigation Systems Component FINAL REPORT
Miglamin CIS Miglamin CIS in Malaybalay City has a FUSA of 52 ha of rice field. The CIS is managed by the Miglamin Farmers Irrigators’ Association, which as of July 2018, has 30 farmer-beneficiaries. The system consists of two dams, Dam 1 drawing water from Miglamin Creek and Dam 2 from Liwas Creek. Both dams were about 5-6 ft deep before but are now almost filled with rocks and boulders. This is due to the denuded mountains in the watershed. Dam 2 was built in the 1970’s through the FSDC and was rehabilitated during 1980’s. Dam 2 is the main water source except during summer when Dam 1 is mainly used. The IA already requested for a backhoe to clean and remove the siltation in both dams. The IA wants to build a dike upstream of the dam to control siltation. During heavy rains, the water overflows in both dams. In the last El Niño in 2016, the IA practiced water scheduling. The main canals of the system are all lined but the lateral canals are still earthen. The main canal of Dam 2 is 3.5 km in length with a trapezoidal cross section. The main canal of Dam 1 is 2 km in length and has no major problem like siltation. The silt ejector in the canal of Dam 1 is effective better than the one connected to Dam 2. The planting of corn on the slopes adjacent to the canals are a major source of siltation in canals. The IA practiced bayanihan to clean the canals every summer and they are requesting for a riprap to stabilize the slopes near canals. Election of the IA President and the governing board is done every 2 years. The current president, however, has been the president of the IA since 2007. Officials are not compensated but are only given allowances every meetings. According to IA officials, they are effective in implementing their accountability provisions with regards to water use and allocation. The need for rehabilitation of their main canal and the need for lining of their dam is usually what IA members discuss during IA meetings. With regards to water delivery service, they believe that all farmers receive the required volume of water at the right time during the wet season. The water distribution scheme they follow is clear and adequately implemented. Among the functions of IAs, it is in the maintenance of control structures that they deemed they are least performing, pointing to inadequate funds to cover all repair and maintenance needs. Before FISA, IA members give 100 kg/ha per cropping. The collection rate is relatively high at 95% with the remaining 5% sometimes unable to pay due to crop failure and damages. After the FISA was implemented, ₱1,000 is still being collected per ha per cropping and collection rate dropped to 80%. The IA is requesting funds to rehabilitate their dams and canals, as well as increased subsidy for operation and maintenance.

Page | 238
Assessing the Resurgent Irrigation Development Program of the
Philippines – Communal Irrigation Systems Component FINAL REPORT
Figure 1C-44. Dam 1 of Miglamin CIS Source: Author's capture
Figure 1C-45. Dam 2 of the system wherein the sand also enters the intake gate Source: Author's capture
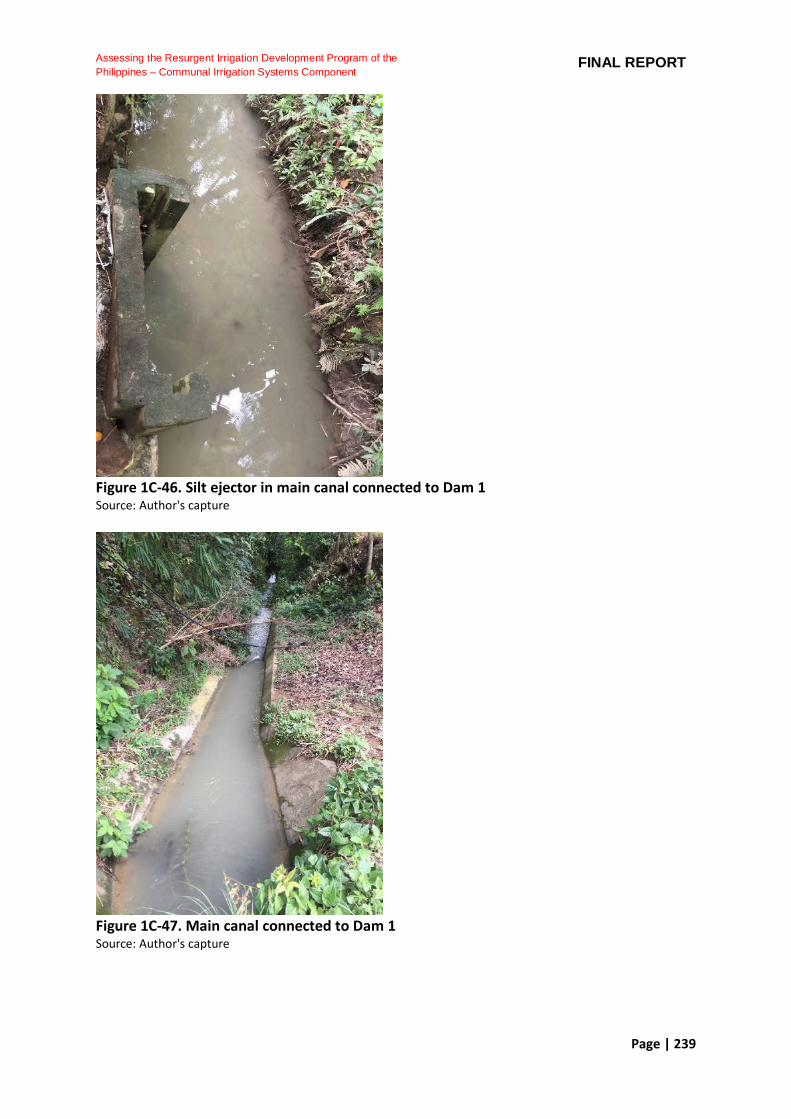
Page | 239
Assessing the Resurgent Irrigation Development Program of the
Philippines – Communal Irrigation Systems Component FINAL REPORT
Figure 1C-46. Silt ejector in main canal connected to Dam 1 Source: Author's capture
Figure 1C-47. Main canal connected to Dam 1 Source: Author's capture
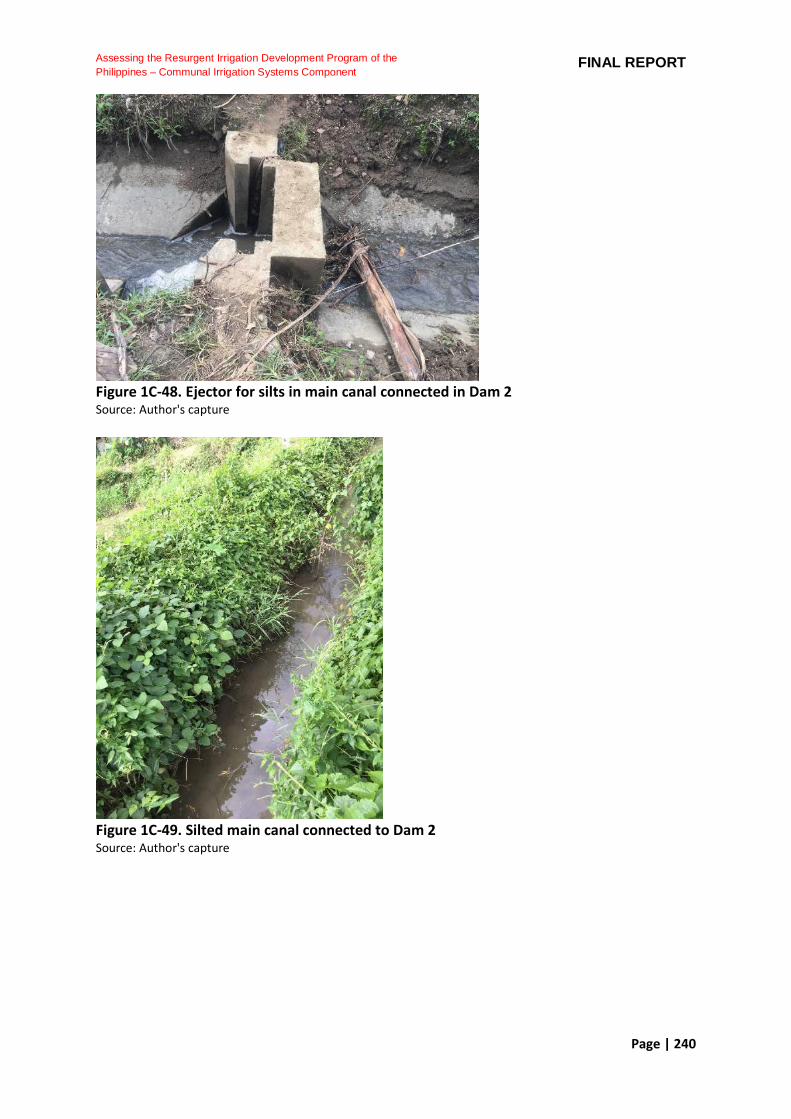
Page | 240
Assessing the Resurgent Irrigation Development Program of the
Philippines – Communal Irrigation Systems Component FINAL REPORT
Figure 1C-48. Ejector for silts in main canal connected in Dam 2 Source: Author's capture
Figure 1C-49. Silted main canal connected to Dam 2 Source: Author's capture
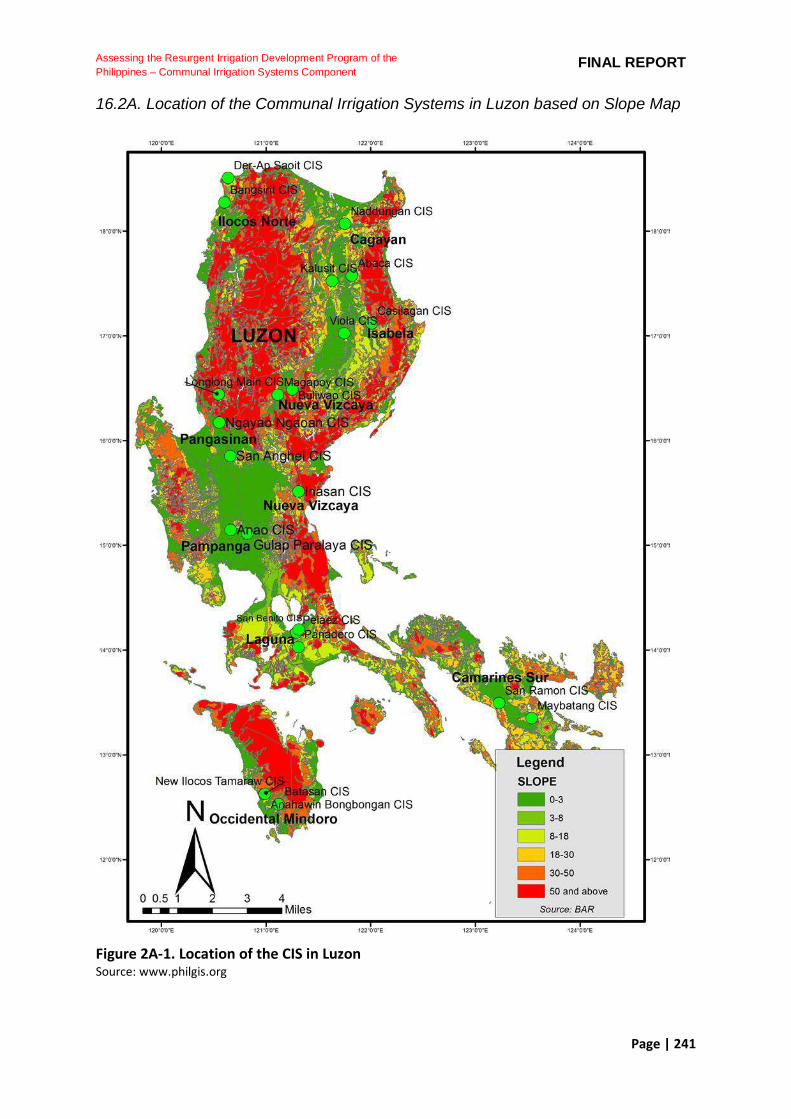
Page | 241
Assessing the Resurgent Irrigation Development Program of the
Philippines – Communal Irrigation Systems Component FINAL REPORT
16.2A. Location of the Communal Irrigation Systems in Luzon based on Slope Map
Figure 2A-1. Location of the CIS in Luzon Source: www.philgis.org
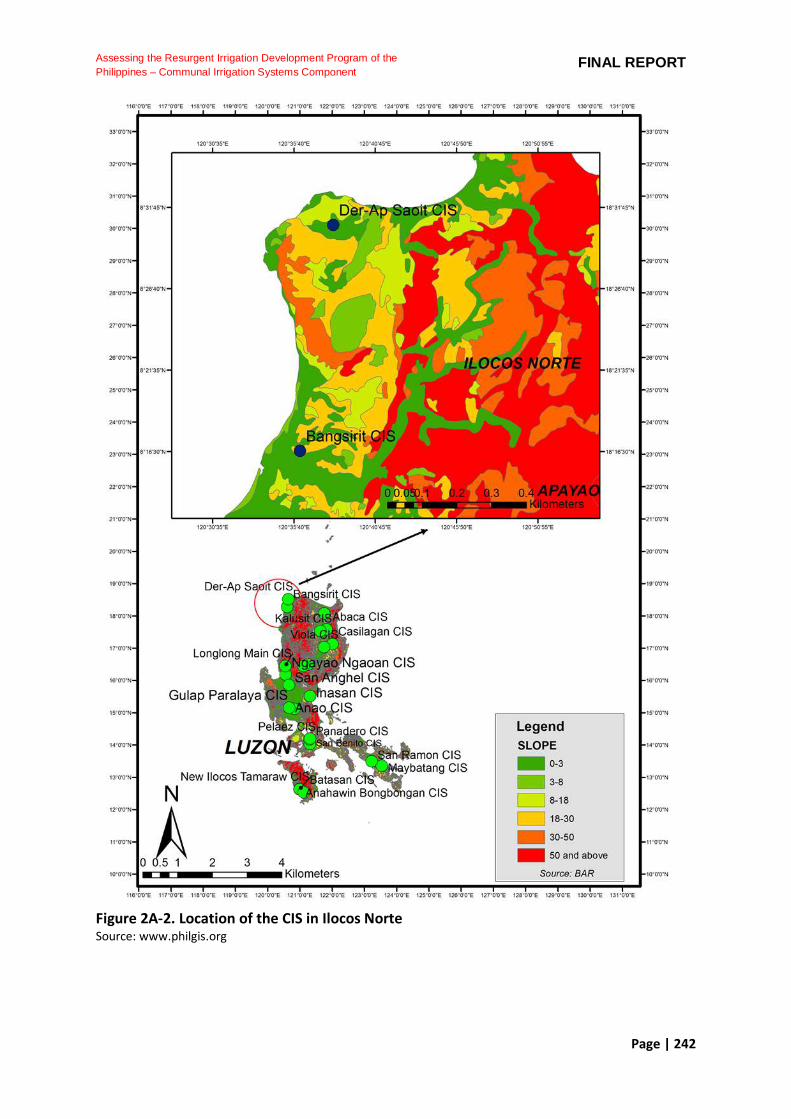
Page | 242
Assessing the Resurgent Irrigation Development Program of the
Philippines – Communal Irrigation Systems Component FINAL REPORT
Figure 2A-2. Location of the CIS in Ilocos Norte Source: www.philgis.org
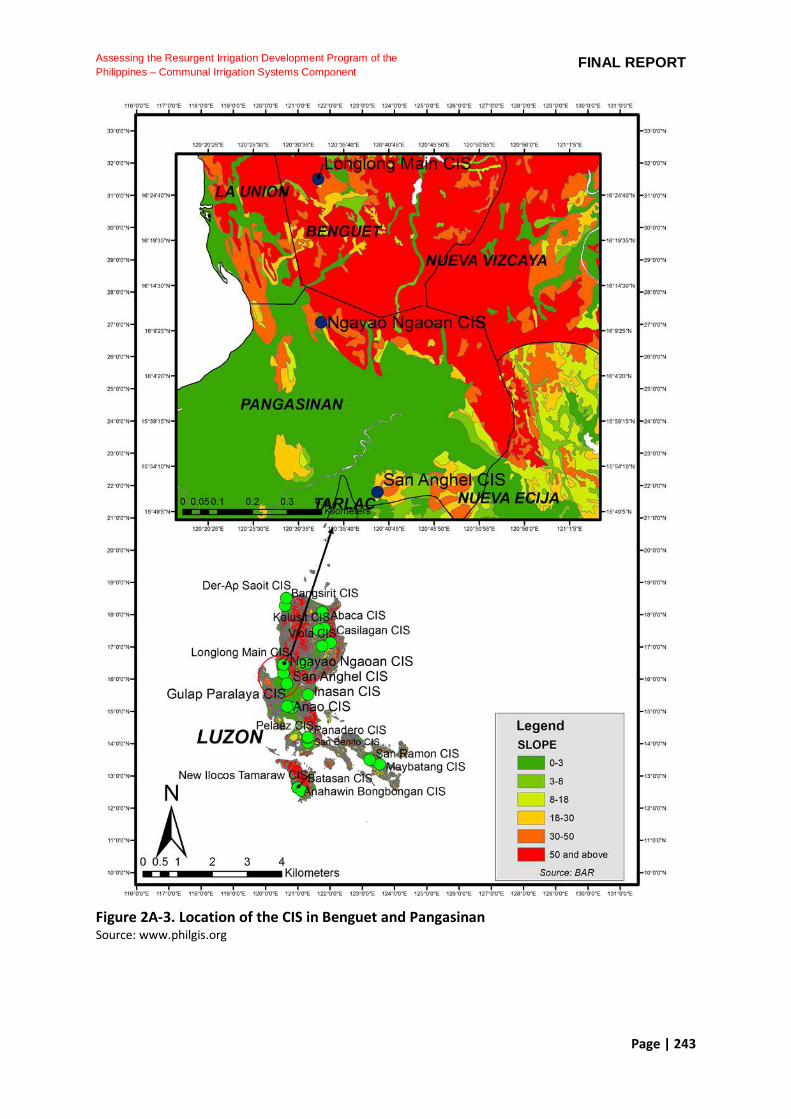
Page | 243
Assessing the Resurgent Irrigation Development Program of the
Philippines – Communal Irrigation Systems Component FINAL REPORT
Figure 2A-3. Location of the CIS in Benguet and Pangasinan Source: www.philgis.org
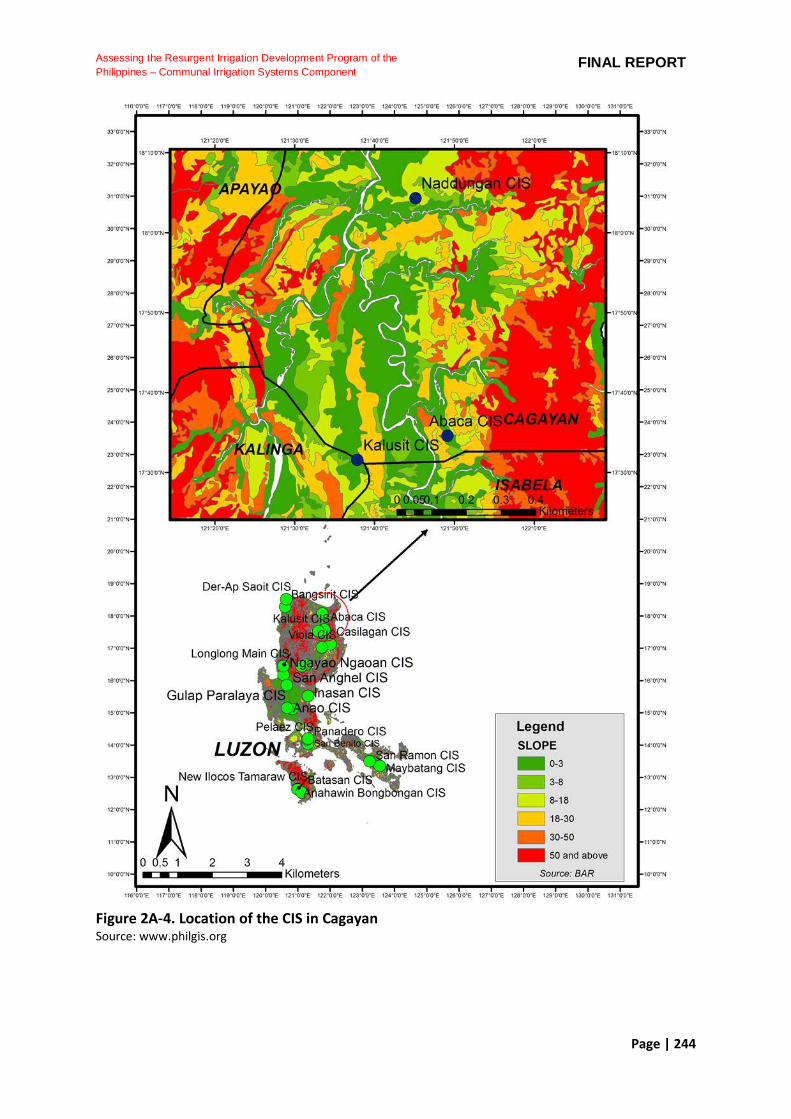
Page | 244
Assessing the Resurgent Irrigation Development Program of the
Philippines – Communal Irrigation Systems Component FINAL REPORT
Figure 2A-4. Location of the CIS in Cagayan Source: www.philgis.org

Page | 245
Assessing the Resurgent Irrigation Development Program of the
Philippines – Communal Irrigation Systems Component FINAL REPORT
Figure 2A-5. Location of the CIS in Isabela Source: www.philgis.org
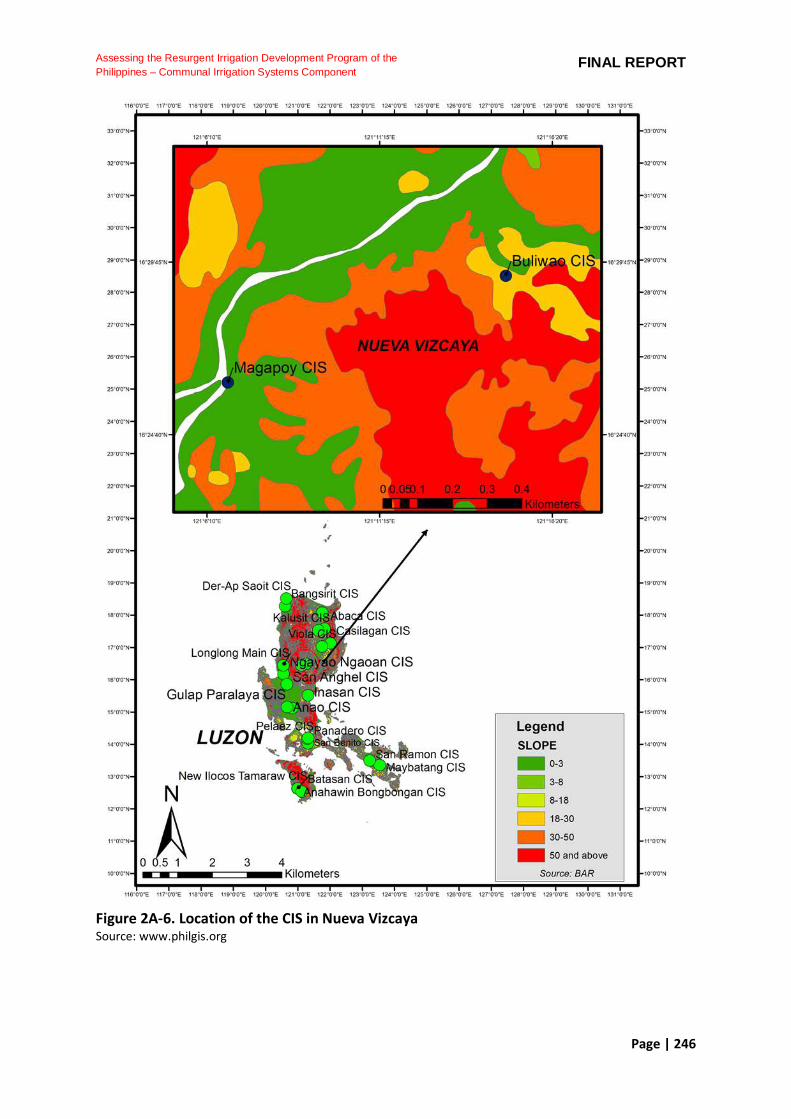
Page | 246
Assessing the Resurgent Irrigation Development Program of the
Philippines – Communal Irrigation Systems Component FINAL REPORT
Figure 2A-6. Location of the CIS in Nueva Vizcaya Source: www.philgis.org

Page | 247
Assessing the Resurgent Irrigation Development Program of the
Philippines – Communal Irrigation Systems Component FINAL REPORT
Figure 2A-7. Location of the CIS in South Nueva Ecija Source: www.philgis.org
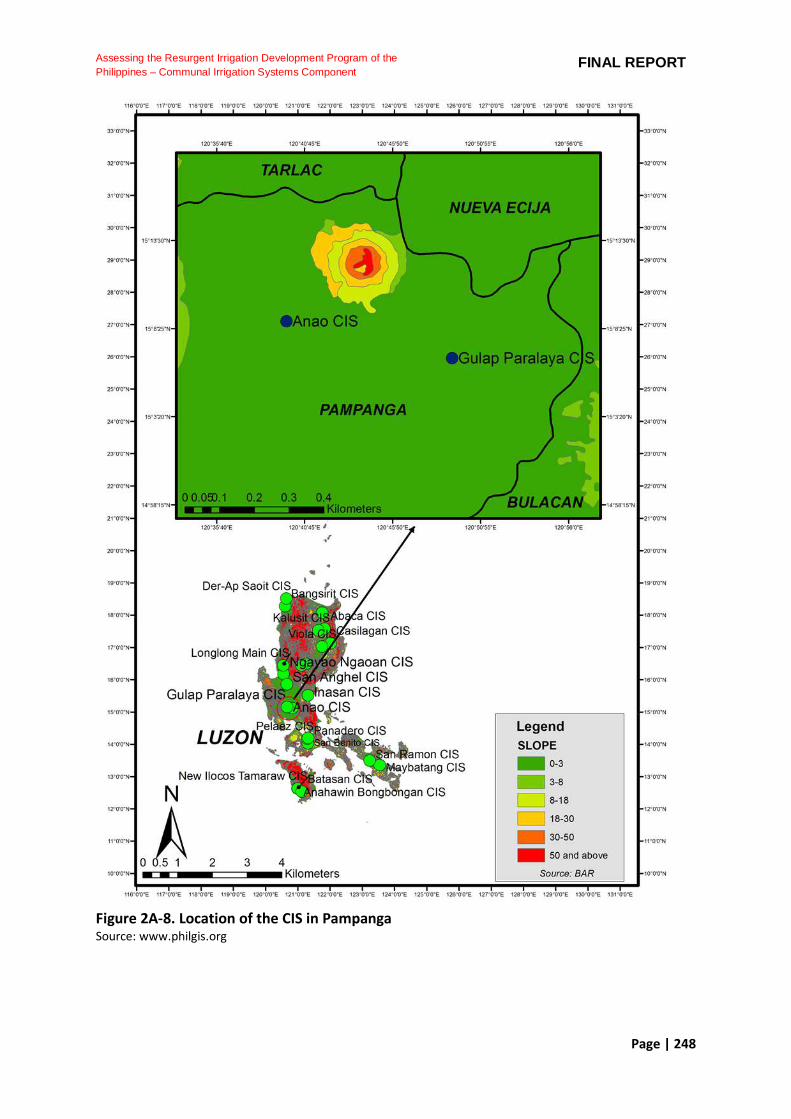
Page | 248
Assessing the Resurgent Irrigation Development Program of the
Philippines – Communal Irrigation Systems Component FINAL REPORT
Figure 2A-8. Location of the CIS in Pampanga Source: www.philgis.org

Page | 249
Assessing the Resurgent Irrigation Development Program of the
Philippines – Communal Irrigation Systems Component FINAL REPORT
Figure 2A-9. Location of the CIS in Laguna Source: www.philgis.org
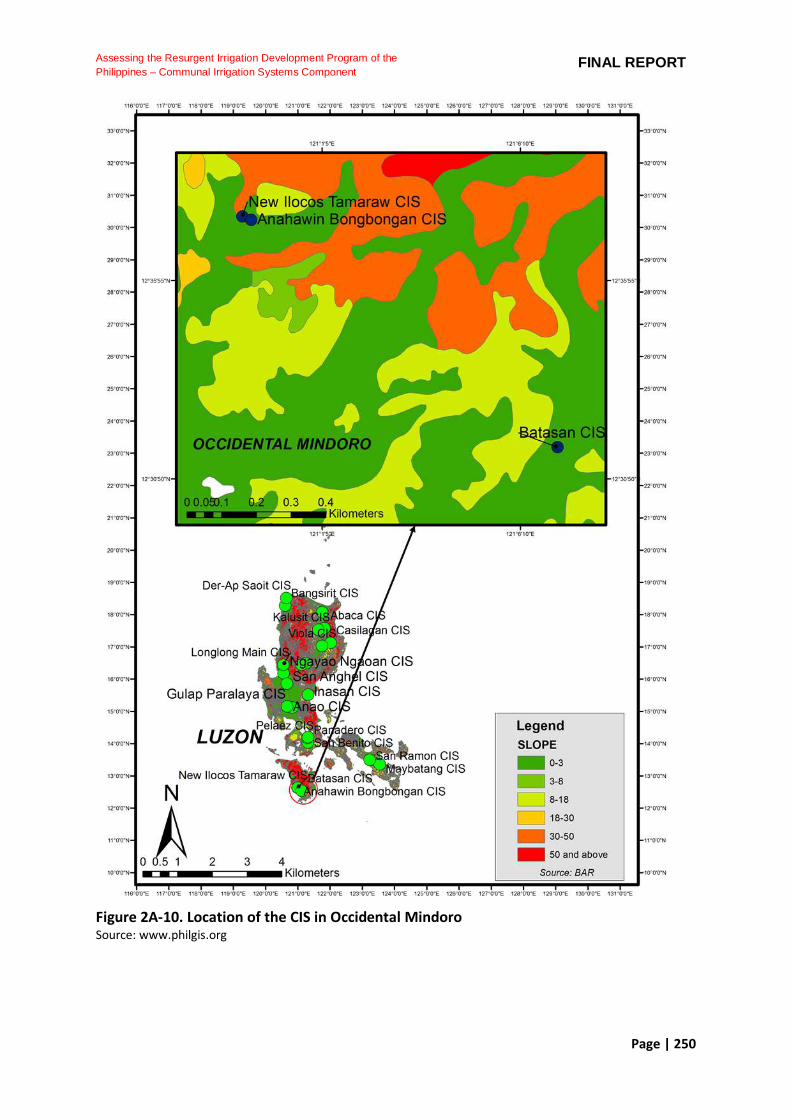
Page | 250
Assessing the Resurgent Irrigation Development Program of the
Philippines – Communal Irrigation Systems Component FINAL REPORT
Figure 2A-10. Location of the CIS in Occidental Mindoro Source: www.philgis.org
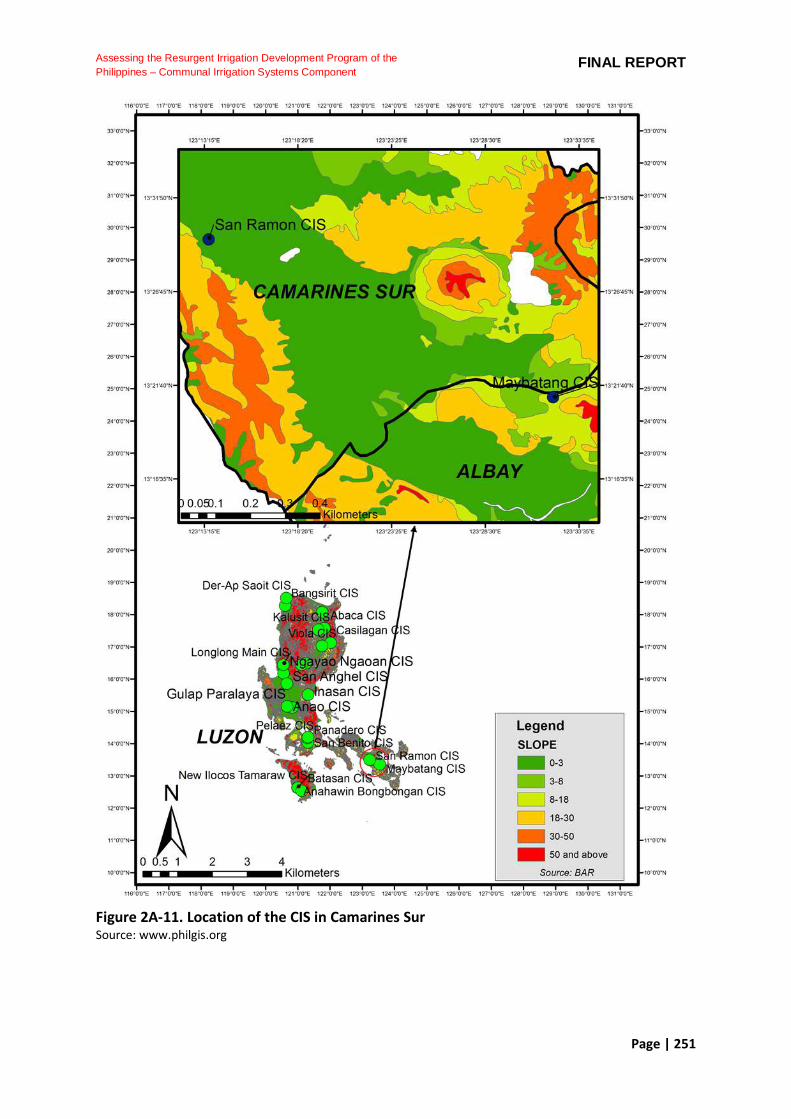
Page | 251
Assessing the Resurgent Irrigation Development Program of the
Philippines – Communal Irrigation Systems Component FINAL REPORT
Figure 2A-11. Location of the CIS in Camarines Sur Source: www.philgis.org

Page | 252
Assessing the Resurgent Irrigation Development Program of the
Philippines – Communal Irrigation Systems Component FINAL REPORT
16.2B. Location of the Communal Irrigation Systems in Visayas and Mindanao based on Slope Map
Figure 2B-1. Location of the CIS in Visayas Source: www.philgis.org
Figure 2B-2. Location of the CIS in Bohol Source: www.philgis.org
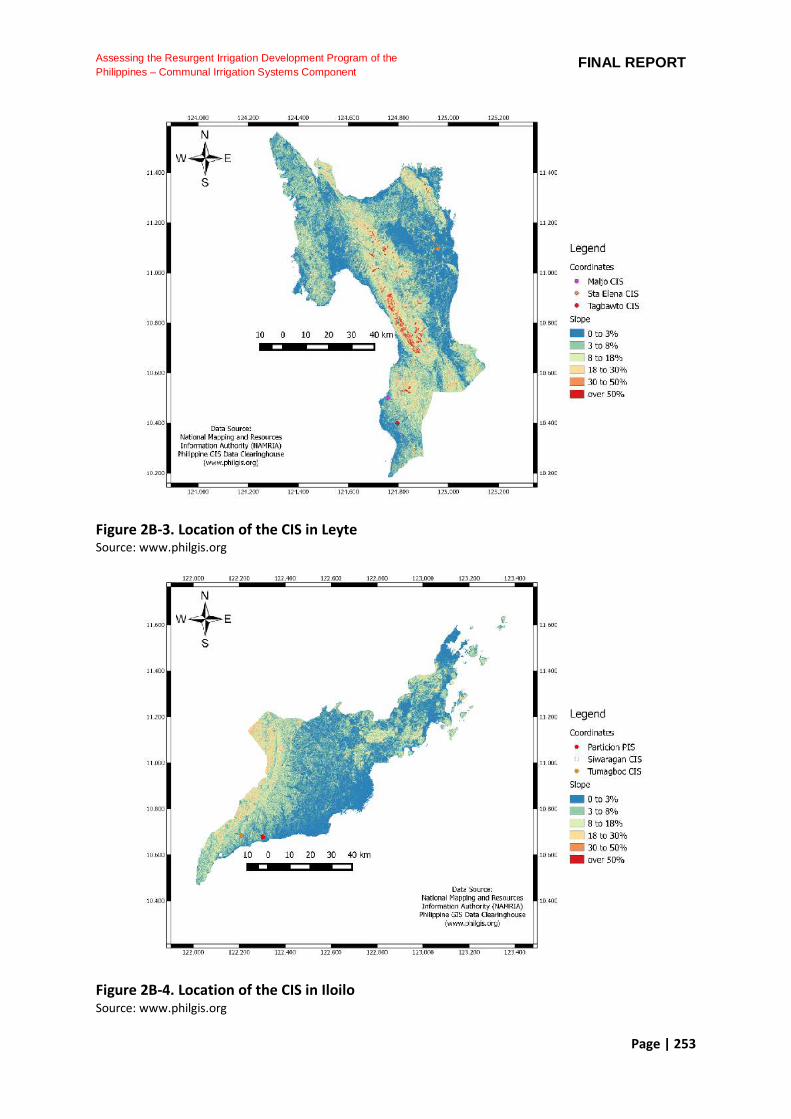
Page | 253
Assessing the Resurgent Irrigation Development Program of the
Philippines – Communal Irrigation Systems Component FINAL REPORT
Figure 2B-3. Location of the CIS in Leyte Source: www.philgis.org
Figure 2B-4. Location of the CIS in Iloilo Source: www.philgis.org
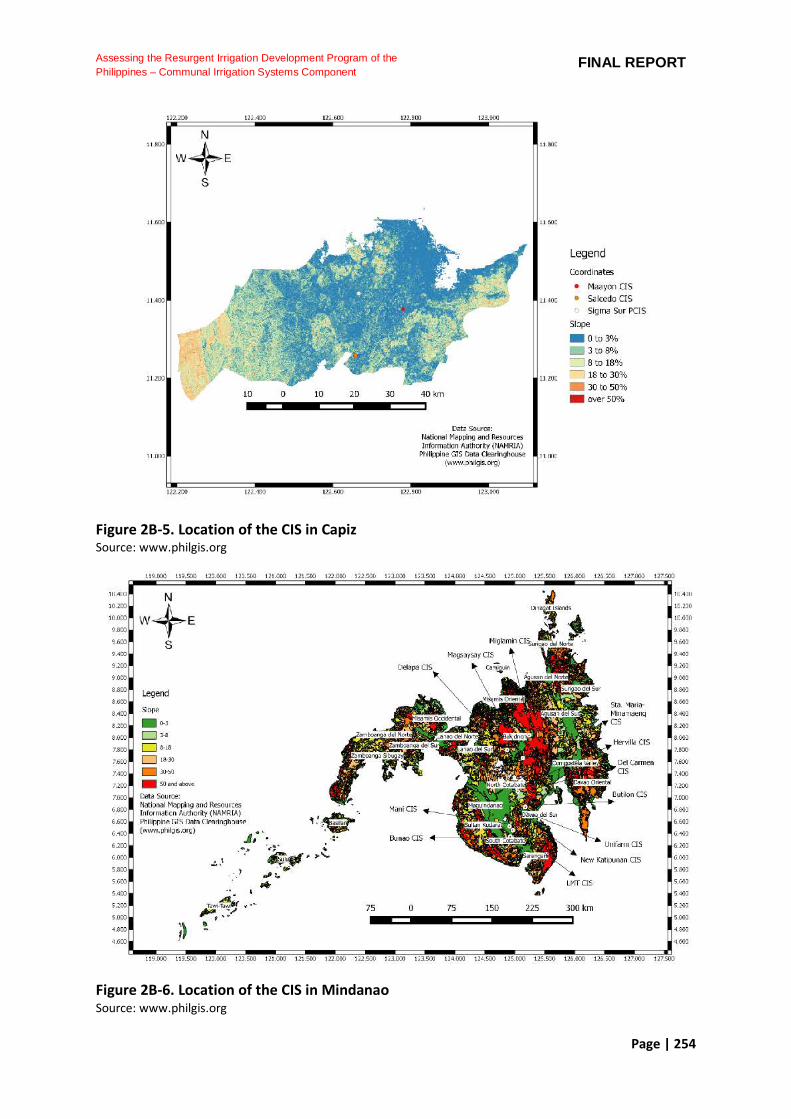
Page | 254
Assessing the Resurgent Irrigation Development Program of the
Philippines – Communal Irrigation Systems Component FINAL REPORT
Figure 2B-5. Location of the CIS in Capiz Source: www.philgis.org
Figure 2B-6. Location of the CIS in Mindanao Source: www.philgis.org
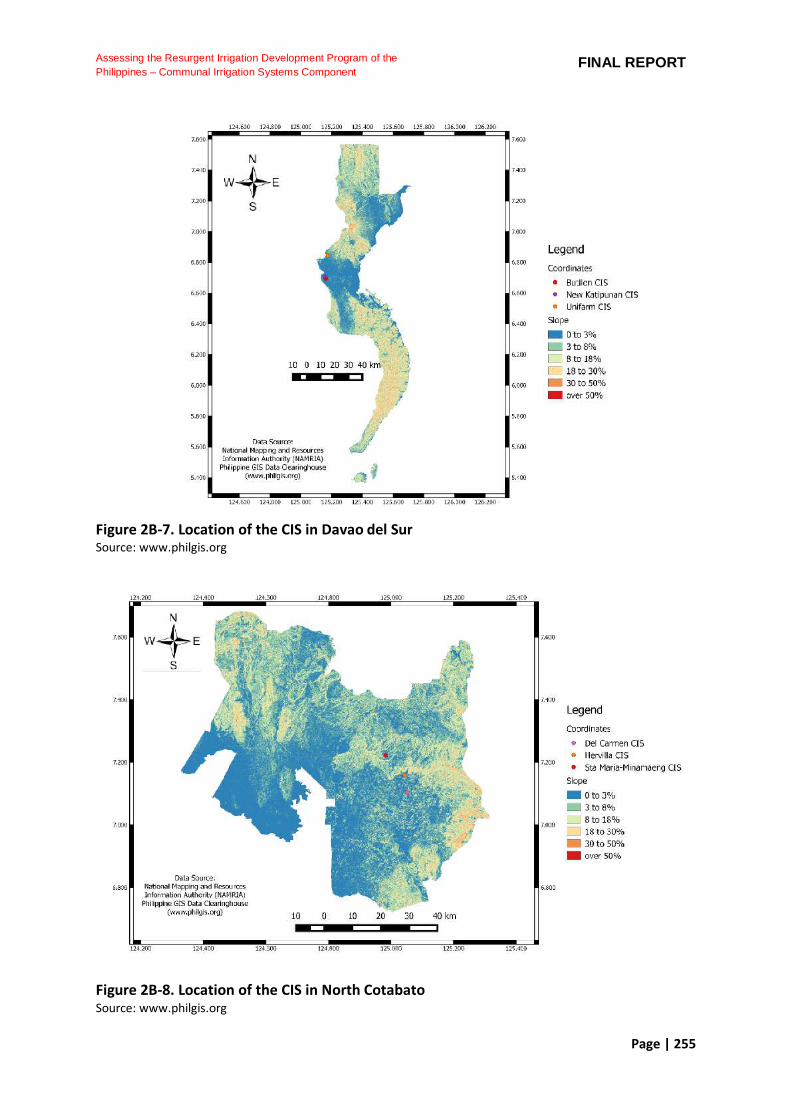
Page | 255
Assessing the Resurgent Irrigation Development Program of the
Philippines – Communal Irrigation Systems Component FINAL REPORT
Figure 2B-7. Location of the CIS in Davao del Sur Source: www.philgis.org
Figure 2B-8. Location of the CIS in North Cotabato Source: www.philgis.org
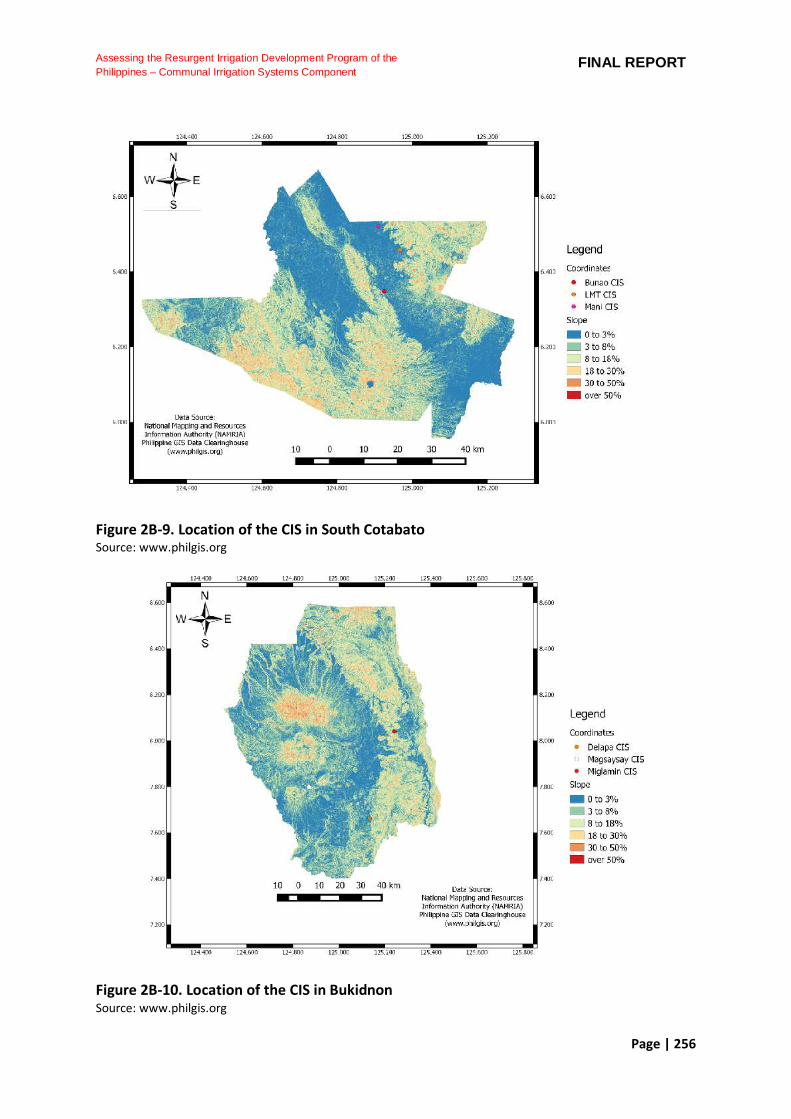
Page | 256
Assessing the Resurgent Irrigation Development Program of the
Philippines – Communal Irrigation Systems Component FINAL REPORT
Figure 2B-9. Location of the CIS in South Cotabato Source: www.philgis.org
Figure 2B-10. Location of the CIS in Bukidnon Source: www.philgis.org
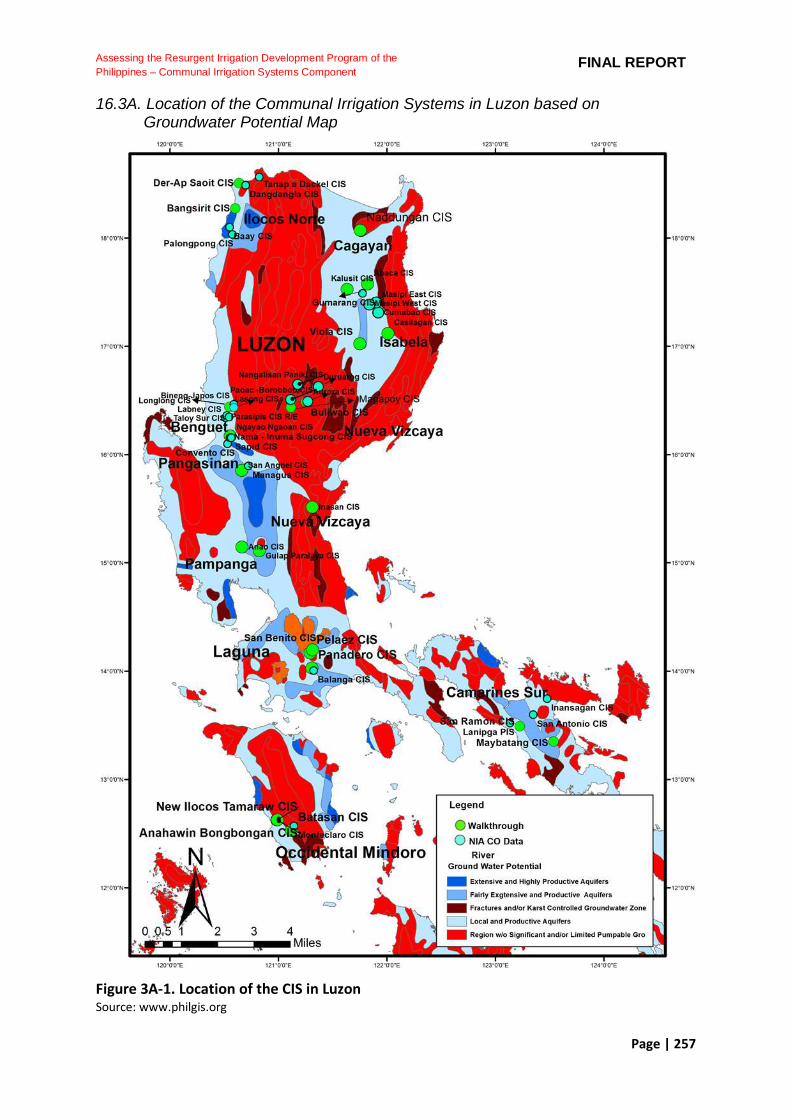
Page | 257
Assessing the Resurgent Irrigation Development Program of the
Philippines – Communal Irrigation Systems Component FINAL REPORT
16.3A. Location of the Communal Irrigation Systems in Luzon based on Groundwater Potential Map
Figure 3A-1. Location of the CIS in Luzon Source: www.philgis.org

Page | 258
Assessing the Resurgent Irrigation Development Program of the
Philippines – Communal Irrigation Systems Component FINAL REPORT
Figure 3A-2. Location of the CIS in Ilocos Norte Source: www.philgis.org
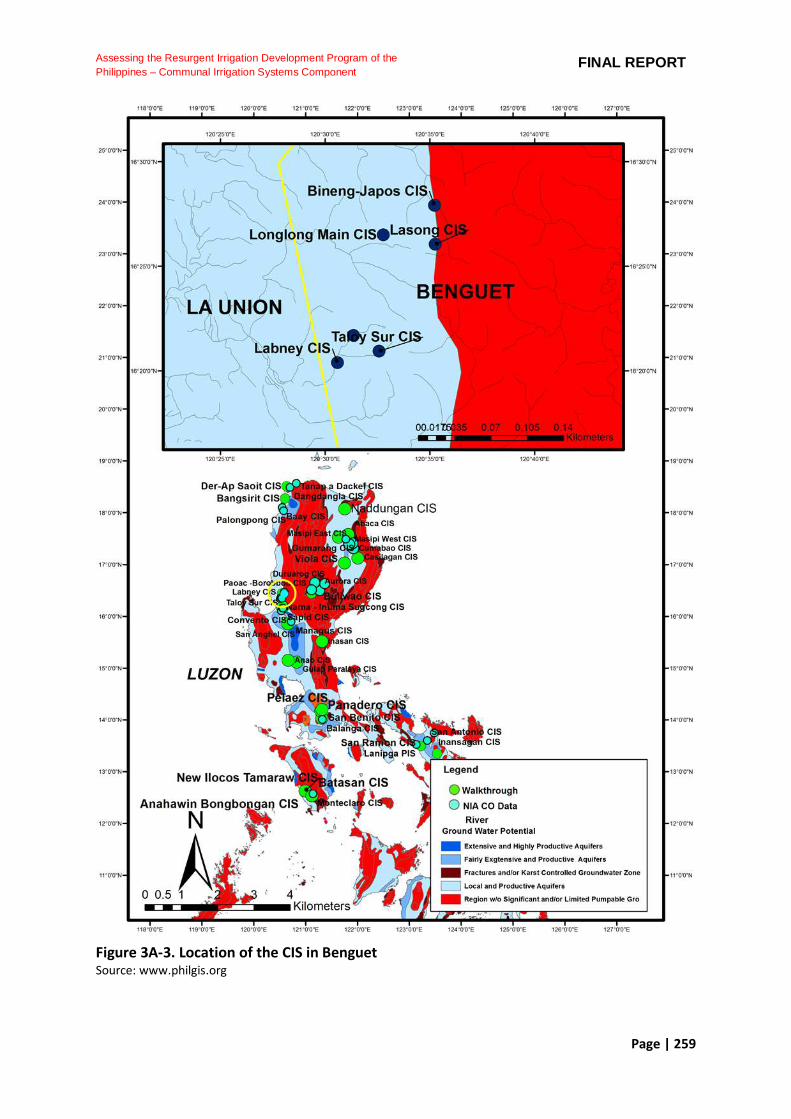
Page | 259
Assessing the Resurgent Irrigation Development Program of the
Philippines – Communal Irrigation Systems Component FINAL REPORT
Figure 3A-3. Location of the CIS in Benguet Source: www.philgis.org
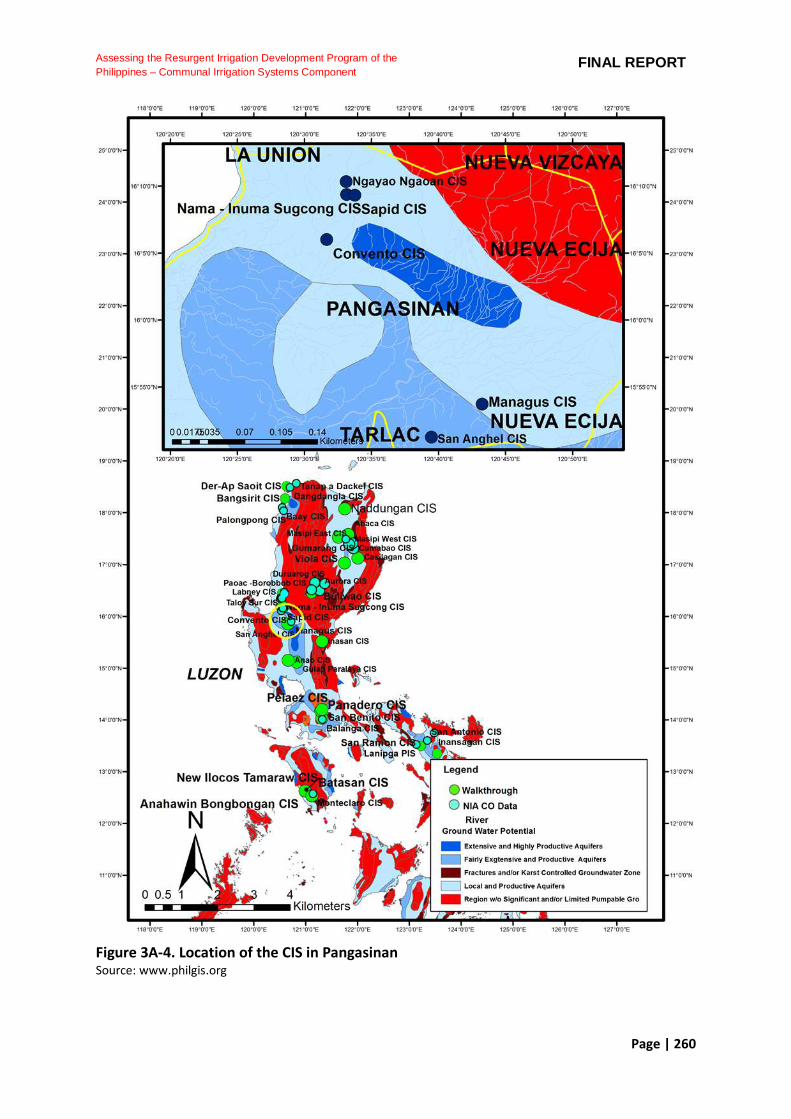
Page | 260
Assessing the Resurgent Irrigation Development Program of the
Philippines – Communal Irrigation Systems Component FINAL REPORT
Figure 3A-4. Location of the CIS in Pangasinan Source: www.philgis.org
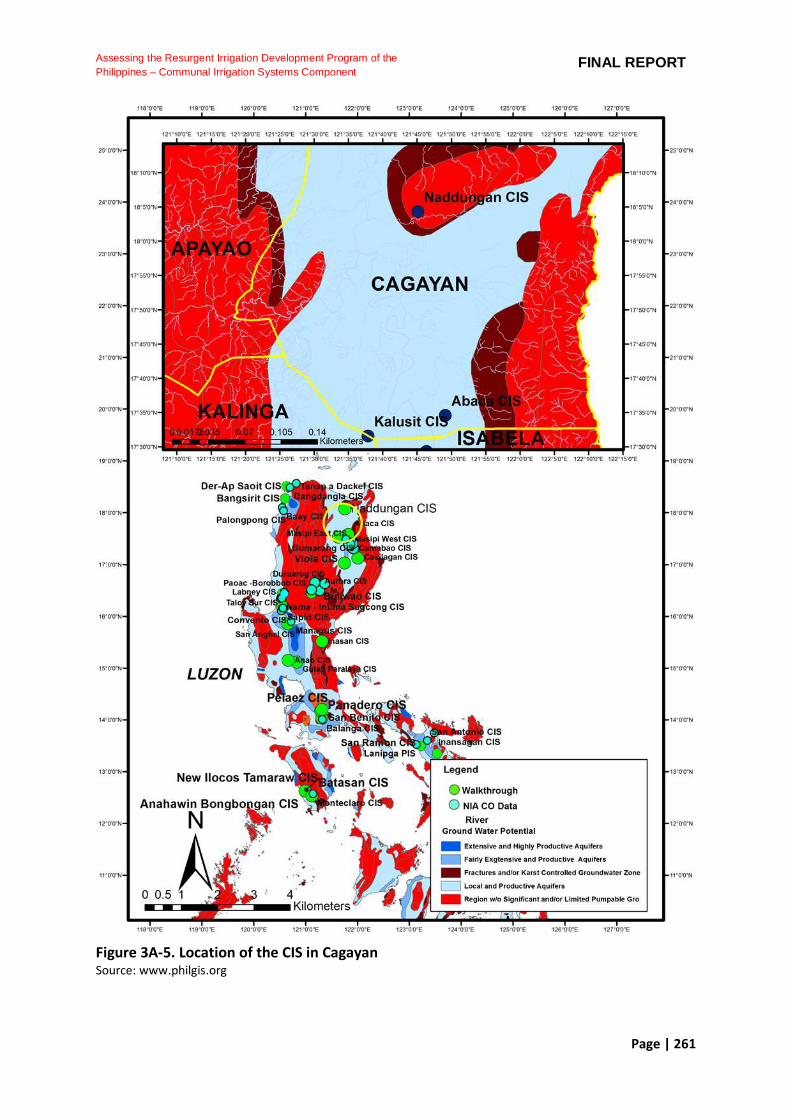
Page | 261
Assessing the Resurgent Irrigation Development Program of the
Philippines – Communal Irrigation Systems Component FINAL REPORT
Figure 3A-5. Location of the CIS in Cagayan Source: www.philgis.org
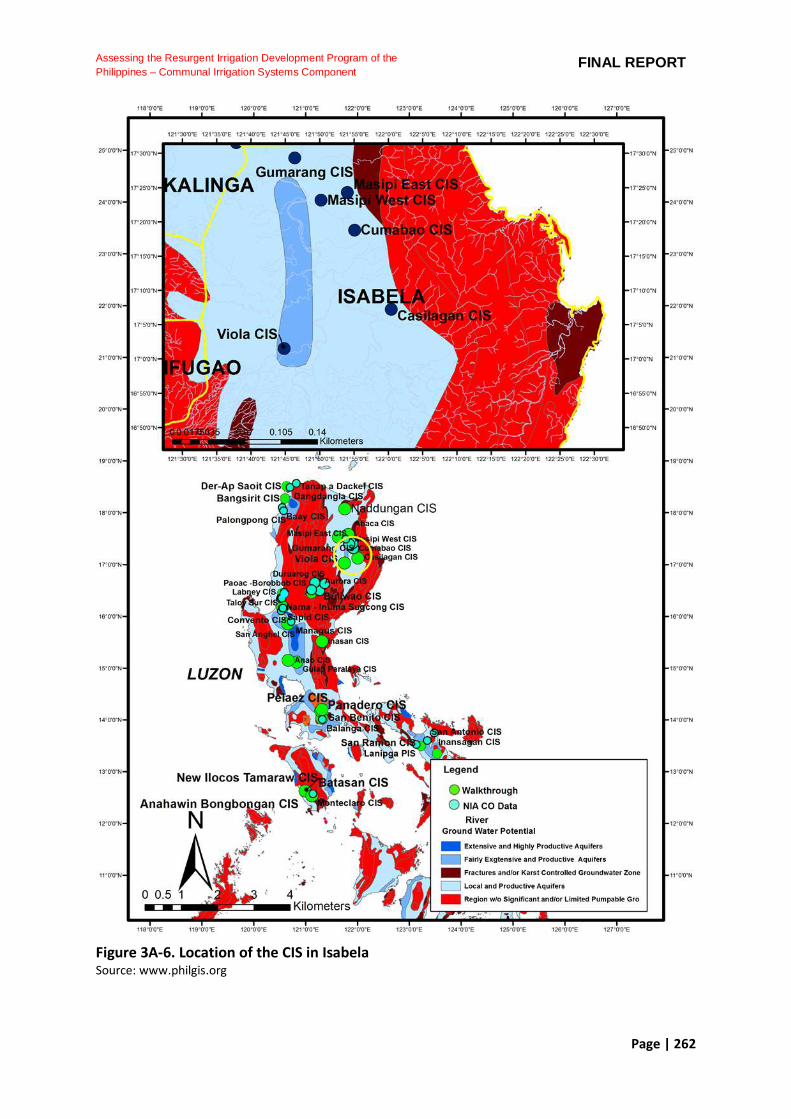
Page | 262
Assessing the Resurgent Irrigation Development Program of the
Philippines – Communal Irrigation Systems Component FINAL REPORT
Figure 3A-6. Location of the CIS in Isabela Source: www.philgis.org
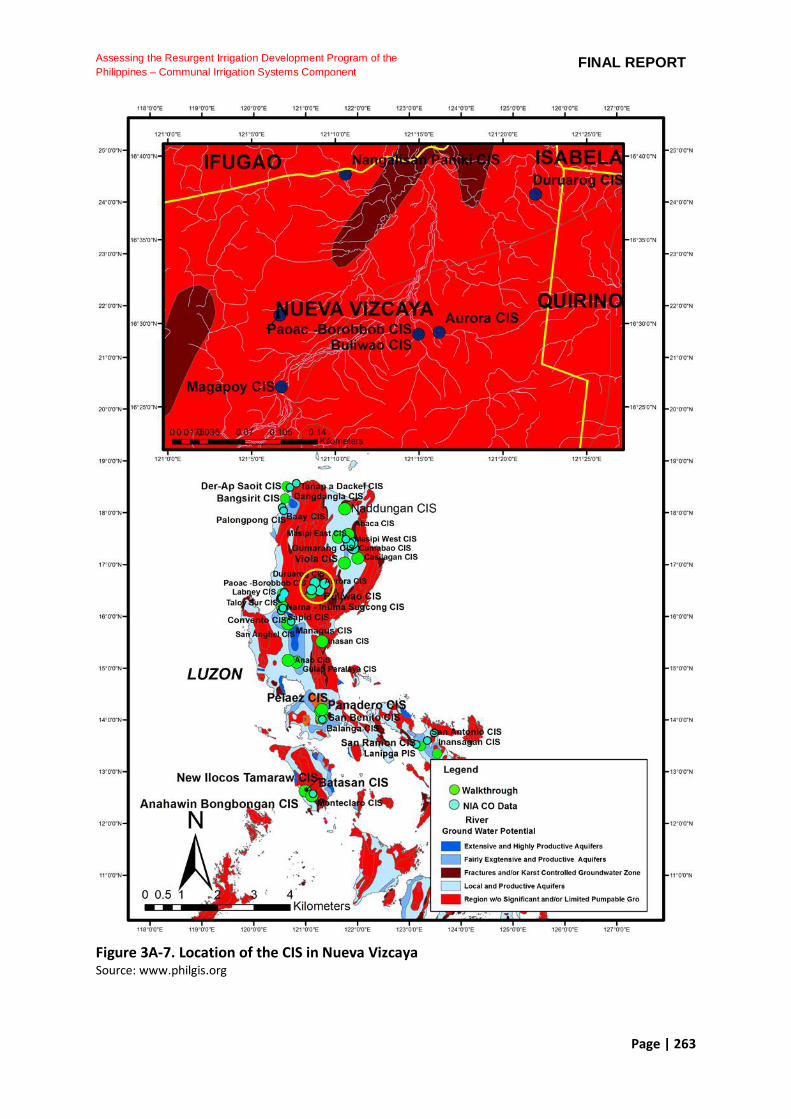
Page | 263
Assessing the Resurgent Irrigation Development Program of the
Philippines – Communal Irrigation Systems Component FINAL REPORT
Figure 3A-7. Location of the CIS in Nueva Vizcaya Source: www.philgis.org
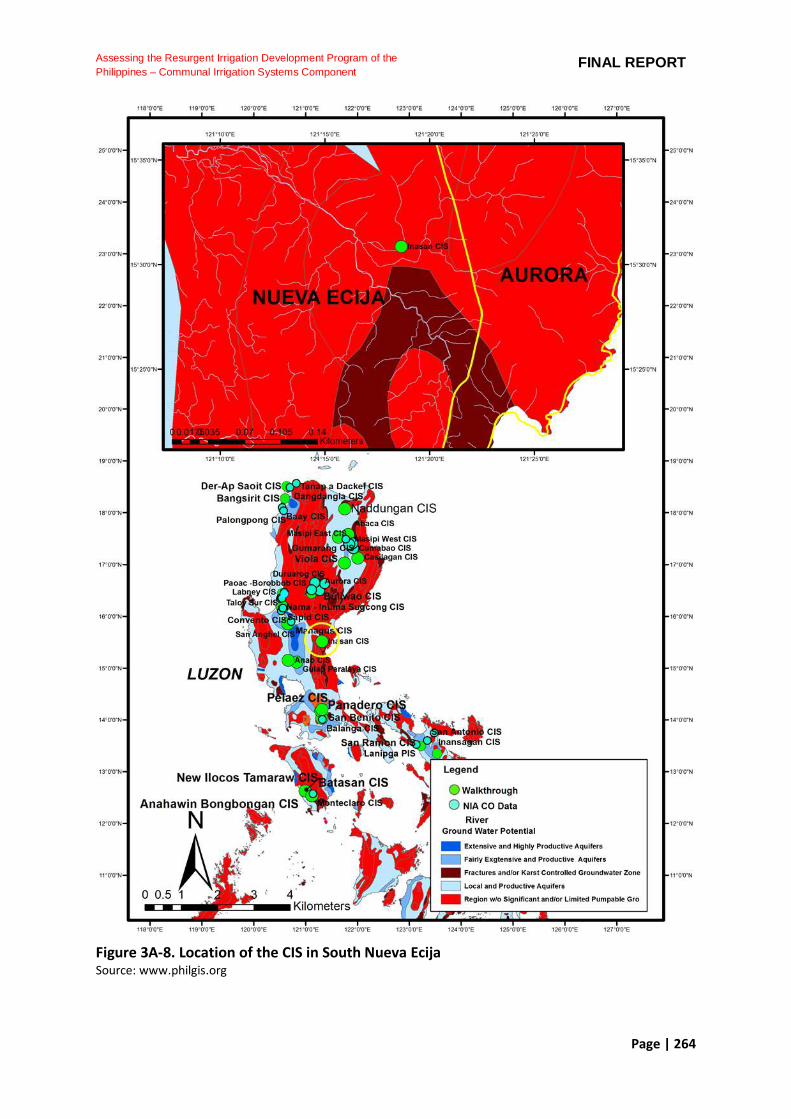
Page | 264
Assessing the Resurgent Irrigation Development Program of the
Philippines – Communal Irrigation Systems Component FINAL REPORT
Figure 3A-8. Location of the CIS in South Nueva Ecija Source: www.philgis.org
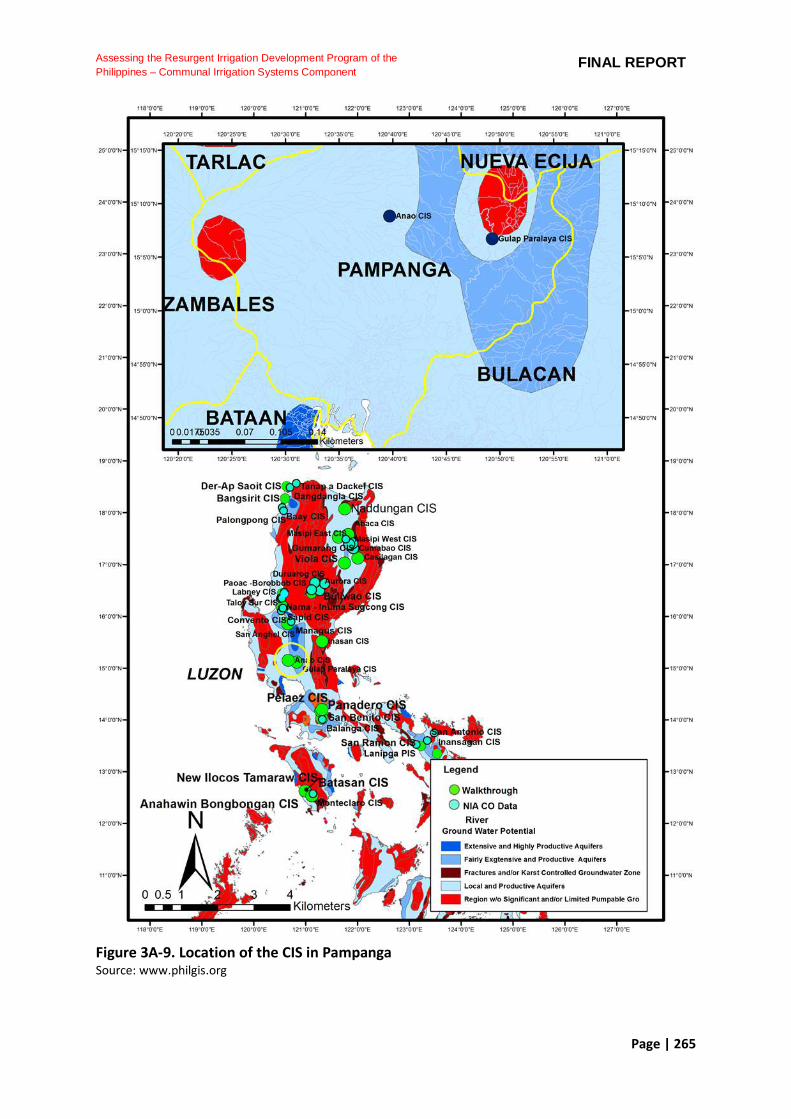
Page | 265
Assessing the Resurgent Irrigation Development Program of the
Philippines – Communal Irrigation Systems Component FINAL REPORT
Figure 3A-9. Location of the CIS in Pampanga Source: www.philgis.org
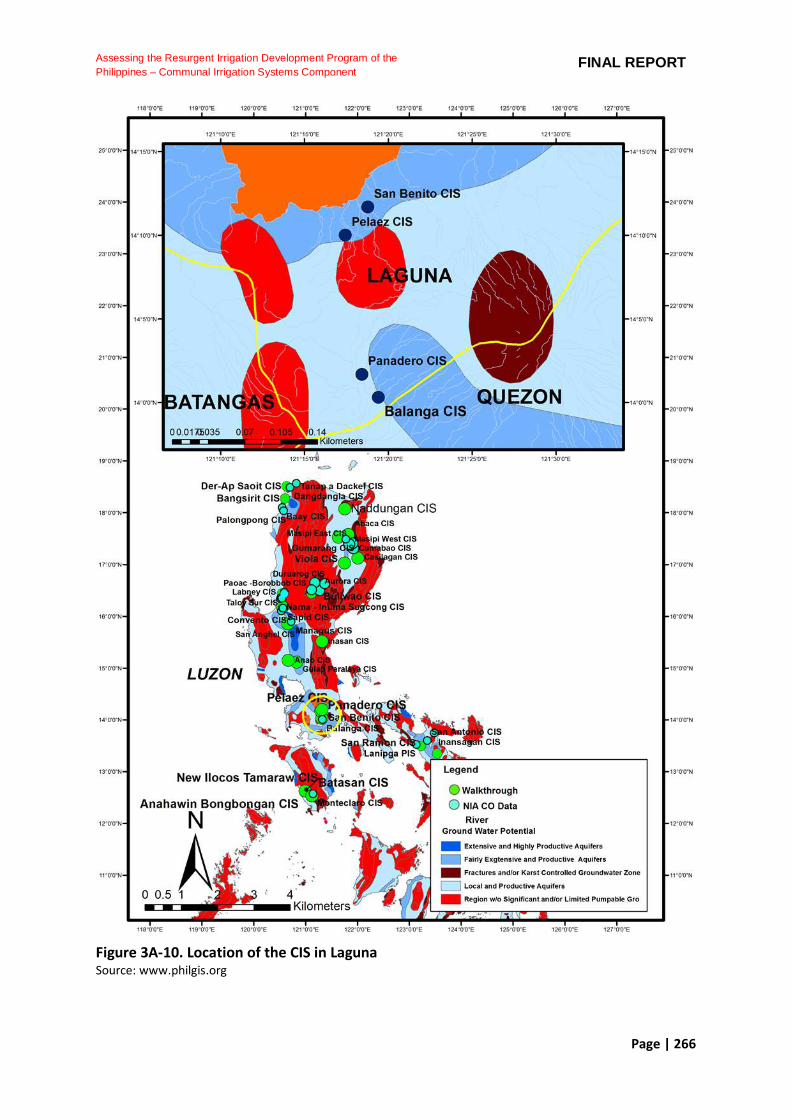
Page | 266
Assessing the Resurgent Irrigation Development Program of the
Philippines – Communal Irrigation Systems Component FINAL REPORT
Figure 3A-10. Location of the CIS in Laguna Source: www.philgis.org
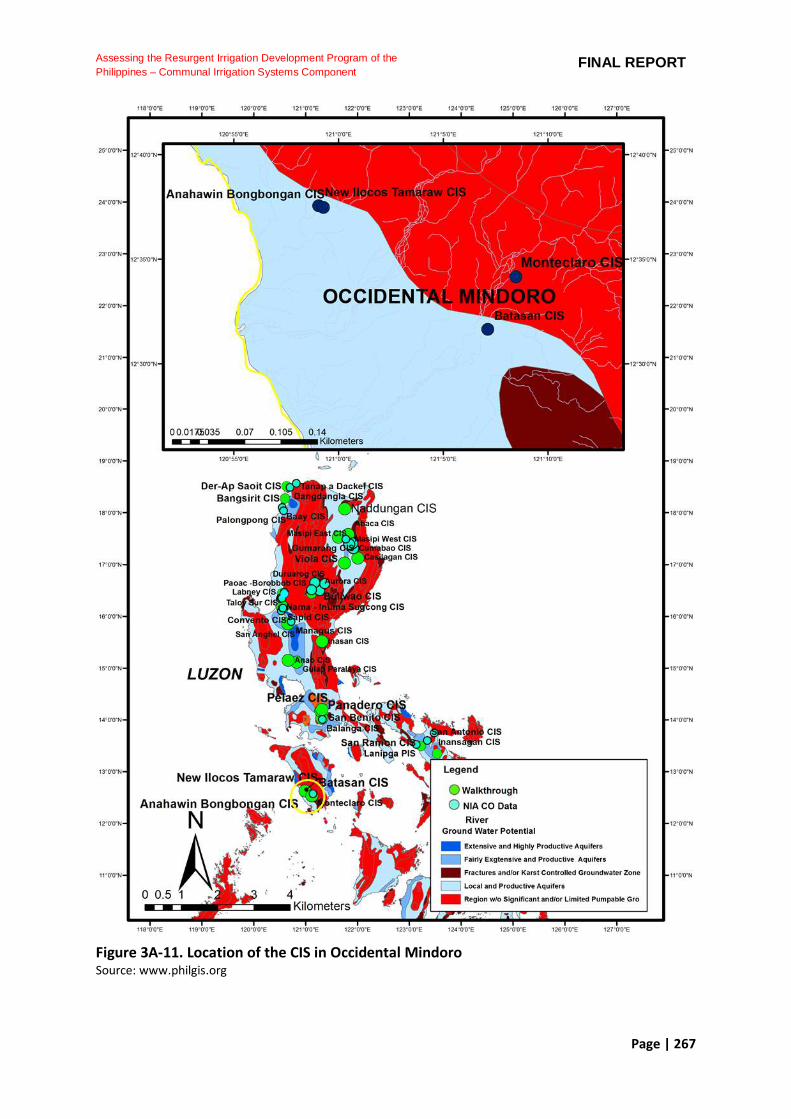
Page | 267
Assessing the Resurgent Irrigation Development Program of the
Philippines – Communal Irrigation Systems Component FINAL REPORT
Figure 3A-11. Location of the CIS in Occidental Mindoro Source: www.philgis.org
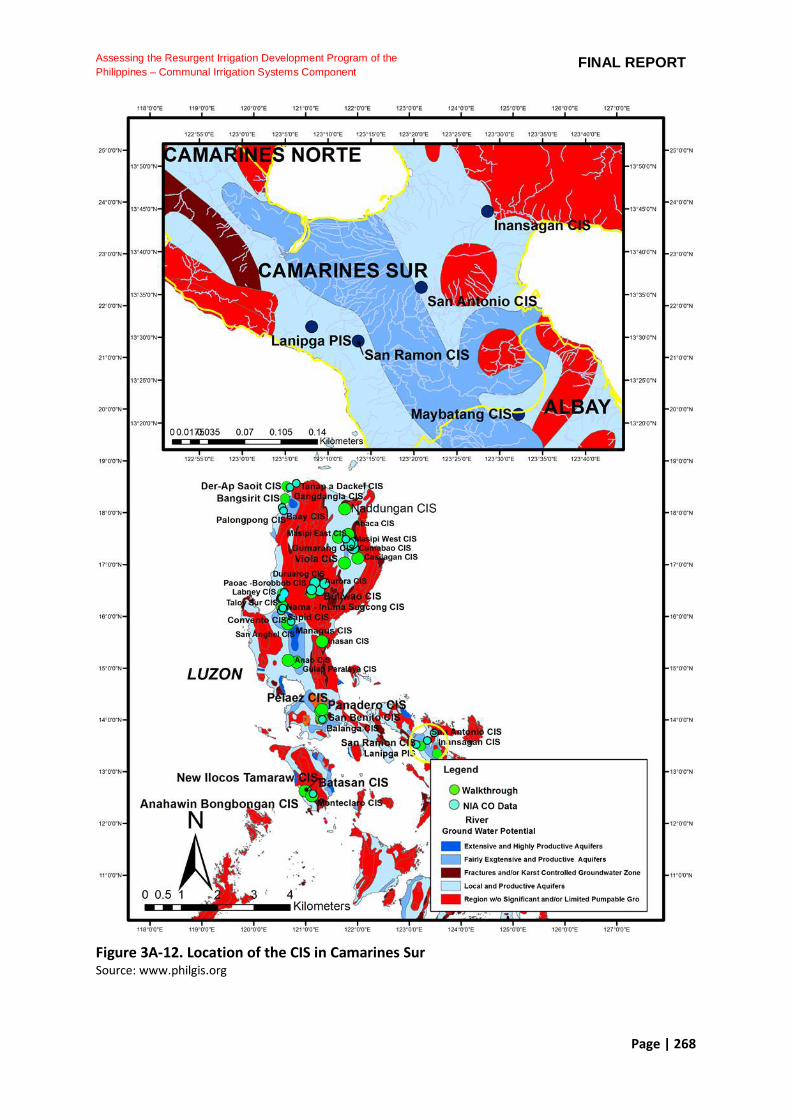
Page | 268
Assessing the Resurgent Irrigation Development Program of the
Philippines – Communal Irrigation Systems Component FINAL REPORT
Figure 3A-12. Location of the CIS in Camarines Sur Source: www.philgis.org
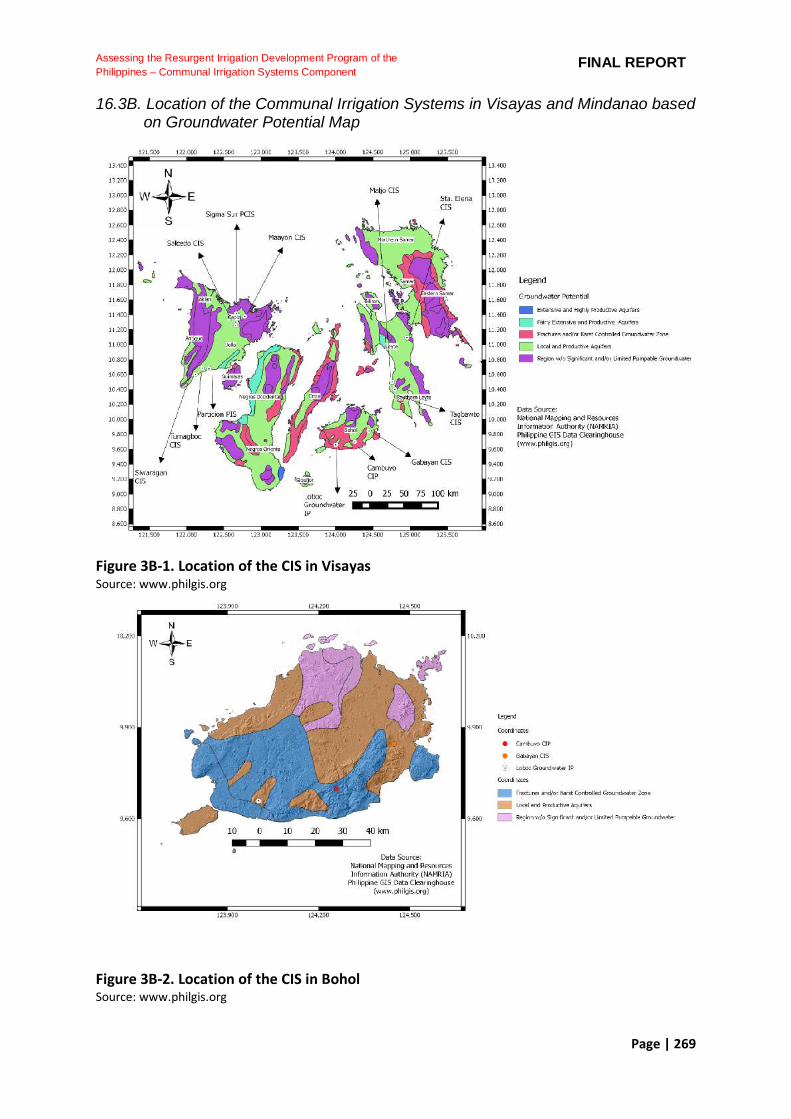
Page | 269
Assessing the Resurgent Irrigation Development Program of the
Philippines – Communal Irrigation Systems Component FINAL REPORT
16.3B. Location of the Communal Irrigation Systems in Visayas and Mindanao based on Groundwater Potential Map
Figure 3B-1. Location of the CIS in Visayas Source: www.philgis.org
Figure 3B-2. Location of the CIS in Bohol Source: www.philgis.org
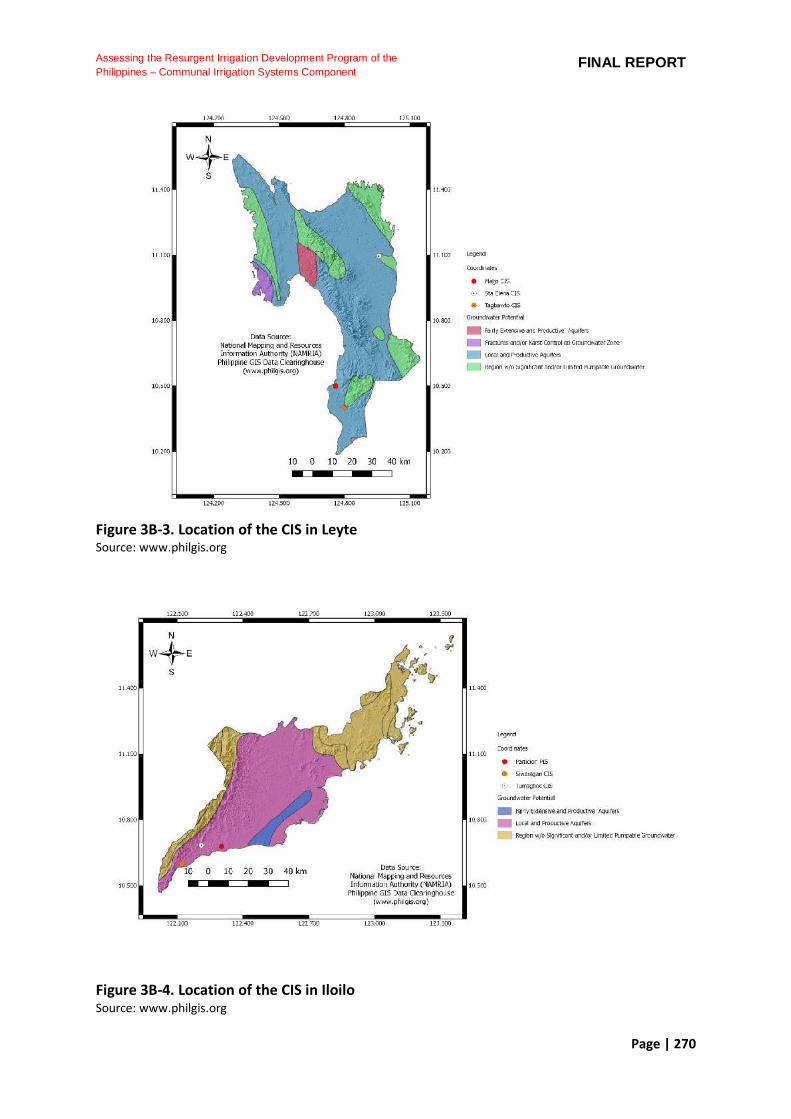
Page | 270
Assessing the Resurgent Irrigation Development Program of the
Philippines – Communal Irrigation Systems Component FINAL REPORT
Figure 3B-3. Location of the CIS in Leyte Source: www.philgis.org
Figure 3B-4. Location of the CIS in Iloilo Source: www.philgis.org
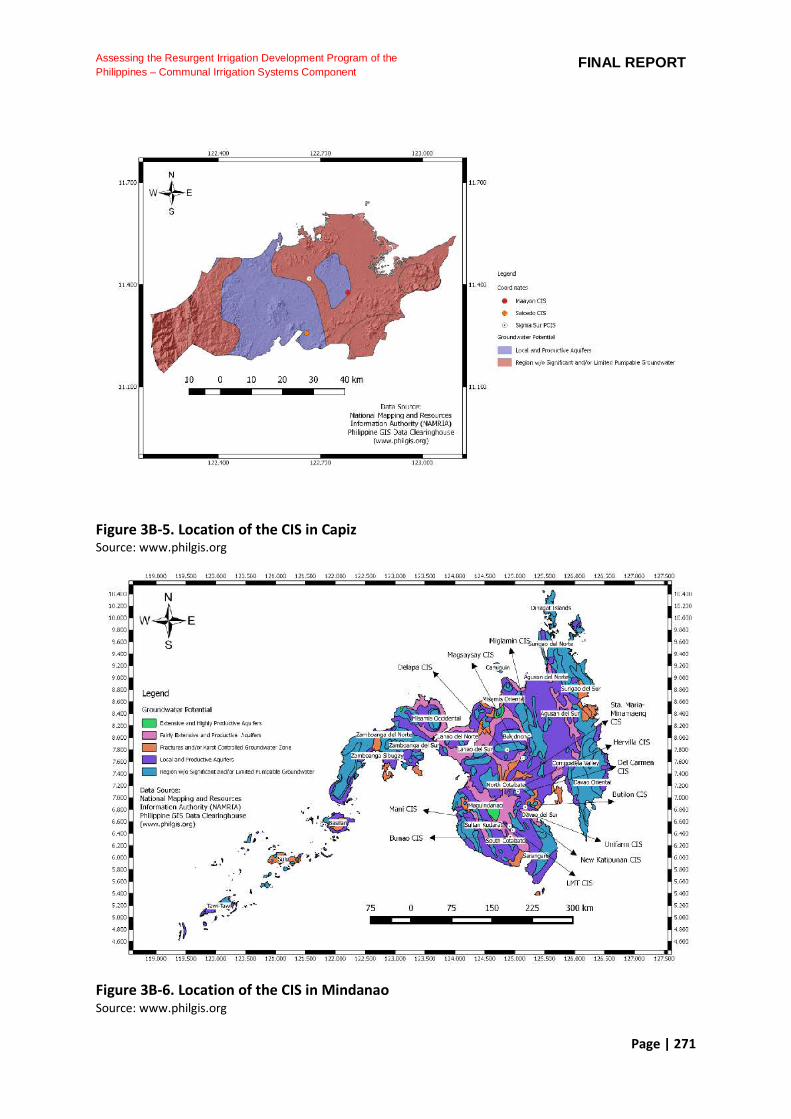
Page | 271
Assessing the Resurgent Irrigation Development Program of the
Philippines – Communal Irrigation Systems Component FINAL REPORT
Figure 3B-5. Location of the CIS in Capiz Source: www.philgis.org
Figure 3B-6. Location of the CIS in Mindanao Source: www.philgis.org
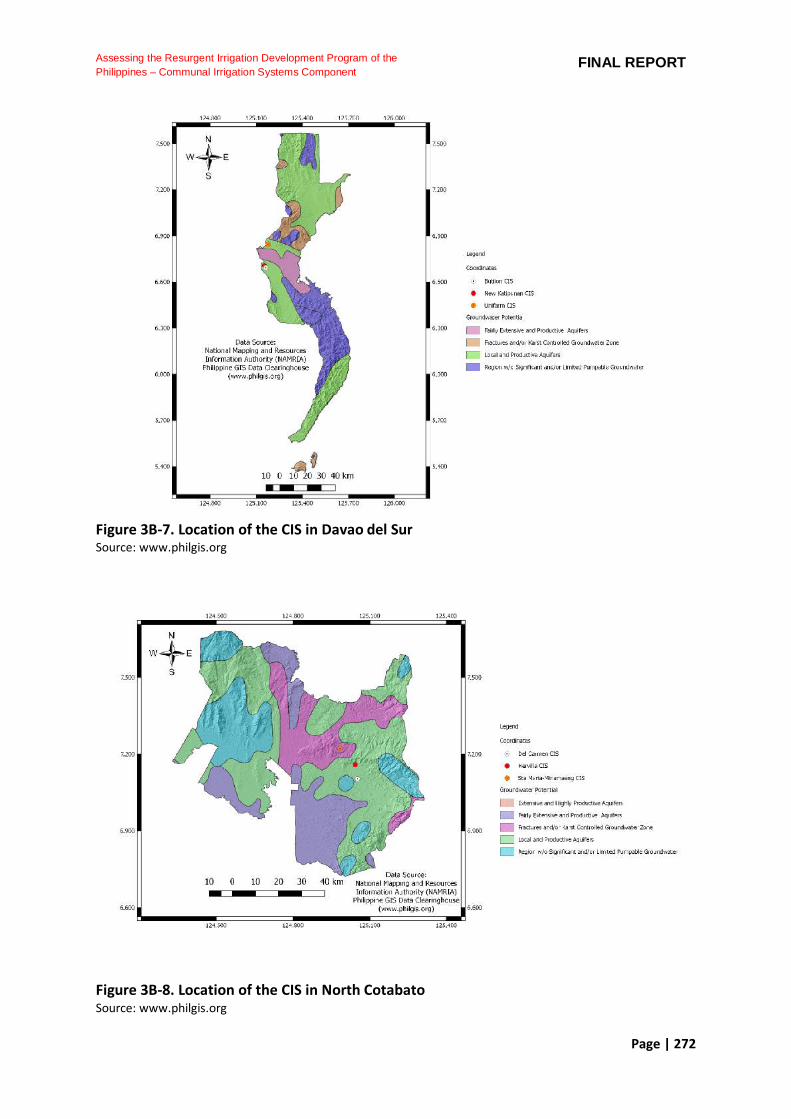
Page | 272
Assessing the Resurgent Irrigation Development Program of the
Philippines – Communal Irrigation Systems Component FINAL REPORT
Figure 3B-7. Location of the CIS in Davao del Sur Source: www.philgis.org
Figure 3B-8. Location of the CIS in North Cotabato Source: www.philgis.org
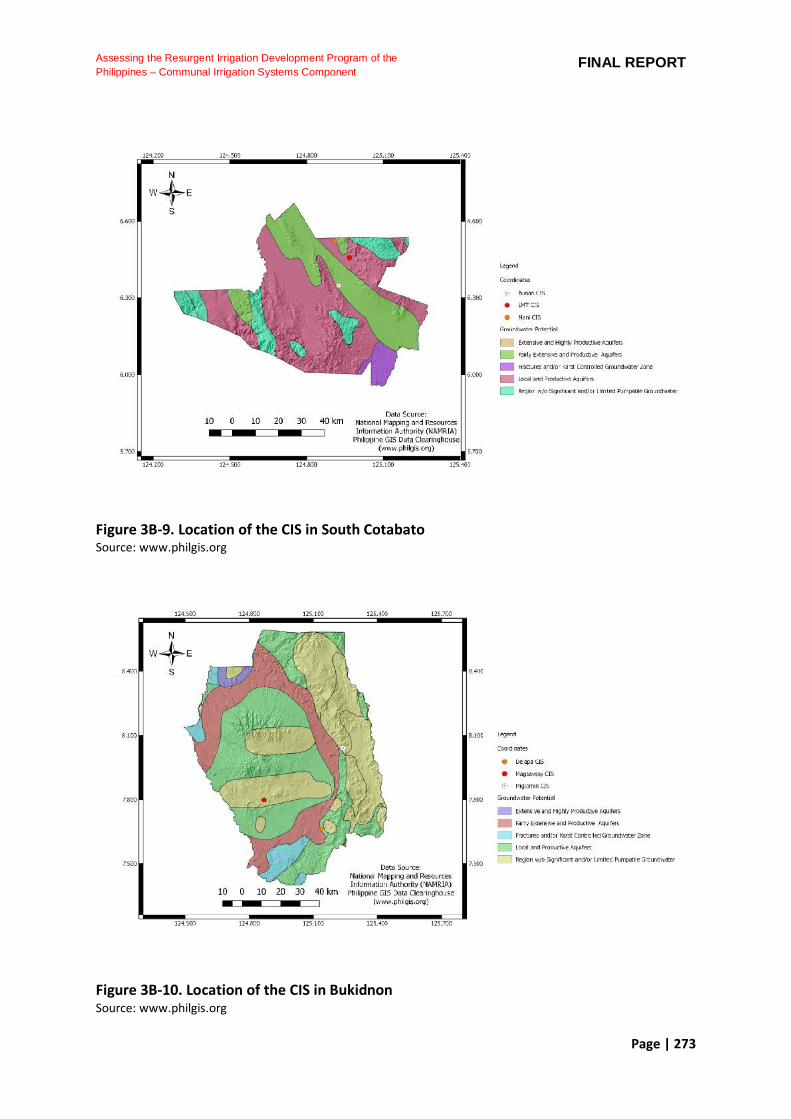
Page | 273
Assessing the Resurgent Irrigation Development Program of the
Philippines – Communal Irrigation Systems Component FINAL REPORT
Figure 3B-9. Location of the CIS in South Cotabato Source: www.philgis.org
Figure 3B-10. Location of the CIS in Bukidnon Source: www.philgis.org
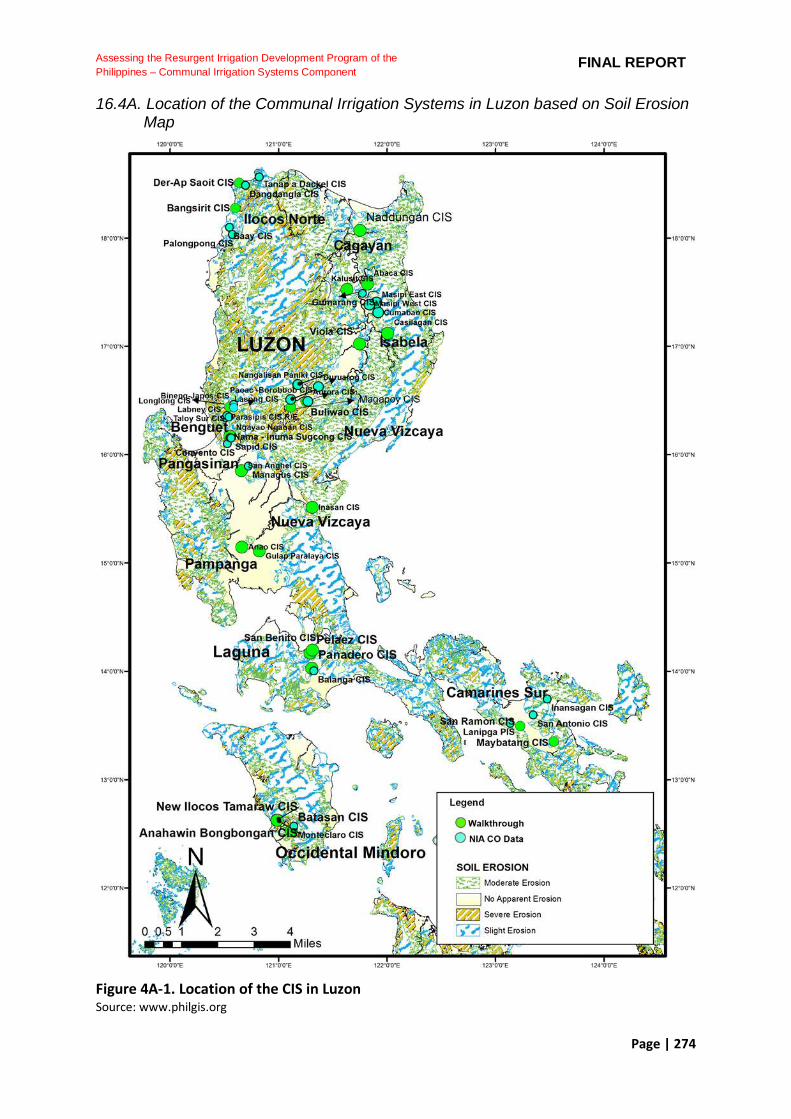
Page | 274
Assessing the Resurgent Irrigation Development Program of the
Philippines – Communal Irrigation Systems Component FINAL REPORT
16.4A. Location of the Communal Irrigation Systems in Luzon based on Soil Erosion Map
Figure 4A-1. Location of the CIS in Luzon Source: www.philgis.org
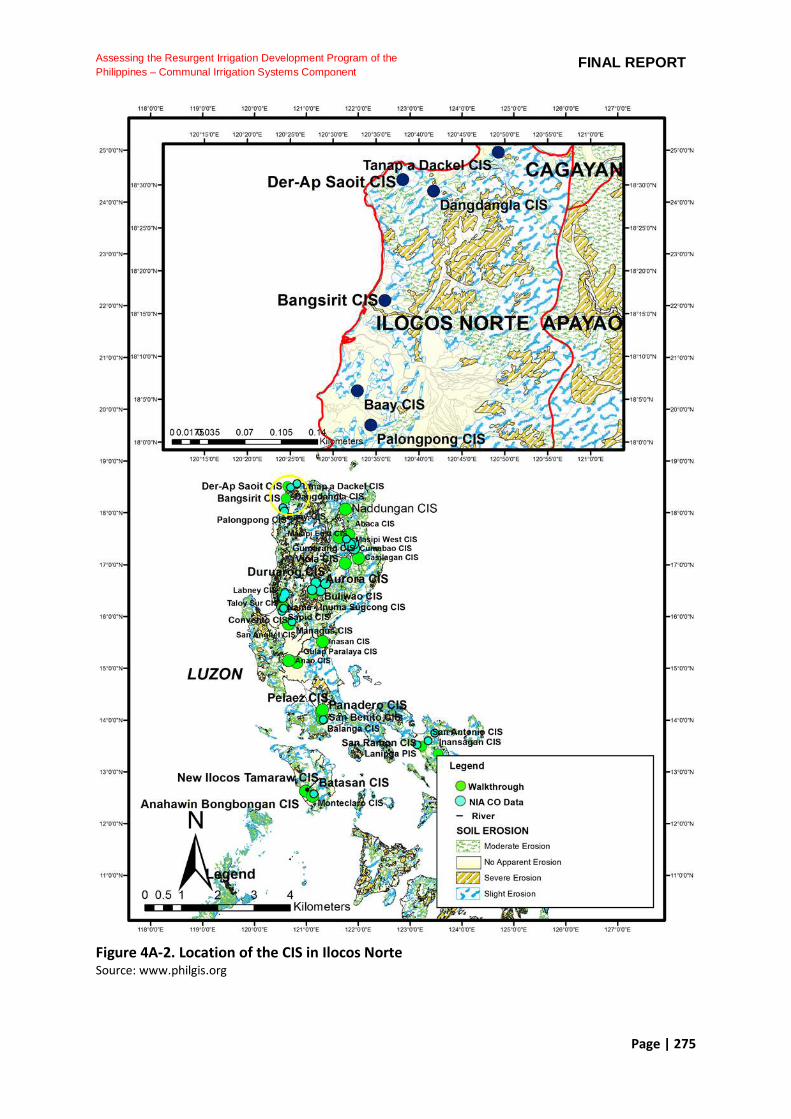
Page | 275
Assessing the Resurgent Irrigation Development Program of the
Philippines – Communal Irrigation Systems Component FINAL REPORT
Figure 4A-2. Location of the CIS in Ilocos Norte Source: www.philgis.org

Page | 276
Assessing the Resurgent Irrigation Development Program of the
Philippines – Communal Irrigation Systems Component FINAL REPORT
Figure 4A-3. Location of the CIS in Benguet Source: www.philgis.org
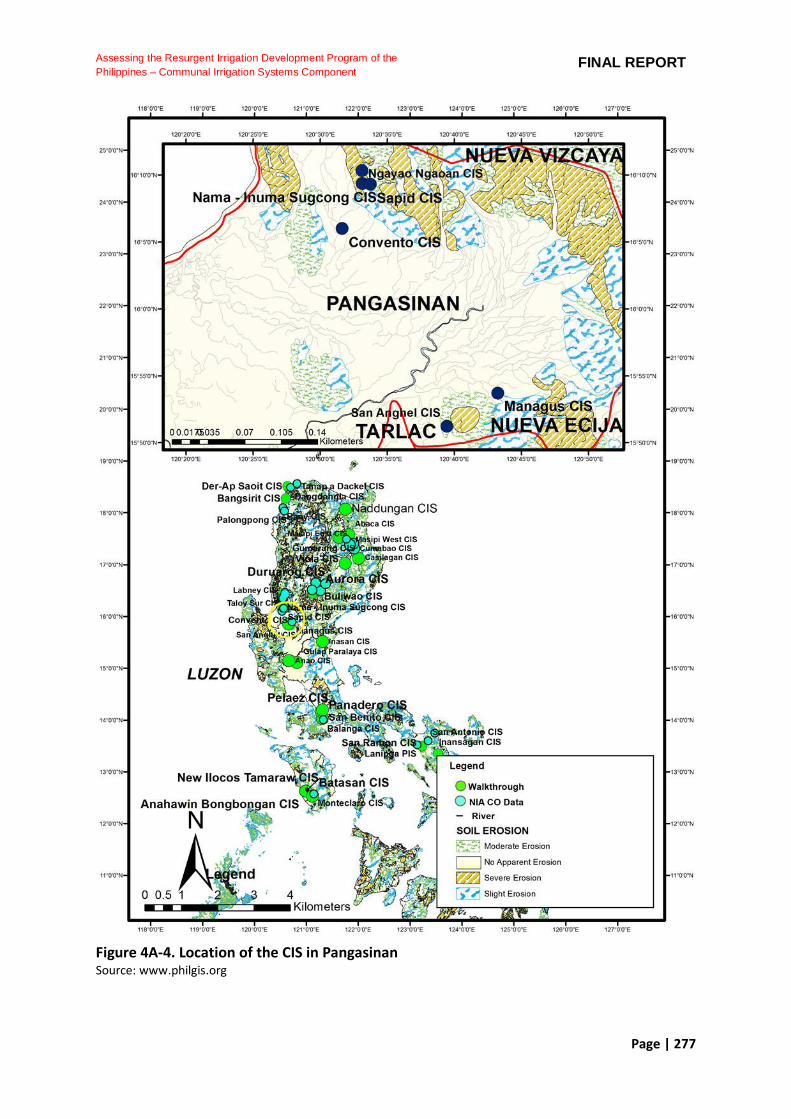
Page | 277
Assessing the Resurgent Irrigation Development Program of the
Philippines – Communal Irrigation Systems Component FINAL REPORT
Figure 4A-4. Location of the CIS in Pangasinan Source: www.philgis.org

Page | 278
Assessing the Resurgent Irrigation Development Program of the
Philippines – Communal Irrigation Systems Component FINAL REPORT
Figure 4A-5. Location of the CIS in Cagayan Source: www.philgis.org

Page | 279
Assessing the Resurgent Irrigation Development Program of the
Philippines – Communal Irrigation Systems Component FINAL REPORT
Figure 4A-6. Location of the CIS in Isabela Source: www.philgis.org
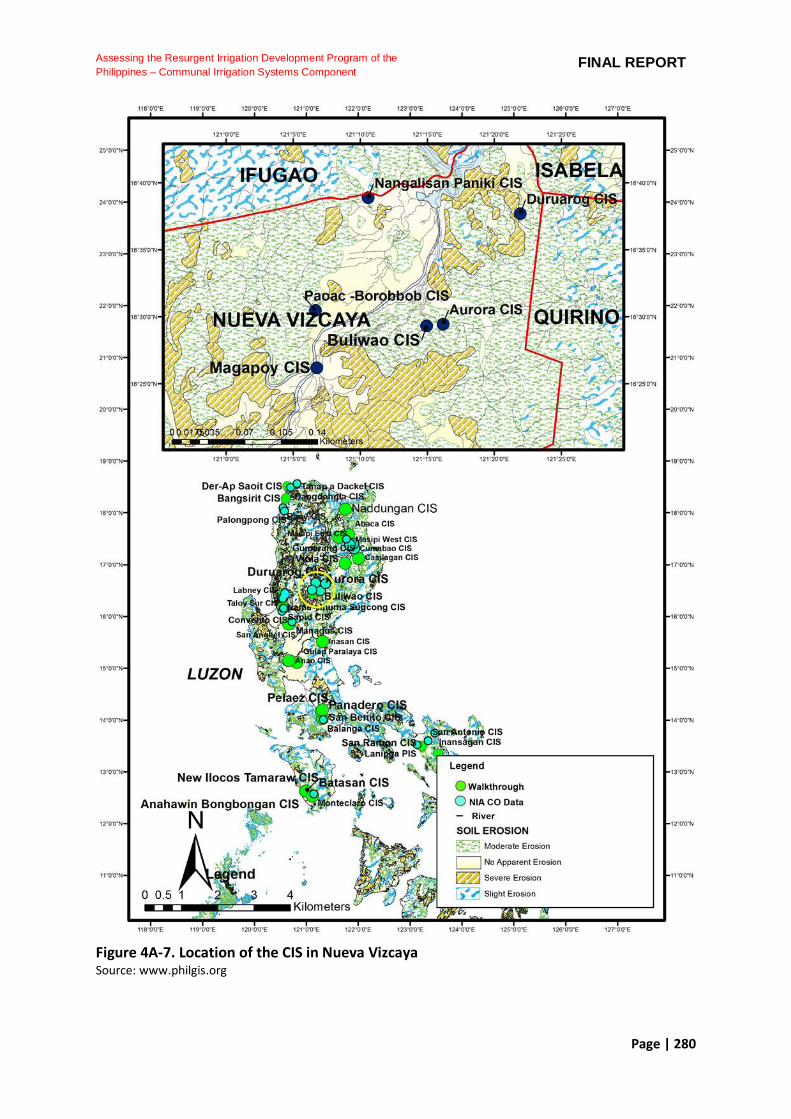
Page | 280
Assessing the Resurgent Irrigation Development Program of the
Philippines – Communal Irrigation Systems Component FINAL REPORT
Figure 4A-7. Location of the CIS in Nueva Vizcaya Source: www.philgis.org

Page | 281
Assessing the Resurgent Irrigation Development Program of the
Philippines – Communal Irrigation Systems Component FINAL REPORT
Figure 4A-8. Location of the CIS in South Nueva Ecija Source: www.philgis.org

Page | 282
Assessing the Resurgent Irrigation Development Program of the
Philippines – Communal Irrigation Systems Component FINAL REPORT
Figure 4A-9. Location of the CIS in Pampanga Source: www.philgis.org
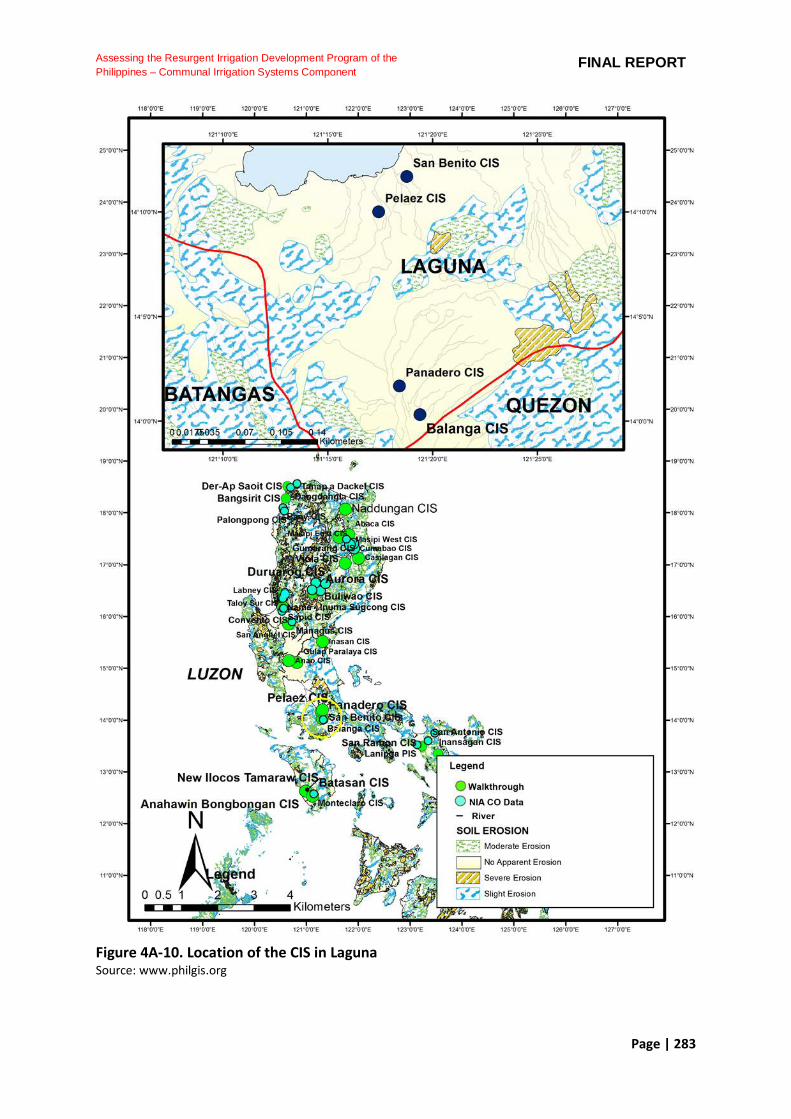
Page | 283
Assessing the Resurgent Irrigation Development Program of the
Philippines – Communal Irrigation Systems Component FINAL REPORT
Figure 4A-10. Location of the CIS in Laguna Source: www.philgis.org

Page | 284
Assessing the Resurgent Irrigation Development Program of the
Philippines – Communal Irrigation Systems Component FINAL REPORT
Figure 4A-11. Location of the CIS in Occidental Mindoro Source: www.philgis.org
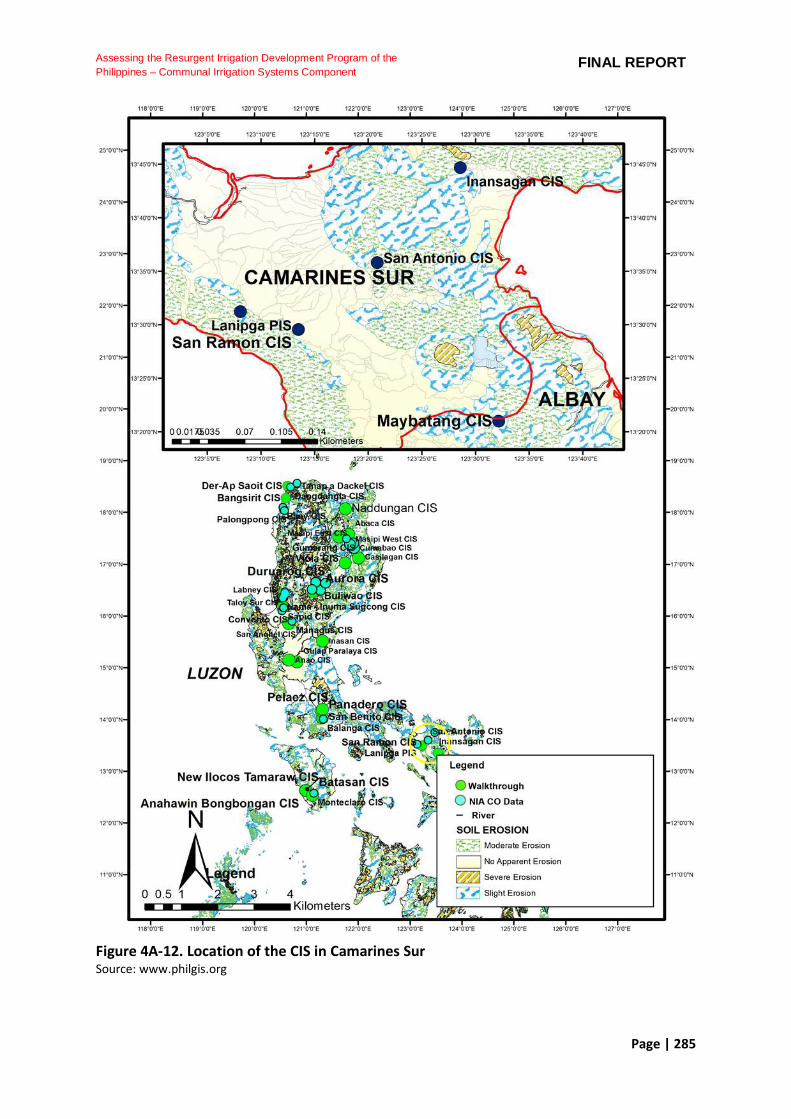
Page | 285
Assessing the Resurgent Irrigation Development Program of the
Philippines – Communal Irrigation Systems Component FINAL REPORT
Figure 4A-12. Location of the CIS in Camarines Sur Source: www.philgis.org

Page | 286
Assessing the Resurgent Irrigation Development Program of the
Philippines – Communal Irrigation Systems Component FINAL REPORT
16.4B. Location of the Communal Irrigation Systems in Visayas and Mindanao based on Soil Erosion Map
Figure 4B-1. Location of the CIS in Visayas Source: www.philgis.org
Figure 4B-2. Location of the CIS in Bohol Source: www.philgis.org
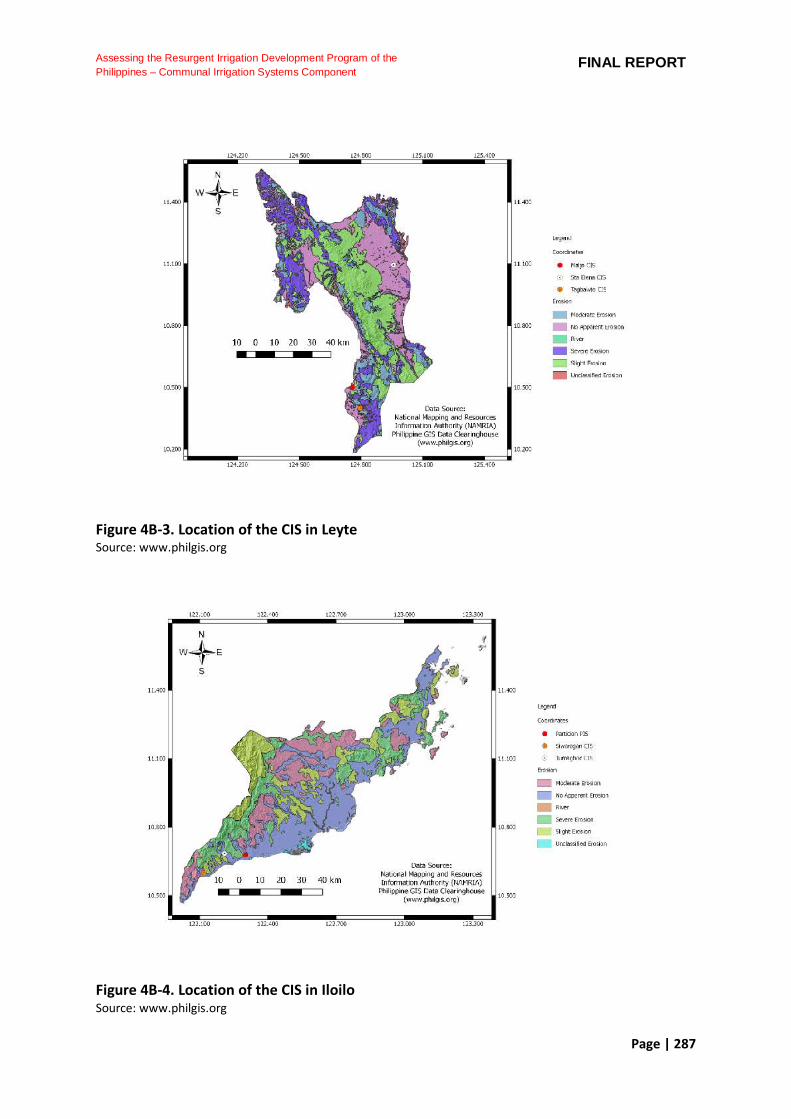
Page | 287
Assessing the Resurgent Irrigation Development Program of the
Philippines – Communal Irrigation Systems Component FINAL REPORT
Figure 4B-3. Location of the CIS in Leyte Source: www.philgis.org
Figure 4B-4. Location of the CIS in Iloilo Source: www.philgis.org

Page | 288
Assessing the Resurgent Irrigation Development Program of the
Philippines – Communal Irrigation Systems Component FINAL REPORT
Figure 4B-5. Location of the CIS in Capiz Source: www.philgis.org
Figure 4B-6. Location of the CIS in Mindanao Source: www.philgis.org
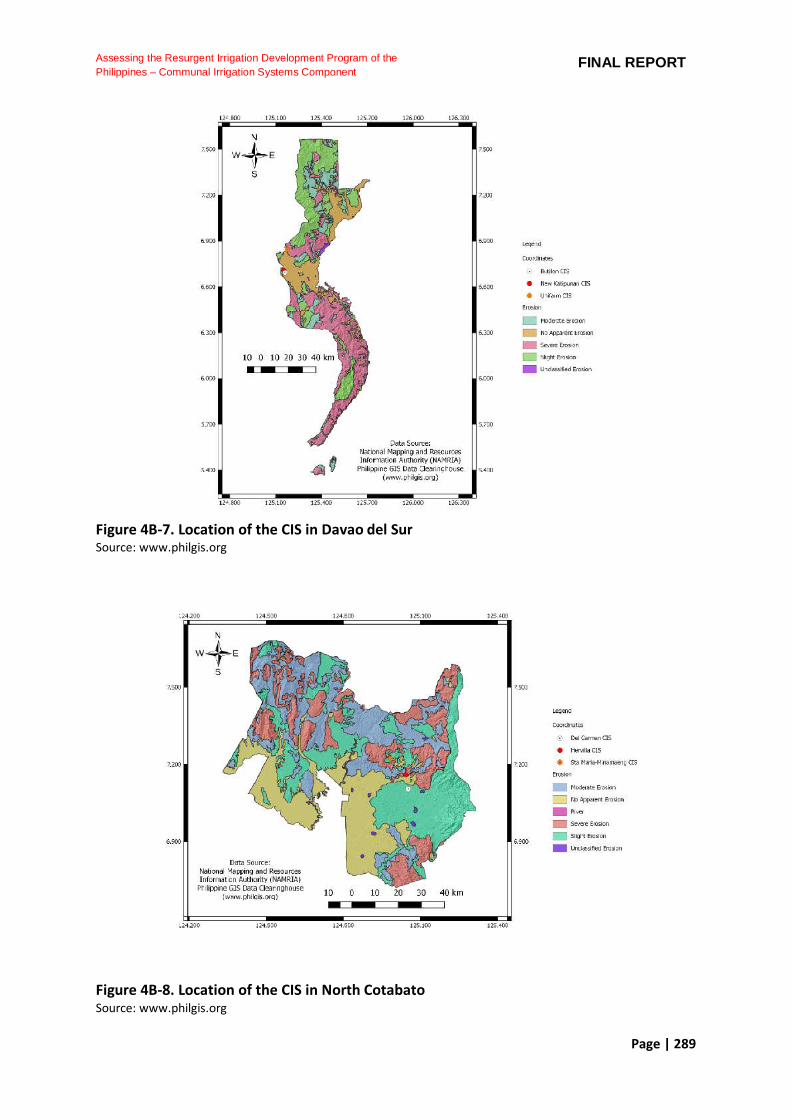
Page | 289
Assessing the Resurgent Irrigation Development Program of the
Philippines – Communal Irrigation Systems Component FINAL REPORT
Figure 4B-7. Location of the CIS in Davao del Sur Source: www.philgis.org
Figure 4B-8. Location of the CIS in North Cotabato Source: www.philgis.org

Page | 290
Assessing the Resurgent Irrigation Development Program of the
Philippines – Communal Irrigation Systems Component FINAL REPORT
Figure 4B-9. Location of the CIS in South Cotabato Source: www.philgis.org
Figure 4B-10. Location of the CIS in Bukidnon Source: www.philgis.org
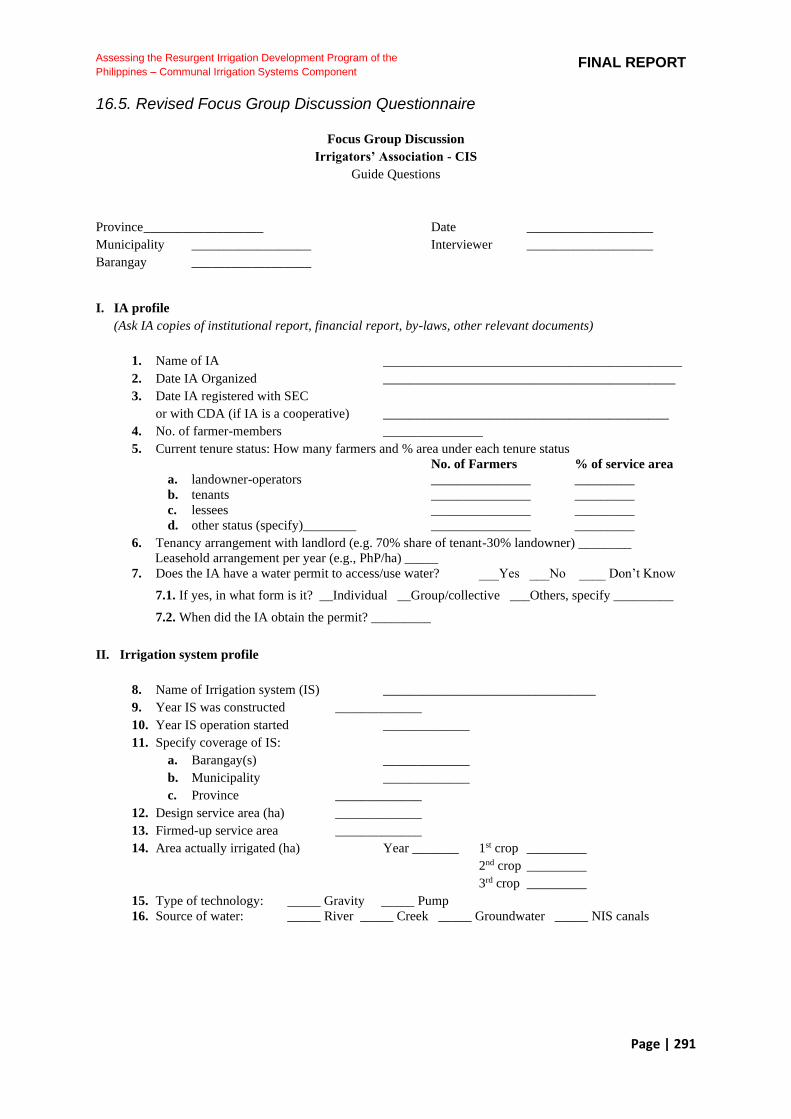
Page | 291
Assessing the Resurgent Irrigation Development Program of the
Philippines – Communal Irrigation Systems Component FINAL REPORT
16.5. Revised Focus Group Discussion Questionnaire
Focus Group Discussion
Irrigators’ Association - CIS
Guide Questions
Province __________________ Date ___________________
Municipality __________________ Interviewer ___________________
Barangay __________________
I. IA profile
(Ask IA copies of institutional report, financial report, by-laws, other relevant documents)
1. Name of IA _____________________________________________
2. Date IA Organized ____________________________________________
3. Date IA registered with SEC
or with CDA (if IA is a cooperative) ___________________________________________
4. No. of farmer-members _______________
5. Current tenure status: How many farmers and % area under each tenure status
No. of Farmers % of service area
a. landowner-operators _______________ _________
b. tenants _______________ _________
c. lessees _______________ _________
d. other status (specify)________ _______________ _________
6. Tenancy arrangement with landlord (e.g. 70% share of tenant-30% landowner) ________
Leasehold arrangement per year (e.g., PhP/ha) _____
7. Does the IA have a water permit to access/use water? ___Yes ___No ____ Don’t Know
7.1. If yes, in what form is it? __Individual __Group/collective ___Others, specify _________
7.2. When did the IA obtain the permit? _________
II. Irrigation system profile
8. Name of Irrigation system (IS) ________________________________
9. Year IS was constructed _____________
10. Year IS operation started _____________
11. Specify coverage of IS:
a. Barangay(s) _____________
b. Municipality _____________
c. Province _____________
12. Design service area (ha) _____________
13. Firmed-up service area _____________
14. Area actually irrigated (ha) Year _______ 1st crop _________
2nd crop _________
3rd crop _________
15. Type of technology: _____ Gravity _____ Pump
16. Source of water: _____ River _____ Creek _____ Groundwater _____ NIS canals

Page | 292
Assessing the Resurgent Irrigation Development Program of the
Philippines – Communal Irrigation Systems Component FINAL REPORT
III. Operational Aspects
17. Is there a formal memorandum of acceptance or understanding (MOU/MOA) between NIA and IA
regarding the turnover of system/component(s) of the system? ___Yes ___No
17.1 If yes, is the CIS ownership fully turned over to the IA? Yes ____ When ____
17.2 If No, is the IA still paying amortization of the CIS? ___Yes ___No
18. Have you heard of the Free Irrigation Act exempting farmers from payment of irrigation service fee?
___Yes ___No a. If yes, when did you get the information? __________________
From whom? ______________
b. Is the free irrigation service fee already being implemented in your area?
___Yes (proceed to No. 19)
___No (proceed to No. 20)
19. If YES and the IA has not yet fully paid the cost of the CIS,
19.1. did the IA stop paying the amortization to NIA? ___Yes ___No
19.2. have you received any funding for your O&M activities? ___Yes ___No
19.3. from whom did the funding come from? ______________
20. If NO and IA is still paying loan amortization, pls. provide the following info:
20.1. Amount of loan: _________________________
20.2. Equity: ________________________________
20.3. Source of funds for equity payment:
20.3.1. _____IA owned funds
20.3.2. _____Landlord
20.3.3. _____Grant from Municipal
20.3.4. _____Grant from Provincial
20.3.5. _____Grant from politicians (specify) ______________
20.3.6. _____Others (specify) _____________
20.4. Year loan was granted: _____________
20.5. No. of years for amortization: ______________________
20.6. Rate of amortization (Peso/season or Peso/year):________________
20.7. How many more years to pay? ______________________________
20.8. Problems related to loan amortization ________________________
20.9. For tenants and leaseholders, does the landlord/owner share the payment of
20.9.1. Equity? ___No ___ Yes How much is their share? PhP_____
20.9.2. Amortization cost? ___No ___ Yes How much is their share? PhP_____
20.10. Other remarks: ___________________
21. If the Free Irrigation Act will be implemented, what will be its effects on your IA and your CIS?
____________________________________________________
____________________________________________________
22. What regular activity/support/assistance (technical financial, etc.) is continually provided by the NIA
and other agencies/organizations with regard to the irrigation system?___Yes ___No
Agency Specify assistance provided
Rating
4- Very satisfactory to
0- very unsatisfactory
Improvement in performance
NIA
DA (e.g.,
BSWM)
Local
Others
(specify)
23. Role of IA in CIS Project Phases
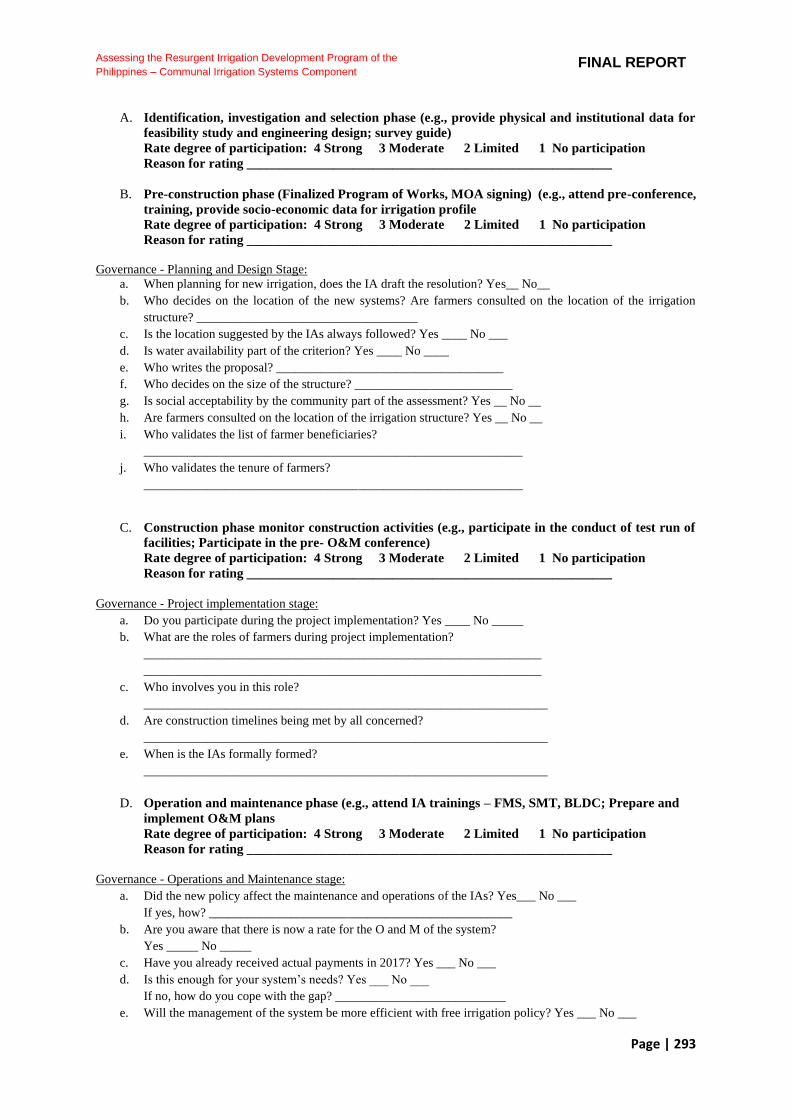
Page | 293
Assessing the Resurgent Irrigation Development Program of the
Philippines – Communal Irrigation Systems Component FINAL REPORT
A. Identification, investigation and selection phase (e.g., provide physical and institutional data for
feasibility study and engineering design; survey guide)
Rate degree of participation: 4 Strong 3 Moderate 2 Limited 1 No participation
Reason for rating _______________________________________________________
B. Pre-construction phase (Finalized Program of Works, MOA signing) (e.g., attend pre-conference,
training, provide socio-economic data for irrigation profile
Rate degree of participation: 4 Strong 3 Moderate 2 Limited 1 No participation
Reason for rating _______________________________________________________
Governance - Planning and Design Stage:
a. When planning for new irrigation, does the IA draft the resolution? Yes__ No__
b. Who decides on the location of the new systems? Are farmers consulted on the location of the irrigation
structure? ___________________________________
c. Is the location suggested by the IAs always followed? Yes ____ No ___
d. Is water availability part of the criterion? Yes ____ No ____
e. Who writes the proposal? ____________________________________
f. Who decides on the size of the structure? _________________________
g. Is social acceptability by the community part of the assessment? Yes __ No __
h. Are farmers consulted on the location of the irrigation structure? Yes __ No __
i. Who validates the list of farmer beneficiaries?
____________________________________________________________
j. Who validates the tenure of farmers?
____________________________________________________________
C. Construction phase monitor construction activities (e.g., participate in the conduct of test run of
facilities; Participate in the pre- O&M conference)
Rate degree of participation: 4 Strong 3 Moderate 2 Limited 1 No participation
Reason for rating _______________________________________________________
Governance - Project implementation stage:
a. Do you participate during the project implementation? Yes ____ No _____
b. What are the roles of farmers during project implementation?
_______________________________________________________________
_______________________________________________________________
c. Who involves you in this role?
________________________________________________________________
d. Are construction timelines being met by all concerned?
________________________________________________________________
e. When is the IAs formally formed?
________________________________________________________________
D. Operation and maintenance phase (e.g., attend IA trainings – FMS, SMT, BLDC; Prepare and
implement O&M plans
Rate degree of participation: 4 Strong 3 Moderate 2 Limited 1 No participation
Reason for rating _______________________________________________________
Governance - Operations and Maintenance stage:
a. Did the new policy affect the maintenance and operations of the IAs? Yes___ No ___
If yes, how? ________________________________________________
b. Are you aware that there is now a rate for the O and M of the system?
Yes _____ No _____
c. Have you already received actual payments in 2017? Yes ___ No ___
d. Is this enough for your system’s needs? Yes ___ No ___
If no, how do you cope with the gap? ___________________________
e. Will the management of the system be more efficient with free irrigation policy? Yes ___ No ___
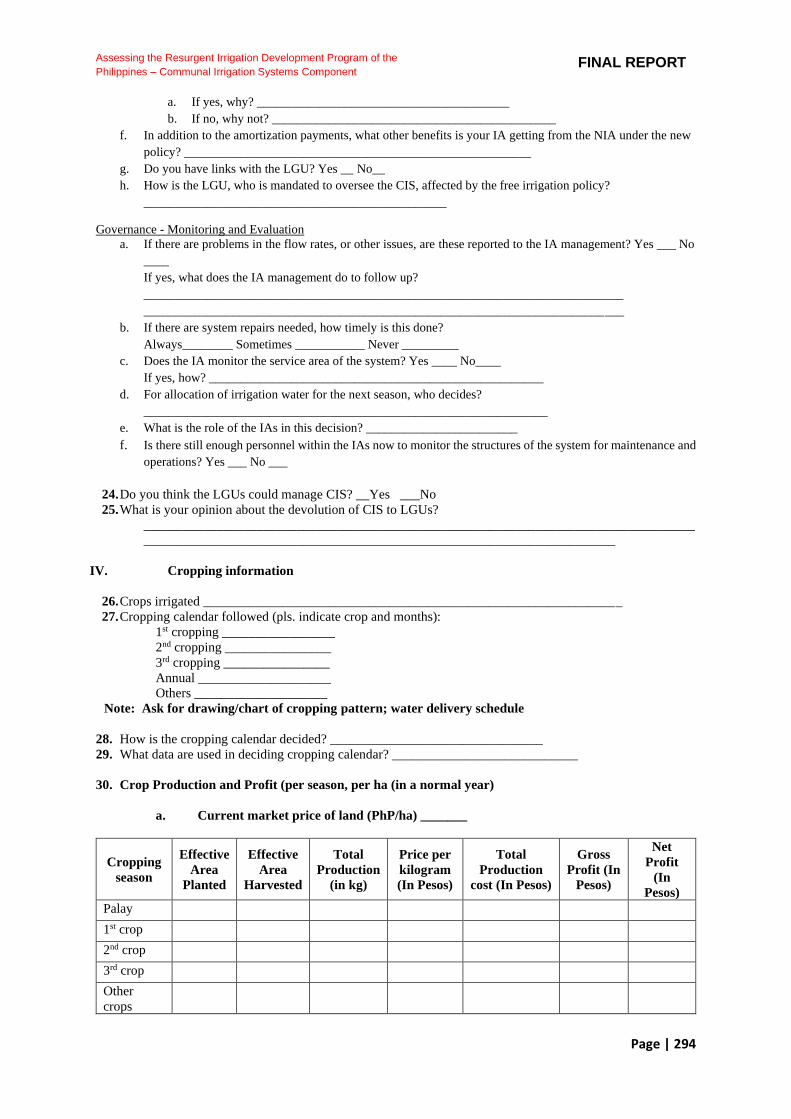
Page | 294
Assessing the Resurgent Irrigation Development Program of the
Philippines – Communal Irrigation Systems Component FINAL REPORT
a. If yes, why? ________________________________________
b. If no, why not? _____________________________________________
f. In addition to the amortization payments, what other benefits is your IA getting from the NIA under the new
policy? _______________________________________________________
g. Do you have links with the LGU? Yes __ No__
h. How is the LGU, who is mandated to oversee the CIS, affected by the free irrigation policy?
________________________________________________
Governance - Monitoring and Evaluation
a. If there are problems in the flow rates, or other issues, are these reported to the IA management? Yes ___ No
____
If yes, what does the IA management do to follow up?
____________________________________________________________________________
____________________________________________________________________________
b. If there are system repairs needed, how timely is this done?
Always________ Sometimes ___________ Never _________
c. Does the IA monitor the service area of the system? Yes ____ No____
If yes, how? _____________________________________________________
d. For allocation of irrigation water for the next season, who decides?
________________________________________________________________
e. What is the role of the IAs in this decision? ________________________
f. Is there still enough personnel within the IAs now to monitor the structures of the system for maintenance and
operations? Yes ___ No ___
24. Do you think the LGUs could manage CIS? __Yes ___No
25. What is your opinion about the devolution of CIS to LGUs?
___________________________________________________________________________________
_______________________________________________________________________
IV. Cropping information
26. Crops irrigated _______________________________________________________________
27. Cropping calendar followed (pls. indicate crop and months):
1st cropping _________________
2nd cropping ________________
3rd cropping ________________
Annual ____________________
Others ____________________
Note: Ask for drawing/chart of cropping pattern; water delivery schedule
28. How is the cropping calendar decided? ________________________________
29. What data are used in deciding cropping calendar? ____________________________
30. Crop Production and Profit (per season, per ha (in a normal year)
a. Current market price of land (PhP/ha) _______
Cropping
season
Effective
Area
Planted
Effective
Area
Harvested
Total
Production
(in kg)
Price per
kilogram
(In Pesos)
Total
Production
cost (In Pesos)
Gross
Profit (In
Pesos)
Net
Profit
(In
Pesos)
Palay
1st crop 2nd crop 3rd crop
Other
crops

Page | 295
Assessing the Resurgent Irrigation Development Program of the
Philippines – Communal Irrigation Systems Component FINAL REPORT
31. Pump usage
Where pumps are used:
a. Provide details/describe pump technology and practices used ________________________
____________________________________________________________________________
b. Why is the IA using pump or what factors made the IA adopt pump? __________________
____________________________________________________________________________
c. Cost of the unit ____________ Fund source ________________
If loan, specify terms of payment _________________ IA’s Equity ____
b. Pump rental: Does the IA rent the pump? __ Yes__ No
b.1. Is there a special charge for private well usage? ___ Yes ___ No
If yes, what is the charge? __________________________________________________
b.2 Describe the item (e.g., fuel cost, pump rental) that is charged for ___________________
b.3 If so, what percentage of these charges is collected? ____________________________
e. Costs involved in O&M of the pump (e.g., PhP /year for fuel, PhP for O&M)
_________________________
f. Problems associated with operation of irrigation pumps______________________________
___________________________________________________________________________
32. In case of prolonged dry spell, what are the coping strategies adopted by the IA? ___________
____________________________________________________________________________
____________________________________________________________________________
33. Problems encountered related to cropping: _________________________________________
____________________________________________________________________________
____________________________________________________________________________
V. Organizational Aspects
A. Human Resource
34. Does the IA have a President? ___Yes ___No
35. How is the president chosen? What is their term of office? ______________________________
____________________________________________________________________________
____________________________________________________________________________
36. How is the governing board chosen? What is their term of office? _______________________
____________________________________________________________________________
____________________________________________________________________________
37. How are the members of this body compensated? ___________________________________
____________________________________________________________________________
38. How much are they paid per month? __________ per meeting? ___________
39. Frequency of meetings:
i. IA officers: __________________
ii. BOD: _______________________
iii. General Assembly: ____________
40. Average % participation in meetings
i. IA officers: __________________
ii. BOD: _______________________
iii. General Assembly: ____________
41. Is the IA member of an IA federation? ___Yes ___No
41.1. If yes, specify: ___________________________________________________________
41.2. Frequency of federation meeting:_______________
42. What training relevant to irrigation have IA officers/members attended? ___________________
____________________________________________________________________________
____________________________________________________________________________
42.1. How often do IA officers/members attend trainings? _____________________________
43. How many per cent of the members attended such training? ___________________________
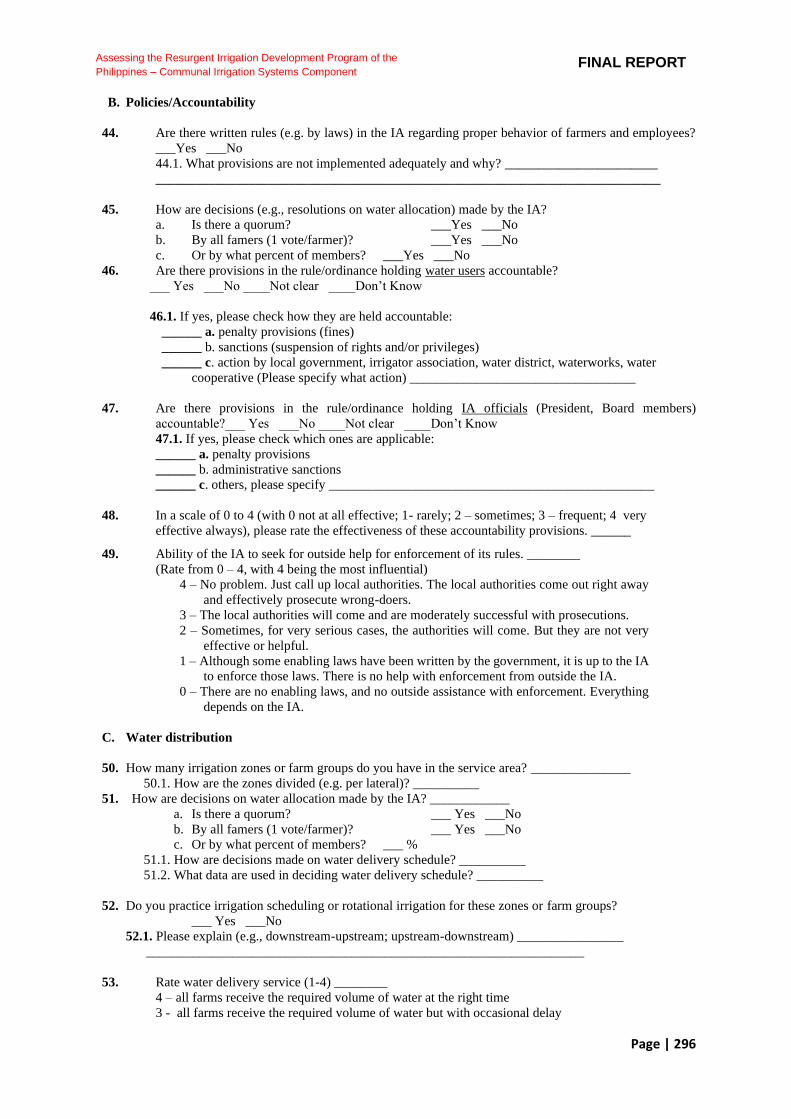
Page | 296
Assessing the Resurgent Irrigation Development Program of the
Philippines – Communal Irrigation Systems Component FINAL REPORT
B. Policies/Accountability
44. Are there written rules (e.g. by laws) in the IA regarding proper behavior of farmers and employees?
___Yes ___No
44.1. What provisions are not implemented adequately and why? _______________________
____________________________________________________________________________
45. How are decisions (e.g., resolutions on water allocation) made by the IA?
a. Is there a quorum? ___Yes ___No
b. By all famers (1 vote/farmer)? ___Yes ___No
c. Or by what percent of members? ___Yes ___No
46. Are there provisions in the rule/ordinance holding water users accountable?
___ Yes ___No ____Not clear ____Don’t Know
46.1. If yes, please check how they are held accountable:
______ a. penalty provisions (fines)
______ b. sanctions (suspension of rights and/or privileges)
______ c. action by local government, irrigator association, water district, waterworks, water
cooperative (Please specify what action) __________________________________
47. Are there provisions in the rule/ordinance holding IA officials (President, Board members)
accountable?___ Yes ___No ____Not clear ____Don’t Know
47.1. If yes, please check which ones are applicable:
______ a. penalty provisions
______ b. administrative sanctions
______ c. others, please specify _________________________________________________
48. In a scale of 0 to 4 (with 0 not at all effective; 1- rarely; 2 – sometimes; 3 – frequent; 4 very
effective always), please rate the effectiveness of these accountability provisions. ______
49. Ability of the IA to seek for outside help for enforcement of its rules. ________
(Rate from 0 – 4, with 4 being the most influential)
4 – No problem. Just call up local authorities. The local authorities come out right away
and effectively prosecute wrong-doers.
3 – The local authorities will come and are moderately successful with prosecutions.
2 – Sometimes, for very serious cases, the authorities will come. But they are not very
effective or helpful.
1 – Although some enabling laws have been written by the government, it is up to the IA
to enforce those laws. There is no help with enforcement from outside the IA.
0 – There are no enabling laws, and no outside assistance with enforcement. Everything
depends on the IA.
C. Water distribution
50. How many irrigation zones or farm groups do you have in the service area? _______________
50.1. How are the zones divided (e.g. per lateral)? __________
51. How are decisions on water allocation made by the IA? ____________
a. Is there a quorum? ___ Yes ___No
b. By all famers (1 vote/farmer)? ___ Yes ___No
c. Or by what percent of members? ___ %
51.1. How are decisions made on water delivery schedule? __________
51.2. What data are used in deciding water delivery schedule? __________
52. Do you practice irrigation scheduling or rotational irrigation for these zones or farm groups?
___ Yes ___No
52.1. Please explain (e.g., downstream-upstream; upstream-downstream) ________________
__________________________________________________________________
53. Rate water delivery service (1-4) ________
4 – all farms receive the required volume of water at the right time
3 - all farms receive the required volume of water but with occasional delay

Page | 297
Assessing the Resurgent Irrigation Development Program of the
Philippines – Communal Irrigation Systems Component FINAL REPORT
2 - all farms fail to receive the required water often
1 - no farm receives sufficient water when needed
54. Rate (0-4) the IA policy on water distribution scheme ________
4 – clear policy and adequately implemented
3 – clear policy but not implemented sometimes
2 – clear policy but not implemented oftentimes
1 – unclear policy
0 - no policy
55. Other uses of water source
______ a. None
______ b. Recreation
______ c. Domestic
______ d. Aquaculture
______ e. Others (specify)______________________
D. Conflict Resolution
56. What are the typical issues solved/discussed by the IA? List three.
_________________________________________________________________________________
_______________________________________________________________________
57. If and when conflicts arise between water users, are there any conflict resolution mechanisms?
___ Yes ___ No ___ Don’t Know
58. Describe conflicts encountered and how it was resolved or not resolved:
a. Conflict on water distribution/use ___________________________________________
_______________________________________________________________________
_______________________________________________________________________
b. Conflict on management of the IS __________________________________________
_______________________________________________________________________
_______________________________________________________________________
c. Others (specify) ________________________________________________________
_______________________________________________________________________
_______________________________________________________________________
59. Are there any legally specified mechanisms for inter-municipality/trans-boundary and multiple-use
conflicts? ___ Yes ___ No ___ Don’t Know
59.1. If yes, please describe the mechanisms. _______________________________________
____________________________________________________________________________
____________________________________________________________________________
59.2. Who/what agency does the IA ask for help to resolve conflict? _____________________
60. Rate IA’s ability on conflict resolution __________
4 – Very effective such that conflict rarely happens
3 – Moderately successful as the conflict repeatedly happens
2 – Not very effective as the conflict happens occasionally
1 – Not effective at all since the conflicts are not resolved
0 – nothing done by IA to resolve conflict
E. Financial aspects (If possible, get IA records/reports)
61. IA funds and sources (average over the last 5 years)
PhP/year
a. National government ____________________
b. Local government funds ____________________
c. Foreign funds ____________________
d. Irrigation service fee from farmers
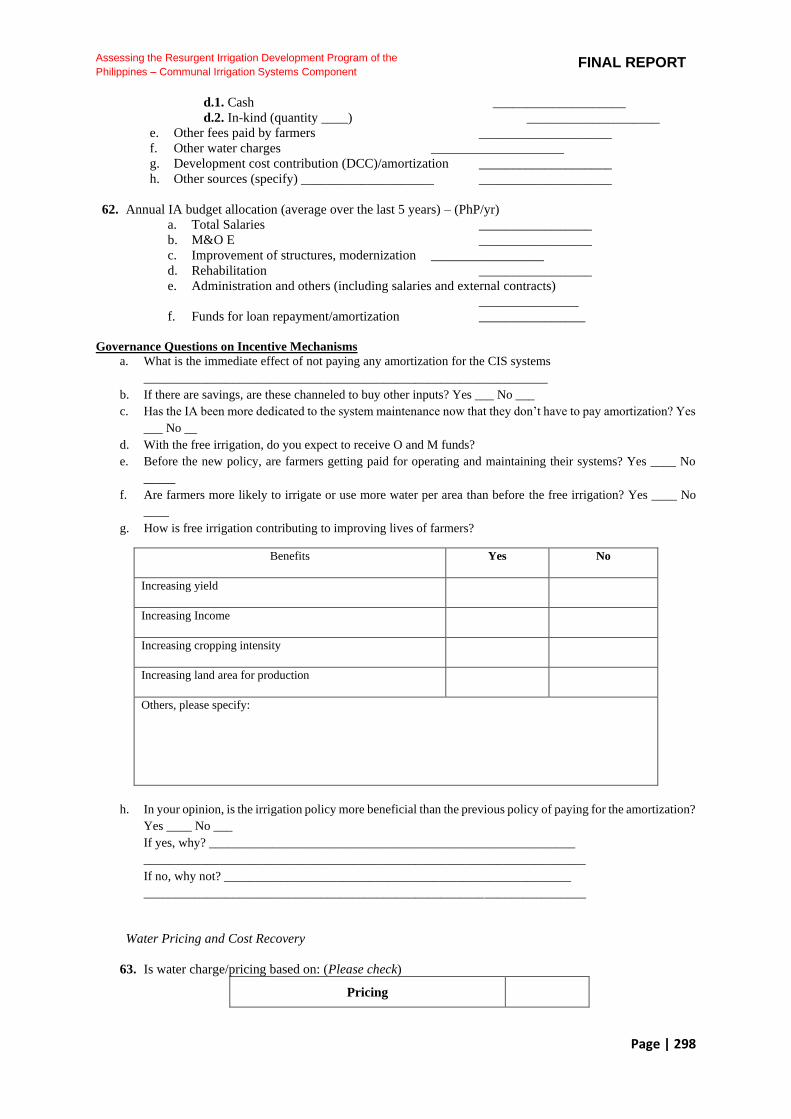
Page | 298
Assessing the Resurgent Irrigation Development Program of the
Philippines – Communal Irrigation Systems Component FINAL REPORT
d.1. Cash ____________________
d.2. In-kind (quantity ____) ____________________
e. Other fees paid by farmers ____________________
f. Other water charges ____________________
g. Development cost contribution (DCC)/amortization ____________________
h. Other sources (specify) ____________________ ____________________
62. Annual IA budget allocation (average over the last 5 years) – (PhP/yr)
a. Total Salaries _________________
b. M&O E _________________
c. Improvement of structures, modernization _________________
d. Rehabilitation _________________
e. Administration and others (including salaries and external contracts)
_______________
f. Funds for loan repayment/amortization ________________
Governance Questions on Incentive Mechanisms
a. What is the immediate effect of not paying any amortization for the CIS systems
________________________________________________________________
b. If there are savings, are these channeled to buy other inputs? Yes ___ No ___
c. Has the IA been more dedicated to the system maintenance now that they don’t have to pay amortization? Yes
___ No __
d. With the free irrigation, do you expect to receive O and M funds?
e. Before the new policy, are farmers getting paid for operating and maintaining their systems? Yes ____ No
_____
f. Are farmers more likely to irrigate or use more water per area than before the free irrigation? Yes ____ No
____
g. How is free irrigation contributing to improving lives of farmers?
Benefits Yes No
Increasing yield
Increasing Income
Increasing cropping intensity
Increasing land area for production
Others, please specify:
h. In your opinion, is the irrigation policy more beneficial than the previous policy of paying for the amortization?
Yes ____ No ___
If yes, why? __________________________________________________________
______________________________________________________________________
If no, why not? _______________________________________________________
______________________________________________________________________
Water Pricing and Cost Recovery
63. Is water charge/pricing based on: (Please check)
Pricing
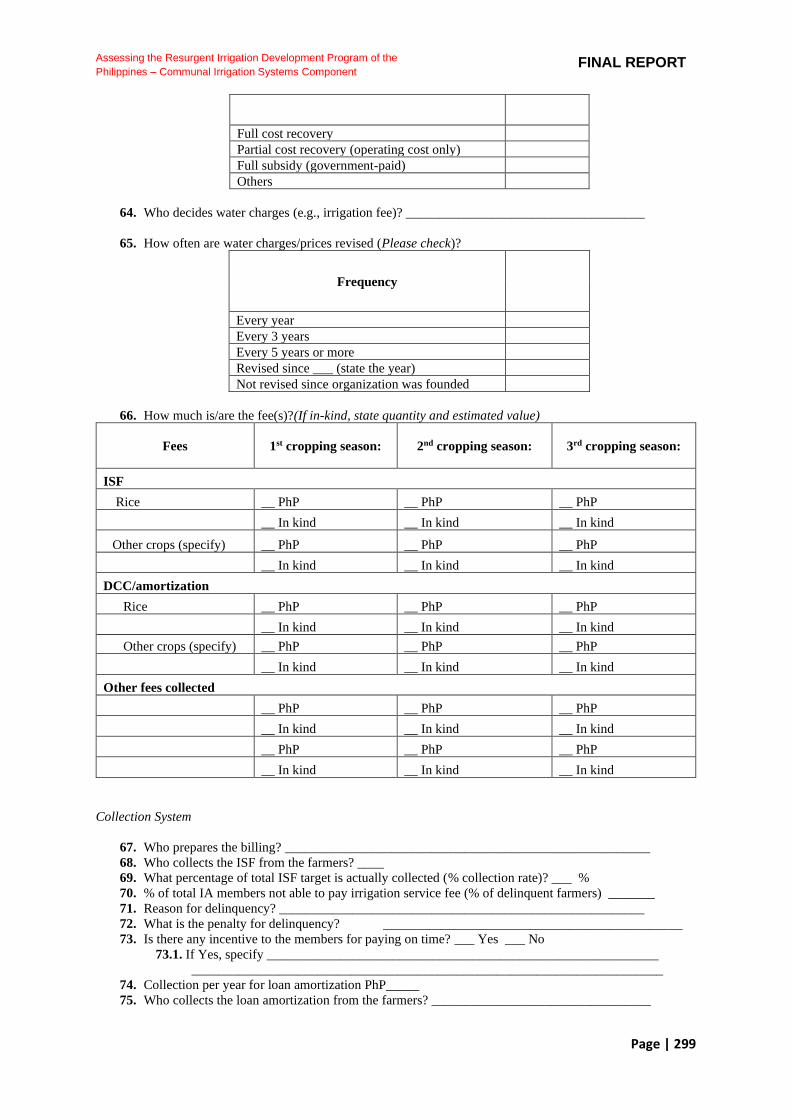
Page | 299
Assessing the Resurgent Irrigation Development Program of the
Philippines – Communal Irrigation Systems Component FINAL REPORT
Full cost recovery
Partial cost recovery (operating cost only)
Full subsidy (government-paid)
Others
64. Who decides water charges (e.g., irrigation fee)? ____________________________________
65. How often are water charges/prices revised (Please check)?
Frequency
Every year
Every 3 years
Every 5 years or more
Revised since ___ (state the year)
Not revised since organization was founded
66. How much is/are the fee(s)?(If in-kind, state quantity and estimated value)
Fees 1st cropping season: 2nd cropping season: 3rd cropping season:
ISF
Rice __ PhP __ PhP __ PhP
__ In kind __ In kind __ In kind
Other crops (specify) __ PhP __ PhP __ PhP
__ In kind __ In kind __ In kind
DCC/amortization
Rice __ PhP __ PhP __ PhP
__ In kind __ In kind __ In kind
Other crops (specify) __ PhP __ PhP __ PhP
__ In kind __ In kind __ In kind
Other fees collected
__ PhP __ PhP __ PhP
__ In kind __ In kind __ In kind
__ PhP __ PhP __ PhP
__ In kind __ In kind __ In kind
Collection System
67. Who prepares the billing? _______________________________________________________
68. Who collects the ISF from the farmers? ____
69. What percentage of total ISF target is actually collected (% collection rate)? ___ %
70. % of total IA members not able to pay irrigation service fee (% of delinquent farmers) _______
71. Reason for delinquency? _______________________________________________________
72. What is the penalty for delinquency? _____________________________________________
73. Is there any incentive to the members for paying on time? ___ Yes ___ No
73.1. If Yes, specify ___________________________________________________________
_______________________________________________________________________
74. Collection per year for loan amortization PhP_____
75. Who collects the loan amortization from the farmers? _________________________________
Page | 300
Assessing the Resurgent Irrigation Development Program of the
Philippines – Communal Irrigation Systems Component FINAL REPORT
76. Who collects the loan amortization from the IA? _____________________________________
77. % of total members not able to pay for loan amortization (% of delinquent farmers) __________
78. Reason for delinquency? _______________________________________________________
79. What is the penalty for delinquency? ______________________________________________
80. Is there any incentive to the members for paying on time? ___ Yes ___ No
80.1. If Yes, specify _________________________________________
81. Is there any incentive to the collector? ___ Yes ___ No
81.1. If Yes, specify _________________________________________
82. Rate your IA’s financial strength. (Rate from 0 – 4, with 4 being very strong) ______
4 – Completely and sufficiently self-sustaining.
3 – Completely and sufficiently financed.
2 – Underfinanced, but not badly.
1 – Inadequate, but enough funds to replace and maintain key structures. Insufficient funds to do
much of the basic maintenance needed.
0 –Inadequate to cover key structures and basic maintennace
83. What in-kind services or contributions are provided by water users (IA members/farmers)?
Item Frequency of in-kind
service Value/unit
Total
Value
Labor (specify, e.g., cleaning
canal) No. of mandays/year __ PhP/MD w/ meals ___
PhP/MD w/o meals
___
No. of times/year __
Construction Materials (specify) No. of times /year _
Others (specify) No. of times/year __
84. What percentage of farmers participates in the in-kind services? ________________________
85. Reason of members for not being able to participate ___________________
____________________________________________________________________________
____________________________________________________________________________
86. Rate IA performance of the following functions of IA
(4 – excellent; 3 – satisfactory; 2 – average; 1 – poor; 0 – very poor)
a. Distribution of water in its area __________________
b. Maintenance of canals __________________
c. Maintenance of control structures __________________
d. Construction of facilities in the area __________________
e. Collection of irrigation service fee __________________
f. Collection of other fees (specify) ______________________ __________________
g. Technical advice to farmers __________________
h. Others (specify) ___________________________________ __________________
87. Has the IA received any award related to its operation/performance? ___ Yes ___ No
a. If yes, specify __________________________________________________________
_______________________________________________________________________
_______________________________________________________________________
Page | 301
Assessing the Resurgent Irrigation Development Program of the
Philippines – Communal Irrigation Systems Component FINAL REPORT
88. Problems/issues encountered by the IAs and farmers in relation to the:
_____a. Operation and management (O&M) of the irrigation
_____b. Access to funds for rehabilitation (LGU, NIA, other government agencies)
_____c. Access to production credit (including providers)
_____d. Technical support from NIA, support services from the Department of Agriculture (DA)
_____e. Access to water (quantity and timeliness)
_____f. Others (specify) ________________________________________________________
F. Technical capacity
89. What data or information do you use for planning? ____________
90. How adequate and reliable are the data used for planning purposes? Please rate from a scale of 1 to 4,
with 4 being the most adequate/reliable.
Rate Don’t know
a) Adequacy
b) Reliability
91. Does your IA have an office/office space? ____ Yes ___ No
a. If yes, where is it located? ________________________________________________
92. Suggestions to address IA concerns ______________________________________________