Published on Plants in Action Home > Printer-friendly PDF > Printer-friendly PDF
Upload
khangminh22Category
view
0download
0
genesG C A T
T A C G
G C A T
Article
PIDS: A User-Friendly Plant DNA FingerprintDatabase Management System
Bin Jiang, Yikun Zhao, Hongmei Yi, Yongxue Huo, Haotian Wu, Jie Ren, Jianrong Ge, Jiuran Zhaoand Fengge Wang *
Maize Research Center, Beijing Academy of Agriculture and Forestry Sciences/Beijing Key Laboratory of MaizeDNA Fingerprinting and Molecular Breeding, Beijing 100097, China; [email protected] (B.J.);[email protected] (Y.Z.); [email protected] (H.Y.); [email protected] (Y.H.); [email protected] (H.W.);[email protected] (J.R.); [email protected] (J.G.); [email protected] (J.Z.)* Correspondence: [email protected]; Tel.: +86-1362-111-8475
Received: 19 February 2020; Accepted: 29 March 2020; Published: 30 March 2020�����������������
Abstract: The high variability and somatic stability of DNA fingerprints can be used to identifyindividuals, which is of great value in plant breeding. DNA fingerprint databases are essentialand important tools for plant molecular research because they provide powerful technical andinformation support for crop breeding, variety quality control, variety right protection, and molecularmarker-assisted breeding. Building a DNA fingerprint database involves the production of largeamounts of heterogeneous data for which storage, analysis, and retrieval are time and resourceconsuming. To process the large amounts of data generated by laboratories and conduct qualitycontrol, a database management system is urgently needed to track samples and analyze data. Wedeveloped the plant international DNA-fingerprinting system (PIDS) using an open source web serverand free software that has automatic collection, storage, and efficient management functions based onmerging and comparison algorithms to handle massive microsatellite DNA fingerprint data. PIDS alsocan perform genetic analyses. This system can match a corresponding capillary electrophoresis imageon each primer locus as fingerprint data to upload to the server. PIDS provides free customization andextension of back-end functions to meet the requirements of different laboratories. This system canbe a significant tool for plant breeders and can be applied in forensic science for human fingerprintidentification, as well as in virus and microorganism research.
Keywords: microsatellites; database; DNA fingerprint; algorithms; genotyping
1. Introduction
DNA fingerprints have multi-loci, high variability, and simple and stable inheritance, and haveattracted much attention because of their great practical value [1,2]. The high variability and somaticstability of DNA fingerprints can be used to identify individuals, which is of great value in determiningkinship among individuals and in forensics to identify criminals [3–6]. In other applications, DNAfingerprints can provide accurate identification at the varieties level [7–9], and play important roles inplant breeding [10–12]. DNA fingerprints are also commonly used in research on animal evolutionarytrends and animal varieties identification [8,13].
Simple sequence repeats (SSRs) are molecular markers that have the advantages of simplicity,rapidity, high repeatability, and abundant polymorphisms [14–16]. SSRs have been used successfully toconstruct DNA fingerprints that are used widely in plant genetic studies and crop breeding [9,11]. Theidentification of varieties relies heavily on accurate plant genotype indicators to ensure the genetic andphysiological consistency of improved crop varieties [17]. Compared with traditional field planting
Genes 2020, 11, 373; doi:10.3390/genes11040373 www.mdpi.com/journal/genes

Genes 2020, 11, 373 2 of 15
identification, the analysis of SSR fingerprints avoids environmental interference and can quickly andaccurately identify varieties without the restrictions of growth and development times [18–20].
DNA fingerprints can be managed systematically by a computer, and can be organized in DNAfingerprint databases [21]. DNA fingerprint databases are essential and important tools for plantmolecular research because they provide powerful technical and information support for crop breeding,variety quality control, variety right protection, and molecular marker-assisted breeding [22,23].Building a DNA fingerprint database involves the production of large amounts of heterogeneous datafor which storage, analysis, and retrieval are time and resource consuming [24–27]. Some biologicaldata management software has been developed. For example, SLIMS can organize, store, and accesssample information [28]; AutoLabDB provides database schema to support automated laboratories [29];and TheSNPpit can manage large amounts of multi-panel SNP genotype data [30].
However, no automatic management system for plant SSR fingerprints from “experiment tostorage to fingerprint audit to analysis” is available, and no database management system for plantSSR fingerprint development has been reported so far. The construction of an SSR fingerprint databasefor plant varieties is particularly difficult for a number of reasons. First, plant variety is a concept thatcan have different meanings. For example, plant DNA fingerprint databases can have two samplingmethods, mixed and individual samples, which is unlike a human DNA fingerprint database, whichwill have only individual samples [1,3,4,9]. Therefore, a management system of plant DNA fingerprintdata must be able to merge the fingerprints of multiple individual samples, individual and mixedsamples, and mixed samples [9,10,30]. Second, plant varieties tend to have poor consistency betweenindividual samples [9,10]. When collecting DNA fingerprints of mixed samples, it is difficult to describehigh and low peaks, and three or multiple peaks quantitatively because of the low consistency ofsamples. Therefore, the image of a DNA fingerprint is very important, so after collecting the fingerprintdata, it is necessary to upload and maintain a large database of fingerprint images (gel electrophoresisor capillary electrophoresis (CE) image on each primer locus). Third, to select primers for the SSRfingerprint database, high polymorphism was considered as an important selection index, so a largenumber of primers of the 2-bp repeat type were selected. Because the difference between alleles issmall, a naming scheme based on the number of repeats cannot be used when collecting the originaldata. Therefore, alleles need to be named according to segment size, which can lead to data readingerrors of 1–2 bp. To reduce the influence of data acquisition error, a base offset parameter needs to beintroduced into data merge and comparison algorithms. Finally, large numbers of SSR primers arecommonly used to establish crop variety databases, and a composite amplification system has not yetbeen developed. Therefore, it is not possible to build a DNA fingerprint database for plants with only agroup of panels, as has been done for humans. Instead, multiple panels are needed to complete a plantDNA fingerprint database. This raises the problem of how to combine data in multiple panels intodata similar to a group of panels to facilitate the management and query of test information. Finally,the current biological data management systems do not solve the fingerprint processing problem ofdata from repeated experiments. Therefore, the development of a suitable plant variety SSR fingerprintdatabase management system is very necessary.
In this paper, we describe the Plant International DNA-Fingerprinting System (PIDS) that wedeveloped to solve the problems created by the situations described in the previous paragraph.PIDS has automatic collection, storage, and efficient management functions based on merging andcomparison algorithms to handle massive amounts of fingerprint data, and the system can also performgenetic analyses. PIDS is available online at https://ssr.PIDS.online:8445/ssr. This system can match acorresponding CE image on each primer locus as fingerprint data to upload to the server. For morethan five years, PIDS has been used widely by 20 institutions, including the China National RiceResearch Institute, the Chinese Academy of Agricultural Sciences, and the Development Center forScience and Technology (China), and has proved to be a stable efficient system for sharing data and theresults of genetic analyses.

Genes 2020, 11, 373 3 of 15
2. Materials and Methods
2.1. System and Database Schema
In genotyping experiments of individual and population samples, representative fingerprintdata should be screened out from the fingerprints of multiple parallel experiments performedby different experimenters and/or from multiple repeated experiments performed by a singleexperimenter. Therefore, PIDS constructs a hierarchical weighted tree structure (experiment–DNA–experimenter–sample) that is used to quantify and reflect the impact of different experiment stageson the quality of the automated integrated DNA fingerprint data, so as to accurately evaluate andselect the best DNA fingerprint, while avoiding manual data errors. This method uses an automatedoptimal typing and selection algorithm based on DNA fingerprint literal data. For any problematicdata, manual verification and genotype reselection is used to generate DNA fingerprint data that meetexperimental requirements. In this way, unreliable genotype data that could interfere with the finalDNA fingerprint are avoided, so as to improve the efficiency of the whole data integration processingand reduce the occurrence of errors.
The PIDS schema contains hierarchical permission structures that limit the query and operationrights of fingerprint data as follows. An experimenter can query and operate their own uploadedfingerprint data, but cannot access data from others; and after an experimenter uploads a SampleInformation Table (SIT) to clarify which samples he/she is responsible for, then the experimenter is ableto query and audit the sample fingerprints (in the SIT) from multiple parallel experiments submittedby different experimenters.
The fingerprint data are stored in different fingerprint databases according to their differentpurposes and functions as follows. Experimental Fingerprint Database (EFD): An experimenter canupload an Excel file, GeneMapper output file, and project file into the EFD. Original fingerprintinformation is recorded and can be queried and traced. Every piece of fingerprint data in the EFD mustbe audited through the Fingerprint Merging Algorithm by the experimenter before the fingerprintdata are submit automatically to the Sample Fingerprint Database (SFD). This merging algorithm cansolve the problem of fingerprint duplication in multiple experiments of a single experimenter andreduce experimental errors. This design also ensures the integrity of data and avoids the absenceof loci data. Sample Fingerprint Database (SFD): An experimenter can audit the sample fingerprintdata (in the SIT) from the EFD. After the data are audited and confirmed by the experimenter, a setof sample fingerprints are generated and submitted automatically to the Local Fingerprint Database(LFD) using the Fingerprint Merging Algorithm. By merging the audited data, any artificial errorscaused by different experimenters can be reduced. The two layers of data audit and merge (EFD–SFDand SFD–LFD) achieve sufficient quality assurance of the experimental results data. Local FingerprintDatabase (LFD): The LFD can be used for fingerprint data comparisons and reports. A locking functionis provided and, once locked, the data cannot be changed.
PIDS can track DNA samples through workflows, which allows users to trace back to GE and CEfiles (CE image on each primer locus). Users can also query the sample sources.
2.2. Fingerprint Merging and Comparison Algorithms
2.2.1. Fingerprint Merging Algorithm
The procedure used in the Fingerprint Merging Algorithm is shown in Figure 1. The data mergingdirection is “experiment→ DNA→ experimenter→ sample→ variety”, with the aim of achievingoptimal selection and generating the final fingerprint data step by step. Four layers and four parametersare defined (Figure 1). The four layers are experiment, DNA, experimenter, and sample. The fourparameters are defined as: i, which indicates the number of experiments performed for the currentDNA sample by the same experimenter; j, which indicates the number of copies of DNA extracted bythe current experimenter from one sample; k, which indicates the number of experimenters assigned

Genes 2020, 11, 373 4 of 15
to current samples; and m, which indicates the number of samples for the current variety. To treat eachsample as an independent variety, m is set as 1.
Genes 2020, 11, x FOR PEER REVIEW 4 of 16
experimenters assigned to current samples; and m, which indicates the number of samples for the current variety. To treat each sample as an independent variety, m is set as 1.
Figure 1. Schematic representation of the Fingerprint Merging Algorithm.
The algorithm distinguishes the weight of each group of fingerprint data by merging fingerprints step by step, reflects the stage of each fingerprint, and traces the source of fingerprint data errors through each layer by setting weights as follows. The sample layer reflects the differences among different batches of samples and the weight is set as 1. The experimenter layer reflects the data analysis of several experimenters and the weight is set as 1/n. The DNA layer reflects the experimental operation of an experimenter and the weight is set as 1/m. The experiment layer reflects the state of the instrument and the sampling and the weight is set as 1/k. Therefore, the weight accumulation of hierarchical merging preliminarily reflects the qualities of the experiment, instrument, and data analysis of the sample fingerprint. The default base offset during merging is: |x| 2bp (1)
The Fingerprint Merging Algorithm has two categories: peer fingerprint merging and cross-layer fingerprint merging. Peer fingerprint merging refers to the locus-by-locus comparison of multiple sets of data in the same layer. The genotype is retained into the merged result if it is the same among the different datasets, otherwise only the genotype that occurs most frequently is retained.
Cross-layer fingerprint merging is performed as follows: 1. Assign the fingerprint data of the i round of the same DNA solution Ai with the same weight
of 1/(i × j × k × m), then perform peer layer fingerprint merging at the experiment layer to obtain the merged fingerprint B of the experiment layer.
2. Assign the merged fingerprint Bj from different DNA solutions of the same sample performed by the same experimenter the same weight of 1/(j × k × m), then perform peer fingerprint merging at the DNA layer to obtain the merged fingerprint C of the DNA layer.
3. Assign the merged fingerprint at the DNA layer Ck of the same sample conducted by different experimenters with the same weight of 1/(k × m), then perform peer layer fingerprint merging at the experimenter layer to obtain the merged fingerprint D of the experimenter layer.
4. Assign the merged fingerprint at the experimenter layer Dm of different samples of the same variety with the same weight of 1/m, then perform peer layer fingerprint merging at the sample layer to obtain the final merged fingerprint of the sample layer, which represents the standard fingerprint of a variety.
5. The cross-layer fingerprint merging is finished. A variety can be represented by multiple samples, and generally a standard DNA fingerprint
database can be constructed using only one of the most authoritative samples to represent one variety. For example, in the DNA fingerprint database of maize, the sample layer reflects the differences among different batches of samples, the experimenter layer reflects the differences of the data analysis layers of several experimenters, the DNA layer reflects the experimental operation layer of the experimenter, and the experiment layer reflects the state of the instruments and sampling methods used. Therefore, through the weight accumulation of hierarchical merging, the quality of the sample fingerprint experiments, instruments, and data analysis can be preliminarily reflected. To
Figure 1. Schematic representation of the Fingerprint Merging Algorithm.
The algorithm distinguishes the weight of each group of fingerprint data by merging fingerprintsstep by step, reflects the stage of each fingerprint, and traces the source of fingerprint data errorsthrough each layer by setting weights as follows. The sample layer reflects the differences amongdifferent batches of samples and the weight is set as 1. The experimenter layer reflects the dataanalysis of several experimenters and the weight is set as 1/n. The DNA layer reflects the experimentaloperation of an experimenter and the weight is set as 1/m. The experiment layer reflects the state ofthe instrument and the sampling and the weight is set as 1/k. Therefore, the weight accumulationof hierarchical merging preliminarily reflects the qualities of the experiment, instrument, and dataanalysis of the sample fingerprint. The default base offset during merging is:
|x| < 2bp (1)
The Fingerprint Merging Algorithm has two categories: peer fingerprint merging and cross-layerfingerprint merging. Peer fingerprint merging refers to the locus-by-locus comparison of multiple setsof data in the same layer. The genotype is retained into the merged result if it is the same among thedifferent datasets, otherwise only the genotype that occurs most frequently is retained.
Cross-layer fingerprint merging is performed as follows:1. Assign the fingerprint data of the i round of the same DNA solution Ai with the same weight of
1/(i × j × k × m), then perform peer layer fingerprint merging at the experiment layer to obtain themerged fingerprint B of the experiment layer.
2. Assign the merged fingerprint Bj from different DNA solutions of the same sample performedby the same experimenter the same weight of 1/(j × k ×m), then perform peer fingerprint merging atthe DNA layer to obtain the merged fingerprint C of the DNA layer.
3. Assign the merged fingerprint at the DNA layer Ck of the same sample conducted by differentexperimenters with the same weight of 1/(k ×m), then perform peer layer fingerprint merging at theexperimenter layer to obtain the merged fingerprint D of the experimenter layer.
4. Assign the merged fingerprint at the experimenter layer Dm of different samples of the samevariety with the same weight of 1/m, then perform peer layer fingerprint merging at the sample layerto obtain the final merged fingerprint of the sample layer, which represents the standard fingerprint ofa variety.
5. The cross-layer fingerprint merging is finished.A variety can be represented by multiple samples, and generally a standard DNA fingerprint
database can be constructed using only one of the most authoritative samples to represent one variety.For example, in the DNA fingerprint database of maize, the sample layer reflects the differences amongdifferent batches of samples, the experimenter layer reflects the differences of the data analysis layersof several experimenters, the DNA layer reflects the experimental operation layer of the experimenter,and the experiment layer reflects the state of the instruments and sampling methods used. Therefore,through the weight accumulation of hierarchical merging, the quality of the sample fingerprintexperiments, instruments, and data analysis can be preliminarily reflected. To reflect the weight

Genes 2020, 11, 373 5 of 15
of each layer objectively and truthfully, at the laboratory management layer it should be stipulatedthat different experimenters should not cross-use the same DNA sample and different DNA samplesextracted by the same experimenter must be labeled differently, otherwise the system will process themas different repeats of the same DNA. Multiple DNA samples extracted by the same experimenter froma single plant are considered as one repeat regardless of the different DNA numbers.
2.2.2. Fingerprint Comparison Algorithm
Suppose, for a particular crop, two sets of DNA fingerprint data are ready to be compared. Theyare the pending fingerprint data in queue f(n) and the comparison fingerprint data in queue f(m),where n(n > 0) and m(m > 0) indicate how many DNA fingerprints are in each queue, and eachfingerprint is set to contain p(p > 0) loci data. If the number of different loci between the fingerprintsin the two queues is D, the number of non-different loci is S, and the number of missing loci is M, thenthe relationship among them is:
p = D + S + M (2)
This equation represents the basic information obtained after a fingerprint comparison. Thedifference between a fingerprint pair (pending and comparison) can be obtained by defining theproportions of the different loci as:
x =Dp
, x ∈ (0, 1) (3)
This equation indicates that the larger the x value is, the greater is the genotyping differencebetween a fingerprint pair. This value plays an extremely important role in determining the report andother conclusions.
The basic definitions of different loci, non-different loci, and missing loci points are as follows:1. Number of different loci (D): The total number of differences between the data of two valid loci
at the same locus of a fingerprint pair. A threshold value is usually set for the number of different locito limit the number of comparisons within the expected difference range.
2. Number of missing loci (M): The number of effective loci at the same locus of a fingerprint pairis less than the total number of 2.
3. Number of non-different loci (S): The total number of non-different loci between two valid lociat the same locus of a fingerprint pair. This number can be derived from Equation (2).
Different comparison methods are needed to adapt to different needs. In the FingerprintComparison Algorithm, different conditions are used to adjust the comparison methods and the defaultlimit range of the fingerprint data (the fingerprint data that can be used when the fingerprint datarange is not specified) needs to be set. If the range of fingerprint data is not specified, the followingequation is applied: homonymy + non-homonymy = the entire database. The conditions that need tobe specified are listed in Table 1.
Table 1. Conditions to be specified for the Fingerprint Comparison Algorithm.
Comparison Method Default Fingerprint Data Range
Database Comparison Entire Local Fingerprint Database
Homonymy Comparison Fingerprints of the same name or synonyms within the entire LocalFingerprint Database
Non-homonymy Comparison Fingerprints with different names and synonyms within the entire LocalFingerprint Database
Sub-Database Comparison Assigned through Excel
Paired Comparison Assigned through Excel
The functions of the parameters required in the Fingerprint Comparison Algorithm are describedin Table 2.

Genes 2020, 11, 373 6 of 15
Table 2. Parameters required in the Fingerprint Comparison Algorithm.
Condition Description
Number ofcomparison loci
To control the matching of locus between different fingerprints, value: X ≥ 0. Thisparameter is used in the Fingerprint Comparison Algorithm, proper control of avalue can reduce invalid comparison to improve fingerprint comparison speed,
the default value of min(X) is 20.
Number ofdifferential loci
To control the locus difference between samples, which used in the FingerprintComparison Algorithm to filter the comparison results. Proper control of a value
can reduce the display of useless results, the range of X is ≥0, and the defaultvalue of max(X) is 20.
Percentage ofdifferential loci
To control the degree of difference between samples, the range of X is 0 ≤ X ≤ 1,detail descriptions can be found in the mixed strain comparison algorithm. The
default value of max(X) is 0.05.
Base offset To control the difference between the two loci, the range of X is 0 bp ≤ X ≤ 2 bp.The default MaxX is 2 bp. This parameter is used in the comparison algorithm.
The pseudocodes for the algorithms are:
Algorithm 1: GCA
Input: [a1,b1] as loci 1, [a2,b2] as loci 2, a1/a2 is the first data of diploid, b1/b2 is the lastdata of diploid, the different offset allowed is named nresult = 1 # initialized as not sameconditionR1 = abs(a1 - a2) ≤ nconditionR2 = abs(b1 - b2) ≤ nconditionR3 = abs(a1 - b2) ≤ nconditionR4 = abs(a2 - b1) ≤ nif (conditionR1 and conditionR2) or (conditionR3 and conditionR4)result = 0end ifreturn resultOutput: 0-> two loci are same; 1-> two loci are different
Algorithm 2: FCPP
Input: queue f1 of length n, queue f2 of length m, f1 and f2 should have same number ofloci, named as pInitialize compareResult array as size m*nfor i = 1 to m
for j = 1 to ndiffCount = 0
for k = 1 to pdiffCount=diffCount+GCA(f1[j][p]+f2[i][p])
end forcompareResult.append([f1[j], f2[i], diffCount])
end forend forreturn compareResultOutput: compareResult
2.3. System and Database Implementation
PIDS was developed over two years of continuous use and has evolved in parallel with theautomation of biological experiments. PIDS is implemented on a Tomcat server (The Apache SoftwareFoundation, Wakefield, MA, USA). The system uses browser/server (B/S) architecture combined withJava and J2EE technologies. The MySQL web server (Oracle Corporation, Redwood Shores, CA, USA)

Genes 2020, 11, 373 7 of 15
is used for database storage. PIDS is flexible and can be expanded to accommodate multiple detectiontechniques (e.g., SNPs, indels) and for storage and analysis of multiple fingerprint data. This system iscompatible with fingerprint data for DNA testing of all plant varieties. It can switch crop modules tobuild a DNA fingerprint database for a crop of interest. PIDS covers both individual detection andgroup detection, so it can be extended to DNA detection and genotyping applications in animals andmicroorganisms. This system has great universal adaptability and stable application effects.
3. Results
3.1. System Modules and Functionality
The core functions of PIDS include data generation, data storage, data audit, and data analysis. Byproviding automatic data generation, storage, audit, and rapid comparison functions, it can replace theprevious methods of manually entering data into the database and manually comparing and mergingdata. Only a small amount of data needs to be corrected manually, namely data that the algorithmcannot automatically determine, to achieve the target of rapid processing of DNA fingerprint data.The data generation function in PIDS is divided into two parts, experimental information processingand fingerprint data analysis processing. These two parts correspond to the phases before and aftera complete experiment, namely the experimental phase and the data analysis phase. Thus, PIDSprovides comprehensive data analysis auxiliary functions for the experimenter, simplifies the oftendifficult data analysis phase, improves the quality of data analysis, and provides the basis for theanalysis of mass fingerprint data. The modular structure of PIDS is shown in Figure 2.Genes 2020, 11, x FOR PEER REVIEW 8 of 16
Figure 2. Modular structure of plant international DNA-fingerprinting system (PIDS), including the workflows between the modules and functions. PIDS covers three core fingerprint databases and the data transfer relationship between them. Modules 5 and 6 perform the core functions of identification and data analysis. The workflows ensure that the entire experiment and data analysis is a closed loop process. When problems occur, they can be solved by supplementary experiments or reanalysis, which can improve the efficiency of the data transfer process.
PIDS can guide and assist users in completing genotyping experiments. Users can enter a project name to begin. The plate table holds information about specific plates (each with a unique barcode), so they can be individually tracked and the results recorded. The information in the plate table includes monitoring and allocating DNA sample locations in plates, loci/loci groups, panel, alleles, genotypes, upper template, PCR plate, electrophoresis plate, and primer information. Users can also upload capillary electrophoresis (CE) output files. Three types of data files can be uploaded: project file, Excel file, and GeneMapper output file. Project files need to be generated using the SSR Analyser software (downloadable free from https://ssr.PIDS.online:8445/ssr). This software can match a corresponding CE image on each primer locus as fingerprint data to upload to the server, and PIDS will automatically bind and store the image and primer locus. SSR Analyser runs on a Windows system that is automatically connected to the web services when opened from PIDS. For Excel files, PIDS provides an export format template file that can be used to generate data in the specified format.
PIDS uses Spring Web Services to handle incoming data files. The standard WSDL file is used to describe the related information Service interfaces and parameters. It contains the invocation
Figure 2. Modular structure of plant international DNA-fingerprinting system (PIDS), including theworkflows between the modules and functions. PIDS covers three core fingerprint databases and thedata transfer relationship between them. Modules 5 and 6 perform the core functions of identificationand data analysis. The workflows ensure that the entire experiment and data analysis is a closed loopprocess. When problems occur, they can be solved by supplementary experiments or reanalysis, whichcan improve the efficiency of the data transfer process.

Genes 2020, 11, 373 8 of 15
PIDS can guide and assist users in completing genotyping experiments. Users can enter a projectname to begin. The plate table holds information about specific plates (each with a unique barcode), sothey can be individually tracked and the results recorded. The information in the plate table includesmonitoring and allocating DNA sample locations in plates, loci/loci groups, panel, alleles, genotypes,upper template, PCR plate, electrophoresis plate, and primer information. Users can also uploadcapillary electrophoresis (CE) output files. Three types of data files can be uploaded: project file, Excelfile, and GeneMapper output file. Project files need to be generated using the SSR Analyser software(downloadable free from https://ssr.PIDS.online:8445/ssr). This software can match a corresponding CEimage on each primer locus as fingerprint data to upload to the server, and PIDS will automatically bindand store the image and primer locus. SSR Analyser runs on a Windows system that is automaticallyconnected to the web services when opened from PIDS. For Excel files, PIDS provides an export formattemplate file that can be used to generate data in the specified format.
PIDS uses Spring Web Services to handle incoming data files. The standard WSDL file is usedto describe the related information Service interfaces and parameters. It contains the invocationspecifications for the interfaces of three services (storage of fingerprint data, storage of image andpanel file download). The WSDL file can be accessed at http://ssr.pids.online:6060/SsrDatasService/
geneUpload.wsdl. For users who have technical problems trying to call this interface, we have providedan e-mail address where we can be contacted for help. We will consider providing an example to helpusers make smooth calls to the interface.
The Fingerprint Comparison Algorithm is applied to complete the comparison between thesource and target fingerprints, which can reveal differences, missing, or no differences betweenfingerprints. PIDS focuses on the core identification function, including authenticity identification,purity identification, and paternity testing. It also has a genetic analysis function that allows users toperform genetic clustering and heterosis group analyses of their uploaded data.
PIDS has an identity authentication function when uploading, which prevents illegal datastorage. Uploaded data can be viewed, downloaded, and printed. PIDS also generates reportsfor varieties identification and genetic analysis results. Users can perform genetic cluster analysison the uploaded data with 12 genetic algorithms. PIDS also can produce common cluster treeimages. The PIDS website provides users with detailed and comprehensive user guides. The detaileddescription of the examples is described in the PIDS User Manual and can be downloaded fromhttps://ssr.pids.online:8445/ssr/sys/cms/files/download/6ec27a20252811ea2a6c538bc13df1b6 and theSSR Analyser User Manual can be downloaded from https://ssr.pids.online:8445/ssr/sys/cms/files/download/1a1b5ed011bd11e4b2a205874e1ede97).
3.2. System Model
PIDS was constructed using a relational database. The database is implemented based on thecurrent mainstream open source software MySQL. Figure 3 shows the entity relationship model (ERD)and the class table model in PIDS. Using Chen’s ERD notation to represent the ERD [31], we firstidentified 10 entities and four relationships (Figure 3A). A table-like model is constructed based onthe ERD (Figure 3B). The “PCR plate” and “CE plate” entities shown in Figure 3A are each split intotwo tables, “PCR” and “PCR_well”, and “CE” and “CE_well” as shown in Figure 3B. These tables areused to include additional information to describe the wells in the plate and to accurately locate them.All the entities are related by the source of the sample and associated with basic information such asprimers, panels, and detection equipment to build a complete fingerprint data information system.

Genes 2020, 11, 373 9 of 15Genes 2020, 11, x FOR PEER REVIEW 10 of 16
(A)
(B)
Figure 3. Entity relationship and class table models in PIDS. (A) Entity relationship model diagram (ERD) based on Chen’s ERD notation. The rectangular boxes indicate entities; ellipses indicate properties of the entities; and diamonds indicate relationships between entities. LFD, Local Fingerprint Database; SFD, Sample Fingerprint Database; EFD, Experimental Fingerprint Database. (B) Table-like model diagram based on the ERD. The top of each box contains the table name. Primary key (PK) indicates a primary key. Foreign key (FK) indicates a foreign key to another table and is indicated by an arrow.
3.3. System Access
Figure 3. Entity relationship and class table models in PIDS. (A) Entity relationship model diagram(ERD) based on Chen’s ERD notation. The rectangular boxes indicate entities; ellipses indicate propertiesof the entities; and diamonds indicate relationships between entities. LFD, Local Fingerprint Database;SFD, Sample Fingerprint Database; EFD, Experimental Fingerprint Database. (B) Table-like modeldiagram based on the ERD. The top of each box contains the table name. Primary key (PK) indicates aprimary key. Foreign key (FK) indicates a foreign key to another table and is indicated by an arrow.
The whole DNA fingerprint database contains basic information, experimental information, andfingerprint data information. These data are referenced to each other by IDs or bar code numbers.To solve the problem that fingerprint data are compatible with different crop primers, PIDS storesfingerprint data and fingerprint image information in independent files. The fingerprint data file isassociated with the storage path information of the fingerprint image, and then the fingerprint datafile path information is stored in the basic information table of fingerprint data. When loading andupdating fingerprint data and fingerprint images, only new information needs to be written into thefingerprint data file. This approach avoids the problem of slow operations such as queries that use adatabase to store a large amount of binary data. Further, the fingerprint data and fingerprint imageinformation are stored with greater freedom, and the DNA fingerprint database can be backed up andrestored more quickly.

Genes 2020, 11, 373 10 of 15
3.3. System Access
The PIDS interface focuses on simplicity as the basic design element. Front-end Web pagesare built based on the open source UI framework Bootstrap3 (https://www.bootcss.com/) and someexcellent open source JavaScript plug-ins have been incorporated to display page data to achieve thebest user experience. In the basic process of PIDS, each operation step generally corresponds to a databatch import function to facilitate the completion of various key data warehousing operations. Exceland CSV are two common data formats in the whole system, which ensures fast data processing speeds.
As shown in Figure 4A, users can first click on the “Template” button to download a data sampletemplate, and then write their self-organized data into this file according to the template requirements.When complete, the file can be imported into the system using the “Upload” or “Save” button. Byfollowing the basic steps shown in Figure 4A and the sequence of importing experimental datadescribed in the PIDS user manual, users can complete the design process, including experimentdesign, data analysis, fingerprint and fingerprint image storage, fingerprint data viewing, and variousidentification and data analysis functions.
Genes 2020, 11, x FOR PEER REVIEW 11 of 16
The PIDS interface focuses on simplicity as the basic design element. Front-end Web pages are built based on the open source UI framework Bootstrap3 (https://www.bootcss.com/) and some excellent open source JavaScript plug-ins have been incorporated to display page data to achieve the best user experience. In the basic process of PIDS, each operation step generally corresponds to a data batch import function to facilitate the completion of various key data warehousing operations. Excel and CSV are two common data formats in the whole system, which ensures fast data processing speeds.
As shown in Figure 4A, users can first click on the “Template” button to download a data sample template, and then write their self-organized data into this file according to the template requirements. When complete, the file can be imported into the system using the "Upload" or "Save" button. By following the basic steps shown in Figure 4A and the sequence of importing experimental data described in the PIDS user manual, users can complete the design process, including experiment design, data analysis, fingerprint and fingerprint image storage, fingerprint data viewing, and various identification and data analysis functions.
Figure 4. The PIDS interface and representative workflows. (A) Users can import the sample information table and DNA information table of the experiment, and automatically create PCR and electrophoresis plates according to the given condition parameters. (B) Users can print the automatically generated electrophoresis plate hole position information table for actual DNA detection experiments. (C) Users can view the fingerprint data and map information submitted for
Figure 4. The PIDS interface and representative workflows. (A) Users can import the sampleinformation table and DNA information table of the experiment, and automatically create PCR andelectrophoresis plates according to the given condition parameters. (B) Users can print the automaticallygenerated electrophoresis plate hole position information table for actual DNA detection experiments.(C) Users can view the fingerprint data and map information submitted for storage. (D) Users canenter comparison condition parameters and view detailed information of the comparison results. (E)Users can enter genetic analysis parameters and generate a chart of genetic analysis related results.
PIDS uses a standardized experimental design process (Figure 4A), so that experimenters have aunified experimental design language to communicate and understand each other. Further, the basicidea of “design before experiment”, ensures that all the experiments are adequately prepared andfully designed, and experimenters only need to carry out the experiment according to the printed
Genes 2020, 11, 373 11 of 15
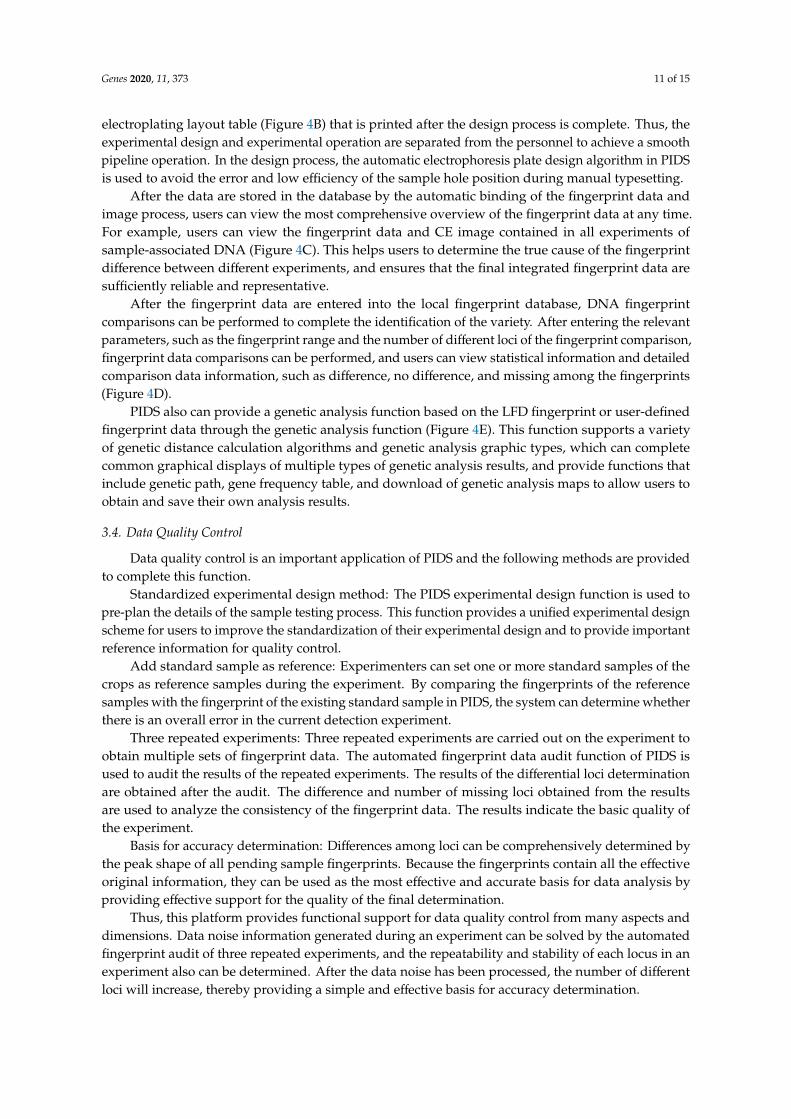
electroplating layout table (Figure 4B) that is printed after the design process is complete. Thus, theexperimental design and experimental operation are separated from the personnel to achieve a smoothpipeline operation. In the design process, the automatic electrophoresis plate design algorithm in PIDSis used to avoid the error and low efficiency of the sample hole position during manual typesetting.
After the data are stored in the database by the automatic binding of the fingerprint data andimage process, users can view the most comprehensive overview of the fingerprint data at any time.For example, users can view the fingerprint data and CE image contained in all experiments ofsample-associated DNA (Figure 4C). This helps users to determine the true cause of the fingerprintdifference between different experiments, and ensures that the final integrated fingerprint data aresufficiently reliable and representative.
After the fingerprint data are entered into the local fingerprint database, DNA fingerprintcomparisons can be performed to complete the identification of the variety. After entering the relevantparameters, such as the fingerprint range and the number of different loci of the fingerprint comparison,fingerprint data comparisons can be performed, and users can view statistical information and detailedcomparison data information, such as difference, no difference, and missing among the fingerprints(Figure 4D).
PIDS also can provide a genetic analysis function based on the LFD fingerprint or user-definedfingerprint data through the genetic analysis function (Figure 4E). This function supports a varietyof genetic distance calculation algorithms and genetic analysis graphic types, which can completecommon graphical displays of multiple types of genetic analysis results, and provide functions thatinclude genetic path, gene frequency table, and download of genetic analysis maps to allow users toobtain and save their own analysis results.
3.4. Data Quality Control
Data quality control is an important application of PIDS and the following methods are providedto complete this function.
Standardized experimental design method: The PIDS experimental design function is used topre-plan the details of the sample testing process. This function provides a unified experimental designscheme for users to improve the standardization of their experimental design and to provide importantreference information for quality control.
Add standard sample as reference: Experimenters can set one or more standard samples of thecrops as reference samples during the experiment. By comparing the fingerprints of the referencesamples with the fingerprint of the existing standard sample in PIDS, the system can determine whetherthere is an overall error in the current detection experiment.
Three repeated experiments: Three repeated experiments are carried out on the experiment toobtain multiple sets of fingerprint data. The automated fingerprint data audit function of PIDS isused to audit the results of the repeated experiments. The results of the differential loci determinationare obtained after the audit. The difference and number of missing loci obtained from the resultsare used to analyze the consistency of the fingerprint data. The results indicate the basic quality ofthe experiment.
Basis for accuracy determination: Differences among loci can be comprehensively determined bythe peak shape of all pending sample fingerprints. Because the fingerprints contain all the effectiveoriginal information, they can be used as the most effective and accurate basis for data analysis byproviding effective support for the quality of the final determination.
Thus, this platform provides functional support for data quality control from many aspects anddimensions. Data noise information generated during an experiment can be solved by the automatedfingerprint audit of three repeated experiments, and the repeatability and stability of each locus in anexperiment also can be determined. After the data noise has been processed, the number of differentloci will increase, thereby providing a simple and effective basis for accuracy determination.

Genes 2020, 11, 373 12 of 15
We prepared three sets of repeated experimental data for a maize hybrid sample; two of the setsare consistent and the other set is noise data. We uploaded the three sets of data to the PIDS systemand carried out an automated fingerprint data audit through the menu functions “Experiment” and“Experiment Audit”. We found that when the number of experiments was an odd number, using < 40%of the noise data did not cause adverse effects and the number of effective data loci did not reduce,whereas using ≥40% of the noise data caused differences in loci and missing data. The proportion ofnoise data can be adjusted, but because PIDS uses statistical methods to obtain the most consistentgenotype of each locus, to ensure the noise data does not adversely affect the results, 40% noise data isset as the maximum threshold boundary for determining effective data.
4. Discussion
PIDS can process large amounts of DNA fingerprint data and perform quality control, whichis urgently needed to track samples and analyze data. The extension of back-end functions wasdeveloped to meet the requirements of different laboratories. Currently, PIDS can support a varietyof crops, including maize, rice, soybean, cotton, and other major food crops. PIDS also can supporthuman and microbial DNA fingerprint data management and analysis. The functions of PIDS can beexpanded according to the target samples studied. PIDS is potentially an efficient DNA fingerprintmanagement platform that can be used for crop breeding research, variety protection, and research inthe fields of medicine, crime, and microbiology. Although the primers used for different species will bedifferent, the requirements for a DNA fingerprint database are similar [21,22]. Species type fields canbe added to the sample information table to distinguish samples. Because all the markers are speciesspecific, to ensure that the naming of the marker sites of different species do not conflict, a speciestype field is added to the marker information table to distinguish the markers. The same fingerprintdatabase management system can be used for cotton and other polyploid species [9]. If the adoptedmarkers have homologs on different chromosomes, the filtering algorithm of the SSR Analyzer and thestructure of the fingerprint database management system will need to be adjusted.
In future updates, PIDS will be modified to support a variety of markers, including SSRs, SNPs,and indels. A marker type field will need to be added to the marker information table to distinguishthe different markers, and the similarities and differences of different marker structures will need to beconsidered when designing the database structure. For example, for diploid species, only 1–2 allelescan be collected during data collection, but the alleles can be named according to the characteristics ofthe different markers. SSR markers can be named according to the size of the allele fragment, indelmarkers can be named according to the deletions/insertions as A and B, and SNP markers can be namedaccording to the single base at the mutation position. For indel and SNP markers, a polyacrylamidegel electrophoresis (PAGE) detection platform can be used to manually collect data, which can beimported into the database as an Excel file. Fluorescent scanning solutions, such as chip detectionplatforms, also can be used. SNP markers need special tail sequences when used on electrophoresisdetection platforms, whereas indel markers are relatively easy to use. When indel and SNP markersare created, there are still requirements for parallel experiments and layer upon layer merging.
Compatible platforms for PIDS are mainly PAGE and fluorescent capillary electrophoresisplatforms. The compatibility of data collection methods, such as PAGE, which uses Excel tables,and capillary electrophoresis, which involves online fingerprint analysis and uploading of dataand fingerprint image, needs to be considered. Different capillary electrophoresis platforms can becustomized for sample plate design, electrophoresis plate design, and FSA file (ABI fragment analysisdata file) configuration. The next generation of molecular identity cards can be linked to the PIDSwebsite to establish a quick response (QR) code for each variety on the website. By scanning the QRcode, users can retrieve molecular data information and fingerprint information of the varieties.
Genes 2020, 11, 373 13 of 15
5. Conclusions
PIDS is an indispensable tool in our laboratory. It assists in automating DNA fingerprintexperiments and reduces human error. It can complete sample tracking and perform common geneticanalysis, thereby improving work efficiency and quality. PIDS can support all diploid plants and can beextended to support polyploid species. We can provide users with free customization and extension ofback-end functions to meet the requirements of their laboratories, such as those involved in human andmicroorganism research. PIDS can monitor the experimental process and ensure the standardization ofDNA fingerprint data. It can be used to conduct inter-database conversations, and exchange fingerprintdata between fingerprint databases, with complete fingerprint data processing services. PIDS includeslocation statistics, fingerprint merging, fingerprint comparison, and genetic analysis functions, andis compatible with single and mixed DNA sample processing methods. PIDS has a complete locistatistics function that can meet the needs of a laboratory’s internal fingerprint database construction.PIDS can also meet the requirements for standard fingerprint database construction and sharing, andsupports the expansion of multiple detection technologies and multiple fingerprint data services.
Author Contributions: B.J. conceived and designed the database management system. Y.Z. and H.Y. wrote themanuscript. Y.H., H.W., J.R., J.G., and C.Z. participated in the related experiments. Conceptualization, J.Z. andF.W. All authors have read and agreed to the published version of the manuscript.
Funding: This research was funded by the 13th Five-Year National Key R&D Program of China, grantnumber 2017YFD0102001.
Acknowledgments: We thank those who helped us in sample collection and technical assistance. We thankMargaret Biswas from Liwen Bianji, Edanz Group China (www.liwenbianji.cn/ac), for editing the English text of adraft of this manuscript.
Conflicts of Interest: The authors declare no conflict of interest.
References
1. Jenjaroenpun, P.; Chew, C.S.; Yong, T.P.; Choowongkomon, K.; Thammasorn, W.; Kuznetsov, A. The TTSMIdatabase: A catalog of triplex target DNA sites associated with genes and regulatory elements in the humangenome. Nucleic Acids Res. 2015, 43, 110–116. [CrossRef] [PubMed]
2. Wall, J.D.; Cox, M.P.; Yong, T.P.; Mendez, F.L.; Woerner, A.; Severson, T.; Hammer, M.F. A novel DNAsequence database for analyzing human demographic history. Genome Res. 2015, 18, 1354–1361. [CrossRef][PubMed]
3. Lapointe, M.; Rogic, A.; Bourgoin, S.; Jolicoeur, C.; Séguin, D. Leading-edge forensic DNA analyses andthe necessity of including crime scene investigators, police offificers and technicians in a DNA eliminationdatabase. Forensic Sci. Int. Genet. 2015, 19, 50–55. [CrossRef] [PubMed]
4. Harbison, S.A.; Fallow, M.; Bushell, D. An analysis of the success rate of 908 trace DNA samples submittedto the Crime Sample Database Unit in New Zealand. Aust. J. Forensic Sci. 2008, 40, 49–53. [CrossRef]
5. Struyf, P.; De, M.S.; Vandeviver, C.; Renard, B.; Vander, B.T. The effectiveness of DNA databases in relation totheir purpose and content: A systematic review. Forensic Sci. Int. 2019, 301, 371–381. [CrossRef] [PubMed]
6. Benschop, C.C.G.; Van, D.M.L.; De, J.J.; Vanvooren, V.; Kempenaers, M.; Van, D.B.C.; Barni, F.; Reyes, E.L.;Moulin, L.; Pene, L.; et al. Validation of SmartRank: A likelihood ratio software for searching national DNAdatabases with complex DNA profiles. Forensic Sci. Int. Genet. 2017, 29, 145–153. [CrossRef]
7. Carew, M.E.; Nichols, S.J.; Batovska, J.; St, C.R.; Murphy, N.P.; Blacket, M.J.; Shackleton, M.E. A DNAbarcode database of Australia’s freshwater macroinvertebrate fauna. Mar. Freshw. Res. 2017, 68, 1788–1802.[CrossRef]
8. Mantelatto, F.L.; Terossi, M.; Negri, M.; Buranelli, R.C.; Robles, R.; Magalhaes, T.; Tamburus, A.F.; Rossi, N.;Miyazaki, M.J. DNA sequence database as a tool to identify decapod crustaceans on the Sao Paulo coastline.Mitochondrial DNA Part A 2018, 29, 805–815. [CrossRef]
9. Zhou, H.Y.; Zhang, P.H.; Luo, J.; Liu, X.Y.; Fan, S.X.; Liu, C.J.; Han, Y.Y. The establishment of a DNAfngerprinting database for 73 varieties of Lactuca sativa capitate L. using SSR molecular markers. Hortic.Environ. Biotechnol. 2018, 60, 95–103. [CrossRef]

Genes 2020, 11, 373 14 of 15
10. Backiyarani, S.; Chandrasekar, A.; Uma, S.; Saraswathi, M.S. MusatransSSRDB (a transcriptome derived SSRdatabase)—An advanced tool for banana improvement. J. Biosci. 2019, 43, 110–116. [CrossRef]
11. Yu, J.Y.; Dossa, K.; Wang, L.H.; Zhang, Y.X.; Wei, X.; Liao, B.S.; Zhang, X.R. PMDBase: A database forstudying microsatellite DNA and marker development in plants. Nucleic Acids Res. 2017, 45, 1046–1053.[CrossRef] [PubMed]
12. Pan, Y.B. Development and Integration of an SSR-Based Molecular Identity Database into Sugarcane BreedingProgram. Agronomy 2016, 6, 28. [CrossRef]
13. Sochorová, J.; Garcia, S.; Gálvez, F.; Symonová, R.; Kovarík, A. Evolutionary trends in animal ribosomalDNA loci: Introduction to a new online database. Chromosoma 2018, 127, 141–150. [CrossRef]
14. Morgante, M.; Hanafey, M.; Powell, W. Microsatellites are preferentially associated with nonrepetitive DNAin plant genomes. Nat. Genet. 2002, 30, 194–200. [CrossRef] [PubMed]
15. Chen, H.; Liu, L.; Wang, L.X.; Wang, S.H.; Somta, P.; Cheng, X.Z. Development and validation of EST-SSRmarkers from the transcriptome of adzuki bean (Vigna angularis). PLoS ONE 2015, 10, e0131939. [CrossRef][PubMed]
16. Guichoux, E.; Lagache, L.; Wagner, S.; Chaumeil, P.; Leger, P.; Lepais, O.; Lepoittevin, C.; Malausa, T.;Revardel, E.; Salin, F.; et al. Current trends in microsatellite genotyping. Mol. Ecol. Resour. 2011, 11, 591–611.[CrossRef]
17. Freixas-Coutin, J.A.; An, S.Y.; Postman, J.; Bassil, N.V.; Yates, B.; Shukla, M.; Saxena, P.K. Development of areliable Corylus sp. reference database through the implementation of a DNA fingerprinting test. Planta2019, 6, 1863–1874. [CrossRef]
18. Li, L.; Fang, Z.W.; Zhou, J.F.; Chen, H.; Hu, Z.F.; Gao, L.F.; Chen, L.H.; Ren, S.; Ma, H.Y.; Lu, L.; et al. Anaccurate and efficient method for large-scale SSR genotyping and applications. Nucleic Acids Res. 2017, 10,e88. [CrossRef]
19. Jasrotia, R.S.; Yadav, P.K.; Angadi, U.B.; Tomar, R.S.; Jaiswal, S.; Rai, A.; Kumar, D. VigSatDB: Genome-widemicrosatellite DNA marker database of three species of Vigna for germplasm characterization andimprovement. Database 2019, 2019, baz055. [CrossRef]
20. Molla, M.R.; Ahmed, I.; Rohman, M.M.; Hossain, M.A.; Chowdhury, M.A.Z. Genetic diversity analysis andDNA fingerprinting of Mungbean (Vigna radiata L.) genotypes using SSR markers. J. Plant Sci. 2016, 6,153–164. [CrossRef]
21. Bengtsson-Palme, J.; Richardson, R.T.; Meola, M.; Wurzbacher, C.; Tremblay, E.D.; Thorell, K.; Kanger, K.;Eriksson, K.M.; Bilodeau, G.J.; Johnson, R.M.; et al. Metaxa2 Database Builder: Enabling taxonomicidentification from metagenomic or metabarcoding data using any genetic marker. Bioinformatics 2018, 34,4027–4033. [CrossRef] [PubMed]
22. Wilton, R.; Wheelan, S.J.; Szalay, A.S.; Salzberg, S.L. The Terabase Search Engine: A large-scale relationaldatabase of short-read sequences. Bioinformatics 2019, 35, 665–670. [CrossRef] [PubMed]
23. Jayashree, B.; Reddy, P.T.; Leeladevi, Y.; Crouch, J.H.; Mahalakshmi, V.; Buhariwalla, H.K.; KE Eshwar, K.E.;Mace, E.; Folksterma, R.; Senthilvel, S.; et al. Laboratory Information Management Software for genotypingworkflows: Applications in high throughput crop genotyping. BMC Bioinform. 2006, 7, 383. [CrossRef][PubMed]
24. Poverennaya, E.V.; Bogolubova, N.A.; Bylko, N.N.; Ponomarenko, E.A.; Lisitsa, A.V.; Archakov, A.I.Gene-centric content management system. Biochim. Biophys. Acta Proteins Proteom. 2014, 1, 77–81. [CrossRef][PubMed]
25. Truong, C.V.C.; Duchev, Z.; Groeneveld, E. Data framework for efficient management of sequence andmicrosatellite data in biodiversity studies. Arch. Anim. Breed. 2013, 56, 50–64. [CrossRef]
26. Voegele, C.; Tavtigian, S.V.; de Silva, D.; Cuber, S.; Thomas, A.; Le Calvez-Kelm, F. A Laboratory InformationManagement System (LIMS) for a high throughput genetic platform aimed at candidate gene mutationscreening. Bioinformatics 2007, 23, 2504–2506. [CrossRef]
27. Viksna, J.; Celms, E.; Opmanis, M.; Podnieks, K.; Rucevskis, P.; Zarins, A.; Barrett, A.; Neogi, S.G.;Krestyaninova, M.; McCarthy, M.I.; et al. PASSIM—An open source software system for managinginformation in biomedical studies. BMC Bioinform. 2007, 83, 52. [CrossRef]
28. Rossum, T.V.; Tripp, B.; Daley, D. SLIMS—A user-friendly sample operations and inventory managementsystem for genotyping labs. Bioinformatics 2010, 26, 1808–1810. [CrossRef]

Genes 2020, 11, 373 15 of 15
29. Sparkes, A.; Clare, A. AutoLabDB: A substantial open source database schema to support a high-throughputautomated laboratory. Bioinformatics 2012, 286, 1390–1397. [CrossRef]
30. Groeneveld, E.; Lichtenberg, H. TheSNPpit—A High Performance Database System for Managing LargeScale SNP Data. PLoS ONE 2016, 11, e0164043. [CrossRef]
31. Chen, P.P. The Entity-Relationship Model—Toward a Unified View of Data. ACM Trans. Database Syst. 1976,1, 9–36. [CrossRef]
© 2020 by the authors. Licensee MDPI, Basel, Switzerland. This article is an open accessarticle distributed under the terms and conditions of the Creative Commons Attribution(CC BY) license (http://creativecommons.org/licenses/by/4.0/).
Copyright © 2022 FDOKUMEN