School Infrastructure in the Philippines: Where Are We ... - PIDS
56
DISCUSSION PAPER SERIES NO. 2022-10 MARCH 2022 School Infrastructure in the Philippines: Where Are We Now and Where Should We Be Heading? Adoracion M. Navarro The PIDS Discussion Paper Series constitutes studies that are preliminary and subject to further revisions. They are being circulated in a limited number of copies only for purposes of soliciting comments and suggestions for further refinements. The studies under the Series are unedited and unreviewed. The views and opinions expressed are those of the author(s) and do not necessarily reflect those of the Institute. Not for quotation without permission from the author(s) and the Institute. CONTACT US: RESEARCH INFORMATION DEPARTMENT Philippine Institute for Development Studies 18th Floor, Three Cyberpod Centris - North Tower EDSA corner Quezon Avenue, Quezon City, Philippines [email protected] (+632) 8877-4000 https://www.pids.gov.ph
-
Upload
khangminh22 -
Category
Documents
-
view
3 -
download
0
Transcript of School Infrastructure in the Philippines: Where Are We ... - PIDS

DISCUSSION PAPER SERIES NO. 2022-10
MARCH 2022
School Infrastructure in the Philippines: Where Are We Now and Where Should We Be Heading?
Adoracion M. Navarro
The PIDS Discussion Paper Series constitutes studies that are preliminary and subject to further revisions. They are being circulated in a limited number of copies only for purposes of soliciting comments and suggestions for further refinements. The studies under the Series are unedited and unreviewed. The views and opinions expressed are those of the author(s) and do not necessarily reflect those of the Institute. Not for quotation without permission from the author(s) and the Institute.
CONTACT US:RESEARCH INFORMATION DEPARTMENTPhilippine Institute for Development Studies
18th Floor, Three Cyberpod Centris - North Tower EDSA corner Quezon Avenue, Quezon City, Philippines
[email protected](+632) 8877-4000 https://www.pids.gov.ph

School Infrastructure in the Philippines: Where Are We Now and Where Should We Be Heading?
Adoracion M. Navarro
PHILIPPINE INSTITUTE FOR DEVELOPMENT STUDIES
March 2022
i
Abstract
This study assesses the adequacy of school infrastructure in the Philippine basic education sector and conducts benchmarking against developmental targets and other countries’ performance. The study shows that with respect to classrooms, there had been progress in decongesting schools, but spatial inequality in classroom-student ratio exists and must be addressed. Spatial inequality is evident given the congested classrooms in some administrative regions. Moreover, additional classrooms are needed given that school buildings in certain remote areas do not meet quality and safety standards, enrolment is increasing, and existing classrooms deteriorate due to wear and tear and calamities. With respect to water, sanitation, and hygiene (WASH) facilities, the gaps are huge and become more visible when benchmarked against other countries. The Philippines is lagging behind most countries in the Eastern and South-Eastern Asia region in providing WASH facilities to schools, even when compared with neighboring countries that have lower per capita income. With respect to electricity access of schools, many countries in the Eastern and South-Eastern Asia region have already achieved universal access and yet the Philippines still struggles to complete the electrification of schools. This challenge is compounded by the need to upgrade the electricity connections of schools to stabilize electricity current fluctuations and meet digital learning requirements. Information and communication technology (ICT) access is another area where the gaps are huge. Computer package delivery targets were not met and to make things worse, the indicator’s performance regressed. Philippine schools have low computer access rates and low internet access rates unlike many of its neighboring countries which had already achieved for their schools universal access to computers and universal access to the internet. Moreover, efforts to increase access rates had been marred by poor implementation of programs for ICT infrastructure in schools. All of these imply the need to invest more in school infrastructure and pursue policy improvements. Both the public and private sectors must assume responsibility in improving the students’ learning environment through better and adequate school infrastructure. After all, a good learning environment is a good investment. It would result in better student learning outcomes, higher productivity of workers in the future, and higher potential for endogenous economic growth.
Keywords: school infrastructure, school buildings, WASH facilities, electricity access, ICT access, human capital

ii
Table of Contents
1. Introduction ............................................................................................................................. 1
1.1 Objectives and significance of the study ............................................................................. 1
1.2 Research framework and method ....................................................................................... 2
1.3 Limitations of the study ....................................................................................................... 2
2. Link between school infrastructure and learning outcomes .............................................. 3
2.1 Literature relating school infrastructure with learning outcomes ......................................... 3
2.2 School infrastructure in the Sustainable Development Goals ............................................. 4
2.3 Philippine Development Plan strategies and targets ........................................................... 7
3. Assessment of the state of the Philippines' school infrastructure .................................... 8
3.1 Adequacy of classrooms ..................................................................................................... 8
3.2 Water, sanitation, and hygiene facilities ............................................................................ 17
3.3 Electricity access............................................................................................................... 26
3.4 ICT access ........................................................................................................................ 30
4. Policy insights and ways forward ....................................................................................... 40
Bibliography .............................................................................................................................. 44
List of Boxes
Box 1. Sustainable Development Goal 4 Targets ......................................................................... 4 Box 2. UNICEF and WHO JMP service ladders for WASH in schools ....................................... 22
List of Tables
Table 1. Monitoring of SDG Target 4.a.1 indicators in the Philippines ......................................... 6 Table 2. Classroom-student ratio in the Philippines, SY 2010-2011 to SY 2019-2020 ................. 9 Table 3. Classroom-to-pupil ratio targets in the PDP 2017-2022 vs. accomplishments ............. 10 Table 4. Classroom-student ratio for SY 2019-2020 (public), by region and school level .......... 12 Table 5. Projected 2021 classroom requirements due to building replacements ....................... 13 Table 6. Water and sanitation targets in the PDP 2017-2022 vs. accomplishments .................. 19 Table 7. Electrification targets in the PDP 2017-2022 vs. accomplishments .............................. 27 Table 8. Schools' access to electricity in Eastern and South-Eastern Asia (latest available data) .................................................................................................................................................... 29 Table 9. Proportion of public schools with computer packages, PDP 2017-2022 targets vs. accomplishments ........................................................................................................................ 32 Table 10. Internet access targets in the PDP 2017-2022 vs. accomplishments ......................... 33 Table 11. Schools' access to computers and the Internet in Eastern and South-Eastern Asia (latest available data) .................................................................................................................. 39
iii
List of Figures
Figure 1. Average class size in educational institutions in OECD countries, by level of education (2012) .......................................................................................................................................... 11 Figure 2. Compliance with the five crucial indicators .................................................................. 21 Figure 3. Access to drinking water of schools in Eastern and South-Eastern Asia, 2019 ........... 23 Figure 4. Access to sanitation facilities of schools in Eastern and South-Eastern Asia, 2019 .... 24 Figure 5. Access to hygiene facilities of schools in Eastern and South-Eastern Asia, 2019....... 24 Figure 6. Schools' access to electricity in Eastern and South-Eastern Asia (latest available data) .................................................................................................................................................... 28 Figure 7. Schools' access to computers in Eastern and South-Eastern Asia (latest available data) ............................................................................................................................................ 37 Figure 8. Schools' access to the Internet in Eastern and South-Eastern Asia (latest available data) ............................................................................................................................................ 38

1
School Infrastructure in the Philippines: Where Are We Now and Where Should We Be Heading?
Adoracion M. Navarro*
1. IntroductionIn the 2020 Human Capital Index released by the World Bank, the Philippines got a score of 0.52 (World Bank 2020a). The index, which ranges from 0 to 1 with 1 indicating highest human capital potential, measures the amount of human capital that children born today can expect to attain by age 18 given the health and education risks in the evaluated economy. Given the World Bank benchmark of complete education and full health, a score of 1 for an economy in a particular year means that a child born on that year can expect to accumulate full human capital in terms of complete education and full health by the time he or she becomes part of the next generation of workers at age 18; a score of less than 1 means expectation of less than full human capital accumulation by age 18. The Philippines’ score of 0.52 therefore implies that, approximately, Filipino children born in 2020 are expected to achieve only a little more than half their potential when they reach 18 years old. The 2020 score of the country is not only low but also a deterioration from its score of 0.55 in 2018, the first year of publication of the Human Capital Index.
Reversing this deterioration and significantly raising human capital potential in the Philippines necessitate urgent and big interventions in the health and education sectors. In the education sector, which is the concern of this study, one intervention is to ensure adequate and equitable access to quality school infrastructure in order to improve education services delivery and learning environments. Thus, it is important to assess the current state of Philippine school infrastructure and determine areas for improvement. So where are we now in terms of adequacy of school infrastructure and where should we be heading?
1.1 Objectives and significance of the study
The general objective of the study is to assess the current state of the school infrastructure in the Philippine basic education sector, identify and explain the gaps, and formulate policy recommendations.
The specific objectives are as follows:
a. To present indicators of the current state of school infrastructure in the country’s basiceducation sector and assess these by comparing with targets or benchmarks
b. To assess how previous programs on school infrastructure in basic education contributedto the current state and discuss lessons learned
∗ Senior Research Fellow, Philippine Institute for Development Studies. Email: [email protected]. The author is grateful to Jokkaz S. Latigar and Jethro El L. Camara for their excellent research assistance.

2
c. To identify current gaps in the provision of school infrastructure in basic education and
analyze the key challenges in filling those gaps d. To formulate policy recommendations.
If the study could contribute to reforming policies affecting school infrastructure such as department level issuances, local government policies, or national government policies on budgeting, prioritization, standards, and procurement, then the potential policy impacts would be better learning outcomes and eventually higher productivity of the next generation of workers. Pouring in the right amount of resources at the right school infrastructure priorities and with the right timing, and then implementing and monitoring the projects and programs well, can contribute to a higher quality of education, which in turn can result in higher human capital accumulation for the students. 1.2 Research framework and method The education production function concept, which is essentially based on the theory of the firm, frames the analysis. Harris (2010) provides a textbook explanation of the education production function, which relates a combination of inputs, such as school variables (including school infrastructure) and family and non-school variables, to measures of education outcomes, such as achievement scores and graduation rates. The expected result in correlation analysis that counts school infrastructure among the input variables is that better school infrastructure improves education outcomes. This study used qualitative research as general research method and document review1 and key informant interviews as specific qualitative research techniques. Document review was used to collect data on school infrastructure and insights on implementation of programs. In the key informant interviews, there was due consideration for the safety of participants in the time of the Coronavirus disease 2019 (COVID-19) pandemic. Interviews were conducted through email and video conferencing rather than in-person meetings. 1.3 Limitations of the study Physical infrastructure in education institutions cover buildings, classrooms, libraries, laboratories, furniture (such as desks, chairs and cabinets) and equipment, as well as facilities enabling access to electricity, water, sanitation and internet connection. It can also cover playgrounds, sports facilities, and dormitories. For studies on basic education, the term that is often used is “school infrastructure” (see, for example, World Bank 2016) and this term is adopted in this study.
1 Frey (2018) describes document review as “a form of qualitative research that uses a systematic procedure to analyze documentary evidence and answer specific research questions.” Since the study is not looking for the importance of or repetitions of certain words or ideas in documents and the mapping of relations between them, it does not apply the so-called “coding” where the occurrence of certain words is counted and their relations mapped through a software. Instead, the study reviews the insights revealed in the reading of whole chapters and sections of documents. It has been proven that program level documents can reveal early program development history, challenges during the implementation, and the basis for decisions made through milestone events (DHHS-ACF 2016).

3
As this study is a contribution to a Philippine Institute for Development Studies (PIDS) project on the basic education sector, it covers the basic education sector only and not the higher education sector.2 In the consideration of school infrastructure as inputs to the production function, the study covers classrooms and school buildings, water and sanitation services, electricity access, and information and communication technology access. Textbooks are not included given that it will be difficult to separate the effect of physical production and distribution of textbooks from the effect of the contents of learning materials. Furniture and fixtures, libraries, playgrounds, sports facilities, and dormitories are also not included given that comprehensive data on these are not available.
2. Link between school infrastructure and learning outcomes Improving school infrastructure results in better learning outcomes. This has been proven many times in the empirical literature. This is also the underlying assumption when the United Nations Sustainable Development Agenda 2030 included education facilities and learning environments in the means of implementation for Sustainable Development Goal 4: Quality Education. This crucial link between school infrastructure and learning outcomes also underpins the strategies and target-setting in the Philippine Development Plan, particularly under the human capital development and social infrastructure development themes. 2.1 Literature relating school infrastructure with learning outcomes The positive relationship between better school infrastructure and better education or learning outcomes is well established in the literature. The study of Murillo and Roman (2011) of school infrastructure and resources vis-à-vis the performance of Latin American students is one example. Results reveal that the availability of basic services and facilities such as potable water, electricity, proper sewage, sport installations, laboratories, libraries, books, and computers in the school have a positive effect on the achievement of primary education students in standardized tests on mathematics and language. Studies focusing on access to specific infrastructure services and its relation to learning outcomes also abound. School electrification is one rich area of study. In Kenya, Kirubi et al. (2009) shows that electric power offsets the negative impacts of shortage of teachers by providing extra teaching hours in early mornings and late evenings in order to make up for the materials not adequately covered during normal teaching hours. Sovacool and Ryan (2016), in a regression analysis of World Bank 2014 data from 56 countries, establishes a strong correlation between electricity access and primary school completion rate. Mejdalani et al. (2018) shows in a study of rural schools in isolated communities in Brazil that dropout rates tend to decline with electrification. There is also evidence that in terms of enrollment, electrification somewhat promotes gender equity. Gurung et al. (2011) shows that in Nepal, girl and boy student enrollment improved by 23.33 percent and 33.33 percent, respectively, after the installation of micro-hydropower plants. Electrification can also facilitate the functioning of other education infrastructure. Welland (2017) notes that electrifying schools, especially those situated in rural areas, can affect school
2 If data availability permits, the physical infrastructure in the higher education sector will be covered in a succeeding PIDS research project on the higher education sector.

4
performance indirectly through powering and improving computers, information and communication technology (ICT), water delivery, water treatment, sanitation, heating and cooling, among other school services. There are also studies which investigated the relationship between students’ academic performance and access to computers and other ICT devices as well as internet usage. Diaz et al. (2019) employs mixed research analysis to the 2009 PISA survey (i.e., the Programme for International Student Assessment or PISA survey, an international assessment that measures every three years the 15-year-old students' reading, mathematics, and science literacy) in Canary Islands in order to evaluate the degree of association between ICT use and students’ performance in mathematics. The study confirms that learning can be enhanced by ICT given that positive changes were observed in the performance of students who used ICT tools to browse the internet when doing school work. Nketiah-Amponsah et al. (2017) also arrives at similar findings in its cross-sectional survey among final year undergraduate students of a university in Ghana. Results show that there is a positive and statistically significant relationship between expenditures in ICT and the cumulative grade point average of the students. These studies suggest that investment in ICT breaks access barriers to online platforms, which are becoming more essential in today’s education landscape. 2.2 School infrastructure in the Sustainable Development Goals That there is a link between school infrastructure and learning outcomes is also recognized in the Sustainable Development Goal (SDG) for education. Education is tackled in the Sustainable Development Agenda 2030 as SDG 4 - Quality Education: Ensure inclusive and equitable quality education and promote lifelong opportunities for all. In pursuing SDG 4, there are seven outcome targets and three means of implementation, which are also expressed as targets (see Box 1). Box 1. Sustainable Development Goal 4 Targets
Outcome Targets Target 4.1 - By 2030, ensure that all girls and boys complete free, equitable and quality primary and secondary education leading to relevant and effective learning outcomes. Target 4.2 - By 2030, ensure that all girls and boys have access to quality early childhood development, care and pre-primary education so that they are ready for primary education. Target 4.3 - By 2030, ensure equal access for all women and men to affordable and quality technical, vocational and tertiary education, including university. Target 4.4 - By 2030, substantially increase the number of youth and adults who have relevant skills, including technical and vocational skills, for employment, decent jobs and entrepreneurship. Target 4.5 - By 2030, eliminate gender disparities in education and ensure equal access to all levels of education and vocational training for the vulnerable, including persons with disabilities, indigenous peoples and children in vulnerable situations. Target 4.6 - By 2030, ensure that all youth and a substantial proportion of adults, both men and women, achieve literacy and numeracy. Target 4.7 - By 2030, ensure that all learners acquire the knowledge and skills needed to promote sustainable development, including, among others, through education for sustainable development
5
and sustainable lifestyles, human rights, gender equality, promotion of a culture of peace and non-violence, global citizenship and appreciation of cultural diversity and of culture’s contribution to sustainable development. Means of Implementation Target 4.a - Build and upgrade education facilities that are child, disability and gender sensitive and provide safe, non-violent, inclusive and effective learning environments for all. Target 4.b - By 2020, substantially expand globally the number of scholarships available to developing countries, in particular least developed countries, small island developing States and African countries, for enrolment in higher education, including vocational training and information and communications technology, technical, engineering and scientific programmes, in developed countries and other developing countries. Target 4.c - By 2030, substantially increase the supply of qualified teachers, including through international cooperation for teacher training in developing countries, especially least developed countries and small island developing States. Source: Lifted in full from UNESCO (2017, p.31–32).
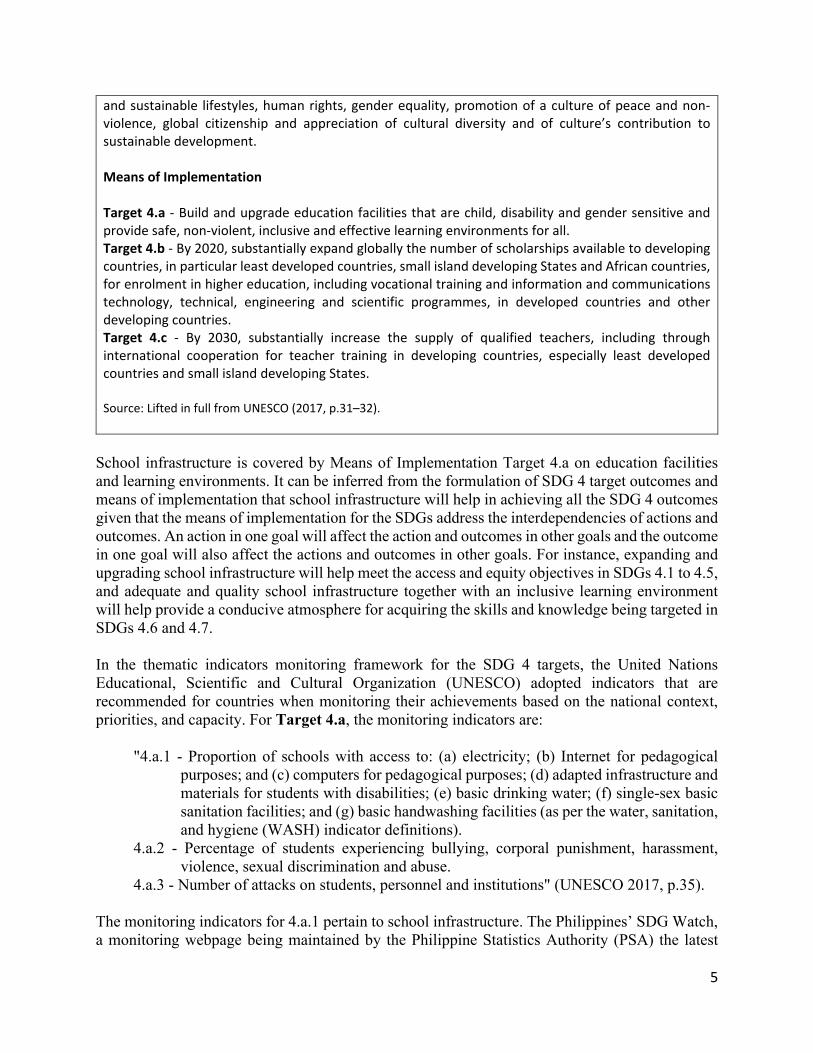
School infrastructure is covered by Means of Implementation Target 4.a on education facilities and learning environments. It can be inferred from the formulation of SDG 4 target outcomes and means of implementation that school infrastructure will help in achieving all the SDG 4 outcomes given that the means of implementation for the SDGs address the interdependencies of actions and outcomes. An action in one goal will affect the action and outcomes in other goals and the outcome in one goal will also affect the actions and outcomes in other goals. For instance, expanding and upgrading school infrastructure will help meet the access and equity objectives in SDGs 4.1 to 4.5, and adequate and quality school infrastructure together with an inclusive learning environment will help provide a conducive atmosphere for acquiring the skills and knowledge being targeted in SDGs 4.6 and 4.7. In the thematic indicators monitoring framework for the SDG 4 targets, the United Nations Educational, Scientific and Cultural Organization (UNESCO) adopted indicators that are recommended for countries when monitoring their achievements based on the national context, priorities, and capacity. For Target 4.a, the monitoring indicators are:
"4.a.1 - Proportion of schools with access to: (a) electricity; (b) Internet for pedagogical purposes; and (c) computers for pedagogical purposes; (d) adapted infrastructure and materials for students with disabilities; (e) basic drinking water; (f) single-sex basic sanitation facilities; and (g) basic handwashing facilities (as per the water, sanitation, and hygiene (WASH) indicator definitions).
4.a.2 - Percentage of students experiencing bullying, corporal punishment, harassment, violence, sexual discrimination and abuse.
4.a.3 - Number of attacks on students, personnel and institutions" (UNESCO 2017, p.35). The monitoring indicators for 4.a.1 pertain to school infrastructure. The Philippines’ SDG Watch, a monitoring webpage being maintained by the Philippine Statistics Authority (PSA) the latest

6
update of which is as of March 2021, reports the baselines for 4.a.1 indicators in year 2016 or 2017, the targets by year 2030, and the achievements in year 2018. Table 1 below summarizes the SDG Watch data but with the achievements updated to year 2020 using inputs from the Department of Education (DepEd). Table 1. Monitoring of SDG Target 4.a.1 indicators in the Philippines
Goal/Targets/Indicators Baseline Latest Target Data Source
Agency Data Year Data Year Data Year Goal 4. Ensure inclusive and quality education for all and promote lifelong learning Target 4.a Build and upgrade education facilities that are child, disability and gender sensitive and provide safe, non-violent, inclusive and effective learning environments for all 4.a.1 Proportion of schools with access to: (a) electricity; (b) the Internet for pedagogical purposes; (c) computers for pedagogical purposes; (d) adapted infrastructure and materials for students with disabilities; (e) basic drinking water; (f) single-sex basic sanitation facilities; and (g) basic handwashing facilities (as per the WASH indicator definitions) 4.a.1.1 Proportion of schools with access to electricity
Elementary schools 88.7 2016 97.6 2020 100.0 2030 EBEIS, DepEd
Secondary schools (Junior High School) 93.1 2016 98.7 2020 100.0 2030 EBEIS, DepEd
Secondary schools (Senior High School) 88.9 2016 98.3 2020 100.0 2030 EBEIS, DepEd
4.a.1.2 Proportion of schools with access to the Internet for pedagogical purposes
Elementary schools 25.6 2016 64.2 2020 100.0 2030 EBEIS, DepEd
Secondary schools (Junior High School) 34.0 2017 60.4 2020 100.0 2030 EBEIS, DepEd
Secondary schools (Senior High School) 31.0 2017 67.3 2020 100.0 2030 EBEIS, DepEd
4.a.1.3 Proportion of schools with access to computers for pedagogical purposes
Elementary schools 78.5 2016 81.6 2020 100.0 2030 EBEIS, DepEd
Secondary schools (Junior High School) 83.1 2016 84.4 2020 100.0 2030 EBEIS, DepEd
Secondary schools (Senior High School) 23.6 2016 81.5 2020 100.0 2030 EBEIS, DepEd
4.a.1.4 Proportion of schools with access to single-sex basic sanitation facilities
Elementary schools 45.1 2016 49.1 2019 100.0 2030 EBEIS, DepEd
Secondary schools (Junior High School) 77.1a 2016 75.9 2019 100.0a 2030 EBEIS, DepEd
Secondary schools (Senior High School) 77.1a 2016 65.8 2019 100.0a 2030 EBEIS, DepEd
4.a.1.5 Proportion of schools with access to basic handwashing facilities (as per the WASH indicator definitions)

7
Goal/Targets/Indicators Baseline Latest Target Data Source
Agency Data Year Data Year Data Year
Elementary schools 61.0 2016 90.6 2020 100.0 2030 EBEIS, DepEd
Secondary schools (Junior High School) 60.5 2016 89.3 2020 100.0 2030 EBEIS, DepEd
Secondary schools (Senior High School) 65.3 2018 83.2 2020 100.0 2030 EBEIS, DepEd
Notes: aBaseline and target data were recorded for secondary schools in general before they were disaggregated
to Junior and Senior High School categories. EBEIS - Enhanced Basic Education Information System; DepEd - Department of Education.
Source: PSA (2021); DepEd's Educational Management Information System Division-Planning Service (EMISD-PS)
(2022). As can be gleaned from above, the country posted notable improvements in most indicators. However, there was minimal change or less than 10 percent increase in the indicators “Proportion of schools with access to electricity-Junior High School”, “Proportion of schools with access to computers for pedagogical purposes-Elementary School and Junior High School”, and “Proportion of schools with access to single-sex basic sanitation-Elementary schools”. Basic sanitation also regressed as indicated by the negative change in the indicator “Proportion of schools with access to single-sex basic sanitation facilities” for both junior and senior high school levels.3 2.3 Philippine Development Plan strategies and targets The Philippine Development Plan (PDP) 2017-2022 also recognizes the importance of school infrastructure and the need to reduce inequities. This is apparent in the assessment of baselines and targets (albeit for only one indicator, the student-to-classroom ratio) and in the articulation of strategies. The assessment of the education sector baseline for the PDP 2017-2022 plan period includes the performance of the sector in the previous PDP plan period with respect to the student to classroom ratio. The assessment shows that the student-to-classroom ratio in school year (SY) 2014-2015 was 1:34 at the elementary level and 1:48 at the secondary level, an improvement from the SY 2010-2011 ratios of 1:39 for the elementary level and 1:54 for the secondary level. The PDP targeted to improve the student-to-classroom ratios to 1:25 for kindergarten, 1:30 for Grades 1-3, 1:40 for Grades 4-6, 1:40 for junior high school, and 1:40 for senior high school by the end of the plan period (i.e., year 2022).4 The PDP also highlights school infrastructure in the strategies for the K to 12 program implementation. Specifically, the PDP states, “Pursue the full implementation of K to 12 - The sub-strategies to ensure the success of K to 12 are: (a) timely delivery of adequate education inputs
3 These indicators are unpacked and assessed further in Section 3 of this paper. 4 The assessment of how these targets are met is in Section 3 of this paper.
8
such as school infrastructure, quality learning materials including assistive devices, and ICT equipment…” (National Economic and Development Authority (NEDA) 2017, p. 153). The Updated PDP 2017-2022 (February 2021 Update) no longer includes school infrastructure in the PDP target indicators but includes it in the strategies, with crucial emphasis on geographically isolated and disadvantaged areas (GIDAs) this time. The Updated PDP states, “Improvement of the learning environment by ensuring that schools, classrooms, and other learning facilities promote productive learning experiences. Particular focus will be given to Last Mile Schools—schools in GIDAs, which are not prioritized when determining the needed inputs using established formulas and ratios for education inputs” (NEDA 2021a, p. 187).
3. Assessment of the state of the Philippines' school infrastructure Where we are now in terms of school infrastructure provision can be assessed by looking at what we have achieved relative to the targets that we set for ourselves and comparing our performance relative to our neighboring countries. Our achievement or non-achievement of targets and our ranking relative to other countries can provide hints on where we should be heading from here onwards. This is done in the discussions below, where the study presents the Philippines’ achievements relative to the PDP and SDG targets in four broad indicators, namely: adequacy of classrooms; access to water, sanitation and hygiene facilities; electricity access; and ICT access. It also presents a benchmarking of Philippine indicators against countries in Eastern and South-Eastern Asia, except with respect to classrooms. (Classroom data on Organisation for Economic Co-operation and Development (OECD) countries are used given data availability limitations). It also discusses the implementation experience in the major programs that aimed to improve the school infrastructure indicators. Compliance with construction standards is not included in the discussion for lack of data. The presumption is that school infrastructure in the Philippines are being built with due consideration for the DPWH-DepEd standards. The DPWH and the DepEd jointly formulated standards and construction handbooks that both the DPWH contractors and the private partners of the DepEd are required to follow. Construction contracts also have allotted periods for remedial measures, that is, if the construction does not follow the standards, the defects are remedied before the certificate of acceptance for the particular school infrastructure facility is issued. 3.1 Adequacy of classrooms Classroom shortages were a serious problem in the 2000s, with ratios of 40.14 elementary pupils per classroom and 55.44 secondary students per classroom in SY 2002-2003 indicating over-crowding in schools. Despite continuous funding for the construction of additional classrooms to reduce over-crowding, the World Bank (WB) and the Australian Agency for International Development (AusAID) public expenditure review in 2012 observed that improvement in the ratio was slow because many new classrooms were not counted as additional facilities but as mere replacements for old, dilapidated classrooms (WB and AusAid 2012).

9
Many innovations for school building and classroom construction were implemented then to address the classroom backlogs, including the “principal-led construction scheme”5 introduced in 2005, the Public-Private Partnerships for School Infrastructure Project introduced in 2011, and the transfer of implementation of all school building programs to the Department of Public Works and Highways (DPWH) starting in 2013 and up to the present. Eventually, school-building programs managed to address over-crowding in classrooms, as can be seen from trends in Table 2. Table 2. Classroom-student ratio in the Philippines, SY 2010-2011 to SY 2019-2020
Elementary High School Junior High School* Senior High School*
SY 2010-2011 1:39 1:53
SY 2011-2012 1:40 1:53
SY 2012-2013 1:40 1:51
SY 2013-2014 1:34 1:49
SY 2014-2015 1:34 1:48
SY 2015-2016 1:32 1:35
SY 2016-2017 1:35 1:39 n.d n.d. SY 2017-2018 1.34 1:36 n.d n.d. SY 2018-2019 1:28
1:40 1:38
SY 2019-2020 1:29
1:39 1:31
SY = school year; n.d. = no data * Starting June 2016, high school education consisted of junior high school and senior high school with the addition of Grades 11 and 12 (the senior high school levels) to the basic education system in accordance with the Enhanced Basic Education Act of 2013. Note on data sources: For SY 2010-2012 up to SY 2014-2015, data on the ratios were given by the NEDA-Social
Development Staff (SDS), citing the DepEd as source. For SY 2015-2016 to SY 2019-2020, data on the ratios were given by the DepEd EMISD-PS.
Sources: NEDA-SDS (2021), DepEd (2021a and 2021b), DepEd EMISD-PS (2022) The table above shows that from 39 elementary students per classroom and 53 high school students per classroom in SY 2010-2011, the student-classroom ratios improved to 29 elementary students per classroom, 39 junior high school students per classroom, and 31 students per classroom in SY 2019-2020. This indicates that classroom provision in the Philippines has been outpacing enrolment growth and classrooms are getting less congested. These accomplishments can be compared with the targets in the Philippine Development Plan 2017-2022, as reflected in the NEDA-released Enhanced PDP 2017-2022 Results Matrices (December 14, 2021 Update). Comparing the accomplishments in classroom-student ratios for
5 The principal-led scheme of construction means that the school principal was tasked to manage and supervise all construction and repair works in the school building project, with technical assistance from an engineer hired by the DepEd.

10
elementary in Table 2 above with the target ratios for Grades 1-3 and Grades 4-6 of primary education in Table 3 below, and the ratios for junior and senior high schools in Table 2 above with the target ratios for the same levels in Table 3 below, one can conclude that most of the PDP targets on the classroom-student ratio indicator have been achieved. The accomplishments data for primary education, however, are not broken down per grade level and the same conclusion cannot be made for kindergarten. Table 3. Classroom-to-pupil ratio targets in the PDP 2017-2022 vs. accomplishments
Indicator Baseline Annual Plan Targets and Accomplishments End of
Plan Targeta Year Value 2017 2018 2019 2020 2021 2022
Classroom to pupilb ratio improved Primary Annual Plan Targets
Kindergarten
2014 1:34
1:30 1:25 1:25 1:25 1:25 1:25 1:25 Grades 1-3 1:34 1:32 1:30 1:30 1:30 1:30 1:30
Grades 4-6 1:40 1:40 1:40 1:40 1:40 1:40 1:40
Annual Accomplishments
Elementaryc 1:34 1:28 1:29
Secondary
Junior High School 2014 1:48 Annual Plan Targets 1:40 1:46 1:45 1:44 1:42 1:40 1:40
Annual Accomplishments
1:36 1:40 1:39
Senior High School Annual Plan Targets 1:40 1:46 1:45 1:44 1:42 1:40 1:40
Annual Accomplishments 1:38 1:31
a End of 2017-2022 Philippine Development Plan b The Enhanced PDP 2017-2022 Results Matrices (December 14, 2021 Update) publication uses the term "classroom
to pupil ratio". c The DepEd EMISD-PS classroom-to-pupil ratio data on accomplishments at the elementary school level are in the
aggregate and do not have breakdown by grade level. Source: NEDA (2021b), DepEd EMISD-PS (2022). Finding an international benchmark which uses most recent data has been challenging. In the absence of most recent data, a 2014 report by the OECD showing 2012 ratios is used. In 2012, the OECD countries had an average of 21 primary students per classroom and 24 lower secondary

11
students per classroom (see Figure 1). The Philippines’ ratios in SY 2012-2013 were 40 primary students per classroom and 51 secondary students per classroom (see Table 2) and were above these averages, meaning, Philippine classrooms were congested in 2012-2013 if set against the OECD averages. Note from Figure 1, however, that other more economically advanced countries from the Asia region were also below the average in 2012. For instance, China also had congested classrooms given its ratios of 38.49 primary students per classroom and 51.83 lower secondary students per classroom in 2012. The Philippines’ latest ratios, for SY 2019-2020, indicate that congestion had been addressed given the student-to-classroom ratios of 29 primary students per classroom, 39 junior high school students per classroom, and 31 senior high school students per classroom. These ratios, however, are still larger than the 2012 OECD averages (i.e., Philippine classrooms are over-crowded relative to those in advanced countries). Figure 1. Average class size in educational institutions in OECD countries, by level of education (2012)
Note: Public institutions only. Countries are ranked in descending order in lower secondary education in 2012.
* Year of reference for Netherlands is 2011 instead of 2012. Source: OECD (2014) Although the national classroom-student ratios show significant progress in addressing over-crowding in classrooms, the regional ratios reveal spatial inequality (see Table 4). The SY 2019-2020 data show that achieving the target 1:40 classroom-student ratio set by the PDP has been difficult for the National Capital Region (NCR) both at the elementary and junior high school levels. Region IV-A has also been experiencing classroom congestion at the junior high school level. The congestion in these two regions can be explained by these regions being highly populated, with high enrollment growth outpacing the build-up of new classrooms.
0
10
20
30
40
50
60
Chin
aCh
ileJa
pan
Isra
elKo
rea
Uni
ted
King
dom
Irela
ndTu
rkey
Braz
ilAu
stra
liaIn
done
siaFr
ance
Net
herla
nds*
Spai
nO
ECD
aver
age
Belg
ium
(Fr.)
Uni
ted
Stat
esGe
rman
yHu
ngar
yPo
rtug
alDe
nmar
kCz
ech
Repu
blic
Mex
ico
Finl
and
Italy
Icel
and
Slov
enia
Pola
ndAu
stria
Russ
ian…
Slov
ak R
epub
licGr
eece
Esto
nia
Latv
iaLu
xem
bour
g
Num
ber o
f stu
dent
s per
cla
ssro
om
Primary Lower secondary
12
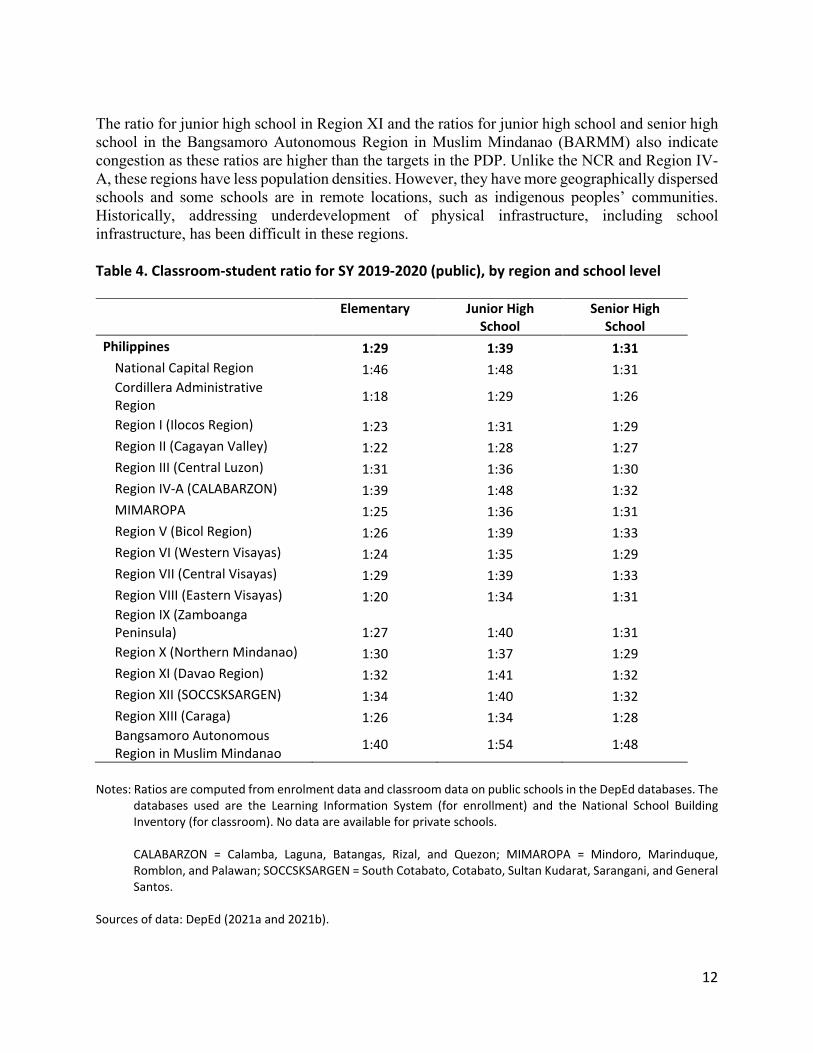
The ratio for junior high school in Region XI and the ratios for junior high school and senior high school in the Bangsamoro Autonomous Region in Muslim Mindanao (BARMM) also indicate congestion as these ratios are higher than the targets in the PDP. Unlike the NCR and Region IV-A, these regions have less population densities. However, they have more geographically dispersed schools and some schools are in remote locations, such as indigenous peoples’ communities. Historically, addressing underdevelopment of physical infrastructure, including school infrastructure, has been difficult in these regions. Table 4. Classroom-student ratio for SY 2019-2020 (public), by region and school level
Elementary Junior High School
Senior High School
Philippines 1:29 1:39 1:31 National Capital Region 1:46 1:48 1:31 Cordillera Administrative Region 1:18 1:29 1:26
Region I (Ilocos Region) 1:23 1:31 1:29 Region II (Cagayan Valley) 1:22 1:28 1:27 Region III (Central Luzon) 1:31 1:36 1:30 Region IV-A (CALABARZON) 1:39 1:48 1:32 MIMAROPA 1:25 1:36 1:31 Region V (Bicol Region) 1:26 1:39 1:33 Region VI (Western Visayas) 1:24 1:35 1:29 Region VII (Central Visayas) 1:29 1:39 1:33 Region VIII (Eastern Visayas) 1:20 1:34 1:31 Region IX (Zamboanga Peninsula) 1:27 1:40 1:31 Region X (Northern Mindanao) 1:30 1:37 1:29 Region XI (Davao Region) 1:32 1:41 1:32 Region XII (SOCCSKSARGEN) 1:34 1:40 1:32 Region XIII (Caraga) 1:26 1:34 1:28 Bangsamoro Autonomous Region in Muslim Mindanao 1:40 1:54 1:48
Notes: Ratios are computed from enrolment data and classroom data on public schools in the DepEd databases. The
databases used are the Learning Information System (for enrollment) and the National School Building Inventory (for classroom). No data are available for private schools.
CALABARZON = Calamba, Laguna, Batangas, Rizal, and Quezon; MIMAROPA = Mindoro, Marinduque,
Romblon, and Palawan; SOCCSKSARGEN = South Cotabato, Cotabato, Sultan Kudarat, Sarangani, and General Santos.
Sources of data: DepEd (2021a and 2021b).

13
Achieving the PDP targets on classroom-student ratios at the national level should leave no room for complacency. The Philippine government still needs to monitor the emergence of classroom shortages. The demand for new classrooms continues as school enrolment increases and existing classrooms get dilapidated due to wear and tear and calamities. Moreover, planners now recognize the additional demand for quality classrooms in so-called "last mile schools", which need to upgrade their school buildings to have basic standard and safe classrooms, among other requirements. The planning parameters of the DepEd therefore consider three factors, the requirements due to enrolment increment, the needed replacements of old and dilapidated school buildings, and the requirements of last mile schools. The standard planning parameters for kindergarten classroom are 25 learners in a class and double shift or one classroom per two classes. The standard planning parameters for Grades 1-10 are 30-40 learners and single shift or one classroom per class. The standard planning parameters for senior high school are 40 learners in a class and single shift or one classroom per class. To get the classroom gap, the DepEd compares the classroom requirements of the estimated enrolment with what is in the national school building inventory and what can be expected from the school building projects that will be completed in time for the incoming school year. In its analysis based on the SY 2019-2020 enrolment, 2019 National School Building Inventory, and remaining projects for completion in 2019-2020, the DepEd estimated a total remaining requirement of 110,954 classrooms as of 2021. The DepEd also estimated that school enrolment increases by an average of 1.5 percent to 2 percent per year, which translates to around additional 10,000 classrooms required on top of the baseline requirement per year (DepEd-OUA 2020a). The regular structural assessment of school building condition indicates which buildings already pose a danger to students and need to be demolished and immediately replaced. The 2019 National School Building Inventory across all regions showed that the CALABARZON region has the highest number of such buildings and the total nationwide is 28,508 school buildings that are either subject for condemnation or were already declared condemned. Given the DepEd planning parameter of an average of three classrooms per school building, this implies an additional requirement of 85,524 classrooms (see Table 5). Table 5. Projected 2021 classroom requirements due to building replacements
Region Total Buildings
for Condemnation
Total Buildings Condemned or for Demolition
Total Buildings for Replacement
Total Equivalent Number of Classrooms
(a) (b) (c = a + b)
CAR 341
523
864
2,592
Region I (Ilocos) 945
548
1,493
4,479 Region II (Cagayan Valley) 729
447
1,176
3,528
Region III (Central Luzon)
1,535
1,188
2,723
8,169

14
Region Total Buildings
for Condemnation
Total Buildings Condemned or for Demolition
Total Buildings for Replacement
Total Equivalent Number of Classrooms
NCR 88 69
157
471 Region IV-A (CALABARZON)
1,746
1,956
3,702
11,106
MIMAROPA 507
387
894
2,682
Region V (Bicol)
1,061
1,071
2,132
6,396 Region VI (Western Visayas)
1,011
742
1,753
5,259
Region VII (Central Visayas) 970
952
1,922
5,766
Region VIII (Eastern Visayas) 622
470
1,092
3,276
Region IX (Zamboanga Peninsula) 522
634
1,156
3,468
Region X (Northern Mindanao)
2,101
1,512
3,613
10,839
Region XI (Davao)
1,311
1,150
2,461
7,383 Region XII (SOCCSKSARGEN) 983
701
1,684
5,052
Region XIII (Caraga) 592
537
1,129
3,387
BARMM 270
287
557
1,671
Grand Total
15,334
13,174
28,508
85,524 Notes:
Assessment based on the 2019 National School Building Inventory. BARMM = Bangsamoro Autonomous Region of Muslim Mindanao; CALABARZON = Cavite, Laguna, Batangas, Rizal and Quezon; CAR = Cordillera Administrative Region; MIMAROPA = Occidental Mindoro, Oriental Mindoro, Marinduque, Romblon, and Palawan; NCR = National Capital Region; SOCCSKSARGEN = South Cotabato, Cotabato, Sultan Kudarat, Sarangani, and General Santos
Source: DepEd-OUA (2020a). With respect to the last mile schools, the DepEd listed under Section 2 of Memorandum Circular No. 59, series of 2019 the following indicators for identifying which are last mile schools:
a. have less than four classrooms; b. with makeshift or nonstandard rooms; c. absence of electricity;

15
d. have not been allocated funds for repairs or new construction projects in the last four years; e. with travel distance of more than one hour from town center, or with difficulty of terrain; f. have multigrade classes/rooms; g. with less than five teachers; h. have a student population of less than 100 learners; and i. with more than 75% indigenous people learners.
In 2019, DepEd field offices made an assessment and were able to estimate a total of 9,225 last mile schools around the country. If these are to be provided with at least five classrooms each, a total of 46,125 classrooms would be the last mile classroom requirement. DepEd set five classrooms per last mile school as planning parameter as it deems that the usually small number of learners in a multi-grade system plus the requirements of a library or equipment corner will need four classrooms and the principal and teachers will need one room (DepEd-OUA 2020a).
How can the government meet the funding requirements of the growing demand for classrooms? It can be through a combination of national government funds, local government funds, and public-private partnerships (PPPs), but with due consideration for the lessons learned from project implementation in previous years. The implementation experience in the main national government budget for school building construction, the Basic Education Facilities (BEF) budget, proves that substantially increasing budget should be accompanied by adequate project-level preparation such as complete cost estimates, site preparation, bidder availability, and manpower sufficiency. In the 2013 General Appropriations Act (GAA), the BEF budget was allocated to the DepEd to replace an existing budget line item for school buildings and the implementation was fully transferred to the DPWH. From 2013 to the present, the DPWH has been implementing all school building projects funded by the DepEd. The DepEd manages the planning for and selection of project sites and turns over the priority list and the funds to the DPWH for implementation. The BEF appropriation started in 2013 at PHP14.11 billion, peaked to PHP109.31 billion in 2017, was drastically cut to PHP14.36 billion in 2019 (DepEd-OUA 2020a), and now stands at PHP5.95 billion in the 2022 GAA. The 2019 drastic budget cut was due to lingering concerns about underutilization. The underutilization is evident in low disbursement to appropriation ratios, as raised by the Department of Budget and Management (DBM). In its 2018 recommendation to cut the BEF appropriation, the DBM raised the issue of very low disbursement to appropriation ratios in previous years: 12.4 percent in 2015, 19.9 percent in 2016, and only 6.2 percent in 2017 (DBM 2018). School building programs implemented by the DPWH under the BEF suffered delays due to various factors. As reported in World Bank and AusAID (2016), a survey of DPWH district engineering offices revealed that the common problems faced by the DPWH in school infrastructure projects implemented in 2014 include insufficient funds for hauling, site availability, impractical uniform pricing, attracting contract bidders, insufficient DPWH staff, late receipt of project list, very rigid specifications, and political intervention. These problems, aside from political intervention, can be solved through adequate project preparation.

16
The DepEd also reported that these problems arose in the past: poor coordination between the DPWH and the DepEd, lack of information dissemination at the field level, no joint DepEd-DPWH validation of the priority list and therefore necessitating the revalidation by the DPWH, non-availability of buildable space in the sites, repeated failures in bidding because sites were hard to access, and problems in payments for completed projects due to procedural lapses. Problems started to be minimized when coordination between the DepEd and the DPWH improved, especially with regular monthly coordination meetings and reporting by the DepEd of needed corrections in the quality of construction (DepEd-OUA 2020a). But implementation problems continue to hound the DepEd and the DPWH, especially since there are backlogs in projects from previous years. For instance, as of September 1, 2021, the DepEd reported that 9,627 classrooms from the 2014-2018 implementation list are still considered ongoing but with issues or for further verification of status and that, among the regions, only Region X has no backlog (DepEd-OUA 2021a). By June 2021, the DPWH reported that it was able to build a total of 144,925 classrooms in the past five years (Unite 2021). Another source of funds for school building construction is the Special Education Fund (SEF) of local government units (LGUs). The SEF is from the 1 percent surcharge on real property taxes being collected by LGUs, as authorized by Republic Act (RA) 7160 or the Local Government Code of 1991, and is administered by Local School Boards (LSB) co-chaired by the local chief executive and the school division supervisor in the particular LGU. RA 7160 provides that “the proceeds shall be allocated for the operation and maintenance of public schools, construction and repair of school buildings, facilities and equipment, educational research, purchase of books and periodicals, and sports development as determined and approved by the Local School Board” (RA 7160, Book 2, Section 272). Although the SEF is being used to fund construction of school buildings, among others, there is no systematic data collection on how much of the nationwide classroom shortage is being funded through the SEF. Moreover, the World Bank (2020b) reported that its Philippines Public Education Expenditure Tracking and Quantitative Service Delivery Survey in 2016 found that fewer than 50 percent of schools receive any kind of LGU financial assistance. A PPP arrangement can also help in meeting future demand for classrooms given that the Philippines has successfully utilized such arrangement in the past. The PPP for School Infrastructure Project (PSIP) is the DepEd’s first PPP project. It was approved by the NEDA Board in 2011 under a build-lease-transfer arrangement where the availability payments of the DepEd to the contractor is for a period of 10 years. Construction under Phase 1 started in February 2013 and was completed in December 2015. Phase 1 delivered 2,156 classrooms in Region I, 2,885 classrooms in Region III, and 9,296 classrooms in Region IV-A. (PPP Center n.d.). Under Phase 2, the PPP structure was changed to build-transfer because when the project was being evaluated, the government had “considerably more comfortable fiscal space that can allow it to absorb the cost of a one-time payment for the Project” as indicated by the DepEd.6 Construction under Phase 2 started in April 2014 and was completed in December 2019 for one contract package and March 2021 for another contract package. Phase 2 delivered 2,438 classrooms in CAR and Regions I, II and III, and 1,657 classrooms in Region X and Caraga (PPP Center n.d.).
6 Phebean Belle A. Ramos-Lacuna, Director, PPP Center, in discussion with the author via online meeting, November 10, 2021, Quezon City, Philippines.
17
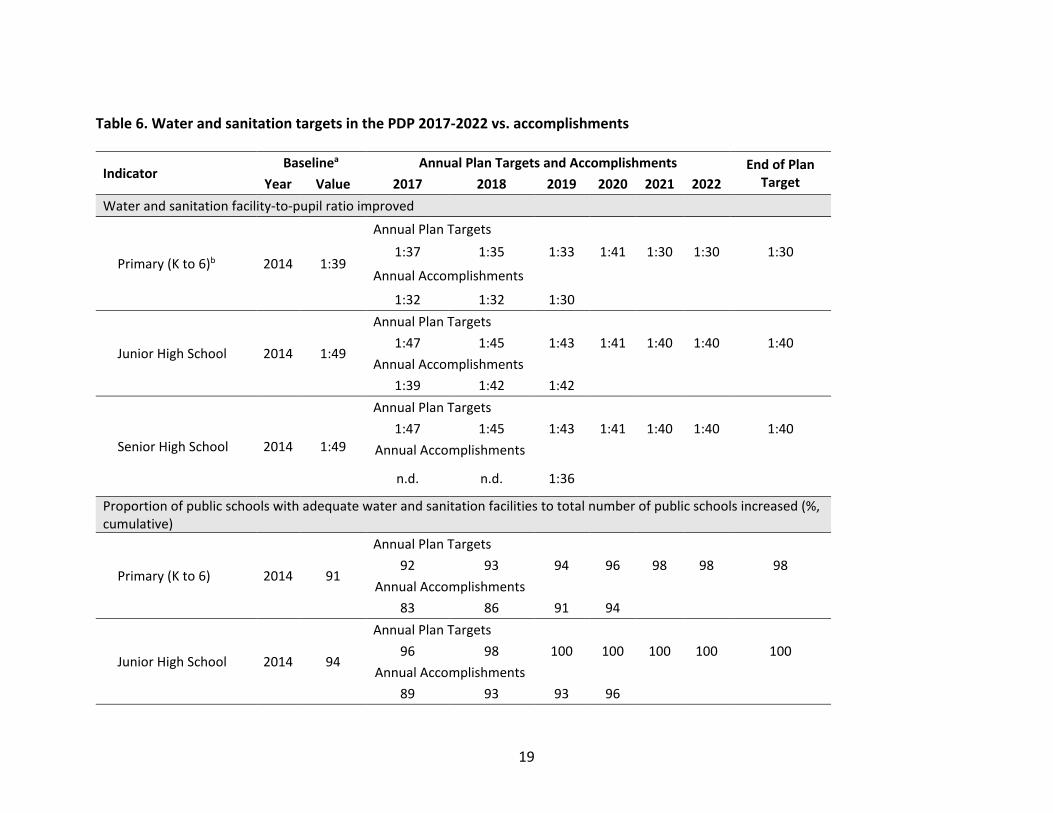
A case study conducted by the PPP Center showed that the PSIP-Phase 1 suffered delays. The following issues affected the timely delivery of milestones: delay in independent consultant procurement because of initial failed bidding; project site issues such as inaccessibility, poor security, geotechnical concerns, presence of obstructions, bad weather condition, and delay in getting replacement sites; delay in LGU permit issuances; and issues with sub-contractors such as sub-contractor abandoning their assigned sub-projects, hence resulting in re-contracting for new sub-contractors. Both the DepEd and the PPP Center documented key learnings from the PSIP-Phase 1 and these include the following: ensuring there is enough time for conducting site inspection and other preparation activities for site identification to avoid delays related to project site issues; improving site appraisal reports by including such information as hazards, climate type, presence of obstruction on the site, setback requirements, possible security issues, distance and travel time from town proper or distance from port for island location, and other incidental works; incorporating clear contract provisions on lease payment, periodic maintenance works, and furniture and fixtures warranty; improving the minimum performance standards and specifications to ensure that all classrooms are conducive for learning; having a dedicated PPP unit in DepEd; as early as during the project development stage, ensuring close coordination among the DepEd regional offices, LGUs, and other stakeholders; greater effort in marketing the PPP opportunities to encourage and increase bidders’ participation; ascertaining the payment mechanisms prior to the bidding proper and sharing relevant guidelines with the bidders; and engaging the independent consultant as early as during project procurement and improving the evaluation and certification procedure of the independent consultant (DepEd and PPP Center 2020). These lessons can be applied not only in future PPPs for school building projects but even in regular contracting or sub-contracting by the DPWH for school building projects. The DepEd also reported that it is open to implement another PPP project and apply the lessons from the experience in implementing the PSIP-Phases 1 and 2 (DepEd-OUA 2020a). 3.2 Water, sanitation, and hygiene facilities In February 2016, the DepEd institutionalized policy and guidelines for the comprehensive Water, Sanitation and Hygiene (WASH) in Schools Program, or the WinS Program, through DepEd Order Number 10 series of 2016. The DepEd recognized at the time that the lack of access to safe and clean water as well as poor sanitation and hygiene practices led to about 43.7 percent of pre-school children and 44.7 percent of school-age children being infected with soil-transmitted helminths or parasitic worms. The department order then set basic requirements and standards such as regular water supply, regular monitoring of water quality, access to functional toilets with individual handwashing facilities for boys and girls, proper septage and waste water disposal, program on supervised group daily handwashing and toothbrushing, health education, and deworming activities (DepEd 2016). The shortage of water and sanitation facilities is also recognized in the assessment part of the PDP 2017-2022 document. The 2017 edition of the PDP reported that 3,819 schools lacked water supply and sanitation facilities (NEDA 2017). Although the assessment did not state what the baseline year is, it may be deduced from the results matrices released by the NEDA that the PDP adopted 2014 as base year for the assessment (NEDA 2021b). The PDP 2017-2022 also included in its strategies for social infrastructure the provision of water and sanitation facilities for schools. The
18
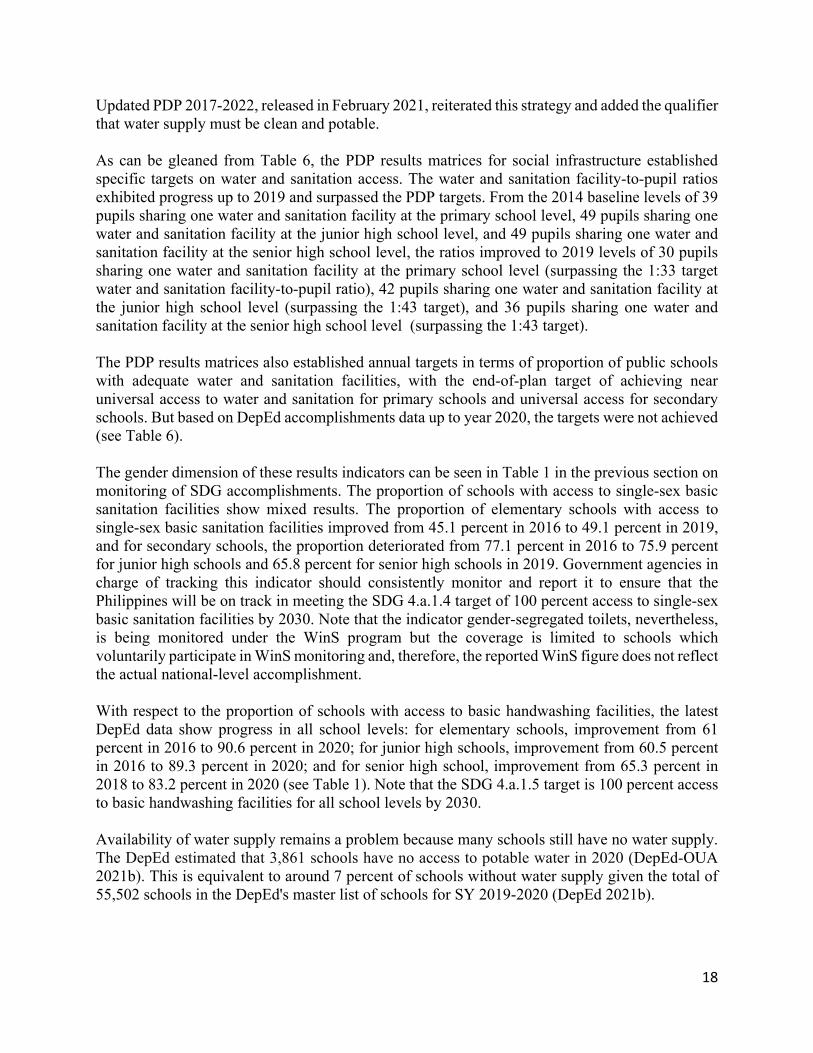
Updated PDP 2017-2022, released in February 2021, reiterated this strategy and added the qualifier that water supply must be clean and potable. As can be gleaned from Table 6, the PDP results matrices for social infrastructure established specific targets on water and sanitation access. The water and sanitation facility-to-pupil ratios exhibited progress up to 2019 and surpassed the PDP targets. From the 2014 baseline levels of 39 pupils sharing one water and sanitation facility at the primary school level, 49 pupils sharing one water and sanitation facility at the junior high school level, and 49 pupils sharing one water and sanitation facility at the senior high school level, the ratios improved to 2019 levels of 30 pupils sharing one water and sanitation facility at the primary school level (surpassing the 1:33 target water and sanitation facility-to-pupil ratio), 42 pupils sharing one water and sanitation facility at the junior high school level (surpassing the 1:43 target), and 36 pupils sharing one water and sanitation facility at the senior high school level (surpassing the 1:43 target). The PDP results matrices also established annual targets in terms of proportion of public schools with adequate water and sanitation facilities, with the end-of-plan target of achieving near universal access to water and sanitation for primary schools and universal access for secondary schools. But based on DepEd accomplishments data up to year 2020, the targets were not achieved (see Table 6). The gender dimension of these results indicators can be seen in Table 1 in the previous section on monitoring of SDG accomplishments. The proportion of schools with access to single-sex basic sanitation facilities show mixed results. The proportion of elementary schools with access to single-sex basic sanitation facilities improved from 45.1 percent in 2016 to 49.1 percent in 2019, and for secondary schools, the proportion deteriorated from 77.1 percent in 2016 to 75.9 percent for junior high schools and 65.8 percent for senior high schools in 2019. Government agencies in charge of tracking this indicator should consistently monitor and report it to ensure that the Philippines will be on track in meeting the SDG 4.a.1.4 target of 100 percent access to single-sex basic sanitation facilities by 2030. Note that the indicator gender-segregated toilets, nevertheless, is being monitored under the WinS program but the coverage is limited to schools which voluntarily participate in WinS monitoring and, therefore, the reported WinS figure does not reflect the actual national-level accomplishment. With respect to the proportion of schools with access to basic handwashing facilities, the latest DepEd data show progress in all school levels: for elementary schools, improvement from 61 percent in 2016 to 90.6 percent in 2020; for junior high schools, improvement from 60.5 percent in 2016 to 89.3 percent in 2020; and for senior high school, improvement from 65.3 percent in 2018 to 83.2 percent in 2020 (see Table 1). Note that the SDG 4.a.1.5 target is 100 percent access to basic handwashing facilities for all school levels by 2030. Availability of water supply remains a problem because many schools still have no water supply. The DepEd estimated that 3,861 schools have no access to potable water in 2020 (DepEd-OUA 2021b). This is equivalent to around 7 percent of schools without water supply given the total of 55,502 schools in the DepEd's master list of schools for SY 2019-2020 (DepEd 2021b).
19
Table 6. Water and sanitation targets in the PDP 2017-2022 vs. accomplishments
Indicator Baselinea Annual Plan Targets and Accomplishments End of Plan
Target Year Value 2017 2018 2019 2020 2021 2022 Water and sanitation facility-to-pupil ratio improved
Primary (K to 6)b 2014 1:39
Annual Plan Targets
1:37 1:35 1:33 1:41 1:30 1:30 1:30
Annual Accomplishments
1:32 1:32 1:30
Junior High School 2014 1:49
Annual Plan Targets
1:47 1:45 1:43 1:41 1:40 1:40 1:40 Annual Accomplishments
1:39 1:42 1:42
Senior High School 2014 1:49
Annual Plan Targets
1:47 1:45 1:43 1:41 1:40 1:40 1:40 Annual Accomplishments
n.d. n.d. 1:36
Proportion of public schools with adequate water and sanitation facilities to total number of public schools increased (%, cumulative)
Primary (K to 6) 2014 91
Annual Plan Targets
92 93 94 96 98 98 98 Annual Accomplishments
83 86 91 94
Junior High School 2014 94
Annual Plan Targets 96 98 100 100 100 100 100
Annual Accomplishments 89 93 93 96

20
Indicator Baselinea Annual Plan Targets and Accomplishments End of Plan
Target Year Value 2017 2018 2019 2020 2021 2022
Senior High School 2014 94
Annual Plan Targets 96 98 100 100 100 100 100
Annual Accomplishments 84 95 97 98
Notes: a Most recent available data; not necessarily year-end values. bAverage ratio for primary level (disaggregated baseline values unavailable).
n.d. = no data Sources: NEDA (2021b) for the baseline and targets, DepEd EMISD-PS (2022) for the accomplishments.

21
WASH monitoring through the WinS program also reveal inadequacy of facilities. In monitoring the WinS program accomplishments, the DepEd uses an online tool where schools upload their own assessment of their respective WinS status. In effect, a participating school analyzes its own accomplishments and the schools' self-analysis aggregated by the DepEd becomes the basis for planning to address gaps or to continue improvements. The WinS monitoring system is tracking multiple indicators five of which are systematically reported as “crucial" indicators, namely: availability of safe drinking water, availability of gender-segregated toilets, having supervised daily group handwashing, availability of group handwashing facilities with soap, and access to sanitary pads. The DepEd WinS monitoring report for SY 2017-2018 to SY 2019-2020 showed an increasing participation rate of schools in the monitoring system. In SY 2017-2018, 65.6 percent of the 46,645 schools nationwide participated; in SY 2018-2019, 74.4 percent of the 47,023 schools nationwide participated; and in SY 2019-2020, 87.9 percent of 45,313 schools nationwide excluding BARMM participated. The report states that BARMM is excluded in SY 2019-2020 assessment because “no data is currently available in the region” (DepEd 2020). As Figure 2 below shows, as of SY 2019-2020, 97.6 percent of the monitored schools reported availability of safe drinking water, 61.5 percent reported availability of gender-segregated toilets, 58.6 percent reported availability of group handwashing facilities with soap, 44.1 percent reported having daily group handwashing activities, and 80.2 percent reported having access to sanitary pads. Again, care should be taken to interpret these as aggregate access rates for the participating schools only and not nationwide access rates. Figure 2. Compliance with the five crucial indicators
Source: DepEd (2020).

22
With respect to access to toilet facilities, the DepEd Order No. 10 s. 2016 set a standard pupil-to-toilet ratio of 50:1 for boys and girls (DepEd 2016). The latest available data, based on the WinS monitoring for SY 2018-2019, the assessment for which included BARMM, show large underachievement in meeting this standard. In SY 2018-2019, only 26,182 schools (55.5% of the total 47,203 schools in SY 2018-2019) were within the ratio of 50 students per toilet bowl; 5,398 schools (11.4%) have ratios of between 51 students per toilet bowl to 100 students per toilet bowl; 2,691 schools (5.7%) have ratios exceeding 100 students per toilet bowl; 734 schools (1.6%) have no toilet at all; and 12,018 schools (25.5%) have no data in the WinS monitoring system (DepEd-OUA 2021b). In assessing how the Philippines is performing on the WASH indicators relative to other countries, we can refer to the progress report produced by the Joint Monitoring Programme (JMP) of the United Nations Children Fund (UNICEF) and the World Health Organization (WHO) for the SDGs related to WASH. The latest report used 2019 data from the surveyed countries (UNICEF and WHO 2020). The JMP uses service ladders for WASH in schools in benchmarking across countries and defines three levels of service, namely, basic service, limited service, and no service (see Box 2 for the definitions). Box 2. UNICEF and WHO JMP service ladders for WASH in schools Drinking water Basic service - Drinking water from an improved source and water is available at the school at the time of the survey Limited service - Drinking water from an improved source but water is unavailable at the school at the time of the survey No service - Drinking water from an unimproved source or no water source at the school Sanitation Basic service - Improved sanitation facilities at the school that are single-sex and usable (available, functional and private) at the time of the survey Limited service - Improved sanitation facilities at the school that are either not single-sex or not usable at the time of the survey No service - Unimproved sanitation facilities or no sanitation facilities at the school Hygiene Basic service - Handwashing facilities with water and soap available at the school at the time of the survey Limited service - Handwashing facilities with water but no soap available at the school at the time of the survey No service - No handwashing facilities or no water available at the school Source: Lifted in full from UNICEF and WHO (2020, p.6).

23
A comparison of the Philippines with other countries shows that the country is lagging behind most countries in the Eastern and South-Eastern Asia region7 given that it is below the median with respect to the three WASH indicators. In 2019, only 47 percent of Philippine schools had access to basic drinking water service (Figure 3), only 39 percent of Philippine schools had access to basic sanitation service (Figure 4), and only 54 percent of schools had access to basic hygiene services (Figure 5).
Figure 3. Access to drinking water of schools in Eastern and South-Eastern Asia, 2019
Notes: a Referred to in the source as China, Hong Kong Special Administrative Region; b Referred to in the source as
China, Macao Special Administrative Region; c Popularly known as South Korea; d Referred to in the source as Lao People’s Democratic Republic; e Referred to in the source as Democratic People’s Republic of Korea, popularly known as North Korea.
Source: UNICEF and WHO (2020).
7 The Eastern and South-Eastern Asia region is one of the major regional groups being monitored by the UNICEF and WHO Joint Monitoring Programme for WASH indicators. For consistency, the same region is used in coming up with cross-country comparisons in the rest of this paper.
>99 >99 >99 >99 9875 74 73 73 69
47
2
2411
5
20
227 17 27 34
33
0%
20%
40%
60%
80%
100%
Perc
enta
ge (%
)
Basic Limited No Service Insufficient Data

24
Figure 4. Access to sanitation facilities of schools in Eastern and South-Eastern Asia, 2019
Notes: a Referred to in the source as China, Hong Kong Special Administrative Region; b Referred to in the source as
China, Macao Special Administrative Region; c Popularly known as South Korea; d Referred to in the source as Lao People’s Democratic Republic; e Referred to in the source as Democratic People’s Republic of Korea, popularly known as North Korea.
Source: UNICEF and WHO (2020). Figure 5. Access to hygiene facilities of schools in Eastern and South-Eastern Asia, 2019
>99 >99 >99 >99 >99
68 63
32 40 38 3916
21
30
4628
53
62
1638
1434
822
0%
20%
40%
60%
80%
100%
Perc
enta
ge (%
)
Basic Limited No Service Insufficient Data
>99 >99 >99 >99 98
5941 48 59 60 54
35
>99
2
365
10 11
2347
31 36
0%
20%
40%
60%
80%
100%
Perc
enta
ge (%
)
Basic Limited No Service Insufficient Data

25
Notes: a Referred to in the source as China, Hong Kong Special Administrative Region; b Referred to in the source as
China, Macao Special Administrative Region; c Popularly known as South Korea; d Referred to in the source as Lao People’s Democratic Republic; e Referred to in the source as Democratic People’s Republic of Korea, popularly known as North Korea.
Source: UNICEF and WHO (2020). Note from the figures above that there are Southeast Asian countries that have lower per capita GDP than the Philippines and yet were still able to achieve higher WASH access rates in 2019. These are Myanmar, Cambodia, and Timor-Leste. The 2019 GDP per capita in constant 2017 dollars of the Philippines was 8,914.72, higher than that of Myanmar which was at 4,739.71, Cambodia at 4,388.80, and Timor-Leste at 3,626.67 (World Bank n.d.). But with respect to access to drinking water and sanitation, schools in Myanmar, Cambodia, and Timor-Leste had higher access rates than the schools in the Philippines (Figure 3 and Figure 4), and with respect to access to hygiene facilities, schools in Myanmar and Timor-Leste had higher access rates than schools in the Philippines (Figure 5). There is no readily available data on countries’ annual expenditure for WASH facilities, but these results suggest that the Philippines has not been investing enough in WASH facilities compared with its Southeast Asian peers that have lower per capita income. Despite the information gaps in monitoring, it can be clearly inferred from available data that the Philippines needs to accelerate investments in WASH facilities. At present, WASH programs in schools are funded through the maintenance and other operating expenses (MOOE) budget of schools. The DepEd Order No. 10 s. 2016 placed on the school head the responsibility of ensuring that the basic requirements and standards are met. It also specifies that the DepEd Central Office shall allocate funds and prepare logistical programs and funding through schools' MOOE budgets. The MOOE budgets of schools are supposed to fund the maintenance and repair of toilets, handwashing facilities, drinking water supply, clean running water for hygiene and sanitation, and waste disposal facilities. In addition, the annual BEF budget of DepEd for school building program also covers the water and sanitation facilities of the new school buildings and replacement school buildings. Although a significant number of schools have no data (i.e., BARMM data for SY 2019-2020 is unavailable, and 25.5% of schools in SY 2018-2019 have no data), the monitored indicators still reveal that past government expenditures had not been enough. The private sector may play a role in augmenting public investments in WASH access for schools, but not in the sense of a PPP contracting scheme as was done for the school building program. PPP contracts for water and sanitation facilities may be better suited for service areas with scale economies from residential and commercial demand rather than for schools that are spread in various locations. As an alternative, the private sector can sustain at least two roles in WASH in schools. One is as developer of low-cost technologies that can meet the requirements of schools facing cost constraints due to the geography or socioeconomic characteristics of their location. Another is as partner of schools in the demonstration of corporate social responsibility practices that integrate WASH projects and programs for the health and wellbeing of the future workforce.

26
3.3 Electricity access Ensuring that schools have access to electricity is an important part of the strategies for social infrastructure under the PDP. The first edition of the PDP 2017-2022 claimed that school buildings will be provided with electric power, among other complementary facilities (NEDA 2017). The Updated PDP 2017-2022 maintained that such will continuously be provided, and electrification of public schools will consider the use of renewable energy sources such as through installation of solar panels (NEDA 2021a). Targeting and monitoring accomplishments in this area is through the indicator "proportion of schools with electricity access." The PDP Results Matrices articulate the PDP targets and the PSA's StatDev for monitoring of PDP targets report the accomplishments on this indicator, but as a proportion of public schools only (NEDA 2021b; PSA 2020). Table 7 below on PDP monitoring shows accomplishments up to 2020. Schools’ electricity access is also part of SDG 4.a.1 monitoring indicators (PSA 2021). The indicator for schools' electricity access in the SDG monitoring is as a proportion of all schools rather than as a proportion of public schools only. Recall that Section 2.2 on Monitoring of SDG Target 4.a.1 indicators in the Philippines shows the targets and accomplishments on school electrification based on the SDG monitoring (see Table 1 ).

27
Table 7. Electrification targets in the PDP 2017-2022 vs. accomplishments
Indicator Baseline Annual Plan Targets and Accomplishments End of
Plan Target Year Value 2017 2018 2019 2020 2021 2022
Proportion of public schools with connection to electricity to total number of public schools increased (%, cumulative)
Primary (K to 6) 2015 85
Annual Plan Targets
95 87 88 90 92 94 95
Annual Accomplishments
92 95 97 98
Junior High School 2015 95
Annual Plan Targets
100 95 96 97 98 99 100
Annual Accomplishments
96 96 98 99
Senior High School 2015 95
Annual Plan Targets
100 95 96 97 98 99 100
Annual Accomplishments 89 92 98 98
Sources: National Economic and Development Authority (2021) for the targets, Philippine Statistics Authority (2020) and DepEd EMISD-PS (2022) for the accomplishments.
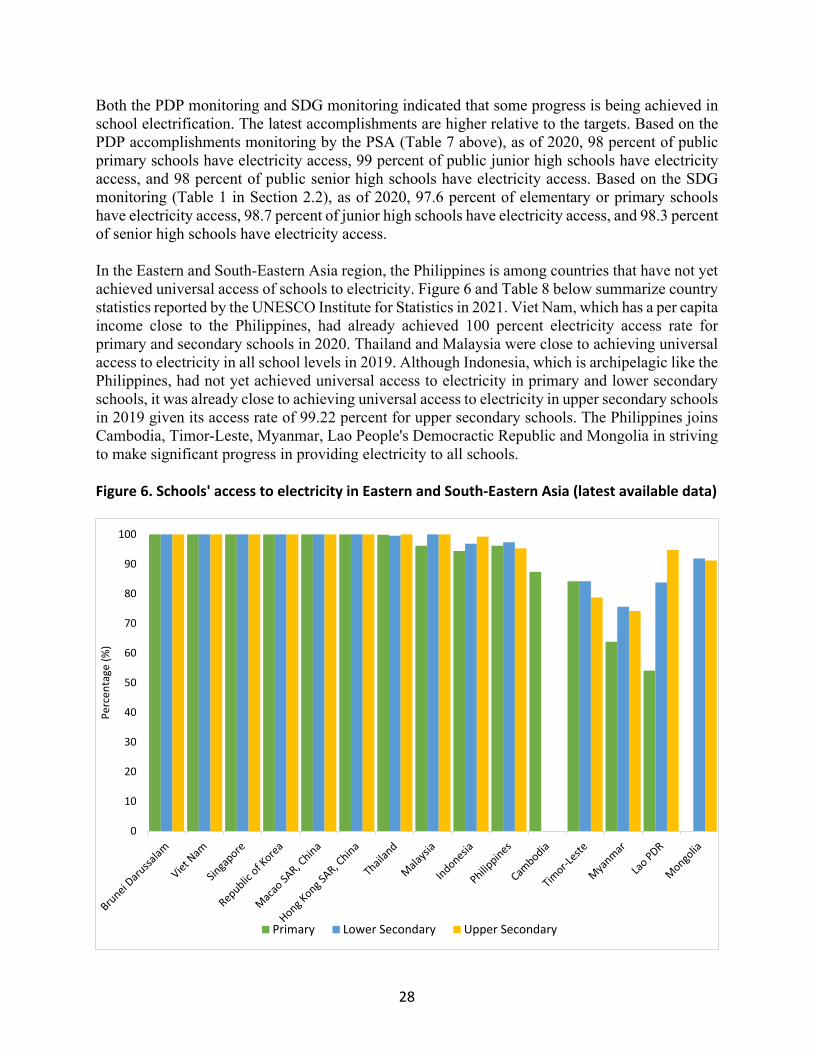
28
Both the PDP monitoring and SDG monitoring indicated that some progress is being achieved in school electrification. The latest accomplishments are higher relative to the targets. Based on the PDP accomplishments monitoring by the PSA (Table 7 above), as of 2020, 98 percent of public primary schools have electricity access, 99 percent of public junior high schools have electricity access, and 98 percent of public senior high schools have electricity access. Based on the SDG monitoring (Table 1 in Section 2.2), as of 2020, 97.6 percent of elementary or primary schools have electricity access, 98.7 percent of junior high schools have electricity access, and 98.3 percent of senior high schools have electricity access. In the Eastern and South-Eastern Asia region, the Philippines is among countries that have not yet achieved universal access of schools to electricity. Figure 6 and Table 8 below summarize country statistics reported by the UNESCO Institute for Statistics in 2021. Viet Nam, which has a per capita income close to the Philippines, had already achieved 100 percent electricity access rate for primary and secondary schools in 2020. Thailand and Malaysia were close to achieving universal access to electricity in all school levels in 2019. Although Indonesia, which is archipelagic like the Philippines, had not yet achieved universal access to electricity in primary and lower secondary schools, it was already close to achieving universal access to electricity in upper secondary schools in 2019 given its access rate of 99.22 percent for upper secondary schools. The Philippines joins Cambodia, Timor-Leste, Myanmar, Lao People's Democractic Republic and Mongolia in striving to make significant progress in providing electricity to all schools. Figure 6. Schools' access to electricity in Eastern and South-Eastern Asia (latest available data)
0
10
20
30
40
50
60
70
80
90
100
Perc
enta
ge (%
)
Primary Lower Secondary Upper Secondary
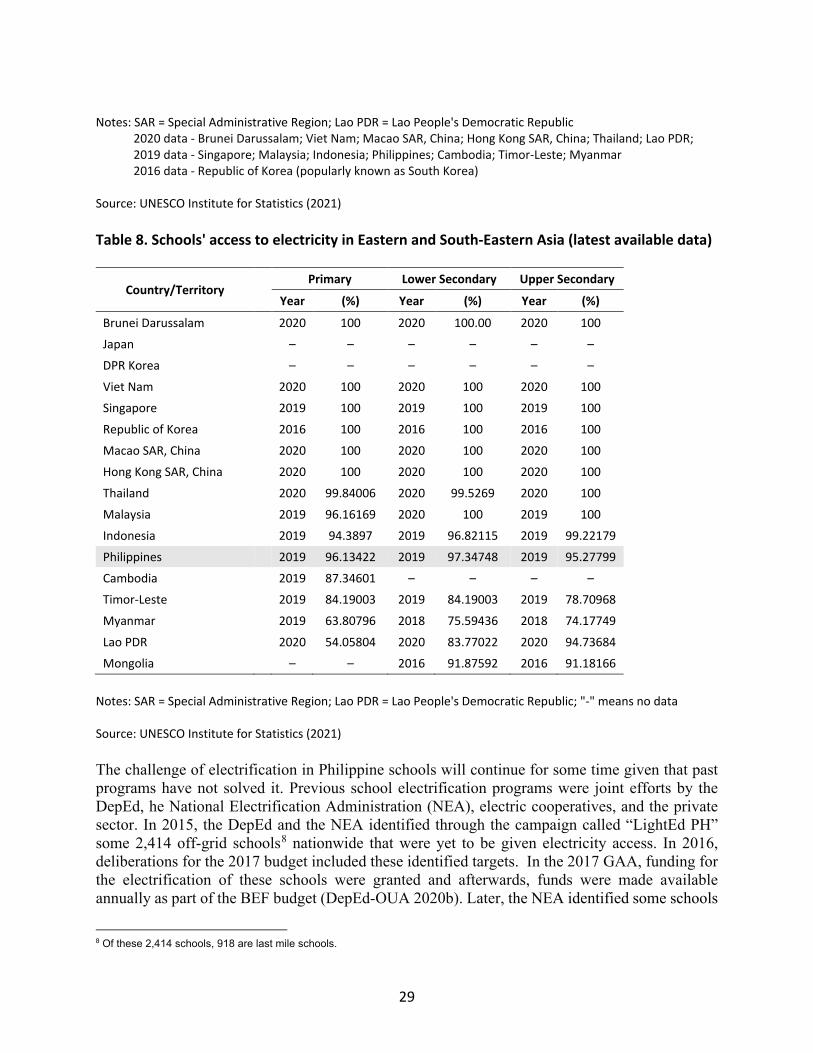
29
Notes: SAR = Special Administrative Region; Lao PDR = Lao People's Democratic Republic
2020 data - Brunei Darussalam; Viet Nam; Macao SAR, China; Hong Kong SAR, China; Thailand; Lao PDR; 2019 data - Singapore; Malaysia; Indonesia; Philippines; Cambodia; Timor-Leste; Myanmar 2016 data - Republic of Korea (popularly known as South Korea)
Source: UNESCO Institute for Statistics (2021) Table 8. Schools' access to electricity in Eastern and South-Eastern Asia (latest available data)
Country/Territory Primary Lower Secondary Upper Secondary
Year (%) Year (%) Year (%)
Brunei Darussalam 2020 100 2020 100.00 2020 100
Japan – – – – – –
DPR Korea – – – – – –
Viet Nam 2020 100 2020 100 2020 100
Singapore 2019 100 2019 100 2019 100
Republic of Korea 2016 100 2016 100 2016 100
Macao SAR, China 2020 100 2020 100 2020 100
Hong Kong SAR, China 2020 100 2020 100 2020 100
Thailand 2020 99.84006 2020 99.5269 2020 100
Malaysia 2019 96.16169 2020 100 2019 100
Indonesia 2019 94.3897 2019 96.82115 2019 99.22179
Philippines 2019 96.13422 2019 97.34748 2019 95.27799
Cambodia 2019 87.34601 – – – –
Timor-Leste 2019 84.19003 2019 84.19003 2019 78.70968
Myanmar 2019 63.80796 2018 75.59436 2018 74.17749
Lao PDR 2020 54.05804 2020 83.77022 2020 94.73684
Mongolia – – 2016 91.87592 2016 91.18166
Notes: SAR = Special Administrative Region; Lao PDR = Lao People's Democratic Republic; "-" means no data Source: UNESCO Institute for Statistics (2021) The challenge of electrification in Philippine schools will continue for some time given that past programs have not solved it. Previous school electrification programs were joint efforts by the DepEd, he National Electrification Administration (NEA), electric cooperatives, and the private sector. In 2015, the DepEd and the NEA identified through the campaign called “LightEd PH” some 2,414 off-grid schools8 nationwide that were yet to be given electricity access. In 2016, deliberations for the 2017 budget included these identified targets. In the 2017 GAA, funding for the electrification of these schools were granted and afterwards, funds were made available annually as part of the BEF budget (DepEd-OUA 2020b). Later, the NEA identified some schools
8 Of these 2,414 schools, 918 are last mile schools.

30
that were on-grid but were still without electricity connection and these became part of the annual BEF targeting. In addition, the private sector contributed and continues to contribute to the electrification of schools, such as through the partnership between the DepEd and the One Meralco Foundation (Estabillo 2021). But despite these programs, many schools still lack access to electricity. The DepEd recorded that as of 2020, 1,562 schools still had no electricity connection, based on the results of the DepEd surveys “Learner Enrollment Survey Form as of July 31, 2020” and “DepEd Q&A FY 2020” for SY 2019-2020.9 Adding to this concern is the need to upgrade the existing electricity connections of many schools to stabilize electricity current fluctuations and avoid fires as well as meet the requirements of laboratory facilities such as computer laboratories. As of 2020, the DepEd reported that 39,335 schools need upgrading of their electrical connections (DepEd-OUA 2020b). 3.4 ICT access The DepEd’s comprehensive program on the use of ICT in basic education started in 1996 through its 10-Year Modernization Program (1996-2005), which involved the use of ICT and supply of computer laboratory packages in schools to improve the teaching and learning processes as well as school administration procedures. In implementing the program, other agencies supported the DepEd, such as the Department of Trade and Industry through its “Personal Computers for Public Schools” project and the then Commission on Information and Communications Technology through its “iSchool Project”10 (DepEd 2018). At present, the DepEd’s major program on expanding schools' access to computers is the DepEd Computerization Program, the comprehensive guidelines for which can be traced from DepEd Order No. 78 s. 2010. The program generally aims to improve the quality of basic education and specifically targets to reduce the computer backlog in public schools by providing them computer laboratory packages or e-classroom packages as well as training for school staff on simple trouble shooting (DepEd 2010). The learner-to-computer ratios used to be reported in tracking progress; for instance, using government data, the UNESCO Institute for Statistics in 2012 reported that the Philippines had a learner-to-computer ratio in public schools of 412 learners per computer in the primary school level and 49 learners per computer in the secondary school level (UNESCO Institute for Statistics 2014). At present, these are no longer systematically reported given that the focus is to ensure that the 1:1 learner-to-computer ratio is achieved in the classroom for ICT education, not necessarily in all classes as there are classes that do not need computers. Thus, the ICT developmental objective in the Philippine basic education sector focuses on providing computer packages, which essentially means equipping computer laboratories with necessary and up-to-date hardware and software. The PDP 2017-2022 first edition highlighted the delivery of ICT equipment as one of the implementation strategies that will ensure the success of the K to 12 program (NEDA 2017, p.
9 In discussion with DepEd Director Roger Masapol via email dated October 21, 2021 and DepEd reply letter dated October 25, 2021. 10 The Commission on Information and Communications Technology was one of the precursors of the Department of Information and Communications Technology. Its "iSchool Project" involved the giving out of "iSchool" packages which consisted of hardware including 19 desktop computers, software, one year of broadband internet access, and 5 training programs (Foronda 2011).

31
153). To track progress, the PDP Results Matrices included the indicator "proportion of public schools with computer packages." Table 9 below presents the PDP annual targets for 2017-2022 and the accomplishments up to 2019 for this indicator. It shows that the annual targets were not met for both the primary and junior high school levels. (There is no report on the PDP annual targets and accomplishments at the senior high school level.) Not only that, there was also a regression in the accomplishments at the junior high school level in 2018 and 2019. For primary schools, the accomplishment in 2017 was 78 percent of public primary schools with computer packages against a 95 percent target, 78 percent accomplishment against a 99 percent target in 2018, and 79 percent accomplishment against 100 percent target in 2019. For junior high schools, the accomplishment in 2017 was 82 percent of public junior high schools with computer packages (a regression from the 2018 baseline of 91 percent of public junior high schools with computer packages) against a 95 percent target, 81 percent accomplishment against a 99 percent target in 2018, and 80 percent accomplishment against 100 percent target in 2019. The PDP Results Matrices also include broadening the schools’ access to the internet. However, the indicator is again for public schools only. Table 10 below shows underachievement relative to the targets; in all school levels, the annual targets were not met, except for senior high school in 2018. Going back to the SDG table in Section 2.2 (see Table 1 in the previous section), we can also see gaps in access to computers for pedagogical purposes. The access rates in 2020 were 81.6 percent at the elementary school level, 84.4 percent at the junior high school level, and 81.5 percent at the senior high school level. With respect to internet access, the SDG reporting also shows low internet access rates in schools: 64.2 percent at the elementary school level, 60.4 percent at the junior high school level, and 67.3 percent at the senior high school level (see Table 1).11 Clearly, the problem is still huge. The Updated PDP 2017-2022 recognizes this problem in its assessment of the education sector in the time of COVID-19 and notes that “As flexible learning will need [to] be adopted to continue delivery of education services during the COVID-19 pandemic, issues of expensive, slow, and unreliable internet connection, and added expenses for devices needed to access online learning resources are major challenges” (NEDA 2021, p. 10-6). The non-achievement of targets on computer packages delivery to public schools and the low internet access rates in all school levels suggest public investment problems. An examination of project-level public documents and media releases reveals that there had indeed been problems in the implementation of the DepEd Computerization Program (DCP) and the DepEd Internet Connectivity Project.
11 Note that juxtaposing the SDG accomplishments versus PDP targets is not feasible as the former covers all schools whereas the latter covers public schools only.

32
Table 9. Proportion of public schools with computer packages, PDP 2017-2022 targets vs. accomplishments
Indicator Baseline Annual Plan Targets and Accomplishments End of
Plan Target Year Value 2017 2018 2019 2020 2021 2022
Proportion of public schools with computer packages to total number of public schools increased (%, cumulative)
Primary (K to 6) 2015 67
Annual Plan Targets
95 99 100 100 100 100 100
Annual Accomplishments
78 78 79
Junior High School 2015 91
Annual Plan Targets
95 99 100 100 100 100 100 Annual Accomplishments
82 81 80
Note: The 2021 Enhanced PDP Results Matrices does not include the indicator "Proportion of public schools with computer packages to total number of public schools increased"; thus, the 2019 PDP Results Matrices was used in getting the annual targets for this indicator. The 2019 PDP Results Matrices does not include targets at the senior high school level for this indicator. Although the 2021 Enhanced PDP Results Matrices includes internet access as another ICT indicator for monitoring, there is no accomplishment report in the 2020 StatDev monitor (latest release) for this indicator; thus, internet access is no longer included in this table.
Sources: NEDA (2019) for the targets, PSA (2020) for the accomplishments.

33
Table 10. Internet access targets in the PDP 2017-2022 vs. accomplishments
Indicator Baseline Annual Plan Targets and Accomplishments End of
Plan Target Year Value 2017 2018 2019 2020 2021 2022
Proportion of public schools with internet access to total number of public schools increased (%, cumulative)
Primary (K to 6) 2015 20
Annual Plan Targets
100 40 60 70 80 90 100
Annual Accomplishments
32 58 62 64
Junior High School 2015 54
Annual Plan Targets
100 60 70 80 90 95 100
Annual Accomplishments
34 80 72 72
Senior High School 2015 54
Annual Plan Targets
100 60 70 80 90 95 100
Annual Accomplishments 31 72 61 67
Sources: NEDA (2021) for the targets, PSA (2020) and DepEd EMISD-PS (2022) for the accomplishments.

34
Under the DCP, the targeting of accomplishments was based on the number of computer laboratory packages or e-classroom packages although the components of a standard package vary per year. Specifically, the hardware components are not fixed for all the years of implementation and were defined per budget year. For instance, in 2010, DepEd Order No. 78 s. 2010 standardized the requirements as follows: an e-classroom package for elementary schools consisted of 1 host personal computer (PC), 6 sets of liquid crystal display (LCD) monitor, keyboard and mouse, 2 desktop virtualization kits, 1 universal power supply (UPS) unit, 1 interactive white board, 1 printer, and 1 projector; and a computer laboratory package for secondary schools consisted of 11 desktop PCs, 1 wireless broadband router, 11 UPS units, and 1 printer (DepEd 2010). In the 2014 DCP Orientation Handbook, the packages were changed as follows: for elementary schools, the package included 1 host PC, 6 units of desktop virtualization/access terminal/thin client12, 1 printer, 2 units of projector, and required peripherals; and for secondary schools, the package included 8 host PCs, 42 units of desktop virtualization/access terminal/thin client, 1 printer, and required peripherals (DepEd 2014). In the 2018 DCP Orientation Handbook, for projects using the 2017 budget onwards, the packages were also adjusted: the package for Kinder to Grade 3 included 1 laptop, 1 projector, and 1 multimedia speaker; the package for Grade 4 to Grade 6 included 12 host mini-PCs, 12 sets of LED monitor, keyboard, mouse, and UPS, 2 laptops, 2 television sets, and 1 wi-fi router; and for junior and senior high school, the package included 2 host mini-PCs, 2 UPS, 50 tablet PCs, 1 laptop, 2 television sets, 1 wi-fi router, and 1 printer (DepEd 2018). Software and training are included in the packages. The guidelines also allow the augmentation of equipment for schools with large student population. Since 2019, the DepEd has been replacing computer laboratories with “mobile laboratories”, which use tablets and laptops that can be moved from one classroom to another. This has the following advantages: freeing up more space for regular classes as there is no need to dedicate a classroom for the sole use of ICT classes and the mobile laboratories can be used by different classes in shifts; minimizing class disruptions given that sufficiently charged laptops and tablets allow ICT classes to continue during power interruptions; and easier maintenance as students and teachers are able move the mobile laboratories to safe locations during typhoons and other emergencies (DepEd-OUA 2021c). The failure to meet targets in computer packages under the DCP was actually raised by the Commission on Audit (COA) in 2019 and 2020. In its 2019 audit, the COA noted that as of December 31, 2019, under the DCP funded by the GAA from 2015 to 2019, the accomplishment was only 59.43 percent as “only 8,523 schools out of the 14,342 targeted schools were provided ICT packages” (COA 2019, p. 385). The deficiencies included, among others: non-delivery of certain ICT packages, belated completion of procurement and delivery, delay by suppliers due to typhoons and other unforeseen events, lapses in the procurement process, and partial or non-utilization of certain ICT packages due to non-readiness of recipient schools. There were also cases when a few weeks after delivery, some of the computers could no longer be used as these turned out to be defective, and yet there were no after-sales services and the warranty privileges could not be availed of because the supplier could no longer be contacted (COA 2019).
12 A “thin client” is a computer that relies on the server rather than a localized hard drive to perform computing tasks. In using a thin client, “either a dedicated thin client terminal or a regular PC with thin client software is used to send keyboard and mouse input to the server and receive screen output in return” (PCMag n.d.)
35
On the readiness of schools, the DepEd actually requires counterpart requirements or criteria from beneficiary schools. The beneficiary school must have: on-site, stable, and continuous supply of electricity; at least one teacher who is assigned to handle computer education classes, can manage the computer laboratory, and willing to be trained; at least one teacher for each subject of English, Science, and Math and who is willing to be trained; capacity to mobilize counterpart support from other stakeholders in the community for needed structures or facilities; never been a recipient of computers from other programs (e.g., DTI’s PCs for Public Schools Project) unless the equipment is due for replacement and augmentation; and a strong partnership with other stakeholders to ensure sustainability of the program (DepEd 2010). The COA reported in 2019 that their validation on the field revealed that some schools were not ready to receive the ICT packages due to lack of multi-media or computer room, proper and sufficient electrical wiring and circuit breaker, and ventilation via window grills. Moreover, although some schools have computer rooms for the ICT packages, these were not properly set up following the prescribed layout (COA 2019). In its 2020 audit report, noting the implementation of the DCP funded by GAA 2018 to 2020, the COA observed that as of December 31, 2020, “the DCP has a physical accomplishment of 7,555 ICT packages out of the total targeted 46,382 ICT packages delivered or an accomplishment of 16.29%” (COA 2020a, p. 484). Although the COA report included the e-textbook packages in the count of physical targets and accomplishments (7,471 are e-textbook packages, 85.45% or 6,384 of which have been delivered), the low overall accomplishment rate still signals problems in implementation. As reported by the COA, delays in procurement is a serious problem given that there were 60 to 317 calendar days of delay for the procurement activities in fiscal year 2020, which the DepEd attributed to the COVID-19 crisis and the mobility restrictions and limitations of the procuring entity, bidders, and suppliers (COA 2020a). As part of its ICT program, the DepEd launched in 2009 the DepEd Internet Connectivity Project (DICP), which initially covered public high schools and later all public school levels. The DepEd through its Order No. 50 s. 2009 allotted MOOE funds for public schools to avail of internet subscription and directed that those schools with computer laboratories should connect through their local area network to the internet and those schools without computer laboratories should have at least one computer connected to the internet (DepEd 2009). In 2011, the revised guidelines included the need to assess the performance of internet service providers (ISPs) before renewing internet subscriptions, conduct public bidding if there are more than one ISP in the service area, and engage in direct contracting if there is only one ISP in the service area (DepEd 2011). However, it had been difficult to accelerate internet access expansion for schools because in the first place, internet coverage was very low in the country. In 2011, there were only 320 ISPs in the country and the Philippines’ fixed broadband subscription rate was only 1.9 per 1,000 inhabitants, which was very low compared to the subscription rates of its ASEAN neighbors such as Vietnam (4.3 per 1,000 inhabitants), Brunei Darrussalam (5.9 per 1,000 inhabitants), Malaysia (8.8 per 1,000 inhabitants) and Singapore (27.2 per 1,000 inhabitants) (PSA 2018). The Department of Information and Communication Technology (DICT) offered to help the DepEd expand internet access in schools through its ongoing “Free Wi-Fi Internet Access in Public Places Project”, also called “Pipol Konek”, and entered into a Joint Memorandum Circular with the DepEd in 2018 for this purpose (DepEd and DICT 2018). But the Pipol Konek project had also

36
been marred by problems, which slowed down project implementation. The slow implementation of the Pipol Konek project also affected its public schools component. Implementing the Pipol Konek project is actually one of the major challenges of the DICT, a relatively young government agency. In 2017, RA 10929 or the “Free Internet Access in Public Places Act of 2017” mandated the DICT, which was then a newly created agency, to implement a program that will provide free access to internet service in public places. The public places covered include national and local government offices, public schools, alternative learning centers, state universities and colleges, public technology institutions, public hospitals, public health centers, rural health clinics, public parks, public libraries, barangay reading centers, public airports and seaports, and public transport terminals. The law also directed the DICT to develop a comprehensive plan for the program within one year from the effectivity of the law (Republic Act 10929). The DICT then enhanced the existing Pipol Konek project of the Department of Science and Technology (DOST)-ICT Office (one of the offices absorbed by the DICT as mandated by the law creating it) that was launched in 2015 under the name “Juan Konek!” project (DOST-ICT Office 2015). But there were many setbacks in the implementation of the Pipol Konek project, including procurement issues (e.g., local ISPs were reluctant to bid given the huge scale of the project, and international firms found it difficult to join government procurement owing to the need for a franchising license). Geographical considerations also meant that many areas must have tailor-fit technology solutions (i.e., alternatives to the prevailing fiber optic cable technology in the Philippines which is appropriate only for geographically flat areas and not island provinces). Thus, the DICT partnered in 2019 with the United Nations Development Programme (UNDP) in accelerating the roll-out of Pipol Konek through the latter’s National Acceleration Modality that applies its procurement system and partnership agreement instruments (UNDP and DICT 2019). The agreement with the UNDP is one among three implementation modes that the DICT was using in 2019. The other modes are the DICT’s procurement of contracts with various ISPs and the use of the Philippine International Trading Corporation13 as a procurement agent. But all these three modes performed poorly. By end-December 2019, the COA noted that the Pipol Konek project had a mere 15 percent accomplishment rate for 2015-2019 implementation given that the DICT had activated only 3,251 public Wi-Fi hotspots out of the targeted 22,034 public Wi-Fi hotspots and that overall, project implementation was low in all the three modes of implementation. Many contracts for the activation of Wi-Fi hotspots were partially terminated, suspended or not yet implemented due to, among other reasons, procurement delays, failure of bidding, supplier compliance problems, pending approvals of permits or agreements, and location or site reassessments (COA 2019). The slow implementation of Pipol Konek remains a challenge as legislators continue to raise this during deliberations on the budget of the DICT. The previous discussion shows that the poor implementation of public investments on ICT for basic education is reflected in the within-country assessment of targets and accomplishments. How about benchmarking across countries? As shown below, the comparison with other countries hints
13 The PITC is a government corporation created in 1973 with a broad mandate of serving as the country’s only state trading corporation for international trading and international trade-related activities. For many years, it has been the procurement agent of choice by many government agencies for specialized goods and services for a service fee of one to four percent of the government procurement contract (COA 2020b).

37
at inadequacy of public investments--another important aspect in the unfolding account of how our learners and future generation of workers are being shortchanged. From Figure 7 and Table 11 below, we can see that across Eastern and South-Eastern Asia, many countries and territories have already achieved universal access of schools to computers. Viet Nam, Singapore, the Republic of Korea, and Macao Special Administrative Region of China are already providing computers to 100 percent of their primary and secondary schools. Thailand is already providing computers to 100 percent of its upper secondary schools and is very close to achieving universal access for primary and lower secondary schools. Hong Kong Special Administrative Region of China is also close to achieving universal access for all school levels. Malaysia already achieved universal access for its primary schools and is also close to achieving universal access for its lower secondary and upper secondary schools. Meanwhile, the Philippines is among the countries that are lagging behind its peers in the region in providing computers to primary and secondary schools. Figure 7. Schools' access to computers in Eastern and South-Eastern Asia (latest available data)
Notes: SAR = Special Administrative Region
2020 data - Viet Nam; Macao SAR, China; Thailand (primary and upper secondary); Hong Kong SAR, China 2019 data - Singapore; Thailand (lower secondary); Philippines 2018 data - Malaysia (lower secondary and upper secondary); Indonesia (primary and upper secondary); Myanmar 2017 data - Malaysia (primary); Indonesia (upper secondary) 2016 data - Republic of Korea; Mongolia
0
10
20
30
40
50
60
70
80
90
100
Perc
enta
ge (%
)
Primary Lower Secondary Upper Secondary

38
Source: UNESCO Institute for Statistics (2021) Universal access to the internet by schools have also been achieved already in many countries in the region (Figure 8 and Table 11). Viet Nam, Singapore, the Republic of Korea, and Macao Special Administrative Region of China have already achieved universal access, and Thailand and Hong Kong Special Administrative Region of China are very close to achieving universal access. Although there is no data on secondary schools for Lao People’s Democratic Republic, it is close to achieving universal access for primary schools. There is also no data on primary schools for Malaysia but it already achieved universal access for lower secondary schools and is close to achieving universal access for upper secondary schools. The Philippines, on the other hand, is among countries with low internet access rates in schools. Figure 8. Schools' access to the Internet in Eastern and South-Eastern Asia (latest available data)
Notes: SAR = Special Administrative Region; Lao PDR = Lao People's Democratic Republic
2020 data - Viet Nam; Macao SAR, China; Thailand; Hong Kong SAR, China 2019 data - Singapore; Lao PDR (primary); Philippines; Malaysia (lower secondary and upper secondary) 2018 data - Myanmar; Indonesia (lower secondary and upper secondary) 2016 data - Republic of Korea; Mongolia
Source: UNESCO Institute for Statistics (2021)
0
10
20
30
40
50
60
70
80
90
100
Perc
enta
ge (%
)
Primary Lower Secondary Upper Secondary

39
Table 11. Schools' access to computers and the Internet in Eastern and South-Eastern Asia (latest available data)
Country/Territory
Computers Internet
Primary Lower Secondary Upper Secondary Primary Lower Secondary Upper Secondary
Year (%) Year (%) Year (%) Year (%) Year (%) Year (%) Brunei Darussalam – – 2020 100 2020 100 – – – – – –
Japan – – – – – – – – – – – –
DPR Korea – – – – – – – – – – – –
Viet Nam 2020 100 2020 100 2020 100 2020 100 2020 100 2020 100
Singapore 2016 100 2019 100 2019 100 2019 100 2019 100 2019 100
Republic of Korea 2016 100 2016 100 2016 100 2016 100 2016 100 2016 100
Macao SAR, China 2020 100 2020 100 2020 100 2020 100 2020 100 2020 100 Hong Kong SAR, China 2020 99.5356 2020 96.52778 2020 95.44688 2020 99.5356 2020 96.52778 2020 95.44688
Thailand 2020 99.84006 2019 99.5269 2020 100 2020 99.84006 2020 99.5269 2020 100
Malaysia 2017 100 2018 93.04224 2018 91.81025 – – 2019 100 2019 92.23602
Indonesia 2018 40.06711 2018 48.1263 2017 67.23037 – – 2018 46.4785 2018 85.16617
Philippines 2019 77.97967 2019 88.30239 2019 76.47457 2019 29.32734 2019 65.09947 2019 81.74664
Cambodia – – – – – – – – – – – –
Timor-Leste – – – – – – – – – – – –
Myanmar 2018 0.51149 2018 2.6595 2018 24.61039 2018 0.23017 2018 1.39691 2018 13.05195
Lao PDR – – – – – – 2019 95.48998 – – – –
Mongolia – – 2016 91.87592 2016 91.18166 2016 70.65949 2016 77.54801 2016 89.06526
Notes: SAR = Special Administrative Region; Lao PDR = Lao People's Democratic Republic; "-" means no data Source: UNESCO Institute for Statistics (2021)

40
4. Policy insights and ways forward The benchmarking against targets and comparison with other countries' indicators showed us where the gaps are in the provision of school infrastructure in the Philippine basic education sector. With respect to classrooms, there had been progress in decongesting schools, but spatial inequality in classroom-student ratio exists and must be addressed. Spatial inequality is evident given the congested classrooms in NCR, Region IV-A, Region XI, and BARMM. Moreover, additional classrooms are needed given that school buildings in last mile schools need to meet quality and safety standards, enrolment is increasing, and existing classrooms deteriorate due to wear and tear and calamities. With respect to WASH facilities, the gaps are huge and become more visible when benchmarked against other countries. The Philippines is lagging behind most countries in the Eastern and South-Eastern Asia region in providing WASH facilities to schools, even when compared with neighboring countries that have lower per capita income. With respect to electricity access of schools, many countries in the Eastern and South-Eastern Asia region have already achieved universal access and yet the Philippines still struggles to complete the electrification of schools. This challenge is compounded by the need to upgrade the electricity connections of schools to stabilize electricity current fluctuations and meet digital learning requirements. The continuing problems on electricity access and quality of electricity connection worsen the digital divide in Philippine schools. ICT is another area where the gaps are huge. Computer package delivery targets were not met and to make things worse, the indicator's performance regressed. Philippine schools have low computer access rates and low internet access rates unlike many of its neighboring countries which had already achieved for their schools universal access to computers and universal access to the internet. Efforts to increase access rates had been marred by poor implementation of programs for ICT infrastructure in schools. All of these imply the need for more investments on school infrastructure. In addition, the COVID-19 pandemic is highlighting urgent action in certain areas of school infrastructure. Classroom standards need to be adjusted to incorporate good ventilation. Programs on WASH facilities need to be scaled up to support disinfection and disease transmission prevention. Adequate ICT infrastructure as well as electricity access that makes ICT work need to be ensured to support distance learning and blended learning modes. Department-level policies on programming the investment requirements, innovating on the financing modalities, and improving the implementation approaches must be issued. Moreover, legislative proposals that promote and fund inclusive approaches must be supported. The full devolution prescribed by Executive Order (EO) No. 138 s. 2021 as an offshoot of the implementation of the Supreme Court ruling on the Mandanas-Garcia case introduces complexity to the challenge of addressing the investment requirements through public sector spending. The implementation of the Supreme Court ruling that increased the LGUs' just share in national taxes beginning fiscal year 2022 reduced the national government's budget envelope for some programs, including school infrastructure. To illustrate, the Basic Education Facilities budget of the DepEd decreased from the GAA 2021 allocation of PHP11.15 billion14 to the GAA 2022 allocation of
14 See the DepEd budget in Republic Act 11518 or the General Appropriations Act Fiscal Year 2021.

41
PHP5.95 billion.15 The full devolution scheme under EO 138 s. 2021 directs that those devolved functions contemplated by the Local Government Code of 1991 (RA 7160) be fully devolved by national government agencies to LGUs. In the case of the DepEd, the implementing guidelines of EO 138 s. 2021 provide that based on the Local Government Code, public spending for the following shall be specifically devolved to municipalities: school buildings and other facilities for public elementary and secondary schools, and information services which include maintenance of public library. In addition, public spending for information and reading centers shall be devolved to barangays.16 In a sense, EO 138 s. 2021 already provides the policy for the utilization of the LGUs' increased share in national taxes in a way that addresses school infrastructure needs. Its coverage should not be interpreted as limited to classroom construction given that the implementing guidelines cover "other facilities". Going forward, policy improvements can be in the areas of targeting, prioritization, equity, monitoring, and public accountability. At this point, there is no easy way of knowing if the LGUs' increased share in national taxes will be enough for the devolved services or if indeed the LGUs will prioritize school infrastructure in their spending. Thus, a geographic information system-based monitoring of school infrastructure needs vis-a-vis spending, results, outcomes, and gaps will be crucial. For monitoring to be effective, it must be participative, transparent, and using open access to key indicators. It should be noted that the first issue of the PDP 2017-2022 articulated this strategy: “An open and comprehensive database of education infrastructure statistics will be developed and updated regularly by DepEd to aid in monitoring and evaluation activities. This will enhance planning programming, and budgeting for basic educational facilities” (NEDA 2017, p. 309). At present, the DepEd has the Basic Education Information System (eBEIS) but it is not entirely open, or there is no open version of it. The eBEIS is operating as a limited access database within the DepEd. An open version of at least the database on main school infrastructure indicators will be useful for policymakers, potential partners in the private sector, and the communities where the schools are located. The Special Education Fund (SEF) of LGUs is another source of funding school infrastructure investments. Previously, the law (RA 7160) prescribing the collection of the SEF surcharge on real property tax was thought to be very restrictive when it comes to the use of the proceeds and, thus, legislative proposals were submitted to clarify and expand the coverage (e.g., Senate Bill 396 in the 18th Congress). But it turned out that a department-level policy can substitute for the legislative proposal and thus, Joint Circular No. 2 s. 2020 was issued by the DepEd, DBM, and the Department of the Interior and Local Government (DILG) to clarify the expense items that are allowed, among other provisions. The allowed expense items under operation and maintenance of public schools include external storage devices for digital files, communication expenses including mobile phone load and Wi-Fi connection, subscription fee for remote applications or platforms, and health and sanitation expenses. The spending for construction and repair of school buildings also includes installation of health facilities such as health clinics and wash areas. The spending for facilities and equipment includes personal computers and ICT devices.17 This policy on
15 See the DepEd budget in Republic Act 11639 or the General Appropriations Act Fiscal Year 2022. 16 See Annex C of the Department of Budget and Management and Department of the Interior and Local Government Joint Memorandum Circular No. 2021-1 dated August 11, 2021 - Guidelines on the Preparation of Devolution Transition Plans of Local Government Units in Support of Full Devolution under Executive Order No. 138, Dated 01 June 2021. 17 See DepEd-DBM-DILG Joint Circular No. 2 s. 2020 - Addendum No. 2 [Clarification to DepEd-DBM-DILG Joint Circular No. 1, series of 2017 dated January 19, 2017, entitled “Revised Guidelines on the Use of the Special Education Fund (SEF)”]
42
expanding the coverage of SEF expense items should be an opportunity to engage more LGUs in accelerating public sector investments on school infrastructure. Possible policy improvements going forward are in the areas of equity and monitoring. The equity aspect should be improved because the size of the SEF of LGUs may not be commensurate with the needs of their constituents in the basic education sector. Since the SEF is a surcharge on the real property tax, high-income LGUs with high valuations of real properties receive higher SEF and low-income LGUs with low valuations of real properties receive lower SEF. As an input to equity assessment, monitoring of needs, targets, accomplishments, results, and gaps should be undertaken. PPPs and other modes involving the private sector are another strategy for accelerating investments in school infrastructure. The PPP mode had already been tested in classroom building and it may be resorted to once again if the DepEd would pursue it, but care should be taken to ensure that lessons from the previous implementation experience are heeded. There are also PPP models for ICT in education that can be studied. An ADB study explains that the following ICT for education services lend themselves to a PPP approach: providing connectivity; providing centrally-managed systems; providing fit-for-purpose online systems; providing ICT hardware and software; managing online professional development systems; delivering preservice and in-service professional development opportunities and support personnel; setting up and running online communities of practice; providing access to repositories of digital knowledge; making educational resources and tools electronically accessible; and providing access to online and distance learning courses (Sarvi et al. 2015, p. 2). But pursuing a PPP approach in ICT for schools does not always guarantee success, especially if outsourcing will distort incentives for building pedagogical capacity in ICT. To illustrate, a comparison between the PPP approach using the Build-Own-Operate-Transfer (BOOT) scheme in a centralized model and an integrated approach using government implementation in a decentralized manner, as explored in Gurumurthy (2010) in a case study of two neighboring Indian states, revealed the shortcomings of the centralized BOOT model. The BOOT model employed in Karnataka state’s Mahiti Sindhu program did not show significant outcomes as vendors, which were chosen mostly based on the least cost principle, had shoddy hardware maintenance support and deputized poorly paid computer instructors. In contrast, the integrated approach in Kerala state’s IT@Schools program was more successful in terms of computer-per learner availability, teacher engagement, and cost efficiency, among other indicators. The computers used Free and Open Source Software (FOSS) rather than preloaded operating systems like Windows and software like Microsoft Office. The use of FOSS allowed the state department of education to interface with the local language and bundle hundreds of educational applications for free, thus resulting in savings that could have gone to vendors but had been used instead to support investments in in-house capacity building. The training outsourcing was done for the master trainers only, an intensive in-house capacity building was conducted, and the ICT training was made an integrated activity of the school support system. Moreover, rather than viewing “computer education” as an additional subject and therefore an additional workload of teachers, it was viewed as a part of the educational process and handled by the teachers as essential in all other curriculum components. In 2017, Kerala’s IT@School project was institutionalized by making it a government corporation, a special purpose vehicle called Kerala Infrastructure and Technology company (KITE), which was set up to allow it to avail of funding from the Kerala Infrastructure

43
and Investment Fund Board18 (Express Web Desk 2017). This experience in India tells us that pursuing a PPP model in ICT for schools should be studied very carefully. To have an informed adoption of any of the available PPP models, there should first be a comprehensive assessment of the needs and options for investment and financing, such as the approach proposed in the bill on Public Schools of the Future in Technology Act (House Bill 10329 in the 18th Congress). As contemplated in the bill, the options are public spending, PPP models in RA 6957 as amended by RA 7718, and partnerships with non-profit entities, civil society, business and industrial sector, and other concerned sectors. A model for private sector participation in the Philippines that had worked in the past is the Gearing Up Internet Literacy and Access for Students (GILAS) program. Initiated by a consortium composed of the Ayala Foundation, Ayala Corporation, Ayala-led Globe Telecom, Integrated Micro-electronics, Inc., American Chamber of Commerce, Apple, Bato-Balani Foundation, Bayan, Digitel, GMA-7, HP, IBM, Intel, Makati Business Club, Microsoft, Mitsubishi Corp., Narra Venture Capital, PBSP, Philstar, PLDT-Smart, and SPI, the GILAS program provided computer packages, internet peripherals, and training support to public high schools for six years until it was turned over to the DepEd in 2011 (Ronda 2011). Although it has been called a PPP model, the GILAS program is not a PPP modality contained in RA 6957 nor RA 7718 but an arrangement that can be deemed as a corporate social responsibility (CSR) activity. The experience in the GILA program demonstrates that investments in water supply and sanitation facilities in schools can also be promoted as a worthwhile undertaking in CSR activities, or as part of the environmental, social and governance scorecards of private firms. Private sector participation in ICT for education can also be accelerated through policies that liberalize access to markets such as the recently issued EO 127 s. 2021 and the proposed Open Access in Data Transmission Act. EO 127 s. 2021 entitled “Expanding the Provision of Internet Services through Inclusive Access to Satellite Services, Amending Executive Order No. 467 (s. 1998) for the Purpose” liberalized access to satellite services as it allowed not only telecommunication companies but also value-added service providers and internet service providers to directly access all satellite systems in order to build and operate broadband facilities. The proposed Open Access in Data Transmission Act aims to have enabling policies for data transmission infrastructure sharing and co-location. It has been filed in the 18th Congress as House Bill No. 8910, Senate Bill No. 45 and Senate Bill No. 911. It cannot be overemphasized that both the public and private sectors must assume responsibility in improving the students' learning environment through better and adequate school infrastructure. After all, a good learning environment is a good investment. It results in better student learning outcomes today and higher productivity of workers in the future. It is an important component of human capital development, which in turn is an important driver of endogenous economic growth. The fact that the Philippines' Human Capital Index deteriorated in recent years means that we have not been investing enough in human capital development. Recognizing this is the first step in reversing the deterioration, taking urgent action is the next one.
18 A state government corporation that channels fund toward critical and large public infrastructure projects in Kerala.
44
Bibliography Commission on Audit. 2019. Consolidated Annual Audit Report on the Department of Education
For the Year Ended December 31, 2020, Part II-Observations and Recommendations. https://coa.gov.ph/index.php/national-government-agencies/2019/category/8560-department-of-education (accessed on December 28, 2021).
————. 2020a. Consolidated Annual Audit Report on the Department of Education For the
Year Ended December 31, 2020, Part II-Observations and Recommendations. https://coa.gov.ph/index.php/national-government-agencies/2020/category/8997-department-of-education (accessed on December 28, 2021).
————. 2020b. Annual Audit Report on the Philippine International Trading Corporation For
the Years Ended December 31, 2020 and 2019. https://coa.gov.ph/index.php/gov-t-owned-and-or-controlled-corp-goccs/2020/category/9160-philippine-international-trading-corporation (accessed on October 21, 2021.)
Commission on Higher Education (CHED). n.d. Higher Education Data and Indicators: AY 2009-
10 to AY 2019-20 (table report). Quezon City: CHED. Department of Budget and Management (DBM). 2018. BEFF 2019 Budget Explained (Press
Release, 15 August 2018). https://www.dbm.gov.ph/index.php/secretary-s-corner/press-releases/list-of-press-releases/1153-beff-2019-budget-explained (accessed on October 15, 2021).
Department of Budget and Management and Department of the Interior and Local Government.
2021. Joint Memorandum Circular No. 2021-1 Dated August 11, 2021 - Guidelines on the Preparation of Devolution Transition Plans of Local Government Units in Support of Full Devolution under Executive Order No. 138, Dated 01 June 2021. https://dilg.gov.ph/issuances/jc/Guidelines-on-the-Preparation-of-Devolution-Transition-Plans-of-Local-Government-Units-in-Support-of-Full-Devolution-under-Executive-Order-No-138-Dated-01-June-2021/169 (accessed on December 1, 2021).
Department of Education (DepEd). 2009. DO 50, s. 2009 – Launching the DepEd Internet
Connectivity Project and Directing All Public High Schools to Subscribe to Internet Connectivity Services, May 15, 2009. https://www.deped.gov.ph/2009/05/15/do-50-s-2009-launching-the-deped-internet-connectivity-project-and-directing-all-public-high-schools-to-subscribe-to-internet-connectivity-services/ (accessed on October 20, 2021).
————. 2010. DepEd Order No. 78 s. 2010 - Guidelines on the Implementation of the DepEd
Computerization Program (DCP). https://www.deped.gov.ph/wp-content/uploads/2010/06/DO-No.-78-s.-2010.pdf (accessed on October 15, 2010).

45
————. 2011. DepEd Order No. 46, s. 2011 - Revised Guidelines on the Implementation of the DepEd Internet Connectivity Project (DICP), June 01, 2011. https://www.deped.gov.ph/wp-content/uploads/2011/06/DO_s2011_46.pdf (accessed on October 21, 2021).
————. 2014. DepEd Computerization Program (DCP) Orientation Handbook.
http://depedcavite.com.ph/wp-content/uploads/2015/08/DCP-Orientation-Handbook-as-of-18-June-2014.pdf (accessed on October 15, 2021).
————. 2016. DepEd Order No. 10 s. 2016 - Policy and Guidelines for the Comprehensive
Water, Sanitation and Hygiene in Schools (WINS) Program, 19 February 2016. https://wins.deped.gov.ph/wp-content/uploads/2021/05/DO_s2016_10-1.pdf (accessed on October 1, 2021).
————. 2018. DepEd Computerization Program Orientation Handbook: Batches 35, 36, 40 to
44. http://www.depedtagbilaran.org/wp-content/uploads/2019/03/DCP-Handbook-Batches-3536-40-to-44.pdf (accessed on October 15, 2021).
————. 2019. DepEd Memorandum 059 s. 2019 - Prioritizing the Development of the Last
Mile Schools in 2020-2021: Reaching Out and Closing the Gap, 22 May 2019. https://www.deped.gov.ph/wp-content/uploads/2019/05/DM_s2019_059.pdf (accessed on October 1, 2021).
————. 2020. WinS Monitoring Results: School Year 2017/2018 to School Year 2019/2020.
https://wins.deped.gov.ph/wp-content/uploads/2020/12/TSA-WinS-Monitoring-Booklet-Web-2020-11-27.pdf (accessed on October 20, 2021).
————. 2021a. DepEd Learning Information System SY 2018-2019 and SY 2019-2020
(Dataset). Pasig City: DepEd. ————. 2021b. National School Building Inventory SY 2018-2019 and SY 2019-2020
(Dataset). Pasig City: DepEd. Department of Education-Office of the Undersecretary for Administration (DepEd-OUA). 2020a.
Accelerating the Implementation of the School Building Program. Aide Memoire, 20 June 2020 (Document). https://authdocs.deped.gov.ph/wp-content/uploads/2020/06/OUAD00-0620-0007.pdf (accessed on October 19, 2021).
————. 2020b. Completing the First Phase of the Solar and Electrification Program for Schools,
Aide Memoire, 02 June 2020 (Document). https://authdocs.deped.gov.ph/wp-content/uploads/2021/09/FINAL-11-Solar-and-Electrification-Program-for-Schools-0921120-20210908.pdf (accessed on October 20, 2021).
————. 2021a. Highlights of the Discussion and Agreements from the National Consultative
Meeting (Document). https://authdocs.deped.gov.ph/wp-content/uploads/2021/09/OUALetter_0921005_Asec.Molano_Highlights-of-Discussion-

46
and-Agreements_National-Consultative-Meeting_20210901.pdf (accessed on October 19, 2021).
————. 2021b. Prioritizing Health-related Requirements for the Safe Return to Schools and
Offices - Part 2: Infrastructure, Aide Memoire 02 June 2020, Updated 04 August 2021 (Document). https://authdocs.deped.gov.ph/wp-content/uploads/2021/09/FINAL-01-Health-Requirements-for-Safe-Return-to-School-Infra_0912110-20210908.pdf (accessed on December 1, 2021).
————. 2021c. Accelerating DepEd’s Computerization Program: Digital Learning
Requirements, Aide Memoire - 27 May 2020, Updated 21 September 2021 (Document). https://authdocs.deped.gov.ph/wp-content/uploads/2021/09/OUA-AideMemoire_0921105_Accelerating-DepEds-Computerization-Program-Digital-Learning-Requirements_20210921rev.pdf (accessed on December 19, 2021).
Department of Education's Educational Management Information System Division – Planning
Service (DepEd EMISD-PS). 2022. School infrastructure indicators – updates on accomplishments. Email.
Department of Education, Department of Budget and Management, and Department of the Interior
and Local Government. 2020. Joint Circular No. 2 s. 2020 - Addendum No. 2 [Clarification to DepEd-DBM-DILG Joint Circular No. 1, series of 2017 dated January 19, 2017, entitled “Revised Guidelines on the Use of the Special Education Fund (SEF)”]. https://www.dbm.gov.ph/wp-content/uploads/Issuances/2020/Joint-Circular/DEPED-DBM-DILG-JOINT-CIRCULAR-NO-2-S-2020-dated-October-23-2020.pdf (accessed on December 1, 2021).
Department of Education and Department of Information and Communication Technology. 2018.
Joint Memorandum Circular No. 01, series of 2018 - Establishment of the Free Internet Access in Public Places Project in Basic Education Public Schools and Learning Centers. https://dict.gov.ph/wp-content/uploads/2020/06/ESTABLISHMENT-OF-THE-FREE-INTERNET-ACCESS-IN-PUBLIC-PLACES-PROJECT-IN-BASIC-EDUCATION-PUBLIC-SCHOOLS-AND-LEARNING-CENTERS.pdf (accessed on October 20, 2021).
Department of Education and Public-Private Partnership Center. 2020. PPP for School
Infrastructure Project (PSIP) Phase 1: DepEd’s First PPP Project. PPP Learning Series. https://ppp.gov.ph/wp-content/uploads/2021/01/PPPC_20201203_PUBMAT_PSIP-Case-Study-CTP.pdf. (accessed on October 15, 2021).
Department of Science and Technology-ICT Office. 2015. Juan Konek! Free Wi-Fi Launch
Kicked Off NSTW ICT Events, June 24, 2015. https://dict.gov.ph/juan-konek-free-wi-fi-launch-kicked-off-nstw-ict-events/ (accessed on October 20, 2021).
Díaz, L.M.B. and Cano, E.V., 2019. Effects on academic performance in secondary students
according to the use of ICT. IJERI: International Journal of Educational Research and Innovation, (12), pp. 90-108.

47
Estabillo, A. 2021. Solar power project to energize 7 off-grid schools in SoCot. Philippine News
Agency, June 23, 2021. https://www.pna.gov.ph/articles/1144697 (accessed on October 20, 2021).
Executive Order No. 127 Series of 2021. Expanding the Provision of Internet Services through
Inclusive Access to Satellite Services, Amending Executive Order No. 467 (s. 1998) for the Purpose. Manila, Philippines: Office of the President of the Philippines.
Executive Order No. 138 Series of 2021. Full Devolution of Certain Functions of the Executive
Branch to Local Governments, Creation of a Committee on Devolution, and for Other Purposes. Manila, Philippines: Office of the President of the Philippines.
Express Web Desk. 2017. Kerala’s ‘IT@school’ project now a government company ‘KITE’, CM
Vijayan launches logo. The Indian Express, August 7, 2017. https://indianexpress.com/article/education/keralas-itschool-project-now-a-government-company-kite-cm-pinarayi-vijayan-launches-logo-4785993/ (accessed on November 20, 2021).
Frey, B.B. 2018. The SAGE encyclopedia of educational research, measurement, and evaluation.
Thousand Oaks, CA: SAGE Publications, Inc. https://methods.sagepub.com/reference/the-sage-encyclopedia-of-educational-research-measurement-and-evaluation/i7603.xml#:~:text=Document%20analysis%20is%20a%20form,and%20answer%20specific%20research%20questions (accessed on October 15, 2021).
Foronda, V. 2011. Integrating Information and Communication Technology into Education: A
Study of the iSchools Project in Camarines Sur, Philippines. Journal of Developments in Sustainable Agriculture 6:101-113 (2011).
Gurumurthy, K. 2010. ICT programmes in school education: PPP models vs. integrated
approach, IT for Change Case Study. https://itforchange.net/sites/default/files/726/PPP%20vs%20integrated%20approach-website.pdf (accessed on November 20, 2021).
Gurung, A., Gurung, O.P. and Oh, S.E., 2011. The potential of a renewable energy technology for
rural electrification in Nepal: A case study from Tangting. Renewable Energy, 36(11), pp. 3203-3210.
Harris, D.N. 2010. Education Production Functions: Concepts. In International Encyclopedia of
Education (Third Edition), edited by Peterson, P., Baker, E. and McGaw, B., pages 402-406. Boston: Academic Press.
House Bill No. 8910 in the 18th Congress. Open Access in Data Transmission Act. Manila,
Philippines: Congress of the Philippines.

48
House Bill No. 10329 in the 18th Congress. An Act Establishing the Public Schools of the Future in Technology and Appropriating Funds Therefor. Manila, Philippines: Congress of the Philippines.
Japan International Cooperation Agency-Nomura Research Institute, Ltd. 2015. Data Collection
Survey for Higher Education Sector in the Philippines: Final Report. https://openjicareport.jica.go.jp/pdf/12233029.pdf (accessed on April 15, 2021).
Kirubi, C., Jacobson, A., Kammen, D.M. and Mills, A., 2009. Community-based electric micro-
grids can contribute to rural development: evidence from Kenya. World development, 37(7), pp.1208-1221.
Mejdalani, A., Mendes E., Costa, R., Hallack, M., Lopez, D. and Vazquez, M., 2018. A brighter
future: the impact of rural school electrification programs on the dropout rate in primary education in Brazil. https://publications.iadb.org/en/brighter-future-impact-rural-school-electrification-programs-dropout-rate-primary-education-brazil (accessed on April 14, 2021).
Murillo, F.J. and Román, M., 2011. School infrastructure and resources do matter: analysis of the
incidence of school resources on the performance of Latin American students. School effectiveness and school improvement, 22(1), pp.29-50.
National Economic and Development Authority (NEDA). 2017. Philippine Development Plan 2017-2022. Pasig City: NEDA.
————. 2019. Philippine Development Plan Results Matrices 2017-2022, Chapter 19:
Accelerating Infrastructure Development. https://neda.gov.ph/wp-content/uploads/2019/05/19-Chapter-19-Accelerating-Infrastructure-Development-1.14.2019.pdf (accessed on October 20, 2021).
————. 2021a. Updated Philippine Development Plan 2017-2022 (February 2021 Update).
Pasig City: NEDA. ————. 2021b. Enhanced PDP 2017-2022 Results Matrices (December 14, 2021 Update).
https://neda.gov.ph/enhanced-pdp-2017-2022-results-matrices/ (accessed on December 15, 2021).
National Economic and Development Authority-Social Development Staff (NEDA-SDS). 2021.
"Physical infrastructure data in education" (unpublished document, 19 October 2021). Nketiah-Amponsah, E., Asamoah, M.K., Allassani, W. and Aziale, L.K., 2017. Examining
students’ experience with the use of some selected ICT devices and applications for learning and their effect on academic performance. Journal of Computers in Education, 4(4), pp. 441-460.

49
Organisation for Economic Co-operation and Development (OECD). 2014. How many students are in each classroom?, In Education at a Glance 2014: Highlights. https://read.oecd-ilibrary.org/education/education-at-a-glance-2014/how-many-students-are-in-each-classroom_eag_highlights-2014-24-en#page2 (accessed on October 15, 2021).
PCMag. n.d. thin client. https://www.pcmag.com/encyclopedia/term/thin-client (accessed on
October 20, 2021). Philippine Statistics Authority (PSA). 2018. Philippine Statistical Yearbook 2018. Quezon City:
PSA. ————. 2020. 2020 Statistical Indicators on Philippine Development (StatDev) - Infrastructure.
https://psa.gov.ph/system/files/Infrastructure_2.pdf (accessed December 14, 2021). ————. 2021. The Philippine SDGs: SDG Watch - Based on data submissions as of 26 March
2021. https://psa.gov.ph/sdg (accessed on October 15, 2021). Public-Private Partnership Center. n.d. List of Projects. https://ppp.gov.ph/list-of-projects/
(accessed on October 5, 2021). ————. 2020. PPP for School Infrastructure Project (PSIP) Phase 1: DepEd’s First PPP Project,
PPP Learning Series. https://ppp.gov.ph/wp-content/uploads/2021/01/PPPC_20201203_PUBMAT_PSIP-Case-Study-CTP.pdf (accessed on April 10, 2021).
Republic Act 7160. Local Government Code of 1991. Manila, Philippines: Congress of the
Philippines. Republic Act 10929. Free Internet Access in Public Places Act of 2017. Manila, Philippines:
Congress of the Philippines. Republic Act 11518. General Appropriations Act Fiscal Year 2021. Manila, Philippines: Congress
of the Philippines. Republic Act 11639. General Appropriations Act Fiscal Year 2022. Manila, Philippines: Congress
of the Philippines. Ronda, R. 2011. DepEd vows to sustain Gilas Internet project. The Philippine Star, November 22,
2011. https://www.philstar.com/headlines/2011/11/22/750400/deped-vows-sustain-gilas-internet-project (accessed on November 20, 2021).
Sarvi, J., Balaji V. and Pillay, H. 2015. Public-Private Partnerships in Information and
Communication Technology for Education. ADB Briefs No. 49, October 2015. https://www.adb.org/sites/default/files/publication/176953/ppp-ict-education.pdf (accessed on November 20, 2021).

50
Senate Bill No. 45 in the 18th Congress. An Act Promoting Open Access in Data Transmission, Providing Additional Powers to the National Telecommunications Commission (NTC), and for Other Purposes. Manila, Philippines: Congress of the Philippines.
Senate Bill No. 396 in the 18th Congress. An Act Expanding the Purposes and Application of the
Special Education Fund, Amending for the Purpose Section 272 of Republic Act No. 7160, Otherwise Known as the Local Government Code of 1991, and for Other Purposes. Manila, Philippines: Congress of the Philippines.
Senate Bill No. 911 in the 18th Congress. An Act Promoting Open Access in Data Transmission,
Providing Additional Powers to the National Telecommunications Commission, and for Other Purposes. Manila, Philippines: Congress of the Philippines.
Sovacool, B.K. and Ryan, S.E., 2016. The geography of energy and education: Leaders, laggards,
and lessons for achieving primary and secondary school electrification. Renewable and Sustainable Energy Reviews, 58, pp.107-123.
Unite, B. 2021. A look back on ‘Build, Build, Build’s’ milestones as it reaches its final year. Manila Bulletin, June 22, 2021. https://mb.com.ph/2021/06/22/a-look-back-on-build-build-builds-milestones-as-it-reaches-its-final-year/ (accessed on October 15, 2021).
United Nations Children's Fund (UNICEF) and World Health Organization (WHO). 2020.
Progress on drinking water, sanitation and hygiene in schools: Special focus on COVID-19. https://cdn.who.int/media/docs/default-source/wash-documents/wash-in-schools-20200812-low-res.pdf?sfvrsn=d5b40ebd_6&download=true (accessed on December 15, 2021).
United Nations Development Programme and Department of Information and Communication
Technology. 2019. Pipol Konek Project Document (signed 22 March 2019). https://info.undp.org/docs/pdc/Documents/PHL/DICT%20-%20UNDP%20PIPOL%20KONEK%20PRODOC%20-%20Signed.pdf (accessed on October 20, 2021).
United Nations Educational, Scientific and Cultural Organization (UNESCO). 2017. Unpacking
Sustainable Development Goal 4 Education 2030: Guide. https://www.sdg4education2030.org/unpacking-sustainable-development-goal-4-education-2030-unesco-2017 (accessed on April 15, 2021).
UNESCO Institute for Statistics. 2014. Information and Communication Technology (ICT)
Education in Asia: A comparative analysis of ICT integration and e-readiness in schools across Asia. http://uis.unesco.org/sites/default/files/documents/information-communication-technologies-education-asia-ict-integration-e-readiness-schools-2014-en_0.pdf (accessed on October 21, 2021).

51
————. 2021. UIS Global Education Database. http://data.uis.unesco.org/index.aspx?queryid=3409 (accessed on December 28, 2021).
Welland, A., 2017. Education and electrification of rural schools. Technical report 2013. April
2017. Smart Villages 2017. http://e4sv.org/wp-content/uploads/2017/05/TR13-Education-and-the-Electrification-of-Rural-Schools_web-1.pdf (accessed on April 14, 2021).
World Bank. 2016. Building Better Learning Environments in the Philippines. Philippines
Education Note No. 4, June 2016. http://documents1.worldbank.org/curated/en/804661468567528878/pdf/106951-REVISED-PH-PETS-QSDS-Note-4.pdf (accessed on April 15, 2021).
————. 2020a. The Human Capital Index 2020 Update: Human Capital in the Time of COVID-
19. World Bank, Washington, DC. https://openknowledge.worldbank.org/handle/10986/34432 (accessed on April 15, 2021).
————. 2020b. Philippines Basic Education: Public Expenditure Review.
https://openknowledge.worldbank.org/handle/10986/34670 (accessed on October 15, 2021). ————. n.d. World Bank Open Data. https://data.worldbank.org/ (accessed on November 20,
2021). World Bank and Australian Agency for International Development (WB and AusAID). 2012.
Philippines: Basic Education Public Expenditure Review. https://openknowledge.worldbank.org/handle/10986/13809 (accessed on October 10, 2021).
————. 2016. Building Better Learning Environments. Philippines Education Note No. 4,
June 2016. http://documents1.worldbank.org/curated/en/804661468567528878/pdf/106951-REVISED-PH-PETS-QSDS-Note-4.pdf (accessed on April 15, 2021).