
Client-Friendly Presentation - Dynamic Funds
23
1 Dynamic Energy Evolution Fund Jennifer Stevenson Vice President & Portfolio Manager Frank Latshaw Vice President & Portfolio Manager Oscar Belaiche Senior Vice President & Portfolio Manager
-
Upload
khangminh22 -
Category
Documents
-
view
0 -
download
0
Transcript of Client-Friendly Presentation - Dynamic Funds

1
Dynamic Energy Evolution FundJennifer StevensonVice President & Portfolio Manager
Frank LatshawVice President & Portfolio Manager
Oscar BelaicheSenior Vice President & Portfolio Manager

2
Agenda
Combating climate change and reducing carbon footprint and emissions has an increasing sense of urgency from populations and governments around the world.Renewable energy is the enabler of broader adoption of environmentally friendly practices across global society
Why now?
Why us?
Dynamic Energy Evolution Fund
1
2
3

3
Why now?The energy evolution: An industry In transitionWe are only at the beginning of a long-term transition towards renewable energy
Source: Thunder Said Energy
0
20
40
60
80
100
120
0%10%20%30%40%50%60%70%80%90%
100%17
5017
5917
6817
7717
8617
9518
0418
1318
2218
3118
4018
4918
5818
6718
7618
8518
9419
0319
1219
2119
3019
3919
4819
5719
6619
7519
8419
9320
0220
1120
2020
2920
3820
47
Tota
l glo
bal e
nerg
y us
e (‘0
00TW
H)
Perc
ent o
f tot
al e
nerg
y (%
)
Biomass Animal Coal Oil Gas Hydro Nuclear Solar Wind Other Total

4
31% 28%
27% 20%
23% 25%
5% 6%3%3%9%10%2%9%
0
50
100
150
200
250
300
350
400
2019 2045
Mbo
e/d
Other renewables
Biomass
Hydro
Nuclear
Gas
Coal
Oil
Why now?Energy demand grows – Renewables grow more
All energy sources needed to meet energy demand
Primary energy demand by fuel
Source: OPEC World Oil Outlook 2045 , October 2020 edition
Renewables grow the most
Larger % of a much larger total energy demand

5
The energy evolution – An industry in transitionWhy now?
Source: U.S. EIA
Primary energy consumption by energy source, world (quadrillion btu)
0
50
100
150
200
250
300
2010 2020 2030 2040 2050
History Projections
RenewablePetroleum and other liquids
Natural gasCoal
Nuclear
Three pillars of support
Increasing public
engagement and urgency for reduced carbon
initiatives
Government policies and
fiscal stimulus support
programs
Technological advances make
renewables cost
competitive
Rapid growth in renewables

6
Increasing public engagement & urgency for reduced carbonWhy now?
Government actions should prioritize climate change in the economic recovery after COVID-19% of respondents
Source: McKinsey & Co. “How a post pandemic stimulus can both create jobs and help the climate” 1Question: “To what extent do you agree or disagree with the following: in the economic recovery after COVID-19, it’s important that government actions prioritize climate change.” Response rates shown for “agree” include “strongly agree” and “ somewhat agree”; rates for “disagree” include “strongly disagree” and “ somewhat disagree”. Survey conducted via online poll, April 17, 2020; n = 28,039; data weighted to the profile of the population. Source: Ipsos MORI.
343332312430262726222522161413
575757586061626363636566808081
AustraliaGermany
U.S.U.K.
RussiaCanada
SpainItaly
FranceJapanWorldBrazilChina
MexicoIndia
disagree agree
COVID-19 health concerns have ignited global focus on clean energy

7
→ EU green deal → Biden $2T climate plan→ COVID stimulus is green-focused→ Global government incentives
and plans
Government policy and fiscal stimulus support Why now?
Source: Forbes * As of May 10, 2020. Source: Ceyhun Elgin.
2.2%
3.8%
5.0%
5.7%
7.3%
9.3%
10.7%
12.0%
13.0%
21.1%
South Korea
China
U.K.
Italy
Spain
France
Germany
Sweden
United States
Japan
Global coronavirus stimulus packages comparedFinancial response to the COVID-19 pandemic as a share of GDP (selected countries)*

8
Why now?Government policy and fiscal stimulus supportSpending on renewable energy and energy efficiency has been shown to create more jobs than spending on fossil fuels.
Jobs created, directly and indirectly,1 per $10 million in spending
Renewable technologies(wind, solar, bioenergy,
geothermal, hydro)
Energy efficiency(industrial energy efficiency,
smart grid, mass transit)
Fossil fuel(oil and gas, coal)
75 jobs
77 jobs
27jobs
1Excludes induced jobs.Source: Heidi Garrett-Pelter, “Green versus brown: Comparing the employment impact of energy efficiency, renewable energy, and fossil fuels using an input-output model, Economic modeling, pp 439-47, 2017.Source: McKinsey & Co. “How a post pandemic stimulus can both create jobs and help the climate”

9
Technological advances make renewables cost competitiveWhy now?
Cost reductions for solar and wind are coming from:
Source: IRENA Renewable Cost Database
BIOENERGY GEOTHERMALENERGY
HYDROPOWER OCEAN ENERGY
SOLAR ENERGY
WIND ENERGY
IMPROVED TECHNOLOGY
ECONOMIES OF SCALE
MORE COMPETITIVE SUPPLY CHAINS
DEVELOPER EXPERIENCE

10
Why now?Technological advances make renewables cost competitive
Global LCOES from newly commissioned utility-scale renewable power generation technologies
Average LCOE (levelized cost of electricity) of most renewables has fallen to levels competitive with fossil fuels
2010-2019
Solar PV -82%
CSP -47%
Onshore wind -39%
Offshore wind -29%
Source: IRENA Renewable Cost Survey
LCOE declines
0.0
0.1
0.2
0.3
0.4
2010 2019 2010 2019 2010 2019 2010 2019 2010 2019 2010 2019 2010 2019
2019
USD
/kW
Biomass Geothermal Hydro Solar photovoltaic
Concentrating solar power
Offshore wind
Onshore wind
95th percentile
Fossil fuel cost range

11
Technological advances make renewables cost competitive
Source: IRENA Renewable Cost Survey
0
20
40
60
80
100
120
140
160
180
0%
10%
20%
30%
40%
50%
60%
70%
80%
90%
2001 2002 2003 2004 2005 2006 2007 2008 2009 2010 2011 2012 2013 2014 2015 2016 2017 2018 2019
GW
Shar
e of
new
ele
ctric
ity g
ener
atin
g ca
paci
ty Increase in non-renewables (GW) Increase in renewables (GW) Renewable share (%)
More than 70% of new capacity additions in 2019 came from renewables
Why now?
Renewable share of annual power capacity expansion

12
Why now?Technological advances make renewables cost competitive
Source: U.S. EIA
OECD Non-OECD
Most of the growth in future power demand is expected to come from renewable sources
Sustainable and growing profitability of renewablesChanges from 2018 in generation and demand (Trillion kWh)
-202468
10121416
2019
2021
2023
2025
2027
2029
2031
2033
2035
2037
2039
2041
2043
2045
2047
2049
Renewables
Non-renewables
Demand
-202468
10121416
2019
2021
2023
2025
2027
2029
2031
2033
2035
2037
2039
2041
2043
2045
2047
2049
Non-renewables
Renewables
Demand

13
Why us?
Jennifer Stevenson, B.Comm., MBAVice President & Portfolio ManagerEnergyIndustry 30 yearsDynamic 10 yearsTeam 10 years
Oscar Belaiche, HBA, FICB, CFASr. Vice President & Portfolio ManagerTeam Lead Industry 39 yearsDynamic 23 yearsTeam 23 years
Frank Latshaw, CPA, CA, CBV, CFAVice President & Portfolio ManagerInfrastructureIndustry 27 yearsDynamic 9 yearsTeam 9 years
Robert Cohen, BASC. MBA. CFAVP & Portfolio ManagerMaterialsMineral Process EngineerPractical experience 27 years
Nawojka Wachowiak, M.Sc.Associate Portfolio ManagerMaterialsGeologistPractical experience 21 years
Scott Reid, B.Comm., CFAPortfolio AnalystEnergyCFAPractical experience 12 years
Tarun Joshi, BASC (Hons.), P.Eng., AFMPortfolio AnalystIndustrialsEngineerPractical experience 14 years
EXPERIENCETotal team 42 years
Total industry 96 years

14
Why us?
21 PMs, APMs and AnalystsCOOPERATIVE AND COLLABORATIVE CULTURE
EXPERIENCE
Total team 131 years
Total industry 412 years

15
Dynamic Global Infrastructure Fund
Dynamic Energy Income Fund
Dynamic Strategic Energy Class
Why us?Renewables – A growing part of what we do
2015
2020* 37%
31%
47% 42%
Source: Dynamic Funds.* As of October 31, 2020.
Renewables EnergyUtilities / renewables Other infrastructure

16
Dynamic Energy Evolution FundRenewable energy, endless opportunity
Renewable power Emerging solutions New energy innovators
Invest in companies supporting the global transition to renewable energy on both a residential and commercial scale
Flexibility to find the most compelling opportunities in regions with favourable regulatory and fiscal environments
Fixed quarterly distribution – annualized yield of 2%
The yield is calculated based on a fixed, but not guaranteed, quarterly distribution and an initial net asset value per unit of $10. Quarterly distribution yields may fluctuate as the month end NAVPU changes. A fund’s distribution yield should be not be confused with its performance or rate of return.
INTRODUCING
17
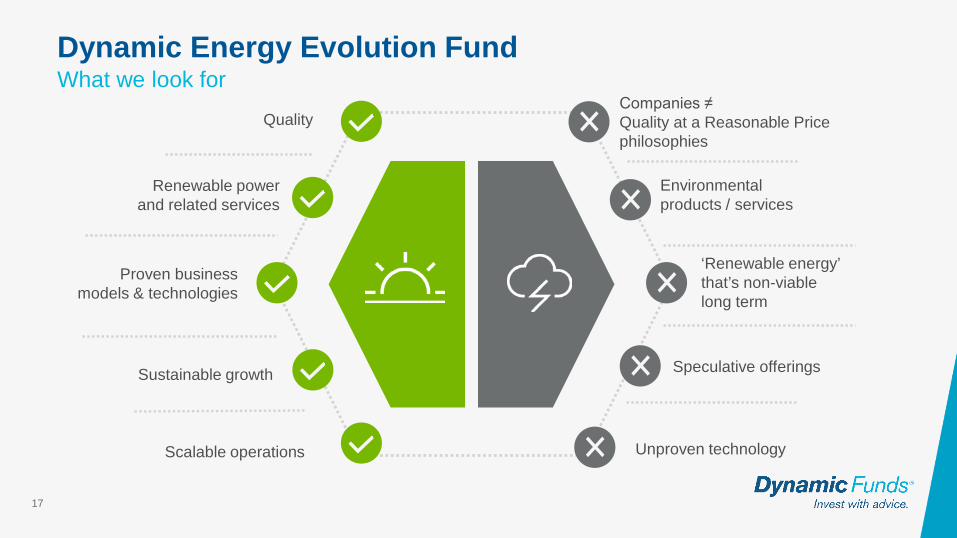
Dynamic Energy Evolution FundWhat we look for
Quality
Renewable powerand related services
Sustainable growth
Environmental products / services
Speculative offerings
‘Renewable energy’ that’s non-viable long term
Scalable operations
Companies ≠ Quality at a Reasonable Price philosophies
Unproven technology
Proven business models & technologies

18
Dynamic Energy Evolution FundThe energy investment spectrum
Car
bon
foot
prin
t
New energy innovators
Renewable power
Emerging solutions
Upgraded oil
Light oil
Oil sands
Heavy oil
Natural gas
Coal
Residential Solar Wind Turbines Batteries Solar Panels / Inverters Hydrogen Fuel
Cells/Electrolyzers
Wind & Solar Hydroelectricity Biofuels Geothermal Nuclear
Rare Earths & Materials
Energy Industrials Sustainable Finance Services Logistics
Manufacturing & development Inputs & integrationGeneration, transmission
distribution, storage
Emerging solutions New energy innovatorsRenewable power

19
Key benefitsDynamic Energy Evolution Fund
UNIQUEGROWTH OPPORTUNITY
INVEST IN POSITIVE CHANGE
SEASONED MANAGERS, PRAGMATIC APPROACH
Allows investors to participate in climate-change action
and the various opportunities presented.
Awareness of climate change has led to unprecedented public and policy support
for renewable energy, creating a secular tailwind for those
companies supporting the energy transition.
Managed by portfolio managers with decades of
boots-on-the-ground experience in the energy and
infrastructure space, and supported by the 21-member
Equity Income team.

20
Renewable energy, endless opportunityDynamic Energy Evolution Fund
Three pillars of support provide rapid growth in renewables
The right teamDecades of energy and investment experience
The right timeRenewable energy is the enabler of broader adoption of environmentally friendly practices across global society
Increasing public engagement and urgency for reduced
carbon initiatives
Government policies and fiscal stimulus support programs
Technological advances make renewables cost competitive
3
1
2

21
Dynamic Energy Evolution FundFees & distributions
Management Fee Fixed Admin Fee Distribution/Unit Frequency Distribution Yield*
Series A 1.85% 0.10% $0.0500 Quarterly 2.0%Series H 1.85% 0.10% $0.04675 Quarterly 1.9%Series T 1.85% 0.10% $0.0333 Monthly 4.0%Series F 0.85% 0.10% $0.0783 Quarterly 3.1%Series FH 0.85% 0.10% $0.07500 Quarterly 3.0%Series FT 0.85% 0.10% $0.0333 Monthly 4.0%Series I 0.85% 0.10% $0.1023 Quarterly 4.1%
The yield is calculated based on a fixed, but not guaranteed, quarterly distribution and an initial net asset value per unit as of $10. Quarterly distribution yields may fluctuate as the month end NAVPU changes. A fund’s distribution yield should be not be confused with its performance or rate of return.
Fund Codes
FE No Load
Series A 3460 Series F 3461
DCAF (A) 3468 DCAF (F) 3469
Series H 3466 Series FH 3467
Series T 3465 Series FT 3462
Series I 3463

22
Important information
This presentation has been prepared by 1832 Asset Management L.P and is provided for information purposes only.
Views expressed regarding a particular investment, economy, industry or market sector should not be considered an indication of trading intent of any of the mutual funds managed by 1832 Asset Management LP. These views are not to be relied upon as investment advice nor should they be considered a recommendation to buy or sell. These views are subject to change at any time based upon markets and other conditions, and we disclaim any responsibility to update such views. To the extent this document contains information or data obtained from third party sources, it is believed to be accurate and reliable as of the date of publication, but 1832 Asset Management L.P. does not guarantee its accuracy or reliability. Nothing in this document is or should be relied upon as a promise or representation as to the future.
© Copyright 2020 1832 Asset Management L.P. All rights reserved. Dynamic Funds® is a registered trademarks of its owner used under license.
Series A units are available for purchase to all investors, while Series F units are only available to eligible investors who participate in eligible fee-based or wrap programs with their registered dealers. Differences in performance between these series are primarily due to differences in management fees and fixed administration fees. Performance results for Series F units may also appear higher than for Series A units as the management fee does not include the trailing commission. Commissions, trailing commissions, management fees and expenses may be associated with mutual fund investments. Please read the prospectus before investing. The indicated rates of return are the historical annual compounded total returns including changes in units value and reinvestment of all distributions and do not take into account sales, redemption, distribution or optional charges or income taxes payable by any securityholder that would have reduced returns. Mutual funds are not guaranteed, their values change frequently and past performance may not be repeated.

23