INSERT CLIENT NAME - HKEXnews
269
THIS WEB PROOF INFORMATION PACK IS IN DRAFT FORM. The information contained herein is incomplete and subject to change and it must be read in conjunction with the section headed ‘‘Warning’’ on the cover of this Web Proof Information Pack. PART XIV: INDEPENDENT TECHNICAL REPORTS SECTION F: KAZZINC REPORT 299
-
Upload
khangminh22 -
Category
Documents
-
view
1 -
download
0
Transcript of INSERT CLIENT NAME - HKEXnews

THIS WEB PROOF INFORMATION PACK IS IN DRAFT FORM. The information contained herein isincomplete and subject to change and it must be read in conjunction with the section headed ‘‘Warning’’on the cover of this Web Proof Information Pack.
PART XIV: INDEPENDENT TECHNICAL REPORTS
SECTION F: KAZZINC REPORT
299

KAZZINC LIMITED
Mineral Resource and Ore Reserve estimations in accordance with the guidelines of the JORC
Code (2004), and provision of a Competent Person’s Report for the Assets held by Kazzinc
Limited in both Kazakhstan and Russia
[•] 2011
THIS WEB PROOF INFORMATION PACK IS IN DRAFT FORM. The information contained herein is incomplete and subject to change and it must be read in conjunction with the section headed ‘‘Warning’’on the cover of this Web Proof Information Pack.

DATE ISSUED: February 2011
JOB NUMBER: 61‐0795
REPORT NUMBER: MM
REPORT STATUS: Draft
VERSION NUMBER: V0.10
KAZZINC LIMITED
Mineral Resource and Ore Reserve estimations in accordance with the guidelines of the JORC Code
(2004), and provision of a Competent Person’s Report for the Assets held by Kazzinc Limited in both
Kazakhstan and Russia
February 2011
PREPARED BY:
Insert Name Insert Qualification
Insert Name Insert Qualification
APPROVED BY:
Insert Name Insert Job Title
This report has been prepared by Wardell Armstrong International with all reasonable skill, care and diligence, within the terms of the Contract with the Client. The report is confidential to the Client and
Wardell Armstrong International accepts no responsibility of whatever nature to third parties to whom this report may be made known.
No part of this document may be reproduced without the prior written approval of Wardell Armstrong
International Ltd.
This is a Draft Report and has been provided for the purpose of checking and comment only. WAI cannot guarantee the accuracy or completeness of facts, interpretation, conclusions or recommendations
contained herein and reserves the right to alter these. The Client and others should not rely on the content of this draft report until it has been expressly signed off and finalised on behalf of the Company.
THIS WEB PROOF INFORMATION PACK IS IN DRAFT FORM. The information contained herein is incomplete and subject to change and it must be read in conjunction with the section headed ‘‘Warning’’on the cover of this Web Proof Information Pack.

Wardell Armstrong International
Wheal Jane, Baldhu, Truro, Cornwall, TR3 6EH, United Kingdom Telephone: +44 (0)1872 560738 Fax: +44 (0)1872 561079 www.wardell‐armstrong.com
Wardell Armstrong International is the trading name of Wardell Armstrong International Limited, Registered in England No. 3813172
Registered office: Sir Henry Doulton House, Forge Lane, Etruria, Stoke‐on‐Trent, ST1 5BD, United Kingdom
UK Offices: Stoke‐on‐Trent, Cardiff, Edinburgh, Greater Manchester, Liverpool, London, Newcastle upon Tyne, Sheffield, Truro, West Bromwich. International Offices: Almaty, Beijing
ENERGY AND CLIMATE CHANGE ENVIRONMENT AND SUSTAINABILITY
INFRASTRUCTURE AND UTILITIES LAND AND PROPERTY
MINING, QUARRYING AND MINERAL ESTATES WASTE RESOURCE MANAGEMENT
[•] 2011 The Directors Kazzinc Limited 1 Promyshlennaya Street, Ust‐Kamenogorsk, 070000 Republic of Kazakhstan The Directors Glencore International plc Address required Dear Sirs
Competent Person’s Report for the Assets held by Kazzinc Limited in Kazakhstan and Russia
Background Kazzinc Limited (the “Client” or “Kazzinc”) commissioned Wardell Armstrong International Ltd ("WAI") to prepare a Competent Person’s Report (the “CPR”) on its gold mining, development and exploration assets held in Kazakhstan and Russia. WAI understands that the CPR will be included as part of a document (the "Document”) to be published by Glencore International plc (“Glencore”). WAI hereby consents to the inclusion of this letter and the CPR in the Document, with the inclusion of its name, in the form and context in which it appears in the Document. WAI understands that Glencore International plc is expected to be the ultimate parent company of the group.
THIS WEB PROOF INFORMATION PACK IS IN DRAFT FORM. The information contained herein is incomplete and subject to change and it must be read in conjunction with the section headed ‘‘Warning’’on the cover of this Web Proof Information Pack.

3
The principal Mineral Assets in which the Client is interested comprise of production sites at Vasilkovskoye Open Pit, Maleevskoye Mine, Ridder‐Sokolniy Mine, Tishinskiy Mine, Shubinskiy Mine, Shaimerden Open Pit, and reclamation of tailings from the Staroye (Old) tailings dam facility; together with advanced exploration properties at Dolinnoe & Obruchevskoe and Chekmar, all of which are located near to Ridder‐Sokolniy in Kazakhstan. A further underground production mine, Novoshirokinskoye is located in the Chita region of the Russian Federation. Additional unexploited resources are to be found in tailings dam facilities (TMF’s) of Chashinskiy located close to Ridder‐Sokolniy Mine; and Tishinskiy TMF, located at Tishinskiy Mine, both in Kazakhstan. In addition Kazzinc has three exploration licences located in Kazakhstan, namely, Solovievskiy Block which is located to the south of Ridder‐Solkolniy Mine, Butachikhinsko‐Kedrovskiy Block located west of Ridder‐Sokolniy Mine; and Western Torgai located in the Kostanai region of north western Kazakhstan. These projects are at various stages of exploration, development and mining, all of which are discussed in detail in the CPR. WAI considers that the relevant areas have sufficient technical merit to justify proposed programmes and associated expenditures. The Document contains an appropriate summary of each of the assets, and WAI is satisfied with the integrity of the information contained in the Document based on the limited validation work performed by WAI, but more importantly, reliance on the legal due diligence performed by Kazzinc and its subsidiaries in the projects geographical locations. WAI has been requested to provide an Independent valuation of the individual assets, although it has not been asked to comment on the fairness and reasonableness of any vendor or promoter considerations. Requirement and Structure of the CPR This report has been prepared by WAI in accordance with the requirements of the relevant applicable requirements, rules and regulations. WAI has reviewed the resources and reserves as presented by Kazzinc and in many cases prepared independent resource and reserve estimates in accordance with the 2004 edition of the “Australasian Code for Reporting of Exploration Results, Mineral Resources and Ore Reserves” (the "JORC Code (2004)"), all of which are shown in the CPR. The CPR has been structured on а technical discipline basis into sections on Geology, Mineral Resources and Ore Reserves, Mining Engineering, Mineral Processing, Infrastructure, Occupational Health and Safety, Environmental Management, and a Financial Assessment for each of the Mineral Assets. Site visits were made by WAI to all the assets mentioned above. Verification, Validation аnd Reliance The CPR is dependent upon technical, financial and legal input. The technical information as provided by Kazzinc to, and taken in good faith by, WAI has not been independently verified by means of re‐calculation, but all reserve and resource estimates have been substantiated, or re‐modelled, by evidence from WAI’s site visits and observations, are supported by details of exploration results, analyses and other evidence and take account of all relevant information supplied by Kazzinc. WAI has conducted a review and assessment of all material technical issues likely to influence the future performance of the Mineral Assets which included the following:
• Inspection visits to the mining operations, processing facilities, surface structures and associated infrastructure, undertaken in the last quarter of 2010, with:
o discussion and enquiry following access to key on‐site and corporate personnel;
THIS WEB PROOF INFORMATION PACK IS IN DRAFT FORM. The information contained herein is incomplete and subject to change and it must be read in conjunction with the section headed ‘‘Warning’’on the cover of this Web Proof Information Pack.

4
o an examination of historical information and results made available by Kazzinc in respect of the mining;
o a review of the Kazzinc's resource and reserve estimates with re‐modelling where appropriate; and
o a review of the Kazzinc's production forecasts and costs and undertaken all necessary investigations to ensure compliance with the relevant regulations and recommendations in terms of the level of disclosure.
The majority of the resource and reserve estimates presented in the CPR have been prepared in accordance with JORC Code (2004) by WAI, with the remainder classified under the Russian system upon which WAI has made comment. WAI has placed reliance on Kazzinc that the following information provided by Kazzinc to WAI is both valid and accurate for the purpose of compiling the CPR:
• all technical information; and • that the legal ownership of all mineral and surface rights has been verified and save as
disclosed in the CPR that no significant legal issues exists which would affect the likely viability of a project and/or the mineral resources and ore reserves as reported herein.
Limitations, Declarations, Consent and Copyright Limitations Kazzinc has confirmed to WAI that to its knowledge the information provided by Kazzinc was true, accurate and complete and not incorrect, misleading or irrelevant in any aspect. WAI has no reason to believe that any facts have been withheld. The achievability of production forecasts and costs are neither warranted nor guaranteed by WAI. The forecasts as presented and discussed herein have been proposed by Kazzinc management and adjusted where appropriate by WAI, based on up‐to‐date reserve estimates, and cannot be assured. They are necessarily based on economic assumptions, many of which are beyond the control of Kazzinc. Declarations WAI will receive a fee for the preparation of the CPR in accordance with normal professional consulting practice. This fee is not contingent on a specific outcome or value of Glencore and WAI will receive no other benefit for the preparation of the CPR. None of WAI or its directors, staff or subcontractors who contributed to the CPR have, at the date of this letter, and has not had within the previous two years, any shareholding in or other relationship with Glencore, Glencore International AG, Kazzinc or the principal current assets in which Kazzinc is interested which include the Vasilkovskoye Open Pit operation, Maleevskoye Mine, Ridder‐Sokolniy Mine; (and its satellites which include Tishinskiy Mine, Shubinskiy Mine, Dolinnoe & Obruchevskoe development projects and Chekmar exploration project) and Shaimerden Open Pit operation, all of which are located in Kazakhstan. WAI considers itself to be independent of Glencore, Glencore International AG and Kazzinc. None of WAI or its directors, staff or subcontractors who contributed to the CPR has any interest in the proposed [transactions] of Glencore. In the CPR, WAI provides assurances to the Directors of Glencore and the Directors of Kazzinc that certain Technical and Economic data including production profiles, operating expenditures and capital expenditures, of the Mineral Assets as provided to WAI by Kazzinc and reviewed and where appropriately modified by WAI are reasonable.
THIS WEB PROOF INFORMATION PACK IS IN DRAFT FORM. The information contained herein is incomplete and subject to change and it must be read in conjunction with the section headed ‘‘Warning’’on the cover of this Web Proof Information Pack.

5
The CPR includes technical information, which requires subsequent calculations to derive subtotals, totals and weighted averages. Such calculations may involve a degree of rounding and consequently introduce an error. Where such errors occur; WAI does not consider these to be material. Furthermore, WAI is responsible for this letter and the CPR as part of the Document and declares that it has taken all reasonable care to ensure that the information contained in this letter and the CPR is, to the best of its knowledge, in accordance with the facts and contains no omission likely to affect its import. Consent and Copyright WAI consents to the inclusion of its name and all references to WAI in the Document, the issuing of this letter and the CPR in the form and content in which it is to be included in the Document. Neither the whole nor any part of this letter and the CPR nor any reference thereto may be included in any other document without the prior written consent of WAI regarding the form and context in which it appears. Copyright of all text and other matter in this document, including the manner of presentation, is the exclusive property of WAI. It is an offence to publish this document or any part of the document under a different cover, or to reproduce and or use, without written consent, any technical procedure and or technique contained in this letter and the CPR. The intellectual property reflected in the contents resides with WAI and shall not be used for any activity that does not involve WAI, without the written consent of WAI. Responsibility for the Competent Person’s Report and No Material Change The CPR is complete up to and including [•] February 2011. Having taken all reasonable care to ensure that such is the case, WAI confirms that, to the best of its knowledge, the information contained in the CPR is in accordance with the facts, contains no omission likely to affect its import, and no material change has occurred from [•] 2011 to the date hereof that would require any amendment to the CPR. Qualification of Consultants WAI comprises over 50 staff, offering expertise in a wide range of resource and engineering disciplines. WAI's independence is ensured by the fact that it holds no equity in any project. This permits WAI to provide its clients with conflict‐free and objective recommendations on crucial .judgment issues. WAI has a demonstrated track record in undertaking independent assessments оf resources and reserves, project evaluations and audits, MER’s and CPR’s, and independent feasibility evaluations to bankable standards on behalf of exploration and mining companies and financial institutions worldwide. The CPR has been prepared based on a technical and economic review by a team of consultants sourced from the WAI offices in Europe over a 4 month period. These consultants are specialists in the fields of geology, resource and reserve estimation and classification, open pit mining, rock engineering, mineral processing, hydrogeology and hydrology, tailings management, infrastructure, environmental management and mineral economics. The individuals listed below have provided input to the CPR and have extensive experience in the mining industry and are members in good standing of appropriate professional institutions:
• Phil Newall, MCSM, BSc, PhD , CEng, FIMMM, is Director of Minerals and Geologist with WAI and has practised his profession as a mine and exploration geologist for over 25 years for both base and precious metals;
THIS WEB PROOF INFORMATION PACK IS IN DRAFT FORM. The information contained herein is incomplete and subject to change and it must be read in conjunction with the section headed ‘‘Warning’’on the cover of this Web Proof Information Pack.

6
• Mark Owen, BSc, MSc, (MCSM), CGeol, EurGeol, FGS, is a Technical Director and Geologist with WAI and has over 28 years international experience as a mine and exploration geologist in both surface and underground mining operations;
• Che Osmond, BSc, MSc (MCSM), ProfGradMIMMM, CGeol, Euro Geol, FGS; is a Principal Geologist with WAI and has over 15 years experience in mining and exploration geology;
• Adam Wheeler, BSc MSc CEng EurIng, MIMMM; is Principal Resource Analyst and Mining Engineer, with WAI specialising in the application, customisation and management of mining and geological software systems;
• Richard Ellis, MCSM BSc MSc FGS; is a Senior Resource Geologist with WAI who has some 8 years operational experience within the industrial minerals sector in the UK;
• Colin Taylor, MA, Pr.Sci.Nat, is an Associate Geologist with WAI who has over 40 years of international experience in exploration and resource geology, initially in South Africa and Namibia before being based in the UK.
• Owen Mihalop, BSc (Hons), MSc, MCSM, CEng, MIMMM, is a Technical Director of Mining with WAI with 15 years broad based experience in the mining and quarrying industries. He has gained experience in grass‐roots exploration through to large scale open‐pit and underground mining projects across Ireland, Bulgaria, Spain and Canada;
• Bruce Pilcher, BE(Mining)Syd, MAusIMM(CP), MIMMM, CEng, Eur Ing is an Associate Director and Principal Mining Engineer with WAI with 25 years experience in underground and surface mining operations in South Africa, Australia and UK. Bruce has served as Mine Superintendent, Regional and Technical Services Manager. He has considerable experience in production management, mine design and planning, and contract management in the coal and metalliferous mining industries
• Lewis Meyer, BEng, ACSM, MSc, MCSM, PhD, CEng, FIMMM is a Principal Mining Engineer with WAI who has over 18 years experience in mining, underground civil construction and rock mechanics of surface and underground mining operations;
• Daniil Lunev, DipEng (SPMI), PhD (SPMI) is a Mining Engineer with WAI whose specialist area is with NPV© scheduler mining software and mining machinery.
• Stuart Richardson, BEng, ACSM, GradMIMMM is a Mining Engineer with WAI who joined Wardell Armstrong in early 2007 as a Graduate Mining Engineer who now assists in the production of of pre‐feasibility and feasibility studies using Mine 2‐4D software;
• Colin Hunter, BSc (Hons), PhD, is an Associate Consultant with WAI who has 32 years minerals processing experience ranging from laboratory test work and pilot plant operations through to plant commissioning, operations and trouble‐shooting;
• Phil King, ARSM, BSc, FIMMM is a Technical Director and Metallurgist with WAI and has over 25 years experience within the minerals industry in both process testwork and design for metallic and industrial minerals worldwide;
• Chris Broadbent, BSc, PhD, CEng, FIMMM, is a Partner with Wardell Armstrong and is a well‐recognised authority on pyrometalurgical processing and the treatment and disposal of wastes from mining and metallurgical plants;
• Andrei Kudrin, BS (Hons), MEng (Hons), as a mature student has recently graduated from the University of Exeter with an engineering degree in Renewable Energy. Before joining WAI he has had placements with various companies such as Scottish and Southern Energy and Cornwall Sustainable Energy Partnership;
• Nick Coppin, BSc, MSc, is Managing Director of WAI and an Environmental Scientist with over 30 years of broadly based experience in the mining and minerals industry. He has worked extensively with government and regional authorities and institutions for mineral planning, mining administration, environmental protection, industrial development and finance. He is fully conversant with national and international guidelines, procedures, regulations and standards for the mining and quarrying sector
• Kim‐Marie Clothier, BSc (Hons) MRes AIEEM, MIEMA, Grad IMMM, ACMI; is a Senior Environmental Scientist with WAI working on Environmental and Social Impact Assessments on mining projects overseas in Uzbekistan, Macedonia, Kyrgyzstan;
THIS WEB PROOF INFORMATION PACK IS IN DRAFT FORM. The information contained herein is incomplete and subject to change and it must be read in conjunction with the section headed ‘‘Warning’’on the cover of this Web Proof Information Pack.

7
• Kathy Hicks, BSc (Hons) MSc MCSM FGS is a Geo‐Environmental Scientist with WAI, Kathy specialising in the field of mineral extraction and the remediation of land affected by past mining activities;
• Christine Blackmore, BSc, MSc, CEnv, FIMMM is a Principal Environmental Geologist with WA who has over 10 years of experience in environmental work both in the UK and overseas. Her expertise is focused in environmental management (EMS, EIA ect) and environmental auditing within the mining industry; and
• Julia Boiko, BSc, Regional Manager – Kazakhstan for WAI, has worked for Western mining companies in Kazakhstan on nickel and gold projects as logistics manager and technical translator.
The Сompetent Рerson who has supervised the production of the CPR is Dr Phil Newall who is Director of Minerals with WAI and a Geologist with over 25 years experience in the mining industry. Yours faithfully for and on behalf of Wardell Armstrong International Ltd
P Newall Director of Minerals
THIS WEB PROOF INFORMATION PACK IS IN DRAFT FORM. The information contained herein is incomplete and subject to change and it must be read in conjunction with the section headed ‘‘Warning’’on the cover of this Web Proof Information Pack.

KAZZINC LTD Competent Person’s Report for the assets held by Kazzinc Ltd in both Kazakhstan and Russia
61‐0795/MM February 2011
Draft V 0.10 Page i
CONTENTS
EXECUTIVE SUMMARY ................................................................................................................... 1 CONSULTANTS AND INTERESTS.....................................................................................................38 1 SITE VISITS ............................................................................................................................43
1.1 Background ...........................................................................................................................43 1.2 Study Strategy ....................................................................................................................... 44
2 OVERVIEW OF THE ASSETS....................................................................................................46 2.1 Introduction ..........................................................................................................................46 2.2 Summary of Assets................................................................................................................47 2.3 Extraction Table ....................................................................................................................56
3 VASILKOVSKOYE DEPOSIT .....................................................................................................81 3.1 Introduction ..........................................................................................................................81
3.1.1 Location & Access .........................................................................................................81 3.1.2 Topography & Climate ..................................................................................................82 3.1.3 Infrastructure ................................................................................................................82 3.1.4 Mineral Rights & Permitting .........................................................................................82
3.2 Geology & Mineralisation .....................................................................................................83 3.2.1 Regional Tectonics ........................................................................................................83 3.2.2 Regional Stratigraphy....................................................................................................83 3.2.3 Mine Geology................................................................................................................84 3.2.4 Mine Structure ..............................................................................................................85 3.2.5 Alteration ......................................................................................................................85 3.2.6 Style of Mineralisation ..................................................................................................86 3.2.7 Mineralogy ....................................................................................................................86 3.2.8 Exploration Potential ....................................................................................................86
3.3 Exploration History ...............................................................................................................88 3.3.1 General..........................................................................................................................88 3.3.2 Core Drilling...................................................................................................................89 3.3.3 Channel Sampling..........................................................................................................90 3.3.4 Core Sampling ...............................................................................................................90 3.3.5 Blastholes ......................................................................................................................90 3.3.6 Density ..........................................................................................................................91
3.4 Mineral Resource ..................................................................................................................91 3.4.1 Introduction ..................................................................................................................91 3.4.2 WAI 2010 Resource Estimate........................................................................................92
3.5 Mining ...................................................................................................................................98
THIS WEB PROOF INFORMATION PACK IS IN DRAFT FORM. The information contained herein is incomplete and subject to change and it must be read in conjunction with the section headed ‘‘Warning’’on the cover of this Web Proof Information Pack.

KAZZINC LTD Competent Person’s Report for the assets held by Kazzinc Ltd in both Kazakhstan and Russia
61‐0795/MM February 2011
Draft V 0.10 Page ii
3.5.1 Introduction ..................................................................................................................98 3.5.2 Mining Operations ........................................................................................................99 3.5.3 Drilling and Blasting ......................................................................................................99 3.5.4 Loading and Hauling....................................................................................................100 3.5.5 Ore Crushing and Stockpiling ......................................................................................100 3.5.6 Mine Planning .............................................................................................................102 3.5.7 Ore Reserves ...............................................................................................................102 3.5.8 Grade Control..............................................................................................................109 3.5.9 Reconciliation..............................................................................................................112 3.5.10 Stockpile...................................................................................................................... 112
3.6 Process ................................................................................................................................113 3.6.1 Introduction ................................................................................................................113 3.6.2 Process Testwork of Sulphide Ores.............................................................................113 3.6.3 Testwork Undertaken at AMMTEC for Bateman Minerals .........................................114 3.6.4 Process Flowsheet.......................................................................................................115 3.6.5 Consumables ...............................................................................................................116 3.6.6 Metallurgical Performance .........................................................................................117 3.6.7 Labour ......................................................................................................................... 118 3.6.8 Assay Laboratory.........................................................................................................118 3.6.9 Conclusions .................................................................................................................118
3.7 Environmental, Social and Health & Safety Issues..............................................................119 3.7.1 Introduction ................................................................................................................119 3.7.2 Environmental & Social Setting and Context ..............................................................119 3.7.3 Communities and Livelihoods .....................................................................................120 3.7.4 Project Status, Activities, Effects, Releases & Controls ..............................................121 3.7.5 Emissions to Air...........................................................................................................126 3.7.6 Permitting ...................................................................................................................127 3.7.7 Environmental Management ......................................................................................128 3.7.8 Social and Community Management..........................................................................130 3.7.9 Health & Safety ...........................................................................................................130 3.7.10 Mine Closure & Rehabilitation....................................................................................131 3.7.11 Conclusions .................................................................................................................132
4 MALEEVSKOYE DEPOSIT......................................................................................................134 4.1 Introduction ........................................................................................................................134
4.1.1 Location & Access .......................................................................................................134 4.1.2 Topography & Climate ................................................................................................134 4.1.3 Infrastructure ..............................................................................................................135 4.1.4 Mineral Rights & Permitting .......................................................................................135
THIS WEB PROOF INFORMATION PACK IS IN DRAFT FORM. The information contained herein is incomplete and subject to change and it must be read in conjunction with the section headed ‘‘Warning’’on the cover of this Web Proof Information Pack.

KAZZINC LTD Competent Person’s Report for the assets held by Kazzinc Ltd in both Kazakhstan and Russia
61‐0795/MM February 2011
Draft V 0.10 Page iii
4.2 Geology & Mineralisation ...................................................................................................136 4.2.1 Regional Geology ........................................................................................................136 4.2.2 Local Geology ..............................................................................................................136 4.2.3 Mineralisation .............................................................................................................140 4.2.4 Orebodies....................................................................................................................142 4.2.5 Mineralogy ..................................................................................................................144 4.2.6 Exploration Potential ..................................................................................................145
4.3 Exploration Works & Procedures........................................................................................145 4.3.1 Background .................................................................................................................145 4.3.2 Drilling .........................................................................................................................146 4.3.3 Surveying.....................................................................................................................147 4.3.4 Core Recovery .............................................................................................................147 4.3.5 Sample Collection........................................................................................................148 4.3.6 Sample Analysis...........................................................................................................148 4.3.7 Current Activities ........................................................................................................149
4.4 Mineral Resources ..............................................................................................................149 4.4.1 Introduction ................................................................................................................149 4.4.2 Resource Conditions ...................................................................................................149 4.4.3 2005 GKZ Approved Estimate .....................................................................................150
4.5 WAI 2010 Resource Estimate..............................................................................................151 4.5.1 Introduction – Previous Resource Estimates ..............................................................151 4.5.2 Database Compilation.................................................................................................151 4.5.3 Domaining ...................................................................................................................151 4.5.4 Global Geostatistical Analysis .....................................................................................152 4.5.5 Variography.................................................................................................................153 4.5.6 Block Modelling...........................................................................................................154 4.5.7 Density and Zinc Equivalent ........................................................................................154 4.5.8 Grade Estimation ........................................................................................................154 4.5.9 Validation ....................................................................................................................155 4.5.10 Depletion.....................................................................................................................155 4.5.11 Resource Classification................................................................................................155 4.5.12 Resource Evaluation....................................................................................................156
4.6 Mining .................................................................................................................................158 4.6.1 Introduction ................................................................................................................158 4.6.2 Mining Methods..........................................................................................................158 4.6.3 Dilution, Recoveries and Losses..................................................................................159 4.6.4 Mining Equipment.......................................................................................................160 4.6.5 Backfill .........................................................................................................................160
THIS WEB PROOF INFORMATION PACK IS IN DRAFT FORM. The information contained herein is incomplete and subject to change and it must be read in conjunction with the section headed ‘‘Warning’’on the cover of this Web Proof Information Pack.

KAZZINC LTD Competent Person’s Report for the assets held by Kazzinc Ltd in both Kazakhstan and Russia
61‐0795/MM February 2011
Draft V 0.10 Page iv
4.6.6 Ore and Waste Extraction ...........................................................................................161 4.6.7 Dewatering System .....................................................................................................161 4.6.8 Ventilation...................................................................................................................161 4.6.9 Conclusions .................................................................................................................161
4.7 Ore Reserves ....................................................................................................................... 162 4.7.1 Introduction ................................................................................................................162 4.7.2 Mine 2‐4D and EPS Software ......................................................................................162 4.7.3 Mining Parameters......................................................................................................162 4.7.4 Mine Layout ................................................................................................................162 4.7.5 Mine Development .....................................................................................................162 4.7.6 Stoping ........................................................................................................................ 162 4.7.7 Losses and Dilution .....................................................................................................163 4.7.8 Mining Schedule..........................................................................................................163 4.7.9 Ore Reserves ...............................................................................................................163
4.8 Process ................................................................................................................................165 4.8.1 Introduction ................................................................................................................165 4.8.2 Ore Mineralogy ...........................................................................................................165 4.8.3 Flowsheet Description ................................................................................................165 4.8.4 Heavy Media Separation.............................................................................................165 4.8.5 Grinding....................................................................................................................... 166 4.8.6 Flotation ...................................................................................................................... 166 4.8.7 Process Control ...........................................................................................................166 4.8.8 Concentrate Dewatering.............................................................................................166 4.8.9 Concentrates Transport and Sales ..............................................................................167 4.8.10 Concentrate Management and Labour.......................................................................167 4.8.11 Metallurgical Performance .........................................................................................167 4.8.12 Process Consumables..................................................................................................168 4.8.13 Process Capital Budget 2011.......................................................................................168 4.8.14 Conclusions .................................................................................................................168
4.9 Environmental, Social, Health & Safety ..............................................................................169 4.9.1 Introduction ................................................................................................................169 4.9.2 Environmental & Social Setting and Context ..............................................................169 4.9.3 Project Status, Activities, Effects, Releases & Controls ..............................................170 4.9.4 Permitting ...................................................................................................................178 4.9.5 Environmental Management ......................................................................................178 4.9.6 Social and Community Management..........................................................................180 4.9.7 Health & Safety ...........................................................................................................181 4.9.8 Mine Closure & Rehabilitation....................................................................................181
THIS WEB PROOF INFORMATION PACK IS IN DRAFT FORM. The information contained herein is incomplete and subject to change and it must be read in conjunction with the section headed ‘‘Warning’’on the cover of this Web Proof Information Pack.

KAZZINC LTD Competent Person’s Report for the assets held by Kazzinc Ltd in both Kazakhstan and Russia
61‐0795/MM February 2011
Draft V 0.10 Page v
4.9.9 Conclusions .................................................................................................................182
TABLES
Table 2.1: Summary of Assets ‐ Kazakstan............................................................................................48 Table 2.2: Summary of all Kazzinc Mineral Resource Estimates...........................................................50 Table 2.3:Kazzinc Mineral Resources Ridder Sokolniy Mine ................................................................52 Table 2.4: Kazzinc Ore Reserve Estimates.............................................................................................54 Table 2.5: Kazzinc Group Extraction .....................................................................................................57 Table 2.6: Maleevskoye Deposit ...........................................................................................................59 Table 2.7: Vasilkovskoye Deposit..........................................................................................................61 Table 2.8: Ridder Sokolniy Deposit ......................................................................................................62 Table 2.9: Tishinskiy Deposit.................................................................................................................64 Table 2.10: Shubinskiy Deposit .............................................................................................................66 Table 2.11: Staroye Tailing Deposit.......................................................................................................69 Table 2.12: Shaimerden Deposit...........................................................................................................71 Table 2.13: Novoshirokinskoye Deposit................................................................................................73 Table 2.14: Dolinnoe Deposit...............................................................................................................75 Table 2.15: Chashinskoye Tailings.........................................................................................................77 Table 2.16: Obruchevskoe Deposit .......................................................................................................78 Table 2.17: Kazzinc Smelter ..................................................................................................................80 Table 3.1: Mining Licence Coordinates .................................................................................................83 Table 3.2: Historical Exploration Works Up To 1990...........................................................................88 Table 3.3: Historical Sampling Methods ..............................................................................................88 Table 3.4: Inclined RC vs Vertical Blasthole Comparison......................................................................91 Table 3.5: Summary of Assay Data by Type ..........................................................................................92 Table 3.6: Standard Statistical Analysis By Borehole Type ...................................................................95 Table 3.7: Standard Statistical Analysis By Lithology ............................................................................95 Table 3.8: Summary of Variogram Models by Domain .......................................................................96 Table 3.9: Estimation Parameters.........................................................................................................97 Table 3.10: Vasilkovskoye Mineral Resource Estimate.........................................................................98 Table 3.11: Optimisation Parameters................................................................................................102 Table 3.12: Pit Optimisation Summary..............................................................................................103 Table 3.13: Pit Design Parameters .....................................................................................................105 Table 3.14: Vasilkovskoye Pit Evaluation Summary............................................................................105 Table 3.15: Schedule Summary...........................................................................................................110 Table 3.16: Reconciliation Data of Block Model to Mining For 2010 .................................................112 Table 3.17: Rational Analysis Results..................................................................................................113
THIS WEB PROOF INFORMATION PACK IS IN DRAFT FORM. The information contained herein is incomplete and subject to change and it must be read in conjunction with the section headed ‘‘Warning’’on the cover of this Web Proof Information Pack.

KAZZINC LTD Competent Person’s Report for the assets held by Kazzinc Ltd in both Kazakhstan and Russia
61‐0795/MM February 2011
Draft V 0.10 Page vi
Table 3.18: AMMTEC Test Results .....................................................................................................114 Table 3.19: Vasilkovskoye Process Consumables ...............................................................................117 Table 3.20: Vasilkovskoye Process Plant Recoveries ..........................................................................117 Table 3.21: Tailings Analysis ..............................................................................................................124 Table 3.22: Tailings Management Facility Parameters .....................................................................125 Table 3.23: Potential Emissions to Air ...............................................................................................126 Table 3.24: Recommendations for Environmental & Social Action Plan .........................................133 Table 4.1: Mining Licence Coordinates ...............................................................................................135 Table 4.2: Technological and Mineralogical Classification of Maleevsky Mineralisation...................144 Table 4.3: Historical Exploration Works ............................................................................................146 Table 4.4: 2005 Conventional Reserve Estimate ................................................................................150 Table 4.5: Geostatistical GKZ‐Approved Resources............................................................................150 Table 4.6: Classified Geostatistical Approved Resource .....................................................................151 Table 4.7: Sample Database................................................................................................................152 Table 4.8: Density Regression Formulas .............................................................................................154 Table 4.9: Maleevskoye Resource Estimate ‐ For All Orebodies ........................................................157 Table 4.10: Maleevskoye Production Schedule (WAI) ......................................................................164 Table 4.11: Maleevskoye Ore Reserves.............................................................................................164 Table 4.12: Process Plant Manning Levels.........................................................................................167 Table 4.13: Maleevskoye Plant Metallurgical Balance (2009) ............................................................167 Table 4.14: Maleevskoye Plant Consumables.....................................................................................168 Table 4.15: Chemical Analysis .............................................................................................................173 Table 4.16: Water Balance for the TMF.............................................................................................175 Table 4.17: Emissions to Air ................................................................................................................177 Table 4.18: Recommendations for Environmental & Social Action Plan .........................................183
FIGURES
Figure 2.1: Location of Kazzinc Assets In Kazakhstan............................................................................................46
Figure 2.1: Location of Kazzinc Assets in Kazakhstan ...........................................................................46 Figure 2.2: Location of Novoshirokinskoye Mine in the Russian Federation........................................47 Figure 3.1: Location of Vasilkovskoye, Northern Kazakhstan ...............................................................81 Figure 3.2: Geology of Vasilkovskoye and Surrounding Area ...............................................................84 Figure 3.3: IP Profile across Vasilkovskoye Deposit ..............................................................................87 Figure 3.4: Isometric View Looking Towards South of Wireframes......................................................94 Figure 3.5: Grade Profile of KMC Model and Composites by Easting...................................................97 Figure 3.6: Optimisation Results – KMC Model ‐ Rock v Profit/Ore ...................................................104 Figure 3.7: Optimisation Results – KMC Model ‐ Phase v Profit/Ore .................................................104
THIS WEB PROOF INFORMATION PACK IS IN DRAFT FORM. The information contained herein is incomplete and subject to change and it must be read in conjunction with the section headed ‘‘Warning’’on the cover of this Web Proof Information Pack.

KAZZINC LTD Competent Person’s Report for the assets held by Kazzinc Ltd in both Kazakhstan and Russia
61‐0795/MM February 2011
Draft V 0.10 Page vii
Figure 3.8: Plan of Final Pit Design......................................................................................................106 Figure 3.9: Section A‐A’ Of Final Pit Design ........................................................................................107 Figure 3.10: Section B‐B’ Of Final Pit Design.......................................................................................108 Figure 3.11: W‐E Section, Depicting Mining Schedule........................................................................111 Figure 4.1: Location of Maleevskoye, Northeast Kazakhstan.............................................................134 Figure 4.2: Regional Geology of the Maleevskoye Area .....................................................................137 Figure 4.3: Long Section through Main Zone and Others...................................................................139 Figure 4.4: Outline of the Maleevskaya Zone (Orebody 3), 12 Level..................................................141 Figure 4.5: Section XIII through Maleevskaya Mineralised Zone (Orebody 3) ...................................142 Figure 4.6: Isometric View of Maleevskaya Zone Orebodies 3 and 3b looking approximately SE .....152 Figure 4.7: Isometric View Rodnikovaya Zone Orebodies 6 and 7 looking approximately SE............152 Figure 4.8: Log Probability Plot of Pb/Zn/Cu within Orebody 3 Maleevskaya Zone...........................153 Figure 4.9: Log Probability Plot for Au in Orebody 7 ..........................................................................153 Figure 4.10: Log probability Plot of Ag within Orebody 7...................................................................153
Figure 4.11: Variogram Model for Pb in Orebody 6
............................................................................................................................................................154
Figure 4.12: Variogram Model for Cu in Orebody
7 ..........................................................................................................................................................154 Figure 4.13: Swath Plot for Orebody 6 Pb Grades ..............................................................................155
THIS WEB PROOF INFORMATION PACK IS IN DRAFT FORM. The information contained herein is incomplete and subject to change and it must be read in conjunction with the section headed ‘‘Warning’’on the cover of this Web Proof Information Pack.

KAZZINC LTD Competent Person’s Report for the assets held by Kazzinc Ltd in both Kazakhstan and Russia
61‐0795/MM February 2011
Draft V 0.10 Page viii
Figure 4.14: Orebody 3 NW‐SE Vertical Section Showing JORC Classification ...................................156 Figure 4.15: Orebody 3 Isometric View from North Showing JORC Classification .............................156 Figure 4.16: SLOS Stope Extraction Sequence at Maleevskoye Mine.................................................159 Figure 4.17: Proposed Stopes with Development ..............................................................................163
PHOTOS
Photo 3.1: General View of Mining Operations at Vasilkovskoye ........................................................99 Photo 3.2: Old Heap Leach Dumps and Associated Infrastructure.....................................................121 Photo 3.3: Aerial View Showing Location of Main Mine Components. The Outline of the new TMF is
shown approximately .........................................................................................................................122 Photo 4.1: Aerial View of Maleevskoye Mine.....................................................................................171 Photo 4.2: Concentrator complex in Zyryanovsk................................................................................172 Photo 4.3: Zyryanovskoye TMF, Showing Local Communities and Connection to Bukhtarma River.173 Photo 4.4: Biological (Oxidation) Water Clarification Lagoon at the TMF..........................................176
THIS WEB PROOF INFORMATION PACK IS IN DRAFT FORM. The information contained herein is incomplete and subject to change and it must be read in conjunction with the section headed ‘‘Warning’’on the cover of this Web Proof Information Pack.

KAZZINC LTD Competent Person’s Report for the assets held by Kazzinc Ltd in both Kazakhstan and Russia
61‐0795/MM February 2011
Draft V 0.10 Page 1
EXECUTIVE SUMMARY Kazzinc Limited (the “Client” or “Kazzinc”) commissioned Wardell Armstrong International Ltd ("WAI") to prepare a Competent Person’s Report (the “CPR”) on its gold mining, development and exploration assets held in Kazakhstan and Russia. WAI understands that the CPR will be included as part of a document (the "Document”) to be published by Glencore International Plc (“Glencore”). WAI understands that Glencore International plc is expected to be the ultimate parent company of the group. Kazzinc has acquired a significant portfolio of mineral assets in Kazakhstan and Russia. These vary from mature mining operations through to grass‐roots exploration terrain and are summarised below. Glencore owns 50.69% of Kazzinc. The remainder of the business is owned by Verny Capital JSC (48.73%), a Kazakh investment fund unrelated to Glencore, with certain small shareholders accounting for the remaining 0.58%. Production Mines Kazakhstan
• Vasilkovskoye Mine; • Maleevskoye Mine and satellite including Grechovsky Mine; • Ridder‐Sokolniy Mine; and satellites including Tishinskiy Mine and Shubinskiy Mine; • Staroye (Old) tailings management facility (TMF); • Ridder Smelter; and • Shaimerden Open Pit.
Russia
• Novoshirokinskoye Mine. Advanced Exploration Properties Kazakhstan
• Dolinnoe & Obruchevskoe; • Chekmar; • Chashinskoye TMF; and • Tishinskiy Slimes Ponds.
Exploration Licences Kazakhstan
• Solovievskiy Block located south of Maleevskoye; • Butachikhinsko‐Kedrovskiy Block located west of Tishinskiy ; and • Western Torgai located in the Kostanai region of northern western Kazkahstan.
In addition to these mineral assets Kazzinc also operates smelters and a hydroelectric power station (which are included in this report as part of the operational structure). These assets are described in more detail below. Production Mines
THIS WEB PROOF INFORMATION PACK IS IN DRAFT FORM. The information contained herein is incomplete and subject to change and it must be read in conjunction with the section headed ‘‘Warning’’on the cover of this Web Proof Information Pack.
KAZZINC LTD Competent Person’s Report for the assets held by Kazzinc Ltd in both Kazakhstan and Russia
61‐0795/MM February 2011
Draft V 0.10 Page 2
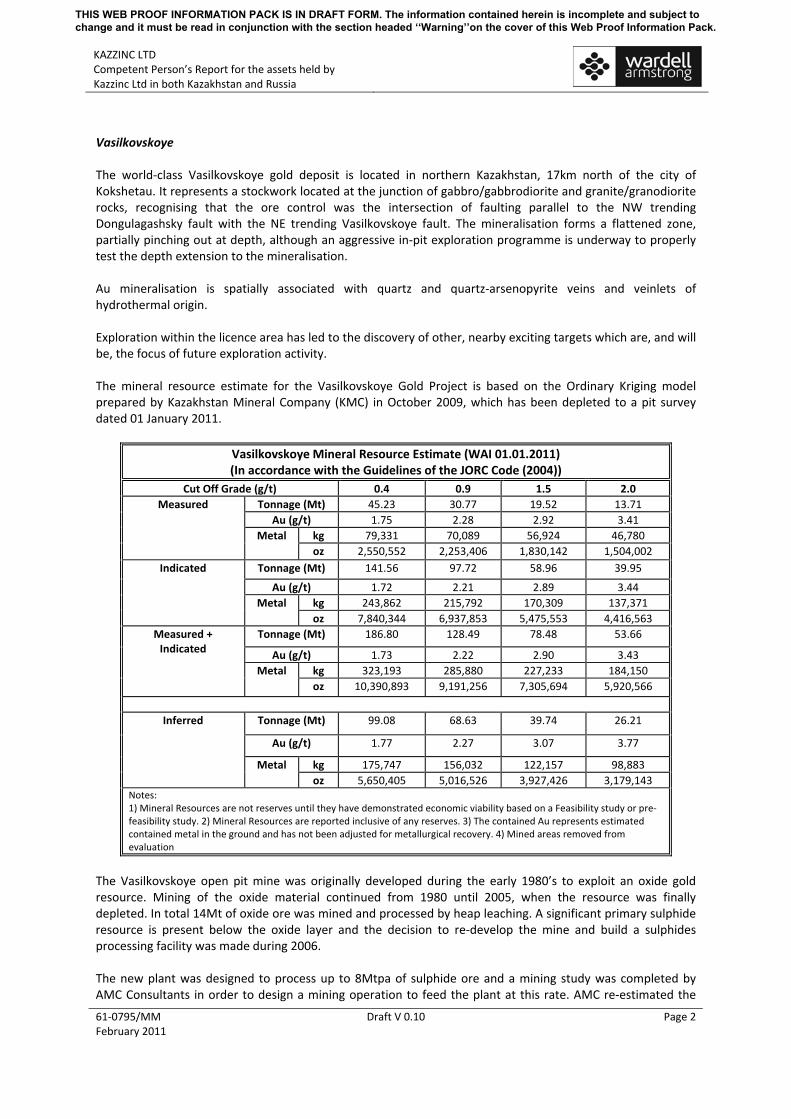
Vasilkovskoye The world‐class Vasilkovskoye gold deposit is located in northern Kazakhstan, 17km north of the city of Kokshetau. It represents a stockwork located at the junction of gabbro/gabbrodiorite and granite/granodiorite rocks, recognising that the ore control was the intersection of faulting parallel to the NW trending Dongulagashsky fault with the NE trending Vasilkovskoye fault. The mineralisation forms a flattened zone, partially pinching out at depth, although an aggressive in‐pit exploration programme is underway to properly test the depth extension to the mineralisation. Au mineralisation is spatially associated with quartz and quartz‐arsenopyrite veins and veinlets of hydrothermal origin. Exploration within the licence area has led to the discovery of other, nearby exciting targets which are, and will be, the focus of future exploration activity. The mineral resource estimate for the Vasilkovskoye Gold Project is based on the Ordinary Kriging model prepared by Kazakhstan Mineral Company (KMC) in October 2009, which has been depleted to a pit survey dated 01 January 2011.
Vasilkovskoye Mineral Resource Estimate (WAI 01.01.2011) (In accordance with the Guidelines of the JORC Code (2004))
Cut Off Grade (g/t) 0.4 0.9 1.5 2.0 Tonnage (Mt) 45.23 30.77 19.52 13.71
Au (g/t) 1.75 2.28 2.92 3.41 kg 79,331 70,089 56,924 46,780
Measured
Metal oz 2,550,552 2,253,406 1,830,142 1,504,002
Tonnage (Mt) 141.56 97.72 58.96 39.95
Au (g/t) 1.72 2.21 2.89 3.44 kg 243,862 215,792 170,309 137,371
Indicated
Metal oz 7,840,344 6,937,853 5,475,553 4,416,563
Tonnage (Mt) 186.80 128.49 78.48 53.66
Au (g/t) 1.73 2.22 2.90 3.43 kg 323,193 285,880 227,233 184,150
Measured + Indicated
Metal oz 10,390,893 9,191,256 7,305,694 5,920,566
Tonnage (Mt) 99.08 68.63 39.74 26.21
Au (g/t) 1.77 2.27 3.07 3.77
kg 175,747 156,032 122,157 98,883
Inferred
Metal oz 5,650,405 5,016,526 3,927,426 3,179,143
Notes: 1) Mineral Resources are not reserves until they have demonstrated economic viability based on a Feasibility study or pre‐feasibility study. 2) Mineral Resources are reported inclusive of any reserves. 3) The contained Au represents estimated contained metal in the ground and has not been adjusted for metallurgical recovery. 4) Mined areas removed from evaluation
The Vasilkovskoye open pit mine was originally developed during the early 1980’s to exploit an oxide gold resource. Mining of the oxide material continued from 1980 until 2005, when the resource was finally depleted. In total 14Mt of oxide ore was mined and processed by heap leaching. A significant primary sulphide resource is present below the oxide layer and the decision to re‐develop the mine and build a sulphides processing facility was made during 2006. The new plant was designed to process up to 8Mtpa of sulphide ore and a mining study was completed by AMC Consultants in order to design a mining operation to feed the plant at this rate. AMC re‐estimated the
THIS WEB PROOF INFORMATION PACK IS IN DRAFT FORM. The information contained herein is incomplete and subject to change and it must be read in conjunction with the section headed ‘‘Warning’’on the cover of this Web Proof Information Pack.

KAZZINC LTD Competent Person’s Report for the assets held by Kazzinc Ltd in both Kazakhstan and Russia
61‐0795/MM February 2011
Draft V 0.10 Page 3
resources in accordance with the JORC Code (2004) and undertook geotechnical, hydro‐geological, pit optimisation and preliminary mine design studies. The initial AMC pit design was to a depth of 360m but following re‐optimisation at higher gold prices, the final pit design by Tomsk Institute was for a 440m deep pit. Waste stripping, ore stockpiling and construction of the in‐pit crushing facilities commenced during 2007. Production itself officially began with the completion of the processing facilities in November 2009. Due to problems with the processing plant, however, the mine is currently running at less than half of the design capacity, producing at present in the region of 270kt of ore per month rather than 600kt per month. The Vasilkovskoye mine is a conventional open pit mine. The ore and waste rock is drilled and blasted prior to excavation by diesel‐hydraulic excavators. The ore is loaded into diesel powered off‐highway rigid dump trucks and hauled to either one of three in‐pit stockpiles, depending on grade, or dumped directly into an in‐pit crusher. The waste rock is hauled to one of two waste dumps depending on which side of the pit is being excavated. The mining fleet is owned and operated by VasGold. Reserve estimations, related to pit design and scheduling, may be summarised as:
• Pit Optimisation: Pit optimisation runs were completed on the available KMC and WAI resource block models, based on parameters supplied by Vasgold;
• Pit Design: Based on the optimisation results, a new pit design was completed. This goes beyond the existing ‘final design (Cutback #4) and incorporates a significant pit extension to the west. A summary of the reserves from this revised pit design estimated in accordance with the guidelines of the JORC Code (2004) is shown in the table below.
Vasilkovskoye Ore Reserve Estimate (WAI 01.01.2011) (In Accordance with the Guidelines of the JORC Code (2004))
Classification Tonnes Mt
Au g/t
Au Contained kg
Rock Mt
Waste Mt
Strip Ratio
Proven 33.3 1.95 64.95 Probable 90.7 1.94 175.76 Total 123.97 1.94 240.71 870.65 746.68 6.02 Notes: Reserves determined with 0.9g/t Au cut‐off, using KMC resource block model Mining factors applies of 17.5% dilution and 95% mining recovery Waste includes 38Mt of Inferred material at ore grades
• Scheduling: A life‐of‐mine schedule was developed, based on an 8Mtpa mill production rate.
Material from the final cutback is not mined until year 5, with the bulk of production from this final cutback coming after year 6.
For processing, ore is subjected to primary crushing in the open pit and the ‐550mm fraction is conveyed to a coarse ore stockpile by overland conveyors. Further cone crushing take this material down to 80% passing 5.2mm. From here, the ore is ground in two parallel circuits, each using a single stage 6.7 x 11.3m Outukumpu ball mills. Further treatment involves flotation and gravity concentration using Knelson units. The gravity and flotation concentrates are combined and ground in a 3.6 x 5.5m ball mill to achieve a product size of 95% passing 45µm. The combined concentrates are then subjected to ultrafine grinding, using Deswick mills, to achieve a product grading 80‐90% passing 4μm.
THIS WEB PROOF INFORMATION PACK IS IN DRAFT FORM. The information contained herein is incomplete and subject to change and it must be read in conjunction with the section headed ‘‘Warning’’on the cover of this Web Proof Information Pack.

KAZZINC LTD Competent Person’s Report for the assets held by Kazzinc Ltd in both Kazakhstan and Russia
61‐0795/MM February 2011
Draft V 0.10 Page 4
The gold in the gravity and flotation concentrates is partially refractory and the sulphide minerals need to be oxidised to ensure maximum gold recovery. This is achieved via the “Leachox Process”, supplied by Maelgwyn Minerals Services (MMS). This is followed by Detox. Gold is recovered from carbon using the standard Zardra method at 140‐150°C and 2.5 atmospheres. The electrolysis product is smelted to produce doré assaying 85‐92% Au in 12kg bars. The technological recoveries for the process plant for 2010 show that there was a gradual increase in recovery throughout the year. The maximum recovery was 67.2% in August and it appears that recoveries generally range between 60‐67%. The plant head grade has generally increased throughout the period, ranging from 1.65ppm Au (January) to 2.28ppm Au (December). The tonnage throughput peaked in May and April, but decreased again in August and September before reaching 556kt in October. However, throughput decreased during November and December due to refurbishment of the Outotec mills. In summary, the Plant has experienced a long ramp up period due to problems with equipment and lower than expected process recoveries. However, recent initiatives by the company has addressed many of these issues to allow plant production and recovery to approach design parameters, although optimal conditions have yet to be reached. Vasilkovskoye has a very high standard of environmental, social, health and safety management. It is compliant with Kazakh licences, permits and norms. Both the environmental and labour safety functions of the company are of high quality and well organised, and supported by a strong corporate policy, commitment and team. There are no known social, community or cultural issues or impacts that need to be addressed, and no displacement or compensation requirements. The mine appears to have a good relationship with the local communities, and does not put undue pressure on the social infrastructure of the District or Oblast. Maleevskoye The Maleevskoye underground polymetallic mine is situated some 17km to the north of the town of Zyryanovsk (where the concentrator is located) which in turn is situated 186km east of Ust Kamenogorsk, northeastern Kazakhstan. The deposit comprises seven gently dipping stratabound zones of lead‐zinc‐copper‐gold‐silver mineralisation: Rodnikovaya, Maleevskaya, Octyabrskaya, Holodnaya, Lugovaya, Bobrovskaya and Platovskaya, confined to broad mushroom‐shaped brecciated domes passing downwards into steeply dipping stockwork feeder channels, which are generally aligned along NW‐trending fractures. The largest and richest mineralised zones (Maleevskaya, Rodnikovaya, Holodnaya and Lugovaya) occur within a 150‐200m thick Maleevsky Member of the Maslovskaya Formation. Strike lengths exceed 1km in Orebody 3 at Maleevskaya zone and in the Rodnikovaya zone. Mineralisation is divided into polymetallic (lead‐zinc with >0.6% Pb) and copper‐zinc (<0.6% Pb and high Cu). In general, polymetallic mineralisation, accompanied by barite, occurs on the flanks and on the hangingwall side of the lenses, whilst copper‐zinc mineralisation tends to prevail in the central parts of the lenses and on the footwall side. The main metalliferous minerals are pyrite, sphalerite, chalcopyrite and galena, whilst the main gangue minerals are quartz, chlorite, calcite, barite, actinolite, tremolite and less common sericite, albite, epidote and biotite.
THIS WEB PROOF INFORMATION PACK IS IN DRAFT FORM. The information contained herein is incomplete and subject to change and it must be read in conjunction with the section headed ‘‘Warning’’on the cover of this Web Proof Information Pack.

KAZZINC LTD Competent Person’s Report for the assets held by Kazzinc Ltd in both Kazakhstan and Russia
61‐0795/MM February 2011
Draft V 0.10 Page 5
The main recoverable by‐products are gold and silver. Gold occurs in its native form as very fine grains (5‐8 microns) dispersed mainly in pyritic copper mineralisation and barite‐bearing lead‐zinc mineralisation. A small percentage of gold occurs as larger visible grains of up to 0.8mm across. The fineness of gold is 794. For resources, WAI has prepared a Mineral Resource estimate dated 01.01.2011 for Maleevskaya in accordance witht he guidelines of the JORC Code (2004), with grade estimation carried out using Ordinary Kriging (OK) as the principal interpolation method with Inverse Power of Distance (IPD) used for comparative purposes. For orebodies 3b in the Maleevskaya Zone, 18 and 19 in the Octyabrskaya Zone and orebody 5 in the Rodnikovaya Zone, IPD was used as the principal interpolation method. The results of this study are shown in the table below:
THIS WEB PROOF INFORMATION PACK IS IN DRAFT FORM. The information contained herein is incomplete and subject to change and it must be read in conjunction with the section headed ‘‘Warning’’on the cover of this Web Proof Information Pack.

KAZZINC LTD Competent Person’s Report for the assets held by Kazzinc Ltd in both Kazakhstan and Russia
61‐0795/MM February 2011
Draft V 0.10 Page 6
Maleevskoye Mineral Resource Estimate ‐ For All Orebodies (WAI 01.01.2011)
(In Accordance with the Guidelines of the JORC Code (2004)) Pb Zn Cu Au Ag Ba Sp EQV Classification Type Tonnage
(Mt) Density
% t % t % t g/t oz g/t oz % t % t % CuZn 5.16 3.57 0.31 16,118 3.17 163,709 2.37 122,268 0.46 76,838 45.78 7,592,815 2.34 12,074 20.83 107,488 6.62 PbZn 7.77 3.81 1.68 130,483 9.41 730,724 2.39 185,584 0.73 181,078 98.97 24,707,132 5.19 40,308 18.06 140,209 13.44
Measured
Total 12.92 3.71 1.13 146,601 6.92 894,433 2.39 307,852 0.62 257,917 77.74 32,299,948 4.05 52,382 19.17 247,696 10.71 CuZn 3.68 3.22 0.35 12,826 3.28 120,504 1.65 60,638 0.39 45,517 41.84 4,943,748 2.30 8,438 11.46 42,095 5.71 PbZn 7.36 3.62 1.55 114,356 8.59 631,546 2.10 154,476 0.65 154,837 76.29 18,043,611 3.78 27,792 11.49 84,529 12.15
Indicated
Total 11.03 3.49 1.15 127,182 6.82 752,050 1.95 215,114 0.56 200,354 64.82 22,987,359 3.28 36,231 11.48 126,625 10.00 CuZn 8.83 3.43 0.33 28,944 3.22 284,213 2.07 182,906 0.43 122,355 44.14 12,536,563 2.32 20,512 16.93 149,583 6.24 PbZn 15.12 3.72 1.62 244,838 9.01 1,362,270 2.25 340,060 0.69 335,915 87.94 42,750,744 4.50 68,101 14.86 224,738 12.81
Measured + Indicated
Total 23.96 3.61 1.14 273,783 6.87 1,646,483 2.18 522,966 0.60 458,271 71.79 55,287,307 3.70 88,613 15.63 374,321 10.39
CuZn 1.77 3.06 0.29 5,047 2.80 49,408 1.22 21,533 0.18 10,145 24.28 1,377,707 1.15 2,038 5.80 10,234 4.55 PbZn 3.11 3.21 2.31 71,746 6.23 193,725 0.84 26,099 0.29 28,611 60.67 6,061,129 2.75 8,538 5.83 18,101 8.55
Inferred
Total 4.87 3.16 1.58 76,794 4.99 243,133 0.97 47,632 0.25 38,756 47.49 7,438,836 2.17 10,576 5.82 28,334 7.10
THIS WEB PROOF INFORMATION PACK IS IN DRAFT FORM. The information contained herein is incomplete and subject to change and it must be read in conjunction with the section headed ‘‘Warning’’on the cover of this Web Proof Information Pack.

KAZZINC LTD Competent Person’s Report for the assets held by Kazzinc Ltd in both Kazakhstan and Russia
61‐0795/MM February 2011
Draft V 0.10 Page 7
Maleevskoye is the largest underground mine in the Kazzinc group in terms of ore production. Operations at Maleevskoye started in 2000 at a rate of 1.5Mtpa, with full scale production of 2.25Mtpa being reached in 2002. Two ore types are mined at Maleevskoye, copper‐zinc ore and polymetallic ore. Both products are transported by road to the Zyryanovsky Mining and Concentrating Complex (“ZGOK”) located some 25km to the south of the mine site. The mine utilises modern high capacity trackless mining methods combined with a traditional tracked haulage system. The main mining methods in operation are sub‐level caving, which accounts for approximately 5% of production, and sub‐level open stoping with backfill, which accounts for the remaining 95% of production. Both mining methods utilise mechanised development with electric‐hydraulic face‐jumbos and diesel LHDs for drilling and ore extraction. Ore and waste is transported either directly to ore/waste passes using LHDs or loaded into trucks and transported to a central ore/waste pass. Tailings are used for backfill. Despite the fact that the mine is located 25km from the processing facility, the modern high productivity mining methods allow a good overall mining cost (approximately US$18/t of ore mined). The reserves appear sufficient to maintain operations at the present level until 2015, but after that production rate drops as a result of fewer faces being available. WAI has carried out a mine design, and produced Ore Reserves for the Maleevskoye deposit, based upon the most recent Mineral Resource Block Model (WAI 2010). WAI has used GijimaAST Mine2‐4D® software to prepare the mine design, and EPS® software to produce Ore Reserves. During the mine design process, losses (4‐8%) and dilution (10‐12%) were applied to the mined tonnages at Maleevskoye. The stope blocks for Maleevskoye have been designed to a minimal average block grade of 4% Zn, or 4% Zinc Equivalent (ZnEQV). Ore Reserves for the Maleevskoye deposit have been calculated in accordance with the guidelines of the JORC Code (2004). A summary of the Ore Reserves is presented below with the production schedule. It should be noted that the production schedule includes 171,010t of Inferred material (at 5.14% Zn, 1.31% Cu, 0.93% Pb, 0.30g/t Au and 41.8g/t Ag), which have not been reported as Ore Reserves. This material has been included in the production schedule, as it is not realistic to leave this material in‐situ.
THIS WEB PROOF INFORMATION PACK IS IN DRAFT FORM. The information contained herein is incomplete and subject to change and it must be read in conjunction with the section headed ‘‘Warning’’on the cover of this Web Proof Information Pack.

KAZZINC LTD Competent Person’s Report for the assets held by Kazzinc Ltd in both Kazakhstan and Russia
61‐0795/MM February 2011
Draft V 0.10 Page 8
Maleevskoye Ore Reserve Estimate (WAI 01.01.2011) (In Accordance with the Guidelines of the JORC Code (2004))
Grade Contained Metal (t) Classification Tonnage (Kt)
Zn (%) Cu (%) Pb (%) Au (g/t) Ag (g/t) Zn (t)
Cu (t)
Pb (t)
Au (oz)
Ag (oz)
Proven 5,042 6.46 1.92 1.00 0.56 68.13 325,627 96,770 50,358 90,779 11,044,289 Probable 7,061 6.29 1.69 1.04 0.51 56.23 444,011 119,630 73,522 115,777 12,764,963 Total 12,103 6.36 1.79 1.02 0.53 61.19 769,638 216,400 123,880 260,233 23,810,222
Maleevskoye Production Schedule (WAI 01.01.2011) Year Units 2011 2012 2013 2014 2015 2016 2017 2018 2019 2020 2021 2022 2023 Total Total Mined Tonnage Kt 2,313 2,137 2,196 1,710 822 899 420 393 386 328 352 200 118 12,274 Zinc Grade % Zn 5.22 6.14 6.57 7.41 6.69 7.10 6.90 6.41 6.44 7.15 5.27 4.74 5.08 6.34 Copper Grade % Cu 1.75 1.66 1.60 1.59 1.62 1.76 1.97 2.05 2.42 2.55 2.82 1.94 2.82 1.78 Lead Grade % Pb 0.89 1.00 1.00 1.16 0.94 1.04 1.22 1.10 1.18 1.53 0.88 0.85 0.85 1.02 Gold Grade g/t Au 0.42 0.48 0.42 0.64 0.50 0.56 0.67 0.55 0.71 0.77 0.82 0.48 0.63 0.52 Silver Grade g/t Ag 68.07 58.03 49.82 58.55 55.97 56.58 77.36 78.25 79.81 69.70 68.14 59.65 59.42 60.92
THIS WEB PROOF INFORMATION PACK IS IN DRAFT FORM. The information contained herein is incomplete and subject to change and it must be read in conjunction with the section headed ‘‘Warning’’on the cover of this Web Proof Information Pack.

KAZZINC LTD Competent Person’s Report for the assets held by Kazzinc Ltd in both Kazakhstan and Russia
61‐0795/MM February 2011
Draft V 0.10 Page 9
The concentrator at Zyryanovski was constructed in 1953 and has undergone several stages of refurbishment. The plant utilises the standard processes of crushing, heavy media concentration (HMS) and froth flotation to produce copper, lead, zinc concentrates as well as a gold rich gravity concentrate. The plant went through a substantial upgrade in 2000 when all sections of the plant were refurbished and the grinding and flotation sections were renewed. The plant was originally designed to treat 1.5Mtpa but by 2001 the throughput had increased to 2.25Mtpa. The maximum plant throughput is reported to be 3.5Mtpa. The plant treats ore from three sources:
• Maleevskoye mine copper‐zinc and polymetallic ores; • Grekovskoe mine – polymetallic ore; and • “Foreign” ores.
All ore types contain copper, lead, zinc, silver and gold. The gold is present predominantly in the native form and can therefore be recovered using gravity processing methods. The zinc concentrates are transported by rail to either the zinc smelters at Ridder or Ust Kamenogorsk. The lead and gravity gold concentrates are sent to smelters in Ust Kamenogorsk. The copper concentrates are shipped to customers in China. The company is in the process of constructing an IsaSmelt furnace in Ust Kamenogorsk and this is scheduled for completion in 2011. This facility will be able to process the copper concentrates. The metallurgical balance shows a high degree of metallurgical efficiency with low losses of metals to the HMS tailings and satisfactory grades of base metal concentrates at good recovery levels. The recovery of gold to the gravity concentrates was 37.1% with a further 34% reporting to the copper concentrate. Copper recovery to the copper concentrate was 86.1% and the concentrate assayed 24.6% Cu, 3.63% Pb, 2.92% Zn, 2.63ppm Au and 572ppm Ag. The lead concentrate was rather low at 46% Pb, 2.3% Cu and 8.5% Zn at a lead recovery of 58.2%. The zinc concentrate assayed 55.4% Zn, 0.92% Cu and 0.46% Pb at a zinc recovery of 88.9%. The average grade of ore treated was 1.98% Cu, 0.91% Pb, 6.28% Zn, 0.53ppm Au and 59.3ppm Ag. For the most part, the Zyryanovsk Complex and Maleevskoye Mine has a very high standard of environmental, social, health and safety management. It is compliant with Kazakh licenses, permits and norms. Both the environmental and labour safety functions of the company are of high quality and well organised, and supported by a strong corporate policy, commitment and team. There are no known social, community or cultural issues or impacts that need to be addressed, and no displacement or compensation requirements. The mine appears to have a good relationship with the local communities, and does not put undue pressure on the social infrastructure of the District or Oblast. Ridder‐Sokolniy Kazzinc own and operate three polymetallic deposits within the Ridder Area including Ridder‐Sokolniy, Tishinskiy, Shubinskiy, and are planning to develop a further three at Chekmar, Dollinnoe and Obruchevskoe. The Ridder‐Sokolniy deposit was discovered in 1786 and has been worked since 1789, initially exploiting silver and gold‐bearing ore, before producing gold‐polymetallic ore from surface and underground working since 1920. The deposit is situated in the northern part of the Ridder mining district in the Rudnyi Altay. Geologically, this district coincides with an unusual graben structure oriented perpendicular to the regional north west structural trend and preserving Silurian to Middle Devonian volcano‐sedimentary sequences almost in the same position as they were laid down. The graben is filled with four volcano‐sedimentary formations with the Kriukovskaya Formation hosting most of the polymetallic mineralised ore. The deposit is a cluster of
THIS WEB PROOF INFORMATION PACK IS IN DRAFT FORM. The information contained herein is incomplete and subject to change and it must be read in conjunction with the section headed ‘‘Warning’’on the cover of this Web Proof Information Pack.

KAZZINC LTD Competent Person’s Report for the assets held by Kazzinc Ltd in both Kazakhstan and Russia
61‐0795/MM February 2011
Draft V 0.10 Page 10
approximately 20 ore zones of veinlet‐type and disseminated sulphide mineralised ore found at the same stratigraphic position within the Middle Devonian volcano‐sedimentary Kriukovskaya Formation. Four other ore zones are known from deeper stratigraphic levels. The mineralised ore covers an area of approximately 20km2 and extends down to a depth of at least 700m. The most distinguishing feature of the Ridder‐Sokolniy mineralised ore is the dominance of zinc over copper and lead. The average ratio of Cu:Pb:Zn is 0.2:1:2.4, except in copper and zinc‐copper veins where copper predominates. The other characteristic feature is the presence of substantial quantities of gold and, to a lesser degree, silver. Significant exploration has been conducted at Ridder‐Sokolniy and Kazzinc continues to investigate extension to mineralisation both on the flanks and at depth to known deposits. In 2010 over 62,000m of drilling was completed from surface and a further 77,200m completed underground. Ridder‐Sokolniy has a long mining history with underground operations commencing in 1791. Originally there were three separate mines: ’40 Years of VLKSM’, ‘Ridder’ and ‘Leninogorskiy’, which eventually merged into one operation to enable a combined access to the ore. Mining operations have been conducted in the 17 major lodes and future plans are to develop the eastern flank of the Perspektivnaya Lode at Bakhrushinsky deposit. The mine has an extensively developed underground infrastructure on 11 haulage levels and in 11 different deposits. The deposits are accessed by 12 shafts (10 in operation), with a maximum depth of 460m. The main hoisting shafts are Skipovaya (for Pb‐Zn ore) and Novaya (for Cu ore and development waste). The mine has a staffing of approximately 1,500 and most of the production is performed using hand‐held equipment and scrapers and the main haulage is tracked. Trackless methods have been approached recently, and are now focused in the Pobeda area (narrow high‐grade gold vein) in the southern part of the mine. It is proposed to implement 30% trackless mining machinery (especially in development and haulage) in 2011 and to increase utilisation to 50% of overall production by 2013. The majority of the ore is extracted using Sub‐Level Open Stoping method or Open Stoping method, which are relatively similar. Where conditions require, Sublevel Open Stoping with Backfill is used to prevent caving of empty stopes or where potential damage to buildings on surface exists. Shrinkage stoping (<5% of production) is applied in thin steeply dipping ore bodies. The Ridder mining and metallurgical complex employs some 600 staff and treats ore from several sources including Ridder‐Sokolniy mine, Tishinskiy mine, Shubinskiy mine, Staroye tailings, Aged and Fresh slimes from crushing, and Shaimerden zinc oxide and other oxide ores. The latter is transported some 1,200km by rail. All but the zinc oxide ores are initially sent for crushing at one of three crushing facilities with one ore type, a high gold grading silica rich ore from the Ridder‐Sokolniy mine, dispatched to Ust‐Kamenogorsk (smelter) directly after crushing. The remaining ores are further treated by crushing, milling, gravity and froth flotation in one of two concentrator buildings. The copper concentrate is sold to a Chinese smelter and the lead concentrate is dispatched to the Kazzinc lead smelter in Ust‐Kamenogorsk. The gold concentrate is also dispatched to Ust‐Kamenogorsk where it is fed into the lead smelter. The zinc concentrate is transported by truck a few kilometres to the Kazzinc zinc smelter (located in Ridder) and several other ores and concentrates, including Shaimerden and other oxide ores, are also treated at the zinc smelter. Tailings from the complex are pumped some 5km to the Talovskoye TMF that has a remaining capacity of 50Mt. There has been mining activity at Ridder since 1786, via surface and underground workings, with concentration facilities since the 1920s. Prior to 1991, mining and processing at Ridder Sokolniy was State owned and operated, Kazzinc started operating in 1997. The mineral rights for Ridder Sokolniy mine remain State owned, and operations take place under the Subsoil Use Contract with the government and Kazzinc is responsible only for liabilities generated via their current operations and does not have any liabilities associated with contaminations prior to 1997. Mineral Resources for individual Ridder Sokolniy ore zones have been calculated in accordance with the guidelines of the JORC Code (2004) and are shown in the tables together with a summary below.
THIS WEB PROOF INFORMATION PACK IS IN DRAFT FORM. The information contained herein is incomplete and subject to change and it must be read in conjunction with the section headed ‘‘Warning’’on the cover of this Web Proof Information Pack.
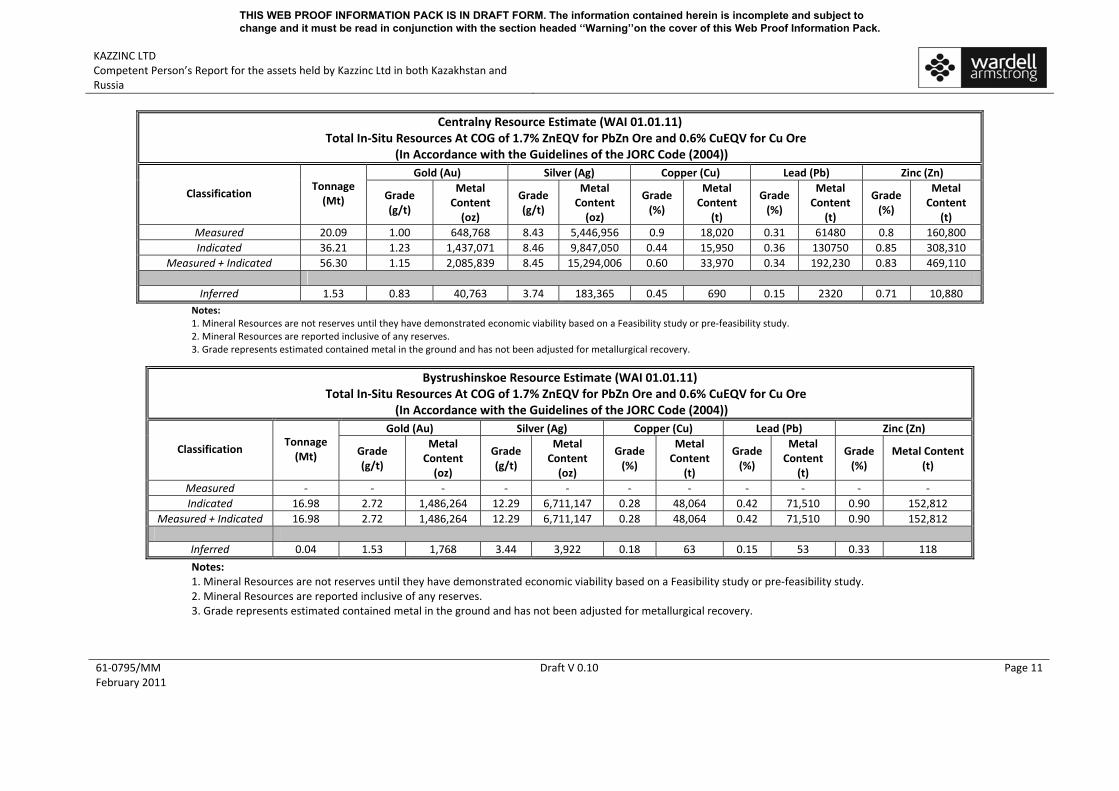
KAZZINC LTD Competent Person’s Report for the assets held by Kazzinc Ltd in both Kazakhstan and Russia
61‐0795/MM February 2011
Draft V 0.10 Page 11
Centralny Resource Estimate (WAI 01.01.11) Total In‐Situ Resources At COG of 1.7% ZnEQV for PbZn Ore and 0.6% CuEQV for Cu Ore
(In Accordance with the Guidelines of the JORC Code (2004)) Gold (Au) Silver (Ag) Copper (Cu) Lead (Pb) Zinc (Zn)
Classification Tonnage (Mt) Grade
(g/t)
Metal Content (oz)
Grade (g/t)
Metal Content (oz)
Grade (%)
Metal Content
(t)
Grade (%)
Metal Content
(t)
Grade (%)
Metal Content
(t) Measured 20.09 1.00 648,768 8.43 5,446,956 0.9 18,020 0.31 61480 0.8 160,800 Indicated 36.21 1.23 1,437,071 8.46 9,847,050 0.44 15,950 0.36 130750 0.85 308,310
Measured + Indicated 56.30 1.15 2,085,839 8.45 15,294,006 0.60 33,970 0.34 192,230 0.83 469,110
Inferred 1.53 0.83 40,763 3.74 183,365 0.45 690 0.15 2320 0.71 10,880 Notes: 1. Mineral Resources are not reserves until they have demonstrated economic viability based on a Feasibility study or pre‐feasibility study. 2. Mineral Resources are reported inclusive of any reserves. 3. Grade represents estimated contained metal in the ground and has not been adjusted for metallurgical recovery.
Bystrushinskoe Resource Estimate (WAI 01.01.11) Total In‐Situ Resources At COG of 1.7% ZnEQV for PbZn Ore and 0.6% CuEQV for Cu Ore
(In Accordance with the Guidelines of the JORC Code (2004)) Gold (Au) Silver (Ag) Copper (Cu) Lead (Pb) Zinc (Zn)
Classification Tonnage (Mt) Grade
(g/t)
Metal Content (oz)
Grade (g/t)
Metal Content (oz)
Grade (%)
Metal Content
(t)
Grade (%)
Metal Content
(t)
Grade (%)
Metal Content (t)
Measured ‐ ‐ ‐ ‐ ‐ ‐ ‐ ‐ ‐ ‐ ‐ Indicated 16.98 2.72 1,486,264 12.29 6,711,147 0.28 48,064 0.42 71,510 0.90 152,812
Measured + Indicated 16.98 2.72 1,486,264 12.29 6,711,147 0.28 48,064 0.42 71,510 0.90 152,812
Inferred 0.04 1.53 1,768 3.44 3,922 0.18 63 0.15 53 0.33 118
Notes: 1. Mineral Resources are not reserves until they have demonstrated economic viability based on a Feasibility study or pre‐feasibility study. 2. Mineral Resources are reported inclusive of any reserves. 3. Grade represents estimated contained metal in the ground and has not been adjusted for metallurgical recovery.
THIS WEB PROOF INFORMATION PACK IS IN DRAFT FORM. The information contained herein is incomplete and subject to change and it must be read in conjunction with the section headed ‘‘Warning’’on the cover of this Web Proof Information Pack.

KAZZINC LTD Competent Person’s Report for the assets held by Kazzinc Ltd in both Kazakhstan and Russia
61‐0795/MM February 2011
Draft V 0.10 Page 12
North Bystrushinskoe Resource Estimate (WAI 01.01.11) Total In‐Situ Resources At COG of 1.7% ZnEQV for PbZn Ore and 0.6% CuEQV for Cu Ore
(In Accordance with the Guidelines of the JORC Code (2004)) Gold (Au) Silver (Ag) Copper (Cu) Lead (Pb) Zinc (Zn)
Classification Tonnage (Mt) Grade
(g/t)
Metal Content (oz)
Grade (g/t)
Metal Content (oz)
Grade (%)
Metal Content
(t)
Grade (%)
Metal Content
(t)
Grade (%)
Metal Content
(t) Measured ‐ ‐ ‐ ‐ ‐ ‐ ‐ ‐ ‐ ‐ ‐ Indicated 1.75 1.26 70,796 5.63 317,328 1.02 17,890 0.29 5,140 1.08 18,868
Measured + Indicated
1.75 1.26 70,796 5.63 317,328 1.02 17,890 0.29 5,140 1.08 18,868
Inferred 0.09 2.46 7,106 6.90 19,997 0.86 776 0.29 264 1.03 925
Notes: 1. Mineral Resources are not reserves until they have demonstrated economic viability based on a Feasibility study or pre‐feasibility study. 2. Mineral Resources are reported inclusive of any reserves. 3. Grade represents estimated contained metal in the ground and has not been adjusted for metallurgical recovery.
Belkina Resource Estimate (WAI 01.01.11) Total In‐Situ Resources At COG of 1.7% ZnEQV for PbZn Ore (In Accordance with the Guidelines of the JORC Code (2004))
Gold (Au) Silver (Ag) Copper (Cu) Lead (Pb) Zinc (Zn)
Classification Tonnage (Mt) Grade
(g/t)
Metal Content (oz)
Grade (g/t)
Metal Content (oz)
Grade (%)
Metal Content
(t)
Grade (%)
Metal Content
(t)
Grade (%)
Metal Content
(t) Measured 3.76 1.26 152,331 18.98 2,294,630 0.09 3,384 0.47 17,670 0.98 36,850 Indicated 4.77 1.11 170,126 16.85 2,582,538 0.08 3,814 0.41 19,550 0.85 40,520
Measured + Indicated
8.53 1.18 322,456 17.79 4,877,168 0.08 7,200 0.44 37,220 0.91 77,370
Inferred 0.52 0.88 14,669 23.42 390,393 0.28 1,450 0.32 1,660 0.90 4,670
Notes: 1. Mineral Resources are not reserves until they have demonstrated economic viability based on a Feasibility study or pre‐feasibility study. 2. Mineral Resources are reported inclusive of any reserves. 3. Grade represents estimated contained metal in the ground and has not been adjusted for metallurgical recovery.
THIS WEB PROOF INFORMATION PACK IS IN DRAFT FORM. The information contained herein is incomplete and subject to change and it must be read in conjunction with the section headed ‘‘Warning’’on the cover of this Web Proof Information Pack.

KAZZINC LTD Competent Person’s Report for the assets held by Kazzinc Ltd in both Kazakhstan and Russia
61‐0795/MM February 2011
Draft V 0.10 Page 13
Perspectivnaya Resource Estimate (WAI 01.01.11) Total In‐Situ Resources At COG of 1.7% ZnEQV for PbZn Ore
(In Accordance with the Guidelines of the JORC Code (2004)) Gold (Au) Silver (Ag) Copper (Cu) Lead (Pb) Zinc (Zn)
Classification Tonnage (Mt) Grade
(g/t)
Metal Content (oz)
Grade (g/t)
Metal Content (oz)
Grade (%)
Metal Content
(t)
Grade (%)
Metal Content
(t)
Grade (%)
Metal Content
(t) Measured 4.59 1.55 228,476 16.01 2,359,940 0.13 5,960 0.57 26,130 1.07 49,060 Indicated 3.94 1.36 172,076 16.79 2,124,381 0.13 5,120 0.53 20,860 1.03 40,530
Measured + Indicated
8.52 1.46 400,552 16.37 4,484,321 0.13 11,080 0.55 46,990 1.05 89,590
Inferred 2.03 1.19 77,607 12.08 787,806 0.14 2,840 0.49 9,940 0.95 19,270
Notes: 1. Mineral Resources are not reserves until they have demonstrated economic viability based on a Feasibility study or pre‐feasibility study. 2. Mineral Resources are reported inclusive of any reserves. 3. Grade represents estimated contained metal in the ground and has not been adjusted for metallurgical recovery.
Sokolok Resource Estimate (WAI 01.01.11) Total In‐Situ Resources At COG of 1.7% ZnEQV for PbZn Ore
(In accordance with the Guidelines of the JORC Code (2004)) Gold (Au) Silver (Ag) Copper (Cu) Lead (Pb) Zinc (Zn)
Classification Tonnage (Mt) Grade
(g/t)
Metal Content (oz)
Grade (g/t)
Metal Content (oz)
Grade (%)
Metal Content
(t)
Grade (%)
Metal Content
(t)
Grade (%)
Metal Content
(t) Measured ‐ ‐ ‐ ‐ ‐ ‐ ‐ ‐ ‐ ‐ ‐ Indicated 0.29 1.36 12,839 120.84 1,140,808 0.13 380 1.00 2,940 1.89 5,550
Measured + Indicated
0.29 1.36 12,839 120.84 1,140,808 0.13 380 1.00 2,940 1.89 5,550
Inferred 0.37 1.40 16,715 15.27 182,315 0.14 520 1.48 5,500 1.98 7,350 Notes:
1. Mineral Resources are not reserves until they have demonstrated economic viability based on a Feasibility study or pre‐feasibility study.
2. Mineral Resources are reported inclusive of any reserves.
3. Grade represents estimated contained metal in the ground and has not been adjusted for metallurgical recovery.
THIS WEB PROOF INFORMATION PACK IS IN DRAFT FORM. The information contained herein is incomplete and subject to change and it must be read in conjunction with the section headed ‘‘Warning’’on the cover of this Web Proof Information Pack.

KAZZINC LTD Competent Person’s Report for the assets held by Kazzinc Ltd in both Kazakhstan and Russia
61‐0795/MM February 2011
Draft V 0.10 Page 14
New Glubokaya Resource Estimate (WAI 01.01.11) Total In‐Situ Resources At COG of 1.7% ZnEQV for PbZn Ore (In Accordance with the Guidelines of the JORC Code (2004))
Gold (Au) Silver (Ag) Copper (Cu) Lead (Pb) Zinc (Zn)
Classification Tonnage (Mt) Grade
(g/t)
Metal Content (oz)
Grade (g/t)
Metal Content (oz)
Grade (%)
Metal Content
(t)
Grade (%)
Metal Content
(t)
Grade (%)
Metal Content
(t) Measured ‐ ‐ ‐ ‐ ‐ ‐ ‐ ‐ ‐ ‐ ‐ Indicated 0.32 0.18 1,867 2.48 25,723 0.06 190 0.67 2,160 1.80 5,810
Measured + Indicated
0.32 0.18 1,867 2.48 25,723 0.06 190 0.67 2,160 1.80 5,810
Inferred 0.07 0.14 314 2.68 6,004 0.31 220 0.74 520 2.10 1,460
Notes: 1. Mineral Resources are not reserves until they have demonstrated economic viability based on a Feasibility study or pre‐feasibility study. 2. Mineral Resources are reported inclusive of any reserves. 3. Grade represents estimated contained metal in the ground and has not been adjusted for metallurgical recovery.
Glubokaya Resource Estimate (WAI 01.01.11) Total In‐Situ Resources At COG of 1.7% ZnEQV for PbZn Ore (In Accordance with the Guidelines of the JORC Code (2004))
Gold (Au) Silver (Ag) Copper (Cu) Lead (Pb) Zinc (Zn)
Classification Tonnage (Mt) Grade
(g/t)
Metal Content (oz)
Grade (g/t)
Metal Content (oz)
Grade (%)
Metal Content
(t)
Grade (%)
Metal Content
(t)
Grade (%)
Metal Content
(t) Measured ‐ ‐ ‐ ‐ ‐ ‐ ‐ ‐ ‐ ‐ ‐ Indicated ‐ ‐ ‐ ‐ ‐ ‐ ‐ ‐ ‐ ‐ ‐
Measured + Indicated
‐ ‐ ‐ ‐ ‐ ‐ ‐ ‐ ‐ ‐ ‐
Inferred 0.51 0.10 1,640 1.48 24,277 0.08 410 0.83 4,230 1.91 9,740
Notes: 1. Mineral Resources are not reserves until they have demonstrated economic viability based on a Feasibility study or pre‐feasibility study. 2. Mineral Resources are reported inclusive of any reserves. 3. Grade represents estimated contained metal in the ground and has not been adjusted for metallurgical recovery.
THIS WEB PROOF INFORMATION PACK IS IN DRAFT FORM. The information contained herein is incomplete and subject to change and it must be read in conjunction with the section headed ‘‘Warning’’on the cover of this Web Proof Information Pack.

KAZZINC LTD Competent Person’s Report for the assets held by Kazzinc Ltd in both Kazakhstan and Russia
61‐0795/MM February 2011
Draft V 0.10 Page 15
Dalnaya Resource Estimate (WAI 01.01.11) Total In‐Situ Resources At COG of 1.7% ZnEQV for PbZn Ore (In Accordance with the Guidelines of the JORC Code (2004))
Gold (Au) Silver (Ag) Copper (Cu) Lead (Pb) Zinc (Zn)
Classification Tonnage (Mt) Grade
(g/t)
Metal Content (oz)
Grade (g/t)
Metal Content (oz)
Grade (%)
Metal Content
(t)
Grade (%)
Metal Content
(t)
Grade (%)
Metal Content
(t) Measured ‐ ‐ ‐ ‐ ‐ ‐ ‐ ‐ ‐ ‐ ‐ Indicated 3.14 0.31 31,104 3.49 352,551 0.68 21,281 0.22 6,975 2.31 72,368
Measured + Indicated
3.14 0.31 31,104 3.49 352,551 0.68 21,281 0.22 6,975 2.31 72,368
Inferred 1.16 0.18 6,855 3.18 118,984 0.51 5,958 0.40 4,620 2.07 24,083
Notes: 1. Mineral Resources are not reserves until they have demonstrated economic viability based on a Feasibility study or pre‐feasibility study. 2. Mineral Resources are reported inclusive of any reserves. 3. Grade represents estimated contained metal in the ground and has not been adjusted for metallurgical recovery.
Zavodskaya Resource Estimate (WAI 01.01.11) Total In‐Situ Resources At COG of 1.7% ZnEQV for PbZn Ore (In Accordance with the Guidelines of the JORC Code (2004))
Gold (Au) Silver (Ag) Copper (Cu) Lead (Pb) Zinc (Zn)
Classification Tonnage (Mt) Grade
(g/t)
Metal Content (oz)
Grade (g/t)
Metal Content (oz)
Grade (%)
Metal Content
(t)
Grade (%)
Metal Content
(t)
Grade (%)
Metal Content
(t) Measured 1.78 0.82 46,922 22.60 1,293,223 0.12 2,111 0.79 14,105 1.53 27,187 Indicated 0.51 0.97 15,816 21.62 352,524 0.10 509 0.67 3,397 1.29 6,523
Measured + Indicated
2.29 0.85 62,739 22.38 1,645,747 0.12 2,620 0.76 17,502 1.48 33,710
Inferred 0.33 1.00 10,567 21.10 222,961 0.14 459 0.60 1,958 1.21 3,991
Notes: 1. Mineral Resources are not reserves until they have demonstrated economic viability based on a Feasibility study or pre‐feasibility study. 2. Mineral Resources are reported inclusive of any reserves. 3. Grade represents estimated contained metal in the ground and has not been adjusted for metallurgical recovery.
THIS WEB PROOF INFORMATION PACK IS IN DRAFT FORM. The information contained herein is incomplete and subject to change and it must be read in conjunction with the section headed ‘‘Warning’’on the cover of this Web Proof Information Pack.

KAZZINC LTD Competent Person’s Report for the assets held by Kazzinc Ltd in both Kazakhstan and Russia
61‐0795/MM February 2011
Draft V 0.10 Page 16
Kazzinc Mineral Resources Ridder Sokolniy Mine (WAI 01.01.2011)
(In Accordance with the Guidelines of the JORC Code (2004) Gold (Au) Silver (Ag) Copper (Cu) Lead (Pb) Zinc (Zn)
Deposit Resources Cut Off
Grade Date
Tonnes
(Mt) Grade
(g/t)
Metal
Content
(oz)
Grade (g/t) Metal Content
(oz)
Grade
(%)
Metal
Content
(t)
Grade
(%)
Metal
Content
(t)
Grade
(%)
Metal
Content
(t)
Measured 20.09 1.00 648,768 8.43 5,446,956 0.9 18,020 0.31 6,1480 0.8 160,800 Indicated 36.21 1.23 1,437,071 8.46 9,847,050 0.44 15,950 0.36 130,750 0.85 308,310 Measured + Indicated 56.30 1.15 2,085,839 8.45 15,294,006 0.60 33,970 0.34 192,230 0.83 469,110
Inferred 1.53 0.83 40,763 3.74 183,365 0.45 690 0.15 2,320 0.71 10,880
Centralniy
Total
1.7% ZnEq for PbZn ore and 0.6% CuEq for Cu
ore
01‐Jan‐11
57.83 1.14 2,126,602 8.33 15,477,371 0.60 34,660 0.34 194,550 0.83 479,990 Measured ‐ ‐ ‐ ‐ ‐ ‐ ‐ ‐ ‐ ‐ ‐
Indicated 16.98 2.72 1,486,264 12.29 6,711,147 0.28 48,064 0.42 71,510 0.90 152,812 Measured + Indicated 16.98 2.72 1,486,264 12.29 6,711,147 0.28 48,064 0.42 71,510 0.90 152,812 Inferred 0.04 1.53 1,768 3.44 3,922 0.18 63 0.15 53 0.33 118
Bystrushinskoe
Total
1.7% ZnEq for PbZn ore and 0.6% CuEq for Cu
ore
01‐Jan‐11
17.02 2.72 1,488,032 12.28 6,715,069 0.28 48,127 0.42 71,563 0.90 152,930 Measured ‐ ‐ ‐ ‐ ‐ ‐ ‐ ‐ ‐ ‐ ‐ Indicated 1.75 1.26 70,796 5.63 317,328 1.02 17,890 0.29 5,140 1.08 18,868 Measured + Indicated 1.75 1.26 70,796 5.63 317,328 1.02 17,890 0.29 5,140 1.08 18,868 Inferred 0.09 2.46 7,106 6.90 19,997 0.86 776 0.29 264 1.03 925
Bystrushinskoe North Flank
Total
1.7% ZnEq for PbZn ore and 0.6% CuEq for Cu
ore
01‐Jan‐11
1.84 1.31 77,902 5.69 337,325 1.01 18,666 0.29 5,404 1.07 19,793 Measured 3.76 1.26 152,331 18.98 2,294,630 0.09 3,384 0.47 17,670 0.98 36,850 Indicated 4.77 1.11 170,126 16.85 2,582,538 0.08 3,814 0.41 19,550 0.85 40,520 Measured + Indicated 8.53 1.18 322,456 17.79 4,877,168 0.08 7,200 0.44 37,220 0.91 77,370 Inferred 0.52 0.88 14,669 23.42 390,393 0.28 1,450 0.32 1,660 0.90 4,670
Belkina_RSM_WA
Total
1.7% ZnEq 01‐Jan‐11
9.05 1.16 337,125 18.11 5,267,561 0.10 8,650 0.43 38,880 0.91 82,040 Measured 4.59 1.55 228,476 16.01 2,359,940 0.13 5,960 0.57 26,130 1.07 49,060 Indicated 3.94 1.36 172,076 16.79 2,124,381 0.13 5,120 0.53 20,860 1.03 40,530 Measured + Indicated 8.52 1.46 400,552 16.37 4,484,321 0.13 11,080 0.55 46,990 1.05 89,590 Inferred 2.03 1.19 77,607 12.08 787,806 0.14 2,840 0.49 9,940 0.95 19,270
Perspectivnaya
Total
1.7% ZnEq 01‐Jan‐11
10.55 1.41 478,159 15.55 5,272,127 0.13 13,920 0.54 56,930 1.03 108,860
THIS WEB PROOF INFORMATION PACK IS IN DRAFT FORM. The information contained herein is incomplete and subject to change and it must be read in conjunction with the section headed ‘‘Warning’’on the cover of this Web Proof Information Pack.

KAZZINC LTD Competent Person’s Report for the assets held by Kazzinc Ltd in both Kazakhstan and Russia
61‐0795/MM February 2011
Draft V 0.10 Page 17
Measured ‐ ‐ ‐ ‐ ‐ ‐ ‐ ‐ ‐ ‐ ‐ Indicated 0.29 1.36 12,839 120.84 1,140,808 0.13 380 1.00 2,940 1.89 5,550 Measured + Indicated 0.29 1.36 12,839 120.84 1,140,808 0.13 380 1.00 2,940 1.89 5,550 Inferred 0.37 1.40 16,715 15.27 182,315 0.14 520 1.48 5,500 1.98 7,350
Sokolok
Total
1.7% ZnEq 01‐Jan‐11
0.67 1.38 29,554 61.94 1,323,123 0.14 900 1.27 8,440 1.94 12,900 Measured ‐ ‐ ‐ ‐ ‐ ‐ ‐ ‐ ‐ ‐ ‐ Indicated 0.32 0.18 1,867 2.48 25,723 0.06 190 0.67 2,160 1.80 5,810 Measured + Indicated 0.32 0.18 1,867 2.48 25,723 0.06 190 0.67 2,160 1.80 5,810 Inferred 0.07 0.14 314 2.68 6,004 0.31 220 0.74 520 2.10 1,460
New Glubokaya
Total
1.7% ZnEq 01‐Jan‐11
0.39 0.17 2,181 2.51 31,727 0.10 410 0.68 2,680 1.85 7,270 Measured ‐ ‐ ‐ ‐ ‐ ‐ ‐ ‐ ‐ ‐ ‐ Indicated ‐ ‐ ‐ ‐ ‐ ‐ ‐ ‐ ‐ ‐ ‐ Measured + Indicated ‐ ‐ ‐ ‐ ‐ ‐ ‐ ‐ ‐ ‐ ‐ Inferred 0.51 0.10 1,640 1.48 24,277 0.08 410 0.83 4,230 1.91 9,740
Glubokaya
Total
1.7% ZnEq 01‐Jan‐11
0.51 0.10 1,640 1.48 24,277 0.08 410 0.83 4,230 1.91 9,740 Measured ‐ ‐ ‐ ‐ ‐ ‐ ‐ ‐ ‐ ‐ ‐ Indicated 3.14 0.31 31,104 3.49 352,551 0.68 21,281 0.22 6,975 2.31 72,368 Measured + Indicated 3.14 0.31 31,104 3.49 352,551 0.68 21,281 0.22 6,975 2.31 72,368 Inferred 1.16 0.18 6,855 3.18 118,984 0.51 5,958 0.40 4,620 2.07 24,083
Dalnaya
Total
1.7% ZnEq 01‐Jan‐11
4.30 0.27 37,959 3.41 471,535 0.63 27,239 0.27 11,595 2.24 96,451 Measured 1.78 0.82 46,922 22.60 1,293,223 0.12 2,111 0.79 14,105 1.53 27,187 Indicated 0.51 0.97 15,816 21.62 352,524 0.10 509 0.67 3,397 1.29 6,523 Measured + Indicated 2.29 0.85 62,739 22.38 1,645,747 0.12 2,620 0.76 17,502 1.48 33,710
Inferred 0.33 1.00 10,567 21.10 222,961 0.14 459 0.60 1,958 1.21 3,991
Zavodskaya
Total
1.7% ZnEq 01‐Jan‐11
2.62 0.87 73,305 22.22 1,868,709 0.12 3,079 0.74 19,460 1.44 37,701 Measured 30.21 1.11 1,076,497 11.73 11,394,749 0.64 29,475 0.40 119,385 0.91 273,897
Indicated 67.91 1.55 3,397,959 10.74 23,454,050 0.38 113,198 0.40 269,542 0.95 645,031 Measured + Indicated 98.12 1.42 4,474,456 11.05 34,848,799 0.46 142,675 0.40 388,927 0.94 918,928 Inferred 6.64 0.83 178,004 9.09 1,940,024 0.29 13,386 0.59 39,365 1.12 74,187
Ridder‐Sokolny Mine
Total
104.76 1.38 4,652,459 10.92 36,788,824 0.45 156,061 0.41 428,292 0.95 993,115
THIS WEB PROOF INFORMATION PACK IS IN DRAFT FORM. The information contained herein is incomplete and subject to change and it must be read in conjunction with the section headed ‘‘Warning’’on the cover of this Web Proof Information Pack.

KAZZINC LTD Competent Person’s Report for the assets held by Kazzinc Ltd in both Kazakhstan and Russia
61‐0795/MM February 2011
Draft V 0.10 Page 18
Ore Reserves for individual ore zones at Ridder Sokolniy have been calculated in accordance with the guidelines of the JORC Code (2004) and are shown in the table below.
Ridder Sokolniy Ore Reserve Estimate
(WAI 01.01.2011)
(In Accordance with the Guidelines of the JORC Code (2004))
Gold (Au) Silver (Ag) Copper (Cu) Lead (Pb) Zinc (Zn) Deposit Reserves Ore (Mt) Grade
(g/t) Metal
Content (oz) Grade (g/t)
Metal Content (oz)
Grade (%)
Metal Content (t)
Grade (%)
Metal Content (t)
Grade (%)
Metal Content (t)
Proven 5.016 0.71 114,830 5.19 837,614 0.69 34,566 0.18 9,076 0.52 26,208
Probable 9.174 1.03 303,446 5.95 1,756,434 0.26 23,699 0.34 31,365 0.64 58,683 Centralny
Total 14.190 0.92 418,276 5.69 2,594,048 0.41 58,264 0.28 40,440 0.60 84,891
Proven 2.238 0.98 70,492 25.38 1,826,106 0.07 1,541 0.45 9,960 0.93 20,814
Probable 1.215 0.82 31,972 13.16 514,297 0.06 672 0.29 3,499 0.61 7,369 Belkina
Total 3.453 0.92 102,463 21.08 2,340,403 0.06 2,213 0.39 13,459 0.82 28,183
Proven 1.449 1.54 71,946 18.55 864,235 0.11 1,632 0.52 7,501 0.97 14,126
Probable 0.832 1.33 35,682 13.82 369,402 0.09 785 0.37 3,086 0.69 5,711 Perspectivnaya
Total 2.281 1.47 107,628 16.82 1,233,637 0.11 2,416 0.46 10,587 0.87 19,837
Proven 0.237 0.72 5,511 21.73 165,757 0.13 299 0.86 2,050 1.71 4,047
Probable 0.026 1.56 1,278 19.65 16,120 0.10 26 0.70 179 1.28 326 Zavodskaya
Total 0.263 0.80 6,789 21.53 181,876 0.12 324 0.85 2,228 1.66 4,373
Proven ‐ ‐ ‐ ‐ ‐ ‐ ‐ ‐ ‐ ‐ ‐
Probable 0.802 1.05 26,971 23.76 612,977 0.12 971 0.85 6,791 1.54 12,387 North Bestrushinskoye
Total 0.802 1.05 26,971 23.76 612,977 0.12 971 0.85 6,791 1.54 12,387
Proven 8.940 0.91 262,779 12.85 3,693,712 0.43 38,038 0.32 28,587 0.73 65,195
Probable 12.049 1.03 399,349 8.44 3,269,230 0.22 26,153 0.37 44,920 0.70 84,476 Total
Total 20.989 0.98 662,127 10.32 6,962,941 0.31 64,188 0.35 73,505 0.71 149,671
THIS WEB PROOF INFORMATION PACK IS IN DRAFT FORM. The information contained herein is incomplete and subject to change and it must be read in conjunction with the section headed ‘‘Warning’’on the cover of this Web Proof Information Pack.

KAZZINC LTD Competent Person’s Report for the assets held by Kazzinc Ltd in both Kazakhstan and Russia
61‐0795/MM February 2011
Draft V 0.10 Page 19
Tishinskiy The Tishinskiy deposit is situated 18km south west of Ridder. The Tishinskiy mine is linked by rail and asphalt road, which lies adjacent to the mine with Ridder and Ust Kamenogorsk. The Tishinskiy deposit was discovered in 1958. Preliminary and detailed exploration of the new discovery was completed in mid‐1963. Mine development and detailed underground exploration began in July 1963. Whilst underground work was in progress, drilling from surface continued until the end of 1983 focusing primarily on deep levels of the deposit. The central part of the Main Lode and its eastern flank were delineated to depth of 1,200m and the western flank to a depth of 900m (Tishinsky Shaft collar being at 644m). The Tishinskiy deposit is situated in the central portion of the Butachihinsko‐Kedrova shear zone, which adjoins the south‐western flank of the Ridder graben. The Palaeozoic host rocks have undergone strong polyphase folding and intense shearing. The deformed formations comprise high grade metamorphic Ordovician basement rocks and weakly metamorphosed volcanogenic‐sedimentary Devonian‐Upper Carboniferous rocks. Tishinskiy is a stratabound deposit developed along the E‐W trending subvertical contact between the Ilinskaya and Sokolnaya Formations, both of Middle Devonian (Eifelian) age. The Main Orebody, also known as Orebody No 1 extends over a strike length of 1,250m from surface to a depth of 1,270m corresponding to Level 22 at the absolute elevation of minus 590m. The central part of this body, about 500m in strike length and up to 60m in width, contains three subvertical lenses of massive sulphides (Western, Central and Eastern) with a combined strike length of about 200m, enveloped in disseminated mineralised ore. The Western and Central lenses peter out downwards on Levels 14 to 18 at the absolute elevations of ‐110m and ‐350m respectively and the Eastern lens pinches out at about the zero datum (10m below Level 12). Average widths range from 6.5m to 17m. Lower grade disseminated mineralised ore with much reduced widths (generally less than 10m) occurs in the Western Shaft section of the mine on the western flank of the deposit above Level 8 and on the eastern flank, where it peters out rapidly towards a major transverse fault. Orebody No 67 has a strike length of 1,000m, dip extent of 700m and an average width of 3.7m. Orebody No.1011 has a strike length of 550m, dip extent of 400m and an average width of 1.7m. On its flanks, the Main Lode divides into a number of parallel tapering branches to the east and west and gradually fades out. Lenses and small vein‐like bodies on the flanks of the deposit range from 25m to 50m in strike length and from 40m to 150m in down dip extent. Four primary and two secondary mineral associations have been recognised at the Tishinskiy deposit. The prevalent associations are: (1) A polymetallic (chalcopyrite‐galena‐pyrite‐sphalerite) association, and (2) A copper‐zinc (chalcopyrite‐sphalerite‐pyrite) association. Disseminated veinlet‐type polymetallic mineralised ore predominates, but massive sulphide lenses of various sizes occur in the central parts of mineralised bodies. The resource classification for the Tishinskiy deposit is classified in accordance with the Australian Code for Reporting of Exploration Results, Mineral Resources and Ore Reserves JORC Code (2004). Criteria for defining resource categories were also derived from the geostatistical studies. The grades in the final resource model were derived from the Ordinary Kriging estimation method for all elements, using a cut–off grade of 2.2% Zn equivalent:
THIS WEB PROOF INFORMATION PACK IS IN DRAFT FORM. The information contained herein is incomplete and subject to change and it must be read in conjunction with the section headed ‘‘Warning’’on the cover of this Web Proof Information Pack.

KAZZINC LTD Competent Person’s Report for the assets held by Kazzinc Ltd in both Kazakhstan and Russia
61‐0795/MM February 2011
Draft V 0.10 Page 20
Tishinskiy Mineral Resource Estimate ‐ At COG of 2.2% ZnEqv (WAI 01.01.2011) (In Accordance with the Guidelines of the JORC Code (2004))
Zn Pb Cu Au Ag ZNEQV Classification Tonnes (Mt)
Density % Kt % kt % kt g/t oz g/t oz %
Measured 21.23 3 4.7 1,000 1.0 212 0.6 125 0.60 412,000 9.02 6,154,000 7.4 Indicated 7.01 3 4.3 305 0.9 66 0.4 31 0.46 104,000 9.75 2,072,000 6.3 Inferred 5.19 3 4.5 231 1.4 70 0.6 29 0.33 55,000 11.94 2,380,000 9.4
Notes: 1. Mineral Resources are not reserves until they have demonstrated economic viability based on a Feasibility study
or pre‐feasibility study. 2. Mineral Resources are reported inclusive of any reserves. 3. Grade represents estimated contained metal in the ground and has not been adjusted for metallurgical recovery.
Mining operations at the Tishinskiy mine started in 1975 using both surface and underground mining methods. To date, approximately 49Mt of ore has been extracted (including open pit ore). Historically, the main mining method employed in the underground mine has been underhand open stoping with hydraulic cemented backfill. Trackless mining equipment is employed for the development and stoping activities, but a track haulage system is used to transport ore and waste from drawpoints and ore passes to the main hoisting shaft. The current ore production rate is between 1,300‐1,400ktpa. The mining method utilises jumbo development, electric over hydraulic production drilling and diesel load haul dump (LHD) loaders. The mine has its own backfill preparation plant, where backfill is mixed and pumped to a pipeline connected to the underground infrastructure. From this pipeline the backfill is distributed to stopes via backfill boreholes (normally one for the backfill, and additional borehole for control) and pipeline extensions. With depletion of the ore reserves from the central part of the deposit, the mine will be developed towards its flanks, and towards the bottom. Current exploration programmes are targeting to bring into production the levels below 18 Level to 22 Level. An additional resource estimation study is currently being conducted for the eastern flank of the deposit, with production from this area due to commence in 2012. WAI has performed an evaluation of the Tishinskiy mine Ore Reserves in accordance with the requirements of the JORC Code (2004). The evaluation has been performed using geological block model produced by WAI dated 01.01.2011 and considers modifying factors, such as dilution and losses, with respect to the current mining operations and methods. The stope boundaries were generated to correspond with the standardised dimensions of the existing stopes and development in the mine and also be above the minimum cut‐off grade for exploitation. A total of 2,725 stopes were produced to justify the Tishinskiy ore reserves. The greatest part of the reserve is contained in the central part of the deposit, but there is a significant portion of reserves located in the western part of the deposit. A summary of ore reserves is given in the table below.
Tishinskiy Ore Reserve Estimate (WAI 01.01.2011)
(In Accordance with the Guidelines of the JORC Code (2004))
Ore Zinc Copper Lead Gold Silver kt % kt % kt % kt g/t kg g/t kg Proven 18,886 4.22 797 0.52 98 0.91 172 0.54 10,198 8.12 153,353 Probable 4,928 4.13 204 0.4 20 0.88 43 0.47 2,316 9.36 46,124 Total Proven and Probable 23,814 4.20 1,001 0.50 118 0.90 215 0.53 12,514 8.38 199,477 Inferred material within stopes 156 11.17 17 0.45 1 1.2 2 0.45 70 11.05 1,728
THIS WEB PROOF INFORMATION PACK IS IN DRAFT FORM. The information contained herein is incomplete and subject to change and it must be read in conjunction with the section headed ‘‘Warning’’on the cover of this Web Proof Information Pack.

KAZZINC LTD Competent Person’s Report for the assets held by Kazzinc Ltd in both Kazakhstan and Russia
61‐0795/MM February 2011
Draft V 0.10 Page 21
Tishinskiy mine is a mature operation. Despite relatively unfavourable rock conditions, resulting in the requirement for additional ground support, mining is performed to a high standard. The utilisation of modern western underground mining equipment and qualified personnel provide confidence that production targets are being met. The remaining Ore Reserve together with available Mineral Resources estimated by both internal and independent sources, show long‐term potential for this operation. Kazzinc’s environmental management and monitoring is performed in line with national requirements, and Kazzinc has achieved accreditation under international environmental, quality and health and safety management systems. Further reviews of requirement to achieve international compliance should be undertaken. This should include a review of monitoring and closure request. A key area for attention is water recycling and management. In 2010 an independent environmental audit was conducted at Kazzinc including Tishinskiy Mine. During the audit all environmental aspects, risks, targets and environmental management program applied by these operations and the efficiency of planned impact mitigation actions was assessed. The first step in moving towards best practice, would be to review all procedures against international standards. Shubinskiy The Shubinskiy deposit is situated in the Glubokovskoe region of East Kazakhstan province 14km north‐east of Ridder from which it is readily accessible by an all weather graded road. The mine development consists of five underground levels connecting two vertical shafts located on the north‐western and south‐eastern flanks of the deposit. The deposit covers an area of 600*110m extending from north west to south east along the contact of the Uspenskaya Formation, comprising volcanogenic‐sedimentary rocks and the Beloubinskaya Formation terrigenous sediments. The deposit consists of two clusters of sub‐parallel, tabular and lenticular mineralised bodies, the North‐Western Lode and the South‐Eastern Lode respectively. Five ore bodies and 24 lenses of balance pyritic polymetallic mineralisation in the C1 and C2 categories have been identified at Shubinsky. The majority of the reserves (78.7%) are concentrated in the No.1 and No.2 ore bodies, and 63.9% in these bodies in the NW Lode where the grades are higher. The ore bodies and lenses themselves, dip 65‐800 NE and strike 320‐3400. They vary from 100‐130m to 200‐220m in length, extend down dip from 190m to 500‐725m with widths between 0.26‐0.40m to 21‐28m and average values from 1.6‐9.0m. The primary sulphide and mixed zones are defined by the degree of oxidation. In the oxide zone, base metal grades are low and for this reason the oxide zone is not included in the reserves. Gold grade is usually low (average 0.2‐0.6g/t), although higher values have been recorded occasionally, in the upper part of the deposit. The current GKZ resource estimates are based on results from surface diamond core drilling (50,872m) and underground exploration on three levels, including small diameter diamond core drilling (9,575m), both programmes producing a total of 15,131 samples. Underground production began at Shubinskiy with trial mining in 1990/1991 and continued intermittently at low output rates for over six years. In 1999 the production exceeded 100,000t and has since risen to reach its full capacity of 200,000tpa in 2009. During the period 1992‐2009, the mine produced 1.6 Mt of ore grading
THIS WEB PROOF INFORMATION PACK IS IN DRAFT FORM. The information contained herein is incomplete and subject to change and it must be read in conjunction with the section headed ‘‘Warning’’on the cover of this Web Proof Information Pack.

KAZZINC LTD Competent Person’s Report for the assets held by Kazzinc Ltd in both Kazakhstan and Russia
61‐0795/MM February 2011
Draft V 0.10 Page 22
0.66 g/t Au, 17.9 g/t Ag, 1.74% Cu, 0.28% Pb and 2.25% Zn. The mine is operated by TOO Shubinskoye, who had worked as Kazzinc's mining contractors prior to April 2009. Ore is extracted from the stopes on the 1‐5 Level, it is loaded in rail wagons and hauled by electric locomotives to the hoisting shaft. The ore is hauled by road trucks to the Ridder processing plant, where it is stockpiled for separate treatment. The mining method is chamber mining with backfill and is used down to 5 Level. It employs conventional handheld pneumatic machine drift development and stope production drilling, electric scraper mucking and electric locomotive haulage. Drifting is carried out with handheld portable rock drills using compressed air. Blast holes for the stopes are drilled with handheld drill rigs using compressed air. In the stoping operations, the ore from the drifts and stopes is mucked using 30LC‐2CM and 55LC‐2CM scraper winches. The chamber mining with backfill method is also known as sublevel open stoping with classified cemented tailings backfill. The extraction sequence is top‐down (under hand), working from the centre of each lode to the strike flanks. It is intended that mining below 5 Level will be via a decline which will be mined using rubber tyred diesel mining equipment. The Shubinsky mine uses a zinc equivalent (ZnEq) cut‐off for the polymetallic lodes. The ZnEq grade is calculated as Zn% + 0.4Pb% + 1.7Cu%. The cut‐off grades are based on historic metal prices used for the 1989 TEO for the Shubinsky project. The ZnEq cut‐offs are unlikely to be optimal, from an economic perspective, for 2010 costs, metal prices and process terms. Staroye (Old) Tailings Management Facility (TMF) The Staroye tailings dam is adjacent to the Ridder‐Sokolniy Mine, was in operation from 1926 to 1953 inclusive accepting material from the Leninogorsk Polymetallic Concentrator (LPC). The feed during this period was derived exclusively from processing polymetallic ore of the Ridder‐Sokolny deposit. Kazzinc commenced a reprocessing operation in 1991 that by September 2010 had reprocessed almost 6Mt returning an average head grade (from concentrator reports) of 1.41g/t Au, 12.70g/t Ag, 0.08% Cu, 0.31% Pb and 0.79% Zn. The process involves a two stage grinding followed by a gravity flotation scheme with the recovery of gravity concentrate, auriferous concentrate and zinc concentrate. WAI has performed a resource and reserve evaluation for Staroye TMF in accordance with the guidelines of the JORC Code (2004). The details of these evaluations are given in tables below.
Staroye Tailings Mineral Resource Estimate (WAI 01.01.2011) (In Accordance with the Guidelines of the JORC Code (2004))
Au Ag Cu Pb Zn AuEq Category Tonnes t g/t g/t % % % g/t
Indicated 824,258 2.01 18.78 0.05 0.48 1.11 3.19 Inferred 5,899,119 0.91 11.16 0.04 0.30 0.63 1.72
Notes:
• AuEq calculation based on prices of
Au 1287 US$/oz
Ag 23 US$/oz
Cu 7341 US$/t
Pb 2422 US$/t
Zn 2420 US$/t
THIS WEB PROOF INFORMATION PACK IS IN DRAFT FORM. The information contained herein is incomplete and subject to change and it must be read in conjunction with the section headed ‘‘Warning’’on the cover of this Web Proof Information Pack.

KAZZINC LTD Competent Person’s Report for the assets held by Kazzinc Ltd in both Kazakhstan and Russia
61‐0795/MM February 2011
Draft V 0.10 Page 23
WAI has calculated Ore Reserves based upon the above Mineral Resource Estimate. WAI has applied losses of 4.4% based upon historical data, and dilution of 0.5% to take into account minimal dilution from the bunds and floor.
Staroye Tailings Ore Reserve Estimate (WAI 01.01.2011)
(In Accordance with the Guidelines of the JORC Code (2004))
Gold (Au) Silver (Ag) Copper (Cu) Lead (pb) Zinc (Zn)
Reserves Ore (Mt) Grade
(g/t)
Metal Content (koz)
Grade (g/t)
Metal Content (koz)
Grade (%)
Metal Content (kt)
Grade (%)
Metal Content (kt)
Grade (%)
Metal Content (kt)
Proven Probable 0.79 2.00 50.97 18.69 475.89 0.05 0.38 0.48 3.80 1.10 8.72 Total 0.79 2.00 50.97 18.69 475.89 0.05 0.38 0.48 3.80 1.10 8.72
Ridder Smelter Kazzinc operates integrated metallurgical complexes in Ust‐Kamenogorsk and Ridder in Eastern Kazakhstan. At Ust‐Kamenogorsk there is a currently operational lead plant (traditional sinter plant‐blast furnace‐refinery); a conventional electrolytic zinc plant; sulphuric acid plants and a precious metals refinery. At the time of the site visits (October 2010) a copper Isa‐smelt furnace and tank house; a lead Isa‐smelt furnace and a dual contact sulphuric acid plant were under construction with commissioning and production scheduled for 2011. At Ridder there is an operational, conventional electrolytic zinc plant with associated conventional sulphuric acid plant. In 2009 at Ust‐Kamenogorsk lead metal production was almost 75kt, although the plant can and has produced over 100kt per annum and zinc production (metal and zinc alloy) was over 190kt. The precious metals refinery can produce over 170,000kg silver and 18,500kg gold. The Ridder zinc refinery utilises essentially the same process flowsheet as the plant at Ust‐Kamenogorsk and produced over 110kt saleable zinc, in 2009. The lead Isa‐smelt furnace under construction currently will eventually replace the existing Dwight‐Lloyd sinter plant. The copper Isa‐smelt furnace and tank house will offer potential for Kazzinc to become a low cost copper produce and provide opportunities to toll smelt third party copper ores/concentrates. Shaimerden The Shaimerden structure was discovered in 1956 during prospecting for bauxite and in 1989 a programme to investigate scandium levels in the bauxite deposits revealed anomalous lead and zinc concentrations in the Shaimerden area. In 1996 the deposit was taken over by the Zinc Corporation of Kazakhstan (ZCK) and in 2001 ZincOx acquired a 95% interest which, due to the deteriorating market conditions, was sold to Kazzinc in 2003. ZincOx had envisaged mining over 17 years averaging 250,000t/year whilst Kazzinc planned to complete the development of the same volume within 5.5 years (averaging up to 1Mt/year). Latest projections indicate that stockpiled ore will provide raw material to the Ridder Zinc Plant until 2019. Shaimerden is located some 200km SSW of the city of Kostenay in northern Kazakhstan with access via metalled roads, initially of a reasonable standard comprising a four lane highway to Rudnay but deteriorating thereafter, whilst rail links are excellent, connecting the Kostenay district with Russia and the rest of Kazakhstan at Tobol and Arka stations, and there also exists a short spur to the mine loading site.
THIS WEB PROOF INFORMATION PACK IS IN DRAFT FORM. The information contained herein is incomplete and subject to change and it must be read in conjunction with the section headed ‘‘Warning’’on the cover of this Web Proof Information Pack.
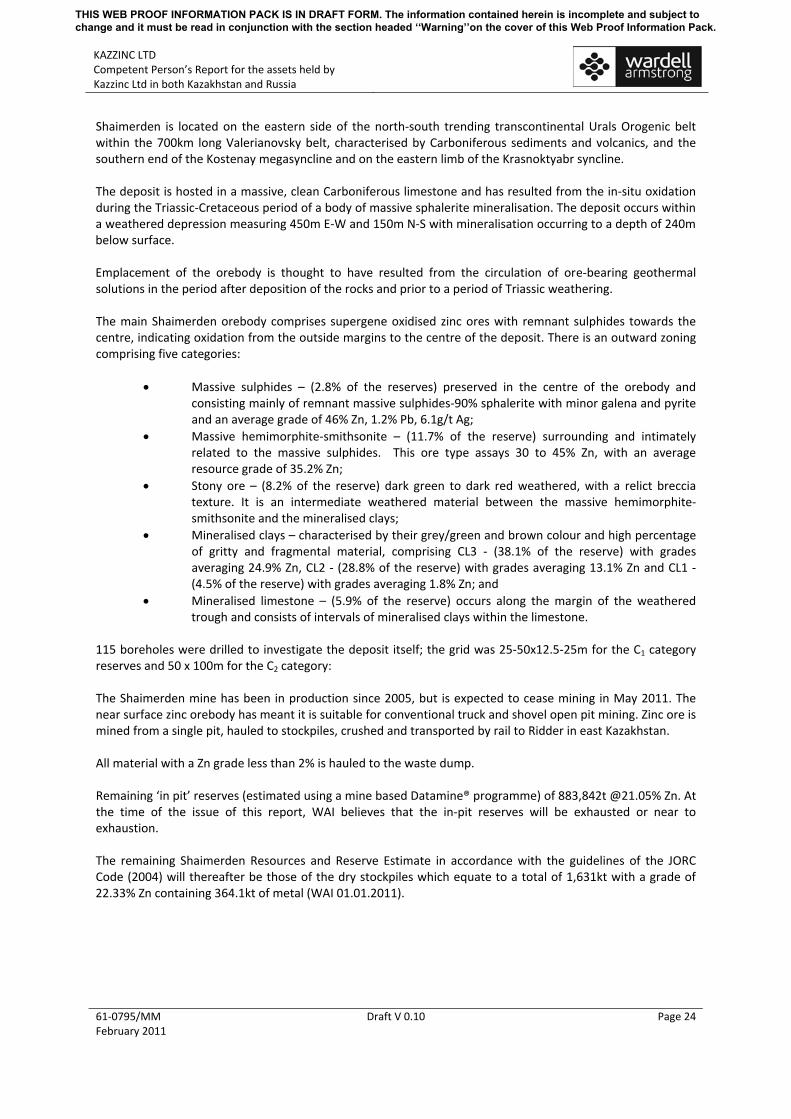
KAZZINC LTD Competent Person’s Report for the assets held by Kazzinc Ltd in both Kazakhstan and Russia
61‐0795/MM February 2011
Draft V 0.10 Page 24
Shaimerden is located on the eastern side of the north‐south trending transcontinental Urals Orogenic belt within the 700km long Valerianovsky belt, characterised by Carboniferous sediments and volcanics, and the southern end of the Kostenay megasyncline and on the eastern limb of the Krasnoktyabr syncline. The deposit is hosted in a massive, clean Carboniferous limestone and has resulted from the in‐situ oxidation during the Triassic‐Cretaceous period of a body of massive sphalerite mineralisation. The deposit occurs within a weathered depression measuring 450m E‐W and 150m N‐S with mineralisation occurring to a depth of 240m below surface. Emplacement of the orebody is thought to have resulted from the circulation of ore‐bearing geothermal solutions in the period after deposition of the rocks and prior to a period of Triassic weathering. The main Shaimerden orebody comprises supergene oxidised zinc ores with remnant sulphides towards the centre, indicating oxidation from the outside margins to the centre of the deposit. There is an outward zoning comprising five categories:
• Massive sulphides – (2.8% of the reserves) preserved in the centre of the orebody and consisting mainly of remnant massive sulphides‐90% sphalerite with minor galena and pyrite and an average grade of 46% Zn, 1.2% Pb, 6.1g/t Ag;
• Massive hemimorphite‐smithsonite – (11.7% of the reserve) surrounding and intimately related to the massive sulphides. This ore type assays 30 to 45% Zn, with an average resource grade of 35.2% Zn;
• Stony ore – (8.2% of the reserve) dark green to dark red weathered, with a relict breccia texture. It is an intermediate weathered material between the massive hemimorphite‐smithsonite and the mineralised clays;
• Mineralised clays – characterised by their grey/green and brown colour and high percentage of gritty and fragmental material, comprising CL3 ‐ (38.1% of the reserve) with grades averaging 24.9% Zn, CL2 ‐ (28.8% of the reserve) with grades averaging 13.1% Zn and CL1 ‐ (4.5% of the reserve) with grades averaging 1.8% Zn; and
• Mineralised limestone – (5.9% of the reserve) occurs along the margin of the weathered trough and consists of intervals of mineralised clays within the limestone.
115 boreholes were drilled to investigate the deposit itself; the grid was 25‐50х12.5‐25m for the С1 category reserves and 50 х 100m for the С2 category: The Shaimerden mine has been in production since 2005, but is expected to cease mining in May 2011. The near surface zinc orebody has meant it is suitable for conventional truck and shovel open pit mining. Zinc ore is mined from a single pit, hauled to stockpiles, crushed and transported by rail to Ridder in east Kazakhstan. All material with a Zn grade less than 2% is hauled to the waste dump. Remaining ‘in pit’ reserves (estimated using a mine based Datamine® programme) of 883,842t @21.05% Zn. At the time of the issue of this report, WAI believes that the in‐pit reserves will be exhausted or near to exhaustion. The remaining Shaimerden Resources and Reserve Estimate in accordance with the guidelines of the JORC Code (2004) will thereafter be those of the dry stockpiles which equate to a total of 1,631kt with a grade of 22.33% Zn containing 364.1kt of metal (WAI 01.01.2011).
THIS WEB PROOF INFORMATION PACK IS IN DRAFT FORM. The information contained herein is incomplete and subject to change and it must be read in conjunction with the section headed ‘‘Warning’’on the cover of this Web Proof Information Pack.

KAZZINC LTD Competent Person’s Report for the assets held by Kazzinc Ltd in both Kazakhstan and Russia
61‐0795/MM February 2011
Draft V 0.10 Page 25
Shaimerden Total Stockpile Mineral Resource Estimate (WAI 01.01.2011)
(In Accordance with the Guidelines of the JORC Code (2004) Category Tonnage (t) Grade (% Zn) Metal (Kt) Indicated 1,631.1 22.33 364.1
Shaimerden Total Stockpile Ore Reserve Estimate (WAI 01.01.2011)
(In Accordance with the Guidelines of the JORC Code (2004) Category Tonnage (t) Grade (% Zn) Metal (Kt) Probable 1,631.1 22.33 364.1
Novoshirokinskoye The Novoshirokinskoye underground gold‐polymetallic mine is located in East Zabaykal in the Gazimuro region of Chita province, Russian Federation. Transport to the mine is via a 10km long un‐metalled road which joins the Sretensk ‐ Nerchinsk provincial highway. The total distance to the railway siding at Priiskovaya where concentrates are loaded for transport to Ust‐Kamenogorsk is some 230km. The Novoshirokinskoye area is characterised by a sequence of Jurassic sediments folded into a synclinal structure with variable dip. Sediments are cut by many faults with hydrothermal alteration and brecciation associated with their development. Economic mineralisation at Novoshirokinskoye is constrained within broader zones of hydrothermal alteration, which in turn are related to several fracturing systems. Mineralisation within the alteration zones is seen as lensoid and can be continuous over several hundred metres along strike and has been traced to over 900m in depth where the structure remains open in some parts of the system. Orebodies are generally oxidised in their upper parts (where close to surface), followed by a thin transition zone grading into sulphide where the predominant economic mineralisation comprises galena and sphalerite with associated gold and silver. The Main ore zone is the most persistent, and in the central part, 16 orebodies have been identified. In the footwall of the Main orebody are found orebodies 5, 11, 7, 4, 3, 2, 1, 13, 14 and 16, whilst in the hangingwall 8, 6 and 12 are located. The Novoshirokinskoye tectonic zone is characterised by strong metasomatism of quartz‐micaceous‐dolomite composition. The width of the metasomatic zone varies from 20‐300m, and has been traced down‐dip for more than 750m. Ore mineralisation is concentrated in the centre of the zone. Disseminated mineralisation predominates which is developed along the systems of small fractures, brecciated mineralisation is also common as is massive ore which is found within the breccias. Overall, the Novoshirokinskoye zone can be considered a linear stockwork with a strike varying from 255‐335°, and dipping generally to the southwest at angles from 30‐90°. The zone extends for 50‐1,450m along strike, and from 40‐760m (Main orebody) down‐dip, and economic mineralisation has been proven down to the 450m level. The principal orebodies within the Novoshirokinskoye mineralised area are Main, 5 and 7. The Main orebody typically pinches and swells, but in the centre is persistent over considerable distance, with an overall length of 1,330m, maximum down‐dip depth of 760m, strike of 290‐300°, and dip of between 33‐82°. Thickness varies from 0.20 to 22.1m. At a 3g/t Au equivalent cut‐off grade, the average thickness is 4.52m.
THIS WEB PROOF INFORMATION PACK IS IN DRAFT FORM. The information contained herein is incomplete and subject to change and it must be read in conjunction with the section headed ‘‘Warning’’on the cover of this Web Proof Information Pack.

KAZZINC LTD Competent Person’s Report for the assets held by Kazzinc Ltd in both Kazakhstan and Russia
61‐0795/MM February 2011
Draft V 0.10 Page 26
Orebody 7 is the second largest and occurs in the central and southeastern part of the deposit on the footwall of the Main and Orebody 5. The orebody thins to the southeast and northwest both along strike and down‐dip. At the surface, the length of the orebody is some 480m, whereas at the 700m level, strike length approaches 1,510m, with a maximum down‐dip extension of 460m. The general dip is to the southwest, varying from 54‐80°, and averaging 65°. Thickness varies from 0.26‐15m, with the average thickness at a 3g/t Au equivalent cut‐off grade is 2.73m. Orebody 5, which is the third most important orebody at Novoshirokinskoye, lies in the central part of the area, in the footwall of the Main orebody, some 5‐50m away from it, although sometimes merging, although down dip, the orebodies become more separate. The maximum strike length (270‐335° azimuth) of Orebody 5 is some 1,060m, and has been traced down‐dip for some 775m. Thickness is highly variable from 0.19 – 18.15m, with an average of 3.04m using the 3g/t Au equivalent cut‐off grade. More than 60 ore and vein minerals have been identified at Novoshirokinskoye. Principal mineralogy comprises galena, pyrite and sphalerite, with hydroxides of iron and manganese, lead ochres, quartz, dolomite and sericite. The typical average grades are 3.72% lead, 1.79% zinc, 3.51g/t Au and 96.91g/t Ag. In November 2010, WAI produced a new resource and reserve estimate for five of the ore bodies (Main, 5, 7, 8 and 16), prepared in accordance with JORC (2004) and updated as of 01.01.2011. The resource estimate for Novoshirokinskoye based on Inverse Power Distance Cubed method is given below.
Novoshirokinskoye Mineral Resource Estimate at COG of 3g/t Aueq (WAI 01.01.2011)
(In Accordance with the Guidelines of the JORC Code (2004)) JORC
Classification Volume (m3)
Ore Tonnes (t)
Density (t/m3)
Au (g/t)
Ag (g/t)
Pb (%)
Zn (%)
Measured 835,326 2,425,050 2.90 4.43 87.74 3.43 1.47 Indicated 1,603,523 4,636,718 2.89 4.30 94.82 3.07 1.15
Measured + Indicated
2,438,849 7,061,767 2.89 4.34 92.39 3.19 1.26
Inferred 525,673 1,510,303 2.87 2.08 57.02 2.44 1.81
Mining operations at Novoshirokinskoye mine started relatively recently with industrial scale production first achieved early in 2010. Currently the mine is producing around 35‐38kt of ore per month, targeting 450kt annual production. The original mine design dates to the late 1960’s when the deposit was intensively studied and pilot underground mine design took place. In 2004 an updated design was performed, considering the requirement for rehabilitation works (as the underground workings remained abandoned for some time) and modernised infrastructure facilities. According to this design, the mine is accessed via two shafts. One of the shafts “Skiovaya” is used to hoist the ore (In skips), whilst the other “Kletievaya” is used for man, materials and waste hoisting (cage), providing an annual production rate of 450kt. Currently, the majority of production comes from sub‐level stoping (79% of production) and ore shrinkage stoping (conventional short hole shrinkage stoping). Expected dilution and mining losses are 12.5% and 8.8% for sublevel stoping respectively; and 21.7% and 6.1% for shrinkage stoping respectively. The shafts extend to the 750m level (with skip loading and weighing facilities below that level). First production from the mine took place in January 2010.
THIS WEB PROOF INFORMATION PACK IS IN DRAFT FORM. The information contained herein is incomplete and subject to change and it must be read in conjunction with the section headed ‘‘Warning’’on the cover of this Web Proof Information Pack.

KAZZINC LTD Competent Person’s Report for the assets held by Kazzinc Ltd in both Kazakhstan and Russia
61‐0795/MM February 2011
Draft V 0.10 Page 27
Mining works, based on a tracked system, are progressing from the centre of the deposit to the flanks, mining reserves on the top levels first. Currently, one of the most developed levels is the 850m level. It is intended that the current production rate of 450ktpa be maintained in 2011 and increased it to 550ktpa by 2013. Novoshirokinskiy ore reserves are given in table below.
Novoshirokinskiy Ore Reserve Estimate (WAI 01.01.2011)
(In Accordance with the Guidelines of the JORC Code (2004))
Ore (kt)
AuEq (g/t)
AuEq (kg)
Ag (g/t)
Ag (kg)
Au (g/t)
Au (kg)
Pb (%)
Pb (t)
Zn (%)
Zn (t)
Proven 2,438 7.89 19,233 77.0 187,676 3.89 9,473 2.98 72,601 1.28 31,089
Probable 4,427 7.78 34,463 84.3 373,276 3.89 17,200 2.69 118,896 0.99 43,912
Total Proven and Probable
6,865 7.82 53,695 81.7 560,953 3.89 26,673 2.79 191,498 1.09 75,000
Inferred material within stopes
48 5.16 249 53.3 2,577 1.5 74 1.94 937 1.14 549
The plant at Novoshirokinskoye began treating ore in December 2009. Construction of the plant buildings commenced in the early 1990’s but work was stopped due to the break up of the Soviet Union. The plant uses the standard minerals processing techniques of SAG‐ball milling, gravity and flotation to produce a gold‐rich lead concentrate and a zinc concentrate. Current plant performance is broadly in line with planned values. The environmental, social and H&S matters are generally being addressed in a competent and locally compliant manner. Advanced Exploration Properties Dolinnoe and Obruchevskoe The Dolinnoe and Obruchevskoe deposits in east Kazakhstan are located 7.5 and 11km respectively from Ridder, the nearest railhead. The deposits are situated in the centre and deepest south‐eastern portions respectively of the Ridder mining district in the Rudnyi Altay geotectonic block The Dolinnoe deposit, which lies at a depth of between 450‐650m, was discovered in 1987 and was followed up by integrated deep drilling, geophysical prospecting and geochemical investigations. The Obruchevskoe deposit is situated at a depth of 800‐1,000m and was discovered by DDH 1798 who drilled in March 1987 to follow up a geochemical anomaly. Geologically, the Ridder mining district coincides with an unusual graben structure preserving Silurian to Middle Devonian volcano‐sedimentary sequences. The two lodes comprising the Dolinnoe deposit are centred on anticlinal structures with gentle to moderate dips in all directions (domes) separated by a shallow trough. Each lode contains discrete mineralised bodies of two contrasting forms:
• Conformable, stratabound, mineralised mound‐like bodies in altered calcareous siltstones; and
• Moderately to steeply dipping cross‐cutting lenticular vein‐like bodies in the gravelites which underlie the calcareous siltstone horizon.
THIS WEB PROOF INFORMATION PACK IS IN DRAFT FORM. The information contained herein is incomplete and subject to change and it must be read in conjunction with the section headed ‘‘Warning’’on the cover of this Web Proof Information Pack.

KAZZINC LTD Competent Person’s Report for the assets held by Kazzinc Ltd in both Kazakhstan and Russia
61‐0795/MM February 2011
Draft V 0.10 Page 28
The stratabound North‐Eastern Lode is represented by a single mineralised body, Orebody 3 and a few small and isolated lenses. The underlying mineralisation is represented by a swarm of twelve moderately to steeply dipping north‐northwest trending veins. The South Western Lode occurs at a depth of 495‐580m below surface and steeply dipping feeder veins extend to deeper levels. Grades tend to be lower than those recorded in the North‐Eastern Lode. The Obruchevskoe stratabound polymetallic sulphide mineralisation was outlined by drilling on two cupola‐shaped lodes, Northern and Southern, and traced over the intervening ground, the Central Prospect, within the same lithological unit of the Kryukovskaya Formation. The mineralisation occurs as tabular and lenticular veinlet‐disseminated and massive sulphide bodies on three horizons (Nos.1, 2 and 3) in both Southern and Northern Lodes. Mineralogically, the ores comprise sphalerite, galena, chalcopyrite and pyrite which, depending on their content in different ores, can constitute major, abundant or accessory minerals, although in solid sulphide polymetallic ores they may all be major components. Accessory minerals include tetrahedrite and tennantite with a high zinc content (fahlores which can be present in varying amounts); rare minerals consist of free gold, gold‐silver alloy (electrum), pyrrhotite and, specifically at Obruchevskoe, bornite and some chalcopyrite and arsenical pyrite. Gold is the main mineral of economic interest at Dolinnoe; veinlet‐disseminated polymetallic mineralisation predominates at Obruchevskoe. The 2008 Technical Economic Assesment (TEO) or Feasibility Study considered three scenarios for accessing the Dolinnoye and Obruchevskoye deposits:
• Option 1: Three shafts from surface independent of Ridder‐Sokolniy mine; • Option 2, 2A and 2B: Opening jointly with Ridder‐Sokolniy mine, and • Option 3: Using two shafts from surface but independent of Ridder‐Sokolniy mine.
Kazzinc has chosen Option 3 because this option provides the greatest NPV and Internal Rate of Return and the lowest Discounted Payback Period. Mineral resource estimates which have been performed for the Dolinnoe and Obruchevskoe ore zones are based on the models prepared by Kazakhstan Mineral Company (KMC) in January and February 2011 and have been calculated in accordance with the guidelines of the JORC Code (2004). The mineral resource models considers drilling available to this date and the effective date of this resource estimate is 02/02/2011.
Dolinnoe & Obruchevskoe Mineral Resource Estimate ‐ COG 1.7% EqvZn (WAI 01.01. 2011)
(In Accordance with the Guidelines of the JORC Code (2004)) Au Ag Cu Pb Zn Classification Tonnage (kt) EqvZn % g/t g/t % % %
Dolinnoye Measured 1,678 10.07 3.73 36.76 0.2 0.74 1.41 Indicated 3,736 7.88 2.86 33.17 0.15 0.6 1.08
Measured + Indicated 5,413 8.56 3.13 34.28 0.16 0.64 1.18 Inferred 9,025 6.2 2.09 25.46 0.14 0.52 1
Obruchevskoye Measured 1,154 17.75 1.62 40.68 0.88 4.02 8.87 Indicated 7,783 9.61 0.67 25.36 0.73 1.78 4.64
Measured + Indicated 8,937 10.66 0.79 27.34 0.75 2.07 5.18 Inferred 5,500 4.56 0.5 24.97 0.41 0.64 1.75
THIS WEB PROOF INFORMATION PACK IS IN DRAFT FORM. The information contained herein is incomplete and subject to change and it must be read in conjunction with the section headed ‘‘Warning’’on the cover of this Web Proof Information Pack.

KAZZINC LTD Competent Person’s Report for the assets held by Kazzinc Ltd in both Kazakhstan and Russia
61‐0795/MM February 2011
Draft V 0.10 Page 29
Ore Reserves for the Dolinnoe and Obruchevskoe deposits have been calculated in accordance with the guidelines of the JORC Code (2004). A summary of the Ore Reserves is presented in the table below.
THIS WEB PROOF INFORMATION PACK IS IN DRAFT FORM. The information contained herein is incomplete and subject to change and it must be read in conjunction with the section headed ‘‘Warning’’on the cover of this Web Proof Information Pack.

KAZZINC LTD Competent Person’s Report for the assets held by Kazzinc Ltd in both Kazakhstan and Russia
61‐0795/MM February 2011
Draft V 0.10 Page 30
Dolinnoe & Obruchevskoe Ore Reserve Estimate
(WAI 01.01. 2011)
(In Accordance with the Guidelines of the JORC Code (2004))
Gold (Au) Silver (Ag) Copper (Cu) Lead (pb) Zinc (Zn) Deposit Reserves Ore (Mt) Grade
(g/t) Metal Content
(oz) Grade (g/t)
Metal Content (oz)
Grade (%)
Metal Content (t)
Grade (%)
Metal Content (t)
Grade (%)
Metal Content (t)
Proven 1.164 3.99 149,222 50.14 1,876,491 0.21 2,499 0.75 8,711 1.50 17,438 Probable 0.923 3.36 99,851 46.27 1,373,112 0.18 1,660 0.72 6,622 1.28 11,837 Dolinnoye Total 2.087 3.71 249,073 48.43 3,249,603 0.20 4,159 0.73 15,333 1.40 29,275 Proven 0.886 1.73 49,363 42.80 1,219,753 0.81 7,161 4.27 37,829 8.98 79,581 Probable 3.247 0.90 94,019 33.21 3,466,977 0.83 26,845 2.66 86,520 6.50 211,092 Obruchevskoye Total 4.134 1.08 143,382 35.26 4,686,731 0.82 34,006 3.01 124,349 7.03 290,673
THIS WEB PROOF INFORMATION PACK IS IN DRAFT FORM. The information contained herein is incomplete and subject to change and it must be read in conjunction with the section headed ‘‘Warning’’on the cover of this Web Proof Information Pack.

KAZZINC LTD Competent Person’s Report for the assets held by Kazzinc Ltd in both Kazakhstan and Russia
61‐0795/MM February 2011
Draft V 0.10 Page 31
Chekmar The deposit is situated 46km north of Ridder and linked with Ridder by a graded road. The Chekmar deposit comprises three polymetallic ore zones, Chekmar, South‐Eastern and Gusliakov. They are located in close proximity to each other in the centre of an 8km long mineralised trend. The Chekmar ore zone contains about 40 mineralised bodies, predominantly of stockwork and stringer type ore. The South Eastern ore is a blind zone of which only the top part has been explored. The structure is a NW‐trending tight to isoclinal anticline with a moderate to steep (40‐60°) NW plunge. Eleven lenses of stockwork and stringer mineralisation have been delineated with strike lengths in the range of 175‐290m. The Gusliakov Ore Zone occurs in a NW‐trending double plunging tight to isoclinal anticline, which is correlated with the anticline of the South‐Eastern ore zone. Due to faulting, this area is lifted up at least 200m in relation to the South‐Eastern ore zone. Mineralisation at Gusliakov is polymetallic with barite‐rich lenses at high stratigraphic levels. Stockwork, stringer and disseminated mineralisation predominates, but massive sulphide lenses are more abundant than at the South‐Eastern deposit and account for over 5% of the mineralised volume. Twenty four mineralised lenses have been delineated with strike lengths of 60‐150m. Down dip dimensions vary from 100‐375m and widths from 7‐10.5m. The ore zones were explored by core drilling from surface augmented by underground exploration from two adits at Chekmar (Adit No.1 at +800m level and Adit No.2 at +670m level) and from another adit at Gusliakov (at +600m level). Historical resource and reserve conditions for the Chekmar ore zones were developed in a Technical‐Economic Assessment (TEO) conducted by the Ministry of Geology of Kazakhstan SSR and approved by GKZ USSR on 14 August 1981 (Memorandum No 1610‐k). The conditions are as follows:
• Minimum head grade ‐ 1.65% ZnEq, where ZnEq = 1.1Cu + 1.1Pb + Zn. • Sample cut‐off grade ‐ 1% ZnEq. • Minimum width ‐ 10m, or accumulation of 10m% ZnEq for widths of less than 1m. • Maximum thickness of internal waste (which may include mineralisation grading <1% ZnEq) ‐
10m. The conditions also state that resource estimates must be subdivided into oxidised, mixed and sulphidic ore types based on percentages of lead and zinc sulphide forms and cyanide soluble copper. Any gold mineralisation above a cut‐off grade of 1g/t Au and barite mineralisation above 2% Ba must also be included in the resource regardless whether it is contained within or outside the resource delineated using the other conditions. These reserve estimates have not been prepared in accordance with an internationally recognised standard, are based on historical data and are included for information only. The total reserves contained within the proposed Chekmar ore zone open pit are given in the table below:
THIS WEB PROOF INFORMATION PACK IS IN DRAFT FORM. The information contained herein is incomplete and subject to change and it must be read in conjunction with the section headed ‘‘Warning’’on the cover of this Web Proof Information Pack.

KAZZINC LTD Competent Person’s Report for the assets held by Kazzinc Ltd in both Kazakhstan and Russia
61‐0795/MM February 2011
Draft V 0.10 Page 32
Total Reserves – Chekmar Open Pit (GKZ USSR 1981) Balanced (C1 + C2) Off‐balance Ore Type Unit Mixed Sulphides Total Mixed & Sulphide
C1 +C2 Oxides C2
kt 41,975.0 16,205.0 58,180.0 3,268.3 3,282.0 % 0.15 0.09 0.13 0.22 0.56 Cu kt 64.6 14.1 78.7 7.4 18.3 % 0.67 0.68 0.67 0.19 0.86 Pb kt 281.1 109.6 390.7 6.1 28.2 % 1.78 1.73 1.76 0.52 0.79 Zn kt 745.3 279.7 1,025.0 17.0 26.0 g/t 0.28 0.23 0.27 0.19* ‐ Au kg 11,753.0 3,727.2 15,480.2 369 ‐ g/t 7.76 6.47 7.40 4.67* Ag t 325.7 104.8 430.5 9.0 % 0.006 0.006 0.006 0.003* Cd t 2,518.5 972.3 3,490.8 56.7 % 3,40 3,35 3,39 2.06* Sulphide
sulphur kt 1,427.1 542.9 1,970.0 40.6 % 2.21 2.51 2.29 1.54* Inc. pyrite
sulphur kt 927.6 406.7 1,334.3 30.2 Note: * As impurities are approved only in С1 ore, their share in С1 ore is 1965.2kt
Chashinskoye TMF The Chashinskoye tailings dam, located some 3.5km to the east of the Ridder‐Sokolniy Mine, was in operation from 1953 to 1978 inclusive, taking over from the Staroye tailings dam in containing material from the LPC and processed ore predominantly from the Ridder‐Sokolny deposit. Although much larger, covering an area of some 250ha, the grade of the tailings is much lower as a result of reduced head grade to the LPC and improved recovery over time. A summary results of the evaluation of the resources in accordance with the guidelines of the JORC Code (2004) are shown in the table below.
Chashinskoye Tailings Mineral Resource Estimate (WAI 01.01.2011)
(In Accordance with the Guidelines of the JORC Code (2004)) Classification Tonnes (Mt) Au (g/t) Ag (g/t) Cu (%) Pb (%) Zn (%) AuEq* (g/t) Indicated 57.8 0.67 5.16 0.05 0.15 0.38 1.15
Inferred 30.0 0.50 4.57 0.06 0.19 0.45 1.06
WAI has calculated Ore Reserves based upon the above Mineral Resource Estimate and in accordance with the guidelines of the JORC Code (2004). WAI has applied losses of 4.4% based upon historical data, and dilution of 0.5% to take into account minimal dilution from the bunds and floor.
THIS WEB PROOF INFORMATION PACK IS IN DRAFT FORM. The information contained herein is incomplete and subject to change and it must be read in conjunction with the section headed ‘‘Warning’’on the cover of this Web Proof Information Pack.
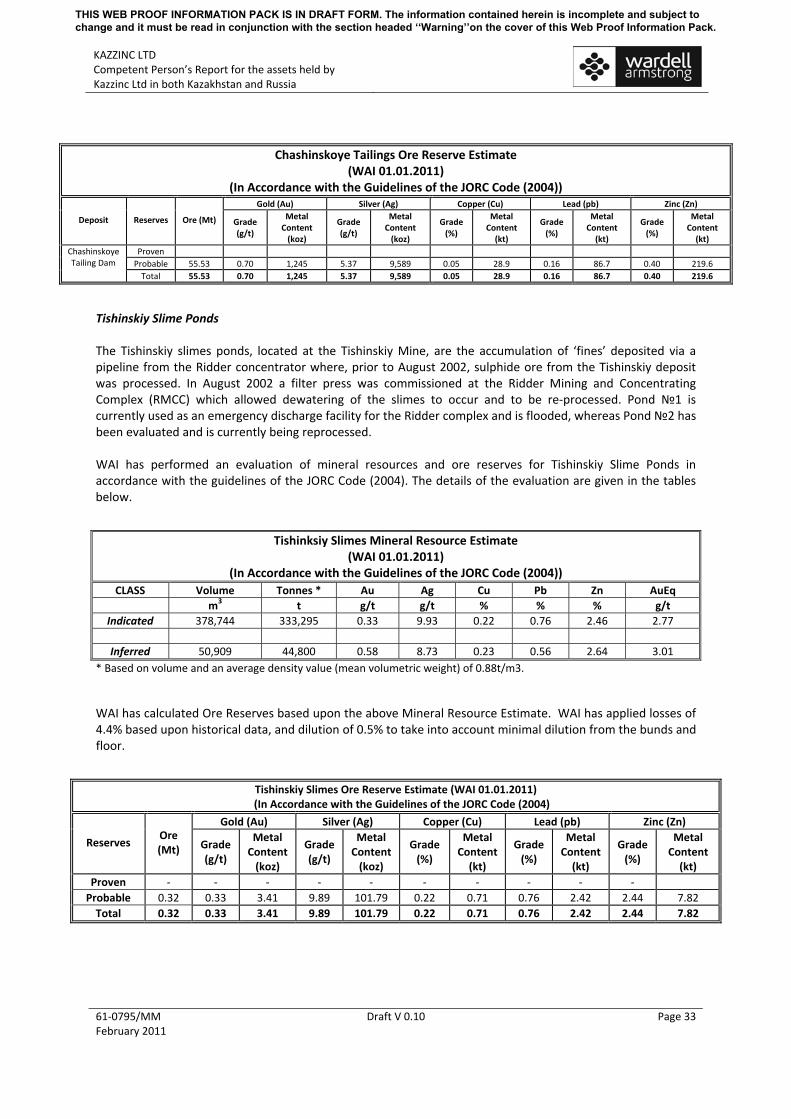
KAZZINC LTD Competent Person’s Report for the assets held by Kazzinc Ltd in both Kazakhstan and Russia
61‐0795/MM February 2011
Draft V 0.10 Page 33
Chashinskoye Tailings Ore Reserve Estimate (WAI 01.01.2011)
(In Accordance with the Guidelines of the JORC Code (2004)) Gold (Au) Silver (Ag) Copper (Cu) Lead (pb) Zinc (Zn)
Deposit Reserves Ore (Mt) Grade (g/t)
Metal Content (koz)
Grade (g/t)
Metal Content (koz)
Grade (%)
Metal Content (kt)
Grade (%)
Metal Content (kt)
Grade (%)
Metal Content (kt)
Proven Probable 55.53 0.70 1,245 5.37 9,589 0.05 28.9 0.16 86.7 0.40 219.6
Chashinskoye Tailing Dam
Total 55.53 0.70 1,245 5.37 9,589 0.05 28.9 0.16 86.7 0.40 219.6
Tishinskiy Slime Ponds The Tishinskiy slimes ponds, located at the Tishinskiy Mine, are the accumulation of ‘fines’ deposited via a pipeline from the Ridder concentrator where, prior to August 2002, sulphide ore from the Tishinskiy deposit was processed. In August 2002 a filter press was commissioned at the Ridder Mining and Concentrating Complex (RMCC) which allowed dewatering of the slimes to occur and to be re‐processed. Pond №1 is currently used as an emergency discharge facility for the Ridder complex and is flooded, whereas Pond №2 has been evaluated and is currently being reprocessed. WAI has performed an evaluation of mineral resources and ore reserves for Tishinskiy Slime Ponds in accordance with the guidelines of the JORC Code (2004). The details of the evaluation are given in the tables below.
Tishinksiy Slimes Mineral Resource Estimate (WAI 01.01.2011)
(In Accordance with the Guidelines of the JORC Code (2004)) CLASS Volume Tonnes * Au Ag Cu Pb Zn AuEq
m3 t g/t g/t % % % g/t Indicated 378,744 333,295 0.33 9.93 0.22 0.76 2.46 2.77
Inferred 50,909 44,800 0.58 8.73 0.23 0.56 2.64 3.01
* Based on volume and an average density value (mean volumetric weight) of 0.88t/m3.
WAI has calculated Ore Reserves based upon the above Mineral Resource Estimate. WAI has applied losses of 4.4% based upon historical data, and dilution of 0.5% to take into account minimal dilution from the bunds and floor.
Tishinskiy Slimes Ore Reserve Estimate (WAI 01.01.2011) (In Accordance with the Guidelines of the JORC Code (2004)
Gold (Au) Silver (Ag) Copper (Cu) Lead (pb) Zinc (Zn)
Reserves Ore (Mt) Grade
(g/t)
Metal Content (koz)
Grade (g/t)
Metal Content (koz)
Grade (%)
Metal Content (kt)
Grade (%)
Metal Content (kt)
Grade (%)
Metal Content (kt)
Proven ‐ ‐ ‐ ‐ ‐ ‐ ‐ ‐ ‐ ‐ Probable 0.32 0.33 3.41 9.89 101.79 0.22 0.71 0.76 2.42 2.44 7.82 Total 0.32 0.33 3.41 9.89 101.79 0.22 0.71 0.76 2.42 2.44 7.82
THIS WEB PROOF INFORMATION PACK IS IN DRAFT FORM. The information contained herein is incomplete and subject to change and it must be read in conjunction with the section headed ‘‘Warning’’on the cover of this Web Proof Information Pack.

KAZZINC LTD Competent Person’s Report for the assets held by Kazzinc Ltd in both Kazakhstan and Russia
61‐0795/MM February 2011
Draft V 0.10 Page 34
Exploration Licences Solovievskiy Block The Solovievskiy Block, covering 4,300km2 and registered under Contract No.2114 dated 25.07.2006, is located in the eastern Kazakhstan region, Katon‐Karagaiskiy District, some 100km south‐southeast of Ridder and 140km east southeast of Ust‐Kamenogorsk. The nearest large town is Zyryanovsk where Kazzinc operate the Maleevskoye mine and processing plant. The Solovievskiy Block is the most advanced exploration licence currently in operation by Kazzinc and the only one to possess a valid exploration licence (at the time of the site visits in 2010). The Solovievskiy Block lies within the Rudny Altai Palaeozoic province, or belt, and predominantly comprises Carboniferous and Devonian geological units. Kazzinc are undertaking a comprehensive and thorough exploration programme within the Solovievskiy block that commenced in 2005. This structured work has resulted in the identification of three targets; Novokhairuzovskoie (Au), Khairuzovskoie (Cu‐Zn) and Greizenovoie, which are all located in the south‐southwest of the licence block. The most advanced of which, Novokhairuzovskoie, is currently being drilled and a preliminary mineral resource estimation and model has been completed. To date (01.07.2010) some 30,510m of surface trenching and 16,544.8m of diamond drilling (plus 41,180m of Reverse Circulation drilling has been completed). Kazzinc has estimated a Soviet classified P1 resource of some 216.8Mt at 0.67g/t Au (0.3g/t Au cut‐off grade) for Novokhairuzovskoie. Butachikhinsko‐Kedrovskiy The Butachikhinsko‐Kedrovskiy Block is located in the East Kazakhstan Oblast, some 40km northeast of Ust‐Kamenogorsk and to the southwest of Ridder. The licence block covers an area of 700km2 and a contract was sent to the Ministry of Industry and New Technologies for approval, and which is awaited to be received by Kazzinc. It should be noted that the Tishinskiy deposit/mine is enclosed within this licence block. The Butachikhinsko‐Kedrovskiy Block lies within the Rudny Altay (VMS) province and predominantly comprises Lower to Upper Devonian geological units, with a small area of Carbonaceous in the extreme west of the block. Regional prospecting has been conducted within the Block since the early 1900’s, initially involving geological mapping and later through geochemical and geophysical surveys. Since 2005 Kazzinc has undertaken a limited amount of exploration within the Block, prior to the issuing of the licence but with State agreement. Initial work comprised the collation of available historic data, including drillholes and trench data, along with a confirmatory programme with sampling that identified elevated levels of mineralisation, particularly copper. Although preliminary in nature the work identified several promising targets and Kazzinc estimated a Prognostic resource of some 150Mt at 1.2% Cu, 0.70% Pb and 3.7% Zn, including 5.0Mt at 0.9g/t Au. Western Torgai The Western Torgai exploration asset, comprising the Karabaitalsky and Sakharovsko‐Adaevskiy sites, lies immediately to the southwest of the original Shaimerden exploration licence and contracts are in the process of registration at the Ministry of Industry and New Technologies. At the Karabaitalsky site a 3 year programme of drilling (19,000m) and geophysics is planned to investigate previously identified anomalies representing porphyry gold and polymetallic deposits; at the Sakharovsko‐Adaevskiy site a similar 3 year programme has been drawn up to investigate the Klochkovskoye quartz diorite porphyry Cu/Mo deposit (intersected in old soviet boreholes) with 13,000m drilling and geophysics. Bukhtarma Hydroelectric Power Plant The plant was constructed in stages between 1953 and 1968. The Standard design life for hydro stations is generally in the region of 30 years. Currently the Bukhtarma Hydro Station is in the last stage of major
THIS WEB PROOF INFORMATION PACK IS IN DRAFT FORM. The information contained herein is incomplete and subject to change and it must be read in conjunction with the section headed ‘‘Warning’’on the cover of this Web Proof Information Pack.

KAZZINC LTD Competent Person’s Report for the assets held by Kazzinc Ltd in both Kazakhstan and Russia
61‐0795/MM February 2011
Draft V 0.10 Page 35
refurbishment works, which are expected to be completed in 2011. The reconstruction programme has led to the increase in capacity from 675MW to 720MW. The dam is a reinforced concrete gravity type dam. The Bukhtarma reservoir is located in East Kazakhstan and Semipalatinsk oblasts of Kazakhstan and has an area of 5,500km2. Valuations WAI has undertaken a valuation of the Kazzinc operations using discounted cash flow analysis to determine the Net Present Value (“NPV”) of both the operations as a whole and each individual mine. A post‐tax un‐geared cash flow model was constructed for each operation based on the JORC Code (2004) compliant Ore Reserves estimated by WAI. Ore production rates, operating costs and metallurgical recoveries for each mine were estimated on the performance over the last 3 years along with Kazzinc’s forecast for 2011 production. Capital expenditure for 2011 to 2016 is based on Kazzinc’s 5 year plan; thereafter, WAI has estimated likely capital expenditure based on the 2008 to 2016 expenditure. In order to derive an individual valuation for each mine, a Net Smelter Return (“NSR”) has been assumed for each concentrate product based on typical refining and treatment charges for that concentrate type. For the combined operations scenario, Kazzinc smelts its own concentrate and therefore benefits from the sale of by‐products and other penalty elements, which are not included in the individual mine valuations. Third party concentrates smelted by Kazzinc are also included in the combined scenario but not in the individual mine valuations.
THIS WEB PROOF INFORMATION PACK IS IN DRAFT FORM. The information contained herein is incomplete and subject to change and it must be read in conjunction with the section headed ‘‘Warning’’on the cover of this Web Proof Information Pack.

KAZZINC LTD Competent Person’s Report for the assets held by Kazzinc Ltd in both Kazakhstan and Russia
61‐0795/MM February 2011
Draft V 0.10 Page 36
*Includes Net Revenue from third party concentrates but not volumes processed. Smelter recovery factors applied.
Kazzinc Life of Mine Production and Valuation
Metal Production Operation
Ore Mined/Concentrate Processed
(Mt) Zn (kt)
Pb (kt)
Cu (kt)
Au (koz)
Ag (koz)
Revenue (US$M)
Total Operating Costs (US$M)
EBIT (US$M)
NPV (US$M)
Combined Kazzinc Operations including Smelters and Third Party Concentrates*
266.6/8.6 2,363 603 331 8,564.3 47,375.2 20,649.3 10,119.3 9,320.2 4,114.1
Vasilkovskoye 124.0 ‐ ‐ ‐ 5,617.8 ‐ 5,675.7 2,724.5 2,437.7 1,230.7 Maleevskoye 12.1 744.6 149.8 131.5 158.0 19,574.0 2,393.3 633.0 1,825.4 1,075.3 Shaimerden 1.9 244.3 ‐ ‐ ‐ ‐ 608.0 165.5 400.9 229.6 Chashinskoye Tailings 55.5 ‐ ‐ ‐ 1,076.5 3,659.2 1,040.1 515.1 461.3 188.4 Tishinskiy 29.3 1,015.4 125.6 75.5 338.0 5,234.9 2,601.8 1,877.3 473.9 220.6 Novoshirokinskoye 7.3 84.3 176.0 17.2 650.3 13,029.9 1,136.8 569.3 392.7 187.3 Ridder‐Sokolniy 21.1 100.2 57.9 63.5 837.2 5,592.8 1,469.5 1,028.5 304.6 134.4 Obruchevskoe 4.1 281.8 115.3 33.5 107.5 94.0 849.9 235.0 426.0 65.8 Staroye Tailings 6.9 23.5 9.4 2.0 132.3 1,454.8 207.7 99.8 64.7 36.0 Shubinskiy 2.3 32.5 4.3 21.0 6.5 368.4 189.7 125.0 45.0 19.7 Dolinnoye 2.1 25.7 13.4 3.7 76.5 99.6 142.0 122.3 ‐74.9 9.7
Total 266.6 2,552.3 651.7 347.9 9,000.6 49,107.6 16,314.50 8,095.30 6,757.30 3,397.50
THIS WEB PROOF INFORMATION PACK IS IN DRAFT FORM. The information contained herein is incomplete and subject to change and it must be read in conjunction with the section headed ‘‘Warning’’on the cover of this Web Proof Information Pack.

KAZZINC LTD Competent Person’s Report for the assets held by Kazzinc Ltd in both Kazakhstan and Russia
61‐0795/MM February 2011
Draft V 0.10 Page 37
A summary of the combined Kazzinc operations cash flow forecast, including third party concentrates, between 2011 and 2027 is provided in the Table below. Total operating costs for the operations are estimated at US$10,119.3M, with a cumulative operating free cash flow of US$7,672.2M and EBIT of US$9,320.2M. The operations generate a positive NPV of US$4,114.1M.
Kazzinc Combined Operations ‐ Summary Economic Statistics Summary Units Value
Ore Mined Mt 266.6 Zn Concentrate Produced kt 5,105 Pb Concentrate Produced kt 1,201 Cu Concentrate Produced kt 1,189 Au Concentrate Produced kt 1,067 Zinc Metal Recovered kt 2,363 Lead Metal Recovered kt 603 Zinc Metal Recovered kt 331 Gold Metal Recovered t 291 Silver Metal Recovered t 1,523 Gross Revenue Generated US$M 20,649.3 Operating Costs US$M 10,119.3 Capital Expenditure US$M 1,322.7 Depreciation US$M 1,209.8 Cash Taxes US$M 1,535.1 Total Operating Free Cash Flow US$M 7,672.2 EBIT US$M 9,320.2 NPV US$M 4,114.1
THIS WEB PROOF INFORMATION PACK IS IN DRAFT FORM. The information contained herein is incomplete and subject to change and it must be read in conjunction with the section headed ‘‘Warning’’on the cover of this Web Proof Information Pack.

KAZZINC LTD Competent Person’s Report for the assets held by Kazzinc Ltd in both Kazakhstan and Russia
61‐0795/MM February 2011
Draft V 0.10 Page 38
CONSULTANTS AND INTERESTS Wardell Armstrong International (“WAI”) is an internationally recognised, independent minerals industry consultancy. All consultants used in the preparation of this report are employed directly by WAI or are Associates of WAI and have relevant professional experience, including prior field experience of the geology and mineralisation of gold and polmetallic deposits in Kazakhstan and Russia. Details of the principal consultants involved in the preparation of this document are as follows: Phil Newall, BSc (ARSM), PhD (ACSM), CEng, FIMMM, Director of Minerals, Geology and Project Management Phil is a Mining Geologist with over 25 years experience of providing consultancy services to minerals companies throughout the world, with particular specialisation in CIS, Europe, Central and West Africa, and China. He has developed an extensive portfolio of exploration and mining‐related contracts, from project management through to technical audits of a large variety of metalliferous and industrial mineral deposits. In particular, Phil has recently managed the Kempirsai Pre‐feasibility Study for Bekem Metals on a Ni laterite in Kazakhstan, ARICOM’s London CPR on their Fe assets in Russia, CPR for Kazakhaltyn for their London listing, PHM’s London MER report, a large technical Due Diligence for Kazakhmys and the Feasibility Study for Oriel Resources on their Shevchenko Ni project. Mark Owen, BSc, MSc (MCSM), CGeol, FGS, EurGeol, Technical Director, Geology and Mineral Resources Mark has over 27 years as a Mining Geologist, in both the metalliferous and industrial mineral mining sectors. He has considerable expertise of front line production mining, both in the underground and exploration environments, working on mines in the UK, Saudi Arabia and Venezuela. Throughout his experience he has had responsibility for technical teams addressing resource estimation, exploration planning and management, mining and process issues and environmental impact assessment. At WAI over the last 11 years, he has gained considerable experience of completing gold projects in Russia and the CIS, from scoping level through to full Bankable Feasibility Study and at the same time is fully conversant with the requirements of both the London and North American stock exchanges both acting as a Competent Person and author of numerous NI 43‐101 reports. Che Osmond, BSc, MSc (MCSM), ProfGradMIMMM, CGeol, Euro Geol, FGS; Principal Geologist, Exploration Geology Che is a Geologist with over 15 years experience of implementation and management of geological, geotechnical, environmental and civil engineering contracts. Upon completion of his MSc in Mining Geology he undertook a position with CSMA to plan and supervise nickel and copper exploration projects in Southern Africa before going on to other projects including exploration programmes for Cyprus‐type VMS deposits within the ophiolite belt in the Sultanate of Oman. Che is also experienced with Datamine® modelling software. Since joining WAI in 2005, Che has been involved with exploration programme proposals, mineral resource estimation and audits, technical audits and CPR’s as well as preparation of NI 43‐101 Technical Reports of industrial and metalliferous minerals in Eastern Europe, CIS, North and West Africa and the Middle East. Colin Taylor, BA (Hons), MA, Pr. Sci Nat, Associate Consultant, Exploration Geology Colin has some 40 years of international experience in exploration and resource geology, initially in South Africa and Namibia before being based in the UK. Colin has held such positions as Exploration, Mine and Chief Geologist and is widely versed in a variety of mineral commodities, including base and precious metals, industrial minerals and coal. Colin continues to contribute to technical studies, due diligence reviews and competent persons reports in the CIS, Europe and Africa and is fully conversant with the JORC Code (2004) and in the preparation of NI 43‐101 reports. Adam Wheeler, BSc MSc CEng Eur Ing, Manager of Resources, Resource Modelling and Estimation Adam is a Mining Engineer specialising in the application, customisation and management of mining and geological software systems. He has particular expertise relating to general mining/geological software
THIS WEB PROOF INFORMATION PACK IS IN DRAFT FORM. The information contained herein is incomplete and subject to change and it must be read in conjunction with the section headed ‘‘Warning’’on the cover of this Web Proof Information Pack.

KAZZINC LTD Competent Person’s Report for the assets held by Kazzinc Ltd in both Kazakhstan and Russia
61‐0795/MM February 2011
Draft V 0.10 Page 39
systems used in the geostatistical resource and reserve assessment for both open pit and underground optimisation. His skills include undertaking geostatistical studies, ore reserve estimation, geological modeling and mine planning, and training of personnel. Adam has broad international experience, but has been more involved in projects in CIS, Europe, Africa and South America. Richard Ellis, MCSM, BSc, MSc, FGS; Senior Resource Geologist, Database & Resource Modelling Richard is a Geologist with nearly 10 years operational experience within the industrial minerals sector in the UK. He has conducted reserve and resource reports for annual corporate financial reporting and has been responsible for pit optimisation, production scheduling, grade control and reconciliation. As a resource modelling geologist with WAI, Richard has worked on numerous resource modelling projects including the Koksay Cu‐Mo porphyry deposits, Kazakhstan, the Bapy iron ore deposit, Kazakhstan and recently conducted resource auditing of the Mount Nimba, iron ore deposit, Guinea. Owen Mihalop, BSc (Hons), MSc, MCSM, CEng, MIMMM, Technical Director, Mining Engineering and Financial Modelling Owen is a chartered mining engineer with 15 years broad based experience in the mining and quarrying industries. He has gained experience in grass‐roots exploration through to large scale open‐pit and underground mining projects across Ireland, Bulgaria, Spain and Canada. He has worked as an operations manager in industrial mineral mining and quarrying operations in the UK and has gained considerable project management and financial evaluation experience through these roles. Bruce Pilcher, BE(Mining)Syd, MAusIMM(CP), MIMMM, CEng, Eur Ing Associate Director ‐ Principal Mining Engineer, WAI, Mining and Infrastructure Bruce is a Chartered Mining Engineer with 25 years experience in underground and surface mining operations in South Africa, Australia and UK. Bruce has served as Mine Superintendent, Regional and Technical Services Manager. He has considerable experience in production management, mine design and planning, and contract management in the coal and metalliferous mining industries. Bruce also has worked within the explosives industry focussing on drilling & blasting applications and contracting which included managing optimisation projects in Australasia, UK, France, Spain, Germany, Poland and Kyrgyzstan. Since joining WAI, Bruce has worked on several metal projects including the Macusani uranium deposit in Peru, the Namib lead and zinc mine in Namibia, the Bjorkdal gold mine in Sweden and the Kemparsai nickel mines in Kazakhstan Lewis Meyer, BEng, ACSM, MSc, MCSM, PhD, CEng, FIMMM, Principal Mining Engineer, Geotechnics and Mine Design Lewis is a Chartered Mining Engineer with 18 years experience in mining, underground civil construction and rock mechanics of surface and underground mining operations. The early part of his career was spent in production mining in the platinum mines of South Africa. On returning to the United Kingdom, he completed a MSc, before joining a civil engineering consultancy gaining experience in project and contract management of various tunneling projects in London. Following completion of a PhD in geomechanics, Lewis spent 6 years working as a consultant rock mechanics engineer specializing in underground excavation and support design, on mining projects located in South Africa, India, Bangladesh, Kazakhstan, Indonesia and the UK. Since joining WAI in 2007, Lewis has specialised in open pit and underground mine design using Mine 2‐4D software. Stuart Richardson, BEng, ACSM, GradMIMMM, Mining Engineer, Mine Design and Scheduling Stuart is a mining engineer, graduating from Camborne School of Mines in 2006. He was employed as a student mining engineer by Deno Gold, Republic of Armenia, in 2005 gaining experience in metalliferous mining methodologies. He joined Wardell Armstrong in early 2007 as a Graduate Mining Engineer and has been involved in several projects, including the analysis of coal resources in Kentucky, USA. He has also gained experience in managing site works, acting as the Resident Engineer for a project at the Great Laxey Mine on the Isle of Man and as CQA Engineer for drilling works at Sutton Courtenay Landfill Site, Oxfordshire. In 2008, Stuart transferred to Wardell Armstrong International, working as a mining engineer and assisting in the production of a number of pre‐feasibility and feasibility studies using Mine 2‐4D software.
THIS WEB PROOF INFORMATION PACK IS IN DRAFT FORM. The information contained herein is incomplete and subject to change and it must be read in conjunction with the section headed ‘‘Warning’’on the cover of this Web Proof Information Pack.

KAZZINC LTD Competent Person’s Report for the assets held by Kazzinc Ltd in both Kazakhstan and Russia
61‐0795/MM February 2011
Draft V 0.10 Page 40
Daniil Lunev, DipEng (SPMI), PhD (SPMI) Mining Engineer, Mine Design and Scheduling Daniil is a specialist in mining machinery. His skills include the following: optimisation of schemes of underground and land mining equipment; calculations of mining transport systems and estimation of efficiency and reliability of mining machinery. He is particularly experienced in belt conveyor system development, modernisation of construction, and resolving conveyor application problems. He has 5 patents related to belt conveyor innovation. His has recently been involved in the Bapy Fe Ore Project in Kazakhstan, which involved the review of a feasibility study, advising on mining operation and scheduling, and the Feasibility Study of the Akbakai gold project in the same country. Philip King, BSc (Eng) Mineral Technology (Hons), Technical Director, Processing Phil has 20 years minerals processing experience ranging from laboratory test work and pilot plant operations through to plant commissioning, operations and trouble‐shooting. He has considerable experience in the technical and financial evaluation of many mining projects through the completion of both pre‐feasibility and feasibility studies, and has been involved in process design and engineering studies, equipment selection, and capital and operating cost estimates. He has also participated in a number of multi‐disciplinary projects throughout Central Asia, Africa and Europe involving base and precious metals, industrial minerals and coal. In particular, Phil has considerable experience of the metallurgy and extraction from gold ores. Colin Hunter, BSc (Hons), PhD, Associate Consultant, Processing Colin has 32 years minerals processing experience ranging from laboratory test work and pilot plant operations through to plant commissioning, operations and trouble‐shooting. He has considerable experience in the technical and financial evaluation of many mining projects through the completion of both pre‐feasibility and feasibility studies, and has been involved in process design and engineering studies, equipment selection, and capital and operating cost estimates. He has also participated in a number of multi‐disciplinary projects throughout Russia, Western Australia, West Africa, Central Asia, and Europe involving base and precious metals. In particular, Colin has considerable experience of commissioning and operation of Biox plants and bacterial leaching technology. Chris Broadbent, BSc, PhD, CEng, FIMMM, Partner, Wardell Armstrong, Pyrometallurgy Chris is a well‐recognised authority on pyrometalurgical processing and the treatment and disposal of wastes from mining and metallurgical plants. He has worked on R & D projects at universities as well as with ISP Ltd, RTZ Technical Services Ltd and Billiton (Shell) Research B.V. Whilst at Shell he chaired the Nickel Research Group and managed the FeNi R&D team. He has also published widely on the pysio‐chemistry of nickel smelting slags. Since 1994, as head of the pollution group in Wardell Armstrong, he has become experienced in assessing the environment consequences of general industrial pollution and the use of environmental chemistry in contaminated land investigations. In the UK he works closely with the metallurgical industries, especially the ferrous foundry sector and was a member of the Environment Agency Working Parties revising Process Guidance to the Ferrous Foundry, non‐ferrous metal and glass making sectors. Andrei Kudrin, BS (Hons), MEng (Hons), Engineer, Renewable Energy Andrei, as a mature student has recently graduated from the University of Exeter with an engineering degree in Renewable Energy. Before joining Wardell Armstrong International he has had placements with various companies such as Scottish and Southern Energy and Cornwall Sustainable Energy Partnership. He is a member of the Institute of Engineering and Technology and the Energy Institute. Andrei has worked on various wind and solar farm development projects, CHP and hydro schemes. He continues to contribute to technical, economical and environmental assessments within Wardell Armstrong. Nick Coppin, Bsc, MSc, Managing Director WAI, Environmental Scientist, Environment, Social and Health & Safety Nick is an environmental scientist with over 30 years of broadly based experience in the mining and minerals industry. He has worked extensively with government and regional authorities and institutions for mineral planning, mining administration, environmental protection, industrial development and finance. He is fully
THIS WEB PROOF INFORMATION PACK IS IN DRAFT FORM. The information contained herein is incomplete and subject to change and it must be read in conjunction with the section headed ‘‘Warning’’on the cover of this Web Proof Information Pack.

KAZZINC LTD Competent Person’s Report for the assets held by Kazzinc Ltd in both Kazakhstan and Russia
61‐0795/MM February 2011
Draft V 0.10 Page 41
conversant with national and international guidelines, procedures, regulations and standards for the mining and quarrying sector. Kim‐Marie Clothier, BSc (Hons) MRes AIEEM, MIEMA, Grad IMMM, ACMI; Senior Environmental Scientist, Environment, Social and Health & Safety Kim‐Marie is a Senior Environmental Scientist, mainly dealing with Environmental and Social Impact Assessments on mining projects overseas. She has worked with the company for over 5 years on projects located in Uzbekistan, Macedonia, Kyrgyzstan, Portugal, DRC, Sierra Leone, Greenland, Russia and Kazakhstan, providing environmental and social impact assessments of mining projects as part of feasibility studies and CPR or due diligence processes. She has contributed to projects for improving environmental performance and implementing Environmental Management Systems and plans as well as ESIAs. She also regularly undertakes environmental audits for UK mineral sites and has extensive experience in the assessment and remediation of contaminated land and has a strong interest in sustainable treatment options for Brownfield sites. Kathy Hicks BSc (Hons) MSc MCSM FGS Geo‐Environmental Scientist, Environment Kathy is a Geo‐environmental Scientist specialising in the field of mineral extraction and the remediation of land affected by past mining activities. After graduating from Camborne School of Mines, Kathy has worked as a Geotechnical Engineer with Fugro Engineering Services Ltd on sites with a range of issues throughout the UK. As a Mining Consultant for a further 4½ years, Kathy has acquired further experience in the assessment and remediation of mining impacted land. Since working for WAI, Kathy has worked as part of a multidisciplinary environmental team on a wide range of mining and development projects and has acquired experience in the remediation of contaminated land, risk assessment, gas, soils, water and environmental condition monitoring. Kathy has also worked on specific mining related projects within the UK, EU and CIS. She is conversant with OVOS/ESIA procedures and writing environmental reviews. Kathy has been responsible for formulating on‐site health and safety guidance and is conversant with health and safety, environmental management and permitting requirements. Christine Blackmore, BSc, MSc, CEnv, FIMMM, Principal Environmental Geologist, WA, Enviroment Christine has over 10 years of experience in environmental work both in the UK and overseas. Her expertise is focused in environmental management (EMS, EIA ect) and environmental auditing within the mining industry, with some of the work including aspects of health and safety procedures and protocols. Her recent experience has included work in Mauritania (Copper and Gold), Burkina Faso (Gold), Mexico (Gold), Kazahkstan (Zinc/Copper) and China (Silca). Clients include mining companies, investment bankers, government departments and design institutes. She has experience in design and construction using both natural and geosynthetic materials for tailings dams, lagoons, landfills, together with the design of environmental monitoring programmes. Lately she has been involved in transportation of dangerous goods audits for cyanide and waste oil, which have involved preparing accompanying management plans. Elena Bagayeva, BA, Regional Manager and Translator, WAI Kazakhstan ‐ Logistics Elena joined the WAI Kazakhstan team at the end of 2009 as Executive Secretary/ Technical Translator. She has gained her diversified professional experience in mineral mining sector through working with a number of international mining companies, including 4 years full‐time employment in UK‐based Central Asia Metals Ltd which holds exploration/mining properties across Kazakhstan and Mongolia. Elena’s wealth of knowledge in both the mining industry and the technical terminology thereof is a valuable asset for WAI. Yelena Borovikova, Senior Translator, WAI Kazakhstan Yelena has recently joined the WAI Kazakhstan team as Senior Translator. Her previous experience was gained through working with a number Western consultancies operating in FSU. Timur Mussin, MA, Technical Manager, WAI Kazakhstan Timur currently works at WAI’s Kazakhstan office to assist the Regional Manager in technical aspects of liaison with clients and technical translation for many of our FSU projects, as well as support in reconciliation of FSU standards and practices with international ones. He has 12 years experience in various aspects of the minerals and mining industry of the FSU. Previously, he has worked in R&D Dept of ALROSA (Russian diamond producer) and several Western mining companies in Kazakhstan on manganese, gold and copper projects as a project
THIS WEB PROOF INFORMATION PACK IS IN DRAFT FORM. The information contained herein is incomplete and subject to change and it must be read in conjunction with the section headed ‘‘Warning’’on the cover of this Web Proof Information Pack.

KAZZINC LTD Competent Person’s Report for the assets held by Kazzinc Ltd in both Kazakhstan and Russia
61‐0795/MM February 2011
Draft V 0.10 Page 42
manager and an operations manager and has gained considerable project management and evaluation experience through these roles, as well as good understanding of both FSU and Western standards and practices. Neither WAI, its directors, employees nor company associates hold any securities in Glencore, Glencore International AG or Kazzinc, its subsidiaries or affiliates, nor have:
• Any rights to subscribe for any Glencore, Glencore International AG or Kazzinc securities either now or in the future;
• Any vested interest or any rights to subscribe to any interest in any properties or concessions, or in any adjacent properties and concessions held by Kazzinc; and
• Been promised or led to believe that any such rights would be granted to WAI. The only commercial interest WAI has in relation to Glencore, Glencore International AG or Kazzinc is the right to charge professional fees to Glencore, Glencore International AG or Kazzinc (as applicable) at normal commercial rates, plus normal overhead costs, for work carried out in connection with the investigations reported herein. Disclaimer/Reliance on Experts The observations, comments and results of technical analyses presented in these reports represent the opinion of WAI as of [•] February 2011 and are based on the work as stated in the report. While WAI is confident that the opinions presented are reasonable, a substantial amount of data has been accepted in good faith. Although WAI has visited all of the assets described in this report, WAI did not conduct any verification or quality control sampling. WAI cannot therefore accept any liability, either direct or consequential, for the validity of such information accepted in good faith.
THIS WEB PROOF INFORMATION PACK IS IN DRAFT FORM. The information contained herein is incomplete and subject to change and it must be read in conjunction with the section headed ‘‘Warning’’on the cover of this Web Proof Information Pack.

KAZZINC LTD Competent Person’s Report for the assets held by Kazzinc Ltd in both Kazakhstan and Russia
61‐0795/MM February 2011
Draft V 0.10 Page 43
1 SITE VISITS 1.1 Background In order to prepare the Competent Person’s Report, WAI personnel undertook site visits to the various assets as follows: Kazakhstan Vasilkovskoye Open Pit and Maleevskoye Mine A team of WAI consultants visited the Vasilkovskoye open pit operation during the period 12 and 15 October 2010 and Maleevskoye Mine during the period 16 and 18 October 2010. During the site visit the WAI team inspected current exploration, production and process activities, discussed many aspects of the project with Kazzinc technical staff and collected sufficient data to complete the studies. The team from WAI visiting the project comprised Phil Newall, Director of Minerals and Mining Geologist; Richard Ellis, Resource Geologist, Owen Mihalop, Technical Director and Mining Engineer; Phil King, Technical Director and Processing Engineer; and Nick Coppin, Managing Director of WAI and Environment Scientist. All the technical team are full time employees of WAI. Ridder‐Sokolniy Mine and Satellite Mines and Advanced Exploration Properties A large team of WAI consultants visited the Ridder‐Sokolniy, Shubinskiy and Tishinskiy mines, Dolinnoe & Obruchevskoe development projects and Chekmar exploration licence during the period 12 to 22 October 2010. During the various site visits the WAI team inspected current exploration, production and process activities, discussed many aspects of the project with Kazzinc technical staff and collected sufficient data to complete the studies. The team from WAI visiting the project comprised Mark Owen, Technical Director and Mining Geologist; Adam Wheeler, Resource Geologist; Owen Mihalop, Technical Director and Mining Engineer; Bruce Pilcher, Lewis Meyer, Stuart Richardson and Daniil Lunev, Mining Engineers; Coin Hunter, Processing Engineer; and Chris Broadbent, Director of WA and Pyrometallurgist. All the technical team are full time employees of WAI or WAI. A separate visit was made by Kim‐Marie Clothier, Kathy Hicks and Christine Blackmore, all Environmental Scientists with WAI on 10‐21 November 2010. Kazzinc Smelters – Ust Kamenogorsk The Kazzinc smelters in Ust Komenogorsk were visted by Chris Broadbent, Director of WA and Pyrometallurgist during the period 12 to 22 October 2010. During the visit he inspected the processing activities, discussed many aspects of the project with Kazzinc technical staff and collected sufficient data to complete the study. Shaimerden Open Pit WAI personnel Bruce Pilcher (Mining Engineer), Colin Taylor (Geologist) and Colin Hunter (Process Engineer) visited the Shaimerden mine and offices during the period 12 to 14 October 2010. A separate visit was made by Anne Mihalop, Environmental Scientist with WAI on 23 to 25 November 2010.
THIS WEB PROOF INFORMATION PACK IS IN DRAFT FORM. The information contained herein is incomplete and subject to change and it must be read in conjunction with the section headed ‘‘Warning’’on the cover of this Web Proof Information Pack.
KAZZINC LTD Competent Person’s Report for the assets held by Kazzinc Ltd in both Kazakhstan and Russia
61‐0795/MM February 2011
Draft V 0.10 Page 44
Solovievskiy Exploration Block On 06 October 2010, Che Osmond, Senior Geologist with WAI visited the TOPAZ Mining Co. LLP analytical laboratory in Ust‐Kamenogorsk where the fire assay analysis is conducted for the current Solovievskiy Block exploration works. Che Osmond visited the Solovievskiy Block licence area on 07 and 08 November 2010, specifically the Novokhairuzovskoie deposit, the Kazzinc Geological Camp where core is logged, prepared and stored from the current exploration work. The Kazzinc sample preparation laboratory in Zyryanovsk was also inspected as well as the Kazzinc analytical laboratory located in the Zyryanovskiy Mining and Processing Complex. The Plazma Analit LLP analytical laboratory (Ust‐Kamenogorsk) was also visited on the 08 October 2010, where polymetallic ore is analysed by ICP methods. Tishinskoye Slimes Ponds & Staroye and Chanshinskoye TMF’s From 09 to 11 October 2010, Che Osmond visited the Tishinskoye slimes ponds, Staroye and Chanshinskoye TMF’s as well as the Kazzinc office in Ridder to review data with senior technical staff. The Kazzinc ‘Technical Control Dept.’ sample preparation and analysis laboratory in Ridder was also visited where samples from the mining and process plant are analysed. Bukhtarma Hydroelectric Power Plant Andrei Kudrin visited the Bukhtarma Hydroelectric Power Plant between 17 and 18 November 2010. RUSSIA Novoshirokinskoye Mine A team of WAI consultants visited the Novoshirokinskoye Mine during the period 10 and 11 November 2010. During the site visit the WAI team inspected current exploration, production and process activities, discussed many aspects of the project with Kazzinc technical staff and collected sufficient data to complete the studies. The team from WAI visiting the project comprised Phil Newall, Director of Minerals and Mining Geologist;, Owen Mihalop, Technical Director and Mining Engineer; Phil King, Technical Director and Processing Engineer; and Chris Broadbent, Director of WA and Environment Scientist. All the technical team are full time employees of WAI or WA. 1.2 Study Strategy The basic strategy for this CPR has been to examine and report on the existing information available on the properties held globally by the Client, which includes geological, resources/reserves, mining and metallurgical data and basic economic parameters. During the visits, further information was gathered on infrastructure, equipment, costs, potential mining methods, permitting and environmental issues. Locally‐based and publicly available documentation was viewed by WAI and in addition, WAI held meetings with key staff at the project sites. For the environmental aspects of the projects WAI has adopted the following strategy throughout the study:
• Carry out a review of environmental and social issues associated with each mine and processing facilities development in line with national and international requirements;
THIS WEB PROOF INFORMATION PACK IS IN DRAFT FORM. The information contained herein is incomplete and subject to change and it must be read in conjunction with the section headed ‘‘Warning’’on the cover of this Web Proof Information Pack.

KAZZINC LTD Competent Person’s Report for the assets held by Kazzinc Ltd in both Kazakhstan and Russia
61‐0795/MM February 2011
Draft V 0.10 Page 45
• Provide a preliminary evaluation of the project in this respect and to identify the main issues likely to affect valuation, viability, and access to funds from international financial institutions; and
• Identify and comment on areas of particular risk or exemplary practice. The methodology used by WAI for the environmental study has been to:
• Review project information and seek further clarification of project description as necessary; • Review the environmental studies previously undertaken; • Visit the sites and make a visual inspection of the project area and its surroundings; • Review and comment on key environmental and social issues; • Assess projects with in line with international requirements (generally including the Equator
Principles, IFC Performance Standards and World Bank EHS guidelines); • Advise on recommendations to satisfy ‘best practice environmental management’; and • Assess the adequacy of planned rehabilitation and closure costs.
THIS WEB PROOF INFORMATION PACK IS IN DRAFT FORM. The information contained herein is incomplete and subject to change and it must be read in conjunction with the section headed ‘‘Warning’’on the cover of this Web Proof Information Pack.

KAZZINC LTD Competent Person’s Report for the assets held by Kazzinc Ltd in both Kazakhstan and Russia
61‐0795/MM February 2011
Draft V 0.10 Page 46
2 OVERVIEW OF THE ASSETS 2.1 Introduction This CPR covers all the main project technical areas including geology, resources, mining methods, processing, infrastructure, markets, Capex, Opex and environmental. The core assets form the basis of the CPR and comprise the following assets as shown in Figure 2.1 and Figure 2.2 below.
Figure 2.1: Location of Kazzinc Assets in Kazakhstan
(Note: Ridder‐Sokolniy & Satellites includes: Ridder‐Sokolniy Mine, Tishinskiy Mine, Shubinskiy Mine; Dolinnoe, Obruchevskoe and Chekmar advanced exploration projects; and Staroye and Chashinskoye TMF’s
and Tishinskiy Slime Ponds)
THIS WEB PROOF INFORMATION PACK IS IN DRAFT FORM. The information contained herein is incomplete and subject to change and it must be read in conjunction with the section headed ‘‘Warning’’on the cover of this Web Proof Information Pack.
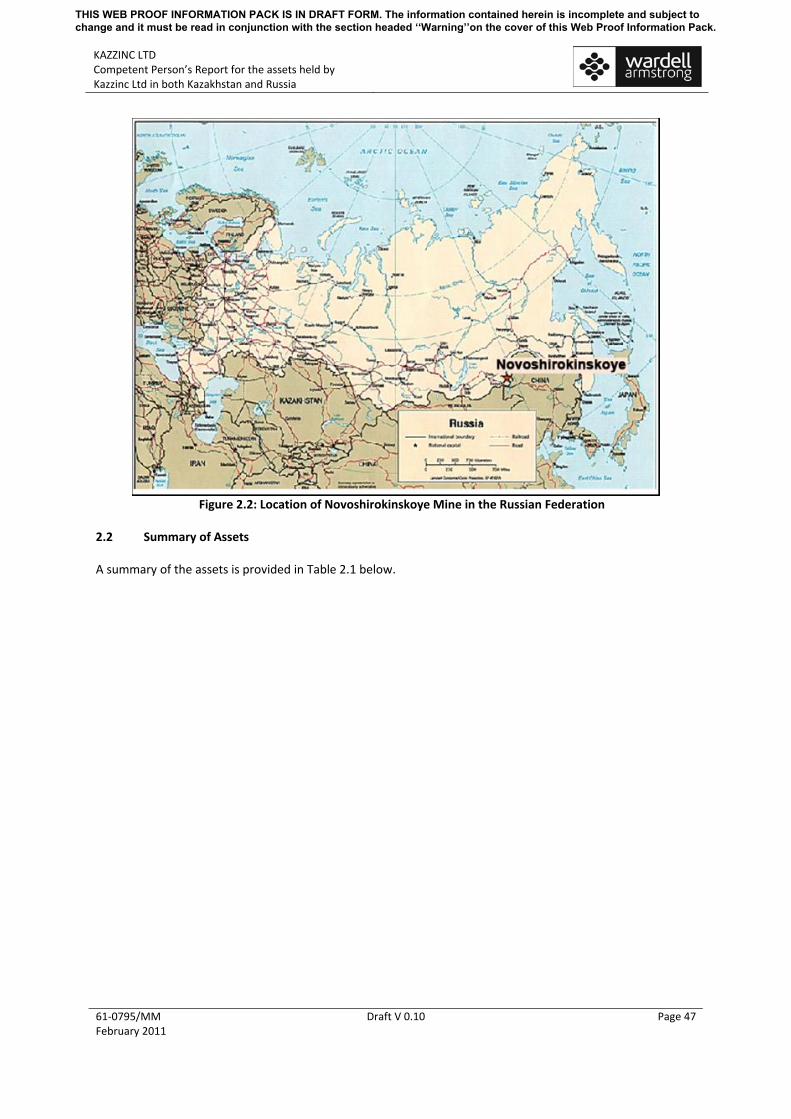
KAZZINC LTD Competent Person’s Report for the assets held by Kazzinc Ltd in both Kazakhstan and Russia
61‐0795/MM February 2011
Draft V 0.10 Page 47
Figure 2.2: Location of Novoshirokinskoye Mine in the Russian Federation
2.2 Summary of Assets A summary of the assets is provided in Table 2.1 below.
THIS WEB PROOF INFORMATION PACK IS IN DRAFT FORM. The information contained herein is incomplete and subject to change and it must be read in conjunction with the section headed ‘‘Warning’’on the cover of this Web Proof Information Pack.

KAZZINC LTD Competent Person’s Report for the assets held by Kazzinc Ltd in both Kazakhstan and Russia
61‐0795/MM February 2011
Draft V 0.10 Page 48
Table 2.1: Summary of Assets ‐ Kazakstan Licence
Asset Holder Interest Status Expiry Date
Area (km²)
Comments
Vasilkovskoye Deposit Contract No.1185 dd.
07.07.2003 Kazzinc 100% Mining 07 July 2025 28.3
Valid for 20 years Permit for mining to depth
of 660m Maleevskoye Deposit Contract No.95 dd
21.05.1997 Kazzinc 100% Mining 21 May 2022 7.703
Valid for 25 years Permit for mining to depth
of 1,100m Ridder‐Sokolniy Deposit
Contract No.91 dd. 21.05.1997
Kazzinc 100% Mining 21 May 2022 8.558 Valid for 25 years
Permit for mining to depth of Level 18
Ridder‐Sokolniy Deposit Contract No.91 dd.
21.05.1997 Kazzinc 100% Mining 21 May 2022 11.5
Valid for 25 years Permit for mining to depth
of Level 24 Ridder‐Sokolniy Deposit
Contract No.91 dd. 21.05.1997
Kazzinc Exploration 21 May 2022 12.1
Tishinskiy Deposit Contract No.92 dd.
21.05.1997 Kazzinc 100% Mining 21 May 2022 3.8k
Valid for 25 years Permit for mining to depth
of 590m Shubinsky Deposit
Contract No. 1296 dd. 30.12.2003
Kazzinc (indirectly through TOO Shubinskiy)
100% Mining 7 April 2015 0.97 Valid for 25 years
Permit for mining to depth of 510m
Staroye TMF Contract No.559 dd.
07.11.2000 Kazzinc 100% Mining
07 November 2030
0.615
Valid for 30 years
Permit for mining to a depth of 14m
Chasinskoye TMF Contract No.559 dd.
07.11.2000 Kazzinc 100% Mining
07 November 2030
2.65 Valid for 30 years
Permit for mining to a depth of 60m
Slimesdumps No.1 and No.2 Contract No.2693
dd. 19.06.2008 Kazzinc 100% Mining 19 May 2013 0.3
Valid for 30 (5) years Permit for mining to a
depth of 12m Shaimerden Deposit Contract No.298 dd.
04.03.1999
Kazzinc (indirectly through Shaimerden JSC)
100% Mining 04 March 2024 3.23 Valid for 25 years
Permit for mining to depth of 245m
Dolinnoe Contract No.2450 dd. 20.08.2007
Kazzinc 100% Exploration 20 August 2026 3.3 Valid for 19 years
Permit for mining to depth of 520m
Obruchevskoe Contract 450 dd. 20.08.2007
Kazzinc 100% Exploration 20 August 2026 1.61 Valid for 19 years
Permit for mining to depth of 1,015m
Novoshirokinskoye Deposit Licence ЧИТ
12697 ТЭ dd. 30.09.2004
Kazzinc (indirectly through
OAD Novoshirokinskoye
Rudnik)
48.3% Mining 01 October
2024 1.4
Valid for 20 years Permit for mining to depth
of 660m
Note: The Chekmar subsoil use contract is expected to be finalised and registered with the relevant Kazakhstan authority by the end of 2011. The Chekmar mining plan, which was submitted by Kazzinc to the relevant Kazakhstan authority, is currently going through the approval process. As of [•] 2011, those Mineral resources estimated in accordance with the guidelines of the JORC Code (2004) held by Kazzinc in Kazakhstan and Russia are provided in Table 2.2, whilst Ore reserves estimated in
THIS WEB PROOF INFORMATION PACK IS IN DRAFT FORM. The information contained herein is incomplete and subject to change and it must be read in conjunction with the section headed ‘‘Warning’’on the cover of this Web Proof Information Pack.

KAZZINC LTD Competent Person’s Report for the assets held by Kazzinc Ltd in both Kazakhstan and Russia
61‐0795/MM February 2011
Draft V 0.10 Page 49
accordance with the the guidelines of the JORC Code (2004) and derived from these are given in Table 2.3 and Table 2.4Table 2.3 below.
THIS WEB PROOF INFORMATION PACK IS IN DRAFT FORM. The information contained herein is incomplete and subject to change and it must be read in conjunction with the section headed ‘‘Warning’’on the cover of this Web Proof Information Pack.

KAZZINC LTD Competent Person’s Report for the assets held by Kazzinc Ltd in both Kazakhstan and Russia
61‐0795/MM February 2011
Draft V 0.10 Page 50
Table 2.2: Summary of all Kazzinc Mineral Resource Estimates (WAI 01.01.2011)
(In Accordance with the Guidelines of the JORC Code (2004)) Gold (Au) Silver (Ag) Copper (Cu) Lead (Pb) Zinc (Zn) Deposit Resources Cut Off
Grade Date Tonnes
(Mt) Grade (g/t) Metal Content (oz)
Grade (g/t)
Metal Content (oz) Grade (%)
Metal Content (t)
Grade (%)
Metal Content (t)
Grade (%)
Metal Content (t)
Measured 45.23 1.75 2,550,552 Indicated 141.56 1.72 7,840,344
Measured + Indicated 186.80 1.73 10,390,893 Inferred 99.08 1.77 5,650,405
Vasilkovskoye
Total
0.4 g/t Au 01 January
2011
285.87 1.74 16,041,301 Measured 12.92 0.62 257,917 77.74 32,299,948 2.39 307,852 1.13 146,601 6.92 894433 Indicated 11.03 0.56 200,354 64.82 22,987,359 1.95 215,144 1.15 127,182 6.82 752050
Measured + Indicated 23.96 0.59 458,271 71.79 55,287,307 2.19 522,966 1.14 273,783 6.87 1,646,483 Inferred 4.87 0.25 38,756 47.79 7,438,836 0.97 47,632 1.58 76794 4.99 243133
Maleevskoye
Total
n/a 01 January
2011
28.83 0.53 497,027 67.73 62,726,143 1.98 570,598 1.21 350,577 6.56 1,889,616 Measured 2.43 4.43 345,395 87.74 6,840,843 3.43 83,179 1.47 35,648 Indicated 4.64 4.30 641,022 94.82 14,135,204 3.07 142,347 1.15 53,322
Measured + Indicated 7.06 4.34 985,356 92.39 20,976,337 3.19 225,270 1.26 88,978 Inferred 1.51 2.08 100,985 57.02 2,768,726 2.44 36,851 1.81 27,336
Novoshirokinskoye
Total
3g/t AuEq 01 January
2011
8.57 3.94 1,086,341 86.18 23,745,063 3.06 262,121 1.36 116,314 Measured Indicated 1.63 22.33 364,100
Measured + Indicated 1.63 22.33 364,100 Inferred
Shaimerden (Stockpiles)
Total
n/a 01 January
2011
1.63 22.33 364,100 Measured 21.23 0.60 412,348 9.02 6,153,840 0.587 124,635 1.00 212,031 4.71 1,000,316 Indicated 7.01 0.46 103,607 9.75 2,072,238 0.446 31,289 0.95 66,298 4.35 304,634
Measured + Indicated 28.24 0.57 515,956 9.20 8,226,078 0.552 155,924 0.99 278,329 4.62 1,304,950 Inferred 5.19 0.33 55,131 11.94 2,379,670 0.554 28,748 1.36 70,285 4.46 231,443
Tishinskiy
Total
2.2% ZnEq 01 January
2011
33.43 0.53 571,087 9.87 10,605,748 0.553 184,672 1.04 348,614 4.60 1,536,393 Measured 1.68 3.73 201 36.76 1,983 0.2 3,292 0.74 12,381 1.41 23,625 Indicated 3.74 2.86 344 33.17 3,983 0.15 5,499 0.6 22,271 1.08 40,377
Measured + Indicated 5.41 3.13 543 34.28 5,966 0.16 8,791 0.64 34,652 1.18 64,002 Inferred 9.03 2.09 284 25.46 7,388 0.14 13,077 0.52 47,372 1 89,916
Dolinnoe
Total
1.7% ZnEq 01 January
2011
14.44 2.46 1,158 28.81 13,558 0.15 21,868 0.56 82,024 1.05 153,918 Measured 1,154 1.62 60,105 40.68 1,509,308 0.88 10,155 4.02 46,391 8.87 102,360 Indicated 7,783 0.67 167,654 25.36 6,345,814 0.73 56,816 1.78 138,537 4.64 361,131
Measured + Indicated 8,937 0.79 226,992 27.34 7,855,636 0.75 67,028 2.07 184,996 5.18 462,937 Inferred 5,500 0.50 88,415 24.97 4,415,423 0.41 22,550 0.64 35,200 1.75 96,250
Obruchevskoe
Total
1.7% ZnEq 01 January
2011
14,437 0.68 315,407 26.44 12,271,059 0.62 89,578 1.53 220,196 3.87 559,187 Measured 0.00 0.00 0.00 0.00 0.00 0.00 0.00 0.00 0.00 0.00 0.00 Chashinskoye
Tailing Dam Indicated n/a 01 January
2011 57.80 0.67 1,245,068 5.16 9,588,882 0.05 28,900 0.15 86,700 0.38 219,640
THIS WEB PROOF INFORMATION PACK IS IN DRAFT FORM. The information contained herein is incomplete and subject to change and it must be read in conjunction with the section headed ‘‘Warning’’on the cover of this Web Proof Information Pack.

KAZZINC LTD Competent Person’s Report for the assets held by Kazzinc Ltd in both Kazakhstan and Russia
61‐0795/MM February 2011
Draft V 0.10 Page 51
Measured + Indicated 57.80 0.67 1,245,068 5.16 9,588,882 0.05 28,900 0.15 86,700 0.38 219,640 Inferred 30.00 0.50 482,238 4.57 4,407,655 0.06 18,000 0.19 57,000 0.45 135,000
Total 87.80 0.61 1,727,306 4.96 13,996,537 0.05 43,900 0.16 131,700 0.40 333,640 Measured Indicated 0.33 0.33 3,536 9.96 106,407 0.22 733 0.76 2,533 2.46 8,199
Measured + Indicated 0.33 0.33 3,536 9.96 106,407 0.22 733 0.76 2,533 2.46 8,199 Inferred 0.04 0.58 835 8.73 12,574 0.23 103 0.56 251 2.64 1,183
Tishinskiy Tailing Dam
Total
n/a 01 January
2011
0.38 0.36 4,372 9.79 118,981 0.22 836 0.74 2,784 2.48 9,382 Measured Indicated 0.82 2.01 53,266 18.78 497,680 0.05 412 0.48 3,956 1.11 9,149
Measured + Indicated 0.82 2.01 53,266 18.78 497,680 0.05 412 0.48 3,956 1.11 9,149 Inferred 5.90 0.91 172,592 11.16 2,116,618 0.04 2,360 0.3 17,697 0.63 37,164
Staroye Tailing Dam
Total
n/a 01 January
2011
6.72 1.04 225,858 12.09 2,614,297 0.04 2,772 0.32 21,654 0.69 46,314 Measured 30.21 1.11 1,076,497 11.73 11,394,749 0.64 29,475 0.40 119,385 0.91 273,897 Indicated 67.91 1.55 3,397,959 10.74 23,454,050 0.38 113,198 0.40 269,542 0.95 645,031
Measured + Indicated 98.12 1.42 4,474,456 11.05 34,848,799 0.46 142,675 0.40 388,927 0.94 918,928 Inferred 6.64 0.83 178,004 9.09 1,940,024 0.29 13,386 0.59 39,365 1.12 74,187
Ridder‐Sokolniy
Total
1.7%
ZnEq for
PbZn ore
and 0.6%
CuEq for
Cu Ore
01 January 2011
104.76 1.38 4,652,459 10.92 36,788,824 0.45 156,061 0.41 428,292 0.95 993,115
Gold plus other metals expressed in ‘equivalent ounces’ of gold use a conversion ratio dependent on prevailing gold and metal prices, or as stated. Zinc equivalent is the zinc grade plus other metals in equivalent units, using a conversion ratio dependent on prevailing zinc and other metal prices, or those stated. Metal content is based on tonnage and grade with no account of mining losses and dilution, and metallurgical recoveries.
THIS WEB PROOF INFORMATION PACK IS IN DRAFT FORM. The information contained herein is incomplete and subject to change and it must be read in conjunction with the section headed ‘‘Warning’’on the cover of this Web Proof Information Pack.

KAZZINC LTD Competent Person’s Report for the assets held by Kazzinc Ltd in both Kazakhstan and Russia
61‐0795/MM February 2011
Draft V 0.10 Page 52
Table 2.3:Kazzinc Mineral Resources Ridder Sokolniy Mine
(WAI 01.01.2011) (In Accordance with the Guidelines of the JORC Code (2004)
Gold (Au) Silver (Ag) Copper (Cu) Lead (Pb) Zinc (Zn)
Deposit Resources Cut Off
Grade Date
Tonnes
(Mt) Grade
(g/t)
Metal
Content
(oz)
Grade (g/t) Metal Content
(oz)
Grade
(%)
Metal
Content
(t)
Grade
(%)
Metal
Content
(t)
Grade
(%)
Metal
Content
(t)
Measured 20.09 1.00 648,768 8.43 5,446,956 0.9 18,020 0.31 6,1480 0.8 160,800 Indicated 36.21 1.23 1,437,071 8.46 9,847,050 0.44 15,950 0.36 130,750 0.85 308,310 Measured + Indicated 56.30 1.15 2,085,839 8.45 15,294,006 0.60 33,970 0.34 192,230 0.83 469,110
Inferred 1.53 0.83 40,763 3.74 183,365 0.45 690 0.15 2,320 0.71 10,880
Centralniy
Total
1.7% ZnEq for PbZn ore and 0.6% CuEq for Cu
ore
01‐Jan‐11
57.83 1.14 2,126,602 8.33 15,477,371 0.60 34,660 0.34 194,550 0.83 479,990 Measured ‐ ‐ ‐ ‐ ‐ ‐ ‐ ‐ ‐ ‐ ‐ Indicated 16.98 2.72 1,486,264 12.29 6,711,147 0.28 48,064 0.42 71,510 0.90 152,812 Measured + Indicated 16.98 2.72 1,486,264 12.29 6,711,147 0.28 48,064 0.42 71,510 0.90 152,812 Inferred 0.04 1.53 1,768 3.44 3,922 0.18 63 0.15 53 0.33 118
Bystrushinskoe
Total
1.7% ZnEq for PbZn ore and 0.6% CuEq for Cu
ore
01‐Jan‐11
17.02 2.72 1,488,032 12.28 6,715,069 0.28 48,127 0.42 71,563 0.90 152,930 Measured ‐ ‐ ‐ ‐ ‐ ‐ ‐ ‐ ‐ ‐ ‐ Indicated 1.75 1.26 70,796 5.63 317,328 1.02 17,890 0.29 5,140 1.08 18,868 Measured + Indicated 1.75 1.26 70,796 5.63 317,328 1.02 17,890 0.29 5,140 1.08 18,868 Inferred 0.09 2.46 7,106 6.90 19,997 0.86 776 0.29 264 1.03 925
Bystrushinskoe North Flank
Total
1.7% ZnEq for PbZn ore and 0.6% CuEq for Cu
ore
01‐Jan‐11
1.84 1.31 77,902 5.69 337,325 1.01 18,666 0.29 5,404 1.07 19,793 Measured 3.76 1.26 152,331 18.98 2,294,630 0.09 3,384 0.47 17,670 0.98 36,850 Indicated 4.77 1.11 170,126 16.85 2,582,538 0.08 3,814 0.41 19,550 0.85 40,520 Measured + Indicated 8.53 1.18 322,456 17.79 4,877,168 0.08 7,200 0.44 37,220 0.91 77,370 Inferred 0.52 0.88 14,669 23.42 390,393 0.28 1,450 0.32 1,660 0.90 4,670
Belkina_RSM_WA
Total
1.7% ZnEq 01‐Jan‐11
9.05 1.16 337,125 18.11 5,267,561 0.10 8,650 0.43 38,880 0.91 82,040 Measured 4.59 1.55 228,476 16.01 2,359,940 0.13 5,960 0.57 26,130 1.07 49,060 Indicated 3.94 1.36 172,076 16.79 2,124,381 0.13 5,120 0.53 20,860 1.03 40,530 Measured + Indicated 8.52 1.46 400,552 16.37 4,484,321 0.13 11,080 0.55 46,990 1.05 89,590 Inferred 2.03 1.19 77,607 12.08 787,806 0.14 2,840 0.49 9,940 0.95 19,270
Perspectivnaya
Total
1.7% ZnEq 01‐Jan‐11
10.55 1.41 478,159 15.55 5,272,127 0.13 13,920 0.54 56,930 1.03 108,860
THIS WEB PROOF INFORMATION PACK IS IN DRAFT FORM. The information contained herein is incomplete and subject to change and it must be read in conjunction with the section headed ‘‘Warning’’on the cover of this Web Proof Information Pack.

KAZZINC LTD Competent Person’s Report for the assets held by Kazzinc Ltd in both Kazakhstan and Russia
61‐0795/MM February 2011
Draft V 0.10 Page 53
Measured ‐ ‐ ‐ ‐ ‐ ‐ ‐ ‐ ‐ ‐ ‐ Indicated 0.29 1.36 12,839 120.84 1,140,808 0.13 380 1.89 5,550 1.00 2,940 Measured + Indicated 0.29 1.36 12,839 120.84 1,140,808 0.13 380 1.89 5,550 1.00 2,940 Inferred 0.37 1.40 16,715 15.27 182,315 0.14 520 1.98 7,350 1.48 5,500
Sokolok
Total
1.7% ZnEq 01‐Jan‐11
0.67 1.38 29,554 61.94 1,323,123 0.14 900 1.94 12,900 1.27 8,440 Measured ‐ ‐ ‐ ‐ ‐ ‐ ‐ ‐ ‐ ‐ ‐ Indicated 0.32 0.18 1,867 2.48 25,723 0.06 190 1.80 5,810 0.67 2,160 Measured + Indicated 0.32 0.18 1,867 2.48 25,723 0.06 190 1.80 5,810 0.67 2,160 Inferred 0.07 0.14 314 2.68 6,004 0.31 220 2.10 1,460 0.74 520
New Glubokaya
Total
1.7% ZnEq 01‐Jan‐11
0.39 0.17 2,181 2.51 31,727 0.10 410 1.85 7,270 0.68 2,680 Measured ‐ ‐ ‐ ‐ ‐ ‐ ‐ ‐ ‐ ‐ ‐ Indicated ‐ ‐ ‐ ‐ ‐ ‐ ‐ ‐ ‐ ‐ ‐ Measured + Indicated ‐ ‐ ‐ ‐ ‐ ‐ ‐ ‐ ‐ ‐ ‐ Inferred 0.51 0.10 1,640 1.48 24,277 0.08 410 1.91 9,740 0.83 4,230
Glubokaya
Total
1.7% ZnEq 01‐Jan‐11
0.51 0.10 1,640 1.48 24,277 0.08 410 1.91 9,740 0.83 4,230 Measured ‐ ‐ ‐ ‐ ‐ ‐ ‐ ‐ ‐ ‐ ‐ Indicated 3.14 0.31 31,104 3.49 352,551 0.68 21,281 0.22 6,975 2.31 72,368 Measured + Indicated 3.14 0.31 31,104 3.49 352,551 0.68 21,281 0.22 6,975 2.31 72,368 Inferred 1.16 0.18 6,855 3.18 118,984 0.51 5,958 0.40 4,620 2.07 24,083
Dalnaya
Total
1.7% ZnEq 01‐Jan‐11
4.30 0.27 37,959 3.41 471,535 0.63 27,239 0.27 11,595 2.24 96,451 Measured 1.78 0.82 46,922 22.60 1,293,223 0.12 2,111 0.79 14,105 1.53 27,187 Indicated 0.51 0.97 15,816 21.62 352,524 0.10 509 0.67 3,397 1.29 6,523 Measured + Indicated 2.29 0.85 62,739 22.38 1,645,747 0.12 2,620 0.76 17,502 1.48 33,710
Inferred 0.33 1.00 10,567 21.10 222,961 0.14 459 0.60 1,958 1.21 3,991
Zavodskaya
Total
1.7% ZnEq 01‐Jan‐11
2.62 0.87 73,305 22.22 1,868,709 0.12 3,079 0.74 19,460 1.44 37,701 Measured 30.21 1.11 1,076,497 11.73 11,394,749 0.64 29,475 0.40 119,385 0.91 273,897
Indicated 67.91 1.55 3,397,959 10.74 23,454,050 0.38 113,198 0.40 269,542 0.95 645,031 Measured + Indicated 98.12 1.42 4,474,456 11.05 34,848,799 0.46 142,675 0.40 388,927 0.94 918,928 Inferred 6.64 0.83 178,004 9.09 1,940,024 0.29 13,386 0.59 39,365 1.12 74,187
Ridder‐Sokolny Mine
Total
104.76 1.38 4,652,459 10.92 36,788,824 0.45 156,061 0.41 428,292 0.95 993,115
THIS WEB PROOF INFORMATION PACK IS IN DRAFT FORM. The information contained herein is incomplete and subject to change and it must be read in conjunction with the section headed ‘‘Warning’’on the cover of this Web Proof Information Pack.

KAZZINC LTD Competent Person’s Report for the assets held by Kazzinc Ltd in both Kazakhstan and Russia
61‐0795/MM February 2011
Draft V 0.10 Page 54
Table 2.4: Kazzinc Ore Reserve Estimates
(WAI 01.01.2011) (In Accordance with the Guidelines of the JORC Code (2004))
Gold (Au) Silver (Ag) Copper (Cu) Lead (pb) Zinc (Zn) Deposit Reserves Ore (Mt) Grade (g/t)
Metal Content (oz) Grade (g/t)
Metal Content (oz)
Grade (%)
Metal Content (t)
Grade (%)
Metal Content (t)
Grade (%)
Metal Content (t)
Proven 33.30 1.95 2,087,709 ‐ ‐ ‐ ‐ Probable 90.70 1.94 5,657,181 ‐ ‐ ‐ ‐ ‐ ‐ ‐ ‐
Vasilkovskoye
Total 127.80 1.94 7,971,199 ‐ ‐ ‐ ‐ ‐ ‐ ‐ ‐ Proven 5.042 0.56 90,779 68.13 11,044,289 1.92 96,770 1.00 50,358 6.46 325,627 Probable 7.061 0.51 115,777 56.23 12,764,963 1.69 119,630 1.04 73,522 6.29 444,011
Maleevskoye
Total 12.103 0.53 206,233 61.19 23,810,222 1.79 216,400 1.02 123,880 6.36 769,638 Proven 2.44 3.89 304,564 77.00 6,033,915 ‐ ‐ 2.98 72,601 1.28 31,089 Probable 4.43 3.89 552,992 84.30 12,001,085 ‐ ‐ 2.69 118,896 0.99 43,912
Novoshirokinskoye
Total 6.87 3.89 857,556 81.70 18,035,032 ‐ ‐ 2.79 191,498 1.09 75,000 Proven 8.940 0.91 262,779 12.85 3,693,712 0.43 38,038 0.32 28,587 0.73 65,195 Probable 12.049 1.03 339,349 8.44 3,269,230 0.22 26,153 0.37 44,920 0.70 84,476
Ridder‐Sokolniy
Total 20.989 0.98 662,127 10.32 6,962,941 0.31 64,188 0.35 73,505 0.71 149,671 Proven Probable 1.63 22.33 364,100
Shaimerden (Stockpiles)
Total 1.63 22.33 364,100 Proven 18.886 0.54 330,299 8.12 4,930,099 0.52 98,415 0.91 172,093 4.22 796,457 Probable 4.928 0.47 74,056 9.36 1,482,209 0.40 19,621 0.88 43,139 4.13 203,681
Tishinskiy
Total 23.814 0.53 405,782 8.38 6,415,955 0.50 119,068 0.90 214,323 4.20 1,000,174 Prove 1.164 3.99 149,222 50.14 1,876,491 0.21 2,499 0.75 8,711 1.50 17,438
Probable 0.923 3.36 99,851 46.27 1,373,112 0.18 1,660 0.72 6,622 1.28 11,837 Dolinnoe
Total 2.087 3.71 249,073 48.43 3,249,603 0.20 4,159 0.73 15,333 1.40 29,275 Proven 0.88 1.73 49,363 42.80 1,219,753 0.81 7,161 4.27 37,829 8.98 79,581 Probable 3.247 0.90 94,019 33.21 3,466,977 0.83 26,845 2.66 86,520 6.50 211,092
Obruchevskoe
Total 4.134 1.08 143,382 35.26 4,686,731 0.82 34,006 3.01 124,349 7.03 290,673 Proven ‐ ‐ ‐ ‐ ‐ ‐ ‐ ‐ ‐ ‐ ‐ Probable 55.53 0.70 1,245,070 5.37 9,588,896 0.05 28,900 0.16 86,700 0.40 219,640
Chashinskoye Tailing Dam
Total 55.53 0.70 1,245,070 5.37 9,588,896 0.05 28,900 0.16 86,700 0.40 219,640 Proven 0.00 ‐ ‐ ‐ ‐ ‐ ‐ ‐ ‐ ‐ ‐ Probable 0.32 0.33 3,410 9.89 101,790 0.22 710 0.76 3,420 2.44 7,820
Tishinskiy Tailing Dam
Total 0.32 0.33 3,410 9.89 101,790 0.22 710 0.76 3,420 2.44 7,820 Staroye Tailing Dam Proven 0.00 ‐ ‐ ‐ ‐ ‐ ‐ ‐ ‐ ‐ ‐
THIS WEB PROOF INFORMATION PACK IS IN DRAFT FORM. The information contained herein is incomplete and subject to change and it must be read in conjunction with the section headed ‘‘Warning’’on the cover of this Web Proof Information Pack.

KAZZINC LTD Competent Person’s Report for the assets held by Kazzinc Ltd in both Kazakhstan and Russia
61‐0795/MM February 2011
Draft V 0.10 Page 55
Probable 0.79 2.00 51,000 18.69 475,900 0.05 380 0.48 3,800 1.10 8.720 Total 0.79 2.00 51,000 18.69 475,900 0.05 380 0.48 3,800 1.10 8.720
THIS WEB PROOF INFORMATION PACK IS IN DRAFT FORM. The information contained herein is incomplete and subject to change and it must be read in conjunction with the section headed ‘‘Warning’’on the cover of this Web Proof Information Pack.

KAZZINC LTD Competent Person’s Report for the assets held by Kazzinc Ltd in both Kazakhstan and Russia
61‐0795/MM February 2011
Draft V 0.10 Page 56
2.3 Extraction Table Extraction tables for each of the deposits are shown in Table 2.5: Kazzinc Group Extraction to Table 2.17 below.
THIS WEB PROOF INFORMATION PACK IS IN DRAFT FORM. The information contained herein is incomplete and subject to change and it must be read in conjunction with the section headed ‘‘Warning’’on the cover of this Web Proof Information Pack.

KAZZINC LTD Competent Person’s Report for the assets held by Kazzinc Ltd in both Kazakhstan and Russia
61‐0795/MM February 2011
Draft V 0.10 Page 57
Table 2.5: Kazzinc Group Extraction 2008A 2009A 2010A 2011E 2012E 2013E 2014E 2015E Finished metal production capacity (tonnes) Zinc t 300,900 300,900 300,900 300,900 300,900 300,900 300,900 300,900 Lead t 168,000 168,000 168,000 168,000 168,000 168,000 168,000 168,000 Copper t 70,000 70,000 70,000 70,000 70,000 70,000 70,000 70,000 Gold oz 1,511,084 1,511,084 1,511,084 1,511,084 1,511,084 1,511,084 1,511,084 1,511,084 Silver oz 46,297,041 46,297,041 46,297,041 46,297,041 46,297,041 46,297,041 46,297,041 46,297,041 Finished metal actual / forecast production (tonnes) Total Zinc t 299,443 301,104 300,750 300,800 300,800 300,800 300,800 300,800 Lead t 90,240 79,041 100,789 99,249 160,135 169,054 171,848 171,523 Copper t 55,956 59,420 49,782 47,700 70,000 87,500 87,500 87,500 Gold oz 183,428 238,226 347,778 625,068 762,417 815,583 803,270 791,934 Silver oz 7,617,831 6,285,871 6,730,970 6,470,494 19,349,636 22,857,937 24,375,092 25,212,401 From own mines' concentrate Zinc t 261,904 226,853 239,050 259,543 194,925 222,917 210,477 150,387 Lead t 43,276 46,472 33,142 42,086 51,986 51,706 44,553 33,802 Copper t 55,956 57,324 47,955 45,308 30,945 31,456 29,813 19,593 Gold oz 179,293 232,674 326,315 619,663 542,061 541,726 560,994 523,720 Silver oz 5,312,570 5,335,199 5,182,404 5,899,184 5,221,692 4,815,430 4,573,657 3,093,167 From third party concentrate* Zinc t 37,538 74,251 61,700 41,257 105,875 77,883 90,323 150,413 Lead t 46,964 32,570 67,647 57,163 108,149 117,348 127,295 137,722 Copper t 0 2,096 1,827 2,392 39,055 56,044 57,687 67,907 Gold oz 4,135 5,552 21,463 5,405 220,357 273,857 242,277 268,214 Silver oz 2,305,262 950,672 1,548,566 571,310 14,127,944 18,042,507 19,801,434 22,119,234 Cash cost (excl. royalties, before by‐product revenues) (US$m)***
997 725 1,040 1,500 2,077 2,460 2,415 2,444
By‐products revenues (US$m) 411 368 542 491 523 552 477 495 Royalties (as a % market price)
THIS WEB PROOF INFORMATION PACK IS IN DRAFT FORM. The information contained herein is incomplete and subject to change and it must be read in conjunction with the section headed ‘‘Warning’’on the cover of this Web Proof Information Pack.

KAZZINC LTD Competent Person’s Report for the assets held by Kazzinc Ltd in both Kazakhstan and Russia
61‐0795/MM February 2011
Draft V 0.10 Page 58
Zinc 3.5% 7.00% 7.00% 7.00% 7.00% 7.00% 7.00% 7.00% Lead 3.5% 8.00% 8.00% 8.00% 8.00% 8.00% 8.00% 8.00% Copper 3.5% 5.70% 5.70% 5.70% 5.70% 5.70% 5.70% 5.70% Gold 4.0% 5.00% 5.00% 5.00% 5.00% 5.00% 5.00% 5.00% Silver 4.0% 5.00% 5.00% 5.00% 5.00% 5.00% 5.00% 5.00% Royalties (US$M) 19.054 67.71 101.61 123.77 105.37 116.47 119.41 86.12
Depreciation & amortisation (US$m) 116 147 236 Tax rate % 30.00% 20.00% 20.00% 20.00% 20.00% 20.00% 20.00% 20.00% Capex (US$m) 568** 367** 350** 345 299 190 174 312 Sustaining 243 248 164 139 208 Expansionary 102 51 26 35 104 Note:
* Kazzinc will purchase third party concentrate to load all available capacity in smelters.
**Kazzinc’s CapEx for 2008‐2010 excludes development loans to Novoshirokinskoe and VasGold in the amount of US$642 million (US$277 million in 2008, US$324 millionin 2009, and US$41 million in 2010)
***Cash cost calculations include the cost of purchased concentrates.
THIS WEB PROOF INFORMATION PACK IS IN DRAFT FORM. The information contained herein is incomplete and subject to change and it must be read in conjunction with the section headed ‘‘Warning’’on the cover of this Web Proof Information Pack.

KAZZINC LTD Competent Person’s Report for the assets held by Kazzinc Ltd in both Kazakhstan and Russia
61‐0795/MM February 2011
Draft V 0.10 Page 59
Table 2.6: Maleevskoye Deposit 2008A 2009A 2010A 2011E 2012E 2013 E 2014E 2015E Milled Capacity (tonnes) 2,250,000 2,250,000 2,250,000 2,250,000 2,250,000 2,250,000 2,250,000 2,250,000 Milled actual / forecast (tonnes) 2,216,329 2,357,243 2,230,246 2,250,000 2137000 2196000 1710000 822000 Grades (g/t) Zinc % 6.90 6.71 6.37 6.31 6.14 6.57 7.41 6.69 Lead % 1.14 1.00 0.99 0.97 1.66 1.6 1.5 1.4 Copper % 2.06 1.90 1.96 2.01 1 1 1.16 0.94 Gold г/т 0.61 0.57 0.56 0.55 0.48 0.42 0.64 0.5 Silver г/т 65.69 59.22 59.73 62.58 58.03 49.82 58.55 55.97 Concentrate produced (tonnes) Zn Conc dmt 248,148 257,050 229,644 225,739 212,647 233,822 205,353 89,122 Metals in concentrate (oz) Zinc t 137,603 141,601 126,616 127,087 117,435 129,128 113,406 49,218 Lead t 1,256 1,302 1,264 1,038 1,703 1,687 1,231 552 Copper t 2,144 2,052 2,230 1,672 791 813 734 286 Gold oz 3,379 3,495 3,151 2,396 1,979 1,779 2,111 793 Silver oz 274,968 297,461 277,138 247,569 219,310 193,481 177,062 81,363 Pb Conc dmt 33,318 31,452 28,462 29,564 49,214 48,745 35,585 15,965 Metals in concentrate (oz) Zinc t 2,632 2,669 2,485 2,513 2,321 2,552 2,241 973 Lead t 15,642 13,680 12,765 13,599 22,194 21,983 16,048 7,200 Copper t 773 1,177 1,015 579 274 282 254 99 Gold oz 1,353 2,113 1,704 2,289 1,888 1,698 2,014 756 Silver oz 867,105 969,074 878,877 1,066,158 970,770 856,437 783,759 360,153 Cu Conc dmt 155,254 166,036 157,137 158,225 77,402 79,539 71,846 27,986 Metals in concentrate (oz) Zinc t 4,687 5,240 4,853 3,501 3,233 3,555 3,122 1,355 Lead t 5,510 5,849 5,477 4,400 7,182 7,113 5,193 2,330 Copper t 39,126 37,798 36,730 38,917 18,407 18,915 17,085 6,655 Gold oz 14,920 15,134 12,687 12,760 10,526 9,464 11,230 4,217 Silver oz 3,015,129 2,696,398 2,640,619 2,630,407 2,320,573 2,047,266 1,873,532 860,925
THIS WEB PROOF INFORMATION PACK IS IN DRAFT FORM. The information contained herein is incomplete and subject to change and it must be read in conjunction with the section headed ‘‘Warning’’on the cover of this Web Proof Information Pack.

KAZZINC LTD Competent Person’s Report for the assets held by Kazzinc Ltd in both Kazakhstan and Russia
61‐0795/MM February 2011
Draft V 0.10 Page 60
Au Conc dmt 4,812 4,778 5,341 4,731 4,697 4,826 3,758 1,807 Metals in concentrate (oz) Zinc t 151 126 114 165 152 167 147 64 Lead t 347 295 377 438 715 709 517 232 Copper t 42 35 30 49 23 24 22 8 Gold oz 15,846 13,786 14,374 14,256 11,759 10,574 12,546 4,712 Silver oz 36,193 33,835 44,117 30,399 27,640 24,385 22,316 10,255 Cash cost (excl. royalties, before by‐product revenues) (US$m) 92.761 89.689 100.132 120.861 115.29 117.21 101.54 72.90 By‐products revenues (US$m) 323.437 271.330 388.541 342.359 Royalties (as a % of market price) Zinc 2.17% 7.00% 7.00% 7.00% 7.00% 7.00% 7.00% 7.00% Lead 1.95% 8.00% 8.00% 8.00% 8.00% 8.00% 8.00% 8.00% Copper 2.62% 5.70% 5.70% 5.70% 5.70% 5.70% 5.70% 5.70% Gold 2.07% 5.00% 5.00% 5.00% 5.00% 5.00% 5.00% 5.00% Silver 1.56% 5.00% 5.00% 5.00% 5.00% 5.00% 5.00% 5.00% Total Royalty (US$M) 16.796 37.458 52.252 47.959 42.79 43.89 37.31 15.45
THIS WEB PROOF INFORMATION PACK IS IN DRAFT FORM. The information contained herein is incomplete and subject to change and it must be read in conjunction with the section headed ‘‘Warning’’on the cover of this Web Proof Information Pack.

KAZZINC LTD Competent Person’s Report for the assets held by Kazzinc Ltd in both Kazakhstan and Russia
61‐0795/MM February 2011
Draft V 0.10 Page 61
Table 2.7: Vasilkovskoye Deposit 2008A 2009A 2010A 2011E 2012E 2013 E 2014E 2015E Milled Capacity (tonnes) 3,520,650 8,000,000 8,000,000 8,000,000 8,000,000 8,000,000 Milled actual / forecast (tonnes) 3,520,650 7,470,000 8,000,000 8,000,000 8,000,000 8,000,000 Grades (g/t) Gold 1.93 2.19 2.03 2.05 2.11 1.97 Concentrate produced (tonnes) 977 0 0 0 0 0 Metals in concentrate (oz) Gold 5,977 0 0 0 0 0 Alloy Doré (tonnes) 4.954 14.587 Metals (oz) Gold 117,982 402,296 365,490 369,091 379,893 354,687 Cash cost (excl. royalties, before by‐product revenues) (US$m) US$m 106.932 165.389 165.32 165.34 165.36 165.38 By‐products revenues (US$m) 0 0 0 0 0 0 Royalties (as a % of market price) Gold 5% 5% 5% 5% 5% 5% Total Royalty (US$M) 15.167 31.625 23.64 23.75 24.32 22.59
THIS WEB PROOF INFORMATION PACK IS IN DRAFT FORM. The information contained herein is incomplete and subject to change and it must be read in conjunction with the section headed ‘‘Warning’’on the cover of this Web Proof Information Pack.

KAZZINC LTD Competent Person’s Report for the assets held by Kazzinc Ltd in both Kazakhstan and Russia
61‐0795/MM February 2011
Draft V 0.10 Page 62
Table 2.8: Ridder Sokolniy Deposit
2008A 2009A 2010A 2011E 2012E 2013 E 2014E 2015E Milled Capacity (tonnes) 2,354,000 2,150,000 2,300,000 2,125,000 2,125,000 2,125,000 2,125,000 2,125,000
Milled actual / forecast (tonnes) 2,126,780 2,086,024 2,036,102 2,125,000 2,125,000 2,125,000 2,125,000 2,125,000
Grades (g/t)
Zinc 0.51 0.46 0.52 0.47 0.71 0.71 0.71 0.71 Lead 0.25 0.24 0.27 0.20 0.35 0.35 0.35 0.35
Copper 0.23 0.34 0.30 0.35 0.31 0.31 0.31 0.31 Gold 1.98 2.22 2.23 1.99 0.98 0.98 0.98 0.98 Silver 10.35 7.78 13.10 13.98 10.35 10.35 10.35 10.35
Concentrate produced (tonnes)
Zn Conc dmt 10,515 8,452 8,947 8,802 13,366 13,366 13,366 13,366
Metals in concentrate (oz) Zinc t 5,904 4,590 4,858 4,753 7,217 7,217 7,217 7,217 Lead t 120 140 247 110 196 196 196 196
Copper t 144 278 294 256 226 226 226 226 Gold oz 2,018 2,159 2,137 2,395 1,180 1,180 1,180 1,180 Silver oz 27,603 20,674 34,083 37,134 27,495 27,495 27,495 27,495
Pb Conc dmt 0 0 0 20,588 17,700 17,700 17,700 17,700
Metals in concentrate (oz) Zinc t 0 0 0 1,222 1,380 1,380 1,380 1,380 Lead t 0 0 0 2,633 4,850 4,850 4,850 4,850
Copper t 0 0 0 519 690 690 690 690 Gold oz 0 0 0 19,798 10,084 10,084 10,084 10,084 Silver oz 0 0 0 256,434 177,788 177,788 177,788 177,788
Cu Conc dmt 5,484 24,393 24,341 27,777 24,505 24,505 24,505 24,505
Metals in concentrate (oz) Zinc t 166 552 751 853 1,295 1,295 1,295 1,295
THIS WEB PROOF INFORMATION PACK IS IN DRAFT FORM. The information contained herein is incomplete and subject to change and it must be read in conjunction with the section headed ‘‘Warning’’on the cover of this Web Proof Information Pack.

KAZZINC LTD Competent Person’s Report for the assets held by Kazzinc Ltd in both Kazakhstan and Russia
61‐0795/MM February 2011
Draft V 0.10 Page 63
Lead t 65 234 974 304 543 543 543 543 Copper t 1,351 2,891 2,710 5,768 5,089 5,089 5,089 5,089 Gold oz 1,149 10,744 17,036 34,871 17,183 17,183 17,183 17,183 Silver oz 18,792 48,960 124,070 409,761 303,397 303,397 303,397 303,397
Au Conc dmt 30,805 36,988 32,055 8,170 7,208 7,208 7,208 7,208
Metals in concentrate (oz) Zinc t 2,305 1,988 2,420 455 691 691 691 691 Lead t 4,154 3,262 3,458 327 584 584 584 584
Copper t 2,765 2,835 2,215 185 163 163 163 163 Gold oz 83,801 72,718 70,317 31,463 15,504 15,504 15,504 15,504 Silver oz 486,102 304,866 542,346 79,830 59,108 59,108 59,108 59,108
Ore Flux dmt 44,470 60,316 59,820 104,394 65,433 65,433 65,433 65,433
Metals in concentrate (oz) Zinc t 365 351 401 417 411 411 411 411 Lead t 132 147 223 268 196 196 196 196
Copper t 110 274 369 227 242 242 242 242 Gold oz 28,332 52,012 37,906 34,444 38,174 38,174 38,174 38,174 Silver oz 13,908 26,818 37,700 28,431 26,714 26,714 26,714 26,714
Cash cost (excl. royalties, before by‐product
revenues) (US$m) 86.267 65.164 89.981 112.021 112.032 112.032 112.032 112.032
By‐products revenues (US$m) 26.878 32.355 50.701 47.177
Royalties (as a % of market price)
Zinc 0.27% 7.00% 7.00% 7.00% 7.00% 7.00% 7.00% 7.00% Lead 0.21% 8.00% 8.00% 8.00% 8.00% 8.00% 8.00% 8.00%
Copper 0.27% 5.70% 5.70% 5.70% 5.70% 5.70% 5.70% 5.70% Gold 0.16% 5.00% 5.00% 5.00% 5.00% 5.00% 5.00% 5.00% Silver 0.16% 5.00% 5.00% 5.00% 5.00% 5.00% 5.00% 5.00%
Total Royalty (US$M) 0.388 10.889 13.104 13.343 11.996 11.719 11.456 11.202
THIS WEB PROOF INFORMATION PACK IS IN DRAFT FORM. The information contained herein is incomplete and subject to change and it must be read in conjunction with the section headed ‘‘Warning’’on the cover of this Web Proof Information Pack.

KAZZINC LTD Competent Person’s Report for the assets held by Kazzinc Ltd in both Kazakhstan and Russia
61‐0795/MM February 2011
Draft V 0.10 Page 64
Table 2.9: Tishinskiy Deposit 2008A 2009A 2010A 2011E 2012E 2013 E 2014E 2015E Milled Capacity (tonnes) 1,400,000 1,187,500 1,330,000 1,330,000 1,330,000 1,330,000 1,330,000 1,330,000 Milled actual / forecast (tonnes) 1,421,038 1,262,510 1,476,486 1,330,000 1,187,500 1,187,500 1,187,500 1,187,500 Grades (g/t) Zinc 5.01 5.23 4.61 4.81 5.08 5.08 5.08 5.08 Lead 0.72 0.79 0.63 0.55 0.57 0.57 0.57 0.57 Copper 0.40 0.43 0.41 0.38 0.35 0.35 0.35 0.35 Gold 0.81 0.87 0.82 0.78 0.70 0.65 0.65 0.60 Silver 10.06 10.83 9.69 9.00 9.00 9.00 9.00 9.00 Concentrate produced (tonnes) Zn Conc dmt 115,908 110,061 113,758 106,918 99,834 99,834 99,834 99,834 Metals in concentrate (oz) Zinc t 64,703 61,234 60,956 58,245 54,924 54,924 54,924 54,924 Lead t 1,352 1,497 1,654 1,136 1,060 1,060 1,060 1,060 Copper t 605 498 784 573 477 477 477 477 Gold oz 9,369 8,974 10,742 8,578 6,873 6,382 6,382 5,891 Silver oz 166,658 172,497 181,645 144,389 133,315 133,315 133,315 133,315 Pb Conc dmt 9,839 9,649 8,747 6,827 6,583 6,583 6,583 6,583 Metals in concentrate (oz) Zinc t 762 758 820 660 622 622 622 622 Lead t 6,993 6,821 5,700 4,693 4,541 4,541 4,541 4,541 Copper t 80 84 121 72 52 52 52 52 Gold oz 3,784 3,274 3,659 2,733 2,190 2,033 2,033 1,877 Silver oz 85,065 81,292 69,038 56,585 52,245 52,245 52,245 52,245 Cu Conc dmt 15,453 15,211 15,458 13,268 11,322 11,322 11,322 11,322 Metals in concentrate (oz) Zinc t 881 837 950 896 845 845 845 845 Lead t 350 409 434 288 269 269 269 269 Copper t 4,357 4,020 4,363 3,754 3,127 3,127 3,127 3,127 Gold oz 8,938 8,644 9,172 8,552 6,853 6,363 6,363 5,874 Silver oz 89,662 91,003 88,149 70,249 62,844 62,844 62,844 62,844 Au Conc dmt 445 1,247 421 1,851 753 753 753 753
THIS WEB PROOF INFORMATION PACK IS IN DRAFT FORM. The information contained herein is incomplete and subject to change and it must be read in conjunction with the section headed ‘‘Warning’’on the cover of this Web Proof Information Pack.

KAZZINC LTD Competent Person’s Report for the assets held by Kazzinc Ltd in both Kazakhstan and Russia
61‐0795/MM February 2011
Draft V 0.10 Page 65
Metals in concentrate (oz) Zinc t 25 117 35 72 72 72 72 72 Lead t 81 158 68 85 84 84 84 84 Copper t 6 79 13 24 22 22 22 22 Gold oz 839 2,051 762 4,463 3,682 3,419 3,419 3,156 Silver oz 1,807 4,798 1,604 3,537 3,381 3,381 3,381 3,381 Cash cost (excl. royalties, before by‐product revenues) (US$m) 81.852 50.674 72.105 86.782 77.93 77.93 77.93 77.93 By‐products revenues (US$m) 46.538 42.266 64.228 54.842 Royalties (as a % of market price) Zinc 0.74% 7.00% 7.00% 7.00% 7.00% 7.00% 7.00% 7.00% Lead 0.57% 8.00% 8.00% 8.00% 8.00% 8.00% 8.00% 8.00% Copper 0.74% 5.70% 5.70% 5.70% 5.70% 5.70% 5.70% 5.70% Gold 0.44% 5.00% 5.00% 5.00% 5.00% 5.00% 5.00% 5.00% Silver 0.44% 5.00% 5.00% 5.00% 5.00% 5.00% 5.00% 5.00% Total Royalty (US$M) 1.40 12.94 16.34 14.19 14.23 13.76 13.39 12.94
THIS WEB PROOF INFORMATION PACK IS IN DRAFT FORM. The information contained herein is incomplete and subject to change and it must be read in conjunction with the section headed ‘‘Warning’’on the cover of this Web Proof Information Pack.

KAZZINC LTD Competent Person’s Report for the assets held by Kazzinc Ltd in both Kazakhstan and Russia
61‐0795/MM February 2011
Draft V 0.10 Page 66
Table 2.10: Shubinskiy Deposit
2008A 2009A 2010A 2011E 2012E 2013 E 2014E 2015E Milled Capacity (tonnes) 190,000 200,000 190,000 190,000 190,000 190,000 190,000 190,000 Milled actual / forecast (tonnes) 179,457 211,650 194,414 190,000 190,000 190,000 190,000 190,000 Grades (g/t) Zinc 1.66 1.74 1.65 1.66 1.66 1.66 1.66 1.66 Lead 0.19 0.23 0.22 0.23 0.23 0.23 0.23 0.23 Copper 1.15 1.37 0.91 1.00 1.00 1.00 1.00 1.00 Gold 0.54 0.72 0.55 0.31 0.31 0.31 0.31 0.31 Silver 12.49 13.94 11.51 8.48 8.48 8.48 8.48 8.48 Concentrate produced (tonnes) Zn Conc dmt 4,947 6,331 5,709 5,196 5,316 5,316 5,316 5,316 Metals in concentrate (oz) Zinc t 2,333 2,873 2,432 2,400 2,395 2,395 2,395 2,395 Lead t 37 57 43 53 53 53 53 53 Copper t 116 179 127 171 171 171 171 171 Gold oz 211 330 218 132 134 134 134 134 Silver oz 9,226 12,782 9,091 6,494 6,491 6,491 6,491 6,491 Cu Conc dmt 8,084 11,290 6,593 7,025 7,000 7,000 7,000 7,000 Metals in concentrate (oz) Zinc t 303 367 330 302 301 301 301 301 Lead t 249 368 312 310 307 307 307 307 Copper t 1,821 2,526 1,475 1,568 1,570 1,570 1,570 1,570 Gold oz 885 1,388 739 402 408 408 408 408 Silver oz 33,364 42,870 39,989 24,049 24,037 24,037 24,037 24,037 Au Conc dmt 13 44 0 0 0 0 0 0 Metals in concentrate (oz) Zinc t 0 1 0 0 0 0 0 0
THIS WEB PROOF INFORMATION PACK IS IN DRAFT FORM. The information contained herein is incomplete and subject to change and it must be read in conjunction with the section headed ‘‘Warning’’on the cover of this Web Proof Information Pack.
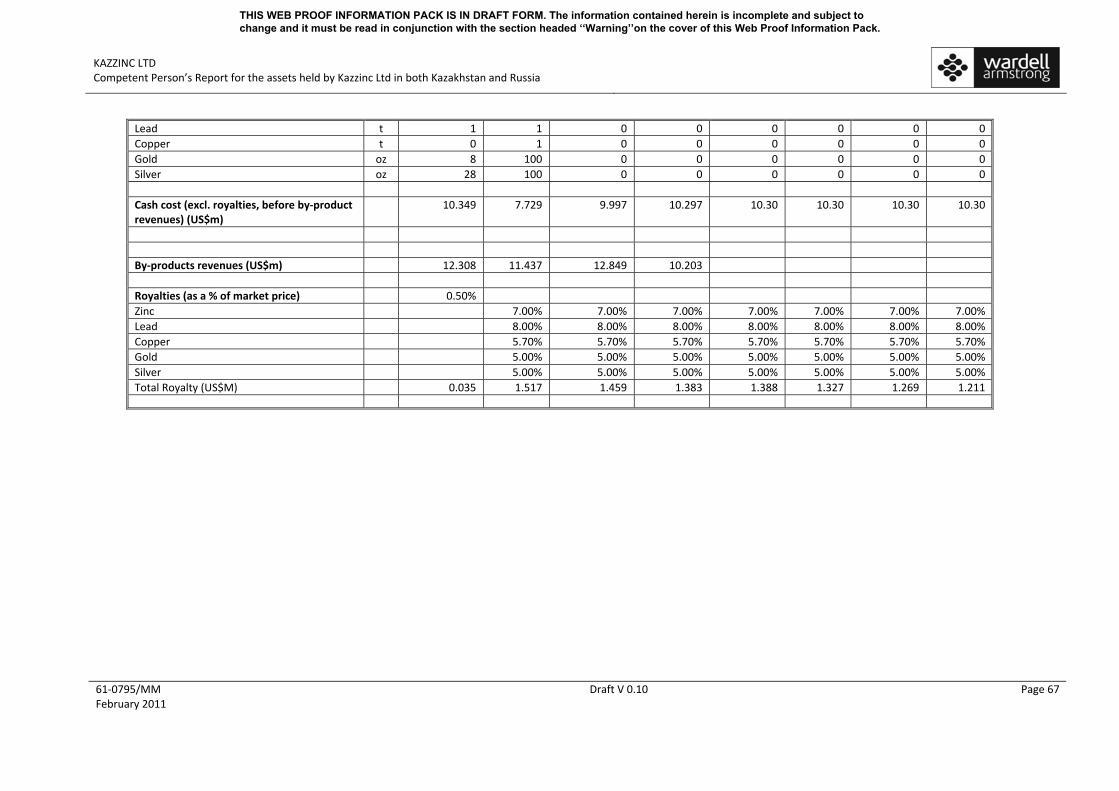
KAZZINC LTD Competent Person’s Report for the assets held by Kazzinc Ltd in both Kazakhstan and Russia
61‐0795/MM February 2011
Draft V 0.10 Page 67
Lead t 1 1 0 0 0 0 0 0 Copper t 0 1 0 0 0 0 0 0 Gold oz 8 100 0 0 0 0 0 0 Silver oz 28 100 0 0 0 0 0 0 Cash cost (excl. royalties, before by‐product revenues) (US$m)
10.349 7.729 9.997 10.297 10.30 10.30 10.30 10.30
By‐products revenues (US$m) 12.308 11.437 12.849 10.203 Royalties (as a % of market price) 0.50% Zinc 7.00% 7.00% 7.00% 7.00% 7.00% 7.00% 7.00% Lead 8.00% 8.00% 8.00% 8.00% 8.00% 8.00% 8.00% Copper 5.70% 5.70% 5.70% 5.70% 5.70% 5.70% 5.70% Gold 5.00% 5.00% 5.00% 5.00% 5.00% 5.00% 5.00% Silver 5.00% 5.00% 5.00% 5.00% 5.00% 5.00% 5.00% Total Royalty (US$M) 0.035 1.517 1.459 1.383 1.388 1.327 1.269 1.211
THIS WEB PROOF INFORMATION PACK IS IN DRAFT FORM. The information contained herein is incomplete and subject to change and it must be read in conjunction with the section headed ‘‘Warning’’on the cover of this Web Proof Information Pack.

KAZZINC LTD Competent Person’s Report for the assets held by Kazzinc Ltd in both Kazakhstan and Russia
61‐0795/MM February 2011
Draft V 0.10 Page 68
THIS WEB PROOF INFORMATION PACK IS IN DRAFT FORM. The information contained herein is incomplete and subject to change and it must be read in conjunction with the section headed ‘‘Warning’’on the cover of this Web Proof Information Pack.

KAZZINC LTD Competent Person’s Report for the assets held by Kazzinc Ltd in both Kazakhstan and Russia
61‐0795/MM February 2011
Draft V 0.10 Page 69
Table 2.11: Staroye Tailing Deposit
2008A 2009A 2010A 2011E 2012E 2013 E 2014E 2015E Milled Capacity (tonnes) 500,000 1,100,000 1,100,000 1,100,000 1,100,000 1,100,000 1,100,000 1,100,000 Milled actual / forecast (tonnes) 421,885 936,966 414,636 660,850 660,850 660,850 660,850 660,850 Grades (g/t) Zinc 0.92 0.97 0.72 0.67 0.67 0.67 0.670046 0.670046 Lead 0.37 0.35 0.26 0.31 0.31 0.31 0.310055 0.310055 Copper 0.07 0.15 0.06 0.04 0.04 0.04 0.039949 0.039949 Gold 1.64 1.76 1.12 1.05 1.05 1.05 1.050011 1.050011 Silver 16.56 14.99 11.16 12.25 12.25 12.25 12.249376 12.249376 Concentrate produced (tonnes) Zn Conc dmt 2,190 6,842 1,635 3,824 3,824 3,824 3,824 3,824 Metals in concentrate (oz) Zinc t 771 2,178 354 1,109 1,109 1,109 1,109 1,109 Lead t 84 303 69 122 122 122 122 122 Copper t 40 291 54 60 60 60 60 60 Gold oz 1,324 5,393 941 1,720 1,720 1,720 1,720 1,720 Silver oz 18,166 49,135 11,950 30,448 30,448 30,448 30,448 30,448 Cu Conc dmt 0 2,127 3,419 0 0 0 0 0 Metals in concentrate (oz) Zinc t 0 234 68 0 0 0 0 0 Lead t 0 63 50 0 0 0 0 0 Copper t 0 29 26 0 0 0 0 0 Gold oz 0 1,364 805 0 0 0 0 0 Silver oz 0 6,181 6,236 0 0 0 0 0 Au Conc dmt 11,123 20,838 6,673 8,713 8713 8713 8713 8713 Metals in concentrate (oz) Zinc t 970 2,510 769 1,145 1,145 1,145 1,145 1,145 Lead t 563 1,411 320 780 780 780 780 780 Copper t 176 842 123 133 133 133 133 133 Gold oz 14,129 28,655 6,707 10,950 10,950 10,950 10,950 10,950 Silver oz 117,585 195,988 57,338 108,900 108,900 108,900 108,900 108,900 Cash cost (excl. royalties, before by‐product revenues) (US$m)
6.30 11.55 7.14 12.16 12.16 12.16 12.16 12.16
By‐products revenues (US$m) 2.075 10.498 2.238 3.408
THIS WEB PROOF INFORMATION PACK IS IN DRAFT FORM. The information contained herein is incomplete and subject to change and it must be read in conjunction with the section headed ‘‘Warning’’on the cover of this Web Proof Information Pack.

KAZZINC LTD Competent Person’s Report for the assets held by Kazzinc Ltd in both Kazakhstan and Russia
61‐0795/MM February 2011
Draft V 0.10 Page 70
Royalties (as a % of market price) Zinc 0.58% 7.00% 7.00% 7.00% 7.00% 7.00% 7.00% 7.00% Lead 0.58% 8.00% 8.00% 8.00% 8.00% 8.00% 8.00% 8.00% Copper 0.58% 5.70% 5.70% 5.70% 5.70% 5.70% 5.70% 5.70% Gold 0.88% 5.00% 5.00% 5.00% 5.00% 5.00% 5.00% 5.00% Silver 0.68% 5.00% 5.00% 5.00% 5.00% 5.00% 5.00% 5.00% Total Royalty (US$M) 0.265 4.910 1.712 2.193 1.64 1.61 1.59 1.57
THIS WEB PROOF INFORMATION PACK IS IN DRAFT FORM. The information contained herein is incomplete and subject to change and it must be read in conjunction with the section headed ‘‘Warning’’on the cover of this Web Proof Information Pack.

KAZZINC LTD Competent Person’s Report for the assets held by Kazzinc Ltd in both Kazakhstan and Russia
61‐0795/MM February 2011
Draft V 0.10 Page 71
Table 2.12: Shaimerden Deposit
2008A 2009A 2010A 2011E 2012E 2013 E 2014E 2015E Milled Capacity (tonnes) 305,000 74,711 212,898 276,386 276,386 276,386 276,386 276,386 Milled actual / forecast (tonnes) 305,519 74,711 212,898 276,386 100,000 280,000 296,000 300,000 Grades (g/t) Zinc % 20.64 21.23 20.66 20.51 21.00 21.00 21.00 21.00 Concentrate produced (tonnes) 305,519 74,711 212,898 276,386 47,975 134,330 142,136 143,925
THIS WEB PROOF INFORMATION PACK IS IN DRAFT FORM. The information contained herein is incomplete and subject to change and it must be read in conjunction with the section headed ‘‘Warning’’on the cover of this Web Proof Information Pack.

KAZZINC LTD Competent Person’s Report for the assets held by Kazzinc Ltd in both Kazakhstan and Russia
61‐0795/MM February 2011
Draft V 0.10 Page 72
Metals in concentrate (oz) Zinc t 63,074 15,861 43,980 56,700 10,000 28,000 29,627 30,000 Cash cost (excl. royalties, before by‐product revenues) (US$m) 13.35 0.53 7.04 18.16 7.70 18.37 19.34 19.56 By‐products revenues (US$m) 0.000 0.024 0.797 1.234 Royalties (as a % of market price) Zinc 1.50% 7.00% 7.00% 7.00% 7.00% 7.00% 7.00% 7.00% Total Royalty (US$M) 0.173 0.000 0.000 9.056 3.668 10.006 10.314 10.171
THIS WEB PROOF INFORMATION PACK IS IN DRAFT FORM. The information contained herein is incomplete and subject to change and it must be read in conjunction with the section headed ‘‘Warning’’on the cover of this Web Proof Information Pack.

KAZZINC LTD Competent Person’s Report for the assets held by Kazzinc Ltd in both Kazakhstan and Russia
61‐0795/MM February 2011
Draft V 0.10 Page 73
Table 2.13: Novoshirokinskoye Deposit 2008A 2009A 2010A 2011E 2012E 2013 E 2014E 2015E
THIS WEB PROOF INFORMATION PACK IS IN DRAFT FORM. The information contained herein is incomplete and subject to change and it must be read in conjunction with the section headed ‘‘Warning’’on the cover of this Web Proof Information Pack.

KAZZINC LTD Competent Person’s Report for the assets held by Kazzinc Ltd in both Kazakhstan and Russia
61‐0795/MM February 2011
Draft V 0.10 Page 74
Milled Capacity (tonnes) 450,000 450,000 450,000 450,000 450,000 450,000 Milled actual / forecast (tonnes) 392,720 450,000 450,000 450,000 450,000 450,000 Grades (g/t) Zinc 0.81 1.27 1.23 1.23 1.23 1.23 Lead 2.04 2.80 2.70 2.70 2.70 2.70 Copper 0.14 0.00 0.17 0.17 0.17 0.17 Gold 3.30 3.48 3.36 3.36 3.36 3.36 Silver 60.37 64.90 62.48 62.48 62.48 62.48 Concentrate produced (tonnes) Zn Conc dmt 4,003 6,723 6,723 6,723 6,723 6,723 Metals in concentrate (oz) Zinc 1,752 3,051 3,051 3,051 3,051 3,051 Lead 68 0 0 0 0 0 Copper 21 0 0 0 0 0 Gold 673 1,660 1,660 1,660 1,660 1,660 Silver 16,459 15,953 15,953 15,953 15,953 15,953 Pb Conc dmt 19,136 26,634 26,634 26,634 26,634 26,634 Metals in concentrate (oz) Zinc 850 2,131 2,131 2,131 2,131 2,131 Lead 6,992 10,823 10,823 10,823 10,823 10,823 Copper 450 1,057 1,057 1,057 1,057 1,057 Gold 32,087 38,356 38,356 38,356 38,356 38,356 Silver 634,379 785,571 785,571 785,571 785,571 785,571 Cash cost (excl. royalties, before by‐product revenues) (US$m) 0.000 0.000 33.234 39.835 39.836 39.836 39.836 39.836 By‐products revenues (US$m) 0.000 0.000 22.730 31.846 Royalties (as a % of market price of concentrate) 6.0% 6.0% 6.0% 6.0% 6.0% 6.0% Total Royalty (US$M) 0.000 0.000 1.569 4.020 6.02 5.93 5.85 5.78 0.000
THIS WEB PROOF INFORMATION PACK IS IN DRAFT FORM. The information contained herein is incomplete and subject to change and it must be read in conjunction with the section headed ‘‘Warning’’on the cover of this Web Proof Information Pack.

KAZZINC LTD Competent Person’s Report for the assets held by Kazzinc Ltd in both Kazakhstan and Russia
61‐0795/MM February 2011
Draft V 0.10 Page 75
Table 2.14: Dolinnoe Deposit
2008A 2009A 2010A 2011A 2012A 2013A 2014A 2015A Milled Capacity (tonnes) 100,000 250,000 Milled actual / forecast (tonnes) 100,000 250,000 Grades (g/t) Zinc % 1.40 1.40 Lead % 0.73 0.73 Copper % 0.20 0.20 Gold г/т 3.71 3.71 Silver г/т 48.43 48.43 Zn Conc dmt 1,888 4,719 Metals in concentrate (oz) Zinc t 1,057 2,643 Lead t 22 54 Copper t 13 31 Gold oz 20 51 Silver oz 389 973 Pb Conc dmt 2,842 5,683 Metals in concentrate (oz) Zinc t 56 140 Lead t 533 1,332 Copper t 4 11 Gold oz 26 64 Silver oz 852 2,131 Cu Conc dmt 1,873 3,745 Metals in concentrate (oz) Zinc t 12 29 Lead t 9 24 Copper t 145 362 Gold oz 65 162 Silver oz 1,434 3,584 Au Conc dmt 938 2,344 Metals in concentrate (oz) Zinc t 285 571
THIS WEB PROOF INFORMATION PACK IS IN DRAFT FORM. The information contained herein is incomplete and subject to change and it must be read in conjunction with the section headed ‘‘Warning’’on the cover of this Web Proof Information Pack.

KAZZINC LTD Competent Person’s Report for the assets held by Kazzinc Ltd in both Kazakhstan and Russia
61‐0795/MM February 2011
Draft V 0.10 Page 76
Lead t 206 411 Copper t 46 93 Gold oz 3,554 8,885 Silver oz 2,096 5,239 Cash cost (excl. royalties, before by‐product revenues) (US$m)
5.36 13.39
By‐products revenues (US$m) Royalties (as a % of market price) Zinc Lead 8.00% 8.00% Copper 5.70% 5.70% Gold 5.00% 5.00% Silver 5.00% 5.00% Total Royalty (US$M) 4.48 8.85
THIS WEB PROOF INFORMATION PACK IS IN DRAFT FORM. The information contained herein is incomplete and subject to change and it must be read in conjunction with the section headed ‘‘Warning’’on the cover of this Web Proof Information Pack.

KAZZINC LTD Competent Person’s Report for the assets held by Kazzinc Ltd in both Kazakhstan and Russia
61‐0795/MM February 2011
Draft V 0.10 Page 77
Table 2.15: Chashinskoye Tailings
2008A 2009A 2010A 2011E 2012E 2013 E 2014E 2015E Milled Capacity (tonnes) 3,869,000 4,000,000 Milled actual / forecast (tonnes) 3,869,000 4,000,000 Grades (g/t) Zinc % 0.40 0.40 Lead % 0.16 0.16 Copper % 0.05 0.05 Gold г/т 0.7 0.7 Silver г/т 5.37 5.37 Au Conc dmt Metals in concentrate (oz) 10,240 10,585 Zinc t Lead t Copper t Gold oz 74,571 77,089 Silver oz 254,635 254,635 Cash cost (excl. royalties, before by‐product revenues) (US$m)
36.94 35.59
By‐products revenues (US$m) Royalties (as a % of market price) Zinc 7.00% 7.00% Lead 8.00% 8.00% Copper 5.70% 5.70% Gold 5.00% 5.00% Silver 5.00% 5.00% Total Royalty (US$M) 5.06 5.20
THIS WEB PROOF INFORMATION PACK IS IN DRAFT FORM. The information contained herein is incomplete and subject to change and it must be read in conjunction with the section headed ‘‘Warning’’on the cover of this Web Proof Information Pack.

KAZZINC LTD Competent Person’s Report for the assets held by Kazzinc Ltd in both Kazakhstan and Russia
61‐0795/MM February 2011
Draft V 0.10 Page 78
Table 2.16: Obruchevskoe Deposit
2008A 2009A 2010A 2011E 2012E 2013 E 2014E 2015E Milled Capacity (tonnes) 70,000 350,000 350,000 350,000 350,000 350,000 350,000 350,000 Milled actual / forecast (tonnes) 70,000 350,000 350,000 350,000 350000 350000 350000 350000 Grades (g/t) Zinc % 7.03 7.03 7.03 7.03 7.03 7.03 7.03 7.03 Lead % 3.01 3.01 3.01 3.01 3.01 3.01 3.01 3.01 Copper % 0.82 0.82 0.82 0.82 0.82 0.82 0.82 0.82 Gold г/т 1.08 1.08 1.08 1.08 1.08 1.08 1.08 1.08 Silver г/т 35.26 35.26 35.26 35.26 35.26 35.26 35.26 35.26 Concentrate produced (tonnes) Zn Conc dmt 11,505 27,417 27,417 27,417 27,417 27,417 27,417 27,417 Metals in concentrate (oz) Zinc t 3,071 15,354 15,354 15,354 15,354 15,354 15,354 15,354 Lead t 63 314 314 314 314 314 314 314 Copper t 36 180 180 180 179.662 179.662 179.662 179.662 Gold oz 4.1 20.7 20.7 20.7 20.7 20.7 20.7 20.7 Silver oz 198.4 991.9 991.9 991.9 991.9 991.9 991.9 991.9 Pb Conc dmt 2,314 11,569 11,569 11,569 11569 11569 11569 11569 Metals in concentrate (oz) Zinc t 197 984 984 984 984.2 984.2 984.2 984.2 Lead t 1,273 6,363 6,363 6,363 6363.14 6363.14 6363.14 6363.14 Copper t 13 63 63 63 63.14 63.14 63.14 63.14 Gold oz 5 26 26 26 26 26 26 26 Silver oz 434 2,172 2,172 2,172 2,172 2,172 2,172 2,172 Cu Conc dmt 1,265 6,323 6,323 6,323 6,323 6,323 6,323 6,323 Metals in concentrate (oz) Zinc t 41 203 203 203 203 203 203 203
THIS WEB PROOF INFORMATION PACK IS IN DRAFT FORM. The information contained herein is incomplete and subject to change and it must be read in conjunction with the section headed ‘‘Warning’’on the cover of this Web Proof Information Pack.

KAZZINC LTD Competent Person’s Report for the assets held by Kazzinc Ltd in both Kazakhstan and Russia
61‐0795/MM February 2011
Draft V 0.10 Page 79
Lead t 27 136 136 136 136 136 136 136 Copper t 329 1,644 1,644 1,644 1,644 1,644 1,644 1,644 Gold oz 13 66 66 66 66 66 66 66 Silver oz 731 3,653 3,653 3,653 3,653 3,653 3,653 3,653 Au Conc dmt 272 1,361 1,361 1,361 1,361 1,361 1,361 1,361 Metals in concentrate (oz) Zinc t 272 1,360 1,360 1,360 1,360 1,360 1,360 1,360 Lead t 167 837 837 837 837 837 837 837 Copper t 31 156 156 156 156 156 156 156 Gold oz 27 136 136 136 136 136 136 136 Silver oz 229 1,145 1,145 1,145 1,145 1,145 1,145 1,145 Cash cost (excl. royalties, before by‐product revenues) (US$m) 2.91 14.55 14.55 14.55 14.55 14.55 14.55 14.55 By‐products revenues (US$m) Royalties (as a % of market price) Zinc 7.00% 7.00% 7.00% 7.00% 7.00% 7.00% 7.00% 7.00% Lead 8.00% 8.00% 8.00% 8.00% 8.00% 8.00% 8.00% 8.00% Copper 5.70% 5.70% 5.70% 5.70% 5.70% 5.70% 5.70% 5.70% Gold 5.00% 5.00% 5.00% 5.00% 5.00% 5.00% 5.00% 5.00% Silver 5.00% 5.00% 5.00% 5.00% 5.00% 5.00% 5.00% 5.00% Total Royalty (US$M) 0.98 4.74 4.66 4.54 4.14 4.14 4.14 4.14
THIS WEB PROOF INFORMATION PACK IS IN DRAFT FORM. The information contained herein is incomplete and subject to change and it must be read in conjunction with the section headed ‘‘Warning’’on the cover of this Web Proof Information Pack.

KAZZINC LTD Competent Person’s Report for the assets held by Kazzinc Ltd in both Kazakhstan and Russia
61‐0795/MM February 2011
Draft V 0.10 Page 80
Table 2.17: Kazzinc Smelter
2008 2009 2010 2011 2012 2013 2014 2015
Processed actual / forecast (tonnes) 696,849 816,415 781,717 610,796 Finished Metal 194,925 222,917 210,477 150,387 Zinc t 51,986 51,706 44,553 33,802 Lead t 30,945 31,456 29,813 19,593 Copper t 176,571 172,635 181,101 169,033 Gold oz 5,221,692 4,815,430 4,573,657 3,093,167 Silver oz Cash cost (excl. royalties, before by‐product revenues) (US$m) 75.87 86.30 81.66 59.25
THIS WEB PROOF INFORMATION PACK IS IN DRAFT FORM. The information contained herein is incomplete and subject to change and it must be read in conjunction with the section headed ‘‘Warning’’on the cover of this Web Proof Information Pack.
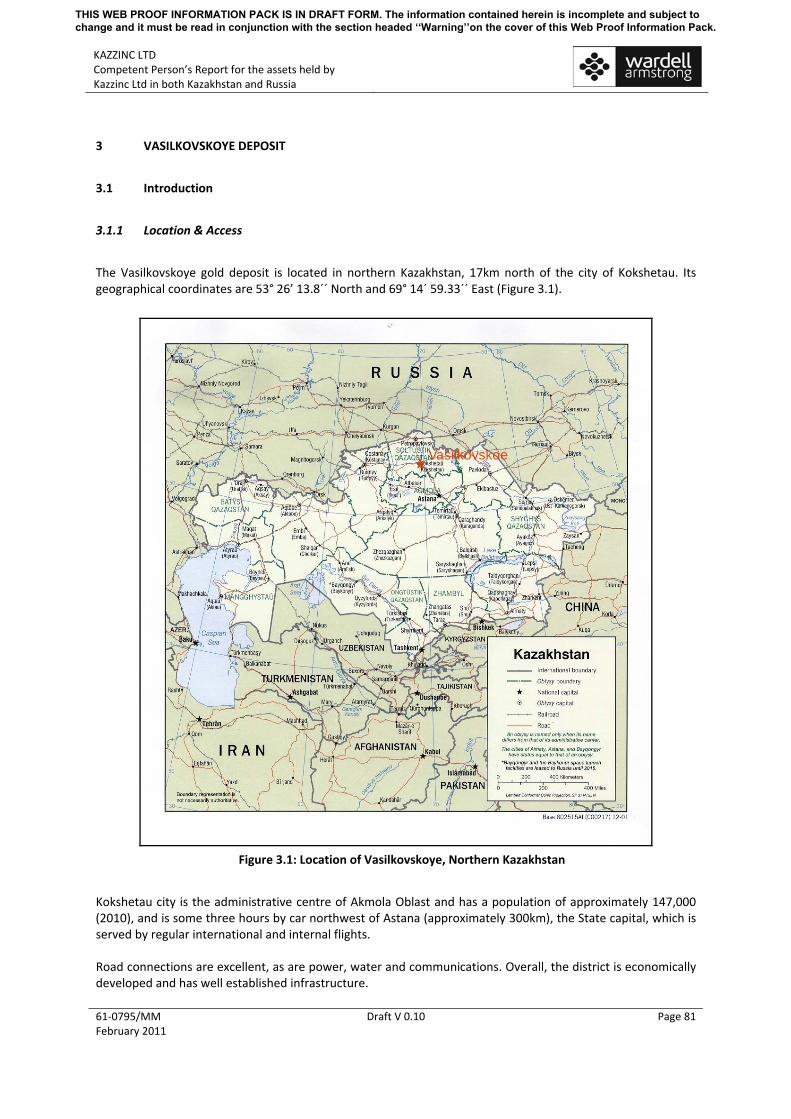
KAZZINC LTD Competent Person’s Report for the assets held by Kazzinc Ltd in both Kazakhstan and Russia
61‐0795/MM February 2011
Draft V 0.10 Page 81
3 VASILKOVSKOYE DEPOSIT
3.1 Introduction
3.1.1 Location & Access
The Vasilkovskoye gold deposit is located in northern Kazakhstan, 17km north of the city of Kokshetau. Its geographical coordinates are 53° 26’ 13.8´´ North and 69° 14´ 59.33´´ East (Figure 3.1).
Vasilkovskoe
Figure 3.1: Location of Vasilkovskoye, Northern Kazakhstan
Kokshetau city is the administrative centre of Akmola Oblast and has a population of approximately 147,000 (2010), and is some three hours by car northwest of Astana (approximately 300km), the State capital, which is served by regular international and internal flights. Road connections are excellent, as are power, water and communications. Overall, the district is economically developed and has well established infrastructure.
THIS WEB PROOF INFORMATION PACK IS IN DRAFT FORM. The information contained herein is incomplete and subject to change and it must be read in conjunction with the section headed ‘‘Warning’’on the cover of this Web Proof Information Pack.
KAZZINC LTD Competent Person’s Report for the assets held by Kazzinc Ltd in both Kazakhstan and Russia
61‐0795/MM February 2011
Draft V 0.10 Page 82
The deposit was discovered in 1963, but it was not until 1980‐1986 that a pilot open pit mining project was undertaken, where some of the ore was processed through a pilot plant, although most was stacked. Due to the complicated economic situation within the country, mining was suspended, but then continued again in 1995 until the end of 2007, mining the oxide ores which were treated using heap leach technology. Production up to this time is believed to be approximately 14Mt.
3.1.2 Topography & Climate
The Vasilkovskoye mine lies in an area of typical Kazakh steppe, with little or no change in elevation, dominated by grasslands with occasional isolated scrub and small trees. The area is drained by Ishim and Nura rivers. Kokshetau exhibits a typical harsh continental climate with hot summers and cold winters. Average January temperature is ‐16 to ‐18°C, and +19 to +21°C in July. Annual precipitation is some 250‐400mm.
3.1.3 Infrastructure
Kokshetau city was established on Kopa Lake, a major feature of the town. There are urban light industries such as food production, whilst the region produces low grades of wheat and other crops such as potatoes, vegetables and sunflower. The world's only power line with a voltage greater than 1000kV is installed near Kokshetau, connecting the town of Ekibastuz with the central part of Russia. In terms of mineral resources, some 19 ore deposits and 155 non‐metallic deposits have been described in the region, including 6 operating gold mines, 4 uranium, 1 titanium, 1 antimony, 2 ornamental stone, 6 coal, 6 limestone, 14 mortar sand and 16 building stone deposits. 3.1.4 Mineral Rights & Permitting
In August 2002, JSC Vasilkovskoye Zoloto obtained a Mining Allotment for the extraction of gold ores from an area of 2.65km2 to a depth of 660m (level 425m). In July 2003 a contract with the Kazakhstan Government was awarded granting the right to extract gold bearing ore within the abovementioned Mining Allotment till 2022. Moreover, a mining allotment was obtained for development of the whole mine infrastructure. In 2010, the existing Mining Contract was amended by a Supplementary Agreement which mainly resulted in the following:
• Extended Mining Allotment of 28.3km2 (see co‐ordinates in Table 3.1); • Ore processing expanded up to 8Mtpa; • Extended validity of the Contract till 2025; • Assignment of the contractual right from JSC “JV “Vasilkovskoye Zoloto” in favour of Kazzinc
Ltd.
THIS WEB PROOF INFORMATION PACK IS IN DRAFT FORM. The information contained herein is incomplete and subject to change and it must be read in conjunction with the section headed ‘‘Warning’’on the cover of this Web Proof Information Pack.

KAZZINC LTD Competent Person’s Report for the assets held by Kazzinc Ltd in both Kazakhstan and Russia
61‐0795/MM February 2011
Draft V 0.10 Page 83
Table 3.1: Mining Licence Coordinates
Co‐ordinate Easting Northing 1 69o 12’ 54.70” 53o 27’ 34.35” 2 69o 15’ 34.32” 53o 27’ 32.33” 3 69o 18’ 10.02” 53o 28’ 01.22” 4 69o 18’ 30.13” 53o 27’ 37.79” 5 69o 17’ 26.32” 53o 27’ 05.03” 6 69o 17’ 48.06” 53o 26’ 18.84” 7 69o 16’ 02.33” 53o 24’ 30.80” 8 69o 12’ 50.14” 53o 24’ 39.50”
WAI Comment: The licence documentation has been inspected and is in order. Moreover, the conditions of the licence are sufficient for the life of mine, particularly now that the Mining Allotment has been extended around the property and which now also includes adjacent exploration properties.
3.2 Geology & Mineralisation 3.2.1 Regional Tectonics The Vasilkovskoye deposit is located within the Altai‐Sayan Orogenic Belt, more precisely within the endo‐exocontact Zerendinsky Granitoid Complex Massif, which intruded Pre‐Cambrian metamorphic rocks. Both of them were then overlain by Paleozoic and Cenozoic sediments (Mesozoic period represents a weathering phase). The Altai‐Sayan Orogenic Belt extends from northern Kazakhstan, through China, Mongolia and into Russia. In Kazakhstan the western extension of this belt is referred to as the Charsk Gold Belt, which hosts numerous gold deposits. The belt forms part of the Altaids orogen, which is at the same time included in the Central Asia orogenic region. Central Asia is an orogenic supercollage consisting of three generations of orogenic collages that are grouped into the Timanides‐Baikalides, Altaids and Mongolides. The supercollage is separated by the giant Trans‐Eurasian fault system into the Altai‐Mongolian and Kazakhstan‐Khingan domains. The Altaids has significant metallogenic importance (including world‐class Au, Ag, Cu‐Mo, Pb‐Zn, and Ni, of late Proterozoic to Mesozoic age). It is widely accepted that subduction‐related orogenesis of the Altaids started in the late Precambrian and gradually migrated southward (present coordinates). 3.2.2 Regional Stratigraphy 3.2.2.1 General The regional geology of Vasilkovskoye deposit comprises a Precambrian metamorphic basal complex intruded by Ordovician granitoids and overlain by Paleozoic sediments. The area was subjected to Mesozoic weathering and overlain by Cenozoic sand and clay sediments. Figure 3.2 shows the geology of Vasilkovskoye and the surrounding area.
THIS WEB PROOF INFORMATION PACK IS IN DRAFT FORM. The information contained herein is incomplete and subject to change and it must be read in conjunction with the section headed ‘‘Warning’’on the cover of this Web Proof Information Pack.

KAZZINC LTD Competent Person’s Report for the assets held by Kazzinc Ltd in both Kazakhstan and Russia
61‐0795/MM February 2011
Draft V 0.10 Page 84
Figure 3.2: Geology of Vasilkovskoye and Surrounding Area
3.2.3 Mine Geology
The Vasilkovskoye deposit belongs to the group of intruded‐related Au deposits. It is located in the western part of the Shatskaya metalogenic zone of the North Kazakhstan province, with a northwest striking trend. The deposit is located in the endo‐exo contact of the Altybaysky granite intrusion (part of the Zerendinsky Complex) with the Precambrian metamorphic rocks. Within this contact occurs a large gold chemical halo, which represents a thermal aureole caused by the granitic intrusion, and where the gold enrichment took place. The Altybaysky intrusion is crossed by a considerable number of faults, with main directions being NW and NE. These two main faults are the Vasilkovskoye fault (NE strike) and a major northwest trending structure parallel to the Dongulagashsky fault (NW strike). The deposit is situated in the northeast quadrant of this intersection. At Vasilkovskoe, the Altybaysky granite intrusion is represented by two major units at the Vasilkovskoye deposit; a diorite/gabbrodiorite unit and granite/granodiorite unit. Planar and sharp contacts between the two units are common, although sometimes contacts are not clear. The Diorite/Gabbrodiorite Unit is located in the northern part of the deposit, and shows generally weak mineralisation. This unit represents the transitional zone between the metamorphic host rocks and the Altybaysky intrusion granite rocks. The Granite/Granodiorite Unit occupies the majority of the deposit and hosts the mineralised body. In the southern part of the deposit, at depths of 400‐500m, quartz diorites, diorites and gabbro‐diorites have been intersected which may be related to the Stepnyaksky Complex (the main gold deposits of North Kazakhstan province are paragenetically related to this complex).
THIS WEB PROOF INFORMATION PACK IS IN DRAFT FORM. The information contained herein is incomplete and subject to change and it must be read in conjunction with the section headed ‘‘Warning’’on the cover of this Web Proof Information Pack.

KAZZINC LTD Competent Person’s Report for the assets held by Kazzinc Ltd in both Kazakhstan and Russia
61‐0795/MM February 2011
Draft V 0.10 Page 85
3.2.4 Mine Structure
The deposit’s area is characterised by the presence of intense faulting and shearing zones. First, second and third order faults can be distinguished, with the main first order faults represented by the NW major structure parallel to the Dongulagashsky fault and the NE trending Vasilkovskoye fault. The rest of the faults trend in various directions such as N, NW or NE. After detailed structural mapping, seven dislocation orientations have been identified:
• North Western (NW 300‐320°) of variable dip, widespread and occur as isolated fractures and zones of jointing. They are 2‐10cm wide, rectilinear, contain ferruginous fault gouge and fine schistosity along vein margins. They are related to the Dongulagashsky regional fault. They are pre‐ore but were reactivated during the ore forming event;
• North Western (NW 330‐350°) dipping steeply NE and SW (relatively uncommon); • North (N 350‐10°) vertical and rarely dip steeply to the NE and SW. These are numerous and
occur as thick (5‐7m) zones of schistosity, lenses of brecciated rocks and narrow zones of tectonic fault gouge. They are curvilinear and were reactivated into shear zones;
• North Eastern (NE 15‐30°) dipping steep to vertical, predominantly SE (65 to 90°). These are predominant and may be part of a very thick zone of a large regional fault. Steeply dipping (75 to 90°), narrow fractures (0.5 to 25‐30cm) control the distribution of ore veins of the deposit. The longest of these veins is 143m, but they generally pinch out between 1‐2m and tens of metres. Quartz‐arsenopyrite and arsenopyrite veinlets (0.5 to 3cm) develop at the contacts of the quartz veins. The frequency of the veins and veinlets varies from one per 5‐7m to hundreds per metre. The frequency is determined by intersecting fractures. The highest frequency occurs in blocks bounded by submeridional dislocations. At the intersection of the NE veins and veinlets with NW dislocations, clusters of veinlets merge into veins along NW fractures;
• North Eastern (NE 40‐60°), dipping 30 to 55°. They are predominant and may be part of a very thick zone of a large regional fault. The thickness of isolated schistosity zones is up to 5‐10m. Rectilinear surfaces, considerable extension and do not enclose productive assemblages;
• East (E 80‐100°) various dips predominantly to the north (45°). Uncommon; and • North Western (NW 290‐310°), gently dipping to the northeast at 10 to 15°. They are up to
30cm wide and are related to the ore phase.
3.2.5 Alteration
Alteration zones exist in the deposit area and are seen as steeply dipping lenticular zones. The different types of alteration are: chlorite; chlorite‐albite; albite; carbonate (known as listvenite, a term used for CO2 metasomatism of an ultramafic rock); quartz‐sericite (known as beresite); quartz‐k‐feldspar; k‐feldspar; argillite alteration. The bodies decrease in frequency with increasing distance from the centre of the mineralisation. The most intensive alteration is confined to areas of increased fracturing. Syn‐mineral alteration accompanying the sulphide‐quartz auriferous stockwork and veins are on beresitised rocks. It comprises grey quartz, the filling of vesicles and minor recrystallisation of rock minerals (sericite, carbonate etc). The post mineralisation stage comprises the development of argillite alteration comprising of 2‐5cm veins, predominantly of carbonate composition.
THIS WEB PROOF INFORMATION PACK IS IN DRAFT FORM. The information contained herein is incomplete and subject to change and it must be read in conjunction with the section headed ‘‘Warning’’on the cover of this Web Proof Information Pack.

KAZZINC LTD Competent Person’s Report for the assets held by Kazzinc Ltd in both Kazakhstan and Russia
61‐0795/MM February 2011
Draft V 0.10 Page 86
3.2.6 Style of Mineralisation
Vasilkovskoye represents a stockwork located at the junction of the gabbro/gabbrodiorite and the granite/granodiorite rocks, recognising that the ore control was the intersection of faulting parallel to the NW trending Dongulagashsky fault with the NE trending Vasilkovskoye fault. The mineralisation forms a flattened zone, pinching out at depth.
3.2.7 Mineralogy
Au mineralisation is spatially associated with quartz and quartz‐arsenopyrite veins and veinlets of hydrothermal origin. The dominant sulphides are arsenopyrite (which occurs as sulphide veinlets, with quartz veins and as disseminations), with minor pyrite plus chalcopyrite (which occur only in trace amounts), bismuth sulphides and bismuth tellurides. Uranium mineralisation is spatially associated with the Au mineralisation, but is younger than the main Au mineralising event. Minor Au occurs within carbonate and silicates, Uranium mineralisation is present within the deposit, and in the area of the pit, values over 0.1% uranium can be found, with rare, narrow higher grades. Outside of the pit envelope, uranium grades >1% occur.
All the sulphides occur in both major rock units, but pyrite and chalcopyrite are more common in the mafic rocks. Due to the extensive weathering in the upper levels of the pit (now mined out) the sulphides were typically altered to various oxide minerals.
Microcrystalline grey quartz veins and veinlets carry the higher grade Au mineralisation. The veins are commonly high angle, either en echelon or slightly oblique to the direction of the main faults, and relatively thin (< 3cm). In the ore zones the concentration of veinlets ranges from 1‐5/m to >10/m. Au ranges in size from 1 to 63 microns, and the average size in the gabbro is 2.5 microns and in granodiorite 4 microns. Detailed mineralogy has indicated that most of the gold occurs as less than 10 micron grains within arsenopyrite.
Mineralisation has been divided into early and late stages. All stages include some sulphides, especially arsenopyrite, complicating interpretation of element associations within the ore deposit, especially the As and Au relationships. Pre Ore Phase: The earliest sulphides include chalcopyrite‐pyrrhotite‐pyrite, arsenopyrite‐pyrite and Au assemblages. The sulphides are well developed within the gabbro suite, especially adjacent to the contact with the granitic suite and in strongly jointed areas. The chalcopyrite‐pyrrhotite‐pyrite assemblage is usually associated with the development of mafic minerals. Early Ore Phase: The early ore phase is dominated by the introduction of quartz, carbonates, sericite and pyrite (listvenite and beresite alteration). Main Ore Phase: The main ore phase is essentially a quartz, carbonate and chalcophile mineral assemblage, with the introduction of complex copper, bismuth, antimony, arsenic and tellurium minerals. Post Ore Phase: The post ore phase is a waning of the system with the introduction of silica, carbonate and minor complex sulphides. Uranium was deposited during the post ore phase.
3.2.8 Exploration Potential
In February 2010, the Company expanded its Mining Allotment to 28.3km2 to include some surrounding exciting exploration projects.
THIS WEB PROOF INFORMATION PACK IS IN DRAFT FORM. The information contained herein is incomplete and subject to change and it must be read in conjunction with the section headed ‘‘Warning’’on the cover of this Web Proof Information Pack.

KAZZINC LTD Competent Person’s Report for the assets held by Kazzinc Ltd in both Kazakhstan and Russia
61‐0795/MM February 2011
Draft V 0.10 Page 87
Geophysical exploration has defined that the Vasilkovskoye deposit appears localised on an IP Gradient area, particularly noticeable from Chargeability, but also from Resistivity (Figure 3.3). A limited volume of geophysical works (IP‐R) was undertaken at Promozutichnoye, located 2km to the northeast of the main deposit in 2008. This followed on from a small hydrocore drilling and trenching (1,100m) programme undertaken in 2002 where trenching revealed 36 samples with “industrial grades”, with a maximum grade of 5.6g/t, and drilling revealed 39 samples with at maximum grade of 7.7g/t.
Figure 3.3: IP Profile across Vasilkovskoye Deposit
In 2010, some 13,943m of hydrocore drilling was undertaken, producing 6,400 samples from 462 holes. Chemical analysis is being undertaken at Vasilkovskoye, although only some 2,200 sample assays have been returned with values up to 0.3g/t Au. Although not spectacular, the geophysical signatures still appear promising for the delineation of deeper‐seated mineralisation (historic Soviet deep drilling (>200m) had picked up some high grades in this area). A budget for this 2010 programme was set at US$1.3M which included geophysical and topographical baseline works (180km and 190km respectively), trenching, hydrocore drilling and analytical work. Results are awaited from this work. In addition, the Company has designed an exploration programme for some 8 years within an expanded 1,600km2 area which includes Turan in the west which is currently being explored by Kostanai Expedition (a sub‐contractor to Kazakhstan Mineral Corporation).
WAI Comment: The geology and mineralisation of the Vasilkovskoye deposit are well known through years of exploration and development. Importantly, controls to mineralisation are also well defined, and are clearly related to prominent fracture systems. Thus, WAI has a high degree of confidence in the magnitude, tenor and morphology of mineralisation.
THIS WEB PROOF INFORMATION PACK IS IN DRAFT FORM. The information contained herein is incomplete and subject to change and it must be read in conjunction with the section headed ‘‘Warning’’on the cover of this Web Proof Information Pack.

KAZZINC LTD Competent Person’s Report for the assets held by Kazzinc Ltd in both Kazakhstan and Russia
61‐0795/MM February 2011
Draft V 0.10 Page 88
Furthermore, this understanding has led to the discovery of other, nearby exciting targets which are, and will be, the focus of future exploration activity. WAI believes that the potential of the Vasilkovskoye area for further significant discovery is high.
3.3 Exploration History
3.3.1 General
During the 1960s, the deposit was explored on a 60m x 60m rectangular grid, with a more detailed 30m x 30m grid in the central part of the deposit. The deposit has been investigated by means of core drilling from surface along 18 exploration profiles (azimuth 315°) each 60m apart, as well as from underground. All surface holes are inclined, and the underground holes are drilled directionally. Between 360‐400m, the drill grid was 60 x 60m, from 360‐600m, the grid was 60 x 60m and 120 x 120m, with a maximum exploration depth of between 800‐1,000m. Three shafts were sunk to depths of 60m and 180m, with horizontal drives on three levels at 60m intervals (60m, 120m and 180m elevations) from which raises and drilling chambers were excavated. Cross‐cuts were developed from the longitudinal drives every 60m along the exploration profiles of core drilling. The length of the cross‐cuts was selected so as to intersect the whole width of the mineralised zone. Within the central part of the deposit short longitudinal drives were developed to detail the deposit structure and grade. All the exploration works (Table 3.2 and Table 3.3) have been surveyed in a local grid coordinate system, with no UTM equivalent coordinates provided.
Table 3.2: Historical Exploration Works Up To 1990 Years Total
Work types Unit 1966 ‐1970 1971‐1975
1976‐1980
1980‐1987
1988‐1990
1971‐1990
Core drilling from surface M 36,500 27,900 48,000 73,308 4,471 190,179
Underground core drilling M 5,495 7,305 3,729 1,303 ‐ 17,832
Exploration shafts M 60 180 180 ‐ ‐ 420
Raises M ‐ 436 260 121 ‐ 817
Test pits 4m2 size M ‐ 403 93 ‐ 496
Drives from the shafts M 2,439 5,394 9,615 1,015 ‐ 18,463
Lateral drives from the test pits M ‐ 1,018 ‐ ‐ ‐ 1,018 * From KMC’s Resource Estimation report 2009
Table 3.3: Historical Sampling Methods
Sampling Method Year Number of holes Metres drilled Metres sampled Number of samples
Drillholes 1966‐2007 580 212,969 176,482 99,707 Channel 1966‐1987 1,129 32,125 31,755 31,230 Blastholes 1995‐2007 65,628 196,884 196,884 65,628
* 2009 drillholes not included
THIS WEB PROOF INFORMATION PACK IS IN DRAFT FORM. The information contained herein is incomplete and subject to change and it must be read in conjunction with the section headed ‘‘Warning’’on the cover of this Web Proof Information Pack.

KAZZINC LTD Competent Person’s Report for the assets held by Kazzinc Ltd in both Kazakhstan and Russia
61‐0795/MM February 2011
Draft V 0.10 Page 89
3.3.2 Core Drilling 3.3.2.1 Historical Drilling The deposit has been drilled using core drilling on profiles oriented at an azimuth of approximately 315°. This direction is approximately 90° to the orientation of the contact between the two main rock units and the main NE trending fault (Vasilkovskoye fault). The drillholes were drilled at a diameter of either 59mm or 76mm for the majority of the deposit. All holes were drilled conventionally, and most of them nearly vertical (approximately 80°) for the first 200m or so, and then gradually deviated to a dip of 45°. The holes were drilled on 60m spaced sections with some widening of this spacing at the edges of the drill pattern. Spacing of collars along drill sections is generally between 30m and 60m, reducing to 5m or less on some profiles. Up until 2009, a total of 580 drillholes has been drilled over the mine area, of which 192 were drilled from underground. A current drilling campaign is underway to extend and infill the resource, details of which are provided below. For the historic data, the average core recovery is 84.3% for Soviet holes (1975‐1990). Placer Dome’s core recovery was reported in AMC Consultant’s report as 100%. Micromine’s report (2005) indicates that drillholes completed prior to 1975 had core recoveries of 70% applied to all samples. From 1963 to 1995 a total of 570 drillholes was drilled (including four geotechnical drillholes) and 96,358 samples collected. Most of the core samples were assayed for Au, As and Bi. In 2007, 10 more drillholes were drilled, under the advice of the AMC Consultants (Australia), and 3,349 samples collected, as a part of a validation campaign. 3.3.2.2 Current Drill Programme
During 2009, a further programme of core drilling was undertaken to update the Mineral Resources (within the open pit to 450m depth) currently classified in the Inferred Category to Indicated status, under the guidelines of the JORC Code (2004). Following this, starting in April 2010, an extensive drilling programme has been taking place for detailed exploration of the deeper levels of the deposit. Currently, 8 rigs are operating in the pit, provided by the contractor Iscander, managed by KMC, with samples going to both Ridder laboratory and Stewart Group laboratories, Karabalta, Kyrgyzstan. The rigs comprise one LF 90 (LongYear), five XY44 (Chinese) and two Brasilian (BBS56). Another rig is planned to join the programme shortly. All rigs drill NQ core, with holes planned to variable depths, with a maximum of 1,050m. Holes are drilled on a 315° azimuth, but with variable inclination, usually 60° although some future holes are planned to be drilled at 115°. Hole spacing is 60m. A total of 31,457m of drilling was undertaken inside the open pit and 17,946m was drilled outside the confines of the pit in 2010 and a further 25,000m is scheduled in 2011. However, full results from this deep drilling programme are not expected until November 2011. The budget for this work is some US$12M. 3.3.2.3 Sampling Methodology
WAI inspected several of the drill rigs operating in the pit. The quality of both the drilling and core handling appeared good. All drilling utilised wireline techniques with LongYear tools.
THIS WEB PROOF INFORMATION PACK IS IN DRAFT FORM. The information contained herein is incomplete and subject to change and it must be read in conjunction with the section headed ‘‘Warning’’on the cover of this Web Proof Information Pack.

KAZZINC LTD Competent Person’s Report for the assets held by Kazzinc Ltd in both Kazakhstan and Russia
61‐0795/MM February 2011
Draft V 0.10 Page 90
Core is collected on site in well built and labelled six‐row wooden trays. These are then transported to the core storage facility where the core is logged, photographed and marked up for sampling. The Company uses “Ballmark” core orientation system for downhole structural control. Samples are usually 1m in ore and 3m in waste. Once samples are marked up, they go to the core cutting room for splitting. Currently, three core saws are in operation. From here, samples are then placed into large sacks for transportation to either the Ridder laboratory, or Alex Stewart in Kyrgyzstan. 3.3.2.4 Sample Analysis The Company has currently sent some 22,187 samples to Stewart Group laboratories and has received some 4,000 results back. To accelerate results, the Kyrgyzstan laboratory has sent 2,500 samples to Ridder laboratory as well as 5% check samples comprising standards (0.5, 1.52 and 6.0g/t Au) and blanks. The Company has also used repeat samples as standards in an effort to test the competence of the Ridder facility. 3.3.3 Channel Sampling The surface and underground workings were sampled by channel sampling, with a length of 0.1‐2.5m and an average sample length of 1.0m. The channel size was 10x3cm and a 1 metre‐long sample typically weighted 8kg. In total, some 31,230 samples were collected, 94% of them 1.0m long. The drive faces were sampled every 2‐3 blasts. The long cross‐drives were continuously sampled on both walls, while the shorter drives on one wall only. In raises, samples were collected from two opposite walls every metre.
3.3.4 Core Sampling
During the Soviet period, sectional core sampling was performed with a section length of 3.0‐3.2m, average length of sample was 1.6‐1.7m. Typically one drilling run core comprised one sample. All the mineralised core intervals were fully sampled with sampling of inter‐mineral intervals of enclosing rocks. Unaltered rocks beyond mineralised ore zones were not sampled – the total volume of non‐sampled core was 25.4%. For drilling diameter 76mm and more, a half core was taken as a sample, for 59mm, the core was fully sampled. The average weight of core sample ranged from 2.2kg to 11.0kg depending on drilling diameter and sample length. Slimes were not sampled. Core holes drilled in 1994‐95 by Placer Dome and in 2007 by АМС (drilling diameter 76mm), were cut into two parts. One half was sent to PDI (Canada) and Alex Stewart (Kyrgyzstan) laboratories. The second half was used for metallurgical testwork, whilst the remaining part was stored. 3.3.5 Blastholes
65,628 blastholes to 7.5m depth have been drilled on different bench levels, from the level 226mRL to the level 175mRL.
The vertical blastholes were spaced between 5x5 to 7x7m. Up to 2009, blastholes were sampled by one sample to the whole depth of 7.5m, but since 2009, three samples are taken from the hole, 2.5m in length, as ore mined on 2.5 flitches. Generally the material size is ‐10mm, with a sample weight of 8‐10kg. In 2009‐10, tests on operational sampling using RC inclined holes were performed, in an attempt to better delineate the predominantly vertical/sub‐vertical mineralisation.
THIS WEB PROOF INFORMATION PACK IS IN DRAFT FORM. The information contained herein is incomplete and subject to change and it must be read in conjunction with the section headed ‘‘Warning’’on the cover of this Web Proof Information Pack.

KAZZINC LTD Competent Person’s Report for the assets held by Kazzinc Ltd in both Kazakhstan and Russia
61‐0795/MM February 2011
Draft V 0.10 Page 91
In order to develop the RC drilling procedure and compare the RC drilling with blastholes, a trial block (167‐2) has been drilled on the south‐western flank of the Main ore zone. Blastholes were drilled using a ROC‐L8 rig with a simple air hammer. All the holes were vertical. RC drillholes were drilled using a ROC‐L8 with a reverse flushing and automated sampling setup. All the drillholes were 53° inclined to ensure maximum ore intersections. The inclined drillholes azimuth complies with exploration grid of 315°. Each borehole was sampled by sections (three samples for each section). Sample length was 2.5m in the vertical drillholes, and 3m in the inclined drillholes. The results of this work are shown in Table 3.4 below.
Table 3.4: Inclined RC vs Vertical Blasthole Comparison
Drilling with ROC L‐8 RC Drilling with ROC L‐8 DBH RC/ DBH
ore, tons grade, g/t
Au, g ore, tons grade, g/t
Au, g grade, g/t
Au, g/t
1 level 24 411 3.06 74 746 24 411 1.90 46 305 1.61 1.61 2 level 24 411 2.80 68 418 24 411 1.74 42 484 1.61 1.61 3 level 24 411 2.41 58 843 24 411 1.89 46 093 1.28 1.28 Total 73 233 2.76 202 006 73 233 1.84 134 882 1.50 1.50
The comparison was carried out within the RC drilling outlines. The results showed that the vertical blastholes underestimate the grade by approximately 30%. As a result of this work, from the end of January 2011, a 10x15m spacing RC drilling programme, at 53°, will be implemented when the Company will principally use the inclined data for grade control. 3.3.6 Density
WAI Comment: The Vasilkovskoye project has been well studied with historic exploration works done to a high standard. WAI has, as part of the resource estimation process, conducted a detailed audit of the data and in general, been satisfied of the procedures used and results received. The latest on‐going drilling works are also being undertaken to a good standard, but the current problems of getting analysis done is of concern, as has been experienced by many other explorers and producers in Kazakhstan who have historically used the Alex Stewart facility in Kyrgyzstan. Although no assays are available for the deep drilling project, preliminary geological interpretation does indicate that overall resources are likely to be increased.
3.4 Mineral Resource
3.4.1 Introduction
In 2006, AMC prepared a test resource model (“the 2006 Model”) using an interpretation provided by Vasgold (operator of Vasilkovskoye Mine), and recommended that Vasgold should drill ten more diamond drillholes for resource confirmation. On completion of these holes AMC compared the results with the previous drilling and updated the resource model where required. The confirmation drill holes were completed in late 2007 and the assay results sent to AMC in June 2008. AMC compared the results with the previous drilling and found that although there were differences in the data sets, globally the new data supported the older data and as such were satisfied that the old data was suitable for use in resource estimation at Vasilkovskoye.
THIS WEB PROOF INFORMATION PACK IS IN DRAFT FORM. The information contained herein is incomplete and subject to change and it must be read in conjunction with the section headed ‘‘Warning’’on the cover of this Web Proof Information Pack.

KAZZINC LTD Competent Person’s Report for the assets held by Kazzinc Ltd in both Kazakhstan and Russia
61‐0795/MM February 2011
Draft V 0.10 Page 92
AMC revised the interpretation of the mineralisation outline, as defined by a 0.4g/t Au cut‐off, with more emphasis placed on the new data where there was discordance between the old and new data. The directional variography was updated to reflect the trend of the higher grades in the primary grade domain (called “the Main Zone”) and was oriented with the major axes sub‐parallel to the Vasilkovskoye fault. In situ bulk density for the Main Zone was updated, with the additional information provided by the 2007 drilling and the density for the Main Zone was set at 2.75t/m3. The density of 2.68t/m3 used in the 2009 Model was used for all other domains. Ordinary kriging was used to estimate Au and As grades into the block model (2008 Model) and the reported Mineral Resource above a 0.4g/t Au cut‐off was 150Mt @ 1.90g/t Au (Indicated) and 120Mt @ 1.50g/t Au (Inferred). The tonnes and grade above a 0.0g/t Au cut‐off within the interpretation wireframe for the 2009 Model were compared to the 2006 Model: 2006 Model 310Mt @ 1.5g/t Au; and 2009 Model 296Mt @ 1.6g/t Au. 3.4.2 WAI 2010 Resource Estimate
3.4.2.1 Introduction The mineral resource estimate presented here for the Vasilkovskoye Gold Project is based on the model prepared by Kazakhstan Mineral Company (KMC) in October 2009, which has been depleted to a pit survey dated 01 January 2011. Database Compilation Three distinct sampling techniques have been used at the Vasilkovskoye deposit; diamond drilling, underground channel sampling and blasthole sampling. A summary of these data can be found in Table 3.5.
Table 3.5: Summary of Assay Data by Type
Sampling Method Year Number of Collars
Total Metres Total Assays Number of Au
Assays Drillholes 1966‐2009 633 236,117 122,838 120,128 Blastholes 1995 ‐ 2007 64,990 194,970 65,628 65,628 Channel Samples 1966 ‐ 1987 1,129 33,321 31,260 31,197 The drillholes have mainly been drilled on profiles orientated at an azimuth of 315°. This orientation is at approximately 90° to the NE trending Vasilkovskoye fault. Most of the holes are vertical to sub‐vertical within the first 200m and the deviate gradually towards 45°. The profiles are 60m apart and although in general the collars are spaced 30‐60m along the section there are some collars less than 5m apart. Ten of the holes were drilled in 2008 as twinned holes to verify the older data. Forty seven of the holes were drilled in 2009.
Three shafts were sunk with horizontal drives on three levels at 60m intervals (60, 120 and 180m levels).
Cross‐cuts were developed every 60m from horizontal workings along the survey profiles of core drilling. Cross‐cut lengths were sufficient to cross the whole length of the mineralised area. Short longitudinal workings were developed in the central part of the deposit in order to get more detailed information about structure and content.
THIS WEB PROOF INFORMATION PACK IS IN DRAFT FORM. The information contained herein is incomplete and subject to change and it must be read in conjunction with the section headed ‘‘Warning’’on the cover of this Web Proof Information Pack.

KAZZINC LTD Competent Person’s Report for the assets held by Kazzinc Ltd in both Kazakhstan and Russia
61‐0795/MM February 2011
Draft V 0.10 Page 93
These underground workings were sampled by channel sampling with the drive faces sampled every 2‐3 blasts, the longer drives sampled on both walls and the shorter drives sampled on one wall only. Samples were also taken from raises connecting the three levels. In addition, the upper levels of the pit were sampled by channel sampling (sample length was 2.0m and section was 10x3cm). Blasthole details are provided above.
WAI Comment: WAI has checked and verified the individual assay files for duplicate samples, overlapping samples and missing collar and survey data. The database verifies correctly and is organised in a sensible and professional manner.
3.4.2.2 Domaining
The gold mineralisation at the Vasilkovskoye deposit is associated with steeply dipping vein sets and associated alteration. The alteration halo is associated with a 0.4g/t Au cut‐off and this grade was used to construct wireframes defining the mineralisation outlines. As the mineralisation at Vasilkovskoye depends on the concentration of quartz veining, veinlets and sulphide mineralisation, the interpretation is based on the outer edge of the alteration halo rather than the interpretation of individual veins. An indicator approach was used to define the edges of mineralisation at 0.4g/t Au. The gold assay values were converted to one or zero to indicate that the original grade was above or below the chosen cut‐off and an indicator kriged block model was created using these data that estimated the probability of a block having an Au grade greater than 0.4g/t. Blocks that had a greater than 50% probability were subsequently used to guide the interpretation to define the outer limits of the mineralised zones. The outline strings were then modified to fit drillhole data more accurately and the final strings were used in the creation of domain wireframes. KMC created 27 domains based on the cut‐off grade of 0.4g/t Au. These domains were separated in to 4 ore zones. Figure 3.4 below is an isometric view of the wireframes delineating these four ore zones. In addition to the grade shell, wireframes of the two main lithological units, diorite and granite, were created by KMC. These were created from a combination of drillhole logging and underground mapping. These wireframes were used to control density assignation.
WAI Comment: The methodology behind the creation of the mineralised zone wireframes is appropriate to the situation at Vasilkovskoye. Attempting an interpretation of individual veins considering distances between boreholes is more than likely to give a wrong interpretation. During snapping of strings to boreholes, where there is ambiguity over interpretation, preference was given to the more recent assay information. Wireframes were verified within Datamine Studio 3 to check for crossovers and open edges and were found to verify correctly.
THIS WEB PROOF INFORMATION PACK IS IN DRAFT FORM. The information contained herein is incomplete and subject to change and it must be read in conjunction with the section headed ‘‘Warning’’on the cover of this Web Proof Information Pack.

KAZZINC LTD Competent Person’s Report for the assets held by Kazzinc Ltd in both Kazakhstan and Russia
61‐0795/MM February 2011
Draft V 0.10 Page 94
Figure 3.4: Isometric View Looking Towards South of Wireframes
Delineating the Four Ore Zones
3.4.2.3 Geostatistical Analysis
Log probability plots of Au in the individual files were constructed before amalgamation of the files to form a complete database. The population of assay values in the blast holes was significantly different from the population of the diamond drillhole samples and channel samples. The blast hole assays were not included in the final assay database due to this indication of a separate statistical population. The final assay database was made up of all the diamond drilling assays and the channel samples. The data shows a strong positive skew with a mean value of 1.10g/t Au and a few very high grade samples with a maximum of 395g/t Au. The statistical analysis of the global data by sample type as described above is listed in Table 3.6. Each of the sample campaigns shows a similar distribution with a strong positive skew indicating that the database as a whole covers a single population. Log probability plots of Au assays were constructed for each of the main lithological types, Diorite and Granite, within the overall sample set. Each of the individual lithological types shows a similar type of distribution with a strong positive skew. There is slight deviation between lithological types at higher grades. The statistical analysis of the global data by lithological type is listed in Table 3.7.
WAI Comment: The final sample database is verified and robust and suitable for further processing and grade estimation with no significant bias present due to sample type or lithology.
THIS WEB PROOF INFORMATION PACK IS IN DRAFT FORM. The information contained herein is incomplete and subject to change and it must be read in conjunction with the section headed ‘‘Warning’’on the cover of this Web Proof Information Pack.

KAZZINC LTD Competent Person’s Report for the assets held by Kazzinc Ltd in both Kazakhstan and Russia
61‐0795/MM February 2011
Draft V 0.10 Page 95
Table 3.6: Standard Statistical Analysis By Borehole Type
Borehole Type Pre‐2008 Drillholes
2008 Drillholes
UG 2009 Drillholes
Field Au Au Au Au No. of Samples 96,370 3,563 33,518 18,228 Minimum 0 0.045 0 0.045 Maximum 395 57.33 104.8 86.58 Range 395 57.29 104.8 86.54 Mean 1.01 0.69 1.43 1.08 Variance 9.94 5.92 9.99 8.31 StandDev 3.15 2.43 3.16 2.88 Skewness 29.03 10.22 6.86 7.86 Kurtosis 2,687.02 157.46 92.95 106.23 Coefficient of Variation 3.13 3.54 2.20 2.67
Table 3.7: Standard Statistical Analysis By Lithology
Lithology Diorite Granite Field Au Au No. of Samples 43,558 107,002 Minimum 0 0 Maximum 118.53 395.00 Range 118.53 395.00 Mean 0.95 1.15 Variance 8.29 10.18 StandDev 2.88 3.19 Skewness 9.77 25.82 Kurtosis 181.64 2,341.68 Coefficient of Variation 3.03 2.76
KMC applied no top‐cuts to the raw data and believe that their search ellipses, estimation parameters and domains adequately account for their influence during Kriging. The mean sample length is 1.3m and the most common sample length is 1m. KMC chose to use a composite length of 1m for the resource estimation.
WAI Comment: Typically top‐cuts are applied to outlier samples which have grades outside of the main population in order to avoid any undue influence during grade estimation. The log‐probability plot for Au assays selected within the mineralised zones shows that in the main there is a single major population within the mineralised domains suggesting good stationarity. There is, however, a very minor high grade population which, left uncut, could lead to localised over estimation within the resource model. Any over estimation though will be minimal on a deposit wide scale. Although the most common sample length is 1m, approximately 34% of samples within the mineralised zones have a larger length than this. A 1m composite length would lead to a large amount of decompositing where samples are split in to two or more samples of equal grade. This has the effect of artificially reducing the local variability of data, in particular suggesting that the nugget value of the data is lower than reality. This may lead to over smoothing of grade within the resource model.
3.4.2.4 Variography
KMC calculated a single set of directional experimental variograms for the Vasilkovskoye deposit in Micromine using the composited samples. Using a lag distance of 10m, horizontal and then vertical experimental variograms were created to define the main axis of anisotropy. This direction corresponded roughly to the trend of the main mineralisation controlling fault. Perpendicular directions to this main axis were assigned for across strike and down dip directions. Single structure spherical models were assigned to the selected experimental directions. Table 3.8 lists the model parameters.
THIS WEB PROOF INFORMATION PACK IS IN DRAFT FORM. The information contained herein is incomplete and subject to change and it must be read in conjunction with the section headed ‘‘Warning’’on the cover of this Web Proof Information Pack.

KAZZINC LTD Competent Person’s Report for the assets held by Kazzinc Ltd in both Kazakhstan and Russia
61‐0795/MM February 2011
Draft V 0.10 Page 96
Table 3.8: Summary of Variogram Models by Domain
Nugget Along Strike
Range Across Strike Range
Down Dip Range
Sill
5.3 40.1 52.3 17.0 10.4
WAI Comment: The directions chosen for experimental variogram creation are appropriate considering the interpreted trends of mineralisation. The variogram models assigned are appropriate to the experimental variograms.
3.4.2.5 Block Modelling Block models were created within the mineralised zone wireframes. KMC used a block model with parent cells of 20m x 20m x 15m in the X, Y and Z directions respectively. Ten subcells were allowed in each direction so that the smallest possible call size was 2m x 2m x 1.5m.
WAI Comment: The block model parent cell sizes are appropriate to the sample spacing and the subcell splitting achieves a good fit against the mineralised zone wireframes.
3.4.2.6 Density Density calculations were based on 1199 wax‐treated samples and 16 pillars testing results received in Soviet times with 147 and 829 additional samples analysed respectively in 2007 and 2009. Two sets of density data are available for the Vasilkovskoye deposit. Density results were organised by rock type and then amalgamated to form groups representing the two major lithological units; diorite and granite. Based on these results KMC assigned an average bulk density of 2.83 to the diorite unit and an average density of 2.68 to the granodiorite into the block model. Blocks within the model were selected using the lithological wireframes and assigned the average grade for that unit. 3.4.2.7 Grade Estimation Gold grades were estimated in to the block model using a zonal control based on domain. Gold grades were estimated using ordinary Kriging as the main estimator and Inverse Power of Distance Squared for comparative purposes. Grades were estimated into parent cell volumes with any subcells all receiving the same grade as the parent. Gold grade in the subcells was the same as in the parent cells. Cell discretisation was set at 2 x 2 x 2. A multiple pass approach was used with up to an initial possible three expansions of the search ellipse if minimum conditions were not met in the first or second ellipse. The first search ellipse is equal in size to 2/3 of the variogram ranges as outlined above. The second ellipse was equal in size to the range of the variograms and the third equal to twice the variogram range. With any blocks left unestimated after the third pass, further expansions of the search ellipse were carried out until all blocks within the mineralised zone estimated. The key estimation parameters used by KMC are listed in Table 3.9. The pass used in estimating blocks formed the basis used in resource classification. 3.4.2.8 Validation A model validation process included the examination of block model versus composites, and the building up of a model grade profile, to compare average grades on vertical slices, as derived from the composites directly, as well as from interpolated model grades. An example Swath plot from this process is shown below in Figure 3.5.
THIS WEB PROOF INFORMATION PACK IS IN DRAFT FORM. The information contained herein is incomplete and subject to change and it must be read in conjunction with the section headed ‘‘Warning’’on the cover of this Web Proof Information Pack.
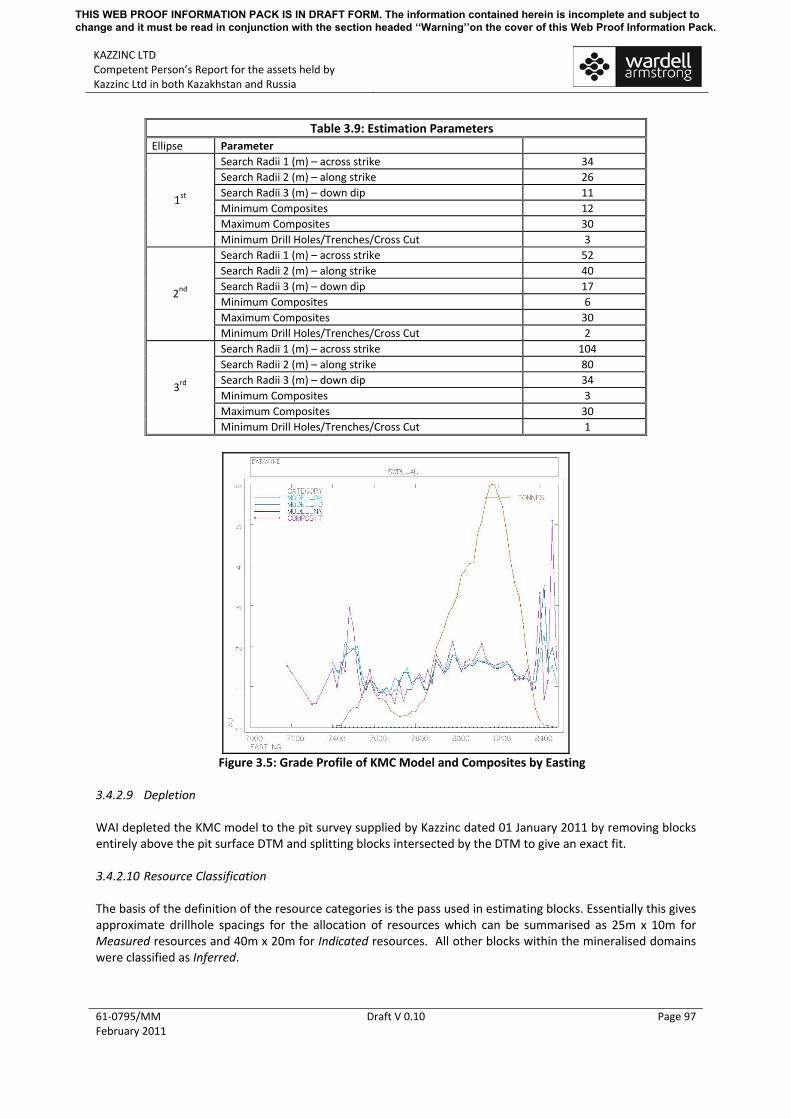
KAZZINC LTD Competent Person’s Report for the assets held by Kazzinc Ltd in both Kazakhstan and Russia
61‐0795/MM February 2011
Draft V 0.10 Page 97
Table 3.9: Estimation Parameters Ellipse Parameter
Search Radii 1 (m) – across strike 34 Search Radii 2 (m) – along strike 26 Search Radii 3 (m) – down dip 11 Minimum Composites 12 Maximum Composites 30
1st
Minimum Drill Holes/Trenches/Cross Cut 3 Search Radii 1 (m) – across strike 52 Search Radii 2 (m) – along strike 40 Search Radii 3 (m) – down dip 17 Minimum Composites 6 Maximum Composites 30
2nd
Minimum Drill Holes/Trenches/Cross Cut 2 Search Radii 1 (m) – across strike 104 Search Radii 2 (m) – along strike 80 Search Radii 3 (m) – down dip 34 Minimum Composites 3 Maximum Composites 30
3rd
Minimum Drill Holes/Trenches/Cross Cut 1
Figure 3.5: Grade Profile of KMC Model and Composites by Easting
3.4.2.9 Depletion WAI depleted the KMC model to the pit survey supplied by Kazzinc dated 01 January 2011 by removing blocks entirely above the pit surface DTM and splitting blocks intersected by the DTM to give an exact fit. 3.4.2.10 Resource Classification The basis of the definition of the resource categories is the pass used in estimating blocks. Essentially this gives approximate drillhole spacings for the allocation of resources which can be summarised as 25m x 10m for Measured resources and 40m x 20m for Indicated resources. All other blocks within the mineralised domains were classified as Inferred.
THIS WEB PROOF INFORMATION PACK IS IN DRAFT FORM. The information contained herein is incomplete and subject to change and it must be read in conjunction with the section headed ‘‘Warning’’on the cover of this Web Proof Information Pack.

KAZZINC LTD Competent Person’s Report for the assets held by Kazzinc Ltd in both Kazakhstan and Russia
61‐0795/MM February 2011
Draft V 0.10 Page 98
3.4.2.11 Resource Evaluation Grade‐tonnage information for the Vasilkovskoye Au deposit (for all domains) is summarised in Table 3.10 for total in‐situ resources estimated in accordance with the guidelines of the JORC Code (2004) at a range of cut‐off grades. The grades and classifications are reported as estimated by OK method in the KMC model, which has been depleted to a pit survey dated 01 January 2011 by WAI.
Table 3.10: Vasilkovskoye Mineral Resource Estimate (WAI 01.01.2011)
(In Accordance with the guidelines of the JORC Code (2004) Cut Off Grade (g/t) 0.4 0.9 1.5 2.0
Tonnage (Mt) 45.23 30.77 19.52 13.71 Au (g/t) 1.75 2.28 2.92 3.41
kg 79,331 70,089 56,924 46,780
Measured
Metal oz 2,550,552 2,253,406 1,830,142 1,504,002
Tonnage (Mt) 141.56 97.72 58.96 39.95
Au (g/t) 1.72 2.21 2.89 3.44 kg 243,862 215,792 170,309 137,371
Indicated
Metal oz 7,840,344 6,937,853 5,475,553 4,416,563
Tonnage (Mt) 186.80 128.49 78.48 53.66
Au (g/t) 1.73 2.22 2.90 3.43 kg 323,193 285,880 227,233 184,150
Measured + Indicated
Metal oz 10,390,893 9,191,256 7,305,694 5,920,566
Tonnage (Mt) 99.08 68.63 39.74 26.21
Au (g/t) 1.77 2.27 3.07 3.77
kg 175,747 156,032 122,157 98,883
Inferred
Metal oz 5,650,405 5,016,526 3,927,426 3,179,143
Notes: 1) Mineral Resources are not reserves until they have demonstrated economic viability based on a Feasibility study or pre‐feasibility study. 2) Mineral Resources are reported inclusive of any reserves. 3) The contained Au represents estimated contained metal in the ground and has not been adjusted for metallurgical recovery. 4) Mined areas removed from evaluation
WAI Comment: WAI has also prepared a geostatistical resource model for the Vasilkovskoye deposit which presents a more global picture. Although the data are not reported here, overall, tonnages are higher and grades lower. However, since production began, it appears that the KMC model better represents the grades of mineralisation being recovered from the pit. As such, a decision was taken in 2010 to utilise the KMC model for short term planning, whilst the WAI model may be more suitable for long term planning purposes. In any event, the large drilling campaign currently taking place at the mine will provide the opportunity for an updated resource model later in 2011.
3.5 Mining 3.5.1 Introduction The Vasilkovskoye open pit mine was originally developed during the early 1980’s to exploit an oxide gold resource. Mining of the oxide material continued from 1980 until 2005, when the resource was finally depleted. In total 14Mt of oxide ore was mined and processed by heap leaching. A significant primary sulphide resource is present below the oxide layer and the decision to re‐develop the mine and build a sulphides processing facility was made during 2006.
THIS WEB PROOF INFORMATION PACK IS IN DRAFT FORM. The information contained herein is incomplete and subject to change and it must be read in conjunction with the section headed ‘‘Warning’’on the cover of this Web Proof Information Pack.

KAZZINC LTD Competent Person’s Report for the assets held by Kazzinc Ltd in both Kazakhstan and Russia
61‐0795/MM February 2011
Draft V 0.10 Page 99
The new plant was designed to process up to 8Mtpa of sulphide ore and a mining study was completed by AMC Consultants in order to design a mining operation to feed the plant at this rate. AMC re‐estimated the resources in accordance with the JORC Code (2004) and undertook geotechnical, hydro‐geological, pit optimisation and preliminary mine design studies. The initial AMC pit design was to a depth of 360m but following re‐optimisation at higher gold prices, the final pit design by Tomsk Institute was for a 440m deep pit. Waste stripping, ore stockpiling and construction of the in‐pit crushing facilities commenced during 2007. Production itself officially began with the completion of the processing facilities in November 2009. Due to problems with the processing plant, however, the mine is currently running at less than half of the design capacity, producing at present in the region of 270kt of ore per month rather than 600kt per month. 3.5.2 Mining Operations The Vasilkovskoye mine is a conventional open pit mine. The ore and waste rock is drilled and blasted prior to excavation by diesel‐hydraulic excavators. The ore is loaded into diesel powered off‐highway rigid dump trucks and hauled to either one of three in‐pit stockpiles, depending on grade, or dumped directly into an in‐pit crusher. The waste rock is hauled to one of two waste dumps depending on which side of the pit is being excavated. The mining fleet is owned and operated by VasGold. Photo 3.1 shows a general view of the open pit mining operations at Vasilkovskoye.
Photo 3.1: General View of Mining Operations at Vasilkovskoye
3.5.3 Drilling and Blasting Blast hole drilling operations at Vasilkovskoye are conducted using 7 blast hole drilling rigs of which 4 units are generally operating at any one time. Three types of rig are in operation, 2 x Atlas Copco Roc L8 DTH drills, 3 x Atlas Copco Pit Viper PV 275 rotary drills and 2 x Atlas Copco DM45 drill rigs capable of both rotary and DTH drilling.
THIS WEB PROOF INFORMATION PACK IS IN DRAFT FORM. The information contained herein is incomplete and subject to change and it must be read in conjunction with the section headed ‘‘Warning’’on the cover of this Web Proof Information Pack.

KAZZINC LTD Competent Person’s Report for the assets held by Kazzinc Ltd in both Kazakhstan and Russia
61‐0795/MM February 2011
Draft V 0.10 Page 100
The Pit Viper rigs are fitted with 251mm drill bits and are used to drill both ore and waste but generally in softer areas of the pit. The DM45’s are fitted with 171mm drill bits and are used to drill both ore and waste in areas of harder ground. The Roc L8’s are fitted with 165mm drill bits and are used for drilling ore and trim blasting of the final faces. The drill patterns vary depending on whether it is ore or waste, the hardness of the rock and the type of drill rig used. The patterns range from an 8.5m x 8.5m pattern for a Pit Viper drilling waste rock down to a 5.0m x 5.0m pattern when using Roc L8’s in ore. The drilling depth in both ore and waste is 8.5m for a 7.5m bench height. All blast holes are loaded with Rioflex bulk emulsion explosives which are supplied by the local division of Maxam, an international explosives supplier and blasting contractor. Maxam has an explosive mixing and storage facility located adjacent to the Vasilkovskoye pit and supplies all explosives and blasting accessories for each blast. An average blast will contain between 120 and 150 holes and liberate between 30k and 50k bank cubic metres (BCMs) of material. The Rioflex emulsion is loaded into the blast hole directly using a bulk explosives delivery truck with a capacity of 11,000kg of bulk emulsion explosives. Each hole contains between 25kg and 55kg of Rioflex depending on the diameter of the blast hole being loaded (170mm to 250mm). The Rioflex column charges are detonated using 450g Pentolite boosters which are placed in the bottom of each blast hole and initiated using non‐electric (Nonel) detonators. All surface delays and connectors are also Nonel. The blast design work is undertaken by VasGold’s Mine Planning department. 3.5.4 Loading and Hauling The main loading and haulage fleet at Vasilkovskoye consists of 6 hydraulic excavators, 5 x Komatsu PC1800 backhoes and 1 x Terex RH120 face shovel, 2 x Komatsu WA800 wheel loaders and 20 x Caterpillar 777F rigid dump trucks. Additional support equipment includes 3 x Caterpillar D10 bulldozers, 3 x Caterpillar graders, 2 x water trucks for dust suppression and 1 x fuel tanker for re‐fuelling the excavators and drill rigs. Excavators are used for loading waste rock whereas ore is usually loaded using the wheel loaders. The mining fleet is currently operating well below its design capacity due to the problems with the processing plant. During the WAI visit only 3 excavators, 1 wheel loader and 13 trucks were operating. Currently, up to 4 blocks are in operation at any one time. Blocks may be waste only blocks or may be mixed ore and waste blocks. In the mixed ore and waste blocks loading of the material is selective with marker tapes and a banksman used to assist the loader operator. On average 8,000BCMs of ore and 23,000BCMs of waste are excavated each day. It is anticipated that the number of blocks in operation and the amount of equipment operating will increase when the plant throughput issues are resolved. The operations are continuous with 2 x 12 hour shifts operating per day. Effective operating hours are 20 hours per day due to meal breaks, shift changes and re‐fuelling/servicing of equipment. Due to the fact that the majority of the mining equipment is diesel‐hydraulic, if the temperature drops below ‐38°C then operations cease to avoid damage to the hydraulic systems due to freezing of oil. Last year, 4 days were lost due to low temperatures and snow storms. 3.5.5 Ore Crushing and Stockpiling The ore is hauled from the working faces to an in‐pit crushing facility located on the south side of the pit. Haul trucks dump the ore into 1 of 2 x 150t rock hoppers which feed 2 x Sandvik CJ615 single toggle jaw crushers at a rate of up to 750tph each. The crushers reduce the ore to ‐350mm and discharge onto a 1,200m long inclined conveyor belt which transports the ore to an 18,000t live coarse ore stockpile that in‐turn feeds the secondary crushing plant.
THIS WEB PROOF INFORMATION PACK IS IN DRAFT FORM. The information contained herein is incomplete and subject to change and it must be read in conjunction with the section headed ‘‘Warning’’on the cover of this Web Proof Information Pack.

KAZZINC LTD Competent Person’s Report for the assets held by Kazzinc Ltd in both Kazakhstan and Russia
61‐0795/MM February 2011
Draft V 0.10 Page 101
Located adjacent to the in‐pit crushing facility are three run‐of‐mine (ROM) stockpiles for low grade ore (0.4g/t to 0.9g/t), medium grade ore (0.9g/t to 2.0g/t) and high grade ore (>2.0g/t). Ore is tipped on the stockpiles when the live stockpile is full, when the crushing plant is not operating due to maintenance or the ore is required to be blended. The secondary crushing plant consists of 2 x cone crushers operating in closed circuit, which reduce the ore to ‐30mm in size. 3.5.5.1 Waste Rock Waste rock from the mining operations is transported to one of two rock dumps located on the east and west sides of the pit. Waste is transported to the closest dump to the face being excavated. Sufficient waste dump capacity is available for the whole mine life but waste haulage distances increase as the mine deepens and the waste dumps extend further from the pit rim. The current average haul distance is 1.5km from the face to the waste dump. VasGold anticipates that the waste haulage fleet will need to increase in future to accommodate longer haulage distances. Five additional trucks will be made available in 2011 when the Shaimerden open pit ceases operations. 3.5.5.2 Dispatch and Control VasGold is in the process of upgrading all the vehicles in the mining fleet with GPS transmitters with the aim of implementing a computerised dispatch and control system. Currently, the shift supervisor and dispatcher are located in an office overlooking the pit and control and record all truck movements manually by radio. This system works well but does not always provide optimal truck movements/waiting times, requires all data to be manually recorded and suffers in poor weather due to reduced visibility. The GPS dispatch system will automatically record all movements of materials and direct each truck to the nearest available excavator, ensuring reduced haul distances and lower waiting times. The GPS dispatch system is due to be operational during 2011. 3.5.5.3 Maintenance Facilities Vasilkovskoye is equipped with very good maintenance facilities for both the mobile and static plant equipment. The main maintenance facility for the mining equipment consists of a “Pit Stop” workshop for minor maintenance, servicing, re‐fuelling, tyre changing and lubrication of the truck and mobile equipment fleet. Each truck visits the Pit Stop once per shift for re‐fuelling and lubrication. A mobile tanker truck which is based at this facility also visits the tracked vehicles (drill rigs, excavators and bulldozers) to re‐fuel and lubricate them without the need for them to be tracked too far. In addition to the Pit Stop, there is a large workshop where both planned and unplanned maintenance is carried out. This workshop is equipped with full servicing, fabrication and machining facilities and is capable of undertaking most servicing and repair tasks. The main items within the mining fleet are maintained under a service contract with their respective Original Equipment Manufacturers (OEMs). Each OEM is allocated a space within this workshop and conducts all necessary maintenance to its fleet of vehicles. Currently, Komatsu, Caterpillar and Atlas Copco are contracted to maintain the fleet of excavators, trucks and drill rigs. 3.5.5.4 Power and Pumping The Vasilkovskoye pit is reported to be relatively dry and requires very little pumping. In winter the ground water is frozen and has no effect on the operations. A borehole fitted with a submersible pump is located in the middle of the pit and does operate during the summer months. WAI did not note any significant ground water during its site visit in October when air temperatures were still above freezing. The is no major requirement for electrical power in the pit due to the fact that all the mining equipment is diesel powered, however, a system of low voltage overhead lines is present to supply power to the in‐pit
THIS WEB PROOF INFORMATION PACK IS IN DRAFT FORM. The information contained herein is incomplete and subject to change and it must be read in conjunction with the section headed ‘‘Warning’’on the cover of this Web Proof Information Pack.

KAZZINC LTD Competent Person’s Report for the assets held by Kazzinc Ltd in both Kazakhstan and Russia
61‐0795/MM February 2011
Draft V 0.10 Page 102
submersible water pump and flood lights for night time operations. Portable diesel lighting sets are also used to supplement the mains powered units. 3.5.6 Mine Planning Long term mine planning at Vasilkovskoye is conducted by the Mine Planning Department and short term planning is conducted by the Mine Operations Department. The Mine Planning Department are primarily responsible for the production of the annual plan, a 3 month plan and 1 month plan. The primary tool used by the Mine Planning Department is Surpac for the production of survey plans and the Gemcom Gems suite of software for blast design. The Mine Operations Department have an input to the monthly plan and then produce their own weekly and daily plans to ensure that the operations are scheduled and managed effectively. There is close communication between the Mine Operations and the Mine Planning Departments. Other key inputs to the management of the mining operations are provided by the Geology Department (Resources and Grade Control), the Survey Department and the Maintenance Department. During the WAI site visit the mining operations appeared to be well managed and the operations were conducted to a very high standard. Inter‐department communications and data sharing tools were well implemented with the effective sharing of basic geological data, survey data and production data to all interested parties.
3.5.7 Ore Reserves
3.5.7.1 Optimisation
A summary of the pit optimisation parameters used are shown in Table 3.11.
Table 3.11: Optimisation Parameters Description Unit Value Gold Price US$/oz 1,000 US$/g 32.15 Selling Cost US$/g 0.30 Ore Production Rate Mtpa 8.0 Discount Factor 10.0% Mining Cost US$/t 1.45 Dilution Factor 17.0% Mining Recovery Factor 95.0% Processing Cost US$/t ore 10.74 Processing Recovery 82% Overall Slope Angle Degrees 41 Derived Cut‐Off Grade g/t 0.48
Optimisation runs were completed on both the KMC and WAI resource block models, and for different cut‐off strategies. Free cut‐off runs were made with the cut‐off effectively calculated directly from the supplied parameters (which gives 0.48g/t). Fixed cut‐off runs were also made at a fixed cut‐off of 0.9g/t. All of the optimisation results, for maximum cashflow pits, are summarised in Table 3.12. The NPV’s and other financial indices shown here are used to select an option pit shell and do not reflect the project valuation. For reference, the same results for final design pit are also shown in the same table. Graphs depicting the results for the KMC free optimisation runs are shown in Figure 3.6 and Figure 3.7, with the selected pit (shell 87), which includes the pit’s western extension.
THIS WEB PROOF INFORMATION PACK IS IN DRAFT FORM. The information contained herein is incomplete and subject to change and it must be read in conjunction with the section headed ‘‘Warning’’on the cover of this Web Proof Information Pack.

KAZZINC LTD Competent Person’s Report for the assets held by Kazzinc Ltd in both Kazakhstan and Russia
61‐0795/MM February 2011
Draft V 0.10 Page 103
Table 3.12: Pit Optimisation Summary Run +
Model Cut‐off g/t
Price US$/oz
Profit US$M
Revenue US$M
Processing Cost US$M
Mining Cost US$M
Total Rock Mt
In‐Situ Mt
Plant Feed Mt
Total Waste Mt
Strip Ratio
Mes Mt Ind Mt Au g/t Au Recovered
t KMC Free cut‐off
0.48 900 3,898 6,430 1,612 920 635 135 151 500 3.70 41 94 1.92 202
KMC Free cut‐off
0.48 1,000 3,909 6,618 1,670 1,038 716 140 156 576 4.12 41 99 1.91 208
KMC Free cut‐off*
0.48 1,060 3,891 6,980 1,782 1,307 901 149 167 752 5.04 43 106 1.89 219
KMC Fixed cut‐off
0.9 900 3,733 5,872 1,219 920 634 102 114 532 5.21 30 72 2.32 184
KMC Fixed cut‐off
0.9 1,000 3,740 5,991 1,247 1,004 692 104 117 588 5.63 30 74 2.31 188
WAI Free* 0.48 900 4,323 8,169 2,594 1,253 864 217 243 647 2.98 16 201 1.52 256 WAI Free 0.48 1,000 4,352 8,845 2,885 1,608 1,109 242 270 868 3.59 18 224 1.48 278 WAI Fixed 0.9 900 3,927 6,485 1,562 996 687 131 146 556 4.25 9 122 2.00 204
Optimisations – Max
Cashflow
WAI Fixed 0.9 1,000 3,963 7,060 1,710 1,387 956 143 160 813 5.68 10 133 1.99 222 Design +
KMC Model 0.9 1,000 3,897 6,575 1,373 1,306 901 115 128 773 6.05 36 92 1.97 206
THIS WEB PROOF INFORMATION PACK IS IN DRAFT FORM. The information contained herein is incomplete and subject to change and it must be read in conjunction with the section headed ‘‘Warning’’on the cover of this Web Proof Information Pack.

KAZZINC LTD Competent Person’s Report for the assets held by Kazzinc Ltd in both Kazakhstan and Russia
61‐0795/MM February 2011
Draft V 0.10 Page 104
0
20
40
60
80
100
120
140
160
180
0
500
1,000
1,500
2,000
2,500
3,000
3,500
4,000
4,500
0 200 400 600 800 1,000 1,200 1,400
Tota
l Ore
Prof
it
Total Rock
Total Rock v Profit and NPV and Total Ore
Profit
Selected
NPV
Total Ore
Figure 3.6: Optimisation Results – KMC Model ‐ Rock v Profit/Ore
0
20
40
60
80
100
120
140
160
180
0
500
1,000
1,500
2,000
2,500
3,000
3,500
4,000
4,500
0 20 40 60 80 100 120 140
Tota
l Ore
Prof
it
Phase
Phase v Profit and NPV and Total Ore
Profit
Selected
NPV
Total Ore
Figure 3.7: Optimisation Results – KMC Model ‐ Phase v Profit/Ore
THIS WEB PROOF INFORMATION PACK IS IN DRAFT FORM. The information contained herein is incomplete and subject to change and it must be read in conjunction with the section headed ‘‘Warning’’on the cover of this Web Proof Information Pack.

KAZZINC LTD Competent Person’s Report for the assets held by Kazzinc Ltd in both Kazakhstan and Russia
61‐0795/MM February 2011
Draft V 0.10 Page 105
3.5.7.2 Pit Design Based on the pit optimisation results, specifically those resulting from the optimisation of the KMC model (Phase 87, for a price of US$1060/oz), as well as the optimisation of the WAI model (US$900/oz), a final pit design was developed. This used the design parameters summarised in Table 3.13.
Table 3.13: Pit Design Parameters Description Unit Value Face Angles
Above 145mRl Degrees 60 Below 145mRl Degrees 65
Berm Width m 10 Bench Height between Berms m 30 Ramp Width m 32 Ramp Gradient 10% Minimum Working Width between Cutback #4 and Final Design m 50
The final pit design is shown in a plan in Figure 3.8, with reference sections in Figure 3.9 and Figure 3.10. The ramp was designed so as to exit in the south, and at the south end a horizontal pad was also incorporated, for the crusher and ore stockpile area, similar to that in cutback #4. A summary of this overall pit evaluation and the estimated reserves at Vasilkovskoye calculated in accordance with the guidelines of the JORC Code (2004), against the KMC model, are shown in Table 3.14.
Table 3.14: Vasilkovskoye Pit Evaluation Summary
(WAI 01 01.2011)
(In Accordance with the guidelines of the JORC Code (2004)
Reserves Other Pit Contents Class Tonnes Mt
Au g/t
Au Contained Moz
Rock Mt
Waste Mt
Strip Ratio
Proven 33.3 1.95 2.088 Probable 90.7 1.94 5.6576 Total 123.97 1.94 7.732 870.65 746.68 6.02
THIS WEB PROOF INFORMATION PACK IS IN DRAFT FORM. The information contained herein is incomplete and subject to change and it must be read in conjunction with the section headed ‘‘Warning’’on the cover of this Web Proof Information Pack.

KAZZINC LTD Competent Person’s Report for the assets held by Kazzinc Ltd in both Kazakhstan and Russia
61‐0795/MM February 2011
Draft V 0.10 Page 106
Figure 3.8: Plan of Final Pit Design
THIS WEB PROOF INFORMATION PACK IS IN DRAFT FORM. The information contained herein is incomplete and subject to change and it must be read in conjunction with the section headed ‘‘Warning’’on the cover of this Web Proof Information Pack.

KAZZINC LTD Competent Person’s Report for the assets held by Kazzinc Ltd in both Kazakhstan and Russia
61‐0795/MM February 2011
Draft V 0.10 Page 107
Figure 3.9: Section A‐A’ Of Final Pit Design
THIS WEB PROOF INFORMATION PACK IS IN DRAFT FORM. The information contained herein is incomplete and subject to change and it must be read in conjunction with the section headed ‘‘Warning’’on the cover of this Web Proof Information Pack.

KAZZINC LTD Competent Person’s Report for the assets held by Kazzinc Ltd in both Kazakhstan and Russia
61‐0795/MM February 2011
Draft V 0.10 Page 108
Figure 3.10: Section B‐B’ Of Final Pit Design
THIS WEB PROOF INFORMATION PACK IS IN DRAFT FORM. The information contained herein is incomplete and subject to change and it must be read in conjunction with the section headed ‘‘Warning’’on the cover of this Web Proof Information Pack.

KAZZINC LTD Competent Person’s Report for the assets held by Kazzinc Ltd in both Kazakhstan and Russia
61‐0795/MM February 2011
Draft V 0.10 Page 109
3.5.7.3 Scheduling A mining schedule was developed for the final pit, incorporating the supplied earlier cutbacks (#1, #2 and #4) and based on an 8Mtpa mill production rate. Material from the final cutback is not mined until year 5, with the bulk of production from this final cutback coming after year 6. A summary of this schedule is shown in Table 3.15, with a diagrammatic cross‐section in Figure 3.11. This schedule has been developed with a relatively low stripping ratio for the first 5 years. 3.5.8 Grade Control Within the open pit, grade control is done using blastholes, drilled on a 6x6m grid to a depth of 7.5m for the 7m bench. Several blasthole rigs are used including Atlas Copco ROC, drilling 151 and 171mm holes, and the Viper which drills 250mm holes.
THIS WEB PROOF INFORMATION PACK IS IN DRAFT FORM. The information contained herein is incomplete and subject to change and it must be read in conjunction with the section headed ‘‘Warning’’on the cover of this Web Proof Information Pack.
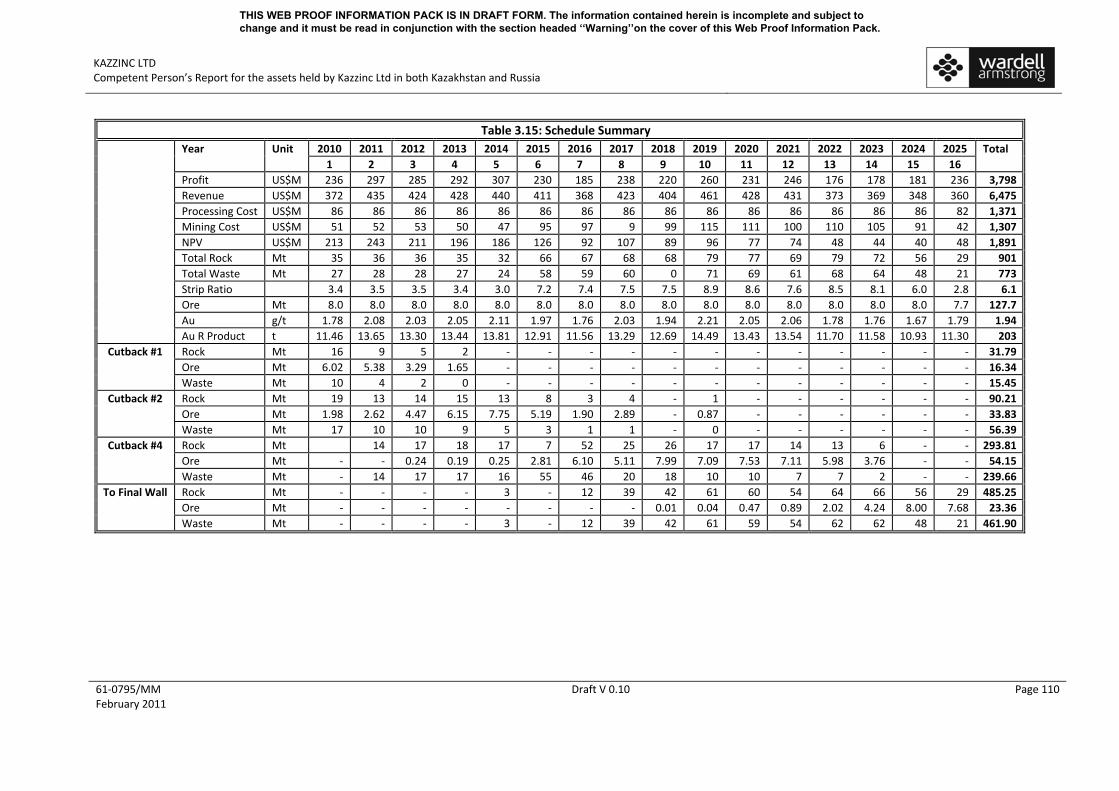
KAZZINC LTD Competent Person’s Report for the assets held by Kazzinc Ltd in both Kazakhstan and Russia
61‐0795/MM February 2011
Draft V 0.10 Page 110
Table 3.15: Schedule Summary 2010 2011 2012 2013 2014 2015 2016 2017 2018 2019 2020 2021 2022 2023 2024 2025 Year Unit 1 2 3 4 5 6 7 8 9 10 11 12 13 14 15 16
Total
Profit US$M 236 297 285 292 307 230 185 238 220 260 231 246 176 178 181 236 3,798 Revenue US$M 372 435 424 428 440 411 368 423 404 461 428 431 373 369 348 360 6,475 Processing Cost US$M 86 86 86 86 86 86 86 86 86 86 86 86 86 86 86 82 1,371 Mining Cost US$M 51 52 53 50 47 95 97 9 99 115 111 100 110 105 91 42 1,307 NPV US$M 213 243 211 196 186 126 92 107 89 96 77 74 48 44 40 48 1,891 Total Rock Mt 35 36 36 35 32 66 67 68 68 79 77 69 79 72 56 29 901 Total Waste Mt 27 28 28 27 24 58 59 60 0 71 69 61 68 64 48 21 773 Strip Ratio 3.4 3.5 3.5 3.4 3.0 7.2 7.4 7.5 7.5 8.9 8.6 7.6 8.5 8.1 6.0 2.8 6.1 Ore Mt 8.0 8.0 8.0 8.0 8.0 8.0 8.0 8.0 8.0 8.0 8.0 8.0 8.0 8.0 8.0 7.7 127.7 Au g/t 1.78 2.08 2.03 2.05 2.11 1.97 1.76 2.03 1.94 2.21 2.05 2.06 1.78 1.76 1.67 1.79 1.94
Au R Product t 11.46 13.65 13.30 13.44 13.81 12.91 11.56 13.29 12.69 14.49 13.43 13.54 11.70 11.58 10.93 11.30 203 Rock Mt 16 9 5 2 ‐ ‐ ‐ ‐ ‐ ‐ ‐ ‐ ‐ ‐ ‐ ‐ 31.79 Ore Mt 6.02 5.38 3.29 1.65 ‐ ‐ ‐ ‐ ‐ ‐ ‐ ‐ ‐ ‐ ‐ ‐ 16.34
Cutback #1
Waste Mt 10 4 2 0 ‐ ‐ ‐ ‐ ‐ ‐ ‐ ‐ ‐ ‐ ‐ ‐ 15.45 Rock Mt 19 13 14 15 13 8 3 4 ‐ 1 ‐ ‐ ‐ ‐ ‐ ‐ 90.21 Ore Mt 1.98 2.62 4.47 6.15 7.75 5.19 1.90 2.89 ‐ 0.87 ‐ ‐ ‐ ‐ ‐ ‐ 33.83
Cutback #2
Waste Mt 17 10 10 9 5 3 1 1 ‐ 0 ‐ ‐ ‐ ‐ ‐ ‐ 56.39 Rock Mt 14 17 18 17 7 52 25 26 17 17 14 13 6 ‐ ‐ 293.81 Ore Mt ‐ ‐ 0.24 0.19 0.25 2.81 6.10 5.11 7.99 7.09 7.53 7.11 5.98 3.76 ‐ ‐ 54.15
Cutback #4
Waste Mt ‐ 14 17 17 16 55 46 20 18 10 10 7 7 2 ‐ ‐ 239.66 Rock Mt ‐ ‐ ‐ ‐ 3 ‐ 12 39 42 61 60 54 64 66 56 29 485.25 Ore Mt ‐ ‐ ‐ ‐ ‐ ‐ ‐ ‐ 0.01 0.04 0.47 0.89 2.02 4.24 8.00 7.68 23.36
To Final Wall
Waste Mt ‐ ‐ ‐ ‐ 3 ‐ 12 39 42 61 59 54 62 62 48 21 461.90
THIS WEB PROOF INFORMATION PACK IS IN DRAFT FORM. The information contained herein is incomplete and subject to change and it must be read in conjunction with the section headed ‘‘Warning’’on the cover of this Web Proof Information Pack.

KAZZINC LTD Competent Person’s Report for the assets held by Kazzinc Ltd in both Kazakhstan and Russia
61‐0795/MM February 2011
Draft V 0.10 Page 111
Figure 3.11: W‐E Section, Depicting Mining Schedule
THIS WEB PROOF INFORMATION PACK IS IN DRAFT FORM. The information contained herein is incomplete and subject to change and it must be read in conjunction with the section headed ‘‘Warning’’on the cover of this Web Proof Information Pack.

KAZZINC LTD Competent Person’s Report for the assets held by Kazzinc Ltd in both Kazakhstan and Russia
61‐0795/MM February 2011
Draft V 0.10 Page 112
The Viper takes one sample per blasthole, the ROC’s three samples (2.5x3m). Holes are laid out by GPS and tagged using nails hammered into the ground. During the early development of the mine, extensive tests were undertaken to determine the optimum grade control methodology. This involved changing the drillhole spacing and importantly, using angled RC holes. Bearing in mind that the mineralisation is broadly a sub‐vertical stockwork, it is logical that angled holes will be better at delineating the steeply dipping mineralised features as opposed to vertical holes. This was in fact the case, with the angled holes providing a better reconciliation between predicted and actual grades. However, the mine currently does not operate an RC rig, although angled exploration holes are planned for early 2011 to improve grade estimation.
WAI Comment: The introduction of angled RC holes for grade control should greatly improve the ability of the mine to predict bench grades thus allowing more efficient management of stockpile/direct feed/waste issues.
3.5.9 Reconciliation In an effort to establish how accurate the existing KMC resource model is in relation to mined production, the Company has undertaken some preliminary reconciliation studies. The results of this work for 2010 are shown in Table 3.16 below.
Table 3.16: Reconciliation Data of Block Model to Mining For 2010 Balanced Ores
Ore Tonnes Grade g/t Au kg KMC Block Model 3,278,406 2.43 7,976.4 Production 3,271,189 2.29 7,496.2 Difference ‐7,217 ‐0.14 ‐480.1
Off‐balanced Ores KMC Block Model 1,177,973 0.62 735.1 Production 2,332,834 0.59 1,371.8 Difference 1,154,861 ‐0.04 636.8
Reconciling model grade to the production grade is always difficult due to the uncertainty in sampling the mined material. At Vasilkovskoye, the production grade was estimated from sampling the belt at the plant and assuming that this material has increased a 12% dilution, thus allowing grade to be back‐calculated. Broadly, the results from the Balanced Ore (run‐of‐mine material) were good with only a small decrease in grade and produced gold in comparison to the model by 5% lower which appears to be well within tolerance for normal losses within the pit. For the Off‐balance Ore (low‐grade material), there was a significant production tonnage increase, although at approximate predicted grade. The reasons for this are that the mine has consistently mined low‐grade material that is not in the model, either on the periphery of the ore zone or as additional lenses. With high gold prices, off‐balance material may well be economic to mine – a view shared by the Company. 3.5.10 Stockpile At present, there are three stockpiles used by the mine:
• High clay content; • High grade, and
THIS WEB PROOF INFORMATION PACK IS IN DRAFT FORM. The information contained herein is incomplete and subject to change and it must be read in conjunction with the section headed ‘‘Warning’’on the cover of this Web Proof Information Pack.

KAZZINC LTD Competent Person’s Report for the assets held by Kazzinc Ltd in both Kazakhstan and Russia
61‐0795/MM February 2011
Draft V 0.10 Page 113
• Run‐of‐mine. The high clay content ore is not currently treated and therefore this stockpile does not play a part in everyday mining activities. The other two remaining stockpiles are formed by trucks dumping ore. Each truck is grab sampled (several small pieces) to give approximately 6kg of material. The stockpile is then levelled and a simple average grade applied to the horizon. When the company plans to utilise a part of the stockpile, local averages are calculated both in plan and section, based on the original grab sample data to provide a grade for that particular slice of the stockpile. During 2010, some (864kt @ 2.57g/t Au) 23% of total ore to the concentrator came from the stockpiles. This was in contrast (2,779kt @ 1.78g/t Au) to the balanced ore that went directly from the pit to the concentrator as well as (113kt @3.83g/t Au) of high grade ore.
WAI Comment: The use of 6kg grab samples to provide grade information for each truck is flawed as it is extremely unlikely that any degree of “representability” can be achieved. It may be possible with the introduction of the angled RC holes for grade control that the amount of ore passing through the stockpiles might be reduced, with an associated decrease in numbers of assays required.
3.6 Process 3.6.1 Introduction Processing of the Vasilkovskoye ores was initially undertaken in the 1990’s using heap leach technology to treat the oxide ores. In 2006 the oxide ores were exhausted and a decision was made to begin the treatment of the sulphide ores by using flotation and cyanide leaching. The design and plant construction was undertaken by Toms (Irkutsk) in conjunction with Kazzinc staff. The plant design was approved by the Kazak regulatory authorities and the construction of an 8Mtpa processing facility was begun in late 2007. Plant commissioning began in November 2009. In 2010, the equipment pre‐commissioning was undertaken and in October 556kt of ore was processed which represents 83% of design plant capacity. 3.6.2 Process Testwork of Sulphide Ores The results of rational analysis undertaken on two samples of Vasilkovskoye primary ores are given in Table 3.17.
Table 3.17: Rational Analysis Results
Phase Sample 1 Sample 2
Free gold 11.65 7.16
Cyanide leachable gold 63.82 74.95
Total cyanide recoverable 75.47 82.11
Gold in Sulphides 20.28 15.81
Gold in Silicates 4.25 2.08
Total 100.0 100.0
The tests were undertaken at a grind size of 95% passing 71µm. The samples contained relatively low levels of free gold (11.6% for Sample 1 and 7.16% for Sample 2). The cyanide recoverable gold contents were 75.47% and 82.11%. A significant proportion of the gold was associated with sulphide minerals.
THIS WEB PROOF INFORMATION PACK IS IN DRAFT FORM. The information contained herein is incomplete and subject to change and it must be read in conjunction with the section headed ‘‘Warning’’on the cover of this Web Proof Information Pack.

KAZZINC LTD Competent Person’s Report for the assets held by Kazzinc Ltd in both Kazakhstan and Russia
61‐0795/MM February 2011
Draft V 0.10 Page 114
3.6.3 Testwork Undertaken at AMMTEC for Bateman Minerals A sample assaying 3.12g/t Au, 0.3g/t Ag, 2.3% As and 3.2% Fe was subjected to a programme of metallurgical testwork at AMMTEC (Australia). The ore minerals were found to be sulphides with significant quantities of arsenopyrite and lesser amounts of pyrite. Mineralogical analysis showed the presence of fine‐grained gold particles (less than 10 microns) predominantly occurring in arsenopyrite. Direct cyanidation of the ore showed that gold recovery increased with decrease in particle size, with a maximum recovery of 75.4% obtained at a grind size of 80% passing 45µm. Gravity concentration tests gave low upgrading with 40.2% of the gold being recovered at a 2.51% mass recovery and a concentrate grade of 57.2g/t. Flotation tests on the gravity tailings gave high gold recoveries of 95‐97%. The recovery of gold from the head sample by flotation was lower, at 84.6%. The overall recovery by gravity and flotation was 90.8%. Direct cyanidation of the flotation concentrate after ultrafine grinding to 100% passing 25µm, gave a gold recovery of 77.3%. Preliminary alkalization of the concentrate with NaOH for 8 hours increased the gold recovery up to 83.8% from the cyanidation operation. A summary of the test results undertaken by AMMTEC is summarised in Table 3.18.
Table 3.18: AMMTEC Test Results
Technology Overall gold Recovery %
Comments
Direct ore leaching 75.4 Passing size 80% ‐0,045 mm Gravity concentration – cyanidation of gravity concentrate and tailings
80.3 Passing size 95%‐0,074 mm,
Gravity concentration with flotation and cyanidation of concentrates
79.2 Grind size 95% ‐0,074 mm, Regrind ‐25µm (concentrates).
Gravity concentration + cyanidation of concentrates – cyanidation of flotation tailings
85.9 Passing size 95%‐0,074 mm Less than 25 µm (concentrates)
Further testing at Kazzinc’s ZMCC laboratory broadly confirmed these results. The main conclusions of the testwork programmes were as follows: 1. Gravity concentration and flotation will give a recovery of gold into concentrates of 85‐90.8%; 2. Recovery of gold from the concentrates is complicated due to their refractory nature. This was
attributed to the fine disseminations of gold (less than 10 microns) and the presence of cyanicides which decrease the efficiency of the cyanidation process. The leach recovery of gold from the concentrates without regrinding was 66‐69%;
3. The application of ultrafine grinding down to 25 microns resulted in the additional exposure of fine‐grained gold with leach recoveries increasing to 87.0‐88.4%) but also lead to increased consumptions of cyanide (of up to 39kg/t of concentrate); and
4. An alkalization pre‐treatment with fine grinding increased gold recovery and resulted in lower cyanide consumptions.
THIS WEB PROOF INFORMATION PACK IS IN DRAFT FORM. The information contained herein is incomplete and subject to change and it must be read in conjunction with the section headed ‘‘Warning’’on the cover of this Web Proof Information Pack.

KAZZINC LTD Competent Person’s Report for the assets held by Kazzinc Ltd in both Kazakhstan and Russia
61‐0795/MM February 2011
Draft V 0.10 Page 115
3.6.4 Process Flowsheet 3.6.4.1 Crushing Ore is subjected to primary crushing in the open pit and the ‐550mm fraction is conveyed to a coarse ore stockpile by overland conveyors. The primary crushing and ore transport are the responsibility of the mine department. The coarse ore stockpile has a live capacity of 18,000t. Ore is recovered using 13 vibrating feeders and is conveyed via a surge hopper to an inclined double deck vibrating screen fitted with 50 and 30mm decks. The screen oversize passes to a Sandvik H8800C cone crusher (open size setting of 40mm) and the crushed product is further screened at 30mm with the oversize passing to a tertiary Sandvik H8800EF cone crusher. The tertiary crushed product and the screen undersize products are combined and are conveyed to one of two fine ore bins, each of 4,200m3 capacity. The products from the fine ore bins are conveyed via surge bins to two parallel lines utilising KHD high pressure grinding rolls (HPGR) which are designed to crush the material to 80% passing 5.2mm. The roller presses are fitted with two 1745kW motors each. The design feed rate is 1,280tph (1,380tph maximum). The edge products are recirculated to the surge bins. 3.6.4.2 Milling The ore is ground in two parallel circuits, each using a single stage 6.7 x 11.3m Outukumpu ball mills; with each mill being powered using two 4.9MW motors. The ball mill discharge is cycloned using Krebs D75 cyclones and the underflow is returned to the mill. The cyclone overflow passes to “Intercycle flotation” which consists of three 130m3 Outotec flotation tank cells to recover coarsely liberated sulphide minerals. The flotation tailings are cycloned and the overflows pass to rougher flotation. The secondary cyclone underflows gravitate via a 1.5mm screen to an XD70 Knelson concentrator. The Knelson concentrates are pumped to a regrind ball mill. In October 2010, ore processing reached 556kt and in December all the required repairs and maintenance works were completed, including replacement and new design of gearboxes and reinforcement of foundation. 3.6.4.3 Flotation Rougher flotation takes place in three 130m3 Outotec flotation tank cells which give a rougher flotation time of 16 minutes. Rougher tailings pass to scavenger (Control) flotation where a further four 130m3 cells give a further 20 minutes flotation time. The scavenger tailings are pumped via a trash screen to three Knelson KC‐CVD60 concentrators in parallel (continual discharge). The concentrates are cleaned using a single KC‐CVD20. The concentrate from this machine joins the concentrate from the grinding circuit for regrinding. The rougher concentrate is cleaned in two stages, with the first stage consisting of four 10m3 cells and the second stage of three 5m3 cells. The residence times are 12 and 10 minutes respectively. The final flotation concentrates are pumped to the regrind mill. The mass pull to the flotation concentrate is 4.8%. The plant has experienced problems in 2010 with insufficient pump capacities within the flotation circuit. This has now been overcome with the replacement of many 6” x 4” pumps with 8” x 6” models. During the WAI site visit, high pulp levels and minimum froth depths were observed in the flotation plant. However, recent plant recovery statistics (Table 3.20) indicate that the plant is nearing design efficiency. 3.6.4.4 Concentrate Regrind The gravity and flotation concentrates are combined and ground in a 3.6 x 5.5m ball mill fitted with a 1250kW motor to achieve a product size of 95% passing 45µm.
THIS WEB PROOF INFORMATION PACK IS IN DRAFT FORM. The information contained herein is incomplete and subject to change and it must be read in conjunction with the section headed ‘‘Warning’’on the cover of this Web Proof Information Pack.

KAZZINC LTD Competent Person’s Report for the assets held by Kazzinc Ltd in both Kazakhstan and Russia
61‐0795/MM February 2011
Draft V 0.10 Page 116
3.6.4.5 Ultrafine Grinding The combined concentrates are then subjected to ultrafine grinding, using Deswick mills, to achieve a product grading 80‐90% passing 4μm. There are three 2m3 mills operating in parallel. The grinding media is obtained from a French supplier (SiLi beads, 1‐6 –1.8mm). The Deswick mills have failed to achieve the target grind size and are currently only achieving 60‐65% passing 4μm. Since December, the mill’s vendors have been performing the works to assure the production target grind size achieves not less than 85% passing 4μm, which involves the use of a hydrocyclone prior to the Deswick mills, scheduled for implementation in March 2011. 3.6.4.6 Gold Recovery from the Gravity and Sulphide Concentrates The gold in the gravity and flotation concentrates is partially refractory and the sulphide minerals need to be oxidised to ensure maximum gold recovery. This is achieved via the “Leachox Process”, supplied by Maelgwyn Minerals Services (MMS). After ultrafine grinding, the concentrates, typically assaying 40g/t Au and 25‐30% As, are pumped at 30‐40% solids to four oxidation tanks in series, each fitted with two “Aachen Reactors”, with one operating and the other on standby. These are externally mounted and supply oxygen (900m3/h), which is obtained from an Oxygen Plant, as ultrafine bubbles, thus giving the opportunity for oxidation of the sulphide minerals. Dissolved oxygen levels are maintained at 20ppm. However, the Company plans to replace the Aachen reactors with special “Telescopic Dispersion Units” within the period January to March 2011 in order to increase the level of dissolved oxygen to 30‐35ppm. Lime is added to control pH. After oxidation the pulp is pumped to a Preliminary leach column where lime and cyanide is added to a pH of 10‐11 and a cyanide concentration of 0.2g/l. There are a further two leach tanks (250m3) and a further eight tanks for carbon in leach (CIL) 3.6.4.7 Detox There are three tanks for detox. The first two are dosed with lime and sodium metabisulphite for cyanide destruction. Iron sulphate (1,140g/t) and lime are added to the third tank for arsenic precipitation. The Company has installed a Mintec analyser to control cyanide levels for direct measurement of Total, WAD and Free cyanide. 3.6.4.8 Gold Recovery from Carbon Gold is recovered from carbon using the standard Zardra method at 140‐150C and 2.5 atmospheres. Final gold loadings are approximately 3.5‐5.8kg/t. 6t of carbon is eluted giving a gold production per cycle of approximately 25‐30kg. The elution cycle is 12 hours and gold stripping efficiency is reported to be 95%. Gold is recovered from the eluate by electrolysis is two cells with 40 cathodes. The gold bearing sludge is removed by high pressure water sprays and filtered and dried. The electrolysis product is smelted to produce Doré assaying 85‐92% Au in 12kg bars. The carbon is regenerated at a rate of 500kg/h in a furnace at 600°C. 3.6.5 Consumables The consumables for the process plant are given in Table 3.19.
THIS WEB PROOF INFORMATION PACK IS IN DRAFT FORM. The information contained herein is incomplete and subject to change and it must be read in conjunction with the section headed ‘‘Warning’’on the cover of this Web Proof Information Pack.

KAZZINC LTD Competent Person’s Report for the assets held by Kazzinc Ltd in both Kazakhstan and Russia
61‐0795/MM February 2011
Draft V 0.10 Page 117
Table 3.19: Vasilkovskoye Process Consumables Crushing and grinding Kg/tonne Steel balls 1.4336 80mm 0.6846 70mm 0.2251 60mm 0.4259 40mm 0.1091 Soda ash 0.4000 Flotation and Gravity Metal balls 25 mm 0.0489 Potassium butyl xanthogenate (BKK) 0.1318 Sodium‐butyl Aeroflot 0.0242 Pine oil 0.0331 Frother X‐133 0.0003 Collector AERO 7279A 0.0003 Depressor AERO 7261A 0.0015 Flocculant Magnafloc 10 0.0040 Lime 0.0024 Coagulator Mafnafloc 1697 ‐ Ceramic balls 0.0116 Flotation agent (OXAL) Т‐92 0.0009 Flotation agent Flotanol С7 0.0009 Thickening, industrial water supply and tailings Flocculant Magnafloc 10 0.0380 Coagulant Magnafloc 1697 0.0139 Hydrometallurgy Sodium cyanide, 88% activity 0.3455 Lime 70% activity 1.3087 Diesel fuel ‐ Caustic ash NaOH, 96% activity 0.0352 Hydrochloric acid (HCl), 35 % activity 0.0117 Sulphuric acid 0.0014 Sodium metabisulphite 1.2130 Ferrous sulfate grade II, 1.3931
3.6.6 Metallurgical Performance The technological recoveries for the process plant for 2010 are given in Table 3.20 below.
Table 3.20: Vasilkovskoye Process Plant Recoveries
Month Tonnes treated
Head Grade Au ppm Recovery % % Flotation Recovery
% Hydrometallurgical Recovery
January 154,383 1.65 47.9 64.2 74.5 February 130,661 1.78 50.2 67.4 74.3 March 230,131 1.65 42.5 63.5 68.5 April 247,041 1.78 61.2 71.9 85.1 May 450,915 1.7 59.0 66.9 81.3 June 441,540 1.77 59.3 55.0 82.5 July 324,685 1.82 62.6 77.4 80.9
August 373,276 2.07 67.2 81.4 82.5 September 257,633 2.02 62.5 79.2 77.8 October 556,868 2.13 61.8 79.7 77.1 November 435,297 2.04 59.0 82.1 71.8 December 203,261 2.28 57.6 77.1 74.7
THIS WEB PROOF INFORMATION PACK IS IN DRAFT FORM. The information contained herein is incomplete and subject to change and it must be read in conjunction with the section headed ‘‘Warning’’on the cover of this Web Proof Information Pack.

KAZZINC LTD Competent Person’s Report for the assets held by Kazzinc Ltd in both Kazakhstan and Russia
61‐0795/MM February 2011
Draft V 0.10 Page 118
There was a gradual increasing in recovery throughout the year. The maximum recovery was 67.2% and it appears that recoveries are ranging between 60‐67%. The plant head grade has generally increased throughout the period, ranging from 1.65ppm Au (January) to 2.28ppm Au (December). The tonnage throughput peaked in May and April, but decreased again in August and September before reaching 556kt in October. However, throughput decreased during November and December due to refurbishment of the Outotec mills. 3.6.7 Labour A total of 597 persons are employed in the Plant. There are three senior managerial positions, and a total of 18 supervisors. There are four senior mechanical positions and an electrical foreman with two electrical engineers. A further 48 are classified as “technical and engineering” staff and there are 516 workers. 3.6.8 Assay Laboratory The Vasilkovskoye mine contains a well‐equipped assay laboratory. The laboratory is not accredited but there are plans to apply for Accreditation in the near future and also install a Quality Management system. The laboratory typically assays 8,000 mine and geological samples and 1,500 plant samples per month. Sample preparation is achieved in three stages using a combination of jaw crushers, rolls crushers and ring mills to produce material that is 100% passing 200 mesh. The equipment is both Russian and Australian (Rocklabs). The sample preparation laboratory was well equipped and maintained. Gold analysis is undertaken using fire assay (in duplicate) on 50g trials for geological or plant feed and tails samples and 25g for plant concentrates. The laboratory has four furnaces, each capable of holding 24 crucibles. There are also three cupellation furnaces. The beads are parted using nitric acid and the gold weighed using a Sartorius micro balance to a limit of detection of 0.2ppm Au. The laboratory is also equipped with atomic adsorption machines (Perkin Elmer and Kvant) for solution analysis. The laboratory also has an “Express Laboratory” for Lasersizer particle size analysis and rapid analysis of process solutions (Analysis, pH and cyanide). The laboratories QA/QC procedures include duplicate gold analysis, where the agreements between analyses must be within certain limits which are dictated by state protocol. There is a regular programme of external check analyses. The laboratory also uses International reference materials such as those supplied by “Geostats”. 3.6.9 Conclusions The plant has experienced a long ramp up period due to problems with equipment and lower than expected process recoveries. However, recent initiatives by the company has addressed many of these issues to allow plant production and recovery to approach design parameters, although optimal conditions have yet to be reached. It is reported by Kazzinc that the key to the Vasilkovskoe process is the ultrafine grinding of the bulk concentrate in order to liberate the fine Gold. This is achieved through the use of Deswik ultrafine grinding mills which take the particle size to 90% <4µm. The ultrafinely ground pulp is then subjected to an intensive aeration process in four columns. Oxygen is injected through telescopic gas dispergators (produced through Kazzinc's JV with Bakor Ceramics of Russia), where oxygen is forced into a ceramic membrane and finely diffused into the pulp, with approximately 20‐25ppm dissolved oxygen content. The process results in an Iron
THIS WEB PROOF INFORMATION PACK IS IN DRAFT FORM. The information contained herein is incomplete and subject to change and it must be read in conjunction with the section headed ‘‘Warning’’on the cover of this Web Proof Information Pack.

KAZZINC LTD Competent Person’s Report for the assets held by Kazzinc Ltd in both Kazakhstan and Russia
61‐0795/MM February 2011
Draft V 0.10 Page 119
hydroxide fim coating the outer shell of the mineral particles, thereby passivating the refractory mineralisation prior to the cyanide leach process. The pulp then passes through cavitators, which are required in order to clean the surface area of the mineral particles through rapidly changing pressure. The pulp is then processed through a conventional CIL system. The process is designed to keep the arsenopyrite mollecular structure in tact, oxidising only the outer surface in order to reduce subsequent cyanide consumption and increase gold dissolution. A small proportion of the arsenic will be dissolved, which is subsequently handled through the addition of Iron sulphate into the pulp in order to neutralise the arsenic into scorodite prior to discharge into the sorbtion tailings dam. Empirical tests to date, performed by Kazzinc, show that sorbtion tailings contain only unliberated gold which has been interpreted by Kazzinc as indicating the success of the aeration process but highlights the sub‐optimal nature of the current grind size achieved by the Deswick mills. Going forward, WAI believes that the problem of low process recoveries may be difficult to fully solve as although the Leachox process is not designed to achieve a high degree of oxidation of the sulphide minerals it is very dependent on grind size to liberate refractory gold particles. The low pulp temperatures being achieved in the Leachox Plant certainly indicate that very little oxidation of sulphide minerals is occurring, therefore, without the grind performance, it is difficult for WAI to see clearly how the refractory or locked gold will be liberated. 3.7 Environmental, Social and Health & Safety Issues 3.7.1 Introduction 3.7.1.1 Scope of Study This review of the environmental and social performance of the Vasilkovskoye Mine and processing project is based on a brief site visit and reconnaissance, together with discussions with staff of the geology department and Department of Health Safety & Environment. In the short time available it is only possible to have an overview of the project and the way that the company manages its health, safety, environmental and social obligations. Whilst WAI believes it has gained sufficient insight into the key issues and performance, there may be additional information that was not seen, or variations in interpretation of the available data that could not be explored further. 3.7.1.2 Method of Study and Information Sources A site visit was undertaken over 2 days between 12 and 14 October 2010. Documents and plans were inspected but not translated from Russian, and key data was provided by the company staff. The main documents inspected are listed as appropriate in this Chapter. In addition to site specific information, the overall Kazzinc Company Environmental Policy and Programme was discussed with the Chief Environmental Manager. 3.7.2 Environmental & Social Setting and Context 3.7.2.1 Landscape, Topography The Vasilkovskoye mine is located about 10km from Kokshetau town, in a flat, open steppe landscape. The mine buildings, structures and dumps dominate the landscape.
THIS WEB PROOF INFORMATION PACK IS IN DRAFT FORM. The information contained herein is incomplete and subject to change and it must be read in conjunction with the section headed ‘‘Warning’’on the cover of this Web Proof Information Pack.

KAZZINC LTD Competent Person’s Report for the assets held by Kazzinc Ltd in both Kazakhstan and Russia
61‐0795/MM February 2011
Draft V 0.10 Page 120
3.7.2.2 Climate The climate is characterised by a semi‐arid continental climate, with hot dry summers and cold dry winters. Average annual rainfall is around 260mm. 3.7.2.3 Land Use and Land Cover Theland cover is dominated by short dry grassland (mainly Stipa species) with no trees and only very occasional shrubs. Lower lying areas consist of wetland and ponds, probably seasonal in nature. 3.7.2.4 Water Resources Surface Waters Whilst the mine area has few surface watercourses, the area drains generally to the south and southwest into the River Chaglinka, which flows northeast to Lake Chagly (Shaghalaltengiz). To the south of the mine, in the vicinity of the old heap leach dumps and current TMF, the land is lower lying and there are a number of small seasonal ponds, probably arising from the high water table (Photo 3.2). This zone generally drains east into the River (visible in Photo 3.3), though there is no defined watercourse or drain. Groundwater The groundwater is sparse and there are no major aquifers. In the area of the TMF it is within 10m of the surface and is reported to be saline. In the vicinity of the open pit the GKZ groundwater reserve is stated to be 3,800m3/day. Groundwater flows are very slow, due to the low permeability of the rocks. Water Supply The mine is licensed to obtain water from the River Chaglinka (potable), groundwater from the open pit, boreholes (near the river) and from the Murzakolsol Lake (industrial water). The water sources for Murzakolsol Lake are surface waters, drainage water from Kokshetau city after treatment and precipitation. Water from Murzakolsol Lake is neutralised and treated using ultraviolet lamps. Nearby villages obtain their water supply from boreholes. 3.7.3 Communities and Livelihoods There are 3 local villages: a) Konysbay, 2km to the east of mine, on the River Chaglinka and close to the mine entrance (see
Photo 3.2); b) Altybay, adjacent to Konysbay and the other side of the river; and c) Dongulagash, 5km to the west of the mine. Kokshetau is the nearest major settlement, 20km to the south‐east of the mine. Kokshetau is the capital of Akmola Oblast and has a population of around 150,000. Akmola Oblast has a population of around 810,000. The mine is located in the District of Zerendinsky, which has a population of 41,000. The district centre is Zerendi, about 60km south of the mine. The area has a low population density, concentrated in settlements. The majority of the people in the local villages and a significant number in Kokshetau work for the mining company, directly or indirectly via contractors and suppliers.
THIS WEB PROOF INFORMATION PACK IS IN DRAFT FORM. The information contained herein is incomplete and subject to change and it must be read in conjunction with the section headed ‘‘Warning’’on the cover of this Web Proof Information Pack.

KAZZINC LTD Competent Person’s Report for the assets held by Kazzinc Ltd in both Kazakhstan and Russia
61‐0795/MM February 2011
Draft V 0.10 Page 121
Apart from the mine, the main livelihoods are agricultural, particularly cattle and sheep grazing, and some grain production. In the vicinity of the mine the only land use is for subsistence grazing, and the mine provides the only source of livelihood. 3.7.3.1 Infrastructure & Communications The mine has road connections and a rail connection. Most of the plant and equipment for the mine was delivered by rail. 3.7.4 Project Status, Activities, Effects, Releases & Controls 3.7.4.1 Project Description & Activities Past activities Originally the open pit extracted oxide ores and produced gold by heap leaching. It is understood that some ore remains in the heaps (Photo 3.2).
Photo 3.2: Old Heap Leach Dumps and Associated Infrastructure
Note low lying areas of wetland Current Operations The arrangement of the current and past mine components in relation to the highway, River Chaglinka and Komysbay village is shown in Photo 3.3.
THIS WEB PROOF INFORMATION PACK IS IN DRAFT FORM. The information contained herein is incomplete and subject to change and it must be read in conjunction with the section headed ‘‘Warning’’on the cover of this Web Proof Information Pack.

KAZZINC LTD Competent Person’s Report for the assets held by Kazzinc Ltd in both Kazakhstan and Russia
61‐0795/MM February 2011
Draft V 0.10 Page 122
Photo 3.3: Aerial View Showing Location of Main Mine Components. The Outline of the new TMF is
shown approximately The open pit has a large surface area, but is still relatively shallow, the company having utilised the current excavation capacity to strip overburden whilst normal production through the plant has been limited due to construction and ramp up. Associated with the pit are two waste rock dumps – one to the north‐west and one to the south‐east (Photo 3.3). Along the west perimeter of the pit is a water storage pond, into which the pit water was pumped. However, this is now decommissioned and water is pumped to the TMF. The plant area has a number of facilities:
• Mobile plant maintenance area; • Primary crusher and ROM stockpile; • Milling (ball mills);
Sorption
Tailings
Konysbay
Village
THIS WEB PROOF INFORMATION PACK IS IN DRAFT FORM. The information contained herein is incomplete and subject to change and it must be read in conjunction with the section headed ‘‘Warning’’on the cover of this Web Proof Information Pack.

KAZZINC LTD Competent Person’s Report for the assets held by Kazzinc Ltd in both Kazakhstan and Russia
61‐0795/MM February 2011
Draft V 0.10 Page 123
• Flotation concentrator and sorption (Leachox Process) plant; • Rail head for equipment delivery, and warehousing; • Heating plant – coal fired; • Tailings treatment and detox plant; and • Offices and administration.
In addition, to the south and south‐west of the main plant area are located:
• Tailings pipelines and return water lines; • The main flotation tailings disposal area (TMF); • Sorption tailings disposal area (STMF); • Water storage and conditioning lagoon (previously a tailings disposal area from oxide ore
treatment); and • Old heap leach dumps and associated derelict infrastructure.
The mining methods and processing flowsheet are described in a separate section of this report. The sulphide ore has a high content of both arsenic and pyrite, which give rise to environmental complications as well as processing difficulties. 3.7.4.2 Energy Consumption & Source Energy is used as follows:
• Electricity ‐ Connection to Kazakh grid. Majority of power requirement; main use in process plant, conveyors, etc;
• Coal – Heating Plant; and • Diesel fuel – Mobile plant in the mine.
Whilst the mine is connected to the Kazakhstan power grid, which has high carbon intensity (being coal, oil and gas dominated), Kazzinc operates a hydroelectric power station, which produces much of the required power of the company. Thus the total carbon emissions of the company from electricity are much reduced. 3.7.4.3 Mine Wastes – Rock Overburden and waste rock is disposed of in two dumps, adjacent to the open pit (Photo 3.3). The waste rock production so far is high in relation to ore production. This means that the mine has used its mobile plant capacity to pre‐strip overburden in preparation for ore production. Geochemical information on the sulphide and sulphate content of the waste is very limited; however it is considered that the environmental stability of this waste material is good. The results of runoff monitoring indicate an alkaline pH, which is regularly controlled. Off balance ore is dumped separately and is intended for future processing. The cone of depression caused by the open pit results in all drainage waters collecting in the pit base. Water is pumped from the open pit to the flotation tailings dam as recycled water.
WAI Comment: Whilst the waste rock may be largely inert, there may be areas or zones from mineralised parts of the orebody, which have the potential to be acid generating or contain metals (particularly As). Waste rock should be tested for ARD and metals (total content and leachability) on a routine basis on the dumps. Zones of potential contamination can then be placed within the dump to isolate them in safer condition. Currently, the geochemical composition of pit drainage waters, including waste dumps is regularly monitored.
THIS WEB PROOF INFORMATION PACK IS IN DRAFT FORM. The information contained herein is incomplete and subject to change and it must be read in conjunction with the section headed ‘‘Warning’’on the cover of this Web Proof Information Pack.

KAZZINC LTD Competent Person’s Report for the assets held by Kazzinc Ltd in both Kazakhstan and Russia
61‐0795/MM February 2011
Draft V 0.10 Page 124
3.7.4.4 Mine Wastes – Tailings Tailings Properties & Treatment The process plant produces two tailings streams: 1. Flotation tailings, from the first stage of concentration; and 2. Sorption tailings, from treatment of the Au (and As) rich concentrate by oxidation to release the Au,
and subsequent cyanidation. Recent analysis of tailings solids provided by Vasgold is given in Table 3.21 below.
Table 3.21: Tailings Analysis Element Unit Flotation tailings Sorption tailings
Fe % 0.74 15.92 Pb % 0.002 0.009 Zn % 0.002 0.008 Cu % 0.003 0.15 As % 0.17 19.80 S % 0.14 11.17 CN total mg/l 11 ‐ 160 CN free mg/l 7.4 ‐ 3 Average of monthly samples, April – September 2010
It can be seen that the Sorption tailings contains a substantial quantity of iron and sulphur (pyrite), which may have acid production potential, and contain arsenic. Even the flotation tailings contains significant quantities of Fe, As and S, and may be geochemically active. As a result, the tailings may represent an environmental hazard, and the sorption tailings may also be a potential hazard. The alkaline character of the tailings decant water will reduce the dissolution of sulphide minerals, and the thick layer of natural clay below the waste dump is considered to reduce the risk of environmental contamination. Prior to disposal, the sorption tailings are treated in a detox unit in a two‐stage process: 1. CN destruction, in two tanks – addition of lime and sodium metabisulphite. Residual CN levels are
normally within the range 7mg/l to 10mg/l; and 2. Arsenic precipitation – addition of Iron sulphate (1,140g/t) and lime to precipitate arsenic as the
more stable calcium iron arsenate (also referred to as ‘scorodite’, though this is slightly different from naturally occurring scorodite).
Levels of As, CN and pH are regularly monitored at the processing plant discharge to assess the effectiveness of the detox and further analyses for these compounds are performed in the TMF. Cyanide is destroyed by sunlight, and analyses indicate a consequent reduction in levels. In 2010 pH has not dropped below 9, with an average of 9‐12. Arsenic levels in liquid phase in the tailings flow and decant water is undertaken weekly and there is no indication of solubilisation of As in the short term. CN levels are monitored daily. Tailings Pipelines The flotation and sorption tailings are delivered to the TMF in separate pipelines, two lines for each (one operational, one backup). Pipelines are conventional high density plastic, and are laid directly on the ground surface, with no secondary pipeline containment, however there is an emergency spill discharge pond in the event of an incident, into which tailings will flow if there is a pipeline breach. Pipelines are inspected twice per shift by trained personnel and once per week by the Chief Engineer.
THIS WEB PROOF INFORMATION PACK IS IN DRAFT FORM. The information contained herein is incomplete and subject to change and it must be read in conjunction with the section headed ‘‘Warning’’on the cover of this Web Proof Information Pack.

KAZZINC LTD Competent Person’s Report for the assets held by Kazzinc Ltd in both Kazakhstan and Russia
61‐0795/MM February 2011
Draft V 0.10 Page 125
Tailings Disposal The tailings management facility (TMF) was designed by Mechanobr Enginerring, St Petersburg, in 2009 and was subject to a full OVOS concluded in 2009 (along with the mine and plant facilities). A particular issue of concern was the safe disposal of the tailings and whether the TMF or STMF needed to be lined. The selected site for tailings disposal is underlain by 6m to 10m depth of low permeability clay (<1x10‐9m/sec), with a regulatory requirement of 1x10‐7m/sec. This depth decreases towards the south‐east of the TMF, the lower lying areas. The sorption tailings are contained within a separate paddock, at the north‐west portion of the TMF area (see Photo 3.2), i.e. where the underlying clay is thickest. The paddocks for both the sorption and flotation tailings have been developed and in situ tests were performed to assess permeability and the natural clay layer was not compacted. The tailings dam embankments are compacted rockfill and will be constructed in two stages – the first stage comprising 3 lifts, the first of which has been completed and the second has commenced. The main TMF parameters are summarised in Table 3.22.
Table 3.22: Tailings Management Facility Parameters 1st Stage Total on 2nd Stage (20 years) Parameter Units
Flotation tailings Flotation tailings Sorption tailings Elevation, datum metres 240 254 240 Area Mm2 5.96 6.20 2.16
Mm3 54.54 144.02 6.5 Volume Mt (@1.7t/m3) 93 245 11
Perimeter of dam metres 8805 11,108 5801 Max height of dam to crest
metres 20 34 8
The intention is that the sorption tailings will retain a cover of water over them, in order to prevent pyrite oxidation. It is reported that since the TMF has recently been developed, to date, insufficient water has collected to cover the TMF surface. The company considers this water will be accumulated in 1‐2 years time. It is also intended to rework the tailings beach in the future. The sorption tailings material has been assumed to be of the highest hazard class, which has informed the design of the TMF. To date, the company has designed all storage structures in line with national standards, which has been approved by the required regulatory authorities. The company considers that the pH of tailings decant waters which is maintained at pH 9 is sufficiently high to neutralise any potential acid generation.
WAI Comment: WAI has not independently examined the TMF design and OVOS, and has thus not verified the potential seepage rates and long term risks to water resources from the sorption tailings. WAI would recommend that the character of the sorption tailings material should be further clarified via specific ARD testwork, and that a review against compliance with international standards (IFC Performance Standards and EU Mine Waste Directive) should be undertaken as soon as possible. In Kazakhstan, tailings and other mine wastes are considered as a mineral resource or asset (an industrial raw material under the Law of Republic of Kazakhstan, on Mineral Resource & Subsoil use), on the basis that either technology development or economics (i.e. increased commodity prices) will enable them to be economically re‐processed in the future. Whilst this may be true in some cases, the consequence of this policy is that the storage of potentially toxic materials can be considered as a temporary requirement. Thus long term or permanent risks to land and water resources are less critical, and storage requirements might be to a lower standard than would be for permanent final disposal.
THIS WEB PROOF INFORMATION PACK IS IN DRAFT FORM. The information contained herein is incomplete and subject to change and it must be read in conjunction with the section headed ‘‘Warning’’on the cover of this Web Proof Information Pack.

KAZZINC LTD Competent Person’s Report for the assets held by Kazzinc Ltd in both Kazakhstan and Russia
61‐0795/MM February 2011
Draft V 0.10 Page 126
The TMF has a naturally very low permeability clay base layer, as indicated by the company, so the risk of seepage, particularly from the sorption tailings, is very low. WAI does not consider that there is a risk of acid being generated; as this is mitigated by the high pH of the tailings decant water in the long term.
3.7.4.5 Water Management & Effluents The Vasilkovskoye Mine operates as a mainly closed system with maximum water recycling. This is necessitated by the scarcity of water supply, as well as by environmental considerations and minimisation of discharges.
• Groundwater from the open pit is pumped to the TMF for purification and recycling; • Water decanted from the flotation tailings is stored in the water clarification dam, where
natural biological activity provides some treatment; • Water from the water clarification dam is recycled to the plant as industrial water; • Water is not recycled from the sorption tailings, in order to maintain a water cover over the
tailings; • Industrial makeup water is abstracted from the Murzakolsol Lake and potable water is
sourced from the Chaglinskoye water dam; and • ‘Domestic’ waste water is treated in a biological treatment plant and the effluent recycled via
the TMF. Losses of water are likely to include:
• Process losses; • Evaporation from the TMFs and water clarification dam; and • Seepage to groundwater from the TMFs and water clarification dam.
In addition to the pumped pit water discharge, it is possible that some discharge occurs via shallow groundwater seepage reaching the natural drainage from the south‐eastern corner of the TMF/leach pads area, although company monitoring data indicates that there has not yet been any contamination of water via this route. Potential drainage is intercepted by one pumping station (and another under construction) which collects and pumps any discharge to the old TMF, although none has been encountered to date. Vasgold have commissioned hydrogeological modelling of the potential groundwater drawdown from pit dewatering. At its full extent this will extend to a radius of 7km from the pit, except towards the river which is 4.8km distant. It is possible therefore that pit dewatering will have a significant effect on some surface waters, and may affect the river, although the river bed is comprised of low permeability clays, and the cone of depression caused by the open pit is considered to intercept all drainage waters. Pit water is pumped at a rate of 750,000m3 per year, whilst the average annual volume of Chaglinka River is 22,450,000m3 per year. 3.7.5 Emissions to Air Emissions to air are summarised in Table 3.23. Emissions are generally of low significance, although WAI considers that following emission is significant dust blow from the open ore stockpile, which is particularly prevalent during dry, windy conditions. Currently, this is stated to be controlled by water spray on the conveyors as an interim measure. Three options for treatment in 2011 are being considered: 1. enclosure by a concrete structure, 2. snow covering of the dump in winter and water spray in summer, 3. Dust removal by telescopic extractor duct.
Table 3.23: Potential Emissions to Air Fugitive dust from drilling, blasting Open pit Inert and mineralised rock dust. Controlled by
THIS WEB PROOF INFORMATION PACK IS IN DRAFT FORM. The information contained herein is incomplete and subject to change and it must be read in conjunction with the section headed ‘‘Warning’’on the cover of this Web Proof Information Pack.

KAZZINC LTD Competent Person’s Report for the assets held by Kazzinc Ltd in both Kazakhstan and Russia
61‐0795/MM February 2011
Draft V 0.10 Page 127
dust filters on rigs. Fugitive dust from loading and haulage of ore
Open pit and haul roads. Mineralised rock dust. Controlled by watering of haul roads.
Deposition and storage of coarse ore prior to milling
Ore stockpiles Mineralised rock dust. Conveyors are covered; dust from stockpile is uncontrolled (winter only).
Process emissions Process plant stacks and ventilation
Dust and acid vapours. Controlled by filters and enclosure.
Combustion gasses from coal‐fired heating plant
Chimney stack at heating plant.
Combustion gasses, smoke particulate. Particulate filters in place, no scrubbing of gasses (low emissions).
Fugitive dust from tailings surface TMFs Hazardous dust, containing As and metals, which could contaminate surrounding land. (not confirmed by company monitoring) Controlled by maintaining water cover and wet tailings beaches; effectiveness is dependent on water availability and it is estimated to improve within 1‐2 years as more water accumulates.
3.7.5.1 Waste Management – General General waste and recyclable materials are collected and stored separately as appropriate, for disposal by specialist contractors. Non‐recyclable waste goes to the local municipal landfill. As part of the environmental license the company maintains records and makes returns on the quantities of waste produced, under different waste categories. 3.7.5.2 Hazardous Materials Storage & Handling Oils and fuel (hydrocarbons) – are stored in proper bunded facilities in accordance with license requirements and international standards. Cyanide – separate and secure storage and handling facilities. The company has recently undertaken a review of requirements under the International Cyanide Code and has prepared a detailed and comprehensive specification of requirements and actions for compliance (copy received by WAI in draft) and the company is currently considering the implementation of such requirements and actions. 3.7.5.3 General Housekeeping In general housekeeping at the mine is excellent and all areas are maintained well. No evidence was seen of uncontrolled tipping or abandonment of disused equipment, scrap, containers or wastes. 3.7.5.4 Fire Safety Good quality systems and arrangements are in place. 3.7.5.5 Security The site is well secured within a perimeter fence and public safety is maintained. The plant area is accessed via manned security gates and scanners. 3.7.6 Permitting
THIS WEB PROOF INFORMATION PACK IS IN DRAFT FORM. The information contained herein is incomplete and subject to change and it must be read in conjunction with the section headed ‘‘Warning’’on the cover of this Web Proof Information Pack.

KAZZINC LTD Competent Person’s Report for the assets held by Kazzinc Ltd in both Kazakhstan and Russia
61‐0795/MM February 2011
Draft V 0.10 Page 128
3.7.6.1 ESIA/OVOS The OVOS (EIA in accordance with Kazakhstan Environmental Code) process commenced in 2008 and was completed in 2009. This covered all elements of the current project (open pit mining, processing, ancillary activities, waste rock and tailings disposal) with the exception of the chemical storage, which was added as an addendum. The work was carried out by Ecotera PLC of Almaty, which is a specialist environmental design institute licenced by the Ministry of Environment. A copy of the conclusion of the ‘Expertise’ (expert review and issuing of environmental permit) was provided to WAI. No major issues of concern were identified by the Ministry of Environment. 3.7.6.2 Environmental Permits and Licenses Under the Environmental Code the following licenses are required, and copies were provided to WAI:
• Emission Permit, setting out annual limits of releases to air, water and wastes; o Air emissions – dust, heating plant, and process plant stacks/vents; o Solid wastes – tailings, waste rock, heating plant slimes, containers, oil & filters,
office/household waste; and • • Water use permit – open pit, boreholes, Chaglinka river/reservoir and municipal
waste water use. There are no water discharge permits as there is no planned discharge of water to surface or groundwater.
WAI Comment: The company has the necessary environmental permits and licenses in place, in accordance with Kazakh Environmental Code.
3.7.7 Environmental Management 3.7.7.1 Environmental Policy and Company Approach Kazzinc has a strong central corporate environmental management function, based in Ust‐Kamenogorsk. There is a Chief Environmental Manager, reporting to the Vice President of Operations, and two environmental specialists at the headquarters, supporting the site‐based staff. The company therefore has a consistent approach to environmental and social management systems, procedures and standards. The company is certified across all its sites for:
ISO9001 – Quality Assurance
Certified in 2004 and audited in 2010
ISO14001 – Environmental Management System and OHSAS18001 ‐ Occupational Health and Safety Management System
Certified in 2006, recertification audit in 2009 and supervisory audits of company facilities alternately each year, starting 2007.
Glencore is a majority shareholder in Kazzinc and thus also exercises an overarching commitment to Health, Safety, Environment and Community, through the Glencore Corporate Practice commitment applied to all subsidiary companies and operations. WAI understands that all Kazzinc assets were audited by a Glencore team in early 2010. The findings of this are not available to WAI, though it is understood that the main recommendation was in connection with implementing the International Cyanide Code and the company is currently considering the implementation of such requirements and actions.
THIS WEB PROOF INFORMATION PACK IS IN DRAFT FORM. The information contained herein is incomplete and subject to change and it must be read in conjunction with the section headed ‘‘Warning’’on the cover of this Web Proof Information Pack.
KAZZINC LTD Competent Person’s Report for the assets held by Kazzinc Ltd in both Kazakhstan and Russia
61‐0795/MM February 2011
Draft V 0.10 Page 129
Kazzinc also commissioned specialist environmental institute ECOTERA LLC of Almaty to undertake a full audit of all the company’s assets. The report: Assessment of Compliance of Activities of Kazzinc LLC with the Nature Protection Laws of the Republic of Kazakhstan and with the Requirements of Controlling Agencies, Auditors Report to Management, was presented in September 2010.
WAI Comment: It is clear that, at a corporate level, Kazzinc is progressive and responsible in its approach to environmental, social, health & safety management across all their operations. They have progressively implemented measures to improve air quality and water management and tailings management and maintain consistent standards in accordance with Kazakh norms, policies and requirements.
3.7.7.2 Environmental Management Staff & Resources Health & Safety and Environmental are separate departments, under the Department of Production and Safety, reporting to the Director of Production. The Head of the Environmental Protection department has 4 staff: two responsible for Control (processes, checks, operations, etc.) and two responsible for monitoring (including emissions control, environmental taxes, etc.). In addition, sampling and analytical requirements are outsourced to contractors. 3.7.7.3 Systems and Work Procedures Vasgold has prepared a series of work procedures, dated 2009, copies were provided to WAI:
• PC‐EP‐016 Process card for environmental management; and • PLC‐EP‐011 Environmental policy and procedures.
These set out the main processes and procedures to be followed. Parameters and norms that these apply to are set out in detail in the Environmental Permits. The company adheres to these requirements; there are no additional self‐imposed requirements. Vasgold are due to be audited on 2011 in accordance with ISO14001 and OHSAS18001 certification requirements. As indicated above, Vasgold is considering the implementation of measures in accordance with the International Cyanide Code, covering transportation, storage, handling and disposal of CN used in connection with gold recovery. 3.7.7.4 Environmental Monitoring, Compliance & Reporting Monitoring of a range of parameters as required by the Environmental Permit, and to an agreed protocol with the Government, is undertaken quarterly by an independent laboratory. In addition, weekly samples from boreholes are monitored for a limited range of basic parameters by the mine laboratory. Groundwater boreholes are located downstream (south‐east) of the TMF, but none upstream and none around the mine or process plant. CN and As levels are monitored in these boreholes and in surface waters. Data over the last 2 years seen by WAI did not show any significant levels of either contaminant, although SO4‐Cu+ and Fe+ levels could also be measured. Soils are monitored once per year around the mine. It is reported that As levels are naturally high background; no significant elevated metal levels are evident so far.
THIS WEB PROOF INFORMATION PACK IS IN DRAFT FORM. The information contained herein is incomplete and subject to change and it must be read in conjunction with the section headed ‘‘Warning’’on the cover of this Web Proof Information Pack.

KAZZINC LTD Competent Person’s Report for the assets held by Kazzinc Ltd in both Kazakhstan and Russia
61‐0795/MM February 2011
Draft V 0.10 Page 130
WAI Comment: As the mine has only been operational at a reduced production and for a short period, significant contamination would not be expected and it is not yet possible to comment on compliance. WAI considers that the mine has a good monitoring regime in place.
3.7.7.5 Emergency Preparedness & Response This is included within the Health & Safety policy and covers environmental aspects. There are plans covering the pit, plant, tailings, fuel storage and chemical storage, and other aspects such as tailings pipeline burst, as part of a full Emergency Preparedness and Response Plan. 3.7.7.6 Training The Environmental Manager and staff carry out inductions and specific training on environmental awareness and procedures to supervisory and management staff. 3.7.8 Social and Community Management 3.7.8.1 Stakeholder Dialogue and Grievance Mechanisms WAI understand that 80% of the local population in the vicinity of the mine are employed in the mine. The mine therefore has a very close relationship with its neighbours. There is regular communication with communities through public meetings and the local press, and regular meetings with the heads of local villages. No issues or complaints have been raised in the last 4 years and the community see the mine as a positive benefit to the area, bringing jobs and prosperity. 3.7.8.2 Social Initiatives and Community Development Vasgold has a range of community development and support activities:
• Use of equipment for small works; • Tree planting and support for local forestation initiatives; • Participation and financial support for local and community events and projects; and • Provision of sports ground for the disabled.
Kokshetau is a significant town and has a good social infrastructure, including culture, health and recreational facilities, housing and communications. 3.7.9 Health & Safety 3.7.9.1 Health & Safety Management Arrangements The Head of Labour Safety reports to the Health and Safety Director, similar to the Head of Environmental Protection. He has a staff of 7 occupational safety specialists and 9 first aid and medical specialists (total 17). The company has in place an extensive management system and documentation, including the following (copies provided to WAI): 1. Safe Labour Code, setting out the mission, principles and rules, dated March 2010; 2. Process card for implementation of the health care and safety of the workforce – setting out the
requirements for all aspects of the mine, inputs and outputs, legal responsibilities and documents; 3. Workflow tables – detailed responsibilities, resources, parameters, reporting procedures, training,
maintenance of records, etc; and 4. Specific activity ‘passports’ (working procedures) – 54 covering various stages and activities.
THIS WEB PROOF INFORMATION PACK IS IN DRAFT FORM. The information contained herein is incomplete and subject to change and it must be read in conjunction with the section headed ‘‘Warning’’on the cover of this Web Proof Information Pack.

KAZZINC LTD Competent Person’s Report for the assets held by Kazzinc Ltd in both Kazakhstan and Russia
61‐0795/MM February 2011
Draft V 0.10 Page 131
There are regular health checks for employees involved in hazardous activities and who control machinery, including blood pressure, sight/hearing, alcohol and drug use. Signage and PPE observed around the mine by WAI were good and employees clearly respected and followed safety requirements. 3.7.9.2 Performance and Accident Records The mine considers that it has a good no‐blame culture and incidents are reported reliably, for both employees and contractors. The reporting procedures for accidents and incidents cover 5 main categories and are reported monthly. Data seen by WAI showed that for 2010 to September, there had been 73 no‐lost‐time incidents, 11 lost‐time incidents and 0 fatalities amongst employees, and only 1 no‐lost‐time incident for contractors. Workplace monitoring for light, noise exposure, respirable air quality and exposure to hazardous chemicals (such as CN) is carried out on a regular basis by specialist contractors. 3.7.10 Mine Closure & Rehabilitation 3.7.10.1 Mine Closure Plans Vasgold has prepared a closure and rehabilitation plan for the open pit, waste rock dumps and objects directly serving the mining process, in accordance with the requirements of the Kazakh Subsoil Use Code. This is the responsibility of the mine manager and does not involve the environmental department. There are no plans covering the old heap leach areas, the process plant (licensed under a separate Industrial Code) and the TMF (considered as industrial raw material rather than mine waste). The mine closure plan was seen but not reviewed in detail by WAI. In general it included the following:
• Construction of a safety berm around the open pit; • Dump slopes graded and planted with vegetation; and • Buildings and mine related structures (offices, conveyor, vehicle maintenance, refuelling
area) dismantled and removed. There are no proposals for the pit itself, as it is considered unusable due to the steep slopes, arsenic and acid contents. It is likely to flood to natural groundwater levels. WAI understand that the company is considering the rehabilitation of the heap leach areas, dumps and unused infrastructure, but no details or plans were reviewed. There is a plan to reprocess the heaps again, and there is a contract with a Russian company to assess different processing circuits for this material, and a specialist has been employed to investigate processing options. 3.7.10.2 Financial Provision for Closure The Subsoil Use Code imposes contractual obligations on the mine license holder, to fund the closure requirements. A sum of 0.1% of all mine operating costs (i.e. not including the plant and other activities) has to be placed in an escrow account, separate from the company assets. In addition, a liquidation programme has to be agreed with the Government and the fund made up to cover this. This fund cannot be drawn down until mining ceases and can only be used for closure requirements. WAI did not receive information on the detail of the closure requirements, since an action plan is not required until 2‐3 years prior to closure under Kazakh standards. The sum of accrued estimated costs for closure as at 31.12.10 was US$2,120,900 as per the contract requirements. With a ‘good will’ sum of US$37,420,000 set aside by the Company to cover all closure requests.
THIS WEB PROOF INFORMATION PACK IS IN DRAFT FORM. The information contained herein is incomplete and subject to change and it must be read in conjunction with the section headed ‘‘Warning’’on the cover of this Web Proof Information Pack.

KAZZINC LTD Competent Person’s Report for the assets held by Kazzinc Ltd in both Kazakhstan and Russia
61‐0795/MM February 2011
Draft V 0.10 Page 132
WAI Comment: WAI considers that the present arrangements for mine closure and restoration of the Vasilkovskoye Mine are fully compliant with Kazzakh requirements,although they are insufficient when compared with international requirements. It is advisable that a full and comprehensive mine closure and rehabilitation plan, with estimated costs, is prepared, covering not only the mine and waste dumps, but also the process plant, TMFs, the old heap leach areas, administration/offices, power plant, warehousing and related infrastructure. The safe long term (maybe permanent) storage of the sorption tailings is a particular concern. Once the closure and long term risks and liabilities are quantified it is advisable that a financial provision and guarantee is put in place to cover these. This could probably be arranged through Kazzinc and/or Glencore corporate, as parent company guarantors, subject to whether the assets are publicly or privately owned.
3.7.11 Conclusions 3.7.11.1 Environmental and Social Liabilities & Risks For the most part, the Vasilkovskoye Mine has a very high standard of environmental, social, health and safety management. It is compliant with Kazakh licenses, permits and norms. Both the environmental and labour safety functions of the company are of high quality and well organised, and supported by a strong corporate policy, commitment and team. There are no known social, community or cultural issues or impacts that need to be addressed, and no displacement or compensation requirements. The mine appears to have a good relationship with the local communities, and does not put undue pressure on the social infrastructure of the District or Oblast. WAI emphasise the following areas requiring further Company attention: 1. The characterisation and safe long term disposal of arsenic and acid‐producing tailings, notably the
sorption tailings. Monitoring and protection of groundwater and related surface water resources is important regionally, via the River Chaglinka;
2. Dust control from the exposed tailings surface, particularly a backup irrigation system during periods of water shortage;
3. Dust control from the dry ore stockpile, from the open pit and haul roads, to prevent contamination of surrounding land; and
4. Long term closure liabilities for all the project areas need to be addressed, with a full closure plan, rehabilitation and costs, and a long term environmental liability risk assessment.
The Company considers that the above areas already receive regular attention and are being fully managed with regard to national standards, but is prepared to assess any further requirements to achieve international practice compliance. 3.7.11.2 Compliance with Local and International Standards and Expectations The project is generally compliant with international standards and expectations, with the exception of the potential liabilities and risks identified above. It is likely that the management of hazardous tailings and the mine closure provisions fall short of international practice, although WAI believes that the company’s attention is focussed on further improvement in connection with these issues and there are no reasons why they cannot be readily resolved in the near future. 3.7.11.3 Recommendations for ESAP
THIS WEB PROOF INFORMATION PACK IS IN DRAFT FORM. The information contained herein is incomplete and subject to change and it must be read in conjunction with the section headed ‘‘Warning’’on the cover of this Web Proof Information Pack.

KAZZINC LTD Competent Person’s Report for the assets held by Kazzinc Ltd in both Kazakhstan and Russia
61‐0795/MM February 2011
Draft V 0.10 Page 133
Table 3.24 shows WAI recommendations for inclusions in an environmental and social action plan for the mine to achieve international compliance. All these issues are being addressed by the Company.
Table 3.24: Recommendations for Environmental & Social Action Plan
Action Priority & timescale
1. Geochemical and environmental characterisation of the waste rock and tailings (flotation and sorption) – acid‐base accounting and TCLP/SPLP leaching tests.
Immediate, high priority.
2. Further review of tailings disposal arrangements, particularly the sorption tailings, given information from (1) above and hydrogeological modelling of seepage movements.
Q2 2011, high priority.
3. Depending on the outcome of (1) and (2) above, implement remedial measures and improved containment for sorption tailings.
Q4 2011, 2012, priority depends on previous.
4. Design and implement dust control for ore stockpile; possibly by containment or wind barriers.
2012; medium priority.
5. Prepare a full and comprehensive mine closure and rehabilitation plan for all current and past project areas, with costs and timescales. Include a post closure Environmental Liability Risk Assessment.
Q4 2011; medium priority.
6. Based on (7) above, it is advisable to provide a mine closure guarantee and fund for implementation.
2012; medium priority.
THIS WEB PROOF INFORMATION PACK IS IN DRAFT FORM. The information contained herein is incomplete and subject to change and it must be read in conjunction with the section headed ‘‘Warning’’on the cover of this Web Proof Information Pack.

KAZZINC LTD Competent Person’s Report for the assets held by Kazzinc Ltd in both Kazakhstan and Russia
61‐0795/MM February 2011
Draft V 0.10 Page 134
4 MALEEVSKOYE DEPOSIT 4.1 Introduction 4.1.1 Location & Access The Maleevskoye polymetallic mine is situated some 17km to the north of the town of Zyryanovsk (where the concentrator is located) which in turn is situated 186km east of Ust Kamenogorsk, northeastern Kazakhstan. The geographic coordinates for the mine are latitude 49°52'57"N, longitude 84°16'49"E (Figure 4.1).
Figure 4.1: Location of Maleevskoye, Northeast Kazakhstan
The mine is linked by a graded road to Zyryanovsk (a town established on the site of historic lead‐zinc production), and paved road to Ust Kamenogorsk, with a driving time between the two of approximately 3 hours. The deposit is bordered by Russia to the northeast (some 45km in a straight line) and China to the southeast 4.1.2 Topography & Climate The area surrounding the mine shows moderate mountain relief with absolute elevations from 450m to 920m. Much of the area is covered by superficial diluvial‐proluvial material which ranges from 3m to 15m in thickness effectively masking bedrock.
THIS WEB PROOF INFORMATION PACK IS IN DRAFT FORM. The information contained herein is incomplete and subject to change and it must be read in conjunction with the section headed ‘‘Warning’’on the cover of this Web Proof Information Pack.

KAZZINC LTD Competent Person’s Report for the assets held by Kazzinc Ltd in both Kazakhstan and Russia
61‐0795/MM February 2011
Draft V 0.10 Page 135
Vegetation consists of high mixed grass and thick bushy undergrowth with small groves of birch, aspen, poplar and bird‐cherry. The Bukhtarma River flows south of the deposit and is the main artery of the region along with its tributaries the Khamir and Bobrovka, the latter flowing through the western part of the deposit. The region has a typical extreme continental climate characterised by a long winter (November‐February) and short summer (June‐August), both with sharp variations of daily temperatures. The average annual temperature is 1‐2°C, with annual absolute temperature variations from ‐52°C in winter to +40°C in summer. The average annual precipitation at Kutiha, west of the deposit, is 700mm, distributed evenly throughout the year. Snow cover normally prevails from November to May. 4.1.3 Infrastructure The region is sparsely populated with the majority being concentrated in the town of Zyryanovsk, which has some 50,000 inhabitants. The town has grown up around historic polymetallic mining and processing, although the deposits close to the town are now exhausted. As a result, it is only mining and agriculture that are the main sources of income in the region. Electrical power is supplied to the mine from the Bukharma and Ust‐Kamenogorsk power station, whilst water is taken from the Khamir River. 4.1.4 Mineral Rights & Permitting Kazzinc holds the right to mine polymetallic ores under the terms of the Contract for Subsurface Use dated 21 May 1997. The contract supersedes Licence Series MG No 59 D granted to ОАО Kazzinc on 28 March 1997. As amended, the Contract is valid for 25 years from the date of the licence issue and can be extended by mutual agreement between Kazzinc and the issuing authority. The current mining lease (7.703km2) was issued by the Ministry of Energy and Mineral Resources of the Republic of Kazakhstan in August 2001, superseding an earlier released mining lease. The boundaries of the lease are defined by 14 corner points as detailed in Table 4.1. The legal depth limit for mining defined in the mining lease is to the elevation of 1,500m below Baltic Sea datum. The deepest mine level is currently at approximately ‐70m level, the deepest shaft reaches ‐303m level and the deepest mineralised zone extends to an elevation of ‐1,220m.
Table 4.1: Mining Licence Coordinates Coordinate Easting Northing 1 84°14’40” 49°51’58” 2 84°14’10” 49°52’51” 3 84°15’54” 49°53’43” 4 84°16’36” 49°53’40” 5 84°17’05” 49°53’37” 6 84°17’29” 49°53’25” 7 84°18’45” 49°53’41” 8 84°18’47” 49°53’37” 9 84°17’54” 49°53’24” 10 84°17’50” 49°53’12” 11 84°17’35” 49°53’02” 12 84°16’51” 49°52’39” 13 84°15’49” 49°52’37” 14 84°15’49” 49°52’20”
THIS WEB PROOF INFORMATION PACK IS IN DRAFT FORM. The information contained herein is incomplete and subject to change and it must be read in conjunction with the section headed ‘‘Warning’’on the cover of this Web Proof Information Pack.

KAZZINC LTD Competent Person’s Report for the assets held by Kazzinc Ltd in both Kazakhstan and Russia
61‐0795/MM February 2011
Draft V 0.10 Page 136
WAI Comment: The Maleevskoye mine benefits extensively from the proximity of Zyryanovsk which provides the majority of the workforce as well as being well connected by rail, road and power to the rest of Kazakhstan. In this respect, the mine is very well located. In addition, although the climate can be harsh, the underground nature of operations insulates against weather extremes. Also, the licence documentation has been inspected and is in order. Moreover, the conditions of the licence are sufficient for the life of mine.
4.2 Geology & Mineralisation 4.2.1 Regional Geology The Maleevskoye deposit is situated on the western limb of the Maleyevsko‐Putintsevskaya anticline between the Bukhtarmy River and the northern periclinal closure of the anticline. The Revniushinskaya Formation occurs in the core of the anticline, whilst terrigenous sediments of the Maslyanskaya, Khamirskaya and Turgusunskaya Series form the limbs. In a broader regional context, the Maleevsko‐Putintsevskaya anticline forms the northern closure of the Revniushinskaya anticlinorium, which covers an area of 250km2 and contains six other polymetallic deposits, including the now exhausted Zyryanovsky and Grekhovskoe. With one exception, all these deposits are hosted by Middle Devonian volcano‐sedimentary rocks and closely associated with sills of quartz‐plagioclase porphyry and felsite either of submarine volcanic or subvolcanic origin. Polymetallic and copper mineralisation is found in several stratigraphic levels within the Revniushinskaya and Maslyanskaya Formations and can be considered a fairly typical VMS Exhalative type. On the western side, the Revniushinskaya anticlinorium abuts against the Schebniushinsky intrusive massif composed mostly granite, tonalite and diorite. Figure 4.2 shows the regional geology of the Maleevskoye area and the main stratigraphic units, whilst Figure 4.3 shows a long section through the mineralisation which is seen becoming progressively deeper to the southeast. 4.2.2 Local Geology 4.2.2.1 Structure The Maleevskoye deposit comprises seven stratabound zones of lead‐zinc‐copper‐gold‐silver mineralisation: Rodnikovaya, Maleevskaya, Octyabrskaya, Holodnaya, Lugovaya, Bobrovskaya and Platovskaya. They are found at three stratigraphic levels within a 600‐700m interval of the Revniushinskaya and Maslovskaya Formations, and are confined to broad mushroom‐shaped brecciated domes passing downwards into steeply dipping stockwork feeder channels, which are generally aligned along a NW‐trending fractures. The stratabound bodies generally strike 300‐310°, parallel to axial traces of the domes, dip at low to moderate angles SW and plunge NW.
THIS WEB PROOF INFORMATION PACK IS IN DRAFT FORM. The information contained herein is incomplete and subject to change and it must be read in conjunction with the section headed ‘‘Warning’’on the cover of this Web Proof Information Pack.

KAZZINC LTD Competent Person’s Report for the assets held by Kazzinc Ltd in both Kazakhstan and Russia
61‐0795/MM February 2011
Draft V 0.10 Page 137
Figure 4.2: Regional Geology of the Maleevskoye Area
THIS WEB PROOF INFORMATION PACK IS IN DRAFT FORM. The information contained herein is incomplete and subject to change and it must be read in conjunction with the section headed ‘‘Warning’’on the cover of this Web Proof Information Pack.

KAZZINC LTD Competent Person’s Report for the assets held by Kazzinc Ltd in both Kazakhstan and Russia
61‐0795/MM February 2011
Draft V 0.10 Page 138
Legend for Figures
THIS WEB PROOF INFORMATION PACK IS IN DRAFT FORM. The information contained herein is incomplete and subject to change and it must be read in conjunction with the section headed ‘‘Warning’’on the cover of this Web Proof Information Pack.

KAZZINC LTD Competent Person’s Report for the assets held by Kazzinc Ltd in both Kazakhstan and Russia
61‐0795/MM February 2011
Draft V 0.9 Page 139
Figure 4.3: Long Section through Main Zone and Others
THIS WEB PROOF INFORMATION PACK IS IN DRAFT FORM. The information contained herein is incomplete and subject to change and it must be read in conjunction with the section headed ‘‘Warning’’on the cover of this Web Proof Information Pack.

KAZZINC LTD Competent Person’s Report for the assets held by Kazzinc Ltd in both Kazakhstan and Russia
61‐0795/MM February 2011
Draft V 0.10 Page 140
4.2.3 Mineralisation Mineralisation is divided into polymetallic (lead‐zinc with >0.6% Pb) and copper‐zinc (<0.6% Pb and high Cu), the division defined by the lead content. In general, polymetallic mineralisation, accompanied by barite, occurs on the flanks and on the hangingwall side of the lenses, whilst copper‐zinc mineralisation tends to prevail in the central parts of the lenses and on the footwall side. Soviet geologists initially thought that the mineralisation formed within thick zones of intrabed brecciation and cleavage (“traps”) in pelitic‐siliceous siltstones after the emplacement of the overlying rhyolite, which acted as a screen. The deposit is now regarded as syngenetic exhalative VMS mineralisation developed on the sea floor. The largest and richest mineralised zones (Maleevskaya, Rodnikovaya, Holodnaya and Lugovaya) occur within a 150‐200m thick Maleevsky Member of the Maslovskaya Formation. They consist of massive sulphide stratabound bodies of various forms (saddles, lenses, tabular bodies) which pass downwards into veinlet‐disseminated mineralisation. Figure 4.4 shows a plan outline of the Maleevskaya Zone on 12 Level, whilst Figure 4.5 shows a section through this zone. The upper boundary to mineralisation is generally sharp, although veinlet‐disseminated mineralisation occurs locally above the massive sulphides. The footwall boundary is generally inconspicuous as massive sulphide bodies pass into fracture filling veinlets and replacements of cement in hydrothermal breccias. This boundary has to be defined by sampling. The hangingwall is controlled by brecciated rhyolite (69%), porphyritic andesite sills and dykes (26%) and hydrothermal quartzites (5%). Veinlet‐disseminated mineralisation of the Bobrovskaya and Platovskaya zones occur at the level called Platovsky, 100‐150m below the Maleevsky level in the hinge zone of the Maleevsko‐Putintsevska anticline. This type of mineralisation is characterised by poor continuity and erratic metal grades. Resource delineation requires closely spaced sampling, especially in areas where veinlet‐type and disseminated mineralisation is dispersed throughout the Maslovskaya Formation between the upper and lower rhyolite bodies (e.g. on the northwestern flank of the Rodnikovaya zone and the Bobrovskaya zone). The veinlet‐disseminated mineralisation of the Octyabrskiy level occurs in mottled slates at and below the interface of the Revniushinskaya and Maslovskaya Formations. Another level of veinlet‐disseminated mineralisation has been encountered in the middle of the Revniushinskaya Formation, 50‐150m below the Octyabrskiy level. The mineralisation at this level occurs in quartz rhyolites and andesite‐dacite porphyries and is also characterised by erratic grades and poor continuity.
THIS WEB PROOF INFORMATION PACK IS IN DRAFT FORM. The information contained herein is incomplete and subject to change and it must be read in conjunction with the section headed ‘‘Warning’’on the cover of this Web Proof Information Pack.
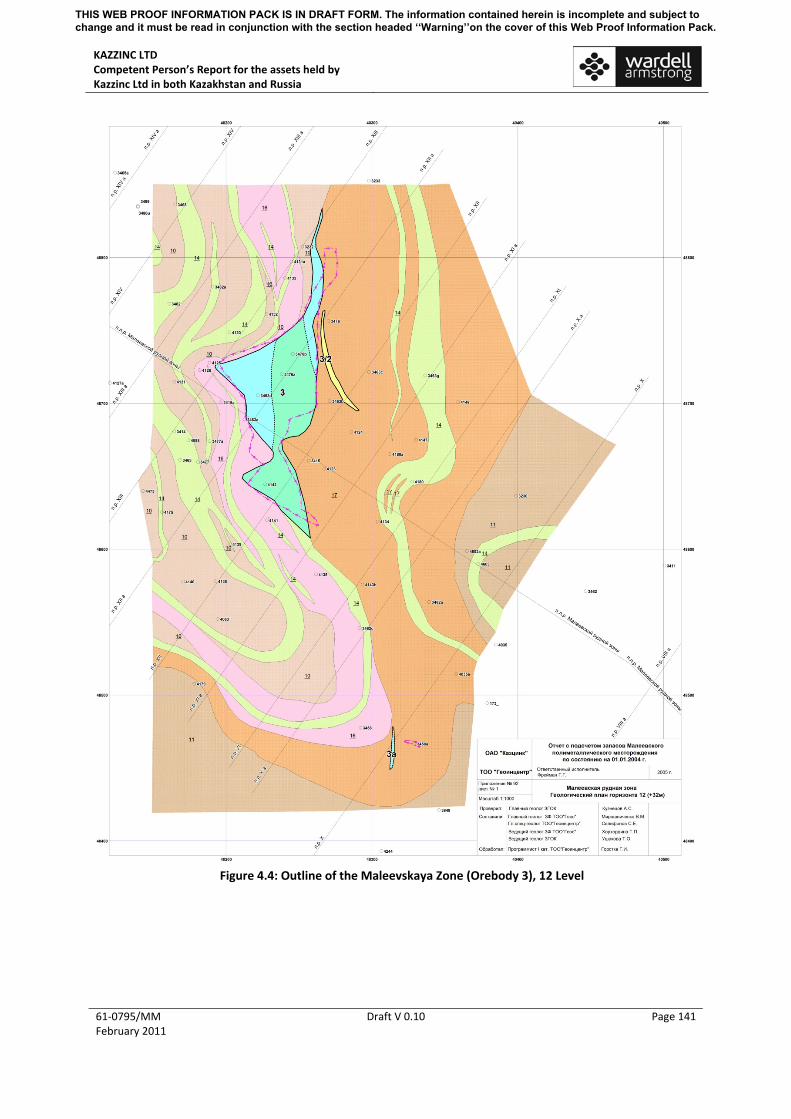
KAZZINC LTD Competent Person’s Report for the assets held by Kazzinc Ltd in both Kazakhstan and Russia
61‐0795/MM February 2011
Draft V 0.10 Page 141
Figure 4.4: Outline of the Maleevskaya Zone (Orebody 3), 12 Level
THIS WEB PROOF INFORMATION PACK IS IN DRAFT FORM. The information contained herein is incomplete and subject to change and it must be read in conjunction with the section headed ‘‘Warning’’on the cover of this Web Proof Information Pack.

KAZZINC LTD Competent Person’s Report for the assets held by Kazzinc Ltd in both Kazakhstan and Russia
61‐0795/MM February 2011
Draft V 0.10 Page 142
Figure 4.5: Section XIII through Maleevskaya Mineralised Zone (Orebody 3)
4.2.4 Orebodies 4.2.4.1 Maleevskaya Zone The outcrop of this zone was mined in a small open pit and from shallow adits. The blind extension of this zone, called Novo‐Maleevskaya, was discovered in 1979. A series of folded stratabound lenses of complicated geometry has subsequently been traced to a depth of 700‐750m. The overall strike of the zone is 315˚ with a 32‐35˚ with a northwestern plunge. The combined strike length is 2.3km. The largest mineralised body in this zone, called No 3 Orebody, has a strike length of 1,175m and extends from Level 4 (430m) down to Level 16 (‐170m). Its larger north¬western segment measures 575m in strike length with a down‐dip extent of up to 250m. Dips are highly variable but generally less than 40˚SW flattening and turning NE at the north¬western end. The southeastern part is about 410m in strike length and extends down‐dip for up to 195m. The average dip is 20‐25˚SW.
THIS WEB PROOF INFORMATION PACK IS IN DRAFT FORM. The information contained herein is incomplete and subject to change and it must be read in conjunction with the section headed ‘‘Warning’’on the cover of this Web Proof Information Pack.

KAZZINC LTD Competent Person’s Report for the assets held by Kazzinc Ltd in both Kazakhstan and Russia
61‐0795/MM February 2011
Draft V 0.10 Page 143
In addition, this zone contains small satellite bodies. Mineralised body 3a is located at Levels 10 to 12 (130‐32m) at the same stratigraphic level as No 3 Orebody. Mineralised lenses 3b and 3v are located at a slightly higher stratigraphic level, 90‐125m from the south‐eastern segment of No.3 Orebody. Lenses 3/2 (Figure 4.5 and Figure 4.6) and 3l are found in the footwall of No.3 Orebody at levels 11 to 13 and 13 to 15 respectively. 4.2.4.2 Rodnikovaya Zone This is the main mineralized zone at the Maleevsky deposit. It extends from Level 9 at 180m down to Level ‐550m along a dome structure plunging 25‐30˚ northwest. The Total strike length is 1,750m. The zone contains 18 stratabound mineralised lenses with complicated forms due to folding and the presence of cross‐cutting dykes. Orebodies 6 and 7, which hold the bulk of the Maleevskoye resource, represent a single predominantly massive sulphide body cut by a dyke of porphyritic dolerite and its apophyses. Orebody 6 is situated above the steeply dipping porphyrite dyke. On average, it dips 35°WSW and plunges 27°NNW. The vertical span is 434m between absolute elevations of 318m and ‐116m. Orebody 7 is situated below the dirotic porphyrite dyke. It dips 36° WSW and plunges 23° NNW. The vertical span is 383m from 213m to ‐170m. The combined strike length of both orebodies exceeds 1,500m, the combined true width is in the range of 120‐380m and the horizontal width reaches 900m in the central part of the zone. There is strong vertical mineral zoning. From top to bottom the main zones are:
• Thin discontinuous pyritic zone along the hangingwall; • Barite‐lead‐zinc mineralisation; • Zinc mineralisation; • Pyrite‐polymetallic mineralisation with barite; • Pyrite‐copper‐zinc mineralisation; • Copper‐pyrite mineralisation, and • Pyritic zone in the footwall (0.5‐7m) passing down into disseminated pyrite.
Massive sulphides, represented by pyritic‐polymetallic, copper‐zinc and barite‐bearing varieties are best developed in Orebody 6 (over 70% of Total volume). Disseminated ore types occur mostly in the footwall and on the flanks. Overall, the dyke and its apophyses make up about 11% of the volume of the Rodnikovaya Zone. As dolerite apophyses are more abundant in disseminated mineralisation, they contribute about 8% of volume within copper‐zinc mineralisation and only 3% of volume within predominantly massive sulphide polymetallic mineralisation. Other barren and sub‐economic partings are represented mainly by weakly mineralised quartzites. On average, barren and sub‐economic partings form 8.3% of the Rodnikovaya Zone. The footwall contact is transitional. The pyritic zone passes into microquartzites with relics of bedding and disseminated syngenetic pyrite (0.001‐0.05mm) forming bands and small lenses. These rocks are cut by steep feeder channels marked by brecciation with quartz‐sericite‐chlorite alteration and cubic pyrite (0.04‐0.1mm). In contrast, the hangingwall contact with rhyolites, siltstones and porphyritic andesites is sharp with no or very weak alteration. 4.2.4.3 Bobrovskaya Zone This zone is situated southwest of the Rodnikovaya Zone at a depth of 1,000‐1,500m below the surface. It contains at least three lenticular bodies over a strike length of 1,750m.
THIS WEB PROOF INFORMATION PACK IS IN DRAFT FORM. The information contained herein is incomplete and subject to change and it must be read in conjunction with the section headed ‘‘Warning’’on the cover of this Web Proof Information Pack.

KAZZINC LTD Competent Person’s Report for the assets held by Kazzinc Ltd in both Kazakhstan and Russia
61‐0795/MM February 2011
Draft V 0.10 Page 144
4.2.4.4 Octyabrskaya Zone This zone is situated a short distance to the northeast of the Maleevskaya Zone. In contrast to other zones, it is bowl shaped. The strike length is 600m. Mineralised bodies forming this zone dip west and northwest. 4.2.4.5 Holodnaya Zone This is the deepest zone so far discovered at the Maleevskoye deposit. It is situated at a depth of 1,400‐1,700m, 2km from the central part of the Rodnikovaya Zone. It has been followed by drilling over a strike length of 1,500m. From the north and northwest, the zone is bounded by intrusive rocks of the Schebniushinskiy massif. Its prognosticated southwest extension, called Lugovaya Zone, was confirmed in drillholes 4452а, 4503 and 4510. In 2001‐2008 Kazzinc drilled 12 diamond drillholes Totalling 21,579m, including 4,068m of deflections. Drillhole 7005 intercepted rich massive pyritic‐polymetallic mineralisation. Four other holes intercepted lower grade veinlet‐type mineralisation. 4.2.4.6 Platovskaya Zone This zone occurs within a NNW trending subsidiary situated in the northeastern part of the deposit, 700m from the Maleevskaya Zone. It extends over a vertical distance of about 120m with widths in the range of 5.5m to 23m (6m on average). The lode plunges 20° NW. 4.2.5 Mineralogy The main metalliferous minerals are pyrite, sphalerite, chalcopyrite and galena. Black ore (tetrahedrite‐tennantite), pyrrhotite and magnetite occur in subordinate amounts. Accessories include native gold, silver, antimony, bismuth, electrum, bismuthite, molybdenite, cobaltine, pyrargyrite. The main gangue minerals are quartz, chlorite, calcite, barite, actinolite, tremolite and less common sericite, albite, epidote and biotite. With respect to chemical composition, the Maleevskoye mineralisation is pyritic polymetallic with the average Pb:Zn:Cu ratio of 1:6:1.7. As mentioned above, from a technological standpoint, the ore is divided into pyritic copper‐zinc (<0.6% Pb) and polymetallic (≥ 0.6% Pb), with further subdivisions depending on the relative abundance of sphalerite, galena, chalcopyrite and pyrite. The lead content is the key parameter as ore with less than 0.6% does not produce a lead concentrate. The relative abundance of the two technological types and the mineralogical subtypes are given in Table 4.2. Pyritic copper‐zinc mineralisation generally prevails in the central portions of mineralised bodies. Although the various mineralogical types alternate, there is a weak mineral zoning within the main mineralised zones expressed, from footwall to hangingwall, by the following sequence: pyritic ‐ pyritic copper ‐ copper‐zinc – zinc ‐ lead‐zinc ‐polymetallic.
Table 4.2: Technological and Mineralogical Classification of Maleevsky Mineralisation
Type Subtype Relative
Abundance % Polymetallic (>0.6% Pb) Polymetallic
Lead‐zinc Zinc
10 7 34
Pyritic copper‐zinc (<0.6% Pb) Copper‐zinc Pyritic copper
Pyritic
37 10 2
THIS WEB PROOF INFORMATION PACK IS IN DRAFT FORM. The information contained herein is incomplete and subject to change and it must be read in conjunction with the section headed ‘‘Warning’’on the cover of this Web Proof Information Pack.
KAZZINC LTD Competent Person’s Report for the assets held by Kazzinc Ltd in both Kazakhstan and Russia
61‐0795/MM February 2011
Draft V 0.10 Page 145
Pyritic mineralisation in the footwall is highly variable in thickness (up to 7m). The pyrite content is in the range of 30‐60% in disseminated varieties and up to 95% in massive mineralisation. Chalcopyrite is the main associated ore mineral (1‐3%). The boundary between the pyritic subtype zone and the overlying mineralisation (generally pyritic copper) is arbitrarily set at 1% ZnEq1. Massive sulphides have complex internal composition with massive, banded, lenticular and rare brecciated and mottled textures. Disseminated mineralisation, which makes up about 40% of the Total volume of the mineralisation, occurs mainly at the base and on the flanks of massive sulphide bodies. It is represented by veinlet, veinlet‐disseminated and disseminated textures. The matrix is formed by hybrid rocks (95.9%) represented by quartzites and silicified siltstones and porphyries (4.1%). Polymetallic and lead‐zinc mineralisation often contains barite either as bands or lenses. The main recoverable by‐products are gold and silver. Gold occurs in its native form as very fine grains (5‐8 microns) dispersed mainly in pyritic copper mineralisation and barite‐bearing lead‐zinc mineralisation. A small percentage of gold occurs as larger visible grains of up to 0.8mm across. The fineness of gold is 794. Silver is also very fine and occurs as native silver and electrum in massive and banded barite‐bearing polymetallic mineralisation and, in lesser quantities, in lead‐zinc mineralisation. It is associated with pyrrhotite, barite and black ore. Coarser electrum (20‐70 microns) occurs as inclusions in pyrrhotite in pyritic copper‐zinc mineralisation. Barite‐bearing polymetallic mineralisation also contains silver in freibergite and pyrargyrite. 1 ZnEq (zinc equivalent) is defined as 0.4*Pb + Zn + 1.4*Cu, with grades less than 0.4% Pb, less than 0.1% Zn and less than 0.1% Pb not being subject to conversion 4.2.6 Exploration Potential A number of other small occurrences/deposits have been identified which either have been depleted (Grekhovskoe) or are too small to be of interest. However, the main potential appears to be down‐dip from the known mineralisation towards Holodnaya zone, although as yet, no other commercial scale mineralisation has been defined.
WAI Comment: The geology and mineralisation of the Maleevskoye deposit are well known through decades of exploration and nearly ten years of exploitation. It is characterised as a Volcanogenic Massive Sulphide (Exhalative Type) deposit. The orebody geometry and mineralogy are relatively straightforward and well known and efficient mining methods maximise ore extraction. Maleevskoye deposit is world class in terms of the base and precious metal grades it contains. Coupled with the generally large dimensions of the various ore zones which lend themselves to bulk mining techniques, Maleevskoye represents a tremendous asset to Kazzinc.
4.3 Exploration Works & Procedures 4.3.1 Background The Maleevskoye mine has had a long history of exploration before production finally commenced in 2000. Surface discoveries were made in the 19th Century, but it was not until the 1950’s that systematic exploration took place which has continued following a series of specified protocols through to the present day.
THIS WEB PROOF INFORMATION PACK IS IN DRAFT FORM. The information contained herein is incomplete and subject to change and it must be read in conjunction with the section headed ‘‘Warning’’on the cover of this Web Proof Information Pack.

KAZZINC LTD Competent Person’s Report for the assets held by Kazzinc Ltd in both Kazakhstan and Russia
61‐0795/MM February 2011
Draft V 0.10 Page 146
4.3.2 Drilling Table 4.3 below presents data on exploration undertaken at Maleevskoye from 1950 – 2004.
Table 4.3: Historical Exploration Works Activity Dates Drilling (km) Drilling (holes) Preliminary Reconnaissance Works 1950‐1955 14.0 56 Follow‐up Exploration 1967‐1974 6.4 10 Continued Exploration 1979‐1983 93.6 159 Reconnaissance 1981‐1986 159.6 281 Detailed Reconnaissance 1983‐1986 111.3 237 Additional flanks exploration 1987‐1988 31.2 47 Exploration on flanks and deep horizons 1986‐1992 176.1 153 Exploration on the flanks 1988‐1993 124.8 121 Holodnaya Exploration 2001‐2004 10.3 6 Total: 724.3 1070
The main surface drilling campaign was carried out in 1979‐1986 using conventional drill rigs, including hydro‐percussive rigs. Depending on depth of drilling, the drilling diameter was 76mm or 59mm. Unusually, some of the core remains from this period, representing mineralised intersections through ore that has not yet been mined ‐ protocols allowed for core to be discarded once that particular part of the orebody had been exploited. Wireline drilling with the NQ size (75mm) has been used in most recent drilling programmes, including the most recent deep drilling to delineate the Holodnaya zone. Drilling profiles at Holodnaya are aligned on an azimuth of 055˚, which appears to be perpendicular to plunge, whereas early drillholes, prior to the discovery of the Rodnikovaya zone, were sited on profiles trending 074‐075˚. The majority of surface drillholes are sited along profile lines on an azimuth of 035˚, perpendicular to the prevailing plunge direction, and drilled at various angles with or without wedging to reach expected intercepts at predetermined points. As most mineralised bodies have lenticular forms elongated along the plunge direction and highly variable strikes and dips, grid orientations vary to suit local conditions. Most drillholes were angled as required to secure intersections at angles approximating 90˚. Many holes had up to three or wedged deflections (total of 302 wedged deflections for 103,000m). In most instances, drillholes were naturally deflecting due to complex folds typically 60‐300m in wavelength and 200‐300m in strike length. Recent exploration in the developed sections of the mine from Level 3 to Level 14 has been conducted entirely by underground exploration methods, including underground diamond core drilling. A grid of 50x50m is regarded as optimal for the delineation of a C1 resource and a grid of 30m along strike or plunge by 25m along dip for an upgrade to a B category. Closer spaced drilling is applied is areas of complex geology. Sludge drilling combined with electrical logging to confirm the hangingwall contact had been used in addition to channel sampling prior to 1999. Exploration below the current development and elsewhere in undeveloped areas relies on surface diamond drilling which is subcontracted to Zyryanovsk Geological‐Exploration Expedition (Zyryanovsk GRE). Drilling grids vary depending on the structural complexity and grade variability. A grid of 100m by 100m is currently considered optimal for the delineation of a C2 category resource. Grids used in the past were generally 200m along strike or plunge by 25‐50m down dip for the delineation of a C2 category resource and 100m by 25m respectively for its upgrade to the C1 category.
THIS WEB PROOF INFORMATION PACK IS IN DRAFT FORM. The information contained herein is incomplete and subject to change and it must be read in conjunction with the section headed ‘‘Warning’’on the cover of this Web Proof Information Pack.

KAZZINC LTD Competent Person’s Report for the assets held by Kazzinc Ltd in both Kazakhstan and Russia
61‐0795/MM February 2011
Draft V 0.10 Page 147
4.3.3 Surveying All underground exploratory workings, collar positions of surface and underground exploration drillholes and geophysical survey points were surveyed using instrumental methods. This is considered sufficiently accurate for resource modelling and mine planning purposes. Downhole surveys have been conducted in all drillholes at 20m intervals and at 5‐10m intervals in wedged intervals. Various instruments were used at various times. In the 1987 report, it is stated that absolute errors of zenithal angles and azimuths were 21΄ and azimuth 1˚53΄ respectively. Higher errors are mentioned in the report on the Holodnaya drilling (series 7000 holes). At deviations to 10˚, errors in measurements of zenithal angle and azimuth did not exceed 0.5˚ and 5˚ respectively. At deviations exceeding 10˚, errors in measurements of zenithal angle and azimuth did not exceed 1˚ and 5 respectively. Geophysical drillhole logging, including electrical logging and roentgen‐radiometric grade logging, has been routinely conducted in most surface drillholes to monitor depths of mineralised intercepts recorded in drill logs and to monitor grades. Oriented drill core was collected from 111 holes in 1980 and compared with telephoto logging records. 4.3.4 Core Recovery 4.3.4.1 Surface Drilling Geoincentr (2005) reported that core recoveries in excess of 80% were achieved for 61.7% of the Total length of mineralised intercepts included in the resource estimate approved by GKZ RK. Core recoveries improved in surface drillholes completed after 1986.
Geoincentr (2005) also reported results of a comparison of linear core recoveries with weight core recoveries for the post‐1987 drilling. No systematic bias in recording linear core recovery was observed. Differential loss is suspected to have occurred only in pre‐1986 drilling. Correction coefficients have been proposed to account for it. The correction coefficients are: 1.2 for Pb, 1.2 for Zn, 1.1 for Cu, 1.3 for gold and 1.1 for Ag. 4.3.4.2 Underground Drilling Geoincentr (2005) reported some quality control data for the underground diamond core drilling and sludge drilling. 4.3.4.3 Underground Sampling Horizontal channel samples were taken with a chisel and hammer from one or two walls of each underground opening with visible sulphide mineralisation. Channels are 10cm wide and 2.5cm deep. There has been a considerable amount of work done to check the quality of channel sampling. It included duplicate sampling, larger channels, control drilling and bulk sampling. Geoincentr (2005) reported rather large relative differences, but no systematic bias. 4.3.4.4 Core Sampling All mineralised intervals have been sampled, by splitting drill core in a mechanical splitter up to 1968, and then by sawing the core in two halves. From 1974, all drill core recovered from 59mm diameter holes was taken for sample preparation. Core from subsequent drilling programmes was sawn in half. Lengths of core samples range from 0.1m to 2m.
THIS WEB PROOF INFORMATION PACK IS IN DRAFT FORM. The information contained herein is incomplete and subject to change and it must be read in conjunction with the section headed ‘‘Warning’’on the cover of this Web Proof Information Pack.

KAZZINC LTD Competent Person’s Report for the assets held by Kazzinc Ltd in both Kazakhstan and Russia
61‐0795/MM February 2011
Draft V 0.10 Page 148
Geoincentr (2005) mentioned that that 5,784 core samples were included in the 1986 resource and those samples comprised 39 samples from 93mm diameter holes, 610 samples from 76mm diameter holes and 5,135 samples from 59mm diameter holes. Core sampling variance depends on the core diameter, the smaller the diameter the larger the variance. Pulverised sample rejects were composited over intervals with similar characteristics for analyses for potential by‐product elements and deleterious elements. The analyses also included the main elements. The samples were typically in the range of 300‐500g each. Geoincentr (2005) reported that a statistical analysis of composite sample results confirmed that no mineralisation of potentially economic grades was overlooked. Geochemical samples were collected from each lithological unit outside mineralised zones. 4.3.5 Sample Collection The sample preparation scheme is based on the Richard‐Czeczott formula Q=kda, where Q is the minimum sample quantity at a given stage of volume reduction, d is the diameter of the largest fragments defined as the screen size that retains the largest 5% of the mass, k is a coefficient dependent on the distribution irregularity of the mineral of interest and a is a coefficient related to the roundness of mineral grains (generally approximately 2). The coefficient k is the key parameter. In general terms, the lower coefficient k is, the better it accounts for the erratic distribution of minerals. Different schemes were used at different times. The k coefficient for processing drill core from surface drilling was initially 0.2, then 0.6 from 1978 and 0.2 again from February 1984. Experimental tests confirmed that the 0.2 coefficient was appropriate. The k coefficient for processing underground drill core was initially 0.2 and then it was changed to 0.1 in 1993. A series of tests conducted on four bulk samples representing polymetallic and copper‐zinc mineralisation confirmed that the scheme based on the coefficient 0.2 was appropriate. 4.3.6 Sample Analysis Routine analyses were performed mainly by the Zyryanovsk GRE laboratory. All samples with spectral Pb+Zn+Cu results greater than 0.5% or Zn results greater than 0.3% were analysed by the AAS method, which was introduced towards the end of 1980. Reported lower and upper detection limits are: 0.005‐20% for Cu and Zn and 0.02‐20% for Pb. Samples containing more than 20% Zn or more than 20% Pb were analysed by the titrometric method. A small number of drill core samples from surface exploration was analysed by the polarographic method on electron polarograph CLA‐2122. External control analyses were performed by Vostkazgeologia in Ust Kamenogorsk. Analyses for by‐product elements and deleterious elements were conducted by Vostkazgeologia and external control analyses by Yuzhkazgeologia in Almaty. Out of a Total of 14,524 analysis made in 1980‐1986, 2,016 duplicate samples (13.9%) were subjected to internal control analyses and 1,765 duplicate samples (12.2%) to external control analyses. Average relative differences of internal control samples were within acceptable limits. However, based on external control analyses, some systematic errors were detected in specific periods, although samples from these periods represented different parts of the deposit, most of which have since been delineated in detail during underground development. On the whole, therefore these errors are not considered to have biased the average grades.
THIS WEB PROOF INFORMATION PACK IS IN DRAFT FORM. The information contained herein is incomplete and subject to change and it must be read in conjunction with the section headed ‘‘Warning’’on the cover of this Web Proof Information Pack.

KAZZINC LTD Competent Person’s Report for the assets held by Kazzinc Ltd in both Kazakhstan and Russia
61‐0795/MM February 2011
Draft V 0.10 Page 149
4.3.7 Current Activities The mine currently operates three Diamec 262 rigs drilling around 50,000m of development exploration drilling per year. All the core from this drilling is crushed and sampled, as the 42mm diameter core does not allow sub‐samples to be statistically valid. The results from these samples is input to the resource model to improve future mine planning and resource estimation. For grade control, a small 5‐9kg grab sample is taken after each blast. In addition, all wagons pass over a weightometer where sample analysis is done using a portable XRF, which allows classification of the ore into either polymetallic or copper‐zinc (or some mixture of the two). Continued surface exploration drilling uses a half core for analysis, the remainder are currently kept at the mine in a new core storage unit, which also has a small laboratory attached.
WAI Comment: The Maleevskoye deposit has been thoroughly explored and developed over a period of approximately sixty years. As such, the huge volume of exploration data available on the mine, coupled with the knowledge that these data will have been collected under strict Soviet protocols, provides strong comfort to the quality of data. Moreover, nearly ten years of production has allowed comparisons of exploration data with production information, and in general, exploration (both past and present) has proved satisfactory in delineating the sometimes complex mineralised zones. In particular, the use of small, versatile underground core rigs for development exploration have proved vital in efficient orebody definition.
4.4 Mineral Resources 4.4.1 Introduction Maleevskoye is unusual in Kazakhstan in that the most recent GKZ approved resource was estimated using contemporary techniques and software. The initial estimate was created in the Datamine software by Computing Resource Services Ltd (CRS) in late 1999. CRS then went on to train Kazzinc personnel before handing over to them in 2002/03. After the handover, Kazzinc retained Almaty‐based TOO Geoincentr and ZF TOO Geos to prepare a resource report in the format required by GKZ RK. The report (Geoincentr, 2005) contains two resource estimates:
• Geostatistical estimate in Datamine (Kriging) with about 80% of the estimated resource checked using locally‐developed GST program; and
• Conventional estimate using the method of parallel vertical cross sections in the developed part of the deposit and the method of geological blocks in the undeveloped part.
The estimates were accepted and approved by GKZ RK in February 2005 (Protocol No 379‐05‐U dated 11 February 2005). 4.4.2 Resource Conditions The currently valid resource conditions were approved by GKZ RK on 22 July 2004 (Memorandum No 327‐04‐K).
THIS WEB PROOF INFORMATION PACK IS IN DRAFT FORM. The information contained herein is incomplete and subject to change and it must be read in conjunction with the section headed ‘‘Warning’’on the cover of this Web Proof Information Pack.

KAZZINC LTD Competent Person’s Report for the assets held by Kazzinc Ltd in both Kazakhstan and Russia
61‐0795/MM February 2011
Draft V 0.10 Page 150
The approved conditions require a resource to be estimated and reported for two types of mineralisation, namely polymetallic mineralisation (with the lead grade equal to or more than 0.6% Pb) and copper‐zinc mineralisation (with the mean lead grade less than 0.6%). For the developed part of the Maleevskoye deposit, the resource conditions are as follows:
• Sample cut‐off grade to define mineralised intercept intervals ‐ 1.0% ZnEq, where ZnEq = 0.4*Pb + Zn + 1.4*Cu, with grades less than 0.4 % Pb, less than 0.1% Zn and less than 0.1% Pb not being subject to conversion.
• Minimum grade in estimation block ‐ 3.3% ZnEq. • No top‐cut applied. • Minimum thickness – 2m. • Maximum thickness of barren and below cut‐off inclusions – 4m. • Cut‐off grade for delineation of off‐balance resource – 0.8% ZnEq.
Grades of lead, zinc, copper, gold, silver, cadmium, bismuth, indium, selenium, tellurium, arsenic, antimony, Total sulphur, pyritic sulphur and barite should be estimated within mineralisation shells. Blocks with mean grades of less than 3.3% ZnEq should be classified as an off‐balance resource. Estimates of pyritic sulphur and total sulphur should be reported in the off‐balance category. Correction coefficients should be applied to mean block grades estimated from drilling results reported prior to 1987. The correction coefficients are: 1.2 for Pb, 1.2 for Zn, 1.1 for Cu, 1.3 for gold and 1.1 for Ag. 4.4.3 2005 GKZ Approved Estimate Details of the 2005 Balanced Ore Conventional Reserve calculation are given in Table 4.4 below.
Table 4.4: 2005 Conventional Reserve Estimate Reserves Average content
Ore 000’t
Pb 000’t
Zn 000’t
Cu 000’t Au kg Ag t
Pb % Zn % Cu % Au g/t Ag g/t
Total 39400.5 548.3 3415.3 1012.4 28627.0 3233.3 1.39 8.67 2.57 0.73 82.06 Made up of: Polymetallic 19294.6 491.7 2643.2 379.2 16851.6 2427.4 2.55 13.70 1.97 0.87 125.81 Copper‐zinc 20105.8 56.6 772.1 633.2 11775.4 805.9 0.28 3.84 3.15 0.59 40.08 In comparison, detailed below is the 2005 Geostatistical Reserve Estimate which has been approved by GKZ (Table 4.5).
Table 4.5: Geostatistical GKZ‐Approved Resources Reserves Average Content Ore 000’t Pb 000’t Zn 000’t Cu 000’t Au kg Ag t Pb % Zn % Cu % Au g/t Ag g/t
Total 42703.5 641.9 3499.6 1017.4 33139.9 3478.4 1.50 8.20 2.38 0.78 81.45 Made up of: Polymetallic 28084.6 592.00 2894.8 624.8 24088.9 2631.9 2.11 10.31 2.22 0.86 93.71 Copper‐zinc 14618.9 49.9 604.9 392.5 9051.0 846.5 0.34 4.14 2.69 0.62 57.91
The approved resource estimate has also been classified according to the various parts of the deposit, the results of which are shown in Table 4.6.
THIS WEB PROOF INFORMATION PACK IS IN DRAFT FORM. The information contained herein is incomplete and subject to change and it must be read in conjunction with the section headed ‘‘Warning’’on the cover of this Web Proof Information Pack.

KAZZINC LTD Competent Person’s Report for the assets held by Kazzinc Ltd in both Kazakhstan and Russia
61‐0795/MM February 2011
Draft V 0.10 Page 151
Table 4.6: Classified Geostatistical Approved Resource Metal content
Ore Reserves Lead Zinc Copper
t % % % Category С1 Reserves of Developed part of Mine Total 23,399,055 1.35 8.56 2.76 Reserves of Undeveloped part of Mine
Reserves of Rodnikovaya ore zone Total 8,852,260 1.41 7.43 2.00
Reserves of Maleevskaya ore zone Total 6,276,000 1.36 8.02 2.39 Total Category С1 Total 38,527,215 1.37 8.21 2.53 Category С2 Reserves of Undeveloped part of Mine
Reserves of Rodnikovaya ore zone Total 2,101,500 3.36 8.17 1.38
Reserves of Maleevskaya ore zone Total 113,800 3.00 10.21 0.79
Reserves of Oktyabrskaya ore zone Total 1,909,900 2.13 8.02 0.73 Total С2 category Total 4,125,200 2.78 8.16 1.06 Total С1+С2 categories Total 42,652,415 1.50 8.20 2.39
WAI Comment: It is very encouraging that GKZ has allowed the use of a geostatistical resource estimate to become part of the State balance, albeit still classified under the Russian system. Moreover, the closeness of the geostatistical and conventional estimates provides extra comfort as to the robustness of the resource. Overall, the Maleevskoye resource base is sound and can be relied upon for future mine scheduling and development.
4.5 WAI 2010 Resource Estimate 4.5.1 Introduction – Previous Resource Estimates The mineral resource model presented and evaluated here for the Maleevskoye polymetallic deposit has been supplied by Kazzinc and created by the methods laid out below in accordance with the guidelines of the JORC Code (2004). The effective date of the resource estimate is 01 January 2011. 4.5.2 Database Compilation The sample database was supplied by Kazzinc in Datamine Format separated by mineralised zone and orebody. Checks were made for overlapping or duplicate samples and the database was found to be in good order. Orebody 3 in the Maleevskaya Zone and orebodies 6 and 7 in the Rodnikovaya Zone are the most extensively sampled. Table 4.7 below lists the number of samples by orebody. As different sampling intervals were used for the different elements, the lengths and number of samples reported in Table 4.7 are for Pb/Zn/Cu analysis. 4.5.3 Domaining Mineralised zone wireframes have been created within Datamine to a sample cut‐off grade of 1.0% Zinc Equivalent (ZnEq) where ZnEq= 0.4*Pb + Zn + 1.4*Cu where grades of less than 0.4% Pb, 0.1% Zn and 0.1% Cu were not converted. The minimum thickness of mineralised intercept is 2m and the maximum included
THIS WEB PROOF INFORMATION PACK IS IN DRAFT FORM. The information contained herein is incomplete and subject to change and it must be read in conjunction with the section headed ‘‘Warning’’on the cover of this Web Proof Information Pack.
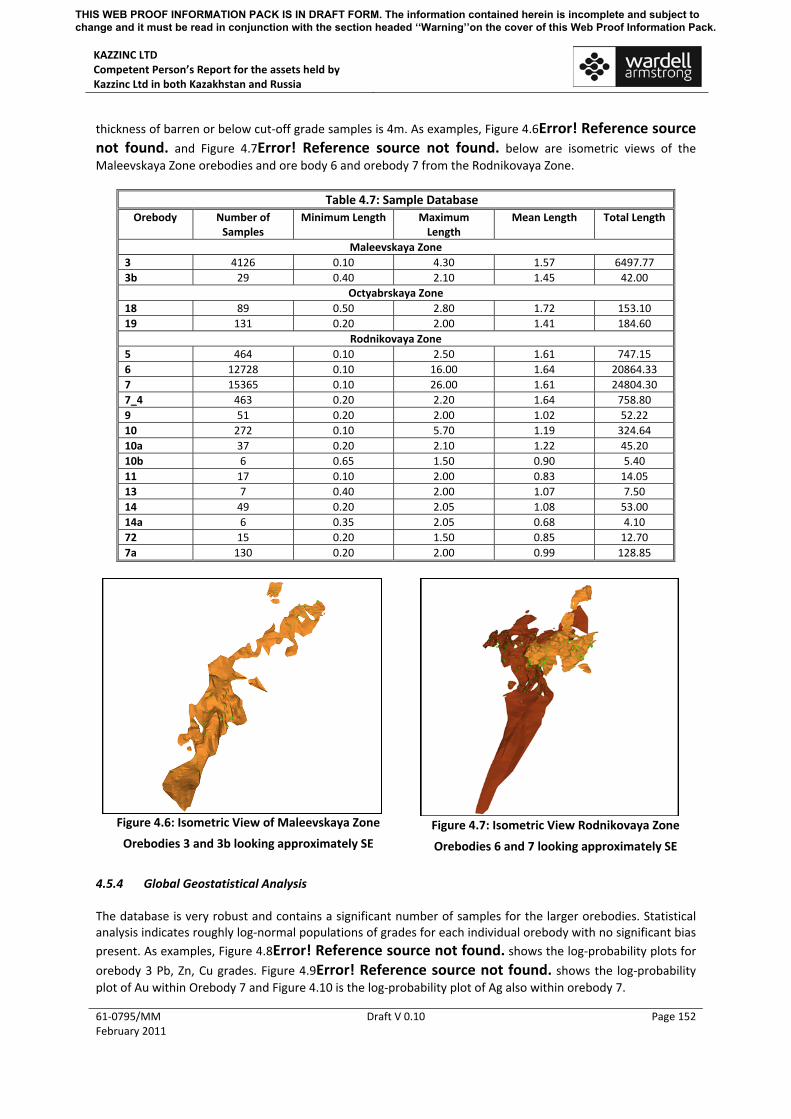
KAZZINC LTD Competent Person’s Report for the assets held by Kazzinc Ltd in both Kazakhstan and Russia
61‐0795/MM February 2011
Draft V 0.10 Page 152
thickness of barren or below cut‐off grade samples is 4m. As examples, Figure 4.6Error! Reference source not found. and Figure 4.7Error! Reference source not found. below are isometric views of the Maleevskaya Zone orebodies and ore body 6 and orebody 7 from the Rodnikovaya Zone.
Table 4.7: Sample Database Orebody Number of
Samples Minimum Length Maximum
Length Mean Length Total Length
Maleevskaya Zone 3 4126 0.10 4.30 1.57 6497.77 3b 29 0.40 2.10 1.45 42.00
Octyabrskaya Zone 18 89 0.50 2.80 1.72 153.10 19 131 0.20 2.00 1.41 184.60
Rodnikovaya Zone 5 464 0.10 2.50 1.61 747.15 6 12728 0.10 16.00 1.64 20864.33 7 15365 0.10 26.00 1.61 24804.30 7_4 463 0.20 2.20 1.64 758.80 9 51 0.20 2.00 1.02 52.22 10 272 0.10 5.70 1.19 324.64 10a 37 0.20 2.10 1.22 45.20 10b 6 0.65 1.50 0.90 5.40 11 17 0.10 2.00 0.83 14.05 13 7 0.40 2.00 1.07 7.50 14 49 0.20 2.05 1.08 53.00 14a 6 0.35 2.05 0.68 4.10 72 15 0.20 1.50 0.85 12.70 7a 130 0.20 2.00 0.99 128.85
Figure 4.6: Isometric View of Maleevskaya Zone
Orebodies 3 and 3b looking approximately SE
Figure 4.7: Isometric View Rodnikovaya Zone
Orebodies 6 and 7 looking approximately SE
4.5.4 Global Geostatistical Analysis The database is very robust and contains a significant number of samples for the larger orebodies. Statistical analysis indicates roughly log‐normal populations of grades for each individual orebody with no significant bias present. As examples, Figure 4.8Error! Reference source not found. shows the log‐probability plots for orebody 3 Pb, Zn, Cu grades. Figure 4.9Error! Reference source not found. shows the log‐probability plot of Au within Orebody 7 and Figure 4.10 is the log‐probability plot of Ag also within orebody 7.
THIS WEB PROOF INFORMATION PACK IS IN DRAFT FORM. The information contained herein is incomplete and subject to change and it must be read in conjunction with the section headed ‘‘Warning’’on the cover of this Web Proof Information Pack.

KAZZINC LTD Competent Person’s Report for the assets held by Kazzinc Ltd in both Kazakhstan and Russia
61‐0795/MM February 2011
Draft V 0.10 Page 153
Different sample intervals have been used for Pb/Zn/Cu, Au/Ag and Ba/S analysis. For this reason different composite lengths have been selected. A composite length of 3m has been selected for Pb/Zn/Cu assays, a composite length of 5m has been selected for Au/Ag analysis and a composite length of 4.5m has been selected for S/Ba assays.
Figure 4.8: Log Probability Plot of Pb/Zn/Cu within
Orebody 3 Maleevskaya Zone
Figure 4.9: Log Probability Plot for Au in Orebody 7
Rodnikovaya Zone
Figure 4.10: Log probability Plot of Ag within Orebody 7
Rodnikovaya Zone
WAI Comment: WAI considers the composite lengths chosen to be appropriate with regard to the mean and the spread of the sample lengths.
4.5.5 Variography The initial estimate for the Maleevskoye deposit was created using Datamine software by Computing Resources Limited (CRS) in 1999. CRS continued to update the model and train Kazzinc personnel until the model was handed over to Kazzinc in 2002/2003. Part of this process was a variographic study which has been updated as required. Directional semi‐variograms for the along strike, down dip and across strike directions were generated for Pb, Zn, Cu, Ag, Au, Ba and pyritic Sulphur. Examples of some of these experimental variograms and their associated models are shown below in Figure 4.11Error! Reference source not found. and Figure 4.12Error! Reference source not found..
THIS WEB PROOF INFORMATION PACK IS IN DRAFT FORM. The information contained herein is incomplete and subject to change and it must be read in conjunction with the section headed ‘‘Warning’’on the cover of this Web Proof Information Pack.

KAZZINC LTD Competent Person’s Report for the assets held by Kazzinc Ltd in both Kazakhstan and Russia
61‐0795/MM February 2011
Draft V 0.10 Page 154
Figure 4.11: Variogram Model for Pb in Orebody 6 Figure 4.12: Variogram Model for Cu in Orebody 7 4.5.6 Block Modelling Block models were created within each of the mineralised zone wireframes. A parent cell size of 10x10x10m was selected. Sub cell splitting to a minimum block size of 2.5x2.5m in the X strike and Y directions has been used with precise fitting to wireframe boundaries in the Z direction where additional cell resolution is required. 4.5.7 Density and Zinc Equivalent Bulk density has been determined on approximately 15,000 samples (mostly drill core). This included 4,135 samples from the Maleevskaya Zone and 5,939 samples from the Rodnikovaya Zone. Regression formulas have been developed for each of the zones and these were used post grade estimation to calculate density in to the block models. These regression formula are listed below in Table 4.8. A zinc equivalent grade (ZnEq) is calculated in to the block models from the estimated grades using the formula ZnEq= (0.4 x Pb) + Zn + (1.4 x Cu).
Table 4.8: Density Regression Formulas Zone Density Regression Formula Maleevskaya 2.7351+0.101*(PB+0.8*ZN+CU)‐0.0019*(PB+0.8*ZN+CU) Octyabrskaya 2.773 + (0.0403*Cu) + (0.0134*Pb) + (0.0365 Zn) Rodnikovaya For samples with analysis for Cu, Pb, Zn, pyritic S and Ba
=100/(36.9‐(0.303*Pb+0.186*Zn+0.395*Cu+0.31*S+0.262*Ba) For samples with <8.39% ZnEq (see below) =2.8306+0.1789*(0.9Pb+1.0Zn+1.0*Cu) For samples with >=8.39% ZnEq =4.3397‐0.0009*(0.9*Pb+1.0*Zn+1.0*Cu)
4.5.8 Grade Estimation Grade estimation was carried out using Ordinary Kriging (OK) as the principal interpolation method with Inverse Power of Distance (IPD) used for comparative purposes. For orebodies 3b in the Maleevskaya Zone, 18 and 19 in the Octyabrskaya Zone and orebody 5 in the Rodnikovaya Zone, IPD was used as the principal interpolation method. The OK method used estimation parameters defined by the variography. The estimation was performed only on mineralised material defined by each ore zone and only drillholes contained within each ore zone were used in the grade estimation (i.e. no drillholes from adjacent ore zones have been used).
THIS WEB PROOF INFORMATION PACK IS IN DRAFT FORM. The information contained herein is incomplete and subject to change and it must be read in conjunction with the section headed ‘‘Warning’’on the cover of this Web Proof Information Pack.

KAZZINC LTD Competent Person’s Report for the assets held by Kazzinc Ltd in both Kazakhstan and Russia
61‐0795/MM February 2011
Draft V 0.10 Page 155
Where used, the OK estimation was run in a three pass kriging plan, the second and third passes using progressively larger search radii to enable the estimation of blocks unestimated on the previous pass. The search parameters were derived from the variographic analysis, with the first search distances corresponding to the variogram range where a spherical mode was used, the second search distance twice the variogram range and the third search distance three times the variogram range. Where exponential models were used the search ellipses were limited to one third of the variogram model range. Sample weighting during grade estimation was determined by variogram model parameters for the OK method. Block discretisation was set to 3x3x3 to estimate block grades. Grades were estimated in to each individual subcell. 4.5.9 Validation A model validation process included the examination of block model versus composites, and the building up of a model grade profile, to compare average grades on vertical slices, as derived from the composites directly, as well as from interpolated model grades. An example Swath plot from this process is shown below in Figure 4.13 for Pb grades within orebody 6.
Figure 4.13: Swath Plot for Orebody 6 Pb Grades
4.5.10 Depletion The block models were coded based on existing stopes and other underground development. The effective date of the resource assessment is 01 July 2010. 4.5.11 Resource Classification WAI has classified the Maleevskoye deposit in accordance with the Australian Code for Reporting of Exploration Results, Mineral Resources and Ore Reserves JORC Code (2004). Key drillhole spacings for the allocation of resources by area can be summarised as follows:
• Measured resources ‐ 20m x 25m (down dip and along strike) with underground development within this area;
• Indicated resources – 40m x 50m (down dip and along strike); and • Inferred resources – 80m x 100m (down dip and along strike);
THIS WEB PROOF INFORMATION PACK IS IN DRAFT FORM. The information contained herein is incomplete and subject to change and it must be read in conjunction with the section headed ‘‘Warning’’on the cover of this Web Proof Information Pack.

KAZZINC LTD Competent Person’s Report for the assets held by Kazzinc Ltd in both Kazakhstan and Russia
61‐0795/MM February 2011
Draft V 0.10 Page 156
An example vertical section is shown in Error! Reference source not found. for orebody 6, demonstrating the resultant resource class categories which have been set into the block model. An example isometric view of the resource classification for orebody 6 is shown in Error! Reference source not found.. 4.5.12 Resource Evaluation The resource classification for the Maleevskoye deposit is classified in accordance with the guidelines of the JORC Code (2004). The final block models were used as the basis for resource evaluation. The resource is reported to different types of mineralisation; polymetallic mineralisation (PbZn) with a Pb grade more than or equal to 0.6% Pb and copper‐zinc mineralisation (CuZn) with a mean Pb grade of less than 0.6% Pb. Summary results of the evaluation of the unmined, in‐situ resources for the whole of the Maleevskoye deposit are shown below in Table 4.9.
WAI Comment: The resource modelling process at Maleevskoye is, in WAI’s opinion, robust and accurately reflects the remaining resources both in the developed part of the mine, and in those other undeveloped areas. As the parameters set for the Zinc Equivalent cut‐off were set in 2004, it is likely that a late‐2010 economic cut‐off might be a little lower which would have an effect of increasing the resource tonnage, but probably decreasing the grade. However, WAI does not believe that this change would be significant and moreover would have minimal effect on the overall life‐of‐mine schedule.
Figure 4.14: Orebody 3 NW‐SE Vertical Section
Showing JORC Classification
Figure 4.15: Orebody 3 Isometric View from North
Showing JORC Classification
THIS WEB PROOF INFORMATION PACK IS IN DRAFT FORM. The information contained herein is incomplete and subject to change and it must be read in conjunction with the section headed ‘‘Warning’’on the cover of this Web Proof Information Pack.

KAZZINC LTD Competent Person’s Report for the assets held by Kazzinc Ltd in both Kazakhstan and Russia
61‐0795/MM February 2011
Draft V 0.10 Page 157
Table 4.9: Maleevskoye Resource Estimate ‐ For All Orebodies (WAI 01.01.2011)
(In Accordance with the guidelines of the JORC Code (2004)) Pb Zn Cu Au Ag Ba Sp EQV Classification Ore
Type Tonnage (Mt)
Density % t % t % t g/t oz g/t oz % t % t %
CuZn 5.16 3.57 0.31 16,118 3.17 163,709 2.37 122,268 0.46 76,838 45.78 7,592,815 2.34 12,074 20.83 107,488 6.62 PbZn 7.77 3.81 1.68 130,483 9.41 730,724 2.39 185,584 0.73 181,078 98.97 24,707,132 5.19 40,308 18.06 140,209 13.44
Measured
Total 12.92 3.71 1.13 146,601 6.92 894,433 2.39 307,852 0.62 257,917 77.74 32,299,948 4.05 52,382 19.17 247,696 10.71 CuZn 3.68 3.22 0.35 12,826 3.28 120,504 1.65 60,638 0.39 45,517 41.84 4,943,748 2.30 8,438 11.46 42,095 5.71 PbZn 7.36 3.62 1.55 114,356 8.59 631,546 2.10 154,476 0.65 154,837 76.29 18,043,611 3.78 27,792 11.49 84,529 12.15
Indicated
Total 11.03 3.49 1.15 127,182 6.82 752,050 1.95 215,114 0.56 200,354 64.82 22,987,359 3.28 36,231 11.48 126,625 10.00 CuZn 8.83 3.43 0.33 28,944 3.22 284,213 2.07 182,906 0.43 122,355 44.14 12,536,563 2.32 20,512 16.93 149,583 6.24 PbZn 15.12 3.72 1.62 244,838 9.01 1,362,270 2.25 340,060 0.69 335,915 87.94 42,750,744 4.50 68,101 14.86 224,738 12.81
Measured + Indicated
Total 23.96 3.61 1.14 273,783 6.87 1,646,483 2.18 522,966 0.60 458,271 71.79 55,287,307 3.70 88,613 15.63 374,321 10.39
CuZn 1.77 3.06 0.29 5,047 2.80 49,408 1.22 21,533 0.18 10,145 24.28 1,377,707 1.15 2,038 5.80 10,234 4.55 PbZn 3.11 3.21 2.31 71,746 6.23 193,725 0.84 26,099 0.29 28,611 60.67 6,061,129 2.75 8,538 5.83 18,101 8.55
Inferred
Total 4.87 3.16 1.58 76,794 4.99 243,133 0.97 47,632 0.25 38,756 47.49 7,438,836 2.17 10,576 5.82 28,334 7.10
THIS WEB PROOF INFORMATION PACK IS IN DRAFT FORM. The information contained herein is incomplete and subject to change and it must be read in conjunction with the section headed ‘‘Warning’’on the cover of this Web Proof Information Pack.

KAZZINC LTD Competent Person’s Report for the assets held by Kazzinc Ltd in both Kazakhstan and Russia
61‐0795/MM February 2011
Draft V 0.10 Page 158
4.6 Mining 4.6.1 Introduction Maleevskoye is the largest underground mine in the Kazzinc group in terms of ore production. Operations at Maleevskoye started in 2000 at a rate of 1.5Mtpa, with full scale production of 2.25Mtpa being reached in 2002. Two ore types are mined at Maleevskoye, copper‐zinc ore and polymetallic ore. Both products are transported by road to the Zyryanovsky Mining and Concentrating Complex (“ZGOK”) located some 25km to the south of the mine site. The mine utilises modern high capacity trackless mining methods combined with a traditional tracked haulage system. The main mining methods in operation are sub‐level caving, which accounts for approximately 5% of production, and sub‐level open stoping with backfill, which accounts for the remaining 95% of production. 4.6.2 Mining Methods Two main mining methods are employed at Maleevskoye, being:
• Block Caving (5%); and • Sub‐level Open Stoping (“SLOS”) with Backfill (95%).
Both mining methods utilise mechanised development with electric‐hydraulic face‐jumbos and diesel LHDs for drilling and ore extraction. Ore and waste is transported either directly to ore/waste passes using LHDs or loaded into trucks and transported to a central ore/waste pass. Both sub‐level caving and SLOS mining methods use electric‐hydraulic production jumbos for blast hole drilling The sub‐level caving method is essentially open stope mining but the hangingwall is allowed to cave into the stope void after the ore has been extracted. Blast holes drilled from hangingwall development drives are used to initiate and control the caving. Stopes are orientated longitudinally along the strike of the lode and are extracted in a top‐down sequence. The caving method is only used between Level 2 and Level 7 (inclusive) of the Maleevskiy lode. The minimum mining width is approximately 5m; maximum width is approximately 20m and sub‐level spacing is typically 25‐50m. SLOS mining with backfill is a variation of Open Stope Mining with the final void being backfilled with cemented classified tailings, typically with a final strength of 1.5‐2.5MPa. Extraction takes place from multiple sub‐levels located vertically between main mine levels. The SLOS stopes are transversely orientated across the orebody strike. The method employs up‐hole drilling and stope extraction usually takes place as a series of four stopes mined along strike (20m width each) with each stope containing several sub‐level stopes with a vertical spacing of 12.5m between sub‐levels. The first stope in each block is always mined top‐down over several sub‐levels and opened up as one large open stope and subsequently backfilled with cemented fill. The second and third stopes in the sequence are mined bottom‐up and always adjacent to a stope side wall fill exposure. The last (4th) stope in the block is the closest to the access point and is essentially a pillar recovery stope. It is mined bottom‐up as per stages 2 and 3. The SLOS mine method is employed from Level 11 down to Level 16 (inclusive) in both the Maleevskaya and Rodnikovaya Zones and represents approximately 95% of current and future production. For mining blocks that span more than four sub‐levels, the lower (down‐dip) series of stopes are mined under the backfill. When this occurs (which is not often), the floor of the overlying stope incorporates tank‐buster style steel frames embedded in higher strength cemented backfill to ensure safe working conditions in the underlying stope. In areas where the ore does not extend to an extraction level, it is mined with an intermediate sub‐level to reduce waste rock dilution. The majority of stopes employ up‐hole drilling but some down‐hole drilling is
THIS WEB PROOF INFORMATION PACK IS IN DRAFT FORM. The information contained herein is incomplete and subject to change and it must be read in conjunction with the section headed ‘‘Warning’’on the cover of this Web Proof Information Pack.

KAZZINC LTD Competent Person’s Report for the assets held by Kazzinc Ltd in both Kazakhstan and Russia
61‐0795/MM February 2011
Draft V 0.10 Page 159
employed for resources that don’t extend the full extent between sub‐levels. All stopes have a uniform 20m strike width. The stope extraction sequence is 1 to 3 (right to left) followed by the 4th, on the right hand side of 1 (see Figure 4.16). The extraction sequence within the primary stope is top‐down; for example 13L+37m, 13L+25m, 13L+12m, 13L and then all sub‐levels are backfilled. The extraction sequence within the 2nd 3rd and 4th stopes is bottom‐up; for example 13L+12m, 13L followed by backfilling of these two sub‐levels, then 13L+37m, 13L+25m followed by backfilling of these two sub‐levels. Adjacent stopes on the same sub‐level have a strike step stagger, for example Stope 2 – 13L+37m sub‐level and Stope 2 13L+25m sub‐level are mined, backfilled and allowed to cure for 90 days before production starts in the adjacent Stope 3 – 13L+12m sub‐level.
Figure 4.16: SLOS Stope Extraction Sequence at Maleevskoye Mine
Where the orebody thickness (from hangingwall to footwall) is greater than 50‐60m, the stope may be split into two transverse stopes as well as 4 sub‐levels. Again, a stepped extraction sequence is employed between transverse stopes. Typically each stope can take 9‐12 months to complete from development through to backfilling. Approximately 10 to 11 stopes are active at any time to achieve the 2.25Mtpa production rate. Ore transportation from the stopes to the ore and waste passes is via loaders (LHDs) and trucks Ground conditions are very good underground with little or no support required. Kazzinc reports very few in‐situ or mining induced stress problems and none were viewed during WAI’s site visit. 4.6.3 Dilution, Recoveries and Losses Dilution factors are applied to the Mineral Resource depending on the mining method to be employed in extracting the resource. Total dilutions (primary and secondary) typically vary between 10 – 12% (mine dilution) with the overall average being 11%. Dilutions are typically higher for the 4th stage pillar recovery stopes.
THIS WEB PROOF INFORMATION PACK IS IN DRAFT FORM. The information contained herein is incomplete and subject to change and it must be read in conjunction with the section headed ‘‘Warning’’on the cover of this Web Proof Information Pack.

KAZZINC LTD Competent Person’s Report for the assets held by Kazzinc Ltd in both Kazakhstan and Russia
61‐0795/MM February 2011
Draft V 0.10 Page 160
The dilution factors applied assume zero grade for material classified as waste even if it may contain some mineralization. Off balance material that is included within stope boundaries is assigned its respective grade for mining and planning purposes. Exploitation losses (under‐break, mucking losses, spillages, misallocation etc) are applied to the Mineral Resource depending on the mining method to be employed when extracting the resource. Total losses (primary and secondary) typically vary between 4‐8% with the overall average for stope extraction method being 4%. 4.6.4 Mining Equipment The following main mining equipment fleet is employed at Maleevskoye mine:
• 3 x Atlas Copco Boomer – Twin boom electric‐hydraulic face drilling jumbos for mine development;
• 7 x Caterpillar R1700G LHDs for ore extraction and haulage; • 4 x Sandvik Solo 7 electric‐hydraulic production drilling jumbos; • 1 x Kiruna K635E – 35t electric haul truck; and • 2 x Caterpillar 740 – 40t diesel haul trucks.
The mine is equipped with an underground workshop for maintaining all underground mining equipment. All equipment is owner operated and maintained. 4.6.5 Backfill Backfill for the SLOS mining operations at Maleevskoye is produced in an on‐site backfill plant. The principal ingredients in the fill are:
• Tailings from ZGOK – 1,140kg/m3 (60%); • Granulated smelter slag from Karaganda – 240kg/m3 (12.6%); • Smelter slag from Ust‐Kamenogorsk – 260kg/m3 (13.7%); • Cement – 60kg/m3 (3.2%); and • Water – 200kg/m3 (10.5%).
The combined bulk density of the backfill is 1.9t/m3 with 3.2% cement content. The tailings are excavated from the ZGOK tailings dam located 14km south of the Maleevskoye mine and transported as a return load by the trucks used to transport ore from the mine to the metallurgical plant. The smelter slags from Ust‐Kamenogorsk and Karaganda are transported to Zyryanovsk by rail and then to the mine site by truck. The backfill plant consists of two ball mills in series which mill the tailings and smelter slags down to the correct particle size before the cement is added. All ingredients are measured and added by their dry weight and then water is added to make up to the prescribed pulp density. The fill is transported underground by gravity through a borehole within the backfill plant. Underground there is a distribution system comprising of steel pipes and valves to direct the backfill to the required stope for filling. The backfill plant is fully automated and control by a SCADA system located in a central control room.
THIS WEB PROOF INFORMATION PACK IS IN DRAFT FORM. The information contained herein is incomplete and subject to change and it must be read in conjunction with the section headed ‘‘Warning’’on the cover of this Web Proof Information Pack.

KAZZINC LTD Competent Person’s Report for the assets held by Kazzinc Ltd in both Kazakhstan and Russia
61‐0795/MM February 2011
Draft V 0.10 Page 161
4.6.6 Ore and Waste Extraction The majority of the ore production at Maleevskoye is produced between Levels 11 and 14 (1,200ktpa) and Levels 4 to 7 (550ktpa). The remaining 500ktpa is produced between Levels 14 and 16. The main haulage level is located on Level 14. All ore produced above level 14 is dropped down a series of ore passes to Level 14 where it is collected and loaded into rail wagons. The ore produced on Level 14 and below is transported up a dedicated haulage ramp, using a Kiruna electric haul truck, to a central ore pass located just above Level 14 on the 14+25m sub‐level. From here it drops down to Level 14 and loaded into wagons. The ore and waste is transported by rail along Level 14 to an automated sampling point where the ore type is determined. The wagons are analysed and then proceed to a wagon tipping point which discharges into a series of storage bins depending on whether it is polymetallic ore or copper‐zinc ore. The ore is then drawn from the various storage bins, crushed and hoisted to surface via Skipovaya Shaft, which is equipped with an automated twin skip hoisting system. Waste rock is sent to Maleevskaya Shaft where it is hoisted to surface in a single skip hoist without being crushed. All men and material enter the mine through Vozduzhovdyushtaya (Exhaust) Shaft, which is equipped with a man riding cage. Maleevskaya Shaft also serves as a second means of egress. 4.6.7 Dewatering System The main pumping station at the mine is located in close proximity to Maleevskaya Shaft. Mine water is collected in a series of sumps close to the bottom of the shaft from where it is pumped 660m to surface using 5 pumps (one on stand‐by) each with a capacity of 300m3/hr. 4.6.8 Ventilation The mine utilises forced ventilation. Fresh air enters the mine via Ventilatsioniya Shaft and Maleevskaya Shaft using VOD 30 (180m3/m) and VOD 40 (300m3/m) main ventilation fans, respectively. The total air intake is 480m3/m and is heated when required. The main exhaust is Vozduzhovdyushtaya (Exhaust) Shaft, which is equipped with a VCD 47.5 ventilation fan extracting 500m3/hr. Two new ventilation shafts are currently being constructed by raise boring and are due for completion in early 2012. This will increase the fresh air intake capacity by 150m3/m. The airflow in the existing Exhaust Shaft can be increased to match. 4.6.9 Conclusions The Maleevskoye Mine is a modern underground mine with high production capacity, which utilises modern mining methods and equipment. The mine employs many automated systems and has been developed to a very high standard. The mine is also operated to a very high standard and the workforce appears to be qualified and skilled providing stable production rates. Despite the fact that the mine is located 25km from the processing facility, the modern high productivity mining methods allow a good overall mining cost (approximately US$18/t of ore mined). The reserves appear sufficient to maintain operations at the present level until 2015, but after that production rate drops as a result of fewer faces being available.
THIS WEB PROOF INFORMATION PACK IS IN DRAFT FORM. The information contained herein is incomplete and subject to change and it must be read in conjunction with the section headed ‘‘Warning’’on the cover of this Web Proof Information Pack.

KAZZINC LTD Competent Person’s Report for the assets held by Kazzinc Ltd in both Kazakhstan and Russia
61‐0795/MM February 2011
Draft V 0.10 Page 162
4.7 Ore Reserves 4.7.1 Introduction WAI has carried out a mine design, and produced Ore Reserves for the Maleevskoye deposit in accordance with the guidelines of the JORC Code (2004), based upon the most recent Mineral Resource Block Model (WAI 2010). WAI has used GijimaAST Mine2‐4D® software to prepare the mine design, and EPS® software to produce Ore Reserves. The objective of the mine design is the best utilisation of the economic resources with a safe and productive mining method; making maximum use of the existing infrastructure. 4.7.2 Mine 2‐4D and EPS Software The mine design for the Maleevskoye deposit was carried out using Mine2‐4D software, which is an automated mining software package developed in Australia and currently marketed by GijimaAST. It allows the user to accurately design mine excavations such as development and stoping, and then allows the operator to apply time‐dependent mining activities such as backfilling and cable bolting in a fully three‐dimensional graphical environment. Following the design of excavations and associated activities (i.e. bolting or backfilling), mining activities can be sequenced, with time delays built into the sequence where appropriate. Once the design is complete and the associated activities applied, the mine design is exported into the Enhanced Production Scheduler (EPS) which is a direct representation of the 3D mine design in a Gantt chart format. The sequence and delays built into the model in Mine2‐4D are also exported to EPS. EPS allows the user to input specific production rates for individual activities and manipulate, in detail, the various mining activities by applying mining resources such as drilling crews, mining equipment and personnel to tasks. A mining schedule and production report including mined tonnages, grade, and development metres over the life of the mine or for specific time periods can then be produced. 4.7.3 Mining Parameters The stope blocks for Maleevskoye have been designed to a minimal average block grade of 4% Zn, or 4% Zinc Equivalent (ZnEQV). 4.7.4 Mine Layout The Maleevskoye mine has been laid out following the proposed mining methods laid out in Section 4.6. 4.7.5 Mine Development The principal mining levels at Maleevskoye currently incorporate ramps, main mining levels, crosscuts and repair/storage areas, at 50m vertical intervals, with 12‐13m sub‐levels, extending to the ‐175m level. WAI has carried out a mine design by utilising existing development to access proposed new stoping areas on the +400m to ‐175m levels, and designed extensions to the existing development to provide access to new mining horizons to the ‐275m levels. 4.7.6 Stoping All proposed new stopes for the Maleevskoye deposit have been designed as sub‐level chamber stopes with backfill as outlined in the Mining chapter of this document, above.
WAI Comment: WAI considers that the stoping methods outlined are well suited to the deposit and in addition will not require significant investment in new equipment or training of personnel.
THIS WEB PROOF INFORMATION PACK IS IN DRAFT FORM. The information contained herein is incomplete and subject to change and it must be read in conjunction with the section headed ‘‘Warning’’on the cover of this Web Proof Information Pack.

KAZZINC LTD Competent Person’s Report for the assets held by Kazzinc Ltd in both Kazakhstan and Russia
61‐0795/MM February 2011
Draft V 0.10 Page 163
Figure 4.17 shows the proposed stope layout for Maleevskoye.
Figure 4.17: Proposed Stopes with Development
4.7.7 Losses and Dilution During the mine design process, losses (4‐8%) and dilution (10‐12%) were applied to the mined tonnages at Maleevskoye. 4.7.8 Mining Schedule The production schedule for Maleevskoye is shown in Table 4.10 below.
WAI Comment: It should be noted that the production schedule includes 171,010t of Inferred material (at 5.14% Zn, 1.31% Cu, 0.93% Pb, 0.30g/t Au and 41.8g/t Ag), which have not been reported as Ore Reserves. This material has been included in the production schedule, as it is not realistic to leave this material in‐situ.
4.7.9 Ore Reserves Ore Reserves for the Maleevskoye deposit have been calculated in accordance with the guidelines of the JORC Code (2004). A summary of the Ore Reserves is presented in Table 4.11.
THIS WEB PROOF INFORMATION PACK IS IN DRAFT FORM. The information contained herein is incomplete and subject to change and it must be read in conjunction with the section headed ‘‘Warning’’on the cover of this Web Proof Information Pack.

KAZZINC LTD Competent Person’s Report for the assets held by Kazzinc Ltd in both Kazakhstan and Russia
61‐0795/MM February 2011
Draft V 0.10 Page 164
Table 4.10: Maleevskoye Production Schedule (WAI)
Year Units 2011 2012 2013 2014 2015 2016 2017 2018 2019 2020 2021 2022 2023 Total Total Mined Tonnage kt 2,313 2,137 2,196 1,710 822 899 420 393 386 328 352 200 118 12,274 Zinc Grade % Zn 5.22 6.14 6.57 7.41 6.69 7.10 6.90 6.41 6.44 7.15 5.27 4.74 5.08 6.34 Copper Grade % Cu 1.75 1.66 1.60 1.59 1.62 1.76 1.97 2.05 2.42 2.55 2.82 1.94 2.82 1.78 Lead Grade % Pb 0.89 1.00 1.00 1.16 0.94 1.04 1.22 1.10 1.18 1.53 0.88 0.85 0.85 1.02 Gold Grade g/t Au 0.42 0.48 0.42 0.64 0.50 0.56 0.67 0.55 0.71 0.77 0.82 0.48 0.63 0.52 Silver Grade g/t Ag 68.07 58.03 49.82 58.55 55.97 56.58 77.36 78.25 79.81 69.70 68.14 59.65 59.42 60.92
Table 4.11: Maleevskoye Ore Reserves
(WAI 01.01.2011) (In Accordance with the guidelines of the JORC Code (2004))
Grade Contained Metal Ore Reserves Tonnage (Mt)
Zn (%) Cu (%) Pb (%) Au (g/t) Ag (g/t) Zn (t)
Cu (t)
Pb (t)
Au (oz)
Ag (oz)
Proven 5.04 6.46 1.92 1.00 0.56 68.13 325,627 96,770 50,358 90,779 11,044,289 Probable 7.06 6.29 1.69 1.04 0.51 56.23 444,011 119,630 73,522 115,777 12,764,963 Total 12.10 6.36 1.79 1.02 0.53 61.19 769,638 216,400 123,880 260,233 23,810,222
THIS WEB PROOF INFORMATION PACK IS IN DRAFT FORM. The information contained herein is incomplete and subject to change and it must be read in conjunction with the section headed ‘‘Warning’’on the cover of this Web Proof Information Pack.

KAZZINC LTD Competent Person’s Report for the assets held by Kazzinc Ltd in both Kazakhstan and Russia
61‐0795/MM February 2011
Draft V 0.10 Page 165
4.8 Process 4.8.1 Introduction The concentrator at Zyryanovski was constructed in 1953 and has undergone several stages of refurbishment. The plant utilises the standard processes of crushing, heavy media concentration (HMS) and froth flotation to produce copper, lead, zinc concentrates as well as a gold rich gravity concentrate. The plant went through a substantial upgrade in 2000 when all sections of the plant were refurbished and the grinding and flotation sections were renewed. The plant was originally designed to treat 1.5Mtpa but by 2001 the throughput had increased to 2.25Mtpa. The maximum plant throughput is reported to be 3.5Mtpa. The plant treats ore from three sources:
• Maleevskoye mine copper‐zinc and polymetallic ores; • Grekorsky mine – polymetallic ore; and • “Foreign” ores.
All ore types contain copper, lead, zinc, silver and gold. The gold is present predominantly in the native form and can therefore be recovered using gravity processing methods. At Maleevskoye there are two ore types: a copper‐zinc ore and a polymetallic copper‐lead‐zinc ore. The ore types are classified based on the lead content – those containing <0.6% Pb are deemed to be copper zinc ores and those with > 0.6% are classified as polymetallic ores. The copper‐zinc ores also have high copper and zinc contents than the polymetallic ores. The plant also processes a small amount of ore (70ktpa) from the Grekhovskoe mine, which is located some 12km from the plant. This ore source is only expected to last for another three years. 4.8.2 Ore Mineralogy The ore minerals are chalcopyrite, tennantite, tetrahedrite, galena, sphalerite and pyrite. 4.8.3 Flowsheet Description 4.8.3.1 Crushing and HMS feed Preparation The crushing plant is designed to operate 21 hours per day. Ore is trucked to site, after primary crushing at the mine site to ‐100mm, and dumped directly into the main plant feed hopper (170m3). Ore is further crushed in a Telman (2,120 x 1,500mm) jaw crusher, which crushes any oversize material that the mine has produced. The crushed produce passes to three stages of feed preparation screening with an intermediate cone crushing stage to produce a –70+5 mm feed product to the HMS. This product is conveyed to one of three bunkers with 8,000, 5,400 and 5,400m3 capacities. The crushed material is transferred via conveyors fitted with belt weightometers to two 5mm Feed Preparation screens in series. The screen undersize gravitates to spiral classifiers and the classifier sands are conveyed to flotation. The classifier overflows are pumped to hydrocyclones and the underflows are returned to the spiral classifiers. The cyclone overflows are thickened and pass to flotation. 4.8.4 Heavy Media Separation Heavy media separation (HMS) takes place on the –70+5mm material in two 6m diameter cones each with a capacity of 170t/h. A combination of ferrosilicon and magnetite is used at separating densities of between 2.8‐
THIS WEB PROOF INFORMATION PACK IS IN DRAFT FORM. The information contained herein is incomplete and subject to change and it must be read in conjunction with the section headed ‘‘Warning’’on the cover of this Web Proof Information Pack.
KAZZINC LTD Competent Person’s Report for the assets held by Kazzinc Ltd in both Kazakhstan and Russia
61‐0795/MM February 2011
Draft V 0.10 Page 166
3.0g/cc. Weight rejection to the “floats” product ranges between 13‐30%. The “floats” and “sinks” are crushed to pass 10mm and the floats used as backfill. The “sinks” and fines products passes to flotation. 4.8.5 Grinding Milling of the HMS and fines product is achieved using a total of nine 3.2 x 3.9m diameter ball mills, with five being used as primary mills and four as secondary mills. The primary mill discharge gravitates to a jig for coarse gold recovery and the jig tailings spiral classifier and the sands products are returned to the mill. The spiral classifier overflows are cycloned and the underflows are also returned to the mill. The cyclone overflow is pumped to secondary cyclones and the underflows pass to jigs and intercycle bulk Cu‐Pb flotation. Copper and lead minerals are floated using potassium amyl xanthate at pH 7.6. Zinc sulphate and sodium cyanide are used as pyrite and sphalerite depressants. The concentrate is pumped to the second stage Cu‐Pb cleaning cells. The intercycle flotation tailings pass to the secondary mills. The secondary cyclone overflow, at 85‐90% pass 74μm passes to Cu‐Pb bulk rougher flotation. The jig concentrates are pumped to a magnetic drum separator to remove grinding steel and then are cleaned using shaking tables to produce a gold rich lead concentrate. The final gravity concentrate, which assays typically 100g/t Au, is free draining as is loaded into Big Bags for transport. 4.8.6 Flotation Separate copper lead and zinc concentrates are produced by floating a bulk copper lead concentrate and then depressing the lead using sodium dichromate. Zinc is recovered from the copper‐lead flotation tailings. There are two parallel flotation circuit using Russian RHYF flotation machines with automatic levels control and low pressure air supply. Rougher copper lead flotation takes place in seven 25m3 cells with scavenger flotation taking place in a further six cells. Zinc sulphate and cyanide are used as a zinc and pyrite depressant. The scavenger concentrates are pumped back to rougher flotation. The rougher concentrate is cleaned in three stages with a ball mill regrind stage on the cleaner tailings product. The regrind ball mill is currently being replaced with Metso SMD mills which will result in a finer particle size and improved metallurgical performance. The bulk concentrate is then conditioned with sodium dichromate to depress galena and the copper minerals are re‐floated in a separation circuit. The copper and lead products are pumped to thickeners. The copper lead scavenger tailings are conditioned with copper sulphate to activate sphalerite and the pH is increased to 11‐12 using lime. Rougher flotation takes place in four 25m3 cells and scavenger flotation takes place in a further 11 cells. The rougher concentrate is cleaned in three stages using seven, five and three cells of 8.5m3 capacity. 4.8.7 Process Control The plant is controlled with a SCADA system using Delta V software. Feed rate to the plant is controlled automatically and motor temperature and oil pressures are monitored. The system also monitors cyclone pressures, bunker levels, flotation cell pulp levels, air flows, pH and reagent controls. The efficiency of the plant is monitored with a Courier 11 stream on stream analyser. 4.8.8 Concentrate Dewatering The concentrates are pumped to 15m conventional thickeners. The copper concentrate is filtered using a Svedala VPA Filter Press. The gold rich lead concentrates are filtered using an Outotec Ceramic filter and the
THIS WEB PROOF INFORMATION PACK IS IN DRAFT FORM. The information contained herein is incomplete and subject to change and it must be read in conjunction with the section headed ‘‘Warning’’on the cover of this Web Proof Information Pack.

KAZZINC LTD Competent Person’s Report for the assets held by Kazzinc Ltd in both Kazakhstan and Russia
61‐0795/MM February 2011
Draft V 0.10 Page 167
zinc concentrates are filtered using a Ceramic filter (Kazakh), or a vacuum drum filter or a Svedala 1540 Filter Press. 4.8.9 Concentrates Transport and Sales The zinc concentrates are transported by rail to either the zinc smelters at Ridder or Ust Kamenogorsk. The lead and gravity gold concentrates are sent to smelters in Ust Kamenogosk. The copper concentrates are shipped to customers in China. The company is in the process of constructing an IsaSmelt furnace in Ust Kamensogorsk and this is scheduled for completion in 2011. This facility will be able to process the copper concentrates. 4.8.10 Concentrate Management and Labour There are a total of 415 persons employed within the concentrator. The plant is managed by the “Head of Department” to whom the Chief Engineer reports. A breakdown of the other personnel employed is given in Table 4.12.
Table 4.12: Process Plant Manning Levels Chief Technologist 1 Health and Safety 4 Information centre 4 Testwork research 32 Crushing and Beneficiation 121 Grinding and flotation 90 Thickening and filtration 90 TMF 16 Reagents 48 Financial 1 Plant managers assistant 1 Project Manager 1 Copper sulphate production 13
The manning levels would be considered high by western standards but are typical for an operation in the CIS. 4.8.11 Metallurgical Performance The metallurgical balance for the treatment of all ore types in 2009 is given in Table 4.13.
Table 4.13: Maleevskoye Plant Metallurgical Balance (2009)
Assay %, ppm Distribution Product
Tonnes (t) Zn Pb Cu Au Ag Zn Pb Cu Au Ag
Feed 2,405,000 6.28 0.91 1.98 0.53 59.28 100.00 100.00 100.00 100.00 100.00
Zn Concentrate 242,405 55.40 0.46 0.92 0.31 31.24 88.91 5.14 4.68 5.88 5.31
Pb Concentrate 27,603 8.50 46.00 2.30 1.28 757.04 1.55 58.25 1.33 2.76 14.66
Cu Concentrate 166,354 2.92 3.63 24.64 2.63 572.14 3.21 27.73 86.13 33.99 66.76
Gravity Concentrate 4,770 3.52 7.94 1.05 100.00 192.63 0.11 1.74 0.10 37.12 0.64
Tailings 1,642,086 0.51 0.07 0.19 0.09 8.61 5.58 5.32 6.66 11.98 9.92
HMS Tailings 307390 0.17 0.06 0.16 0.06 8.33 0.34 0.89 1.06 1.33 1.80
THIS WEB PROOF INFORMATION PACK IS IN DRAFT FORM. The information contained herein is incomplete and subject to change and it must be read in conjunction with the section headed ‘‘Warning’’on the cover of this Web Proof Information Pack.

KAZZINC LTD Competent Person’s Report for the assets held by Kazzinc Ltd in both Kazakhstan and Russia
61‐0795/MM February 2011
Draft V 0.10 Page 168
The balance shows a high degree of metallurgical efficiency with low losses of metals to the HMS tailings and satisfactory grades of base metal concentrates at good recovery levels. The recovery of gold to the gravity concentrates was 37.1% with a further 34% reporting to the copper concentrate. Copper recovery to the copper concentrate was 86.1% and the concentrate assayed 24.6% Cu, 3.63% Pb, 2.92% Zn, 2.63ppm Au and 572ppm Ag. The lead concentrate was rather low at 46% Pb, 2.3% Cu and 8.5% Zn at a lead recovery of 58.2%. The zinc concentrate assayed 55.4% Zn, 0.92% Cu and 0.46% Pb at a zinc recovery of 88.9%. The average grade of ore treated was 1.98% Cu, 0.91% Pb, 6.28% Zn, 0.53ppm Au and 59.3ppm Ag. 4.8.12 Process Consumables The major processing consumables are given in Table 4.14 below.
Table 4.14: Maleevskoye Plant Consumables Item Consumption kg/t
Ferrosilicon 0.12 Balls 1.09 ZnSO4 0.76 CuSO4 0.36 Xanthate 0.22 NaCN 0.077 Na2S 0.032 Lime 4.1
Dichromate 0.10 Frother 0.017
Thionocarbamate 0.043 FeSO4 0.30
Electricity 40.4kWh/t Industrial Water 2.86m3/t
The rates of consumable usage are typical for the treatment of a moderately hard polymetallic base metal ore. 4.8.13 Process Capital Budget 2011 The total capital expenditure budget for 2011 is US$24.8M. The major items are
• Modernisation of the main flotation plant (US$10.9M); • New cells for the Cu‐Pb separation circuit (US$4.2M); • A new treatment facility to process lead dust from the Isasmelt process (US$3.0M); and • One new SMD mill (US$1.69M).
4.8.14 Conclusions The Maleekskoye Plant operates with a high degree of efficiency on a range of plant feeds from different ore bodies and ore types. The concentrates so produced are typical of those obtained from polymetallic ores. The HMS section is rather old, perhaps overly complex, and in need of modernisation yet it produces a satisfactory upgrade of plant feed with minimal metal losses to the floats products. The flotation plant operates with a high level of process control and the operators are clearly highly experienced in the treatment of such ores.
THIS WEB PROOF INFORMATION PACK IS IN DRAFT FORM. The information contained herein is incomplete and subject to change and it must be read in conjunction with the section headed ‘‘Warning’’on the cover of this Web Proof Information Pack.
KAZZINC LTD Competent Person’s Report for the assets held by Kazzinc Ltd in both Kazakhstan and Russia
61‐0795/MM February 2011
Draft V 0.10 Page 169
The intstallation of Metso SMD mills for copper‐lead regrind should result in improved metallurgical performance. 4.9 Environmental, Social, Health & Safety 4.9.1 Introduction This review of the environmental and social performance of the Zyryanovsk Mining & Concentrator Complex (ZGOK), including the Maleevskoye mine, is based on a brief site visit and reconnaissance, together with discussions with staff of the geology department and Department of Health Safety & Environment. In the short time available it is only possible to have an overview of the project and the way that the company manages its health, safety, environmental and social obligations. Whilst WAI believes it has gained sufficient insight into the key issues and performance, there may be additional information that was not seen, or variations in interpretation of the available data that could not be explored further. 4.9.2 Environmental & Social Setting and Context 4.9.2.1 Landscape, Topography The main ZGOK processing plant is located within the industrial zone at the north‐east side of the town of Zyryanovsk. This zone is characterised by the largely disused remains of former mining related industry and works, and has an air of dereliction and abandonment. Immediately adjacent to the plant are a large water‐filled open pit and a range of mine waste dumps, which are owned by the Government. The Maleevskoye mine and the TMF are located in rural areas to the north of Zyryanovsk. The Zyryan region is mountainous, located in the foothills of the southern Altai Mountains, with a landscape dominated by steep hills and open valleys, many are wide and fertile. 4.9.2.2 Climate The climate is sharply continental with hot summers and cold dry winters. 4.9.2.3 Land Use and Land Cover Zyrynaovsk Concentrator Plant The surrounding land is mainly post‐industrial urban fringe, with a high proportion of derelict or unused land. There is quite a lot of natural colonisation with scrub and trees, as well as municipal and company planting of trees. Old open pits are now open water, usually with steep hazardous slopes into the water. Previous attempts at ‘reclamation’ by state authorities have been largely ineffective. Within the urban fringe landscape there are many residences and informal smallholdings, mainly of lower standard. Zyryanovsk Tailings Storage Facility This is located in a fertile river valley, dominated by cultivation and cattle grazing. There are a number of rural communities such as the village of Maleevsk.
THIS WEB PROOF INFORMATION PACK IS IN DRAFT FORM. The information contained herein is incomplete and subject to change and it must be read in conjunction with the section headed ‘‘Warning’’on the cover of this Web Proof Information Pack.

KAZZINC LTD Competent Person’s Report for the assets held by Kazzinc Ltd in both Kazakhstan and Russia
61‐0795/MM February 2011
Draft V 0.10 Page 170
Maleevskoye Mine The mine is located in a mountainous area, with a high proportion of the land forested. Land use consists of localised cultivation in sheltered valleys and pastoral grazing. 4.9.2.4 Water Resources The area is in the catchment of the Bukhtarma/Hamir River, which flows west into the Irtysh River, one of the main river catchments of eastern Kazakhstan and rising in the southern Altai Mountains. Water resources are mainly surface waters – fast flowing streams and rivers, with shallow groundwater resources in the river valley alluvial deposits The Zyryanovsk tailings facility is within 2km of the river, in the river plain, and overlying the valley alluvial aquifer. 4.9.2.5 Communities and Livelihoods The town of Zyryanovsk is a significant industrial town, though clearly prosperity has declined in recent years. The community has grown up and developed around the mining and concentrator plant, and a significant proportion of the community will depend on Kazzinc for employment as employees, contractors or providing services. Outside of the town smaller communities have developed, mainly relying on agriculture, though tourism is also significant (as a base for the mountains). There are a number of village communities in the Bukhtarma River valley, close to the tailings facility. Zyryanovsk is the administrative centre for Zyryan District, within which the mine and concentrator complex sits. Zyryan is within the East Kazakhstan Oblast, the provincial capital being Ust‐Kamenogorsk. 4.9.2.6 Infrastructure & Communications Zyryranovsk has the usual road, rail and communication infrastructure associated with an industrial town and complex. Power is available from the Kazakhstan grid. 4.9.3 Project Status, Activities, Effects, Releases & Controls 4.9.3.1 Project Description & Activities Project Components The Zyryanovsk Mining and Concentrator Complex (ZGOK) consist of 4 main components: 1. The Maleevskoye Mine, 25km to the north of Zyryanovsk. This is the main ore production facility; 2. The Grekhovskoe Mine, 12km to the south of Zyryanovsk. This is exhausted and will shortly be
closed, though some areas will continue to be used for waste disposal. This site is not considered further in this report;
3. The Zyryanovskok Concentrator facility itself; and 4. The Tailings Management Facility (TMF), midway between Zyryanovsk and Maleevskoye. Ore is hauled by truck from the mine to the concentrator, partly on a dedicated haul road and partly on the public highway. On the return journey, trucks are loaded with tailings excavated from the TMF and hauled to the mine for backfill underground.
THIS WEB PROOF INFORMATION PACK IS IN DRAFT FORM. The information contained herein is incomplete and subject to change and it must be read in conjunction with the section headed ‘‘Warning’’on the cover of this Web Proof Information Pack.
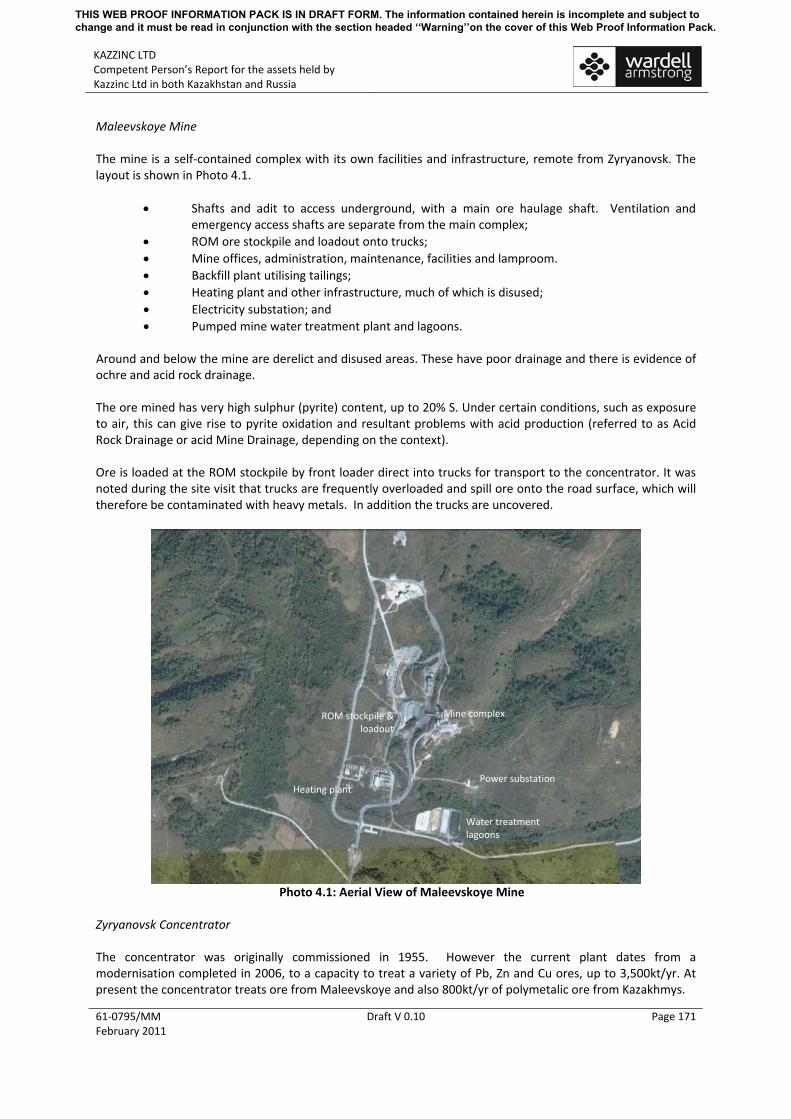
KAZZINC LTD Competent Person’s Report for the assets held by Kazzinc Ltd in both Kazakhstan and Russia
61‐0795/MM February 2011
Draft V 0.10 Page 171
Maleevskoye Mine The mine is a self‐contained complex with its own facilities and infrastructure, remote from Zyryanovsk. The layout is shown in Photo 4.1.
• Shafts and adit to access underground, with a main ore haulage shaft. Ventilation and emergency access shafts are separate from the main complex;
• ROM ore stockpile and loadout onto trucks; • Mine offices, administration, maintenance, facilities and lamproom. • Backfill plant utilising tailings; • Heating plant and other infrastructure, much of which is disused; • Electricity substation; and • Pumped mine water treatment plant and lagoons.
Around and below the mine are derelict and disused areas. These have poor drainage and there is evidence of ochre and acid rock drainage. The ore mined has very high sulphur (pyrite) content, up to 20% S. Under certain conditions, such as exposure to air, this can give rise to pyrite oxidation and resultant problems with acid production (referred to as Acid Rock Drainage or acid Mine Drainage, depending on the context). Ore is loaded at the ROM stockpile by front loader direct into trucks for transport to the concentrator. It was noted during the site visit that trucks are frequently overloaded and spill ore onto the road surface, which will therefore be contaminated with heavy metals. In addition the trucks are uncovered.
Photo 4.1: Aerial View of Maleevskoye Mine
Zyryanovsk Concentrator The concentrator was originally commissioned in 1955. However the current plant dates from a modernisation completed in 2006, to a capacity to treat a variety of Pb, Zn and Cu ores, up to 3,500kt/yr. At present the concentrator treats ore from Maleevskoye and also 800kt/yr of polymetalic ore from Kazakhmys.
Water treatment lagoons
Power substationHeating plant
Mine complexROM stockpile & loadout
THIS WEB PROOF INFORMATION PACK IS IN DRAFT FORM. The information contained herein is incomplete and subject to change and it must be read in conjunction with the section headed ‘‘Warning’’on the cover of this Web Proof Information Pack.

KAZZINC LTD Competent Person’s Report for the assets held by Kazzinc Ltd in both Kazakhstan and Russia
61‐0795/MM February 2011
Draft V 0.10 Page 172
The process flowsheet involves the following stages: crushing and HMS (waste rock) ‐ grinding – gravity – flotation (flotation tailings) – thickening – filtration of concentrates. CN and dichromate are hazardous materials used in the plant. There is a detox unit in the plant for converting the toxic chromium(IV) to the less toxic (and insoluble) chromium(III) form. In 2008 water recirculation was introduced, to reduce the need to abstract industrial water from local supplies, and eliminate the discharge of waste process water.
Photo 4.2: Concentrator complex in Zyryanovsk
Note the old open pit mine and waste dumps are owned by the Government. Zyryanovsk TMF Flotation tailings produced by the concentrator are piped 4.3km to the TMF, via two steel 820mm diameter slurry lines, one operational and one backup. The pipelines were initially installed in 1986. They are visually inspected daily (walking) and x‐rayed annually. A pumping station at the base of the TMF raises the tailings onto the lagoon. Slurry discharge rates are typically 2,000m3/hr, but vary between 1,800m3/hr and 2,500m3/hr; the slurry pulp density is 900kg/m3. There are also 2 return water lines, 600mm and 530mm diam, to the plant. Return water rates are usually 1,100m3/hr to 1400m3/hr, though at the time of the visit were 600m3/hr. The area of the TMF is 368.5ha in total and the dam structure is 4.35km in length. The predicted flow to the spillway (residence time) is 15 – 25 days. The dam and tailings basin are unlined and the western half (downslope) is on former alluvial deposits, connected to the river. Infiltration/seepage through the base is estimated by the company at around 800m3/hr. The TMF was last raised in 2005 to give a total capacity of 85Mm3; the current volume is 84Mm3, equivalent to 120Mt @1.8t/m3 density. Thus the dam is close to capacity. A new raise is planned which will bring the capacity to 95Mm3 up to 2016.
Concentrator
complex
THIS WEB PROOF INFORMATION PACK IS IN DRAFT FORM. The information contained herein is incomplete and subject to change and it must be read in conjunction with the section headed ‘‘Warning’’on the cover of this Web Proof Information Pack.

KAZZINC LTD Competent Person’s Report for the assets held by Kazzinc Ltd in both Kazakhstan and Russia
61‐0795/MM February 2011
Draft V 0.10 Page 173
Photo 4.3: Zyryanovskoye TMF, Showing Local Communities and Connection to Bukhtarma River
The technical study “Operation of concentrator tailing storage” for 2008 – 2010 has been approved by the State Committee of Emergency Control and Industrial Safety (Report 47 dated 11.01.2008). An Emergency response plan for the TMF was developed and approved by the Company Operations Manager, and approved by the State Emergency Control Agency, dated 15.12.2009. 4.9.3.2 Mine Wastes – Rock The existing external waste dumps at Maleevskoye and Grekhovsky mines pre‐date 1993 and are owned by the State; Kazzinc has no liability for them. All mine waste produced at Maleevskoye is used for backfilling underground and for raising the TMF dam, so there are no current waste rock dumps associated with the mine. 4.9.3.3 Mine Wastes – Tailings Tailings waste from the concentrator has a small particle size – 97% <0.15mm. Recent chemical analysis of the tailings solids is as follows:
Table 4.15: Chemical Analysis Element % of solids
Total S 32.82 Fe 5.2 Pb 0.083 Zn 0.2 Cu 0.033 Co 0.005 Ni 0.006 Cd 0.002 Mn 0.08
TMF lagoon
Water treatment area
Beryozovka river
THIS WEB PROOF INFORMATION PACK IS IN DRAFT FORM. The information contained herein is incomplete and subject to change and it must be read in conjunction with the section headed ‘‘Warning’’on the cover of this Web Proof Information Pack.

KAZZINC LTD Competent Person’s Report for the assets held by Kazzinc Ltd in both Kazakhstan and Russia
61‐0795/MM February 2011
Draft V 0.10 Page 174
The tailings have a very high pyrite S content and significant metal content, so are considered hazardous waste. The tailings will be acid generating and there is visible evidence of this on the tailings beaches, however no acid‐base accounting or leaching testwork has been undertaken. The tailings liquid phase (and return water) has a very high pH (9 to 12), together with a high Ca, bicarbonate and sulphate content (as expected), and generally a low heavy metal content. This strong alkalinity will neutralise any acid produced by pyrite oxidation, as long as there is process water on the TMF. However, dispersed tailings, dry beaches and zones where there is no high pH water (such as after the TMF is closed) will be net acid generating and no provision has been made for this. 4.9.3.4 Other Solid Mineral Wastes Sludge residue, containing precipitated heavy metals, is produced by the mine water treatment plant (see below). Recent analysis of this is as follows:
Element % of solids Pb 0.8 Zn 3.5 Cu 1.91
This sludge is transported to an old open‐pit at Grekhovskoe; the long term safety and stability of this facility is not known. The Company is proposing to use the TMF for the disposal of imported ‘Scorodite’ waste from Vasilkovskoye Mine and the smelters at Ust‐Kamenorgorsk. This material is a synthetic Scorodite, being the residue from treatment of arsenic‐containing wastes, by addition of lime and iron sulphate, to precipitate insoluble calcium iron arsenate. The design of this facility is still in preparation. WAI understands that it is proposed to construct a geomembrane lined cell within the tailings and to deposit the Scorodite within this containment. The nature of this containment would seem to be adequate, however the long term risk of depositing arsenic waste in this location, close to groundwater and an important river, will need to be carefully examined. 4.9.3.5 Water Management & Effluents The recent policy of the company is to conserve water, and water recycling has been introduced at Zyryanovskoye. Water stored on the TMF is returned to the Concentrator as technical water. Potable water required for the plant (drinking and reagent mixing) is supplied from the town supply, and technical water for makeup etc comes from boreholes. The expected water balance provisions for the TMF are given in Table 4.16 below.
THIS WEB PROOF INFORMATION PACK IS IN DRAFT FORM. The information contained herein is incomplete and subject to change and it must be read in conjunction with the section headed ‘‘Warning’’on the cover of this Web Proof Information Pack.

KAZZINC LTD Competent Person’s Report for the assets held by Kazzinc Ltd in both Kazakhstan and Russia
61‐0795/MM February 2011
Draft V 0.10 Page 175
Table 4.16: Water Balance for the TMF Balance items (planned on 2010) Total 2010 Tailings Storage Basin А. Water supply thousand cubic metres Drainage basin dregs 3248,0 Concentrator production waste water 16095,24 Total of А 19343,24 B. Waterloss, thousand cubic metres Evaporation 2805,43 ‐ pool surface 1133,59 ‐ land surface (beach) 1671,84 Filtration through dams 635,04 Filtration through bead 113,88 Bead steeping 85,20 Filtration through base 486,96 Total of B 4126,51 C. Total volume of water (A‐B), thousand cubic metres 15216,73 D. LOOSE WATER km3 0,0 E. Tailings storage water(C‐Г km3 15216,73 ‐ porewater 690,0 ‐ store water (to the pool) ‐373,26 ‐ spill water (discharge) 14900,0 INWASH SPECIFICATION Tailings inflow (kТ) 2700,0 The same as previous, but packed, thousand cubic metres 1500,0 Solid particles in pool bulk, % 65,0 Tailings storage space filling, % ‐ Displaced water volume, 000m3 970,83 Raising the water level because of displacement, m 0,61 Water level rise by reason of accumulation, m ‐0,24 General water level rise in the pool, m 0,37 Inwash height, m 0,63 Summarized tailings volume at the end of the year, thnd. cub. m 84576,0 Beach length, m 200,0 Inwash line length, m 4000,0 Pool water volume at the end of the year, thnd. cub. m 1955,74 Pool area at the end of the year km3 1622,49 Pool water average depth, m 1,18 Water mark in pool year at the end of the year, м 469,67 Minimal crest level of warp tailings at the end of the year, m 472,0 Feather excess above the water line at the end of the year, m 2,33 Water Treatment Oxidation Pond A. Water in flow km3 Drainage basin dregs 522,0 Tailings storage discharge 14900,0 Filtration from the tailings storage 253,80 Total of А 15675,80 B. Waterloss, thousand cubic metres Vaporation 546,0 ‐ pool surface 420,0 ‐ land surface (beach) 126,0 Filtration underflow 9920,64 Total of B 10466,64 C. LOOSE WATER km3 5225,0
Prior to the installation of water recycling in 2008, the decant overflow from the TMF was discharged to the river via a biological oxidation treatment lagoon; see Photo 4.3 and Photo 4.4. At times of high rainfall and
THIS WEB PROOF INFORMATION PACK IS IN DRAFT FORM. The information contained herein is incomplete and subject to change and it must be read in conjunction with the section headed ‘‘Warning’’on the cover of this Web Proof Information Pack.

KAZZINC LTD Competent Person’s Report for the assets held by Kazzinc Ltd in both Kazakhstan and Russia
61‐0795/MM February 2011
Draft V 0.10 Page 176
snowment, excess water is still discharged via the lagoon system – the current license permits a total of 800,000m3/year. Monitoring data indicates that this discharge is within acceptable limits. Seepage from beneath the TMF is significant and will contain contaminated process water leached through the tailings. Groundwater flows from east to west, towards the river, and there is the potential for significant polluted water to reach the river. There is a network of 27 boreholes along the western perimeter and northwest corner of the TMF, used for monitoring and for pumping intercepted groundwater, to prevent migration of contaminated groundwater. This interception is apparently effective and pumped water is returned to the TMF; however it is a long term liability and pumping may be required for many years post‐closure of the TMF.
Photo 4.4: Biological (Oxidation) Water Clarification Lagoon at the TMF
Since the water recirculation scheme was introduced, this facility is only used when high rainfall or snowmelt require water to be discharged from the dam. The Maleevskoye Mine is too far away from the Concentrator for use of the mine water in the Concentrator to be feasible. Minewater is pumped from the mine and is treated in a treatment plant before discharge to the Buktarma river. Treatment involves two stages: i. Lime dosing with hydrated lime to raise the pH and precipitate metals; and ii. Settlement in lagoons to remove the sediment. The 3 lagoons are used in rotation and excavated
periodically to remove the sludge for disposal. The resulting effluent is monitored and falls within discharge limits, with the exception of ammonia (NH3‐), which originates from underground blasting residues. The company has planned to reduce ammonia discharge levels by 2012, by utilising the treated mine water in the backfill plant (thus reducing the total quantity discharged). In addition to the mine water, there are other fugitive uncontrolled discharges from the Mine site:
• Drainage from the road during heavy rainfall will transport contaminated sediment (ore spilt from overloaded trucks) onto surrounging land and into streams; and
THIS WEB PROOF INFORMATION PACK IS IN DRAFT FORM. The information contained herein is incomplete and subject to change and it must be read in conjunction with the section headed ‘‘Warning’’on the cover of this Web Proof Information Pack.

KAZZINC LTD Competent Person’s Report for the assets held by Kazzinc Ltd in both Kazakhstan and Russia
61‐0795/MM February 2011
Draft V 0.10 Page 177
• Storm rainfall runoff from the mine site area contains acid and metals leached from ore residues deposited or spilled on the ground over a period of years. This discharges via local streams to the river.
The Company has identified the need to reconstruct the stormwater drainage system for the mine area and has an action plan to improve this. 4.9.3.6 Emissions to Air The significant emissions to air are summarised in Table 4.17:
Table 4.17: Emissions to Air Mine ventilation Maleevskoye ventilation
shafts Inert and mineralised rock dust; combustion gasses from underground diesel plant.
Deposition and storage of coarse ore at RoM stockpile
ROM stockpiles at Maleevskoye
Mineralised rock dust. Conveyors are covered.
Fugitive dust from loading and haulage of ore
ROM stockpile and haul roads.
Mineralised rock dust. Controlled by watering of haul roads. Spillage of ore from overloaded trucks onto haul roads will increase this source considerably.
Process emissions Concentrator plant stacks and ventilation
Dust and acid vapours. Controlled by filters and enclosure.
Fugitive dust from tailings surface Zyryanovskoye TMF Hazardous dust, containing metals, which could contaminate surrounding land. Controlled by maintaining water cover and wet tailings beaches; effectiveness is dependent on water availability.
One of the most significant sources is fugitive ore dust from the ROM stockpile, due to conveyor deposition and truck loading activities. Dust will contain heavy metals and will disperse onto the surrounging land during dry windy periods. Fugitive ore dust is also emitted from the haul road between the mine and concentrator. The passage of trucks at speed emits significant dust from the haul road surface and by windblow from the load itself. 4.9.3.7 Waste Management – General General waste and recyclable materials are collected and stored separately as appropriate, for disposal by specialist contractors. Non‐recyclable waste goes to the local municipal landfill. As part of the environmental license the company maintains records and makes returns on the quantities of waste produced, under different waste categories. 4.9.3.8 Hazardous Materials Storage & Handling Oils and fuel (hydrocarbons) – are stored in proper bunded facilities in accordance with license requirements and international standards. The Company maintains full monthly records and provides annual returns to the State for all consumption and outflows of hazardous materials and wastes. Particular hazardous materials in use at the Concentrator are cyanide and Dichromate. Facilities for storage and handling are in accordance with requirements. There is a detox plant in the Concentrator for treating the streams containing toxic Cr(VI) and converting it to the non‐toxic Cr(III) form.
THIS WEB PROOF INFORMATION PACK IS IN DRAFT FORM. The information contained herein is incomplete and subject to change and it must be read in conjunction with the section headed ‘‘Warning’’on the cover of this Web Proof Information Pack.

KAZZINC LTD Competent Person’s Report for the assets held by Kazzinc Ltd in both Kazakhstan and Russia
61‐0795/MM February 2011
Draft V 0.10 Page 178
4.9.3.9 General Housekeeping In general housekeeping at the mine is excellent and all areas are maintained well. No evidence was seen of uncontrolled tipping or abandonment of disused equipment, scrap, containers or wastes. 4.9.3.10 Fire Safety Good quality systems and arrangements are in place. 4.9.3.11 Security The site is well secured within a perimeter fence and public safety is maintained. The plant area is accessed via manned security gates and scanners. 4.9.4 Permitting 4.9.4.1 ESIA/OVOS The Zyryanovskoye complex and Maleevskoye Mine have been operational for many years and have therefore developed progressively. Most of the activities pre‐date the requirement for an OVOS so have not been through this process. WAI understands that an OVOS is in progress as part of the proposed project to stockpile scorodite waste the TMF dam. This will be undertaken in accordance with Kazakh norms and regulatory requirements. 4.9.4.2 Environmental Permits and Licenses The Kazzinc audit of its facilities confirms that all necessary permits and licenses are in place for the mining and processing operations. The latest TMF dam raise, in 2005, was linked to the increase in mine and plant production. Required permits from the Fishing authorities and water basin authorities (both part of the Ministry of Agriculture) are in place. The project was subject to State Expertise in 2006 and received full permits, including the requirements of the Emergency Department. The Sanitary Zone for the Concentrator plant and TMF has been set at 100m from the perimeter of each facility. 4.9.5 Environmental Management 4.9.5.1 Environmental Policy and Company Approach Kazzinc has a strong central corporate environmental management function, based in Ust‐Kamenogorsk. There is a Chief Environmental Manager, reporting to the First Vice President, and two environmental specialists at headquarters, supporting the site‐based staff. The company therefore has a consistent approach to environmental and social management systems, procedures and standards. The company is certified across all its sites for:
ISO9001 – Quality Assurance
Certified in 2004 and audited in 2010
ISO14001 – Environmental Management System and OHSAS18001 ‐ Occupational Health and Safety Management System
Certified in 2006, recertification audit in 2009 and supervisory audits of company facilities alternately each year, starting 2010.
THIS WEB PROOF INFORMATION PACK IS IN DRAFT FORM. The information contained herein is incomplete and subject to change and it must be read in conjunction with the section headed ‘‘Warning’’on the cover of this Web Proof Information Pack.

KAZZINC LTD Competent Person’s Report for the assets held by Kazzinc Ltd in both Kazakhstan and Russia
61‐0795/MM February 2011
Draft V 0.10 Page 179
Glencore is a majority shareholder in Kazzinc and thus also exercises an overarching commitment to Health, Safety, Environment and Community, through the Glencore Corporate Practice commitment applied to all subsidiary companies and operations. WAI understands that all Kazzinc assets were audited by a Glencore team in early 2010. The findings of this are not available to WAI, though it is understood that the main recommendation was in connection with implementing the International Cyanide Code. Kazzinc also commissioned specialist environmental institute ECOTERA LLC of Almaty to undertake a full audit of all the company’s assets. The report: Assessment of Compliance of Activities of Kazzinc LLC with the Nature Protection Laws of the Republic of Kazakhstan and with the Requirements of Controlling Agencies, Auditors Report to Management, was presented in September 2010.
WAI Comment: It is clear that, at a corporate level, Kazzinc is progressive and responsible in its approach to environmental, social, health & safety management across all their operations. They have progressively implemented measures to improve air quality and water management, and maintain consistent standards in accordance with Kazakh norms, policies and requirements.
4.9.5.2 Environmental Management Staff & Resources There are 2 environmental staff covering all of the facilities at the operation – a Head Environmental Specialist and an Environmental Engineer. These two both report to the Kazzinc central Environmental Service Department and locally to the Operations Support Manager (and thus to the Chief Engineer). The Head Environmental Specialist attends weekly management conferences with all function heads, and any environmental issues are dealt with here. There is also regular dialogue with the District Environmental Inspector (Ministry of Environment and Nature Protection ‐ MENP). 4.9.5.3 Systems and Work Procedures The company has an Environmental Activity Standard and all operations have their individual work procedures and requirements documented. There are regular quarterly and annual reports to MENP detailing all emissions, discharges and wastes, hazardous raw materials and activities, against annual permit levels and norms. The company prepares a 5 year plan in consultation with MENP, setting out the significant environmental impacts, targets, aims and specific actions and budget to implement the plan. The current action plan has 5 specific actions identified: 1. Reduction of dust emission from Tailings surface, target reduction of 1.5t/yr by 2015; 2. Reduction of discharge of NH3 in mine water by 0.8t/yr by 2012; 3. Safe disposal of Scorodite (As containing waste) in TMF by 2011; 4. Reconstruction of surface stormwater drainage for Maleevskoye Mine by 2011; and 5. Improvements within the Sanitary Protection Zone of the Concentrator, 49.7ha, by 2012. 4.9.5.4 Environmental Monitoring, Compliance & Reporting There is an extensive groundwater and surface water monitoring regime around the project areas, and particularly the TMF, which is contracted out to a specialist supplier. Monitoring is undertaken 4 times per year and a detailed annual report is prepared. This monitoring is supplemented by the company with 10‐day monitoring of critical parameters (pH, conductivity, metals, etc) at key locations such as discharges. No details of air quality or soil monitoring were reviewed.
THIS WEB PROOF INFORMATION PACK IS IN DRAFT FORM. The information contained herein is incomplete and subject to change and it must be read in conjunction with the section headed ‘‘Warning’’on the cover of this Web Proof Information Pack.

KAZZINC LTD Competent Person’s Report for the assets held by Kazzinc Ltd in both Kazakhstan and Russia
61‐0795/MM February 2011
Draft V 0.10 Page 180
In addition to physio‐chemical monitoring, regular monthly inspections are carried out by environmental staff. Whilst there are no pro‐forma reports or checklists, any problems or issues are noted and reported. Quarterly and annual reports are prepared for company management, and the Environmental Manager participates in the weekly management meetings. The independent Kazzinc audit confirms that the compliance record with standards and norms is good, with only a few problem areas as identified in this report
WAI Comment: The monitoring of water quality, which is the main risk area, is thorough and sufficiently comprehensive, and compliance with the required standards is good. However, as is usual it is based on measuring physio‐chemical parameters of effluents and pathways, and does not give a good picture of the impacts or health of the receiving environment. For example, periodic sampling of soils, vegetation and stream/river sediments, gardens, drinking water, and biological monitoring of benthic invertebrates, would give an indication of the long term impacts of the mining operation on the surrounding environment and communities. Monitoring air quality, particularly dust deposition, should also be considered.
4.9.6 Social and Community Management 4.9.6.1 Stakeholder Dialogue and Grievance Mechanisms Zyryanovsk is a mining community and has a very close relationship with the company; it is reported that there is regular dialogue with the local administration and the Mayor of Zyryanovsk. However, whilst the OVOS law prescribes structured public hearings, none have apparently been carried out yet under these regulations. Nevertheless the Company does hold public meetings and involves representatives of the community in the planning stages. Company news and initiatives are regularly reported and discussed in local and Oblast newspapers and the local radio broadcast channel. The Company employs a journalist specifically to report on company activities. There is ample opportunity for the public to voice opinions, concerns or support for the company activities through these media. The local administration authority holds open public meetings twice per year, at which any member of the public can raise issues or request information from any industrial enterprise in the District. GOK Directors are usually present at these meetings and present reports on the company activities. Specific complaints or grievances are received by the GOK Director’s office and recorded in a register. This register also gives a response to the comment and any actions taken. The results of this are published in the local newspapers. It was reported to WAI that there are no NGOs active in the region. 4.9.6.2 Social Initiatives and Community Development The Company has an active social sponsorship and community development programme, which is set out in a Memorandum between Kazzinc and the Mayor of Zyryanovsk, the current one being dated May 2008. This sets out a commitment to 8 specific initiatives for community support, mainly covering donations and provision of facilities for orphans, disabled and elderly within the District. These initiatives are mainly of a charitable nature and are clearly an important contribution to the District. No information was provided to WAI on other types of community support such as economic diversification, local enterprise and training that the Company could consider as part of a wider and longer term support.
THIS WEB PROOF INFORMATION PACK IS IN DRAFT FORM. The information contained herein is incomplete and subject to change and it must be read in conjunction with the section headed ‘‘Warning’’on the cover of this Web Proof Information Pack.

KAZZINC LTD Competent Person’s Report for the assets held by Kazzinc Ltd in both Kazakhstan and Russia
61‐0795/MM February 2011
Draft V 0.10 Page 181
4.9.7 Health & Safety 4.9.7.1 Health & Safety Management Arrangements The mine and the concentrator plant both have labour safety departments, responsible to the mine and concentrator managers respectively, but overseen by the Kazzinc team (responsibility for Labour is 1st VP of Kazzinc). Staffing is organised as follows:
• Safety Manager for ZGOK • 3 Safety Inspectors & 2 Clerks reporting to the Safety Manager • 2 Safety Specialists at the Mine • 1 Safety Specialist at the Concentrator • 2 Safety Specialists at auxiliary departments
There are overall standardised policies and procedures for Kazzinc together with local procedures in each facility appropriate to the activities carried out there. These follow the statutory prescribed procedures in the Law on Industrial Safety, which sets out the functions, responsibilities and procedures to be followed. These are implemented with the prescribed 3 layers of safety control and responsibility: Foreman; Senior Specialist at each facility and Senior Specialist of Company. The medical service at the mine and plant is outsourced to a specialist company, who provide a medical centre and trained staff. All staff receive 5 days of safety and other induction training at the dedicated Kazzinc training centre at commencement of employment. 4.9.7.2 Occupational Issues at ZGOK The Company is aware of potential problems at the mine due to the high level of silica in the rock. Mine ventilation is being improved with the proposed installation of a larger fan, to reduce the risk further and ensure that air quality is within required norms. 4.9.7.3 Performance and Accident Records The company performs regular occupational health and exposure surveys, with annual monitoring and reports prepared by an independent specialist company. Air quality (dust and gasses from blasting) is monitored daily by the mine rescue department, in accordance with sanitary norms. Occupational health and safety data was seen by WAI and no particular issues were noted. There has been one case of silicosis in 5 years, and the incidence of bronchitis is slightly above normal expectations. 4.9.8 Mine Closure & Rehabilitation 4.9.8.1 Mine Closure Plans According to the Subsoil Use Code, all stockpiles and tailings formed before 1992 revert to State supervision. Thus all old waste dumps around Zyryanovskoye are not connected with the Company and are not a liability for the present operation. The TMF was originally constructed in 1968 so the deeper layers technically fall under State control and are not the responsibility of the Company. However, in practice it is not possible to separate the pre and post‐1992 parts of the TMF and all is treated as one entity. Under the Subsoil Use Code license requirements the mining operation has prepared a closure plan, dealing with the physical closure only; there is no provision for social closure, other than the statutory redundancy payments. The costs of the closure plan have been estimated at US$2.5million.
THIS WEB PROOF INFORMATION PACK IS IN DRAFT FORM. The information contained herein is incomplete and subject to change and it must be read in conjunction with the section headed ‘‘Warning’’on the cover of this Web Proof Information Pack.

KAZZINC LTD Competent Person’s Report for the assets held by Kazzinc Ltd in both Kazakhstan and Russia
61‐0795/MM February 2011
Draft V 0.10 Page 182
The Concentrator and TMF are licensed as an Industrial complex and thus have no requirement for a formal closure plan. The TMF is considered as a man‐made mineral formation, with a metal content that may, one day, be of economic or beneficial value, and is therefore considered as an asset. It is thus treated as a potential resource that will either be re‐worked by the company or returned to the State. Kazzinc have stated that, in the long term, they will continue to be responsible for the TMF and will prepare a design for decomissioning and Recultivation, but that this is too far in the future for consideration now. Thus, no provision has been made for its long term and post closure condition, or funding.
WAI Comment: Whilst the Maleevskoye Mine has made provision for closure, there is no provision for the concentrator or TMF, and only short‐term plans are made. There is no consideration of long term and post‐closure physical, geochemical or land use stability, and long term risks do not appear to be well considered. Thus the TMF in particular must be considered a potential long term liability, particularly as the tailings material itself is potentially hazardous and deposition of imported arsenic‐containing scorodite waste increases the potential risk.
4.9.8.2 Financial Provision for Closure Under the Subsoil Use Code license the closure fund for the Maleevskoye Mine (US$2.5M) has been created and is held in a special Company account, as part of the Mine Closure Program that has been developed. There is no financial provision for closure of the Concentrator complex and TMF, and in the absence of a closure plan there is no basis for estimating the magnitude of the closure and post‐closure liability. 4.9.9 Conclusions 4.9.9.1 Environmental and Social Liabilities & Risks For the most part, Maleevskoye Mine has a very high standard of environmental, social, health and safety management. It is compliant with Kazakh licenses, permits and norms. Both the environmental and labour safety functions of the company are of high quality and well organised, and supported by a strong corporate policy, commitment and team. There are no known social, community or cultural issues or impacts that need to be addressed, and no displacement or compensation requirements. The mine appears to have a good relationship with the local communities, and does not put undue pressure on the social infrastructure of the District or Oblast. The town of Zyryanovsk is essentially a mining town, and grew up around the developing mining operations kover 200 years. It is heavily dependent on the continuation of mining for its economy. Whilst there are a number of historic mining liabilities around Zyryanovsk, these are not part of the company’s current liability and responsibility for them lies with the State. WAI has identified the following areas of potential liability and risk, which do not meet international expectations and standards: 1. The characterisation and risk assessment for long term disposal (storage) of acid‐producing tailings.
Monitoring and protection of groundwater and related surface water resources is important regionally;
2. Dust control from the exposed tailings surface, particularly a backup irrigation system during periods of water shortage;
THIS WEB PROOF INFORMATION PACK IS IN DRAFT FORM. The information contained herein is incomplete and subject to change and it must be read in conjunction with the section headed ‘‘Warning’’on the cover of this Web Proof Information Pack.

KAZZINC LTD Competent Person’s Report for the assets held by Kazzinc Ltd in both Kazakhstan and Russia
61‐0795/MM February 2011
Draft V 0.10 Page 183
3. Dust control from the ROM ore stockpile, from the haul roads between the mine and concentrator, to prevent contamination of surrounding land and sediment in runoff into watercourses. Overloading of haul trucks, and the absence of load sheeting, should be addressed by the company urgently; and
4. Long term closure liabilities for the concentrator and the TMF Facilities within the company’s responsibility need to be addressed, with a full closure plan, rehabilitation and costs, and a long term environmental liability risk assessment.
4.9.9.2 Compliance with Local and International Standards and Expectations The project is generally compliant with international standards and expectations, with the exception of the potential liabilities and risks identified above. It is likely that the management of hazardous tailings and the mine closure provisions fall short of international practice, although WAI believes that the company’s attention is focussed on further improvement in connection with these issues and there are no reasons why they cannot be readily resolved in the near future. 4.9.9.3 Recommendations for ESAP The following Table 4.18 summarises the action plan identified for investment by the Company (numbers 1 to 5), together with some additional WAI recommendations for an environmental and social action plan for the mining and concentrator complex.
Table 4.18: Recommendations for Environmental & Social Action Plan Action Priority & Timescale
1. Reduction in the emission of dust from the TMF, by a combination of maintaining water cover and irrigation sprays.
2015
2. Reduction in the release of ammonia in treated mine water effluent 2012
3. Disposal of imported Scorodite in safe containment cell on TMF (benefits to other Company operations)
2011
4. Reconstruction of stormwater drainage and treatment for Maleevskoye Mine 2011
5. Improvements to the housekeeping and landscape within the sanitary protection zone of the Zyryanovskoye Plant (49.7ha)
2012
6. Improvements to ore loading on trucks at Maleevskoye Mine – avoidance of overloading and sheeting of loads, to prevent ore spillage on haul road and dust emission
2011
7. Characterisation and testing of tailings solids for ARD and metal leaching; risk assessment for long term storage of tailings, including Scorodite.
2012
8. Prepare integrated closure plans for Mine, Concentrator and TMF, for physical, biological and social closure, including cost estimates and financial provision.
2013
9. Characterisation and testing of mine water treatment sludges at Grekhovskoe quarry; risk assessment and groundwater monitoring.
2012
The environmental and social performance of the Zyryanovsk Mining & Concentrator Complex (ZGOK), including the Maleevskoye mine, is based on a brief site visit and reconnaissance, together with discussions with staff of the geology department and Department of Health Safety & Environment. In the short time available it is only possible to have an overview of the project and the way that the company manages its health, safety, environmental and social obligations. Whilst WAI believes it has gained sufficient insight into the key issues and performance, there may be additional information that was not seen, or variations in interpretation of the available data that could not be explored further.
THIS WEB PROOF INFORMATION PACK IS IN DRAFT FORM. The information contained herein is incomplete and subject to change and it must be read in conjunction with the section headed ‘‘Warning’’on the cover of this Web Proof Information Pack.
THIS WEB PROOF INFORMATION PACK IS IN DRAFT FORM. The information contained herein is incomplete and subject to change and it must be read in conjunction with the section headed ‘‘Warning’’on the cover of this Web Proof Information Pack.
KAZZINC LTD Competent Person’s Report for the assets held by Kazzinc Ltd in both Kazakhstan and Russia
61‐0795/MM February 2011
Draft V 0.9 Page i
CONTENTS
5 RIDDER‐SOKOLNIY DEPOSIT ................................................................................................................ 1
5.1 Introduction ..........................................................................................................................................1
5.1.1 Location & Access......................................................................................................................... 1
5.1.2 Topography and Climate ..............................................................................................................2
5.1.3 Infrastructure ...............................................................................................................................3
5.1.4 Project History..............................................................................................................................8
5.2 Geology and Mineralisation ..................................................................................................................8
5.2.1 Regional Geology..........................................................................................................................8
5.2.2 Local Geology .............................................................................................................................10
5.2.3 Description of the Ore Zones .....................................................................................................17
5.2.4 Mineralogy of the Veins .............................................................................................................19
5.2.5 Mineralisation ............................................................................................................................20
5.3 Exploration Works...............................................................................................................................20
5.3.1 Sample Collection.......................................................................................................................20
5.3.2 Sample Preparation.................................................................................................................... 21
5.3.3 Sample Analysis ..........................................................................................................................21
5.3.4 Bulk Densities .............................................................................................................................21
5.4 QA/QC Analysis for Ridder‐Sokolniy and Satellite Areas.....................................................................24
5.4.1 Internal Checks ...........................................................................................................................24
5.4.2 External Checks ..........................................................................................................................24
5.5 Current Mineral Resource Estimates ..................................................................................................24
5.5.1 Centralny ....................................................................................................................................25
5.5.2 Bystrushinskoe ...........................................................................................................................25
5.5.3 North Bystrushinskoe ................................................................................................................. 25
5.5.4 Belkina ........................................................................................................................................26
5.5.5 Perspectivnaya ...........................................................................................................................27
5.5.6 Sokolok .......................................................................................................................................27
5.5.7 New Glubokaya ..........................................................................................................................28
5.5.8 Glubokaya...................................................................................................................................28
5.5.9 Dalnaya.......................................................................................................................................29
5.5.10 Zavodskaya .................................................................................................................................29
5.6 Mining .................................................................................................................................................32
5.6.1 Introduction................................................................................................................................32
5.6.2 Historical Mining ........................................................................................................................32
5.6.3 GKZ Resources and Reserves......................................................................................................32
5.6.4 Mine Design and Current Mining Activities................................................................................33
5.6.5 Mining Schedule .........................................................................................................................36
5.6.6 Mining Methods .........................................................................................................................38
5.6.7 Block Grade Evaluation...............................................................................................................41
5.6.8 Rock Properties and Geotechnical Conditions ...........................................................................41
THIS WEB PROOF INFORMATION PACK IS IN DRAFT FORM. The information contained herein is incomplete and subject to change and it must be read in conjunction with the section headed ‘‘Warning’’on the cover of this Web Proof Information Pack.

KAZZINC LTD Competent Person’s Report for the assets held by Kazzinc Ltd in both Kazakhstan and Russia
61‐0795/MM February 2011
Draft V 0.9 Page ii
5.6.9 Drilling and Blasting....................................................................................................................41
5.6.10 Losses and Dilution.....................................................................................................................42
5.6.11 Ore and Waste Transportation...................................................................................................42
5.6.12 Hoisting Facilities........................................................................................................................43
5.7 Dewatering System .............................................................................................................................44
5.7.1 Ventilation ..................................................................................................................................45
5.7.2 Mine Personnel ..........................................................................................................................46
5.7.3 Future Mine Development .........................................................................................................47
5.7.4 Conclusions.................................................................................................................................47
5.8 Process ................................................................................................................................................47
5.8.1 Introduction................................................................................................................................47
5.8.2 Services.......................................................................................................................................49
5.8.3 Ore Crushing Facilities ................................................................................................................50
5.8.4 Concentration Facilities..............................................................................................................52
5.8.5 Ore Types and Treatment...........................................................................................................58
5.8.6 Production ..................................................................................................................................62
5.8.7 Zinc Smelter................................................................................................................................66
5.8.8 Manpower ..................................................................................................................................66
5.8.9 Tailings Dams..............................................................................................................................67
5.8.10 Laboratory ..................................................................................................................................68
5.8.11 Engineering Workshop ...............................................................................................................69
5.9 WAI Ore Reserve Estimate ..................................................................................................................69
5.9.1 Introduction................................................................................................................................69
5.9.2 Mine 2‐4D Software ...................................................................................................................69
5.9.3 Mining Parameters ..................................................................................................................... 69
5.9.4 Mine Layouts ..............................................................................................................................69
5.9.5 Ore Reserves...............................................................................................................................75
5.10 Environmental Issues ..........................................................................................................................77
5.10.1 Introduction................................................................................................................................77
5.10.2 Environmental & Social Setting and Context..............................................................................77
5.10.3 Project Status, Activities, Effects, Releases & Controls ..............................................................78
5.10.4 Permitting...................................................................................................................................84
5.10.5 Environmental Management......................................................................................................85
5.10.6 Social and Community Management .........................................................................................88
5.10.7 ealth & Safety .............................................................................................................................90
5.10.8 Mine Closure & Rehabilitation ...................................................................................................91
5.10.9 Conclusions.................................................................................................................................91
6 TISHINSKIY DEPOSIT.......................................................................................................................... 94
6.1 Introduction ........................................................................................................................................94
6.1.2 Project History............................................................................................................................94
6.2 Geology and Mineralisation ................................................................................................................95
6.2.1 Regional Geology........................................................................................................................ 95
THIS WEB PROOF INFORMATION PACK IS IN DRAFT FORM. The information contained herein is incomplete and subject to change and it must be read in conjunction with the section headed ‘‘Warning’’on the cover of this Web Proof Information Pack.

KAZZINC LTD Competent Person’s Report for the assets held by Kazzinc Ltd in both Kazakhstan and Russia
61‐0795/MM February 2011
Draft V 0.9 Page iii
6.2.2 Local Geology .............................................................................................................................95
6.2.3 Mineralisation ..........................................................................................................................100
6.3 Exploration Works.............................................................................................................................101
6.3.1 Sample Collection..................................................................................................................... 101
6.3.2 Sample Preparation..................................................................................................................103
6.3.3 Sample Analysis ........................................................................................................................104
6.4 Proposed Exploration Drilling for Deep Horizons and Flanks............................................................104
6.5 Current Mineral Resources Estimate ................................................................................................110
6.5.1 Topography and Underground Survey .....................................................................................110
6.5.2 Database Compilation ..............................................................................................................110
6.5.3 Domaining ................................................................................................................................111
6.5.4 Sample Data Processing ...........................................................................................................113
6.5.5 Variography ..............................................................................................................................114
6.5.6 Block Modelling........................................................................................................................115
6.5.7 Density......................................................................................................................................115
6.5.8 Grade Estimation......................................................................................................................115
6.5.9 Validation .................................................................................................................................116
6.5.10 Resource Classification.............................................................................................................117
6.5.11 Depletion..................................................................................................................................117
6.5.12 Resource Evaluation .................................................................................................................118
6.6 Mining ...............................................................................................................................................120
6.6.1 Introduction..............................................................................................................................120
6.6.2 Mine Design and Current Mining Activities..............................................................................121
6.6.3 Mining Schedule ....................................................................................................................... 123
6.6.4 Mining Method......................................................................................................................... 126
6.6.5 Rock Properties and Geotechnical Conditions .........................................................................127
6.6.6 Ore and Waste Transportation.................................................................................................127
6.6.7 Dewatering System...................................................................................................................129
6.6.8 Ventilation ................................................................................................................................129
6.6.9 Mine Personnel ........................................................................................................................130
6.6.10 Future Mine Development .......................................................................................................131
6.6.11 WAI Ore Reserve Estimation ....................................................................................................131
6.6.12 Conclusions...............................................................................................................................133
6.7 Environmental...................................................................................................................................133
6.7.1 Introduction..............................................................................................................................133
6.7.2 Environmental & Social Setting and Context............................................................................133
6.7.3 Project Status, Activities, Effects, Releases & Controls ............................................................134
6.7.4 Permitting.................................................................................................................................142
6.7.5 Environmental Management....................................................................................................142
6.7.6 Environmental Management Staff & Resources ......................................................................142
6.7.7 Social and Community Management .......................................................................................144
6.7.8 Health & Safety......................................................................................................................... 144
THIS WEB PROOF INFORMATION PACK IS IN DRAFT FORM. The information contained herein is incomplete and subject to change and it must be read in conjunction with the section headed ‘‘Warning’’on the cover of this Web Proof Information Pack.

KAZZINC LTD Competent Person’s Report for the assets held by Kazzinc Ltd in both Kazakhstan and Russia
61‐0795/MM February 2011
Draft V 0.9 Page iv
6.7.9 Mine Closure & Rehabilitation .................................................................................................145
6.7.10 Conclusions...............................................................................................................................146
7 SHUBINSKIY DEPOSIT .......................................................................................................................147
7.1 Introduction ......................................................................................................................................147
7.1.1 Location and Access .................................................................................................................147
7.1.2 Topography and Climate ..........................................................................................................149
7.1.3 Infrastructure ...........................................................................................................................149
7.1.4 Mineral Rights and Permitting..................................................................................................149
7.2 Geology and Mineralisation ..............................................................................................................150
7.2.1 Regional Geology......................................................................................................................150
7.2.2 Deposit Geology .......................................................................................................................150
7.2.3 Ore Body Morphology ..............................................................................................................151
7.2.4 Mineralogy ...............................................................................................................................157
7.3 Exploration ........................................................................................................................................158
7.3.1 Historical Work.........................................................................................................................158
7.3.2 Drilling ......................................................................................................................................159
7.3.3 Sampling ...................................................................................................................................161
7.4 Historical Reserve Estimates .............................................................................................................163
7.4.1 Introduction..............................................................................................................................163
7.4.2 Cut‐off‐Grade ...........................................................................................................................163
7.4.3 Degree of Complexity and Drilling Density...............................................................................163
7.4.4 Bulk Density..............................................................................................................................163
7.4.5 GKZ Resource Estimate.............................................................................................................164
7.5 Mining ...............................................................................................................................................165
7.5.1 Introduction..............................................................................................................................165
7.5.2 Mine Design..............................................................................................................................165
7.5.3 Mine Optimisation....................................................................................................................166
7.5.4 Approved Reserve ....................................................................................................................166
7.5.5 Recovery and Losses.................................................................................................................167
7.5.6 Production Schedule ................................................................................................................167
7.5.7 Geotechnical.............................................................................................................................168
7.5.8 Mining Method......................................................................................................................... 169
7.5.9 Dewatering ...............................................................................................................................171
7.5.10 Future Development ................................................................................................................172
7.6 Infrastructure ....................................................................................................................................172
7.6.1 Introduction..............................................................................................................................172
7.6.2 Offices.......................................................................................................................................172
7.6.3 Maintenance Workshop...........................................................................................................172
7.6.4 Warehouse and Stores .............................................................................................................172
7.6.5 Ore Loading Facility ..................................................................................................................172
7.6.6 Ventilation ................................................................................................................................172
7.6.7 Backfill Plant .............................................................................................................................173
THIS WEB PROOF INFORMATION PACK IS IN DRAFT FORM. The information contained herein is incomplete and subject to change and it must be read in conjunction with the section headed ‘‘Warning’’on the cover of this Web Proof Information Pack.

KAZZINC LTD Competent Person’s Report for the assets held by Kazzinc Ltd in both Kazakhstan and Russia
61‐0795/MM February 2011
Draft V 0.9 Page v
7.6.8 Power Supply............................................................................................................................174
7.6.9 Water Supply ............................................................................................................................174
7.6.10 Air Supply .................................................................................................................................174
7.6.11 Heat Supply ..............................................................................................................................174
7.7 Environmental...................................................................................................................................175
7.7.1 Environmental & Social Setting and Context............................................................................175
7.7.2 Project Status, Activities, Effects, Releases & Controls ............................................................177
7.7.3 Permitting.................................................................................................................................179
7.7.4 Environmental Management....................................................................................................179
7.7.5 Social and Community Management .......................................................................................181
7.7.6 Health & Safety......................................................................................................................... 181
7.7.7 Mine Closure & Rehabilitation .................................................................................................181
7.7.8 Conclusions...............................................................................................................................182
8 DOLINNOE AND OBRUCHEVSKOE DEPOSITS .....................................................................................184
8.1 Introduction ......................................................................................................................................184
8.1.1 Location & Access.....................................................................................................................184
8.1.2 Topography and Climate ..........................................................................................................184
8.1.3 Infrastructure ...........................................................................................................................185
8.1.4 Mineral Rights and Permitting..................................................................................................185
8.2 Geology and Mineralisation ..............................................................................................................186
8.2.1 Regional Geology......................................................................................................................186
8.2.2 Deposit Geology .......................................................................................................................187
8.2.3 Morphology and Mode of Occurrence of Lodes ......................................................................189
8.2.4 Obruchevskoe...........................................................................................................................194
8.2.5 Mineralogy ...............................................................................................................................196
8.3 Exploration ........................................................................................................................................199
8.3.1 Historical Work.........................................................................................................................199
8.3.2 Drilling ......................................................................................................................................199
8.3.3 Sampling ...................................................................................................................................201
8.3.4 Bulk Density..............................................................................................................................204
8.3.5 Future Exploration.................................................................................................................... 204
8.4 Historical Reserve Estimates .............................................................................................................205
8.4.1 Dolinnoe ...................................................................................................................................205
8.4.2 Obruchevskoe...........................................................................................................................207
8.4.3 Mining Reserves ....................................................................................................................... 210
8.5 Current Mineral Resource Estimate (2011).......................................................................................211
8.5.1 Dolinnoe & Obruchevskoe........................................................................................................211
8.5.2 Obruchevskoe...........................................................................................................................218
8.6 Mining ...............................................................................................................................................224
8.6.1 Production Rate........................................................................................................................224
8.6.2 Life of Mine...............................................................................................................................224
8.6.3 Mine Design..............................................................................................................................224
THIS WEB PROOF INFORMATION PACK IS IN DRAFT FORM. The information contained herein is incomplete and subject to change and it must be read in conjunction with the section headed ‘‘Warning’’on the cover of this Web Proof Information Pack.

KAZZINC LTD Competent Person’s Report for the assets held by Kazzinc Ltd in both Kazakhstan and Russia
61‐0795/MM February 2011
Draft V 0.9 Page vi
8.6.4 Mine Scheduling .......................................................................................................................227
8.6.5 Mining Method......................................................................................................................... 229
8.6.6 Services.....................................................................................................................................229
8.6.7 Manpower ................................................................................................................................230
8.7 Financial ............................................................................................................................................230
8.7.1 Introduction..............................................................................................................................230
8.7.2 Capital Expenditure ..................................................................................................................231
8.7.3 Operating Costs ........................................................................................................................231
8.7.4 Economic Assessment ..............................................................................................................231
8.8 WAI Ore Reserve Estimation.............................................................................................................232
8.8.1 Introduction..............................................................................................................................232
8.8.2 Mine 2‐4D Software .................................................................................................................232
8.8.3 Mining Parameters ...................................................................................................................232
8.8.4 Mine Layout..............................................................................................................................232
8.8.5 Dolinnoe ...................................................................................................................................233
8.8.6 Obruchevskoe...........................................................................................................................233
8.8.7 Ore Reserves.............................................................................................................................234
8.9 Processing .........................................................................................................................................236
8.9.1 Dolinnoe Deposit ......................................................................................................................236
8.9.2 Obruchevskoe Deposit .............................................................................................................237
8.10 Environmental...................................................................................................................................237
8.10.1 Introduction..............................................................................................................................237
8.10.2 Environmental & Social Setting and Context............................................................................237
8.10.3 Project Status, Activities, Effects, Releases & Controls ............................................................239
8.10.4 Permitting.................................................................................................................................240
8.10.5 Environmental Management....................................................................................................240
8.10.6 Social and Community Management .......................................................................................240
8.10.7 Health & Safety......................................................................................................................... 240
8.10.8 Mine Closure & Rehabilitation .................................................................................................241
8.10.9 Conclusions...............................................................................................................................241
9 CURRENT EXPLORATION PROGRAMS IN THE RIDDER AREA...............................................................242
9.1 Exploration Drilling on Ridder Sokolniy Flanks..................................................................................242
9.1.1 South‐Eastern Flank of Perspektivnaya Lode ...........................................................................242
9.1.2 Western, South‐Western, South, South‐Eastern and North‐Western Flanks of the Ridder‐
Sokolny Deposit ........................................................................................................................................242
9.1.3 Exploration 2010 ......................................................................................................................243
9.2 Exploration Drilling for Deep Horizons and Flanks at Tishinskiy .......................................................247
TABLES
Table 5.1: Mining Licence (1) Boundary Points ......................................................................................................3
Table 5.2: Mining Licence (2) Boundary Points ......................................................................................................4
THIS WEB PROOF INFORMATION PACK IS IN DRAFT FORM. The information contained herein is incomplete and subject to change and it must be read in conjunction with the section headed ‘‘Warning’’on the cover of this Web Proof Information Pack.

KAZZINC LTD Competent Person’s Report for the assets held by Kazzinc Ltd in both Kazakhstan and Russia
61‐0795/MM February 2011
Draft V 0.9 Page vii
Table 5.3: Exploration Licence Boundary Points.....................................................................................................5
Table 5.4: Stratigraphy of the Ridder Graben .........................................................................................................9
Table 5.5: Primary Minerals ..................................................................................................................................20
Table 5.6: Bulk Density versus Grade (from Geoincentr, 2001) ...........................................................................23
Table 5.7: Centralny Resource Estimate (WAI 01.11.10)......................................................................................25
Table 5.8: Bystrushinskoe Resource Estimate (WAI 01.11.10) .............................................................................25
Table 5.9: North Bystrushinskoe Resource Estimate (WAI 01.11.10)...................................................................26
Table 5.10: Belkina Resource Estimate (WAI 01.11.10)........................................................................................26
Table 5.11: Perspectivnaya Resource Estimate (WAI 01.11.10) ...........................................................................27
Table 5.12: Sokolok Resource Estimate (WAI 01.11.10).......................................................................................27
Table 5.13: New Glubokaya Resource Estimate (WAI 01.11.10) ..........................................................................28
Table 5.14: Glubokaya Resource Estimate (WAI 01.11.10) ..................................................................................28
Table 5.15: Dalnaya Resource Estimate (WAI 01.11.10) ......................................................................................29
Table 5.16: Ridder Sokolniy GKZ‐Approved Resources & Reserves as of 01.01.2010 ..........................................33
Table 5.17: Summary Mine Schedule for 2011.....................................................................................................37
Table 5.18: Major Dewatering Facilities ...............................................................................................................45
Table 5.19: Kazzinc Personnel ..............................................................................................................................46
Table 5.20: Ridder Concentrators Target Ore Production and Treatment for 2010 ............................................48
Table 5.21: Ridder Concentrators Target Production for 2010 ............................................................................48
Table 5.22: Feed to Ridder Zinc Smelter (2010) ...................................................................................................49
Table 5.23: Ridder Zinc Smelter Target Production for 2010 ...............................................................................49
Table 5.24: Concentrator Building No.2 Annual Tonnage ....................................................................................57
Table 5.25: Concentrator Building No.3 Annual Tonnage ....................................................................................57
Table 5.26: Summary of Nominal Grades.............................................................................................................58
Table 5.27: Tishinskiy Polymetallic Ore ................................................................................................................62
Table 5.28: Ridder Sokolniy Pb/Zn Ore.................................................................................................................63
Table 5.29: Ridder‐Sokolniy Cu Ore......................................................................................................................63
Table 5.30: Ridder‐Sokolniy Ore Flux....................................................................................................................64
Table 5.31: Shubinskiy Cu/Zn................................................................................................................................64
Table 5.32: Staroye Tailings ..................................................................................................................................64
Table 5.33: Current Tishinskiy Slimes ...................................................................................................................65
Table 5.34: Old Tishinskiy Slimes ..........................................................................................................................65
Table 5.36: All Crushing, Concentration and Related Activities ...........................................................................67
Table 5.37: Zinc Smelting and all Related Activities .............................................................................................67
Table 6.1: Lease Boundary Points......................................................................................................................... 94
Table 6.3: Mineral Associations..........................................................................................................................101
Table 6.4: Planned Exploration Works For 2011 Proposed by Kazzinc...............................................................109
Table 6.5: Sample Database Summary ...............................................................................................................110
Table 6.6: Conversion Factors for Equivalent Grades.........................................................................................111
Table 6.7: Minimum Grades for Conversion to Equivalent Grades ....................................................................111
Table 6.9: Summary of Block Model Parameters ...............................................................................................115
Table 6.10: Density Calculation ..........................................................................................................................115
THIS WEB PROOF INFORMATION PACK IS IN DRAFT FORM. The information contained herein is incomplete and subject to change and it must be read in conjunction with the section headed ‘‘Warning’’on the cover of this Web Proof Information Pack.

KAZZINC LTD Competent Person’s Report for the assets held by Kazzinc Ltd in both Kazakhstan and Russia
61‐0795/MM February 2011
Draft V 0.9 Page viii
Table 6.11: Summary of Kriging Plan..................................................................................................................116
Table 6.12: Global Statistical Grade Validation ..................................................................................................117
Table 6.13: Tishinskiy Resource Estimate ‐ At COG of 2.2% ZnEQV ...................................................................119
Table 6.14: Distribution of Production between Levels .....................................................................................121
Table 6.15: Summary of Mining Schedule for 2011............................................................................................125
Table 6.16: Compressive Strength Properties of Various Types of Backfill (MPa) .............................................127
Table 6.17: First Stage Pumps.............................................................................................................................129
Table 6.18: Second Stage Pumps........................................................................................................................129
Table 6.20: Mine Personnel by Department.......................................................................................................130
Table 6.21: Typical Stope Parameters ................................................................................................................131
Table 6.22: Tishinskiy Ore Reserves Estimate.....................................................................................................132
Table 6.23: Summary of Development Requirement .........................................................................................133
Table 7.1: Mining Licence Boundaries ................................................................................................................149
Table 7.2: Characteristics, Morphology and Parameters of Ore Bodies.............................................................153
Table 7.3: Primary Minerals................................................................................................................................157
Table 7.5: Exploration Summary..........................................................................................................................159
Table 7.6: Exploration Works 2004‐2010 ...........................................................................................................160
Table 7.7: GKZ Approved Reserves as at 01.01.2010 .........................................................................................164
Table 7.8: Reserves of Shubinskiy Deposit as of 01.01.2011..............................................................................167
Table 7.9: Mine Production ................................................................................................................................168
Table 7.10: Rock Stability Classification..............................................................................................................169
Table 7.11: Mining Equipment Fleet...................................................................................................................171
Table 8.1: Dolinnoe Geological Licence Boundaries .............................................................................................185
Table 8.2: Obruchevskoe ‐ Geological Lease Boundaries......................................................................................185
Table 8.4: Dolinnoe Mineralogy .........................................................................................................................197
Table 8.5: Dolinnoe‐ Forms of Gold and Silver Occurrence Based .........................................................................198
Table 8.6: Obruchevskoe Mineralogy.................................................................................................................198
Table 8.7: Dolinnoe Drilling Summary..................................................................................................................200
Table 8.8: Laboratories Used for Dolinnoe Exploration Analyses.......................................................................202
Table 8.9: Grade Classes with Relative Differences in Excess.............................................................................203
Table 8.10: Regression Formulae Used in Current Reserve Estimates...............................................................204
Table 8.11: Schedule and Budget for Detailed Exploration of the Dolinnoe and...............................................205
Table 8.12: Dolinnoe ‐ Reserves Approved by GKZ KR (1995) ............................................................................206
Table 8.15: Obruchevskoe – Reserves (ТОО «Geolen » 01.01.2002) .................................................................210
Table 8.16: Dolinnoe & Obruchevskoe‐Commodity Reserves of Ore and Metals Accepted for the Final
Feasibility Study [TEO] ........................................................................................................................................210
Table 8.17: Summary of Assay Data ...................................................................................................................211
Table 8.18: Basic Global Statistics.......................................................................................................................211
Table 8.19: Basic Statistics of Selected Samples.................................................................................................212
Table 8.20: Top Cutting Summary ......................................................................................................................213
Table 8.21: Estimation Parameters for Upper Ore Zone of Dolinnoe deposit (KMC 2011)................................215
Table 8.22: Estimation Parameters for Lower Ore Zone of Dolinnoe deposit (KMC 2011)................................215
THIS WEB PROOF INFORMATION PACK IS IN DRAFT FORM. The information contained herein is incomplete and subject to change and it must be read in conjunction with the section headed ‘‘Warning’’on the cover of this Web Proof Information Pack.

KAZZINC LTD Competent Person’s Report for the assets held by Kazzinc Ltd in both Kazakhstan and Russia
61‐0795/MM February 2011
Draft V 0.9 Page ix
Table 8.23: Dolinnoe Mineral Resource Estimate ‐ COG 1.7% EqvZn.................................................................217
Table 8.24: Summary of Assay Data ...................................................................................................................218
Table 8.25: Basic Global Statistics.......................................................................................................................218
Table 8.26: Basic Statistics of Selected Samples.................................................................................................219
Table 8.27: Top Cutting Summary ......................................................................................................................220
Table 8.28: Estimation Parameters for Obruchevskoe.......................................................................................221
Table 8.29: Obruchevskoe Mineral Resource Estimate......................................................................................223
Table 8.30: Mine Schedule for the Option 3 (ktpa) ............................................................................................228
Table 8.31: Summary of Technical & Economic Parameters ..............................................................................229
Table 8.32: Number of Mining Personnel...........................................................................................................230
Table 8.33: Salable Products from Dolinnoe‐Obruchevskoe Deposits ...............................................................231
Table 8.34: Summary of Capital Costs for Option 3............................................................................................231
Table 8.35: Summary of Operating Costs ...........................................................................................................231
Table 8.36: Summary of the Financial Performance for Option 3 ......................................................................232
Table 8.37: Dolinnoe and Obruchevskoe Ore Reserve Estimate ........................................................................235
Table 8.38: Analysis of Sample #1 of Dolinnoe Ore............................................................................................236
Table 9.1: Exploration Drilling Summary 2000‐2008 ..........................................................................................242
Table 9.2: Planned Exploration Works For 2011 Proposed by Kazzinc...............................................................247
FIGURES
Figure 5.1: Ust Region and (inset) Ridder Area.......................................................................................................2
Figure 5.2: Location Plan showing Position of Ridder Licences ..............................................................................6
Figure 5.3: Map showing the location of Main deposit and Exploration Projects..................................................7
Figure 5.4: Geology Plan showing the Location of the Main Ore Zones...............................................................11
Figure 5.5: West‐East Cross Section through the Central Block (main ore zones in red) .....................................12
Figure 5.6: North‐ South Cross Section through the Central Block (main ore zones in red) ................................13
Figure 5.7: Long Section showing the Location of the Main Ore Zones ...............................................................14
Figure 5.8: Stratigraphic Position..........................................................................................................................16
Figure 5.9: Scatter Plots of External Au and Ag Check Assays ..............................................................................24
Figure 5.10: Long Section of Ridder‐Sokolniy .......................................................................................................35
Figure 5.11: Sub‐Level Open Stoping: 3D Image...................................................................................................38
Figure 5.12: Section of a Sub‐Level Open Stoping Block ......................................................................................39
Figure 5.13: Sublevel Open Stoping with Backfill .................................................................................................40
Figure 5.14: Unmechanised Sublevel Stoping ......................................................................................................41
Figure 5.15: Plan of Horizon 16 ............................................................................................................................43
Figure 5.16: Dewatering Scheme (planned layout changes are shown in red) ....................................................44
Figure 5.17: Ventilation Scheme...........................................................................................................................45
Figure 5.18: Concentrator Building No.2 ..............................................................................................................54
Figure 5.19: Concentrator Building No.3 ..............................................................................................................54
Figure 5.20: Centralny Orebody ...........................................................................................................................70
Figure 5.21: Centralny Stope Blocks .....................................................................................................................70
THIS WEB PROOF INFORMATION PACK IS IN DRAFT FORM. The information contained herein is incomplete and subject to change and it must be read in conjunction with the section headed ‘‘Warning’’on the cover of this Web Proof Information Pack.

KAZZINC LTD Competent Person’s Report for the assets held by Kazzinc Ltd in both Kazakhstan and Russia
61‐0795/MM February 2011
Draft V 0.9 Page x
Figure 5.22: Belkina Orebody ...............................................................................................................................71
Figure 5.23: Belkina Stope Blocks ......................................................................................................................... 71
Figure 5.24: Perspectivnaya Orebody..................................................................................................................72
Figure 5.25: Perspectivnaya Stope Blocks ............................................................................................................72
Figure 5.26: Existing Development at Zavodskaya ..............................................................................................73
Figure 5.27: Zavodskaya Current (white) and planned (coloured) Stope Blocks..................................................74
Figure 5.28: North Bestrushinskoye Stopes.........................................................................................................75
Figure 6.1: Geological Plan of the Main Orebody.................................................................................................97
Figure 6.2: Legend for Geological Plan (Figure 6.1) ..............................................................................................98
Figure 6.3: Typical Cross Section (No.21) through the Main Orebody (Looking East)..........................................99
Figure 6.4: Plan showing Location of Deep Horizon (collars and traces shown in red) and Flank (collars shown in
black with traces in green) Exploration Drill holes .............................................................................................105
Figure 6.5: Long Section showing Location of Deep Horizon (Collars and targets shown in red) and Flank
(targets shown in green) Exploration Drill holes ................................................................................................106
Figure 6.6: Cross Section No.21 showing Location of Deep Horizon..................................................................107
Figure 6.7: Isometric View of Underground Survey Wireframes........................................................................110
Figure 6.8: 100m Level Plan of Drillholes ...........................................................................................................111
Figure 6.9: Example Plan section 220m of Mineralised Zone Interpretation with Composites above Cut‐Off
Grade ..................................................................................................................................................................112
Figure 6.10: Variograms for High grade and Low grade Zn Populations ............................................................114
Figure 6.11: Grade Tonnage Curve for Measured and Indicated Resources ......................................................120
Figure 6.12: Annual Underground Production (ktpa) .........................................................................................120
Figure 6.13: 3D Layout of Tishinskiy Mine..........................................................................................................121
Figure 6.14: Long‐Section through Centre of Tishinskiy Mine............................................................................122
Figure 6.15: Cross‐Section through Centre of Tishinskiy Mine...........................................................................123
Figure 6.16: Ore Haulage Schematic...................................................................................................................128
Figure 6.17: Stope Layout for Tishinskiy .............................................................................................................132
Figure 7.1: Location of Shubinskiy Mine in Relation to Ridder...........................................................................148
Figure 7.2: Geology Showing the Mineralised Bodies and Lenses (Hatched) on the Contact between
Uspenskaya Formation (Yellow) and the Beloubinskaya Formation (Pale Yellow) with Magmatic Rocks (Green
and Mauve).........................................................................................................................................................151
Figure 7.3: Modelled North Western and South Eastern Lodes.........................................................................154
Figure 7.4: Plan of Level No.3 (870m) showing the NW and SE Lodes and the Dislocated and Sheared Ore
Bodies .................................................................................................................................................................155
Figure 7.5: Cross Section No 3 through the North Western Lode ......................................................................156
Figure 7.6: Schematic Underground Mine Layout..............................................................................................166
Figure 8.1: Dolinnoe and Obruchevskoe‐Geological Setting and Section Lines XXVI and XXV...........................186
Figure 8.2: Dolinnoe – Outline of the North Eastern and South Western Lodes................................................189
Figure 8.3: Dolinnoe‐North Eastern Ore Body....................................................................................................191
Figure 8.4: Dolinnoe‐Diagrammatic Representation of Proposed Development with Perspectivnaya Extension
............................................................................................................................................................................193
THIS WEB PROOF INFORMATION PACK IS IN DRAFT FORM. The information contained herein is incomplete and subject to change and it must be read in conjunction with the section headed ‘‘Warning’’on the cover of this Web Proof Information Pack.

KAZZINC LTD Competent Person’s Report for the assets held by Kazzinc Ltd in both Kazakhstan and Russia
61‐0795/MM February 2011
Draft V 0.9 Page xi
Figure 8.5: Obruchevskoe‐Southern (Left) and Northern (Right) Lodes from Section XXV (Refer Error! Reference
source not found.) ..............................................................................................................................................195
Figure 8.6: Obruchevskoe Northern (Left) and Southern Lodes (Right) from Section XXVI (Refer Error!
Reference source not found.).............................................................................................................................195
Figure 8.7: Plan View With Upper (Brown) and Lower (Green) Mineralised Zones ...........................................212
Figure 8.8: Along strike (Top) and down dip (Bottom) variogram models for Zn in the Lower Ore Zone..........214
Figure 8.9: Plan view of JORC Classification at Dolinnoe....................................................................................216
Figure 8.10: Isometric View Looking North East of Mineralised Zones ..............................................................219
Figure 8.11: Along strike (Top) and down dip (Bottom) variogram models for Zn.............................................220
Figure 8.12: Isometric View to the North East view of JORC Classification at Obruchevskoe............................222
Figure 8.13: Schematic of Option 1 ....................................................................................................................226
Figure 8.14: Schematic of Option 3 ....................................................................................................................227
Figure 8.15: Dolinnoe Stope Blocks ....................................................................................................................233
Figure 8.16: Obruchevskoe Stope Blocks............................................................................................................233
Figure 9.1: Plan showing Location of Exploration Drill holes on the Flanks of Ridder Sokolniy Deposit............244
Figure 9.2: Cross Section of Proposed Exploration Drilling on the South‐western Flank ...................................245
Figure 9.3: Cross Section of Proposed Exploration drilling on the South‐eastern Flank ....................................246
Figure 9.4: Proposed Exploration Drilling on the Northern Flank of Dolinnoe Deposit .....................................246
Figure 9.5: Plan showing Location of Deep Horizon (collars and traces shown in red) and Flank (collars shown in
black with traces in green) Exploration Drill holes .............................................................................................248
Figure 9.6: Long Section showing Location of Deep Horizon (Collars and targets shown in red) and Flank
(targets shown in green) Exploration Drill holes ................................................................................................249
Figure 9.7: Cross Section No.21 showing Location of Deep Horizon..................................................................250
PHOTOS
Photo 5.1: LPS‐3U Pneumatic Drillrig in Operation ..............................................................................................42
Photo 5.2: DMS Drum and Magnetic Roll Separators...........................................................................................53
Photo 5.3: Concentrator Building No.3 and Spiral Classifier ................................................................................55
Photo 5.4: Jig on Mill Discharge (centre left) and New Knelson Concentrator ....................................................55
Photo 5.5: RIF Flotation Cells and Shaking Table..................................................................................................56
Photo 5.6: Thickening and Filtration..................................................................................................................... 56
Photo 5.7: Talovskoye and Chashinskoye Tailings Dams......................................................................................68
Photo 8.1: Dolinnoe and Obruchevskoe – Location Adjacent to Ridder ............................................................184
THIS WEB PROOF INFORMATION PACK IS IN DRAFT FORM. The information contained herein is incomplete and subject to change and it must be read in conjunction with the section headed ‘‘Warning’’on the cover of this Web Proof Information Pack.

KAZZINC LTD Competent Person’s Report for the assets held by Kazzinc Ltd in both Kazakhstan and Russia
61‐0795/MM February 2011
Draft V 0.9 Page 1
5 RIDDER‐SOKOLNIY DEPOSIT 5.1 Introduction Kazzinc own and operate three polymetallic deposits within the Ridder Area: Ridder‐Sokolniy, Tishinskiy, Shubinskiy and are planning to develop a further three at Chekmar, Dolinnoe and Obruchevskoe. 5.1.1 Location & Access All of the six deposits are located within approximately 35km of the town of Ridder, which itself is situated some 120km north‐east of the city of Ust‐Kamenogorsk (Ust). The town is located in the north‐eastern part of the Ridder basin, which has an undulating relief and absolute elevations between 650m‐1,000m above Baltic Mean Sea Level. It is flanked on the southern side by the Prohodny and Ivanovsky mountains which rise to 2,300m, and by several lower mountain ranges on the northern side. The town of Ridder is linked by metalled roads and by rail, with total driving time to Ust of approximately two hours. Ust is served by regular Air Astana flights to the main Kazakh cities of Astana and Almaty. The six deposits are located as follows:
• The Ridder‐Sokolny mine complex is located on the outskirts of the town of Ridder, with Kazzinc offices located in the town centre;
• The Tishinsky mine is located on the main road between Ridder and Ust, 17km south‐west of Ridder and 20 minutes from Ridder‐Sokolny Mine;
• The Shubinsky deposit is located some 14km to the north‐east of Ridder via a well‐maintained, graded haul road;
• The Chekmar deposit is the most outlying of the Ridder Area deposits and is situated some 46km north of Ridder via a graded road; and
• The Dollinnoe and Obruchevskoe deposits are located 7.5km and 11km respectively to the north of the town of Ridder on a graded gravel road from Ridder to Biysk (located within the Russian Federation).
Figure 5.1 below shows the Ust Region and the Ridder Area deposits.
THIS WEB PROOF INFORMATION PACK IS IN DRAFT FORM. The information contained herein is incomplete and subject to change and it must be read in conjunction with the section headed ‘‘Warning’’on the cover of this Web Proof Information Pack.

KAZZINC LTD Competent Person’s Report for the assets held by Kazzinc Ltd in both Kazakhstan and Russia
61‐0795/MM February 2011
Draft V 0.9 Page 2
Figure 5.1: Ust Region and (inset) Ridder Area
5.1.2 Topography and Climate The climate in the region is extreme continental with an average annual temperature of around 2°C, varying between +35°C in July (average of 18°C) and ‐45°C in December (average of ‐16°C). Mean annual precipitation is approximately 700mm, of which 75% falls between October and April as snow. Snow cover generally lasts from October to mid‐April. The topography of the region comprises principally undulating relief at absolute elevations between 600‐1,200m above Baltic Mean Sea Level, and mountain ranges with peaks of between 1,500‐3,000m. The region has well developed infrastructure.
WAI Comment: In general, access and infrastructure in the Ridder Area are good, and despite harsh winter conditions, present no major obstacles to the continued development of the mines in the area.
THIS WEB PROOF INFORMATION PACK IS IN DRAFT FORM. The information contained herein is incomplete and subject to change and it must be read in conjunction with the section headed ‘‘Warning’’on the cover of this Web Proof Information Pack.

KAZZINC LTD Competent Person’s Report for the assets held by Kazzinc Ltd in both Kazakhstan and Russia
61‐0795/MM February 2011
Draft V 0.9 Page 3
5.1.3 Infrastructure 5.1.3.1 Mineral Rights and Permitting Kazzinc holds the right to mine gold‐polymetallic ore under the terms of the ‘Contract for Subsurface Use (MG No.65D)’ dated 28 March 1997. The Contract is valid for 25 years from the date of the licence issue and can be extended by mutual agreement between Kazzinc and the issuing authority. The current mining licence (Ridder Sokolniy) covers an area of 11.5km2 and was issued by the Ministry of Energy, Mineral Resources and the Environment of the Republic of Kazakhstan in May 2003, superseding the previous mining lease. 5.1.3.2 Mining Licence for Subsoil Use for Exploitation of Gold‐polymetallic Ores (1) The licence covers an area of 8.588km2 and permits mining to a depth of horizon 18. The boundaries of the licence (local grid co‐ordinates) are defined in Table 5.1 below.
Table 5.1: Mining Licence (1) Boundary Points Corner Points Y X
1 80 427 10 465 2 80 572 10 780 3 80 573 11 245 4 80 195 11 535 5 79 750 11 700 6 79 675 12 244 7 80 006 13 800 8 79 880 13 650 9 79 662 13 800 10 79 056 13 696 11 79 530 12 850 12 78 285 12 800 13 78 315 13 532 14 77 952 13 480 15 77 267 12 447 16 76 539 12 437 17 75 680 12 480 18 77 480 11 807 19 77 417 11 294 20 77 044 11 047 21 11 120 10 627 22 77 577 10 450 23 77 407 10 067 24 77 953 9 820 25 78 135 10 300 26 78 500 9 856 27 78 690 10 266 28 78 917 10 575 29 78 548 10 918 30 78 942 10 920 31 79 143 10 646 32 79 440 10 490 33 79 630 10 710 34 80 010 10 833 35 80 172 10 476
THIS WEB PROOF INFORMATION PACK IS IN DRAFT FORM. The information contained herein is incomplete and subject to change and it must be read in conjunction with the section headed ‘‘Warning’’on the cover of this Web Proof Information Pack.

KAZZINC LTD Competent Person’s Report for the assets held by Kazzinc Ltd in both Kazakhstan and Russia
61‐0795/MM February 2011
Draft V 0.9 Page 4
5.1.3.3 Mining Licence for subsoil Use for Exploitation of Gold‐polymetallic Ores (2) The licence covers an area of 11.5km2 and permits mining to a depth of horizon 24. The boundaries of the licence are defined in Table 5.2 below.
Table 5.2: Mining Licence (2) Boundary Points Corner Points Coordinates Corner Points
Latitude (N) Latitude (E) 1 50°21’38” 83°31’33” 2 50°21’42” 83°31’50” 3 50°21’43” 83°32’12” 4 50°21’44” 83°32’34” 5 50°21’40” 83°34’04” 6 50°21’25” 83°34’28” 7 50°20’45” 83°34’20” 8 50°20’37” 83°33’38” 9 50°20’30” 83°33’37” 10 50°20’31” 83°34’12” 11 50°20’19” 83°34’10” 12 50°19’39” 83°33’13” 13 50°19’38” 83°32’25” 14 50°19’57” 83°32’37” 15 50°20’02” 83°32’16” 16 50°19’49” 83°32’04” 17 50°19’42” 83°31’09” 18 50°20’00” 83°30’45” 19 50°20’18” 83°31’02” 20 50°20’24” 83°31’26” 21 50°20’36” 83°31’04” 22 50°20’42” 83°31’24” 23 50°20’33” 83°31’46” 24 50°20’37” 83°31’57” 25 50°20’50” 83°31’56” 26 50°20’56” 83°31’43” 27 50°21’06” 83°31’35” 28 50°21’14” 83°31’27” 29 50°21’30” 83°31’34”
5.1.3.4 Geological Allotment for Exploration of Gold‐Polymetallic Ores on the Flanks of Ridder Solkolniy The exploration licence covers an area of 12.1km2. The boundaries of the licence are defined in Table 5.3 below.
THIS WEB PROOF INFORMATION PACK IS IN DRAFT FORM. The information contained herein is incomplete and subject to change and it must be read in conjunction with the section headed ‘‘Warning’’on the cover of this Web Proof Information Pack.

KAZZINC LTD Competent Person’s Report for the assets held by Kazzinc Ltd in both Kazakhstan and Russia
61‐0795/MM February 2011
Draft V 0.9 Page 5
Table 5.3: Exploration Licence Boundary Points Corner Points Coordinates Corner Points
Latitude (N) Latitude (E) Site #1
1 50°21’42” 83°31’50” 2 50°21’34” 83°31’00” 3 50°20’53” 83°29’48” 4 50°19’20” 83°30’28” 5 50°19’26” 83°24’50” 6 50°20’20” 83°24’50” 7 50°20’46” 83°33’52” 8 50°20’37” 83°33’38” 9 50°20’30” 83°33’37” 10 50°20’31” 83°34’12” 11 50°20’19” 83°34’10” 12 50°19’39” 83°33’13” 13 50°19’38” 83°32’25” 14 50°19’57” 83°32’37” 15 50°20’02” 83°32’16” 16 50°19’49” 83°32’04” 17 50°19’42” 83°31’09” 18 50°20’00” 83°30’45” 19 50°20’18” 83°31’02” 20 50°20’24” 83°31’26” 21 50°20’36” 83°31’04” 22 50°20’42” 83°31’24” 23 50°20’33” 83°31’46” 24 50°20’37” 83°31’57” 25 50°20’50” 83°31’56” 26 50°20’56” 83°31’43” 27 50°21’06” 83°31’35” 28 50°21’14” 83°31’27” 29 50°21’30” 83°31’34” 30 50°21’38” 83°31’33”
Area – 10.2km2 Site #2
1 50°21’25” 83°34’28” 2 50°20’22” 83°36’02” 3 50°20’22” 83°34’56” 4 50°20’49” 83°34’00” 5 50°20’45” 83°34’20”
Area 1.9km2
THIS WEB PROOF INFORMATION PACK IS IN DRAFT FORM. The information contained herein is incomplete and subject to change and it must be read in conjunction with the section headed ‘‘Warning’’on the cover of this Web Proof Information Pack.

KAZZINC LTD Competent Person’s Report for the assets held by Kazzinc Ltd in both Kazakhstan and Russia
61‐0795/MM February 2011
Draft V 0.9 Page 6
Figure 5.2: Location Plan showing Position of Ridder Licences
THIS WEB PROOF INFORMATION PACK IS IN DRAFT FORM. The information contained herein is incomplete and subject to change and it must be read in conjunction with the section headed ‘‘Warning’’on the cover of this Web Proof Information Pack.

KAZZINC LTD Competent Person’s Report for the assets held by Kazzinc Ltd in both Kazakhstan and Russia
61‐0795/MM February 2011
Draft V 0.9 Page 7
Figure 5.3: Map showing the location of Main deposit and Exploration Projects
THIS WEB PROOF INFORMATION PACK IS IN DRAFT FORM. The information contained herein is incomplete and subject to change and it must be read in conjunction with the section headed ‘‘Warning’’on the cover of this Web Proof Information Pack.

KAZZINC LTD Competent Person’s Report for the assets held by Kazzinc Ltd in both Kazakhstan and Russia
61‐0795/MM February 2011
Draft V 0.9 Page 8
5.1.4 Project History The Ridder‐Sokolniy deposit was discovered in 1786 and has been worked since 1789, initially exploiting silver and gold‐bearing ore, before producing gold‐polymetallic ore from surface and underground working since 1920. The total mine production over the period 1789 to 2008 inclusive is understood to be of the order of 180Mt at 3g/t Au, 29.5g/t Ag, 0.3% (Cu), 0.9% (Pb) and 1.7% Zn. These figures are based on a summary of annual accounting. The current underground mine layout was developed on the basis of a project called ‘Reconstruction of the Mines in the Ridder‐Sokolniy Deposit’ which was prepared by the Kazgiprotzvetmet Institute in 1984. Prior to 1994, the deposit was exploited via three separate underground mines (known as Leninogorsk, Ridder and 40th Anniversary). Between 1994 and May 2001 only Ridder and 40th Anniversary were operational, utilising a common haulage and ventilation system, and in May 2001 the three mines were merged into a single operation, subsequently renamed as Ridder‐Sokolniy. 5.2 Geology and Mineralisation 5.2.1 Regional Geology The Ridder‐Sokolniy deposit is situated in the northern part of the Ridder mining district in the Rudnyi Altay. Geologically, this district coincides with an unusual graben structure oriented perpendicular to the regional north‐west structural trend and preserving Silurian to Middle Devonian volcano‐sedimentary sequences almost in the same position as they were laid down. The graben measures 20km in length by up to 8km in width at its centre. It is bounded on all sides by reverse faults. Terrains located immediately to the west and east of these faults display intense folding with steep pervasive north‐west striking schistosity. The graben is filled with four volcano‐sedimentary formations comprising, in ascending order, Zavodskaya (S2‐D1zv), Leninogorskaya (D1ln), Kriukovskaya (D1kr), Ilinskaya (D1‐2il) and Sokolnaya (D2sk) formations (refer to Table 5.4 below). The Kriukovskaya Formation hosts most of the polymetallic mineralisation known within the confines of the graben structure. It consists of three members:
• Upper member of predominantly fine‐grained sedimentary rocks (mainly siltstones of highly variable composition);
• Middle member of acid volcanogenic rocks (agglomerates, tuffs, minor lavas and lava breccias and their reworked derivatives), which attain 350m in thickness in the vicinity of the palaeovolcanic centres (in the central part of the Ridder‐Sokolniy deposit and at the Kriukovskaya Lode) and peter out rapidly in the south‐western, southern and south‐eastern flanks of the Ridder‐Sokolniy deposit; and
• Lower member consisting of carbonaceous siltstones and tuffaceous clastic sediments of varying grain size.
Calcareous siltstones at the top of the Kriukovskaya Formation, with their distinctive green‐grey or ash‐grey colour, serve as the marker horizon throughout the Ridder graben. Isolated reef limestones are also locally known at the same level.
THIS WEB PROOF INFORMATION PACK IS IN DRAFT FORM. The information contained herein is incomplete and subject to change and it must be read in conjunction with the section headed ‘‘Warning’’on the cover of this Web Proof Information Pack.

KAZZINC LTD Competent Person’s Report for the assets held by Kazzinc Ltd in both Kazakhstan and Russia
61‐0795/MM February 2011
Draft V 0.9 Page 9
Table 5.4: Stratigraphy of the Ridder Graben Formation Symbol Typical Lithology of Sedimentary and Volcanogenic Origin Intrusive Rocks
Q Alluvial sediments predominated by gravel and pebble size clasts, loam, thickness from several metres to over 100m
Sokolnaya D2sk Dark‐grey to black carbonaceous‐pelitic siltstones with intercalations of sandstones, gravelites, calcareous siltstones at the base
Sills of dolerite, porphyritic dolerite and subvolcanic porphyries Subconformable subvolcanic rhyolites ranging in thickness from 130m to 400m with widespread hydrothermal alteration Subconformable tabular extrusive to subvolcanic rhyolites and dacites of variable thickness
Ilinskaya D1‐2il Variable banded sedimentary and volcano‐sedimentary rocks, including tuffs of variable composition, tuffites, tuffaceous gravelites, tuffaceous sandstones, siliceous‐mica rocks ("peperite"), sandstones, gravelites, siltstone and rare limestones Basal horizon of coarse tuffogenic‐sedimentary rocks with angular clasts of siliceous siltstones, sandstones and quartzites, generally 10‐15m in thickness, resting on erosional surface of calcareous‐siliceous siltstones of Kriukovska Series
Subvolcanic porphyritic andesites forming subconformable tabular bodies
Kriukovkaya Dkr "Hanging wall schists" (carbonaceous siltstones, calcareous‐pelitic siltstones, siliceous siltstones, sandstones, gravelites and quartzites) Siltstone member formed of fragmented terrigenous rocks: siltstones, aleuropelite, siliceous siltstones, microquartzite. Volcanic material is transformed into chlorite‐sericite‐quartz rocks. Volcanomictous gravelite with interlayers of siltstones and silty sandstones; rock fragments consists of liperaite‐dacite porphyries; albitophyre, rearely tuffs of acid composition
Subvolcanic porphyritic andesites forming subconformable tabular bodies Subconformable subvolcanic rhyolites ranging in thickness from 130m to 400m with widespread hydrothermal alteration
Leninogorskaya Dln Metamorphosed tuffs of acid and intermadiate composition, tuffogenic and volcanomictic sandstones and gravelites Intercalations of siliceous and siliceous‐pelitic siltstones
Subconformable subvolcanic rhyolites ranging in thickness from 130m to 400m with widespread hydrothermal alteration
Zavodskaya S2‐D.,zv Massive and schistose greenschist facies rocks formed from sandstones, siltstones and pelites (chlorite‐epidote‐carbonate‐albite‐quartz schists)
THIS WEB PROOF INFORMATION PACK IS IN DRAFT FORM. The information contained herein is incomplete and subject to change and it must be read in conjunction with the section headed ‘‘Warning’’on the cover of this Web Proof Information Pack.
KAZZINC LTD Competent Person’s Report for the assets held by Kazzinc Ltd in both Kazakhstan and Russia
61‐0795/MM February 2011
Draft V 0.9 Page 10
5.2.2 Local Geology The Ridder‐Sokolniy deposit is a cluster of approximately 20 ore zones of predominantly veinlet‐type and disseminated sulphide mineralisation found at the same stratigraphic position within the Middle Devonian volcano‐sedimentary Kriukovskaya Formation. Four other ore zones are known from deeper stratigraphic levels. The mineralisation covers an area of approximately 20km2 and extends down to a depth of at least 700m. Two NW‐trending faults divide the deposit into three structural blocks:
• The Central block is bounded by the Drill holes 50‐53 Fault on the south‐western side and by the Nikolayevska Shaft Fault on the north‐eastern side. It contains the Central ore zone flanked by the Ridder, 2nd Ridder and Zavodskaya ore zones on the north‐western side and by Pobeda (Victory) ore zone on the south‐eastern side;
• The Western block (south‐west of the Drill holes 50‐53 Fault) contains three South‐Western ore zones (1st, 2nd and 3rd) and Bystrushinskaya and the Southern flank of Bystrushinskaya ore zone; and
• The Eastern block (north‐east of the Nikolayevska Shaft Fault) contains the North‐Eastern, Philippovskoye, Belkina, Perspectivnaya and Kriukovskaya ore zones.
At depth further mineralisation has been identified and includes the Novaya (New), Glubokaya, Dalnyaya (Far) and the 2nd North‐Eastern ore zones. These ore zones are shown in Figure 5.4 to Figure 5.7 below.
THIS WEB PROOF INFORMATION PACK IS IN DRAFT FORM. The information contained herein is incomplete and subject to change and it must be read in conjunction with the section headed ‘‘Warning’’on the cover of this Web Proof Information Pack.

KAZZINC LTD Competent Person’s Report for the assets held by Kazzinc Ltd in both Kazakhstan and Russia
61‐0795/MM February 2011
Draft V 0.9 Page 11
Figure 5.4: Geology Plan showing the Location of the Main Ore Zones
THIS WEB PROOF INFORMATION PACK IS IN DRAFT FORM. The information contained herein is incomplete and subject to change and it must be read in conjunction with the section headed ‘‘Warning’’on the cover of this Web Proof Information Pack.
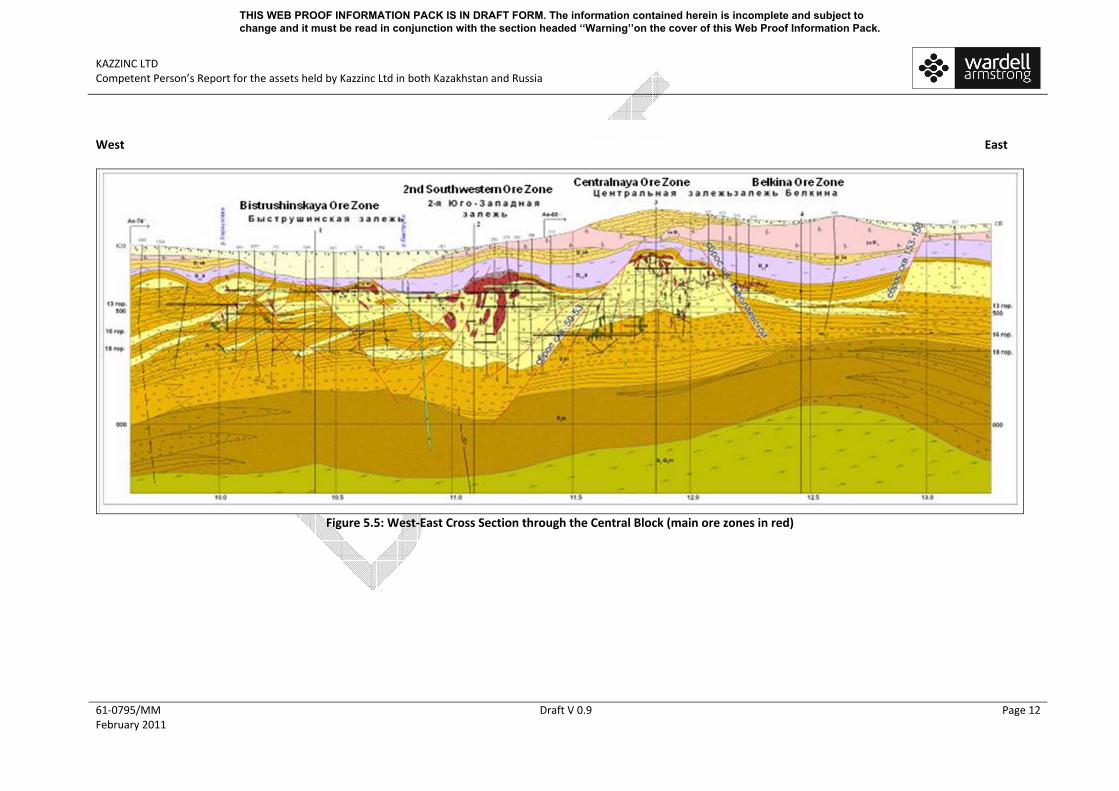
KAZZINC LTD Competent Person’s Report for the assets held by Kazzinc Ltd in both Kazakhstan and Russia
61‐0795/MM February 2011
Draft V 0.9 Page 12
West East
Figure 5.5: West‐East Cross Section through the Central Block (main ore zones in red)
THIS WEB PROOF INFORMATION PACK IS IN DRAFT FORM. The information contained herein is incomplete and subject to change and it must be read in conjunction with the section headed ‘‘Warning’’on the cover of this Web Proof Information Pack.

KAZZINC LTD Competent Person’s Report for the assets held by Kazzinc Ltd in both Kazakhstan and Russia
61‐0795/MM February 2011
Draft V 0.9 Page 13
North South
Figure 5.6: North‐ South Cross Section through the Central Block (main ore zones in red)
THIS WEB PROOF INFORMATION PACK IS IN DRAFT FORM. The information contained herein is incomplete and subject to change and it must be read in conjunction with the section headed ‘‘Warning’’on the cover of this Web Proof Information Pack.

KAZZINC LTD Competent Person’s Report for the assets held by Kazzinc Ltd in both Kazakhstan and Russia
61‐0795/MM February 2011
Draft V 0.9 Page 14
Figure 5.7: Long Section showing the Location of the Main Ore Zones
THIS WEB PROOF INFORMATION PACK IS IN DRAFT FORM. The information contained herein is incomplete and subject to change and it must be read in conjunction with the section headed ‘‘Warning’’on the cover of this Web Proof Information Pack.

KAZZINC LTD Competent Person’s Report for the assets held by Kazzinc Ltd in both Kazakhstan and Russia
61‐0795/MM February 2011
Draft V 0.9 Page 15
Horizon I, which is now completely exhausted within the developed mine area, consisted of stratabound mineralisation comprising massive sulphide lenses among veinlet‐disseminated mineralisation underlain by veinlet‐type and disseminated mineralisation resembling stockwork, which extended to depths of tens of meters. Some veinlet‐type and disseminated mineralisation was also found above the massive sulphide lenses. The largest lens (Central) was 1km long (NW), 300‐500m wide and up to 100m thick. The highest grades at this horizon were reported from gold‐barite‐polymetallic mineralisation, which comprised approximately 15% of the mineralised volume at this horizon but contained approximately 25% of the total contained zinc and lead. Gold grades in this type of mineralisation were in the range of 2g/t Au. Gold‐barite‐polymetallic mineralisation formed clusters of cupola shaped bodies characteristic for the southern and south‐eastern parts of the Ridder‐Sokolniy deposit (Central, 2nd South‐Western, Perspektivnaya ore zones). The underlying Horizon II, which is currently in exploitation, contains steeply to moderately dipping veins of zinc‐copper mineralisation with variable composition ranging from polymetallic through copper‐zinc to copper. The most characteristic feature of this horizon is the predominance of zinc and copper over lead, with zinc being more abundant than copper at Ridder and 2nd South‐Western ore zones and copper being more abundant than zinc in Central ore zones. The proportion of copper mineralisation increases with depth, see Figure 5.8. The other characteristic feature of Horizon II is a higher gold content than at the overlying Horizon I. Gold occurs in sulphide mineralisation and, more importantly, in distinctive narrow veins. Two types of gold veins within the ore zones are known:
• In Type 1 the gold occurs in association with tennantite‐tetrahedrite, galena, sphalerite, ankerite and quartz. These veins, referred to as gold‐sulphide veins, are particularly abundant among copper‐zinc mineralisation in the 2nd South‐Western ore zones. The veins pass upwards into stockwork zones which extend into the gold‐barite‐polymetallic cupolas; and
• In Type 2, gold occurs in quartz. The vein fill consists predominantly of quartz and dolomite, with minor quantities of unevenly disseminated sulphides. These are particularly abundant in the 2nd South‐Western Lode and the Bystrushinskaya ore zones. The veins contain 30‐45g/t Au or more, particularly at levels 11‐15, and despite small tonnages (typically in the 5,000‐10,000t range) may carry as much as 15‐20% of the total gold contained in the deposit. In recent years, gold‐bearing quartz veins have been worked selectively and stockpiled for processing as high value flux ore.
THIS WEB PROOF INFORMATION PACK IS IN DRAFT FORM. The information contained herein is incomplete and subject to change and it must be read in conjunction with the section headed ‘‘Warning’’on the cover of this Web Proof Information Pack.

KAZZINC LTD Competent Person’s Report for the assets held by Kazzinc Ltd in both Kazakhstan and Russia
61‐0795/MM February 2011
Draft V 0.9 Page 16
Figure 5.8: Stratigraphic Position
THIS WEB PROOF INFORMATION PACK IS IN DRAFT FORM. The information contained herein is incomplete and subject to change and it must be read in conjunction with the section headed ‘‘Warning’’on the cover of this Web Proof Information Pack.
KAZZINC LTD Competent Person’s Report for the assets held by Kazzinc Ltd in both Kazakhstan and Russia
61‐0795/MM February 2011
Draft V 0.9 Page 17
5.2.3 Description of the Ore Zones Within the deposit, vein‐impregnated, vein, and stockwork‐vein ore zones can be distinguished. On the upper levels, flat‐dipping hydrothermal‐sedimentary, hydrothermal‐metasomatic ores are developed, whilst with depth the hydrothermal stockwork‐vein formations transform into more typical vein systems. Each ore zone is characterised by the development of all structural‐genetic types of ore at various quantitative ratios. Flat‐dipping ores found within the upper levels had a wide aerial distribution over the deposit, but are now mined only on marginal parts of certain ore zones. Today flat‐lying ore bodies remain within the Bystrushinskaya, 2nd South‐Western and Pobeda ore zones, on the southern flank of Bystrushinskaya ore zone, as well as residual sections in the Perspektivnaya and Belnina lodes. These ore zones are also characterised by small metasomatised vein ore bodies that often occur on the footwall side of the main flat‐dipping ore body and subparallel to it. With distance from the main flat‐dipping ore body veins, the flat‐dipping ore bodies beneath the footwall become steeply dipping veins. Currently within the deposit, the steeply dipping vein formations with the ore zones contain the great majority of reserves. These veins are aligned sub‐parallel to main shear structures of the deposit and associated fractures. Rich ores are represented by massive sulphide lenses and gold‐bearing quartz veins. Gold‐quartz veins with high gold grade (more than 16g/t Au) have been selectively mined and developed particularly in the South‐Western and Bystrushinskaya ore zones, although the majority of these have now been mined. In individual cases, such veins occur in the Central and Pobeda ore zones. Gold‐bearing quartz veins are typically 0.2‐0.8m thick and as a rule occur concordantly with the host lead‐zinc and copper ores, their down dip dimensions are up to 40m, and along the strike – 30‐50m. A brief description by ore zone is given below: Ridderskaya ore zone is mainly represented by vein‐like bodies, rarely by columnar and disk shaped ore shoots. These veins are predominantly made up of vein‐impregnated sulphide lead‐zinc ore, which is altered by complex and oxide variations in the southern part of the lode on the upper levels. In addition, in south‐eastern part of the lode, copper ore vein bodies also occur. 2nd Ridderskaya ore zone is represented by sheet‐like bodies and beds of hydrothermal sedimentary ores. Ore bodies are predominantly oriented along a strike to the north‐west and have a variable south‐westerly dip (35‐75°). 2nd Ridderskaya ore zone borders on Ridderskaya lode and Intermediate area near “Boreholes 50‐53” fault. Intermediate ore zone area is made up of steeply‐dipping vein ore bodies of north‐western strike. Lead‐zinc ores distributed in the western part of the ore zone dip to the south‐west, and copper ores of eastern part of the ore zone dip near‐vertically and steeply to the north‐east, rarely to the south‐west. According to its position, the area is intermediate between the Ridderskaya and Central ore zones. Here, sulphide lead‐zinc ores are predominant, with their complex and oxide variations distributed on upper levels, and copper‐sulphide ores at the deeper levels. Centralniy ore zone has ore bodies which have a lenticular, sheet‐like and vein morphology. On the upper levels, ore bodies are represented by complex dendritic veins and veinlets of various orientation, intersections of multiple‐aged veins are observed. At the lower horizons there is a transition from mesh‐vein stockwork to oriented vein systems, ore bodies are represented by steeply‐dipping veins with banded structure, the banding is conditioned by alternation of variously coloured quartz bands, lenses and spots of sulphides. On the lower levels where copper ores are developed the ore body shape is vein‐like or wedge‐like. The banded structure veins pinch out rapidly down dip, but along the strike they can be traced for long distances. Veins of the Central ore zone are oriented to the north‐west and dip to the south‐west along the “boreholes 50‐53” fault,
THIS WEB PROOF INFORMATION PACK IS IN DRAFT FORM. The information contained herein is incomplete and subject to change and it must be read in conjunction with the section headed ‘‘Warning’’on the cover of this Web Proof Information Pack.

KAZZINC LTD Competent Person’s Report for the assets held by Kazzinc Ltd in both Kazakhstan and Russia
61‐0795/MM February 2011
Draft V 0.9 Page 18
but around the fault of Nikolayevskaya shaft ‐ to the north‐east, and in the central part of the veins are vertical. The Pobeda ore zone contains both flat‐dipping and steeply‐dipping ore bodies which can be lenticular, sheet‐like, vein‐like and disc shaped. The ore zone is made up of sulphide lead‐zinc and copper ores. Sheet‐like ore bodies consist of vein‐impregnated ores. Veins are orientated to the north‐west, but in central part near E‐W trending veins are also developed. Perspektivnaya ore zone is characterised by the development of flat‐dipping sulphide lead‐zinc ore bodies, typically disk‐shaped ore bodies predominate, this shape is conditioned by development of short down dip and along the strike fractures filled with quartz and ore minerals. Veins are oriented from north‐west to north‐south, whilst near Nikolayevskaya shaft fault, ore bodies dip to the north‐east, whereas on the north‐eastern limb of the ore zone, ores occur horizontally. Belkina ore zone is mainly represented by flat‐dipping ore bodies of sheet‐like, band‐like and lenticular shape, rarely of disk shape. Only sulphide lead‐zinc ores are developed in the ore zone. Ore bodies are made up of thin lenses and streaks and of massive sulfides. On the lower levels rare steeply‐dipping thin veins and veinlets with short strike length are developed which are represented by quartz‐ore material. Ore bodies are oriented to the north‐west and dip to the north‐east near Nikolayevskaya shaft fault and to the south‐west around the “boreholes 158‐153” fault. The 1st South‐Western ore zone is represented by small vein‐like ore bodies. The lode veins are oriented to the north‐west and dip to the south‐west. The 2nd South‐Western ore zone is mainly represented by sulphide lead‐zinc and copper vein ore bodies, which are typically thin; and have a vein‐like shape, rarely columnar. Numerous veins are very thin, however, sometimes these can be traced for considerable distances both down‐dip and along the strike. Ore bodies combine one or several veins with numerous sulphide veinlets. Ore bodies typically dip sub‐vertically. The 3rd South‐Western lode mainly consists of sulphide lead‐zinc ores transforming to copper ores with depth. Vein‐type ore bodies of sub‐vertical dip and approximately E‐W strike are similar to ore bodies of the 2nd South‐Western lode in structural location, mineral content and higher gold grade. Bystrushinskaya ore zone is mainly represented by steeply‐dipping veins and crush zones. Veins and zones are oriented approximately E‐W, with crush zones very often overlapping veins and vice versa. Textures are divided into brecciated, brecciform ore bodies filled with quartz, carbonate and sulphide minerals, and brecciated aleuropelites. On the upper levels, minor flat‐dipping lenticular ore bodies are developed and represented by vein‐impregnated mineralisation in quartz‐barite and quartzite. More than half of ore reserves in the lode are represented by copper ores, the rest – by sulphide lead‐zinc ores. Within the Southern flank of Bystrushinskaya ore zone a large main flat‐dipping ore body has been explored which contains small narrow steeply–dipping ore bodies located on the footwall side of the main body. Steeply–dipping veins are oriented approximately E‐W and to the north‐east and dip to the south‐east. Lodes of the 4th level of mineralisation (Novaya, the 2nd North‐Eastern, Glubokaya, Dalnaya ore zones) are mainly represented by flat‐dipping ore bodies occurring sub‐concordantly with the contact of the Zavodskaya suite host rocks with Leninogorskaya suite. These lodes are represented by sulphide lead‐zinc ores. Novaya ore zone is represented by a series of small bodies (total 55) of which the main one has an isometric shape and cross‐sectional size of 300m with an average thickness of 8.41m. The strike of the ore body is approximately E‐W, whose dip is nearly horizontal. The 2nd North‐Eastern ore zone is represented by a lenticular body 600m long, approximately 300‐500m wide and 1 to 19m thick and by 10 small 50‐60m lenses occurring nearly horizontally. Ore bodies are oriented to the north‐west.
THIS WEB PROOF INFORMATION PACK IS IN DRAFT FORM. The information contained herein is incomplete and subject to change and it must be read in conjunction with the section headed ‘‘Warning’’on the cover of this Web Proof Information Pack.

KAZZINC LTD Competent Person’s Report for the assets held by Kazzinc Ltd in both Kazakhstan and Russia
61‐0795/MM February 2011
Draft V 0.9 Page 19
Glubokaya ore zone is represented by one large, some middle‐size and some small ore body (a total of 26). The main ore body has lense‐sheet‐like shape and is isometric about 300m long and average thickness of 16.0m. It is orientated approximately E‐W, flat‐dipping (15‐20°) to the south‐west and the west. Dalnaya ore zone is represented by four quite large flat‐dipping ore bodies as well as by 49 small lenses. The main ore body represents two lenses of irregular shape which have a lenticular section. The thickness of the main ore bodies is between 1.0 and 35.0m, average is 13.63m, with dimensions of 600x400m. Ore bodies are oriented approximately E‐W, sub‐E‐W, and nearly horizontal. Dalnaya lode mainly consists of sulphide lead‐zinc ores, whilst copper ores are rarely developed. Dalnaya lode is more saturated with mineralisation than other lodes of the 4th level, having a greater content of massive sulphide (totally 30 ore bodies) are observed here, one of which is characterised by higher gold grade. North‐Eastern ore zone is represented by 19 small steeply‐dipping ore bodies of vein‐impregnated sulphide lead‐zinc and copper ores. Ore bodies are elongated to the north‐north‐nest and dip to the north‐east. The lode predominantly consists of sulphide lead‐zinc ores, copper ores are of minor significance. Only 3 lenses of massive sulphides with enriched gold are observed in the lode. Philippovskoye ore occurrence is represented by 11 steeply‐dipping small vein oxide and complex copper ore bodies and by 5 small oxide lead‐zinc ore bodies with extension to the north‐north‐west. No rich ore shoots have been discovered. Krukovskaya ore zone consists of a combination of flat‐dipping ore bodies and steeply‐dipping vein‐stockwork mineralisation of the first level. The ores are represented by oxide and complex lead‐zinc variations. 5.2.4 Mineralogy of the Veins Hydrothermal‐sedimentary Ores are represented by brecciated and scaly lead‐zinc polymetallic ores known only in the 2nd Ridderskaya ore zone. The breccia‐like ores prevail near the set of “faults 50‐53”, where thick layers (up to 4m) are split up by intercalations of aleuropelites. With distance from the faults, the layer thickness and size of clasts decrease, and at a distance of 30‐50m from the fault, the scaly variations prevail. The ore body is represented here by rhythmically alternating intercalations of finely disseminated and microfragmental ores from several centimeters to 15cm thick with thicker layers (up to 0.5m) of aleurolites. On the ore body flanks the aleuropelites contain only spots and blotches of fine‐grained pyrite and rarely – inclusions of other sulphides. The scaly lead‐zinc ores are fine‐grained, formed of a galena‐pyrite‐sphalerite‐dolomitic assemblage. Hydrothermal‐metasomatic Ores and Sedimentation in Cleavage cavities Massive and vein‐impregnated polymetallic ores of the level I are composed of chalcopyrite‐ galenite‐pyrite‐sphalerrite mineral assemblage. The main ore mineral is sphalerite; non‐metallic minerals are quartz and dolomite. The rare elements in these ores are fahlore, tennantite, gold, silver, arsenopyrite, calaverite, cellular pyrite, stephanite, enargite, hematite. They differ from scaly ores only by their higher copper content. Hydrothermal, mainly Vein Ores these are zinc‐copper ores of the level II, which consist of copper, copper‐zinc and polymetallic variations separated by gradational contacts. Unlike the level I ores, these ores are characterised by preponderance of zinc and copper over lead and by their coarse‐grained structure resulting from filling of crushed zones by the metal minerals. The veins have a coarse‐ribboned, symmetrical, rarely asymmetrical texture. The ores in the crushed zones are spotty, brecciated, rarely impregnated, lense‐like‐impregnated and massive. Metamorphogenic‐hydrothermal SulphIdic‐sericitic Ores of lead‐zinc composition are impregnated or massive, of medium‐grain size. They consist of pyrite‐sphalerite‐clinochlore‐phengite mineral assemblage. The porphyroblastic textures of ores are typical resulting from cementing of relatively large rounded (15mm) porphyroblasts of dark sphalerite with a phengite and clinochlore assemblage and disseminated small grains of
THIS WEB PROOF INFORMATION PACK IS IN DRAFT FORM. The information contained herein is incomplete and subject to change and it must be read in conjunction with the section headed ‘‘Warning’’on the cover of this Web Proof Information Pack.

KAZZINC LTD Competent Person’s Report for the assets held by Kazzinc Ltd in both Kazakhstan and Russia
61‐0795/MM February 2011
Draft V 0.9 Page 20
pyrite, chalcopyrite and galena. The ores tend to occur in the zones of later displacement that surround the quartz‐barite domes and intersect the bodies of massive and vein‐impregnated polymetallic ores. Oxidized and Mixed Ores are developed in areas lying beneath quaternary deposits and have restrictedly spread. The oxidation zone varies from 30‐100m thick. The subzone of the mixed/transitional ores occurs in the lower part of the oxidation zone and its thickness is up to several meters. 5.2.5 Mineralisation The most distinguishing feature of the Ridder‐Sokolniy mineralisation is the dominance of zinc over copper and lead. The average ratio of Cu:Pb:Zn is 0.2:1:2.4, except in copper and zinc‐copper veins where copper predominates. The other characteristic feature is the presence of substantial quantities of gold and, to a lesser degree, silver. A list of primary minerals identified at the deposit is given in Table 5.5 below.
Table 5.5: Primary Minerals Abundance Metalliferous Minerals Gangue Minerals
Main Sphalerite, pyrite, galena Barite, graphite, dolomite, quartz, sericite, phengite
Abundant Tennantite‐tetrahedrite, gold, silver, electrum, fine‐grained pyrite
Albite, ankerite, hydrophengite, calcite, prochlorite, ripidolite, chlorite
Rare Altayite, hematite, hessite, marcasite, molibdenite, pearcite, rutile
Oligoclase, gypsum, cleavelandite, chlinochlore, corundophyllite, magnesite, muscovite, carbonaceous matter, fluorite
Accessory Acanthite, arsenopyrite, bismuth, bismuthite, calaverite (?), petzite,
stephanite, tellurobismuthite, enargite, bornite
Bleinerite, penninite, siderite, talc
Mineral associations found at Horizons III and IV differs from those at Horizons I and II. Horizon III contains galena‐pyrite‐sphalerite mineralisation, in which sphalerite and pyrite each form 5‐8% by volume, galena forms 1% and chalcopyrite 0.5‐1.5%. The gold content is typically in the range of 0.2‐0.3g/t Au. Gangue minerals include sericite, quartz, calcite, dolomite, chlorite, potassic feldspar, plagioclase, siderite, barite and fluorite. Horizon IV contains chalcopyrite‐galena‐sphalerite mineralisation in calcite‐quartz veinlets. 5.3 Exploration Works 5.3.1 Sample Collection Currently mined veins generally do not exceed 50m in strike length. A grid of 25m along strike by 10m to 25m up and down dip is normally required to delineate such veins in order to classify the estimated reserves as C1 category (under the statutory requirement of mines to report reserves under GKZ (RK) protocols). Detailed pre‐production drilling and channel sampling to upgrade the reserves to the B category is generally carried out on a 12.5m by 12.5m or a closer spacing if necessary. The following sequence has been developed through many years of experience:
• Preliminary exploration by deep diamond core drilling from surface on a 50m by 50m grid (using directional wedging), which is considered optimal to delineate a C2 category resource; now carried out only to explore the flanks of the deposit;
• Detailed underground exploration with geological mapping and sampling of underground openings and drilling on grids varying from 50m by 25m to 25m by 25m; generally sufficient to delineate C1 category resource blocks; and
• Additional pre‐stoping exploration with channel sampling and drilling to achieve a 12.5m by 12.5m or closer sample spacing required to upgrade the C1 reserve to the B category.
THIS WEB PROOF INFORMATION PACK IS IN DRAFT FORM. The information contained herein is incomplete and subject to change and it must be read in conjunction with the section headed ‘‘Warning’’on the cover of this Web Proof Information Pack.

KAZZINC LTD Competent Person’s Report for the assets held by Kazzinc Ltd in both Kazakhstan and Russia
61‐0795/MM February 2011
Draft V 0.9 Page 21
Two different schemes of underground development and detailed exploration are in use depending on the geometry of mineralised zones. They are:
• Crosscut development scheme with crosscuts across the strike of mineralised structures at 50m spacing and fans of exploration drill holes at 25m intervals along the crosscuts to achieve a 25m by 25m sampling grid; and
• Drive development scheme with drives along the strike of mineralisation and fans of drill holes at 25m intervals. The spacing between the drives varies from 100m to 150m.
All underground openings and drill site locations are surveyed with instrumental methods. Drill hole trajectories are monitored at regular intervals. Placement of drill core markers is checked against grades recorded on roentgen‐radioactive logs. Channel samples are cut along one side of each crosscut exposing sulphide mineralisation. Channel samples are 2m in length or less if required. Drives along the strike are sampled by horizontal channel taken from advancing faces at intervals of 6m or 12.5m. Short crosscuts are developed at 12.5m intervals to intersect the whole width of mineralisation. Raises are sampled by horizontal channels at 4‐6m intervals from the same wall or from alternate opposing walls. All channel samples are 10cm wide and 1.5cm deep. Drill core from underground holes is divided into samples of variable length to account for geological features. The whole core is sent for sample preparation. External drill bit diameters are 46mm or 59mm, producing 42mm or 30mm diameter core respectively. 5.3.2 Sample Preparation Sample preparation is conducted at the laboratory of Ridder Mining and Concentrating Complex. The scheme is based on the Richard‐Czeczott formula Q=kda, where Q is the minimum sample quantity at a given stage of volume reduction, d is the diameter of the largest fragments defined as the screen size that retains the largest 5% of the mass, k is a coefficient dependent on the distribution irregularity of the mineral of interest and a is a coefficient related to the roundness of mineral grains (generally approximately 2). The coefficient k is the key parameter. In general terms, the lower coefficient k is, the better it accounts for the erratic distribution of minerals. In this instance, the k parameter of 0.1 has been selected after a series of experiments using schemes with k equal to 0.4, 0.3, 0.2, 0.15 and 0.1. In accordance with the adopted scheme, samples are crushed to less than 1mm and then divided to obtain an approximately 1kg sub‐sample which is pulverised to minus 0.074mm. The scheme is considered to be appropriate for sub‐sampling of samples with variable contents of fine‐grained gold. 5.3.3 Sample Analysis Analyses are performed at the laboratory of Ridder Mining and Concentrating Complex and include semi‐quantitative multi‐element spectral analysis (to select samples for accurate analysis), chemical analyses, phase analyses and fire assaying. External control analyses are performed by CL Evrika (former Central Laboratory of PGO Vostkazgeologia), AO Topaz and VNIItsvetmet, all at Ust Kamenogorsk. Each laboratory is accredited in Kazakhstan. 5.3.4 Bulk Densities Resource tonnages are based on tonnage factors calculated from regression formulas which link dry bulk densities to combined copper, lead and zinc grades. Two general regression formulas are in use; one for polymetallic mineralisation and one for copper mineralisation (see Table 5.6 below). Regression coefficients in the general formula for the polymetallic mineralisation are based on 554 bulk density determinations on samples taken from lodes in the Central and Western blocks. Regression coefficients for the general formula
THIS WEB PROOF INFORMATION PACK IS IN DRAFT FORM. The information contained herein is incomplete and subject to change and it must be read in conjunction with the section headed ‘‘Warning’’on the cover of this Web Proof Information Pack.

KAZZINC LTD Competent Person’s Report for the assets held by Kazzinc Ltd in both Kazakhstan and Russia
61‐0795/MM February 2011
Draft V 0.9 Page 22
for copper mineralisation are based on 140 determinations, also taken from the Central and Western blocks. A separate regression formula has been developed for polymetallic mineralisation of the Zavodskaya Lode. Volumes are converted to tonnages by applying densities based on the general regression formulas for polymetallic mineralisation and copper mineralisation as given in Table 5.6 below.
THIS WEB PROOF INFORMATION PACK IS IN DRAFT FORM. The information contained herein is incomplete and subject to change and it must be read in conjunction with the section headed ‘‘Warning’’on the cover of this Web Proof Information Pack.
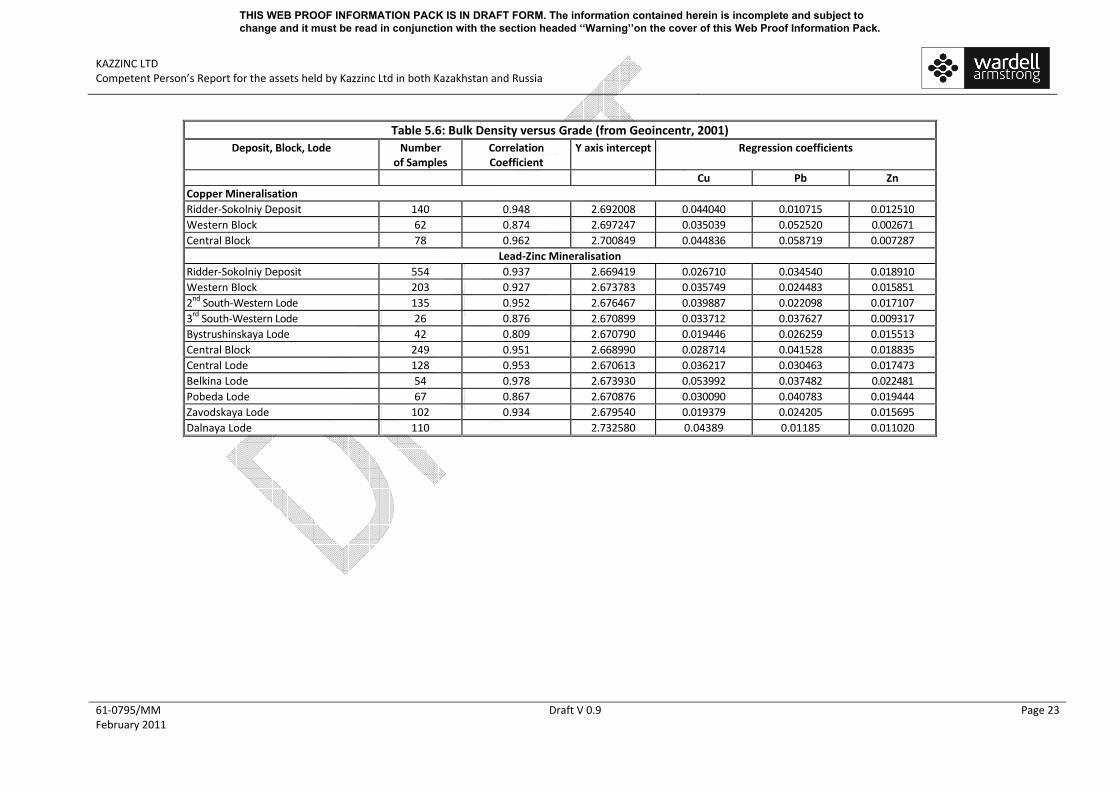
KAZZINC LTD Competent Person’s Report for the assets held by Kazzinc Ltd in both Kazakhstan and Russia
61‐0795/MM February 2011
Draft V 0.9 Page 23
Table 5.6: Bulk Density versus Grade (from Geoincentr, 2001) Deposit, Block, Lode Number
of Samples Correlation Coefficient
Y axis intercept Regression coefficients
Cu Pb Zn Copper Mineralisation Ridder‐Sokolniy Deposit 140 0.948 2.692008 0.044040 0.010715 0.012510 Western Block 62 0.874 2.697247 0.035039 0.052520 0.002671 Central Block 78 0.962 2.700849 0.044836 0.058719 0.007287
Lead‐Zinc Mineralisation Ridder‐Sokolniy Deposit 554 0.937 2.669419 0.026710 0.034540 0.018910 Western Block 203 0.927 2.673783 0.035749 0.024483 0.015851 2nd South‐Western Lode 135 0.952 2.676467 0.039887 0.022098 0.017107 3rd South‐Western Lode 26 0.876 2.670899 0.033712 0.037627 0.009317 Bystrushinskaya Lode 42 0.809 2.670790 0.019446 0.026259 0.015513 Central Block 249 0.951 2.668990 0.028714 0.041528 0.018835 Central Lode 128 0.953 2.670613 0.036217 0.030463 0.017473 Belkina Lode 54 0.978 2.673930 0.053992 0.037482 0.022481 Pobeda Lode 67 0.867 2.670876 0.030090 0.040783 0.019444 Zavodskaya Lode 102 0.934 2.679540 0.019379 0.024205 0.015695 Dalnaya Lode 110 2.732580 0.04389 0.01185 0.011020
THIS WEB PROOF INFORMATION PACK IS IN DRAFT FORM. The information contained herein is incomplete and subject to change and it must be read in conjunction with the section headed ‘‘Warning’’on the cover of this Web Proof Information Pack.

KAZZINC LTD Competent Person’s Report for the assets held by Kazzinc Ltd in both Kazakhstan and Russia
61‐0795/MM February 2011
Draft V 0.9 Page 24
5.4 QA/QC Analysis for Ridder‐Sokolniy and Satellite Areas WAI has carried out QAQC analysis on a selected portion of the available data from the Kazzinc assets. The data can be treated as being representative of the sample handling and assaying procedures of the company's Ridder assets and the analysis of these is presented here. 5.4.1 Internal Checks Internal duplicate checks were carried out on 411 Au‐Ag samples from the Solovievskiy licence area during 2010. Statistical analysis has been carried out on the data. Overall the plots demonstrate that the internal duplicate checks have been carried out to a satisfactory standard. The results for the Ag internal checks give similar results. For the Cu, Zn and Pb assays 270 samples were selected for internal duplicate tests from a range of assay values from the Solovievskiy licence area during the 2010 period. 5.4.2 External Checks 217 of the Au samples and 209 of the Ag samples submitted for internal analysis were also submitted to Ridder Sokolniy laboratory for external tests. Figure 5.9 shows scatter plots for these external assays and show excellent correlation.
Basic vs External Au
y = 1.0007x ‐ 0.4334
R2 = 0.9989
‐50.0
0.0
50.0
100.0
150.0
200.0
250.0
300.0
350.0
400.0
450.0
0.0 50.0 100.0 150.0 200.0 250.0 300.0 350.0 400.0 450.0
Basic Au g/t
Exte
rnal A
u g/
t
Figure 5.9: Scatter Plots of External Au and Ag Check Assays
Similarly the Q‐Q plots for both elements show good linearity. Overall the results give WAI confidence that the sample preparation and analysis across the Kazzinc assets has been carried out to a high standard. 5.5 Current Mineral Resource Estimates Mineral Resources for individual Ridder Sokolniy ore zones have been calculated in accordance with the
guidelines of the JORC Code (2004) and are shown in the tables together with a summary below.
Basic vs External Ag
y = 0.9693x + 0.4047
R2 = 0.982
0
50
100
150
200
250
300
350
400
0.0 50.0 100.0 150.0 200.0 250.0 300.0 350.0 400.0
Basic Ag g/t
Exte
rnal A
g g/
t
THIS WEB PROOF INFORMATION PACK IS IN DRAFT FORM. The information contained herein is incomplete and subject to change and it must be read in conjunction with the section headed ‘‘Warning’’on the cover of this Web Proof Information Pack.

KAZZINC LTD Competent Person’s Report for the assets held by Kazzinc Ltd in both Kazakhstan and Russia
61‐0795/MM February 2011
Draft V 0.9 Page 25
5.5.1 Centralny
The Centralny resource model was produced by WAI. A summary of the resource estimate is shown in Table 5.7 below.
Table 5.7: Centralny Resource Estimate (WAI 01.01.11) Total In‐Situ Resources At COG of 1.7% ZnEQV for PbZn Ore and 0.6% CuEQV for Cu Ore
(In Accordance with the guidelines of the JORC Code (2004)) Gold (Au) Silver (Ag) Copper (Cu) Lead (Pb) Zinc (Zn)
Classification Tonnage (Mt) Grade
(g/t)
Metal Content (oz)
Grade (g/t)
Metal Content (oz)
Grade (%)
Metal Content
(t)
Grade (%)
Metal Content
(t)
Grade (%)
Metal Content
(t) Measured 20.09 1.00 648,768 8.43 5,446,956 0.9 18,020 0.31 61480 0.8 160,800 Indicated 36.21 1.23 1,437,071 8.46 9,847,050 0.44 15,950 0.36 130750 0.85 308,310
Measured + Indicated
56.30 1.15 2,085,839 8.45 15,294,006 0.60 33,970 0.34 192,230 0.83 469,110
Inferred 1.53 0.83 40,763 3.74 183,365 0.45 690 0.15 2320 0.71 10,880
Notes: 1. Mineral Resources are not reserves until they have demonstrated economic viability based on a Feasibility study or pre‐feasibility study. 2. Mineral Resources are reported inclusive of any reserves. 3. Grade represents estimated contained metal in the ground and has not been adjusted for metallurgical recovery.
5.5.2 Bystrushinskoe
The Bystrushinskoe resource model was produced by WAI. A summary of the resource estimate is shown in Table 5.8 below.
Table 5.8: Bystrushinskoe Resource Estimate (WAI 01.01.11) Total In‐Situ Resources At COG of 1.7% ZnEQV for PbZn Ore and 0.6% CuEQV for Cu Ore
(In Accordance with the Guidelines of the JORC Code (2004)) Gold (Au) Silver (Ag) Copper (Cu) Lead (Pb) Zinc (Zn)
Classification Tonnage (Mt) Grade
(g/t)
Metal Content (oz)
Grade (g/t)
Metal Content (oz)
Grade (%)
Metal Content
(t)
Grade (%)
Metal Content
(t)
Grade (%)
Metal Content
(t) Measured ‐ ‐ ‐ ‐ ‐ ‐ ‐ ‐ ‐ ‐ ‐ Indicated 16.98 2.72 1,486,264 12.29 6,711,147 0.28 48,064 0.42 71,510 0.90 152,812
Measured + Indicated
16.98 2.72 1,486,264 12.29 6,711,147 0.28 48,064 0.42 71,510 0.90 152,812
Inferred 0.04 1.53 1,768 3.44 3,922 0.18 63 0.15 53 0.33 118
Notes: 1. Mineral Resources are not reserves until they have demonstrated economic viability based on a Feasibility study or pre‐feasibility study. 2. Mineral Resources are reported inclusive of any reserves. 3. Grade represents estimated contained metal in the ground and has not been adjusted for metallurgical recovery.
5.5.3 North Bystrushinskoe
The North Bystrushinskoe resource model was produced by WAI. A summary of the resource estimate is shown in Table 5.9 below.
THIS WEB PROOF INFORMATION PACK IS IN DRAFT FORM. The information contained herein is incomplete and subject to change and it must be read in conjunction with the section headed ‘‘Warning’’on the cover of this Web Proof Information Pack.

KAZZINC LTD Competent Person’s Report for the assets held by Kazzinc Ltd in both Kazakhstan and Russia
61‐0795/MM February 2011
Draft V 0.9 Page 26
Table 5.9: North Bystrushinskoe Resource Estimate (WAI 01.01.11) Total In‐Situ Resources At COG of 1.7% ZnEQV for PbZn Ore and 0.6% CuEQV for Cu Ore
(In Accordance with the Guidelines of the JORC Code (2004)) Gold (Au) Silver (Ag) Copper (Cu) Lead (Pb) Zinc (Zn)
Classification Tonnage (Mt) Grade
(g/t)
Metal Content (oz)
Grade (g/t)
Metal Content (oz)
Grade (%)
Metal Content (t)
Grade (%)
Metal Content
(t)
Grade (%)
Metal Content
(t) Measured ‐ ‐ ‐ ‐ ‐ ‐ ‐ ‐ ‐ ‐ ‐ Indicated 1.75 1.26 70,796 5.63 317,328 1.02 17,890 0.29 5,140 1.08 18,868
Measured + Indicated
1.75 1.26 70,796 5.63 317,328 1.02 17,890 0.29 5,140 1.08 18,868
Inferred 0.09 2.46 7,106 6.90 19,997 0.86 776 0.29 264 1.03 925
Notes: 1. Mineral Resources are not reserves until they have demonstrated economic viability based on a Feasibility study or pre‐feasibility study. 2. Mineral Resources are reported inclusive of any reserves. 3. Grade represents estimated contained metal in the ground and has not been adjusted for metallurgical recovery.
5.5.4 Belkina
The Belkina resource model was produced by KMC and audited by WAI. A summary of the resource estimate is shown in Table 5.10 below.
Table 5.10: Belkina Resource Estimate (WAI 01.01.11) Total In‐Situ Resources At COG of 1.7% ZnEQV for PbZn Ore (In Accordance with the Guidelines of the JORC Code (2004))
Gold (Au) Silver (Ag) Copper (Cu) Lead (Pb) Zinc (Zn)
Classification Tonnage (Mt) Grade
(g/t)
Metal Content (oz)
Grade (g/t)
Metal Content (oz)
Grade (%)
Metal Content (t)
Grade (%)
Metal Content
(t)
Grade (%)
Metal Content
(t) Measured 3.76 1.26 152,331 18.98 2,294,630 0.09 3,384 0.47 17,670 0.98 36,850 Indicated 4.77 1.11 170,126 16.85 2,582,538 0.08 3,814 0.41 19,550 0.85 40,520
Measured + Indicated
8.53 1.18 322,456 17.79 4,877,168 0.08 7,200 0.44 37,220 0.91 77,370
Inferred 0.52 0.88 14,669 23.42 390,393 0.28 1,450 0.32 1,660 0.90 4,670
Notes: 1. Mineral Resources are not reserves until they have demonstrated economic viability based on a Feasibility study or pre‐feasibility study. 2. Mineral Resources are reported inclusive of any reserves. 3. Grade represents estimated contained metal in the ground and has not been adjusted for metallurgical recovery.
THIS WEB PROOF INFORMATION PACK IS IN DRAFT FORM. The information contained herein is incomplete and subject to change and it must be read in conjunction with the section headed ‘‘Warning’’on the cover of this Web Proof Information Pack.

KAZZINC LTD Competent Person’s Report for the assets held by Kazzinc Ltd in both Kazakhstan and Russia
61‐0795/MM February 2011
Draft V 0.9 Page 27
5.5.5 Perspectivnaya
The Perspectivnaya resource model was produced by WAI. A summary of the resource estimate is shown in Table 5.11 below.
Table 5.11: Perspectivnaya Resource Estimate (WAI 01.01.11) Total In‐Situ Resources At COG of 1.7% ZnEQV for PbZn Ore (In Accordance with the Guidelines of the JORC Code (2004)) Gold (Au) Silver (Ag) Copper (Cu) Lead (Pb) Zinc (Zn)
Classification Tonnage (Mt) Grade
(g/t)
Metal Content (oz)
Grade (g/t)
Metal Content (oz)
Grade (%)
Metal Content
(t)
Grade (%)
Metal Content
(t)
Grade (%)
Metal Content
(t) Measured 4.59 1.55 228,476 16.01 2,359,940 0.13 5,960 0.57 26,130 1.07 49,060 Indicated 3.94 1.36 172,076 16.79 2,124,381 0.13 5,120 0.53 20,860 1.03 40,530
Measured + Indicated
8.52 1.46 400,552 16.37 4,484,321 0.13 11,080 0.55 46,990 1.05 89,590
Inferred 2.03 1.19 77,607 12.08 787,806 0.14 2,840 0.49 9,940 0.95 19,270
Notes: 1. Mineral Resources are not reserves until they have demonstrated economic viability based on a Feasibility study or pre‐feasibility study. 2. Mineral Resources are reported inclusive of any reserves. 3. Grade represents estimated contained metal in the ground and has not been adjusted for metallurgical recovery.
5.5.6 Sokolok
The Sokolok resource model was produced by KMC and audited by WAI. A summary of the resource estimate is shown in Table 5.12 below.
Table 5.12: Sokolok Resource Estimate (WAI 01.01.11) Total In‐Situ Resources At COG of 1.7% ZnEQV for PbZn Ore (In Accordance with the Guidelines of the JORC Code (2004)) Gold (Au) Silver (Ag) Copper (Cu) Lead (Pb) Zinc (Zn)
Classification
Tonnage (Mt) Grade
(g/t)
Metal Content (oz)
Grade (g/t)
Metal Content (oz)
Grade (%)
Metal Content
(t)
Grade (%)
Metal Content
(t)
Grade (%)
Metal Content
(t) Measured ‐ ‐ ‐ ‐ ‐ ‐ ‐ ‐ ‐ ‐ ‐ Indicated 0.29 1.36 12,839 120.84 1,140,808 0.13 380 1.00 2,940 1.89 5,550
Measured + Indicated
0.29 1.36 12,839 120.84 1,140,808 0.13 380 1.00 2,940 1.89 5,550
Inferred 0.37 1.40 16,715 15.27 182,315 0.14 520 1.48 5,550 1.98 7,350
Notes: 1. Mineral Resources are not reserves until they have demonstrated economic viability based on a Feasibility study or pre‐feasibility study. 2. Mineral Resources are reported inclusive of any reserves. 3. Grade represents estimated contained metal in the ground and has not been adjusted for metallurgical recovery.
THIS WEB PROOF INFORMATION PACK IS IN DRAFT FORM. The information contained herein is incomplete and subject to change and it must be read in conjunction with the section headed ‘‘Warning’’on the cover of this Web Proof Information Pack.

KAZZINC LTD Competent Person’s Report for the assets held by Kazzinc Ltd in both Kazakhstan and Russia
61‐0795/MM February 2011
Draft V 0.9 Page 28
5.5.7 New Glubokaya
The New Glubokaya resource model was produced by KMC and audited by WAI. A summary of the resource estimate is shown in Table 5.13 below.
Table 5.13: New Glubokaya Resource Estimate (WAI 01.01.11) Total In‐Situ Resources At COG of 1.7% ZnEQV for PbZn Ore (In Accordance with the Guidelines of the JORC Code (2004)) Gold (Au) Silver (Ag) Copper (Cu) Lead (Pb) Zinc (Zn)
Classification Tonnage (Mt) Grade
(g/t)
Metal Content (oz)
Grade (g/t)
Metal Content (oz)
Grade (%)
Metal Content
(t)
Grade (%)
Metal Content
(t)
Grade (%)
Metal Content
(t) Measured ‐ ‐ ‐ ‐ ‐ ‐ ‐ ‐ ‐ ‐ ‐ Indicated 0.32 0.18 1,867 2.48 25,723 0.06 190 0.67 2,160 1.80 5,810
Measured + Indicated
0.32 0.18 1,867 2.48 25,723 0.06 190 0.67 2,160 1.80 5,810
Inferred 0.07 0.14 314 2.68 6,004 0.31 220 0.74 520 2.10 1,460
Notes: 1. Mineral Resources are not reserves until they have demonstrated economic viability based on a Feasibility study or pre‐feasibility study. 2. Mineral Resources are reported inclusive of any reserves. 3. Grade represents estimated contained metal in the ground and has not been adjusted for metallurgical recovery.
5.5.8 Glubokaya
The Glubokaya resource model was produced by KMC and audited by WAI. A summary of the resource estimate is shown in Table 5.14 below.
Table 5.14: Glubokaya Resource Estimate (WAI 01.01.11) Total In‐Situ Resources At COG of 1.7% ZnEQV for PbZn Ore (In Accordance with the Guidelines of the JORC Code (2004)) Gold (Au) Silver (Ag) Copper (Cu) Lead (Pb) Zinc (Zn)
Classification Tonnage (Mt) Grade
(g/t)
Metal Content (oz)
Grade (g/t)
Metal Content (oz)
Grade (%)
Metal Content
(t)
Grade (%)
Metal Content
(t)
Grade (%)
Metal Content
(t) Measured ‐ ‐ ‐ ‐ ‐ ‐ ‐ ‐ ‐ ‐ ‐ Indicated ‐ ‐ ‐ ‐ ‐ ‐ ‐ ‐ ‐ ‐ ‐
Inferred 0.51 0.10 1,640 1.48 24,277 0.08 410 0.83 4,230 1.91 9,740
Notes: 1. Mineral Resources are not reserves until they have demonstrated economic viability based on a Feasibility study or pre‐feasibility study. 2. Mineral Resources are reported inclusive of any reserves. 3. Grade represents estimated contained metal in the ground and has not been adjusted for metallurgical recovery.
THIS WEB PROOF INFORMATION PACK IS IN DRAFT FORM. The information contained herein is incomplete and subject to change and it must be read in conjunction with the section headed ‘‘Warning’’on the cover of this Web Proof Information Pack.

KAZZINC LTD Competent Person’s Report for the assets held by Kazzinc Ltd in both Kazakhstan and Russia
61‐0795/MM February 2011
Draft V 0.9 Page 29
5.5.9 Dalnaya
The Dalnaya resource model was produced by KMC and audited by WAI. A summary of the resource estimate is shown in Table 5.15 below.
Table 5.15: Dalnaya Resource Estimate (WAI 01.01.11) Total In‐Situ Resources At COG of 1.7% ZnEQV for PbZn Ore (In Accordance with the Guidelines of the JORC Code (2004))
Gold (Au) Silver (Ag) Copper (Cu) Lead (Pb) Zinc (Zn)
Classification Tonnage (Mt) Grade
(g/t)
Metal Content (oz)
Grade (g/t)
Metal Content (oz)
Grade (%)
Metal Content (t)
Grade (%)
Metal Content
(t)
Grade (%)
Metal Content (t)
Measured ‐ ‐ ‐ ‐ ‐ ‐ ‐ ‐ ‐ ‐ ‐ Indicated 3.14 0.31 31,104 3.49 352,551 0.68 21,281 0.22 6,975 2.31 72,368
Measured + Indicated
3.14 0.31 31,104 3.49 352,551 0.68 21,281 0.22 6,975 2.31 72,368
Inferred 1.16 0.18 6,855 3.18 118,984 0.51 5,958 0.40 4,620 2.07 24,083
Notes: 1. Mineral Resources are not reserves until they have demonstrated economic viability based on a Feasibility study or pre‐feasibility study. 2. Mineral Resources are reported inclusive of any reserves. 3. Grade represents estimated contained metal in the ground and has not been adjusted for metallurgical recovery.
5.5.10 Zavodskaya
The Zavodskaya resource model was produced by KMC and audited by WAI. A summary of the resource estimate is shown in Table 5.16 below.
Table 5.16: Zavodskaya Resource Estimate (WAI 01.01.11) Total In‐Situ Resources At COG of 1.7% ZnEQV for PbZn Ore (In Accordance with the Guidelines of the JORC Code (2004))
Gold (Au) Silver (Ag) Copper (Cu) Lead (Pb) Zinc (Zn)
Classification Tonnage (Mt) Grade
(g/t)
Metal Content (oz)
Grade (g/t)
Metal Content (oz)
Grade (%)
Metal Content
(t)
Grade (%)
Metal Content
(t)
Grade (%)
Metal Content
(t) Measured 1.78 0.82 46,922 22.60 1,293,223 0.12 2,111 0.79 14,105 1.53 27,187 Indicated 0.51 0.97 15,816 21.62 352,524 0.10 509 0.67 3,397 1.29 6,523
Measured + Indicated
2.29 0.85 62,739 22.38 1,645,747 0.12 2,620 0.76 17,502 1.48 33,710
Inferred 0.33 1.00 10,567 21.10 222,961 0.14 459 0.60 1,958 1.21 3,991
Notes: 1. Mineral Resources are not reserves until they have demonstrated economic viability based on a Feasibility study or pre‐feasibility study. 2. Mineral Resources are reported inclusive of any reserves. 3. Grade represents estimated contained metal in the ground and has not been adjusted for metallurgical recovery.
THIS WEB PROOF INFORMATION PACK IS IN DRAFT FORM. The information contained herein is incomplete and subject to change and it must be read in conjunction with the section headed ‘‘Warning’’on the cover of this Web Proof Information Pack.

KAZZINC LTD Competent Person’s Report for the assets held by Kazzinc Ltd in both Kazakhstan and Russia
61‐0795/MM February 2011
Draft V 0.9 Page 30
Table 5.17: Kazzinc Mineral Resources Ridder Sokolniy Mine (WAI 01.01.2011) (In Accordance with the Guidelines of the JORC Code (2004)
Gold (Au) Silver (Ag) Copper (Cu) Lead (Pb) Zinc (Zn)
Deposit Resources Cut Off
Grade Date
Tonne
s
(Mt) Grade
(g/t)
Metal
Content
(oz)
Grade (g/t) Metal Content
(oz)
Grade
(%)
Metal
Content
(t)
Grade
(%)
Metal
Content
(t)
Grade
(%)
Metal
Content
(t)
Measured 20.09 1.00 648,768 8.43 5,446,956 0.9 18,020 0.31 6,1480 0.8 160,800
Indicated 36.21 1.23 1,437,071 8.46 9,847,050 0.44 15,950 0.36 130,750 0.85 308,310
Measured + Indicated 56.30 1.15 2,085,839 8.45 15,294,006 0.60 33,970 0.34 192,230 0.83 469,110
Inferred 1.53 0.83 40,763 3.74 183,365 0.45 690 0.15 2,320 0.71 10,880
Centralniy
Total
1.7% ZnEq
for PbZn ore
and 0.6%
CuEq for Cu
ore
01.01.2011
57.83 1.14 2,126,602 8.33 15,477,371 0.60 34,660 0.34 194,550 0.83 479,990
Measured ‐ ‐ ‐ ‐ ‐ ‐ ‐ ‐ ‐ ‐ ‐
Indicated 16.98 2.72 1,486,264 12.29 6,711,147 0.28 48,064 0.42 71,510 0.90 152,812
Measured + Indicated 16.98 2.72 1,486,264 12.29 6,711,147 0.28 48,064 0.42 71,510 0.90 152,812
Inferred 0.04 1.53 1,768 3.44 3,922 0.18 63 0.15 53 0.33 118
Bystrushinskoe
Total
1.7% ZnEq
for PbZn ore
and 0.6%
CuEq for Cu
ore
01.01.2011
17.02 2.72 1,488,032 12.28 6,715,069 0.28 48,127 0.42 71,563 0.90 152,930
Measured ‐ ‐ ‐ ‐ ‐ ‐ ‐ ‐ ‐ ‐ ‐
Indicated 1.75 1.26 70,796 5.63 317,328 1.02 17,890 0.29 5,140 1.08 18,868
Measured + Indicated 1.75 1.26 70,796 5.63 317,328 1.02 17,890 0.29 5,140 1.08 18,868
Inferred 0.09 2.46 7,106 6.90 19,997 0.86 776 0.29 264 1.03 925
Bystrushinskoe
North Flank
Total
1.7% ZnEq
for PbZn ore
and 0.6%
CuEq for Cu
ore
01.01.2011
1.84 1.31 77,902 5.69 337,325 1.01 18,666 0.29 5,404 1.07 19,793
Measured 3.76 1.26 152,331 18.98 2,294,630 0.09 3,384 0.47 17,670 0.98 36,850
Indicated 4.77 1.11 170,126 16.85 2,582,538 0.08 3,814 0.41 19,550 0.85 40,520
Measured + Indicated 8.53 1.18 322,456 17.79 4,877,168 0.08 7,200 0.44 37,220 0.91 77,370
Inferred 0.52 0.88 14,669 23.42 390,393 0.28 1,450 0.32 1,660 0.90 4,670
Belkina_RSM_WA
Total
1.7% ZnEq 01.01.2011
9.05 1.16 337,125 18.11 5,267,561 0.10 8,650 0.43 38,880 0.91 82,040
Measured 4.59 1.55 228,476 16.01 2,359,940 0.13 5,960 0.57 26,130 1.07 49,060
Indicated 3.94 1.36 172,076 16.79 2,124,381 0.13 5,120 0.53 20,860 1.03 40,530
Measured + Indicated 8.52 1.46 400,552 16.37 4,484,321 0.13 11,080 0.55 46,990 1.05 89,590
Inferred 2.03 1.19 77,607 12.08 787,806 0.14 2,840 0.49 9,940 0.95 19,270
Perspectivnaya
Total
1.7% ZnEq 01.01.2011
10.55 1.41 478,159 15.55 5,272,127 0.13 13,920 0.54 56,930 1.03 108,860
THIS WEB PROOF INFORMATION PACK IS IN DRAFT FORM. The information contained herein is incomplete and subject to change and it must be read in conjunction with the section headed ‘‘Warning’’on the cover of this Web Proof Information Pack.

KAZZINC LTD Competent Person’s Report for the assets held by Kazzinc Ltd in both Kazakhstan and Russia
61‐0795/MM February 2011
Draft V 0.9 Page 31
Measured ‐ ‐ ‐ ‐ ‐ ‐ ‐ ‐ ‐ ‐ ‐
Indicated 0.29 1.36 12,839 120.84 1,140,808 0.13 380 1.00 2,940 1.89 5,550
Measured + Indicated 0.29 1.36 12,839 120.84 1,140,808 0.13 380 1.00 2,940 1.89 5,550
Inferred 0.37 1.40 16,715 15.27 182,315 0.14 520 1.48 5,500 1.98 7,350
Sokolok
Total
1.7% ZnEq 01.01.2011
0.67 1.38 29,554 61.94 1,323,123 0.14 900 1.27 8,440 1.94 12,900
Measured ‐ ‐ ‐ ‐ ‐ ‐ ‐ ‐ ‐ ‐ ‐
Indicated 0.32 0.18 1,867 2.48 25,723 0.06 190 0.67 2,160 1.80 5,810
Measured + Indicated 0.32 0.18 1,867 2.48 25,723 0.06 190 0.67 2,160 1.80 5,810
Inferred 0.07 0.14 314 2.68 6,004 0.31 220 0.74 520 2.10 1,460
New Glubokaya
Total
1.7% ZnEq 01.01.2011
0.39 0.17 2,181 2.51 31,727 0.10 410 0.68 2,680 1.85 7,270
Measured ‐ ‐ ‐ ‐ ‐ ‐ ‐ ‐ ‐ ‐ ‐
Indicated ‐ ‐ ‐ ‐ ‐ ‐ ‐ ‐ ‐ ‐ ‐
Measured + Indicated ‐ ‐ ‐ ‐ ‐ ‐ ‐ ‐ ‐ ‐ ‐
Inferred 0.51 0.10 1,640 1.48 24,277 0.08 410 0.83 4,230 1.91 9,740
Glubokaya
Total
1.7% ZnEq 01.01.2011
0.51 0.10 1,640 1.48 24,277 0.08 410 0.83 4,230 1.91 9,740
Measured ‐ ‐ ‐ ‐ ‐ ‐ ‐ ‐ ‐ ‐ ‐
Indicated 3.14 0.31 31,104 3.49 352,551 0.68 21,281 0.22 6,975 2.31 72,368
Measured + Indicated 3.14 0.31 31,104 3.49 352,551 0.68 21,281 0.22 6,975 2.31 72,368
Inferred 1.16 0.18 6,855 3.18 118,984 0.51 5,958 0.40 4,620 2.07 24,083
Dalnaya
Total
1.7% ZnEq 01.01.2011
4.30 0.27 37,959 3.41 471,535 0.63 27,239 0.27 11,595 2.24 96,451
Measured 1.78 0.82 46,922 22.60 1,293,223 0.12 2,111 0.79 14,105 1.53 27,187
Indicated 0.51 0.97 15,816 21.62 352,524 0.10 509 0.67 3,397 1.29 6,523
Measured + Indicated 2.29 0.85 62,739 22.38 1,645,747 0.12 2,620 0.76 17,502 1.48 33,710
Inferred 0.33 1.00 10,567 21.10 222,961 0.14 459 0.60 1,958 1.21 3,991
Zavodskaya
Total
1.7% ZnEq 01.01.2011
2.62 0.87 73,305 22.22 1,868,709 0.12 3,079 0.74 19,460 1.44 37,701
Measured 30.21 1.11 1,076,497 11.73 11,394,749 0.64 29,475 0.40 119,385 0.91 273,897
Indicated 67.91 1.55 3,397,959 10.74 23,454,050 0.38 113,198 0.40 269,542 0.95 645,031
Measured + Indicated 98.12 1.42 4,474,456 11.05 34,848,799 0.46 142,675 0.40 388,927 0.94 918,928
Inferred 6.64 0.83 178,004 9.09 1,940,024 0.29 13,386 0.59 39,365 1.12 74,187
Ridder‐Sokolny
Mine
Total
01.01.2011
104.7
6 1.38 4,652,459 10.92 36,788,824 0.45 156,061 0.41 428,292 0.95 993,115
THIS WEB PROOF INFORMATION PACK IS IN DRAFT FORM. The information contained herein is incomplete and subject to change and it must be read in conjunction with the section headed ‘‘Warning’’on the cover of this Web Proof Information Pack.

KAZZINC LTD Competent Person’s Report for the assets held by Kazzinc Ltd in both Kazakhstan and Russia
61‐0795/MM February 2011
Draft V 0.9 Page 32
5.6 Mining 5.6.1 Introduction Ridder‐Sokolniy has a long history. The deposit was discovered in 1786, the underground operations first started in 1791. Originally there were three separate mines: ‘40 Years of VLKSM’, ‘Ridder’ and ‘Leninogorskiy’. The three mines were eventually joined together into one operation, as they needed a combined access to ore. 5.6.2 Historical Mining Approximately 181.6Mt of ore has been mined since the beginning of operations. Some historical highlights are:
• 1811 – Krukovsky deposit was discovered; • 1817 – Filippovsky deposit was discovered; • 1820 – Sokolniy deposit was discovered; • 1900 – The Austrian concession “Tury‐Taksisa” gained the deposit development rights; • 1914 – The English firm of L. Urkwart gained the deposit development rights; • 1918 ‐ The concession was terminated, mines were flooded; • 1925 ‐ Reconstruction and exploration of Ridder deposits was started; and • 1930 – Intensive development of Sokolniy deposit.
Mining operations have been conducted in the 17 major ore zones till present day. The future plans are to develop the eastern flank of the Perspektivnaya Lode at Bakhrushinsky deposit. 5.6.3 GKZ Resources and Reserves The total resources of approximately 23Mt are currently accounted for by State balance (as of 01 January 2010). A detailed resource statement, approved by GKZ (RK) is given in Table 5.18 below.
THIS WEB PROOF INFORMATION PACK IS IN DRAFT FORM. The information contained herein is incomplete and subject to change and it must be read in conjunction with the section headed ‘‘Warning’’on the cover of this Web Proof Information Pack.

KAZZINC LTD Competent Person’s Report for the assets held by Kazzinc Ltd in both Kazakhstan and Russia
61‐0795/MM February 2011
Draft V 0.9 Page 33
Table 5.18: Ridder Sokolniy GKZ‐Approved Resources & Reserves as of 01.01.2010
Category On‐Balance Off‐Balance Gold‐Polymetalic Resources B 3,643.3 603.0 6,338.9 353.3 C1 19,339.6 15,513.7 24,704.4 11,081.1
1.35 В+С1 22,982.9 16,116.7 31,043.3 11,434.4
0.62 С2 20,729.1 11,645.4 12,837.4 12,533.4 Inclusive of Undeveloped Resources В ‐ ‐ С1 4,007.6 938.2
0.25 997.0 222.3 В+С1 4,007.6 938.2
0.28 997.0 222.3 С2 15,650.3 8,661.3 4,334.9 10,290.4 Inclusive of Developed Resources В 3,643.3 603.0 6,338.9 353.3 С1 15,332.0 14,575.5
1.58 23,707.4 10,858.8 В+С1 18,975.3 15,178.5
1.67 30,046.3 11,212.1 С2 5,078.8 2,984.1 8,502.5 2,243.0 Included into Developed Resources: Cu ore В 328.4 34.4 1,172.9 27.0 С1 3,143.8 1,486.0
1.14 2,786.1 618.8 В+С1 3,472.2 1,520.4
0.94 3,959.0 645.8 С2 478.2 255.7 447.3 106.1 Included into Developed Resources: Pb‐Zn ore В 3,314.9 568.6 5,166.0 326.3 С1 12,188.2 13,089.5
1.68 20,921.3 10,240.0 В+С1 15,503.1 13,658.1
1.75 26,087.3 10,566.3 С2 4,600.6 2,728.4 8,055.2 2,136.9
Historically, the mine has increased its resources by the same amount as mined by exploring adjacent areas. This programme remains in place, but the resource grade is progressively lower because the resource increase is less than material mined. 5.6.4 Mine Design and Current Mining Activities Originally, the operations were worked as three separate units. The mine has an extensively developed underground infrastructure. Mining activities take place on 11 haulage levels and in 11 different ore zones, which are accessed by 12 shafts (10 in operation), to a maximum depth of 460m, hoisting ore and waste, men and materials. The main hoisting shafts are Skipovaya (for Pb‐Zn ore) and Novaya (for Cu ore and development waste). The Skipovaya shaft is equipped with two 7.5m3 skips, which can be loaded from 11, 13 and 16 levels with a
THIS WEB PROOF INFORMATION PACK IS IN DRAFT FORM. The information contained herein is incomplete and subject to change and it must be read in conjunction with the section headed ‘‘Warning’’on the cover of this Web Proof Information Pack.

KAZZINC LTD Competent Person’s Report for the assets held by Kazzinc Ltd in both Kazakhstan and Russia
61‐0795/MM February 2011
Draft V 0.9 Page 34
maximum weight capacity of 13,300kg. The Novaya shaft has two 4.5m3 skips, which has loading facilities on the same levels. Bystrushinskaya, Novaya and Andreevskaya are shafts used for men hoisting. A long section showing the mined out areas (hatched), shafts and ore zones (differentiated by colour) is given in Figure 5.10 below.
THIS WEB PROOF INFORMATION PACK IS IN DRAFT FORM. The information contained herein is incomplete and subject to change and it must be read in conjunction with the section headed ‘‘Warning’’on the cover of this Web Proof Information Pack.
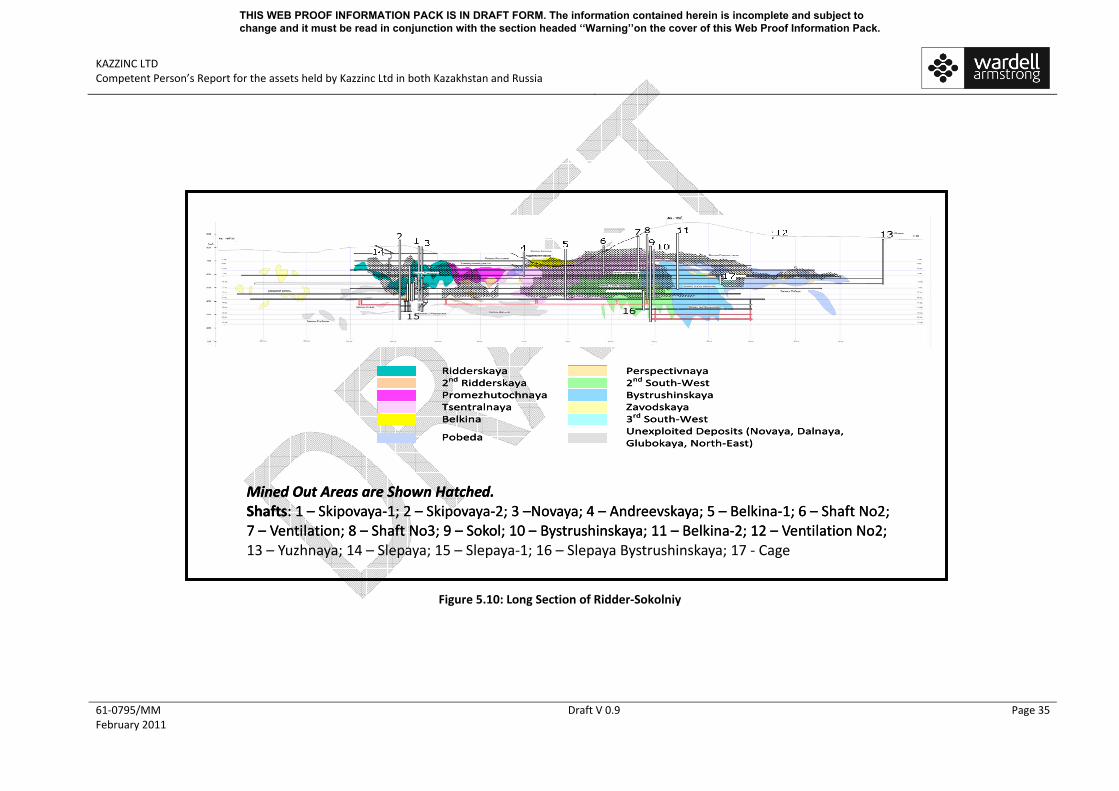
KAZZINC LTD Competent Person’s Report for the assets held by Kazzinc Ltd in both Kazakhstan and Russia
61‐0795/MM February 2011
Draft V 0.9 Page 35
Figure 5.10: Long Section of Ridder‐Sokolniy
Ridderskaya Perspectivnaya 2nd Ridderskaya 2nd South‐West Promezhutochnaya Bystrushinskaya Tsentralnaya Zavodskaya Belkina 3rd South‐West
Pobeda Unexploited Deposits (Novaya, Dalnaya, Glubokaya, North‐East)
Mined Out Areas are Shown Hatched. Shafts: 1 – Skipovaya‐1; 2 – Skipovaya‐2; 3 –Novaya; 4 – Andreevskaya; 5 – Belkina‐1; 6 – Shaft No2; 7 – Ventilation; 8 – Shaft No3; 9 – Sokol; 10 – Bystrushinskaya; 11 – Belkina‐2; 12 – Ventilation No2; 13 – Yuzhnaya; 14 – Slepaya; 15 – Slepaya‐1; 16 – Slepaya Bystrushinskaya; 17 ‐ Cage
Ridderskaya Perspectivnaya 2nd Ridderskaya 2nd South‐West Promezhutochnaya Bystrushinskaya Tsentralnaya Zavodskaya Belkina 3rd South‐West
Pobeda Unexploited Deposits (Novaya, Dalnaya, Glubokaya, North‐East)
Mined Out Areas are Shown Hatched. Shafts: 1 – Skipovaya‐1; 2 – Skipovaya‐2; 3 –Novaya; 4 – Andreevskaya; 5 – Belkina‐1; 6 – Shaft No2; 7 – Ventilation; 8 – Shaft No3; 9 – Sokol; 10 – Bystrushinskaya; 11 – Belkina‐2; 12 – Ventilation No2;
THIS WEB PROOF INFORMATION PACK IS IN DRAFT FORM. The information contained herein is incomplete and subject to change and it must be read in conjunction with the section headed ‘‘Warning’’on the cover of this Web Proof Information Pack.

KAZZINC LTD Competent Person’s Report for the assets held by Kazzinc Ltd in both Kazakhstan and Russia
61‐0795/MM February 2011
Draft V 0.9 Page 36
Figure 5.10 also show the future development in red. This development work targets to access levels 18‐20. A detailed design for mining of the bottom levels is now being undertaken. Some preliminary assessment has shown that a conveyor decline, delivering ore to main haulage level 16 provides better economics in comparison to trackless haulage. The conveyor option is considered as preferred. Currently, main mining activities are concentrated on levels 11 to 16, with 16 level being the major production haulage level. Approximately 70% of the ore is hoisted from 16 level; 20% from 11 level; the remaining 10% from 13 level. The main mining area is currently focused on 14 and 15 levels. 5.6.5 Mining Schedule The mine schedule is based on short term (monthly, annually), medium term (3 years) and long term mine planning (up until year 2035). WAI has been provided and reviewed both short and long term schedules, highlighting areas where future production is going to take place. The annual production schedule is designed at the end of each year and highlights exactly which blocks are to be mined and the amount of ore expected from these blocks together with metal grades. The mining schedule also contains information on development and stope preparation requirements for the year. WAI has reviewed the mining schedule for 2011 which is summarised in Table 5.19 below.
THIS WEB PROOF INFORMATION PACK IS IN DRAFT FORM. The information contained herein is incomplete and subject to change and it must be read in conjunction with the section headed ‘‘Warning’’on the cover of this Web Proof Information Pack.

KAZZINC LTD Competent Person’s Report for the assets held by Kazzinc Ltd in both Kazakhstan and Russia
61‐0795/MM February 2011
Draft V 0.9 Page 37
Table 5.19: Summary Mine Schedule for 2011 Subcontractors
Deposit Ore Mining Method* (% of total ore)
Stope Access Works
Stope Preparation
Works Exploration
Blasthole Drilling
Stope Access Works
Stope Preparation
Works (kt) S1 B S2 m m3 m m3 m m3 m m m3 m m3
Tsentralnaya 160 53 47 810 4,900 1,200 7,200 75,080 125 500 675 3,700 Ridder 96 100 125 500 630 4,380 ‐ ‐ 21,100 Pobeda 378 100 1,240 8,260 2,000 13,780 600 2,400 62,500 1,455 7,310 1,720 9,100 Belkina 76 58 42 125 500 580 4,100 ‐ ‐ 11,000 ‐ ‐ ‐ ‐
Perspectivnaya 102 100 325 1,600 930 5,900 150 600 18,500 50 300 315 1,200 2ndSouth‐West 254 58 32 9 2,975 16,900 5,350 34,600 385 1,540 87,000 1,150 4,700 1,500 6,790 3rdSouth‐West 127 100 770 4,750 1,710 14,600 705 2,820 41,800 Bystrushinskaya 821 100 4,780 44,410 6,650 59,320 3,660 14,640 80,090
TOTAL 2,125 44 53 3 11,150 81,820 19,050 143,880 5,500 22,000 397,070 2,780 12,810 4,210 20,790
THIS WEB PROOF INFORMATION PACK IS IN DRAFT FORM. The information contained herein is incomplete and subject to change and it must be read in conjunction with the section headed ‘‘Warning’’on the cover of this Web Proof Information Pack.

KAZZINC LTD Competent Person’s Report for the assets held by Kazzinc Ltd in both Kazakhstan and Russia
61‐0795/MM February 2011
Draft V 0.9 Page 38
The schedule indicates that 53% of the ore will be mined using sublevel open stoping with backfill). A description of the employed mining methods is given below. The long‐term mining plan has been designed to 2035 due to the active exploration programmes in place, this will be subject to further changes and therefore not considered within this report. 5.6.6 Mining Methods Most of the production is performed using hand‐held production equipment and scrapers. The main haulage equipment is tracked transport. Trackless methods have been recently introduced, and are focused in the Pobeda ore zone which contains high‐grade thin veined gold zones in the southern part of the mine. It is the company plan to implement 30% trackless mining machinery (especially in development and haulage) in 2011 and to increase trackless machinery utilisation to 50% of overall production by 2013. 5.6.6.1 Sublevel Open Stoping The majority of the ore is extracted using the Sub‐Level Open Stoping (SLOS) method or Open Stoping method, which are relatively similar. Figure 5.11 below illustrates SLOS system and Figure 5.12 shows a section through the main haulage drive. SLOS is used in steeply dipping orebodies of more than 50° and where the thickness varies from 3‐15m. Ore in the blocks have a medium to high grade. The average block parameters are as follows:
• Length – 50m; • Width – defined by orebody thickness; 6.1 on average; and • Height – 40m.
Open stoping is used for thicker orebodies, where average thickness reaches 12.4m.
Figure 5.11: Sub‐Level Open Stoping: 3D Image
THIS WEB PROOF INFORMATION PACK IS IN DRAFT FORM. The information contained herein is incomplete and subject to change and it must be read in conjunction with the section headed ‘‘Warning’’on the cover of this Web Proof Information Pack.

KAZZINC LTD Competent Person’s Report for the assets held by Kazzinc Ltd in both Kazakhstan and Russia
61‐0795/MM February 2011
Draft V 0.9 Page 39
Figure 5.12: Section of a Sub‐Level Open Stoping Block
The stopes are split into two sublevels, each of them having a haulage drive and access crosscut. There is also a scraping drift located adjacent to the footwall, ventilation and ladderway raises, and orepasses arranged at each sub‐level. Blasthole fans are drilled from a dedicated drift. After blasting, ore is gravity fed into chutes which have been installed along the length of the orebody. A longitudinal retreat method of extraction is used. The top sublevels are extracted 10‐15m in advance of the bottom sublevels. Blasthole fans are charged and fired after all of the ore from previous cycle has been mucked. Kazzincmash drill rigs LPS‐3U are used for the blastholes and they are charged using a ZP‐12 pneumatic charger. Ore is mucked by 55kW scrapers 55LS‐2SM. After a stope has been mined, temporary pillars are removed and the stope is left unfilled. This leads to caving of rock above the stope into it, caving in many cases accretes to surface. Prior to mining, any area, potentially affected by caving, is thoroughly assessed and checked for the presence of buildings or constructions and appropriate safety pillars are designed. 5.6.6.2 Sublevel Open Stoping with Backfill The method is similar to SLOS as shown Figure 5.13 below, but uses backfill. The ore is mined in same manner as in the SLOS method, except that an additional drive is developed for backfilling purposes, or the exhausted stope is backfilled via a borehole. Temporarily pillars are left between sections of stope, and removed after the backfill has set.
THIS WEB PROOF INFORMATION PACK IS IN DRAFT FORM. The information contained herein is incomplete and subject to change and it must be read in conjunction with the section headed ‘‘Warning’’on the cover of this Web Proof Information Pack.

KAZZINC LTD Competent Person’s Report for the assets held by Kazzinc Ltd in both Kazakhstan and Russia
61‐0795/MM February 2011
Draft V 0.9 Page 40
Figure 5.13: Sublevel Open Stoping with Backfill
The hardness and stability of the backfill is monitored and controlled via boreholes. The backfill is used in areas of the mine where the caving of empty stopes is dangerous or could potentially damage buildings on surface. Backfill is also used where there is potential for a slide or collapse contour reaching the shaft protection pillars. 5.6.6.3 Shrinkage Stoping Shrinkage stoping is applied in thin steeply dipping ore bodies with a thickness varying from 0.2‐1.5m, in medium to stable rock. This method uses the broken ore as a platform for drilling the next lift and installing ground support. After blasting, ore is taken from the stopes until there is sufficient space to drill the next lift. The ore is fed into rail wagons from chutes and draw points. The miners access the faces via timber ladder‐ways which are surrounded by crushed rock but kept open whilst the stope is in production. As well as drilling and blasting, the miners conduct ground support by installing rock bolts. Shrinkage stoping is used for extracting approximately 3‐5% of overall tonnage. Typical shrinkage stope parameters are as follows:
• Length – 50m; • Width – defined by orebody thickness; • Height – 40m.
5.6.6.4 Unmechanised Sublevel Stoping This method is similar to shrinkage stoping and is applied in thin (0.2‐1.5m) steeply dipping ore bodies in medium to stable rock. The difference with shrinkage stoping is that this method allows for an increased production rate by developing several faces simultaneously and the lag time between ore being blast and that ore being hauled to the shaft is minimal. The other difference is this method requires more development as shown in Figure 5.14 below.
THIS WEB PROOF INFORMATION PACK IS IN DRAFT FORM. The information contained herein is incomplete and subject to change and it must be read in conjunction with the section headed ‘‘Warning’’on the cover of this Web Proof Information Pack.

KAZZINC LTD Competent Person’s Report for the assets held by Kazzinc Ltd in both Kazakhstan and Russia
61‐0795/MM February 2011
Draft V 0.9 Page 41
Figure 5.14: Unmechanised Sublevel Stoping
This method is rarely used, as the majority of orebodies could be mined employing more productive and less labour‐intensive methods. The typical stope parameters are as follows:
• Length – 50m; • Width – defined by orebody thickness; • Height – 40m.
WAI Comment: The increase of trackless equipment on the mine will improve the development advance rate and open up access to multiple orebodies quicker. As the number of large orebodies suitable to bulk mining is decreasing; the trackless mining methods will ensure that the target production rate is still met.
5.6.7 Block Grade Evaluation The mining stopes are designed once the mineralised cut‐off grade of the orebody has been outlined. Usually more than one option is considered in terms of ore block access and extraction. All options considered are compared by the amount of preparation required, estimated losses and dilution, final metal content, and proposed value of extracted metals. As a result every mining block is assigned its Net Smelter Return (NSR) value and all the values are compared. At the time of the WAI visit, the cut‐off NSR was US$36/t. The NSR value is dependent upon market prices for metals and other external factors. The actual block NSR value is monitored during mining, and if it is below the set limit for current month, some measures are put in place.
WAI Comment: It is an advantage of the mine that ore tonnages and grades can be tracked for every minimal mining unit using weighing and sampling system of every loaded wagon. Evaluation of block NSR is a good practice, which improves efficiency of mining, and which is not common in former Soviet Union countries.
5.6.8 Rock Properties and Geotechnical Conditions The rock properties are generally medium stable and medium hard. The hardness factor varies from 6 to 14 for ores and 9 to 13 for barren rock. The drillability factor is in a region of 15. Loosening coefficient is normally from 1.24 to 1.88 with average of 1.56 (used in calculations). Average density 2.8t/m3 for ore; 2.7t/m3 for waste. Ore is hazardous in terms of silicosis possibility. 5.6.9 Drilling and Blasting Most of the production blastholes are drilled using LPS‐3U pneumatic drillrigs, as shown in Photo 5.1 below, produced locally by Kazzincmash in Ridder town. The blasthole sizes are either 110mm or 130mm in diameter
THIS WEB PROOF INFORMATION PACK IS IN DRAFT FORM. The information contained herein is incomplete and subject to change and it must be read in conjunction with the section headed ‘‘Warning’’on the cover of this Web Proof Information Pack.

KAZZINC LTD Competent Person’s Report for the assets held by Kazzinc Ltd in both Kazakhstan and Russia
61‐0795/MM February 2011
Draft V 0.9 Page 42
depending on the rock properties. There is a tendency to use 110mm diameter, as it helps to reduce dilution, although requires higher density of the blasthole grid. The mining of the Pobeda deposit will be with trackless equipment in both development and production. Atlas Copco Rocket Boomer 104 and Boomer 282 jumbos will be used for the mine development.
Photo 5.1: LPS‐3U Pneumatic Drillrig in Operation
Both electric and non‐electric initiation systems are used in development blasting. Detonating cords are used to initiate production blasts in the stope. Electric blasting is used in vertical raises and a combination of electric and non‐electric initiation is used in mass blasts. The high explosives are mainly granulated explosives, Granulit‐A6, Granulit‐AS8 and Igdanit, to maintain ore fragmentation. Packaged Ammonit‐6ZhV in 90mm diameter cartridges are used for wet blast holes and Ammonal‐200 in 32mm diameter cartridges are used as a booster. 5.6.10 Losses and Dilution Mining activities take place on a large number of ore bodies which exhibit considerable variation in both morphology and grade, therefore the dilution and loss parameters are variable. The difference can also explained by the large number of ore bodies which are mined at a time. The monthly production reports containing the detailed data on actual dilution and losses were provided to WAI at the site. The monthly results show that expected losses are 3‐6% for sub‐level stoping; 3‐8% for backfilled methods, 25‐35% for sub‐level open stoping and 20‐40% for backfilled stopes. 5.6.11 Ore and Waste Transportation Ore and waste is drawn from chutes and other drawpoints into rail wagons and transported by K‐10, K‐14 and EL 5/04 electric locomotives to the shaft. Each locomotive is capable of towing up to 11 wagons. The capacity of the wagons is 0.8, 2.2, 2.5 and 4.5m3 depending on the level where it is operated. The wagons are discharged by rotary wagon tippers OK‐2.8‐2.96, OKE‐4‐410 or by wagon pushers installed at the shaft stations. The average tramming distance on the 11, 13 and 16 haulage levels is normally around 10km, and an example for 16 level is shown in Figure 5.15 below, and the standard locomotive travel speed is 7‐12km/h.
THIS WEB PROOF INFORMATION PACK IS IN DRAFT FORM. The information contained herein is incomplete and subject to change and it must be read in conjunction with the section headed ‘‘Warning’’on the cover of this Web Proof Information Pack.

KAZZINC LTD Competent Person’s Report for the assets held by Kazzinc Ltd in both Kazakhstan and Russia
61‐0795/MM February 2011
Draft V 0.9 Page 43
Ore and waste from 18 level is hoisted in 2.2m3 wagons to 15 level at Slepaya‐Bistrushinskaya Shaft. From 15 level, it is moved to the main haulage level on 16 level and then delivered to skips at shafts Skipovaya (Pb‐Zn ore) and Novaya (Cu ore and waste).
Figure 5.15: Plan of Horizon 16
5.6.12 Hoisting Facilities Skipovaya shaft is equipped with a 2C‐5x2.3 winder (drum diameter 5m, width 2.3m) which is used for (on levels 13 and 16) Pb‐Zn ore hoisting (7.5m3 skips). Novaya shaft has two winders, skip type and cage type. The skip hoisting is operating with 4.8m3 skips hoisting Cu ore from level 16. Cage hoisting is performed by a CR5‐3.0/0.6 winder working with double deck cage and counter weight. Andreyevskaya Shaft is used for man riding to 11 level and is equipped with a CR‐2.2AR cage type winder. Bystrushinskaya shaft is equipped with a ShPM2x4x1.7 winder operating with a double decked cage and counterweight.
THIS WEB PROOF INFORMATION PACK IS IN DRAFT FORM. The information contained herein is incomplete and subject to change and it must be read in conjunction with the section headed ‘‘Warning’’on the cover of this Web Proof Information Pack.

KAZZINC LTD Competent Person’s Report for the assets held by Kazzinc Ltd in both Kazakhstan and Russia
61‐0795/MM February 2011
Draft V 0.9 Page 44
Belkina‐2 Shaft is used as an emergency egress for the miners, employing a 2BM‐3000/1520 winder and cage. Slepaya‐Bystrushinskaya shaft is equipped with a 2x3x1.5 U4P single cage winder. This shaft is used for hoisting men, materials and equipment and ore from 17 and 18 levels to 15 level. 5.7 Dewatering System There are 4 major pumping stations at Ridder‐Sokolniy mine, located on 11, 13, 16 and 18 levels as shown in Figure 5.16 below. Each station works has two pipelines, one operational and another is a reserve. All of the pipelines are installed within Novaya shaft.
Figure 5.16: Dewatering Scheme (planned layout changes are shown in red)
Water from the lower levels is collected in the sumps on 18 level and then pumped, via 100mm diameter pipes installed in boreholes, to the next pumping station located at the 16 level sumps. Detailed data on pumping facilities is given in Table 5.20 below. From level 16, water is pumped to the adit level via a 400mm diameter pipe which is then used at the ore treatment facilities. After the water is cleaned, it is discharged into Philippovka River. The pumping station on the 13 level works in line with the same treatment facilities. Water from the 11 level sumps is discharged to Phillipovka River via the Mednaya adit without treatment.
THIS WEB PROOF INFORMATION PACK IS IN DRAFT FORM. The information contained herein is incomplete and subject to change and it must be read in conjunction with the section headed ‘‘Warning’’on the cover of this Web Proof Information Pack.

KAZZINC LTD Competent Person’s Report for the assets held by Kazzinc Ltd in both Kazakhstan and Russia
61‐0795/MM February 2011
Draft V 0.9 Page 45
Table 5.20: Major Dewatering Facilities
Unit Adit Station 11 Horizon Station 13 Horizon Station 16 Horizon Station 18 Horizon Station m3/h 1280 734 660 620 102 pcs 1 3 3 2 2 m3 1600 6 200 6 200 3 700 1830 1D1250/125 TsN 1000/180 14M12‐4 14M8‐4 TsNS180/170 m3/h 1250 1000 900 600 180 m 125 180 310 380 170 pcs 3 5 5 5 3 pcs 1 2 2 2 1 pcs 1 2 2 2 1 pcs 1 1 1 1 1
The mine is intending to upgrade the dewatering scheme by installing new pumps on 13 level and removing the existing 11 level pumping station. Boreholes will be used to move water from the 11 level pumping station to 13 level, where higher capacity pumps will be installed in order to deal with the increase water quantities. 5.7.1 Ventilation Fresh air is supplied to the workings from Novaya, Skipovaya‐2, Andreyevskaya, Belkina‐1, Bystrushinskaya, Slepaya‐Bystrushinskaya, Sokolok and Yuzhnaya shafts. Foul air is discharged via Ventilation, Shaft No.3, Belkina‐2 and Severniy shafts by means of exhaust ventilation fans. In order to minimise ventilation requirements, mined out areas, and collapsed areas connected to surface are barricaded off by concrete and timber constructions. A long section illustrating the ventilation scheme is shown in Figure 5.17 below.
Figure 5.17: Ventilation Scheme
There are a number of ventilation fans installed both on surface and underground. The surface ventilation fans are installed as follows: GVhV‐ 40 – 2200 at Ventilation Shaft, reversible by system of by‐passes; VUPD‐2.8 – Shaft No.3, reversible by changing rotation direction of the engine; VUPD‐2.8 – Shaft Belkina‐2, reversible by changing rotation direction of the engine; VOKD‐1.8 – installed in ventilation raise, not used in reverse mode; VOD‐30 – Shaft Andreevskaya, not used in reverse mode; The main underground fans are installed as follows: VOD‐21 – on level 14 of 2‐South‐West ore zone, reversible by changing rotation direction of the engine which should be performed together with reverse of GVhV ‐ 40 ‐ 2200;
THIS WEB PROOF INFORMATION PACK IS IN DRAFT FORM. The information contained herein is incomplete and subject to change and it must be read in conjunction with the section headed ‘‘Warning’’on the cover of this Web Proof Information Pack.

KAZZINC LTD Competent Person’s Report for the assets held by Kazzinc Ltd in both Kazakhstan and Russia
61‐0795/MM February 2011
Draft V 0.9 Page 46
VOD‐21 – on level 16 of 2‐South‐West ore zone, not used in reverse mode; VOD‐21 – on level 11 of Bystrushinskaya ore zone; reversible by changing rotation direction of the engine which should be performed together with the reverse of GVhV ‐ 40 ‐ 2200; VM‐12 – Yuzhnaya shaft, level 14 of Pobeda ore zone, not used in reverse mode; An additional fan is expected to be installed at surface on Belkina‐2 shaft by the end of 2010. Local mobile ventilation fans are also located in the workings to supply fresh air to underground sites. Types and quantities of the fans are specified below. VME‐5 – 17 units; VME‐6 – 58 units; Korfman ESN9‐450 – 5 units.
WAI Comment: It was noticed by WAI during the underground visit that the ventilation was operating efficiently, providing a good quantity of air to the remote locations of the mine as required.
5.7.2 Mine Personnel The total number of people employed by Kazzinc at Ridder‐Sokolniy is approximately 1,600, with a further 700 contractors. The mine has a developed structure of departments, each of the departments has specific designated areas and scope of works. A list of departments, together with the number of staff employed is given in Table 5.21 below.
Table 5.21: Kazzinc Personnel Administration 9 Health and Safety Service 9 Dispatcher department 8 Production management 2 Surveyor Department 23 Geology Department 24 Mine Design and Planning Department 8
Underground Mining Brigade No1 97 Underground Mining Brigade No2 98 Underground Mining Brigade No3 91 Underground Mining Brigade No4 69 Underground Mining Brigade No5 50 Underground Development Works Brigade No14 52 Underground Development Works Brigade No15 64 Underground Development Works Brigade No17 89 Underground Development Works Brigade No18 113 Underground Drilling Works Brigade No6 80 Underground Exploration Works Brigade No11 58 Underground Blasting Works Brigade No7 73 Underground Transportation Brigade No8 235 Underground Materials Supply Brigade No12 64 Underground Installations Maintenance Brigade No9 175 Underground Ventilation Brigade 37 Underground Backfill Brigade No10 52 Total for the mine 1,580
THIS WEB PROOF INFORMATION PACK IS IN DRAFT FORM. The information contained herein is incomplete and subject to change and it must be read in conjunction with the section headed ‘‘Warning’’on the cover of this Web Proof Information Pack.

KAZZINC LTD Competent Person’s Report for the assets held by Kazzinc Ltd in both Kazakhstan and Russia
61‐0795/MM February 2011
Draft V 0.9 Page 47
It was noticed by WAI on the site visit that the mine has high standards of health and safety in place, particularly the use of PPE and minimising risks in underground environs, as well as paying a lot of attention to social aspects. Sports and recreational facilities, medical services are available to employees and their families.
WAI Comment: WAI considers that there are no major employment issues for the mine. The mine is located in close proximity to a town with a population of approximately 60,000 people. Historically mining has been one of the main business activities in the area, and WAI understands that there is a large number qualified personnel available in Ust‐Kamenogorsk (located approximately 80km north‐west from Ridder.
5.7.3 Future Mine Development Most of the mine development work will be centered at the Bystrushinskaya and Pobeda areas next year. It is proposed to develop levels here below 16 level using trackless equipment. There are plans to develop a 2,225m decline from 13 to 20 level in the north‐west part of the mine, accessing the south flank of the Bystrushinskaya deposit. This decline will be connected with a 980m conveyor, with a 10� inclination, running from 16 to 20 level. The conveyor will move ore from the bottom levels to the main haulage on 16 level. Exploration is currently taking place on the flanks of the ore zones and it is anticipated that these new resources will be incorporated into future production plans. 5.7.4 Conclusions Ridder‐Sokolniy mine is an operation with a long history and an expected long mine life. The developed reserves and exploration will ensure the availability of a reserve up 2030 and beyond. The mine is operated to a high standard both in management and actual mining activities. The employment of qualified and skilled personnel provides a stable workforce and assists in meeting the desired production rate. The existing underground infrastructure has some spare capacity to take up the planned increase in production rate. Despite most of mining requiring backfill and employing manual mining methods, reasonable mining costs have been achieved. This has also been helped by the availability of company owned machinery manufacturing facilities for locomotives, wagons and drill rigs and the availability of power. 5.8 Process 5.8.1 Introduction The Ridder Mining and Metallurgical Complex (RMCC) which is owned and operated by Kazzinc is situated approximately 120km due east of Ust‐Kamenogorsk in the north eastern region of Kazakhstan. Various sulphide and precious metal bearing ores are mined in the Ridder area and processed in the nearby metallurgical facilities. Zinc ore from Kazzinc’s Shaimerden mining operation 200km south west of the city of Kostanay is also transported to Ridder for processing. The ores that are processed at Ridder are produced from the following mine resources:
• Ridder‐Sokolniy mine; • Tishinskiy mine; • Shubinskiy mine; • Staroye tailings dam sands; • Aged slimes from crushing; • Fresh slimes from crushing; and • Shaimerden zinc oxide and other oxide ores.
All but the zinc oxide ores are initially sent for crushing at one of three crushing facilities. The Shaimerden ore is transported by rail directly to the zinc smelter. Of the ores sent for crushing one ore type, a high gold grading
THIS WEB PROOF INFORMATION PACK IS IN DRAFT FORM. The information contained herein is incomplete and subject to change and it must be read in conjunction with the section headed ‘‘Warning’’on the cover of this Web Proof Information Pack.
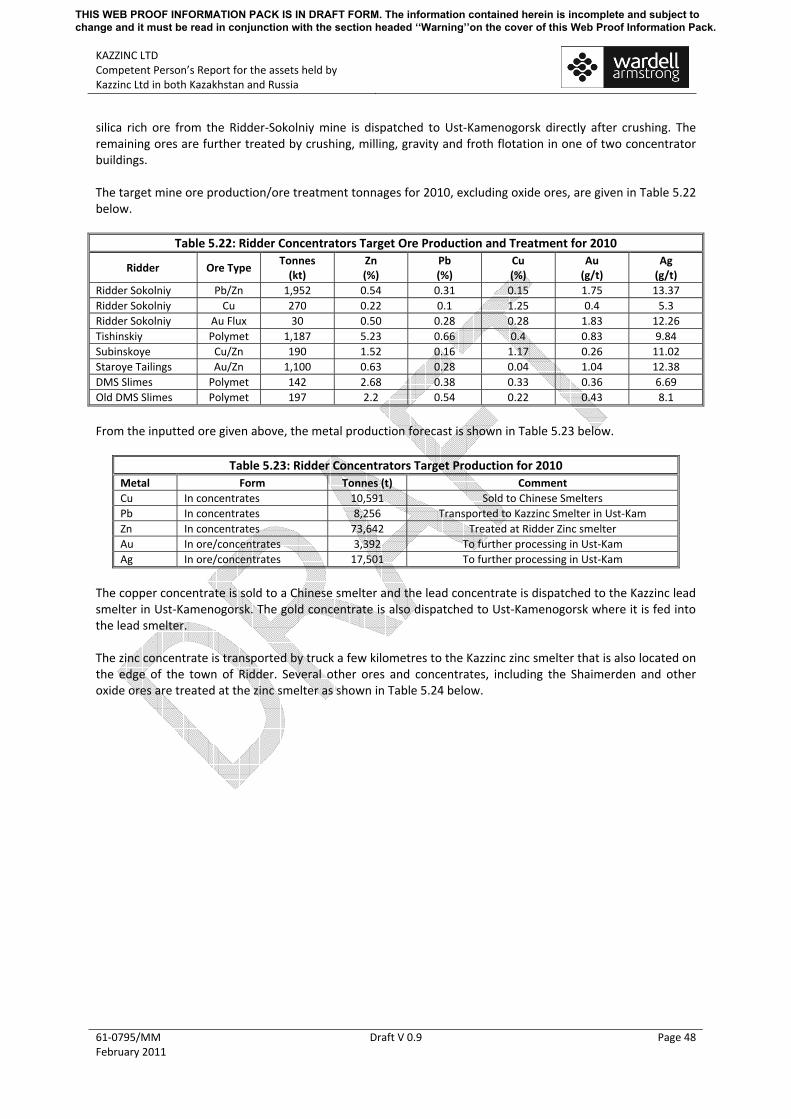
KAZZINC LTD Competent Person’s Report for the assets held by Kazzinc Ltd in both Kazakhstan and Russia
61‐0795/MM February 2011
Draft V 0.9 Page 48
silica rich ore from the Ridder‐Sokolniy mine is dispatched to Ust‐Kamenogorsk directly after crushing. The remaining ores are further treated by crushing, milling, gravity and froth flotation in one of two concentrator buildings. The target mine ore production/ore treatment tonnages for 2010, excluding oxide ores, are given in Table 5.22 below.
Table 5.22: Ridder Concentrators Target Ore Production and Treatment for 2010
Ridder Ore Type Tonnes (kt)
Zn (%)
Pb (%)
Cu (%)
Au (g/t)
Ag (g/t)
Ridder Sokolniy Pb/Zn 1,952 0.54 0.31 0.15 1.75 13.37 Ridder Sokolniy Cu 270 0.22 0.1 1.25 0.4 5.3 Ridder Sokolniy Au Flux 30 0.50 0.28 0.28 1.83 12.26 Tishinskiy Polymet 1,187 5.23 0.66 0.4 0.83 9.84 Subinskoye Cu/Zn 190 1.52 0.16 1.17 0.26 11.02 Staroye Tailings Au/Zn 1,100 0.63 0.28 0.04 1.04 12.38 DMS Slimes Polymet 142 2.68 0.38 0.33 0.36 6.69 Old DMS Slimes Polymet 197 2.2 0.54 0.22 0.43 8.1
From the inputted ore given above, the metal production forecast is shown in Table 5.23 below.
Table 5.23: Ridder Concentrators Target Production for 2010 Metal Form Tonnes (t) Comment Cu In concentrates 10,591 Sold to Chinese Smelters Pb In concentrates 8,256 Transported to Kazzinc Smelter in Ust‐Kam Zn In concentrates 73,642 Treated at Ridder Zinc smelter Au In ore/concentrates 3,392 To further processing in Ust‐Kam Ag In ore/concentrates 17,501 To further processing in Ust‐Kam
The copper concentrate is sold to a Chinese smelter and the lead concentrate is dispatched to the Kazzinc lead smelter in Ust‐Kamenogorsk. The gold concentrate is also dispatched to Ust‐Kamenogorsk where it is fed into the lead smelter. The zinc concentrate is transported by truck a few kilometres to the Kazzinc zinc smelter that is also located on the edge of the town of Ridder. Several other ores and concentrates, including the Shaimerden and other oxide ores are treated at the zinc smelter as shown in Table 5.24 below.
THIS WEB PROOF INFORMATION PACK IS IN DRAFT FORM. The information contained herein is incomplete and subject to change and it must be read in conjunction with the section headed ‘‘Warning’’on the cover of this Web Proof Information Pack.

KAZZINC LTD Competent Person’s Report for the assets held by Kazzinc Ltd in both Kazakhstan and Russia
61‐0795/MM February 2011
Draft V 0.9 Page 49
Table 5.24: Feed to Ridder Zinc Smelter (2010) Tonnes Ore/Concentrate Tonnes Zn
Source Planned 2010
Actual 2010
Planned 2010
Actual 2010
Combined Zn Concentrate, Ridder Concentrator 137,066 132,348 73,643 69,133 Zyryanovsk Concentrate 0 8,480 0 4,703 Akzhalskiy Concentrate 0 0 0 0 Artemievskiy Concentrate 8,641 15,761 4,407 8,093 Zheskentskiy Concentrate 10,121 2,278 4,549 1,051 Ust‐Talovskiy Concentrate 1,421 8,554 537 3,608 Berezovskiy Concentrate 5,364 2,733 2,361 1,211 Karagailinskiy Concentrate 8,548 4,409 2,821 1,782 Belousovskiy Concentrate 9,564 4,382 3,826 1,620 Balquash Concentrate (Cu‐Cd) 4,200 3,638 1,962 1,674 Shaimerden Ore 225,719 235,746 47,401 48,726 Zn cake ex Ust‐Kam Metal Complex 0 4,202 0 841 Iron Concentrate 16,370 7,188 Zinc cake ex Ridder zinc plant 54,230 80,138 11,774 17,480 Zn white bleach 0 0 0 0 Slimes from Purification Facilities 0 0 0 0 Slimes from Ust‐Kam 0 0 0 0
There are two types of smelting operation in the zinc smelter. There are Waelz kilns for treating the oxide ores that produce a precipitated zinc oxide fume product, and there are fluidised bed roasters that treat the zinc sulphides and produce a zinc calcine. Both products are then acid leached using acid made from the roaster off‐gas in the on‐site acid plant to produce a zinc‐rich solution. This solution is purified and electro‐won to produce the final zinc metal product. Cadmium and excess acid are also produced in this facility along with several other minor by‐products. Table 5.25 below shows the planned smelter production for 2010.
Table 5.25: Ridder Zinc Smelter Target Production for 2010 Metal Form Tonnes (t) Comment Cu In Cu cake 878 To Zyrianovskiy plant for further processing Pb In by product 1,747 Transported to Kazzinc Smelter in Ust‐Kam Zn Metal 110,829 Sold to final customer Au In by product 0.0285 To further processing in Ust‐Kam Ag In by product 1.80 To further processing in Ust‐Kam Cd Metal 378 Sold to final customer
H2SO4 93 ‐ 95% concentrate 146,464 Sold to final customer
5.8.2 Services Power to the Ridder mines and ore processing facilities is supplied by overhead power cables from the Bukhtarminskoya Hydro‐power station some 140km away to the west. The whole site consumes 519,026MW per annum. 5.8.2.1 Industrial Water Supply Two systems are applied for industrial water supply to RMCC facilities:
• The fresh industrial water pipeline with water intake from surface sources; and • The process water circulation system of the Concentrator.
The sources of the industrial water circulation system are as follows:
• Verkhne‐Khariuzovskiy water dam. Water from the Gromotukha River flows by gravity through a reinforced concrete flume to the “zero chamber” and from there goes through two
THIS WEB PROOF INFORMATION PACK IS IN DRAFT FORM. The information contained herein is incomplete and subject to change and it must be read in conjunction with the section headed ‘‘Warning’’on the cover of this Web Proof Information Pack.

KAZZINC LTD Competent Person’s Report for the assets held by Kazzinc Ltd in both Kazakhstan and Russia
61‐0795/MM February 2011
Draft V 0.9 Page 50
water pipes to a 1,000m3 distribution tank and further on flows by gravity through two 1,000mm water pipes to the RMCC industrial water supply system; and
• Bystrushinskiy water dam. Water from this dam goes through a 900mm pipeline to the general production water supply system. (This water dam is a backup dam that is to be used in case of a shortage of water from the Verkhne‐Khariuzovskiy dam. The annual water consumption from these facilities is 153Mm3.
Concentrator Process Water Circulation System This system is intended for water supply for crushing and processing and it operates as follows. Slurry with a solid content of 6 to 11%, and рН = 8.8 is pumped sequentially by pumping stations Nos.1, 2 and 5 from the concentrator to the Talovskoye tailings dam where the first settling stage is performed. The settled water from Talovskoye is then pumped through pumping station No.4 into Chashinskiy tailings dam where water is further settled and becomes suitable for application in the production process. Clarified water with a suspended solids content of 4.3mg/l and рН =7.6 from Chashinskiy tailings dam is pumped through the recycling water pumping station No.6 into the Concentrator process water tank. The volume of water that is recycled in this way is 28.8Mm3 per year. 5.8.3 Ore Crushing Facilities There are three crushing installations at Ridder, two of these are located adjacent to the Ridder–Sokolniy mine and Concentrator buildings Nos.2 and 3, while the third installation is located at the Tishinskiy mine site where it crushes ore from the Tishinskiy mine to be used as the feed to a dense media separation facility. 5.8.3.1 Crushing Section No.2 Located in an elevated position behind Concentrator building No.2 is the crushing Section No.2 facility which consists of two almost identical crushing circuits. The first of these circuits, Processing Chain No.1, is used mainly for crushing the Tishinskiy heavy ore product from the DMS beneficiation plant. This ore is transported from the mine by rail and stockpiled close to the crusher and from there it is moved by trucks to a 1,000t primary crusher feed bin. The primary crusher is an old McCool CCD 500 gyratory cone crusher with an installed power of 75kW. Ore from the feed bin is conveyed to a 150mm vibrating screen from which the coarse fraction feeds the primary crusher. The crushed product then joins the screen fine fraction and is conveyed to a 12mm vibrating screen from which the coarse product feeds the Russian Uralmesh CSD 1750B secondary cone crusher. The fine product from this screen however is fed to a spiral classifier. Note that copious amounts of spray water are used throughout the crushing operation here and in all of the crushing facilities, in order to facilitate the transport of ore through transfer points, to reduce sticking of fine fractions to operating parts of crushers and to keep dust levels low which would otherwise pose a health risk. Classifier overflow is pumped to Concentrator building No.2 for processing. The secondary crushed product is conveyed to a third and final 16mm vibrating screen from which the coarse product feeds the Russian Uralmesh CMD 2200 tertiary crusher. The final tertiary crushed ‐16mm product joins the tertiary vibrating screen underflow and together with the second stage classifier sands, is conveyed to the Concentrator building No.2 mill feed bins for further processing. Processing Chain No.1 of Crushing Section No.2 is also used to crush the high grade gold “Flux” ore from the Ridder‐Solkolniy mine for intermittent short periods. And there is facility to remove this from the crushing circuit after secondary crushing and to load it out in trucks to Ust‐Kamenogorsk. Processing Chain No.2 of Crushing Section No.2 is used to treat the Ridder‐Sokolniy Copper Ore and the Shubinskiy mine ore. The circuit is essentially a copy of Processing Chain No.1 with the exeption that the primary jaw cursher CMD‐110 has an installed power of 110kW. There is also some flexibility built in to this crushing chain enabling the circuit feed or final product to be transferred over to Processing Chain No.1. Both
THIS WEB PROOF INFORMATION PACK IS IN DRAFT FORM. The information contained herein is incomplete and subject to change and it must be read in conjunction with the section headed ‘‘Warning’’on the cover of this Web Proof Information Pack.

KAZZINC LTD Competent Person’s Report for the assets held by Kazzinc Ltd in both Kazakhstan and Russia
61‐0795/MM February 2011
Draft V 0.9 Page 51
the Ridder‐Sokolniy copper and the Shubinskiy mine ore also have their own ore bin and feeding systems to introduce each ores into the crushing circuit. Ores crushed in this circuit are conveyed to the Concentrator building No.3 mill feed bins for further processing. 5.8.3.2 Crushing Section No.3 Located close to Crushing Section No.2 and Concentrator Building No.3, Crushing Section No.3 is comprised of a single line, three stage crushing facility that is normally dedicated to treating Pb/Zn ore from the Ridder‐Sokolniy mine which lies directly beneath it. The ore is hoisted up a vertical shaft to the surface in skips to a 500t bin. The ore is then fed on a steel plate apron feeder to the 150mm grizzly screen from which the coarse oversize ore goes for primary crushing in a Kennedy CCD 900 cone crusher (manufactured in 1929) with 184kW power. The screen unders and the primary crushed ore are conveyed to one of two 60mm grizzly screens. The oversize product from the screen is fed to the secondary Uralmash CSDT 2,200 crusher while the screen undersize is fed to a 12mm grizzly screen from which the oversize joins the secondary crusher product and the undersize is fed to a spiral classifier. Note that as for the other crusher circuits, copious amounts of water are added to the circuit. The coarse fraction from the classifier joins the final tertiary crushed product while the overflow is pumped to Concentrator building No.3 for further processing. The secondary crusher product in Crushing Section No.3 is fed by conveyor to a series of 13 16mm vibrating screens from which a complex system of conveyors carries the coarse product to four installed tertiary crushers. Two of the four tertiary crushers are Russian Uralmesh CMDT 2,200 cone crushers while the other two are newly installed Metso/Nordberg HP 400 and HP 200 cone crushers. The undersize from the vibrating screens form the final ‐16mm crushed ore is conveyed to the feed bins of the Concentrator building No.3.
WAI Comment: While most of the facilities in Crushing Section Nos.2 and 3 are old they appear to be well maintained and fit for purpose. Kazzinc management have replaced two of the worst crushers in Crusher Section No.3 with modern Nordberg units from Metso which it is claimed has increased the crushing capacity of the circuit. Further renewal and replacement in the Crusher Sections now forms part of a future plan to increase the overall milling capacity of Concentrator building No.3. The strategy of upgrading the crushing sections appears to revolve around the replacement of individual units of equipment with more modern and efficient units. There are several areas in the crushing circuits as a whole however that do not conform to modern practice and where improvements could be made. For example, the number of standby units is inefficient as is the number of vibrating screens in each circuit. It is also inefficient to pass the classifier coarse product directly to the final tertiary crushed product as appears on both flow sheets in Section No.2. A modern circuit might be comprised of a jaw crusher, a standard cone crusher and a short head cone crusher, arranged in circuit with a double deck screen. The screens (13 units) in Section No.3 installed upstream the fine crushers are in continuous operation. This scheme is arranged in such a way to allow ore stockpiling in the Crushing section for the period of ore supply interruption from the mine. Design and survey works are being carried out by TOMS Institute to select crushing and equipment flowsheet for Crushing Section No.2, particularly, for fine crushing and ore fines removal. It is suggested that Kazzinc put a temporary halt to the acquisition of new crushing equipment and take a step back in order to take a higher level look at their current and future crushing needs and what the most efficient means of achieving this might be.
5.8.3.3 Tishinskiy Crusher Ore from the Tishinskiy mine is hoisted to the surface and tipped into one of two Run‐of‐Mine ore bins. There is also a third ore bin into which ore from outside sources can be introduced into the crushing circuit. From
THIS WEB PROOF INFORMATION PACK IS IN DRAFT FORM. The information contained herein is incomplete and subject to change and it must be read in conjunction with the section headed ‘‘Warning’’on the cover of this Web Proof Information Pack.

KAZZINC LTD Competent Person’s Report for the assets held by Kazzinc Ltd in both Kazakhstan and Russia
61‐0795/MM February 2011
Draft V 0.9 Page 52
these bins the ore is fed by conveyor on to a 100mm grizzley screen from which the coarse +100mm fraction is fed to a UZTM (A Russian manufacturer based in the Urals) model CRD 700/75 primary cone crusher with an installed power of 250kW and a discharge setting of 150mm. This primary discharge then joins the ‐100mm screen fine fraction and is conveyed to a 50mm vibrating screen. Coarse product from this screen, feeds a secondary UZTM CSD 2200T cone crusher with an installed power of 250kW producing a ‐80mm product. The crushed product then joins the ‐50mm screen underflow and is conveyed to a 2,200t crushed ore bin from which it is fed into the dense media separation (DMS) plant. There is a third, tertiary crusher in the Tashinskiy DMS beneficiation plant building that operates on the DMS light (waste) ore fraction. After screening and washing to remove and reclaim the dense media, the light ore fraction is fed by conveyor to a UZTM CMD 2,200T cone crusher with an installed power of 250kW from which the discharge is conveyed to a 25mm vibrating screen. The +25mm fraction from the screen is conveyed back to the tertiary crusher feed. The ‐25mm fine screen product is fed by conveyor to a stockpile. Further on, the crushed light fraction is used for preparation of a concrete fill mixture for mine back fill. The concrete back fill preparation plant and Tishinskiy ore DMS process are discussed elsewhere in this report. 5.8.4 Concentration Facilities There are three main concentrators at and around the Ridder mining complex. These are the DMS plant situated at the Tishinskiy mine site, and Concentrator buildings No.2 and No.3, which are located adjacent to the town of Ridder itself. 5.8.4.1 DMS Plant The crushing section of the Tishinskiy DMS plant as described earlier produces a minus 50mm feed to the dense media separation facility. Prior to separation in the DMS drum however, the ore is split on a double deck vibrating screen into +5mm, +2mm and ‐2mm fractions. The latter fines fraction of the ore is passed through a bank of two spiral classifiers to recover coarse and heavy material which joins the 5mm product. The fine and lighter material from the classifiers is thickened and filtered in a plate and frame filter press. It is then fed by conveyor to a temporary stockpile before being transported by rail to the concentrator. It is then re‐pulped and pumped to the Main Building No.2 concentrator for processing. The coarse ‐50mm +5mm fraction from the double deck screen enters the Russian made DMS SB‐200 drum separator which contains a dense media made up of water and a ferrosilicon: magnetite (70:30) powder. The operating volume of the drum is 1,400m3 with a design throughput of 200tph. The density of the media is controlled at 2.75g/cm3 such that the lighter gangue material will float and can be easily removed from the drum, while the heavy, base metal sulphide fraction of the ore will sink and can be collected separately from the bottom of the drum. To prevent the build‐up of fine ore particles in the heavy media suspension, the overflow DMS plus that washed from the light and heavy fractions during screening is cleaned using wet magnetic roll separators. The dense medium solids cleaned off ore slimes and excess water are used again for suspension preparation.
THIS WEB PROOF INFORMATION PACK IS IN DRAFT FORM. The information contained herein is incomplete and subject to change and it must be read in conjunction with the section headed ‘‘Warning’’on the cover of this Web Proof Information Pack.

KAZZINC LTD Competent Person’s Report for the assets held by Kazzinc Ltd in both Kazakhstan and Russia
61‐0795/MM February 2011
Draft V 0.9 Page 53
Photo 5.2: DMS Drum and Magnetic Roll Separators
As described earlier, the light floating fraction from the DMS is washed on a screen and further crushed to ‐25mm for use as backfill in the Tishinskiy mine. The heavy sinking fraction is similarly washed on a vibrating screen after which it joins the ‐ 5mm ore fraction and is conveyed to the heavy fraction storage bin. From here it is loaded into dump cars and transported by rail for further crushing at Crusher Section No.2 and further processing. Including engineering and management, the Tishinskiy DMS plant employs 66 full time staff. It operates continuously. Periodic shutdowns of the DMS processing chain is allowed when rich ore with zinc content over 8% is delivered from the mine but it happens quite rarely. Ore crushing only is performed at the plant in such cases. The crushing and processing plant is designed for removal of waste rock and backfill concrete at the initial processing stage in order to increase the qualitative indicators of ore processing. On average the DMS plant rejects 15.6% of the ore that is mined.
WAI Comment: An alternative to DMS would be to develop a mine planning strategy to yield a less variable Run of Mine grade and/or a simple blending facility might be a more efficient approach and a separate study into this possibility is recommended.
5.8.4.2 Concentrator No.2 and No.3 Concentrator buildings Nos.2 and 3 process all the sulphide ores that are mined in the Ridder area. These are currently the Tishinskiy polymetallic DMS heavy ore fraction, and the slimes from both the Tishinskiy DMS plant and from the Crushing Sections Nos.2 and 3, which are treated in the No.2 Concentrator, and the Ridder‐Sokolniy Cu ore, the Ridder‐Sokolniy Pb/Zn ore, the Shubinskiy Cu/Zn ore and the Staroye tailings dam sands, which are treated in the No.3 Concentrator. Each of the ore types requires a different treatment to efficiently recover the contained metals and therefore as the figures below show, the overall flow sheet for each concentrator is quite complicated. For this reason, the flow sheets as applied to the individual ore types will be discussed individually in later sections of this report.
THIS WEB PROOF INFORMATION PACK IS IN DRAFT FORM. The information contained herein is incomplete and subject to change and it must be read in conjunction with the section headed ‘‘Warning’’on the cover of this Web Proof Information Pack.

KAZZINC LTD Competent Person’s Report for the assets held by Kazzinc Ltd in both Kazakhstan and Russia
61‐0795/MM February 2011
Draft V 0.9 Page 54
Figure 5.18: Concentrator Building No.2
Figure 5.19: Concentrator Building No.3
In general however, each of the concentrators is comprised of milling, froth flotation and gravity separation. The primary mills are generally grate discharge overflow ball mills with manganese steel liners, while the secondary mills are open discharge overflow ball mills with rubber liners. All the mills have an installed power of 400kW and were originally 2.7m in diameter by 3.6m in length. More recently however, certain of the secondary mills in Concentrator No.3 have been lengthened to 4.5m. There is also a single mill in Concentrator No.2 that is 4.5m long but this is currently mothballed. All of the mills have been manufactured and modified on site in Kazzinc’s own Engineering workshop. All of the mills are in closed circuit with either a spiral classifier (primary mills) or a hydrocyclone classifier (secondary mills).
THIS WEB PROOF INFORMATION PACK IS IN DRAFT FORM. The information contained herein is incomplete and subject to change and it must be read in conjunction with the section headed ‘‘Warning’’on the cover of this Web Proof Information Pack.

KAZZINC LTD Competent Person’s Report for the assets held by Kazzinc Ltd in both Kazakhstan and Russia
61‐0795/MM February 2011
Draft V 0.9 Page 55
Photo 5.3: Concentrator Building No.3 and Spiral Classifier
Gravity separation is achieved with jigs, shaking tables and centrifugal concentrators. The jigs are Russian MOD‐2M diaphragm jigs which are positioned on the primary and secondary mill discharge streams. These machines are to be gradually replaced with Knelson centrifugal concentrators. The gravity concentrates produced by the jigs and Knelson concentrators are further upgraded in two stages using Russian SKO 15m2 and 7.5m2 shaking tables.
Photo 5.4: Jig on Mill Discharge (centre left) and New Knelson Concentrator
Froth flotation is conducted in Russian forced air RIF 16m3 rougher cells and RIF 8.5m3 or FM‐6.3m3 cleaner cells. There is a plan underway in both concentrators however to replace these cells with 14.15m3 and 4.25m3 Wemco induced air flotation cells.
THIS WEB PROOF INFORMATION PACK IS IN DRAFT FORM. The information contained herein is incomplete and subject to change and it must be read in conjunction with the section headed ‘‘Warning’’on the cover of this Web Proof Information Pack.

KAZZINC LTD Competent Person’s Report for the assets held by Kazzinc Ltd in both Kazakhstan and Russia
61‐0795/MM February 2011
Draft V 0.9 Page 56
Photo 5.5: RIF Flotation Cells and Shaking Table
WAI Comment: The upgrading of the existing flotation machines and the introduction of Knelson concentrators in place of jigs is warranted and in line with modern mill practice. There is however, very little free gold in any of the ores and even after two stages of concentration with shaking tables this results in a low grade gravity concentrate of around 120g/t Au. It is questionable therefore whether shaking tables are the correct choice of equipment in these circumstances or even whether gravity separation is warranted at all, given that the gold reporting to the gravity concentrate may be picked up during flotation. A review of the gravity circuit is therefore warranted.
All concentrates are dewatered with conventional rake thickeners and ceramic disc filters prior to being shipped for further processing.
Photo 5.6: Thickening and Filtration
5.8.4.3 Planned Changes to Concentrator Capacities Current and planned annual tonnage throughputs for the Concentrators Nos.2 and 3 are shown in Table 5.26 and Table 5.27.
THIS WEB PROOF INFORMATION PACK IS IN DRAFT FORM. The information contained herein is incomplete and subject to change and it must be read in conjunction with the section headed ‘‘Warning’’on the cover of this Web Proof Information Pack.

KAZZINC LTD Competent Person’s Report for the assets held by Kazzinc Ltd in both Kazakhstan and Russia
61‐0795/MM February 2011
Draft V 0.9 Page 57
Table 5.26: Concentrator Building No.2 Annual Tonnage Current
(t) Planned
(t) Slimes Polymet 500,000 500,000 Tishinskiy Polymet (heavy) 979,090 979,090 Shubinskiy Cu/Zn 0 190,000
Total 1,479,090 1,669,090 Planned Increase 190,000
% Increase 13
Table 5.27: Concentrator Building No.3 Annual Tonnage Current
(t) Planned
(t) Ridder‐Sokolniy Cu 180,000 290,000 Ridder‐Sokolniy Pb/Zn 1,900,000 2,300,000 Shubinskiy Cu/Zn 190,000 0 Staroye tailings dam Au/Zn 1,100,000 1,100,000
Total 3,370,000 3,690,000 Planned Increase 320,000
% Increase 9
In the case of the Concentrator building No.2, plans are in place to increase the flotation capacity by the introduction of five Outotec 50m3 tank cells in order to accommodate the extra tonnage. The ongoing introduction of new and more efficient crushing equipment to Crushing Section No.2 will to some degree offset the increased throughput; there is however, no plan to increase the milling capacity as it is claimed there is sufficient excess capacity in the current circuit. In the Concentrator building No.3 the strategy for handling the planned extra throughput is to increase the milling capacity. This will be achieved by replacing the two primary 2.7x3.6m primary, plus the 2.7x4.5m secondary ball mills with single 4.5m x 5.0m primary and a single 4.5x5.0m secondary ball mills (section 5). This will be aided by a finer crush size from the planned new crushers, and by adopting a smaller steel ball size in the secondary mill, it is believed that this will not only accommodate the increased tonnage but it will also produce a finer grind. There is however, no plan to modify the existing froth flotation and gravity sections of the concentrator as it is claimed that sufficient capacity already exists.
WAI Comment: There is no cause to doubt the calculations and conclusions of the Kazzinc management regarding the planned upgrades. Given the complexity of operations in both of Concentrators Nos.2 and 3 and the potential cost of any mistake however, a full review of the planned upgrades is suggested with the joint objectives of identifying any possible bottle necks and confirming the planned throughput and grind. It is recommended that a “fresh pair of eyes” undertake this review. General Comment On Facilities: All of the plants visited – the DMS facility, the Crusher Section Nos.1 & 2 and the Concentrator buildings Nos.2 & 3 were well maintained and well managed. Some of the equipment was very old and in need of replacement with either new equipment or alternative equipment but the management were aware of this and plans were in place to rectify these matters. All of the management and operational staff that were interviewed or engaged in less formal conversation were knowledgeable and helpful. If there is one negative it is the condition of certain stairways, walkways and access ways within the facilities which were not entirely up to modern European standards.
THIS WEB PROOF INFORMATION PACK IS IN DRAFT FORM. The information contained herein is incomplete and subject to change and it must be read in conjunction with the section headed ‘‘Warning’’on the cover of this Web Proof Information Pack.