DISTRICT IRRIGATION PLAN SUNDARGARH DISTRICT ...
170
GOVERNMENTOFINDIA PRADHAN MANTRIKRISHISINCHAYEE YOJANA (PMKSY) DISTRICT IRRIGATION PLAN SUNDARGARH DISTRICT (ODISHA STATE) March 2016
-
Upload
khangminh22 -
Category
Documents
-
view
1 -
download
0
Transcript of DISTRICT IRRIGATION PLAN SUNDARGARH DISTRICT ...

GOVERNMENTOFINDIA PRADHAN MANTRIKRISHISINCHAYEE YOJANA (PMKSY)
DISTRICT IRRIGATION PLAN SUNDARGARH DISTRICT
(ODISHA STATE)
March 2016

SUNDARGARH DISTRICT IRRIGATIONPLAN
PMKSY
2016-2020
Sri Bhupendra Singh Poonia, IAS
District Collector&District Magistrate, Sundargarh
Sri Surendra Kumar Meena,IAS
Project Director,DRDA, Sundargarh,(Nodal Officer, PMKSY)
Preparation and Compilation
Project Director, Watersheds, Sundargarh
Project Director, ATMA, Sundargarh
Deputy Director of Horticulture, Sundargarh
Superintending Engineer (Irrigation), Sundargarh
Executive Engineer, MI, Sundargarh
Executive Engineer, OLIC, Sundargarh
District Manager, OAIC, Sundargarh
Technical Support Agency
ICAR-Indian Institute of Water Management, Bhubaneswar


Chapter Number
CONTENTS
Page No.
I Introduction 1
1.1 District Profile 1-2
1.2 Demography 3
1.3 Biomass and Livestock 4
1.4 Agro-Ecology, Climate, Hydrology and Topography 5-6
1.5 Soil Profile 7-8
1.6 Soil Erosion and Runoff Status 12
1.7 Land Use Pattern 13
1.8 District Irrigation Plan 14-15
II District Water Profile 17
2.1 Area Wise, Crop Wise Irrigation Status 18
2.2 Production and Productivity of Major Crops 19-22
2.3 Irrigation Based Classification 23
III Water Availability 25
3.1 Status of Water Availability 26-42
3.2 Status of Ground Water Availability 43
3.3 Status of Command Area 44
3.4 Existing Type of Irrigation 45-46
IV Water Requirement / Demand 48
4.1 Domestic Water Demand 49
4.2 Crop Water Demand 50-67
4.3 Livestock Water Demand 69
4.4 Industrial Water Demand 70
4.5 Water Demand for Power Generation 70
4.6 Total Water Demand of the District for Various Sectors 71
4.7 Water Budget 72-73
V Strategic Action Plan for Irrigation in district under PMKSY 75

Executive Summary
Executive Summary Enhancement in water use efficiency and irrigation infrastructure is vital for bringing quantum
jump in the food grain production in India; thereby ensuring food security. District irrigation
plan (DIP) under Pradhan MantriKrishiSinchayeeYojana(PMKSY) will play key role in
achieving this objective. Under this background, District Irrigation Plan of Sundargarh district
has been documented as per PMKSY operational guidelines issued by Govt. of India. There is
a huge gap between the irrigation potential created and utilized of thedistrict. To bridge this
gap to the maximum extent, thorough analysis has been made regarding the general profile of
the district, climate, soil and land utilization pattern (Chapter 1). The crop wise and area wise
irrigation status has been discussed under district water profile in Chapter 2. Similarly, the
status of water availability including ground water status has been summarized in Chapter 3.
The water demands for domestic, crop, livestock and industrial sectors have been assessed and
overall water budget has been computed in Chapter 4. Chapter 5 highlights the strategic
plan for integrated water resource development and utilization covering interventions
under ‘HAR KHET KO PAANI’ (estimated cost of Rs.1199.579 crores), ‘MORE CROP PER
DROP' (estimated cost of Rs.198.86crores), Accelerated Irrigation Benefit Program (AIBP)
(estimated cost of Rs.107.447crores) and PMKSY watershed (estimated cost of Rs.
162.00crores.The overall estimated cost of District irrigation planis estimated to be
Rs.2298.886 crores with long term action plan (for 20 years) of an estimated cost of Rs.
11176.00 Crore.

Chapter I
INTRODUCTION

1
Chapter I
INTRODUCTION
As per PRADHAN MANTRI KRISHI SINCHAYEE YOJANA (PMKSY) operational
guidelines, District Irrigation Plans (DIPs) shall be the corner stone for planning and implementation of
PMKSY. DIPs will identify the gaps in irrigation infrastructure after taking into consideration the
District Agriculture Plans (DAPs) already prepared for RashtriyaKrishiVikasYojana(RKVY) vis-à-vis
irrigation infrastructure currently available and resources that would be added from other ongoing
schemes (both State and Central) like Mahatma Gandhi National Rural Employment Guarantee Scheme
(MGNREGS), RashtriyaKrishiVikashYojana(RKVY), Rural Infrastructure Development Fund (RIDF),
Member of Parliament Local Area Development (MPLAD) Scheme, Member of Legislative Assembly
Local Area Development (MLALAD) Scheme, Local body funds etc. The gaps indentified under
Strategic Research &Extension Plan (SREP) will be made use in preparation of DIP.
DIPs will present holistic irrigation development perspective of the district outlining medium to
longterm development plans integrating
a) Formulations of new Irrigation sources under PMKSY (HAR KHET KO PAANI). b) Stabilization of existing scheme and PMKSY (PER DROP MORE CROP).
c) Water use application incorporating all usage of water like drinking & domestic use, irrigation
and industry
Preparation of DIP has been taken up as joint exercise of all participating departments and is
forming the compendium of all existing and proposed water resource network system in the district.
Based on the above background, an attempt has been made to prepare the District Irrigation Plan for
Sundargarh District in Odisha State. A preliminary discussion was held with District Magistrate/
Collector of Sundargarh on January, 2016 by all District Level Officers and there after an approach to
DIP was sent to the district administration on last week of February’ 2016.
1.1 District profile
Sundargarh is the second largest district in the Odisha State. The soil profile of the district is
generally classified as red sandy loam soil and clay loam. About 72% of villages in the district
contain predominantly sandy loam soil, which accounts for nearly 2/3rd
of the total crop area. Both food

2
crops and non-food crops are cultivated in the district. Among cereal crops, paddy stands first and is
followed by pulses & oil seeds. The principal rivers are Brahmani, Ib and its tributaries are Sankh,
Koil, Ichha and Deo.
Sundargarh district is bounded by Jharkhand &Chhat igarhstate on the North;Keonjhar, Angul
and Deogarh in East; and Jharsuguda&Sambalpurdistrict on South.Geographical area of the d i s t r i c t
is about 9 ,71,244ha. The district is situated between 83o.32' and 85
o.22' of the eastern longitudes and
21o.35' and 22
o.32' of northern latitudes. The climate of the district is characterized by hot summer and
is generally dry except during the south- west monsoon season. The mercury touches 48oC during
summer and drops 5oC during the winter. The cold weather commences towards the end of November,
when the temperature begins to fall rapidly. The average annual rainfall in the district is 1564.2 mm,
out of which about 80% occurs during south-west monsoon.
Brahmaniis the major river, which enters the district near Rourkela. Its main tributaries are
Sankh&Koil. Most of the area of the district is under hilly track. The district comprises of 17 blocks, 262
G.P.s and 1779 villages. There are 4 municipalities in the district. The district is conveniently divided
into 3 irrigation divisions viz. Sundargarh (2 nos.) andPanposh.
Table1.1 General informationof the district Sl. No. Name of the
district
District
code
Latitude Longitude
1 Sundargarh 374 83°.32'&85°.22' N 21°.35'& 22°.32' E
Source: Gazetteer, Census Report, any other source of Government

3
1.2 Demography
As per 2011 census (provisional data), the district has a population of 14.78 lakhs of which
91.69% is rural and 8.30% is urban. The decadal growth rate is 16.34% with a population density of
188 persons/ km2. The literacy rate is 64.86% and the male-female sex ratio is 957 females per 1000
males.
Table 1.2 Demography
Total Household Total Population
S.N. Block
No.
of
GP
No. of
Village
&
Ward Rural Urban Total Rural Urban Total
1 Hemgir 19 153 84559 0 84559 84559 0 84559
2 Lephripada 17 108 19750 0 19750 78808 0 78808
3 Tangarpali 13 80 16597 0 16597 64374 0 64374
4 Balisankara 16 101 21656 0 21656 85690 0 85690
5 Subdega 14 63 15517 0 15517 64254 0 64254
6 Sundargarh 16 86 18046 0 18046 70911 0 70911
7 Baragaon 13 69 16730 0 16730 71242 0 71242
8 Kutra 16 54 17598 0 17598 80470 0 80470
9 Kuarmunda 20 108 20995 2060 23055 97870 9043 106913
10 Nuagaon 20 120 23133 0 23133 106156 0 106156
11 Bisra 15 71 14159 4698 18857 68629 21556 90185
12 Lathikata 16 92 17511 14490 32001 82324 63988 146312
13 Rajagangpur 12 77 20155 2236 22391 95142 9923 105065
14 Gurundia 13 146 14701 0 14701 66988 0 66988
15 Bonaigarh 13 118 15251 1686 16937 62811 7080 69891
16 Lahunipara 17 220 22953 0 22953 99526 0 99526
17 Koida 12 113 16792 2921 19713 75586 11232 86818
Total 262 1779 376103 28091 404194 1355340 122822 1478162

4
1.3 Biomass and Livestock
The district has a livestock population of 26,60,841 consisting of 10,59,445 poultry birds, 11,17,147 goats, 32,192 sheeps,
59,112 cows and 5,312 buffalos.
Table 1.3 Livestock
Small Animals Large Animals Draft Animals (Buffalo/
Yak/ Bulls/ any other
Name of
the Block Poultry
(No.) Ducks
(Nos.) Pigs
(Nos.) Goats
(Nos.) Sheeps
(Nos.) Indigenous
Cow (Nos.)
Hybrid
Cow
(Nos.)
In
descriptive
Buffalo
(Nos.)
Hybrid
Buffalo
(Nos.)
Any
other Milch
or Meat
Animal
(Nos.)
Cattle
(Nos.) Buffalo
(Nos)
Hemgir 53890 208 863 28455 259 2343 40 88 0 0 10440 608
Lephripara 44506 360 2988 30686 270 2105 127 39 0 0 19812 550
Tangarpali 42506 320 987 15592 149 2161 192 45 0 0 17452 412
Sundargarh 49180 920 1255 20092 942 3770 827 143 0 0 16060 110
Balisankra 70554 650 2490 41318 605 3840 40 61 0 0 19410 750
Subdega 51156 688 2420 29031 787 3228 108 66 0 0 19620 780
Bargaon 49497 948 3210 28882 1676 3627 290 62 0 0 17890 610
Kutra 62686 892 4080 25992 2946 3261 85 78 0 0 17460 502
Rajgangpur 82129 960 3690 31618 3147 3593 484 380 0 0 16020 466
Kuarmunda 71210 994 5208 47167 4360 5839 2087 1448 0 0 20070 998
Nuagaon 79955 1070 5512 58727 5344 4024 144 442 0 0 18860 1462
Bishra 61268 910 1792 29241 2482 1287 120 460 0 0 19640 2251
Lathikata 54698 988 2747 34264 1226 2919 899 653 0 0 20508 1281
Lahunipara 71787 1386 3180 68166 3023 2884 219 548 0 0 19652 1051
Koida 63556 663 2360 24262 1398 2897 33 314 0 0 18992 962
Gurundia 74469 1450 4910 40071 823 2597 40 246 0 0 19010 1180
Bonai 76398 1068 996 563583 2755 2526 476 239 0 0 18049 1052
TOTAL 1059445 14475 48688 1117147 32192 52901 6211 5312 0 0 308945 15025

5
1.4 Agro-Ecology, Climate, Hydrology and Topography
By and large the district is characterized by undulating topography, whereas, the
peripheral part exhibits rugged topography formed by hills and hill ranges. The major
geomorphic regions identified in the district are north western plateau region, hilly region,
pediplainand fluvial regions. River Brahmani, which enters at Rourkelais the most important
river that drains the district with its tributaries such as Koil and Sankh. River IB is draining to
Mahanadi.
The forest cover i s about 51% of the geographical area of the district. mahua, teak, sal,
assan, arjun, neem, tamarind and mango are the major trees. The fauna includes tiger, leopard,
hyena, wolf, jackal, fox, sloth beer, black-buck, Indian bison, antelopes, gazelles anddeer. The
common birds are pea fowl, peacock, parrots and mynainthe district.
The climates of the district are characterized by hot summer and generally dry except during
the south-west monsoon season. The cold season commences from December to February and
is followed by the summer season from March to May. The period from June to September
constitute the south-west monsoon season. About 80% of annual rainfall is received during the
south-west monsoon season with the normal annual rainfall is 1647.6 mm. The cold weather
commences towards the end of November when the temperature begins to fall rapidly.
December is generally the coldest month with the mean daily maximum temperature varies at
about 29oC and the mean daily minimum temperature is13
oC. The relative humidity is generally
high during the south-west monsoon season. Winds are light to moderate with some
strengthening in the period from May to August. During the post-monsoon and cold season,
winds blow mostly from the east or north-east.
Table 1.4 Agro Ecology, Climate, Hydrology and Topography
Average weekly
Temperature (ºC)
Potential Evapo-
Transpiration
(PET)
Elevation
Period Period
Summ
er
(April-
May)
Winter
(Oct.-
Mar.)
Rainy
(June-
Sept.)
S
.
N
.
Nam
e of
the
Bloc
k
Agro
Ecological
Zone type
Blo
ck
are
a
(H
a.)
Nor
mal
ann
ual
Rai
nfal
l
(m
m)
Ave
rage
Mo
nthl
y
Rai
nfall
(m
m)
No
. of
Ra
iny
da
ys
(N
o.) M
in
M
a
M
in
M
ax
M
in
M
ax
Sum
mer
Wi
nte
r
Rai
ny
T
ot
al
M
in
M
ax
Me
an

6
x
1
Hem
gir
North western
Plateau &
Hills
93
23
8
142
2.45
118.
5
68.
45
23
.4
2
4
0
13
.4
5
29
.6
22
.7
31.
7 597 605 582
17
84
22
0
60
0 410
2
Leph
ripar
a
North western
Plateau &
Hills
64
02
2
142
2.42
118.
2
68.
47
23
.4
9
4
0.
1
13
.6
7
29
.6
22
.7
31.
7 597 605 582
17
84
22
0
62
0 420
3
Tang
arpal
i
North western
Plateau &
Hills
24
96
6
142
2.38
117.
7
68.
55
23
.5
1
4
0
13
.8
4
29
.7
22
.8
31.
8 597 605 582
17
84
20
0
54
0 370
4
Sund
argar
h
North western
Plateau &
Hills
35
98
8
142
2.40
118.
53
68.
40
23
.5
0
4
0.
0
13
.8
3
29
.6
7
22
.7
5
31.
75 597 605 582
17
84
22
0
32
0 270
5
Balis
ankra
North western
Plateau &
Hills
10
84
76
142
2.39
118.
2
68.
53
23
.5
1
4
0
13
.8
4
29
.7
22
.8
31.
7 597 605 582
17
84
26
0
64
0 450
6
Subd
ega
North western
Plateau &
Hills
32
42
8
142
2.38
118.
5
68.
45
23
.4
9
4
0
13
.8
3
29
.7
22
.7
31.
8 597 605 582
17
84
24
0
46
0 350
7
Barg
aon
North western
Plateau &
Hills
35
66
1
142
2.39
118.
4
68.
33
23
.4
2
4
0
13
.8
4
29
.7
22
.7
31.
7 597 605 582
17
84
24
0
58
0 410
8
Kutr
a
North western
Plateau &
Hills
31
88
5
142
2.34
118.
4
68.
39
23
.4
9
4
0.
1
13
.8
3
29
.6
7
22
.7
31.
7 597 605 582
17
84
22
0
52
0 370
9
Rajg
angp
ur
North western
Plateau &
Hills
34
89
7
142
2.36
118.
5
68.
36
23
.5
1
4
0
13
.8
4
29
.7
22
.7
31.
7 597 605 582
17
84
20
0
76
0 480
1
0
Kuar
mun
da
North western
Plateau &
Hills
57
67
2
142
2.42
118.
2
68.
27
23
.5
0
4
0.
0
0
13
.8
3
29
.7
22
.8
31.
8 597 605 582
17
84
18
0
48
0 330
1
1
Nuag
aon
North western
Plateau &
Hills
38
88
8
142
2.46
117.
7
68.
41
23
.5
1
4
0
13
.8
1
29
.7
22
.7
5
31.
75 597 605 582
17
84
20
0
56
0 380
1
2
Bishr
a
North western
Plateau &
Hills
22
56
0
142
2.41
118.
53
68.
38
23
.4
9
4
0
13
.8
1
29
.7
22
.8
31.
7 597 605 582
17
84
18
0
52
0 350
1
3
Lathi
kata
North western
Plateau &
Hills
74
90
4
142
2.39
118.
4
68.
36
23
.4
2
4
0
13
.6
7
29
.6
22
.7
31.
7 597 605 582
17
84
18
0
62
0 400
1
4
Lahu
nnipa
ra
North western
Plateau &
Hills
12
58
74
142
2.4
117.
9
68.
37
23
.4
9
4
0.
1
13
.8
4
29
.7
22
.7
31.
7 597 605 582
17
84
14
0
10
00 570
1
5
Koid
a
North western
Plateau &
Hills
27
07
7
142
2.41
118.
3
68.
39
23
.5
1
4
0
13
.8
3
29
.6
7
22
.7
31.
7 597 605 582
17
84
18
0
10
00 590
1
6
Guru
ndia North western
Plateau &
Hills
77
76
8
142
2.39
118.
4
68.
35
23
.5
0
4
0.
0
0
13
.8
4
29
.7
22
.8
31.
8 597 605 582
17
84
16
0
80
0 480
1
7
Bona
i
North western
Plateau &
Hills
84
94
0
142
2.41
118.
4
68.
41
23
.5
1
4
0
13
.8
3
29
.7
22
.7
5
31.
75 597 605 582
17
84
14
0
70
0 420
Table 1.4.1 Monthly Normal Rainfall Distribution of Long Period Average
7
S.
No.
Month Normal Rainfall
(mm)
S.
No.
Month Normal Rainfall(mm)
1 January 0 7 July 433
2 February 0 8 August 301.9
3 March 0 9 September 114.6
4 April 6 10 October 38
5 May 35.2 11 November 6.5
6 June 130
12 December 0
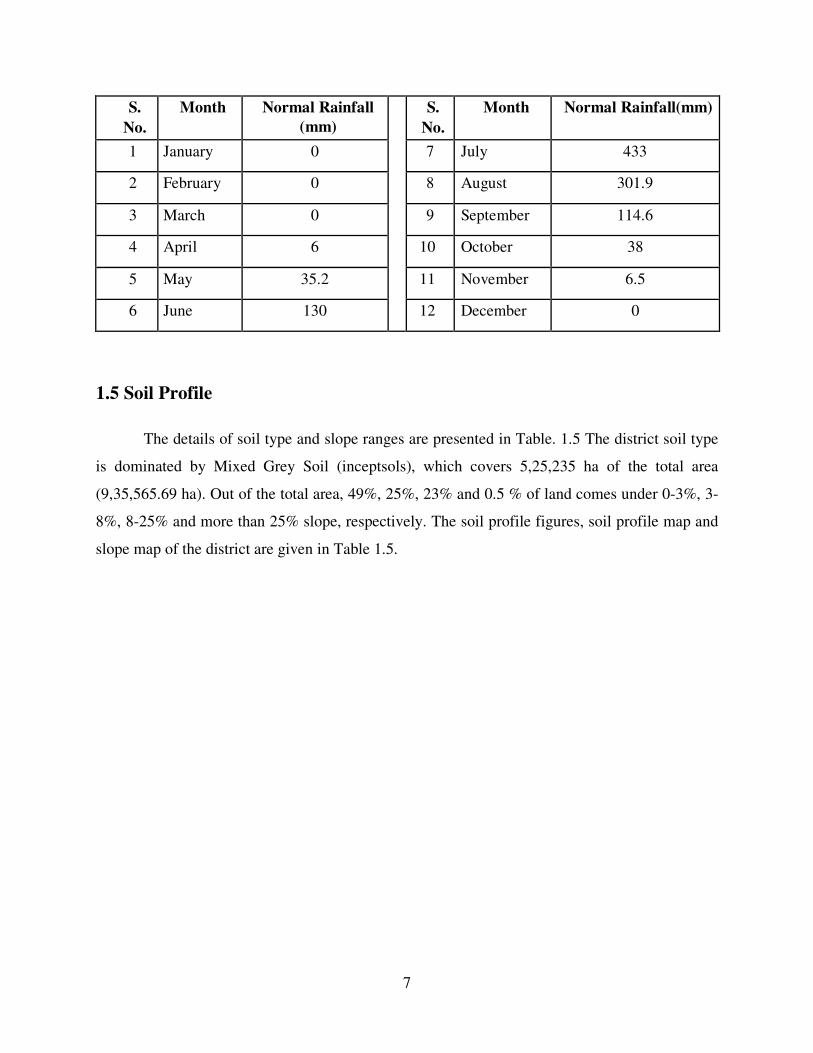
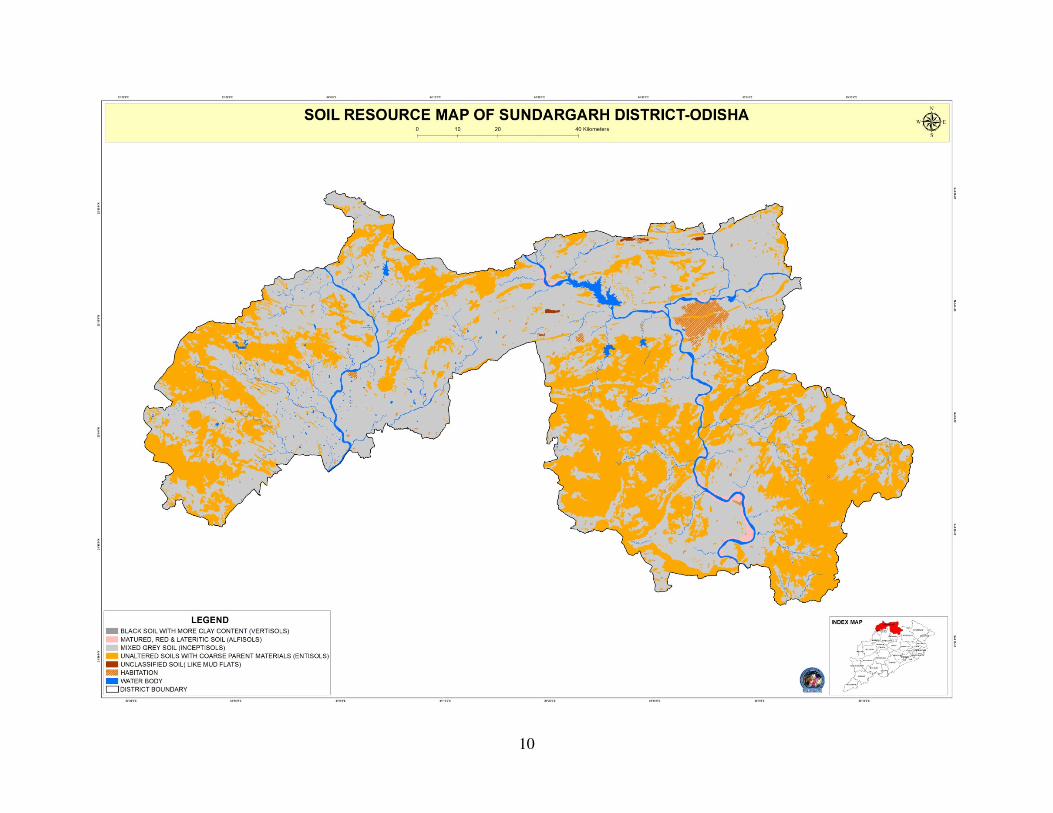
1.5 Soil Profile
The details of soil type and slope ranges are presented in Table. 1.5 The district soil type
is dominated by Mixed Grey Soil (inceptsols), which covers 5,25,235 ha of the total area
(9,35,565.69 ha). Out of the total area, 49%, 25%, 23% and 0.5 % of land comes under 0-3%, 3-
8%, 8-25% and more than 25% slope, respectively. The soil profile figures, soil profile map and
slope map of the district are given in Table 1.5.

8
Table 1.5 SoilProfile Soil Type Land Slope
SL.N
O
NAME OF THE
BLOCK Major Soil Classes Area(Ha.) 0-3% (Ha.) 3-8% (Ha.) 8-25% (Ha.) >25%
(Ha.)
Mixed grey soil (Inceptisols) 45187.30 1 Hemgir
Unaltered soils with coarse parent materials (Entisols) 45637.48 49133.40 29543.65 11852.82 53.28
Mixed grey soil (Inceptisols) 34414.88 2 Lephripada
Unaltered soils with coarse parent materials (Entisols) 22601.69 30213.17 15001.96 11238.79 115.54
Mixed grey soil (Inceptisols) 24686.38 3 Tangarpali
Unaltered soils with coarse parent materials (Entisols) 6647.54 23008.23 5237.16 3543.65 31.74
Mixed grey soil (Inceptisols) 37096.5 4 Sundargarh
Unaltered soils with coarse parent materials (Entisols) 2452.46 32931.6 5825.02 756.16
Mixed grey soil (Inceptisols) 28088.28 5 Subdega
Unaltered soils with coarse parent materials (Entisols) 13089.88 25262.32 12598.16 3577.96 9.29
Mixed grey soil (Inceptisols) 41328.01 6 Balisankara
Unaltered soils with coarse parent materials (Entisols) 12031.36 31465.71 17615.72 4004.44 4.64
Mixed grey soil (Inceptisols) 30225.3 7 Bargaon
Unaltered soils with coarse parent materials (Entisols) 9438.35 24104.19 11004.38 3619.97 110.87
Matured, red & lateritic soil (Alfisols) 296.15
Mixed grey soil (Inceptisols) 29285.11
Unaltered soils with coarse parent materials (Entisols) 5341.43 8 Kutra
Unclassified soil( like mud flats) 190.70
25253.35 6378.06 3148.31 10.76
Mixed grey soil (Inceptisols) 32269.28
Unaltered soils with coarse parent materials (Entisols) 23300.26 9 Rajgangpur
Unclassified soil( like mud flats) 148.67
25465.06 19722.63 11464.74 68.15
Matured, red & lateritic soil (Alfisols) 99.39
Mixed grey soil (Inceptisols) 26567.22 10 Lathikata
Unaltered soils with coarse parent materials (Entisols) 19523.73
21779.07 1329.39 11271.34 196.03
Matured, red & lateritic soil (Alfisols) 581.72
Mixed grey soil (Inceptisols) 46880.65
Unaltered soils with coarse parent materials (Entisols) 9626.08 11 Kuarmunda
Unclassified soil( like mud flats) 337.37
38484.59 16421.37 4902.18 184.02
Mixed grey soil (Inceptisols) 36441.25
Unaltered soils with coarse parent materials (Entisols) 5663.72 12 Nuagaon
Unclassified soil( like mud flats) 195.76
29589.39 7660.87 4267.39 96.53
Matured, red & lateritic soil (Alfisols) 152.29
Mixed grey soil (Inceptisols) 14777.26 13 Bisra
Unaltered soils with coarse parent materials (Entisols) 8029.06
11408.3 6007.96 5594.84 26.28
Matured, red & lateritic soil (Alfisols) 2176.44
Mixed grey soil (Inceptisols) 28844.08 14 Bonai
Unaltered soils with coarse parent materials (Entisols) 9850.00
25053.58 8615.63 7079.47 545.16
Matured, red & lateritic soil (Alfisols) 932.92
Mixed grey soil (Inceptisols) 32909.22 15 Lahunipada
Unaltered soils with coarse parent materials (Entisols) 49687.67
26329.41 14028.29 42354.44 1002.42
Matured, red & lateritic soil (Alfisols) 0.01 16 Koida
Mixed grey soil (Inceptisols) 33286.69
20945.59 24416.08 33427.54 365.17

9
Unaltered soils with coarse parent materials (Entisols) 46940.13
Matured, red & lateritic soil (Alfisols) 366.80
Mixed grey soil (Inceptisols) 35222.35 17 Gurundia
Unaltered soils with coarse parent materials (Entisols) 82716.86
21426.24 33377.65 61212.87 2163.65
10

11

12

13
1.6 Soil Erosion and Run off Status
The average rate of soil erosion in the district is 9.75 tonnes per ha per year.
1.7 Land Use Pattern
Agriculture andforestsarethetwoimportantunitsoflandutilizationand
theforestsoccupyabout 438160ha(45.11%oftotalgeographical areaofthe
district).Thegrosscroppedareainthe districtduringtheyear2014-15is
393622ha(41%).Thenetareasownis 313000ha,whichis 32% oftotalgeographical
areaofthedistrict.Landputtonon- agriculturaluseisonly
6.62%andareasownmorethanonceisverylow. The landutilizationdataisgivenintablebelow.
Table 1.7.1 LanduselandcoverdetailsofSundargarhDistrict
Landcover Area (ha) Area (%)
CropLand 313000 32.22
AgriculturePlantation 13397
Forest 495753 45

14
Table 1.7.2 LandUse pattern
Area in h
Area under Agriculture
SI. No.
No. of the
Gram
Panchayat
No. of the
villages
covered
Total
Geographical
Area Gross
cropped
area (1)
Net sown
Area (2)
Area sown
more than
once (1-2)
Cropping
Intensity
(%)
Area
under
Forest
Area
under
Wasteland
Area
unde
othe
uses
Hemgir 19 153 93238 23055 19324 3731 119 52164 1122
Lephripada 17 108 64022 20407 16174 4233 126 40173 1639
Tangarpali 13 80 24966 20707 17251 3456 120 2082 919
Sundargarh 16 86 35988 23717 19176 4541 124 8801 900
Subdega 14 63 32428 21064 16607 4457 127 10662 3889
Balisankara 16 101 108476 22870 18418 4452 124 76060 6725
Bargaon 13 69 35661 20383 16314 4069 125 4701 995
Kutra 16 54 31885 23938 19433 4505 123 3800 1947
Rajgangpur 12 77 34897 24390 18865 5525 129 6230 2071
Kuarmunda 20 108 57672 28090 22519 5571 125 25086 3955
Nuagaon 20 120 38888 33649 27480 6169 122 2312 1816
Bisra 15 71 22560 14704 9364 5340 157 6800 508
Lathikata 16 92 74904 31188 24695 6493 126 12720 956
Gurundia 13 146 125874 21124 16779 4345 126 102094 2783
Bonaigarh 13 118 27077 21492 17088 4404 126 3705 1756
Lahunipada 17 220 77768 24527 19244 5283 127 39999 3135
Koida 12 113 84940 18317 14269 4048 128 40771 4865
TOTAL 262 1779 971244 393622 313000 80622 126.70588 438160 39981

15
1.8 District Irrigation Plan
District Irrigation plan (DIP) represents planning and implementation of the Pradhan
MantriKrishiSinchayeeYojana (PMKSY). It gives holistic irrigation development perspective of
the district covering medium to long term development plans by integrating three components
i.e. (i) water resources (ii) distribution network, and (iii) water use in drinking and domestic,
irrigation and industry. DIPs are prepared based on the District Agriculture Plans (DAPs) for all
the blocks by considering available and potential water resources. Followings are the basic
information required while planning for DIPs;
• Land use pattern (geographical, net sown area, forest, permanent pasture, cultivable
waste, barren and uncultivable land, current fallows, misc. tree and other area)
• Irrigated and rainfed area
• Cropped area in different season
• Basic climatic data (rainfall, temperature, relative humidity etc.)
• Rural and urban population with growth trend, population density
• Industrial water draft with the growth trend
• Command area under river basin
• Surface flow
• Groundwater resources / groundwater draft / groundwater developement
• Aquifer properties (discharge, transmissivity and drawdown)
• Irrigation potential created under major, medium and minor (flow and lift) irrigation
projects
• Delineated watershed/command area
• Canal/ drain network
• Number of existing water bodies, dug wells/tube wells
• Number of Water Users Associations, PaniPanchayats
Based on the above information, water demand from all sources (domestic, irrigation and
industry) is estimated and compared with the potential of available resources both from surface
and groundwater resources. Water balance scenario gives the idea of the gaps between the
requirement and available water sources. The block wise irrigation plan is developed considering

16
the hydrological, agro-ecological, topographical scenario. Then appropriate options are planned
either in command area basis or watershed basis. Followings are few interventions for increasing
irrigated area.
• Increasing the irrigation potential through creation of water sources both surface and sub-
surface system (ponds, check dams etc.)
• Repair, restoration of water distribution network and renovation of defunct water bodies,
water harvesting structures
• Major, medium and minor irrigation works under command area/watershed basis
• In-situ water conservation structures i.e. bunding, terracing and vegetative barriers,
mulching, furrow based irrigation system etc.
• Increasing area under pressurized irrigation system
The additional irrigated area to be created through these interventions can then be compared
with the existing scenario, which can give an idea about the approximate cost required for
planning DIPs with increase in irrigated area.

17
Chapter II DISTRICT WATER PROFILE

18
Chapter II
DISTRICT WATER PROFILE
Sundargarh district being situated in Mahanadi and Brahmani basin has an abundant
potential for flow irrigation from different rivers and tributaries of river Mahanadi
&Brahmani. Prominent rivers are Koel, Sankha, Ib and Brahmani. Though there is no major
irrigation project in this district, four medium irrigation projects, viz. Kansbahal Irrigation
Project, Sarafgarh Irrigation Project, Talsara Irrigation Project and Pitamahal project are
functioning covering an ayacut of 4218 ha, 2238 ha and 3036 ha and 2630 ha, respectively.
2.1 Area Wise, Crop Wise Irrigation Status
The area and crop wise irrigation status of the 17 blocks of the district is given in Table
2.1. The crop wise details show a total cropping area of 3,13,000 ha in Kharif and 80,586 ha in
Rabi season, out of which 72,140 ha in Kharif and 35,390 ha in Rabi are irrigated and rest area is
under rainfed farming. While the area covered under medium irrigation project has assured
irrigation in Kharif, the area irrigated under other sources has protective irrigation during lean
period only.

19
Table 2.1 Area wise cropwiseirrigationstatus
Name of the District: SUNDARGARH
Kharif (Area in ha) Rabi(Area in
ha)
Summer Crop
(Area in ha)
Total
(Area in ha
Horticulture &Planta
Crops (Area in ha SL.
NO. BLOCK
Irrigate
d
Rainfe
d
Total Irrigate
d
Rai
nfed
Tota
l
Irrig
ated
Rain
fed
To
tal
Irrigate
d
Rainfe
d
Irrigate
d
Rainfe
d
To
l
1 Hemgir 2876 19324 22200 1666 0 1666 0 0 0 4542 19324 257 524 78
2 Lephripada 6217 16174 22391 1775 0 1775 0 0 0 7992 16174 112 753 86
3 Tangarpali 5090 17251 22341 1551 0 1551 0 0 0 6641 17251 32 584 61
4 Sundargarh 4853 19176 24029 2213 0 2213 0 0 0 7066 19176 94 608 70
5 Subdega 4328 16607 20935 1563 0 1563 0 0 0 5891 16607 144 546 69
6 Balisankara 6538 18418 24956 2022 0 2022 0 0 0 8560 18418 145 426 57
7 Bargaon 3909 16314 20223 2181 0 2181 0 0 0 6090 16314 217 496 71
8 Kutra 3804 19433 23237 2769 0 2769 0 0 0 6573 19433 178 523 70
9 Rajgangpur 7054 18865 25919 3721 0 3721 0 0 0 10775 18865 257 350 60
10 Kuarmunda 6122 24695 30817 3273 0 3273 0 0 0 9395 24695 0 824 82
11 Nuagaon 3368 22519 25887 2185 0 2185 0 0 0 5553 22519 0 3165 316
12 Bisra 3761 27480 31241 2553 0 2553 0 0 0 6314 27480 0 1324 132
13 Lathikata 3686 9364 13050 2083 0 2083 0 0 0 5769 9364 0 1039 103
14 Gurundia 3275 17088 20363 1518 0 1518 0 0 0 4793 17088 219 489 70
15 Bonaigarh 6413 19244 25657 2013 0 2013 0 0 0 8426 19244 114 786 90
16 Lahunipada 1975 14269 16244 1047 0 1047 0 0 0 3022 14269 132 605 73
17 Koida 2121 16779 18900 1293 0 1293 0 0 0 3414 16779 159 544 70

20
2.2 Production and Productivity of Major Crops
Cereals like paddy, maize, jowar and other millets, pulses such as arhar, green gram,
blackgram and others, oilseeds such as groundnut, till sunflower, mustard and castor and other
crops are grown in the district. Sugarcane is the major cash crop grown in irrigated areas. Average
yield of the main crop rice, pulses and oilseed crops is 3508, 640and 581 kg per ha. The district
produces 795409, 42255, 20811 MT of cereals, pulses, oilseeds, from its crop fields. The block
wise area area covered under various crops is given in Table.
. TABLE 2.2 Major crops grown in the district
Crop Sown area in ha
Season Cereals
coarse
cereals pulses oilseeds fibre Vegetable Sugarcane
Any other
crops
Name of the Block: Hemgir
A. Kharif 13707 318 2859 1161 34 1368 0 195
B. Rabi 25 0 1756 256 0 1371 0 323
Summer 0 0 0 0 0 0 0 0
Plantation 0 0 0 0 0 0 0 781
Total 13732 318 4615 1417 34 2739 0 1299
Name of the Block: Lephripara
A. Kharif 10926 172 2434 1305 53 1284 0 172
B. Rabi 31 0 1242 887 0 1761 0 312
Summer 0 0 0 0 0 0 0
Plantation 0 0 0 0 0 0 865
Total 10957 172 3676 2192 53 3045 0 1349
Name of the Block: Tangarpali
A. Kharif 12479 136 1972 1578 35 891 0 196
B. Rabi 37 0 1392 345 0 1419 20 243
Summer 0 0 0 0 0 0 0 0
Plantation 0 0 0 0 0 0 0 616
Total 12516 136 3364 1923 35 2310 20 1055
Name of the Block: Sundargarh
A. Kharif 14130 331 1974 1590 52 1173 0 257
B. Rabi 137 0 1409 475 0 2110 10 400
Summer 0 0 0 0 0 0 0 0
Plantation 0 0 0 0 0 0 0 702
Total 14267 331 3383 2065 52 3283 10 1359
Name of the Block: Subdega
A. Kharif 11483 203 1531 1476 131 1636 0 350
B. Rabi 107 0 1683 444 0 1950 11 262
Summer 0 0 0 0 0 0 0 0
Plantation 0 0 0 0 0 0 0 690
Total 11590 203 3214 1920 131 3586 11 1302

21
Name of the Block: Balishankara
A. Kharif 12921 220 2030 1698 42 1610 0 117
B. Rabi 416 0 1208 718 0 1861 1 248
Summer 0 0 0 0 0 0 0 0
Plantation 0 0 0 0 0 0 0 571
Total 13337 220 3238 2416 42 3471 1 936
Name of the Block: Bargaon
A. Kharif 11664 246 1741 1245 16 1407 0 241
B. Rabi 80 0 1507 508 0 1531 9 434
Summer 0 0 0 0 0 0 0 0
Plantation 0 0 0 0 0 0 0 713
Total 11744 246 3248 1753 16 2938 9 1388
Name of the Block: kutra
A. Kharif 11760 377 3495 1709 42 2012 0 415
B. Rabi 161 0 1379 483 0 2101 14 367
Summer 0 0 0 0 0 0 0 0
Plantation 0 0 0 0 0 0 0 701
Total 11921 377 4874 2192 42 4113 14 1483
Name of the Block:Rajgangpur
A. Kharif 11353 132 3375 2031 32 1595 0 479
B. Rabi 1120 0 1503 608 0 1920 0 374
Summer 0 0 0 00 0 0 0 0
Plantation 0 0 0 0 0 0 0 607
Total 12473 132 4878 2639 32 3515 0 1460
Name of the Block:Lathikata
A. Kharif 19542 113 2021 1024 40 1869 0 199
B. Rabi 271 0 2327 797 0 2804 0 294
Summer 0 0 0 0 0 0 0 0
Plantation 0 0 0 0 0 0 0 824
Total 19813 113 4348 1821 40 4673 0 1317
Name of the Block:Kuarmunda
A. Kharif 16797 253 2262 1865 43 1349 0 203
B. Rabi 160 0 2381 853 0 1908 0 269
Summer 0 0 0 0 0 0 0 0
Plantation 0 0 0 0 0 0 0 916
Total 16957 253 4643 2718 43 3257 0 1388
Name of the Block:Nuagaon
A. Kharif 22241 234 1972 1116 45 1906 0 200
B. Rabi 197 0 2523 878 0 2226 0 345
Summer 0 0 0 0 0 0 0 0
Plantation 0 0 0 0 0 0 0 1324
Total 22438 234 4495 1994 45 4132 0 1869

22
Name of the Block:Bisra
A. Kharif 6975 296 934 422 27 879 0 127
B. Rabi 153 0 2238 811 0 1901 0 237
Summer 0 0 0 0 0 0 0 0
Plantation 0 0 0 0 0 0 0 1039
Total 7128 296 3172 1233 27 2780 0 1403
Name of the Block:Bonei
A. Kharif 12320 650 1748 1491 42 1290 0 197
B. Rabi 88 20 1659 1079 0 1323 0 255
Summer 0 0 0 0 0 0 0 0
Plantation 0 0 0 0 0 0 0 708
Total 12408 670 3407 2570 42 2613 0 1160
Name of the Block:Lahunipara
A. Kharif 14472 1083 1814 1420 39 1298 0 201
B. Rabi 119 120 1960 1206 0 1705 0 293
Summer 0 0 0 0 0 0 0 0
Plantation 0 0 0 0 0 0 0 900
Total 14591 1203 3774 2626 39 3003 0 1394
Name of the Block:Koira
A. Kharif 10653 658 1613 858 56 909 0 180
B. Rabi 51 42 1825 1134 0 778 0 260
Summer 0 0 0 0 0 0 0 0
Plantation 0 0 0 0 0 0 0 737
Total 10704 700 3438 1992 56 1687 0 1177
Name of the Block:Gurundia
A. Kharif 12297 503 2069 1448 43 735 0 187
B. Rabi 54 54 2183 930 0 957 0 221
Summer 0 0 0 0 0 0 0 0
Plantation 0 0 0 0 0 0 0 703
Total 12351 557 4252 2378 43 1692 0 1111

23
Cropproductionandproductivityofmajorcrops
Crop Sown Rainfed Total
SL.NO BLOCK
CEREALS coarse
cereals Pulses oilseeds
fibre
crops SPICES
Any
other
crops
Area(ha) Production
(qtn/yr)
Productivity
or Yield
(kg/ha)
Cost of
Cultivation
(Rs/ha)
Area(ha) Production
(qtn/yr)
Productivity
or Yield
(kg/ha)
Production
(qtn/yr)
Productivity
or Yield
(kg/ha)
1 Hemgir 13732 318 4615 1417 34 518 2739 19324 561092 29036 15200 3731 120628 32331 681720 30683.6600
2 Lephripada 10957 172 3676 2192 53 484 3045 16174 548963 33941 15200 4233 157502 37208 706465 35574.5861
3 Tangarpali 12516 136 3364 1923 35 439 2410 17251 557034 32290 15200 3436 127852 37210 684886 34749.7394
4 Sundargarh 14267 331 3383 2065 52 657 3283 19176 553250 28851 15200 4531 191328 42226 744578 35538.8025
5 Subdega 11590 203 3214 1920 131 612 3586 16607 607153 36560 15200 4446 176983 39807 784136 38183.6118
6 Balisankara 13337 220 3238 2416 42 365 3471 18418 555445 30158 15200 4451 179653 40362 735097 35260.0182
7 Bargaon 11744 246 3248 1753 16 675 2938 16314 540728 33145 15200 4060 139904 34459 680632 33802.0376
8 Kutra 11921 377 4874 2192 42 782 4113 19433 650814 33490 15200 4491 184306 41039 835120 37264.5380
9 Rajgangpur 12473 132 4878 2639 32 853 3515 18865 550544 29183 15200 5525 225239 40767 775783 34975.3025
10 Kuarmunda 19813 113 4348 1821 40 493 4673 24695 823735 33356 15200 6493 272412 41955 1096147 37655.5439
11 Nuagaon 16957 253 4643 2718 43 472 3257 22519 985165 43748 15200 5571 191793 34427 1176959 39087.6174
12 Bisra 22438 234 4495 1994 45 545 4132 27480 1389600 50568 15200 6169 244757 39675 1634357 45121.4828
13 Lathikata 7128 296 3172 1233 27 364 2780 9364 379709 40550 15200 5340 190620 35697 570329 38123.2761
14 Gurundia 12408 670 3407 2570 42 452 2613 17088 638713 37378 15200 4404 152209 34561 790921 35969.66521
15 Bonaigarh 14591 1103 3774 2626 39 494 3003 19244 838205 43557 15200 5283 191092 36171 1029297 39863.9100
16 Lahunipada 10704 700 3438 1992 56 440 1687 14269 534847 37483 15200 4048 85869 21213 620716 29347.8936
17 Koida 12351 557 4252 2378 43 408 1692 16779 406496 24226 15200 4345 107612 24767 514108 24496.6374

24
2.3 Irrigation Based Classification
The irrigation based classification of the crop land in the district is given in Table 2.3.
An area of 55690ha covered under4medium irrigation project,MIP and lift irrigation points have
assured irrigation in kharif, whereas, the rest of the irrigated area i.e. 19700 ha is under
protective irrigation. 2,37,610 ha is under rain fed cropping.
Table.5.6Irrigationbased Classification
Rain fed (Area in Ha)
Sl.
No.
Name of the
Block Net
Irrigated
Area (Kharif)
Net
Irrigated
Area (Rabi)
Partially Irrigated/
Protective Irrigation
Un-Irrigated or
Totally Rain fed
1 Hemgir 2876 1666
2 Lephripada 6217 1775
3 Tangarpali 5090 1551
4 Sundargarh 4853 2213
5 Subdega 4328 1563
6 Balisankara 6538 2022
7 Bargaon 3909 2181
8 Kutra 3804 2769
9 Rajgangpur 7054 3721
10 Lathikata 6122 3273
11 Kuarmunda 3368 2185
12 Nuagaon 3761 2553
13 Bisra 3686 2083
14 Bonai 3275 1518
15 Lahunipada 6413 2013
16 Koida 1975 1047
17 Gurundia 2121 1293
75391 35426

25
Chapter III
WATER AVAILABILITY

26
Chapter III
WATER AVAILABILITY
3.1 Status of Water Availability
Out of the total cropped area of 313000 ha, 75391 ha and 35426 ha area is covered under
irrigation in kharif and rabi season, respectively. The volumetric estimation of this irrigation
comes to 0.1565 BCM .The block wise details of this estimate of water availability through
irrigation infrastructure created is given in Table.
While 67,360 ha is being irrigated from surface irrigation sources, 8,030 ha is being irrigated
from ground water sources.
Irrigation potential created
Source Kharif( Ha.) Rabi ( Ha.)
Medium 13460 7480
Minor 28696 3971
Lift 19869 11409
Deep Borewell 18065 5228
Other Sources 33585 20517
Jalanidhi 1058 132
Total 114733 48737

27
Hemgir
in ha. BCM
Sl.No Source Kharif Rabi Summer Total Kharif Rabi Summer Total
1 Surface Irrigation
(i) Canal (Major & Medium
Irrigation)
0 0 0 0 0.0000 0.0000 0.0000 0.0000
(ii) Minor Irrigation tanks 645 74 0 719 0.0106 0.0008 0.0000 0.0114
(iii) Lift Irrigation / Diversion 761 516 0 1277 0.0114 0.0039 0.0000 0.0153
(iv) Various WaterBodiesinculding
Rain water harvesting
1000 512 0 1512 0.0150 0.0038 0.0000 0.0188
(v) Treated Effluent Received
from STP
0 0 0 0 0.0000 0.0000 0.0000 0.0000
(vi) Untreated Effluent 0 0 0 0 0.0000 0.0000 0.0000 0.0000
(vi) Perennial sources of water. 0 0 0 0 0.0000 0.0000 0.0000 0.0000
2 Ground Water 0 0.0000 0.0000 0.0000 0.0000
(i) Open Well 470 564 0 1034 0.0071 0.0042 0.0000 0.0113
(ii) Deep Tube Well 0 0 0 0 0.0000 0.0000 0.0000 0.0000
(iii) Medium Tube Well 0 0 0 0 0.0000 0.0000 0.0000 0.0000
(iv) Shallow Tube Wells
2876 1666 0 4542 0.0441 0.0127 0.0000 0.0569

28
Lephripara
in ha. BCM
Sl.No Source Kharif Rabi Summer Total Kharif Rabi Summer Total
1 Surface Irrigation
(i) Canal (Major & Medium
Irrigation)
2238 223 0 2461 0.04 0.00 0.00 0.04
(ii) Minor Irrigation tanks 1579 108 0 1687 0.03 0.00 0.00 0.03
(iii) Lift Irrigation / Diversion 1030 462 0 1492 0.02 0.00 0.00 0.02
(iv) Various WaterBodiesinculding
Rain water harvesting
1050 490 0 1540 0.02 0.00 0.00 0.02
(v) Treated Effluent Received
from STP
0 0 0 0 0.00 0.00 0.00 0.00
(vi) Untreated Effluent 0 0 0 0 0.00 0.00 0.00 0.00
(vi) Perennial sources of water. 0 0 0 0 0.00 0.00 0.00 0.00
2 Ground Water 0 0.00 0.00 0.00 0.00
(i) Open Well 320 492 0.00 0.00 0.00 0.01
(ii) Deep Tube Well 0.00 0.00 0.00 0.00
(iii) Medium Tube Well 0.00 0.00 0.00 0.00
(iv) Shallow Tube Wells 0.00 0.00 0.00 0.00
6217 1775 0 7180 0.10 0.01 0.00 0.11

29
Tanagarpali in ha. BCM
Sl.No Source Kharif Rabi Summer Total Kharif Rabi Summer Total
1 Surface Irrigation
(i) Canal (Major & Medium
Irrigation)
0 0 0 0.00 0.00 0.00 0.00
(ii) Minor Irrigation tanks 1775 10 1785 0.03 0.00 0.00 0.03
(iii) Lift Irrigation / Diversion 1265 499 1764 0.02 0.00 0.00 0.02
(iv) Various WaterBodiesinculding
Rain water harvesting
1150 490 1640 0.02 0.00 0.00 0.02
(v) Treated Effluent Received
from STP
0 0.00 0.00 0.00 0.00
(vi) Untreated Effluent 0 0.00 0.00 0.00 0.00
(vi) Perennial sources of water. 0 0.00 0.00 0.00 0.00
2 Ground Water 0.00 0.00 0.00 0.00
(i) Open Well 900 552 1452 0.01 0.00 0.00 0.02
(ii) Deep Tube Well 0 0.00 0.00 0.00 0.00
(iii) Medium Tube Well 0 0.00 0.00 0.00 0.00
(iv) Shallow Tube Wells 0 0.00 0.00 0.00 0.00
5090 1551.00 0 6641 0.08 0.01 0.00 0.09

30
Sundargarh
in ha. BCM
Sl.No Source Kharif Rabi Summer Total Kharif Rabi Summer Total
1 Surface Irrigation
(i) Canal (Major & Medium
Irrigation)
0 0 0 0.00 0.00 0.00 0.00
(ii) Minor Irrigation tanks 1509 85 1594 0.02 0.00 0.00 0.03
(iii) Lift Irrigation / Diversion 1474 978 2452 0.02 0.01 0.00 0.03
(iv) Various WaterBodiesinculding
Rain water harvesting
1130 546 1676 0.02 0.00 0.00 0.02
(v) Treated Effluent Received
from STP
0 0.00 0.00 0.00 0.00
(vi) Untreated Effluent 0 0.00 0.00 0.00 0.00
(vi) Perennial sources of water. 0 0.00 0.00 0.00 0.00
2 Ground Water 0.00 0.00 0.00 0.00
(i) Open Well 740 604 1344 0.01 0.00 0.00 0.02
(ii) Deep Tube Well 0 0.00 0.00 0.00 0.00
(iii) Medium Tube Well 0 0.00 0.00 0.00 0.00
(iv) Shallow Tube Wells 0 0.00 0.00 0.00 0.00
4853 2213 0 7066 0.08 0.02 0.00 0.09

31
Subdega in ha. BCM
Sl.No Source Kharif Rabi Summer Total Kharif Rabi Summer Total
1 Surface Irrigation
(i) Canal (Major & Medium
Irrigation)
1467 60 1527 0.02 0.00 0.00 0.02
(ii) Minor Irrigation tanks 387 90 477 0.01 0.00 0.00 0.01
(iii) Lift Irrigation / Diversion 704 404 1108 0.01 0.00 0.00 0.01
(iv) Various WaterBodiesinculding
Rain water harvesting
1220 493 1713 0.02 0.00 0.00 0.02
(v) Treated Effluent Received
from STP
0 0.00 0.00 0.00 0.00
(vi) Untreated Effluent 0 0.00 0.00 0.00 0.00
(vi) Perennial sources of water. 0 0.00 0.00 0.00 0.00
2 Ground Water 0.00 0.00 0.00 0.00
(i) Open Well 550 516 1066 0.01 0.00 0.00 0.01
(ii) Deep Tube Well 0 0.00 0.00 0.00 0.00
(iii) Medium Tube Well 0 0.00 0.00 0.00 0.00
(iv) Shallow Tube Wells 0 0.00 0.00 0.00 0.00
5891 0.07 0.01 0.00 0.08

32
Balisankara in ha. BCM
Sl.No Source Kharif Rabi Summer Total Kharif Rabi Summer Total
1 Surface Irrigation
(i) Canal (Major & Medium
Irrigation)
1569 392 1961 0.03 0.00 0.00 0.03
(ii) Minor Irrigation tanks 2801 105 2906 0.05 0.00 0.00 0.05
(iii) Lift Irrigation / Diversion 568 471 1039 0.01 0.00 0.00 0.01
(iv) Various Water Bodies
including Rain water
harvesting
1180 543 1723 0.02 0.00 0.00 0.02
(v) Treated Effluent Received
from STP
0 0.00 0.00 0.00 0.00
(vi) Untreated Effluent 0 0.00 0.00 0.00 0.00
(vi) Perennial sources of water. 0 0.00 0.00 0.00 0.00
2 Ground Water 0.00 0.00 0.00 0.00
(i) Open Well 420 511 931 0.01 0.00 0.00 0.01
(ii) Deep Tube Well 0 0.00 0.00 0.00 0.00
(iii) Medium Tube Well 0 0.00 0.00 0.00 0.00
(iv) Shallow Tube Wells 0 0.00 0.00 0.00 0.00
6538 2022 0 8560 0.10 0.02 0.00 0.12

33
Bargaon in ha. BCM
Sl.No Source Kharif Rabi Summer Total Kharif Rabi Summer Total
1 Surface Irrigation
(i) Canal (Major & Medium
Irrigation)
0 0 0 0.00 0.00 0.00 0.00
(ii) Minor Irrigation tanks 1120 79 1199 0.02 0.00 0.00 0.02
(iii) Lift Irrigation / Diversion 1019 939 1958 0.02 0.01 0.00 0.02
(iv) Various Water Bodies
including Rain water
harvesting
1170 738 1908 0.02 0.01 0.00 0.02
(v) Treated Effluent Received
from STP
0 0.00 0.00 0.00 0.00
(vi) Untreated Effluent 0 0.00 0.00 0.00 0.00
(vi) Perennial sources of water. 0 0.00 0.00 0.00 0.00
2 Ground Water 0.00 0.00 0.00 0.00
(i) Open Well 600 425 1025 0.01 0.00 0.00 0.01
(ii) Deep Tube Well 0 0.00 0.00 0.00 0.00
(iii) Medium Tube Well 0 0.00 0.00 0.00 0.00
(iv) Shallow Tube Wells 0 0.00 0.00 0.00 0.00
3909 2181 0 6090 0.06 0.02 0.00 0.08

34
Kutra in ha. BCM
Sl.No Source Kharif Rabi Summer Total Kharif Rabi Summer Total
1 Surface Irrigation
(i) Canal (Major & Medium
Irrigation)
0 0 0 0.00 0.00 0.00 0.00
(ii) Minor Irrigation tanks 267 8 275 0.00 0.00 0.00 0.00
(iii) Lift Irrigation / Diversion 1727 1495 3222 0.03 0.01 0.00 0.04
(iv) Various Water Bodies
including Rain water
harvesting
1150 826 1976 0.02 0.01 0.00 0.02
(v) Treated Effluent Received
from STP
0 0.00 0.00 0.00 0.00
(vi) Untreated Effluent 0 0.00 0.00 0.00 0.00
(vi) Perennial sources of water. 0 0.00 0.00 0.00 0.00
2 Ground Water 0.00 0.00 0.00 0.00
(i) Open Well 660 440 1100 0.01 0.00 0.00 0.01
(ii) Deep Tube Well 0 0.00 0.00 0.00 0.00
(iii) Medium Tube Well 0 0.00 0.00 0.00 0.00
(iv) Shallow Tube Wells 0 0.00 0.00 0.00 0.00
3804 2769 0 6573 0.06 0.02 0.00 0.08

35
Rajgangpur
in ha. BCM
Sl.No Source Kharif Rabi Summer Total Kharif Rabi Summer Total
1 Surface Irrigation
(i) Canal (Major & Medium
Irrigation)
4421 1325 5746 0.07 0.01 0.00 0.09
(ii) Minor Irrigation tanks 157 20 177 0.00 0.00 0.00 0.00
(iii) Lift Irrigation / Diversion 1076 1136 2212 0.02 0.01 0.00 0.02
(iv) Various Water Bodies
including Rain water
harvesting
1150 715 1865 0.02 0.01 0.00 0.02
(v) Treated Effluent Received
from STP
0 0.00 0.00 0.00 0.00
(vi) Untreated Effluent 0 0.00 0.00 0.00 0.00
(vi) Perennial sources of water. 0 0.00 0.00 0.00 0.00
2 Ground Water 0.00 0.00 0.00 0.00
(i) Open Well 250 525 775 0.00 0.00 0.00 0.01
(ii) Deep Tube Well 0 0.00 0.00 0.00 0.00
(iii) Medium Tube Well 0 0.00 0.00 0.00 0.00
(iv) Shallow Tube Wells 0 0.00 0.00 0.00 0.00
7054 3721 0 10775 0.11 0.03 0.00 0.15

36
Lathikata in ha. BCM
Sl.No Source Kharif Rabi Summer Total Kharif Rabi Summer Total
1 Surface Irrigation
(i) Canal (Major & Medium
Irrigation)
2427 1025 3452 0.04 0.01 0.00 0.05
(ii) Minor Irrigation tanks 524 10 534 0.01 0.00 0.00 0.01
(iii) Lift Irrigation / Diversion 1571 1205 2776 0.02 0.01 0.00 0.03
(iv) Various Water Bodies
including Rain water
harvesting
1250 633 1883 0.02 0.00 0.00 0.02
(v) Treated Effluent Received
from STP
0 0.00 0.00 0.00 0.00
(vi) Untreated Effluent 0 0.00 0.00 0.00 0.00
(vi) Perennial sources of water. 0 0.00 0.00 0.00 0.00
2 Ground Water 0.00 0.00 0.00 0.00
(i) Open Well 350 400 750 0.01 0.00 0.00 0.01
(ii) Deep Tube Well 0 0.00 0.00 0.00 0.00
(iii) Medium Tube Well 0 0.00 0.00 0.00 0.00
(iv) Shallow Tube Wells 0 0.00 0.00 0.00 0.00
6122 3273 0 9395 0.10 0.03 0.00 0.12

37
Kuarmunda in ha. BCM
Sl.No Source Kharif Rabi Summer Total Kharif Rabi Summer Total
1 Surface Irrigation
(i) Canal (Major & Medium
Irrigation)
0 0 0 0.00 0.00 0.00 0.00
(ii) Minor Irrigation tanks 456 35 491 0.01 0.00 0.00 0.01
(iii) Lift Irrigation / Diversion 1111 1041 2152 0.02 0.01 0.00 0.02
(iv) Various Water Bodies
including Rain water
harvesting
1200 539 1739 0.02 0.00 0.00 0.02
(v) Treated Effluent Received
from STP
0 0.00 0.00 0.00 0.00
(vi) Untreated Effluent 0 0.00 0.00 0.00 0.00
(vi) Perennial sources of water. 0 0.00 0.00 0.00 0.00
2 Ground Water 0.00 0.00 0.00 0.00
(i) Open Well 600 570 1170 0.01 0.00 0.00 0.01
(ii) Deep Tube Well 0 0.00 0.00 0.00 0.00
(iii) Medium Tube Well 0 0.00 0.00 0.00 0.00
(iv) Shallow Tube Wells 0 0.00 0.00 0.00 0.00
3367 2185 0 5552 0.05 0.02 0.00 0.07

38
Nuagaon
in ha. BCM
Sl.No Source Kharif Rabi Summer Total Kharif Rabi Summer Total
1 Surface Irrigation
(i) Canal (Major & Medium
Irrigation)
0 0 0 0 0.00 0.00 0.00 0.00
(ii) Minor Irrigation tanks 0 0 0.00 0.00 0.00 0.00
(iii) Lift Irrigation / Diversion 1861 1300 0.03 0.01 0.00 0.04
(iv) Various Water Bodies
including Rain water
harvesting
1250 633 0.02 0.00 0.00 0.02
(v) Treated Effluent Received
from STP
0.00 0.00 0.00 0.00
(vi) Untreated Effluent 0.00 0.00 0.00 0.00
(vi) Perennial sources of water. 0.00 0.00 0.00 0.00
2 Ground Water 0.00 0.00 0.00 0.00
(i) Open Well 650 620 0.01 0.00 0.00 0.01
(ii) Deep Tube Well 0.00 0.00 0.00 0.00
(iii) Medium Tube Well 0.00 0.00 0.00 0.00
(iv) Shallow Tube Wells 0.00 0.00 0.00 0.00
3761 2553 0 0 0.06 0.02 0.00 0.08

39
Bisra
in ha. BCM
Sl.No Source Kharif Rabi Summer Total Kharif Rabi Summer Total
1 Surface Irrigation
(i) Canal (Major & Medium
Irrigation)
0 0 0 0 0.00 0.00 0.00 0.00
(ii) Minor Irrigation tanks 642 36 0.01 0.00 0.00 0.01
(iii) Lift Irrigation / Diversion 1514 1334 0.02 0.01 0.00 0.03
(iv) Various Water Bodies
including Rain water
harvesting
1300 433 0.02 0.00 0.00 0.02
(v) Treated Effluent Received
from STP
0.00 0.00 0.00 0.00
(vi) Untreated Effluent 0.00 0.00 0.00 0.00
(vi) Perennial sources of water. 0.00 0.00 0.00 0.00
2 Ground Water 0.00 0.00 0.00 0.00
(i) Open Well 230 280 0.00 0.00 0.00 0.01
(ii) Deep Tube Well 0.00 0.00 0.00 0.00
(iii) Medium Tube Well 0.00 0.00 0.00 0.00
(iv) Shallow Tube Wells 0.00 0.00 0.00 0.00
3686 2083 0 0 0.06 0.02 0.00 0.07

40
BONEI
in ha. BCM
Sl.No Source Kharif Rabi Summer Total Kharif Rabi Summer Total
1 Surface Irrigation
(i) Canal (Major & Medium
Irrigation)
0 0 0 0 0.00 0.00 0.00 0.00
(ii) Minor Irrigation tanks 1035 114 1149 0.02 0.00 0.00 0.02
(iii) Lift Irrigation / Diversion 788 469 1257 0.01 0.00 0.00 0.02
(iv) Various Water Bodies
including Rain water
harvesting
1100 583 1683 0.02 0.00 0.00 0.02
(v) Treated Effluent Received
from STP
0 0.00 0.00 0.00 0.00
(vi) Untreated Effluent 0 0.00 0.00 0.00 0.00
(vi) Perennial sources of water. 0 0.00 0.00 0.00 0.00
2 Ground Water 0.00 0.00 0.00 0.00
(i) Open Well 352 352 704 0.01 0.00 0.00 0.01
(ii) Deep Tube Well 0 0.00 0.00 0.00 0.00
(iii) Medium Tube Well 0 0.00 0.00 0.00 0.00
(iv) Shallow Tube Wells 0 0.00 0.00 0.00 0.00
3275 1518 0 4793 0.05 0.01 0.00 0.06

41
LAHUNIPADA
in ha. BCM
Sl.No Source Kharif Rabi Summer Total Kharif Rabi Summer Total
1 Surface Irrigation
(i) Canal (Major & Medium
Irrigation)
0 0 0 0 0.00 0.00 0.00 0.00
(ii) Minor Irrigation tanks 3918 380 4298 0.06 0.00 0.00 0.07
(iii) Lift Irrigation / Diversion 1005 650 1655 0.02 0.00 0.00 0.02
(iv) Various Water Bodies
including Rain water
harvesting
1151 633 1784 0.02 0.00 0.00 0.02
(v) Treated Effluent Received
from STP
0 0.00 0.00 0.00 0.00
(vi) Untreated Effluent 0 0.00 0.00 0.00 0.00
(vi) Perennial sources of water. 0 0.00 0.00 0.00 0.00
2 Ground Water 0.00 0.00 0.00 0.00
(i) Open Well 340 350 690 0.01 0.00 0.00 0.01
(ii) Deep Tube Well 0 0.00 0.00 0.00 0.00
(iii) Medium Tube Well 0 0.00 0.00 0.00 0.00
(iv) Shallow Tube Wells 0 0.00 0.00 0.00 0.00
6414 2013 0 8427 0.10 0.02 0.00 0.12
KOIDA

42
in ha. BCM
Sl.No Source Kharif Rabi Summer Total Kharif Rabi Summer Total
1 Surface Irrigation
(i) Canal (Major & Medium
Irrigation)
0 0 0 0 0.00 0.00 0.00 0.00
(ii) Minor Irrigation tanks 582 110 692 0.01 0.00 0.00 0.01
(iii) Lift Irrigation / Diversion 113 144 257 0.00 0.00 0.00 0.00
(iv) Various Water Bodies
including Rain water
harvesting
1051 533 1584 0.02 0.00 0.00 0.02
(v) Treated Effluent Received
from STP
0 0.00 0.00 0.00 0.00
(vi) Untreated Effluent 0 0.00 0.00 0.00 0.00
(vi) Perennial sources of water. 0 0.00 0.00 0.00 0.00
2 Ground Water 0.00 0.00 0.00 0.00
(i) Open Well 230 260 490 0.00 0.00 0.00 0.01
(ii) Deep Tube Well 0 0.00 0.00 0.00 0.00
(iii) Medium Tube Well 0 0.00 0.00 0.00 0.00
(iv) Shallow Tube Wells 0 0.00 0.00 0.00 0.00
1976 1047 0 3023 0.03 0.01 0.00 0.04
GURUNDIA

43
in ha. BCM
Sl.No Source Kharif Rabi Summer Total Kharif Rabi Summer Total
1 Surface Irrigation
(i) Canal (Major & Medium
Irrigation)
0 0 0 0 0.00 0.00 0.00 0.00
(ii) Minor Irrigation tanks 144 0 144 0.00 0.00 0.00 0.00
(iii) Lift Irrigation / Diversion 409 340 749 0.01 0.00 0.00 0.01
(iv) Various Water Bodies
including Rain water
harvesting
1200 603 1803 0.02 0.00 0.00 0.02
(v) Treated Effluent Received
from STP
0 0.00 0.00 0.00 0.00
(vi) Untreated Effluent 0 0.00 0.00 0.00 0.00
(vi) Perennial sources of water. 0 0.00 0.00 0.00 0.00
2 Ground Water 0.00 0.00 0.00 0.00
(i) Open Well 368 350 718 0.01 0.00 0.00 0.01
(ii) Deep Tube Well 0 0.00 0.00 0.00 0.00
(iii) Medium Tube Well 0 0.00 0.00 0.00 0.00
(iv) Shallow Tube Wells 0 0.00 0.00 0.00 0.00
2121 1293 0 3414 0.03 0.01 0.00 0.04
3.2 Status of Ground Water Availability

44
As per Central Ground Water Board (CGWB) all the blocks are in the safe limits of ground water utilization. The details of
draft, recharge and gap of ground water in all the blocks is given in Table
Table.5.8StatusofGroundWaterAvailability
Name of the District: SUNDARGARH
Status of Block as per Central Ground
Water Board Notification Ground Water
(BCM) SL.NO.
NAME OF THE
BLOCK Critical
Semi-
Critical Safe Draft Recharge Gap
1 Hemgir Safe 0.0098 0.0616 0.0518
2 Lephripada Safe 0.0089 0.0316 0.0227
3 Tangarpali Safe 0.1710 0.7733 0.6023
4 Sundargarh Safe 0.0142 0.0358 0.0217
5 Subdega Safe 0.0084 0.0267 0.0183
6 Balisankara Safe 0.0109 0.0441 0.0332
7 Bargaon Safe 0.0125 0.0326 0.0201
8 Kutra Safe 0.0106 0.0504 0.0398
9 Rajgangpur Safe 0.0119 0.0523 0.0404
10 Kuarmunda Safe 0.0095 0.0907 0.0813
11 Nuagaon Safe 0.0103 0.0335 0.0232
12 Bisra Safe 0.0134 0.0709 0.0575
13 Lathikata Safe 0.0066 0.0719 0.0653
14 Gurundia Safe 0.0100 0.0560 0.0460
15 Bonaigarh Safe 0.0069 0.0308 0.0240
16 Lahunipada Safe 0.0095 0.0310 0.0215
17 Koida Safe 0.0060 0.0274 0.0214

45
3.3 Status of Command Area
The command area development and participatory irrigation management taken up in the state under the centrally sponsored
plan scheme has not been extended to all the irrigation projects in the district as yet. Only four medium irrigation projects are covered
in this programme and the details of the developed area is given in Table.
Table5.9Statusofcommandarea
Status of Command Area Source: CADA, CGWB
Name of the State: ODISHA
Name of the District: SUNDARGRH
Area in Ha
S.No. Block
Name
of the
Village
Information of Canal
Command
Information on the other
Services Command Total Area
No. of
Village
Total
Area in
ha.
Developed
Area
Undeveloped
Area
Total
Area
Developed
Area
Undeveloped
Area
Developed
Command
Undeveloped
Command
1 2 3 4 5 6 7 8 4+7 5+8
1 Lathikata 19 2737.67 2427.11 10.54
2 Rajgangpur 23 5242.35 4420.89 821.46
3 Subdega 6 1467.31 1467.31 0
4 Balisankara 4 1568.69 1568.69 0
5 Lephripada 9 2238 2238 0

46
3.4 Existing Type of Irrigation In total 29562 units of irrigation source are in operation in the district to provide irrigation in 75391ha land in kharif and 35426 ha of
land in rabi crop season. The block wise details of this is given in Table.
TableExistingtypeof irrigation Existing type of irrigation Source:NWDA,CGG
Name of the state: ODISHA
Name of the District: SUNDARGARH
Surface Irrigation(1) Ground Water (2)
Water
extractio
n
devices/L
ift
canal based tanks/ponds/Reservoirs Tubewell Open Well Bore well
BLO
CK
So
urc
e o
f ir
riga
tio
n
Govt.
Canal
Commun
ity/Pvt.
Canal
Commun
ity ponds
including
small
Individu
al/Pvt.
Ponds
Govt.
Reservoir
s/Dams
Govt. Pvt. Communi
ty/Govt. Pvt. Govt. Pvt
other
source
includin
g
traditio
nal
WHS(3)
Treated
effluent
discharg
ed from
STP Electricit
y
pump(4)
K
m.
com
and
area
(ha)
N
o
com
and
area
(ha)
N
o
com
and
are
a(h
a)
N
o
com
and
are
a(h
a)
N
o
com
and
area
(ha)
N
o
com
and
are
a(h
a)
N
o
com
and
are
a(h
a)
No
com
and
are
a(h
a)
N
o
com
and
are
a(h
a)
N
o
com
and
are
a(h
a)
N
o
com
and
are
a(h
a)
N
o
com
and
are
a(h
a)
N
o
com
and
are
a(h
a)
N
o
com
and
area
(ha)
Hemgi
r 0 0 0 0
13
7 54.8
22
8 91.2
3
4 813 0 0 0 0
11
90 450 0 0
48
2 964 0 0 0 0 0 0 47
108
8.96
Lephri
pada
43.
05
223
8 0 0
15
2 60.8
24
3 97.2
4
5
1528
.43 0 0 0 0
79
5 360 0 0
18
4 368 0 0 0 0 0 0 81
176
0.52
Tanga
rpali 0 0 71 28.4
13
6 54.4
3
5
1903
.43 0 0 0 0
15
35 450 0 0 53 106 0 0 0 0 0 0 89
199
8.03
Balisa
nkara
34.
08
156
8.69 0 0
13
7 54.8 49 19.6
5
0 2675 0 0 0 0
10
50 400 0 0
28
5 570 0 0 0 0 0 0 55
111
7.84
Subde
ga
19.
72
5
146
7.31 0 0
16
4 65.6
20
9 83.6
3
7 541 0 0 0 0
12
50 450 0 0 72 144 0 0 0 0 0 0 54
129
4.4
Sunda
rgarh 0 0 0 0 98 39.2
16
1 64.4
6
1
1477
.2 0 0 0 0
16
10 500 0 0 69 138 0 0 0 0 0 0
11
2
233
6.44
Barag
aon 0 0 0 0
12
5 50
20
2 80.8
4
7
1277
.3 0 0 0 0
13
50 400 0 0
15
9 318 0 0 0 0 0 0 76
154
3.77
Kutra 0 0 0 0 97 38.8 14
5 58
3
1
430.
28 0 0 0 0
13
98 400 0 0
41
3 826 0 0 0 0 0 0
14
2
303
6.92
Kuanr
munda 0 0 0 0 96 38.4
30
7
122.
8
2
9
591.
47 0 0 0 0
12
25 570 0 0
49
5 990 0 0 0 0 0 0
10
7
279
4.25

47
Nuaga
on 0 0 0 0 73 29.2 21 8.4
2
4 120 0 0 0 0
13
28 620 0 0 28 56 0 0 0 0 0 0
16
1
358
3.86
Bisra 0 0 0 0 86 34.4 27 10.8 5
1
872.
6 0 0 0 0
59
5 280 0 0
33
1 662 0 0 0 0 0 0
11
3
237
5.23
Lathik
ata
40.
72
9
242
7.11 0 0 92 36.8 60 24
4
6
308.
5 0 0 0 0
87
8 400 0 0
47
3 946 0 0 0 0 0 0
13
8
307
5.8
Rajag
angap
ur
87.
52
442
0.89 0 0 73 29.2 85 34
1
9
219.
09 0 0 0 0
59
2 500 0 0
47
0 940 0 0 0 0 0 0 83
190
2.4
Gurun
dia
111
4.34
4
0 0 87 34.8 12
4 49.6
2
2
160.
71 0 0 0 0
92
0 250 0 0
28
1 562 0 0 0 0 0 0 53
115
8.4
Bonai
garh
404
4.61
6
0 0 18
9 75.6
17
0 68
5
1
1183
.43 0 0 0 0
88
0 250 0 0
27
9 558 0 0 0 0 0 0 51
152
5
Lahun
ipara 0 0 0 0
22
0 88
23
2 92.8
4
2
4188
.94 0 0 0 0
85
2 250 0 0
32
2 644 0 0 0 0 0 0 82
179
3.2
Koida 0 0 0 0 36 14.4 53
7
214.
8 8 617 0 0 0 0
57
6 160 0 0
20
1 402 0 0 0 0 0 0 16 420
TOT
AL
22
5.1
172
80.9
6
0 0 19
33
773.
2
29
36
117
4.4
6
3
2
1890
7.4 0 0 0 0
18
02
4
669
0 0 0
45
97
919
4 0 0 0 0 0 0
14
60
328
05.0
2

48
Chapter IV
WATER REQUIREMENT /
DEMAND

49
Chapter IV
WATER REQUIREMENT / DEMAND
It is necessary to estimate the water demand from all sources (domestic, livestock,
irrigation and industry) for comparison with the potential of available resources both from
surface and groundwater resources to arrive at a good irrigation plan. The domestic, livestock,
irrigation and industrial requirement of the district is estimated as detailed in the following
sections.
4.1 Domestic Water Demand
From the population figures of 2011 census the present population and projected
population for 2021 was estimated considering the prevailing growth rate. The domestic water
demand was then estimated considering 100 litres of consumption per person per day basis. A
demand of 0.05755 BCM and 0.06081 BCM of water was estimated as the domestic demand
during 2015 and 2020, respectively.

50
DomesticWaterDemand
Water Requirement/Demand:
4.1 Domestic Water
Demand Source: CWC, Department of Water Resources in District and Status Report
Blocks Population in 2011 Present population Present water
Demand (BCM)
Projected population
in 2020
Gross Water
Demand(BCM)
HEMGIR 90643 96081.58 0.003506977670 101520.16 0.003705486
LEPHRIPADA 78808 83536.48 0.003049081520 88264.96 0.003221671
TANGARPALI 64374 68236.44 0.002490630060 72098.88 0.002631609
SUNDARGARH 71082 75346.92 0.002750162580 79611.84 0.002905832
BALISANKARA 86803 92011.18 0.003358408070 97219.36 0.003548507
SUBDEGA 63873 67705.38 0.002471246370 71537.76 0.002611128
BARGAON 72086 76411.16 0.002789007340 80736.32 0.002946876
KUTRA 80472 85300.32 0.003113461680 90128.64 0.003289695
RAJGANGPUR 112433 119178.98 0.004350032770 125924.96 0.004596261
KUARMUNDA 106913 113327.78 0.004136463970 119742.56 0.004370603
NUAGAON 106156 112525.36 0.004107175640 118894.72 0.004339657
BISRA 90185 95596.1 0.003489257650 101007.2 0.003686763
LATHIKATA 140218 148631.08 0.005425034420 157044.16 0.005732112
GURUNDIA 67333 71372.98 0.002605113770 75412.96 0.002752573
BONAIGARH 69891 74084.46 0.002704082790 78277.92 0.002857144
LAHUNIPADA 99526 105497.56 0.003850660940 111469.12 0.004068623
KOIDA 86818 92027.08 0.003358988420 97236.16 0.00354912
TOTAL 14,87,614 15,76,871 0.05755578 1666127.68 0.06081366

51
4.2 Crop Water Demand
The block wise and crop wise area sown and the corresponding area under irrigation are
given in Table 4.2. The volumetric water demand was then estimated by multiplying the crop
water requirement for the particular crop to arrive at total water demand for irrigation for the
present cropping area. For the present cropping area of 313000 ha in kharif and 80586ha in rabi,
a total of 2.96810133 of water is required for irrigation on annual basis. Deducting the
availability of 1.45564 BCM from the existing potential created in the district a potential to
provide 1.51246 BCM is required to meet the irrigation demand of the crops being grown at the
present level.

52
CropWaterRequirement
Bargaon.
Irrigated area
(ha)
Crop water demand
(mm)
Existing water
potential (bcm)
Water potential
to be created
(bcm) Area sown (ha)
Crop water demand (bcm)
Crops
Kharif Rabi Total Kharif Rabi Total
Water potential
required (bcm)
Paddy 11050 20 11070 10 1100 0.007293 0.00022 0.007513 0.0112695
Maize 288 0 288 2 700 0.00012096 0 0.00012096 0.00018144
Ragi ( dry ) 145 0 145 0 400 0.0000348 0 0.0000348 0.0000522
Bajra ( local ) 0 0 0 0 400 0 0 0 0
Small millets 80 0 80 0 400 0.0000192 0 0.0000192 0.0000288
Jower 101 0 101 0 400 0.00002424 0 0.00002424 0.00003636
Wheat 0 60 60 17 400 0 0.00024 0.00024 0.00036
Total ceareals 11664 80 11744 0 0 0 0 0
Mung 300 18 318 0 400 0.000072 0.000072 0.000144 0.000216
Biri 608 14 622 91 400 0.00014592 0.000056 0.00020192 0.00030288
Cowpea 701 63 764 0 475 0.000199785 0.00029925 0.000499035 0.000748553
Arhar 132 0 132 0 600 0.00004752 0 0.00004752 0.00007128
Horsegram 0 980 980 0 400 0 0.00392 0.00392 0.00588
Gram 0 186 186 0 400 0 0.000744 0.000744 0.001116
Fieldpea 0 120 120 0 450 0 0.00054 0.00054 0.00081
Lentil 0 126 126 0 0 0 0 0
Total pulses 1741 1507 3248 0 0 0 0 0
Groundnut 120 0 120 0 500 0.000036 0 0.000036 0.000054
Til 1125 30 1155 326 425 0.000286875 0.0001275 0.000414375 0.000621563
Caster 0 0 0 0 500 0 0 0 0
Sunflower 0 5 5 0 400 0 0.00002 0.00002 0.00003
Mustard 0 385 385 173 400 0 0.00154 0.00154 0.00231
Nizer 0 18 18 0 0 0 0 0
Linseed 0 70 70 0 0 0 0 0
Potato 0 131 131 0 600 0 0.000786 0.000786 0.001179
Onion 0 73 73 0 600 0 0.000438 0.000438 0.000657
Other
vegetables 1277 1291 2568 0 600 0.00045972 0.007746 0.00820572 0.01230858
Turmeric 65 0 65 0 600 0.0000234 0 0.0000234 0.0000351
Zinger 40 0 40 0 600 0.0000144 0 0.0000144 0.0000216
Garlic 0 51 51 0 600 0 0.000306 0.000306 0.000459
Fiber 16 0 16 0 0 0 0 0
Sugarcane 0 9 9 0 2000 0 0.00018 0.00018 0.00027
0.039018855 0.08 -0.04

53
Hemgir
Area sown (ha) Crop water demand (bcm)
Crops Kha
rif Rabi Total
Irrigated area
(ha)
Crop water
demand (mm) Kharif Rabi Total
Water
potential
required
(bcm)
Existing
water
potential
(bcm)
Water
potential to be
created (bcm)
Paddy 129
81 10
1299
1 2855.82 1100 0.0856746 0.00011 0.085785 0.1286769
Maize 407 2 409 700 0.0017094 0.000014 0.001723 0.0025851
Ragi ( dry ) 145 0 145 400 0.000348 0 0.000348 0.000522
Bajra ( local ) 0 0 0 400 0 0 0 0
Small millets 101 0 101 400 0.0002424 0 0.000242 0.0003636
Jower 73 0 73 400 0.0001752 0 0.000175 0.0002628
Wheat 0 13 13 400 0 0.000052 0.000052 0.000078
Total cereals 137
07 25
1373
2 0 0 0 0
Mung 830 35 865 400 0.001992 0.00014 0.002132 0.003198
Biri 147
4 0 1474 221 400 0.0035376 0 0.003538 0.0053064
Cowpea 405 78 483 475 0.0011543 0.0003705 0.001525 0.002287125
Arhar 150 0 150 600 0.00054 0 0.00054 0.00081
Horsegram 0 1270 1270 400 0 0.00508 0.00508 0.00762
Gram 0 298 298 400 0 0.001192 0.001192 0.001788
Fieldpea 0 40 40 450 0 0.00018 0.00018 0.00027
Lentil 0 35 35 0 0 0 0
Total pulses 285
9 1756 4615 0 0 0 0
Groundnut 254 0 254 500 0.000762 0 0.000762 0.001143
Til 891 0 891 258 425 0.0022721 0 0.002272 0.003408075
Caster 16 0 16 500 0.000048 0 0.000048 0.000072
Sunflower 0 11 11 400 0 0.000044 0.000044 0.000066
Mustard 0 191 191 86 400 0 0.000764 0.000764 0.001146
Nizer 0 18 18 0 0 0 0
Linseed 0 36 36 0 0 0 0
Total oil seeds 116
1 256 1417 600 0.0041796 0.001536 0.005716 0.0085734
Potato 0 90 90 600 0 0.00054 0.00054 0.00081
Onion 0 294 294 600 0 0.001764 0.001764 0.002646
Other vegetables 127
1 987 2258 600 0.0045756 0.005922 0.010498 0.0157464
Turmeric 50 0 50 600 0.00018 0 0.00018 0.00027
Zinger 67 0 67 600 0.0002412 0 0.000241 0.0003618
Garlic 0 68 68 0 0 0 0
Fibers 34 0 34 2000 0.000408 0 0.000408 0.000612
368
76 5513
4238
9 3421 14750 0.1080399 0.0177085 0.1257484 0.1886226 0.0568541 0.1317685

54
Lephripada
Area sown (ha) Crop water demand (bcm) Crops
Kharif Rabi Total
Irrigated
area (ha)
Crop water
demand (mm) Kharif Rabi Total
Water potential
required (bcm)
Existing
water
potential
(bcm)
Water potential
to be created
(bcm)
Paddy 10459 22 10481 2301 1100 0.0690294 0.000242 0.0692714 0.1039071
Maize 254 4 258 700 0.0010668 0.000028 0.0010948 0.0016422
Ragi ( dry ) 72 0 72 400 0.0001728 0 0.0001728 0.0002592
Bajra ( local ) 0 0 0 400 0 0 0 0
Small millets 41 0 41 400 0.0000984 0 0.0000984 0.0001476
Jower 100 0 100 400 0.00024 0 0.00024 0.00036
Wheat 0 5 5 400 0 0.00002 0.00002 0.00003
Total cereals 10926 31 10957 0 0 0 0
Mung 56 133 189 400 0.0001344 0.000532 0.0006664 0.0009996
Biri 1723 0 1723 258 400 0.0041352 0 0.0041352 0.0062028
Cowpea 500 63 563 475 0.001425 0.00029925 0.00172425 0.002586375
Arhar 155 0 155 600 0.000558 0 0.000558 0.000837
Horsegram 0 965 965 400 0 0.00386 0.00386 0.00579
Gram 0 40 40 400 0 0.00016 0.00016 0.00024
Fieldpea 0 41 41 450 0 0.0001845 0.0001845 0.00027675
Lentil 0 0 0 0 0 0 0
Total pulses 2434 1242 3676 0 0 0 0
Groundnut 285 13 298 500 0.000855 0.000065 0.00092 0.00138
Til 1012 0 1012 293 425 0.0025806 0 0.0025806 0.0038709
Caster 8 0 8 500 0.000024 0 0.000024 0.000036
Sunflower 0 4 4 400 0 0.000016 0.000016 0.000024
Mustard 0 777 777 350 400 0 0.003108 0.003108 0.004662
Nizer 0 46 46 0 0 0 0
Linseed 0 47 47 0 0 0 0
Potato 0 96 96 600 0 0.000576 0.000576 0.000864
Onion 0 62 62 600 0 0.000372 0.000372 0.000558
Other
vegetables 1230 1588 2818 600 0.004428 0.009528 0.013956 0.020934
Turmeric 34 0 34 600 0.0001224 0 0.0001224 0.0001836
Zinger 36 0 36 600 0.0001296 0 0.0001296 0.0001944
Garlic 0 63 63 600 0 0.000378 0.000378 0.000567
Fiber 53 0 53 0 0 0 0
2000 0.156552525 0.1134184 0.043134125

55
Tangarpali
Area sown (ha) Crop water demand (bcm) Crops
Kharif Rabi Total
Irrigated area
(ha)
Crop water demand
(mm) Kharif Rabi Total
Water potential required
(bcm)
Existing water potential
(bcm)
Water potential to be created
(bcm)
Paddy 12019 8 12027 2644.18 1100 0.0793254 0.000088 0.0794134 0.1191201
Maize 284 12 296 700 0.0011928 0.000084 0.0012768 0.0019152
Ragi ( dry ) 68 0 68 400 0.0001632 0 0.0001632 0.0002448
Bajra ( local ) 0 0 0 400 0 0 0 0
Small millets 40 0 40 400 0.000096 0 0.000096 0.000144
Jower 68 0 68 400 0.0001632 0 0.0001632 0.0002448
Wheat 0 17 17 400 0 0.000068 0.000068 0.000102
Total cereals 12479 37 12516 0 0 0 0
Mung 781 7 788 400 0.0018744 0.000028 0.0019024 0.0028536
Biri 823 0 823 123 400 0.0019752 0 0.0019752 0.0029628
Cowpea 245 34 279 475 0.00069825 0.0001615 0.00085975 0.001289625
Arhar 123 0 123 600 0.0004428 0 0.0004428 0.0006642
Horsegram 0 1170 1170 400 0 0.00468 0.00468 0.00702
Gram 0 162 162 400 0 0.000648 0.000648 0.000972
Fieldpea 0 19 19 450 0 0.0000855 0.0000855 0.00012825
Lentil 0 0 0 0 0 0 0
Total pulses 1972 1392 3364 0 0 0 0
Groundnut 232 4 236 500 0.000696 0.00002 0.000716 0.001074
Til 1346 0 1346 390 425 0.0034323 0 0.0034323 0.00514845
Caster 0 0 0 500 0 0 0 0
Sunflower 5 5 400 0 0.00002 0.00002 0.00003
Mustard 283 283 127 400 0 0.001132 0.001132 0.001698
Nizer 0 36 36 0 0 0 0
Linseed 0 17 17 0 0 0 0
Potato 0 94 94 600 0 0.000564 0.000564 0.000846
Onion 0 101 101 600 0 0.000606 0.000606 0.000909
Other vegetables 894 1224 2118 600 0.0032184 0.007344 0.0105624 0.0158436
Turmeric 48 0 48 600 0.0001728 0 0.0001728 0.0002592
Zinger 31 0 31 600 0.0001116 0 0.0001116 0.0001674
Garlic 0 52 52 600 0 0.000312 0.000312 0.000468

56
Fiber 35 0 35 0 0 0 0
Sugarcane 0 20 20 2000 0 0.0004 0.0004 0.0006
0.164705025 0.090679 0.074026025
Sundargarh.
Area sown (ha) Crop water demand (bcm) Crops
Kharif Rabi Total
Irrigated
area
(ha)
Crop water
demand (mm) Kharif Rabi Total
Water potential
required (bcm)
Existing water
potential (bcm)
Water potential to
be created (bcm)
paddy 13250 5 13255 2915 1100 0.08745 0.000055 0.087505 0.1312575
maize 463 21 484 700 0.0019446 0.000147 0.0020916 0.0031374
Ragi ( dry ) 205 0 205 400 0.000492 0 0.000492 0.000738
Bajra ( local ) 2 0 2 400 0.0000048 0 0.0000048 0.0000072
Small millets 86 0 86 400 0.0002064 0 0.0002064 0.0003096
Jower 124 0 124 400 0.0002976 0 0.0002976 0.0004464
Wheat 0 111 111 400 0 0.000444 0.000444 0.000666
total cereals 14130 137 14267 0 0 0 0
Mung 345 7 352 400 0.000828 0.000028 0.000856 0.001284
Biri 1403 0 1403 210 400 0.0033672 0 0.0033672 0.0050508
Cowpea 146 190 336 475 0.0004161 0.0009025 0.0013186 0.0019779
Arhar 80 0 80 600 0.000288 0 0.000288 0.000432
Horsegram 0 774 774 400 0 0.003096 0.003096 0.004644
Gram 0 298 298 400 0 0.001192 0.001192 0.001788
Fieldpea 0 140 140 450 0 0.00063 0.00063 0.000945
Lentil 0 0 0 0 0 0 0
Total pulses 1974 1409 3383 0 0 0 0
Groundnut 296 18 314 500 0.000888 0.00009 0.000978 0.001467
Til 1286 0 1286 373 425 0.0032793 0 0.0032793 0.00491895
Caster 8 44 52 500 0.000024 0.00022 0.000244 0.000366
Sunflower 0 5 5 400 0 0.00002 0.00002 0.00003
Mustard 0 395 395 178 400 0 0.00158 0.00158 0.00237
Nizer 0 2 2 0 0 0 0
Linseed 0 11 11 0 0 0 0
Potato 0 109 109 600 0 0.000654 0.000654 0.000981
Onion 0 195 195 600 0 0.00117 0.00117 0.001755
Other
vegetables 1088 1786 2874 600
0.0039168 0.010716 0.0146328 0.0219492
Turmeric 41 0 41 600 0.0001476 0 0.0001476 0.0002214
Zinger 156 0 156 600 0.0005616 0 0.0005616 0.0008424
Garlic 0 80 80 600 0 0.00048 0.00048 0.00072
Fiber 52 0 52 0 0 0 0
Sugarcane 0 10 10 2000 0 0.0002 0.0002 0.0003

57
0.18860475 0.0919450 0.0966598
Subdega.
Area sown (ha) Crop water demand (bcm) Crops
Kharif Rabi Total
Irrigated
area (ha)
Crop water
demand
(mm) Kharif Rabi Total
Water potential
required (bcm)
Existing water
potential (bcm)
Water potential
to be created
(bcm)
paddy 10821 70 10891 2381 1100 0.0714186 0.00077 0.0721886 0.1082829
maize 364 24 388 700 0.0015288 0.000168 0.0016968 0.0025452
Ragi ( dry ) 153 0 153 400 0.0003672 0 0.0003672 0.0005508
Bajra ( local ) 0 0 0 400 0 0 0 0
Small millets 78 0 78 400 0.0001872 0 0.0001872 0.0002808
Jower 67 0 67 400 0.0001608 0 0.0001608 0.0002412
Wheat 0 13 13 400 0 0.000052 0.000052 0.000078
total cereals 11483 107 11590 0 0 0 0
Mung 193 26 219 400 0.0004632 0.000104 0.0005672 0.0008508
Biri 874 13 887 131 400 0.0020976 0.000052 0.0021496 0.0032244
Cowpea 203 116 319 475 0.00057855 0.000551 0.00112955 0.001694325
Arhar 261 0 261 600 0.0009396 0 0.0009396 0.0014094
Horsegram 0 1200 1200 400 0 0.0048 0.0048 0.0072
Gram 0 148 148 400 0 0.000592 0.000592 0.000888
Fieldpea 0 126 126 450 0 0.000567 0.000567 0.0008505
Lentil 0 24 24 0 0 0 0
Total pulses 1531 1683 3214 0 0 0 0
Groundnut 372 12 384 500 0.001116 0.00006 0.001176 0.001764
Til 1094 70 1164 317 425 0.0027897 0.0002975 0.0030872 0.0046308
Caster 10 26 36 500 0.00003 0.00013 0.00016 0.00024
Sunflower 0 38 38 45 400 0 0.000152 0.000152 0.000228
Mustard 0 100 100 400 0 0.0004 0.0004 0.0006
Nizer 0 185 185 0 0 0 0
Linseed 0 13 13 0 0 0 0
Potato 0 107 107 600 0 0.000642 0.000642 0.000963
Onion 0 74 74 600 0 0.000444 0.000444 0.000666
Other vegetables 1536 1684 3220 600 0.0055296 0.010104 0.0156336 0.0234504
Turmeric 95 0 95 600 0.000342 0 0.000342 0.000513
Zinger 201 0 201 600 0.0007236 0 0.0007236 0.0010854
Garlic 0 24 24 600 0 0.000144 0.000144 0.000216
Fiber 131 0 131 0 0 0 0
Sugarcane 0 11 11 2000 0 0.00022 0.00022 0.00033

58
0.162782925 0.07993350 0.08284943
Balisankara.
Area sown (ha) Crop water demand (bcm) Crops
Kharif Rabi Total
Irrigated
area
(ha)
Crop water
demand (mm) Kharif Rabi Total
Water potential
required (bcm)
Existing water
potential (bcm)
Water potential
to be created
(bcm)
Paddy 12254 220 12474 2696 1100 0.0808764 0.00242 0.0832964 0.1249446
Maize 426 16 442 700 0.0017892 0.000112 0.0019012 0.0028518
Ragi ( dry ) 138 0 138 400 0.0003312 0 0.0003312 0.0004968
Bajra ( local ) 0 0 0 400 0 0 0 0
Small millets 38 0 38 400 0.0000912 0 0.0000912 0.0001368
Jower 65 0 65 400 0.000156 0 0.000156 0.000234
Wheat 0 180 180 400 0 0.00072 0.00072 0.00108
Total cereals 12921 416 13337 0 0 0 0
Mung 245 22 267 400 0.000588 0.000088 0.000676 0.001014
Biri 1040 0 1040 156 400 0.002496 0 0.002496 0.003744
Cowpea 346 51 397 475 0.0009861 0.00024225 0.00122835 0.001842525
Arhar 399 0 399 600 0.0014364 0 0.0014364 0.0021546
Horsegram 0 830 830 400 0 0.00332 0.00332 0.00498
Gram 0 194 194 400 0 0.000776 0.000776 0.001164
Fieldpea 0 100 100 450 0 0.00045 0.00045 0.000675
Lentil 0 11 11 0 0 0 0
Total pulses 2030 1208 3238 0 0 0 0
Groundnut 622 15 637 500 0.001866 0.000075 0.001941 0.0029115
Til 1074 0 1074 311 425 0.0027387 0 0.0027387 0.00410805
Caster 2 0 2 500 0.000006 0 0.000006 0.000009
Sunflower 0 30 30 94 400 0 0.00012 0.00012 0.00018
Mustard 0 209 209 400 0 0.000836 0.000836 0.001254
Nizer 0 450 450 0 0 0 0
Linseed 0 14 14 0 0 0 0
Potato 0 114 114 600 0 0.000684 0.000684 0.001026
Onion 0 149 149 600 0 0.000894 0.000894 0.001341
Other
vegetables 1534 1543 3077 600
0.0055224 0.009258 0.0147804 0.0221706
Turmeric 14 0 14 600 0.0000504 0 0.0000504 0.0000756
Zinger 50 0 50 600 0.00018 0 0.00018 0.00027
Garlic 0 55 55 600 0 0.00033 0.00033 0.000495
Fiber 42 0 42 0 0 0 0
Sugarcane 0 1 1 2000 0 0.00002 0.00002 0.00003

59
0.179188875 0.12 0.06
Kutra.
Area sown (ha) Crop water demand (bcm)
Crops
Kharif Rabi Total
Irrigated
area (ha)
Crop water demand
(mm) Kharif Rabi Total
Water
potential
required
(bcm)
Existing
water
potential
(bcm)
Water
potential
to be
created
(bcm)
Paddy 10899 55 10954 2398 1100 0.0719334 0.000605 0.0725384 0.1088076
Maize 354 0 354 700 0.0014868 0 0.0014868 0.0022302
Ragi ( dry ) 192 0 192 400 0.0004608 0 0.0004608 0.0006912
Bajra ( local ) 0 0 0 400 0 0 0 0
Small millets 130 0 130 400 0.000312 0 0.000312 0.000468
Jower 185 0 185 400 0.000444 0 0.000444 0.000666
Wheat 0 106 106 400 0 0.000424 0.000424 0.000636
Total cereals 11760 161 11921 0 0 0 0
Mung 209 8 217 400 0.0005016 0.000032 0.0005336 0.0008004
Biri 1188 21 1209 178 400 0.0028512 0.000084 0.0029352 0.0044028
Cowpea 613 43 656 475 0.00174705 0.00020425 0.0019513 0.00292695
Arhar 1485 0 1485 600 0.005346 0 0.005346 0.008019
Horsegram 0 710 710 400 0 0.00284 0.00284 0.00426
Gram 0 268 268 400 0 0.001072 0.001072 0.001608
Fieldpea 0 154 154 450 0 0.000693 0.000693 0.0010395
Lentil 0 175 175 0 0 0 0
Total pulses 3495 1379 4874 0 0 0 0
Groundnut 110 3 113 500 0.00033 0.000015 0.000345 0.0005175
Til 1599 10 1609 464 425 0.00407745 0.0000425 0.00411995 0.006179925
Caster 0 0 0 500 0 0 0 0
Sunflower 0 23 23 400 0 0.000092 0.000092 0.000138
Mustard 3 3 6 140 400 0.0000072 0.000012 0.0000192 0.0000288
Nizer 0 77 77 0 0 0 0
Linseed 0 60 60 0 0 0 0
Potato 0 106 106 600 0 0.000636 0.000636 0.000954
Onion 0 52 52 600 0 0.000312 0.000312 0.000468
Other
vegetables 1787 1879 3666 600
0.0064332 0.011274 0.0177072 0.0265608
Turmeric 40 0 40 600 0.000144 0 0.000144 0.000216
Zinger 33 0 33 600 0.0001188 0 0.0001188 0.0001782
Garlic 0 58 58 600 0 0.000348 0.000348 0.000522

60
0.172318875 0.08 0.09
Rajgangpur
Area sown (ha) Crop water demand (bcm) Crops
Kharif Rabi Total
Irrigated
area
(ha)
Crop water
demand (mm) Kharif Rabi Total
Water potential
required (bcm)
Existing water
potential
(bcm)
Water potential
to be created
(bcm)
Paddy 10555 836 11391 2322 1100 0.069663 0.009196 0.078859 0.1182885
Maize 491 6 497 700 0.0020622 0.000042 0.0021042 0.0031563
Ragi ( dry ) 68 0 68 400 0.0001632 0 0.0001632 0.0002448
Bajra ( local ) 0 0 0 400 0 0 0 0
Small millets 175 0 175 400 0.00042 0 0.00042 0.00063
Jower 64 0 64 400 0.0001536 0 0.0001536 0.0002304
Wheat 0 278 278 400 0 0.001112 0.001112 0.001668
Total cereals 11353 1120 12473 0 0 0 0
Mung 220 123 343 400 0.000528 0.000492 0.00102 0.00153
Biri 1228 10 1238 178 400 0.0029472 0.00004 0.0029872 0.0044808
Cowpea 467 55 522 475 0.00133095 0.00026125 0.0015922 0.0023883
Arhar 1460 0 1460 600 0.005256 0 0.005256 0.007884
Horsegram 0 720 720 400 0 0.00288 0.00288 0.00432
Gram 0 292 292 400 0 0.001168 0.001168 0.001752
Fieldpea 0 138 138 450 0 0.000621 0.000621 0.0009315
Lentil 0 165 165 0 0 0 0
Total pulses 3375 1503 4878 0 0 0 0
Groundnut 135 10 145 500 0.000405 0.00005 0.000455 0.0006825
Til 1896 10 1906 464 425 0.0048348 0.0000425 0.0048773 0.00731595
Caster 0 0 0 500 0 0 0 0
Sunflower 0 12 12 400 0 0.000048 0.000048 0.000072
Mustard 0 415 415 140 400 0 0.00166 0.00166 0.00249
Nizer 0 45 45 0 0 0 0
Linseed 0 116 116 0 0 0 0
Potato 0 194 194 600 0 0.001164 0.001164 0.001746
Onion 0 82 82 600 0 0.000492 0.000492 0.000738
Other
vegetables 1415 1604 3019 600
0.005094 0.009624 0.014718 0.022077
Turmeric 30 0 30 600 0.000108 0 0.000108 0.000162
Zinger 51 0 51 600 0.0001836 0 0.0001836 0.0002754
Garlic 0 55 55 600 0 0.00033 0.00033 0.000495
Fiber 32 0 32 0 0 0 0

61
Sugarcane 0 0 0 2000 0 0 0 0
0.18355845 0.15 0.04
Lathikata
Area sown (ha) Crop water demand (bcm) Crops
Kharif Rabi Total
Irrigated
area (ha)
Crop water
demand
(mm) Kharif Rabi Total
Water potential
required (bcm)
Existing water
potential
(bcm)
Water potential
to be created
(bcm)
Paddy 18604 161 18765 4093 1100 0.1227864 0.001771 0.1245574 0.1868361
Maize 587 12 599 700 0.0024654 0.000084 0.0025494 0.0038241
Ragi ( dry ) 116 0 116 400 0.0002784 0 0.0002784 0.0004176
Bajra ( local ) 0 0 0 400 0 0 0 0
Small millets 98 0 98 400 0.0002352 0 0.0002352 0.0003528
Jower 137 0 137 400 0.0003288 0 0.0003288 0.0004932
Wheat 0 98 98 400 0 0.000392 0.000392 0.000588
Total cereals 19542 271 19813 0 0 0 0
Mung 148 41 189 400 0.0003552 0.000164 0.0005192 0.0007788
Biri 1065 43 1108 207 400 0.002556 0.000172 0.002728 0.004092
Cowpea 210 170 380 475 0.0005985 0.0008075 0.001406 0.002109
Arhar 598 0 598 600 0.0021528 0 0.0021528 0.0032292
Horsegram 0 1658 1658 400 0 0.006632 0.006632 0.009948
Gram 0 252 252 400 0 0.001008 0.001008 0.001512
Fieldpea 0 71 71 450 0 0.0003195 0.0003195 0.00047925
Lentil 0 92 92 0 0 0 0
Total pulses 2021 2327 4348 0 0 0 0
Groundnut 142 4 146 500 0.000426 0.00002 0.000446 0.000669
Til 876 22 898 486 425 0.0022338 0.0000935 0.0023273 0.00349095
Caster 6 8 14 500 0.000018 0.00004 0.000058 0.000087
Sunflower 0 22 22 400 0 0.000088 0.000088 0.000132
Mustard 0 638 638 285 400 0 0.002552 0.002552 0.003828
Nizer 91 91 182 0 0 0 0
Linseed 0 12 12 0 0 0 0
Potato 0 131 131 600 0 0.000786 0.000786 0.001179
Onion 0 75 75 600 0 0.00045 0.00045 0.000675
Other
vegetables 1707 2556 4263 600
0.0061452 0.015336 0.0214812 0.0322218
Turmeric 57 0 57 600 0.0002052 0 0.0002052 0.0003078
Zinger 54 0 54 600 0.0001944 0 0.0001944 0.0002916
Garlic 0 80 80 600 0 0.00048 0.00048 0.00072
Fiber 40 0 40 0 0 0 0

62
Sugarcane 0 0 0 2000 0 0 0 0
0.2582622 0.12 0.13
Kuarmunda.
Area sown (ha) Crop water demand (bcm) Crops
Kharif Rabi Total
Irrigated
area
(ha)
Crop
water
demand
(mm) Kharif Rabi Total
Water potential
required (bcm)
Existing water
potential (bcm)
Water potential
to be created
(bcm)
Paddy 16067 20 16087 3535 1100 0.1060422 0.00022 0.1062622 0.1593933
Maize 427 12 439 700 0.0017934 0.000084 0.0018774 0.0028161
Ragi ( dry ) 115 0 115 400 0.000276 0 0.000276 0.000414
Bajra ( local ) 0 0 0 400 0 0 0 0
Small millets 69 0 69 400 0.0001656 0 0.0001656 0.0002484
Jower 119 0 119 400 0.0002856 0 0.0002856 0.0004284
Wheat 0 128 128 400 0 0.000512 0.000512 0.000768
Total cereals 16797 160 16957 0 0 0 0
Mung 56 0 56 400 0.0001344 0 0.0001344 0.0002016
Biri 1378 0 1378 207 400 0.0033072 0 0.0033072 0.0049608
Cowpea 210 169 379 475 0.0005985 0.00080275 0.00140125 0.002101875
Arhar 618 0 618 600 0.0022248 0 0.0022248 0.0033372
Horsegram 0 1716 1716 400 0 0.006864 0.006864 0.010296
Gram 0 312 312 400 0 0.001248 0.001248 0.001872
Fieldpea 0 80 80 450 0 0.00036 0.00036 0.00054
Lentil 0 104 104 0 0 0 0
Total pulses 2262 2381 4643 0 0 0 0
Groundnut 188 6 194 500 0.000564 0.00003 0.000594 0.000891
Til 1675 14 1689 486 425 0.00427125 0.0000595 0.00433075 0.006496125
Caster 2 7 9 500 0.000006 0.000035 0.000041 0.0000615
Sunflower 0 16 16 400 0 0.000064 0.000064 0.000096
Mustard 0 588 588 265 400 0 0.002352 0.002352 0.003528
Nizer 0 110 110 0 0 0 0
Linseed 0 112 112 0 0 0 0
Potato 0 162 162 600 0 0.000972 0.000972 0.001458
Onion 0 95 95 600 0 0.00057 0.00057 0.000855
Other vegetables 1239 1608 2847 600 0.0044604 0.009648 0.0141084 0.0211626
Turmeric 53 0 53 600 0.0001908 0 0.0001908 0.0002862
Zinger 65 0 65 600 0.000234 0 0.000234 0.000351
Garlic 0 72 72 600 0 0.000432 0.000432 0.000648
Fiber 0 0 0 0 0 0 0
Sugarcane 0 0 0 2000 0 0 0 0

63
0.2232111 0.07 0.16
Nuagaon.
Area sown (ha) Crop water demand (bcm) Crops
Kharif Rabi Total
Irrigated
area (ha)
Crop
water
demand
(mm) Kharif Rabi Total
Water potential
required (bcm)
Existing water
potential (bcm)
Water potential to
be created (bcm)
Paddy 21219 16 21235 4668 1100 0.1400454 0.000176 0.1402214 0.2103321
Maize 648 17 665 700 0.0027216 0.000119 0.0028406 0.0042609
Ragi ( dry ) 166 0 166 400 0.0003984 0 0.0003984 0.0005976
Bajra ( local ) 0 0 0 400 0 0 0 0
Small millets 78 0 78 400 0.0001872 0 0.0001872 0.0002808
Jower 130 0 130 400 0.000312 0 0.000312 0.000468
Wheat 0 164 164 400 0 0.000656 0.000656 0.000984
Total cereals 22241 197 22438 0 0 0 0
Mung 142 37 179 400 0.0003408 0.000148 0.0004888 0.0007332
Biri 955 33 988 143 400 0.002292 0.000132 0.002424 0.003636
Cowpea 305 167 472 475 0.00086925 0.00079325 0.0016625 0.00249375
Horsegram 0 1896 1896 600 0 0.011376 0.011376 0.017064
Arhar 570 0 570 400 0.001368 0 0.001368 0.002052
Gram 0 246 246 400 0 0.000984 0.000984 0.001476
Fieldpea 0 66 66 450 0 0.000297 0.000297 0.0004455
Lentil 0 78 78 0 0 0 0
Total pulses 1972 2523 4495 0 0 0 0
Groundnut 202 11 213 500 0.000606 0.000055 0.000661 0.0009915
Til 913 12 925 265 425 0.00232815 0.000051 0.00237915 0.003568725
Caster 1 8 9 500 0.000003 0.00004 0.000043 0.0000645
Sunflower 0 28 28 400 0 0.000112 0.000112 0.000168
Mustard 0 633 633 285 400 0 0.002532 0.002532 0.003798
Nizer 0 99 99 0 0 0 0
Linseed 0 87 87 0 0 0 0
Potato 0 191 191 600 0 0.001146 0.001146 0.001719
Onion 0 105 105 600 0 0.00063 0.00063 0.000945
Other
vegetables 1760 1869 3629 600
0.006336 0.011214 0.01755 0.026325
Turmeric 50 0 50 600 0.00018 0 0.00018 0.00027
Zinger 54 0 54 600 0.0001944 0 0.0001944 0.0002916
Garlic 0 82 82 600 0 0.000492 0.000492 0.000738
Fiber 0 0 0 0 0 0 0

64
Sugarcane 0 0 0 2000 0 0 0 0
0.283703175 0.08 0.21
Bisra.
Area sown (ha) Crop water demand (bcm) Crops
Kharif Rabi Total
Irrigated
area
(ha)
Crop
water
demand
(mm) Kharif Rabi Total
Water potential
required (bcm)
Existing water
potential (bcm)
Water potential to
be created (bcm)
Paddy 6348 30 6378 1397 1100 0.0418968 0.00033 0.0422268 0.0633402
Maize 473 15 488 700 0.0019866 0.000105 0.0020916 0.0031374
Ragi ( dry ) 43 0 43 400 0.0001032 0 0.0001032 0.0001548
Bajra ( local ) 0 0 0 400 0 0 0 0
Small millets 41 0 41 400 0.0000984 0 0.0000984 0.0001476
Jower 70 0 70 400 0.000168 0 0.000168 0.000252
Wheat 0 108 108 400 0 0.000432 0.000432 0.000648
Total cereals 6975 153 7128 0 0 0 0
Mung 58 37 95 400 0.0001392 0.000148 0.0002872 0.0004308
Biri 386 36 422 58 400 0.0009264 0.000144 0.0010704 0.0016056
Cowpea 150 223 373 475 0.0004275 0.00105925 0.00148675 0.002230125
Arhar 340 0 340 600 0.001224 0 0.001224 0.001836
Horsegram 0 1459 1459 400 0 0.005836 0.005836 0.008754
Gram 0 298 298 400 0 0.001192 0.001192 0.001788
Fieldpea 0 87 87 450 0 0.0003915 0.0003915 0.00058725
Lentil 0 98 98 0 0 0 0
Total pulses 934 2238 3172 0 0 0 0
Groundnut 86 6 92 500 0.000258 0.00003 0.000288 0.000432
Til 335 21 356 97 425 0.00085425 0.00008925 0.0009435 0.00141525
Caster 1 8 9 500 0.000003 0.00004 0.000043 0.0000645
Sunflower 0 16 16 400 0 0.000064 0.000064 0.000096
Mustard 0 517 517 233 400 0 0.002068 0.002068 0.003102
Nizer 0 87 87 0 0 0 0
Linseed 0 156 156 0 0 0 0
Potato 0 185 185 600 0 0.00111 0.00111 0.001665
Onion 0 68 68 600 0 0.000408 0.000408 0.000612
Other
vegetables 781 1577 2358 600
0.0028116 0.009462 0.0122736 0.0184104
Turmeric 22 0 22 600 0.0000792 0 0.0000792 0.0001188
Zinger 52 0 52 600 0.0001872 0 0.0001872 0.0002808
Garlic 0 65 65 600 0 0.00039 0.00039 0.000585
Fiber 0 0 0 0 0 0 0

65
Sugarcane 0 0 0 2000 0 0 0 0
0.111693525 0.07 0.04
Bonei.
Area sown (ha) Crop water demand (bcm) Crops
Kharif Rabi Total
Irrigated
area
(ha)
Crop
water
demand
(mm) Kharif Rabi Total
Water potential
required (bcm)
Existing water
potential (bcm)
Water potential to
be created (bcm)
Paddy 11613 0 11613 2555 1100 0.0766458 0 0.0766458 0.1149687
Maize 508 18 526 700 0.0021336 0.000126 0.0022596 0.0033894
Ragi ( dry ) 78 0 78 400 0.0001872 0 0.0001872 0.0002808
Bajra ( local ) 0 0 0 400 0 0 0 0
Small millets 50 0 50 400 0.00012 0 0.00012 0.00018
Jower 71 0 71 400 0.0001704 0 0.0001704 0.0002556
Wheat 0 70 70 400 0 0.00028 0.00028 0.00042
Total cereals 12320 88 12408 0 0 0 0
Mung 515 90 605 400 0.001236 0.00036 0.001596 0.002394
Biri 843 72 915 126 400 0.0020232 0.000288 0.0023112 0.0034668
Cowpea 260 49 309 475 0.000741 0.00023275 0.00097375 0.001460625
Arhar 130 0 130 600 0.000468 0 0.000468 0.000702
Horsegram 0 1060 1060 400 0 0.00424 0.00424 0.00636
Gram 0 199 199 400 0 0.000796 0.000796 0.001194
Fieldpea 0 152 152 450 0 0.000684 0.000684 0.001026
Lentil 0 37 37 0 0 0 0
Total pulses 1748 1659 3407 0 0 0 0
Groundnut 160 68 228 500 0.00048 0.00034 0.00082 0.00123
Til 1330 95 1425 386 425 0.0033915 0.00040375 0.00379525 0.005692875
Caster 1 5 6 500 0.000003 0.000025 0.000028 0.000042
Sunflower 0 13 13 400 0 0.000052 0.000052 0.000078
Mustard 0 578 578 260 400 0 0.002312 0.002312 0.003468
Nizer 0 216 216 0 0 0 0
Linseed 0 52 52 0 0 0 0
Potato 0 105 105 600 0 0.00063 0.00063 0.000945
Onion 0 149 149 600 0 0.000894 0.000894 0.001341
Other vegetables 1157 989 2146 600 0.0041652 0.005934 0.0100992 0.0151488
Turmeric 41 0 41 600 0.0001476 0 0.0001476 0.0002214
Zinger 30 0 30 600 0.000108 0 0.000108 0.000162
Garlic 0 71 71 600 0 0.000426 0.000426 0.000639
Fiber 0 0 0 0 0 0 0
Sugarcane 0 0 0 2000 0 0 0 0

66
0.165066 0.06 0.10
Lahunipada.
Area sown (ha) Crop water demand (bcm) Crops
Kharif Rabi Total
Irrigated
area
(ha)
Crop water
demand
(mm) Kharif Rabi Total
Water potential
required (bcm)
Existing
Water
potential
(BCM)
Water
potential to
be created
(BCM)
Paddy 13354 0 13354 2938 1100 0.0881364 0 0.0881364 0.1322046
Maize 915 23 938 700 0.003843 0.000161 0.004004 0.006006
Ragi ( Dry ) 74 0 74 400 0.0001776 0 0.0001776 0.0002664
Bajra ( Local ) 0 0 0 400 0 0 0 0
Small Millets 65 0 65 400 0.000156 0 0.000156 0.000234
Jower 64 0 64 400 0.0001536 0 0.0001536 0.0002304
Wheat 0 96 96 400 0 0.000384 0.000384 0.000576
TotalCereals 14472 119 14591 0 0 0 0
MUNG 461 90 551 400 0.0011064 0.00036 0.0014664 0.0021996
BIRI 773 48 821 116 400 0.0018552 0.000192 0.0020472 0.0030708
Cowpea 430 55 485 475 0.0012255 0.00026125 0.00148675 0.002230125
Arhar 150 0 150 600 0.00054 0 0.00054 0.00081
Horsegram 0 1350 1350 400 0 0.0054 0.0054 0.0081
Gram 0 199 199 400 0 0.000796 0.000796 0.001194
Fieldpea 0 172 172 450 0 0.000774 0.000774 0.001161
Lentil 0 46 46 0 0 0 0
Total Pulses 1814 1960 3774 0 0 0 0
Groundnut 110 10 120 500 0.00033 0.00005 0.00038 0.00057
Til 1309 90 1399 380 425 0.00333795 0.0003825 0.00372045 0.005580675
Caster 1 6 7 500 0.000003 0.00003 0.000033 0.0000495
Sunflower 0 18 18 400 0 0.000072 0.000072 0.000108
Mustard 0 778 778 350 400 0 0.003112 0.003112 0.004668
Nizer 0 229 229 0 0 0 0
Linseed 0 75 75 0 0 0 0
Potato 0 191 191 600 0 0.001146 0.001146 0.001719
Onion 0 164 164 600 0 0.000984 0.000984 0.001476
Other Vegetables 1173 1270 2443 600 0.0042228 0.00762 0.0118428 0.0177642
Turmeric 46 0 46 600 0.0001656 0 0.0001656 0.0002484
Zinger 29 0 29 600 0.0001044 0 0.0001044 0.0001566
Garlic 0 91 91 600 0 0.000546 0.000546 0.000819
Fiber 0 0 0 0 0 0 0
Sugarcane 0 0 0 2000 0 0 0 0

67
0.1914423 0.12 0.07
Koida.
Area sown (ha) Crop water demand (bcm) Crops
Kharif Rabi Total
Irrigated
area
(ha)
Crop water
demand
(mm) Kharif Rabi Total
Water potential
required (bcm)
Existing Water
potential
(BCM)
Water potential
to be created
(BCM)
Paddy 9949 0 9949 2189 1100 0.0656634 0 0.0656634 0.0984951
Maize 466 17 483 700 0.0019572 0.000119 0.0020762 0.0031143
Ragi ( Dry ) 79 0 79 400 0.0001896 0 0.0001896 0.0002844
Bajra ( Local ) 0 0 0 400 0 0 0 0
Small Millets 70 0 70 400 0.000168 0 0.000168 0.000252
Jower 89 0 89 400 0.0002136 0 0.0002136 0.0003204
Wheat 0 34 34 400 0 0.000136 0.000136 0.000204
Total Cereals 10653 51 10704 0 0 0 0
MUNG 363 35 398 400 0.0008712 0.00014 0.0010112 0.0015168
BIRI 543 20 563 81 400 0.0013032 0.00008 0.0013832 0.0020748
Cowpea 597 57 654 475 0.00170145 0.00027075 0.0019722 0.0029583
Arhar 110 0 110 600 0.000396 0 0.000396 0.000594
Horsegram 0 1275 1275 400 0 0.0051 0.0051 0.00765
Gram 0 175 175 400 0 0.0007 0.0007 0.00105
Fieldpea 0 201 201 450 0 0.0009045 0.0009045 0.00135675
Lentil 0 62 62 0 0 0 0
Total Pulses 1613 1825 3438 0 0 0 0
Groundnut 20 0 20 500 0.00006 0 0.00006 0.00009
Til 834 95 929 242 425 0.0021267 0.00040375 0.00253045 0.003795675
Caster 4 6 10 500 0.000012 0.00003 0.000042 0.000063
Sunflower 0 13 13 400 0 0.000052 0.000052 0.000078
Mustard 0 631 631 284 400 0 0.002524 0.002524 0.003786
Nizer 0 235 235 0 0 0 0
Linseed 0 154 154 0 0 0 0
Potato 0 105 105 600 0 0.00063 0.00063 0.000945
Onion 0 113 113 600 0 0.000678 0.000678 0.001017
Other Vegetables 782 410 1192 600 0.0028152 0.00246 0.0052752 0.0079128
Turmeric 30 0 30 600 0.000108 0 0.000108 0.000162
Zinger 35 0 35 600 0.000126 0 0.000126 0.000189
Garlic 0 76 76 600 0 0.000456 0.000456 0.000684
Fiber 0 0 0 0 0 0 0
Sugarcane 0 0 0 2000 0 0 0 0
0.138593325 0.04 0.10

68
Gurundia.
Area sown (ha) Crop water demand (bcm) Crops
Kharif Rabi Total
Irrigated
area
(ha)
Crop
water
demand
(bcm) Kharif Rabi Total
Water potential
required (bcm)
Existing Water
potential
(BCM)
Water potential
to be created
(BCM)
PADDY 11558 0 11558 2543 1100 0.0762828 0 0.0762828 0.1144242
MAIZE 487 19 506 202 700 0.0020454 0.000133 0.0021784 0.0032676
Ragi ( Dry ) 89 0 89 400 0.0002136 0 0.0002136 0.0003204
Bajra ( Local ) 0 0 0 400 0 0 0 0
Small Millets 65 0 65 400 0.000156 0 0.000156 0.000234
Jower 98 0 98 400 0.0002352 0 0.0002352 0.0003528
Wheat 0 35 35 20 400 0 0.00014 0.00014 0.00021
0 0 0 0
MUNG 438 30 468 400 0.0010512 0.00012 0.0011712 0.0017568
BIRI 833 25 858 125 400 0.0019992 0.0001 0.0020992 0.0031488
Cowpea 693 47 740 475 0.00197505 0.00022325 0.0021983 0.00329745
Arhar 105 0 105 600 0.000378 0 0.000378 0.000567
Horsegram 0 1625 1625 400 0 0.0065 0.0065 0.00975
Gram 0 125 125 400 0 0.0005 0.0005 0.00075
Fieldpea 0 161 161 450 0 0.0007245 0.0007245 0.00108675
Lentil 0 170 170 0 0 0 0
Total Pulses 2069 2183 4252 0 0 0 0
Groundnut 60 0 60 500 0.00018 0 0.00018 0.00027
Til 1384 95 1479 401 425 0.0035292 0.00040375 0.00393295 0.005899425
Caster 4 4 8 500 0.000012 0.00002 0.000032 0.000048
Sunflower 0 13 13 400 0 0.000052 0.000052 0.000078
Mustard 0 518 518 233 400 0 0.002072 0.002072 0.003108
Nizer 0 185 185 0 0 0 0
Linseed 0 105 105 0 0 0 0
Potato 0 129 129 600 0 0.000774 0.000774 0.001161
Onion 0 111 111 600 0 0.000666 0.000666 0.000999
Other Vegetables 637 620 1257 600 0.0022932 0.00372 0.0060132 0.0090198
TURMERIC 41 0 41 600 0.0001476 0 0.0001476 0.0002214
Zinger 31 0 31 600 0.0001116 0 0.0001116 0.0001674
Garlic 0 71 71 600 0 0.000426 0.000426 0.000639
Fiber 0 0 0 0 0 0 0
Sugarcane 0 0 0 2000 0 0 0 0
0.160776825 0.04 0.12

69
4.2: CROP WATER DEMAND
Sl.No Block Present Crop Water requirement(in BCM) Crop Water Requirement in 2020 (in BCM)
1 Hemgir 0.1886226 0.220015035
2 Lephripada 0.156552525 0.186083123
3 Tangarpali 0.164705025 0.197259464
4 Balisankara 0.179188875 0.216063993
5 Subdega 0.162782925 0.196685531
6 Sundargarh 0.18860475 0.227648906
7 Baragaon 0.039018855 0.194641536
8 Kutra 0.172318875 0.205269516
9 Kuanrmunda 0.2232111 0.26876918
10 Nuagaon 0.283703175 0.338690638
11 Bisra 0.111693525 0.128538718
12 Lathikata 0.2582622 0.308173908
13 Rajagangapur 0.18355845 0.200417229
14 Gurundia 0.160776825 0.194312519
15 Bonaigarh 0.165066 0.192387857
16 Lahunipara 0.1914423 0.231021469
17 Koida 0.138593325 0.16764341
Total 2.96810133 3.673622032

70
4.3 Livestock Water Demand
Considering the daily water requirement of individual livestock the total water
requirement for the livestock in various blocks as per the present level and the projected
requirement during 2020 was worked out to be 0.09710 and 0.11652BCM. As no specific water
availability facility is available for livestock population the total demand was taken as the
potential to be created for meeting out of the water needs of the livestock.
Sl
Blocks
Total no. of
livestock
Present water
demand (BCM)
Water demand in 2020
(BCM)
Water potential to be
created (BCM)
1 Hemgir 97194
0.003547581 0.004257097200 0.004257097200
2 Lephripara 101443
0.00370267 0.004443203400 0.004443203400
3 Tangarpali 79816
0.002913284 0.003495940800 0.003495940800
4 Sundargarh 93299
0.003405414 0.004086496200 0.004086496200
5 Balisankra 139718
0.005099707 0.006119648400 0.006119648400
6 Subdega 107884
0.003937766 0.004725319200 0.004725319200
7 Bargaon 106692
0.003894258 0.004673109600 0.004673109600
8 Kutra 117982
0.004306343 0.005167611600 0.005167611600
Rajgangpur 142487
0.005200776 0.006240930600 0.006240930600
Kuarmunda 159381
0.005817407 0.006980887800 0.006980887800
Nuagaon 175540
0.00640721 0.007688652000 0.007688652000
Bishra 119451
0.004359962 0.005231953800 0.005231953800
Lathikata 120183
0.00438668 0.005264015400 0.005264015400
Lahunnipara 171896
0.006274204 0.007529044800 0.007529044800
Koida 115437
0.004213451 0.005056140600 0.005056140600
Gurundia 144796
0.005285054 0.006342064800 0.006342064800
Bonai 667142
0.024350683 0.029220819600 0.029220819600
TOTAL 26,60,341 0.09710244650 0.116522935800 0.116522935800

71
4.4 Industrial Water Demand
Present Industrial draft was collected from the Groundwater Survey report. It was also
noted that growth rate of industry is 2-3% in Odisha, so this has been considered while
calculating the water demand from the industrial sector. The figures are given in Table
Industrial Water demand
Industrial Water Demand
Sl.No Block No.of
Industries
Present Water
Demand(in
BCM)
Water Demand In
2020(in BCM)
1 Bargaon 2 0.00004292730 0.000051512760
2 Bonei 13 0.00019981374 0.000239776488
3 Hemgir 2 0.00038392416 0.000460708992
4 Koira 13 0.00063268236 0.000759218832
5 Kuarmunda 10 0.00044585688 0.000535028256
6 Kutra 5 0.00002282118 0.000027385416
7 Lathikata 24 0.00762205398 0.009146464776
8 Nuagaon 3 0.00000322872 0.000003874464
9 Rajgangpur 14 0.00065799846 0.000789598152
10 Sundargarh 6 0.00001155001 0.000013860014
Total 92 0.01002285679 0.012027428150
4.5 Water Demand for Power Generation
No water has been provisioned for power generation as the feasibility for the same has
not yet been taken up.
4.6 Total Water Demand of the District for Various Sectors
The water demand for various sectors for various blocks was added up to find out the
overall water demand for the different blocks and the district for the present period. It is worked
out that 3.1574653BCM of water is required for the district to meet the domestic, crop, livestock
and industrial requirements as given in the following Table.

72
4.6 Total Water Demand of the district for Various sectors
S.
No. Block Components
Total,
BCM
1 Domestic Crop Livestock Industrial Power
generation
2 Hemgir 0.0037055 0.1886226 0.0042571 0.0004607 0.0000000 0.2284383
3 Lephripada 0.0032217 0.156552525 0.0044432 0.0000000 0.0000000 0.1937480
4 Tangarpali 0.0026316 0.164705025 0.0034959 0.0000000 0.0000000 0.2033870
5 Balisankara 0.0029058 0.179188875 0.0040865 0.0000000 0.0000000 0.2230563
6 Subdega 0.0035485 0.162782925 0.0061196 0.0000000 0.0000000 0.2063537
7 Sundargarh 0.0026111 0.18860475 0.0047253 0.0000139 0.0000000 0.2349992
8 Baragaon 0.0029469 0.039018855 0.0046731 0.0000515 0.0000000 0.2023130
9 Kutra 0.0032897 0.172318875 0.0051676 0.0000274 0.0000000 0.2137542
10 Kuanrmunda 0.0045963 0.2232111 0.0062409 0.0005350 0.0000000 0.2801414
11 Nuagaon 0.0043706 0.283703175 0.0069809 0.0000039 0.0000000 0.3500460
12 Bisra 0.0043397 0.111693525 0.0076887 0.0000000 0.0000000 0.1405670
13 Lathikata 0.0036868 0.2582622 0.0052320 0.0091465 0.0000000 0.3262391
14 Rajagangapur 0.0057321 0.18355845 0.0052640 0.0007896 0.0000000 0.2122030
15 Gurundia 0.0027526 0.160776825 0.0075290 0.0000000 0.0000000 0.2045941
16 Bonaigarh 0.0028571 0.165066 0.0050561 0.0002398 0.0000000 0.2005409
17 Lahunipara 0.0040686 0.1914423 0.0063421 0.0000000 0.0000000 0.2414322
18 Koida 0.0035491 0.138593325 0.0292208 0.0007592 0.0000000 0.2011726
GRAND TOTAL 0.0608137 2.96810133 0.1165229 0.0120274 0.0000000 3.862986

73
4.7 Water Budget
On finding the demand and availability, the gap in the district for the present level and for
2020 was worked out (Table 4.7). The present demand and projected demand for 2020 in the
district comes to be 3.862986 and 4.392215082 BCM, respectively indicating a gap 2.4073489
BCM for the present and 2.936577982 bcm for the projected demand of 2020.

74
4.7 Water Budget
Existing water availability
(BCM) Water Demand (BCM) Water Gap (BCM)
DISTRICT
Surface of
water Ground
water
Total (BCM)
Present Projected
(2020) Present
Projected
(2020)
Hemgir 0.0455741 0.01128 0.0568541 0.228438300000 0.259734347 0.171584200000 0.202880247
Lephripada 0.1049284 0.008490 0.1134184 0.193748 0.220291476 0.080329600000 0.106873076
Tangarpali 0.073039 0.017640 0.090679 0.203387 0.231251019 0.112708000000 0.140572019
Balisankara 0.1113473 0.0101325 0.1214798 0.2230563 0.253615013 0.101576500000 0.132135213
Subdega 0.0678135 0.012120 0.0799335 0.2063537 0.234624157 0.126420200000 0.154690657
Sundargarh 0.076315 0.015630 0.091945 0.2349992 0.26719409 0.143054200000 0.17524909
Baragaon 0.0647536 0.0121875 0.0769411 0.202313000000 0.230029881 0.125371900000 0.153088781
Kutra 0.0650552 0.013200 0.0782552 0.2137542 0.243038525 0.135499000000 0.164783325
Kuanrmunda 0.0544205 0.013275 0.0676955 0.2801414 0.318520772 0.212445900000 0.250825272
Nuagaon 0.0611625 0.0144000 0.0755625 0.350046 0.398002302 0.274483500000 0.322439802
Bisra 0.0664479 0.0055500 0.0719979 0.140567 0.159824679 0.068569100000 0.087826779
Lathikata 0.116073 0.0082500 0.124323 0.3262391 0.370933857 0.201916100000 0.246610857
Rajagangapur 0.13747 0.0076875 0.1451575 0.212203000000 0.241274811 0.067045500000 0.096117311
Gurundia 0.0335835 0.0081450 0.0417285 0.2045941 0.232623492 0.162865600000 0.190894992
Bonaigarh 0.0545301 0.0079200 0.0624501 0.2005409 0.228015003 0.138090800000 0.165564903
Lahunipara 0.1107515 0.0077250 0.1184765 0.2414322 0.274508411 0.122955700000 0.156031911
Koida 0.0333395 0.0054000 0.0387395 0.2011726 0.228733246 0.162433100000 0.189993746
Total 1.2766046 0.1790325 1.4556371 3.862986000000 4.392215082000 2.407348900000 2.936577982000

75
Chapter V
STRATEGIC ACTION PLAN
FOR IRRIGATION IN THE
DISTRICT UNDER PMKSY

76
Chapter V STRATEGIC ACTION PLAN FOR IRRIGATION IN THE DISTRICT
UNDER PMKSY
Considering the demand and availability and taking into account the geological, physical
and sociological factors and feasibility of irrigation structures and methods, the specific approach
for irrigation action plan was developed as given in Table 5.1. The block wise representation of
the irrigation approach is given in Fig. 5.1 to 5.8.
TABLE 5.1 Specific approaches for irrigation plan
Sl
No
Block Approach for irrigation plan
1 Hemgir WHS, Minor and lift irrigation structures
2
Lephripada
Development of Groundwater structures, WHS, Minor,Medium and lift
irrigation structures
3
Tangarpali
Development of Groundwater structures, WHS,, Minor, Medium and lift
irrigation structures Watershed management approach.
4
Balisankara
Development of Groundwater structures, WHS,, Minor and lift irrigation
structures Groundwater structures along with WHS
5 Subdega Medium,Minor and lift irrigation structures, WHS
6
Sundargarh
Development of Groundwater structures, WHS,, Minor and lift irrigation
structures
7 Baragaon Medium,Minor and lift irrigation structures, WHS
8
Kutra
Minor and lift irrigation structures ,Watershed management approach,
WHS, Conjunctive use of surface and groundwater.
9
Kuanrmunda
Minor irrigation check dam and lift irrigation structures ,Watershed
management approach, WHS, Conjunctive use of surface and
groundwater.
10
Nuagaon
Medium,Minor irrigation check dam and lift irrigation structures,
Watershed management approach WHS
11
Bisra
Minor and lift irrigation structures Watershed management approach
WHS
12
Lathikata
Medium,Minor and lift irrigation structures, Watershed management
approach WHS
13
Rajagangapur
Medium,Minor and lift irrigation structures, Watershed management
approach WHS
14
Gurundia
Medium,Minor and lift irrigation structures, Watershed management
approach WHS
15
Bonaigarh
Medium,Minor and lift irrigation structures, Watershed management
approach WHS
16
Lahunipara
Medium,Minor and lift irrigation structures, Watershed management
approach WHS
17 Koida Medium, and lift irrigation structures, Watershed management approach

77
WHS
5.1 Strategic Action plan for Irrigation in District under PMKSY
The proposed Plan was prepared for Sundararh district considering block as unit, the
district wise and component wise abstract is given in Table 5.2 and 5.3. Plan for Rs.
2298.886Crore was made for PMKSY for 5 years.
TABLE 5.2. Component wise proposal for PMKSY
Sl
No
Name of the
Component
Total
Number
Irrigation
Potential (Ha)
Estimate d cost (in
Rs.) Crore
1 AIBP 90 8544 107.447
2
HarKhetkoPani
29929
78556
1199.579
3 More crop per drop 34080 0 198.86
4
Watersheds
5850
11500
162.00
5 Convergence 10000 0 50.00
6
Other State Plan 31
39500
581.00
7 Loan 0 0 0
Total 79980 138100 2298.886
The Block wise no. of Projects, additional area to be put under irrigation and estimated cost of
the projects are given in Table 5.4, 5.5 and 5.6, respectively. The Block wise irrigation potential
proposed and department wise breakup of cost is given in Table 5.7 and Table 5.8, respectively.

78

79
TABLE 5.3 Strategic plan for irrigation development proposed under PMKSY
Sl No
Name of
the Blocks/
Sub
Districts
Concerned
Ministry/
Department
Component Activity Total
Number
Irrigation
Potential
(Ha)
Estimated
cost (Rs. in
crore)
1 2 3 4 5 6 7 8
1 MoWR AIBP Irrigation 0 0 0
2 MoWR Medium Irrigation 05 6950 73.00
3 MoWR Surface Minor Irrigation 85 1594 34.447
Sub Total AIBP 90 8544 107.447
4 MoWR Harkhetkopani Community Lift Irrigation
Project 658 13160 131.60
5 MoWR Revival of Community Lift
Irrigation Points 200 4000 30.00
Extention of distribution system
of community lift Irrigation
points
300 1500 6.00
Construction of New deep bore
well 5000 20000 200.00
Revival of defective bore well 1000 1000 5.00
Installation of solar pump in
bore well 200 16.00
Ground water Development
(Dugwell ) 10000 4000 150.00
6 MoWR RRR of Water Boidies (Minor
Irrigation 100 7781.87 159.705
CADA Construction of field
chanels 98 10000 147.00
7 MoWR Renovation of village Tank 2000 2000 100.00
7.1 MoWR Farm Pond 10000 4000 108.274
7.2 MoWR Minor irrigation (C.D) 371 11114.13 146.00
Sub Total HKKP 29929 78556 1199.579
11 MOA &FW- Non -DPAP Drip 14000 0 140

80
DAC&FW
12 MOA &FW-
DAC&FW Non -DPAP Sprinkler 20000 0 58.58
13 MOA &FW-
DAC&FW
Per drop more crop
(Supplementary
water management
activities)
Microlift 80 00 0.28
Sub Total PDMC 34080 00 198.86
17 DoLR-MoRD Newly created WHS 2000 5000 100.00
17 DoLR-MoRD Farm Ponds 2000 400 1.00
17 DoLR-MoRD Chek Dam 200 1000 20.00
18 DoLR-MoRD Renovated WHS 1000 2000 10.00
18 DoLR-MoRD Chek Dams 50 100 1.00
18 DoLR-MoRD
PMKSY Watershed
Percolation Tanks 600 3000 30
Sub Total Watershed 5850 11500 162.00
Total PMKSY - - 1667.886
20 DoLR-MoRD Convergence with
MGNREGA Land Development 10000 0 50.00
Sub Total Convergence 10000 0 50
21.2(i) DOWR,
Odisha State Plan Megalift 31 39500 581.00
Sub Total state plan 31 39500 581.00
GRAND TOTAL 79980 138100 2298.886

81
IRRIGATION POTENTIAL AREA CREATED IN HA.
(A) Irrigation Potential to be created
a. AIBP
(i) Medium 6950 ha.
(ii) Minor 1594 ha.
b. Her KhetKoPani
i) Lift Irrigation 13160 ha.
ii) Bore well 20000 ha.
iii) Dug well 4000 ha.
iv) Farm pond 4000 ha.
v) Check dam 1114 ha.
c. Watershed
i) WHS 5000 ha.
ii) Farm pond 400 ha.
iii) Check dam 1000 ha.
iv) Percolation tank 3000 ha.
d. State plan
i) Mega lift 39500 ha.
Total 99718
ha.
(B) Renovation, Restoration
i) Minor irrigation tank 7781 ha.
ii) Lift Irrigation point 4000 ha.
iii) Bore well 1000 ha.
iv) Tank 2000 ha.
v) WHS 2000 ha.
vi) Extension of distribution system LI
point 1500 ha.
vii) Command area development field
channel 10000 ha.
viii) Check dam 100 ha.

82
Total 28381
ha.
( C ) Micro irrigation, area to be benefitted
i) Drip irrigation 14000 ha.
ii) Sprinkler 20000 ha.
Total 34000
ha.

83
TABLE 5.4 Block wise number of Projects proposed under PMKSY
Sl
no Activity
Hem
gir
Lephri
para
Tangar
pali
Subd
ega
Balishan
kara
Sundar
garh
Barga
on
Kut
ra
Rajgan
gpur
Nuag
aon
Kuarmu
nda
Lathik
ata
Bis
ra
Lahuni
para
Koi
ra
Bon
ei
Gur
undi
a
Tota
l
1 Irrigation 0 0 0 0 0 0 0 0 0 0 0 0 0 0 0 0 0 0
2 Medium
Irrigation 0 0 0 0 1 0 0 0 2 0 0 1 0 0 0 1 0 05
3
Surface
Minor
Irrigation 8 06 07 02 9 2 2 04 8 4 3 6 6 7 3 5 3 85
AIB
P
Total
AIBP 8 06 07 02 10 02 02 04 10 04 03 07 06 07 03 06 03 90
4
Lift
Irrigation
Project 18 25 29 15 16 20 16 12 36 71 56 66 34 111 47 41 45 658
5
Revival
of
communi
ty lift
irrigation
(OLIC)
23 23 10 10 17 14 19 21 10 10 10 10 10 0 13 0 0 200
Extention
of
distributi
on
system of
(OLIC)
20 10 5 5 5 15 50 60 5 5 20 20 20 10 20 20 10 300
6
Har
khet
kopan
i
Construct
ion of
New
deep bore
well(OLI
C)
500 400 350 250 250 250 500 500 250 250 450 250 250 200 200 100 50 5000

84
7
Revival
of
defective
Bore well
200 100 100 100 50 50 100 50 40 10 0 50 50 40 40 10 10 1000
7.1
Installati
on of
Solar
pump in
Bore well
20 20 20 20 20 20 20 20 20 20 0 0 0 0 0 0 0 200
7.2
Ground
water
Recharge
structure
(Dug
well)
800 700 500 500 500 500 700 800 600 600 600 600 600 500 500 500 500 10000
RRR of
water
bodies
(Minor
Irrigation
)
10 10 10 5 4 3 10 10 2 1 5 3 2 5 1 13 6 100
CADA
Construct
ion of
field
chanels
10 15 10 5 5 5 5 5 3 4 3 5 5 5 5 5 3 98
Renovati
on of
village
Tank
130 130 100 110 115 115 150 150 110 115 115 115 115 115 115 100 100 2000
Farm
Pond 800 700 500 500 500 500 1000 1000 500 500 500 500 500 500 500 500 500 10000
Minor
Irrigation
Check
Dam
27 22 25 30 30 20 30 30 15 15 17 10 20 20 20 20 20 371
Total
KHKP 2558 2155 1659 1550 1512 1512 2600 2658 1591 1598 1776 1629 1606 1256 1211 1054 994 29929
Micro-lift
Irrigation 3 0 0 1 3 2 3 1 3 13 5 4 7 22 2 11 0 80
11 more
cro
p
(Mic
ro
Non -
DPAP 831 824 843 826 835 843 835 832 839 838 836 824 810 799 689 845 851 14000

85
Drip
12
Non -
DPAP
Sprinkler 1181 1185 1176 1188 1191 1203 1199 1198 1191 1198 1203 1180 1190 1202 880 1221
121
4 20000
15
Secondar
y storage
structures 0 0 0 0 0 0 0 0 0 0 0 0 0 0 0 0 0 0
Total
PDMC 2012 2009 2019 2014 2026 2046 2034 2030 2030 2036 2039 2004 2000 2001 1569 2066
206
5 34080
17
Newly
created
WHS 98 108 69 113 106 112 131 165 124 122 119 133 115 129 65 155 136 2000
17 Farm
Ponds 103 115 75 132 118 129 139 145 114 129 124 132 117 131 53 121 123 2000
17 Chek
Dam 10 10 10 20 20 20 20 20 20 10 5 6 6 3 3 2 5 200
18 Renovate
d WHS 51 55 35 61 65 65 70 75 66 55 55 65 63 66 36 52 65 1000
18 Chek
Dams 2 3 3 3 3 4 3 3 3 3 3 3 3 3 3 3 2 50
18 Percolati
on Tanks 40 33 29 32 35 39 40 39 37 38 40 34 37 35 33 31 28 600
Total
Watersh
ed
304 324 221 361 347 369 403 447 364 357 346 373 341 367 193 364 359 5850
20
Land
Develop
ment 588 586 602 583 601 592 599 587 592 595 590 594 588 586 521 595 601 10000
Total
Converg
ence
588 586 602 583 601 592 599 587 592 595 590 594 588 586 521 595 601 10000
21.2
(i)
Medium
Irrigation
project
(Dam &
Canal
system)
0 0 0 0 0 0 0 0 0 0 0 0 0 0 0 1 1 2
(ii)
PM
KS
Y W
ater
shed
Mega
Lift 0 1 3 2 2 5 2 1 2 1 6 0 3 1 0 1 1 31

86
Total
Other 0 1 3 2 2 5 2 1 2 1 6 0 3 1 0 2 2 33
Grand Total 5470 5081 4511 4512 4498 4526 5640 5727 4589 4591 4760 4607 4544 4218 3497 4087 4024 78882
TABLE 5.5 Block wise additional area to be brought under irrigation proposed under PMKSY Area in ha.
S
l
n
o
Activ
ity
He
mgi
r
Lephr
ipara
Tanga
rpali
Subd
ega
Balisha
nkara
Sunda
rgarh
Barg
aon
Kutr
a
Rajga
ngpur
Nuag
aon
Kuar
munda
Lathi
kata Bisra
Lahun
ipara
Koir
a
Bone
i
Guru
ndia Total
2
Mediu
m
Irrigati
on
0 0 0 0 1390 0 0 0 2780 0 0 1390 0 0 0 1390 0 6950
3
Surfac
e
Minor
Irrigati
on
150 112.5 131.2
7 37.5 168.77 37.5 37.5 75 150 75 56.25
112.
5
112.
5
131.2
7
56.2
5
93.7
6
56.4
3 1594
AIB
P
Total
AIBP 150 112.5
131.2
7 37.5
1558.7
7 37.5 37.5 75 2930 75 56.25
1502
.5
112.
5
131.2
7
56.2
5
1483
.76
56.4
3 8544
4
Lift
Irrigati
on
360 500 580 300 320 400 320 240 720 1420 1120 1320 680 2220 940 820 900 1316
0
5
Reviva
l of
comm
unity
lift
irrigati
on
(OLIC
460 460 200 200 340 280 380 420 200 200 200 200 200 0 260 0 0 4000
Har
kh
etk
op
ani
Extenti
on of
distrib
ution
system
of
(OLIC
)
100 50 25 25 25 75 250 300 25 25 100 100 100 50 100 100 50 1500

87
6
Constr
uction
of New
deep
bore
well(O
LIC)
200
0 1600 1400 1000 1000 1000
200
0
200
0 1000 1000 1800 1000 1000 800 800 400 200
2000
0
7
Reviva
l of
defecti
ve
Bore
well
200 100 100 100 50 50 100 50 40 10 0 50 50 40 40 10 10 1000
7
.
1
Installa
tion of
Solar
pump
in Bore
well
0 0 0 0 0 0 0 0 0 0 0 0 0 0 0 0 0 0
7
.
2
Groun
d water
Rechar
ge
structu
re
(Dug
well)
320 280 200 200 200 200 280 320 240 240 240 240 240 200 200 200 200 4000
RRR
of
water
bodies
(Minor
Irrigati
on)
778.
21
778.2
1
778.1
8
389.0
9 311.27
233.4
8
778.
18
778.
18
155.6
3 77.81
389.0
9
233.
46
155.
63
389.0
9
77.8
1
1011
.64
466.
91
7781
.87
CADA
Constr
uction
of field
chanel
s
102
0.4
1530.
6
1020.
4 510.2 510.2 510.2
510.
2
510.
2
306.1
2
408.1
6 306.2
510.
2
510.
2 510.2
510.
2
510.
2
306.
12
1000
0
Renov
ation
of
village
Tank
130 130 100 110 115 115 150 150 110 115 115 115 115 115 115 100 100 2000
8 Farm 320 280 200 200 200 200 400 400 200 200 200 200 200 200 200 200 200 4000

88
Pond
Minor
Irrigati
on
Check
Dam
808.
85
659.0
6
748.9
3
898.7
2 898.72
599.1
4
898.
72
898.
72
449.3
6
449.3
6
509.2
7
299.
57
599.
14
599.1
4
599.
14
599.
14
599.
14
1111
4.13
Total
HKKP
649
7.46
6367.
87
5352.
51
3933.
01
3970.1
9
3662.
82
606
7.10
606
7.10
3446.
11
4145.
33
4979.
56
4268
.23
3849
.97
5123.
43
384
2.15
3950
.98
3032
.17
7855
6
1
7
Newly
created
WHS
196 216 138 226 212 224 262 330 248 244 238 266 230 258 130 310 272 4000
1
7
Farm
Ponds 20.6 23 15 26.4 23.6 25.8 27.8 29 22.8 25.8 24.8 26.4 23.4 26.2 10.6 24.2 24.6 400
1
7
Chek
Dam 102 110 70 122 130 130 140 150 132 110 110 130 126 132 72 104 130 2000
1
8
Renov
ated
WHS
102 110 70 122 130 130 140 150 132 110 110 130 126 132 72 104 130 2000
1
8
Chek
Dams 4 6 6 6 6 8 6 6 6 6 6 6 6 6 6 6 4 100
1
8
Percol
ation
Tanks
200 165 145 160 175 195 200 195 185 190 200 170 185 175 165 155 140 3000
PM
KS
Y W
ater
shed
Total
Waters
hed
624.6 630 444 662.4 676.6 712.8 775.8 860 725.8 685.8 688.8 728.4 696.4 729.2 455.6 703.2 700.6
1
1500
(i
i)
OTH
ERS
STA
TE
PLA
N
M
E
G
A
L
I
F
T
0 1274.
19
3822.
5806
2548.
3871
2548.3
871
6370.
97
254
8.39
127
4.19
2548.
39
1274.
1935
7645.
16 0 3822
.581
1274.
19 0 1274
.194
1274
.19
3950
0

89
Total Other
0 1274.
19
3822.
58
2548.
38
2548.3
8
6370.
97
254
8.4
127
4.19
2548.
39
1274.
19
7645.
16 0
3822
.58
1274.
19 0
1274
.19
1274
.19
3950
0
Grand Total 727
2.06
8384.
56
9750.
36
7181.
29
8753.9
4
10784
.09
942
8.79
827
6.29
9650.
30
6180.
32
13369
.77
6499
.13
8481
.45
7258.
09
435
4.00
7412
.13
5063
.39
1381
00

90
TABLE 5.6 Block wise Estimated cost proposed under PMKSY Rs. in crore.
Sl No
Activity HE
MGI
R
LEPH
RIPAR
A
TANG
ARPA
LI
SUB
DEG
A
BALISH
ANKAR
A
SUNDA
RGARH
BAR
GAO
N
KU
TR
A
RAJGANGPUR
NUA
GAO
N
KUAR
MUND
A
LATH
IKAT
A
BIS
RA
LAHU
NIPAR
A
KOI
RA
BO
NEI
GUR
UNDI
A
Tota
l
2 Medium Irrigation
0 0 0 0 14.6 0 0 0 29.2 0 0 14.6 0 0 0 14.6 0 73
3 Surface Minor Irrigation
3.24 2.43 2.84 0.81 3.65 0.81 0.81 1.62 3.24 1.62 1.22 2.43 2.43 2.84 1.22 2.03 1.22 34.4
47
AIB
P
Total AIBP
3.24 2.43 2.84 0.81 18.25 0.81 0.81 1.62 32.44 1.62 1.22 17.03 2.43 2.84 1.22 16.6
3
1.22 107.447
4 Lift Irrigation
3.6 5 5.8 3 3.2 4 3.2 2.4 7.2 14.2 11.2 13.2 6.8 22.2 9.4 8.2 9 131.
6
5 Revival
of
commun
ity lift
irrigatio
n
(OLIC)
3.45 3.45 1.5 1.5 2.55 2.1 2.85 3.15 1.5 1.5 1.5 1.5 1.5 0 1.95 0 0 30
Extentio
n of
distribut
ion
system
of
(OLIC)
0.4 0.2 0.1 0.1 0.1 0.3 1 1.2 0.1 0.1 0.4 0.4 0.4 0.2 0.4 0.4 0.2 6
6 Constru
ction of
New
deep
bore
well(OL
IC)
20 16 14 10 10 10 20 20 10 10 18 10 10 8 8 4 2 200
7 Revival
of
defectiv
e Bore
well 1 0.5 0.5 0.5 0.25 0.25 0.5 0.25 0.2 0.05 0 0.25 0.25 0.2 0.2 0.05 0.05
5
7.1
Hark
hetk
opani
Installati
on of
Solar
pump in
Bore
well
1.6 1.6 1.6 1.6 1.6 1.6 1.6 1.6 1.6 1.6 0 0 0 0 0 0 0 16

91
7.2
Ground
water
Recharg
e
structure
(Dug
well)
12 10.5 7.5 7.5 7.5 7.5 10.5 12 9 9 9 9 9 7.5 7.5 7.5 7.5 150
8 RRR of
water
bodies
(Minor
Irrigatio
n)
15.9
705
15.970
5
15.970
5
7.985
25
6.3882 4.79115 15.97
05
15.9
705
3.1941 1.597
05
7.98525 4.7911
5
3.19
41
7.9852
5
1.59
705
20.7
616
5
9.582
3
159.
705
CAD
Constru
ction of
field
chanels
15 22.5 15 7.5 7.5 7.5 7.5 7.5 4.5 6 4.5 7.5 7.5 7.5 7.5 7.5 4.5 147
Renovat
ion of
village
Tank
6.5 6.5 5 5.5 5.75 5.75 7.5 7.5 5.5 5.75 5.75 5.75 5.75 5.75 5.75 5 5 100
Farm
Pond
8.66
192
7.5791
8
5.4137 5.413
7
5.4137 5.4137 10.82
74
10.8
274
5.4137 5.413
7
5.4137 5.4137 5.41
37
5.4137 5.41
37
5.41
37
5.413
7
108.
274
Minor
Irrigatio
n Check
Dam
10.6
2534
8.6576
8194
9.8382
749
11.80
593
11.80593 7.87062 11.80
593
11.8
059
3
5.90296
5
5.902
965
6.69002
7
3.9353
1
7.87
062
7.8706
2
7.87
062
7.87
062
7.870
62
146
Total KHKP
98.8
0776
98.457
3619
82.222
475
62.40
488
62.05783 57.0754
7
93.25
383
94.2
038
3
54.1107
6
61.11
371
70.438
98
61.74
016
57.6
784
2
72.619
57
55.5
813
7
66.6
959
7
51.11
662
1199.57
9
Micro-Irrigation
0.01
05
0 0 0.003
5
0.0105 0.007 0.010
5
0.00
35
0.0105 0.045
5
0.0175 0.014 0.02
45
0.077 0.00
7
0.03
85
0 0.28
11
Non -DPAP Drip
8.31 8.24 8.43 8.26 8.35 8.43 8.35 8.32 8.39 8.38 8.36 8.24 8.1 7.99 6.89 8.45 8.51 140
12
Non -DPAP Sprinkler
3.45
9149
3.4708
65
3.4445
04
3.479
652
3.488439 3.52358
7
3.511
871
3.50
894
2
3.48843
9
3.508
942
3.52358
7
3.4562
2
3.48
551
3.5206
58
2.57
752
3.57
630
9
3.555
806
58.5
8
Per
dro
p m
ore
cro
p (
Mic
ro
Irrigation)
Total PDMP
11.7
7965
11.710
865
11.874
504
11.74
315
11.84894 11.9605
9
11.87
237
11.8
324
4
11.8889
4
11.93
444
11.901
09
11.71
022
11.6
100
1
11.587
66
9.47
452
12.0
648
1
12.06
581
198.86
17
Newly created WHS
4.9 5.4 3.45 5.65 5.3 5.6 6.55 8.25 6.2 6.1 5.95 6.65 5.75 6.45 3.25 7.75 6.8 100
17
PM
KS
Y
Wate
rshed
Farm Ponds
0.05
15
0.0575 0.0375 0.066 0.059 0.0645 0.069
5
0.07
25
0.057 0.064
5
0.062 0.066 0.05
85
0.0655 0.02
65
0.06
05
0.061
5
1

92
17
Chek Dam
1 1 1 2 2 2 2 2 2 1 0.8 0.6 0.6 0.6 0.3 0.6 0.5 20
17
Renova
ted
WHS
0.51 0.55 0.35 0.61 0.65 0.65 0.7 0.75 0.66 0.55 0.55 0.65 0.63 0.66 0.36 0.52 0.65 10
17
Chek
Dams 0.04 0.06 0.06 0.06 0.06 0.08 0.06 0.06 0.06 0.06 0.06 0.06 0.06 0.06 0.06 0.06 0.04 1
18
Percola
tion
Tanks
2 1.65 1.45 1.6 1.75 1.95 2 1.95 1.85 1.9 2 1.7 1.85 1.75 1.65 1.55 1.4 30
Total Watershed
8.50
15
8.7175 6.3475 9.986 9.819 10.3445 11.37
95
13.0
825
10.827 9.674
5
9.422 9.726 8.94
85
9.5855 5.64
65
10.5
405
9.451
5
162
20
Land Development
2.94 2.93 3.01 2.915 3.005 2.96 2.995 2.93
5
2.96 2.975 2.95 2.97 2.94 2.93 2.60
5
2.97
5
3.005 50
Converg
ence w
ith
MG
NR
EG
A
Total Convergence
2.94 2.93 3.01 2.915 3.005 2.96 2.995 2.93
5
2.96 2.975 2.95 2.97 2.94 2.93 2.60
5
2.97
5
3.005 50
(ii)
Mega Lift
0 18.741
9355
56.225
806
37.48
387
37.48387 93.7096
8
37.48
387
18.7
419
4
37.4838
7
18.74
194
112.451
6
0 56.2
258
1
18.741
94
0 18.7
419
4
18.74
194
581
Sta
te p
lan
Total Other
0 18.741
9355
56.225
806
37.48
387
37.48387 93.7096
8
37.48
387
18.7
419
4
37.4838
7
18.74
194
112.45
16
0 56.2
258
1
18.741
94
0 18.7
419
4
18.74
194
581
Grand Total 125.
271
142.98
9215
162.51
71
125.3
434 142.462
176.860
8
157.7
951
142.
416
7
149.712
6
106.0
606
208.37
95
103.1
779
139.
834
3
118.30
15
74.5
231
7
127.
644
5
95.59
664
2298.886

93
TABLE 5.7 Block wise irrigation potential proposed
Item Hem
gir
Lephri
para
Tanga
rpali
Subde
ga
Balishan
kara
Sundarga
rh
Barga
on Kutra
Rajga
ngpur
Nuaga
on
Kuarmu
nda
Lathika
ta Bisra
Lahuni
para Koira Bonei
Gurun
dia Total
Kharif
crop area
in ha 19324 16174 17251 16607 18418 19176 16314 19433 18865
27480
22519
24695
9364
19244
14269
17088
16779
313000
Presently
available
irrigation
potential
in ha
2876 6217 5090 4328 6538 4853 3909 3804 7054 3761 3368 6122 3686 6413 1975 3275 2121 75390
Percentag
e of
irrigation
potential
available
in % 15 38 30 26 35 25 24 20 37 14 15 25 39 33 14 19 13 24
Irrigation
potential
proposed
to be
increased
through
interventi
ons under
PMKSY
in ha 6760 8818 10229 7214 8717 11426 8872 7519 9646 6000 13560 6297 8706 7324 4110 7678 5225 138100
Expected
irrigation
potential
after
PMKSY
in ha
9636
.13
15035
.049
15318
.508
11542
.02
15254.6
7
16279.47
6
12780
.51
11322.
929
16699
.9
9760.7
89
16928.0
16
12419.
36
1239
1.61
8
13737.
35
6085.2
6
10952
.619
7345.
799
213490
.003
Expected
percentag
e of
irrigation
potential
after
PMKSY
interventi
ons in %
50 93 89 70 83 85 78 58 89 36 75 50 132 71 43 64 44 68

94
TABLE 5.8 Department wise and component wise breakup of cost
Sl No Name of the
Component
Major
and
medium
Minor OLIC CADA Total WR Horticulture Watersheds Grand Total
1 AIBP73 34.447 0 0 107.447 0 0 107.447
2 Har Khet ko Pani 159.705 388.6 147 695.305 0 504.274 1199.579
3 More crop per
drop0 0 0.28 0 0.28 198.58 0 198.86
4 Watersheds 0 0 0 0 0 0 162 162
5 Convergence 0 0 0 0 0 0 50 50
6 Othe State Plan 581 0 0 0 581 0 0 581
7 Loan0 0 0 0 0 0 0 0
Total654 194.152 388.88 147 1384.032 198.58 716.274 2298.886

95
DETAILS OF PROPOSED PROJECT UNDER AIBP HEAD OF PMKSY (MAJOR/ MEDIUM)
Sl.No
Name of the Project Name of the
River/ Stream
Name of the Block
Name of the G.P
Location/ Village
Aycutl to be
created in Ha
Estimated cost of
the project in
Lakhs
1 2 3 4 5 6 8 7
Major/ Medium
1 Rukura Irrigation Project (
JamerposhDisty. Canal Lining
works
Rukura Nala Bonai 7 Nos 47 Nos 1060 600.00
2 Kinjirma (In stream storage
structure) Sapai
Sundargarh Kinjirma Kinjirma 1500 1500
3 Phulbari ( In stream storage
structure) Sapai
Bargaon Phulbari Phulbari 1100 800
4 Raidihi ( In stream storage
structure) Basundhara Lephripara Raidihi Raidihi 2000 1500
5 Rutkpedi ( In stream storage
structure) Deo Nuagaon Kundurukhunt Rutkpedi 800 1400
Mega Lift ( Fund Proposed under state Irrigation
Plan)
1 Katingdihi IB Subdega Dumarbahal Katingdihi 2000 5605
2 Semina 1 IB Sundargarh Lankahuda Semina 2000 5660
3 Billeigarh 1 IB Tangarpali Jogimal Billeigarh 1 2000 5660
4 Rangabira 1 Sankha Kuarmunda Rangabira 1125 3183
5 Khairidihi 1 Sankha Rajgangpur Khairidihi 1 1375 3891
6 Jangla Brahmani Bonaigarh Ruguda Jangla 1000 2830
7 Jamsara Koel Bishra Jamsara 1200 3396
8 Mitikundiri Deo Kuarmunda Mitikundiri 1200 3396
9 Masarikudar Koel Bishra Masarikudar 900 2547
10 Bargaon Sapai Bargaon Bargaon Bargaon 700 1981
11 Laxmiposh Sankha Kutra Laxmiposh 1950 5518
12 Bharatpur Ichha Lephripara Badbanga Bharatpur 700 1981
13 Birtola Brahmani Lahunipara Birtola 3000 8490
14 Satkuta Brahmani Gurundia Satkuta Satkuta 600 1698
15 Madhupur Deo Nuagaon Madhupur 800 2264
20550 58100
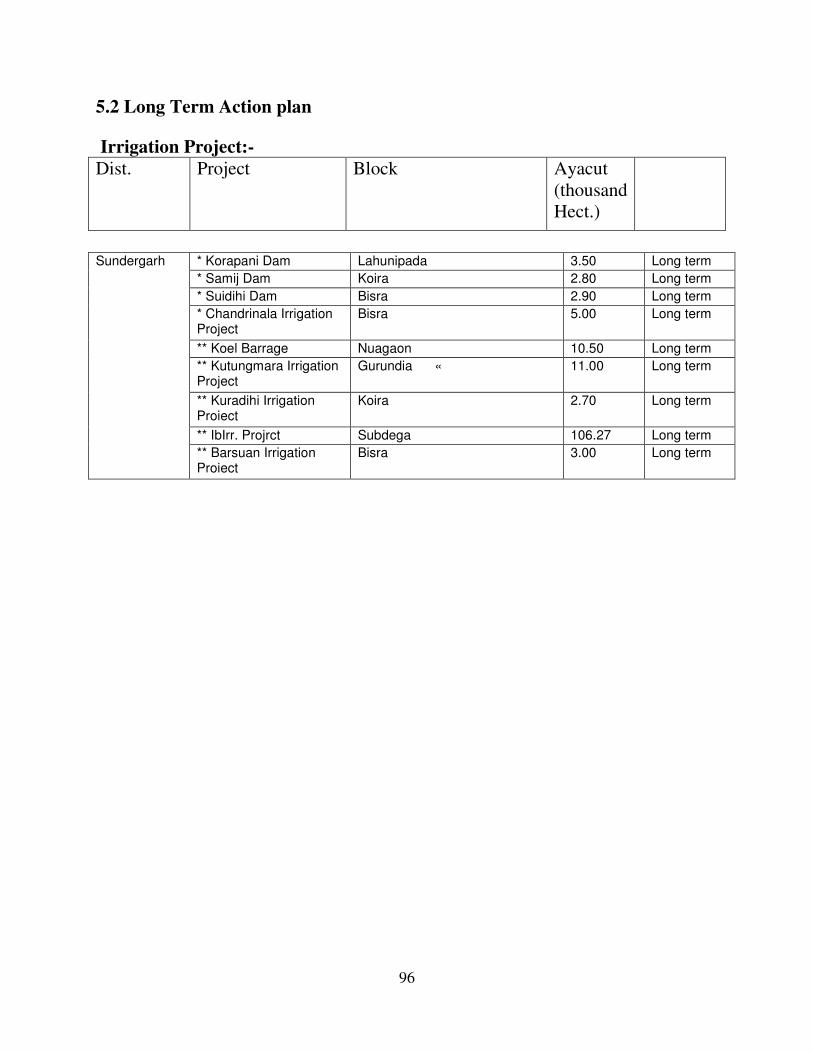
96
5.2 Long Term Action plan
Irrigation Project:-
Dist. Project Block Ayacut
(thousand
Hect.)
* Korapani Dam Lahunipada 3.50 Long term
* Samij Dam Koira 2.80 Long term
* Suidihi Dam Bisra 2.90 Long term
* Chandrinala Irrigation Project
Bisra 5.00 Long term
** Koel Barrage Nuagaon 10.50 Long term
** Kutungmara Irrigation Project
Gurundia « 11.00 Long term
** Kuradihi Irrigation Proiect
Koira 2.70 Long term
** IbIrr. Projrct Subdega 106.27 Long term
Sundergarh
** Barsuan Irrigation Proiect
Bisra 3.00 Long term

97
COMPONENT WISE YEAR WISE BREAK UP.
YEAR Sl.No
.
Name of the
Component 2016-17 2017-18 2018-19 2019-20 2020-21 Total
1 AIBP
16.11705 26.86175 26.86175 21.48940 16.11705 107.4470
2
HarKhetkoPani 179.93685 299.89475 299.89475 239.91580 179.93685 1199.5790
3
More crop per drop 29.82900 49.71500 49.71500 39.77200 29.82900 198.8600
4 Watersheds
24.30000 40.50000 40.50000 32.40000 24.30000 162.0000
5 Convergence
7.50000 12.50000 12.50000 10.00000 7.50000 50.0000
6
Othe State Plan 87.15000 145.25000 145.25000 116.20000 87.15000 581.0000
7 Loan
0.00000 0.00000 0.00000 0.00000 0.00000 0.0000
Total
344.8329
0
574.7215
0
574.7215
0
459.7772
0
344.8329
0
2298.886
0

98

99

100

101

102

103

104

105

106

107

108

109

110

111

112

113

114

115

116

117
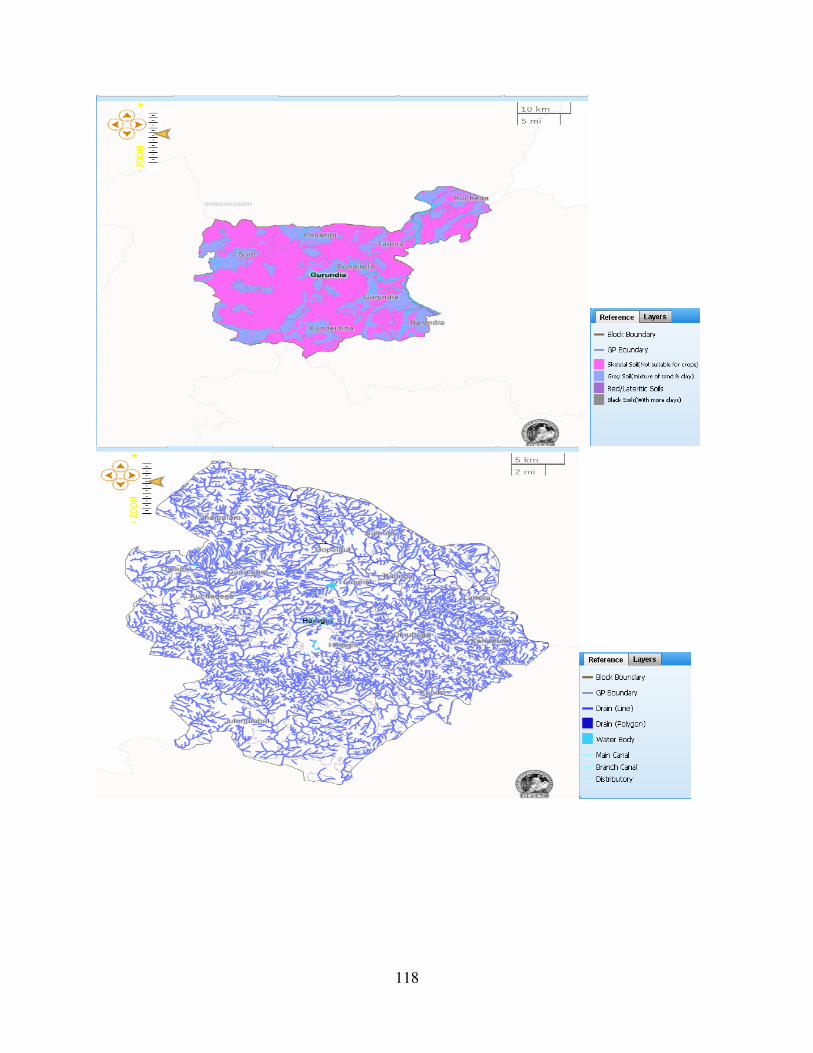
118

119

120
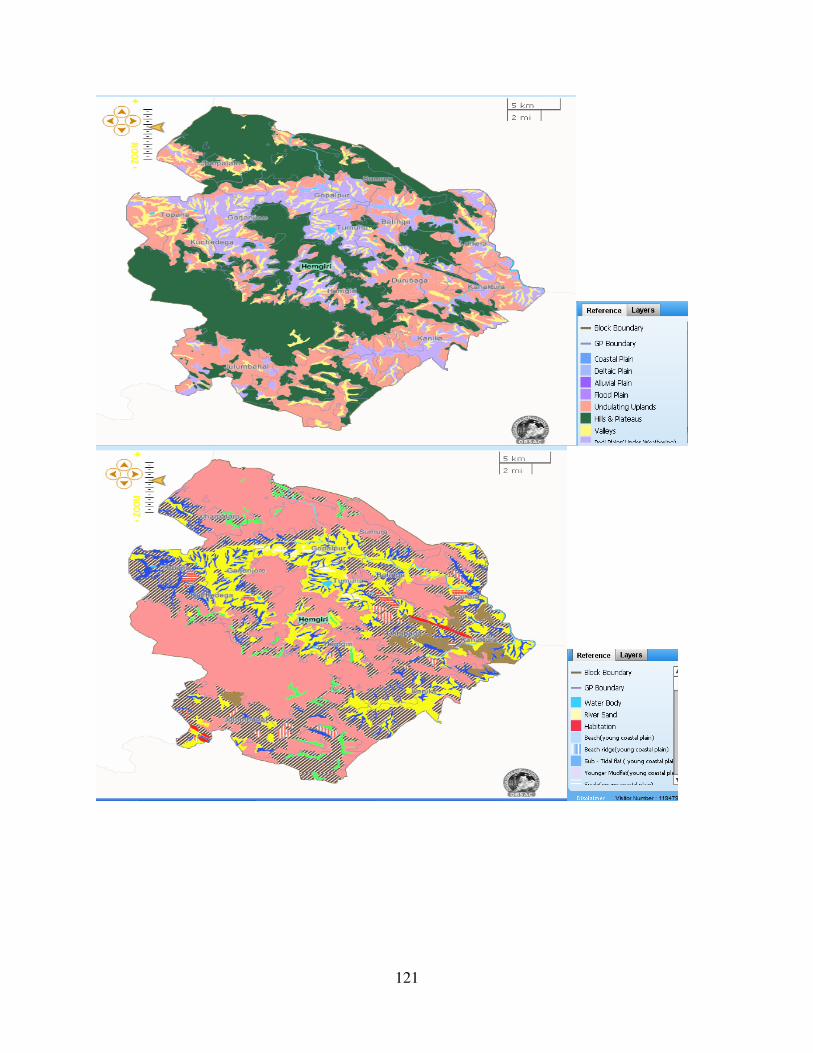
121

122

123

124

125

126

127
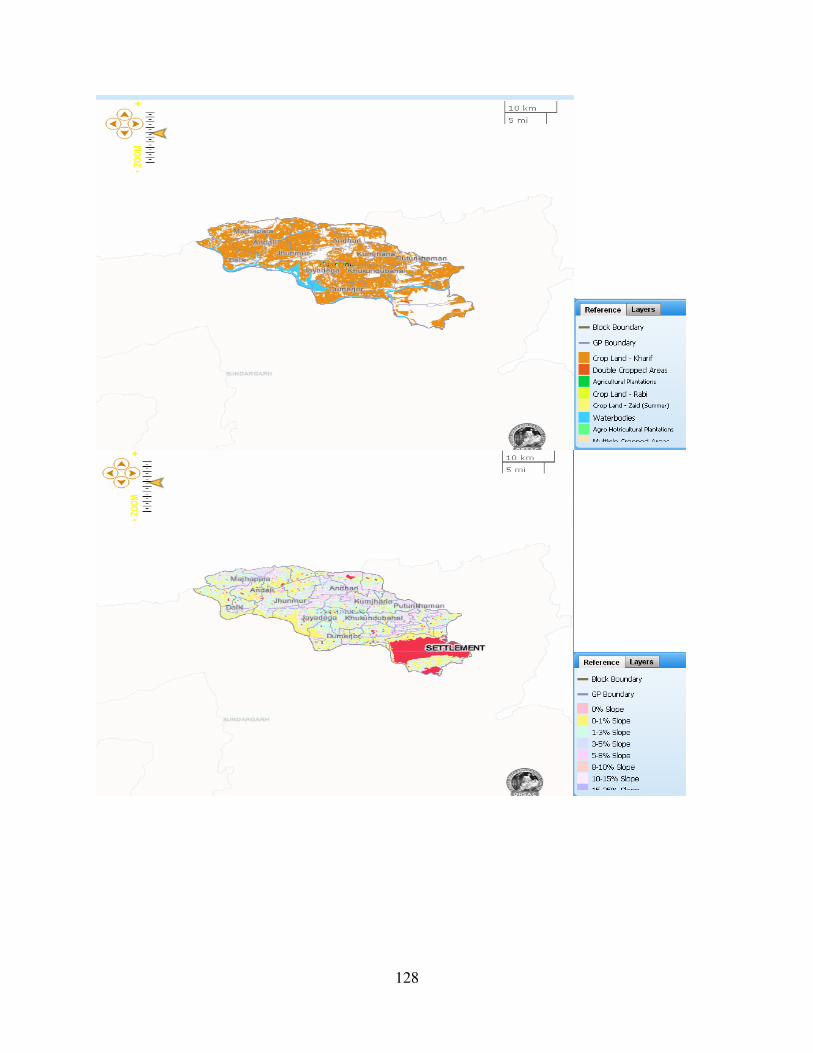
128
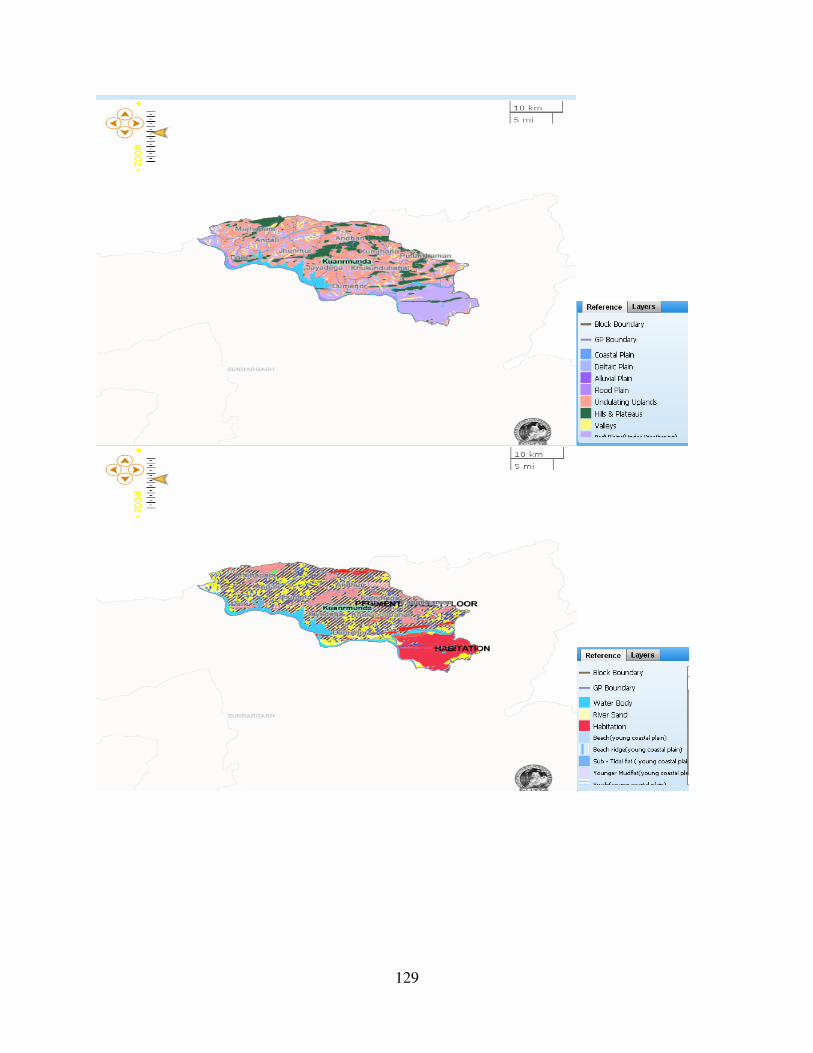
129

130
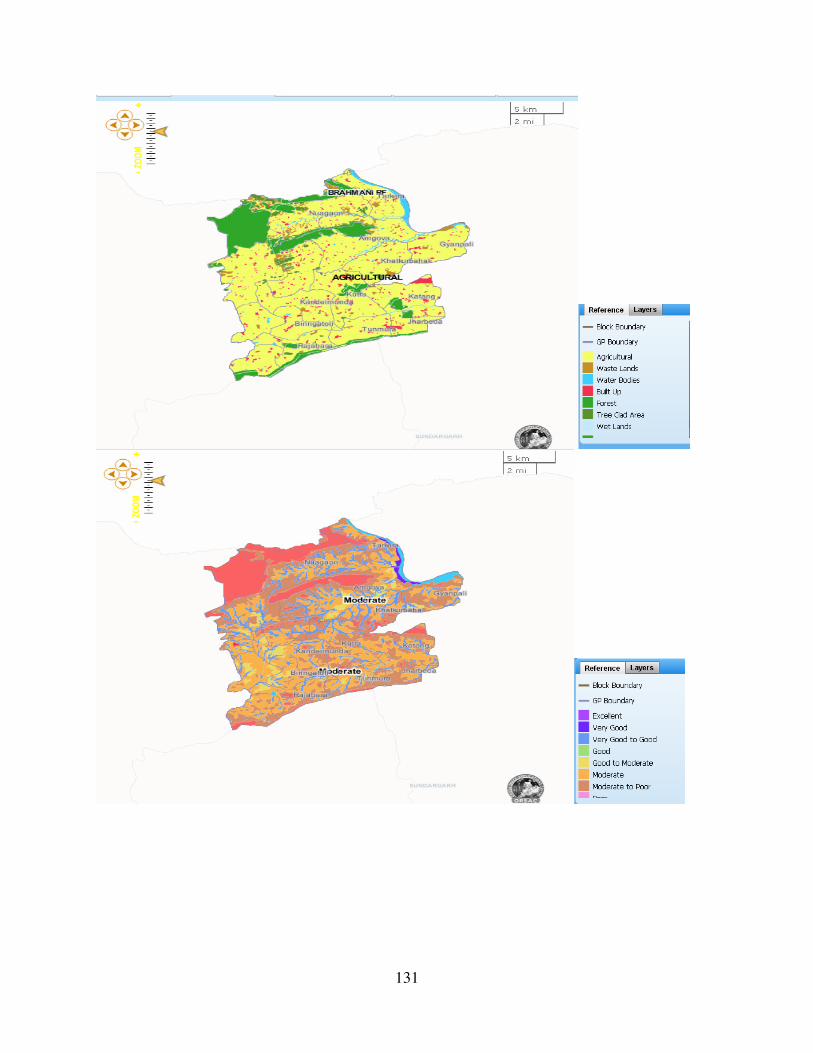
131

132

133

134

135

136

137

138

139

140

141

142

143

144

145

146

147
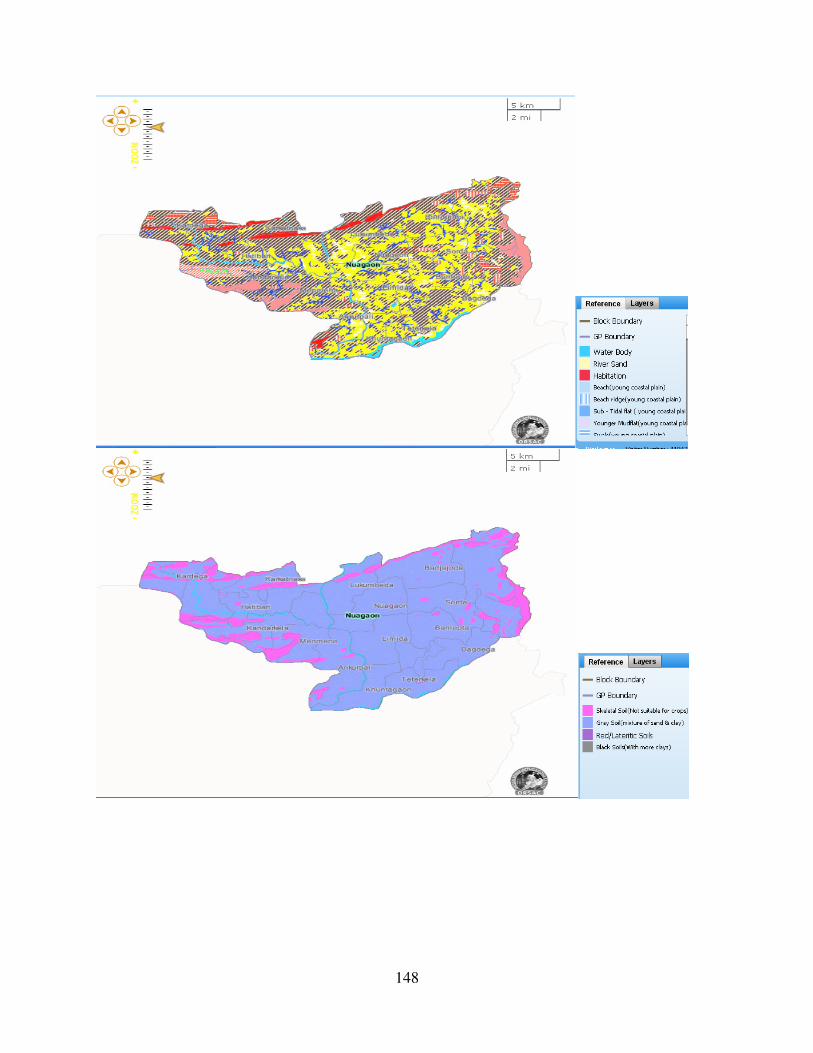
148

149

150

151

152

153

154
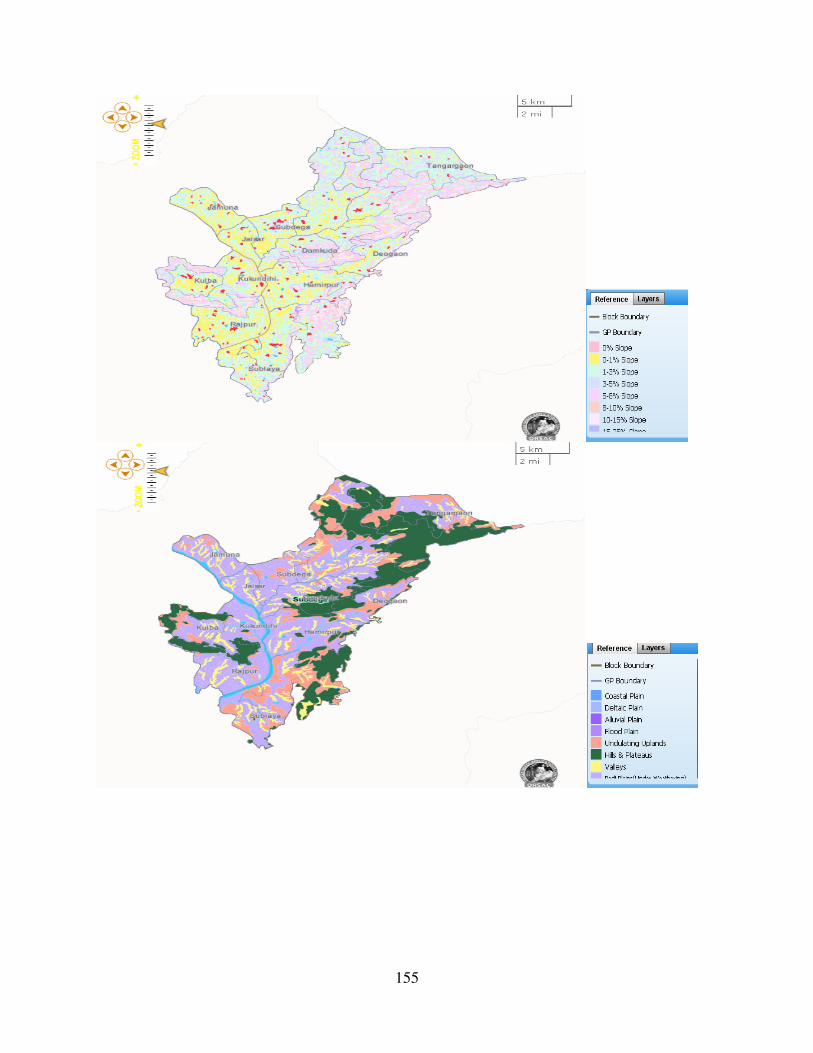
155

156

157

158

159

160

161

162

163

164