District Census Handbook, Andamans District & Nicobars, Part ...
Upload
khangminh22Category
view
6download
0
DISTRICT ENVIRONMENT PLAN
for
Alwar District
Submitted by:
Sh. Nannumal Pahadia
District Collector and District Magistrate
Alwar, Rajasthan
Prepared by:
MNIT Jaipur, Rajasthan

i
Contents List of Figures .............................................................................................................................................. iv
List of Tables ............................................................................................................................................. viii
Acknowledgement ....................................................................................................................................... xi
Preface ........................................................................................................................................................ xii
Prologue ..................................................................................................................................................... xiii
1. Introduction ......................................................................................................................................... 16
1.1 District Environment Plan: Background ........................................................................................... 16
1.2 Constitution of District Environment Committee ............................................................................. 17
1.3 National Green Tribunal Directions .................................................................................................. 18
1.4 Objectives of the District Environment Plan .................................................................................... 19
2. Profile of Alwar District ..................................................................................................................... 21
2.1 Introduction ....................................................................................................................................... 21
2.2 Geographic Profile ............................................................................................................................ 21
2.2.1 Location and Extent ................................................................................................................... 22
2.2.2 Land-Use Pattern........................................................................................................................ 22
2.3 Administrative Set-up ....................................................................................................................... 23
2.4 Physical Linkages ............................................................................................................................. 25
2.5 Physical Setting ................................................................................................................................. 29
3. Demography of Alwar District ........................................................................................................... 31
3.1 Population Assessment ..................................................................................................................... 31
3.2 Urban Profile of Alwar District ........................................................................................................ 32
3.3 Economy ........................................................................................................................................... 33
4. Waste Management ............................................................................................................................. 34
4.1 Literature Review .............................................................................................................................. 34
4.1.1 Municipal Solid Waste ............................................................................................................... 34
4.1.2 Plastic Waste Management ........................................................................................................ 48
4.1.3 Construction and Demolition Waste Management .................................................................... 68
4.1.4 Bio Medical Waste Management ............................................................................................... 80
4.1.5 Hazardous Waste Management ................................................................................................ 100
4.2 Present Scenario and Action Plan ................................................................................................... 130
4.2.1 Municipal Solid Waste Management ....................................................................................... 130
4.2.2 Action Plan for Municipal Solid Waste Management ............................................................. 150

ii
4.2.3 Plastic Waste Management ...................................................................................................... 154
4.2.4 Action Area for Plastic Waste Management ............................................................................ 158
4.2.5 Construction and Demolition Waste Management .................................................................. 160
4.2.6 Action Areas for C&D Waste Management ............................................................................ 162
4.2.7 Biomedical Waste Management .............................................................................................. 164
4.2.8 Action Areas for Bio-Medical Waste Management ................................................................. 167
4.2.9 Hazardous Waste Management ................................................................................................ 168
4.2.10 Action Areas for Hazardous Waste Management .................................................................. 169
4.2.11 E-Waste Management ............................................................................................................ 170
4.2.12 Action Plans for E-Waste Management ................................................................................. 171
4.3 Summary ......................................................................................................................................... 172
4.3.1 Municipal Solid Waste Management ....................................................................................... 172
4.3.2 Plastic Waste Management ...................................................................................................... 177
4.3.3 Construction and Demolition Waste Management .................................................................. 181
4.3.4 Bio-Medical Waste Management ............................................................................................. 183
4.3.5 Hazardous Waste Management ................................................................................................ 184
4.3.6 E-Waste Management .............................................................................................................. 184
5. Water Quality Management .............................................................................................................. 185
5.1 Water Quality Monitoring ............................................................................................................... 185
5.1.1 Literature review ...................................................................................................................... 185
5.1.2 Present Scenario and Gap Identification .................................................................................. 188
5.1.3 Action Plan ............................................................................................................................... 203
5.1.4 Summary .................................................................................................................................. 207
5.2 Rainwater Harvesting ...................................................................................................................... 208
5.3 Domestic Sewage Management Plan .............................................................................................. 211
5.3.1 Literature review ...................................................................................................................... 211
5.3.2 Present scenario and gaps identification .................................................................................. 219
5.3.3 Action Plan ............................................................................................................................... 225
5.3.4 Summary .................................................................................................................................. 228
6. Air and Noise Pollution Management Plan ....................................................................................... 229
6.1 Air Quality Management ................................................................................................................ 229
6.1.1 Literature Review ..................................................................................................................... 229
6.1.2 Present Scenario ....................................................................................................................... 242
6.1.3 Action Plan ............................................................................................................................... 249
6.1.4 Summary .................................................................................................................................. 256

iii
6.2 Noise Pollution Management .......................................................................................................... 257
6.2.1 Literature Review ..................................................................................................................... 257
6.2.2 Present Scenario and Gap Identification .................................................................................. 263
6.2.3 Action Plan ............................................................................................................................... 264
6.2.4 Summary .................................................................................................................................. 264
7. Industrial Waste Management .......................................................................................................... 266
7.1 Literature Review ............................................................................................................................ 266
7.2 Present Scenario and Data Gap ....................................................................................................... 273
7.3 Action Plan...................................................................................................................................... 283
7.4 Summary ......................................................................................................................................... 285
8. Mining Activity Management Plan ................................................................................................... 286
8.1 Literature Review ............................................................................................................................ 286
8.2 Present Scenario and Gap Identification ......................................................................................... 298
8.3 Action Plan...................................................................................................................................... 300
8.4 Summary ......................................................................................................................................... 302
9. Rural Environment Management Plan .............................................................................................. 304
9.1 Literature Review ............................................................................................................................ 304
9.1.1 Soils of India ............................................................................................................................ 304
9.1.2 Agriculture in India .................................................................................................................. 306
9.1.3 Present Scenario in Rajasthan .................................................................................................. 310
9.1.4 Governance and Management Structure .................................................................................. 313
9.1.5 Rules and Regulations .............................................................................................................. 317
9.1.6 Literature Case Studies ............................................................................................................ 318
9.1.7 Environmental Management in rural areas .............................................................................. 319
9.1.8 Present Scenario for Alwar District ......................................................................................... 322
9.2 Conclusion ...................................................................................................................................... 326
10. Forest Conservation Practices and Management Plan .................................................................. 328
10.1 Literature Review .......................................................................................................................... 328
10.2 Present Scenario and Gap Identification ....................................................................................... 337
10.3 Action Plan.................................................................................................................................... 342
10.4 Summary ....................................................................................................................................... 344

iv
List of Figures
Figure 2.1 Location of Alwar district in Rajasthan (Coordinates: 27°34′12″N 76°36′00″E) ..................... 21
Figure 2.2 Urban Growth pattern for Alwar ............................................................................................... 23
Figure 3.1 Population of Alwar District ...................................................................................................... 32
Figure 3.2 Rural Urban Alwar Population Distribution .............................................................................. 32
Figure 4.1 Map of Cities Generating distinct Quantities of MSW ............................................................. 35
Figure 4.2 Composition of Urban MSW ..................................................................................................... 36
Figure 4.3 Waste Generation Techniques ................................................................................................... 37
Figure 4.4 Typical section of sanitary landfill. ........................................................................................... 47
Figure 4.5 Types of Plastics ........................................................................................................................ 48
Figure 4.6 Sustainable Development Goal 12 ............................................................................................ 59
Figure 4.7 Process of making Recycled Road (S. Sharma & Mallubhotla, 2019) ...................................... 60
Figure 4.8 Process of making Bags and T-shirts......................................................................................... 62
Figure 4.9 Eight R’s waste hierarchy extended diagram ............................................................................ 68
Figure 4.10 Construction and Demolition Waste ........................................................................................ 69
Figure 4.11 Schematic of Current vs. Ideal C&D Waste Management Processes in India ........................ 70
Figure 4.12 C&D Waste Composition: Indian Urban Areas ...................................................................... 71
Figure 4.13 Major Steps in Processing of C&D Waste .............................................................................. 75
Figure 4.14 Process Outlay for Processing of C&D Waste into Secondary Raw Materials ....................... 76
Figure 4.15 Standardised C&D Waste Management in a City without a Central Processing Unit ........... 79
Figure 4.16 Standardised C&D Waste Management Model with a Central Processing Unit .................... 80
Figure 4.17 3R’s Concept ........................................................................................................................... 81
Figure 4.18 Different Categories of Bio-Medical Waste (Babu et al., 2009) ............................................. 83
Figure 4.19 Composition of Bio-Medical Waste (Babu et al., 2009) ......................................................... 83
Figure 4.20 Waste Management Process .................................................................................................... 88
Figure 4.21 Waste Segregation at Source in Correct Liners (CPCB, 2019a) ............................................ 89
Figure 4.22 BMW Collection Bins ............................................................................................................. 91
Figure 4.23 (International Infectious Substance Symbol) Biohazard sign .................................................. 92
Figure 4.24 E-waste Flow in India ............................................................................................................ 123
Figure 4.25 E-waste recycling chain, (Source UNEP, Step initiative, 2009) ........................................... 129
Figure 4.26 Population Distribution for all ULBs of Alwar District ........................................................ 138
Figure 4.27 Waste Generation for 10 ULBs in Alwar District ................................................................. 139
Figure 4.28 Dry Waste Generation for 10 ULBs of Alwar District .......................................................... 139
Figure 4.29 Wet Waste Generation for 10 ULBs of Alwar District ......................................................... 140

v
Figure 4.30 Large Quantity of Legacy Waste at Closed Dump Site, Alwar ULB .................................... 141
Figure 4.31 Google Earth View of Closed Dump Site, Alwar (Coordinates- 27°32'36.9"N 76°41'34.8"E)
.................................................................................................................................................................. 142
Figure 4.32 Waste Dumped near Road Side in Bhiwadi ULB ................................................................. 143
Figure 4.33 Animal at Waste dumped near Road Side ............................................................................. 143
Figure 4.34 Waste bin at market area in Thanagazi ULB ......................................................................... 143
Figure 4.35 Waste Dump site Thanagazi ULB ......................................................................................... 143
Figure 4.36 Twin Bin Tipper for Segregated Waste Collection in Ramgah ULB .................................... 143
Figure 4.37 Choked unlined Drainage due to Waste Dump in Ramgarh ULB ......................................... 143
Figure 4.38 Waste dumped Near Residential Area, Ramgarh ULB ......................................................... 144
Figure 4.39 Sewage near Road due to Lack of Drainage .......................................................................... 144
Figure 4.40 Tipper in Waste Collection Operation, Ramgarh ULB ......................................................... 144
Figure 4.41 ULB Wastewater Dump Site in Ramgarh ULB .................................................................... 144
Figure 4.42 Dedicated Staff of Ramgarh ULB ......................................................................................... 144
Figure 4.43 Municipal waste Dumped near Waste water Drain, Laxmangarh ULB ................................ 144
Figure 4.44 MSW with plastic Waste Dumped Near Road Side, Laxmangarh ULB ............................... 145
Figure 4.45 Wastewater near Residential Vicinity in Laxamangarh ULB ............................................... 145
Figure 4.46 Dump Site, Laxmangarh ULB ............................................................................................... 145
Figure 4.47 Plastic Waste at Dump Site, Laxmangarh ULB .................................................................... 145
Figure 4.48 Tipper for Waste collection at Tijara ULB ............................................................................ 145
Figure 4.49 Large Quantity of Legacy Waste on Dump site at Tijara ULB ............................................ 145
Figure 4.50 Waste Collection Tipper Vehicle at Kishangarh Bas ULB ................................................... 146
Figure 4.51 Common Dump site for Kishangarh Bas and Khairthal ULBs ............................................. 146
Figure 4.52 Tyre Recycling Facility near Rajgarh ULB ........................................................................... 146
Figure 4.53 Waste Collection Vehicle at Rajgarh ULB ............................................................................ 146
Figure 4.54 Legacy Waste Tratment Facility at Rajgarh ULB Dump Site ............................................... 146
Figure 4.55 Mechanical Segregator at Alwar ULB (27°30'56.8"N 76°45'08.6"E) ................................... 147
Figure 4.56 Closed Dump site with Large Volume of Legacy Waste at Alwar ULB .............................. 147
Figure 4.57 Manuual MRF Facility at Alwar ULB................................................................................... 148
Figure 4.58 Google Earth view of Waste Dump Site Thanagazi (27°23'25.4"N 76°19'17.9"E) .............. 148
Figure 4.59 Google Earth view of Waste Dump Site Tijara (Co-ordinates 27°56'09.7"N 76°51'51.3"E )
.................................................................................................................................................................. 149
Figure 4.60 Google Earth view of Waste Dump in Open, Ramgarh ULB (27°34'59.0"N 76°48'47.4"E) 149

vi
Figure 4.61 Waste Dump Site, Khairthal and Kishangarh Bas ULB (Coordinate 27°48'32.8"N
76°37'33.9"E) ............................................................................................................................................ 150
Figure 5.1 Circularity in Waste water Management ................................................................................. 188
Figure 5.2 Administrative Division .......................................................................................................... 189
Figure 5.3 Average Rainfall for Alwar District (1957-2019) ................................................................... 190
Figure 5.4 Location of Piezometer Wells in Alwar District ..................................................................... 196
Figure 5.5 Overhead Water Supply Tank in Rajgarh ULB (27°14'08.8"N 76°36'41.8"E) ....................... 201
Figure 5.6 Baveri- Artificial Water Storages Structure (27°14'08.8"N 76°36'41.8"E) ............................. 202
Figure 5.7 Slogan Writing for Water Conservation .................................................................................. 209
Figure 5.8 Sewage Treatment Technologies ............................................................................................. 212
Figure 5.9 Schematic flow diagram of MBBR process (Source: urbanindia.nic.in)................................. 213
Figure 5.10 Schematic flow diagram of Submerged Membrane Bioreactor process (Source:
urbanindia.nic.in) ..................................................................................................................................... 214
Figure 5.11 Process followed in fecal sludge treatment (Source:cpeeho.gov.in) ..................................... 215
Figure 5.12 Google Earth view of 20 MLD STP, Alwar ULB ................................................................. 220
Figure 5.13 20 MLD STP at Alwar ULB (27°30'46.3"N 76°44'47.1"E) .................................................. 222
Figure 5.14 Site Picture of Status of Domestic Sewage in ULBs ............................................................. 223
Figure 5.15 Google Map View Waste water in Market Laxmangarh ULB (Coordinates- 27°21'53.3"N
76°51'43.0"E) ............................................................................................................................................ 224
Figure 5.16 Domestic Sewage dump site, Ramgarh ULB (Coordinates- 27°35'39.5"N 76°49'06.5"E) ... 224
Figure 6.1 Air Quality Management Cycle ............................................................................................... 230
Figure 6.2 Breakpoints for AQI Scale 0-500 (units: μg/m3 unless mentioned otherwise) ........................ 231
Figure 6.3 Schematic of an integrated global to local framework for air quality monitoring. .................. 232
Figure 6.4 Rajasthan’s major industrial zones with industrial output ....................................................... 235
Figure 6.5 AQMP 6 step procedure ......................................................................................................... 236
Figure 6.6 Episodic Urban Area Quality Management Plan (Gokhale & Khare, 2007) ........................... 238
Figure 6.7 Best Practices as Policy Brief (Seth Block, 2018) ................................................................... 242
Figure 6.8 Graphical Representation of Monthly Average Concentration of PM10 in Alwar City ........... 246
Figure 6.9 Graphical Representation of Monthly Average Concentration of SO2 in Alwar City ............. 246
Figure 6.10 Graphical Representation of Monthly Average Concentration of NO2 in Alwar City .......... 247
Figure 6.11 Graphical Representation of Monthly average concentration of PM10 in Bhiwadi City ....... 248
Figure 6.12 Graphical Representation of Monthly average concentration of SO2(µg/m3)....................... 248
Figure 6.13 Graphical Representation of Monthly average concentration of NO2(µg/m3) ...................... 249
Figure 6.14 Different type of Noise Barrier .............................................................................................. 262

vii
Figure 7.1 Effluent Treatment Technologies ............................................................................................ 271
Figure 7.2 Planning Process of a CETP .................................................................................................... 272
Figure 7.3 Industrial Waste dumped in open at Bhiwadi ULB ................................................................. 283
Figure 8.1 Waste Generation in Mining Cycle ......................................................................................... 286
Figure 8.2 Methodology applied to good mining practice ........................................................................ 287
Figure 8.3 Impacts of mining projects on wildlife, Habitat fragmentation ............................................... 288
Figure 8.4 District wise distribution of mineral deposits .......................................................................... 292
Figure 8.5 Issue of Mining Lease by Mining Department ........................................................................ 297
Figure 8.6 Marble Industries in Ramgarh ULB (27°34'56.5"N 76°48'30.4"E) ........................................ 299
Figure 8.7 Google Map Earth View of Marbel Industries at Ramgarh ULB ............................................ 299
Figure 9.1: Major Soil types and their percentage in India (Maps of India, 2021) ................................... 305
Figure 9.2 Soil Map of India (Maps of India, 2021) ................................................................................. 305
Figure 9.3 Agro-climatic Regions/zones in India as per the planning commission (PCI, 1989) .............. 310
Figure 9.4 Land use Area (lac. Ha.) pattern in Rajasthan (as per 2016 Statistics) (DoA, 2021) .............. 311
Figure 9.5 Agro-climatic Regions/zones of Rajasthan (DoST, 2010) ...................................................... 312
Figure 9.6 Cropped area in Rajasthan (as per 2016 Statistics) (DoP, 2017) ............................................. 313
Figure 9.7 Road site Drainage work on Village Road (Coordinates- 27°34'01.5"N 76°47'36.2"E) ......... 325
Figure 10.1 Share of forest in the world (Ritchie & Roser, 2021) ............................................................ 328
Figure 10.2 Forest Cover in India, 2015 (ISFR, 2019) ............................................................................. 330
Figure 10.3 Forest cover in Rajasthan (ISFR-b, 2019) ............................................................................. 331
Figure 10.4 Management of forests in a region ........................................................................................ 333

viii
List of Tables
Table 2.1 Alwar District Profile ................................................................................................................. 22
Table 2.2 Administrative Division of Alwar District, source ..................................................................... 24
Table 3.1 Population of Alwar District ....................................................................................................... 31
Table 4.1 Components & treatment for municipal solid waste ( TERI, 2014) ........................................... 46
Table 4.2 Duties and Responsibilities of Stakeholders (Central Pollution Control Board, 2017) .............. 73
Table 4.3 Categories of Bio-Medical Waste (BMWM Rules, 1998) (CPCB, 2016) .................................. 85
Table 4.4 Color Coding of BM Waste Dustbins (BMWM Rules, 1998) (CPCB, 2019a) .......................... 90
Table 4.5 Classification of Physical Hazards ............................................................................................ 101
Table 4.6 Classification of Environment Hazards .................................................................................... 103
Table 4.7 Definitions of E-waste .............................................................................................................. 110
Table 4.8 Categorisation of items ............................................................................................................. 120
Table 4.9 Recycling Principles ................................................................................................................. 124
Table 4.10 Population of ULBs, Alwar District ....................................................................................... 130
Table 4.11 Inventory of Solid Waste in Alwar District ............................................................................ 131
Table 4.12 Litter Bins and Waste Bins Storage ........................................................................................ 133
Table 4.13 Report on compliance in segregated solid waste management ............................................... 133
Table 4.14 Waste Management operations in Alwar District ................................................................... 134
Table 4.15 Report on efficacy of infrastructure ........................................................................................ 136
Table 4.16 Report on Material Recovery Facility ..................................................................................... 137
Table 4.17 Report on financial adequacy of ULB .................................................................................... 137
Table 4.18 Report on Notification and Implementation of by-laws ......................................................... 138
Table 4.19 ULB wise action plan for Alwar district ................................................................................. 153
Table 4.20 Report on Inventory of Plastic Waste Generation .................................................................. 155
Table 4.21 Report on linkage with stakeholders & Availability of facilities for recycling/utilization of PW
.................................................................................................................................................................. 156
Table 4.22 Report on Implementation of PW management rules, 2016 and Implementation of ERP ..... 157
Table 4.23 Action Plan for Plastic Waste Management ........................................................................... 159
Table 4.24 Inventory of C&D waste ......................................................................................................... 160
Table 4.25 Scheme for bulk waste generator and C&D waste deposition center ..................................... 161
Table 4.26 By-laws and recycling plant for C&D waste .......................................................................... 161
Table 4.27 Action points for C&D waste management ............................................................................ 164
Table 4.28 Report on Inventory of Biomedical Waste Generation, 2019 ................................................. 166
Table 4.29 Action Plan for Bio-Medical Waste Management .................................................................. 167
Table 4.30 Hazardous Waste Datasheet for Alwar district ....................................................................... 168
Table 4.31 Action Plan for Hazardous Waste Management ..................................................................... 169
Table 4.32 Report on E-Waste Management ............................................................................................ 170
Table 4.33 Action Plan for E-Waste Management ................................................................................... 172
Table 4.34 Summary for SWM in all ULBs of Alwar District ................................................................. 174
Table 4.35 Summary about PWM for all ULBs of Alwar District ........................................................... 178
Table 4.36 Summary for C&D waste management in all the ULBs of Alwar District............................. 182
Table 4.37 Summary about Bio-Medical Waste Management for all the ULBs of Alwar District .......... 183
Table 4.38 Summary of present status and action points for HWM in all the ULBs of Alwar ................ 184

ix
Table 5.1 Land Use, Alwar District .......................................................................................................... 191
Table 5.2 Tehsil-wise distribution of River Basin area, Alwar District .................................................... 191
Table 5.3 Status of Irrigation Bunds, Alwar District ................................................................................ 192
Table 5.4 Block-wise Range of Depth to ground Water Level, Alwar District (May, 2015) ................... 193
Table 5.5 Block-wise Range of Depth to ground Water Level, Alwar District (Nov, 2015) ................... 194
Table 5.6 Block-wise Ground Water Level Trend(2001-2012), Alwar District ....................................... 194
Table 5.7 Categorization on the basis of stage of development of ground water for blocks of Alwar ..... 197
Table 5.8 Datasheet for Water Quality Management for Alwar ............................................................... 198
Table 5.9 City-wise, category- wise data of number of WS connections ................................................. 199
Table 5.10 City-wise, data of population served by piped water supply .................................................. 199
Table 5.11 city-wise and source- wise data of water supply ..................................................................... 200
Table 5.12 City-wise/PHED circle water quality data .............................................................................. 200
Table 5.13 Drinking Water Quality Standards .......................................................................................... 201
Table 5.14 Summary of recharge structures and percolation tanks .......................................................... 204
Table 5.15 Locations of Watersheds in Alwar .......................................................................................... 210
Table 5.16 Report on Inventory of domestic sewage ................................................................................ 219
Table 5.17 Actions and timelines for domestic waste management ......................................................... 226
Table 5.18 Summary about Domestic Sewage Management Alwar District, highlighting present status
and action plan for future .......................................................................................................................... 228
Table 6.1 Other Applicable rules and regulations for the district ............................................................. 233
Table 6.2 7 Non-attainment Cities of Rajasthan State .............................................................................. 239
Table 6.3 Air Quality Management Datasheet Alwar District .................................................................. 243
Table 6.4 Overall Baseline Emission Inventory (2017) for the Bhiwadi City (kg/day) ........................... 245
Table 6.5 Monthly Average Concentration of Pollutants in Alwar City .................................................. 245
Table 6.6 Monthly average concentration of Pollutants in Bhiwadi City ................................................. 247
Table 6.7 Action Plan for Alwar Air Quality Management ...................................................................... 249
Table 6.8 Ambient air quality standards in respect of noise for different areas/zones ............................. 260
Table 6.9 Rajasthan Noises Management Act, 1963 ................................................................................ 260
Table 6.10 Present Scenario in Alwar district ........................................................................................... 263
Table 6.11 Action Plan for Noise Pollution Management ........................................................................ 264
Table 6.12 Summary for noise management in Alwar district ................................................................. 265
Table 7.1 Inventory of industrial wastewater Generation in Alwar .......................................................... 280
Table 7.2 Status of compliance by Industries and action taken in treating wastewater ............................ 281
Table 7.3 Registered Small Scale Industries in District Alwar ................................................................ 282
Table 7.4 Action Area for Industrial Waste Management ........................................................................ 284
Table 7.5 Summary about Industrial Waste Management in Alwar District ........................................... 285
Table 8.1 Mining Activity Datasheet ........................................................................................................ 298
Table 8.2 Responsibility of the district with plan of Action ..................................................................... 302
Table 8.3 Summary Table for Mining Activity Management for Alwar district ...................................... 303
Table 9.1 Projections of various food products demand in India for 2020-2021(million tonnes) (Ch.
Srinivasa Rao & Sumanta, 2014) .............................................................................................................. 307
Table 9.2 Yield Gaps in dryland agriculture in India (Ch. Srinivasa Rao & Sumanta, 2014) .................. 308
Table 9.3 Agro-climatic Regions/zones in India (PCI, 1989) ................................................................... 309

x
Table 9.4 Roles and Responsibilities of the Department of Agriculture, Govt. of Rajasthan (DoA, 2016)
.................................................................................................................................................................. 314
Table 9.5 Compositions of Panchayat Samities (GoR, 2021) ................................................................... 322
Table 9.6 Rural Statistics (GoR, 2011) ..................................................................................................... 323
Table 9.7 Rural Environment Datasheet Zila Parishad, Alwar ................................................................ 324
Table 10.1 Regulations regarding forest conservation .............................................................................. 337
Table 10.2 Total Forest Area in Alwar Forest Division............................................................................ 338
Table 10.3 Forest Cover in Alwar District (area in Sq. Kms.) .................................................................. 338
Table 10.4 Activity by Forest Department ................................................................................................ 338
Table 10.5 Range-wise Forest area in Alwar Forest Division .................................................................. 338
Table 10.6 Commonly found Wild life in Alwar District (as per 2020-21 Census data) ......................... 339
Table 10.7 List of Nurseries in Alwar Division ........................................................................................ 339
Table 10.8 Number of Plant Seedlings raised in Nurseries during 2020-21 ............................................. 340
Table 10.9 Range-wise running plantation under different schemes from the year 2015-16 to 2021-22 . 340
Table 10.10 Distribution of Plants to different Ranges of Alwar District ................................................ 341
Table 10.11 Distribution of Plants under different schemes ..................................................................... 341
Table 10.12 Action Plan for Forest Conservation for Alwar District ....................................................... 344

xi
Acknowledgement
It gives us immense pleasure to present the District Environmental Plan for Alwar district. We
acknowledge the support and constructive push of Smt. Sreya Guha, IAS, Principal Secretary, Shri Pavan
Kumar Upadhyay, Secretary, Department of Forest & Environment, Govt. of Rajasthan to complete the
District Environment Management Plan. We express our sincere gratitude and indebtedness towards the
District Collector, Shri Nannumal Pahadia, IAS, for his invaluable guidance and encouragement
throughout the process of preparation of the environment plan. The team thank the contribution and
support of Shri Vikram Kesharee Pradhan, Director cum Joint Secretary, Department of Forest &
Environment, Govt. of Rajasthan. The constant support of Shri Kamlesh Meena Commissioner, Alwar
ULB; Shri Mukesh Kumar Sharma Commissioner, Bhiwadi ULB is also sincerely acknowledge in
formulating this plan. The Forest Department (especially Shri Apoorva Krishna Srivastava, the Deputy
Conservator of Forest) has been the guiding light for us in this humongous task of collecting data,
analyzing it and drawing inferences from it. This work would not have been possible without their
support.
We also express our gratitude to all the Executive officers of ULBs in the district. Some officers that we
interacted directly with are Mr. Ankit Shrivatsav, and Mr. Surender Yadav Assistant Engineer, Bhiwadi
ULB; Mr. Rajesh Verma, Water Resources, Alwar; Mr. Vivek Goel, RO, Bhiwadi (Pollution Control
Board); Sh. Sharad Saksena, RO Alwar (Pollution Control Board); Mrs. Sonali, Excecutive Engineer,
(Pollution Control Board).
We express our sincere thanks to various departments: Regional Office Rajasthan State Pollution Control
Board, District Transport Office, Police Department, Zila Parishad, Nagar Palika /Nagar Parishad,
Department of Water Resources, Public Health Engineering Department, District Industrial Centre,
Factories and Boilers office, RIICO, Education Department, Health Department, SPCB, Public works
Deptt, Agriculture Department, Mining Department; in the district for their whole-hearted support in this
work.
We also thank Prof. Uday Kumar Yaragatti, Director, MNIT Jaipur, Prof. Gunwant Sharma, Dean R&C,
MNIT Jaipur for their constant support and help in timely executing the work. We also thank Shri Surjeet
Singh, Secretary-General, ISPER, Panchkula for providing his valuable suggestion for the improvement
of the work. The team also thank M. Plan and M. Tech. students, who have contributed a lot to the
exercise.

xii
Preface
Our biosphere is rigidly limited with finite resources. Humankind, regardless of its technological
advancements till date and far in future, remains in a state of obligate dependence on the productivity and
life support services of the ecosphere. It is necessary to examine environmental burdens arising from
development choices and prepare an environmental management plan to enhance preparedness in
mitigating the adverse environmental impacts of development.
The District Environment Plan for Alwar district has been prepared in pursuance of the directions issued
by the Honorable National Green Tribunal (NGT) and is based on Model template for District
Environment Plan proposed by Central Pollution Control Board (CPCB), New Delhi. The plan presents
the current status of various environmental attributes, identifies probable environmental issues and
proposes an action plan. I am confident it will be a useful reference in planning and executing various
development schemes of the district for maintaining the environmental quality and will prove to be an
invaluable asset for concerned departments.
The active participation, invaluable contributions and team effort of all the concerned district officials is
highly appreciated with a request to forge similar synergies in their respective domains to make this plan
a success.
Special thanks are extended to Dr. Nand Kumar, Associate Professor and Head, Department of
Architecture and Planning; Dr. Virendra Kumar Saharan, Department of Chemical Engineering; Dr.
Vivekanand Vivekanand, Associate Professor, Centre for Energy & Environment; Dr. Ashwani Kumar,
Assistant Professor, Department of Architecture and Planning; MNIT Jaipur and their team for accepting
the task of preparing the district environment plan for Alwar district. Thier relentless efforts throughout
the preparation of this report are highly appreciated. The plan shall surely prove fruitful to the region and
the people of Alwar.
Alwar Shri Nannumal Pahadia, IAS
October 2021 District Collector and District Magistrate

xiii
Prologue
Nature is indispensable to our lives; we are solely dependent on natural processes for the bulk of our
waste disposal; for most of the cycling of chemical nutrients that sustain our food production; and for
maintaining a library of genetic information. In the backdrop of the fact that biosphere is rigidly limited
with finite resources and humankind regardless of its technological advancements till date and far in
future remains in a state of 'obligate dependence' on the productivity and life support services of the
ecosphere, it is necessary that development choices are made in cognizance of the environmental carrying
capacity.
There is a complex set of relationships, arising firstly from our place in nature, secondly coloured by our
system of values, thirdly leading us to specific kinds of conduct, and fourthly leading us to attempt
modifications of nature. This modification of nature may take many physical forms; varying with our
varied needs. Notwithstanding the varied physical forms arising from our differentiated activities, in fact
we are simply a part of a large and exceedingly complex system and are continuously adjusting our
relationship with nature. The overall aim of environmentally sound development, therefore, is to
minimize the negative impact of development on the environment.
Vision
The Government of Rajasthan intends to adopt 7R approach (Reduce, Reuse, Recycle, Refurbished,
Recover, Refill, and Remove) by imparting thrust on collection, segregation, improving data and
analytics, minimizing environmental impacts, creating market for recyclable products and aiming towards
sustainable development. The principle of 7R is essential strategy for achieving the sustainability. It
reduces the load and over exploitation on the natural resources and is a key for resource efficiency. It
envisions sustainable use of natural resources like cultivable land, forests and water bodies and also aims
at reversing environmental degradation by restoring the degraded ecosystems thus ensuring their
availability for future generations.
Mission
Environmental concerns in India have been attended significantly in the past few decades marked by
notable increase in citizen awareness, proactive approach by governments and landmark judgments by the
judiciary and evolution in jurisprudence. At this juncture, it is pertinent to evolve context specific
strategies to attend the environmental concerns. The district environment plan is one such attempt to
examine environmental burdens arising from development choices and prepare an environmental
management plan to enhance preparedness in mitigating the adverse environmental impacts of

xiv
development at the district level. Subsequently, information from all district environment plans shall
serve as basis for preparing the State Environment Plans and finally, the National Environment Plan.
Central Pollution Control Board (CPCB), New Delhi, in pursuance of the directions issued by Honorable
National Green Tribunal (NGT) has placed the model template of the District Environment Plan on its
website, which specifies the scope, data requirements and structure of the report. Typically, District
environment plan should outline the present status and gaps in implementation and also identify agencies
responsible, requirement of infrastructure facilities for sewage treatment, waste management, monitoring
environmental quality etc. District environment plan should also provide timelines for implementation;
identify local issues, constraints in implementation, priority action areas and issues requiring more
attention. Accordingly, the report on ‘District Environment Plan for Alwar District’ is being organized in
sixteen chapters and the chapter outline is presented below, in sequel.
Chapter 1 Introduction: The Chapter deals with background information for preparation of the District
Environment Plan along with its objectives, scope, and the details of the District Environment Committee
for Alwar district of Rajasthan state.
Chapter 2 Profile of the Alwar District: A brief profile of the aspects that define the development context
of Alwar district such as: Administrative System, Geographic Location and regional connectivity,
Topography and Climatic Conditions,
Chapter 3 Demography of Alwar District: A brief profile of the aspects that define the development
context of Alwar district such as: Demographic profile, Economy and Workforce Profile, Industrial
Profile, Social and Physical Infrastructure; etc. is presented in this chapter.
Chapter 4 Waste Management: duly filled and verified dataset of the CPCB prescribed waste management
parameters i.e., Solid Waste Management, Plastic Waste Management, Construction and Demolition
Waste, Bio Medical Waste Management, Hazardous Waste Management, and E- Waste Management,
ULB wise analysis of existing scenario and future projections, present status of implementation,
identification of gaps, the details of action plan, actionable points along with proposed timeline and
estimate of financial cost is presented in the chapter.
Chapter 5 Water Quality Management Plan: duly filled and verified dataset of the CPCB prescribed water
quality and Domestic Sewage parameters, an analysis of existing scenario, present status of
implementation, identification of gaps, the details of action plan, actionable points along with proposed
timeline is presented in the chapter. The chapter also has description for Rainwater Harvesting provisions
in the district.

xv
Chapter 6 Air Quality Management Plan: deals with the Status and Inventory of Air Quality Management
in the Alwar District along with a brief insight on each of the air pollutants. 'Noise Management Plan'
deals with the Status and Inventory of noise pollution in Alwar District. Duly filled and verified dataset of
the CPCB prescribed water quality and Domestic Sewage parameters, an analysis of existing scenario,
present status of implementation, identification of gaps, the details of action plan, actionable points along
with proposed timeline is presented in the chapter.
Chapter 7 Industrial Waste Management Plan: duly filled and verified dataset of the CPCB prescribed
Industrial Waste Management parameters, an analysis of existing scenario, present status of
implementation, identification of gaps, the details of action plan, actionable points along with proposed
timeline is presented in the chapter.
Chapter 8 discusses the ‘Mining Activity Management Plan'. Alwar district is rich in mineral resources.
Alwar is fairly endowed with various minerals whose industrial use has immensely contributed to the
economy of the district.
Chapter 9 on Rural Environment Management Plan is a comprehensive account of different aspects of the
environment in the rural areas of the district.
Chapter 10 on ‘Forest Conservation Practices’ covers the general information regarding types of forest
found in Alwar district, forest land, the current management practices being adopted. The threats to
forest/forest land in context to this district have also been identified and discussed. Finally, different
afforestation activities proposed in forest land, as well as city/town area, are listed along with brief action
plans.

16
1. Introduction
1.1 District Environment Plan: Background
On July 15, 2019, the Honble National Green Tribunal in New Delhi issued an order in O.A. No.
710/2017 titled Shailesh Singh Versus Sheela Hospital and Trauma Centre Shahjahanpur that it is
necessary to have a District Environment Plan to be operated by the District Committee, and on
September 26, 2019, the Honble National Green Tribunal in New Delhi issued an order in O.A. No.
360 of 2018 filed by Shree Nath Sharma Vs Union of India and others that it is necessary that CPCB
is directed to assist the District Magistrates in the creation of the District Environmental Plan by
putting a model plan on its website. All districts, under the supervision of the District Magistrate, may
adopt this model plan as needed to meet local needs.
In the above-said order, it is stated that among others
“Chief Secretaries may personally monitor compliance of environmental norms (including
BMW Rules) with the District Magistrate once every month. The District Magistrates may
conduct such monitoring twice every month.”
“We find it necessary to add that in view of Constitutional provisions under Articles 243 G,
243 W, 243 ZD read with Schedules 11 and 12 and Rule 15 of the Solid Waste Management
Rules, 2016, it is necessary to have a District Environment Plan to be operated by a District
Committee (as a part of District Planning Committee under Article 243 ZD) with
representatives from Panchayats, Local Bodies, Regional Officers, State PCB and a suitable
officer representing the administration, which may, in turn, be chaired and monitored by the
District Magistrate. Such District Environment Plans and Constitution of District Committee
may be placed on the website of Districts concerned. The monthly report of monitoring by the
District Magistrate may be furnished to the Chief Secretary and may be placed on the website
of the district and kept on such websites for a period of one year. This may be made operative
from 1.08.2019. Compliance of this direction may also be seen by the Chief Secretaries of the
States/UTs. This may not only comply with the mandate of law but provide an institutional
mechanism for effective monitoring of environment norms.”

17
In light of the above discussion, it has been proposed that the Alwar District Environment
Development Plan be prepared in such a way that it not only outlines the current status and gaps in
implementation, but also identifies the agencies responsible, as well as the need for infrastructure
facilities for sewage treatment, waste management, and environmental quality monitoring, among
other things. It also includes implementation timelines, local issues, implementation constraints,
priority action areas, and issues that require additional attention.
State and national environmental plans will be developed based on the District Environment Plans. It
is necessary to ensure that information from all District Environmental Plans is incorporated into State
and National Environment Plans.
1.2 Constitution of District Environment Committee
The District Collector of Alwar, vide letter no. F-Misc./2020-21, issued the directives. For the purpose
of preparing the District Environment Plan, Rajasthan State Pollution Control Board, Department of
Environment, and an officer representing the administration formed a District Committee with
representatives from Village Panchayats, Municipal Councils, Regional Offices, Rajasthan State
Pollution Control Board, Department of Environment, and an officer representing the administration.
In collaboration with Shri, Head of District Environment Committee and District Collector, Alwar,
MNIT Jaipur has been tasked with preparing the District Environment Plan.
This plan was created in accordance with the CPCB's model District Environment Plan (DEP) and
covers the following topics:
Waste Management Plan
Solid Waste Management Plan
Plastic Waste Management
C&D Waste Management
Biomedical Waste Management
Hazardous Waste Management
E-Waste Waste Management
Water Quality Management Plan
Domestic Sewage Management Plan
Industrial Wastewater Management Plan
Air Quality Management Plan
Mining Activity Management plan

18
Noise Pollution Management Plan
The awareness about the preparation of District Environment Plans among the stakeholders of each
department were created in a time-bound manner and action plans were formulated to implement it.
1.3 National Green Tribunal Directions
A. According to the NGT's order dated 15.07.2019 in O. A. No 710-713/2017, O.A. No. 606/2018,
numerous stakeholders are responsible for making the solid waste management plan a successful and
implementable action. National Green Tribunal has issued several directions in various matters which
have been based on status brought out by the CPCB on their website and status reports filed before the
Tribunal.
B. In the present case, it was stated in an order dated September 26, 2019: - I While dealing with the
compliance of the Municipal Solid Waste Management Rules, 2016, this Tribunal raised various
issues and necessitated monitoring at the level of the Chief Secretaries and District Magistrates in
O.A. No. 606/2018. The Chief Secretaries of all the States/UTs, including the Chief Secretary of State
of Rajasthan, have appeared before this Tribunal, and orders have been made for continued
surveillance and the filing of additional reports. (ii) The direction has been issued by order dated
12.09.2019, while assigning a timetable for the future appearance of the Chief Secretaries of all the
States/UTs to compile information with reference to the following specific thematic areas viz.:
Compliance with Solid Waste Rules including Legacy Waste.
Compliance to Bio-medical Waste Rules.
Compliance with Construction & Demolition Waste.
Compliance with Hazardous Waste Rules.
Compliance with E-waste Rules.
351 Polluter Stretches in the country.
122 non-attainment cities.
100 industrial clusters.
Status of STPs and re-use of treated water.
Status of CETPs/ETPs including performance.

19
Ground water extraction/contamination and re-charge.
Air pollution including noise pollution.
Illegal sand mining.
Forest Conservation Practices and Management Plan
Rejuvenation of water bodies
C. The National Green Tribunal (NGT) has issued Pan-India Directions on a variety of environmental
matters, which must be carried out by the Central and State Governments, as well as other relevant
institutions. Furthermore, the Directions must be carried out at the district level, encompassing all
cities, towns, and villages.
District Collectors/Magistrates, Pollution Control Boards, Municipal Bodies, Public Health
Engineering Departments, and others are responsible for enforcement.
Chief Ministers/Chief Secretaries with DMs/DCs supervise the current state-level execution and
monitoring framework for several State and Central Government Schemes.
The District Environment Management Plan will include NGT's various directions (DEMP).
Any District-specific cases (if any) and the Committee/Task Force that has been formed have also
been discussed.
1.4 Objectives of the District Environment Plan
The objectives of this District Environment Plan (DEP) are set as given below:
To ensure the conservation of the environment and natural resources at the district level.
Restore ecological balance.
To achieve the Sustainable Development Goals (SDGs) and district level targets within the
prescribed timeline.
To ensure sustainability at the district level following the principles of resource efficiency.
To ensure decentralized micro-level planning, execution and monitoring regarding
environment conservation.

20
To incorporate all facets of environmental conservation in micro-level planning
To harness the active participation of all stakeholders in planned environment conservation
actions.
Assess, mitigate and monitor adverse impacts of various pollution sources at the district level.
Capacity building of stakeholders, departments, agencies, organizations and individuals at the
district level to understand and implement micro-level environmental conservation actions.
To harness inter-departmental coordination for the implementation of action plans.
To develop local knowledge centres and expertise for developing environmental conservation
strategies at the district level.

21
2. Profile of Alwar District
2.1 Introduction
In 1775, Rao Pratap Singh established the study area of Alwar. Salwapur, afterwards known as
Salwar, Halwar, and finally Alwar, was the original name of Alwar, which was derived from the
Salwar tribe. It is one of Rajasthan's 33 districts, and it is located in the state's north-east corner.
North-east, south-east, north-west, and south-west were the four zones that Alwar was divided into.
The National Capital Area (NCR) is the country's first experimental territory, consisting of an inter-
state region centred on the capital core of NCR. Rajasthan Sub-Region is a section of the National
Capital Region that is located in the south-western region of the city. The Rajasthan Sub-Region
(Alwar) is 8290 square kilometres in size. Alwar is located 150 kilometres west of Jaipur and 170
kilometres north of Delhi. Within the NCR, NH-8 (Delhi–Jaipur Road) runs through RSR, connecting
Gurgaon, Maneswar, Bawal, and Rewari (Map-1) The Alwar district is crossed by the NH-11A, while
the NH 71B connects Rewari to Palwal in the north. The railway lines connecting Delhi and
Ahmadabad were built with broad gauge rail line, which passes through the Jaipur, the state capital
(GoR, 2021c).
2.2 Geographic Profile
Figure 2.1 Location of Alwar district in Rajasthan (Coordinates: 27°34′12″N 76°36′00″E)

22
The city of Alwar is located in Rajasthan's north-eastern area. The city is situated between two
metropolises: Jaipur and New Delhi, on the Delhi-Ahmedabad railway line, and stands at the foothills
of the Aravalli range. Alwar city is 48.14 square kilometres in size and has a population of 315,330
people (Census, 2011). The city is divided into 50 wards. Alwar is a city in Rajasthan, India, and the
administrative centre of the Alwar District. It's roughly 150 kilometres south of Delhi and 150
kilometres north of Jaipur, Rajasthan's capital. The city of Alwar is located in the National Capital
Region (NCR). The Ahirwal regional includes Alwar.
Alwar, Bansur, Behror, Govindgarh, Kathumar, Kishangarhbas, Kotkasim, Laxmangarh, Malakhera,
Mundawar, Neemrana, Rajgarh, Ramgarh, Reni, Thanagazi, Tijara are the 16 tehsils that constitute
the district.
2.2.1 Location and Extent
The District is located between 27°34' and 28°4' north latitudes and 76°7' and 77°13' east longitudes,
with a population of 36,74,179 people living in 2021 inhabited communities. The district covers an
area of 8380 square kilometres. The primary rivers that pass through the district are the Ruparel and
Sabi
Table 2.1 Alwar District Profile
2.2.2 Land-Use Pattern
People sought security from external threats such as repeated wars and the dread of wild animals, thus
the city did not expand and remained limited within the border wall until 1940. As a result, the pattern
of urban land use and its structure were likewise achieved in this manner. Along tight zigzag lanes
and streets, the houses were built side by side. Commercial structures with three independent
Alwar: District
No. of Tehsil 16
No. of towns 16
No. of statutory towns 7
No. of census towns 9
No. of villages 2054
Total area (sq.km) 8380
No. of ULBs 12

23
chambers were built on the ground levels of residential dwellings. People's requirements altered
dramatically after independence.
Though the pattern of roads in the city's center was already established under Vinay Singh's tenure,
the rise of urban land use and structure could not occur until after Independence, when growing
immigration necessitated the accommodation of immigrants. As a result, a number of planned and
semi-planned colonies were established. These developments are distinct from those of the old walled
town. House sizes shrank dramatically as the number of nuclear households grew. The expansion of
many functions occurred to meet the needs of the rural population as well.
To help rural people, commercial areas providing agricultural implements and machines, as well as
grain and vegetable markets, have sprung along key external routes. Furthermore, it is due to the need
for industrial labourers that urban land use and structure grew near industrial sites, resulting in urban
sprawl (GOR, 2013).
Figure 2.2 Urban Growth pattern for Alwar
2.3 Administrative Set-up
Alwar district is one of the five districts, those come under Jaipur Division.

24
District Collector & District Magistrate is head of the district for revenue and law and order matters.
District Collector & District Magistrate is the head of District Administration. For admininstration
and development the district is divided into Sub-Divisions and Tehsils.
The district Alwar has 15 Sub-Divisions. Malakhera is newly created Sub-division. There are 15 Sub
Divisional Officers (SDOs) working at the sub-division level.
There are 16 Tehsil headquarters in Alwar district and each one has a Tehsildar as an administrative
officer who work in accordance with the Land Record System to serve for the rural farmers and land
holders
For the purpose of the implementation of rural deveopment projects/schemes under Panchayat Raj
system, the district is divided into 14 Panchayat Samitis (Blocks) and each one has a BDO (Block
Development Officer) to serve as the representatives of the district administration in the rural areas
(GoR, 2021b).
Table 2.2 Administrative Division of Alwar District, source
S.No. Sub-Division Block 2Tehsil Sub-Tehsil
1 Alwar Bansur Alwar Baroda Meo (Laxmangarh)
2 Bansur Behror Bansur Bahadarpur (Alwar)
3 Behror Kathumar Behror Bhanokhar (Kathumar)
4 Kathumar Kishangarh Bas Govindgarh Harsauli (Kotkasim)
5 Kishangarhbas Kotkasim Kathumar Khairthal (Kishangarhbas)
6 Kotkasim Laxmangarh Kishangarh
Bas Mandhan (Neemrana)
7 Laxmangarh Mundawar Kotkasim Narayanpur (Thanagazi)
8 Mundawar Neemrana Laxmangarh Tapukda (Tijara)
9 Neemrana Rajgarh Malakhera Tehla (Rajgarh)
10 Rajgarh Ramgarh Mundawar
11 Ramgarh Reni Neemrana
12 Thanagazi Thanagazi Rajgarh
13 Tijara Tijara Ramgarh
14 Raini Umren Reni
15 Malakhera
Thanagazi
16
Tijara

25
2.4 Physical Linkages
While travelling from Delhi to Rajasthan, Alwar is considered an important city. Indira Gandhi
International Airport in Delhi is 143 kilometres distant, while Jaipur International Airport is 150
kilometres away. Bhiwadi, 90 kilometres from Alwar, has also been approved for an international and
cargo airport. The city is crossed by the Delhi-Jaipur railway line. Alwar is connected to Delhi,
Mumbai, Jaipur, Agra, Jodhpur, Ajmer, Chandigarh, Amritsar, Katra, and other key tourist
destinations in India via the railway network. Bus services are available at Alwar's old bus station,
which is located 5 kilometres from the Alwar railway station (GoR, 2021b).
2.4.1 Regional Connectivity
Alwar's transportation infrastructure has not kept up with the city's rapid growth, causing lots of new
commuting issues for residents. There was no city transit service supplied by the government in
Alwar. For local transportation, the city operates a shared auto service that uses three-wheeled
vehicles known as "Vikram" and "Ganesh." These tempos were between the ages of 20 and 25, and
they were inconsistent.
2.4.2 Major Settlements in close proximity
Alwar's history and roots may be traced all the way back to 1500 BC. It is home to majestic palaces
and forts from a past era, nestled within the green hills of the Aravalli range. Many kinds of birds,
such as the grey partridge and white-throated kingfisher, and mammals, such as the Bengal tiger and
golden jackal, thrive in the deep valleys and dense forest cover of the hills. Alwar is a traveller's
dream because of its beauty and superb architecture, as well as the peaceful lakes, royal hunting
lodges, lush jungles, and a socio-cultural setting unlike any other.
Bala qila
The Bala Qila (young fort) is a towering structure atop a hill that was erected on the foundations of a
10th century mud fort. The fort is made out of strong walls, beautiful marble columns, and delicate
latticed balconies. Jai Pol, Suraj Pol, Laxman Pol, Chand Pol, Krishan Pol, and Andheri Gate are the
six gates that lead to Bala Qila.
Alwar city palace
The City Palace, designed by Raja Bakhtawar Singh in 1793 AD, is a stunning blend of Rajputana and
Islamic architecture. The beautiful marble pavilions built on lotus flower bases in the centre courtyard

26
are the palace's feature. The Maharaja's former residence has been turned into the District
Collectorate. Government offices are currently housed in its great halls and chambers.
The palace museum
The Palace Museum is a must-see for anyone interested in the Maharajas of Alwar's luxurious life and
lifestyle. Rare manuscripts, such as one portraying Emperor Babur's life, Ragamala paintings and
miniatures, and even historic swords originally owned by Muhammad Ghori, Emperor Akbar, and
Aurangzeb can all be found here.

27
Moosi maharani chhatri
The Indo-Islamic style of architecture is shown in this cenotaph, which was created in
commemoration of Maharaja Bakhtawar Singh and his queen, Rani Moosi. The upper section, which
includes columned pavilions and domed arches, is composed of marble, while the bottom section has
red sandstone pillars. The memorial is considered to be one of the best of its kind.
Fateh jung gumbad
This magnificent monument, which features a blend of domes and minarets, is a work of beauty. Its
huge dome, made of high-quality sandstone, can be seen from afar and is a combination of Hindu and
Muslim architecture. It is dedicated to Fateh Jung, a kind-hearted Mughal Emperor Shah Jahan's
minister.
Purjan vihar
Maharaja Sheodan Singh is responsible for this lovely garden, which he designed and built in 1868.
To provide relief from the hot sun, a charming spot known as Simla (the Summer House) was created
in the garden.
Bhangarh
The beautiful town of Bhangarh, constructed by Raja Madho Singh in the 17th century, is 50
kilometres from Sariska Sanctuary. According to mythology, the village was cursed by an evil
magician and abandoned as a result. The curse's nefarious effects are thought to be active even now.
Bhangarh is one of India's most haunted cities.
Garbhaji water falls
Garbhaji Falls is a famous tourist attraction for both foreign and domestic visitors. The outstanding
feature of the location is the stunning sight of water pouring from the rocks. It's popular with
photographers and environment lovers, as well as those who want to go beyond the city's man-made
constructions.
Hill fort kesroli
Turrets, ramparts, and arched verandas distinguish this 14th-century fort. It was constructed by the
Yaduvanshi Rajputs, who are supposed to be Lord Krishna's descendants. The fort has now been
turned into a heritage hotel.

28
Pandu pol
This temple dedicated to Lord Hanuman is reached by a trail that runs via the Sariska Sanctuary gate.
A spring appears to mysteriously cascade down from the rough and solid rocks at the Pandu Pol or
Pandu gate. The Pandava brothers are said to have sought refuge here during their exile, according to
legend.
Neemrana fort
According to legend, the Yaduvanshis, who are thought to be Lord Krishna's descendants, built
Neemrana Fort. Its history is littered with conquests and defeats, and it has moved through the hands
of the Rajputs, Mughals, and Jats until returning to the Rajputs in 1775. It is now operated as a well-
known heritage hotel.
Silliserh lake
This tranquil lake, 15 kilometres southwest of Alwar, is set among forested hills and displays stunning
cenotaphs on its bank. Maharaja Vinay Singh built a hunting chalet for his Queen, Shila, in 1845. It is
now used as a tourist bungalow.
Sariska Tiger Reserve
Sariska Tiger Reserve is only 200 kilometres from Delhi and 107 kilometres from Jaipur, making it
the world's first tiger reserve to successfully move tigers. In 1955, it was designated as a sanctuary,
and in 1979, it was designated as a National Park.
Tijara Jain Temple
This famous Jain pilgrimage centre is around 60 kilometres from the Alwar-Delhi road. The ornately
designed ancient temple was created to honour Shri Chandra Prabha Bhagwan, the eighth Tirthankar.
He ruled his kingdom for numerous years before acquiring Diksha and being initiated. He was the son
of King Mahasen and Queen Sulakshana. He gained Nirvana after serving humanity for numerous
years and meditating for a month.
Moti Doongri
The original structure of Moti Doongri was constructed in 1882. It served as the residence for royal
family of Alwar until 1928. Maharaja Jai Singh chose to demolish the old palace in 1928 and replace
it with a more spectacular structure.

29
Talvrakash
This fascinating spot, where pilgrims bathe in hot sulphur springs, is reached through the Sariska-
Alwar road. It has a distinct atmosphere, with dispersed temple bells and strolling langurs. It is well-
known for being the location where Mandav Rishi sought penance.
Bhartrihari Temple
Bhartrihari Temple is a popular pilgrimage destination that draws visitors from all across the country.
It is based on the mythology of King Bhartrihari, who is claimed to have spent his final years in this
ancient hilltop fortress.
Naraini Mata
This lovely site, located 80 kilometres southwest of Alwar, is home to hot springs and a temple
devoted to Naraini Mata. The annual Baisakh Sudi fair attracts individuals from all castes, with the
largest gathering of ‘nais' (barbers).
Neelkanth
Neelkanth is truly hidden deep within the Sariska Tiger Reserve and in the centre of the mountainous
Aravalli range. Rough roads, steep curves, and little evidence of human presence line the path to the
shrine, adding to the mystique surrounding it.
Naldeshwar Shrine
This shrine is located 24 kilometres south of Alwar, amidst rocky hills. Two natural ponds in the
historic Shiva temple draw water from the surrounding hills. This region is exceptionally beautiful
and serene during the monsoon season.
Neemrana Baori
The Neemrana Baori is located in Neemrana, not far from the fort palace. The first glance alone gives
an indication of how magnificent the location may have been in the past. Neemrana Baori is an
architectural masterpiece that resembles a fortress rather than a step well.
Lal Masjid, Tijara
Lal Masjid is the name of the mosque located to the east of Tijara Town. Alwar city is about 55
kilometres away (GoR, 2021e).
2.5 Physical Setting
2.5.1 Topography

30
Alwar city, the district headquarters of Alwar district, is situated at 27° 34' north latitude and 76° 35'
east longitude, at a height of 270 metres above sea level. The district covers an area of 8380 square
kilometres. It is encircled on all sides by the Aravali hills, which shield it from the sand and heat of
the Thar desert. River Ruparail is the district's main river, and it supports a diverse diversity of flora
and fauna (GoR, 2021a).
2.5.2 Climate
The district's climate is classified as semi-arid. Summers are scorching hot, while winters are bitterly
cold, with plenty of rain during the south-west monsoon season. Summer temperatures can reach up to
47°C, while winter temperatures can plummet below freezing. The average annual rainfall is 61.2 cm
(GoR, 2021a).
2.5.3 Geological and Mineralogical profile
The district is shaped like a quadrilateral. In most places, the Aravalli mountains feature rocky hill
ridges and are generally parallel. These appear in the district from the north east in the Tijara
subdivision and extend southwards for about 24 kilometres, terminating near Naugaon, establishing
the district's northern boundary. Mandawar is another significant hill range in the district, passing
through Jindoli and Alwar on its way to the district's extreme south west corner, which borders Jaipur.
A mature topography of more or less flat topped hills comprising the northern continuation of the
main Aravalli range characterises the region. The territory is dominated by a folded hill range that is
densely forested and home to the well-known Sariska Game Sanctuary. While the flood plains in the
east and north support intensive agriculture production, Alwar is an agriculturally successful area in
Rajasthan.
2.5.4 Hydrology
The rocks of the Delhi Super Group are primarily underlain in Alwar, with minor outcrops of
Bhilwara Super Group and Post Delhi Intrusives at sites overlain by Quaternary alluvium. The
presence of ground water in the district is primarily influenced by geographic factors, physical traits,
and structural features found in geological formations. Ground water in the area is restricted in
phreatic zones, semi-confined in deeper zones, and found in worn and cracked areas of the hard rocks
(GOI, 2017).

31
3. Demography of Alwar District
3.1 Population Assessment
The purpose of population assessment is to gather the information needed to understand the type and
distribution of services required for a population to gain the maximum benefit. This requires an
understanding of the health and wellbeing needs of the population in order to support improvement
through health and care services and other initiatives including self-care. The approach outlined here
involves three stages: i) assess the level of need for health and social care services ii) describe the
current pattern and level of supply of services iii) identify the extent of the gap between need and
supply.
Alwar had a population of 3,674,179 people in 2011, with male and female populations of 1,939,026
and 1,735,153, respectively. Alwar had a population of 2,992,592 people in the 2001 census, with
1,586,752 males and 1,405,840 females. The population of Alwar District was 5.36 percent of
Maharashtra's total population. In comparison to the population in 2001, there was a 22.78 percent
increase in the population. Alwar District's population increased by 27.22 percent between 1991 and
2001, according to India's last census (GoR, 2011).
Table 3.1 Population of Alwar District
Description 2011 2001
Population 36.74 Lakhs 29.93 Lakhs
Actual Population 36,74,179 29,92,592
Male 19,39,026 15,86,752
Female 17,35,153 14,05,840
Population Growth 22.78% 27.22%

32
Figure 3.1 Population of Alwar District
3.2 Urban Profile of Alwar District
In the 2011 census, 17.81 percent of the people of Alwar lived in the district's urban areas. In total,
654,451 people live in urban areas, with 349,518 men and 304,933 females. According to 2011 census
data, the sex ratio in Alwar district's urban area is 872. In the 2011 census, the child sex ratio in Alwar
district was 851. In the urban region, there were 85,433 children aged 0 to 6, with 46,165 males and
39,268 females. Alwar district's child population is 13.21 percent of the total urban population.
According to the 2011 census, the average literacy rate in Alwar district is 83.39 percent, with males
and females literate at 91.02 percent and 74.67 percent, respectively.
Figure 3.2 Rural Urban Alwar Population Distribution
Rural
18%
Urban
82%
Rural Urban Alwar

33
3.3 Economy
Alwar is a transportation hub as well as an agricultural market. Cloth weaving, oilseed and grain
milling, and the manufacture of paint, varnish, and pottery are among its significant industries.
Agriculture:
Alwar district has total geographical area 8380 Sqkm. The area under irrigation is 3744.94 sq km
which is about 44.68 percent of the total geographical area of the District. Prominent five rivers of the
District are Ruparel and Sabi. Important watershed/drainage are Sabi, Ruparel and Banganga. There
are 129 tanks and dams having capacity to irrigate more than 50 acres of the land in the District.The
list of important bandhs is as enclosed out of which 22 tanks are in the jurisdiction of Water resources
Department and 107 tanks are in jurisdiction of Panchayti Raj Deptt.The details of 107 dams can be
obtained from Zila Parishad, Alwar office (GoR, 2019).
Resources and power:
The district is a fairly regular quadrilateral in shape with its central northern portion consisting of
tehsil Mandawar on the north, tehsil Behror on the west tehsil Tijeras on east and Laxmangarh tehsil
on its south eastern corner. The rocks belonging to pre aravalli and consisting of schists and
quartizites with intrusions of granite occur in the southernmost pene plained part of the district. The
pre Aravalli is succeeded by 700 m. which sequence of metasediments belonging to Delhi super group
for the study of which the district offers the type area. The rocks of Raialo Group consists of dolomite
marble and felspathic quartizities with subordinate schist’s and marbles whereas Ajabgarh group is
dominated by phylites, marble and quartzite (GoR, 2019).
Infrastructure
The infrastructure such as Communication, transport, industrial training facilities are sufficiently
developed to cater to the needs of the district. The only constraint is power supply. Similarly, the
social amenities like education medical, housing, banking, etc. also seem to be sufficient for the
present needs. But with the suggested industrialization program me, these facilities would have to be
augmented in tune of the requirements from time to time (GoR, 2019).
Colleges & Institutes
The district has registered 86.1% the literacy rate in year 2011 of 861 in which 71.68 percent is
registered for male and 85.08 for female. However, the literacy rate registered for the State as a whole
in the 2011 stood at 88.3% (GoR, 2019).

34
4. Waste Management
4.1 Literature Review
4.1.1 Municipal Solid Waste
Any garbage or refuse, as well as sludge from a wastewater treatment plant, a water supply treatment
plant, or an air pollution control facility, and other discarded material resulting from industrial,
commercial, mining, and agricultural operations, as well as community activities, is considered waste.
Almost everything we do produces garbage in some form.
MSW, often known as trash or rubbish, is made up of ordinary goods such as product packaging,
grass clippings, furniture, clothing, bottles, food scraps, newspapers, appliances, paint, and batteries
that we use and then discard. This is found in our homes, schools, hospitals, and workplaces.
Infectious infections, land and water pollution, drain blockage, and biodiversity loss are all possible
repercussion of an ineffectual municipal solid waste management system. If towns continue to dump
waste without treatment at current rate, 1240 hectares of land would be needed every one year, with
an estimated waste generation of 165 million tonnes bythe end of 2031, the requirement of setting up
of land fill for 20 years of 10-meter height will necessary 66,000 hectares of land.
Meeting incremental infrastructural needs of an expanding urban population in India is getting
increasingly difficult (CPHEEO, 2016b). As the country's population rises, municipal solid waste
management has become more composite, not only because of environmental and aesthetic concerns,
but also because of the huge amounts of municipal solid waste (MSW) generated every day. In 2014–
2015, India generated 1,43,449 tonnes per day (TPD) of MSW, with an average waste of generation
0.11 kg per person per day, according to the Central Pollution Control Board (CPCB). Only 32,871
TPD (22%) of the total MSW was processed or handled, despite the fact that 1,17,644 TPD (80%)
was collected. The amount of garbage generated per capita in India ranges from 0.2 kg to 0.6 kg,
depending on the number of person at home and the economy. Isolation at source, assortment,
transportation, treatment, and logical removal of waste were all inadmissible, bringing about
ecological debasement and a lower expectation for everyday comforts (CPHEEO, 2016b). MSW age
is irrefutably ascending over the world because of quick populace and monetary development, just as
changes in living practices and buyer patterns (Al-Ghouti et al., 2021). The rising volumes of trash
created would not be an issue in case trash was treated as an asset and appropriately dealt with (S.
Kumar, 2016). It's important that waste be seen as a for the most part undiscovered asset for
recuperating assets, acknowledging ecological, financial, and social benefits, and moving toward a
more reasonable future (Ferronato and Torretta, 2019).

35
Municipal strong waste (MSW) dumps in Indian urban areas are in critical state (Datta and Kumar,
2016). Statures and base spaces of 62 dumps sites in 26 urban areas range from 2 to 29 m (i.e., 6 to 95
ft) and 2 to 53 hectares (i.e., 5 to 130 sections of land) separately. These dump sites have potential for
ecological effect since 62% of the destinations are under 500 meter from the networks, 85% of the
locales have groundwater at under 25-meter profundity and 40 % of the destinations have surface
water bodies inside 2 km distance.
Figure 4.1 Map of Cities Generating distinct Quantities of MSW
As displayed in figure 4.2 the organization of metropolitan MSW in India is consist of 51 % organics,
17.5 % recyclables (paper, plastic, metal, and glass) and 31 % of dormant. The dampness content of
metropolitan MSW is 47 % and the normal calorific worth is 7.3 MJ/kg (1745 kcal/kg). The
organization of MSW in the North, East, South and Western areas of the nation differed between 50-
57 % of organics, 16-19 % of recyclables, 28-31 % of inactive and 45-51 % of dampness. The
calorific worth of the waste shifted between 6.8-9.8 MJ/kg (1,620-2,340 kcal/kg).

36
Figure 4.2 Composition of Urban MSW
The Ministry of Urban Development started the Swachh Bharat Mission (SBM) in year 2014 to
advance metropolitan strong waste administration in urban areas (CPHEEO-Part I, 2016). SBM plans
to advance urban communities as motors of financial development by further developing metropolitan
framework quality, guaranteeing administration norms, and guaranteeing proficient administration.
SBM additionally plans to determine city strong waste administration concerns and help urban areas
in making present day and proper arrangements as per (CPHEEO, 2016b). Strong waste
administration can be imagined as a progression of interconnected advances that start with squander
age by individual families, foundations, and organizations and progress by means of Collection,
Segregation, Processing, and Disposal. The cutting edge coordinated civil strong waste administration
depends on the waste administration chain of command displayed in Figure 4.3 the point of which is
to lessen the measure of waste being arranged while amplifying asset recuperation and productivity
(CPHEEO-Part I, 2016).
All out 193 ULBs are answerable for MSW the board in the territory of Rajasthan. The all out strong
waste age in the State is 6625.56 TPD out of which 6475.39 TPD is being gathered through Door-to-
entryway assortment framework from 5350 wards out of 5399 wards of Urban Local bodies. Presently
780.18 TPD squander is being prepared by ULBs out of 6625.56 TPD in 4 strong waste handling
offices working in the State (GOR, 2019)

37
Figure 4.3 Waste Generation Techniques
Decentralized waste management v/s Centralized waste management
Now and again, decentralized waste administration techniques at the local area level are desirable
over incorporated waste administration strategies (CPHEEO, 2016c) e.g., as the size of city
increments or populace builds the waste produced additionally increments so to diminish the weight
on a unified waste administration office decentralized waste administration frameworks are liked.
Decentralized waste administration frameworks, otherwise called local area squander the board
frameworks, lighten the strain of overseeing immense volumes of MSW at a focal area, bringing
down transportation and transitional stockpiling costs (CPHEEO, 2016c) Potential downsides of
decentralized waste administration according to (CPHEEO, 2016c) are: I) In numerous metropolitan
areas, land is hard to get. ii) Inadequate space, preparing, and limit of laborers make it difficult to
keep up with logical and clean conditions. iii) Unreliable final result quality.
Integrated solid waste management and role of informal sector
Coordinated strong waste administration is a thorough way to deal with strong waste counteraction,
reusing, and the board. As per (Datta and Kumar, 2016) eventually, this complete methodology will
support the insurance of human wellbeing and the climate. ISWM analyzes nearby requests and
conditions prior to delineating the best waste administration system for every circumstance. Complete
waste administration, including treating the soil, consuming, and removal at an all around developed
and oversaw landfill site, are the fundamental activities. Indeed, even a little expansion in pay in
urban areas can lead individuals' utilization examples to move, bringing about waste kinds and
volumes that are more hard for regions to oversee. e.g., the inconvenience of lockdowns and the
conclusion of eating foundations (bistros and eateries) has brought about a flood in the transportation

38
of food proportions and food, bringing about the development of different plastic squanders like
polyethylene high-density (HDPE), Low-Density Polyethylene (LDPE), Polypropylene (PP),
Polyethylene Terephthalate (PET), and so forth (S. Kumar, 2016).
ULBs should address an assortment of concerns while arranging a Municipal Solid Waste
administration framework, for example, garbage stream portion and waste stock (Al-Ghouti et al.,
2021). Viable methodologies that can resolve these issues in an all encompassing way are
significantly expected to help MSW the executives arranging. As indicated by (Batista et al., 2021)11
basic achievement factors which whenever executed accurately can address a reasonable method to
conquer the current problem that encompasses the administration of Integrated Municipal Solid Waste
Management they ought to be lined up with public approaches (Digital public meeting, verbalized
activities, improved coordinations), removal procedures (draining, cremation), lawful viewpoints
(adaptable agreements, incorporated enactment), Public Private Partnerships (current and significant
practices, upgraded models for framework) and Energy recuperation (burned strong waste, impetuses
and ventures).
Three administration qualities are vital for economical strong waste administration, as per the UN-
Habitat system: inclusivity (which incorporates the two clients and suppliers of administrations),
monetary manageability, and successful establishments and proactive arrangements (United Nations,
2009). A very much planned and painstakingly executed waste administration strategy will assist with
accomplishing every one of the three "columns" of supportable turn of events (ecological, monetary,
and social): working on financial productivity, especially in asset extraction and use; diminishing or
disposing of adverse consequences on wellbeing and the nearby and general climate; and giving more
appealing and charming human repayments (Le Blanc and UN Environment Program, 2017).
The casual area (which incorporates cloth pickers and unlawful or unapproved recyclers) should
likewise be coordinated into the standard waste administration measure since they handle a lot of junk
without the vital natural protections (S. Kumar, 2016). Recyclables ought to be gathered at the local
area level, ideally with the help of the casual area, and natural waste ought to be overseen through
family treating the soil frameworks and local area treating the soil frameworks (CPHEEO, 2016c).
The casual area, which incorporates the kabaadi framework and waste pickers, is basic to the SWM
esteem chain since it recuperates significant materials from trash. According to (CPHEEO, 2016c) in
India the casual area, which incorporates the kabaadi framework and waste pickers, assumes an
indispensable part in reusing material assortment and preparing. Squander unloaded in unapproved
places, empty parcels, and so forth, trash recuperated by kabaadi framework, trash gathered by casual
waste authorities or waste pickers are totally rejected from squander estimation at depots, handling or

39
removal destinations, which doesn't sufficiently reflect squander age rates, since these estimations do
exclude: squander arranged at unapproved places, empty parts, and so on, squander recuperated by
kabaadi framework, squander recuperated by casual waste authorities or waste pickers from the road,
canisters, and halfway exchange focuses, and so on (CPHEEO, 2016c). Cloth pickers save more than
14 % of the civil financial plan every year, yet their work goes practically unseen, and they are
regularly denied the option to work (Joshi and Ahmed, 2016). As indicated by gauges expressed by
(Joshi and Ahmed, 2016) cloth pickers bring down the heap on transportation and landfills by up to 20
%. This further poses a case in the blessing of consideration of casual area in city strong waste
administration framework with the goal that the waste gathered by them can likewise be represented
in the waste age rates. The advantages of coordinating the casual area as indicated by (CPHEEO,
2016c) incorporate the formation of vocations, social acknowledgment, and security for casual area
laborers, just as the regularization of the reusing market. This can be refined by shaping self
improvement gatherings (SHGs) or cooperatives to empower individuals to function as business
visionaries in a business association (CPHEEO, 2016c). So they may claim unobtrusive reusing
offices that are experimentally and cleanly oversaw later on. The casual area has made a huge
commitment to the reusing of auxiliary materials, with the proportion of all out recyclable materials
bought by scrap purchasers surpassing the normal measure of homegrown strong waste created and
gathered in the Mekong Delta, Vietnam, by 7.9 % and 17.8 %, individually, permitting the economy
to work and develop effectively. Subsequently, the economy can progress to a round economy model
(He and Mai, 2021).

40
Roles and Responsibilities of concerned Institutions
Role of Urban Local body
Due to the large number of institutions and stakeholders engaged in MSWM, it is critical that the
MSWM plan, which attempts to close breach or upgrade service quality, is produced collaboratively.
The ULB, specifically the SWM division, is primarily responsible for developing an MSWM plan. As
per (CPHEEO, 2016a) for the purpose of designing the MSWM plan, a dedicated team or advisory
team, often known as internal collaborator, may be formed. This team should be cross-functional,
with representatives from all departments connected with, influenced by, or influencing SWM
services in a city. The internal collaborator team should be pilot by the ULB's commissioner or chief
executive (CPHEEO, 2016a)
If capacity within the ULB is insufficient, municipal officials may seek advice from subject-matter
experts, academicians, environmental planners, and engineers, according to (CPHEEO, 2016a). The
community (external stakeholders) must be informed and involved, as well as avenues for all
stakeholders to participate in decision-making, for the MSWM approach to be successful. (CPHEEO,
2016a)
Homes, businesses, industries, the informal sector, local government, non-governmental organisations
(NGOs), community-based organisations (CBOs), self-help groups (SHGs), women groups,
secondary school and college students, and members of other institutions that may play a role in
ensuring community participation are examples of typical MSWM system shareholders. (CPHEEO,
2016a). According to (CPHEEO, 2016a) these paticipant would have to act for the interests of men,
women, youth, and other marginalized or at-risk groups of persons involved in the MSWM process.
Women's groups, in particular, must be involved in the planning phase (CPHEEO, 2016a).
Action points and stakeholder responsible as per SWM rules, 2016 (District Collector and District
Magistrate)
● Collection, segregation and treatment of solid waste, strengthening the capacities at ULB’s –
ULB’s
● Notification and implementation of by-laws – ULBs and District Information and Public
Relations Office (DIPRO)
● Awareness – ULB’s, NGO’s, SHG’s, Insp. Of schools, DIPRO
● Monitoring and Review – EO of ULB’s and District level committee

41
Role of State and local authorities
MSW management duties are not only responsibility of ULBs but also State government also. These
are:
● The Secretary-in-Charge of the Department of Urban Development Department (UDD) of the
state or union territory has the complete liability for MSWM system installation in cities and
municipalities in accordance with the SWM Rules 2016.
● UDD is responsible for developing an MSWM state policy and action plan inside the state.
● UDD is needed to report on SLBs in order to provide SWM services in ULBs to the Ministry of
Housing and Urban Development (MoUD).
● UDD is in charge of approving land transfers from the state to ULBs (for all projects).
● The establishment of staff posts is regulated by the states in the ULBs (both technical and
nontechnical).
● The State Pollution Control Board (SPCB) is in charge of regulating pollution at state level.
Ensuring that the MSWM and SWM rules are being followed. It also has the authority to provide
environmental permits.
● The authority to provide local authorities or contractor permission to establish treatment and
disposal facilities is duty of SPCB.
State governments are also required to keep check on the following:
● The separation of trash at the source has been enforced in order to channel waste into wealth
through recovery, reuse, and recycling.
● No one should discard, burn, or bury his or her solid waste on roadways, open public places
outside his or her premises, or in drains or water bodies.
● Hotels and restaurants should separate biodegradable garbage and establish a collection
mechanism to ensure that such food waste is composted or converted to biomethane.
● Residents' welfare groups and gated communities with an area of more than 5,000 square metres
should segregate rubbish and send it over to approved waste pickers or recyclers, or to the local
government.
● Every street vendor should keep appropriate containers for storing waste generated during the
course of his business, such as food waste, disposable plates, cups, cans, wrappers, coconut shells,

42
leftover food, vegetables, fruits, and so on, and deposit such waste at a waste storage depot,
container, or vehicle designated by the local authority.
Best practices for solid waste management
According to Kochi Municipal Corporation, source segregation of garbage is a smart practise. The
case study shows how the segregation of sources, compost, strict legislation combined with the
cooperation of multi-stakeholders results in efficient waste management of urban sites without
appropriate waste sites. (GIZ, 2018).
The Panaji module explains how the Panaji City Company has effectively implemented the vision of a
city for achieving zero landfilling. The entire town is split into at least 6 parts of waste. The dry trash
is further divided into 18-20 recycling parts, composted organic waste and rejected dry waste sent,
among other things, for co-processing. Panaji was supported by a vision, solid leadership, frequent
campaigns and ongoing innovation for various users groups to address the issues of new waste
streams (GIZ, 2018).
The Gorai module explains how the Municipal Corporation of Mumbai needs the scientific closing of
a garbage site. It briefly captures the technological process involving a specific attention on the
standpoint of the community. The module shows a general improvement in living standards, local
economy, ecology and the region's biodiversity both before and after the scientific closure (GIZ,
2018).
The Municipal Corporation of Vijayawada has demonstrated the simple and efficient treatment of
organic waste via decentralised vermicomposting systems. The module provides information of the
vermicomposting technology step-by-step guidance on its operation, maintenance, pre and postal care.
It also displays the great results of vermicomposting by other urban local organisations for replication
(GIZ, 2018).
Hierarchy of Solid Waste Management Approach
A solid waste management hierarchy explains the best actions to take before waste is disposed of at a
waste dump or site. The first and preferable stage in hierarchy, reducing source and reuse is the
prevention of waste. In reducing or reusing waste at the source, fewer raw materials are required and
fewer rubbish must be collected, transported and disposed. This decrease in extractive processes leads
to environmental advantages as well as financial savings over time. Recycling or composting is the
next best alternative for garbage which cannot be reduced or utilised at source. Recycling/composting
results in environmental advantages and economic savings comparable to reduction and reuse of

43
sources, but requires early investment expenses to implement an efficient programme of
recycling/composting. Reduction of sources and strategy of recycling both limit the amount of waste,
including waterbodies and sea litter, which could ultimately reach the environment. For garbage that
is not recyclable or compostable, energy recovery can be explored. The recovery of energy minimises
the waste which ends in sites and dumps and compensates for the consumption of fossil fuel.
However, the recovery of energy from trash can lead to emissions of air pollution and demand large
investment and operating costs (EPA, 2020b).
Best practices at collection and transportation stage
A synchronised primary and secondary collection/transportation system is needed to avoid
overflowing containers and garbage on the roads (CPHEEO-Part I, 2016a).
Primary collection: The process of waste collection is called primary collection from households,
markets, institutions and other businesses (CPHEEO-Part I, 2016a)
Secondary collection is the procedure for collecting and transporting waste from community bins,
storage and/or stations to waste treatment plants or final disposal facilities (CPHEEO-Part I, 2016a).
The collection of waste segregating from residential, business and institutional areas (wet wastes, dry
recyclables and household hazardous wastes), sanitary, horticultural and construction and demolition
scrap (CPHEEO-Part I, 2016a). The waste generated by each of these groups and the amount of waste
separated determine the frequency of waste collection. While daily domestic waste should be
collected, the waste collected twice daily may be collected at market areas, at business enterprises and
institutions. In addition, the type of waste collection is decided by the quantity of waste generated and
collected Separate containers are necessary for various fractions; ULBs must gather at least damp and
dry trash separately. The waste that can be collected from doors can be stored in a secondary
collector's station or transfered directly to secondary collector's vehicles, depending on whether
secondary storage or transfer is more practicable. The availability of secondary car collectors, area
size and collecting time all affect the sustainability of secondary or direct transfers to secondary car
collectors. It is best to synchronise primary and secondary collections whenever possible to avoid
secondary storage containers or depots (CPHEEO, 2016b)
Some of the additional points that may be followed for collection of municipal solid waste are:
● The collection of daily wet waste is advisable. Dry waste and hazardous rubbish can be collected
weekly and home. The local ULB shall collect and disposal separate sanitary waste in an
incinerator daily.

44
● The collection of doors to doors of rubbles utilising ICT and IOT (Internet of Things)
technologies will be monitored by all ULBs. In order to assure 100% garbage collections, this
should be used in all ULBs. The consumption charges can be evaluated using intelligent home
cards against the end user. The smart card can also be used to update the waste pickup status for
all users.
● Additionally, compactor bins can be geo-tagged and equipped with a smart card to enable
monitoring of the bin lifting operation.
The amount of money earned is related to the amount of waste that is processed at treatment facilities.
As a result, treatment facilities rather than disposal centres must transport an increasing share of
garbage. The waste is also collected from treatment facilities, lowering the former's maximum trash
holding capacity. As a result, in order to maximise waste allocations, the quantities moved from
distribution centres to treatment facilities must be greater than those sent to disposal sites (Jalil et al.,
2018).Regardless of the way that the expense of keeping trash per ton at Distribution Centers is less
expensive than the expense of transportation from Distribution Centers to treatment offices and
removal focuses, more trash is dispatched than is kept up with as stock this is because of the inflow
limits of Distribution Centers, which restricts the amount of trash that could be held as stock to not
exactly or equivalent to the appropriation communities' most extreme stock holding limit. The stock
holding limits of Distribution Centers are diminished to limit stock levels and increment waste
shipment from Distribution Centers to treatment and removal offices. Nonetheless, that the chief, then
again, may extend these limits as per the determinations to address the issues of Distribution Centers
and the issue (Jalil et al., 2018).
Best practices at segregation stage
Individuals should be aware of the importance of waste separation at the source. Source reduction and
reuse are two terms that refer to operations that help reduce trash output. NGOs, SHGs, and RWAs
should raise awareness regarding trash separation at the source. School students may be the ideal
target group for instilling the source segregation culture in private houses.
For all ULBs, 100 percent source segregation should be implemented. At the moment, no ULB has a
facility for source segregation. Segregation can be achieved manually or mechanically.
● Efforts should be made to implement decentralized waste management strategies.

45
● Given the low cost of labor in India, manual classification of recyclable fractions into distinct
components such as paper, plastic, and so on may be more appropriate (Malaviya National
Institute of Technology Jaipur, n.d.)
● All ULBs should provide a waste transfer point.
● Distances between the collection places and the finalisation place of treatments and disposal should
govern the location of the intermediate transmission station. Transfer stations may be established if a
distance exceeds 15 kilometres between the competent municipality and the last treatment and
disposal areas or where land is available and needed.
A study found that, unless there is an incentive for townspeople to take part in sources-seperated
collection schemes to a much higher degree than usual in the sector, applying source-separated
materials for the production of paper, plastic, glass and metals would not result in higher material
recuperation rate than or above 35 percent. This could boost the possible recycle rate (Fabbricino,
2001).
Best practices at processing and treatment stage
Inefficient municipal solid waste management can have major negative environmental result such as
infectious diseases, water and soil pollution, drain blockage, and biodiversity loss, but on the other
hand if done efficiently results have showed that plastic recycling contributed significantly to the
economy among plastic, metal, glass, paper, and non-recyclable garbage, and recycling being the
most economical waste management method.
Gasification and incineration are the most efficient ways to generate energy while also lowering trash
volume, according to findings from a model prepared for the city of Tehran, Iran. Recycling and
composting, he added, are the greatest answers and should be prioritised. Overall, recycling is a non-
negotiable alternative that can be a significant source of money and help with cost coverage (Ahmadi
et al., 2020). Recycling and burning are the most prevalent treatment alternatives, according to a
survey done in a Greek region, with landfilling being the least acceptable management option
(Minoglou & Komilis, 2013).
The volume and mix of garbage created determine how quickly processing technology is adopted. It is
necessary to quantify and characterise the waste generated by the local body prior to adopting any
processing or treatment system. Table 4 lists the key components of waste and the techniques required
to treat them (TERI, 2014).

46
Table 4.1 Components & treatment for municipal solid waste ( TERI, 2014)
Type Composition of Waste Traetment Operation
Biodegradable Kitchen, garden and food
waste
Biological Treatment Aerobic processes,
anaerobic processes
Thermal treatment Incineration, pyrolysis
systems, gasification
systems
Transformation Mechanical
transformation, thermal
transformation
Recyclable Plastic Plasma Pyrolysis Technology (PPT), Alternate fuel as
Refuse Derived Fuel (RDF)
Paper Dissolution, Screening, De-inking, Sterilization and
bleaching process
Glass Vitrification technology
Inert Sand, pebbles & gravels Landfilling: Jaw and Pulse Crusher
A landfill without engineered measures may result into a number of hazards e.g. groundwater
contamination (Kumar et al., 2019) surface water contamination (Kumar et al., 2016) air
contamination and landfill gas explosion (Kumar et al., 2018) So it is highly recommended to develop
a sanitary/engineered landfill. To provide a sanitary landfill, a cluster of ULBs may be constructed
and a suitable piece of land designated for the cluster's waste disposal (Kumar et al., 2016) (Kumar et
al., 2018) (Kumar et al., 2019).
The location of the waste disposal must be sufficiently large to last 20-25 years and be built up in
stages to avoid water logging and abuse. Dumping site must be at least 100 metres far from a river,
200 metres away from a pond, 20 kilometres from airports and air bases, and 200 metres away from
motorways, habitats, public parks and wells (CPHEEO, 2016b). Deposit sites may be created in rare
cases within a 10- to 20-kilometer airport/airbase radius, after receipt from the civil aviation
authority/air force of a certificate of no objection, if applicable. This site should not be positioned
within flood basins, coastal control areas, wetland areas, major habitat areas or sensitive eco-fragile
regions, as historical records specify (CPHEEO, 2016b).
The non-development area surrounding solid waste processing and disposals facilities, having
installed capacity greater than five tonnes per day, shall be preserved within the framework of the
entire footprint of the solid waste treatment and disposal plant. The local authority shall prescribe the
buffer zone in conjunction with the competent State Pollution Control Board (CPHEEO, 2016b).

47
The use of closed landfill sites for human habitation or other purposes can be considered only after
confirming that gas emission and leachate quality evaluations fulfil required standards and soil
stability is maintained after fifteen years of post-closure monitoring. Figure 4.4 shows a typical
section of a scientific landfill.
Figure 4.4 Typical section of sanitary landfill.

48
4.1.2 Plastic Waste Management
In today's world, plastic products have become an inextricable aspect of human life. Its application
can be seen in everyday activities all throughout the world, from small communities to developed
metropolises. However, their large-scale production and use result in a large amount of plastic
garbage generation and production.
When a piece of plastic has outlived its usefulness, it is referred to as discarded plastic. Because this
trash is non-biodegradable, it accumulates in the adjacent eco system for an extended period of time,
causing harm to animals, marine life, and humans. Only because the material deteriorates under
thermal pressure, limiting its life duration, virgin plastic can be recycled for reuse up to 2-3 times.
However, these secondary and tertiary versions contain chemicals and colours that are damaging to
the environment. As a result, recycling is not a safe nor a long-term strategy for disposing of plastic
garbage.
The negative consequences of incorrect plastic waste management are not only distasteful to look at,
but they also have an impact on a country's overall economy. Furthermore, as a result of swallowing
plastic waste and water contamination, animals that rely on the environment are at risk. The burning
of trash and plastic objects pollutes the air and harms the ecosystem. Microplastics are produced as a
result of faulty plastic waste management, and they are hazardous to both humans and animals.
Thermoplastics or Recyclable Plastics (do not undergo chemical changes when exposed to heat and
hence can be moulded repeatedly) and Thermosetting Plastics or Non-Recyclable Plastics (do not
undergo chemical changes when exposed to heat and thus cannot be moulded repeatedly) (can melt
and only be shaped once and very hard to be moulded again using the existing technologies).
Figure 4.5 Types of Plastics
If left unchecked, plastic garbage can be toxic and dangerous to humans, animals, and the
environment, posing major risks. They quickly mix with land and water to generate microplastics, and

49
their macro forms operate as physical barriers, degrading soil quality and causing livestock and other
animals to consume them. Plastic debris clogs sewers and streams, causing catastrophic flooding and
runoff obstructions (CPCB, 2013). (Sharma & Mallubhotla, 2019).
Furthermore, plastic trash poses a greater threat to marine ecosystems. According to data conducted
by "The Energy and Resource Institute," 8 million tons of plastic waste enter the waters every year all
around the world. To date, the total amount of plastic garbage in the oceans has reached 150 million
tonnes. Even in efforts to clean up the coast, plastic packing trash makes up roughly 62 percent of the
total proportion (Bhattacharya et al., 2018).
Furthermore, plastic trash poses a greater risk to marine ecosystems. According to data conducted by
"The Energy and Resource Institute," 8 million tons of plastic waste enter the waters each year
throughout the world. And, as of now, the total amount of plastic waste in the oceans is 150 million
tonnes. Even in efforts to clean up the coast, plastic packing materials account for almost 62 percent
of the total proportion (Bhattacharya et al., 2018)
According to a survey by "The Energy and Resource Institute," around 60% of plastic manufactured is
recycled, and approximately 9400 tons of plastic is left abandoned in the environment, creating
pollution of land, air, and water. In a short period of time, 70% of plastic packaging products are
turned into plastic garbage (Bhattacharya et al., 2018).
Lack of segregation of plastic trash, lack of structured collection and efficient aggregation systems,
low economic value in low-grade (thin) plastics, and livelihoods related with plastic manufacture are
main obstacles in the process of Plastic Waste Management.
There is an immediate need for a framework to deal with plastic garbage to prevent the above-
mentioned adverse impacts on the environment and solve the problems. This can be accomplished by
utilising a variety of technologies and processes at each stage of the process, from generation through
collection to final disposal. Plastic Waste Management is the name given to the entire procedure.
Furthermore, it is critical to raise public knowledge about their involvement in the Plastic Waste
Management process and to advocate the use of alternative materials in order to limit the use of
plastics in all forms.

50
Scenario in Country
Every year, the global manufacturing of plastic exceeds 150 million tonnes (Sharma & Mallubhotla,
2019). Packaging films, wrapping items, shopping and rubbish bags, fluid vessels, apparel, toys,
domestic and industrial products, and building materials are all part of this diverse range of
manufacture. Approximately 70% of the total amount of plastic generated is turned into plastic waste
in a little period of time (Sharma & Mallubhotla, 2019).
Around 9.4 million tons per day of plastic garbage is produced in India, which equates around 26,000
TPD. About 60% of this gets recycled, with the informal sector accounting for the majority of it
(Sharma & Mallubhotla, 2019). In contrast, India's recycling rate is significantly greater, roughly 20%
more than the global average. Even so, around 9,400 tonnes of plastic garbage are either disposed of
in landfills or pollute streams and groundwater supplies. A few plastics do not disintegrate, and even
if they do, it can take up to 450 years for them to decompose entirely (Sharma & Mallubhotla, 2019).
(GOI, 2019).
Traditionally, Indian laws concentrated primarily at improving and managing plastic waste in the
country's metropolitan areas, with an emphasis on segregation, collecting, and even banning the use of
some types of plastics. For the first time in 2016, rules were extended to rural areas, with Gram
Panchayats given particular responsibilities.
Scenario in State
There are 193 Urban Local Bodies (ULBs), 295 Panchayat Samitis, and 9,892 Gram Panchayats
throughout Rajasthan's 33 districts (GPs). According to the 2011 Census, the state's population is 6.86
crores, with 24.78 percent living in urban areas and 75.13 percent in rural areas. Plastic garbage
accounts for around 4% of total solid waste created in the state, with ULBs, Industrial Units, RIICO,
and other main sources of generation (GOR, 2019).
Roles and Responsibilities
Central Pollution Control Board
Responsible for regulating and controlling noise producing sources aiming to maintain the ambient air
quality standards (CPCB, 2013)

51
State Level Monitoring Committee
Responsible for planning, facilitating, problem-solving and monitoring overall implementation of the
programme in the state. The Rajasthan Pollution Control Board (SPCB) has issues their instruction
for the management of plastic waste so as to control the pollution levels in the entire state(GOR,
2019).
Department Of Environment, Science and Technology
Responsible for environmental planning, co - ordination, advertising and monitoring of science and
technology, prevention of pollution, reduction of pollution, monitoring and environmental protection
activities and programmes, regulation, policy formulation, monitoring and surveillance by means of
technological advances (S. Sharma & Mallubhotla, 2019)
Ministry of Environment, Forest and Climate Change (MoEF&CC)
Responsible for efficient enforcement of laws, focusing on waste reduction, segregation of source
materials, recycling, involvement of waste pickers, recyclers and waste processors for household or
other production sources in the plastic waste collection system (MoEFCC, 2020).
The Energy and Resource Institute (TERI)
It focused on developing technologies and solutions that minimise the production of trash and turn all
wastes into usable goods. They include promoting the cycle economy by means of effective resource
and clean industrial production and optimising resource recovery and recycling for waste-free towns.
(Bhattacharya et al., 2018)
Ministry of Housing and Urban Affairs (MoHUA)
Responsible for the capacity-building of the Urban Local Organizations (urban local authorities)
focuses on certain components of solidified waste management and holistic sanitation (MoEF&CC,
2016).
Duties of Various Stakeholders as per Plastic Waste Management Rules 2011 (Amendment 2016
& 2018), MoEF&CC:

52
Responsibility of Local Body
i. The development and construction of infrastructure to segregate, collect, store, transport, process
and waste disposal by each local government body, by themselves or through the involvement of
agencies or producers is the task for every local government body. ii. The local authority shall
establish, operate, and coordinate the waste management system and fulfil the associated
functionalities, which include: a) ensuring that the separation, storage, transport, processing and
disposal is done in plastic waste, b) ensuring the process does not cause environmental damage and c)
ensuring that no environmental damage is caused during this process and d) ensuring the processing
and disposal, in accordance with the Central Pollution Control Board, of the non-recyclable fraction
of plastic waste.; and g) Preventing plastic garbage from open burning. iii.The local organisation shall
seek cooperation of manufacturers with the objective of developing a plastic waste management
system and such a system shall be set up within one year after the final publication in the Indian
Official Gazette of these Regulations. iv. It is the local authority that is accountable for drawing up
ordinances incorporating those rules (MoEF&CC, 2016).
Responsibility of Gram Panchayat
Every gramme panchayat, either by itself or through an agency, must develop, operate, coordinate and
perform the following functions in rural regions, as well as in the following: I ensure that recyclable
waste fractions are segregated, collected, stored, transported, and channelled into recyclers with valid
registration; (MoEF&CC, 2016)
Responsibility of Waste Generators
i. The waste generator shall: a. Do not litters plastic waste and ensures the segregation of waste
from the source and transfer separated waste to the urban body, to local gramme panchayat or
organisations designated by them or to register it; b. do not take measures to minimise waste
generation and to segregate plastic at the source in accordance with the 2016 Solid Waste
Management Rules or, as amended, from time to time.
ii. ii. Wastes produced in accordance with the Municipal Solid Waste shall be split and kept
under compliance with all institutional generators. (Management and Handling) Rules of
2016 or amending and delivering segregated waste on its own or by the approved agency for
waste collection, to allowed waste processing or disposal or repository centres.
iii. All waste generators shall pay the user fees or charges that are set by the local authorities for
the management of plastic waste, such as the collection or operation of garbage collection
facilities etc.

53
iv. Every person who is responsible for organising an open-air event that involves serving of
plastic or multi-layered foodstuffs shall, in accordance with the Municipal Solid Waste
Management and Handling Regulations of 2016 or amendments, segregate and manage waste
produced during such events (MoEF&CC, 2016).
Responsibility of Producers, Importers and Brand Owners:
i. Within six months from the publication of the Rules, the producers shall develop, individually
or collectively, through their own distribution channel or through the local authority
concerned, modalities for waste collection systems that are based on Extender Producers'
Responsibility and involving State Urban Development Departments.
ii. Producers, importers, and Brand Owners who advertise the items are primarily responsible for
the collection of multi-layered plastic sachets or sleeves or packaging. They need to develop a
mechanism for the recovery of plastic waste produced by their products. The collection plan
is to be presented in the application for consent to be established or operated by the State
Pollution Control Boards. Within a year of notification of these rules, the Brand Owners
whose consent is renewed before notification of these rules shall produce such a Plan and
implement it for a period of two years.
iii. Manufacture and usage, in a two years’ time period, of plastic multilayer, that can be non-
recovered or non-energy recycled or without alternative use of plastic.
iv. For granting registration a producer shall apply to the Pollution Control Board or, if
applicable, a Pollution Control Committee of the States or of the Union Territories
Administration concerned within a period of three months from the date of their final
publication in the Official Gazette.
v. No producer shall manufacture or use any plastic or multi-layered packaging for packaging
commodity products without registration of the State Pollution Control Board concerned, on
or after an expiration period of six months from the date of final publication of those rules in
the Official Gazette.
vi. Each manufacturer must keep a record of the details of a person supplying plastic that is used
as a raw material to create bags, plastic sheets or similar or coated in plastic sheets or in
multi-layered packaging (MoEF&CC, 2016).
Responsibility of State Pollution Control Board (As Per Rule 12):
i. For the purpose of enforcing the provisions of the present regulations concerning the
registration, manufacture, multi-layered packaging, transforming and disposal of plastic
trash, the State Pollution Control Board is responsible for the territories of the Union.

54
ii. The secretary-in-charge responsible for the waste management of LSG, usage of plastic
bags, plastic sheets and the like, covers made of plastic sheets and packaging of various
layers, must be the authority for compliance with the provisions of the present rules on
waste management by generator.
iii. The gramme panchayat concerned shall have the power to enforce the provisions of those
rules on waste generator management, the use of plastic transmission bags, plastic sheets
etc. and on the covers of plastic sheets and multi-lader packages made in the countryside
of the State or territory of the Union.
iv. Within the territorial limitations of the competence of the District concerned to implement
the provisions of these rules, the authorities referred to in sub-rules (1) to (3) shall assist
the Regional Magistrate or Deputy Commissioner (MoEFCC, 2016).
Responsibility of Retailers and Street Vendors
i. Retailers or road vendors may not market or give consumers with commodities that are not made,
labellated or marked in carry or plastic sheet or multilayered packaging as stipulated by this Rules. ii.
Any dealer or road seller selling or supplying products in, plastic bags or multifaceted packaging or
sheets of plastic or similar products or coverings made from sheets of plastics not made, labelled or
marked under the above rules shall be liable for paying the penalties set out in local bodies' by-laws
(MoEFCC, 2016).
Rules and Regulations
Rules and Regulation to be followed for Plastic Production as per Plastic Waste Management Rules
2011 (Amendment 2016 & 2018), MoE&CC
i. The plastic carrying bags used for the transport or supply of goods, which are an intrinsic part of the
packaged products, are not included. The bag thickness is not <40μ. ii. Compostable plastics
compliant IS/ISO:17088:2008 can also be created with carrier bags. iii. State Pollution Control Board
(SPCB) or Pollution Control Committee shall be the prescribed registration, manufacturing and
recycling authority (PCC). And the municipal authority is tasked with the implementation of rules for
the application, collection, segregation, transport and disposal of plastic trash. iv. Not plastic material
in any form shall be utilised in multi-layered pouches or sachets used in gutkha, etc. packaging v. The
labelling or mark "recycled" in accordance with IS: 14534:1998 shall apply to each plastic bag. Every
bag manufactured of "Compostable" has the "Compostable" mark and complies with IS/ISO:
17088:2008. Each bag is supported. vi. The retailers shall not make a carry bag available for
consumers free of charge. The municipal authorities involved may notify the transport bag to promote

55
re-use to decrease the development of plastic garbage. vii. In order to oversee implementation, each
State Government shall form a State Level Advisory (SLA) body. This organisation shall convene
once a year and may invite specialists, if necessary. viii. The Plastic Waste Management shall be as
under; a) plastic waste shall be recycled, recovered or disposed of in accordance with rules,
regulations and standards from time to time established by the Central Government; b) Plastic
recycling shall take place as part of guiding the recycling of plastics, as updated sometimes, in
conformity with Indian Standard IS 14534:1998; c) In order to ensure safe waste collection,
stockpiling, separation, transport, processing and deposition, no environmental damage is caused
throughout that process the Municipal Authorité is responsible for the setting up, operation and
coordination of the waste management system and for carrying out the related functions; d) The
Municipal Authority may, collectively or individually, request the manufacturers to provide for the
establishment of such a collecting centre, in accordance with the Principle of Extended Producer
Responsibility (EPR); e) Recyclers shall ensure that recycling plants comply with the Indian Standard:
IS 14534:194 titled "Plast Recycling Guidelines" and "Precycling Rules" Ad 1986 amended from time
to time; the Municipal Authority concerned shall ensure the disposal, in compliance with the Sche
Recycles Processes, of residuals created through recycle processes; f) In the Municipal Bye-laws of
all urban local authorities, the Municipal Authority shall incorporate the rules; g) By adopting
appropriate technology such as road construction, co-incineration, etc. the Municipal Authority will
stimulate the utilisation of plastic trash. The municipal authority or the operator wishing to apply such
technology must ensure that the prescribed standards, including pollution standards, are complied
with in that respect by the competent authority. ix. By 30 days of September each year, each SPCB
and PCC must draught and submit annual reports to the CPCB. In its report on the usage of plastic
transport bags, sachets / bags and the management of plastic trash, the Central Pollution Control
Board (CPCB) consolidates the report. The consolidated report and suggestions for implementing the
2011 (amendment) Plastic Waste Rules are submitted to the MoEF by 30th December (CPCB, 2013),
(MoEFCC, 2016)

56
Conditions for Production of Plastic
The following conditions apply to the fabrication, importation, distribution, sale and usage of carrying
bags, plastic sheets or the like, or cover made of plastic sheet and multi-layered packages, namely: i)
Carrying bags and plastic containers shall either be in natural shade without additional colours, or be
created using pigments and colourants in accordance with the Indian Standard only:: IS 9833:1981
entitled 'List of pigments and colourants used for plastic products in contact with foodstuffs,
pharmaceuticals and drinking water; ii) Carry bags made of plastic recycled or items made of plastic
recycled shall not be used in the storage, transport, delivery and packaging of food ready for
consumption or drinking; iii) of virgin or recycled plastic, shall not be less than fifty microns in
thickness; iv) The wrapping of the product shall not be less than fifty microns in thickness unless the
thickness of these plastic sheets impairs the function of the product, or similar, that is not a part of the
multi-layered packaging or plastic sheets used for packaging; v) The manufacturer should not, after
obtaining valid registration with its State Pollution Control Boards or Pollution Control Committee,
sell or arrange plastic to be used as raw material to a producer the manufacturer; vi) Plastic material
sachets shall not be utilised for the storage, packaging or sale of gutkha, tobacco, and pan masala; vii)
Plastic waste recycling shall be in accordance with the Indian Standard: IS 14534:1998 entitled Plastic
recycling guiding principles, as modified occasionally; viii) The thickness of the bags consisting of
biodegradable plastic must not be applied. Compounding plastic containers must be conducted in
accordance with Indian Standard: IS 17088:2008, named Compostable Plastics Specifications as
updated from time to time. Manufacturers or sellers of plastic compost carry bags shall, before selling
and before commercialisation, obtain a certificate from the Central Pollution Control Board, and ix.
plastic material shall not be used in any product packaging for gutkha, panmasala and tobacco in all
forms including vinyl acetate – Malic acid – vinyl chloride copolymer in any form (CPCB, 2013).

57
Producers, recyclers and manufacturers registration
i. Unless you got registration from a national Pollution Control Board before the beginning of the
production, no individual shall produce bags or recycle plastic bags or packaging that is multi layered.
ii. An application in Form-I shall be made to each manufacturer or brand-owner for registration or
registration renewal, a) “The State Control Board concerned, if one or two States or territories of the
Union are running”; or b) “If functioning in more than two states or Union Territories, the Central
Pollution control board”. iii. Application to the State PCB to grant registration or renewal of a
registration in the recycling unit in Form II3 must be made by any person who recycles or processes
wastes or proposes to recycle or process wastes. iv. An application shall be made to the State
Pollution Control Board or the Pollution Control Committee of the territories of the Union in
question, to grant a licence or to renew a registration in the form III4 of each manufacturer involved in
a production of plastic to be used as a raw material by the producer. v. Unless the unit has a valid
consent under the Water (Preservation and Control of Pollution) Act of 1974 (6 of 1974) and Air
(Pollution Prevention and Control) Act of 1981 (14 of 1981) along with a registration certification
issued by a District Industry Centre or any o-Registration, it shall not issue or renegotiate the register
of plastic waste recycling and processing units. vi. Unless the producer has a plan and action plan
certified by the Secretary responsible for Urban Development of the state or the territory of the Union
concerned for plastics waste disposal system, the State Pollution Control Board may not reinstate the
registération of a producer.vii. Upon receiving the full application, the State Pollution Control Board
may, after the inquiry which it sees fit and with the satisfaction that the applicant possesses adequate
installations and technical capacity and facilities for handling plastic waste in a safe manner, grant
registration in all respects for the recycling and processing of plastic wastes under sub-Rule (3), (a)
viii. The decision to grant registration shall be reached within 90 days of receipt of an application that
is complete in all respects by each State Pollution Control Board or Pollution Control Committee. ix.
Initially, registration granted in accordance with this rule is valid for one year, without revoking,
suspending or cancelling and afterwards for three years. x. State Pollution Control Board or the
Pollution Control Committees may not revoke, suspend or terminate the registration without giving a
hearing to the manufacturer or those involved in plastic waste recycling or processing. xi. Each
application for renewal shall be made at least 100 days prior to the end of the validity of the certificate
of registration. (CPCB, 2013), (MoEFCC, 2016).

58
Recommendations from CPCB
In India the disposal of plastic waste is a major concern, however various experiments with the
objective of reusing plastic trash in road building or co-processing plastic waste in cement ovens, etc.
are done due to lack of technology and inadequate implementation. The most commonly utilised
method is now the combustion of plastic trash, however as a result of low grade ovens and their poor
maintenance, they emit dangerous gases, including dioxins and furans that burn chlorinated and
brominated plastic waste (CPCB, 2013)
The fundamental problems with the failure to follow the PWM Rules of 2011 were mainly the
indiscriminate use of plastic bags and litter in towns and villages, as well as the use of pan-masala,
tobacco and tobacco plastic packets. In order for the Rule to be amended appropriately and/or for an
Office Memorandum for improved PWM Rules 2011, a listing of critical points based on contact with
representatives of SPCBs and other agencies may be considered.: i. The definition of petro-based
plastic and compostable plastic or renewable material can be examined in the current PWM Rules. ii.
The monitoring method must be reinforced in order to prevent the market from offering substandard
carry bags (< 40μ). iii. The existing PWM Rules 2011 may include a prescribed enforcement agency
for the use of plastic carrying bags and bags & pouches. iv. MoEFs can be analysed in the light of the
thickness and use of biodegradable plastics or material for food packaging by means of the
recommendations of the Biodegradable Committee (under Director General CIPET). Municipal
authorities may submit an annual report on the execution of the PWM rules to SPCBs/PCCs, 2011., as
the same is not given in the Rules. Accordingly, suitable amendments be made in the Rules. v. It is
possible for SPCBs/PCCs to use plastic waste in highway construction, plastic waste co-processing in
cement ovens, plastic waste conversion into liquid fuel etc. vi. SPCBs/PCCs should create laboratory
facilities for analysing plastic bags and plastic material in bags/pouche thicknesss.vii. The bags of
plastic must be consistent in thickness because some States still allow bags of <40 μ, such as Madhya
Pradesh, Kerala etc. (CPCB, 2013), (S. Sharma & Mallubhotla, 2019)).
Sustainable Development Goal (SDG 12_UNDP): Ensure Sustainable Consumption and
Production Patterns
According to UNDP's SDG 12, regular monitoring of the life cycle of plastic products should be
carried out in order to use the fewest resources possible to produce the greatest output (Figure 4.6).
To limit energy consumption and garbage output, recycling and disposal processes should be
enhanced (Le Blanc & UN Environment Programme, 2017)

59
Fig (a). 17 SDGs Fig. (b). SDG 12
Figure 4.6 Sustainable Development Goal 12
Governance and Management Structure
Among the institutions involved in plastic waste administration are the Central Committee for
Pollution Control, the National Monitoring Committee for the Environment, the Environmental
Sciences and Technology Department and the Ministry of Environment, Forest and Climate Change.
Best Practices
Road construction in Bengaluru: use of plastic wastes (Bruhat Bengaluru MahanagaraPalika)
In addition to KK Plastic Waste Management Ltd (the Bangalore-based company), Bruhat Bangaluru
Mahanagara Palika (BBMP) discussed developing solutions for the use of non-recyclable plastic in
street improvements. The Center of Transport Engineering (CTE) and Central Road Research Institute
have protected and guaranteed innovation (CRRI). Since 2002, the road is around 3000 kilometres
long, using approximately 12,000 tonnes of plastic garbage from the city trash of the area. In 2004-05,
KK Poly Blend in Bitumen, used for street development in the company, signed a memorandum of
understanding to collect and engage with city trash. Yelchenahalli, Kanakpura Road and Anjanapur,
Kanakpura Road, provide its two huge materials suitable for delivering 20 tonnes of material each
day.
The first stretch of road was laid 500m long as a trial run for Karnataka under World Bank Funding.

60
Figure 4.7 Process of making Recycled Road (S. Sharma & Mallubhotla, 2019)
This innovative innovation has resulted in a more efficient procedure for reusing and recycling plastic
trash for road and transportation corridor building (Figure 4.7). Other binding elements are used with
plastic composites. Polystyrene (PS) (hard packaging, cartons, plates, vending cups, etc.);
Polypropylene (PP) (ketchup bottles, yoghurt cups, etc.); Polyethylene (PE) (both low and high
density) are some of the plastics that are favoured for this procedure (plastic bags, water bottle,
shampoo bottle etc.). (Sharma & Mallubhotla, 2019) Polyvinyl Chloride (PVC) or Flux sheets should
not be allowed (GOI, 2019).
Use of Plastic Pavement Block - Hyderabad
The first Dog park situated at Hyderabad; India is a wonderful instance of reusing plastic waste.
Around 400 sq. ft asphalt region outside the recreation center is comprised of 1,500 reused plastic
tiles. It was started and finished by GHMC and Bamboo House India (Hyderabad based beginning
up). The tiles are an eco-accommodating other option and a keen expense saving venture choice for
the administrations as they are solid, enduring and have nearly less expensive assembling cost. Each
tile weight upto 300 grams and is comprised of 600 polybags. They are exceptionally intended for
permeation of water to guarantee better ground water re-energize and are flame resistant and harm
free. Presently a days, these tiles are getting in market and are being utilized for making a few more
common pathways across the city.
Collection and Segregation of Plastic Waste
Cleaning and Drying of Plastic Waste
Shredding Plastic Waste into required
size
Stone aggregate heated to around
160-170° C
Shredded polymer waste is added to heated stone
aggregate for 30-40 sec and mixed for uniform coating
The coated aggregate is mixed with hot
bitumen at trmp. 155-165°C
The mix known as mix platic-aggregate bitumen mix can be used for road laying
at 110-120°

61
Aside from that, the Miyapur Metro Station parking lot was renovated with a one-of-a-kind dwelling
made entirely of recovered plastic garbage. A single housing costs only Rs.1.5 lakhs, which is nearly
half the price of conventional steel shelters. The resultant construction is heat, water, fire-proof, and
damage-free because the raw materials employed were ‘trash' such as tetra packs, bottle caps, and
poly bags. Other plastic debris, such as pet bottles, bags, shampoo bottles, and toothpaste packets, was
also used to create public recycling bins. Each dumpster held 30 kilogrammes of plastic (Sharma &
Mallubhotla, 2019)
Tetra Park's Go Green Initiative
The "Go Green" campaign for the promotion of carton retraining was launched by Tetra Pak India. It
participated with McCann Health India's "Boxes le aao, banao school" campaign, promoting
consumer adoption of green practises by depositing Tetra Pak cartons in collecting centres. These
cartons can be transformed into desks, note pads, examination pads and even clothes for those less
fortunate. In order to increase awareness and promote the recycling of discarded boxes, Tetra Pak's
continuing flagship initiative "Go green with Tetra Pak."
Since the “Go Green” campaign began in year 2010, 1.8 million cartons have been collected and
recycled, and 250 school desks have been donated to underprivileged schools. This initiative is multi-
city, with the initial phase taking place in Mumbai in partnership with retail chains “Reliance Fresh,
Reliance Smart, and SahakariBhandar,” as well as the Mumbai-based environmental NGO RUR
Greenlife (Sharma & Mallubhotla, 2019). (GOI, 2019).
Conversion into textile products of pet bottle waste
A petrochemical organization has started a project to collect PET bottle waste from all over countery
and turn it into textiles. The company is installing RVMs (Reverse Vending Machines) in a variety of
locations, including malls, exposition centres, schools/colleges, and temples/pilgrimage sites, to
collect PET bottle waste and create public acknowledgement about how to safely use PET bottles.
These bottles are collected, repurposed, and used to make fabrics for bags, and clothing made of
natural fibres like cotton and wool (Figure 4.8).
The company has used 4R model instead of 3R model which added “Replace” along with “Reduce,
Reuse and Recycle”.

62
Figure 4.8 Process of making Bags and T-shirts
They replaced old PET bottles with natural raw materials in this way, saving one barrel of oil for
every 8000 PET bottles recycled. Furthermore, wet dyeing changes polyester staple fibre into a dry
one without polluting the environment, and removing wet dyeing from this process eliminated
associated pollutants. As a result, dry dyeing has shown to be environmentally friendly. 1400 litres of
watervsaved on every bag or T-shirt created from PET bottles saved, saved 8 waste PET bottles from
landfill, cut pesticide use by more than 50%, and lowered carbon footprint by 32%.
Therefore, the environmentally friendly PET bottle conversion method is based on the zero waste
idea, renewable energies, sewer pollution prevention, reduction in bag use and the green environment
(GOI, 2019).

63
"Green Recycling Industry," Guwahati Plastic Bottle Recycling (Assam)
"Green Recycling Industry" at Bongshar, Kamrup district is the lone Plastic Bottle reusing unit of
where 3MT waste Polyethylene terephthalate (PET) bottles are reused, creating 'Hot Washed PET
Flakes'. Mr. Ranendra Baishya is the owner of the unit. The Flakes and PET powders goes about as
the element of various polyester pieces of clothing and 2nd grade PET containers The waste plastic
jugs are gathered by the waste authorities and packed into parcels. The bundles are then transferred to
the plant. Subsequent to arriving at the plant, arranging measure is done, and pet jugs are isolated
from different materials. The new reused structure is known as PET chips. Later these drops are
shipped to various offices where it is changed into various completed items.
Collection and treatment unit for plastic waste- Indore
Indore Municipal Corporation (IMC) has set up a Plastic Collection Center (PCC) to reuse and reuse
the city's PW. Alongside setting up a PCC, IMC has additionally introduced a plastic purifying
machine known as a 'Phatka Machine'. Waste pickers isolate and sell the plastic waste that can be
reused. The excess plastic waste is then taken to the PCC where it goes through the most common
way of cleaning and destroying. Around 10 Tons of the destroyed and sanitized plastic is shipped off
the plastic waste fuel converter unit while the remainder of the plastic is shipped off Madhya Pradesh
Rural Road Development Authority for development of streets. Plastic waste fuel convertor unit: IMC
was confronting trouble in removal of scrap plastic like chocolate coverings, tobacco and dish masala
pockets. Along these lines, IMC thought of a plastic waste fuel converter unit. This office chips away
at switch polymerization measure and is fit for creating something like 3000 liter of fuel each day
with 10 tons of scrap plastic waste. The whole interaction requires something like 16 hours. As of
now, the unit is creating around 2400 liter fuel including diesel, petroleum just as unrefined
petroleum. The fuel created is of acceptable quality. This plastic waste fuel change unit has tackled
the issue of removal of scrap plastic waste gathered on regular schedule from the city. Roughly three
crores have been spent as the expense of the plant.

64
Reduce
Plastic, obviously, is especially tricky since it is non-biodegradable and henceforth, perseveres for far
longer than different sorts of waste. A couple of minor changes in day to day existence could assist
with keeping plastics out of the waste stream. A few drives that can be embraced: I) Discourage the
utilization of removal plastics. Observe how frequently we depend on items and supplant them with
reusable forms. ii) Minimize Buying Water and make a propensity for utilizing reusable jug clinched.
iii) Reduce the use of plastic cutlery and use metal utensils. Utilized as more current objects, the
purchase of bundling materials rather attempts to use the materials used until it is very essential iv)
Tax or ban package support Supporting legislation and legislation that charges the boycott of plastics
for single use (CPHEEO, 2016b).
Reuse
The next best thing to recycling. It reduces the amount of plastic in landfills and relieves the load on
recycling systems. Reuse, in reality, acts as a link between reduce and recycle. The reuse of plastic
may help to minimise demand for new plastics, the demand for throwaway plastic and the utilisation
of energy resources (CPHEEO, 2016b).
Recycle
Recycling and repurposing waste plastics has a number of positive profit. It result to a decrease in the
use of virgin product and energy, as well as a decrease in CO2 emissions. (CPHEEO, 2016b);
(CPHEEO, 2016a); (CPHEEO, 2016b); (CPHEEO, 2016a); (CPHEEO (Ruj et al., 2015).
Mechanical Recycling:
The Zig Zag Separator (Air Classifier):
Technique for removing fine dust from recycled materials, such as plastic flake, other granular
materials, light films, or paper/foil contaminants. It is most often used after granulation or dry
washing and is quite effective.
Air tabling: A technique of concentrating densities by differential settlement in regulated upward
airflow under the influence of vibrants, which separate particles of different sizes, shapes and
densities from one other. Ballistic Separator: designed to separate solid waste from the inlet in
accordance with its dimensions, density and shape.
Sink Float Tank (or Dry and Wet Gravity Separation): This density-based technique separates the
many forms of plastics. The heavier plastic fractions sink to the bottom of the tank and the lighter

65
ones to the top. It is a substance for recycling plastic bottles and their caps. The lids and caps of these
bottles are usually made of coloured HDPE plastic, while the bottles themselves are made of PET
plastic. HDPE floats in the Sink-Float Tank, while PET sinks.
Froth Flotation: It is a thorough rinsing technique that uses either fluid or steam to recover huge
amounts of fluid, making it a viable option for recycling. Friction Separation uses a high level of
rotation and friction to dissolve impurities and separate them. This is often used to clean very dirty
and mixed plastics. This strategy is helpful in the process of recycling of filthy plastics.
Electrostatic Separation (or Triboelectric Separation): The electrostatically charged particles pass
through a tribocyclone in which negative charged particles migrate to the positively charged plate and
vice-versa, which allows for the classification of three or more resins.
Plastic Color Sorting: Ultraviolet light used with good digital camera technology to recognize
components as small as 0.04 mm in this technique. Material throughputs of 300-1800 kg/hr are
covered by this series of plastics colour sorting machines. The machine throughput is affected by the
type of material and the amount of contaminants. Sorting accuracy can reach 99.99 percent in most
cases.
Near Infrared (NIR):
Materials when burned, they mainly reflect light with a wavelength in the near NIR. The NIR sensor
can tell the difference between different materials based on how light is reflected. Optical sorting is
used to positively identify various resins. It's mainly utilised for full bottles and jugs, and a particle
size of 50mm is required.
Plastic to Road Construction
New potential for postconsumer plastic recycling are opened up through the usage of materials on
highways. Plastic roads are either completely built of plastic or consist of a plastic blend with other
materials. Polystyrene (PS) (hard packaging, cartons, plates, selling cups, and so on) (PP) (such as
high- and low-density bottles, yoghurt cups, etc.) and polyethylene (PE) (such as low density) are all
plastics that can serve for road building (plastic bags, water bottle, shampoo bottle etc.).

66
Plastic to Pavement Blocks
In contrast to toilet blocks, Plastone Block technology may also be used for making Pavement Blocks.
Plastone block created from a combination of discarded plastics and stones were proven to be
significantly more powerful than concrete blocks by 5 times with greater pressure and water
percolation resistance. It has several advantages over ordinary cement bricks. Each plastone block
requires 300 plastic bags and between 4 and 6 PET bottles. Its weight is modest and its transverse
strength is outstanding. These blocks can be used for a multitude of uses such as floors, walls and
channel furnishings.
Recycling of Multi-Layered Plastic
According to the 2016 rules on plastic waste management (CPCB) "diverse bundling means all
materials used, or to be used in bundling and having no less than a single plastic layer as the principle
fixing element, combined as overlays or co-expelled structures with at least one layer of material,
such as paper, paper board, polymeric materials, metal layers or aluminium film (CPCB, 2013).
Natural product squeezes and wines can be put away at room temperature for extended timeframes in
compartments made of paper, aluminum foil, and polyethylene film. Tea and desserts are bundled in
covered foil with paper within. Indeed, even in hot conditions, this foil is multiple times as watertight
as expected foil: the paper retains dampness while the foil shields the substance from other negative
components. Most organizations incline toward complex bundling since it is light, decreases
delivering volume, doesn't occupy a lot of room on a rack, and is illustrations agreeable.
Until the business finds a solution as opposed to multi-layered bundling, tertiary recicling is the
preferred choice, since the isolation of the individual layers is problematic and expensive. Two
essential cycles for tertiary reuse of different bundling wastes are pyrolysis and gasification. If tertiary
replenishment is unpracticable, quaternary recycling can also be taken into consideration when
reusing complex materials for the recovery of energy from squandering plastics by burning (Sharma
and Mallubhotla, 2019).
Concept of Circular Economy
A circular economy is a restorative or regenerative industrial system. It substitutes the concept of the
end of life with restoration, moves towards renewable energy, eliminates the use of dangerous
chemicals that restrict reuse and re-enter the biosphere and seeks to reduce waste by means of
superior material, product, system and business model development. The process of sustainable
production, sustainable consumption and upgrading is crucial. This is important.

67
Sustainable consumption and production means less. The aim is also to divorce economic progress
from environmental degradation, enhance resource efficiency and promote ecological lifestyles. It can
also contribute substantially to alleviating poverty and transitioning to low carbon and green
economies.
The activity of upcycling is the preparation of a useable product from waste or unwanted material or
the modification of the existing product to add value. The objective of upcycling is to eliminate waste
and increase the efficiency of resources.
There are 2-fold benefits of a circular economy approach, that is, economic and environmental
benefits. The economic benefits include Substantial resource savings; Economic growth; Growth of
employment; Innovation stimulus and Changing demand. The environmental benefits include: Less
greenhouse gas emissions; Conserving vital soil; Water bodies; Bio reserves etc.
Circular economy relates to 4 loops, namely: Repair, Maintenance & Upgrade; Reuse;
Remanufacturing; Re-Upcycling. The transition process from the linear economy to circular economy
involves 4 different approaches, namely: Circular Economy Design; Reverse Cycle; New Innovative
Business Model; Enabler System Conditions.
The new plastic economy has a few transition strategies like: Re-Design, Recycle and Reuse Plastics
(Design packaging so as to make it a less harmful on the environment); Having economical attractive
alternatives so as to reduce the generation of waste; Recycling Pay (Improving packaging at the
palnning stage would make recycling simple and more profitable than sending plastic to the landfill
sites).
Emerging Concept of 8R
The term 8R's refers to an expanded version of the 3R's waste hierarchy, which stands for reduce –
reuse – recycle. The 8Rs require a rethinking of the consumer products purchasing process. The 8 R’s
include: “Rethink, Regift, Recover, Recycle, Refuse, Reduce, Reuse and Repair” (Figure 4.9).

68
Figure 4.9 Eight R’s waste hierarchy extended diagram
4.1.3 Construction and Demolition Waste Management
Safe and practical administration of strong squanders (SW) is quite difficult for current culture. Fast
urbanization is switching the idea of strong waste administration from a low need, confined issue to
an unavoidable ecological and social issue with dangers to general wellbeing and climate.
"Developments and destruction wastefulness" is a squander conveyed by the development,
demonstration, repair, and destruction of all considerable design. It contains construction materials,
floats, jetsam and scrap. Waste for development and destruction is generated at all levels, for example
building streets, bridges, fly over, tram, reconstruction, etc (Figure 4.10). It usually consists of non-
biodegradable materials such as cement, morter, metal, wood etc. (CPCB), 2017).
Due to the rapid expansion, India's development area is scheduled to develop at 7-8% in the next 10
years and is expected to become the world's third largest in the centre of the next decade. It is
estimated that over 70 percent of planned structures will still remain in existence before 2030
(Mckinsey, 2010). It is estimated that around 70% of the structures predicted to exist by 2030 have
still to be built together. A portion of these materials, particularly sand, are as of now confronting
supply imperatives, subsequently influencing the area (Sakshi Gupta & Malik, 2018).

69
Figure 4.10 Construction and Demolition Waste
There ought to be a typical reusing office for the entire locale. The greater part of C&D squander is
non-unsafe. Be that as it may, there are ecological issues during destruction and removal stages.
Certain hazardous problems detected in more established structures include asbestos removal,
polychlorinated biphenyl (PCBs), cables and linkages (brominated fire retardants and copper metals),
lighting mercury and plume paint (Duan et al., 2015). So, C&D waste facility can be managed in time
duration of 10 years.
C&D garbage generation activities in cities and cities are mostly based on: (i) Destroying existing, old
structures; (ii) Existing buildings renovation (residential or commercial); (iii) Construction of new
structure (residential or commercial or hotel etc.); (iv) Excavation or reconstruction of
asphalt/concrete roads; (v) New bridge/bridge/subway construction, etc. New fly; and (vi) Present
collection and disposal system (CPCB), 2017).
In the revised C&D Waste Management Rules 2016, a cradle-to-grave approach must be taken to
properly manage C&D waste. The system should include proper collection, transportation, storage or
collection of the waste from the generator, followed by correct treatment for the waste in recycled or
repurpose items of market value that produce minimum trash disposed of in approved sites. A well-
deployed management system must also include a good C&D waste quantification and classification
system at various processing stages and a well-implemented surveillance system with a clear
documentation procedure.

70
Figure 4.11 Schematic of Current vs. Ideal C&D Waste Management Processes in India
C&D waste generation and utilisation scenario
Huge heaps of C&D garbage are frequently seen alongside major roads in India, causing traffic jams,
congestion, and disturbance, as well as clogging drains. C&D garbage accounts for almost 30% of all
MSW generated in the country. TIFAC regulated a techno-market study on the 'Utilization of Waste
from the Construction Industry,' which focused on the housing/building and road segments. The entire
amount of garbage generated by the construction sector is estimated to be 12 to 15 million tonnes per
year, with concrete and brick debris accounting for 7-8 million tonnes (Shrivastava & Chini, 2005).
According to the CPHEEO, the Indian Real Estate Industry alone is experiencing a 55,000 million
total aggregate deficit. Furthermore, 750 million cum of aggregates would be required to meet the
road building sector's ambitions, putting great strain on natural resources (Jay, 2019).
The resulting C&D waste would have various characteristics based on each city's growth trend and
lifestyles. While recyclable materials such as bricks, wood, metal, and tiles are recycled, concrete and
masonry waste, which accounts for more than half of the trash generated by construction and
demolition activities in India, is not.
The contents of C&D waste created, as well as their respective quantities, vary by region and even
within regions. Soil, sand, and gravel (26 percent), bricks & masonry (32 percent), Concrete (28
percent), metal (6 percent), wood (3 percent), and others (5 percent) make up the typical C&D trash in

71
Northern Plains cities (Figure 4.12). Bricks, tiles, wood and iron metal are sold for reuse or recycling.
The rest of the materials are normally removed in sites (Vani & Shah, 2020).
Figure 4.12 C&D Waste Composition: Indian Urban Areas
C&D waste management is currently very alert and active in the Government, the civil authorities and
industry. More than 10 municipal companies have begun the process of establishing C&D waste
processing facilities (Building Materials and Technology Promotion Council, 2018). In addition,
Delhi is planning to set up four more plants for processing of C&D waste, including one by Delhi
Metro Corporation (DMRC, 2018).
Rationale/Justification for C&D Waste Strategy
To develop an effective implementation strategy, it is vital to comprehend the importance of good
C&D waste management as well as identify the problems and roadblocks.
Economic and Social Benefits
i. For communities, transporting bulky C&D garbage for disposal is an important cost to which a
good, structured C&D waste management system may be lowered (or prevented) with generators
paying for dispose as provided for by Rules of 2016.
ii. The mixture of C&D waste with solid waste compounds the municipal solid waste system and
generates imbalances in the MSW tipping rate.
iii. As can be shown in Delhi and Ahmedabad, C&D waste treatment into recovered items can create
jobs through new companies.
iv. Unregulated disposal of C&D trash produces considerable nuisance, safety and aesthetic hazards
that can be improved by effective management of C&D waste.
Soil, Sand and
Gravel
26%
Brick and
Masonary
32%
Concrete
28%
Metal
6%
Wood
[PERCENTA
GE]
[CATEGORY
NAME]
[PERCENTA
GE]

72
Environmental Benefits
i. Unauthorized dumping of C&D waste through drainage and hydrological channels prevents and
aggravates floods.
ii. Piles of C&D waste come up with to particulate air pollution when carried by wind.
iii. Unauthorised dumping of C&D waste in wetlands or stream/river channels disrupts local
hydrology and related ecosystems.
iv. Hazardous materials associated with C&D waste may leach out and contaminate soil and
groundwater from unofficial dumps.
v. Utilisation of recycled products from processed C&D waste helps reduce pressure on natural
resources by decreasing extraction of virgin materials like sand.
Compatibility with current government policies and priorities
i. Swachh Bharat Mission-India: The Indian flagship waste management programme and resource
recovery programme; C&D waste management is a vital part of its objectives. In comprehensive
yearly surveys, towns must demonstrate advances in cleanliness and trash management, which should
act as an incentive to local organisations.
ii. AMRUT: Urban infrastructure mission focusing on pedestrian areas of 500 ULBs. C&D waste
recycled products (e.g., paver blocks) can be used beneficially for pedestrian zones (MoHUA & NITI
Aayog, 2018).
iii. Smart Cities Mission: Mission proposes transformative projects in cities with an significance on
innovation. C&D waste processing as well as utilisation of recycled products can be included in such
projects.
iv. Housing for All (Pradhan Mantri Awas Yojana): A courageous objective is to create 1,2 million
cheap homes by 2022 to address acute housing shortages. The Mission encourages the use of
'sustainable green resources' and allows the reuse of recovered items from C&D waste.
Governance and Management
Duties and Responsibilities of Stakeholders
In 2016, the Indian government issued the “Construction and Demolition Waste Management Rules”
in response to the challenges caused by C&D waste. These regulations are fairly detailed and handle

73
several stakeholders' obligations, among others generators, municipal authorities, state pollution
control boards and urban development departments.
Table 4.2 Duties and Responsibilities of Stakeholders (Central Pollution Control Board, 2017)
Shareholders Responsibilities and duties
Waste generator ● Collect and store garbage in your facility so that MSW is not spread
or mixed.
● Dispose garbage at identified areas as local authorities have notified.
● Submit waste management plan before construction work /
demolition activity begins and receive approval.
● Payment by the local authorities of the appropriate collection and
disposal charges;.
Utility service
providers and
their contractors
● Preparation of a comprehensive waste planning.
● Preparation of a comprehensive waste planning
Local authority ● C&D waste management by-laws and appropriate levies and penalties
are established. ●
● designate, in cooperation with government agencies, intermediate
collecting places and sites for processing facilities.
● Examine and approve the generator waste management plan and
collect applicable charges.
● Make agreements with private parties to collect, transport and
process.
● Create C&D waste generating database through the connections and
compliance monitoring of waste management permits.
● Sustainable IEC activities for all parties involved.
State Pollution
Control Board/
Committee
● Monitor local authorities' enforcement of the Regulations.
● Calculate and monitor environmental compliance by criteria for the
C&D waste processing facility.
● Prepare yearly reports for CPCB.
State government ● Prepare policy document for C&D waste management.
● Help towns identify land for waste management where necessary.
● Facilitate special procurement to recycled materials by all state
agencies.
CPCB ● Prepare guidelines/regulation for C&D waste management.
● Analyse/compile data collected by SPCBs and prepare annual
compliance report for central government.
BIS/Indian Roads
Congress ● Prepare standards for appropriate utilisation of recycled products from
C&D waste in construction and inroads.
Central ● Compliance facilitation by Ministry of Housing and Urban Affairs,

74
government Ministry of Rural Developmen.
● Review of implementation by MoEFCC.
The local authority is responsible to establish/ get established the C&D waste processing plant
functional within 18 months from the date of notification of C&D Waste Management Rules, 2016 for
1 million and above population cities, within 24 months for cities with population of 0.5 -1 million
and 36 months for the cities with population less than 0.5 million (MoEFCC, 2017).
Guidelines and Advisories
The Ministry of Urban Development (MoUD) In 2012 all states required the establishment, in all
cities/towns, of ecologically friendly CDW recyclers with a population of more than 1 million. CDW
management was recognised and emphasised by the Swachh Bharat Mission (MoHUA & NITI
Aayog, 2018)
Central Public Works Department’s (CPWD) 2014 ‘Guidelines for Sustainable’ A set of
recommendations on recovered C&D wastes was included Habitats' (Department, 2014). The
suggestions offer strategies and safeguards for CDW recycling, and emphasise the necessity for a
deconstruction plan to re-use beneficial goods without a lot of processing.
Building Materials and Technology Promotion Council (BMTPC) In 2016, Guidelines were published
to address a large shortage in Indian traditionals and traditional building materials due to the high
demand for building materials in 2016, and the Guidelines for the Uses of Construction & Demolition
Waste for Construction of Housing Units and Related Infrastructuring for Government Housing
Schemes.
The Ministry of Housing and Urban Affairs (MoHUA) has circulated the notification, if available
within 100 kilometres of the building site, to the CPWD on the necessary use of recycled parts of
C&D trash in construction activities. It has further detailed the use of Lean Concrete, Plain Concrete
(PCC) and Reinforced Concrete Cement (RCC) for construction in coarser and fine types of recyclic
concrete aggregates (RCC) from C&D waste (MoHUA & NITI Aayog, 2018).
In 2015, Delhi PWD released a 2-10 percent use of recycled C&D waste products in construction and
road development guideline for all Delhi Government Departments. In 2018, the Delhi PWD reissued
the consultation. The amended consultation also demands the use of C&D waste products and
promotes the establishment of C&D waste recycling plants, including at least one for each major
government stakeholder, in various places in the city. The advise further mentions that North Delhi

75
Municipal Corporation has made seven C&D dumping sites from single homes available (CPCB,
2017).
Processing and Utilisation of C&D Waste
Material streams in C&D garbage with immediate market value, such as metals and wood frames, are
currently salvaged for the secondary market (typically the informal sector) in India, while the
remainder of the debris is left behind. Some of the debris are utilised to replenish and cover every day,
but the majority of it is not (DGFIZ, 2017). C&D waste treatment plants that produce a large range of
goods have been successfully established in Delhi and Ahmedabad. These processing units must be
set all throughout India as needed by the new Regulations (Vani & Shah, 2020).
Technologies for C&D Waste Processing
Because Indian C&D waste mainly consists of concrete, mortar, bricks and cylinders, processing
generally comprises crushing, shrinking, washing and screening into uniform sizes the material into
aggregated particles which can be used in the construction market as substitutes for primary
aggregates. The processing process is relatively similar to the preparation of stone and uses the same
technology. The key phases and a simplified flow chart for C&D waste processing are shown in
figures 4.13 and
4.14.
Figure 4.13 Major Steps in Processing of C&D Waste

76
Figure 4.14 Process Outlay for Processing of C&D Waste into Secondary Raw Materials
Technology options for small towns and cities
Different measures may be required for tiny cities and communities that generate far less waste. In
India, C&D waste recycling is relatively new; experience from the first few recycling units has
revealed that a centralised stationary processing facility is only economically viable for trash
generation above 100 TPD). Stationary processing facilities, on the other hand, may be viable for
lesser capacity as the market and business models evolve (DGFIZ, 2017).
Although mobile crushers are the viable form of decentralisation that small towns can embrace, for
towns that generate C&D trash less than 20-30 TPD, such a facility is not suggested. Mini mobile
crusher can be a solution for such cities. The use of tiny mobile crushers is a convenient solution for
ULBs to generate less than 1 or 2 C&D waste truck loads each day. Mini crushers can be maintained
by ULB for processing waste into finer secondary raw material with processing capacity of
approximately 5 TPD. Alternatively, selected concrete construction material manufacturers can
maintain the small crushers, to which C&D waste can be sent as an enterprise model. The Foundation
for MSME Clusters is now testing such a model (DGFIZ, 2017).
If ULBs can run a common C&D waste treatment facility close to borders, a cluster strategy is also
conceivable for processing C&D waste. The fixed facility can be accessed or equidistant from a
number of ULBs within a common region. Other ULBs can supply C&D waste on a prorated basis,
and this can be operated by a single ULB, on the basis of the signed agreement. In addition, urban
development agencies responsible for the management of different ULBs can coordinate the
application of this technique (e.g., Chennai Metropolitan Development Authority, Mumbai
Metropolitan Region Development Authority)
Primary Segregation
Primary screening
Primary Crushing
Secondary Crushing
Dust Removal Sand Washing
Chamber

77
The cluster can optionally run a mobile crushing system, which, depending upon the documented
contract, can be relocated between ULBs for a given number of days. Each ULB can store the
material till the machine is able to include C&D waste and treat it for a certain amount of time. For
ULBs with a tight boundaries of 20-30 km which can make large transport costs financially unviable,
both of the above-mentioned methods are advisable.
Best Practices of C&D Waste Management in India
In India, scientific processing and utilisation of C&D waste has seen some success. In 2010, Delhi
became the first city to implement a C&D waste management plan with the establishment of a pilot
processing facility through a public-private partnership (PPP). After the pilot plant's initial success
processing garbage at 500 TPD, the plant's capacity has been extended to 2,000 TPD (MoHUA &
NITI Aayog, 2018). Delhi planned to establish a scattered network of processing plants in different
zones of the city to save transportation distances and expenses. As a result, two more smaller plants
(500 TPD and 150 TPD, respectively) have recently come online (2017-18), with more planned
(MoHUA & NITI Aayog, 2018)
Ahmedabad was the second Indian town to utilise a PPP-like strategy to C&D waste processing in
Delhi. A 300 TPD processing plant was opened in 2014 and the capacity was upgraded to 600 TPD in
2016 and to 1,000 TPD in 2018, following a successful year of operation (DMRC, 2018).
Both Delhi and Ahmedabad are followed by the DBOFT model of Design Build Operate Finance and
Transfer. The Municipal Corporation contracts with a private company which is responsible, with its
own funding, for the transportation and treatment of C&D waste and for the development of the
necessary infrastructure. It provides the contracting party with property for the establishment of the
processing plant and also identifies a number of interim collecting points at favoured places across the
city. The authorised agency collects and transports C&D trash from these collection sites and
unauthorised dumping sites, as instructed by the urban authorities, to the plant. The municipal
company shall pay an agreed charge per tonne of rubbish collected and transported to the authorised
agency. The authorised agency may also charge waste collection directly from major generators for
recycling (such as Metro Rail), although the company receives waste at its own expense if waste
generators bring the processing facilities. Thus, two sources of income for your private partner are
ULB "tapping fee" and the sale of C&D waste recycled products. This guarantees the company's
viability. But the use of recycled products derived from C&D trash on the market remains a
continuing challenge in Delhi and Ahmedabad both (DMRC, 2018).

78
Proposed C&D Waste Management Model
Collection
Existing Practices– Most ULBs do not collect or transport C&D waste in regular manner. Typically,
the waste is collected by a local contractor and utilised for restocking elsewhere, or it is dumped
illegally. Some towns have designated landfills/dumpsites for trash disposal, and waste generators
must make their own arrangements to dump waste there. In most situations, however, this does not
occur since the dumpsite is either located on the outskirts of town or the designated region is unknown
to the waste generator due to poor communication by the ULB. Only a few of the ULBs with defined
collection points have a proper tracking system using weigh bridges.
Changes to be adopted - C&D waste should be adequately segregated in the producers's complex and
subsequently shifted to specified disposal sites stipulated by the concerned authorities, according to
the new Rules. The local government will formalise a collecting mechanism that includes proper
tracking and monitoring, and will make this information available to all generators.
Transportation
Generators should transport C&D waste to the authorised location/s on their own or through other
ULB-provided means, whichever is specified in the ULB's by-laws. In any event, both the generator
and the transportation organisation must monitor the quantity of waste they transfer at the specified
dumping location. Intermediate collecting points/transfer stations are useful to reduce transit distances
before being removed to the final disposal and processing facility.
C&D vehicles should be covered in order to prevent dust, air pollution and the spill of waste on
highways. These trucks can also be used to follow garbage flow from collection stations or generation
sites to waste treatment plants with GPS sensors. Waste shall be quantified by weighing of trucks at
the disposal or treatment location.
Disposal
Existing practices – C&D trash is commonly disposed of in MSW dumpyards or landfills, where it
takes up a large amount of space and limits the landfill's capacity. In MSW landfills, it's also
employed as a daily cover. However, only a small percentage of C&D trash generated in most cities
makes it to the ULB landfills. Unauthorized garbage disposal occurs in low-lying places, open spaces,
roadside areas, and other locations.

79
Changes to be adopted – Before extracting usable elements from the waste stream, C&D trash
shouldn’t be permitted to be placed in landfills. The little amount of C&D waste that is rendered
unusable after processing must be appropriately disposed of in a sanitary landfill and should not be
mixed with other MSW. C&D garbage that is dangerous must be disposed of in a hazardous waste
landfill. More than 90% of the C&D garbage can be processed/recycled in Indian cities and recycled
as secondary raw materials. C&D waste material can also be used, to a certain degree, for approved
public works construction projects when possible in cities without specific recycling facilities and the
rest at designated dumping sites for recycling in future.
A processing unit may not be feasible in smaller towns with trash generation of less than 100 TPD. It
may be conceivable in some rare cases for neighbouring towns to share a plant if they are close
enough to each other. In most circumstances, a mobile crusher is a viable alternative, and the recycled
aggregates produced can be used by the town's civil works department, other government agencies
such as the PWD, or local construction material producers. City adopts preferential procurement
policy to use recycled products made from C&D waste in municipal civil works and encourages other
private and public entities to do the same. This standardized management model with a processing
unit is depicted in a simplified way (MoHUA, 2018).
Figure 4.15 Standardised C&D Waste Management in a City without a Central Processing Unit

80
A processing facility may not be important for smaller communities with low C&D Waste generating
rates. If many cities are close enough, a cluster approach may be used, in which a common C&D
waste treatment facility is operated collaboratively.
This system can be accessible to or equidistant from a number of ULBs in a common area. On the
other hand, smaller towns might run a mobile crusher plant that can be moved to places where waste
from C&D is generated. End-users can then take crushed and sorted C&D trash (recycled aggregates)
to a distant, depending on the type of utilization (e.g., backfilling/landfill use/road repair or
construction/etc.). A standardized model C&D waste management model without a processing unit is
shown below (DGFIZ, 2017).
Figure 4.16 Standardised C&D Waste Management Model with a Central Processing Unit
4.1.4 Bio Medical Waste Management
Human exercises make a lot of rubbish. Such rubbish might be unsafe, requiring appropriate removal.
Contingent upon their source, strong waste might be isolated into a few classifications. It comprises of
(a) homegrown rubbish (b) modern waste (c) biomedical waste, medical clinic squander, or irresistible
waste (Sachan and Chaurasia, 2006). Medical clinic squander is viewed as risky because of the
presence of harmful substances. Bio-Medical Waste (BMW) contains creature squander, research
center garbage, human physical waste, blood liquids and sharps made at medical clinics, nursing

81
homes, facilities, dispensaries, veterinary establishments, creature houses, pathology labs, and blood
donation centers during determination or Medical therapy. BMW takes on an all encompassing way to
deal with squander the executives, including arrangement, evaluation, isolation, stockpiling,
transportation, and treatment (Babu et al., 2009).
After 1980, the Bio Medical Waste was considered as the basic issue, as the illnesses like HIV and
Hepatitis B contaminated materials can prompt a development of microorganism lead sicknesses in
different patients (Patil and Pokhrel, 2005). The Bio-Medical Waste Administration Idea is new in
India and gain spotlight after the warnings of Bio Medical Waste (The executives and Taking care of)
Rules, 1998.The issue can be correspondingly decline with a severe source isolation approach.
Essentially, with further developed arranging and organization, not exclusively can squander creation
be diminished, yet in addition squander the board expenses might be monitored. Nowadays,
institutional/hierarchical construction, preparing, and inspiration are totally given a ton of weight.
Legitimate preparing of medical services laborers at all levels, alongside continuous inspiration, may
essentially advance the circumstance. In contrast to other trash, the Bio-Medical waste is
biohazardous, irresistible, and obsessive in character, which animates the development of various
infections and vectors while likewise tainting non-risky and non-harmful material. This waste has
high capability of transmission of illnesses for cloth pickers and waste gatherers as well as for overall
population and patients too. Thus, its treatment and removal become a significant concern.
Figure 4.17 3R’s Concept
Therefore, biomedical waste is sorted at the source and disposed of in accordance with best urban
practices and guidelines. The ideal management strategy (BMWM) for BMW is not to waste disposal,
but as much as possible to avoid waste generation or recycling. In the order that is convenient for you,
prevention, reduction, reuse, recycling, recycling, treatment and final disposal BMW is BMW’s many
disposal options.
Therefore, instead of adopting the “tailpipe” approach, it is better to solve the waste problem from the
source. All parties involved in funding and supporting healthcare operations have a moral and legal

82
obligation to protect the safety of others, and therefore must provide expenses for the proper
management of BMW. Manufacturers are responsible for providing environmentally friendly medical
products to ensure proper disposal.
Bio‐medical waste is waste formed during human or animal diagnosis or treatment or immunisation
and during related research and biological testing.
Hospital waste refers to any discarded and not intended biological or non-biological waste.
Infectious waste: Wastes that contain germs in high enough concentrations or quantities to cause
illness. It is dangerous, for example, infectious agent culture and stocks from laboratories, surgical
waste, and trash from infected patients.
Sources of Bio-Medical Waste
Biomedical waste generation sources include hospitals, health care facilities, clinics, medical
laboratories, blood banks, mortar shelters, medical research & training centres, biotechnology
institutions, animals houses etc. Such waste can also be produced at home if a patient receives
healthcare (e.g., injection, dressing material etc.)
Components of Bio Medical Waste
Discarded Medicines, Tubing, Gloves, Intravenous sets, Urine Bags, Plastic Bottles, Syringe, Plaster,
Human Tissues, Cotton, Untidy Bandages, Blood Bags, Placenta, Body Part carcass, Blades, Vials
and ampoule of medicines and glass bottles etc. are the prime components of Bio Medical Waste.
Only between ten percent to twenty-five percent of BMWs are harmful, with the remaining seventy-
five percent to ninety percent being non-hazardous. As a result of waste processing, treatment, and
disposal, hazardous waste poses a chemical, physical, and/or microbiological risk to the general
public and health-care employees (CPHEEO, 2000).

83
Figure 4.18 Different Categories of Bio-Medical Waste (Babu et al., 2009)
Figure 4.19 Composition of Bio-Medical Waste (Babu et al., 2009)
Bio-Medical Waste
Non-hazardous Hazardous
Other Hazardous (5-7%)
Radioactive Waste
Discarded Waste
Pressurized Container
Chemical Waste
Cytotoxic Waste
Incineration Waste
Infectious (15-18%)
Non-Sharps
Sharps
Plastic Disposables
Liquid Wastes
Non
infectious
waste
80%
Pathological
and
infectious
waste 15%
Chemical
and
phramaceuti
cal waste
3%
Sharps
1%
Radioactive ,
cytotoxic
and heavy
metals 1%
Composition of
BMW

84
Categories of Bio Medical Waste
The most recent developments in healthcare facilities are aimed primarily at preventing and protecting
community health. Sophisticated gadgets have become available in a number of procedures for
treatment of illnesses. Waste generation in health-care facilities has increased per capita per patient as
a result of these advances in scientific understanding.
During the healthcare procedure are manufactured hypodermic needles, squirrels, blades, operative
cottons, gloves, bandages, clothing, medicines and fluids, human tissue and organ, chemicals and
other wastes. Radioactive wastes, devices with mercury-containt, PVC plastics, and other wastes
created in healthcare facilities are examples. These are the most ecologically sensitive healthcare
goods, and they require a higher level of attention and monitoring (Babu et al., 2009).
Handling, segregation, mutilation, disinfection, storage, transportation, and final disposal are all
important processes in ensuring the safe and scientific management of biological waste in any setting
(Chatterjee, 2018).
Segregation (separate) and identification of biological waste are essential for its reduction and
appropriate management. Sorting biomedical waste by colour is the most effective means of
recognising the different types of trash.
All critical processes for the safe and scientific management of biological wastes in all environments
include handling, sorting, mutilation, disinfection, storage, transportation and final disposal.
Segregation (separate) and identification of biological waste are essential for its reduction and
appropriate management.
Sorting biomedical waste into color-coded plastic bags or containers is the best approach to
distinguish the different types of trash. According to Schedule II of the Biomedical Waste
(Management and Handling) Rules 1998, biomedical wastes shall be divided into containers or bags
at the site of production (Ibrahim Dincer Pouria Ahmadi, 2019).

85
Table 4.3 Categories of Bio-Medical Waste (BMWM Rules, 1998) (CPCB, 2016)
Option Waste Category Treatment and Disposal
Category
No. I Human Anatomical Waste (human tissues, organs, body parts) incineration/ deep burial
Category
No. 2
Animal Waste (animal tissues, organs, body parts carcasses,
bleeding parts, fluid, blood and experimental animals used in
research, waste generated by veterinary hospitals colleges,
discharge from hospitals, animal houses)
incineration/ deep burial
Category
No. 3
Microbiology & Biotechnology Waste (wastes from laboratory
cultures, stocks or specimens of micro organisms live or
attenuated vaccines, human and animal cell culture used in
research and infectious agents from research and industrial
laboratories, wastes from production of biologicals, toxins,
dishes and devices used for transfer of cultures)
Local autoclaving/
microwaving/ incineration
Category
No. 4
Waste sharps (needles, syringes, scalpels, blades, glass, etc.
that may cause puncture and cuts. This includes both used and
unused sharps)
disinfection (chemical
treatment/ autoclaving /
microwaving and
mutilation/ shredding
Category
No. 5
Discarded Medicines and Cytotoxic drugs (wastes comprising
of outdated, contaminated and discarded medicines)
incineration/ destruction
and drugs disposal in
secured landfills
Category
No. 6
Solid Waste (Items contaminated with blood, and body fluids
including cotton, dressings, soiled plaster casts, lines, beddings,
other material contaminated with blood)
Incineration/ autoclaving/
microwaving
Category
No. 7
Solid Waste (wastes generated from disposable items other than
the waste sharps such as tubings, catheters, intravenous sets etc).
disinfection by chemical
treatment/ autoclaving/
microwaving and
mutilation/ shredding
Category
No. 8
Liquid Waste (waste generated from laboratory and washing,
cleaning, house keeping and disinfecting activities).
disinfection by chemical
treatment and discharge
into drains

86
Category
No. 9
Incineration Ash (ash from incineration of any bio‐medical
waste)
disposal in municipal
landfill
Category
No. 10
Chemical Waste (chemicals used in production of biologicals,
chemicals used in disinfection, as insecticides, etc.)
Chemical discharge into
drains for liquids and
secured landfill for solids
Effects of Bio-Medical Waste
Improper biomedical waste management has serious environmental consequences, including pollution
of the air, water, and land. Biological, chemical, and radioactive pollutants are the three types of
pollutants that cause harm. In India, there are a number of laws and policies that can be used to
address environmental issues. It is investigated how radioactive waste created as part of biomedical
waste is classified. Pollution's impacts on air, radioactivity, land, health, and risks are studied (Patil &
Pokhrel, 2005).
Air Pollution: Buildings may pollute the air both inside and outdoors. The three types of biomedical
waste created as a result of air pollution are biological, chemical, and radioactive waste (Patil &
Pokhrel, 2005).
In-door Air Pollution: Diseases identified in garbage can infiltrate and persist in the air as spores or
infections for a long period. Waste separation, source pretreatment, and other measures can all help to
alleviate the situation to some extent. Sterilization of rooms will help minimise indoor biological
pollution and indoor biological pollution (Babu et al., 2009) Indoor air pollution caused by the
aforementioned contaminants, along with inadequate ventilation, causes Sick Building Syndrome
(SBS). SBS may be reduced with the suitable construction design and well-kept air conditioners.
Chemicals must be used in accordance with the regulations. It is necessary to prevent excessive use of
chemical products (Saurabh Gupta & Boojh, 2006).
Out-door Air Pollution: Pathogens can contaminate the air we breathe outside. Pathogens can enter
the environment when biomedical waste is moved outside of the facility without being prepared or put
in open locations. Open burning and incinerators are the two main sources of chemical pollutants in
outdoor air pollution. The most hazardous way is to openly burn biological waste. When inhaled, it
can lead to respiratory problems. Dioxins and furans, for example, are carcinogenic organic gases
(Patil & Pokhrel, 2005). The design specifications and maintenance of such technologies should
comply with the rules laid down (Saurabh Gupta & Boojh, 2006).

87
Radioactive Emissions: Small amounts of radioactive gas can be generated during research and
radioimmunoassay procedures. Gasses should be eliminated from the outside as early as feasible. Trap
maintenance and off-gas monitoring are required while using such a device. (Chatterjee, 2018).
Water Pollution: If liquid waste is dumped into sewers without being adequately handled, it can
pollute the water supply. Water contamination can change pH, BOD, DO, COD, and other
parameters. Dioxins have been found in water bodies around incineration factories in the past.
Airborne dioxins infiltrate the water body (Babu et al., 2009), (Saurabh Gupta & Boojh, 2006)
Radioactive Effluent: Chemical or biological research, bodily organ imaging, radioactive spill
cleanup, patient's urine, and radioimmunoassay scintillation liquids can all produce radioactive waste
in liquid form. In most circumstances, urine and faeces can be treated as non-radioactive waste if the
patient's room is checked for radioactive contamination on a regular basis (Chatterjee, 2018); (Mandal
& Dutta, 2009).
Land Pollution: Bio-medical waste soil contamination is caused by infectious waste, abandoned
medications, treatment chemicals, and ash, other trash generated during treatment operations. Heavy
metals such as cadmium, plum and mercury in the waste, which can eventually enter the food chain,
are absorbed by plants. Pollutants such as nitrates and phosphates can be identified in waste dumping
leachates. Excessive levels of trace nutritional elements, as well as other elements like heavy metals,
are harmful to agriculture, animals, and humans (Babu et al., 2009).

88
Waste Management Practices
Figure 4.20 Waste Management Process
Step 1: Segregation
Bio Medical waste is separated firstly in Healthcare Institutions. For the segregation, a colour coding
process is adopted for this separation process. Each type of waste must be maintained segregated in a
designated container or bag, depending on the treatment choices specified in the guidelines.
According to the CPCB and the Bio-medical Waste Management Rules of 2016, bio-medical waste
must be separated into four color-coded waste types.

89
Figure 4.21 Waste Segregation at Source in Correct Liners (CPCB, 2019a)
The container/bag must have the following characteristics: 1. The maximum volume and weight of the
waste must be robust enough without causing harm. It must have no perforations or leaks. 3. If
possible, the container should have a foot cover. If plastic bags are to be used, they should be firmly
fixed in the container so that they remain in place when the lid is opened and closed, and can be easily
removed. Four. Sharps should be stored in a sharp container that is puncture-resistant. They must
however be cut with a cuff and placed in the apartment/room before they are placed in the container.

90
Table 4.4 Color Coding of BM Waste Dustbins (BMWM Rules, 1998) (CPCB, 2019a)
Color
Coding
Different type
of Container
Waste Categories Items Includes
Yellow
Plastic Bags Cat. 1 Human Anatomical Waste
Cat. 2 Animal Waste
Cal. 3 Microbiological Waste
Cat. 6 Solid Waste
Human Tissues, Plaster, Cotton,
Untidy Bandages, Blood Bags,
Placenta, Amputated Parts of
Human Beings
Red
Disinfected
Container,
Plastic Bags
Cat. 3 Microbiological
Cat. 6 Soiled Dressing
Tubing, Catheters, Gloves,
Intravenous Sets, Urine Bags,
Plastic Bottles, Syringes
Blue/White
Plastic Bags,
Puncture Proof
Containers
Cat. 4 Waste sharp
Cat.7 Plastic disposable
Blades & Sharp Waste, Vials &
Ampoules, Broken Glass &
Bottles
Black Plastic Bags,
Puncture Proof
Containers
Cat. 5 Discarded medicines
Cat. 9 Incineration ash
Cat 10 Chemical Waste
Discarded Medicine
Incineration Ash
Chemical Waste

91
Step 2: Collection and Storage
Figure 4.22 BMW Collection Bins
Depending on the volume of trash, it may be temporarily held at the hospital's central storage facility
before being delivered in bulk to the final disposal location once or two times a day. Before disposal,
HCF should double-check that waste bags/containers are sealed and marked appropriately with
information regarding point of production. The disposal color coded bags should not be totally filled,
allowing them to be taken up by the neck for additional handling. Hence the bags should be sealed
when they are three- quarters full. Manual handling of waste bags should be avoided to prevent the
risk of needle prick injury and infection. After removal of the bag, clean the container, even the lid,
with an appropriate disinfectant. Waste bags and containers should be collected every day or more
frequently, when appropriate, from wards and ambulatory departments (OPDs) (as in Operation
Theatres, ICUs, labour rooms). Waste bags should be transported in covered wheeled containers or
covered trolleys with big bins. Untreated biomedical waste must not be stored for more than 48 hours
as per the guidelines. Within the health care institution or research centre, a storage place for medical
waste should be specified. The waste should be stored in bags or containers in a different location,
room or building which is large enough for the volume of waste produced and the regularity in which
the rubbish is collected (Ibrahim Dincer Pouria Ahmadi, 2019).
Step 3: Transportation
Biomedical waste should be transported in or from a hospital with wheelchairs, containers or carts
which are not used for anything and meet the specifications below.: It must be simple to load and
unload; they should have no sharp edges that might harm trash bags or containers during loading and
unloading; and it must be easy to disinfect. The cars must be cleansed and cleaned regularly with an
appropriate disinfectant. All trash bags or containers should be labelled with basic composition and
waste producer information. Vehicles used for BMW transportation must display the International
Infectious Substance Symbol as shown in figure and should not be utilized for any other purpose.

92
Vehicles or containers used to carry health-care waste should not be utilized to transport any other
type of trash.
Figure 4.23 (International Infectious Substance Symbol) Biohazard sign
Parking Lot for Collection Vehicles: Carts, trolleys, covered vehicles, and other waste collecting and
transportation vehicles should be stored in a shed with fencing. To prevent cross contamination,
separate sheds for hazardous and non-hazardous waste should be provided. A wash area with ample
water jets, drainage, an elevated platform, and good drainage should be included in both sheds.
Step 4: Treatment and Disposal
Due to improper treatment and disposal, infections such as TB, hepatitis, enteric fever, HIV infection,
and even AIDS can spread. The 'Bio-Medical Waste (Management and Handling) Rules, 1998' are
having the detailed categorization and disposal methods of 10 different categories of trash produced in
health-care institutions. The essential concept of biological waste treatment is that mutilation or
shredding must be capable of preventing illegal reuse. Chemical treatment begins with a one-percent
hypochlorite solution. Incineration, on the other hand, does not require any kind of pre-treatment.
Only towns with a population of fewer than 5 lakhs are obliged to follow the deep burial procedure
(MoEFCC, 2016).

93
The Detailed Methods for Treatment of Bio Medical Waste with technological interventions are:
Incineration: It's a very much directed burning interaction where garbage is completely oxidized and
any perilous microorganisms are killed or denatured at a high temperature to change squander into
latent materials and gases. Three sorts of incinerators are being used for clinic squander: numerous
hearth type, revolving furnace, and air types (Wahid, 2013).
Plasma Pyrolysis: The waste is used directly as a combustion fuel or indirectly processed into
different fuel to help use the energy it contains. In this case, pyrolysis is identified as a similar heat
treatment in which high temperatures are used to treat waste materials with limited oxygen supply. It
is an environmentally friendly technology that converts organic waste into by-products of economic
value(WHO, 2014)
Autoclaving: Autoclaving is a low-heat thermal technology that disinfects waste by steam directly
into regulated and long-term contact with it. The system should be designed horizontally and
especially for the handling of bio-medical waste for operational comfort and safety (Babu et al.,
2009).
Hydroclaving: This is the same as autoclaving, except that the waste is indirectly heated by steam
from the outer jacket. During the operation, garbage kept falling inside.
Landfills: Infectious medical waste becomes safe waste after disinfection or combustion, which can
then be disposed of in a landfill. However, after disinfection, many forms of medical waste, such as
anatomical waste, can produce unpleasant visual effects, which are culturally unacceptable in many
countries. Therefore, such wastes should not be identified prior to disposal, for example by
incineration. If this is not an option, these wastes should be placed in containers prior to disposal
(WHO, 2014).
Shredding: Sharps (needles, blades, glass, etc.) and plastic (I.V. bottles, I.V. sets, syringes, catheters,
etc.) should be shredded following chemical treatment/microwaving/autoclaving. Needle destroyers
can be used to dispose of needles without having to treat them chemically.
Scenario outside Country
In 2012, the World Health Organization (WHO) performed a survey on the status of BMWM in 24
West Pacific nations, including New Zealand, Japan, China, Australia, the Philippines, Malaysia,
Vietnam, Cambodia, the Republic of Korea, Micronesia, Nauru, and Kiribati. A research, study of
publications, newspaper stories, and other sources of information were all used in the study.
Management, training, policy and regulatory framework, technology utilised, and economic resources

94
were all considered in determining each country's standing. All Western Pacific countries, with the
exception of Micronesia, Nauru and Kiribati, were good in terms of administration, training and
BMWM policies. Only Japan and the Republic of Korea employ BAT (best available technology) for
BMW logistics and treatment, and these systems are well-maintained and tested on a regular basis.
The majority of countries lacked or had insufficient financial resources to support BMWM. Therefore,
the HCWM of most Western Pacific countries is still far from ideal, and more funds to expand the
HCWM system in several countries are essential to ensure the implementation of a secure HCWM
system in the next ten years. In Canada, different jurisdictions have different methods of managing
medical waste. The management and disposal of medical waste has not been regulated by all
provinces. However, it seems that Canadian hospitals are migrating to BMW's national central
disinfectant from incinerators in place (Mishra et al., 2016).
Scenario in Country
In India BMW has problems with the absence, and second, of re-use syringes with correct
disinfection, of gloves, masks, shoes and open and un-protected medical waste for reuse. The
International Medical Epidemiology Network investigated the current BMW practices, settings and
structures in basic, intermediate and tertiary healthcare facilities (HCF) in 20 states of India from
2002 to 2004. They found that 82% of primary care does not have a reliable BMWM system center.
In India there are 60% of secondary school CS and 54% of higher education. In 2009 approximately
240 persons, who had used non-sterile needles in Gujarat, India, contracted hepatitis B. Different
studies show that although India is one of the first countries to take measures to safely dispose of
BMWs, there is an urgent need to expand existing system capacity, increase funding, and increase
BMW’s commitment to disposal safety. For healthy humans and a cleaner environment, effective
biomedical waste management is highly needed. Safe and sustainable biological waste management is
the duty of managers and owners of sanitary systems.
CPCB published an Annual Report on Biomedical Waste Management for 2019 based on data
compiled and reported by all SPCBs. The country generates a total of BMW of 614 TPD (tonnes a
day) from 2,70,416 HCFs, according to the data. Sadly, 447 TPDs are only treated, which leaves 37
untreated. 200 CBMWTF and 28 under construction are in operating (Mishra et al., 2016).
Annual Report Information has been submitted by every RSPCB for as per the data annual report
information for the year 2019, there are 5974 no. of HCFs which generate 22502.57 kg/day bio-
medical waste.

95
09 CBWTFs (07 under development) are in operation (RSPCB, 2019). The trash is usually collected
without disinfection in open containers. Plastic or other non-specific containers hold bandages, cotton
and other absorbing materials. Miscellaneous waste is collected. Some hospitals around the country
have established a colour coding scheme for themselves. Sharps are dumped without disinfection or
mutilation, which might lead to reuse and disease transmission. The recyclable material for sale is
segregated by the garbage and transport personnel in the hospital. Likewise, any disposable plastic
item is separated by garbage pickers, which are used for transit and for the municipal solid waste
either within the hospital or outside the community waste bin. Since infectious waste is intermingled
with municipal waste, it might cause the whole lot to become contagious under adverse environmental
conditions (CPCB, 2016)
Scenario in State
There are 193 Urban Local Bodies (ULBs), 295 Panchayat Samitis, and 9,892 Gram Panchayats
throughout Rajasthan's 33 districts (GPs). According to the 2011 Census, the state's population is 6.86
crores, with 24.78 percent living in urban areas and 75.13 percent in rural areas. The RSPCB provided
the annual report for 2019 and has produced 8 100 No. HCFs, which provide 20685.65 kg/day of bio-
medical waste. Annual reports RSPCB has submitted for 2016. There are 08 no. of CBWTFs in
operation (RSPCB, 2019). The 78.9% of waste generated is treated per day. Rajasthan's government
has designed and implemented a plan to handle this crucial issue, and Dept. of Medical & Health
Science is responsible for it.
Hospital Waste Management Plan, Ministry of Health and Family Welfare
Hospital waste disposal is a complicated operation in which the many processes listed below are
highly interrelated on both a technical and organisational level. The following are the governing
principles in general terms:
A. Generation / Minimization: - Under rules hospital trash is categorised into 10 categories
including human anatomical waste, animal waste, microbiological or biotechnological waste, waste
cutting, abandoned pharmaceuticals and cytotoxic medicines. Dirty waste, solid waste, liquid waste,
incinerator ash, and chemical waste are all examples of waste. Compliance with 3 Rs, namely
reduction, recycling and reuse, encourages a significant reduction in waste generated by health
institutions.
B. Segregation of Waste: - Segregation is the most important process in the category of organic
waste, and each form of trash is followed by. It is done at the point of generation, for example, in all

96
patient activity areas, diagnostic service areas, operating rooms, labour rooms, and treatment rooms.
The generators of bio-medical waste, such as physicians and nurses, are responsible for segregation.
C. Collection: - Only non-chlorinated plastic collecting bags are utilised in the bins and receptacles.
This prevents rag pickers from recycling or repurposing the products. Every day, waste is collected
and delivered to a designated storage facility or deep burial pits. After 2/3 of the bags have been filled
with biomedical waste, they are removed.
D. Transportation: - Garbage routes and transit times have been established within the hospital to
minimize the amount of garbage that passes through busy and patient care areas. To transfer plastic
bags to deep storage / burial places, special containers with wheels, trolleys / trolleys are used. The
design of the container allows the garbage to be easily dumped into it, and the foot cover can safely
close the sick waste inside.
E. Storage: - Storage, according to the Bio-Medical Waste Rules, is explained as keeping biomedical
waste for a specified amount of time before it is treated and disposed of. Inside the facility, there is a
specific storage site for hospital waste collection. The garbage is collected in bags or containers and
stored in a designated place.
F. End Treatment and Disposal: - The Office of Local Bodies, which is part of the GoR's Local Self
Government (LSG), has been tasked with establishing Common Treatment Facilities (CTFs) in a
number of cities. CTFs are in charge of trash collection and transportation from hospitals, as well as
treatment and destruction when needed, and ultimate disposal at the CTF site. Before installing the
equipment and treatment processes, the owner of CTF obtains permission from the appropriate
authority under the BMW Rules, particularly the Rajasthan Pollution Control Board (RPCB). The
provision exists for the payment of CTF hiring fees by RHSDP to CTF operators at the rate of Rs.
1000/- per bed per year for project-supported installations only. The CTF recruiting fees are paid via
RMRS, which is repaid on an as-needed basis. This refund of CTF connection expenses is available
until the end of the project duration (September 2011), after which it becomes liable (CPHEEO-Part I,
2016b).
Monitoring of the Health Care Waste Management Activities
The Director-Hospital Administration at the Department of Medical, Health, and Family Welfare has
chaired a Coordination, Monitoring, and Evaluation (CM&E) Committee for health care waste
management. This committee is in charge of overseeing all actions relating to the management of
medical waste. The Rajasthan government has undertaken regular cooperation between the RHSDP,

97
DM&HS and NRHM authorities for the sustainable and convergent activities and practises of all
HCWM with the Department of Medical and Health (TERI, 2014).
Governance and Management Structure
The various concerned institutions involved in the process of Bio-Medical Waste Management are:
Central Pollution Control Board, Ministry of Environment, Forest and Climate Change, Central Public
Health and Environmental Engineering Organisation (CPHEEO), Department of Medical, Health &
Family Welfare, Rajasthan, The Energy and Resource Institute (TERI) and Ministry of Housing and
Urban Affairs.
Roles and Responsibilities
Functions of the Central Board at the National Level
Advising the Government of the Central on any topic concerning the prevention and control of water
and air pollution and the improvement of air quality. Developing and implementing a national water
and air pollution prevention, control or reduction programme; Coordinate and resolve problems
between the State Board's operations; Providing the State Boards with technical advice and guidance,
and carrying out and funding research and research into the prevention of water and air pollution,
control and abatement of these concerns; Planning and organising training on the prevention, control
or mitigation of water and air pollution programmes; Organize a comprehensive mass sensitization
effort in media prevention, control and mitigation of water and air pollution; Collect, consolidate and
publicise data on water and air pollution techniques and statistics and actions to successfully prevent
them, control, or abate it; Prepare wastewater treatment and disposal instructions, rules and
recommendations as well as gas cleaning equipment, stacks and pipes for stacking gas, stacks and
canals; disseminate information on and prevention and management of water and air pollution; Lay
standards for waterways or wells and establish criteria for air quality, alter them and annul them, in
consultation with the State Governments concerned; fulfil the additional function that the government
of India may prescribe (CPCB, 2016);(Patidar et al., 2014)
Rules and Regulations
Their reckless disposal from hospitals, nursing homes and pathological laboratories has caused
significant environmental degradation, leading to the spread of illness and exposure of people to some
very infectious and disease-prone vector. This has caused considerable environmental concern.
Bio Medical Waste (Management and Handling) Rules, 2016

98
The Ministry of the Environment and Forestry issued in July 1998 the Government of India, pursuant
to the Environment (Protection) Act (1986, the first Bio Medical Waste rules (hereafter "BMW
Rules"). The BMW 1998 rules were updated in 2000, 2003 and 2011. The drawn BMW Regulations
2011 remain a draught, not announced, because of lack of consensus on classification and criteria. In
March 2016, the Ministry of Environment, Forestry, and Climate Change revised the BMWM
guidelines (Ibrahim Dincer Pouria Ahmadi, 2019).
To reduce pollution, these new guidelines have expanded coverage, simplified classification and
authorisation, and improved segregation, transportation, and disposal techniques.
The new BMWM Rules 2016 states the guidelines, effective implementation, techniques and eco-
friendly methods. These laws are suggested to improve methods of segregation, transport and
disposal, by decreasing pollution in the environment. To properly dispose of BMWM, we need to
have a collective team-based approach with strong government assistance on financing and
infrastructure development, dedicated health-care employees and health facilities, on-going
monitoring of BMW practises, strict regulations and powerful regulatory organisations. State
governments have made steps to establish Common Biomedical Waste Treatment Facilities
(CBWTFs) for waste treatment and disposal. Segregation at the source and waste minimization are the
cornerstones of BMWM.
Furthermore, tight procedures have been established to prevent pilferage of recyclable items,
secondary handling, or animal dispersal or spillage during delivery from the HCFs to the shared
BMW treatment plant (CBMWTF). Waste collection, sorting, transportation, and disposal are all
being improved. Simultaneously, by adopting new rules for incinerators and improving their
operations, the function of incinerators in increasing environmental air pollution has been controlled
(Balasubramanian, 2018; Sachan & Chaurasia, 2006)
“Any waste generated during the diagnosis, treatment, or immunization of humans or animals, or
during related research, or during the production or testing of biologicals,” according to India's
Biomedical Waste (Management and Handling) Rules, 1998. As a result of the Government of India
promulgation, medical administrators have now been legally obliged to deal properly with and
disposal this sort of waste.
Following rules have been followed for Bio-Medical Waste Management (CPHEEO, 2000):
The health facilities must get authorization/renovation certificates from the State Pollution Control
Board in accordance with Bio-Medical Wastes (Management and Handling) Rules, 1998. (SPCB).

99
Bio-medical waste must be segregated in four color-coded red (infected dressing, pop cast), yellow
(body-shaped), blue (syringe), white (needles, cut glasses) waste categories as indicated by the
disposal methods laid down in Schedule I of the R, as notified the Central Pollution Control Board
and in line with Bio-Medical Waste Management Rulings, 2016 (CPHEEO, 2000).
The following are some of the act's most notable features:
The Act requires the approvable operator of the Common Bio-Medical Waste Treatment and Disposal
Facility (CBWTF) to take reasonable action to ensure the safe and ecologically acceptable
transportation, handling, storage, processing and disposal of biomedical waste collected from the
worker. Local governments, like gramme panchayats, local authorities and corporations, shall provide
or allocate appropriate land for the establishment in their jurisdictions of a CBWTF in accordance
with CPCB Guidelines by Schedule III of the Bio-medical waste management Rules, 2016.
Solid Waste Management rules, 2016 -Requirements on Bio-Medical Waste
The treatment of biomedical waste, industrial waste, e-waste and domestic hazardous wastes shall be
subject to specific rules on their administration and domestic hazardous waste may be handled in
accordance with the provisions of the SWM Rules, 2016 by the State Pollution Control Board or
Pollution Control Board. In line with the Bio-Medical Waste Management Rule, 2016, the biological
waste shall be disposed of as reviewed from time to time based on the site selection criteria set out in
Schedule I(x) of the 2016 SWM Rules. In compliance with the CPCB guidelines, local governments,
such as gramme panchayats, local governments and corporations, shall provide for or allocate suitable
land to establish a CBWTF within their jurisdiction under Schedule III of the Bio-medical Waste
Management Rules of 2016. In compliance with the 2016 SWM regulations or as revised sometimes,
collect other solid waste (no bio-medical waste) from health care establishments (CPCB, 2016).
Environmental Concern
The following are the primary environmental risks about incorrect bio-medical waste disposal:
A. Infection and diseases carried via vectors that affect the internal and external populations (fly,
mosquitoes, insects etc.). B. Infection spreads to healthcare personnel and sweepers/pickers
by contact and damage, notably from sharps (needles, blades). C. The infection spreads to
hypodermic needles, bowls, blades and bottles by unauthorised recycling of throwaway
things. Reaction caused by the usage of expired medications. D. Toxic emissions from
incinerators that are malfunctioning or inefficient, as well as indiscriminate disposal of
incinerator ash and leftovers (Patil & Pokhrel, 2005).
B.

100
Best Practices
Disposal in three stages
1. Primary Level
At this level, the factory is located in the urban area, so it is located in the urban area. Air pollution
will take center stage, so we replaced the incinerator with a plasma pyrolysis system, which can
destroy dioxins and furans, which are carcinogenic compounds emitted during improper combustion.
To increase capacity we replaced the autoclave with Hydroclave, by using Hydroclave we can
increase speed and efficiency. At this level, the focus should be on adequate insulation to avoid
mixing of food waste and reducing waste from incineration. The adjustment of the GPS tracker in the
vehicle is also used for a correct collection The transport vehicle will be carried out in accordance
with the Motor Vehicle Law.
2. Secondary Level
The main goal is to collect and dispose of rubbish from the suburbs and villages. Since the factory is
located in a non-residential area, there is no need to advance the system because it will be expensive.
The plant will include an incinerator and an autoclave. For collection and transportation purposes, we
are implementing collection points. The local EHR will collect your waste at the center. Transport
vehicles collect the waste to the factory.
3. Tertiary Level
Prime aim is disposal of the waste Area is remote so the old burning using the Brick masonry
incinerator and old container can be used to dispose the waste.
4.1.5 Hazardous Waste Management
Hazardous waste refers to any type of waste, if improperly disposed of, it will cause health problems
to humans and the environment. It can take many forms, can be produced from various human
activities, such as industrial projects and factory work, and can even be found in domestic waste. It is
important to have a clear and concise plan that can be followed to minimize hazardous waste, and at
the same time to properly separate, process and dispose of waste, to ensure that humans and the
environment are protected from the dangers it poses.
"Hazardous waste" refers alone or in contact with chemicals which provide a hazard to health or the
environment, and which may pose a risk to the environment, physical, chemical, biological, reagent,
poisonous, flammable, explosive or corrosive qualities. Health or environment. Any Wastes or
material, and must comprise a) Hazardous Waste 2016, as described in Annex I column (3) and Other

101
(Handling and Cross-Border Movement) Regulations; b) Class A and B of Annex II of equal or higher
Class composition or any characteristic specified in Class C of Annex II of the 2016 Hazardous Waste
and Other Waste (Handling and Transboundary Movement) Regulations; and c) The restrictions on
imports or exports of such wastes, movements, wastes identified in Part A of Annex III which, not
defined in Part A, have dangerous qualities specified in Part C of Annex III and in Part C of
Hazardous Waste and Others, 2016. (Karthikeyan et al., 2018)
“Domestic hazardous wastes are defined as discarded paint drums, pesticide cans, CFL bulbs, tube
lights, expired medicines, broken mercury thermometers, used batteries, used needles and syringes,
contaminated gauge, etc. generated at the household level” (CPHEEO, 2016b).
Hazard Classification
Physical Hazards
The following are classified by GHS as physical hazards or chemicals that cause physical property
damage:
Table 4.5 Classification of Physical Hazards
HAZARD CLASS NO. OF CATEGORIES GHS SYMBOL
Explosives: Explosive substances (or mixtures) are
solids or liquids (or mixtures of substances) that are in
and of themselves able to produce gas at such a
temperature, pressure and speed to cause damage to the
environment by chemical reaction.
Unstable explosives – 1
Explosives Division 1.1-1.6
Mixtures and self-heating compounds is a solid or
liquid, other than a pyrophoric liquid or solid, which is
limbic to self-heat by reaction with air and without
energy source. It varies in that it ignited only when it is
largely (kilogramme) and after long period, from
pyrophoric liquids or solids.
periods of time (hours or days).
Two Categories: 1 and 2
classified in accordance
with
test N.4 under GHS
Substances and compounds that emit flammable gases
in contact with water or compounds which are likely to
be flammable spontaneously by interaction with water,
in dangerous concentrations, and to emit inflammable
gases.
Three Categories: 1, 2 and 3
classified in accordance
with
test N.5 under GHS

102
Oxidizing liquid: A liquid which, although not always
fuel in itself, can generally lead to the combustion of
other materials by releasing oxygen.
Three Categories: 1, 2 and 3
classified in accordance
with
test O.2 under GHS
Oxidizing solids: A liquid that, although not always fuel
in itself, can usually lead or contribute to the
combustion of other materials by releasing oxygen.
Three Categories: 1, 2 and 3
classified in accordance
with
test O.1 and O.3 under GHS
Organic peroxides: Thermally unstable or prone to
blending exothermically accelerated breakdown, fluid or
solid organic molecules. They may also be responsible
for explosives.
Seven categories: Types A -
G
divided on the basis of
principles under Chapter
2.15
Flammable gases: A flammable gas range 20 degrees
Celsius and a standard 101,3 kPa pressure. They differ
from pyrophoric gases and chemical instabilities. A
pyloric gas which can fire at or below 54 degrees
Celsius in the air is a flammable gas. However, a
chemically unstable gas is an inflammable gas that even
in the absence of air or oxygen can react explosively.
Three categories - 1A, 1B
and 2
Anaerole is a non-refillable container made of metal,
glass or plastic, with or without a liquid, paste or
powder compressed, liquid or dissolved gas under
pressure. The containers are provided with a releasing
device that permits the dispersion into gas, foam,
adhesive or powder or liquid or raucous conditions of
solid or liquid particles in suspension. The classification
of aerosols as Flammable should be evaluated where
they contain any component which is designated as
GHS-inflammable.
Three categories- 1, 2 and 3
Oxidising Gases: Oxidizing gas is defined as a category
and is a gas that can contribute to the combustion of
other materials than air, often by giving oxygen.
One Category

103
Gases under pressure: Gases that contained arc in a
container at a pressure of 20 degrees Celsius not less
than 200 kPa or as a cooled Liquid.
Four Categories:
Compressed gases,
Liquefied gases, Dissolved
gases and refrigerated
liquefied gases.
Corrosive to metals: A metal-corrosive substance or
mixture is a substance or mixture that substantially
damages, or even destroys metals with a chemical
effect.
One category
Desensitized Explosive: They have arc solid or liquid
explosive ingredients or mixtures that are made less
vulnerable to their explosive properties in a way that
does not explode in mass or burn too quickly and is
therefore free from the dangerous class of explosives.
Four categories: 1, 2, 3 and
4 based on ‘burning rate
test’
Environment Hazards
Chemical compounds and combinations in environmental dangers are categorised by environmental
components into several classes (such as the aquatic environment, the ozone layer). The GHS
classifies chemicals as:
Table 4.6 Classification of Environment Hazards
HAZARD CLASS NO. OF CATEGORIES GHS SYMBOL Aquatic environment dangerous
The intrinsic quality of a substance which is harmful to
an organism during short exposure to that substance is
acute aquatic toxicity.
Chronic aquatic toxicity – The potential or actual
qualities of the drug in relation to the life cycle of the
organism which can create detrimental effects to aquatic
species during exposures.
In the three categories: the
Acute 1, Acute 2 and Acute
3 short term hazard is listed.
Long-term (chronic) hazards
are also categorised on the
basis of sufficient data
available on toxicity.
Ozone layer dangerous
Ozone Depletion Potential is an integrative amount that
reflects the extent of ozone depletion of the halocarbon
in the stratosphere expected in relation to the mass for
mass of the CFC-11 for each halocarbon source type.
One Category.
Governance and Management Structure

104
Concerned Stakeholders
Solid Waste Management stakeholders are as follows:
Government Departments
Waste Generators (Residential and Bulk Waste Generators)
Producers Manufacturers &Brand Owners
Industrial Units
Roles and Responsibilities
According to Solid Waste Management Rules, 2016 the duties of various stakeholders are as follows:
Duties of Ministry of Urban Development
The Ministry of Urban Development and State Government Administrations shall conduct regular
reviews of measures taken by the states and local bodies to improve the practises of solid waste
management, and implement solid waste management projects financed by the Department and
external agencies. (GOR, 2019).
Duties of Department of Fertilisers, Ministry of Chemicals and Fertilisers
Through appropriate procedures the Fertilizers Department must offer market development aid to city
compost, ensuring the co-selling of compost with chemical fertilisers at the ratio of 3 to 4 bags: 6 to 7
bags of fertilisers provided to enterprises by compost for marketing (GOR, 2019).
Duties of Ministry of Agriculture
The Agriculture Department shall provide the Fertiliser control order flexibility for compost
manufacture and sales, the propagation of compost on farmland, the development of compost quality
testing laboratories produced by local authorities or their authorised authorities and the development
of appropriate directives for the maintenance of compost quality and the use relation between compost
and chemical fertiliser wheat and other chemical fertilisers (GOR, 2019).
Duties of the Ministry of Power
The Power Ministry shall decide tariffs or fees for energy generated from waste to power plants on the
basis of solid waste by means of acceptable methods (GOR, 2019).
Duties of Ministry of New and Renewable Energy Sources

105
The Ministry of New and Renewable Energy shall enable waste infrastructure generation in power
stations and shall provide suitable subsidies or incentives for such waste in power plants via
appropriate channels. (GOR, 2019).
Duties of the Secretary-in-charge, LSG or Local Self Government Department and the Secretary-
in-charge of Gram Panchayats or Rural Development Department
The Secretary of LSG shall prepare, in consultation with stakeholders including representatives of
waste pickers, self-sustainers, through a Commissioner or Director of the Municipal Administration or
Director of the local authorities or of the Secretary of Gram Panchayats or of the Rural Development
Department of the State a State policy and strategy for solid waste management; the focus is laid on
waste reduction, reuse, recycling, recovery and optimal use of various solid waste components, as
well as on minimising waste disposal impacts on human health or the environment, as well as on
preparing state policies and strategies for solid waste management. State policies and strategies should
recognise the main role of informal waste management
It shall also ensure the compliance by all municipal governments of the terms of the Regulation and
conduct regular meetings of the State Level Advisory Body (SLAB). (GOR, 2019).
Duties of District Magistrate or District Collector
The District Magistrate or District Collector shall, in closer consultation with the Minister-in-
Commerce of the State Urban Development, facilitate the identification and allotment of suitable land
for building solid waste processing and disposal facilities in his district and supervise the performance
of local authorities (GOR, 2019).
Duties and Responsibilities or Local bodies and Gram Panchayats
In addition to the duties and responsibilities required for gramme panchayat, the key tasks are to
prepare a Solid and Liquid Resource Management (SLRM), arrange door-to-door recycling of solider
waste segregated in each household, set up a material recycling facility, i.e. a Resource Recovery
Center (RRC) (GOR, 2019).
It is also their job, as ordered by the State Pollution Control Board or the Pollution Control
Committee, to guarantee that the home hazardous waste is safely stored and transported to the
disposal site or to, Direct street sweepers not to burn tree leaves collected and separately stored and
transferred to local authorised collectors and agencies, train waste collectors and waste collectors to
solid waste management, collect waste from vegetables, fruits, meat, poultry and fish market day-to-

106
day and promote the establishment and development of decentralised poultry waste collector systems.
waste collection Recycling initiatives through the informal trash recycling sector may be encouraged.
Their task is to make it possible for solid waste processing plants and associated infrastructure to be
builed or maintained by themselves or by the private sector, or through any agency to make the best
use of various solid waste components using appropriate technology, including the following
techniques and following the guidelines issued by the Ministry of Urban Affairs. (GOR, 2019).
Duties of State Pollution Control Board
The National Pollution Control Board, in close cooperation with the Directorate for Municipal
Administration or Secretary-in-Charge of LSG concerned, shall implement these rules by local
authorities in their respective jurisdiction at least twice a year and shall monitor the environmental
standards and compliance with the conditions set out in Schedule I of this Convention.
After providing adequate chance for the applicant to be heard and for reasons for recording in writing,
the State Pollution Control Board shall refuse to grant or renovate its authorisation. In the case of new
technologies where the Central Pollution Control Board has not established standards, the State
Pollution Control Board shall approach Central Pollution Control Board with regard to the definition
of standards.
The State Pollution Control Board shall monitor the compliance of the standards as prescribed or laid
down and treatment technology as approved and the conditions stipulated in the authorisation and the
standards specified in Schedules I and II under these rules as and when deemed appropriate but not
less than once in a year. The State Pollution Control Board may give directions to local bodies for safe
handling and disposal of domestic hazardous waste deposited by the waste generators at hazardous
waste deposition facilities. It regulates inter-state waste mobility, and prepares and implements the
IEC / BCC plan in different areas involving ULBs / GPs and other stakeholders State Pollution
Control Commission (GOR, 2019).
Duties of Waste Generators (Residential and Bulk Waste Generators)
Every waste generator shall separate the waste produced by it in three separate streams, i.e. in
appropriate bins, biodegradeable and domestic waste and transfer separate waste, as specified by the
directions and notifications of local authorities, to authorised waste collectors or waste picker and
collectors., wrap securely sanitary waste like diapers, sanitary pads etc. in the bags of those goods, or
in the appropriate wrapping material, as directed by local authorities, in the bins intended for dry or
non-bio-degradable waste, store separately the construction and demolition waste, As and when

107
generated, they shall dispose of garden waste and garden waste, as provided by the Construction and
Demolition Waste Management Rules of 2016. They shall be stored separately in their premises and
disposed of, as the local body requires, from time to time in their own premises.
The solid trash generated by it, on the streets, open public areas outside of its premises or in drainage
or water bodies shall not throw, bump or haste.
All waste generators are paid the same user charge as set out in the State SWM Bye-laws of 2019 for
solid waste management, as revised from time to time (GOR, 2019).
Duties of Industrial Units
All fuel-fueled industrial plants situated within a century km from the rejected fuel-fired solid wastes
must arrange to replace at least five per cent of their fuel requirement with the resulting refuse-derived
fuel (RDF) produced within six months of notification of the Solid Waste Management Rules 2016
(GOR, 2019).
Rules and Regulations
Regulatory framework for Rajasthan’s SWM Policy consists of the various legal and regulatory roles
and responsibilities outlined for the various organizations, institutions and local bodies under the
various waste management rules and regulations. These provide a framework for solid waste
management across the state.
The duties and responsibilities to be carried out by various institutions, bodies, groups and individuals
shall be in accordance with the below rules and guidelines or any other waste management rules
notified from time to time: Rajasthan Municipalities Act, 2009; Hazardous and Other Wastes
(Management and Trans-boundary Movement) Rules, 2016; Guidelines of CPCB; and any other
waste management rules/ guidelines provided by any authorized and competent authority from time to
time (GOR, 2019).
Enforcing Authorities
According to the Solid Waste Management Rules, 2016 (Rule 16. a) prescribed by Ministry of
Environment, Forest and Climate Change (MoEF& CC), Rajasthan State Pollution Control Board
(RSPCB) will be the enforcing authority of these rules in the State through local bodies in their
respective administration and review implementation of these rules at least two times a year in close
cooperation with concerned Directorate of Local Bodies or Secretary-in-charge of State Urban

108
Development Department. The ULBs in urban areas and Gram Panchayat in rural areas, respectively,
will perform the implementation of these rules.
Guidelines
Environment Department Guidelines
The Hazardous Waste (management and handling) Rules of the Central Government were notified to
govern the hazardous waste generated in 1989. The 1989 Regulations were introduced to secure the
environmentally sound handling and management of hazardous waste. These Rules have nevertheless
been abolished and a new set of Rules has been established. The new laws focused on dangerous trash
and its cross-border trafficking. In addition to the objectives set out in the Basel Convention on the
control of and disposal of transboundary movement of hazardous wastes, the 2008 Rules on the
Management, Handling and Transboundary Movement of Hazardous Wastes have been specifically
developed to acheve them. The Central Government subsequently created 2016 rules on hazardous
and other waste, recently updated in 2019. (Management and Transboundary Movement) (GOI,
1986).
Application
According to Section 886, the Environment (Protection) Act, 1986 specifically bans anyone save for
the procedure and subsequent compliance with such precautions as may be specified from the
handling of dangerous substances. This clause shall be read in accordance with Rule 13 of the
Environmental Rules (1986). The Central Government replaced the old Rules framed in 2008 ('2016
Rules') by the new Regulations for Hazardous and Other Waste (Management and Transboundary
Movement) of the year 2016 (GOI, 1986).
Swachh Bharat Urban Guidelines
Certain waste products are dangerous to health and can contaminate and damage the environment
when mixed with other garbage. These should be kept every 1-3 months for collection: Using tube
lights and CFLs (since they include mercury), paint cans, cadmium etc., torch cells and button cell
and batteries, which have oils and toxic substances. The following products include cosmetics, hair
dyes (which include lead), cleaning oily rags, and many more: Aerosol canisters, torches and cell
batteries for flashlights, blankets, household cooking and drainage agents, car batteries, oil filters and
car-patients and consumer goods, chemical products and solvents, their vacuum containers, cosmetics,
chemical products and syringes for both, insecticide products, vacuum containers, light bulbs, tube-
light and compa-like products.

109
Best Practices
Waste Minimization through Co-Processing
Co-processing is based on the use of waste in industrial processes, especially in energy intensive
industries like cement, lime, steel, glass and power generation as a staple, energy source or both for
the exchange of natural resources and for the exchange of fossil fuels like coal, petroleum or gas
(recovery of energy).
In Gujarat, the usage of hazardous waste in cement fuel and input materials climbed from 15,693
tonnes once a year to 543,569 TPA in 2013/2014 35 times between 2009/2010. In 2013/2014, the
amount of cement plants used increased by 185% from 190,707 TPA in 2012/2013 (Karthikeyan et
al., 2018).
Treatment, Processing, and Disposal Facilities in Gujarat
Under the HW-containing restrictions in safety areas, considerable stocks are kept near commercial
locations of hazardous or partially treated HW. The garbage must be properly disposed of. Failure to
handle such waste leads to pollution by groundwater, so endangering those who utilise groundwater as
their source of domestic water and irrigation (Karthikeyan et al., 2018).
Role of Gujarat Government in Hazardous Waste Management
Gujarat was the main state in dealing with hazardous waste issues and created a wholly new idea of
the TSDF for the industrial cluster. Gujarat is the country's leading manufacturer of TSDF sites. There
are eight TSDFs in the country out of 27 TSDF sites (Karthikeyan et al., 2018).
Common Hazardous Wastes Incineration Facility (CHWIF):
It is recommended to disposal in an environmental safe manner specific non-biodegradable trash and
liquid hazardous waste (toxic). The detoxification procedure is not economically possible for the
treatment of non-biodegradable wastewater. At the end of 1990 a concept was adopted for the safe
disposal of toxic waste by individual common incinerators. The State now has five common
hazardous burning sites and 83 individual burning facilities (Karthikeyan et al., 2018).
The Clean-up of Old Waste Dump Sites in Gujarat:
Hazardous waste 34,395.40 MT was removed and transferred to the place of deposition (TSDF). The
board is continuing with the clean-up of unlawful dumping sites throughout the country (Karthikeyan
et al., 2018).

110
Public private partnership Common TSDFs have come up:
Common TSDFs have received subsidies of capital investment from the State Government and the
Government of India, in some situations. State Industrial Growth Corporation land at concessional
rates and the financial involvement of industrial units as well as the financial backing of institutional
institutions have contributed in this development.
Green industries formation in Gujarat:
The Gujarat Pollution Control Board issued a list of 100 small and cottage industries with no pollution
potential. These industries are excluded from obtaining NOCs for the establishment of such industries
and converting the land into "non-agricultural" usage by the board (Karthikeyan et al., 2018).
4.1.6 E-Waste Management
Development in the field of science and technology have led to major industrial developments and
revolutions. This has had a great impact on the lives of each of us and has also caused many problems,
including a large amount of hazardous waste and other waste generated by electronic items. WEEE or
Ewaste waste can be defined as any electrical appliance (Organization for Economic Cooperation and
Development) that uses an electronic power supply that has reached the end of its useful life. The
electronics sector is one of the world's largest and most rapidly developing production industries,
hence e-waste is a global problem which needs to be tackled.
There are several conventions and initiatives that discuss the importance and current scenarios of
waste management. The Basel Convention is one of the first global initiatives on the subject, it aims
to solve problems related to the generation and transport of electronic waste and introduces the idea of
reuse and recycling, as well as marketing methods. Here are some definitions of some of these
initiatives:
Table 4.7 Definitions of E-waste
Conventions Definition
EU WEEE Directive
(EU, 2002a)
“Electrical or electronic equipment, which is waste including all components,
subassemblies & consumables, which are part of the product at the time of
discarding.” Directive 75/442/EEC Article 1(a) defines "waste" as any of the
substances or objects which, pursuant to National Law provisions in force, the
holder disposes of or is obliged to disposed of."
Basel Convention “E-waste encompasses a broad and growing range of electronic devices ranging

111
Action Network
(Puckett & Smith,
2002)
from large household devices such as refrigerators, air-conditioners, cell phones,
personal stereos, and consumer electronics to computers which have been
discarded by their users.”
OECD (2001) “Any appliance using an electric power supply that has reached its end of life.”
Sinha (2004) “An electrically powered appliance that no longer satisfies the current owner for
its original purpose.”
StEP (2005) E-waste- “the reverse supply chain which collects products no longer desired by
a given consumer and refurbishes for other consumers recycles or otherwise
processes wastes.”
Sources and generators
Electron waste includes residues that are not suitable for the originally expected use. Includes a
computer and its accessories, a monitor, a keyboard, a printer and a central processing unit.
Typewriter, mobile phone, charger, compact disc, remote control, headphones, battery, LCD / plasma
TV, air conditioning, refrigerator and other appliances. Waste contain toxic substances and chemical
products. This negatively affects the environment and health, directly or indirectly if it is not
processed properly. India is one of the estimated annual productions of the world's annual production
country of the estimated Taobao production countries.
EWASTE is generally collected from individual, small and medium business segments, unique
manufacturing departments, large companies, institutions and four main sources of government
agencies.
Material components in E-waste
E-waste generally contains a complex combination of materials and ingredients, and can even be
microscopic. It includes about 1000 distinct compounds, many of them dangerous to the environment
and human health if not disposed of in an ecologically sound way (MoEF, 2011). Printed circuit
boards, CRTs, switches and flat screens, computer battery, condensers and transformers, print circuit
boards, plastic shell cables, and cable insulation/sheathing are all very poisonous. They are toxic
components. lead and cadmium, lead and cadmium oxide, mercury, cadmium, PCB, brominate flame
retardant and PVC are all elements present. There are a number of valuable metals, rare earth metals,
ferrous and non-ferrous metals, polymers, wood and glass available in electronic waste. Around 50%
of the waste is derived from steel, then plastics (21%), non-ferrous metals (13%) and other elements.
Scenario in Country

112
It is estimated that more than 50 metric tons of E-waste is produced globally every year and it is the
rapidly growing component of municipal waste across the world today. We note that emerging
countries would increase as significant generators of e-waste in the years ahead due to their growing
customer base and predicted sales growth in economic products due to high future demand and quick
economic and industrial growth. United States of America holds the first position in E-waste
generation and three Asian countries are included in the top five list including India in the fifth
position.
India is the 5th largest producer of E-waste on world level but is not among top 15 E-waste generators
per capita. India produces 1.8 million tons of E-waste every year that is roughly 4 per cent of E-waste
generated annually. The collection of e-waste is done together with other debris in India, which means
that documented information is almost nonexistent about the quantity of e-waste produced each year,
which is disposed of. This indicates that the data available on the environmental and health sector is
also not documented. There are only estimations based on independent studies conducted by the
NGOs or government agencies. The yearly growth rate of E-waste in India is 30%.
E-Waste Sources
The prime sources of e-waste are manufacturers, consumers, and imports from other countries. In year
2005, the Central Pollution Control Board (CPCB) estimated that India’s e-waste was 1.8 million tons
which is 0.573 metric tons per day. According to reports, only 10 states in the country generate 70%
of the total e-waste, while 65 cities in India generate more than 60% of the total e-waste. Maharashtra
was top among the 10 most populated countries of E-waste, followed by Tamil Nadu, and Andhra
Pradesh, and Uttar Pradesh, West Bengal and Delhi and Karnataka, and Gujarat. It was followed by
Delhi, Bangalore, Chennai, Kolkata, Ahedabad, Hyderabad, Pune, Surat and Nagpur.
E-waste in India is mainly produced in the public, public and private sectors, accounting for nearly
70% of the total waste generated. At the same time, the total contribution of self-employed individuals
is relatively small, about 15%; the rest is provided by manufacturers.

113
The 2009 Indian Market Research Bureau (IMRB) 'e-waste at source' survey indicated that TV and
desktop computers, including servers, are the principal categories of total e-waste in India. Their
combined revenues are about 68% and 27% respectively. Mobile and imports accounted for 2% and
1%, respectively.
Major contributors to this are computers and computer components; the field of consumer electronics
is mainly television, telecommunications and changing consumer patterns.
Maharashtra leads the list with an annual e-waste generation of 20,270 tonnes. The electronic trash
generated by Rajasthan annually is about 6326.9 tonnes.
E-Waste management in India
According to report from ASSOCHAM, India recycles only 1.5 per cent of the E-waste generated
through an ‘institutional operation’. The total E-waste produced in a year is 1.8 million and the
amount undergoing E-waste treatment is 4000 tons. That gives us 1.6 million tonnes of unprocessed e-
waste each year on average.
The informal sector handles the more than 90% of the E-waste management system i.e., the
collection, recycling etc. and the formal sector accounts for less than 10% of the recycling business.
Indian cities produce alarming rates of E-waste with no organized system available present on which
Mumbai tops the list with 11000 tons of E-waste, Delhi with 9000 tons, Bangalore 8000 tons and
Chennai 5000-6000 tons each year.
The Ministry of Environment and Forest of the Government of India is responsible for environmental
legislation and its control. The CPCB also plays an important role as an autonomous agency under
MoEF, responsible for drafting guidelines and advising MoEF on policy matters related to
environmental issues. According to the Ministry of Environment and Forests, there are currently
4,444 hazardous materials in 28 processing, storage and disposal facilities (TSDF).
The project titled "Development of e-waste recycling and reuse processing technology" has been
successful. It was implemented in March 2011 at the Jamshedpur National Metallurgical Laboratory
in India, which is a research and development laboratory under the Council of Scientific and
Industrial Research (CSIR). In this project, local technology was developed to recycle 90% of the
metal content in e-waste. The process will not produce toxic gases or harmful wastewater. Thus, you
will reduce environmental hazards caused by waste recycling units in unorganized sectors. The
increasing quality of life and high rates of resource consumption patterns have had an adverse and
involuntary environmental impact through trash generation well beyond government and agency

114
capacity. Also, E-waste recycling is still an alien concept in India where it is practiced only in very
few urban areas of the country.
Some of the Indian Enforced Agencies involved in E-waste are Ministry of Environment and Forests,
Government of India, Central Pollution Control Board, State Pollution control Board, Port and
Customs Authorities, The Directorate General of Foreign Trade etc.
In conjunction with industry associations since 2015, the Ministry of Electronics and Information
Technology (MeitY) has launched a Digital India e-waste awareness programme to raise public
awareness about e-waste recycling dangers and to educate them about alternative ways to dispose of
their electronic wasted material. The program stresses the need for adopting environment friendly e-
waste recycling practices. In order to provide jobs and business chances for local residents, the
initiative has incorporated best practises for e-waste recycling accessible worldwide. Institutional
infrastructures, such as e-waste collection, movement, processing, stockpiling, recovery and disposal,
must be built for environmentally sound management of e-waste at the national and/or regional level.
These facilities should be approved by the regulatory authorities and if required provided with
appropriate incentives. MeitY has created cost effective technologies for the environmentally sound
recycling of materials and polymers, including two exclusive PCB recyclers, with an acceptable
environmental standard of 1000 kg/day (~35 MT e-waste) and 100 kg/batch (~3.5 MT e-waste)
processes. The 1000kg PCB/day continuous processing plant is suited for building an eco-park in the
country, while the 100kg processing plant is suitable for the informal sector. The current condition of
affairs in informal sectors can be upgraded and transformed. E-waste also comprises up to almost
25% of the weight of plastic. New retrieval and conversion of plastics for the use of the e-waste has
also been created successfully. A majority (76 percent) of waste plastics can be turned into
appropriate materials for use in virgin plastic products by the established procedure. The technology
for commercialisation has already been transferred.
Scenario in State
As per the Country level WEEE assessment study by International Resource Group Systems South
Asia Pvt. Ltd, Rajasthan produces 6326.9 tons of WEEE in 2005. The Rajasthan State Pollution
Control Board, pursuant to E-waste Management Regulations of 2016 established the permission to
generate, handle, gather, collect, receive, store, transport, renovate, remove, recycle, process and
disposal of electric waste. For this, they have developed an online system for the submission of the
application. There are 26 authorized Dismantler/ Recycler located in the state with a total capacity of
90769 MTA.

115
There is Policy for condemnation of IT Equipment and disposal under Department of Information
Technology & Communication, which describes certain rules for the disposal of IT equipment such as
Servers, PCs, Dumb Terminals, Printers, UPS, Laptop, Package Software, Mouse, LAN cabling 100
MBPS or below, Dialog Modems with less than 33 KBPS speed etc.
This policy is applicable to all government departments under Government of Rajasthan, all
autonomous bodies and all PSUs under Government of Rajasthan.
The government along with the state pollution control board, Indian Oil, Instacash, and Greenspace,
has started a campaign to create public awareness and improve understanding on e-waste and plastic
so that a common man is made aware on about the importance of e-waste management.
In addition, in the Indian Oil pumps in Jaipur, the government established 20 collection points for
electric waste and plastic bags, where you can easily go and store your plastically and electric waste
bags. While money is paid in return for plastic bags for e-waste. Jute bags are supplied.
Governance and Management Structure
Some of the Indian enforced Agencies involved in E-waste are Ministry of Environment and Forests
and Climate change, Central Pollution Control Board, State Pollution control Board, Port and
Customs Authorities, The Directorate General of Foreign Trade, Department of Environment Science
and Technology, Local Self-Governing Bodies, Department of Information Technology &
Communication, NGOs etc.
Roles and Responsibilities
Central Pollution Control Board
They are responsible for regulating and controlling and overlooking the procedures done and also to
identify the impacts on environment and health. Some of the responsibilities are to grant and Renewal
of Extended Producer Responsibility - Control of compliance and authorisation, maintain information
on Extended Producer Responsibility, Setting and review of e-waste collection targets from time to
time, coordination with state pollution control boards, creation of environmental management
guidelines for e-waste management, The producer should take the responsibility for conducting
random sampling of the electric and electronic equipment on the market for the monitoring and
monitoring of compliance with the provisions for the reduction of hazardous substance and the costs
for sampling and testing, Publish sampling and analysis methodologies of hazardous substances, carry
out random dismantler or recycler inspections, or revamp them, documentation, e-waste data

116
collection, and web-based downloading by Central Pollution Control Board, infringement measures.
Training programmes, submitting to the Department Annual Report on the reduction in the use of risk
substances in electric and electronic equipment manufacturing, interaction with IT industries to reduce
hazardous substances, setting and reviewing targets for the reduction of the use of hazardous
substances in electrical or electronic equipment manufacturing (GOI, 2011).
State Pollution Control Board
They overlook the situations on state level and also divide the responsibilities among the urban local
bodies. The important responsibilities are to Inventorize E-waste, grant and renewal of authorization
to manufacturers, dismantlers, recyclers and refurbishes, monitoring and compliance of Extended
Producer Responsibility - The approval of dismantlers, recyclers or refurbishers is controlled by
CPCB, Random dismantler or recycler inspection or rehabilitation, keep the authorisation provided to
manufacturers, dismantlers, recyclers, rehabilitators, implement ecologically responsible recycling
programmes, fight against infringements of those regulations, and other function designated to the
Ministry by the Ministry under these rules (MoEFCC, 2017).
State Government
There are a few divisions which bear liability regarding the general well-working of the framework.
Some of them are the Department of Industry, which need to guarantee reserving or assignment of
modern space for E-squander preparing in the current or impending mechanical park, domain and
modern groups. The other one is Department if Labor which needs to guarantee acknowledgment and
enlistment of laborers included, help arrangement of gatherings of laborers, embrace ability
advancement exercises and lead yearly observing and guarantee wellbeing and soundness of laborers
included. It ought to likewise get ready coordinated arrangement for viable execution and submit
yearly report to Ministry of Environment, Forest and Climate Change
Urban Local Bodies (Municipal Committee or Corporation)
Responsible for efficient grassroots implementation. Some of the duties include to ensure that e-waste
is properly separated, recovered and channelled to authorised dismantlers or recovery machines if
found to be combined with municipal solid goods, and that e-waste is collected and channelled to an
approved decommissioner or recycler.
Port Authority
The Port Authority plays a significant role because there are numerous levels of legal and illicit E-
waste imports. The duties include verifying the Extended Producer Responsibility-Authorization,

117
informing the Central Pollution Control Board of any illegal traffic so that appropriate action can be
taken, and prosecuting importers for violations of the Indian Ports Act, 1908.
Rules and Regulations
The environmental ramifications of these materials were recognised early on, and guidelines were put
in place to preserve the environment. Previously, e-waste management was lumped in with dangerous
substances and categorised as environmental protection. The regulations are listed in order of their
occurrence.
Factories Act 1948: There are several contaminants arising out from manufacturing or recycling of
electronic components and are listed in this Act.
Environmental Protection Rules 1986 (amended till 2004): There is no direct standard to deal with
contaminants in the production or recycling of electronics. However, some PCB units are categorised
as electroplating units and must therefore comply with the waste disposal standards in accordance
with Schedule 1 of this rule. (GOI, 1986).
Hazardous waste (management and Handling) rules 1989, amended in 2003: Schedule 2 of this act
can be applied for the disposal of e-waste. It stated that authorization is to be obtained by the
generator or collection receptor, treatment, storage and Disposal of Hazardous waste in an
environmentally sound manner. Non-direct usage, but recycling electrical and electronic assemblies.
Hazardous Waste (management, Handling and Transboundary movement) rules, 2008: It includes
the list of e-waste to be imported, and it also includes e-waste to be imported and exported and which
does not require prior informed permission. The site for the collection, reception, storage and disposal
to the open space shall be approved by competent authority. It also describes the regulations for the
import export of hazardous waste (MoEF&CC, 2008).
Policy for Condemnation of IT Equipment and disposal
The IT equipment can be condemned when they have completed 5 years and are currently not in
working condition, third party software/ books/ manuals for which the technical support or service is
currently no longer available, when the cost of repair is high compared to the current rate, damage due
to fire or any other similar reason.
The policy states that once the equipment is condemned it should be removed from the office and
taken for alternate use if there is any or for disposal with proper bio-friendly techniques.
E-Waste Management Rules, 2016

118
A combined exclusive set of rules for E-waste was implemented year 2012 by the Ministry of
Environment and Forest named as E-waste (Management and Handling) Rules, 2012. This was
amended in the year 2016 and 2018 for further additions. The Central Pollution Control Board Swatch
Bharat Abhiyan Mission keeps these guidelines as base for the waste treatment.
The Indian Government is a core agency for environmental policy, planning, promotion, coordination
of the programme, including electronic waste. The e-Waste Management Rules of the year 2016 were
applied to every manufacturer of electronic equipment, collection centres, e-Waste recycler and
dumping centres and recycler concerned with the manufacture, sale and procurement of electrical and
electronic equipment, even if it is based primarily on the principle of extended production
responsibility (EPR). It excluded batteries, micro and small enterprises and radio–active wastes as
they all are separately covered in their own Acts or guidelines. It defines responsibilities for each
group involved from producer, collection center, bulk consumer, dismantler, recycler etc.
Responsibility of Manufacturer
The main responsibility of manufacturers is to collect and channel electrical waste created during the
production of electrical or electronic recycling or disposal equipment. Furthermore, authorisations
should also be obtained from the State Pollution Control Board to ensure that no environmental
damages occurr during storage and transport of e-waste, to maintain, handle and disposal records for
e-waste produced and made available to State Pollution Control Boards for inspection and to file the
State Pollution Control Boards annual return record.
Responsibility of Producer
Extended Producer Responsibility (EPR): Authorization should include a normal scheme for
collecting waste Electrical Equipment from previously placed on the market Electrical Equipment,
such as through dealers, collection centres, Producer Responsibility Organizations, buy-back
arrangements, trade schemes, and so on, whether directly or indirectly. It also includes collection and
channelization of E-waste generated from the ‘end-of-life’ of their products or products with same
electrical and electronic equipment code and historical waste available, Pre-treatment is necessary for
the volume reduction of waste before the treatment, storage and disposal facility. This is necessary to
immobilise mercury to ensure that the channelling of e-waste, including those from its service centres
into an approved dismantler or recycler, is in conformity with Extended Productor Liability,
Facilitating the return of electrical and electronic terminal equipments by providing contact details,
such as the e-mail address, telephone and helpline number to the customer(s) or bulk consumer(s),
Creation of awareness about dangerous components of the item, risks of inadequate handling and

119
disposal, do-and-don't, etc. through media, publications, advertisements, posters or other media and
product user information., Provide information on Deposit Refund Scheme.
The EPR can be an individual or collective system in which the producer enlists the help of other
members to complete the process and ensure that only EPR-authorized producers are allowed to
import electrical and electronic products.
Responsibility of Collection centres
The collection centres, including those resulting from orphaned products, collection points or bins
should also be designed to collect e-waste on behalf of the manufacturer, dismantler, recycler or
rehabilitator, ensure that the facilities are in line with CPCB guidelines and standards, ensure safe
storation of the recovered e-waste, and ensure no damage.
Responsibility of Dealers
The dealer should collect E-waste on behalf of the producer and shall collect it by providing the
customer with a box, bin, or a delimited place to dump it, or by using a take-back system and sending
it to the producer's designated collection centre, dismantler, or recycler. The money will be returned
according to the take-back system. They must also ensure that no harm is done to the environment
during the process.
Responsibility of Refurbisher
The renovators should collect the e-waste generated during renovation and send it via their collection
centre to an accredited dismantler or recycler. You must ensure that no environmental or human
health damage is done during the whole refurbishment process, that e-waste is securely transported
and that records are retained.
Responsibility of Consumer or Bulk Consumer
Consumer should have minimum awareness not to throw E-waste in municipal waste bins. They
should ensure that the end-of-life electrical are not admixed with E-waste containing radioactive
material mention under Atomic Energy Act, 1962.
Responsibility of Dismantler
The Dismantler has responsibilities to ensure that facilities comply with CPCB standards and
guidelines, to obtain SPCB approvals, to ensure that no harm occurs, to ensure that decomposed E-

120
waste is segregated and sent to permitted material recovery recycling facilities and to ensure that non-
recyclable or non-recoverable materials are not covered.
The data held in the memory of end-of-life items (hard disc, telephones and mobile phones) should be
destroyed or permanently deleted by hammers or by data erasers.
Responsibility of Recycler
Recyclers must ensure that their facilities meet CPCB standards/guidelines, that no harm is done to
the environment, and that the residue produces during the recycling process is disposed of in a CPCB-
approved treatment storage disposal facility.
Categorisation of Electronic items
Under the rule, the electrical items are categorized into two categories as shown below. This includes
their components, consumables, parts and spares.
Table 4.8 Categorisation of items
Categories of Electrical and
Electronic Equipment
Items
Information technology and
telecommunication equipment
Centralized Data Processing, Mainframes, Minicomputers,
Personal Computers, Laptop, Notebook, Notepad, Printers
Including Cartridges, Copying Equipment, Electrical and
Electronic Typewriters, User Terminals and Systems, Facsimile,
Telex, Telephones, Pay Telephones, Cordless-Phones, Cellphones,
& Answering Systems.
Consumer electrical and
electronics:
Television sets, Liquid crystal display, Light emitting diode
display, Refrigerator, washing machine, and Air conditioners,
Fluorescent and other Mercury containing lamps.
All manuals involved in manufacturing, sales, buying and processing of electric and electronic
equipment or components, producer, dealer, collectors, dismantlers, recyclers or auctioneers,
customers or bulk consumers should be subject to updated guidelines.
The electrical equipment producer must channel any E-waste generated throughout the
manufacturing process to recycle or eliminate it. Dealers must plan the collections of e-wastes and,

121
where applicable, acquire permission from the SPCB or the CPCB, as well as ensuring the safety
and security of the storage, transit, disassembly and restoration of e-wastes.
Extended Producer Responsibility (EPR)
This is an environment policy approach where the obligation of manufacturers is extended to
include final disposals during the post-consumer phase of their life cycle. In theory, the identical
answer lies with all categories, including customer, producer and provider.
Guidelines for Collection and storage
1. A well-functioning collection mechanism should be introduced by producers which could include
take-back, collection centres etc.2. For collection, producer can take help from Producer
Responsibility Organization (PRO) or E-waste exchange. 3. It should be accessible to all citizens if a
take-back system is given. 4. Each manufacturer, collection facility, distributor, recycler and
refurbisher shall keep records of the collection, sale, transport and storage of trash for a period of no
more than 180 days and shall make these documents available for examination. In case of special
stocks of e trash for research development, a procedure of recycling or reuse of e-waste may be
extended up to 365 days. 5. End-of-life storage may be carried out in a way not leading to the
breakdown and safe handling of these products by personnel. 6. Fire prevention systems should be in
place in the storage area and evacuation route.
Guidelines for Transportation of E-waste
The e-waste sender, who can be producer, producer, recycler, dismantler, bulk consumer, renovator
and collection centre, should identify the carriers or make arrangements for transport of e-waste in a
manner which minimises the environmental consequences of the hazards associated with their
transport. E-waste should be transported in accordance with the regulations.
Guidelines for Dismantling Process
1. Dismantler could perform De-dusting or Manual Dismantling. 2. After opening electric and
electronic equipment into the component by human operations, the procedure will consist of physical
separation and segregation. 3. The dismantling of the dismantling table should be manually performed
with space de-pollution equipment in order to preserve appropriate air quality in the working area. 4.
The de-dusting system should consist of suction hoods over the disassembly table with a cyclone, a
bag filter, and a three-meter high chimney above the roof level. 5. Boxes to collect the removable
components should be positioned next to the removable table. 6. The personnel should be using
adequate personal protection facilities such as goggles, masks, gloves, casks and gum boats, etc.,

122
throughout dismantling operations. 7. After disassembling, the volume or size shall be reduced. Noise
and dust checks should be installed for volume reduction. 8. The decommissioners should have
sufficient leak management facilities for compressor oils, refreshing/cooling gases such CFCs,
HCFCs and end-of-life mercury, fluorescent mercury and other lamps containing, for example. 9. The
premise for removal should comply with the following conditions. 10. Waterproof roofing and
impermeable surfaces needed to be provided. 11. Storage space for dissembled spare parts shall be
given. 12. Separate containers, condensers containing PCBs, must be provided for battery storage. `
Environmentally sound e-waste recycling guidelines
Dismantling and recovering operations are among the activities of recyclers. They should construct
suitable wastewater treatment facilities and air pollution control devices for the waste water treatment
process.
It is necessary to provide noise control for equipment such as the crusher, grinder, and shredder. The
recovery of resources, notably valuable metals included in e-waste, should be prioritised. Recyclers
should use the following processes:
a) Manual / semi- automatic / automatic dismantling operations
b) Shredding / crushing / fine grinding/wet grinding/ enrichment operations, gravity/ Magnetic
/density /eddy current separation
c) Pyro metallurgical operations - Smelting furnace
d) Hydro metallurgical operations
e) Electro-metallurgical operations
f) Chemical leaching
g) CRT/LCD/Plasma processing
h) Toner cartridge recycling
i) Melting, casting, moulding operations (for metals and plastics)
Best Practices

123
E-Waste flow in India
Currently, e-waste is eliminated in one of four ways: garbage disposal, incineration or recycling or
exporting. Each procedure affects the environment and the health and safety of employees. Recycling
is only considered one of the best means of disposing of electronic components when the recycling
operation involves environmentally sound recycling. In developing nations like India, harmful e-
Waste management techniques are becoming more common due to poor employment, missing
consciousness, lack of technological advancement, and lack of regulatory rules. The manufacturers
and governments are not able to keep pace with the electronic waste policy and practice which makes
the issue quite serious.
The informal sector now handles more than 90% of India's e-waste management. The sources and
numerous stakeholders form a complex system involving formal and informal sectors that is
nonscientific and equally destructive to the Environment and people's health, as well as the
community as a whole. The majority of e-waste is sold to scrap merchants, who then sell it to the
informal sector.
Figure 4.24 E-waste Flow in India
Eco-Assurance System
Improving the recycling rate of E-waste and following up on prohibitions on the usage of dangerous
chemicals. It comprised preventative policies such as limiting the use of hazardous materials,

124
enhancing the quality of materials and structures, providing recycling information, and reaching the
highest possible rate of recycling. It also had a recycling policy, which includes enforcing facility
standards, establishing recycling procedures and standards, and meeting recycling targets, among
other things.
Table 4.9 Recycling Principles
Items Recycling Principles
Common
products ● Reuse and recycling of parts after processing treatment
(disassembling, compression, crushing, and cutting)
● Recovery of valuable metals from the printed circuit boards
Large scale
appliances
● Recovery of chlorofluorocarbons from refrigerators, air conditioners,
and vending ma-chines
● Implementation of mandatory recycling rate (weight base) of over
65% for the television (except for liquid crystal displays and plasma
display panels), over 70% for refrigerators and vending machines, and
over 80% for washing machines and air conditioners.
Office
equipment
● Recycling of personal computers
● Implementation of mandatory recycling rate (weight base) of over
65% for PCs, over 75% for printers, copiers, and fax machines, and
over 70% for mobile phones
Medium scale
appliances
● Recovery of chlorofluorocarbons from electric water purifiers
● Implementation-of mandatory recycling rate (weight base) of over
75%
Small scale
appliances ● Recycling of electric heaters
● Implementation of mandatory recycling rate (weight base) of over
75%
International Measures
The Basel convention
Mobile Phone Partnership Initiative (MPPI): Developing and promoting ecological mobile handling
for used and end-of-life devices. MPPI created standards for environmentally sustainable management
of used and end-of-life mobile phones, including education, design considerations, collecting,
transboundary transportation, refurbishing, and material recovery/recycling. It comprises companies
including Alcatel, LG, Mitsubishi, Motorola, Nokia, Philips, Samsung, Sony Ericsson, and Vodafone,
Orange, and Bell Canada, as well as telecom providers like Vodafone, Orange, and Bell Canada.

125
The MPPI's objectives include improving product stewardship, influxing consumer behaviour,
promoting the best disposal/recycling/refurbishment options, organising political and institutional aid
for environmentally sound management and establishing a replicable project to build new,
public/private environmental support partnerships.
The StEP Initiative
It is the responsibility of the United Nations University. This was designed to build a worldwide
information platform for stakeholders, including country representatives, producers' groups, recyclers,
refurbishers, academia, NGOs and the international organisations, to share information on e-waste
management systems., to enhance global efforts and coordinate sustainable handling of e-waste. The
goal is to undertake research investigations, enhance public awareness, science and business
understanding about optimising the electrical and electronics life cycle, improve the supply chain,
close material loops, reduce pollutants and increase resource use.
UNEP DTIE
The aims of UNEP DTIE are the promotion of sustainable consumption and production; voluntary
action to improve the sustainability performance of member countries; implementation in developing
countries of complementary waste management programmes; and the implementation of strategies
that influence informed decision making through partnerships with other international organisations,
NGOs, Govgovernment authorities
Recommendations from CPCB
Due to a lack of technology and inadequate implementation, plastic waste disposal in India is a severe
worry. Different experiments were nonetheless carried out to reuse plastic waste during road
construction or to co-process plastic waste in concrete ovens, among other things. Incineration is now
the most widely used method for disposing of plastic trash, but due to under-graded kilns and poor
maintenance, they emit toxic pollutants such as dioxins and furans when burning chlorinated and
brominated plastic waste, posing a number of environmental concerns.

126
Other interventions
Policy level
1. For economic advantages, a technique can be established for each unit of the product sold on the
marché, such as advanced fee for recycling (ARF) or advanced fees for disposal (ADF). This would
relieve manufacturers of physical collection responsibilities and allow the funds produced to be used
to establish end-of-life products markets. 2. Subsidize consumers to place their electrical waste in
approved centres. 3. Help informal employees in the education or training sector and give them with a
stronger and efficient social security network. 4. In order to foster the broad use of environmentally
friendly electronic waste recycling methods, indigenous technology and/or technology transfers
should be promoted. 5. In the absence of suitable recycling infrastructure in the country, the
prohibition or restriction of all types of imports should be considered. 6. The system should progress
in addressing challenges caused by resource scarcity, a weak legal framework, no non-compliance
fines and collection and recycling targets. 7. Accountability, transparency and sustainability on E-
waste management should be ensured at every stage of the process.
Informal sector
1. The current social and economic situation in the informal sector is unsatisfactory and therefore has
to be addressed and the sector's validity in access to garbage and trading should be recognised. 2.
Review of current regulations to include faster and more organized system.3. Waste intervention and
data generation needs to be updated frequently. 4. Implimentation of online systems for the ease of
work and documentation has to be done. 5. Skill development: Programs to improve the sector's
ability to dismantle and segregate e-waste of various kinds are necessary. Forming and skills to build
the informal sector to grasp proper environmental, safety and health practise creates e-waste recycling
techniques that are environmentally friendly.
Formal Informal partnership
As previously said, the participation of the informal sector is unavoidable, and so a collaboration
between the official and informal sectors would be advantageous. The interventions can be focused on
one thing: collecting and recovering valuable materials with the help of local interface agencies. 2.
Establishing long-term relationships with larger collectors and aggregators helps boost collection
rates. 3. Getting the necessary agreements, contracts, and procedures (including payment systems) in
place as soon as possible should be a top concern. 4. Develop a comprehensive EPR strategy.
Information on the formalisation of informal collectors can enhance the credibility of EPR plans
during downstream stages.

127
Updating partnerships and provide long-term support to partnering organizations and thus
encouraging them and acknowledging their contribution.
Public awareness
For proper system maintenance, the consumer should be educated during the buying process, from the
manufacturers, through media channels, social media platforms, and so on. Institutions in charge
should launch awareness efforts at grass-roots level on a regular basis. Producers would be given
stricter guidelines/regulations regarding the frequency and style of these awareness programmes.
Consumer education: They must be made aware of their function in the system via item labelling
requirements. Consumers are trained to purchase only necessary products that utilise some of the
technological advancement (e.g., non-leaded, halogen-free, recycled plastics, manufacturers or
retailers that will accept their products back) and are eco-labelled.
Customers who are aware of the environmental impact of their purchases are more likely to choose
amongst producers for the most ecologically friendly items, according to responsible purchasing.
Only by raising public awareness can this be accomplished.
Compulsory labelling: Labeling products as 'environmental hazards' to implement hazardous materials
declaration content for the identification and correct management and disposal of e-wastes.
Donating electronics: The donation of electronics for reuse extends the life of the items and keeps
them from being managed for longer periods. It helps the economically weaker sector to enjoy the
benefits of these products.
Technological Advancements
Free cycle
It is built on the foundation of internet-based technology. Members post details of unwanted
products on platforms like yahoo groups, blogs, e-mails, and distribution lists, and other members
can respond to the offers. Similarly, Craiglist is a website where people may list unwanted
electronic items to be purchased by others. This aids in the recycling and repurposing of goods.
Design for the environment (DfE)
DfE Organizations are working together in a number of actors to reduce danger for human beings and
the environment by reducing pollution. It's a worldwide project. It seeks to reduce chemical risks,

128
energy efficiency in order to promote positive and sustainable chemical evaluation tools as well as
knowledge to inform firms about safe chemicals as replacement.
Sustainable Practices
Whole System Approach: It's a method that involves linking sub-frameworks and frameworks and
applies a single solution for several challenges. It is working on cost-effective solutions to lessen the
harmful effects of e-waste on the environment and human health.
Green IT: A multifaceted strategy to safeguarding and supporting long-term IT company operations.
A different viewpoint is that of product service systems, which is a sustainable or environmentally
friendly service. Customers are urged to rent hardware and software components so that the seller
maintains ownership and product maintenance.
Eco parks: can be set up to bring the formal and informal sectors together. This aims to ensure that E-
waste is treated scientifically and to eliminate unlawful E-waste processing. The material movement
could be streamlined from originators to recycling centres at a few predetermined locations.
The most environmentally friendly option is to reuse and recycle, which also benefits society. The
reuse and recycling of E-waste requires enough technical support and skill sets. Reuse refers to things
that have been recycled informally, either immediately or after they have been discarded. The
following sections highlight some of the technological interventions utilised in the E-waste recycling
process.
Recycle
The E-waste process allows metals and/or scarce materials to be recovered which are used as raw
materials to produce EEE. The e-waste recycling chain includes three activities: collection;
categorization, disassembly and pre-processing, and processing, as well as final processing. It is
shown in the figure below:

129
Figure 4.25 E-waste recycling chain, (Source UNEP, Step initiative, 2009)
Some of the sustainable recycling approaches are discussed below:
Cementation Technology: Cementation technology is an integrator technology that requires the use
of a solidifying agent for trapping hazardous E-wastes (i.e. cement). They can also use special powder
mixture, special non-metal reinforcement or chemical crystallization treatment.
Nanotechnology: It can be utilised efficiently to treat contaminants, in particular organic volatile and
organic pollutants in e-waste.
Bio-Metallurgy: The biotechnological technique is one of the potential solutions for solving metals
from e-waste materials. It offers a number of advantages such as:
Low operating costs, Use of less hazardous chemicals, Eco-friendliness and Low energy requirement.
Rethink product design: New and better-conceived concepts must be included. In terms of material
selection, manufacturing process, product distribution, and product support system, better product
design is required. It is necessary to introduce the use of non-renewable materials that are safer than
those now in use. The image below depicts a sustainable recycling process:
Disposal
Integrated E-Waste Management Facility (IEWMF): Integreen E-waste management facility
(IEWMF), reducing the number of actions linked to pollution prevention, reduction and control under
the existing regulation institutional system. Secured Land Filling (SCF) and Incineration only for e-
waste residues is permitted under the regulatory national framework for hazardous waste practiced.
Land allocation: At the level of government, many incentive systems might promote allocation of
land.

130
4.2 Present Scenario and Action Plan
4.2.1 Municipal Solid Waste Management
In Alwar district, there are total 12 ULBs of which are 10 Nagar Palika namely, and 2 Nagar Parishad
namely Alwar and Bhiwadi. The population distribution for Alwar district as shown in the Table 4.10.
Table 4.10 Population of ULBs, Alwar District
Population range Name of ULB Population as per census 2011
1-5 Lakh Alwar 341422
Bhiwadi 104921
50,000-1 Lakh -
25000- 50,000 Khairthal 38298
Rajgarh 26631
Behror 29531
Less than 25,000 Tijara 24734
Kishangarh Bas 20814
Kherli 17634
Data provided by ULBs
Inventory of Solid Waste
The total solid waste generation in the district currently stands at 285 TPD in which Alwar city
contributes around 166 TPD. The solid waste generated in the ULBs comes in the form of dry waste,
wet waste, construction and demolition waste, waste coming through street sweeping and drain slits,
hazardous waste and sanitary waste (Table 4.11). Out of 12 ULBs in Alwar district have total 11
municipal solid waste dumping sites Khairthan and Kishangarh Bas have a common dump site which
currently store huge quantity of legacy waste. Only Rajgarh had started segregating the legacy waste
and -have been trying to recover useful fractions. Alwar have a huge quantity of legacy waste,
segregation of this legacy waste is not yet started during the site visit.
The district has 61 bulk waste generators, which are in Alwar city alone have 49. All the ULBs should
implement regulatin for bulk waste generators. Laxmangarh and Rangarh ULBs have not started
provisions the 100 per cent door to door collection of solid waste in their administrative boundaries
while also achieving 100 per cent sweeping in the ULBs. Only four ULBs, Kishangarh Bas, Behror,
Kherli, Rajgarh, Bansur have been able to achieve partial waste segregation done at source, whereas
the remaining ULBs have not initiated segregation yet.

131
Table 4.11 presents the total quantity of solid waste generated/collected, number of dumpsites in each
ULBs and number of wards present in the respective ULBs.
Table 4.11 Inventory of Solid Waste in Alwar District
Parameters Units Urban Local Bodies
Alw
ar
Bh
iwa
di
Tija
ra
Kish
an
ga
rh
ba
s
Beh
ror
Th
an
aga
zi
Kh
erli
Ra
jga
rh
Kh
air
tha
l
Lax
ma
ng
arh
Ba
nsu
r
Ra
mg
arh
A Inventory
1
Total solid
waste
Generation
TPD 166 60 13 11.00 11.00 9 9.40 11 15 Not
estimated 13.67
Not estimated
2
Qty. of Dry
Waste
segregated
TPD 83 16 8 8.7 8.7 4.05 5.10 8.7 6.75 Not
initiated 10.37
Not initiated
3 Qty. of Wet
Waste
segregated
TPD 83 23 5 2.30 2.30 4.95 3.00 2.3 8.25 Not
initiated 3.30
Not
initiated
4
Qty. of C&D
Waste
segregated
TPD 3 5 0 0.0167 0.0167 1 0.50 0.0167 0.75 Not
initiated 0.0178
Not
initiated
5 Qty. of Street
Sweeping TPD 70 2.5 2 1.5 1.5
0.45 1.5
Not
estimated 1.55
Not
estimated
6 Qty. of Drain
Silt TPD 50 1 5 4.0 4.0
0.30 4
Not
estimated 3.5
Not
estimated
7
Qty. of
Domestic Hazardous
Waste(DHW)
collected
TPD 0.5 0.5 2 0.5 0.5
0.05 0.5 No
Facility
No
Facility 0.25
No
Facility
8
No of bulk
waste
generators
Nos 49 12 0 0 0
12
No Facility
Qty not estimated
0 Qty not
estimated
9
Quantity of
waste generated by
BWG
TPD 1
0 0 0
0
1 None 1 None
10
Total waste
processed by
BWG
TPD 332100
0 2500 2500 100 1870 2500 12613 Qty not
estimated 2700
Qty not estimated
11
Total waste
dumped
untreated by BWG
TPD 1 1 0 0 1
0 None NONE None

132
12
No of
composting
machines
installed by BWG
Nos 65 60 25 25 35 25 25 35 35 35 35 35
13
Qty. of Other
Waste (Horticulture,
sanitary
waste, etc.)
TPD 75 30 0 0 2 0 0 2 0
1
14 No of Old
dump sites
[Nos]
or [None]
8 10 0
0
0
0 No data
15 Qty stored in
dumpsites TPD 100 50 100 40 40 0 46 100 40
16
No of
Sanitary
landfills
[Nos]
or
[None]
0 4 5 3 3 0 2 0 4
17 No of wards [nos] 5 3 5 3 2 2 7 5 3
18
No of wards
covered with
D2D
[nos] 1 0 0 0 0 0 0 0 0
19
No of
vehicles for D2D
[nos] 0 0 0 0 0 0 0 0 0
20
No of
vehicles
covered
[nos] 166 42 13 11 11 9 9.17 11 15 Not
estimated 12
Not estimated
21 No of
Households [nos] 83 17 8 2.3 2.3
5.10 2.3 6.75
Not
initiated 2.3
Not
initiated
22 No of wards with source
segregation
[nos] 83 13 5 8.7 8.7
3.00 8.7 8.25 Not
initiated 8.8
Not
initiated
23
No of wards
partially
covered with source
segregation
[nos] 3 1 0 0.0167 0.0167
0.50 0.0167 0.75 Not
initiated 0.0177
Not
initiated
24
No of wards
not covered
with source
segregation
[nos] 1 1 1 100% 100% 0 100% 1 1 Not
initiated 1
Not
initiated

133
Litter Bins and Waste Bins storage
Litter bins are installed at vulnerable garbage point for waste collection. These garbage bins have twin
compartment for collection of segre gated waste. Zero garbage vulnerable points exits in the
whole district.
Table 4.12 Litter Bins and Waste Bins Storage
S.No
.
Parameters
Unit
s
Urban Local Bodies
Alw
ar
Bh
iwa
di
Tija
ra
Kish
an
ga
rh
ba
s
Beh
ror
Th
an
aga
zi
Kh
erli
Ra
jga
rh
Kh
airth
al
La
xm
an
ga
rh
Ba
nsu
r
Ra
mga
rh
1
No of twin bins
installed in
commercial and
public areas
Nos 10
0 50
10
0 40 40 0 46 100 40
2
No of garbage
vulnerable points
(existing)
Nos 0 4 5 3 3 0 2 0 4
3
No of garbage
vulnerable points
eliminated (Damaged
to be replaced)
Nos 5 3 5 3 2 2 7 5 3
Compliance in segregated waste Collection SW Collection
Waste segregation refers to the separation of dry and wet garbage, which paves the way for other
concepts of waste management like composting, recycling and incineration. Its end goal is to reduce
waste from landfills and eventually, prevent land, water and air pollution. As per Table 4.13,
Segregated waste collection is not initiated in ULB Laxmangarh and Ramgarh.
Table 4.13 Report on compliance in segregated solid waste management
S.No. Parameters Units Urban Local Bodies
Alw
ar
Bh
iwa
di
Tija
ra
Kish
an
ga
rh b
as
Beh
ror
Th
an
aga
zi
Kh
erli
Ra
jga
rh
Kh
airth
a
l
La
xm
an
g
arh
Ba
nsu
r
Ra
mga
rh
1 Total
generation TPD 166 42 13 11 11 9 9.17 11 15
Not
estimated 12
Not
estimated
2 Wet Waste TPD 83 17 8 2.3 2.3 5.10 2.3 6.75 Not
initiated 2.3
Not
initiated
3 Dry Waste TPD 83 13 5 8.7 8.7 3.00 8.7 8.25 Not
initiated 8.8
Not
initiated
4 C&D Waste TPD 3 1 0 0.0167 0.0167 0.50 0.0167 0.75 Not
initiated 0.0177
Not
initiated

134
Waste Management Operations
Waste management (or waste disposal) includes the activities and actions required to manage waste
from its inception to its final disposal. This includes the collection, transport, treatment and disposal
of waste, together with monitoring and regulation of the waste management process and waste-related
laws.
As per Table 4.14, Composting for wet waste and Material Recovery Facility (MRF) for dry waste are
the commonly found processes with landfilling in the district. The ULBs have not started any
reclamation of any old dumpsites except in Alwar, Kherli.
No NGOs are involved in the solid waste management process in any of the ULBs and no linkage is
made with brand owners or waste generators. Few of the ULBs have initiated authorization and
issuance of identity cards to the waste pickers.
Table 4.14 Waste Management operations in Alwar District
S.No
. Parameters Units Urban Local Bodies
Alw
ar
Bh
iwa
di
Tija
ra
Kish
an
ga
rh
ba
s
Beh
ror
Th
an
aga
zi
Kh
erli
Ra
jga
rh
Kh
air
tha
l
Lax
ma
ng
arh
Ba
nsu
r
Ra
mg
arh
1
Door to
Door
Collection
% 100% 100%
100% 100% 100%
100%
100% 100% 100%
Not
initiate
d
100%
Not initiated
2
Mechanical
Road
Sweeping
% partial NO 0 NO NO
NO NO
Not
initiate
d
Not
initiate
d
NO Not
initiated
3 Manual
Sweeping % 100% 80% 100% 100%
100 %
100%
100% 100% 100% 100%
100%
4 Segregated
Waste
Transport
% partial 0.8 [not
initiated] 100%
100
% 100% 100%
Not initiate
d
Not initiate
d
100
%
Not
initiated
5
Digesters
(Bio-
methanation)
% of
WW 1
[not
initiated] nil nil
NIL
Not
initiate
d
Not
initiate
d
nil
6 Composting
operation
% of
WW
initiate
d 0.15
[not
initiated] 0 0
10% 0
Not
initiated
Not
initiated
0 Not
initiated
7
Reclamation of old
dumpsites
[initiated] / [not
initiated]
initiate
d
[not
initiated] 60%
not
initiated
0 not
initiated
8 MRF
Operation
[MRF
used] / [not
installed]
initiated
0.8 [not
initiated] 0 0 No 40% 0
Not
initiate
d
Not
installe
d
0 Not
initiated

135
9 Waste to energy (if
applicable)
[Required
] / [Nos.
Available]
initiate
d 0.8 NO 0 0
0%
0
No
SLF 0
No
SLF
10 Waste to
RDF
[Required] / [Nos.
Available]
initiate
d
[not
initiated] 60%
not
initiated 0
not
initiated
11
Linkage with Waste
to Energy
Boilers / Cement
Plants
[initiated] / [not
initiated]
Not initiate
d
initiated [not
initiated] Initiated
Initiate
d Initiated
Not
initiated
not
initiated
not
initiated
not
initiated
12
Linkage
with Recyclers
initiate
d [not
initiated] Not
initiated not
initiated not
initiated not
initiated
13
Authorizatio
n of waste
pickers
[initiated]
/ [not
initiated]
Not
initiate
d
initiated [not
initiated] Initiated
Initiated
Initiated Initiated Not
initiated not
initiated not
initiated not
initiated
14 Linkage
with TSDF /
CBMWTF
[initiated] / [not
initiated]
initiate
d
[not
initiated]
Not
initiated
not
initiated
not
initiated
not
initiated
15 Involvement
of NGOs
[initiated] / [not
initiated]
Not initiate
d
[not
initiated] Initiated
Initiate
d Initiated Initiated
Not
initiated
not
initiated
not
initiated
not
initiated
16
Linkage
with
Producers / Brand
Owners
[initiated]
/ [not initiated]
[not
initiated]
not
initiated
not
initiated
not
initiated
17 Authorization of Waste
Pickers
not
initiated
18 Issuance of ID Cards
[initiated]
/ [not
initiated]
not initiated
not initiated
[not initiated]
Not initiated
Not
initiate
d
0 Not
Initiated Not
initiated Not
initiated Not
initiated
Adequacy of Infrastructure
As per Table 4.15, Currently the ULBs have 174 waste collection trolleys, 23 mini-trucks and 21 bulk
waste trucks to collect and transport the solid waste generated. Except for Alwar city, no other ULB
has a transfer station and the collected waste is directly transported to the solid waste dumpsite. There
is no requirement for a transfer station in ULBs as the population is less than 50,000. No data related
to routes and fuel consumption of waste transporting vehicle has been provided.
Only Alwar ULB has Bio-methanation unit. Composting unit has been established in ULBs for
treatment of wet waste, however; Tijara, Kishangarh Bas, Laxmangarh and Ramgarh have no
composdting units.

136
Table 4.15 Report on efficacy of infrastructure
S.No. Parameters Units Urban Local Bodies
Alw
ar
Bh
iwa
di
Tija
ra
Kish
an
ga
rh b
as
Beh
ror
Th
an
ag
a
zi
Kh
erli
Ra
jga
rh
Kh
airth
a
l
La
xm
an
g
arh
Ba
nsu
r
Ra
mg
arh
1 Waste Collection
Trolleys
[Nos.
Required] /
[Nos.
Available]
2 50 0 2 2 0 60 2 50 1 5 1
2 Mini Collection
Trucks
[Nos.
Required] /
[Nos.
Available]
4
0 1 1
0 1 9 0 3 4
3 Segregated
Transport
[yes] /
[no] / [%
area
covered]
50 Yes 0 yes yes 0 0.8 Yes No No Yes/3/
100% No
4 GPS enabled
vehicles
[Yes] /
[No]
5
No of
compartmentalized
vehicles
Nos
6
No of non-
compartmentalized
vehicles
Nos
7 Bulk Waste
Trucks
[Nos.
Required]
/ [Nos.
Available]
21
0 no no
no 0 no 0 no
8 Waste Transfer
points
[Nos.
Required]
/ [Nos.
Available]
/[Not
available]
1
0 no no
no 0 no no no
9 Bio-methanation
units
[Nos.
Required]
/ [Nos.
Available]
1
0
0
0
10 Composting units
[Nos.
Required]
/ [Nos.
Available]
2 2 0 NO 1
1 1 1 0 1/0 0
Material Recovery Facilities
Table 4.16 provides the details of material recovery facilities in various ULBs.

137
Table 4.16 Report on Material Recovery Facility
S.No
. Parameters Units Urban Local Bodies
Alw
ar
Bh
iwa
di
Tija
ra
Kish
an
ga
r
h b
as
Beh
ror
Th
an
aga
zi
Kh
erli
Ra
jga
rh
Kh
airth
al
La
xm
an
ga
r
h
Ba
nsu
r
Ra
mga
rh
1
Material
Recovery
Facility
installed Installed 0 Installed Installed
Instal
led 0
not
availa
ble
not
availa
ble
not
availa
ble
2
Waste to
energy (if
applicable
)
[Required
] / [Nos.
Available]
NIL
0
0
0
-
3 Waste to
RDF
[Required
] / [Nos.
Available]
1
0
0
0
-
Adequacy of Financial Status of ULB
Table 4.17 shows the Capital cost and operation and maintenance cost that is being required by the
respective ULBs.
Table 4.17 Report on financial adequacy of ULB
S.No. Parameters Units Urban Local Bodies
Alw
ar
Bh
iwa
di
Tija
ra
Kish
an
ga
rh
ba
s
Beh
ror
Th
an
ag
azi
Kh
erli
Ra
jga
rh
Kh
airth
al
La
xm
an
ga
r
h
Ba
nsu
r
Ra
mg
arh
1 CAPEX
Required
Crore per
annum
2 OPEX
[INR per
Year] / [%
of
requirement]
3 Adequacy
of OPEX [Yes] / [No]
YES
YES
Notification and Implementation of By-Laws
The by-laws have provisions, which if implemented properly, should lead to transformational
changes. The by-laws emphasise the generator’s responsibility to segregate solid waste at source. All
ULBs have initiated the implementation of by-laws except Nagarpalika Tijara, Thanagazi, Khairthal,
Laxmangarh and Ramgarh.

138
Table 4.18 Report on Notification and Implementation of by-laws
S.
No
.
Parameter
s Units Urban Local Bodies
Alw
ar
Bh
iwa
di
Tija
ra
Kish
an
ga
rh
ba
s
Beh
ror
Th
an
ag
azi
Kh
erli
Ra
jga
rh
Kh
airth
al
La
xm
an
ga
rh
Ba
nsu
r
Ra
mg
arh
1
Notificatio
n of By-
laws
[done] /
[in
progress
] / [not
initiated
]
Done Done
Done Done
Not
to
be
fille
d
Done Done
Not
to
be
fille
d
not
initi
ated
done not
initiated
2
Implement
ation of
by-laws
[done] /
[in
progress
] / [not
initiated
]
Done Done
Done Done
Done Done
not
initi
ated
done not
initiated
Inferences for present scenario
The following pie charts shows the population and waste generation distribution for all ULBs of
Alwar district.
Figure 4.26 Population Distribution for all ULBs of Alwar District
Total waste generation for Alwar district is 258 TPD of 0f which morethan 50% waste is generated by
the Alwar ULB. Out of total 12 ULBs only Laxmangarh and Bansur have not estimated their waste
generation per day.
47%
14% 3%
3%
4%
5%
2%
4%
5%
4% 4% 5%
TOTAL POPULATION:7,28,934
Alwar
Bhiwadi
Tijara
Kishangarh bas
Behror
Thanagazi
Kherli
Rajgarh
Khairthal

139
Figure 4.27 Waste Generation for 10 ULBs in Alwar District
Total dry waste generated from 10 ULBs is 160 TPD, which is more than the wet waste (127 TPD).
Figure 4.28 Dry Waste Generation for 10 ULBs of Alwar District
52%
19%
5%
4%
4% 4%
4% 3% 3% 2%
TOTAL WASTE:258 TPD
Alwar
Bhiwadi
Khairthal
Bansur
Tijara
Kishangarh bas
Behror
Rajgarh
Kherli
Not Estimated for Laxmangarh&Bansur ULBs
52%
10%
7%
6%
6%
5%
5%
4% 3% 2%
DRY WASTE: 160 TPD
Alwar
Bhiwadi
Bansur
Kishangarh bas
Behror
Rajgarh
Tijara
Khairthal
Kherli
Thanagazi
Not Estimated for Laxmangarh&Bansur ULBs

140
Figure 4.29 Wet Waste Generation for 10 ULBs of Alwar District
This section presents the inferences compiled from the data provided by the ULBs in Alwar district.
The total solid waste generation in the district currently stands at 258 TPD in which Alwar city
contributes around 166 TPD, which is 52% of total waste. The solid waste generated in the ULBs
comes in the form of dry waste, wet waste, construction and demolition waste, waste coming through
street sweeping and drain slits, hazardous waste and sanitary waste. Waste collected from different
ULBs also have fraction of other waste i.e C&D waste, domestic hazarodous waste. Quantity of C&D
waste segreagated from this waste is 9.3 TPD. The district has 110 bulk waste generators, which are
75 in Alwar and 30 in Bhiwadi ULB.
All the ULBs have made provisions for the 100 percent door to door collection of solid waste in their
administrative boundaries except newly established Laxmangarh and Bansur ULBs. Rajgarh has yet
not achieved 100 percent sweeping in the administrative boundaries. Only five ULBs, Kherli,
Rajgarh, Kishangarh bas, Behror have been able to achieve 100% waste segregation done at source,
whereas rest of the ULBs have not initiated segregation yet.
Litter bins are installed at vulnerable garbage point for waste collection. These garbage bins have twin
compartment for collection of segregated waste. Currently the ULBs have 174 waste collection
trolleys, 23 mini-trucks and 21 bulk waste trucks to collect and transport the solid waste generated.
52%
10%
7%
6%
6%
5%
5%
4% 3% 2%
WET WASTE:127 TPD
Alwar
Bhiwadi
Bansur
Kishangarh bas
Behror
Rajgarh
Tijara
Khairthal
Kherli
Thanagazi
Not Estimated for Laxmangarh&Bansur ULBs

141
Waste Processing and Disposal
The processing of solid waste collected is important for resource recovery from the waste. There are a
number of options for resource recovery e.g., composting, vermi-composting, anaerobic digestion and
incineration. A number of advanced treatment methods are also available e.g., hydrothermal
carbonization. These methods are yet to be employed extensively in the field.
Composting for wet waste and Material Recovery Facility (MRF) for dry waste are the commonly
found processes with landfilling in the district. Bio-methanation process is only established in Alwar
ULB.
Figure 4.30 Large Quantity of Legacy Waste at Closed Dump Site, Alwar ULB

142
Figure 4.31 Google Earth View of Closed Dump Site, Alwar (Coordinates- 27°32'36.9"N 76°41'34.8"E)

143
Figure 4.32 Waste Dumped near Road Side in
Bhiwadi ULB
Figure 4.33 Animal at Waste dumped near Road
Side
Figure 4.34 Waste bin at market area in Thanagazi
ULB
Figure 4.35 Waste Dump site Thanagazi ULB
Figure 4.36 Twin Bin Tipper for Segregated Waste
Collection in Ramgah ULB
Figure 4.37 Choked unlined Drainage due to Waste
Dump in Ramgarh ULB

144
Figure 4.38 Waste dumped Near Residential Area,
Ramgarh ULB
Figure 4.39 Sewage near Road due to Lack of
Drainage
Figure 4.40 Tipper in Waste Collection Operation,
Ramgarh ULB
Figure 4.41 ULB Wastewater Dump Site in Ramgarh
ULB
Figure 4.42 Dedicated Staff of Ramgarh ULB
Figure 4.43 Municipal waste Dumped near Waste
water Drain, Laxmangarh ULB

145
Figure 4.44 MSW with plastic Waste Dumped Near
Road Side, Laxmangarh ULB
Figure 4.45 Wastewater near Residential Vicinity in
Laxamangarh ULB
Figure 4.46 Dump Site, Laxmangarh ULB
Figure 4.47 Plastic Waste at Dump Site,
Laxmangarh ULB
Figure 4.48 Tipper for Waste collection at Tijara
ULB
Figure 4.49 Large Quantity of Legacy Waste on
Dump site at Tijara ULB

146
Figure 4.50 Waste Collection Tipper Vehicle at
Kishangarh Bas ULB
Figure 4.51 Common Dump site for Kishangarh Bas
and Khairthal ULBs
Figure 4.52 Tyre Recycling Facility near Rajgarh
ULB
Figure 4.53 Waste Collection Vehicle at Rajgarh
ULB
Figure 4.54 Legacy Waste Tratment Facility at Rajgarh ULB Dump Site
Alwar, Bhiwadi, Behror, Kherli, Rajgarh, Khairthal ULB have a composting facility for treating the
wet waste. All ULBs in Alwar district have municipal solid waste dumping sites which currently store
lacs of tones of legacy waste. All the ULBs had not started segregating the legacy waste and have

147
been trying to recover useful fractions. Only Rangarh ULBs has established a facility for legacy waste
treatment, which was seen during the site visit.
Figure 4.55 Mechanical Segregator at Alwar ULB (27°30'56.8"N 76°45'08.6"E)
Fig. A- Legacy Waste Fig. B-Waste Pickers at Dump Site
Figure 4.56 Closed Dump site with Large Volume of Legacy Waste at Alwar ULB

148
Figure 4.57 Manuual MRF Facility at Alwar ULB
Figure 4.58 Google Earth view of Waste Dump Site Thanagazi (27°23'25.4"N 76°19'17.9"E)

149
Figure 4.59 Google Earth view of Waste Dump Site Tijara (Co-ordinates 27°56'09.7"N 76°51'51.3"E )
Figure 4.60 Google Earth view of Waste Dump in Open, Ramgarh ULB (27°34'59.0"N 76°48'47.4"E)

150
Figure 4.61 Waste Dump Site, Khairthal and Kishangarh Bas ULB (Coordinate 27°48'32.8"N
76°37'33.9"E)
4.2.2 Action Plan for Municipal Solid Waste Management
Collection and Transportation
Collection of segregated solid waste from individual households and establishments is accomplished
through the use of containerized pushcarts, tricycles or small mechanized vehicles, compartmentalized
vehicles, or tipping vehicles depending on the terrain of the locality, width of streets, and building
density.
Considering the method of collection, 10 out of 12 ULBs are having 100 % door-to-door collection. A
slight improvement of including the houses/commercial establishments present on the fringes of a
ULB may be made by all the ULBs.
The most important aspect of collection is the availability of source-segregated waste for subsequent
transportation, processing and disposal. Only five ULBs, Kherli, Rajgarh, Kishangarh bas, Behror
have 100% waste segregation done at source, whereas Alwar has partial segregation yet. For ensuring
the availability of source-segregated waste from the households, commercial establishments and
institutions, a robust awareness program must be initiated in all the ULBs. The awareness program
may be more fruitful if conducted in primary schools. The experts from diverse disciplines ranging
from science and engineering to humanities should be consulted to plan the awareness program. The
awareness program may also be combined with other missions of the state/central government e.g.,
Swachh Bharat Abhiyan, Unnat Bharat Abhiyan etc.

151
Collection frequency of the waste should be decided depending on the degradation/nuisance potential
of the waste stream. For the purpose of this report, following streams may be considered for the
household waste: dry waste (paper, plastic, metal, textile, rubber), wet waste (kitchen/food waste,
garden/yard waste), sanitary waste (baby diapers, sanitary napkins etc), domestic hazardous waste
(batteries, insecticide bottles/containers, electronic waste). While dry waste and domestic hazardous
waste may be easily stored without creating any nuisance, wet waste and sanitary waste must be
collected daily. Following the philosophy, dry waste and domestic hazardous waste can be arranged to
be collected on a weekly basis. Although waste collection centres are generally the norm for domestic
hazardous waste but collecting and transporting it separately may result into better management of
domestic hazardous waste. After collection, it is of utmost importance to transport the segregated
waste separately either using separable vehicle (which may be too costly) or using compartmentalized
vehcles.
In terms of technological improvement, ULBs may be encouraged to introduce ICT and IoT based
monitoring of Door-to-Door waste collection. This should be implemented in all the ULBs for
ensuring 100% waste collection and better efficiency in operations. The user charges may be levied
on the end-user using smart home cards. The smart card can also be used to update waste collection
status of all users. No ULB have already initiated implementing this technology. Similarly, the
compactor bins may also be geo-tagged and installed with smart card for monitoring of bin lifting
process.
Transfer stations are the intermediate stops between the point of collection and the
processing/disposal facilities in a city. The establishment of intermediate transfer stations is
determined by the distance between secondary waste collection points and the final treatment and
disposal point. If the distance from the city jurisdiction to the final treatment and disposal points
exceeds 15 km, transfer stations may be established or as per availability and requirement of land
(GOR, 2019). Yet another measure may be utilizing the biofuel powered vehicles for collection
purposes.
Environmental pollution is a big concern today. To address the environmental pollution, it is
important to evaluate the composition of our waste streams intensively. Other stakeholders e.g.,
higher education institutions and research institutes should be asked to participate in these exercises
requiring advanced equipment and expertise. Some of the contaminants that should be regularly tested
are heavy metals, pesticides and insecticides.
Last, but not the least, aspect is to maintain the records. The records should be maintained for
collection and at processing/disposal facilities. At collection level, the records may start with the
vehicle number and number of trips made for the collection for each day.

152
Processing and Disposal
For Indian conditions with cheap labour, manual segregation of recyclable fractions into different
components like paper, plastic etc. may be more suited. Waste Transfer point should be established
for all ULBs. Currently only for Alwar ULB waste transfer points are marked.
The adoption of processing technologies largely depends upon the quantity and characteristics of the
waste generated. It is essential to quantify and characterize the waste generated in the local body
before adopting any processing and treatment technology. Ragpicker may be employed for separating
the recyclables into different categories. So, the processing should concentrate on recyclables first for
processing (up to 50% in first 3 years). On the other hand, a smaller fraction of 25% of wet waste
should be used for composting for the next 3 years. In the subsequent three years, the amount of
recyclables and wet waste being processed, can be doubled.
The informal sector, comprising of kabadi system and waste pickers, plays an important role in the
SWM value chain by recovering valuable material from waste. Home composting presents some
potential environmental benefits such as the avoidance of collection, transportation and management
of biowaste.
Decentralised composting (bin and box composting), composting machines; and Vermicomposting
should be practiced where small quantity of wet waste is generated. All ULBs of Alwar district have a
large amount of legacy waste at old dump site. Reclamation work of this waste should be initiated.
The treatment and disposal of Legacy waste can be done by the process of Bioremediation and Bio-
mining. Before starting the process of Bio-remediation and Bio-mining, a survey or mapping of the
site must be done. The ULBs have a tendency of using fine fraction for land application. This should
be practiced with caution as the old legacy waste may have harmful constituents owing to disposal of
mixed waste together on dump sites. For provision of sanitary landfill, a cluster of ULBs may be
formed and suitable piece of land may be allotted for the waste disposal from cluster. To avoid the
mismanagement of cluster landfill, a separate entity may run the landfill independent of ULBs.
Regular monitoring and data collection are essential for designing an efficient SWM framework
system. Research institute should be involved for providing scientific creativity.

153
Table 4.19 ULB wise action plan for Alwar district
ULBs
action
area
Alwar, Bhiwadi, Tijara, Kishangarh bas, Behror,
Thanagazi, Kherli, Rajgarh, Khairthal,
Laxmangarh, Bansur, Ramgarh
Collection ● Source- segregation of the waste
● Awareness programs for the general public especially
at the school level and institution levels (e.g., all bulk
waste generators may be first directed to segregate
their waste)
● Collection frequency of the waste as per waste type
e.g. daily collection of wet waste and sanitary waste;
weekly collection of dry waste and domestic
hazardous waste
● Inclusion of the houses/commercial establishments
present on the fringes of a ULB in waste collection
program
● Introduction ICT and IoT based monitoring of Door-
to-Door waste collection, ensuring 100% waste
collection and better efficiency in operations
Using electrical or biofuel-powered vehicles for
collection
● Source- segregation of the waste
● Awareness programs for the general public
especially at the school level and institution levels
(e.g., all bulk waste generators may be first directed
to segregate their waste)
● Collection frequency of the waste as per waste type
e.g. daily collection of wet waste and sanitary waste;
weekly collection of dry waste and domestic
hazardous waste
● Inclusion of the houses/commercial establishments
present on the
● fringes of a ULB in waste collection program.
● Using electrical or biofuel-powered vehicles for
collection
● Inclusion of the houses/commercial establishments
present on the
Processing ● Mechanised MRF with the full capacity of 50
tons/day for dry waste
● Inclusion of rag-pickers in MRF operations
● Mechanised composting plant of 70 tons/day for wet
waste
● Sanitary waste to be disposed of on daily basis by an
incinerator;
● Integrated domestic hazardous waste management
centre in Alwar for recovering recyclables from
domestic hazardous waste and final disposal into a
hazardous waste landfill
● Regular testing of heavy metals, pesticides and
insecticides in waste collected, compost and RDF
produced
Regular Monitoting and Compilation of Data
● Mechanised/manual MRF for dry waste
● Inclusion of rag-pickers in MRF operations
● Mechanised composting for wet waste
● ULB to start a local collection and storage facility
centre for domestic hazardous waste
● Regular Monitoting and Compilation of Data
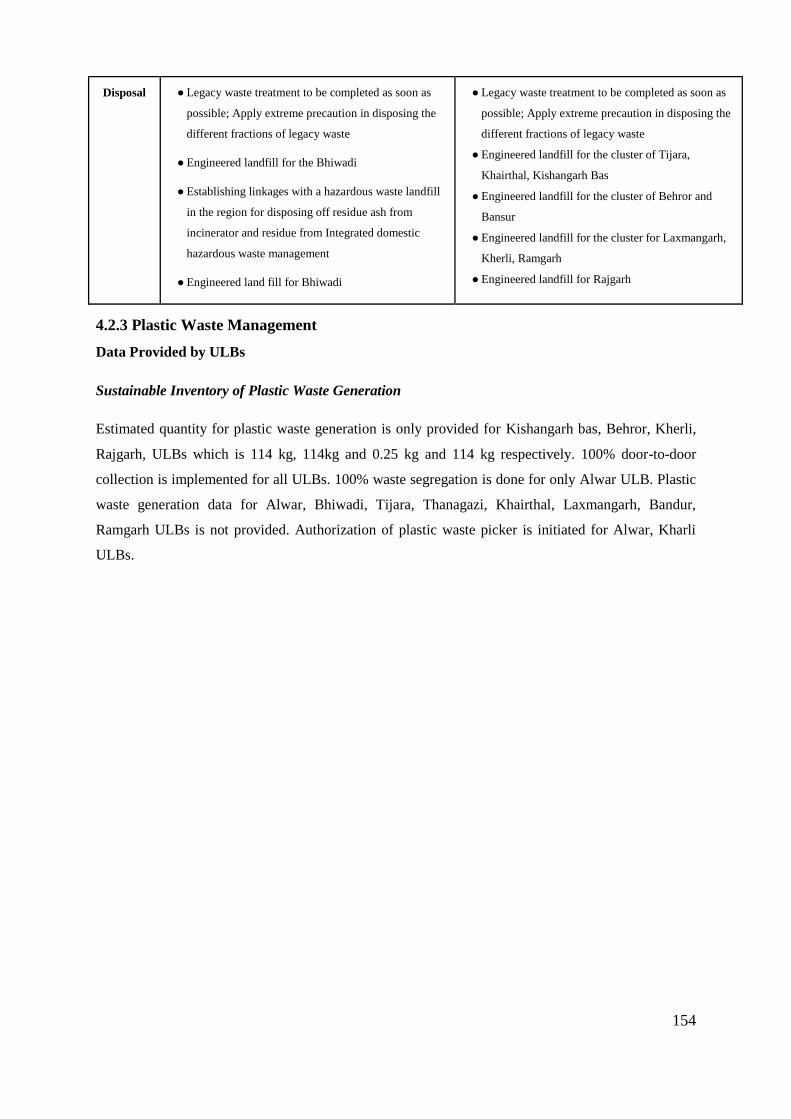
154
Disposal ● Legacy waste treatment to be completed as soon as
possible; Apply extreme precaution in disposing the
different fractions of legacy waste
● Engineered landfill for the Bhiwadi
● Establishing linkages with a hazardous waste landfill
in the region for disposing off residue ash from
incinerator and residue from Integrated domestic
hazardous waste management
● Engineered land fill for Bhiwadi
● Legacy waste treatment to be completed as soon as
possible; Apply extreme precaution in disposing the
different fractions of legacy waste
● Engineered landfill for the cluster of Tijara,
Khairthal, Kishangarh Bas
● Engineered landfill for the cluster of Behror and
Bansur
● Engineered landfill for the cluster for Laxmangarh,
Kherli, Ramgarh
● Engineered landfill for Rajgarh
4.2.3 Plastic Waste Management
Data Provided by ULBs
Sustainable Inventory of Plastic Waste Generation
Estimated quantity for plastic waste generation is only provided for Kishangarh bas, Behror, Kherli,
Rajgarh, ULBs which is 114 kg, 114kg and 0.25 kg and 114 kg respectively. 100% door-to-door
collection is implemented for all ULBs. 100% waste segregation is done for only Alwar ULB. Plastic
waste generation data for Alwar, Bhiwadi, Tijara, Thanagazi, Khairthal, Laxmangarh, Bandur,
Ramgarh ULBs is not provided. Authorization of plastic waste picker is initiated for Alwar, Kharli
ULBs.

155
Table 4.20 Report on Inventory of Plastic Waste Generation
Sl.
No
.
Parameters
Urban Local Bodies
Bh
iwa
di
Tija
ra
Kish
an
ga
rh
ba
s
Beh
ror
Th
an
aga
zi
Kh
erli
Ra
jga
rh
Kh
air
tha
l
Lax
ma
ng
arh
Ba
nsu
r
Ra
mg
arh
A
Inventory
1
Estimated Quantity of
plastic waste
generated in
District
(TPD)
114 kg
114
kg 0.25 114 kg
Not
Estima
ted
B Implementation of collection
1
Door to
Door collection
(%)
100% 100% 100% 100 %
100 % 100%
not initiated
100 % not
initiated
2
Segregated Waste
collection
(%)
partia
l partial 0 100 %
100
% 80 % 100%
not
initiated 100 %
not
initiated
3
Plastic waste collection at
Material Recovery
Facility
MRF
used
MRF
used
Not
installed
not
installed
100
%
MRF
Used
not
installed
not
installed
not
installed
not
installed
4
Authorizatio
n of PW pickers
(Nos.)
initiate
d not
initiated
not
instal
led
Initiated
not initiated
not initiated
not
initiate
d
not initiated
5
PW
collection Centres
(Nos.)
1
not
establishe
d
not
initiat
ed
Established
not
establish
ed
not
establishe
d
not
establis
hed
not
establishe
d
Establishment of Linkage with Stakeholders and Availability of Facilities for Recycling or
Utilization of Plastic Waste
The concept of PRO is recognized in plastic waste management primary burden on the producer for
collection of waste plastic products. They need to establish a system for collecting back the waste
generated due to their products. Linkages with PROs (Producer Responsibility Organization) of
produces and NGOs are not established for ULBs. Plastic waste recycler is only assigned for Bhiwadi
ULBs. No plant for Plastic pyrolysis is established in Alwar district. Co-processing of plastic waste in
cement kiln is only done in Bhiwadi, Rajgarh, Kherli, Behror ULBs.

156
Table 4.21 Report on linkage with stakeholders & Availability of facilities for recycling/utilization of PW
Sl.
No. Parameters Urban Local Bodies
Bh
iwa
di
Tija
ra
Kish
an
ga
rh
ba
s
Beh
ror
Th
an
aga
zi
Kh
erli
Ra
jga
rh
Kh
airth
al
La
xm
an
ga
rh
Ba
nsu
r
Ra
mga
rh
C Establishment of linkage with Stakeholders
1
Established
linkage with
PROs of
Producers
1
not
establish
ed
0
not
establi
shed
not
establis
hed
not
establis
hed
not
establish
ed
2
Established
linkage with
NGOs
2
not
established
not
establish
ed
1
not
establi
shed
not
establis
hed
not
establis
hed
not
establish
ed
D Availability of Facilities for Recycling or Utilization of Plastic Waste
1 No. of PW
recyclers
(Nos.)
1
not
established 0
0 0
0 0 0
2 No
Manufacturers
(Nos.)
1
0
0 0
0 0 0
3 No of
pyrolysis oil
plants (Nos.)
0 0
0
0 0 0
4
Plastic
pyrolysis
(Nos.)
0.5
0 0
0 0
0 0 0
5 Use in road
making (Nos.) 0 0
0
0 0 0
6 Co-processing
in Cement
Kiln (TPD)
0.5
0 0.5
0.30 0.5
0 0 0
Implementation of PW Management Rules, 2016 and Implementation of Extended Producers
Responsibility (EPR) Through –Producers/Brand-Owner
The Central Government, in its 2016 Plastic Waste Management Rules, had banned the manufacture
and usage of single-use plastic that is thinner than 50 microns. Action on Sealing of units producing <
50-micron plastic is partially done in Alwar district. EPR puts the financial and/or physical onus on
manufacturers--meaning plastic producers, importers and brand-owners--for the treatment, recycling,
reuse or disposal of products after a consumer has used and disposed of them. No action is taken for
implementation of Extended Producers Responsibility in Alwar district.

157
Table 4.22 Report on Implementation of PW management rules, 2016 and Implementation of ERP
Sl.
No
. Parameters
Urban Local Bodies
Alw
ar
Bh
iwa
di
Tija
ra
Kish
an
ga
rh
ba
s
Beh
ror
Th
an
aga
zi
Kh
erli
Ra
jga
rh
Kh
air
tha
l
Lax
ma
ng
arh
Ba
nsu
r
Ra
mg
arh
E Implementation of PW Management Rules, 2016
1
Sealing of units
producing <
50-micron plastic
Partial
Partial Partial
Partially
sealed
Partially
sealed
no
action
no
action
2
Prohibiting
sale of carry
bags < 50 micron
Prohibited
Prohibited
Partially
sealed Prohibited Prohibited
no
action no action
no
action
3
Ban on
Carry bags
and other single use
plastics as
notified by State
Government
Implemente
d Partial Prohibited
Impleme
nted Implemented
Partia
l
Implemente
d
Partia
l
F Implementation of Extended Producers Responsibility (EPR) through Producers / Brand-owners
1
No of
Producers
associated with ULBs
(Nos.)
0
2
Financial
support by Producers /
Brand
owners to ULBs
3
Amount of
PRO Support
(INR)
4
Infrastructur
e support by
Producers /
Brand
owners to ULBs
5
No of
collection centres
established
by Producers /
Brand
owners to ULBs(Nos.)

158
Inferences from Present Scenario
Estimated quantity of plastic waste generated is not estimated in Alwar Nagarparishad, Bhiwadi,
Tijara, Kishangarh Bas, Laxmangarh, Bansur, Ramgarh.
Door to door waste collection system has not been implemented Tanagazi, Behror, Laxmangarh,
Ramgarh within all the ULBs. Segregated waste collection is done partial in Alwar Nagarparishad,
Bhiwadi, Kherli ULB whereas, in Tijara, Thanagazi, Khairthal, Lxmangarh, Ramgarh Nagarpalika
ULB it is not implemented.
Authorization of initiated PW pickers in Bhiwadi, Kherli. Further one plastic waste collection centres
are established in Alwar ULBs. Plastic waste collection centers have not been established other ULBs
Establishment of linkages with stakeholders (PROs and NGOs) has been established in only Bhiwadi
ULBs. There are no Manufacturers and Pyrolysis oil plants present in any of the ULBs. Nowhere
plastic waste is used for construction roads whereas, co-processing in cement kiln is carried out in
Bhiwadi, Behror, Kherli, Rajgarh ULBs.
Enforcements have been carried out in some of the ULBs as per the Plastic Waste Management Rules
2016. Sealing of units producing < 50-micron plastic has been partially implemented in all ULBs
except Laxmangarh and Ramgarh. Prohibition of sale of carry bags <50 micron is completely
implemented in some ULBs. Further, ban on carry bags and other single use plastics as notified by
State Government has been implemented within Alwar, Bhiwadi, Tijara ULBs. There is partial
implementation in Kishangarh Bas, Ramgarh, Laxmangarh.
None of the Extended Producers Responsibility (EPR) through Producers/Brand-Owners has been
implemented in any of the ULBs.
4.2.4 Action Area for Plastic Waste Management
For Alwar district, the action plan for plastic waste management includes activities door-to-door
plastic waste collection and plastic waste segregation at source, immediate actions like ban on carry
bags and other single use plastics as notified by State Government and ensuring no open burning and
littering. It also incorporates the management by waste generator through EPR and PRO to be
implemented in all the ULBs of Alwar District and future implementations to be done such as
utilization of non-recyclable plastic waste (road construction, waste to fuel, waste to energy,
alternative uses identification etc.

159
Table 4.23 Action Plan for Plastic Waste Management
Sl.
No.
Action Area Timeline Department/ Agencies
1 Door to Door plastic waste
collection
Regular
activity
Nagr Parihad- Alwar, Bhiwadi Nagar Palika-
Tijara, Kishangarh bas, Behror, Thanagazi,
Kherli, Rajgarh, Khairthal, Laxmangarh,
Bansur, Ramgarh
2 Plastic waste segregation at
Source.
Regular
activity
Nagr Parihad- Alwar, Bhiwadi Nagar Palika-
Tijara, Kishangarh bas, Behror, Thanagazi,
Kherli, Rajgarh, Khairthal, Laxmangarh,
Bansur, Ramgarh
3 Management by waste
generator through EPR and
PRO
Implement
in all ULBs
Nagr Parihad- Alwar, Bhiwadi Nagar Palika-
Tijara, Kishangarh bas, Behror, Thanagazi,
Kherli, Rajgarh, Khairthal, Laxmangarh,
Bansur, Ramgarh
4 Utilization of Non-recyclable
plastic waste (Road
Construction, Waste to Fuel,
Waste to energy, alternative
uses identification etc.
Implemented
in future
Nagr Parihad- Alwar, Bhiwadi Nagar Palika-
Tijara, Kishangarh bas, Behror, Thanagazi,
Kherli, Rajgarh, Khairthal, Laxmangarh,
Bansur, Ramgarh
5 Ban on Carry bags and other
single use plastics as notified
by State Government.
Immediate
Nagr Parihad- Alwar, Bhiwadi Nagar Palika-
Tijara, Kishangarh bas, Behror, Thanagazi,
Kherli, Rajgarh, Khairthal, Laxmangarh,
Bansur, Ramgarh
6 Ensuring no open burning
and littering.
Immediate Nagr Parihad- Alwar, Bhiwadi Nagar Palika-
Tijara, Kishangarh bas, Behror, Thanagazi,
Kherli, Rajgarh, Khairthal, Laxmangarh,
Bansur, Ramgarh

160
4.2.5 Construction and Demolition Waste Management
Data provided by ULBs
Inventory of C&D Waste
Table 4.24 presents the total quantity of C&D waste generated/ collected, amount of C&D collected
and dump in each ULBs. At present total C&D waste generated in Alwar district is 1250 kg/day.
Generated quantity for is estimated for Khaerli, Khairthal.
Table 4.24 Inventory of C&D waste
Name of
ULB
[name of
ULB]
Alw
ar
Bh
iwa
di
Tija
ra
Kish
an
ga
r
h b
as
Beh
ror
Th
an
aga
zi
Kh
erli
Ra
jga
rh
Kh
airth
al
La
xm
an
ga
r
h
Ba
nsu
r
Ra
mga
rh
Population
[Nos as
per 2011
census]
341422 104921 24734 20814 29531
17634 26631 38298 26103 27354 33194
Inventory of C&D waste generation
Estimated
Quantity
[Kg/Day]
/ [Not
estimated
]
N.E. N.E. 0
Not
estim
ate
Not
estim
ate
500
Not
estimat
e
750
Not
estimat
e
Not
estimat
e
Not
estimate
Implement scheme for permitting bulk waste and C&D Waste deposition center
Table 4.25 presents the information about scheme for bulk waste generator and C&D waste deposition
center. All ULB provided the data about the implementing scheme for permitting bulk waste except
Tijara, Thanagazi, Laxmangarh, and Ramgarh ULBs. Only Tijara, Thanagazi, Laxmangarh, Bandur,
Ramgarh ULBs have no establishment of C&D waste deposition Centre’s.

161
Table 4.25 Scheme for bulk waste generator and C&D waste deposition center
Name of ULB [name of ULB]
Alw
ar
Bh
iwa
di
Tija
ra
Kish
an
ga
rh
ba
s
Beh
ror
Th
an
aga
zi
Kh
erli
Ra
jga
rh
Kh
air
tha
l
Lax
ma
ng
arh
Ba
nsu
r
Ra
mg
arh
Population
[Nos as
per 2011
census]
341422 104921 24734 20814 295
31 17634 26631 38298 26103 27354 33194
Implement scheme for permitting bulk waste generators
Issuance of
Permissions
by ULBs
[Initiated
] / [Not
initiated]
initiated initiated Not initiated
Initiated Initiated
Initiated Initiated Initiated Not initiated
Not initiated
Not initiated
Establishment of C&D Waste Deposition centers
Establishment
of Deposition
Points
[Yes] / [No]
Yes Yes No Yes Yes
Yes Yes Yes No No No
C&D Deposition
point
identified
[Yes] /
[No] Yes Yes No Yes Yes
Yes Yes Yes No No No
Implementation of By-Laws for C&D Waste Management and C&D Waste recycling plant
Table 4.26 By-laws and recycling plant for C&D waste presents the data about the Implementation of
By-Laws for CD Waste Management and C&D Waste recycling plant. Alwar, Bhiwadi, Kishangarh
Bas, Behror, Kherli, Rjgarh, Bnasur ULBs have provided the data about implementation of By-Laws
and the collection of deposition/disposal charges. Establishment CD Waste Recycling Plant is done
done in all ULBs
Table 4.26 By-laws and recycling plant for C&D waste
Name of ULB [name of
ULB]
Alw
ar
Bh
iwa
di
Tija
ra
Kish
an
ga
rh
ba
s
Beh
ror
Th
an
aga
zi
Kh
erli
Ra
jga
rh
Kh
air
tha
l
Lax
ma
ng
arh
Ba
nsu
r
Ra
mg
arh
Population
[Nos as per
2011
census] 341422 104921 24734 20814 29531
17634 26631 38298 26103 27354 33194
Implementation of By-Laws for CD Waste Management
Implementation
of By-laws
[notified] /
[not notified]
notified notified [not
notified] Notified Notified
Notified Notified Notified not
notified notified
not
notified
Collection of
Deposition /
disposal Charges
[Initiated] / [Not
initiated]
initiated notified [not
notified] Initiated Initiated
Initiated Initiated Notified not
notified
Not
initiated
not
notified
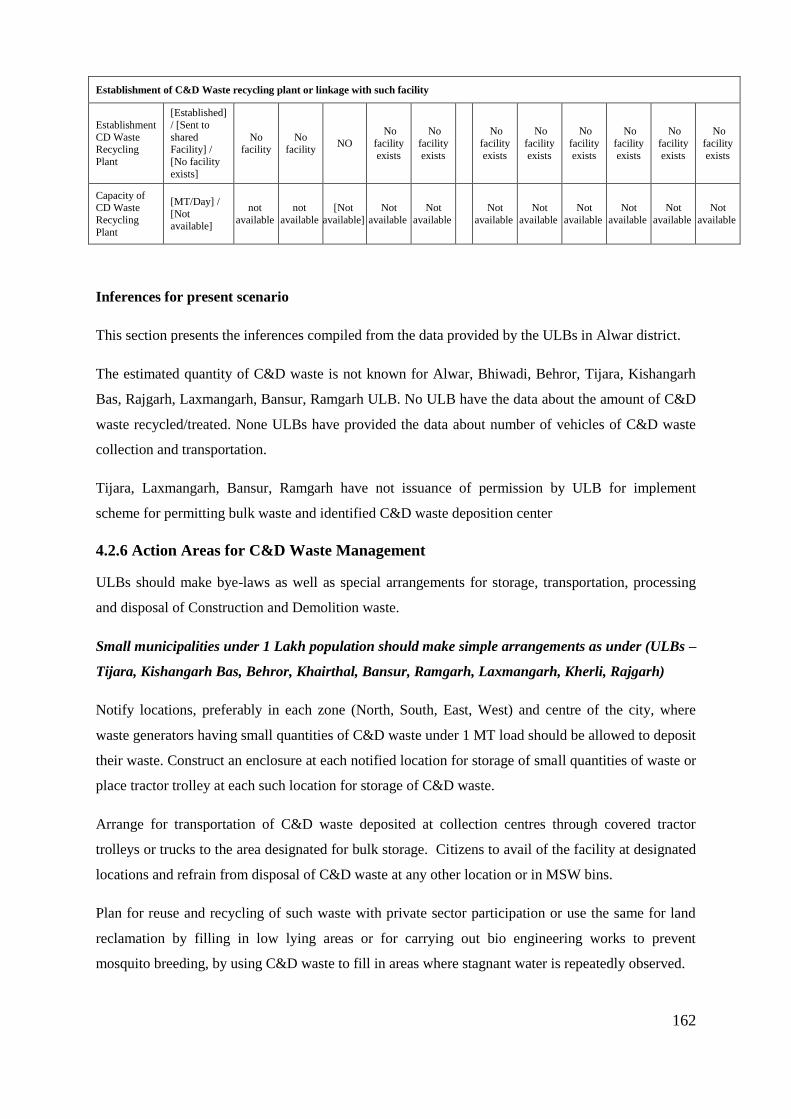
162
Establishment of C&D Waste recycling plant or linkage with such facility
Establishment
CD Waste Recycling
Plant
[Established]
/ [Sent to
shared Facility] /
[No facility
exists]
No facility
No facility
NO
No
facility
exists
No
facility
exists
No
facility
exists
No
facility
exists
No
facility
exists
No
facility
exists
No
facility
exists
No
facility
exists
Capacity of CD Waste
Recycling
Plant
[MT/Day] /
[Not available]
not
available
not
available
[Not
available]
Not
available
Not
available
Not
available
Not
available
Not
available
Not
available
Not
available
Not
available
Inferences for present scenario
This section presents the inferences compiled from the data provided by the ULBs in Alwar district.
The estimated quantity of C&D waste is not known for Alwar, Bhiwadi, Behror, Tijara, Kishangarh
Bas, Rajgarh, Laxmangarh, Bansur, Ramgarh ULB. No ULB have the data about the amount of C&D
waste recycled/treated. None ULBs have provided the data about number of vehicles of C&D waste
collection and transportation.
Tijara, Laxmangarh, Bansur, Ramgarh have not issuance of permission by ULB for implement
scheme for permitting bulk waste and identified C&D waste deposition center
4.2.6 Action Areas for C&D Waste Management
ULBs should make bye-laws as well as special arrangements for storage, transportation, processing
and disposal of Construction and Demolition waste.
Small municipalities under 1 Lakh population should make simple arrangements as under (ULBs –
Tijara, Kishangarh Bas, Behror, Khairthal, Bansur, Ramgarh, Laxmangarh, Kherli, Rajgarh)
Notify locations, preferably in each zone (North, South, East, West) and centre of the city, where
waste generators having small quantities of C&D waste under 1 MT load should be allowed to deposit
their waste. Construct an enclosure at each notified location for storage of small quantities of waste or
place tractor trolley at each such location for storage of C&D waste.
Arrange for transportation of C&D waste deposited at collection centres through covered tractor
trolleys or trucks to the area designated for bulk storage. Citizens to avail of the facility at designated
locations and refrain from disposal of C&D waste at any other location or in MSW bins.
Plan for reuse and recycling of such waste with private sector participation or use the same for land
reclamation by filling in low lying areas or for carrying out bio engineering works to prevent
mosquito breeding, by using C&D waste to fill in areas where stagnant water is repeatedly observed.

163
In cities above 1 Lakh population, the municipality should make elaborate arrangements as under
(Alwar and Bhiwadi):
Notify suitable locations in different parts of the city where waste generators having small quantities
of C&D waste under 1MT load can deposit their waste conveniently. Create a system of renting skips
or containers for storage of C&D waste at source departmentally or through an authorised private
operator, where the generation of such waste is greater than 1 MT.
Prescribed rates for collection and transportation of C&D waste to be published or notified. Citizens
to avail the facility and refrain from disposal of small quantities of C&D waste anywhere else.
Arrange for transportation of C&D waste through skip lifting system departmentally or through
designated contractor. Normally 4.5 cu.m open skips and 10 cu.m roll on and roll of open containers
(to be hauled by hook loaders are suitable for C&D waste. Plan for reuse and recycling of such waste
with private sector participation. The rejects from these plants (soft fines) are used for filling in low
lying areas.
While depositing waste in the bins, care should be taken by the small generators to see that waste
material is not dumped outside the bin or skip. These bins or skips should be periodically inspected by
the municipal authority to ensure that they are cleared before they overflow. Littering should be
strictly prohibited; particularly C&D waste should never be allowed to be deposited in open or
covered drains.
Large generators who are provided with open skips or tractor trolleys on rent by the local body or its
authorised private operators, should inform the municipal authority or concerned agency when the
containers are likely to be full in order to replace the filled skip or trolley with an empty one and
transport the waste at a designated site. In case of very large generators responsible for demolition,
renovation, construction of infrastructure projects like bridges, fly-over, roads, large commercial or
housing complex or demolition of unauthorised structures by municipality etc., the area should be
screened and cordoned off and the material should be stacked systematically without obstructing
traffic or causing any hindrance to the neighbourhood. Different waste components may be segregated
and stored separately. Segregated material should be loaded into tipper lorries or tractors with the help
of front-end loaders or back hoes and transported to designated sites for further processing or other
use. Private sector may be encouraged to facilitate reuse and recycling of C&D waste.
The ULB should fix and notify charges for doorstep collection and transportation of C&D waste,
based on the volume generated.
Placement of Skips on Public Roads: Normally for bulk generators dedicated hook loader bins or
skips may be provided at a cost wherever required and should be kept within the construction sites.

164
The ULB should notify byelaws with regard to management of C&D waste and safety requirements of
such containers on public roads.
Table 4.27 Action points for C&D waste management
Sr.
No.
Action Area Timeline Department/ Agencies
1 Proper collection, transportation,
processing and disposal of C&D
Waste
Regular Activity
All Concern ULBs
2 Approval of Waste Management Plan
submitted by Waste Generators
before Construction starts.
Immediate All Concern ULBs
3 Provisions for using materials made
by C&D Waste in Construction
Activity like paving blocks, lower
layers of road pavements, colony and
rural roads etc.
Immediate All Concern ULBs
4 Collection of deposition charges
should be initiated in all ULBs.
Immediate All Concern ULBs
5 Deposition point for waste shall be
established
Shall be established
in future
All Concern ULBs
6 Information, Education &
Communication (IEC) for C&D
waste management.
Regular Activity
All Concern ULBs
4.2.7 Biomedical Waste Management
With a total population of 3,674,179 in the 8 statutory towns, the district has 351 healthcare facilities
of which 350 are authorized by the SPCB and out of these 107 are non-bedded facilities. The district
also has 6 veterinary hospitals and 70 pathlabs distributed in all of the ULBs. There is a Common Bio-
medical Waste Treatment and Disposal Facility (CBWTF) for Alwar and Bharatpur district.
As per the report published by the pollution control board the amount of total BMW generated is
749.6 kg/day for the Alwar and Bharatpur district. Total number of HCFs covered for this in lwar
district is 199 (RSPCB, 2019).

165
Data Provided by ULBs
Data for different action areas are collected form heath department. These data include details of
number of hospitals (HCFs, clinics, blood bank etc), amount of waste generated per day and,
CBMWTFs in Alwar district.
The district Alwar have two regional offices which are RO, Alwar and RO, Bhiwadi. Data are
separetly provided by these regional offices. As per the data provided 126 medical facilities in the
Alwar district have installed captive disposal facility for treatment of bio-medical waste at hospital
level.

166
Table 4.28 Report on Inventory of Biomedical Waste Generation, 2019
Sr
No. Action Areas Measurable Outcome
Please enter
Measurable
Outcome for
District RO, RPCB,
Alwar
Please enter
Measurable
Outcome for District
RO, Bhiwadi(Tehsil-
Tijara)
Name of ULB [name of ULB]
Population [Nos as per 2011 census]
A Inventory of Biomedical Waste Generation
Total no. of Bedded
Hospitals [Nos] / [No inventory] 282 69
Total no. of non-bedded
HCF [Nos] / [No inventory] 88 19
Total no. Clinics [Nos] / [No inventory] 23 13
No of Veterinary
Hospitals [Nos] / [No inventory] 6 0
Pathlabs [Nos] / [No inventory] 65 5
Dental Clinics [Nos] / [No inventory] 2 3
Blood Banks [Nos] / [No inventory] 2 1
Animal Houses [Nos] / [No inventory] 0 0
Bio-research Labs [Nos] / [No inventory] 0 0
Others [Nos] / [No inventory] 0 0
B Authorization of HCFs by SPCBs / PCCs
Bedded HCFs [Nos Authorized] 282 68
Non-bedded HCFs [Nos Authorized] 88 19
C Biomedical Waste Treatment and Disposal Facilities (CBMWTFs)
No of CBMWTFs [Nos] / None 1 0
Linkage with
CBMWTFs [Yes] / [no linkage] 307 88
Capacity of CBMWTFs [Adequate] / [Not adequate] Adequate
Requirements of
CBMWTFs [Require] / [not required] Required
Captive Disposal
Facilities of HCFs [Nos] / [None] 63 63
D Compliance by CBMWTFs
Compliance to standards [Meeting] / [Not meeting] /
[NA] meeting
Barcode tracking by
HCFs / CBMWTFs [100%] / [Partly %] / [None] Partly Partly
Daily BMW lifting by
CBMWTFs [Kg / day] 613 kg/day 86 kg/day
E Status of Compliance by Healthcare Facilities
Pre-segregation [100%] / [partly %] / [None] Partly Partly
Linkage with
CBMWTFs [100%] / [partly %] / [None] 307 88

167
Inferences for Present Scenario of Alwar
Although the whole district has linkages with a common treatment facility for managing the
biomedical waste, there are a number of issues which may be improved for biomedical waste
management. First the inventory of all the entities producing biomedical waste should be completed.
The practice of tracking of biomedical waste using barcode has not been followed strictly in the
district. The other main concern is the compliance by the common biomedical waste treatment facility
in Alwar.
4.2.8 Action Areas for Bio-Medical Waste Management
The action areas of the Strategy set out how the main goals of the Strategy will be achieved in terms
of areas of need, timeline, and responsible agency. Action plan for segregation, collection, transport,
disposal and data management with timeline and responsible department is given in the table below.
Table 4.29 Action Plan for Bio-Medical Waste Management
S.No. Action Area Timeline Department/ Agencies
1 Segregation of Bio Medical Waste (BMW) at
source of generation in specified Color-Coded bags
Regular
Activities
Health Department/
HCFs
2 Inventorisation of Medical facilities producing Bio-
Medical Waste
Immediate
Health Department
4 Collection of Solid Waste other than BMW from
HCFs
Regular
Activities
CBWTFs
5 Captive Disposal Facilities of HCFs shall be
established.
Immediate
Health Department/
HCFs
6 Authorization to HCFs and Occupiers
and Submission of Annual report to CPCB.
Immediate
RPCB
7 GPS enabled vehicles for Biomedical wastes
transportation
Immediate
Health
Department/RPCB/
CBWTFs
8 Information, Education & Communication (IEC)
for Bio-medical waste management.
Regular
Activities
Health Department /
NGOs/ Education
Department
9 Monitoring compliance by common biomedical
waste treatment facility
Regular
activity
RO, SPCB

168
4.2.9 Hazardous Waste Management
Data provided by ULBs
Table 4.30 shows the Hazardous Waste Datasheet for Alwar district. The industrial cluster of Alwar
and Bhiwadi have 332 authorized industries generating 23,310.63 MT per annum of hazardous waste.
The district recycles/utilizes around 14,696 MT/annum hazardous waste. The quantity of hazardous
waste which goes to landfill and incineration is 7582.58 and 1030.87 respectively.
Table 4.30 Hazardous Waste Datasheet for Alwar district
No. Action Areas Measurable
Outcome
Outcome for
District RO,
RPCB, Alwar
Measurable Outcome
for District RO,
Bhiwadi(Tehsil-
Tijara)
A Inventory of Hazardous Waste
No of HW Generating Industry [Nos.] 151 181
Quantity of HW [MT/Annum] 5978.737 17331.9
Quantity of Incinierable HW [MT/Annum] 432.36 598.51
Quantity of land-fillable HW [MT/Annum] 3901.386 3681.2
Quantity of Recyclable /
utilizable HW [MT/Annum] 1644.91 13052.19
B Contaminated Sites and illegal industrial hazardous waste dumpsites
No of HW dumpsites [Nos] / [None] Nil
Probable Contaminated Sites [Nos] (provide
list) Nil
C Authorization by SPCBs/PCCs
No of industries authorized [Nos] 151 181
Display Board of HW
Generation in front of Gate [Nos] 151 181
D Availability of Common Hazardous Waste TSDF
Common TSDF
[Exists] / [No] /
[Sent to Other
District within
State]
Exist-01
Also sent to other
district within
state
NO
Industries linkage with TSDF [Nos.]
123 units are of
Alwar district
Total connected -
264 of Rajasthan
F Linkage of ULBs in District with Common TSDF
ULBs linked to Common
TSDFs for Domestic Hazardous
Waste
[Yes] / [No]

169
Inferences for present scenario
Out of 23,310.63 MT hazardous waste generated by 332 HW generating units, 63.04 % is recyclable,
0.04 % is incinerable and 32.52 % is land filled. Ther is no hazardous waste dumpsite in district. One
TSDF unit exists in the Alwar region but there is no TSDF facility for Bhiwadi industrial region as
there are more number of industries as compare to Alwar. As for common TSDF, there is no data of
how much HW is being exported to other districts.
4.2.10 Action Areas for Hazardous Waste Management
Hazardous Waste Management Rules are notified to ensure safe handling, generation, processing,
treatment, package, storage, transportation, use reprocessing, collection, conversion, and offering for
sale, destruction and disposal of Hazardous Waste. This action should be completed on a timeline by
responsible department.
Table 4.31 Action Plan for Hazardous Waste Management
S.
No. Action Area Timeline Department/ Agencies
1. Hazardous waste segregation at Source Regular
activity All ULBs
2.
Circular economy approach may be followed in the
industries e.g. modifications in input side leading to
changes in resulting waste compositions
circular economy as one that is restorative, and one
which aims to maintain the utility of products,
components and materials and retain their value
5-years RSPCB (help from technical
institutes may be sought)
3. More opportunities my be searched for utilization of
hazardous waste 5-years
RSPCB (help from technical
institutes may be sought)
4. Information on domestic hazardous waste generated
should be collected and maintained
Implemented
in future All ULBs
6.
Education on Identification of different HW
classification and their respective handling and
storing methods
Immediate All ULBs

170
4.2.11 E-Waste Management
Data Provided by ULBs
Details for different paramets of E-Waste management i.e., collection centers,
authorizedrecyclers/dismantler etc are provided by district authorities. Table 4.37 gives details
regarding e-waste management in the district.
Table 4.32 Report on E-Waste Management
No. Action Areas Measurable
Outcome
Please enter
Measurable
Outcome for
District RO,
RPCB, Alwar
Please enter
Measurable
Outcome for
District RO,
Bhiwadi(Tehsil-
Tijara)
A
Status of facilitating authorized collection of E-Waste
Does the citizen are able to deposit or
provide E-Waste through Toll-free
Numbers in the District
[Yes] / [No] no no
Collection centers established by
ULB in District [Nos] / [None] none none
Collection centers established by
Producers or their PROs in the
District
[Nos] / [None] 3 none
Does the district has linkage with
authorized E-Waste recyclers /
Dismantler
[Yes] / [No] no NO
No authorized E-Waste recyclers /
Dismantler [Nos] / [None] 4 7
B
Status of Collection of E-Waste
Authorizing E-Waste collectors [Authorized] /
[None] none NONE
Involvement of NGOs [Yes] / [No] / [Nos] no NO
Does Producers have approached
NGOs/ Informal Sector for setting up
Collection Centers.
[Yes] / [No] /[Nos] no NO
Does ULBs have linkage with
authorized Recyclers / Dismantlers [Yes] / [No]
to be provided by
ULB
to be provided by
ULB
C
Control E-Waste related pollution
Does informal trading, dismantling,
and recycling of e-waste exists in
District
[Yes] / [No] may be may be
Does the administration closed illegal
E-Waste recycling in the District [Yes] / [No] / [Nos] no no
No of actions taken to close illegal
trading or processing of E-Waste [Nos] none none

171
D
Creation of Awareness on E-Waste handling and disposal
Does PROs / Producers conducted
any District level Awareness
Campaigns
[Yes] / [No] / [Nos] no no
Does District Administration
conducted any District level
Awareness Campaigns
[Yes] / [No] / [Nos] no no
Inferences from Present Scenario
There is no E-waste management infrastructure in the Alwar district. Only 3 collection centers were
established by Producers or their PROs in the District. Total of 11 authorized E-Waste recyclers /
Dismantler exists in the district. The creation of Awareness on E-Waste handling and disposal has not
been taken up in a vigorous way by any of the ULBs.
The generation of e-waste is going to be increased in the future. So, it is important to spread
awareness about the harmful effect of the disposal of e-waste. Collection centers for disposed of e-
waste should be installed. ULBs should start the process of estasblishing linkages with authorized
PROs for proper management of discarded e-waste.
ULBs should establish Toll-free number helpline where a citizen can contact for deposition of their e-
waste. Awareness programme should be initiated by the ULBs and NGOs. A common
recycling/dismantle facility may be established at the two regional level of Alwar and Bhiwadi as
these are the most populated as well as industrialised towns.
4.2.12 Action Plans for E-Waste Management
The lack of primary data is the major concern faced by all the institutions. So, to formulate a site-
specific action plan, firstly requires the data regarding the site. This includes data regarding the
generation, current status of collection of E-waste, the facilities provided by the district used by the
citizens, availability of collection centre under ULBs, status of dismantlers, involvement of formal
informal sectors, about trading, recycling and illegal activities surrounding this etc. Based on these
data an action plan has been formed to the better functioning with the timeframes and requirement
pattern with regards to infrastructural development of the area.

172
Table 4.33 Action Plan for E-Waste Management
4.3 Summary
4.3.1 Municipal Solid Waste Management
In summary, the current state of solid waste management revealed that there are significant issues
with unauthorized waste disposal practices due to the lack of proper waste management process. This
has significantly impacted on the natural environment. The lack of public waste bins and proper waste
collection processes have significantly affected the unauthorized waste disposal practices. Moreover,
the absence of sanitary land filling and inadequate processes are significant issues with SWM. The
absence of practical usage of regulation and laws is identified as a barrier to residents engaging in
proper waste management processes with recycling and waste separation because the council could
not enforce these practices. Lack of knowledge, awareness and cooperation have been identified. As
more and more waste is generated yearly, it is evident that this increasing trend is unacceptable in the
long run. Landfills and recycling can only temporarily mitigate the immediate consequences of this
S.
No Action Points Departments/Agencies
1 Collection, Segregation and Channelization of e-waste pertaining to
orphan products to recyclers/dismantlers
ULBs
2 Segregation of E-waste at source from MSW ULBs/Nagar Nigam/ Waste
Generator
3
Ensuring no illegal processing of e-waste and no dumping of e-waste,
HW & other wastes on banks of river and no illegal transportation of
e-waste.
District Administration
/ULBs/SPCB/RTO
4 Industrial skill development activities for workers in dismantling and
recycling units. Labor Department
5 Monitoring & Compliance of Extended Producers Responsibility
(EPR) - Authorization issue by CPCB.
SPCB
6 Information, Education & Communication (IEC) for E-waste
Management.
ULBs/ SPCB/ Development
Authority/ NGOs/Education
7 Authorization to Manufacturers, Dismantlers, Recyclers,
Refurbishers and Action against defaulters.
SPCB
8 Integrated plan for implementation of EWM Rules, 2016. SPCB
9
Earmarking or allocation of industrial space or shed, abandoned
mills/factories for e-waste dismantling/recycling units in industrial
clusters
Department of Industries
11 Recognition and Registration of workers of dismantling and
recycling units.
Labor Department
12 Implementation of EPR from producers. Department of Industries/SPCB

173
large waste production. However, if the problem of municipal solid waste is to be truly addressed, the
root of the issue must be looked at first. If less waste is generated in the first place, the challenge of
finding environmentally feasible ways of disposing of waste will be much easier.

174
Table 4.34 Summary for SWM in all ULBs of Alwar District
ULBs Aspect Collection and Transportation Processing and disposal
Nagar
parishad
Alwar
Present Status 100% door to door collection
Waste is first transferred to transfer
station and then to the dumpsites
Partial efficiency in segregated waste
transport
80% of the waste is used for composting
Material Recovery facility has been initiated
Recycling of waste is not done
Sanitary landfill is present
One dumpsite is present
Action points Source Segregation of waste.
Educating general public at school
level.
Modification in collection frequency
of waste based on type of waste.
Incorporation of households on the
extremity in waste collection
programme.
Use of ICT and IoT in waste
collection operations.
Use of electrical or biofuel powered
vehicles.
Mannual MRF with capacity of for dry waste
Mechanised composting plant for wet waste
Integrated domestic hazardous waste
management centre for recovering recyclables
from hazardous waste
Incineration of sanitary waste on daily basis
Completion of treatment of legacy waste as soon
as possible
Engineered landfill
Nagar
Parishad
Bhiwadi
Present Status 100% door to door collection
No transfer station is present, so
waste is directly dumped to
dumpsites
Segregated waste transport is not
initiated
No composting unit is present but 20% of the
waste is used for composting operations
Material Recovery facility has been initiated
Recycling of waste is not done
Sanitary landfill is not present
One dumpsites are present
Action points Source Segregation of waste.
Educating general public at school
level.
Modification in collection frequency
of waste based on type of waste.
Incorporation of households on the
extremity in waste collection
programme.
Use of electrical or biofuel powered
vehicles.
No MRF with capacity of for dry waste
Composting plant of capacity for wet waste
Local collection and storage facility for domestic
hazardous waste
Incineration of sanitary waste on daily basis
Completion of treatment of legacy waste as soon
as possible
Engineered landfill for Bhiwadi
Nagarpali
ka Tijara
Present Status 100% door to door collection
No transfer station is present, so
waste is directly dumped to
dumpsites
Partial segregated waste transport is
initiated
No composting unit is present
Material recovery facility has been not initiated
Recycling of waste is not done
No sanitary landfill site is present
One old dumpsite is present
Action points Source Segregation of waste. No MRF for dry waste

175
Educating general public at school
level.
Modification in collection frequency
of waste based on type of waste.
Incorporation of households on the
extremity in waste collection
programme.
Use of electrical or biofuel powered
vehicles.
No composting plant for wet waste
Local collection and storage facility for domestic
hazardous waste
Incineration of sanitary waste on daily basis
Completion of treatment of legacy waste as soon
as possible
Engineered landfill for the cluster of Tijara,
Kishangarh Bas, Khairthal
Nagarpali
ka
Kishanga
rh Bas
Present Status 100% door to door collection
No transfer station is present, so
waste is directly dumped to
dumpsites
100% efficiency in segregated waste
transport
No composting unit is present
Material recovery facility has been initiated
Recycling of waste has been not initiated
Zero sanitary landfill site is present
one dumpsites are present
Action Points Source Segregation of waste.
Educating general public at school
level.
Modification in collection frequency
of waste based on type of waste.
Incorporation of households on the
extremity in waste collection
programme.
Use of electrical or biofuel powered
vehicles.
MRF for dry waste
composting plant for wet waste
Local collection and storage facility for domestic
hazardous waste
Incineration of sanitary waste on daily basis
Completion of treatment of legacy waste as soon
as possible
Engineered landfill for the cluster of Tijara,
Kishangarh Bas, Khairthal
Nagarpali
ka
Behror,
Bansur,
Thanagaz
i
Present Status 100% door to door collection
No transfer station is present, so
waste is directly dumped to
dumpsites
100% efficiency in segregated waste
transport
No composting unit is present but 2% of the
waste is utilized in composting operations
Material recovery facility has been initiated
Recycling of waste has not been initiated
Zero sanitary landfill site is present
One dumpsite is present
Action Points Source Segregation of waste.
Educating general public at school
level.
Modification in collection frequency
of waste based on type of waste.
Incorporation of households on the
extremity in waste collection
programme.
Use of electrical or biofuel powered
vehicles.
MRF with capacity dry waste
Mechanised composting plant for wet waste
Local collection and storage facility for domestic
hazardous waste
Incineration of sanitary waste on daily basis
Completion of treatment of legacy waste as soon
as possible
Engineered landfill for the cluster of Behror and
Bansur
Nagarpali
ka
Laxmang
arh and
Present Status No door to door collection
No transfer station is present, so
waste is directly dumped to
dumpsites
Segregated waste transport is not
No composting unit is present
Material recovery facility has not been initiated
Recycling of waste has not been initiated
Zero sanitary landfill site is present

176
Ramgarh initiated One dumpsite is present
Action Points Source Segregation of waste.
Educating general public at school
level.
Modification in collection frequency
of waste based on type of waste.
Incorporation of households on the
extremity in waste collection
programme.
Use of electrical or biofuel powered
vehicles.
MRF with for dry waste
Mechanised composting plant for wet waste
Local collection and storage facility for domestic
hazardous waste
Incineration of sanitary waste on daily basis
Completion of treatment of legacy waste as soon
as possible
Engineered landfill for the cluster of
Laxmangarh, Kherli, Ramgarh
Nagarpali
ka Kherli
,Rajgar,
Khairthal
Present
Status
100% door to door collection
No transfer station is present, so
waste is directly dumped to
dumpsites
Segregated waste transport is not
initiated for Khairthal
No composting unit is present
Material recovery facility has not been initiated
Recycling of waste has not been initiated
Zero sanitary landfill site is present
One dumpsite is present
Action
Points
Source Segregation of waste.
Educating general public at school
level.
Modification in collection frequency
of waste based on type of waste.
Incorporation of households on the
extremity in waste collection
programme.
Use of electrical or biofuel powered
vehicles.
MRF with for dry waste
Mechanised composting plant for wet waste
Local collection and storage facility for domestic
hazardous waste
Incineration of sanitary waste on daily basis
Completion of treatment of legacy waste as soon
as possible
Engineered landfill for the disposal

177
4.3.2 Plastic Waste Management
ULBs should incorporate personnel from the informal sector, improve their skills via training and
seminars, and increase material recovery facilities in cities. ULBs should integrate these informal
employees into formal chains through waste management concessionaires, self-help groups, or non-
governmental organizations (NGOs), ensuring that these workers of last resort are elevated and
relocated to formal jobs.
Waste segregation at the source is a critical component that can improve material recovery and
recycling rates. Once garbage is identified at the source as dry, moist, or hazardous, there is a
considerable possibility to recover plastics from dry waste in material-recovery facilities. As a result,
citizen involvement and engagement in plastics management are equally important.
The table below highlights the current status and future action plan for all ULBs in order to handle
plastic waste efficiently.

178
Table 4.35 Summary about PWM for all ULBs of Alwar District
Name of ULB Present Status Action Plan for future
Alwar and
Bhiwadi Nagar
parishad ULB
Quantity of plastic waste generated has not been
estimated. There is 100% provision of door-to-
door collection of waste. partial waste
segregating is carried out during waste
collection.
Plastic waste collection at Material Recovery
Facility has been installed. There are no
authorized PW in Alwar ULB. There is one PW
collection center for Alwar.
Linkages with PROs & NGOs have not been
established for Alwar.
There are one PW recyclers for Bhiwadi, none
Manufacturers, Pyrolysis oil plants, 0.5 MT for
Plastic pyrolysis plants at Bhiwadi. Nowhere
plastic is utilized for road construction. Plastic is
used in cement kins at Bhiwadi
Units producing <50 micron carry bags are
partially sealed for Bhiwadi. Sale of carry bags
<50 micron is strictly prohibited. Ban on carry
bags and other single use plastics as notified by
State Government is implemented.
The EPR through Producers/Brand-Owner has
not been implemented. No producers are
associated with ULB, no financial or
infrastructure support is given, and no collection
centres have been setup.
Plastic waste segregation should
be done at source as a regular
activity.
Implementation of Management by
Waste Generator through EPR and
PRO.
Utilization of Non-recyclable
plastic waste (Road Construction,
Waste to Fuel, Waste to energy,
alternative uses identification etc.
to be implemented.
Strict violations on open burning
and littering.

179
Nagarpalika-
Tijara,
Khairthal,
Thanagazi,
Laxmangarh,
Ramgarh,
Bansur
The estimated quantity of plastic waste
generated is not estimated. There is no 100%
provision of door-to-door collection of waste for
Khairthal, Laxmangarh, Ramgarh, Only 20%
waste segregation is done during waste
collection.
Plastic waste collection at Material Recovery
Facility is not installed.
Linkages with PROs & NGOs have not been
established.
There are no PW recyclers but, no
Manufacturers, no Pyrolysis oil plants, and no
plastic pyrolysis plants in the ULB. Plastic is
utilized for road construction but, about 0.5
MT/MONTH of plastic is co-processed in
cement kiln.
No action has been taken for sealing of units
producing <50-micron plastic. Sale of carry bags
<50micron is strictly prohibited. Ban on carry
bags and other single use plastics as notified by
State Government is implemented.
The EPR through Producers/Brand-Owner has
not been implemented. No producer is
associated with ULB, no financial or
infrastructure support is given, and no collection
centres have been setup.
Plastic waste segregation should
be done at source as a regular
activity.
Implementation of Management by
Waste Generator through EPR and
PRO.
Utilization of Non-recyclable
plastic waste (Road Construction,
Waste to Fuel, Waste to energy,
alternative uses identification etc.
to be implemented.
Strict violations on open burning
and littering.

180
Nagarpalika-
Kishangarh bas,
Behror, Kherli,
Rajgarh
Quantity of plastic waste generated has been
estimated. There is 100% no provision of door-
to-door collection of waste at Behror. Partial
waste segregating is being out during waste
collection.
Plastic waste collection at Material Recovery
Facility is not installed. There are no authorized
PW pickers in the ULB. PW collection centers
are not established.
Linkages with PROs & NGOs have not been
established.
There are no PW recyclers, Manufacturers,
Pyrolysis oil plants and Plastic pyrolysis plants.
Nowhere plastic is utilized for road construction
and neither co-processed in cement kiln.
Units producing <50 micron carry bags are
totally sealed. Sale of carry bags <50micron is
partially prohibited. Ban on Carry bags and other
single use plastics as notified by State
Government is implemented.
The EPR through Producers/Brand-Owner has
not been implemented. No producer is
associated with ULB, no financial or
infrastructure support is given, and no collection
centres have been setup.
Plastic waste segregation at source
should be done effectively as a
regular activity.
Implementation of Management by
Waste Generator through EPR and
PRO.
Utilization of Non-recyclable
plastic waste (Road Construction,
Waste to Fuel, Waste to energy,
alternative uses identification etc.
to be implemented.
Strict violations on open burning
and littering.

181
4.3.3 Construction and Demolition Waste Management
The inventory of C&D waste suggests that a significant proportion of construction waste can be
recycled and reused and brought back to construction to substitute naturally sourced material. This
demands a circular economy that can turn C&D waste into a resource. This can help reduce energy
intensity and environmental footprints of buildings and infrastructure.
Management of construction and demolition waste in the state shall be done in accordance with the
construction & Demolition Rules 2016. Each local body shall issue detail directions to the generators
and other involved in the process on proper management of construction and demolition waste within
its jurisdiction in accordance with the provisions of these rules. Each ULB shall make a reasonable
estimate on the quantity of construction and demolition waste generated in its jurisdiction and also
work out the projections for the future years. The ULBs shall ensure separate storage, collection and
transportation of construction and demolition wastes. The ULBs shall make arrangements for
collection and transportation of Construction & Demolition waste either through own resources or by
appointing private operators.
Every ULB shall develop the collection centre or alternate collection mechanism for construction and
demolition waste and hand it over to the authorized processing facility of construction and demolition
waste.
ULB shall also keep a track of the major generation of construction and demolition waste within its
jurisdiction and establish a data base and update once in a year. ULBs shall create a sustained system
of information, education and communication for construction and demolition waste through
collaboration with expert institutions and civil societies and also disseminate through their own
website;

182
Table 4.36 Summary for C&D waste management in all the ULBs of Alwar District
ULBs Present Status Action Points Strategy and Approach
Nagar
Parishad-
Alwar and
Bhiwadi
Nagar
Palika-
Tijara,
Kishangarh
bas, Behror,
Thanagazi,
Kherli,
Rajgarh,
Khairthal,
Laxmangar
h, Bansur,
Ramgarh
1. Estimated quantity of C&D
waste is not mentioned
properly.
2. Amount of C&D waste
collected, dump is calculated.
3. Implement scheme for
permitting bulk waste is not
being issued by ULB.
4. Issuance of permission by
ULB for establishment of
C&D waste deposition is not
being initiated and C&D waste
deposition is not identified
there.
5. Implementation of By-Laws
for C&D waste management is
being notified.
6. Collection of
deposition/disposal charge is
being initiated.
7. C&D recycling plant doesn’t
exist.
Inventory of
C&D waste
generation
1.Survey and Investigate the C & D
generators under the jurisdiction of
ULB.
2. Identify regular bulk waste
generators (Contractors or Builders)
3. Distribution of Staffs in Collecting,
Transporting and Processing of C & D
4. Treatment of C & D Wastes or
Transformation
Implement
scheme for
permitting bulk
waste generators
1. Contractors/Builders should have
registration id in the ULBs to collect &
transfer the C & D Wastes to the C &
D Deposition Center for treatment.
2. The Generators should contact the
ULB staffs or Constructors/Builders.
3. The generators should be charged as
per by law.
Establishment of
C&D Waste
Deposition
centers
1. Identify the transportation point.
Establishment of
C&D Waste
recycling plant or
linkage with such
facility
1. Involve NGOs or to startups to
establish a C&D Waste recycling plant,
2. ULB of Alwar should established
C&D recycling plant in the form of
cluster

183
4.3.4 Bio-Medical Waste Management
The need of proper biomedical waste management has been recognized by both government agencies
and non-governmental organizations. There are several hazards and dangerous objects that should be
handled and disposed of with care. Inadequate and inefficient segregation and transportation networks
may constitute a severe hazard to society, necessitating the installation of safeguards and laws in
writing. All of these circumstances enhance the likelihood of biomedical hazards being exposed to
employees, patients, and the general public.
To accelerate the creation of appropriate processing and management processes, timely regulatory and
legislative rules and procedures are required. To be properly separated, processed, and isolated,
wastes must be well-characterized, which is difficult. Handling biomedical waste properly and
effectively is not just a legal requirement, but also a social obligation.
A lack of caring among people working in the sector, a lack of motivation, a lack of awareness, and a
cost aspect are some of the challenges encountered in proper hospital waste management. In order to
perform complete surveys of waste management processes in various practices, it is required to
undertake thorough surveys of waste management processes in various practices. There is clearly a
need for more education about the consequences of improper waste disposal.
Given the lack of understanding of biomedical waste management at all levels of health-care
employees, an effective communication strategy is critical.
Table 4.37 Summary about Bio-Medical Waste Management for all the ULBs of Alwar District
District Present Status Action Plan for future
Alwar
District
● Quantity of Bio Medical waste generated at
each ULB has not been provided for the latest
data. There is only data available for the year
2008.
● There is 100% provision of segregation at
source and collection of non-hazardous waste in
Municipal Solid Waste.
● Common Bio-Medical Waste Treatment Facility
has not been installed. One CBMWTF present
at sri-ganganagar is being used.
● Barcode on Colour Coded Bags are not being
placed for tracking of waste in ULBs.
● GPS enabled vehicles for
Biomedical wastes
transportation
● Authorization to HCFs
and Occupiers and
Submission of Annual
report to CPCB.
● Authorization to HCFs
and Occupiers and
Submission of Annual
report to CPCB.
● Compliance of regulation
by common biomedical
waste treatment facility

184
4.3.5 Hazardous Waste Management
To summarize, the district has seven authorized industries capable of generating hazardous waste and
recycles/utilizes around 384.27 MT/annum hazardous waste. The focus should be on industrial waste
documentation in individual ULBs, hazardous waste segregation at source and maintaining a detailed
hazardous waste profile.
Table 4.38 Summary of present status and action points for HWM in all the ULBs of Alwar
Name of
District
Present status Action Points Strategy and approach Stakeholder
responsible
Alwar Generates
maximum amount
of domestic
hazardous waste
and sanitary waste
in the district
No details on type
of HW collected,
quantity of HW
recycled and
disposed, no
information of
import/export of
HW
Hazardous waste
reduction
measures
Inventory of
hazardous waste
recycled and
disposed
Inventory of
industrial HW
Maintenance of
Hazardous waste
profile
Stricter laws for enforcing
hazardous waste
segregation at source/
Reward system
Recycle more waste rather
than disposal
Documentation of
hazardous waste profile
Stricter registration of
hazardous waste generating
industries
ULB staff,
waste
generators
4.3.6 E-Waste Management
Currently there is nothing done for the E-waste management at any of the ULB.
E-waste management should be considered as an urgent need and measures have to be taken. The
future projection for each ULB shows that there is considerable increase in the quantity of E-waste
generated. The lack of grass root level data on management system including quantification,
characteristics and existing disposal practices makes detailed assessment of the current and future
scenario very difficult. A holistic approach which is also self-sustained to manage the system from the
generation to disposal will be effective in handling the issue. It can make use of technological
advancements and create a sustainable consumer culture where the public is aware of the
environmental and health hazards caused by E-waste. Care should also be taken to ensure the E-waste
policy is functional and strengthening the legal aspects of the system.

185
5. Water Quality Management
5.1 Water Quality Monitoring
The term "water quality" is assessed in terms of physical, chemical or biological characteristics of
water by which the user evaluates the acceptability of water. According to the Constitution of India,
water supply is the subject of a state jurisdiction while, the Union Government is only responsible for
setting the water quality standards. To address the monitoring of drinking water quality in India, a
programme on community-based water quality monitoring (CBWQM) was initiated under the Rajiv
Gandhi National Drinking Water Mission (RGNDWM). This initiative was started to ensure the safe
water for Indian citizens through a comprehensive surveillance process, incorporating monitoring,
data processing, evaluation, sanitary monitoring, evaluation, sanitary surveys, public health
assessment and remedial and preventive action throughout the length and breadth of the country (R.
K. Sharma et al., 2017).
The water quality management plan is made with an objective of reducing the discharge of pollutants
into the urban runoff from the development projects. This can be done by reducing or eliminating the
source of pollutants and managing site run off volumes and flow rates through application of the best
management practices.
5.1.1 Literature review
Water quality is deteriorating all over the world, in both developed and developing countries. The
types, extents and magnitudes of water quality problems differ from country to country and
sometimes within the same country. In global context, at least 4 billion people in the world do not
have access to safe drinking water. In the entire South Asian region, over 1.7 billion people are
dependent on the tap water for drinking purpose, and majority of people think that the tap water is
safe to drink. However, due to the high concentration of dissolved salts and carcinogenic impurities,
ground water is no longer considered good for the human health. World Health Organization’s data
reports that 3.4 million people die due to the water borne diseases. Ground water quality measures
should be ensured to prevent water-borne diseases, harm to environment, soil degradation and damage
to sensitive crops. The global focus has always been on providing the water to every living beings; but
with ever increasing industrialization and urbanization, the quality of water is continuously
deteriorating. In developing countries less than 10% of population have access to wastewater
collection and treatment facilities Sharma et al., 2017).
Water quality was listed as one of the primary challenges in Asia in the next century by the United
Nations in its recent analysis of global water scarcity. The most visible evidence of water quality
degradation in most of the Asian countries is of serious human health issue which is linked to the
discharge of pathogens into drinking water resources. Apart from affecting the human health it is

186
causing severe impact on aquaculture in surface water resources which can be observed by spread of
algae on surface water, eutrophication of lakes and kills of water habitats. Wastewater discharged into
water bodies is causing destructive influence in near-shore and off-shore marine environments in
Asia. The status of water quality should form the basis for a national action programme on water
quality management in the developing countries of Asia and Pacific region. Countries in the Asia
Pacific region faces many problems in water quality monitoring such as parameters used for water
quality monitoring is out-of-date, methodology used is very old, data collection is sometimes
unreliable that cannot be used for decision making (Castonguay et al., 2018).
According to the government of India, in 2016, 21 million people in over 23,500 habitations were
affected by arsenic and fluoride contaminated groundwater. In December 2018, the Minister of State
for Drinking Water and Sanitation mentioned that out of 25,000 odd habitations across 16 states,
15,811 were affected by arsenic, and 9,660 were affected by fluoride (A. Biswas, 2019).
The groundwater is being exploited excessively in past few decades for several uses such as for
drinking, farming, industries, and construction and this is increasing the amount of the chemical
contamination. This is the reason why the drinking water schemes have been introduced wherein the
use of groundwater has been decreased to some extent whereas, the use of surface water has
increased.
Government of India has come up with National Water Policy in year 2012 (GOI, 2012) to ensure an
integrated approach to water resource development, with rational and equitable resource distribution
and priority for the poor and unserved. Efficient policy mechanisms to address the entire water cycle
and to manage the water quality must be established. Establishing standards and objectives, as well as
a mechanism to track and use them as a benchmarks for planning and management, should be part of
an effective policy process. The government’s goals and strategies for achieving them should be
stated in a national water sector strategy. It will provide investment and project planning
recommendations, with the goal of ensuring that water supply development considers water resource
management and environmental factors, such as fair allocation of water resources and pollution
prevention.
Governance and Management Structure
Rajasthan State Pollution Control Board
The Rajasthan State Pollution Control Board was constituted under section 4 of the Water (Prevention
and Control of Pollution) Act, 1974 on 7th February 1975, with the objectives of prevention, and
control of water pollution and maintaining or restoring the quality of water. Water (Prevention and
Control of Pollution) Cess Act, 1977 has been passed to make the State Board financially
independent. Under this act, the State Board has been given powers to collect cess based on water
consumed by the industries etc. Enactment of the Environment (Protection) Act, 1986 has further

187
widened the scope of the activities of the Board. This Act being umbrella legislation, different rules
for addressing the problems of various sectors have been enacted under this Act. The State Board is
engaged in implementation of the rules made under the Environment Protection Act, 1986.
Public Health Engineering Department
PHED, Rajasthan is responsible for providing potable water to every citizen of Rajasthan state. PHED
is shifting from ground water-based schemes to surface water source-based schemes in the phased
manner. PHED is using different water resources available to tackle the water problems of the state
such as erratic rainfall, depleting water table and degraded quality of natural water available.
Best practices for Water Quality Management
Integrated Urban Water Management (IUWM)
Integrated Urban Water Management (IUWM) is mainly based on the planning, managing and
maintaining the water sector in cities by considering entire urban water loop. IUWM has been
acknowledged in India since the year 2015 as the robust solution to manage the urban water sector.
City’s hydrology, economy, institutional mechanisms, governance and social structure need to take
into consideration while adopting the integrated approach for water sector in India. The framework
can be divided into three major parts namely environment, institutional arrangements, and
management instruments. Different agencies which are working in the water sector of the city helps in
adopting this framework. Coordination among these agencies needs to be improved. Closing the loop
of water sector will help in sustainable development of the cities. It ensures the water supply, sewage
management, solid waste management and storm water management.
Wastewater Management
One of the major causes for the degradation of surface water quality is wastewater which is directly
disposed into the surface streams or lakes. To manage the pollution caused by these sources,
Wastewater Management is necessary.

188
Figure 5.1 Circularity in Waste water Management
A transition from linear economy to circular economy will be helpful in adoption of wastewater reuse
in the community. The reclaimed water reuse is adopted by many countries in the world, but the
proportion of water reuse is still very less. Circular economy will help to achieve the sustainable
development goals. Circularity in the wastewater management can be achieved by reduction,
reclamation, reuse, recycling, recovery and rethink (Figure 5.1). These practices will ensure the
awareness in the public, reduce the quantity of wastewater and reduce the cost of treatment of
wastewater which will finally lead to Zero Liquid Discharge (ZLD). ZLD will ensure to recover all
the water and contaminants are separated. This will decrease the waste volume produced (Tong &
Elimelech, 2016).
5.1.2 Present Scenario and Gap Identification
STUDY AREA
Alwar is located in the north-east of Rajasthan between 27°34′ & 28°4′ north Latitudes and 76°7′ and
77°13′ east Longitudes. It is bounded by Mahendragarh (Haryana) in north-west, Gurgaon (Haryana)
in the north and north-east, by Bharatpur in the east, by Dausa in south and Jaipur in south-west &
west direction.
The total area of District is 8380 Sq. Kms. Its greatest length from south to north is about 137 Kms
and greatest breadth from east to west about 110 Kms. The city is located at 165 kms from Jaipur the
state's capital city which is also the nearest airport. Excellent rail and road links connect Alwar to the
rest of the state.
Administratively, it has only one Lok Sabha constituency, the district is divided into 16 tehsils and 14
Panchayat Samitis. The district has 1991 villages, 9 urban towns and 6 Municipalities. Rural and

189
urban population in the district is 30.18 lacs and 6.54 lacs respectively (Census, 2011). Density of the
population is 438persons/sq.km (GoR, 2021c).
Figure 5.2 Administrative Division
Climatic Condition
Climate of the district can be classified as semi-arid. It is characterized by very hot summer and very
cold winters with fairly good rainfall during southwest monsoon period. The potential
evapotranspiration rates are quite high especially during May and June. Normal annual rainfall of the
district is 631mm.
The average wind speed in Alwar is 2.4 m/s with the maximum wind speed of around 8 m/s. The
average ambient temperature remains 25.4°C, varies from 4.8°C to 44.2°C. The average relative
humidity remains around 58.4%, varies from 7.5% to 98.9%. The station pressure varies from 974
hPa to 956 hPa, averaged around 989 hPa (GOI, 2017).
Rainfall
Normal annual rainfall of the district is 631mm. The rainy period of the year lasts for 5.6 months,
from April 30 to October 17, with a sliding 31-day rainfall of at least 0.5 inches. The most rain falls

190
during the 31 days centered on August 3, with an average total accumulation of 6.2 inches (GOI,
2017.
The rainless period of the year lasts for 6.4 months, from October 17 to April 30. The least rain falls
around November 29, with an average total accumulation of 0.1 inches.
Most rainfall (rainy season) is seen in July and August.
Alwar has dry periods in January, February, March, April, May, October, November and
December.
On average, August is the wettest month with 7.56 inch (192.0 mm) of precipitation.
On average, November is the driest month with 0.12 inch (3.0 mm) of precipitation.
The average amount of annual precipitation is: 23.58 inch (599.0 mm)
Figure 5.3 Average Rainfall for Alwar District (1957-2019)

191
Land Use
The socio-cultural and economic factors have significantly influenced over land use both in rural and
urban areas in the district. Land forms, slope, soils and natural resources are some of the important
which control the land use pattern of the district (GOI, 2017).
Table 5.1 Land Use, Alwar District
Sl.No. Land Use Area in hectare %
1 Total geographical area 783281 -
2 Forest 84886 10.84
3 Uncultivable land 126280 16.11
4
Land not cultivated including pasture
land; barren land; trees, grooves &
orchards; padat land
70702 8.91
5 Actual sown area (subtracting double) 502413 64.14
6 Gross sown area 866860
7 Area sown more than once 364447
Drainage and Hydrology
There is no perennial river in the district. The seasonal rivers, which flow through the district and
carry the runoff from the hills are Sabi (Sahibi), Ruparail (Barah), Chuhar Sidh and Landoha. Several
of these rivers and their tributaries have been impounded at suitable sites and the water is used for
irrigation if remains available. The natural drainage is from southwest to north east. Tehsil wise river
basin area of district is given in Table 5.2 (GOI, 2017).
Table 5.2 Tehsil-wise distribution of River Basin area, Alwar District
S.No. Name of Tehsil River Basin (sq. km)
Sabi Ruparail Banganga
1 Alwar 87.7 1077.8 0.3
2 Bansur 551.4 98.9 -
3 Behror 242.6 - -
4 Kathumar - - -
5 Kishangarh 564.9 138 -
6 Kot kasim - - -
7 Laxmangarh - - 967.1
8 Mandawar 607.4 - -
9 Rajgarh - 254.6 725.6

192
10 Ramgarh - 659.3 -
11 Thanagazi 68.1 114.8 554.6
12 Tijara 625.3 193.6 -
Total 2747.4 2537.0 2247.6
Hydrology
There is no natural lake in the district. However, there are 24 talab/bunds in the district used for
irrigation if water is available. The tehsil wise status of bunds existing the district is presented in
Table 5.3. Bunds/talabs dried up during summer period and water are not available for irrigation
during kharif cultivation. Irrigated area by bund/talab is only 17 hectare (GOI, 2017).
Table 5.3 Status of Irrigation Bunds, Alwar District
S.No. Tehsil
No. of
Talab/
Bunds
Gross
Water
Capacity
(million
feet)
Normal
Water
Capacity
(million
feet)
Command
Area (hec)
Water
Catchment
Length of
canals(km)
1 Rajgarh 4 1432.52 1294.60 4419.00 114.50 39.25
2 Laxmangarh 1 106.00 212.40 3419.78 70.70 21.80
3 Kathumar 1 106.40 106.40 691.00 21.20 0.00
4 Tijara 3 152.38 151.45 1366.00 19.20 9.02
5 Kishangarh 3 454.00 311.00 1657.00 151.70 13.16
6 Mundawar 2 34.43 33.52 334.00 7.68 9.02
7 Behror 0 0.00 0.00 0.00 0.00 0.00
8 Bansur 2 333.00 418.00 3472.00 136.00 22.15
9 Alwar 3 1643.00 1301.25 6129.00 152.20 53.95
10 Thanagazi 4 644.71 330.31 2436.00 130.31 14.30
11 Ramgarh 1 0.00 0.00 2284.00 133.00 0.00
12 Kotkasim 0 0.00 0.00 0.00 0.00 0.00
Total 24 4936.44 4158.93 26207.78 936.49

193
Depth to Water Level
Central Ground Water Board periodically monitors the ground water regime through 36 active
National Hydrograph Network Stations (NHNS) four times a year i.e. in January, May, (Premonsoon),
August and November (Post monsoon) including one time ground water sampling during May
measurement. Depth to water level varies widely depending upon topography, drainage, bed rock,
geology etc (GOI, 2017).
Pre-monsoon (May-2015):
The depth to water level varies widely from about 4.70 (lowest at Tehla in Rajgath block) to about 75
mbgl (deepest at Behror in Behror block). Water level is comparatively shallow in the southwestern,
eastern parts and in Sabi river basin and Barah river basin, especially along river. Whereas it is deeper
in the Northwest and western parts of the district. Block-wise water level ranges are given below:
Table 5.4 Block-wise Range of Depth to ground Water Level, Alwar District (May, 2015)
S.No. Name of Block Depth to Ground Water Level Range (mbgl)
From To
1 Bansur 26.59 36.50
2 Behror 75.00 75.00
3 Kathumar 18.90 33.15
4 Kishangarh Bas 38.72 38.72
5 Kotkasim 19.00 26.15
6 Laxmangarh 7.68 36.70
7 Mandawar 34.10 49.60
8 Neemrana 58.21 59.15
9 Rajgarh 4.70 13.26
10 Ramgarh 21.30 23.25
11 Reni 23.35 23.35
12 Thanagazi 27.00 27.00
13 Tijara 7.25 24.06
14 Umrain 13.45 41.80
Post-monsoon (Nov, 2015):
The depth to water level varies widely from about 5.72 (lowest at Tehla in Rajgath block) to about
76.10 mbgl (deepest at Behror in Behror block). Water level is comparatively shallow in the south
western, eastern parts and in Sabi river basin and Barah river basin, especially along river (GOI,

194
2017).Whereas, it is deeper in the North West and western parts of the district. Block-wise water level
ranges are given in below:
Table 5.5 Block-wise Range of Depth to ground Water Level, Alwar District (Nov, 2015)
S.No. Name of Block Depth to Ground Water Level Range(mbgl)
From To
1 Bansur 27.10 37.10
2 Behror 28.48 76.10
3 Kathumar 17.92 33.15
4 Kishangarh Bas 38.47 38.47
5 Kotkasim 19.00 26.30
6 Laxmangarh 7.93 22.30
7 Mandawar 34.95 49.55
8 Neemrana 60.65 61.53
9 Rajgarh 5.72 17.36
10 Ramgarh 16.36 23.15
11 Reni 20.45 50.52
12 Thanagazi 27.00 27.00
13 Tijara 8.10 24.30
14 Umrain 13.20 43.52
Long Term Water Level Trend (2001-2012):
Block-wise long term ground water level trend for the period 2001 to 2012 are given below:
Table 5.6 Block-wise Ground Water Level Trend(2001-2012), Alwar District
S.No. Name of Block Ground Water Level
Trend (meter/year)
Remarks
1 Bansur 1.24 Declining
2 Behror 2.55 Declining
3 Kathumar 1.33 Declining
4 Kishangarh Bas 1.11 Declining
5 Kotkasim 1.02 Declining
6 Laxmangarh 0.97 Declining
7 Mandawar 1.09 Declining
8 Neemrana 1.08 Declining
9 Rajgarh (-) 0.014 Marginal Rising
10 Ramgarh 0.60 Declining ]
11 Reni 0.45 Declining
12 Thanagazi 0.0183 Declining
13 Tijara 0.35 Declining
14 Umrain 0.94 Declining
The trend data indicates that declining trend has been observed in all the blocks except in Rajgarh
block where marginal rising trend of 0.014 m/year has been found. Declining trend ranges from

195
0.0183 m/year (Thanagazi Block) to 2.55 m/year (Behror Block). Declining trend has been resulted
due to the overdraft of ground water resources than its natural replenishment. Marginal rising trend
may be due to the less withdrawal of ground water in the area being hilly and less availability of
cultivable area. The long term hydrograph of selected monitoring stations are depicted in Figure
(GOI, 2017).
Water Table
The general slope of water table in the area is towards east. In Barah basin, it has a south easterly
slope in the north-eastern part of the district; easterly slope in a major part of the area between Alwar
and Nagar and north-westerly and south easterly slope in the southern part of the area between
Rajgarh and Malakhera. However, near Dhakpuri, water table slopes towards north-easterly direction.
In the northern part of the district, the general slope of water table in the area is broadly towards
north-easterly direction. The highest water table lies at an elevation of more than 400 mamsl in
Thanagazi block and minimum elevation at less than 190 mamsl in Kathumar block. Water table slope
gently in the eastern direction averaging about 1.02 m/km. The hydraulic gradient in Berah sub-basin
is not very steep ranging from 0.60 to 2 m/km (GOI, 2017).
Ground Water Quality
Ground water in the area is alkaline in nature with pH varying from 7.02 to 8.26. In general, quality of
ground water is suitable for irrigation and domestic uses.
Electrical Conductivity (EC) EC varies from 500 μs/cm at 25°C at Chatarpura, Bansur Block to 12000 μS/cm at 25°C at Sundana,
Laxmangarh Block. Electrical conductivity in major part of the district is below 3000μs/cm at 25°C.
EC value of 2000 to 3000 μS / cm at 25°C has been observed in parts of Neemrana, Behror, Tijara,
Mandawar, Kishangarh Bas, Reni, Umrain and Kathumar blocks. Higher EC values varying from
3000 to 10000 μS/cm at 25°C have been reported from Ramgarh, Laxmangarh and Kathumar blocks
and EC more than 10000 μS / cm at 25°C has been reported from localized pockets in Kathumar
block (GOI, 2017). The TDS content is also found to be higher than the permissible limit of 500
mg/L in almost all the ULBs. In Behror and Kherli area, the TDS content in the drinking is even
higher than 1000 mg/L, which is not good for health.

196
Fluoride Fluoride concentration in ground water has been found to vary from 0.672 mg/l at Tapukara, Tijar
block to 3.42 mg/l at Ramgarh. It is found to be within the permissible limit of 1.5 mg/l in major part
of the district. However, Neemrana, Ramgarh and Kathumar blocks have excess fluoride. Fluoride
contamination in ground water has also been reported from parts of Kotkasim, Mandawar, Behror,
Bansur, Thanagazi, Rajgarh, Reni, Umrain, Laxmangarh and Kishangarh Bas blocks (GOI, 2017).
Nitrate Nitrate concentration in ground water has been found to be within the maximum permissible limit of
45 mg/litre in major part of the district. However, higher values of nitrate in excess of 45 mg/l have
been reported from parts of Umrain, Tijara, Thanagazi, Neemrana, Kishangarh Bas, Laxmangarh and
Ramgarh blocks (GOI, 2017). A very high level of nitrate in these areas may be due to the large
number of industries which discharged untreated waste into the environment. The nitrate content in
the Bhiwadi city was found to be in the range of 30 to 80 mg/L which is not good for health and water
is unsafe for drinking purpose. This is mainly due to the discharge of untreated water in the open
nallah and open ground which causes contamination of the ground water.
Iron Iron concentration in ground water has been observed within the permissible limit of 1 mg/litre in
most parts of the district except isolated pockets in Umrain, Laxmangarh, Rajgarh and Reni blocks.
Iron content varies from 0 in Neemrana and Kanhawas in Neemrana block and Holawas in Behror
block to 1.395 mg/l at Govindgarh, Laxmangarh block (GOI, 2017).
Figure 5.4 Location of Piezometer Wells in Alwar District

197
Groundwater Related Issues
Most of the blocks in the district fall under the ‘over exploited’ category indicating that the ground
water is under stress and exploitation exceeding recharge. Two blocks viz., Behror and Rajgarh have
been put in ‘notified’ category which implies a severely stressed ground water situation.
Table 5.7 Categorization on the basis of stage of development of ground water for blocks of
Alwar
Categorization on the basis of stage of
development of ground water
Block Name
Over Exploited Neemrana, Bansur, Reni, Tijara, Kishangarh,
Bas, Mandawar, Kotkasim, Umren, Ramgarh,
Lachhmangarh, Kathumar, Thanagazi
Notified Behror, Rajgarh
The following ground water related issues have been emerged for the Alwar district:
Decline in Water Level
Long term water level data (pre-monsoon, 2001-2012) have indicated declining water level trend
ranging from 0.0183 to 2.55m/year. It has resulted due to the overdraft of ground water resources for
various uses than its annual recharge. All the blocks are over exploited having stage of ground water
development ranging from 102.04% (minimum in Thanagazi Block) to 293.81% (maximum in Behror
Block). Deep water level has caused more consumption of power to draw ground water and
deterioration in ground water quality.71% area has water level more than 20m in the district.
Depletion of Aquifer
Decline in water level has resulted in drying of alluvial aquifer particularly in parts of Behror and
Umrain blocks where water level has entered into the underlying hard rock.
Ground Water Salinity
Ground water salinity with EC more than 3000μs/cm at 25°C has been found in south eastern part of
district covering parts of Ramgarh, Laxmangarh & Kathumar blocks and EC more than 10000 μs/cm
at 25°C has been reported from localized pockets in Kathumar block. The TDS content is also found
to be higher than 500 mg/L in almost all the ULBs and even higher than 1000 mg/L in Behror and
Kherli.
Ground Water Pollution
Industrial clusters have been developed at Bhiwadi, Alwar, Neemrana and Behror in Alwar
district. Untreated disposal of effluents into the open nallah/open depression have caused the
contamination of ground water and thereby unsuitable for human consumption. Pollution study
carried out by CGWB at Bhiwadi industrial cluster, has clearly indicated the contamination of

198
ground water with presence of high concentration of toxic substances viz. cadmium, lead and
nickel more than the acceptable limit of Drinking Water Specification (2012) and rendering
ground water unhealthy/unfit for drinking use. Bhiwadi industrial Cluster has been ranked 6th in
the country and 1st in Rajasthan state with CEPI score 82.91 indicating critically polluted cluster
(MOEF, J-11013/5/2010-IA.II(I), New Delhi dated 13.1.2010). Similar pollution studies are to
under taken in other industrial clusters in the district to assess the ground water contamination
The following tables (table 5.8 to 5.12) provides the details regarding inventory of water
resources in District, Control of Groundwater Water Quality, Availability of Water Quality Data,
Control of Water Pollution in Rivers etc. The area of different lakes, ponds and river which are
being used as a water resources in the district are detailed in the table.
Table 5.8 Datasheet for Water Quality Management for Alwar
S.No. Details of Data Requirement Units Outcome for District
A Inventory of water resources in District
1 Rivers
[Nos] and
[Length in Km]
Sabi 60
Ruparail 84
Banganga 4
2 Length of Coastline [in Km]
Sabi 60
Ruparail 84
Banganga 4
3 Nalas/Drains meeting Rivers [Nos] Landava Nala 25
Dam [Area in Hectares]
4 Lakes / Ponds [Nos] and [Area
in Hectares]
Jaisamand 4790
Siliserh 845
Mangalsar 958
Mansarovar 843
Rampur 1052
Jaisagar 949
Deoti 1410
Dhamrad 637
Laxmangarh 512
Bhagarikhurd 316
Jiroli 426
Khanpur 920
Harsora 1821
Jaitpur 518
Babriya 1852
Silibari 836
Bigota 410
Tusari 718
Nimbhari 459
Sarankhurd 915
Samarsarovar 359
Atriya -
5 Total Quantity of sewage and
industrial discharge in District
[Automatic]
(SW1a+IW1b)

199
Water Supply and Quality for Alwar District
The responsibility of water supply in the whole district and maintenance of this quality is allocated to
Public Health and Engineering Department (PHED), PHED distributes the water connection
throughout 8 circles into categories: Domestic, Non-domestic, Industrial, and State/Center Govt. as
detailed in the table 5.9. The total number of connections are depicted in the table given below
Table 5.9 City-wise, category- wise data of number of WS connections
City
Water supply connections
Domestic Non Domestic Industrial State /
Centre Govt. Total
Alwar 41778 3819 125 338 46060
Behror 4057 94 0 28 4179
Bhiwadi maintened by phed 1677 0 0 0 1677
Bhiwadi maintened by UIT - - - - 3650
Khairthal 6066 17 0 33 6116
Kherli 2727 3 0 9 2739
Rajgarh 3797 290 15 57 4159
Tijara 2881 72 0 35 2988
PHED have responsibility for distribution of water in all 8 circles of Alwar district. Number of
population which get served through PWS is depicted in the table 5.10. Out of the all circles only
Behror gets 100% water supply by PHED. The remaining population is getting water supply from the
public stand post.
Table 5.10 City-wise, data of population served by piped water supply
City Present Population
Population
served by
PWS
Remarks
(% Pop. Served by
PWS)
Alwar 386707 350000 90
Behror 35438 35438 100.00
Remaining
population
is getting
water
through
public
stand posts
Bhiwadi maintened by phed 126954 76172 59.99
Khairthal 45958 36766 80.00
Kherli 21300 18000 84.51
Rajgarh 32200 25438 79.00
Tijara 29944 26350 87.99
Total 773414 700000
The water supply in all the cities of Alwar district is through ground water only and no surface water
source is available for water supply in the district. The ground water extraction in Kilo Litre per Day
(KLD) for all cities is given in the table 5.11.

200
Table 5.11 city-wise and source- wise data of water supply
City Source
Production of water in KLD Total
Production
in KLD Surface Source Ground
water
Alwar 290 0 33800 33800
Behror 33 0 2745 2745
Bhiwadi maintened by phed 129 0 17139 17139
Khairthal 39 0 2400 2400
Kherli 6 0 700 700
Rajgarh 15 0 1540 1540
Tijara 32 0 4042 4042
Chemical quality testing data on four parameters (Total Coliform, Fluoride, TDS and, Nitrate) for the
Alwar district is shown in table 5.12. Nitrate level for Bhiwadi region is exceeding the permissible
limit of 45 as per BIS standards. TDS for the all regions exceeds the permissible limit. The data for
sample test is shown in the table below. The nitrate content in Bhiwadi city is above the permissible
limit and reached to an alarming state.
Table 5.12 City-wise/PHED circle water quality data
City
Bact.
Quality
(Total
Coliform
per 100
ml)
Chemical Quality ((Min - Max)
Fluoride
Min
Fluoride
Max
TDS
Min
TDS
Max
Nitrate
Min
Nitrate
Max
Remark
Alwar Nil 0.4 0.8 450 860 20 40
Behror Nil 0.60 0.80 850 1270 22 35
Bhiwadi Nil 0.40 0.80 525 712 38 80 Unpotable
Khairthal Nil 0.40 1.00 410 865 18 36
Kherli Nil 0.80 1.2 952 1625 20 32
Rajgarh Nil 0.40 0.80 592 816 18 28
Tijara Nil 0.40 0.80 466 848 15 38
Inferences from Present Scenario
Water quality parameters include chemical, physical, and biological properties and can be tested or
monitored based on the desired water parameters of concern. Parameters that may be tested include
temperature, pH, turbidity, salinity, nitrates and phosphates. The Bureau of Indian Standards (BIS)
has specified drinking water quality standards in India to provide safe drinking water to the people.
According to the Central Ground Water Board, BIS (IS_10500 and revised module IS 10500:2012)
has specifications in Uniform Drinking Water Quality Monitoring Protocol. This standard has two
limits i.e. acceptable limits (Maximum Limit) and permissible limits in the absence of an alternate
source. If any parameter exceeds the permissible limit, the water is considered unfit for human
consumption. The standards of drinking water quality are mentioned in the table 5.13 given below.

201
Table 5.13 Drinking Water Quality Standards
S. No Parameters Permissible
Limit
Maximum
Limit S. No Parameters
Permissible
Limit
Maximum
Limit
1 pH 6.5 to 8.5 No
relaxation 10
Arsenic
(mg/l) 0.01 0.05
2 TDS (mg/l) 500 2000 11 Copper
(mg/l) 0.05 1.5
3 Hardness (as
CaCO3) (mg/l) 200 600 12
Cadmium
(mg/l) 0.003
No
relaxation
4 Alkalinity (as
CaCO3) (mg/l) 200 600 13
Chromium
(mg/l) 0.05
No
relaxation
5 Nitrate (mg/l) 45 No
relaxation 14 Lead (mg/l) 0.01
No
relaxation
6 Sulfate (mg/l) 200 400 15 Iron (mg/l) 0.3 No
relaxation
7 Fluoride
(mg/l) 1 1.5 16 Zinc (mg/l) 5 15
8 Chloride
(mg/l) 250 1000 17
Fecal
Coliform
(cfu)
0 0
9 Turbidity
(NTU) 5 10 18 E. Coli (cfu) 0 0
Figure 5.5 Overhead Water Supply Tank in Rajgarh ULB (27°14'08.8"N 76°36'41.8"E)

202
The picture shows a traditional water conservation structure known as Bawari. With rapid
urbanisation and water pollution are putting enormous pressure on the quantity and quality of surface
and ground water. Water conservation is a key element of any strategy that aims to alleviate the water
scarcity. With the construction of the canal that used to divert the rainwater into the human-made
tanks, the major water issues of the population can be solved.
Figure 5.6 Baveri- Artificial Water Storages Structure (27°14'08.8"N 76°36'41.8"E)
The long-term data indicate that a declining trend has been observed in all the blocks except in
Rajgarh. The declining trend has been resulted due to the overdraft of groundwater resources than its
natural replenishment.
The pH of groundwater makes it alkaline with a range of 7.02 to 8.26, which is suitable for irrigation
and domestic uses. Electrical Conductivity (EC) and fluoride concentration in groundwater have been
found within the permissible limit. Nitrate concentration is found within the maximum permissible
limit of 45 mg/L in the major part of the district, however in Bhiwadi city it exceeds the maximum
permissible limit and therefore water is found to be not suitable for the drinking. TDS for the whole
district is found to be higher than the permissible limit of 500 mg/L and therefore unsafe for the
drinking purpose.
Industrial clusters have been developed at Bhiwadi, Neemrana, and Behror in the Alwar district.
Untreated disposal of effluent into open space and in open depression has caused contamination of
groundwater. At the Bhiwadi cluster pollution studies shows the presence of a high concentration of
toxic substance viz. Cadmium, Lead and Nickle as well as nitrate content is also very high.

203
5.1.3 Action Plan
As per data provided by PHED many circles are having high amount of Fluoride, TDS, and Nitrate.
At Bhiwadi area the water is unpotable due to industrial activity as well as due to the discharge of
untreated industrial wastewater in the open area. The polluting chemicals in the water supplied to
people often go unchecked. The constant supply of polluted water leads to several diseases among
people over the period of time.
Small-scale systems for decentralized solutions for the improvement of water quality that cater to
several families or a small community should be established where water quality is poor. Under a
government initiative the rural areas which have population of about 1,000 residents, the state
government will install an RO plant with a capacity of filtering 500 litres of water every hour.
Membrane filtration systems with primarily reverse osmosis plants should be established for water
and waste-water treatment, in water-scarce regions.
The water supply to the population in only dependent on the groundwater extraction without any
recharge strategy for the depleting ground water. The data provided by the water resources department
depicts that there is sources of surface water. The district has three seasonal river Sabi, Ruparail,
Banganga there are also many lakes/ponds in the district, which have area that can hold large quantity
of water. Lakes are usually situated in valleys that catch the runoff from the surrounding area.
Location of these lakes/ponds needs to be identified needs to rejuvenate its traditional water
management systems as per their suitability for drinking water supply or irrigation purpose.
The seasonal river of the Alwar district can also be used for water supply by making proper
arrangement for the water collection and storage through dam. Anicuts and check dam can be created
to hold some quantity of water in rainy season. By developing the catchment area of these river a
drainage system could be established which will divert the water to a reservoir.
Institutional Reform
There is no close interaction between agricultural managers and water quality managers; it leads to
non-availability of data base which is required to assess the agricultural impacts. If the Government-
operated programmes are inefficient, the project can be outsourced with appropriate Q&A control, use
of Public-Private Partnership, fee-for-service and income generation models can be selected.
Management Strategies
All the blocks are over exploited, thereby, leaving no/limited scope of further ground water
development for various consumptions and area is devoid of sustained surface water bodies. In order
to manage the ground water resources and to control further decline in water levels, a management
plan has to be proposed. The management plan comprises two components- supply side management

204
and demand side management. Since there is very little surface water available in this district, very
little intervention in the form of supply side management could be proposed.
Supply Side Management
The supply side management of ground water resources can be done through the artificial
recharge of surplus runoff available within river sub basins and micro watersheds. Also it is
necessary to understand the unsaturated aquifer volume available for recharge. The unsaturated
volume of aquifer for the Alwar district is computed based on following; the area feasible for
recharge, unsaturated depth below 5 m bgl and the specific yield of the aquifer.
Artificial recharge to ground water through interventions of various structures. The following
parameters are inevitable for planning of artificial recharge to ground water.
Availability of sufficient storage space to accommodate recharged water
Availability of surplus water to recharge
Feasibility of sub-surface geological formations
In case of Alwar district, sufficient sub-surface storage space is available to accommodate the
recharged water.
Out of total computed 128 no. of feasible recharge structures, only 72 are possible as per the
availability of water bodies in the zones of Behror, Mandawar and Neemrana blocks. Remaining
surplus water for recharge of 1.68mcm after intervention of 72 recharge structures, may be
recharged through 9 no. of possible percolation tanks. The additional net ground water recharge is
2.68mcm. Summary of recharge structures and percolation tanks and their cost component is as
below:
Table 5.14 Summary of recharge structures and percolation tanks
Information Figure
Surplus available 3.83 MCM
Number of recharge shafts
(in existing village ponds) 72
No. of percolation tanks 9
Net ground water recharge 2.68 MCM
Total cost of proposed interventions Rs 7.81 crore

205
Demand Side Management
Though not much augmentation can be done through supply side management due to less
availability of surplus water, applying the techniques of demand side management can save large
amount of water. Demand side management has been proposed through two interventions –
changing the more water intensive wheat crop to gram (chick pea) and use of sprinkler irrigation
in the areas where rabi crop is being irrigated through ground water and
Change in cropping pattern
In view of the alarming decline of water level, drastic reduction in saturated thickness of aquifer
and resulting of depletion of aquifer, there is need to bring paradigm change/shift in cropping
pattern in the area. It is proposed to grow low water requirement crop like gram in the instead of
wheat. Growing of gram will save the water to the tune of about 95.72mcm per annum @ 0.1m.
Adoption of modern practice of sprinkler irrigation/improved irrigation practices
Data indicate that flooding method of irrigation is still in practice in many parts of the district
which causes wastage of ample quantity of water. In view of this, it is proposed to bring about
50% of total irrigated area under sprinkler irrigation which may save water to the tune of about
192.23mcm/annum @0.08m. Total cost of sprinkler sets has been computed as Rs. 1201 crore
@50,000/hectare.

206
Table 5.6 Action Area Plan in Different ULBs and Timelines
S.
No.
Action point Deficiency in present status and,
planning for future
Timeline Stakeholders
responsible
1 Ground water
depletion
1) Drying of alluvial aquifer in part of
Behror and Umarain
2) Water level is declining in 13 blocks of
Alwar (in range from 0.018-2.55 m/year).
But there is marginal rising in Rajgarh
block (0.014 m/year)
3) Most of the district falls under ‘over
exploited’ category except Behror and
Rajgarh blocks
Artificial recharge of ground is needed in
this block. Rainwater harvesting should be
encouraged in this are by constructing
anicuts, bunds and check dams. Roof top
rain water harvesting techniques should be
promoted in this area.
Rejuvenation of Bunds/talab should be
done
Immediately
in all blocks
All ULBs
2 Quality of
ground water
1)Contamination issues in industrial
clusters of Bhiwadi, Neemrana, and Tijara
2) Indication of contamination of ground
water with presence of toxic substance in
Bhiwadi. Bhiwadi with CEPI score
82.91(Critically polluted cluster) ranked
6 th
in country
3) Salinity with EC more than 3000µ/cm
has been found in south eastern part of
district which is not fit for the drinking and
agriculture purposes.
4) Fluoride is found within permissible
limit of 1.5 mg/L in major part of district.
Tijara and Ramgarh blocks exceeds the
limit with 3.42 mg/L.
5) Iron concentration is in permissible
limit of 1 mg/L for major block of district
except, Behror and Laxmangarh block was
found with 1.395 mg/L
6) TDS is found to be higher than the
permissible limit of 500 mg/L in all the
ULBs of Alwar district and even more
than 1000 mg/L in Behror and Kherli area
7) Nitrate level was found to be higher
than the permissible limit of 40 mg/L in
Bhiwadi city
Quality of ground water based on fluoride,
nitrate and iron should be measured on
regular basis.
Saline ground water available in the
district can be used for agriculture
Immediately
in all blocks
ULBs- Bhiwadi, Tijara,
Ramgarh, Neemrana,
Behror

207
3 Required
water quality
for irrigation
purpose
1) EC value of 2000 to 3000 μS /cm has
been observed in parts of Neemrana,
Behror, Tijara, Mandawar, Kishangarh
Bas, Reni, Umrain and Kathumar blocks.
Higher EC values varying from 3000 to
10000 μS/cm have been reported from
Ramgarh, Laxmangarh and Kathumar
blocks and EC more than 10000 μS / cm at
25°C has been reported from localized
pockets in Kathumar block which is not
good for irrigation
High water requirement crops need to be
discouraged. Knowledge of low water
requirement crops should be given to
farmers.
Modern agricultural management
techniques have to be adopted for effective
and optimum utilization of the water
resources.
Over the 5-
7 years
ULBs of Neemrana,
Behror, Tijara, ,
Kishangarh Bas, Kherli
5.1.4 Summary
Deteriorating water quality is matter of concern in all over the world in developing countries. Tap
water is not considered as safe to drink without treating it. In developing countries fewer than 10% of
people have access to wastewater collection and treatment. Degradation in the water quality in Asian
countries is causing serious human health issues. Along with human health it is causing ill impact on
aquaculture in surface water resources. The parameters on which the water quality in India is checked
are very less. For better water quality monitoring number of these parameters should be increased.
Water quality monitoring requires a trained worker; it is necessary to improve the system which
manages the water quality management.
Taking into consideration the present scenario of ground water quality in Alwar district, it is observed
that there is decrease in the ground water level over the years. Because of the water supply for the
whole district is depend on the ground water extraction. Without any recharge practices for the ground
water or any water supply source (lake, dam etc.) the water level is going to decrease continuously.
The fresh water availability of Alwar district is through ground water sources. District has high
concentration of nitrates and sulphates which is very harmful chemical constituents in the water. TDS
value of all the blocks in the district exceeds the permissible limits.
By adopting some artificial measures ground water can be recharged. The seasonal river of the Alwar
district can also be used for water supply by making proper arrangement for the water collection and
storage through dam. Anicuts and check dam can be created to hold some quantity of water in rainy
season. Small-scale systems for decentralized solutions for the improvement of water quality that
cater to several families or a small community should be established where water quality is poor.

208
Membrane filtration systems with primarily reverse osmosis plants or adsorption units with suitable
adsorbents like alumina or hydroxyapatite should be established for water and waste-water treatment,
in water-scarce regions. Adoption of some modern techniques in agriculture will help in getting more
yields. Modern agricultural management techniques have to be adopted for effective and optimum
utilization of the water resources.
Table 5.7 Summary of Water Quality Management for all the ULBs of Alwar District
Name of
District Present Status Action Plan for future
Alwar
1)Contamination issues in industrial
clusters of Bhiwadi, Neemrana, and
Tijara
2) Indication of contamination of
ground water with presence of toxic
substance in Bhiwadi.
3)Water level is decling in 13
blocks of Alwar (in range from
0.018-2.55 m/year). But there is
marginal rising in Rajgarh block
(0.014 m/year)
4) EC more than 10000 μS / cm at
25°C has been reported from
localized block which is not good
for irrigation
Survey and Identification of the area
Artificial recharge of ground water by means of
rainwater harvesting, anicuts and check dams.
Water should be treated before providing to community
for drinking purpose
Modern water treatment techniques such as membrane
filtration systems with primarily reverse osmosis plants
and adsorption units with suitable adsorbents like
alumina or hydroxyapatite should be established for
water and waste-water treatment, in water-scarce
regions
Modern agriculture management techniques have to be
adopted for effective and optimum utilization of water
resources.
Identify fresh water aquifers through borehole logging
to avoid failure of tube wells in saline belt.
5.2 Rainwater Harvesting
Rainwater Harvesting is referred to as the collection of rain water in household tanks and tunkies,
local surface storages like dams or tanks and anicuts and subsurface aquifers through roof-water
harvesting constitute a fair source of water supply to fulfil our needs. Shekhawati region is known for
having different water storage structures through centuries. The surface water harvesting structures as
local tanks and ponds or an exclusive storage for water supply should not only be developed but also
maintained properly in all district towns and villages (Singhai et al., 2019). The ground water
structures should also be supported through additional recharge on sustainable basis. An integrated
approach of water management is essential for sustainable water supply (G. Singh, 2012).

209
Figure 5.7 Slogan Writing for Water Conservation
Watershed Structures
Check dams/ Ponds and Anicuts Water harvesting structures should be maintained on priority by
people’s participation, sharing with them locally generated resources in terms of water, fodder,
vegetation, wood and land on rent or lease. Large scale watershed structures may be planned and
implemented as per real site-specific design requirements. Integrated Watershed Management
Programme (IWMP) is a modified programme oferstwhile Drought Prone Areas Programme (DPAP),
Desert Development Programme (DDP) and Integrated Wastelands Development Programme (IWDP)
of the Department of Land Resources. The main objectives of the IWMP are to restore the ecological
balance by harnessing, conserving and developing degraded natural resources such as soil, vegetative
cover and water. Different project has been completed through IWMP, area which was covered
through implementation is given in the table below.

210
Table 5.15 Locations of Watersheds in Alwar
(Integrated Watershed Management
Programme) IWMP No. Location, (Alwar) Area (ha)
IWMP-27 Neemrana 4755
IWMP-28 Jatpur (Ramgarh) 7902
IWMP-29 Kathumar 4891
IWMP-30 Jamdoli (Reni) 7264
IWMP-31 Umrain 5000
IWMP-32 Silapata 4400
Surface Water Structures
The water structures such as Anicuts, Tanks, and Dams are divided between Panchayat department
and Irrigation department. Normally irrigation tanks of more them 50 mcft capacity are with Irrigation
department. Panchayat department should get activated to manage planning, design, construction, and
maintenance of their water structures by arranging money (budget) and manpower on priority. All
structures need proper maintenance and management through people’s active participation. Water
User Associations (WUAs) who should be properly educated and equipped with the intervention of
government and NGOs. There is a need of large-scale planning and implementation of small tanks &
dams.
Ground Water Structures
These water structures are completely under the fold of private farmers except that of drinking water
structures under PHED. Farmers are more anxious to drill new bore wells or replace open wells by
bore wells at high cost, which is a dangerous/ negative economic trend and need to be curbed due to
over exploitation and mining of ground water at great environmental risks. Over 121 pumping of
ground water should be checked & controlled through education restriction in power supply and
legislative regulation & control. Feasibility of deep bore well drillings should be checked.
Water Supply Structures
Water Supply Structures run by the Public Health Department (PHED) should also develop its own
surface water tanks/ dams or renovate existing tanks at its own cost and maintain, protect and manage
drinking water wells & bore wells/ tube wells and avoid depletion of water table and pollution. Pump
houses need to be constructed on drinking water tube wells (mobile or permanent as per the health of
the structure). PHED may monitor water levels and quality of all its wells, hand pumps, bore wells
and anicuts.

211
5.3 Domestic Sewage Management Plan
5.3.1 Literature review
Domestic sewage consists of wastewater produced by households, businesses, and organisations in a
given area. It transports wastewater from numerous establishments such as kitchens, toilets, and sinks.
Domestic wastewater is mainly classified into three forms: (i) Black water – water grossly
contaminated with human excreta e.g., toilet water, composting toilet leachate; (2) Grey water – water
that comes from the kitchen, bath/shower and laundry. (3) Sewage – a combination of both black and
grey water (A. K. Biswas & Tortajada, 2019).
Improper sewage management can have a variety of negative environmental consequences. The
degradation of surface water occurs when untreated sewage is discharged into water bodies. Sewage
may potentially contaminate groundwater as a result of poorly constructed infrastructure. Waterborne
diseases such as cholera, typhoid, and polio are spread through contaminating surface and
groundwater. (Yoder and Rankin, 1998).
Domestic wastewater is expected to be 22,900 million liters per day (MLD) in metropolitan areas,
compared to 13,500 MLD for industrial wastewater in India. Domestic wastewater treatment capacity
is just 5,900 MLD as compared to 8,000 MLD for industrial wastewater. The data shows that only
25% of domestic wastewater is treated per day and almost 75% is directly discharged into open land
and water bodies. As a result, there is a significant treatment gap in domestic wastewater treatment.
Based on the average wastewater generation recorded during CPCB's, per capita wastewater
generation is roughly 121 litres per day. Wastewater generation is expected to reach around 132000
MLD by 2051, based on the estimated population.
The per capita water supply and sewage generation have a linear connection. According to Central
Public Health and Environmental Engineering Organization (CPHEEO) estimates, wastewater
accounts for 70-80 percent of total water provided for domestic consumption. The wastewater
generation per capita in India's Class-I cities and Class-II towns, which account for 72 percent of the
country's urban population, is projected to be around 98 lpcd.
According to a study by the Central Pollution Control Board, Rajasthan has established 16 STPs in
selected towns with a total treatment capacity of 384.5 MLD. A total of 11 STPs with a capacity of
149.3 MLD have been built or are in the process of being built. In addition, further 36 STPs with a
capacity of 322.12 MLD are intended to be built (NIUA, 2019).
Technologies for Domestic Sewage Waste Management
Sewage Collection Systems
Sewage collection systems which includes underground pipes, manholes, and maintenance structures
used to convey wastewater to a sewage treatment facility, where it is treated through various physical

212
and chemical processes to make it reusable. The wastewater collection system is one of the most
valuable and largest infrastructure assets which can brought dramatic improvements to public health.
Most sewers carry wastewater from households and commercial establishments of a city/town and are
referred to as domestic sewage waste.
In Sewage treatment plant, unit operations and processes are grouped together to provide various
levels of treatment such as preliminary, primary, secondary (biological treatment), and advanced (or
tertiary) treatment. In preliminary treatment, large objects, rags, and grit are removed, whereas in the
subsequent primary treatment units, a physical operation, usually sedimentation, is used to remove the
floating and settable materials. In Secondary treatment methods, biological and chemical methods are
used to remove most of the organic matter from wastewater. Most common secondary methods such
as the Activated Sludge Process (ASP), Waste Stabilization Pond (WSP), Up Flow Anaerobic Sludge
Blanket (UASB) Reactor, and other traditional sewage treatment technologies are routinely employed
in sewerage systems to treat wastewater up to secondary levels in line with effluent regulations. Due
to advantages such as minimal land needs, high effluent quality, and so on, JNNURM projects have
allowed technologies such as Sequencing Batch Reactor (SBR) and Moving Bed Biofilm Reactor
(MBBR)/ Fluidized Aerobic Bioreactor (CPHEEO, 2012) for their use in sewage treatment plant as an
secondary treatment.
Sequencing Batch Reactor (SBR)
This ASP consist of five steps, which are carried out in sequence as follows: (1) fill, (2) aeration
(reaction), (3) settling (sedimentation/clarification), (4) decanting, and (5) idle (for sludge settling).
The sewage water is treated in a sequence of sequential and possibly simultaneous reactions in the
same basin on a timed cycle. As a result, dual basins are used, with one tank settling and discharging
the treated sewage in a cyclically repeated process while the other basin is at the aeration stage of the
cycle. It is preferable to utilize fine bubble non-clog membrane diffused aeration with a high
efficiency. In comparison to the well-known reaction kinetics of continuous flow steady state ASP for
the sewage features, the bio-kinetic response rate in the non-steady state batch process needs to be
explored for its larger rate or otherwise. The Sequencing Batch Reactor (SBR) process is depicted in a
schematic diagram (CPHEEO, 2012).
Figure 5.8 Sewage Treatment Technologies

213
Moving Bed Bio Reactor (MBBR) / Fluidized Aerobic Bioreactor (FAB)
The material suspended in the reactor provides extra surfaces for the microorganisms to thrive on,
making this technology similar to activated sludge. This, in turn, maximizes the development of
microorganisms in a given volume of aeration tank, making it appear to be advantageous in that
regard to ordinary aeration without the media. Diffuse aeration is, of course, essential. The FAB
technique is similar to MBBR, except that the media in the aeration tank is fixed and fluidized rather
than suspended. The figure depicts a schematic flow diagram of the MBBR process (CPHEEO, 2012).
Figure 5.9 Schematic flow diagram of MBBR process (Source: urbanindia.nic.in)
Membrane Bio Reactor (MBR)
This system integrates the aeration and secondary clarifier in one tank by sucking out the aerated
mixed liquor through membranes rather than settling in a separate downstream tank. It produces
treated sewage with virtually no BOD and suspended solids, making it clear and nearly transparent, as
well as its better ability to hold and sustain mixed liquor suspended solids (MLSS) makes it superior
than other ASPs. Diffuse aeration is, of course, essential. Because the membrane is a proprietary
issue, the throughput per membrane module offered by various manufacturers varies, as do the shapes
of membranes promoted by each vendor, such as flat sheet, cross flow, dead end flow, and so on.
Therefore,universally recognized standard design criteria are difficult to come by. Figure shows a
schematic flow diagram of the Submerged Membrane Bioreactor process. (CPHEEO, 2012).

214
Figure 5.10 Schematic flow diagram of Submerged Membrane Bioreactor process (Source:
urbanindia.nic.in)
Approach towards Recent Technologies
When formulating the DPR for STPs, a techno-economic feasibility analysis of all conventional
technologies such as the Activated Sludge Process, UASB, WSP, and other technologies such as SBR,
MBBR, and others approved under JNNURM may be carried out, and the most appropriate
technology suitable for the local conditions may be proposed in the DPR. During the techno-economic
analysis, life cycle costs for all of these technologies can be evaluated, taking into account capital
expenses, operating and maintenance costs for a certain period, land costs, and so on. Input quality,
effluent quality standards, effluent quality for reuse, and resource recovery (gas/electricity generation)
are all aspects to be considered for selecting the most suitable technology. The schedule of rates or the
previously awarded cost of similar capacities of STPs (average cost of other STPs) based on these
technologies in the relevant State can be used to develop a detailed cost estimate for the STP.
Constructed wetlands
Constructed wetlands have certain distinct advantages over other treatment systems, despite the fact
that their principle is similar to those of other technologies. It is an organic wastewater treatment
system that boosts the efficiency of procedures that filter water in the same way that naturally
occurring wetlands do. Water, aquatic plants (such as reeds and duckweed), naturally occurring
microorganisms, and a filter bed (typically made of sand, soils, and/or gravel) are all necessary
components of the system. Constructed wetlands can handle secondary or tertiary wastewater
treatment. There are a variety of design, technology, and material alternatives that can be used to
tailor the created wetland according to the land availability and local conditions.
The main idea behind this method is that plants, microbes, and substrates all work together to purify
water. Water is first slowed as it reaches the marsh to allow solids to settle. Meanwhile, plant roots
and the substrate remove the bigger particles in the effluent. Pollutants and nutrients in wastewater are
then naturally broken down and absorbed by bacteria and plants. The pathogens in wastewater are

215
also killed by the wetland's retention time, UV radiation, and antibiotics secreted by plants. The water
can then be released safely into surface waterways or utilised for a variety of reasons.
Wetland technology has a number of distinguishing characteristics: Construction, operation, and
maintenance costs are low; wastewater from human waste, agricultural runoff, storm water, and some
metals or pollutants from mining and industry are effectively treated; and a home for plants and
animals is provided, contributing to environmental protection. These wetlands employs basic
technology that is easy to comprehend and administer; operations consume little energy; treated water
can be reused; aids in the maintenance of groundwater and surface water levels; and provides a way of
water storage and pleasant natural aesthetics (Mustafa, 2013).
Fecal Sludge & Septage Management:
Fecal Sludge and Septage Management (FSSM) is important in the Indian context since roughly 60%
of homes rely on on-site sanitation facilities. Because FS&S has a high polluting capability and can
affect both humans and the environment, and thus careful management is required until its safe
disposal/end-use. The cost of inadequate sanitation to the country is enormous, and thus making
efficient management of fecal sludge and septage collected from onsite sanitation systems (OSS) such
as septic tanks and leach pits are even more important. Recycling and repurposing can be used in
agriculture as an oil conditioner and fertiliser.
Fecal Sludge & Septage Value Chain
The FS&S value chain starts with the user interface, which is toilets (individual, community, and
public), emptying, transportation, treatment, and reuse/disposal. Domestic FS&S becomes a resource
once it is properly managed. FS&S is a beneficial soil conditioner that contains nutrients that can help
farmers lessen their dependency on artificial fertilizers. Figure 5.41 depicts the procedure for treating
fecal sludge.
Figure 5.11 Process followed in fecal sludge treatment (Source:cpeeho.gov.in)

216
Financial Sustainability of Sewerage and Sewage Treatment Services
The bulk of India's metropolitan municipal administrations are financially stressed and unable to carry
out their assigned obligations for a variety of reasons. Sewerage and sewage treatment, as well as
sanitation, have gotten minimal attention. According to the study conducted by National Institute of
Urban Affairs (NIUA), sanitation services either earn no money or produce a small amount of money.
Because India's current sewage tariff levels are too low and do not reflect the true economic cost of
providing sewage collection, treatment, and disposal services, and thus raising tariffs to a level that
ensures the sewerage system generates enough revenue to cover capital and operating costs and
becomes self-sustaining may not be possible in one fell swoop. This could be accomplished by
progressively increasing tariffs over time.
It is recommended that tariffs be set early on to ensure that they cover at least the sewer system's
O&M costs. After operational efficiency is established with the infusion of private sector
participation, user approval of a tariff increase by ULBs will improve.
Rates can then be raised to cover capital as well as operating and maintenance expenditures. In the
case of a PPP, the concession should be built to support a rising tariff scenario, with promises from
ULBs to raise charges in the future and requirements from the private partner to increase service
levels.
Governance and Management
The principles in the National Urban Sanitation Policy (NUSP) of 2008 should be adopted for
designing wastewater management projects in urban areas, and the City Sanitation Plan (CSP). A
variety of technologies, such as a traditional sewerage system, decentralised wastewater management
systems, or on-site sanitation, could be used for management. The following principles are set by
NUSP (2008)
● Elimination of Open Defecation
● Conversion of insanitary toilets to sanitary ones
● Retrofitting of on-site containment/treatment structures like septic tanks as per recommended
specifications
● In areas where water supply is inadequate, provision for decentralized wastewater management
system including treatment and non-conventional sewers (settled or simplified sewers/small bore
sewers)

217
● Fecal sludge and septage management in areas dependent on on-site sanitation in the form of
leach pits, twin pits, septic tanks with/without soak pits etc. – desludging of containment units,
transportation, treatment and reuse/disposal
● Mechanization of cleaning of sewers and emptying of septic tanks, safety gear for sanitation
workers
● Planning for conventional sewerage system in areas with a minimum of 135 lpcd water supply or
where contemplated
● Plan for recycling and reuse of treated wastewater and sludge
● Provision of public toilets with appropriate containment/treatment systems
Urban Local body
The Rajasthan Government has formulated a detailed State Sewerage and Wastewater Policy
(SSWWP) to address the problems of centralized sanitation. The important provisions of this policy
are as follows:
● All ULBs will prepare city sanitation plans (CSP) in accordance with\the Central Public Health
and Environmental Engineering Organization’s (CPHEEO) revised Manual on sewerage and
sewage treatment as published in 2013.
● These plans have to be in accordance with the overall town plans so as to avoid mismatches in the
development and to ensure the proper treatment and reuse of wastewater.
● Technologies such as Geographical Information Systems (GIS), Ground Penetrating Radar (GPR)
and Total Station Surveyors (TSS) should be used to prepare detailed maps of the sewer network.
These maps should be updated every ten years and linked to an MIS (Management Information
Systems) for detailing the assets and their parameters.
Best Practices
This section describes case studies from specific regions/cities.
Surat city is located on the west coast of India, in the southern part of Gujarat state. Surat Municipal
Corporation (SMC) has undertaken numerous initiatives to improve the city environment in various
ways and the results are visible in the city's sewage treatment capabilities. It has expanded sewerage
networks in the urban areas and upgraded existing STPs to provide for secondary treatment processes
under JNNURM. Sewage gas generated in these STPs during the anaerobic process of sludge
treatment is utilized as a fuel to run gas engines to produce electrical energy that replaces grid
electricity required to run the sewerage system. The main focus of the approach followed by SMC is

218
the actions taken for climate change mitigation resulting in the reduction of greenhouse gas (GHG)
emissions and any additional benefits that may be associated with the action.
Planning and design of wastewater treatment facilities offers more possibilities for energy
conservation. After sewage treatment, a particular amount of sludge is generated. It consists of
residual organic matter and dead bacteria used in the treatment process. This can be used for
agricultural purposes as manure after primary and secondary treatment. It can help in reduction of
usage of chemical fertilizers. Initiative of good sewage treatment also helps in reduction of water
pollution. Sewage generated from households, restaurants, and commercial buildings usually contain
microorganisms such as bacteria, virus, fungus or parasites which may create water borne diseases.
Treated sewage will help to reduce the chances of the above consequences. It will also help to
increase the chances of better public health and reduction in mortality rate (Espíndola & Presents,
2020).

219
5.3.2 Present scenario and gaps identification
Data Provided by ULBs
Inventory of Sewage Management
As per the data provided in the table below the district has three Class II and Class III towns based on
the Census classification of towns. Alwar being the most populous city also produces the highest
amount of domestic sewage (5 MLD) in the district.
Table 5.16 Report on Inventory of domestic sewage
Details of Data Requirement
Measurable
Outcome Alwar
Bhiwadi(Tehsil-
Tijara)
Population 3,41,422 1,04,921
Inventory of Sewage Management
Total Quantity of Sewage generated in
District from Class II cities and above [MLD] 5 4
No of Class-II towns and above [Nos]
No of Class-I towns and above [Nos]
No of Towns needing STPs [Nos] 5 5
No of Towns STPs installed [Nos] 5 4
Quantity of treated sewage flowing into
Rivers (directly or indirectly) [MLD] 0 0
Quantity of untreated or partially treated
sewage (directly or indirectly) [Automatic]
4
Quantity of sewage flowing into lakes [MLD]
0
No of industrial townships [Nos]
1
Adequacy of Sewerage network
% sewage treated in STPs [Automatic] 58 4
Total available Treatment Capacity [MLD] 20 MLD 9.2
Additional treatment capacity required [MLD] Nil
No of ULBs having partial underground
sewerage network [Nos]
No of towns not having sewerage network [Nos] 1
% population covered under sewerage
network [Automatic] 64%

220
Inferences from Present Scenario
Wastewater generation in the Alwar and Bhiwadi is about 5 MLD and 4 MLD, respectively as per the
data received from Alwar and Bhiwadi ULBs. The wastewater quantities that are being generated
currently from all the ULBs are not estimated. During the ULB visit, it was found that the domestic
sewage management for the Nagar Palika (Tijara, Kishangarh Bas, Khairthal, Ramgarh, Laxmangarh,
Rajgarh) are very poor and no drainage system for the domestic sewage is functioning.
As per the data, the 64% household have sewage network connection and the remaining population
has no option but to discharge the household wastewater directly into the open area as evident from
the Fig. 5.14. Looking at the present scenario, it is utmost important to establish a collection system to
collect the sewage from the households. The entire population of the city should be covered under the
domestic sewage network system. Out of the total sewage generated, only 58% and 4 % is treated at
the STP of Alwar and Bhiwadi city respectively, and the remaining is disposed in an open area. For
Alwar district the installed capacity of the STP is 20 MLD but only 58% of the sewage is being
treated indicating the poor quality and improper maintenance of the STP. Which depicts that the STPs
are not functioning properly. During the site visit at STP (Fig 5.13) it is found that the plant is not
functioning. The filter screen of the plant was not functioning during the visit (Fig 5.13 E) and the
plant was operated by un-skilled labors.
From the data and physical observations during the site visit it is concluded that there is no proper
functioning of Domestic sewage management with connection, collection, and treatment phases.
Figure 5.12 Google Earth view of 20 MLD STP, Alwar ULB

221
Fig. A Fig. B
Fig. C Fig. D
Fig. E Fig. F

222
Fig. G Fig. H
Figure 5.13 20 MLD STP at Alwar ULB (27°30'46.3"N 76°44'47.1"E)
Fig.A Kishangarh Bas Fig.B Ramgarh
Fig.C Ramgarh Fig.D Ramgarh

223
Fig.E Ramgarh Fig.F Laxmangarh
Fig. G Laxmangarh Fig.H Laxmangarh
Fig.I Laxmangarh
Figure 5.14 Site Picture of Status of Domestic Sewage in ULBs

224
Figure 5.15 Google Map View Waste water in Market Laxmangarh ULB (Coordinates- 27°21'53.3"N
76°51'43.0"E)
Figure 5.16 Domestic Sewage dump site, Ramgarh ULB (Coordinates- 27°35'39.5"N 76°49'06.5"E)

225
5.3.3 Action Plan
To avoid the harmful effects of wastewater, it becomes important to treat the wastewater generated in
a ULB. Although 100 % of the wards in a municipality may be connected to sewer network, the
whole arrangement without a STP would be posing a serious risk to the general public and the
environment. Sewage Treatment plants are used to treat sewage generated from residential,
institutional, commercial and industrial establishments which includes household waste liquid from
toilets, baths, showers, kitchens, sinks and so forth that is disposed of via sewers. In India, different
treatment technologies like ASP, UASB, Oxidation Pond and advanced technologies like SBR, MBR
are adopted for the treatment of sewage. On the basis of a country-wide study done in India, CPCB
concluded that 816 number of STPs (including operational, non-operational, under construction and
proposed) are available having treatment capacity of 23,277 MLD equipped with different
technologies like ASP, OP, USAB, SBR etc. It was also find out that maximum STPs having ASP
based treatment technology and nowadays SBR based technology widely used for the treatment of
sewage (CPCB, 2015).
Treatment wetlands are also promising technologies with a number of advantages (e.g., low cost and
maintenance), especially for ULBs with smaller population (IWA, 2017). Costs associated with the
construction of the treatment system can be divided into direct costs (land acquisition, earthwork,
pipes and fittings, pumps, filter media, liner, and plants) and indirect costs (site evaluation, permitting,
and start-up services). Main O&M cost components include energy to run pumps (when necessary),
compliance monitoring, maintenance of access roads and berms, and replacement or repair of
mechanical components. If the wetland system can be loaded via gravity, no external energy is
required and thus no pumping costs occur. Costs for vegetation management depend on items such as
harvesting and pest control. Current design guidelines for VF wetlands foresee cutting of plants and
removal of litter every two to three years. In general, less labor is required for O&M of treatment
wetlands compared to other wastewater treatment plants. Thus, O&M costs of treatment wetlands are
lower than those for other conventional wastewater treatment technologies
In Alwar district, the sewage treatment plants have been constructed in the ULBs where sewer
network have been laid. From data available, it can be deduced that treatment plants are not being
utilized for their full capacity as the sewer network has not reached all the wards in the municipality.
For such ULBs, urgency should be demonstrated in laying the sewer network. It is also very important
that all the ULBs should have their own STPs and necessary steps should be initiated to commission
STPs at all ULBs on immediate basis.
The ULBs which are yet to construct their STPs can go for a combination of technologies e.g., one
plant may be based on SBR, while a new one may be constructed based on treatment wetland
technology. The ULBs having smaller population have the advantage of land availability and cheap

226
labor (as the living cost is lower in these areas). Both factors vigorously support the treatment wetland
technologies. As most of the ULBs still do not have connectivity to wastewater collection system, it
becomes important to plan and lay down the complete sewage network system. Apart wastewater
management, the development of strategies and treatment options to manage the fecal sludge should
also be initiated.
The properties of FS that require attention during treatment are BOD, Ammonia, suspended solids and
pathogens. The treatment of FS includes solid-liquid separation first and then treating the liquid and
solid streams separately. Solid-liquid separation can be done by: (i) drying beds, (ii) settling tank, (iii)
settling pond, (iv) Anaerobic digestion, (v) co-treatment with sewage sludge. For the solid fraction,
various technologies available are: (i) co-composting with organic solid waste (ii) natural drying. For
the liquid fraction, treatment can be carried out using: (i) co-treatment with wastewater (ii) waste
stabilization ponds and (iii) constructed wetland.
Table 5.17 Actions and timelines for domestic waste management
S.
No.
Action point Deficiency in present status and,
planning for future
Timeline Stakeholders
responsible
1 Inventory of
Sewage
collection
network
1) 100% households are not connected
to sewerage network in any of the
ULB.
2) Survey and identification of all
households to ensure proper drainage
of sewage in all the ULBs.
1-year All Nagar Parishad and
Nagar Palaika
2 Provision of
Sewerage
Network
1) Sewerage networks are to be laid in
all the ULBs and accordingly the
capacity of the existing STPs should
be enhanced and updated with the
latest technologies.
2) To take advantage of the sewerage
network, quality assurance for the
sewerage pipes should be an ongoing
activity and not be limited to at the
time of construction only.
3) For all new Greenfield
developments, sewerage network
should be designed and installed
before the construction starts.
5-years All Nagar Parishad and
Nagar Palaika

227
3 Adequacy of
available
Infrastructure
for Sewage
treatment
1. Presently STPs available are under-
utilized in Alwar and Bhiwadi due to
poor maintenance.
2. Only Alwar and Bhiwadi city have
their own STPs and therefore it is
utmost important to establish new
STPs in the remaining ULBs
2. Efforts should be at priority to
utilize the full capacity of these STPs.
More areas have to be connected to
sewer network and to STP in turn.
3. STPs should be operated by the
skilled labor and regular inspection of
the STPs should be made
4. A combination of technologies
should be employed for treatment. The
advantage may be in potential to treat
domestic wastewater and other streams
e.g. fecal sludge or leachate from the
sanitary landfill.
3- years
for
utilizing
the full
capacity of
STPS;
5-years for
installing
the
treatment
plants to
the full
capacity.
All Nagar Parishad and
Nagar Palaika
4 Fecal sludge
management
A program should be undertaken by
the ULBs inspecting tanks for leakages
A regular monitoring program for
groundwater across the ULB and
subsequent analysis will also help
understanding the relation between
fecal sludge and groundwater quality.
Regular emptying of tanks by
awareness campaign
Use of information and
communications technology (ICT) for
GPS tracking of trucks and mobile
applications (apps) to centrally
coordinate service providers
Selection of appropriate technology for
fecal sludge treatment
Immediate All Nagar Parishad and
Nagar Palaika

228
5.3.4 Summary
As of now only partial of urban population is covered with sewerage system and the remaining is
either serviced on onsite sanitation facilities or unserviced. Out of the total 12 ULBs, only 2 ULBs i.e.
Alwar and Bhiwadi have their own STPs. Moreover, these STPs are not functioning at their full
capacity due to poor maintenance and management by unskilled labor. Only 64% population of the
Alwar city is connected through the sewage network system. In the present scenario it is necessary to
do the survey and identification of all households to ensure proper drainage of sewage and connecting
each and every household to the sewerage network. Efforts for full utilization of existing STP by
updating the existing STPs with latest technologies, proper maintenance of the STPs, Skill
development of the labor, and regular inspection of STPs should be made. It is also necessary to
establish new STPs in all the ULBs which do not have their own STPs. The sewage connection,
collection, and treatment should me managed and monitored
Table 5.18 Summary about Domestic Sewage Management Alwar District, highlighting present status
and action plan for future
Name
of
District
Present Status Action Plan for future
Alwar
The estimated quantity of domestic
sewage generated in Nagar Parishad
is 5 MLD (Alwar) and 4 MLD
(Bhiwadi)
% Sewage treated- 58% for Alwar
and 4 % for Bhiwadi
% population covered under sewerage
network- 64% (Alwar)
Survey and identification of all households to
ensure proper drainage of sewage and connecting
each and every household to the sewerage network
Efforts for full utilization of existing STP, proper
maintenance of the STPs, Skill development of the
labor, Inspection of STPs
Establishment of new STPs in all the ULBs which
do not have their own STPs
Sewage connection, Collection, and treatment
should be Managed and Monitored.

229
6. Air and Noise Pollution Management Plan
6.1 Air Quality Management
6.1.1 Literature Review
The level of pollution-free environmental air, assessed by a number of pollution indicators, is called
air quality. It has an impact on our health, the livability of our communities, and the environment. Air
pollution, especially that caused by human activity, can cause heart and lung difficulties, as well as
cancer. The health of one can also be hazardous to short exposure to air pollution. Air pollution
affects children, elderly people and anyone with heart or lung diseases in a very detrimental way. For
example, a person consumes roughly 2-4 litres of water per day, whereas the total volume of air
inhaled per day is approximately 15,000 gallons. Air quality monitoring offers information on the
current state of the air. It aids in the evaluation of current policies as well as their effective
implementation. Planning, designing, and establishing a monitoring network based on air quality
objectives is an important component of any air quality monitoring programme (Gulia et al., 2015).).
Air pollution has been a major cause of concern for India, a developing country trying to achieve a
balance between development and environmental conservation. In this regard, India accept the
foundations of sustainable development as the cornerstone for a nation's long-term economic
prosperity and is working to solve the critical issue of air quality control (Kapoor, 2012).
According to Article 253 of the Constitution, the Air (Prevention and Control of Pollution) Act, 1981,
the United Nations Conference on Human Environment held in Stockholm in June 1972, in which
India participated, was adopted to implement the conclusions taken. Sustainable development is an
inherent aspect of India's development ideology in terms of improving human well-being. In the last
three decades, India has gone through an accelerated phase of industrial activities. The corresponding
boom in urban development and industrialization led in a considerable increase in pollution,
especially the atmosphere. In recent years, pollution levels in medium and small towns and cities have
increased, quickly reflecting in India's non-attainment cities. In recent years, air pollution has become
a big problem, mainly due to its adverse health consequences (Sundaray et al, 2020).
Air pollution management programmes have concentrated on point and area source emissions since
the enactment of the Air Act in 1981, and many localities have benefited from these measures.
Despite the high level of control given to numerous point sources, most cities in the country continue
to have particle non-attainment concerns due to aerosols of unknown origin (or those not considered
for pollution control) (M. Sharma, 2020).
India is dedicated to creating a pollution-free environment and clean air and water. India's
environmental conservation and environmental protection requirements within the SDGs are reflected

230
in the fact that for quite some time many administrative and regulatory measures, including a distinct
air and water pollution statute, have existed (Sundaray et al, 2020).
All of the activities that a regulatory authority conducts to assist protect human health and the
environment from the adverse impacts of air pollution are referred to as air quality management. As
shown in Figure 6.1 Air Quality Management Cycle, the process of managing air quality can be
depicted as a cycle of interconnected aspects (EPA, 2020a).
The Air Quality Management Plan (AQMP) is a methodical approach for evaluating air pollution
control strategies proposed in order to lower air pollution levels in metropolitan areas. This method
combines air quality modelling and mathematical programming approaches to create a decision-
support system for determining the best combinations of air pollution reduction choices based on the
characteristics and demands of the locations being studied (Gulia et al., 2015).
Figure 6.1 Air Quality Management Cycle
Modelling air quality is useful for the development and administration of air pollution control because
it guides good planning for air quality. Its major goal is to predict ambient air pollutant concentrations
of one or more species in place and time as a function of independent variables like emission and
meteorological variables (Gulia et al., 2015)

231
In terms of Air Quality Measurements; approximately five air quality measurements have been
prevailing in the district namely, PM10 (particulate matter of size under and equal to 10 µm diameter),
PM2.5 (particulate matter of size less than and equal to 2.5 µm diameter), SO2, NO2, VOCs (volatile
organic compounds) etc. The vehicle emission contribution is significant for CO, NOx, PM10Band
PM2.5. There is a relatively large contribution of diesel vehicles (trucks, buses, cars, etc.) to PM10, CO,
SO2, PM2.5 and NOx. Out of about 7 t/d emission of PM10 and PM2.5 from vehicles, over 80% is from
diesel vehicles, especially from trucks and buses. Therefore, control measures have to focus on
advanced technological intervention for diesel vehicles or change in fuel to CNG (compressed natural
gas) especially local transport of buses and light commercial vehicles (M. Sharma, 2020).
Air Quality Index
An AQI is described as an aggregate system that turns into a number or set of weights the separate
factors associated with air pollution (SO2, CO, visibility, etc.) (CPCB, 2014).
Figure 6.2 Breakpoints for AQI Scale 0-500 (units: μg/m3 unless mentioned otherwise)
Rajasthan is located in the country's arid and semi-arid agro-climatic zone; therefore, dust is frequent
due to dry climatic conditions combined with strong hot air movement. When the phenomena of
thermal inversion occur in the summer and winter, the presence of Particulate Matter in the
atmosphere is particularly high. At all CAAQMS locations, the yearly average from January to
December 2019 shows that both particle pollutants, PM2.5 and PM10, are typically over acceptable
levels.
Governance and Management
Following the 1972 Stockholm Conference on the Human Environment, Indian politicians grew
interested in ways to manage air pollution and realised that environmental legislation was needed in
order to reduce air pollution. The Air (Prevention and Control of Pollution) Act of 1981 was enacted

232
as a result, with the purpose of preventing, controlling, and abating air pollution. It is a comprehensive
law that authorises SPCBs to identify pollution management areas, to limit certain industrial plants to
minimise their air pollutant emissions, and to enter, inspect, and monitor these areas. It is also a
complete legislation. In addition, the CPCB provides technical help and guidance to the SPCBs, as
well as conducting and sponsoring air pollution investigations and research.
The CPCB issued the first ambient air quality regulations for 3 criterion pollutants (SO2, SPM, and
NO2) separately for industrial, residential, and sensitive regions in 1982. In 1994, the NAAQS were
updated to include 3 more contaminants for everyday and yearly averages (except CO which is 8-hour
average). In 2009, the most recent NAAQS were amended for a total of 12 contaminants (Gulia et al.,
2018).
Monitoring ambient air quality is a major part of Urban Local Air Quality Management since it
monitors current air quality and reviews existing policies. By comparing pollutant concentrations to
criteria, air quality monitoring is used to recognize and proclaim NAAs. CPCB has already created a
methodology for ambient air quality monitoring, which includes real-time continuous monitoring
(Brauer et al., 2019).
Central Government
Under the National Air Monitoring Programmes, in 28 states and 7 Union territories India has 793
stations (NAMP). There are 261 continuous Ambient Air Quality Monitoring Stations connected to
the web-based system giving Real-Time Ambient Air Quality information in 134 cities across 23
states and union territories.
Figure 6.3 Schematic of an integrated global to local framework for air quality monitoring.

233
City-specific action programmes have been designed and implemented in 122 non-attainment cities
recognised by the CPCB based on air Quality levels above national environmental standards
(NAAQS) from 2014 to 2018. Controlling automobile emissions, road dust, biomass/crop/MSW
burning, building activity, industrial pollution, and other city-specific sources are all part of city
action plans (MoEFCC, 2020).
The CPCB estimates 4 monitors per 100,000 inhabitants (for urban areas), which is comparable to
monitor density in the United States and several other high-income nations with similar population
density. In accordance with the CPCB recommendations, the high estimate of CPCB contains
increased monitor density in key cities; to achieve this high estimate, India would need to be the most
densely monitored country in the world (Brauer et al., 2019).
Rules and regulation for air quality management has been defined under different laws which are
specified in the Table 6.1.
Table 6.1 Other Applicable rules and regulations for the district
Law Description Requirement
Environment (Protection)
Act, 1986 and CPCB
Environmental Standards.
Emissions and releases from facilities to be
established or renovated or expanded conform to
the norms notified
Rajasthan State
Environment Policy, 2010
including And Rajasthan
Environment Mission and
Climate Change Agenda
for Rajasthan (2010-14)
The main targets and policies are - conservation
and enhancement of natural resources; ensuring
environmental sustainability of major economic
sectors; and improved environmental governance
and capacity building - It offers specific policies
and activities to tackle critical environmental
problems: water resources, desertification and
land degradation, forest and biodiversity, air
quality, climate change: adoption and mitigation,
mining, industry, tourism, energy, urban
development, etc. - Establishment of the
Environment Mission in six critical areas, chaired
by the Chief Minister and Chairman of the
Steering Committee, Rajasthan Government Task
Force.
Project implementation
should adhere to the policy
aims of: Environmental
conservation and
improvement, integration of
environmental issues into
project plans and capacity
building in environmental
management management
- under water sector, major
concerns, as the policy notes,
are: huge water losses &
wastage, declining water
availability, pollution reuse
and recycling.

234
State Government
In India, 28 states and seven union territories are responsible for SPCBs (state pollution control
boards) and pollution control committees (PCCs). The State Pollution Control Board is responsible
for the following: Advise the State Government on pollution and industrial location problems; Plan
programmes for pollution control; information gathering and dissemination; inspection; effluent and
emission regulations standards; to grant industry approval and other compliance actions to stipulated
emission and effluent standards; Issuing consent for companies and other activities to meet the
emission and effluent requirements prescribed.
State Pollution Control Boards' other functions i. To create and secure a comprehensive air pollution
prevention, control or reduction programme; ii. advise the State Government in all matters relating to
air pollution prevention, control or reduction; iii. Work with the CPCB in organising training for
persons, participate in or participate in a programme on air pollution prevention or reduction, and
establish mass education programmes; iv. To check any inspection equipment, industrial plant or
production process at any reasonable time and to provide, by request of any person, such instruction
as may be necessary for taking measures to avoid, control or reduce pollution in the air; v. To check
air pollution control regions at intervals as it considers essential, assess air quality and take action to
avoid or mitigate air pollution in such places.; vi. Identify the air emissions criteria from industrial
facilities and motor vehicles into the atmosphere or discharge from any other sources, not a ship or
aircraft, in cooperation with CPCB and taking into consideration the standards for the air quality set
by CPCB.; vii. Advise the State Government from time to time of the fitness of any premises,
entrusted by the CPCB or the State Government to perform such other things and act as it considers
necessary to execute its funtions properly, and in general to fulfil the purposes of the Act
(MoEF&CC, 2016)
The state government, in cooperation with SPCBs, can designate specific locations as "air pollution
control areas." State governments, in consultation with SPCBs, may impose conditions on such areas,
such as prohibiting the the use, or burning, of any fuel or equipment other than those approved (other
than fuel) such as garbage and other waste products, which may cause or is likely to cause air
pollution, by publishing a notice in the official gazette. Under section 21 of the Air Code a person is
further required to obtain prior authorization from an SPCB for the creation or operation, in the air
pollution control areas, of industrial plants. Similarly, Section 22 prohibits a person to discharge or
cause, or permit the discharging in excess of SPCB requirements, of the emissions of atmospheric
pollutants at any industrial facility in any air pollution control area (Kapoor, 2012).

235
Urban Local body
The RSPCB has established thirteen regional offices in different parts of the state to keep in check the
application of various allocation including The Air (Prevention and Control of Pollution) Act, 1981
and its rules.
Figure 6.4 Rajasthan’s major industrial zones with industrial output
Best Practices for Air Quality Management
The planning for air quality management is generally based on data from a number of evaluations
merged in an air quality management system (AQMS). The AQMS depends on the technical and
analytical tasks that follow: i. Create a pollutant activity and emissions inventory. ii. Air pollution
monitoring and parameters of dispersion. iii. Air pollution levels calculated using dispersion models.
iv. Expo and damage assessment. v. Estimating the impact of the measures of reduction and control.
vi. Setting and enhancing legislation and policies on air pollution. These activities, and the institutions
necessary to carry them out, constitute the prerequisites for establishing a functioning AQMS.
An air quality standard AQMP discusses how air quality has changed in recent years and what may be
done to ensure clean air in a certain area. The development and deployment of an AQMP is a dynamic
process with six parts as Figure 6.5 shows: i. Goal setting. ii. Baseline air quality assessment. iii. Air

236
quality management system (AQMS). iv. Strategies for intervention. v. Action Plans Implementation.
vi. Evaluation and follow up (Sivertsen & Bartonova, 2012).
Figure 6.5 AQMP 6 step procedure
Multi-pollutant management initiatives can save money and time, as well as provide considerable
economic, environmental and health advantages, all while lowering the costs and burdens associated
with air pollution sources.
Many environmental pollutants (e.g., industrial installations) generate a variety of environmental and
health pollutants that react or cause more harmful pollutants in the environment. Multiple pollutants
can be reduced using some management strategies. Developing integrated control techniques that
handle several contaminants rather than separate measures for each pollutant can be more efficient.
When establishing an air pollution control plan, air quality managers might take into account a variety
of policy objectives. Climate change mitigate and adaptation are all policy objectives that can be
addressed in such a programme: reducing ozone, particle matter and dangerous air (hazardous air
pollutant (HPA) like mercury levels; and preparing transport and energy requirements.
EPISODIC URBAN AREA QUALITY MANAGEMENT PLAN
The e-UAQMP (Figure 6.6) addresses the repercussions of ‘extreme' pollutant concentrations, which
occur mostly at urban ‘hotspots,' such as traffic conjunction, crossroads, and signalized roadways, and
are influenced by the complexities of traffic-generated ‘wake' effects. The e-UAQMP (based on a
probabilistic method) also serves as an effective preventive tool for predicting the "likelihood of
exceedances" in order to plan a successful policy response for the protection of the urban
environment, as well as conveying information to its sensitive "receptors" (Gokhale & Khare, 2007)).

237
The integrated air shed structure could help address current information gaps and provide a basis for
more efficient routine network expansion over time as an economical approach to provide more
detailed information on air quality on a national to local level so as to link local data with global
satellite estimates and a global network (Brauer et al., 2019)
In order to limit pollutant activities from each source, India has been using a command and control
(CAC) method, seting standardised technology, procedures and emissions regulations. The
government aims to reduce pollution, while this method is effective at keeping pollution controlled by
applying standards and controlling emissions; It yet gives the polluter no incentive to stop polluting.
A number of empirical investigations have shown that CAC is an inadequate strategy as it does not
fully take into consideration societal costs i.e., In general, they do not produce optimal pollution-
decrease results that equate the marginal social benefit of the decline with their marginal social costs.
A number of economic techniques were developed to internalise external costs of pollution, make the
polluter pay, And to lower costs of a particular degree of reduction in terms of production and
reduction costs under certain conditions.
Economic instruments such as tradable permits, emission and effluent charges, competitive
performance subsidies, and economic instruments that create income in combination with taxes, and
give incentives for environmental changes, are all instances of environmentally friendly sustainable
insights. India is looking forward to formulating the best combination of these instruments to punish
polluters while also incentivizing pollution reduction (Kapoor, 2012).

238
Figure 6.6 Episodic Urban Area Quality Management Plan (Gokhale & Khare, 2007)
NATIONAL AIR QUALITY MONITORING PROGRAMME (N.A.M.P.)
A national programme known as the National Air Quality Monitoring Program is implemented by the
Central Pollution Control Board (NAMP). The system comprises of 804 operational stations across 28
states and 6 Union Territories of the nation, encompassing 344 cities/cities. Four air pollutants
Sulphur Dioxide (SO2), Oxides of Nitrogen as NO2, Respirable Suspended Particulate Matter (RSPM
/PM10) and Fine Particulate Matter (PM2.5) have been recognized for regular monitoring at each place
under N.A.M.P (CPCB, 2019b).

239
National Clean Air Programme
In 2019, the Center started the National Clean Air Programme in 122 cities. The towns are referred to
be non-attainment cities since, over the period 2011-2015 under the National Air Quality Monitoring
Programme, they failed to comply with national environmental quality requirements (MoEF&CC,
2019).
Table 6.2 7 Non-attainment Cities of Rajasthan State
City Major Sources of Pollution Pollutants of
Concern
Alwar Vehicles, Industries, Natural dust PM10
Jaipur Vehicles, Industries PM10
Jodhpur Vehicles, Industries, Natural dust PM10
Kota Vehicles, Industries, Natural dust PM10
Udaipur Vehicles, Industries, Natural dust PM10
Strategies for Control of Air Pollution in Urban centers via City Planning and Management
Other than emission control, pollution can be reduced to some extent by urban design, topography,
and meteorological conditions. City planners can efficiently scheme the spatial distribution of
pollution point sources, such as factories, landfills, treatment plants, transportation path, and open
spaces, that have an impact on the quality of air in an urban area. Long-term regional and
metropolitan strategies should be combined with small-scale, short-term site and design initiatives.
The shape, density, and organisation of settlement areas, as well as the direction and composition of
subareas, the design and kind of transportation systems, and the shape and placement of open spaces,
all have a significant impact on air pollution. Although several forms of urban development might be
selected, designs which could increase the efficiency of air pollution distribution and reduce drive
travel have to be given priority. In order to reduce journey lengths, automobile traffic, and urban
sprawl, a balanced sub-regional approach for regional and metropolitan development with integration
of mass transportation has been found to be beneficial. Reduced population density around industrial
zones or in the downwind direction can assist reduce exposure to pollutants emitted by industries
through land use planning. In order to improve the spatial arrangements of industrial, commercial, and
residential regions, detailed studies of local meteorology and topography are required. Open areas that
operate as buffer zones are equally vital, although they are frequently absorbed for other land use
purposes during the development plan's lifetime, necessitating robust legislation and enforcement to
ensure their preservation. Solid waste management site planning and placement must also be done

240
with care and foresight. Prior environmental approval is required for large projects, which provides
procedures for reducing key negative environmental impacts.
State/UT Town and Country Planning Acts should be updated in accordance with the Urban and
Regional Development Plans Formulation and Implementation (URDPFI) principles, which were
released in 2014. A few urban design interventions can also be achieved through making changes to
development regulations and construction bylaws. Master plans/development plans, such as city
development plans, city mobility plans, and other special plans, should place a high emphasis on
integrating land use and transportation planning, as well as some of the themes indicated above. The
use of relevant tools and approaches, such as simulation tools (which are also included in the URDPFI
standards), can substantially aid in the selection of superior alternatives (plan proposals).
Supply to rural and urban slum regions of cleaner fuels and furnace supplies: LPG or PNG access
must be expanded, as well as packaging reduction and safe refill choices when appropriate. Several
government programmes aimed at increasing LPG/PNG access have been successful in increasing the
usage of clean fuel in urban areas across India. During the period 2000–12, the proportion of urban
homes using LPG climbed from 44.2 percent to 68.4 percent. Improved biomass-based cook stoves
that are more fuel-efficient can bring exposure levels closer to cleaner fuels. Despite the government's
goal of delivering LPG to everyone, it is clear that due to economic, supply, and transport difficulties,
many million families will continue to rely on traditional biomass for cooking. Furnace enhanced with
efficiency ranging between 30 and 40%, compared to 8 and 10% for typical cook stoves, are needed
to make more efficient use of biomass as a cooking fuel. The usage of better cook stoves, as opposed
to older ones, has resulted in lower indoor pollution concentrations. The necessity for research into the
creation of efficient fuel processing with a higher calorific content and less smoke is also critical.
(Fullerton et al., 2008).
Rural and urban slums have solar lighting options: In India, 7% of urban homes still use kerosene for
lighting (Census 2011). Solar lamps, which may be utilised even after grid-based electricity is given,
could help them until they can connect to electricity (IEP 2008). For selling and after-sales service,
sufficient institutional processes and delivery networks are required. Solar lamps should be pushed to
kerosene-using Urban and rural slums families without electrification, while the kerosene subsidy
should be phased out.
Increased adoption of modest household-level solutions such as better ventilation and the use of
cleaner conventional fuels would require awareness-raising programmes.
Controlling trash burning, maintaining the quality and cleanliness of roads, dust control at building
sites, travel demand management (TDM), fuel quality and vehicle emission requirements, and so on
are some of the other strategies (Seth Block, 2018).

241
Monitoring and modelling scientific studies
Monitoring requirements: India does not have a sufficient air quality monitoring network., since the
CPCB's National Ambient Air Quality Monitoring Programs cover about 600 monitoring stations
across the country. The Bureau of Indian Standards (BIS) has recommended the requirements for a
city's minimum number of stations. This will necessitate the installation of 3,300 monitoring stations
in 605 Indian cities with populations of more than 50,000 people. The monitoring network must be
gradually upgraded, not only in terms of quantity of stations but also in terms of monitoring quality.
Air quality monitoring is currently limited to cities, but it should be expanded to rural and regional
levels. This is especially important for pollutants like ozone, which tend to be higher in areas outside
of cities. The existing network monitors PM10, SO2 and NOx regularly in all stations, although it does
not cover all the contaminants referred to in the National Standards for Environmental Air Quality.
Corporate financing might be obtained through CSR efforts in order to expand monitoring networks
and improve monitoring capabilities.
Emissions, simulation, and forecasting: In addition to pollution monitoring, modelling capabilities are
needed to understand existing and future air quality. There is currently no national or regional
database of emissions. These inventories must be created and kept up to date. TERI has developed
national energy and emission model-based inventories for India for years to come (Sharma and
Kumar 2016). These inventories can be perfectly targeted to produce a national emission database
particular to India. While there have been a lot of studies on air quality simulation at the urban scale
in India, there have been few studies on air quality simulation at the regional/national scale. TERI has
used state-of-the-art models to estimate PM2.5 and ozone concentrations at the national level in India,
and the results reveal an increase in pollutant concentrations that could occur in the future if things
continue as they are. It also depicts the areas with the highest amounts of pollution as well as the
causes that contribute to this. As a result, regional action plans for air quality control may be
established.
The AQMP shall be developed by MoEFCC and CPCB through identified research institutions for the
purpose of carrying out source distribution studies together with the AQMP. AQMPs should be
developed at city level by SPCBs. SPCBs must be institutionally strengthened in order to enable the
successful and effective implementation of the AQMP's strategies. This will necessitate increased
funding allocations, scientific professional recruiting, and training in air quality monitoring and
modelling techniques. Regular board training might be arranged through institutional collaborations
(Seth Block, 2018).

242
Inferences for Best Practices
In the deterioration of air quality in numerous Indian cities, there are common driving causes, but in
different proportions. On the basis of priorities and the conclusions of source apportionment studies,
every city should implement the techniques presented in this short. Figure 6.7 shows a step-by-step
approach to determining air quality management in cities (Seth Block, 2018).
Figure 6.7 Best Practices as Policy Brief (Seth Block, 2018)
6.1.2 Present Scenario
Despite all of the other pressing environmental challenges, air pollution is quickly becoming one of
the country's most serious environmental threats. Air pollution is not just a concern for the
environment, but it also has health repercussions for humans. As a result, India is under tremendous
international and domestic pressure to improve air quality and take this issue seriously. Despite the
urgency, the government's piecemeal approach to solving the problem is yielding unsustainable short-
term gains and a fragmented air quality management system (Kapoor, 2012).
Impact assessment through surveillance and prior repetition.
Implementing the techniques specified
Preparation of air quality management plans for short, medium, and longer
timeframes
Short, medium and extended periods cost benefit analysis
Evaluation of the potential of various pollution management techniques
Projections of future air quality using scatter models
Studies on source distribution
Inventory of pollutant emissions from sources
Monitoring of Air Pollutants

243
Data provided by ULBs
The data provided by the various ULB’s in the district of Alwar, is hereby formulated in Table 6.3.
Details of data regarding availability of air quality monitoring network in district, different sources of
pollution, number of industries meeting standards etc.
Table 6.3 Air Quality Management Datasheet Alwar District
S.No. Action Areas Details of Data
Requirement
Measurable
Outcome
Please enter
Measurable Outcome
for District RO,
RPCB, Alwar
Please enter
Measurable
Outcome for
District RO,
Bhiwadi(Tehsil-
Tijara)
A
AQ1-Availability of
Air Quality
Monitoring
Network in District
Manual Air Quality
monitoring stations
of SPCBs /CPCB
[Nos] / [None] 3 3
Automatic
monitoring stations
Operated by SPCBs /
CPCB
[Nos] / [None] 1 1
B
AQ2-Inventory of
Air Pollution
Sources
Identification of
prominent air
polluting sources
[Large Industry] /
[Small Industry] /
[Unpaved Roads] /
[Burning of Waste
Stubble] / [Brick
Kiln] / [Industrial
Estate] / [Others]
(Multiple
selection)
Large Scale-45
Small scale-503
Brick Kiln-130
Large Scale-68
Small scale-346
Brick Kiln-04
No of Non-
Attainment Cities [Nos / [None] 1 None
Action Plans for non-
attainment cities
[Prepared] / [Not
yet prepared] prepared
C
AQ3-Availability of
Air Quality
Monitoring Data at
DMs Office
Access to air quality
data from SPCBs &
CPCB through
Dashboard
[Available] / [Not
yet Available] Available Available
D
AQ4-Control of
Industrial Air
Pollution
No of Industries
meeting Standards [Nos] 654 385
No of Industries not
meeting discharge
Standards
[Nos] 24 33
E
AQ5-Control of
Non-industrial Air
Pollution sources
Control open burning
of Stubble –during
winter
[Nos of fire
incidents] NA NA
Control Open
burning of Waste –
Nos of actions Taken
[Nos] NA NA
Control of forest
fires
[SOP available] /
[No SoP] NA NA
Vehicle pollution
check centers [% ULBs covered] NA NA
Dust Suppression
Vehicles [% ULBs covered] NA NA
F
AQ6-Development
of Air Pollution
complaint redressal
system
Mobile App / Online
based air pollution
complaint redressing
system of SPCBs.
[Available] / [Not
available] Not Available Not Available

244
As per the table all industries in the district are meeting the air quality standards. However, 24 are not
meeting standards. A number of data are missing for the district such as Control open burning of
Stubble, Control Open burning of Waste, Control of forest fires, Vehicle pollution check centers and
Dust Suppression Vehicles
Inferences from data provided
Rajasthan is one of the six Indian countries with the largest per-capita financial loss due to air
pollution according to the 2019 Global Burden of Disease Study. The Central Pollution Control Board
(CPCB) has identified 124 cities as “non-attainment cities” i.e., they have failed to meet the
prescribed standards on air pollution. Five of these 122 cities are in Rajasthan: Jaipur, Jodhpur, Kota,
Alwar, and Udaipur. Their levels of PM10 and PM2.5 are higher than prescribed limits even though
they meet SO₂ and NOₓ standards. Bhiwadi, a city in Alwar district, has also been identified as a
hotspot primarily because of its being a hub for many polluting industries.
Based to one of a coordination with the Indian Institute of Technology (IIT) Kanpur, the Rajasthan
State Pollution Control Board (RSPCB) started a comprehensive investigation in 2016 in several of
these cities. The purpose of the study was to create a thorough inventory of air pollution sources and
magnitude. The research has shown that road dust contributes considerably to air pollution in the
state—which is frequently not policy important. For example, on Jaipur Road, dust accounts for 46
percent of the emissions of PM2.5 and 48 percent in Bhiwadi. At the same time there is also an
emphasis on municipal waste treatment, as there is evidence that large-scale combustion of urban
garbage and garden waste considerably adds to PM2.5 or PM10 emissions.
Bhiwadi is classified as an industrial city. Due to the government policies and Bhiwadi’s proximity to
Delhi, the city has attracted many large and MSME industries. The city of Bhiwadi, which is part of
Delhi-NCR and home to a range of large, medium and small-scale industries, from steel mills and
furnaces to automobile and electronics manufacturing, is among the most polluted in the state with
high PM2.5, PM10 and NO2 concentration throughout the three years. Most of these industries use
boilers and furnaces. The winter is seen as crucial when it comes to dispersion of pollutants and
pollution consequences (IITK, 2020).

245
Table 6.4 Overall Baseline Emission Inventory (2017) for the Bhiwadi City (kg/day)
Category PM10 PM2.5 CO SO2 NOx
Industrial Point 736 663 3070 1901 1712
Vehicles 1485 1336 16439 384 14428
Road Dust 21654 5239 0 0 0
Hotels/Restaurants 42 21 76 29 12
Domestic 172 156 901 14 46
Industrial Areas 3246 2921 4784 9207 5122
DG Set 317 285 966 295 4474
MSW Burning 296 177 1553 18 111
Construction
Demolition 229 58 - - -
Agriculture Soil
Dust 44 - - - -
Total 28221 10855 27789 11848 25905
Numerous studies have found an association between air pollution and several adverse health effects
in the population. Pollutants with the strongest evidence for public health concern mainly include
particulate matter (PM), Nitrogen dioxide (NO2), and Sulphur dioxide (SO2). Monthly average
concentration for the Alwar and Bhiwadi cities for PM, NO2, SO2 is shown in following table.
Table 6.5 Monthly Average Concentration of Pollutants in Alwar City
MONITORING
SITES
Regional Office,
RSPCB
Jain Irrigation Systems Ltd., MIA,
Alwar (Old Location-RIICO Pump
House)
Vintage Distillers Ltd., MIA,
ALWAR (Old Location-Gaurav
Solvex)
S.
N
O.
Month
MONTHLY
AVERAGE(µg/m3) Month
MONTHLY
AVERAGE(µg/m3)
MONTHLY
AVERAGE(µg/m3)
SO2 NO2 PM10 SO2 NO2 PM10 Month SO2 NO2 PM10
1 January 10.3 34.5 159 January 12.07 39.03 198 January 13.5 41.11 242
2 February 10.1 33.7 186 February 13.9 37.8 194 February 14.7 38.6 230
3 March 9.66 33.7 146 March 13.71 35.03 158 March 13.57 40.56 195
4 April 10.9 35.09 144 April 14.8 37.89 154 April 14.92 40.84 210
5 May 9.44 30.18 168 May 11.41 34.31 186 May 12.25 38.31 207
6 June 8.39 29.3 174 June 11.71 33.38 180 June 11.75 34.29 213
7 July 7.64 26.15 131 July 10.8 31.42 146 July 10.87 35.73 171
8 August 7.35 24.05 97 August 9.87 29.25 95 August 10.59 32.37 119
9 September 8.46 25.82 102 September 11.63 30.03 112 September 11.76 31.39 126

246
0
5
10
15
20
25
30
35
40
45
Regional Office,RSPCB
Jain Irrigation Systems Ltd.,
MIA, Alwar (Old Location-
RIICO Pump House)
Vintage Distillers Ltd., MIA,
ALWAR (Old Location-Gaurav
Solvex)
0
5
10
15
20
25
30
35
40
45
Regional Office,RSPCB
Jain Irrigation Systems Ltd.,
MIA, Alwar (Old Location-
RIICO Pump House)
Vintage Distillers Ltd., MIA,
ALWAR (Old Location-Gaurav
Solvex)
10 October 9.32 26.22 124 October 12.19 34.64 142 October 12.95 35.21 167
11 November 9.56 27.41 177 November 11.7 32.38 190 November 12.48 34.24 218
12 December 11.19 32.4 224 December 14.21 36.82 207 December 15.41 38 272
AVERAGE 9.4 29.9 152.7 AVERAGE 12.3 34.3 163.5 AVERAGE 12.9 36.7 197.5
Figure 6.8 Graphical Representation of Monthly Average Concentration of PM10 in Alwar City
Figure 6.9 Graphical Representation of Monthly Average Concentration of SO2 in Alwar City

247
Figure 6.10 Graphical Representation of Monthly Average Concentration of NO2 in Alwar City
As from the data the concentration of these pollutants is less in summer and high in Winters.
Table 6.6 Monthly average concentration of Pollutants in Bhiwadi City
MONITORING
SITES Regional Office, RSPCB UIT Guest House Uttam Strip Ltd
S. NO
.
Month
MONTHLY AVERAGE(µg/m3)
Month
MONTHLY AVERAGE(µg/m3)
Month
MONTHLY AVERAGE(µg/m3)
SO2 NO2 PM10 SO2 NO2 PM10 SO2 NO2 PM10
1 January 29.75 50.08 325 January 17.36 50.74 322 January 25.31 48.71 277
2 February 30.98 59.86 269 February 24.98 51.57 277 February 24.23 57.38 236
3 March 30.77 56.72 252 March 27.59 53.37 296 March 27.41 51.22 281
4 April 29.03 57.62 296 April 26.47 59.51 270 April 30.74 52.37 239
5 May 29.58 44.44 270 May 25.9 41.81 271 May 21.48 33.36 264
6 June 27.78 37.1 274 June 14.38 42.6 137 June 20.67 37.04 206
7 July 21.68 38.8 210 July 15.04 23.14 122 July 15.45 26.54 139
8 August 29.03 31.44 127 August *
* August 20.36 40.82 180
9 September 24.51 28.07 164 September *
* September 21.6 30.9 163
10 October 31.2 46.19 210 October *
* October 32.97 40.86 212
11 November 28.63 42.49 269 November *
* November 27.11 42.58 281
12 December 29.7 40.3 274 December *
* December 29.03 39.17 246
AVERAGE 28.6 44.4 245 AVERAGE 21.7 46.1 242.1 AVERAGE 24.7 41.7 227
0
5
10
15
20
25
30
35
40
45
Regional Office,RSPCB
Jain Irrigation Systems Ltd.,
MIA, Alwar (Old Location-
RIICO Pump House)
Vintage Distillers Ltd., MIA,
ALWAR (Old Location-Gaurav
Solvex)

248
Figure 6.11 Graphical Representation of Monthly average concentration of PM10 in Bhiwadi City
Figure 6.12 Graphical Representation of Monthly average concentration of SO2(µg/m3)
0
50
100
150
200
250
300
350 C
once
ntr
atio
ns
Month
Regional Office, RSPCB UIT Guest House Uttam Strip Ltd
0
50
100
150
200
250
300
350
Co
nce
ntr
atio
ns
Month
Regional Office, RSPCB UIT Guest House Uttam Strip Ltd

249
Figure 6.13 Graphical Representation of Monthly average concentration of NO2(µg/m3)
6.1.3 Action Plan
The action plan for air pollution control needs to take into account various sources present in a region.
Table 6.7 presents the action plan for air quality management in Alwar. Looking at the number of
large, small scale industries and brick kilns in the district, controlling the air pollution becomes of
paramount importance.
Table 6.7 Action Plan for Alwar Air Quality Management
Source
group/Activity Action Points
Implementati
on period
Responsible agency
Air Quality
Monitoring
Performance monitoring of major air polluting
industries for assessment of compliance of the
notified air emission standards.
3 Years Rajasthan State Pollution
Board
(i) Installation of additional real Time Continuous
Air Quality Monitoring System in such a direction
and location that it is able to capture pollutants
from industries.
(ii) For other ULBs, manual air monitoring may be
for different seasons in a year.
3 Years Rajasthan State Pollution
Board
Vehicles
Emission
Control
1. Launch extensive drive against polluting
vehicles for ensuring strict compliance and regular
checking of vehicular emission and issue of PUC
certificate
Short Term
Dept. of Transport,
Traffic Police
2.Launch Public awareness campaign for air
pollution control, vehicle maintenance, minimizing
use of personal vehicle, lane discipline, etc.
Short Term Traffic Police
3. Prevent parking of vehicles in the non-designed
areas.
Long Term
Dept. of Transport
0
10
20
30
40
50
60
70 C
once
ntr
atio
ns
Month
Regional Office, RSPCB UIT Guest House Uttam Strip Ltd

250
4. Initiate steps for retrofitting of particulate filters
in diesel vehicles, when BS-V fuels are available.
Short Term
Dept. of Food &
Supplies
5. Prepare action plan to check fuel adulteration
and random monitoring of fuel quality data.
Mid Term
LSG,
Development Authorities
Municipal
,Corporations UITs in
their jurisdiction
6. Prepare plan for widening of road and
improvement of Infrastructure for decongestion of
road.
Long Term NHAI,
PWD
7. Prepare plan for construction of
expressways/bypasses to avoid congestion due to
non-destined vehicles
Short Term Dept. of Transport
8. Steps for promoting battery operated vehicles/
Promotion & operationalization of E-rickshaw
Long Term NHAI,
PWD
9. Install weigh in motion bridge at boarders of
cities/towns and States to prevent overloading of
vehicles
Long Term
Traffic Police
10. Synchronize traffic movements /Introduce
intelligent traffic systems for lane-driving.
Long Term
Traffic Police
11.Installation of remote sensor based PUC system Long Term Dept. of Transport
12. Restriction on plying & phasing out of 15
years old commercial diesel driven vehicles.
Long Term Dept. of Transport ,
Food &Supplies
13. Introduction of cleaner fuel for CNG/LPG
vehicles
Mid Term Dept. of Transport
14. Plan for restriction on the registration on diesel
driven Auto-rickshaw & Tempo
Mid Term Dept. of Transport
15. Monitoring on vehicle fitness Mid Term Dept. of Transport
16. Periodic calibration test of vehicular emission
monitoring instrument
Long Term UDH Development
authorities in their
jurisdiction
17. Preparation of plan for development Multi
level Parking
Mid Term
NHAI,
PWD,
Urban local body
Re-Suspension of
Road Dust and
Other Fugitive
Emission
Control
1. Prepare plan for green buffers along the traffic
corridors.
Mid Term
NHAI,
PWD,
Urban local body
2.Maintain potholes free roads for free roads for
free flow of traffic
Mid Term NHAI, PWD,
and Urban local body
3. Introduce water fountain at major traffic
intersection wherever feasible
Mid Term Urban local body,
Development Authorities
Municipal Corporations
UITs in their jurisdiction
4. Greening of open areas, gardens, community
places, schools and housing societies
Mid Term
Short Term
Urban local body,
Dept of Education

251
5. Blacktopping metaled road including pavement
of road shoulders.
Mid Term NHAI,
PWD,
Urban local body
6. Widening of roads and construction of pucca
footpath along main roads (RIICO Industrial
Areas)
Long Term RIICO as per
requirement and
feasibility
7. Regular cleaning of road (RIICO and other
areas)
Long Term RIICO,
UDH
8. Tree plantation along the roads (RIICO
Industrial Areas)
Long Term RIICO
Control of
Emissions from
Biomass/Crop
Residue/Garbage
/Municipal Solid
Waste burning
1.Launch extensive drive against open burning of
bio-mass, garbage, leaves, etc.
Short Term Urban local body
2. Regular check and control of burning of
municipal solid waste.
Short Term
Urban local body
3. Ensure ban on burning of agriculture waste and
crop residues and its implementation
Long Term Department of
Agriculture Revenue
4. Construction of advanced waste management
Site.
Mid Term Urban local body
5. Restriction on open burning of municipal solid
waste biomass and plastic (RIICO Industrial
Areas)
Short Term RIICO
6. Restriction on open burning of biomass and
plastic
Short Term Urban local body
7. Immediate lifting of solid waste generated from
desilting and cleaning of drains for its disposal
Short Term RIICO,
Urban local body
8. Transportation of solid waste, construction
material and debris in covered system.
Short Term RIICO,
Urban local body
Control Of
Industrial
Emissions
1. Identification of brick kilns and their regular
monitoring including use of designated fuel and
closure of unauthorized units.
Mid Term
State Pollution Control
Board
2. Conversion of natural draft brick kilns to
induced draft.
Mid Term
State Pollution Control
Board
3. Action against non-complying industrial units. Short Term State Pollution Control
Board
4. Regulation on setting up of new air polluting
industries in industrial areas located in urban limits
of these 5 cities.
Mid Term State Pollution Control
Board, RIICO
Control of
emissions from
brick kilns
1. Switching to more efficient technologies,
mainly during brick firing,
Mid Term State Pollution Control
Board
Control of Air
Pollution from
Construction
and Demolition
activities
1. Enforcement of Construction and Demolition
Waste Rules
Short Term
Urban Local Bodies;
Development authorities
under their jurisdiction

252
2. Control measures for fugitive emissions from
material handling-conveying and screening
operations through water sprinkling, curtains,
barriers and dust suppression units.
3. Ensure carriage of construction material in
closed / covered vessels
Short Term Urban Local Bodies,
RIICO
4. Covering of construction sites and Restriction
on storage of construction materials along the road
Long Term RIICO,
Urban local body
5. Restriction on storage of construction materials
along the road.
Short Term RIICO,
Urban Local Bodies
Other Steps to
control Air
Pollution
1. Air Quality Index to be calculated and
disseminated to the people through website and
other media.(on maximum weekly basis for
manually operated monitoring stations and real
time basis for continuous monitoring stations)
Short Term State Pollution Control
Board
2. Establish an Air Quality Management Division
at SPCB/PCC Head Quarters to oversee air quality
management activities in the State and interact
CPCB.
Short Term State Pollution Control
Board
3. Set-up and publicize helpline in each city/town
as well as SPCB/PCC HQ for complaints against
reported non-compliance
Short Term State Pollution Control
Board
Engage with concerned authorities on continual
basis for maximizing coverage of LPG /PNG for
domestic and commercial cooking with target of
100% coverage.
Short Term State Govt.
Monitoring of DG sets and action against
violations.
Short Term State Pollution Control
Board
Involvement of industrial associations in
awareness program (RIICO Industrial Areas)
Mid Term RIICO
Development/maintenance of green areas, gardens
and parks (RIICO Industrial Areas)
Long Term RIICO
Hotels/
Restaurants
Restaurants of sitting capacity more than 10 should
not use coal and shift to electric or gas-based
appliances.
1 year
Link Commercial license to clean fuel
1 year
Ash/residue from the tandoor and other activities
should not be disposed near the roadside. 1 year
Domestic Sector
LPG to all. Slums are using wood as cooking fuel. 2 years
By 2030, city may plan to shift to electric cooking
or PNG. 2 years

253
Municipal Solid
Waste (MSW)
Burning
Any type of garbage burning should be strictly
stopped. Immediate State Pollution Control
Board
Surveillance is required that hazardous waste goes
to TSDF.
Desilting and cleaning of municipal drains
Waste burning in Industrial area should be
stopped.
Daily, Monthly mass balance of MSW generation
and disposal
Sensitize people and media through workshops
and
literature distribution.
Construction
and Demolition
Wet suppression Immediate State Pollution Control
Board
Wind speed reduction (for large construction site)
Enforcement of C&D Waste Management Rules.
The waste should be sent to construction and
demolition processing facility
Proper handling and storage of raw material:
covered the storage and provide the windbreakers.
Vehicle cleaning and specific fixed wheel washing
on leaving the site and damping down of haul
routes.
Actual construction area should be covered by a
fine screen.
No storage (no matter how small) of construction
material near roadside (up to 10 m from the edge
of the road)
Builders should leave 25% area for green belt in
residential colonies to be made mandatory.
Sensitize construction workers and contract agency
through workshops.
Road Dust
The silt load in Alwar and Bhiwadi should be
controlled. The silt load on each road should be
reduced under 3 gm/m2.
Regular vacuum sweeping should be done on the
road having silt load above 3 gm/m2.
Convert unpaved roads to paved roads. Maintain
pot hole free roads.

254
Implementation of truck loading guidelines; use
appropriate enclosures for haul trucks and gravel
paving for all haul routes.
Increase green cover and plantation. Undertake
greening of open areas, community places, schools
and housing societies.
vacuum assisted sweeping carried out four times in
a month, this will reduce road dust emission by
71% (Resultant emissions: PM2.5=4 ton/day)
For Vehicles
Diesel vehicle entering the city should be equipped
with DPF which will bring a reduction of 40% in
emissions (This option must be explored once
Bharat stage VI fuel is available.)
3 years
Dept. Of Transport
Industries must be encouraged to use Bharat stage
VI vehicles for transportation of raw and finished
products
Immediate
Restriction on plying and phasing out of 10 years
old commercial diesel driven vehicles. 2 years
Introduction of cleaner fuels (CNG/ LPG) for
vehicles. 2 years
Check overloading: Expedited installation of
weigh-in-
motion bridges and machines at all entry points to
Alwar and Bhiwadi
Immediate
Electric/Hybrid Vehicles should be encouraged;
New residential and commercial buildings to have
charging facilities. Buses should be CNG or
Electric.
1 year
Depot spaces should be rationalized to ensure
more efficient utilization. Multi-modal, multi-use
bus depots to be developed to provide high-class
bus services and terminal experience to
passengers. Should include well- equipped
maintenance workshops. Charging stations shall be
set-up.
1year
Enforcement of bus lanes and keeping them free
from obstruction and encroachment. 1 year
Ensure integration of existing metro system with
bus services. 1 Year
Route rationalization: Improvement of availability
by rationalizing routes and fleet enhancement with
requisite modification.
1 year
IT systems in buses, bus stops and control center
and passenger information systems for reliability
of bus services and monitoring.
1 year
Movement of materials (raw and product) should
be allowed between 10 PM to 5 AM. 1 year
Ensuring emission standards in industries. Shifting
of polluting industries. 1 year
Strict action to stop unscientific disposal of
hazardous waste in the surrounding area 1 year
There should be separate Treatment, Storage, and
Disposal Facilities (TSDFs) for hazardous waste.

255
Industries and
DG Sets
Industrial waste burning should be stopped
immediately 2 years
Follow best practices to minimize fugitive
emission within the industry premises, all leakages
within the industry should be controlled
Immediate
Area and road in front of the industry should be
the responsibility of the industry Immediate
Category A Industries (using coal and other dirty
fuels)
boilers and furnaces in Alwar and Bhiwadi are
running over coal, wood, and other dirty solid
fuels which should be shifted to natural gas and
electricity
Almost all rotary furnace having significant
emissions are running on coal that needs to be
shifted to natural gas and electricity
Multi-cyclones should be replaced by baghouses.
Ensure installation and operation of air pollution
control devices in industries.
2 years
Category B Industries (Induction Furnace) 2 years
Recommended Fume gas capturing hood followed
by Baghouse should be used to control air
pollution
Diesel Generator Sets 2 years
Strengthening of grid power supply, uninterrupted
power supply to the industries
Renewable energy should be used to cater the need
of office requirement in the absence of power
failure to stop the use of DG Set
2 years
Decongestion of
Roads at High
Traffic Areas
Strict action on roadside encroachment.
2 years
Dept. of Transport
Disciplined Public transport (designate one lane
stop). 6 months
Removal of free parking zone
Examine existing framework for removing broken
vehicles from roads and create a system for speedy
removal and ensure minimal disruption to traffic.
Synchronize traffic movements or introduce
intelligent traffic systems for lane-driving.
Introduction of one-way traffic in selected areas to
reduce the traffic density
Implementation
of Traffic Master
Plan
Banning entry of heavy commercial vehicle inside
the city to reduce vehicular pollution 1 year Dept. of Transport
Issuing licenses to LPG based autos as per
notification dated 22/12/2010 1 year
Continuous monitoring of vehicles by flying
squads of transport department to check PUC 1 year
Regular monitoring of the quality of the fuel being
used by the vehicles 1 year

256
Periodic education and awareness campaigns for
the public, drivers, transporters and other stake
holders
1 year
Removal of encroachment on the road side 1 year
Development of parking arrangements by traffic
management near the commercial areas by
concerned ULB
1 year
Widening of main roads for reducing the traffic
congestion and periodic maintenance of Road 1 year
Development of roadside bushes 1 year
6.1.4 Summary
There are number of government initiatives such as National Air Quality Monitoring Programme,
National Clean Air Action Plan, CPCB Guidelines, TERI Policy etc. which focuses on short-term and
long-term measures from broader to local air quality management. As there is no data available for
Alwar district, it is very difficult to comment on the air quality of the region. For an industrial district
like, Alwar more monitoring stations should be installed as soon as possible. In the meantime, the
focus of mitigation may be on major sources e.g. vehicular sources, brick kilns, MSW burning and
other industries. Planning and monitoring for brick kiln should be done immediately.
Table 6.4 Summary for Air Quality Management Alwar
S.No. Urban
Local
Body
Present Status Strategies and Action Plan
1. Nagar
Parishad,
Alwar
Manual Air Quality
monitoring stations- 3,
Automatic monitoring
stations- 1,
No of Industries not meeting
discharge Standards- 24
● Air Quality Monitoring Control Action ● Source based control action for hotels/ restaurants,
vehicles, industries and DG sets, construction and
demolition, domestic sector etc. ● Decongestion of roads in high congestion areas
and implementation of traffic management plans.
2. Nagar
Parishad,
Bhiwadi
Manual Air Quality
monitoring stations- 3,
Automatic monitoring
stations- 1,
No of Industries not meeting
discharge Standards- 33
● Air Quality Monitoring Control Action ● Source based control action for hotels/ restaurants,
vehicles, industries and DG sets, construction and
demolition, domestic sector etc. ● Decongestion of roads in high congestion areas
and implementation of traffic management plans.
The Alwar district doesn’t have a district environment plan yet, it has various regulations for
environmental clearances for industries and other major infrastructure facilities such as urban
transport and need environment clearances including air quality management for its functioning. The
inventory for air quality measurements is not updated which is essential to begin with air quality
control and last official document stating the measurements was till 1995. The districts lack in air
quality monitoring stations and have one regional pollution board which is accountable for the air
quality management along with other environment controls.

257
6.2 Noise Pollution Management
6.2.1 Literature Review
Noise is defined as unwanted sound that interferes with one's quality of life. Sound pollution occurs
when there is a great deal of noise in the environment. A person's personality cannot withstand noise
levels exceeding 85 decibels (dB) When sound interferes with routine activities such as working,
resting, or conserving resources, it becomes unwelcome. It has an underappreciated environmental
disadvantage because to the fact that we can't see, smell, or style it. “Noise should be regarded as a
severe hazard to human well-being,” as depicted by World Health Organization.
The following is a list of noise pollution classifications: I Community Noise: Noise released from all
sources, except at the economic work place, is mentioned as community noise (also known as
environmental noise, home noise, or household noise). Road, rail, and traffic noise, construction and
public works noise, and neighbourhood noise are all common sources of community noise. Live or
recorded music, as well as stock such as barking dogs, are common sources of neighbourhood noise;
(ii) Occupational Noise: Noise is generated by industrial machinery and process, such as rotors, gears,
turbulent flow, impact processes, electric machines, internal combustion engines, pneumatic
equipment, drilling, crushing and blasting. In addition, flooring, ceiling and instrumentality also
reflect the sound produced; (iii) Aircraft pollution: aircraft noise flying across residential areas
interferes with the capacity of individuals to think, study and sleep in school, leading to poor land
values in the regions in question. aircraft pollution With the growth in passenger volumes and the
construction of new and bigger airports, noise is becoming increasingly important; (iv) Roadway
noise pollution: the sound of the aggregate emission of motor vehicles and automobiles roadways; (v)
Underwater noise pollution (UNP) is a type of noise pollution caused by humans in the aquatic
environment. All contributory elements include explosives, oceanographical experiments, geological
analysis, undersea building, ship transportation, powerful active sonars and air cannons used for
unstable oil surveys and associated operations; (vi) Construction noise: Construction noise from
roads, city streets, and buildings may be a significant component to the urban scene. The noise of
construction involves all kinds of gas hammers, air-compressors compressores, bulldozers, loaders,
dump trucks (and their backup signals).
Humans may develop a noise-induced hearing condition as a result of prolonged exposure to noise.
Hearing sensitivity in older guys exposed to vital activity noise is significantly lower than in non-
exposed peers. Unwanted noise is harmful to one's physiological and psychological well-being. Air
pollution, aggressiveness and heart disease, over-stress, tinnitus, hearing loss, sleep problems and
other unpleasant effects might result in pollution. High noise levels can contribute to vascular effects
and exposure over a period of eight hours to moderately high blood pressure increases by five to ten

258
points and increased stress and restriction leading to a rise in blood pressure and a higher risk of
coronary artery disease.
Noise is harmful to animals, it increases the risk of death, disturbs the delicate balance of detection
and avoidance of predators, and it interferes with the use of sounds, especially in terms of the
pertinence of replication and navigation. The loss of usable surround that noise zones may create is
one effect of noise on animal life, and in the case of species, this could be a part of the path to
extinction. Pollution has resulted in the death of tethered whale species that have aground when
exposed to the loud sound of military measuring systems. Hormone imbalance, chronic stress, panic
and escape behaviour, abandonment of offspring, injury, and increased loudness of lay to rest species
communication are some of the other consequences on life and aquatic animals.
Scenario in country
In the current state of affairs in India, pollution may be a natural occurrence, particularly in urban
areas. Typical illustrious sources of pollution are transportation or traffic-related pollution, as well as
mill or activity pollution. Such responsible pollution is an unavoidable part of everyday life, and no
one wants to be concerned about it. During festivals like Diwali, where hearth haywire is blamed for
pollution, the sources of noise pollution tend to rise. Noise pollution appears to be a tradition at public
festivals, just as it appears to be at weddings, birthdays, and election successes. Hearth haywires and
bands were important causes of pollution in the past, but in recent years, other variables have been
added to create undesired sound.
The traditional image seen during public competition events and private festivities such as weddings,
birthdays, and election victories is walls of large speakers accompanied by hearth haywires and bands.
The most terrifying of these is walls of large speakers playing the loudest music at the same time,
nonstop; the intensity is so high that you will just feel the vibrations around you, and you will feel the
palpitations, despite the fact that you are simply going by. Surprisingly, you will notice that not only
adults, but also children, spend hours in such a noisy environment doing arts and enjoying the music
made by it. Such reasonable exposure adversely affects one's health in the same way as social risks
do, and it is particularly harmful to children.
Though their square measure legislations regulation pollution, however non-implementation of
legislations ends up in ever-rising rather multiplying pollution with the addition of the latest
equipment of pollution.

259
Governance and Management Structure
The various concerned institutions involved in the process of Noise Management are: Central
Pollution Control Board, Rajasthan State Pollution Control Board, sustainable goals given by world
health organization.
Roles and Responsibilities
The Central Pollution Manage Board has a responsibility to regulate and control noise sources with a
view to maintaining environmental standards in air quality.
State Pollution Control Board responsible for regulation and controlling of noise producing sources
and noise monitoring in the state
Sustainable Development Goals
The aim of noise control is to maintain low levels of noise to protect human health and well-being
(Greenberg & Schneider, 2019). In any case, noise in an exceedingly explicit situation, according to
the precautionary principle should be minimised to the lowest possible level. In cases with an enough
risk of endangering public health, action should not wait for extensive scientific evidence but should
be acted to safeguard public health. The Polluter Pays Principle states that individuals responsible for
supplying noise should pay the whole cost of sound pollution (including monitoring, control, lowering
levels, and oversight).
The interference principle states that if it is possible to reduce noise at the source, action should be
performed. Associate degree environmental health impact assessment that addresses noise as well as
alternative contaminants should be used to guide land-use planning.
The noise levels in any space/zone must not exceeding the narrow air quality standards with regard to
noise as specified in the Table, and noise levels in any space/zone shall not exceed narrow air quality
standards with regard to noise as set out in the Schedule for enforcement and social management of
sound pollution control measures. The authority is responsible for enforcing sound pollution control
measures and, as a result, ensuring that the near air quality standards in the area of noise are met.
National Rules and Regulation for Noise Pollution (Ministry of Environment & Forests, 2017)
Section three of the environmental protection act of 1986 let to noise regulations rules (2000). The
Environmental Protection Agency is that the umbrella legislation to influence each dynamic issue in
relevance environmental preservation. The foundation regulates noise levels in Table 6.4

260
Table 6.8 Ambient air quality standards in respect of noise for different areas/zones
Sr.
No. Category of Area/Zone
Limits in dB(A)
Day Night
1 Industrial area 75 70
2 Commercial area 65 55
3 Residential area 55 45
4 Silence Zone (near hospitals,
schools etc.) 50 40
The regulations together assign these requirements to the native district courts by the administrative
authority. Some observations from the foundations are essential:
Any authority to utilise public address systems inside 10 pm and before 6 am cannot give a permit to
use them within the open. There is no possible exception. The sound shall be within the sound
limitations laid out under the Noise Rules after approval has been obtained. This may be measured on
a metre of sound. Every person who violates the foundation is susceptible to remission under the
regulations of the EPA. If the authorities don’t act to Prevent violation of the Noise Rules, the subject
Whoever submitted criticisms will approach the Court with his critique when the Court starts
prosecution 60 days in advance. The rules conjointly fix totally different close air quality levels for
firecrackers and industrial activities.
Rajasthan State Rules for Noise Pollution: in accordance with the authorities conferred in Section 9
the Rajasthan Noises Management Act, 1963 (Rajasthan Act 12 of 1963) at intervals that not
everybody shall use or play a loud-speaker or sound electronic equipment for broadcasting any
speech, sermon, music or radio-Programme or attach identical to any wireless radio receiver or
phonograph, shall be as state against every, namely-
Table 6.9 Rajasthan Noises Management Act, 1963
1. From hospital or from a building during which there’s a phone
exchange 150 meters
2.
From any educational institution managed, maintained, recognized
or controlled by the authorities or a University established beneath
any law for the nowadays good or a neighborhood authority,
throughout the hours or operating of such establishment.
150 meters
3.
From any hostel maintained or recognized by the one hundred fifty
meters authorities or University or government agency once such
hostel is within the use of scholars.
150 meters
4. From a building during which a court or Government workplace is
control throughout the hours of operating of such court or office 150 meters

261
Best Practices
Noise Abatement Approaches (SCU, 2017)
Rolling noise and drive noise combine to create road traffic noise owing to the vibrations and
interactions between the vehicle's tyre and its surface (emanating from the engine itself). When cars
are travelling faster than 30 km/h, rolling noise dominates noise emissions, while propulsion noise is
the main source of noise below this speed. Quieter engines, quieter road surfaces, quieter tyres,
electric vehicles, traffic management, and engineering can all help to reduce traffic noise.
Reduced wheel roughness, such as by replacing cast iron brake blocks, is the most effective approach
for reducing railway noise. A new style of low-noise brake block (LL-blocks) may readily replace
noisy cast iron brake blocks, lowering freight train noise by up to 12 decibels (on a nicely kept path).
Isolating the tread from the web of the wheel and optimising the size and form of the wheel to reduce
vibration can also be useful, albeit this is only possible with new vehicles. Acoustic grinding, which
has been found to reduce sound levels by 2.5–5 dB on the track side, can be used to minimise the
roughness of the rail line. Rail vibration can be reduced by using stiffer rail pads, and adding a rail
damper can reduce noise by up to 3 dB(A), though questions about its cost and safety persist.
The aircraft itself is the primary source of airport noise, because it generates noise during parking,
taxiing and while it is running, departure, flying and landing. The main noise sources are aircraft noise
(because of the airflow around the airplane's main bodyshell that increases at speed and low levels),
engine noise/mechanical noise (because of the jet engines that predominate during start-up or
climbing) and noise from aircraft systems (from the auxiliary power unit, which is used to start the
main engines and provide power while the aircraft is on the ground).
Noise reduction at source: new technology, noise regulations, fleet evolution, air traffic control at
source might be explored for aircraft noise reduction.
The design and management of land uses includes zoning, which controls development and bans the
construction of sound-sensitive land uses in the vicinity of an airport or a flight route (e.g. houses,
schools and hospitals). Mitigation techniques include isolation of the noise-sensitive façades
surrounding buildings, tax incentives and financial penalties, for example.
The operational techniques for noise reduction are as follows: Lower noise roads or paths, limited
motor use on the ground, and shifted landing thresholds: Changing where planes can land on a runway
to lessen noise pollution in sensitive areas. The continuous descent approach (CDA) decreases noise
pollution for towns below by reducing power/drag by keeping the aircraft at a higher altitude for the
majority of the descent than the traditional "stair step" approach.

262
Cross-functional methods to noise reduction: Although some noise reduction techniques are unique
to certain kinds of noise, some are suitable for several types of noise:
Noise barriers: A significant noise reduction method is the use of noise barriers. Lärm barriers, such
as those seen near busy roads, are effective means to minimise excessive noise levels. By preventing
it from immediately spreading from the source to the recipient, they minimise noise.
A. Noise Barrier B. Sonic Crystal
Figure 6.14 Different type of Noise Barrier
Building design: Architects can significantly improve the noise levels within a building during the
planning stages. A technique to do this is to position less soundproof rooms, such as a kitchen or
storehouse, closer to a potential source of noise such as a road, and more noiseproof areas such as
bedrooms and the living room further. When designing the geometry of complete structures, it's also a
good idea to think about noise interactions. Noise reflections onto a building can be reduced by
certain orientations. Additional architectural features can also help with noise reduction. Internal noise
exposure can be reduced greatly by orienting windows apart from the noise source and covering them
with wing walls. Balconies, depending on their specifications, offer a high noise reduction capacity
(5–14 dB).
There is no specialised data of individual land-use planning or ‘zoning,' which entails taking into
account the position of future buildings in relation to other areas, such as domestic areas and green
space. Noise-sensitive and peaceful locations that should be protected from noise in the future can be
identified with proper planning. This could entail establishing a sufficient distance between locations
to prevent noise transmission, or including noise abatement into new development plans.
Building sound insulation: Sound-insulated windows can reduce noise by up to 30 decibels, which is
comparable to solid doors. Special sound-dampening windows can reduce emissions by up to 40

263
decibels, albeit this is dependent on the building and window features, and is only effective when the
windows are closed.
Sonic crystals: Sonic glass may block sound waves transmitted at certain frequencies that can be
adjusted by a change in the crystal's size and shape.
To decrease occupational exposure, ear protection devices should be given for those working in noisy
locations such earplugs, mufflers, noise helmets, headphones, etc. Proper lubrication has to be done
for old machines to reduce the noise. Increased distance between source and receiver by zoning of
noisy industrial areas like bus stands and railway stations away from silence zones near residential
areas, educational institutions and hospitals. Planting plants and bushes beside highways, hospitals
and schools significantly helps to reduce noise.
6.2.2 Present Scenario and Gap Identification
There are 12 ULBs in Alwar district namely two Nagar Parishad Alwar, and Bhiwadi, 10 Nagar
Palika Tijara, Kishangarh Bas, Khairthal, Bansur, Behror, Thanagazi, Ramgarh, Laxmangarh, Kherli,
Rajgarh. The very less information that is available regarding noise in Alwar district is shown in the
table below.
Table 6.10 Present Scenario in Alwar district
No. Action Areas Details of Data
Requirement
Measurable
Outcome
Please enter
Measurable
Outcome for,
RO,Alwar,
District
Please enter
Measurable
Outcome for
District RO,
Bhiwadi(Tehs
il-Tijara)
A NP1-Availability
Monitoring equipment
No. of noise
measuring devices
with district
administration
[Nos] / [None]
No. of noise
measuring devices
with SPCBs
[Nos] / [None] 2 2
B
NP2-Capability to
conduct noise level
monitoring by State
agency / District
authorities
capability to conduct
noise level
monitoring by State
agency / District
authorities
[Available] /
[Not available] Available
C Management of Noise
related complaints
No of complaints
received on noise
pollution in last 1
year
[Nos]
No of complaints
redressed [Nos]

264
D Compliance to ambient
noise standards
Implementation of
Ambient noise
standards in
residential and silent
zones
[Regular Activity]
/ [Occasional] /
[Never]
Noise monitoring
study in district
[carried out] / [not
carried out]
Not Carried
Out
Not Carried
Out
Sign boards in towns
and cities in silent
zones
[Installed] /
[Partial] / [Not
Installed]
Inferences from present scenario
There is no dedicated data of individual ULBs. Sign boards in towns and cities in silent zones should
be installed. Noise measuring devices should be provided to the district administration. Noise
monitoring study should be carried out in all ULBs.
6.2.3 Action Plan
The action plan for noise pollution management in Alwar district is shown in the table below.
Table 6.11 Action Plan for Noise Pollution Management
S.
No. Action points
Time Frame
for
implementation
Suggested Responsible stakeholders/
Agency involved
1. Monitoring the noise pollution
especially in residential and
silence zones
1- year RSPCB
2. Monitoring the noise levels in
areas of traffic congestion/
commercial areas
1-year RSPCB
3. Strict implementation of noise
control from vehicles in terms
of honking or engine noise
3-years Traffic police
4. Determining the level of noise
control required in different
areas of an ULB
3-years RSPCB (technical institutes may also be
employed for the same)
5. Installation of noise barriers
e.g.
planting vegetation and earth
barriers for areas where source
control is difficult
5-years
ULB (Tijara, Kishangarh Bas, Khairthal,
Bansur, Behror, Thanagazi, Ramgarh,
Laxmangarh, Kherli, Rajgarh)
6.2.4 Summary
The noise abatement strategy typically starts with the development of noise standards or guidelines,
and the identification, mapping and monitoring of noise sources and exposed communities. A
powerful tool in developing and applying the control strategy is to make use of modeling. These
models need to be validated by monitoring data. Noise parameters relevant to the important sources of
noise must be known.

265
There is no detailed or proper information regarding the noise levels in Alwar and in all particular
ULBs. Therefore, the action plan suggested in the study is more focused on noise monitoring but not
on the controlling measures. Hence it is required to conduct noise survey in the district in order to
know the intensity of the noise so that an effective action plan can be framed and implemented in the
district. The monitoring suggested in the action plan is more focused on residential and silence zones
since they are more susceptible to noise pollution. The focus is also made on traffic noise since the
proportion shared by vehicles in producing noise is higher than any other noise producing source.
Noise barriers are recommended in the action plan because there are some situations where source
control is not possible hence, we have to take certain control measures at least not to transfer the noise
to the surroundings. There are a range of approaches available to reduce exposure to noise locally,
from well-established methods such as insulation and speed limits to more novel strategies such as
low-noise road surfaces. In conclusion, a mix of mitigation at source and noise abatement at the
receiver end will be important to target noise hotspots.
Table 6.12 Summary for noise management in Alwar district
Name of the
ULBs Present Scenario Action Plan for future
Nagar Parishad
Alwar, Bhiwadi
Nagar Palika-
Tijara,
Kishangarh
Bas, Khairthal,
Bansur, Behror,
Thanagazi,
Ramgarh,
Laxmangarh,
Kherli, Rajgarh
● There is no data about noise
measuring devices with district
administration.
● There are only 2 noise measuring
device with SPCB.
● No data regarding the capability to
conduct noise level monitoring by
State agency/ District authorities.
● No data regarding the number of
complaints received and number of
complaints redressed.
● No data regarding the
implementation of ambient noise
standards in residential and silent
zones
● Noise monitoring study in district
is not carried out.
● No data about sign boards in towns
and cities in silent zones.
● Monitoring the noise pollution
especially in residential and
silent zones for 1 year by
RSPCB.
● Monitoring the noise levels in
area of traffic
congestion/commercial areas for
1 year by RSPCB.
● Strict implementation of noise
control from vehicles in terms of
honking or engine noise for 3
years by traffic police.
● Determining the level of noise
control required in different
areas of an ULB for 3 years by
RSPCB.
● Installation of noise barriers e.g.
planting vegetation and earth
barriers for areas where source
control is difficult for 5 years by
ULBs

266
7. Industrial Waste Management
7.1 Literature Review
Industrial trash encompasses all sorts of waste generated by local businesses, including wastewater,
air pollution, and solid waste. Furthermore, because industrial waste can be harmful, scientific
handling of industrial waste is even more important. Toxins released from industrial waste can
contaminate the soil, air, and water as a result of poor industrail waste management. Solid waste
disposal programmes are still in effect for large and medium-sized firms in designated industrial
zones. As a result, local governments must develop a strategy for appropriate collection and disposal
of industrial solid waste in coordination with the State Pollution Control Board (SPCB) (Jadhav &
Hocheng, 2012)..
India's urbanisation is accelerating, with the percentage of people living in cities rising from 14
percent in the 1940s to nearly 35 percent in 2020. The much-needed boost to industrial development
has resulted in large residuals that are having out-of-proportion detrimental effects on the environment
- air, water, and land in comparison to their contribution to overall economic growth. The iron and
steel industry, for example, accounts for 55 percent of total particulate matter emissions while
generating just 16 percent of total industrial output. Chemical and food processing industries account
for up to 86 percent of total industrial BOD load, compared to the industry's 25% contribution to
overall industrial production (Brueckner et al., 2014).
Scenario in Country
India creates around 74.6 lakh tonnes of hazardous waste each year from various sectors. The amount
of waste that can be disposed of in landfills is around 34.1 lakh tonnes, or 46% of total waste.
Recycling accounts for 33.5 lakh tonnes of recyclable hazardous waste, or 45 percent of the total.
Because recyclable hazardous waste accounts for a large fraction of the total, India should improve its
trash recycling operations. Hazardous waste is created by a range of industrial enterprises in India.
Hazardous waste was also brought into India for reprocessing and recycling until the newly updated
rules of 2016 put an end to it. Currently, the majority of India's hazardous waste is disposed of at
ordinary garbage dumping sites rather than specially built landfills for industrial hazardous waste
disposal (Gautam et al., 2017).
Due to the lack of adequate treatment and management, the volume of industrial wastewater in India
is rapidly increasing, contaminating the country's limited freshwater sources. Industrial waste is
dumped into the environment, rendering the available water supply worthless. In the present scenario,
chemical industries such as petrochemicals, textiles, fertilizer, pharma, etc. are producing large
amount of highly polluting effluent due to the poor atom economy and selectivity’s of the

267
conventional processes. The treatment of such effluent is another big task for such industries and most
of the industries either do not have complete solution for the treatment of effluent or they cannot
afford the high treatment cost and hence these industries are directing their effluents to the CETP. But
the numbers of CETP units in industrial zones are limited and the loads on these units are
continuously increasing due to their ineffectiveness in treating complex biorefractory pollutants. The
report about the performance of the CETP plants in North India published in 2014-15 by Central
Pollution control board (CPCB) indicated that almost double the quantity of effluent than the pumping
capacity of the treatment plant was reaching the pumping stations of Common Effluent Treatment
Plants (CETP) at Kanpur and around 50 % of the effluent having COD as high as 5,000 mg/L was
being directly discharged into River Ganga. This report indicated that the Up-flow Anaerobic Sludge
Blanket (UASB) system installed at this CETP unit was not achieving the treatability at the desirable
level to comply with discharge limit set for on land discharge for irrigation. This report also indicated
that most of the CETP units along the river Ganga are not working at full efficiency due to their
inefficiency in handling the high intake load and inability in treating the biorefractory pollutant.
Industry produces around 13468 MLD of wastewater, of which only 60% is treated, with large-scale
enterprises accounting for the majority. (Raveesh et al., 2015). Due to the regional water shortages,
several companies have been discovered to use water recycling technologies. Common Effluent
Treatment Plants (CETP) have been built up for clusters of small size companies that may not be able
to pay the expense of a waste water treatment facility (CPCB, 2005). Some of the treatment
techniques employed in these facilities include dissolved air floatation, dual media filter, activated
carbon filter, sand filtration and tank stabilisation, flash mixer, clariflocculator, secondary clarifiers,
and sludge drying beds. Traditional wastewater treatment systems are expensive and difficult to
operate and maintain. (Dhingra et al., 2015).
Scenario in State
There are 193 Urban Local Bodies (ULBs), 295 Panchayat Samitis, and 9,892 Gram Panchayats
throughout Rajasthan's 33 districts (GPs). According to the 2011 Census, the state's population is 6.86
crores, with 24.78 percent living in urban areas and 75.13 percent in rural areas. The discharge of
untreated industrial effluents has resulted in groundwater pollution in numerous areas of Rajasthan.
(Nandan et al., 2017).
Governance and Management Structure
The various concerned institutions involved in the process of Industrial Waste Management are:
Central Pollution Control Board; Department of Environment Science and Technology; Ministry of
Environment, Forest and Climate Change; Central Public Health and Environmental Engineering
Organization; the Energy and Resource Institute and; Ministry of Housing and Urban Affairs.

268
Roles and Responsibilities
Central Pollution Control Board
Responsibilities include regulating and managing air, water, and noise pollution in order to maintain
acceptable levels of ambient air quality, water quality and noise level.
Department Of Environment, Science and Technology
Through regulation, policy formulation, and supervision and monitoring, responsible for planning,
coordinating, promoting/overseeing environmental, science and technology, pollution prevention,
abatement, and control activities and programmes for environmental protection, conservation, and
enhancement using innovative technologies.
Ministry of Environment, Forest and Climate Change (MoEF&CC)
Responsible for the successful execution of legislation, with a focus on waste reduction, source
segregation, recycling, and waste pickers, recyclers, and waste processors' participation in the
collecting of plastic waste fractions from households and other sources of generation.
The Energy and Resource Institute (TERI)
Dedicated to developing technology and solutions that reduce waste creation while also converting all
waste into usable commodities. Its goals include encouraging the circular economy in industries
through boosting resource-efficient and clean production, as well as improving resource recovery and
recycling for landfill-free communities.
Ministry of Housing and Urban Affairs (MoHUA)
Increasing the ability of Urban Local Bodies (ULBs) through infrastructure development, capacity
training, and communication, with an emphasis on various aspects of solid waste management and
holistic sanitation, such as wastewater treatment.
Responsibility of Local Body
Urban local governments may collect, transport, and dispose of solid waste on a cost-recovery basis in
accordance with existing laws, and they may choose acceptable sites for final treatment and disposal
of industrial solid waste in accordance with existing rules.
Responsibility of State Pollution Control Board (As Per Rule 12)
Management of Industrial Solid Wastes-Coordination (RSPCBs & Local Bodies) (CPHEEO, 2016):
Inventorisation of industries could be attempted through Rajasthan State Pollution Control Board
(RSPCBs) or industries department for characterization of wastes. Rajasthan State Pollution Control
Board (RSPCBs) may take necessary actions for issuance of consents/Authorizations to the industries

269
under relevant Acts and Rules. The State Pollution Control Board's primary goal is to enhance air
quality, promote water body purity, and avoid pollution (CPHEEO, 2016a).
Rules and Regulations
The water (prevention and control of pollution) act 1974
Allow the SPCBs to establish and maintain site and source-specific wastewater discharge standards.
The real enforcement mechanisms, such as fines, imprisonment, and so forth, are limited to source-
specific regulations for particular polluters (GOI, 1974).
The air (prevention and control of pollution) act 1981
The Board is responsible for preventing, reducing, and regulating air pollution in the country, as well
as providing advice to the Central Government. It is in charge of creating and executing a national
plan for air pollution prevention, control, and reduction. The goal is to advice the central government
on matters pertaining to air and air pollution, advice and support state boards in carrying out their
functions, carry out research related to air pollution, and spread awareness and information about air
and air pollution through mass media (GOI, 1981).
The Environment (Protection) Act, 1986
The Environment (Protection) Act of 1986 gives the federal government the authority to protect and
improve environmental quality, control and reduce pollution from all sources, and prohibit or restrict
the development and/or operation of any industrial facility for environmental reasons (GOI, 1986).
Hazardous Waste Management Rules, 2016
To distinguish between Hazardous Waste and other wastes, rules have been established. Trash tires,
paper waste, metal scrap, old electronic products, and other wastes are all recognized as resources for
recycling and reuse. These resources enhance industrial operations while reducing the burden on the
country's virgin resource. The hierarchy of waste management has been integrated, with the top
priorities being prevention, minimization, reuse, recycling, recovery, co-processing, and safe disposal.
The essential need of infrastructure to protect public health and the environment from the waste
processing sector has been established as Standard Operating Procedures (SOPs), which must be
followed by all stakeholders and ensured by the SPCB/PCC when giving such authorization. The
procedure for establishing a hazardous waste disposal facility and importing other wastes has been
streamlined by combining all permissions into a single window clearance. The following are the state
government's responsibilities for ecologically solid waste disposal of hazardous and other wastes: Set
up/ allocate industrial space or sheds for hazardous or other trash recycling, pre-processing, and other
uses. Workers participating in recycling, pre-processing, and other usage operations must be

270
registered. To establish labor groups to make the installation of such facilities easier. To carry out
industrial skill development operations while also ensuring worker safety and health (GOI, 2016).
Environment (Siting for Industrial Project) Rules-1999
The Environment (Siting for Industrial Projects) Rules, 1999, contain detailed provisions relating to
areas to be avoided for industrial project siting, site selection precautions, and environmental
protection aspects that should have been incorporated during the implementation of industrial
development projects (GOI, 1999).
The National Environment Appellate Authority Act, 1997
An Act to create a National Environment Appellate Authority to hear appeals relating to the
restriction of areas in which any industries, operations, processes, or processes shall not be carried out
or shall be carried out subject to certain safeguards under the Environment (Protection) Act, 1986, and
for matters related there to (GOI, 1999).
Best Practices
The best practices for Common Effluent Treatment Plants are described in this section (CETP). Rapid
industrialization is critical for a country's economic development, especially in emerging markets, but
it also has a global environmental impact. If industrial wastewater is not properly treated, it can have
harmful environmental implications. To reduce pollutants released by industry, cleaner manufacturing
techniques and waste reduction initiatives are encouraged. CETPs (Common Effluent Treatment
Plants) are one of the wastewater treatment options available to small and medium-sized industries
(H. D. Sharma et al., 1995). The main objective of establishing CETP are: To reduce the treatment
cost for individual units while protecting the environment, To achieve ‘Economies of scale’ in waste
treatment, thereby reducing the cost of pollution abatement for individual factory, To minimize the
problem of lack of technical assistance and trained personnel as fewer plants require fewer trained
personnel, To solve the problem of lack of space as the centralized facility can be planned in advance
to ensure that adequate space is available, To reduce the problems of monitoring for the pollution
control boards, To organize the disposal of treated wastes and sludge, and To improve the recycling
and reuse possibilities. Till 1990, India had only one CETP in Jeedimetla near Hyderabad (Andhra
Pradesh). Till 2005, around 88 CETPs had been established across the nation. The number of CETPs
rose to more than 150 by the year 2011 (DOIFODE & MATANI, 2015).
Effluent Treatment Technologies
Wastewater depending on its characteristics is subjected to different treatment options as shown in fig.
7.1.

271
Figure 7.1 Effluent Treatment Technologies
Preliminary treatment is required to remove coarse particles and other large items from raw
wastewater. Large materials are removed using screens and grates, coarse particles are ground using
comminutors, and odour is controlled using pre-aeration. Before transferring the effluent to CETP for
further processing, member industries may execute on-site preliminary treatment. CETP's
performance can be improved by conducting preparatory treatment or pre-treatment in individual
member industries.
To physically separate suspended elements from wastewater, primary clarifiers are used. This
approach can minimize total suspended solids (TSS) and related biochemical oxygen demand (BOD).
Primary treatment is to remove organic and inorganic solids that settle through sedimentation, as well
as floatable materials (scum) by skimming. About 25 to 50 percent of the incoming biochemical
oxygen demand (BOD5), 50 to 70% of the total suspended solids (TSS), and 65 percent of the oil and
grease are removed during primary treatment. For advanced primary treatment, chemicals such as
flocculants and coagulants are added to enhance the removal of suspended solids and, to a lesser
extent, dissolved solids
After the preliminary and primary treatment units, wastewater stream is subjected to secondary
treatment which mainly degrades organic matters (in solution or suspension). During this process,
microbes degrade floating and dissolved organic molecules in wastewater. The most often used
biological treatment techniques are activated sludge or biological filtration. Biological therapy can be
aerobic, in which bacteria need oxygen to thrive, anaerobic, in which bacteria can grow without
oxygen, or facultative, in which bacteria can grow in the presence or absence of oxygen.
Microorganisms can be adhered to the surface, as in a trickling filter, or they can be suspended in a
liquid suspension, as in the activated sludge process. The activated sludge process is an aerobic
biological treatment method that utilizes the suspension development of aerobic bacteria to
breakdown organic pollutants.

272
Figure 7.2 Planning Process of a CETP
Because anaerobic treatment systems do not use oxygen, they save energy by reducing the amount of
energy required for oxygen generation and/or transmission. When sulphur is present, these reactions
are slower than aerobic breakdown and create poisonous hydrogen sulphide gas. Although the initial
cost is significant, biogas recovery can help to offset some of it. They are not commonly used in
CETP wastewater treatment systems, except for sludge stabilization.
The final step in the wastewater treatment process is the tertiary treatment which improves the quality
of the wastewater before it is reused, recycled, or discharged into the environment. Among other
things, tertiary treatment polishes effluent (BOD, TSS), removes nutrients (N, P), and removes toxins

273
(pesticides, VOCs, metals). Activated carbon adsorption, flocculation/precipitation, membrane
filtration, ion exchange, de-chlorination, and reverse osmosis are all physical-chemical separation
processes that can be utilised in tertiary treatment.
7.2 Present Scenario and Data Gap
Main industries in the Alwar district are Chemicals, Pesticide, Pharma, Automobile, Dye,
Mettalurgical, Mines, etc. Micro and small-scale industries such as Gypsum Grinding, Plaster of
Paris, Cotton Ginning and Processing, Cotton Spinning Mill, Solvent Extraction Plant, Particle Boards
from cotton Stocks, Roller Flour mill, Straw Board, Processed Food/Achar and Murabba, Mini Dal
Mill, Oil Refinery, Cattle Feed, etc. are situated in the Alwar district.
Data Provided by ULBs
As per the data provided by Alwar and Bhiwadi ULBs (Table 7.1), there are 446 industries which
collectively generates 22.315 MLD of industrial wastewater. It has also found that CETP facility is
not available in these two ULBs. Out of the total industrial wastewater generated, 1.188 MLD of
untreated industrial wastewater is discharged in the Agyara Dam. Three industries in Alwar and 7
industries in the Bhiwadi region do not meet the discharge standards and are not able to treat the
industrial wastewater at their facility. Apart from the data provided by the ULBs, it has also been
noticed that the industrial wastewater is discharged in the open causing water clogging on the main
road as shown in fig. 7.3. Table 7.1 and 7.2 present the current status of compliance by industries and
action taken against those who does not meet the discharge standards shows that there are 10
industries in Alwar and Bhiwadi ULBs which does not meet the discharge standards and one industry
is closed for exceeding standards in last 3 months.
Data for soil quality, ground and surface water, air quality should be provided for environmental
assessment of Industrial Clusters based on Comprehensive Environmental Pollution Index (CEPI)

280
Table 7.1 Inventory of industrial wastewater Generation in Alwar
No. Action Areas Details of Data
Requirement Measurable Outcome
Please enter
Measurable
Outcome for
District RO,
RPCB, Alwar
Please enter
Measurable
Outcome for
District RO,
Bhiwadi(Tehsil-
Tijara)
A
Inventory of
industrial
wastewater
Generation in
District
No of Industries
discharging wastewater [Nos] 193 253
Total Quantity of
industrial wastewater
generated
[MLD] 10.315 MLD Appox. - 12
MLD
Quantity of treated
IWW discharged into
Nalas / Rivers
[MLD] N/A N/A
Quantity of un-treated
or partially treated IWW
discharged into lakes
[MLD]
1.188 MLD is
discharging in
Agyara Dam
Prominent Type of
Industries
[Agro based] / [ Chemical
– Dye etc.] /
[Metallurgical] / [Pharma]
/ [Pesticide] / [Power
Plants] / [Mining] /
[Automobile] : Multiple
selection based on size of
operation and number
Chemical-65,
Pesticide-2,
Pharma-1,
Automobile- 70,
Dye-4,
Mettalurgical-
55, Mines-176
Chemical-96,
Pesticide-4,
Pharma-20,
Automobile-85,
Mettalurgical-48
Common Effluent
Treatment Facilities [Nos] / [No CETPs] NIL NIL
B
Status of
compliance by
Industries in
treating wastewater
No of Industries
meeting Standards [Nos] 190 246
No of Industries not
meeting discharge
Standards
[Automatic] 3 7
No of complaints
received or number of
recurring complaints
against industrial
pollution in last 3
months
[Nos] NIL
C
Status of Action
taken for not
meeting discharge
standards
No of direction issued
by SPCB[Nos]
No industries closed for
exceeding standards in
last 3 months
[Nos] 1
No of industries where
Environmental
Compensation was
imposed By SPCBs
[Nos] NIL

281
Table 7.2 Status of compliance by Industries and action taken in treating wastewater
S. No. Details of Data Requirement Units Outcome for District
1 No of Industries meeting Standards Nos. 436
2 No of Industries not meeting discharge
Standards Nos. 10
3 No of complaints received or number of
recurring complaints against industrial
pollution in last 3 months Nos. NIL
4 No industries closed for exceeding
standards in last 3 months Nos. 1
5 No of industries where Environmental
Compensation was imposed By SPCBs Nos. Nil
Inferences from Present Scenario
This section presents the inferences compiled from the data provided by the ULBs in Alwar district.
As per the data provided there is no CETP functioning in the district but there is an CETP of capacity
9 MLD is already established by “Bhiwadi Jal Pradushan Niwaran Trust”. CETP have advance
treatment technology by the application of Reactor Clarifier, Rapid Gravity sand filter & ultra-
filtration followed by Reverse Osmosis Technology (BJPNT, 2021). At present there are 3 industries
from Alwar and 7 industries from Bhiwadi which are not meeting the prescribed wastewater discharge
standards. Some rectification measures should be implemented immediately to meet the prescribed
effluent discharge standards and environmental regulation for these industries.
During the site visit to Bhiwadi nagar parishad, it was found that the untreated industrial wastewater
was discharged directly into the open area causing water clogging over the road as shown in fig.7.3.
Industrial effluent dumped in the open area has very foul odors, unsightliness and bad odour affect the
aesthetic value of our environment. The industrial waste is more hazardous as compared to municipal
waste. However, it is confined to industries and hence can be easily managed. Moreover, small scale
industries may be supported by the CETP unit and looking at the present scenario it is necessary to
establish one such CETP unit for the Alwar ULB. As per the data provided by Alwar ULB, 1.188
MLD untreated industrial wastewater is discharged into the Agyara Dam, a surface water sources.
This will result in the pollution of ground water as well as surface water. It also harms the aquatic life
which caused ecosystem degradation.
Bhiwadi an industrial cluster with area of 5300 acres. is rapidly evolving into a bustling industrial and
residential real estate hub in the Delhi-NCR region. The state government’s and local authorities’
expedited focus on boosting the suburb’s socio-economic and infrastructural development is going to

282
unlock the economic potential of Bhiwadi and drive the region’s growth in the coming years.
According to the data there are 193 and 253 industrial eatablishment at Alwar and Bhiwadi
respectively. Rajasthan State Industrial Development and Investment Corporation (RIICO) on the
other hand has been relentlessly developing clusters of industrial areas in and around the Bhiwadi
region. As per the data, different categories of industries like Chemical, Pesticide, Pharma,
Automobile, Dye, Mettalurgical, Mines etc. are functioning in the Bhiwadi and Alwar region. As per
the Industrial Potential Survey by RIICO, units of large/medium and small scale sector have been
registered in the district. Registered industries which are most polluting to the environment are
presented in the table 7.3 (GoR, 2019).
Small-scale industries produce mass consumption items: wool, silk and synthetic fibre textiles, cotton
textiles, chemical and chemical products, hosiery and garments, leather and leather goods, automobile
components, paper products and printing, stationary items, plastic and rubber goods, safety matches,
food products, paints and varnishes and domestic utensils. Among the sophisticated items, Small-scale
industries produce televisions, calculators, surgical items and pesticide formulators among many
others. These also produce a variety of parts and components required by large enterprises.
Table 7.3 Registered Small Scale Industries in District Alwar
S. No Industry Description Units
1. Mining of Metal Ores 30
2. Mfg of Food Products and Beverages 385
3. Mfg of Textiles 42
4. Mfg of Wearing Apparel; Dressing and Dyeing of Fur 222
5. Mfg of Leather and Leather Product 65
6. Mfg of Paper And Paper Products 60
7. Mfg of Coke & Refined Petroleum Products and Nuclear Fuel 5
8. Mfg of Chemicals and Chemical Products 75
9. Mfg of Motor Vehicles, Trailers and Semi-Trailers 30
10 Repair & Maintenance of Motor Vehicle, Retail Sale of Automotive Fuel 35
To minimize the environmental pollution due to the small and medium-scale industries, cleaner
production technologies and formation of waste minimization circles should be encouraged at the
industrial clusters along with the centralized treatment facilities like CETP should be established to
boost the industrial development as well as to keep the environment clean. As per the data provided,
for industrial cities like Bhiwadi and Alwar which houses almost 500 industrial establishments there
is no CETP available for the treatment of large quantity of the industrial effluent. The establishment
of CETP at Alwar and Bhiwadi must be set on priorities.

283
Figure 7.3 Industrial Waste dumped in open at Bhiwadi ULB
7.3 Action Plan
To minimize the environmental pollution due to the small, medium and large scale industries, it is
important to implement, Cleaner production technologies, Waste minimization methods and centers,
and establishment of a Common effluent treatment plant (CETP). Collective treatment of effluent
from a large number of small-scale facilities at a single site where the effluent undergoes similar
treatment instead of what it would be subjected to individually. This helps in terms of land
conservation, better treatment at one location, easy operation and maintenance, and shared expenses.
CETPs should be designed to collect and treat effluent from a multitude of facilities, which require
CETPs to deal with varying qualities and quantities of effluent.
For industrial city of Alwar and Bhiwadi where a large number of small and medium scale polluting
industries are established, establishment of CETPs for treatment of effluents generated in clusters is
very important.
The future action plans from different agencies for Alwar have been summarized in table provided
below with time frame for implementation.

284
Table 7.4 Action Area for Industrial Waste Management
S.
No.
Action points (Including source and mitigation
measures)
Time frame for
implementation
Suggested Responsible
stakeholders/ Agency
involved
1. Monitoring of soil and Groundwater quality where
industrial waste has been discarded without any
scientific measures
Urgent State Groundwater Board
2. Installation of Flow meter / Water mater with each
industrial unit for monitoring of compliance of the
permitted discharge quality.
Urgent Industrial Association,
RIICO
3. Periodic water audit of industries Urgent RSPCB and ULB
4. Periodic audit of industries in regard to the industrial
wastewater generated, quantity of industrial
wastewater discharged, and quality of the discharged
wastewater
Urgent RSPCB and ULB
4. Provision of potable water for affected villages, if
any
Urgent PHED
5. Inventory of Industrial emission by doing survey of
all industries to ensure inventory of emission
3-years RSPCB
6. Adequacy of Available Infrastructure for Pollution
Control:
(i) Air Pollution Monitoring and Control
(ii) Industrial Waste water monitoring and Control
(iii) Hazardous Waste Monitoring and Control
5-years RSPCB
7. Environment Compensation 21-year RSPCB
There is a need for proper monitoring of the management of industrial waste so that further
deterioration of the soil and water quality in the area can be prevented.
Suggested Interventions
It is necessary to close the gap between wastewater treatment technology vendors and industry
professionals. For industries, the water metering and accounting system should be made stricter.
Auditing of water and wastewater should be made mandatory. Industrial locations should be chosen
with the least environmental and social effect in mind, and e-filing of the quantity of water utilized
and wastewater released should be done. Industries should be informed about the most recent
advances in wastewater treatment technology on the market. Desalination, ultrafiltration, Nano
filtration, membrane bioreactors, and other sophisticated effective technologies should be rewarded
with incentives. Subsidies for wastewater recycling and reuse should be made available to businesses.
To minimize the environmental pollution due to the small, medium and large scale industries, it is
important to implement cleaner production technologies, Waste minimization methods and centers,
and establishment of the Common effluent treatment plant (CETP) in the industrial cluster zone.

285
It is necessary to do proper monitoring of scattered waste littered on the open ground. If this waste is
already there, then it should be sent to landfill and if it discharged somewhere else it should meet the
standards set by regulatory authority.
7.4 Summary
In summary there are 10 industries in the Alwar and Bhiwadi industrial area which does not meet the
discharge standards. According to RSPCB, no CETP is functioning for the Bhiwadi and Alwar
industrial area. Details for CETPs proposed for the industrial area is not provided. No proper
mechanism is available or used for the handling of industrial wastewater and a very careless approach
is used in the district for the industrial wastewater recycling as evident from the open discharge of the
industrial wastewater. It is very important to make it compulsory for all the industries to follow the
zero discharge policy or alternatively should be supported by establishing the Common effluent
treatment plant (CETP) in the different industrial areas of the Alwar and Bhiwadi district on an
immediate basis.
Table 7.5 Summary about Industrial Waste Management in Alwar District
Name of
District
Present Status Action Plan for future
Alwar
● 193 and 253 industries are discharging
waste water in Alwar and Bhiwadi
respectively.
● Quantity of untreated and treated IWW is
10.31 MLD (Alwar), 12 MLD (Bhiwadi).
● Quantity of un-treated or partially treated
IWW discharged into lakes- 1.188 MLD is
discharging in Agyara Dam for Alwar
● Common Effluent Treatment (CETP)
Facility has not been installed.
Monitoring of soil and groundwater quality
● Installation of Flow meter / Water mater with
each industrial unit for monitoring of
compliance of the permitted discharge
quantity.
● Periodic water audit of industries
● Establishment of CETP units for both Alwar
and Bhiwadi industrial area
● Inventory of Industrial emission by doing
survey of all industries to ensure inventory of
emission
● Utilization of Environment Compensation
for pollution Control
● Provision of potable water for affected
villages.

286
8. Mining Activity Management Plan
8.1 Literature Review
A mineral is a crystalline element or chemical compound that has developed as a result of geological
processes (Aznar-Sánchez et al., 2018). Mining, like agriculture, is one of the world's oldest
industries. Mineral extraction has a long history in India, dating back to the Harappa culture. The
abundance of minerals in the form of abundant rich deposits made the mining sector in India
particularly conducive to growth and development. The minerals and mining business is a vital part of
the Indian economy, as the country is rich in mineral resources. The country's quick growth rate
necessitates the rapid development of the mining industry, which supports the majority of the
manufacturing sector's basic industries. Mineral extraction and development are inextricably tied to
other natural resources such as land, water, air, and forest (Scoble et al., 2003). As a result, the
management of this valuable resource, as well as its optimal and cost-effective usage, are national
priorities. The fundamental goal of a Mining Activity Management Plan is to formalise the actions
and policies that, when done together, will keep environmental impacts to acceptable and sustainable
levels in the medium and long term. Fig. 8.1 explains the waste generation in mining activities.
Environment baseline studies have to be conducted in respect of micrometeorology, air quality,
ambient noise levels, biological environment (flora & fauna), water quality, soil quality & socio-
economics in the core and buffer zone of 10 km radius (Lèbre et al., 2017).
Figure 8.1 Waste Generation in Mining Cycle

287
Figure 8.2 Methodology applied to good mining practice
Environmental Impacts of Mining projects
Impacts on water resources
The consequences of a mining project on water quality and availability of water resources within the
project region have the greatest influence. Acid mine drainage and contaminant leaching have the
greatest impact on water resources. Erosion of soils and mine wastes into surface waters, which has
resulted in the loss of potential of soil and sediment eroding into and reducing surface water quality, is
a critical problem (Nickel & Mandarino, 1987).
Impacts of mining projects on air quality
Airborne emissions occur at every stage of the mining process, but particularly during exploration,
development, building, and operations. Large amounts of material are mobilised during mining
operations, and waste piles containing minute particles are easily scattered by the wind. Mercury leaks
by accident, as well as noise and vibration, are all major issues.
Impacts of mining projects on wildlife, Habitat fragmentation
The destruction of vegetation and topsoil, the displacement of wildlife, the release of pollutants, and
the emission of noise all have an impact on the ecosystem and associated biota. Habitat fragmentation
occurs when huge amounts of land are split up into smaller and smaller chunks, making native species

288
dispersal difficult or impossible from one patch to the next and cutting off migratory routes.
Figure 8.3 Impacts of mining projects on wildlife, Habitat fragmentation
Impacts of mining projects on soil quality, social values
Mining has the potential to contaminate soils across a vast area. Agricultural operations in the vicinity
of a mining activity may be especially impacted. Erosion of exposed soils, mineral ores, tailings, and
fine particles in waste rock piles can cause significant sediment loading in surface waters and drainage
ways. In addition, hazardous substance spills and leaks, as well as the deposition of polluted
windblown dust, can contaminate the soil.
Human displacement and Resettlement, lost access to clean water, impacts on public health, impacts
on livelihoods
Displacement of settled communities is a major source of anger and conflict in areas where large-
scale mineral exploitation is taking place. Entire communities may be uprooted and compelled to
relocate, frequently to purpose-built towns that they did not want. Communities may lose their land,
and hence their livelihoods, in addition to their homes.
Climate change Considerations
Large-scale mining projects have the potential to alter global carbon in at least the following ways:
Many large-scale mining projects are proposed in heavily forested areas of tropical regions that are
critical for absorbing atmospheric carbon dioxide (CO2) and maintaining a healthy balance between
CO2 emissions and CO2 uptake.
Suggestive Interventions for Mining Waste Management
During the construction of a trash dump, there are two significant issues that arise. The first is the
availability of adequate land (that is technically, environmentally, and commercially viable), followed
by the capacity to control the construction of that property. Technically suitable means that the land
can accommodate the volume of trash and can endure ground bearing pressure. Allowable pollution of
ground/surface water; restoration of top soil in both disposal and mining areas, among other things.
Tailing and other finer waste can be disposed in various ways. By order of importance, the disposal of
tailings is generally by:
Terrestrial Impoundment: The most common form of tailings disposal is by burying them in the
ground. It has to do with fine trash and slurries like mill tailings. The goal of tailings dams (or ponds)

289
is to dispose of tailings in a way that allows them to be reprocessed in the future (once improved
technology or a significant increase price makes it profitable).
Underground Backfilling: This method is possible only for ore deposit without communication with
an aquifer. Such an operation is usually costly and will be carried out for stability and safety reasons.
Deep Water Disposal: The disposal of tailings and solid waste directly into bodies of water although
sometimes used in past operations, is rapidly becoming non-authorized as a standard practice due to
the significant
Recycling: Depending on its geotechnical and geochemical qualities, coarse mining waste and
especially barren rock are occasionally regarded as materials for roads, building foundations, or
cement factories. Recycling is not the same as dumping. Solid waste is recycled 22%, 58 percent is
dumped, and 7% is backfilled in the German potash industry; liquid waste is disposed of in deep wells
and 5% is discharged into rivers. Waste rock may not have a market at this time. If a market develops
later, the rock that has been temporarily stored can be sold as aggregate once environmental
requirements are met. The tailings can be recycled using modern procedures. This strategy
necessitates specific circumstances and effect assessments. In the medium term, scientists appear to
agree that a correctly constructed underwater disposal of sulphide tailings is the optimal solution from
an environmental standpoint, with control of the water level (Gadd, 2007).
Scenario in Country
According to the International Organizing Committee for the World Mining Congress's Report on
Mineral Production, India ranked fourth among mineral producing countries, behind China, the
United States, and Russia, in terms of volume of production in 2009. However, it ranked eighth in
terms of value of mineral production in 2009. As a result, the mining industry is an important part of
India's economy, accounting for around 2% of GDP. However, the sector's contribution to India's
GDP has been declining. In 1992-93, the mining sector contributed 3.4 percent of India's GDP. In
1999-2000, it fell to 3.0 percent, and then to 2.3 percent in 2009-10. And, since the sector has shrunk
in absolute terms in recent years, the mining sector's contribution to India's GDP has dropped to just
2% in 2012-13.
There are 87 minerals produced in India, including four fuel minerals, ten metallic minerals, 47 non-
metallic minerals, three atomic minerals, and 23 minor minerals (including building and other
materials). After a five-year average growth rate of 4.8 percent from 2006-07 to 2010-11, the industry
has now experienced negative growth of 0.6 percent for two years in a row (2011-12 and 2012-13). In
India, there are over 3000 mines. There are 560 coal mines (19% of total), 553 limestone mines (19%
of total), and 316 iron ore mines in the country (11 percent of total number). They comprise about half

290
of the total number of reporting mines. The number of mines engaged in extraction was also
significant in cases of bauxite (189), manganese (141), dolomite (116) and Steatite (113).
Scenario in State
There are 193 Urban Local Bodies (ULBs), 295 Panchayat Samitis, and 9,892 Gram Panchayats
throughout Rajasthan's 33 districts (GPs). According to the 2011 Census, the state's population is 6.86
crores, with 24.78 percent living in urban areas and 75.13 percent in rural areas. Rajasthan is today
regarded as a mineral museum, with both metallic and non-metallic minerals, as well as renowned
construction stones. It is in a unique situation since it has large radioactive mineral, lignite, petroleum,
and natural gas deposits. Rajasthan is the richest state in the country in terms of mineral supply and
variety, producing 57 different minerals. Rajasthan is the only state that produces lead and zinc ores,
as well as selenite and wollastonite. Rajasthan was the only garnet (gem) producer until 2004-05.
Rajasthan produces the majority of the country's calcite, natural gypsum, and silver. Ball clay, calcite,
clay, copper ore/conc., feldspar, fireclay, limestone, ochre, phosphorite/rock phosphate, and steatite
are all key products produced in the state. Marble, granite, sandstone, and Kota stone in various
colours are also produced in large quantities throughout the state. The Makrana area is a world-
renowned marble mining centre. Potash (94 percent), lead and zinc ore (89 percent), wollastonite (88
percent), silver ore (88 percent), gypsum (82 percent), ochre (81 percent), bentonite (75 percent),
fuller's earth (74 percent), diatomite (72 percent), feldspar (66 percent), marble (63 percent), asbestos
(61 percent), copper ore (54 percent), copper ore (54 percent), calcite (5 percent) are all resources (27
percent).
In 2014-15, the state produced roughly 12% of the total value of mineral production in the country,
placing it second among the states. It was the only company that produced lead and zinc ores and
concentrates, as well as selenite and wollastonite. During the 2014-15 fiscal year, the State recorded
almost all of the country's silver production. Rajasthan was the leading producer of gypsum
accounting for 99%, calcite 96%, phosphorite 95%, ball clay 92%, ochre 89%, talc/soapstone/steatite
82%, fireclay 36% and limestone 21% of the total production of respective minerals in the country.
Besides, it was the second leading producer of copper concentrates contributing 41%, petroleum
(crude) 24% and kaolin 16% of the nation’s output for the year 2014-15.
Governance and Management structure
Concerned Institutions
The Ministry of Mines (MoM), the Government of India is in charge of the whole minerals and
mining sector in the country, including law, administration, policy formulation, and so on, for all
mines and minerals other than coal, lignite, natural gas, and petroleum, as well as offshore minerals.
Minerals are divided into two categories in India: minor minerals and big minerals. The power to

291
create minor mineral policy and legislation is wholly devolved to state governments, whereas the
MoM is in charge of big mineral policy and law. The Ministry is responsible for the administration of
the Mines and Minerals (Development and Regulation) Act, 1957 and rules made there under in
respect of all mines and minerals other than coal, natural gas and petroleum. MoM through its
attached office, Geological Survey of India (GSI), facilitates exploration, geological mapping and
mineral resource assessment in the country. Indian Bureau of Mines (IBM), a subordinate office of the
mom is mainly responsible for regulation of mining in the country. The Ministry also administers the
Offshore Areas Mineral (Development and Regulation) Act, 2002 and rules made there under.
Mineral concessions in India are granted to Indian nationals or entities incorporated in India only.
Attached Office / Subordinate Office: Geological Survey of India (Headquarters at Kolkata) is an
attached office and Indian Bureau of Mines (Headquarters at Nagpur) is a subordinate office of the
Ministry. Public Sector Undertakings: There are three Public Sector Undertakings under the Ministry
of Mines, namely:-National Aluminum Company Limited (NALCO), Bhubaneswar Hindustan
Copper Limited (HCL), Kolkata Mineral Exploration Corporation Limited (MECL), Nagpur
Autonomous Bodies There are three Research Institutions which are Autonomous Bodies of this
Ministry: Jawaharlal Nehru Aluminum Research Development and Design Centre (JNARDDC),
Nagpur; National Institute of Rock Mechanics (NIRM), Kolar Gold Fields, Karnataka, and National
Institute of Minerals Health (NIMH), Nagpur.
Roles and Responsibilities
National Mineral Policy, 1993
The National Mineral Policy was launched in March 1993 as part of the fiscal, economic, and trade
reforms initiated by the Government of India in July 1991. The National Mineral Policy
acknowledged the need of attracting state-of-the-art technology and fostering private investment,
especially Foreign Direct Investment (FDI). The policy stated that the Central Government will
continue to formulate legal measures for the regulation of mines and the development of mineral
resources in consultation with state governments to ensure basic uniformity in mineral administration
so that mineral resource development keeps pace with national policy goals.
Rajasthan Mineral Policy, 2015
The goal of the policy is to develop economically viable and stable mining, minerals, metal, and
mineral reclamation sectors. Orderly and cost-effective development of indigenous mineral resources,
reserves, and metals and mineral reclamation in order to meet industrial, security, and environmental
needs Study and development of methods for the disposal, control, and reclamation of mineral waste
products, as well as the reclamation of mined land, in order to reduce any negative effects of mineral

292
extraction and processing on the physical environment that may arise from mining or mineral
activities.
Rajasthan State Mines and Minerals Limited (RSMML)
Rajasthan State Mines & Minerals Ltd. is a company based in Rajasthan, India (A Govt. of Rajasthan
Enterprise). With a corporate headquarters in Udaipur and a registered office in Jaipur, the company is
involved in the mining and related business of various minerals, primarily Rock Phosphate, Lignite,
Limestone, Gypsum, and other minerals. Rajasthan State Mines & Minerals Limited (RSMML) is one
of the state's most innovative and forward-thinking businesses. It occupies a place of pride in
production and marketing of non-metallic minerals in India. RSMML is multi mineral and multi-
location enterprise engaged in mining of Rock Phosphate, Lignite, SMS grade Limestone and
Gypsum. RSMML is a national leader in the mining and sale of Rock Phosphate and Gypsum, as well
as a global pioneer in open-cast mining and mineral beneficiation of Carbonate Rock Phosphate.
RSMML has also ventured into the energy sector, constructing a 106.30 MW installed capacity Wind
Power Project in Jaisalmer, Rajasthan.
Figure 8.4 District wise distribution of mineral deposits
Mines and Minerals Development and Regulation (MMDR) Bill, 2011
The Bill seeks a comprehensive and holistic reform of the mining industry, including provisions to
address issues such as sustainable mining and local area development, as well as a benefit sharing
mechanism for those affected by mining operations. It also aims to ensure transparency, equity, the
elimination of discretions, effective redresses and regulatory mechanisms, and incentives to encourage
good mining practices. The Bill's main features are: it establishes a simple and transparent mechanism

293
for granting a mining lease or prospecting license through competitive bidding in areas where
mineralization is known, and on the basis of first-in-time in areas where mineralization is unknown; it
establishes a simple and transparent mechanism for granting a mining lease or prospecting license
through competitive bidding in areas where mineralization is not known; and it establishes a simple
and transparent mechanism for granting a mining lease or prospect; It enables the central government
to promote scientific mineral development, through mining plans and mine closure plans enforced by
a central technical agency namely the Indian bureau of mines, as well as the regulatory authorities and
tribunals; It empowers the state governments to cancel the existing concessions or debar a person
from obtaining concession in future for preventing the illegal and irregular mining.
Geological Survey of India
The GSI is the primary agency in charge of assessing the country's geological and regional mineral
resources. Scientific surveys and research with the purpose of discovering mineral resources are
among its areas of operation. Six regional offices and four specialist wings – marine, coal geophysics,
airborne surveys, and training – make up GSI. The GSI is responsible for geological mapping that
covers approximately 3.146 million sq. km, or 94 percent of India's land area. The maps are
1:63,360/1: 50,000 scale, with the data synthesized to provide 1: 2,000,000 scale geological maps of
India that have been correlated with the global set up in accordance with international standards. The
GSI is also actively involved in mapping and exploration technology research and development. It has
established a network of contemporary petrological, paleontological, chemical, mineralogical,
geochronological, geotechnical, and geophysical laboratories across its several operational bases,
which it makes available for a fee. Commercial geological maps and data are available through GSI.
Indian Bureau of Mines
The Ministry of Mines has formed a committee to evaluate and restructure the activities and role of
the Indian Bureau of Mines (IBM) in accordance with the policy guidelines set forth in the National
Mineral Policy, 2008. The Committee has created a draught report, which has been posted on the
Ministry's website for stakeholders to comment on. The geological services of IBM include survey
and preparation of mine plans, preparation of geological plans, preliminary geological appraisal of
mineral properties, including the formulation of an initial scheme of detailed exploration with
estimate of cost and preliminary reconnaissance, quick survey to determine potential areas out of large
properties, etc. IBM also performs regulatory functions, namely: enforcement of Mines and Minerals
(Regulation and Development) Act, Mineral concession Rules, Mineral Conservation and
Development Rules and compliance with Environmental Protection Act. Separately, the IBM had
obtained administrative clearance to fill up 86 scientific and technical previewed posts in various
groups. Of these 29 posts have been filled up. The remaining posts are at various stages of being filled
up.

294
Public Sector Undertaking (PSUs)
Mineral Exploration Corporation Ltd. (MECL): MECL is responsible for detailed exploration of
various minerals/ ores by drilling and exploratory mining and proving reserves for their eventual
exploitation. National aluminum Company Limited (NALCO), Bhubaneswar, Bharat Aluminum
Company Limited (BALCO), New Delhi; Hindustan Zinc Limited (HZL), Udaipur; Hindustan
Copper Limited (HCL), Kolkata; Mineral Exploration Corporation Limited (MECL), Nagpur; Bharat
Gold Mines Limited (BGML), Kolar Gold Fields (Karnataka); Sikkim Mining Corporation (a
Company jointly owned by the State Government of Sikkim and the Central Government); Research
Institutions.
State Directorate of Mining and Geology
The State Governments have been asked to prepare an Action Plan for strengthening the State
Directorate of Mining and Geology in accordance with the recommendation of the National Mineral
Policy, in light of the increase in royalty revenues to the State Governments following the revision of
royalty rates in August 2009. This topic is evaluated on a regular basis in the Ministry of Mines'
Central Coordination-cum-Empowered Committee meetings, which include participation from state
governments.
Geological Programming Board
The GSI's Central Geological Programming Board is currently in charge of coordinating government
agencies' regional exploration efforts. Before being incorporated into the annual programme, the
disaggregated projects are often addressed in State Level Committees and other technical forums. The
National Mineral Policy of 2008 (NMP) mandated that the existing system be overhauled to guarantee
that projects and programmes be prioritised in accordance with national policy goals and that private
sector exploration work is taken into account. The Central Geological Programming Board has, since,
been revamped and the Board will meet at least twice a year as part of the process to strengthen the
linkage between the Central Geological Programming Board and the State Geological Programming
Boards. The CGPB has held its latest meetings on 2nd and 3rd February, 2012. Accordingly, it is
expected that the Central Board will effectively articulate the policy and programmatic requirements
in a technically feasible and scientifically desirable manner, so that projects and programmes are
prioritized in line with national policy goals and take into account and facilitate the exploration work
of the private sector (MoM, 2008).
Initiatives/new developments for mining sector
Mining Tenement System (MTS)
The MTS was created with the goal of automating the different operations related with mineral
concessions. The Scheme's goal is to create an online National Mineral Information System for

295
investors by connecting Central and State agencies involved in mineral resource management in the
country. The Mining Tenement System (MTS) would include both a graphical information database
(GIS) and textual data. These two databases, the non-special database and the special database, would
be smoothly merged such that graphical and textual information could be retrieved. As a result, the
system will be web-enabled, and prospective investors, government entities, and the general public
will be able to access it via the Internet, as per government policy. This would not only give the
decision-making process a boost, but it would also increase transparency and efficiency. The MTS
will not only allow for online application filing, but it will also aid in the identification of potential
mineral concession regions. IBM has been named as the project's Nodal Implementing Agency by the
Ministry. The Core Committee has already accepted MTS's Detailed Project Report (DPR). In
addition, a request for proposals (RFP) for the design, development, maintenance, and operation of
MTS was released. As a result, the retendering of the Request for Proposal (RFP) for the selection of
an implementing agency for the design, development, maintenance, and operation of the Mining
Tenement System is currently underway (MoM, 2017).
Mining within a Sustainable Development Framework (SDF)
The National Mineral Policy 2008, which finds a mention in the MMDR Act following its revision,
includes a Sustainable Development Framework 2011 (SDF) for the mining sector, which includes
suitable compensation for persons harmed by mining-related operations. The SDF framework was
created with the International Council for Metals and Mining (ICMM) in mind, and it includes the
following seven principles: Consider environmental and social concerns while making lease
selections. At regular periods, conduct strategic assessments of significant mining regions. Sound
management systems are used to manage affects at the mine level. Prioritize land, R&R, and other
societal impacts. Encourage community involvement, benefit sharing, and socioeconomic
development contributions. Ensure that mine closure planning, execution, and post-closure operations
are completed in a timely manner, and that assurance and reliable reporting systems are in place.
At multiple levels, mining-related activities must be closely integrated with the economy,
including aligning exploration and mining to maximise long-term efficient mineral production;
improving the efficiency of the interface between mineral extraction and metal production to
increase potential for manufacturing and jobs, as well as resource use efficiency; and promoting
and incentivizing investment (MoM, 2011).
Mining Lease
An application for a mining lease shall be presented to the District Collector of the State Government
concerned, along with the prescribed fee, for any area in which minerals vest in the government. The
consent of the landowner and any individual with occupation rights over the land should be included

296
in any such application. A mining lease is provided for the purpose of carrying out activities in order
to obtain any mineral. It enables the development and production of minerals from ore deposits
uncovered through prospecting and exploration. A Mining Lease is given for a minimum of 20 years
and a maximum of 30 years for any mineral or designated group of linked minerals. A Mining Lease
can be renewed for a maximum of 20 years each time. A person can be awarded a maximum area of
10 square kilometres in one or more Mining Leases in a State, but if the Central Government believes
it is required for the development of any resource, the maximum area limit can be modified (GOI,
1957).
Central Government
The Central Government is required to take actions to conserve and develop minerals in India in a
systematic manner, as well as to safeguard the environment by preventing and managing pollution
produced by prospecting and mining operations. The Central Government develops guidelines to
guarantee that mineral conservation and development are carried out without causing undue
environmental harm (Section 18). The Government has the power of search, entry and inspection of
mines and recovery of amounts due as arrears of land revenue (Sections 23B, 24 and 25) (GOI, 1957).
Sustainable development (SD)
SD is an all-encompassing, somewhat confusing notion that fundamentally signifies long-term
economic and social development, with intergenerational equality as its core principle. All stages of
the mine life cycle — exploration, mine planning, construction, mineral extraction, mine closure, and
post-closure reclamation and rehabilitation – can benefit from sustainability concepts. The Central
Government shall take all necessary actions to protect key mineral resources in the national interest,
as well as to scientifically develop and utilise all mineral resources. The Central Government shall
cause the development of a National Sustainable Development Plan in order to facilitate the scientific
development and exploration of mineral resources, as well as to ensure environmental protection and
pollution prevention and control from prospecting and mining-related operations.
In Canada, constitutional law requires the government and mining companies to engage in meaningful
discussions with Aboriginal communities living on land where mineral extraction is planned. Mineral
rights holders in South Africa must also plan for socio-economic development in the vicinity of their
mining project. A Social and Labor Plan must be presented before mining and production rights can
be granted, according to the mining law (Mineral and Petroleum Resources Act 2002 - MPRDA). The
most pressing requirement in the Indian mining sector is to ensure that existing mining and
environmental law is effectively, efficiently, and meaningfully implemented to ensure scientific
mining, optimal mineral resource utilisation, and environmental integrity. The largest hindrance to the
mining industry's long-term development appears to be the dual federal and state control over mineral

297
administration, as well as the plethora of regulatory organisations with insufficient people and funding
(GoSA, 2012).
Figure 8.5 Issue of Mining Lease by Mining Department
Issues of resource efficiency and resource security in mining
The extraction efficiency of natural resources is one of the primary challenges in Indian mining. For
“Making in India,” “Exploring in India”: Co-production of by-product metals from base metal ores
through process R&D should be prioritised in order to effectively meet the country's needs for so-
called Technology Metals and Energy Critical Metals, as well as provide raw material security and a
competitive edge for the country's manufacturing sector. Developing a venture-capital-backed
methodology To extract metals of strategic significance that occur in minuscule amounts, an R&D
setup is plainly necessary. In the interest of extraction efficiency and resource securing, the
introduction of the "Large Area Prospecting License (LAPL)" specifically for minerals other than iron
ore, bauxite, limestone, etc. (bulk or surficial minerals) and for deep exploration, as well as providing
a separate channel that allows the LAPL concessionaire to claim assured and direct mining rights
(including transferability thereof), is necessary (TERI, 2019).

298
8.2 Present Scenario and Gap Identification
Data provided by ULBs
Data has been provided by the department of mining in Alwar district. Type of mining activities and
other geographical details of the district.
Table 8.1 Mining Activity Datasheet
S.No. Details of Data Requirement Units Outcome for District
A Inventory
3
Type of Mining Activity [Sand Mining] / [Iron
Ore] / [Bauxite] /
[Coal] / Other
[specify]
326(masonry stone
marble, silica
sand, granite, chart, soapstone,
fireclay, dolomite, limestone)
Multiple selection in
order of magnitude of
operations
4 No of Mining licenses given in the district
[Nos] 326
5
Area covered under mining
[Sq Km] 570.2795hect.
6 Area of District [Sq Km] 8380sq.km.
7 Sand mining [yes] / [no] No
8 Area of sand Mining [River bed] / [Estuary]
/ [Non -river deposit] Nil
B Compliance to Environmental Conditions
1 No of Mining areas meeting Environmental
Clearance Conditions Nos. Monitring by
RSPCB
2 No of Mining areas meeting Consent
Conditions of spcbs / pccs Nos. Monitring by
RSPCB
C Mining related environmental Complaints
1 No of pollution related complaints against
Mining Operations in last 1 year Nos. Nil
D Action against non-complying mining activity
1 No of Mining operations suspended for
violations to environmental norms Nos. Nil
2 No of directions issued by spcbs Nos. Nil
3
Provision of pollution abatement
(Air/water/noise) budget allocated for
environmental Protection
Inferences from present scenario
This section presents the inferences compiled from the data provided by the ULBs in Alwar district.
There is no mining operations suspension for violations the environmental norms. To prevent
pollution by mining industry in the district, there is provision of providing spray, plantation in mining
area by permit holders. Also, as per data provided by the mining department (Figure 8.6), all the

299
operations are meeting environmental clearance conditions. Alwar district that has been adversely
affecting the forests and also the nearby Sariska tiger reserve and Bharatpur bird sanctuary. All
mining activity of minor minerals in district Alwar in relation to the site Tijara, Tapukada and
Kishangarh are hereby prohibited. On December 20, 2018 the National Green Tribunal (NGT)
ordered all mining activities within 10 km of the Sariska Tiger Reserve stopped (Pardikar, 2018).
Figure 8.6 Marble Industries in Ramgarh ULB (27°34'56.5"N 76°48'30.4"E)
Figure 8.7 Google Map Earth View of Marbel Industries at Ramgarh ULB

300
The mining impacts the society in a number of ways in Alwar district. The positive contribution may
be noticed in the form of increasing income source, job creation increasing employment, migration,
community formation, population growth and maintenance of social activities. The negative impacts
include labor migration, loss of cultural heritage, and risk of health hazards and change of local
population of the area by inviting labor from outside leading to income inequality among the
employees, which further leads to community conflicts, and environment concerns. In addition to
these, removal of vegetation, topsoil, waste and ore bring inevitable natural consequences such as
deforestation, climate change, erosion, and air and water pollution. The most noticeable impacts on
the ecosystem are degradation of land, deforestation, displacement of wildlife, effects on aquatic
ecosystem, loss of habitat for biodiversity including rare flora and fauna. These impacts included land
degradation, damage to water quality, pollution, and harm to livestock and wildlife biodiversity.
The lack of effective or adequate employee training compounds the negative impacts of closure,
including inadequate job creation. Unemployment, loss of social services and amenities, pollution,
disturbance of the landscape, the loss of land utility and increased risks to health and safety. The
society living near mining industry is at higher risk of facing adverse effects of unplanned mine
closure in near future illustrated abandoned mine sits after the closure of mining activities continue to
pose potential threat to human safety, health and environment.
8.3 Action Plan
Suggested Interventions/ Strategies
To accomplish asset productivity, the Indian mining area is now anticipating receive progressed mine
studying and investigation advancements (utilizing geophysics applications utilizing 2D and 3D
seismic overviews) alongside the use of programming arrangements by using 3D programming
bundles. Various literature indicates that improved mine closure and mine site rehabilitation planning
are best mining procedures, identifies mining for closure as a sustainability issue, and is no longer
simple an environmental issue.
After the closure mine, mining sites should be reused as recreational land, visitor attractions, creative
gardens and lakes with the collaboration of mining companies, investors, and land use planners etc. to
enhance the job opportunities for the local people. Mining must be environmentally sustainable by
innovative methods that decrease the environmental impact caused by mining activities. These
methods include parameters such as decreasing water and energy utilization, minimizing land
mismanagement, water and air pollution at mine sites and maintaining prosperous mine closure and
reclamation activities.
To eliminate these negative impacts or at least to minimize their effects, it is recommended to
establish a geological study and advanced mining exploration at the deposits to be exploited future as

301
well as evaluate their mining potential before start of exploitation. This will facilitate the choice of the
exploitation method, better start mining operations, and ensure good ore recovery rate. Follow an
exploitation technic well adapted to the morphology of the ore deposit. The chosen method must
consider the different geometric and geotechnical parameters of the mineralization. Since the majority
of deposits are favonian with high dip and competent surrounding rock, it is recommended to use the
method of cut-and-fill mining and sublevel stopping. It will allow a good ore recovery rate and avoid
having long and deep trenches that alter the appearance of the area. Cut-and-fill mining is suitable for
a steeply dipping mineral deposit contained in a rock mass with good to moderate stability. It removes
the ore in horizontal slices starting from a bottom cut and advances upwards, allowing the stop
boundaries to be adjusted to follow irregular mineralization. Sublevel stopping (SLOS) is used for
mining mineral deposits with; steep dip where the footwall inclination exceeds the angle of repose;
stable rock in both hanging wall and footwall; competent ore and host rock; and regular ore
boundaries. SLOS recovers the ore in large open stopes, which are normally backfilled to enable
recovery of pillars. The orebody is divided into separates topes, between which ore sections are set
aside for pillars to support the roof and the hanging wall. Pillars are normally shaped as vertical
beams, across the ore body. Horizontal sections of ore are also left as crown pillars. These conditions
correspond perfectly to that of the studied mines. Rehabilitate mining sites at the end of their life. The
authorities should require operator rehabilitating abandoned sites for example by making a fence
around the mine. It is also possible to transform the old mines to geoparks by their rehabilitation,
thereafter; they can be open to tourists. To avoid these negative effects of barite exploitation on
environment, it is recommended to establish a geological study and advanced mining exploration at
the deposits to evaluate their mining potential before start of exploitation; follow an exploitation
technic well adapted to the morphology of the ore deposit like cut-and-fill mining and sublevel
stopping methods.
Role of Government in Forest Conservation: Although the government of every country is very
particular about conservation of its forest resources and has several rules and laws for the protection
of forests but, they are not implemented in an effective manner. Both national and provincial
governments can take some steps in this direction, such as: passing acts for the conservation of
forests, Survey of the forest resources, Categorization of forest areas and proper delimitation of
reserved forest areas, Find out the areas where reforestation can be done, Regulate the commercial use
of forest products, Protect forest from pre, mining and other natural calamities, Develop national
parks, Encourage forests developmental activities like social forestry, etc., and Prepare master plans.

302
Table 8.2 Responsibility of the district with plan of Action
Responsibly of
the district
Committee/ Action Areas
Plan of Action Responsibility
Preventing
illegal mining
Identification of stretches where there are
chances for illegal mining.
Frequent checks in those stretches by the
Taluk Level Task Force and submit reports to
District Level Task Force fortnightly.
To infuse greater transparency and enhance
efficiency in grant of mining activity.
Department of mining
Mining related
environmental complains.
District Level Task Force shall meet once in a
month to discuss the illegal mining
/transporting /damage caused to the
environment and send report to State Level
Proper policies, and regulations that govern
Environment during mining and after mine
closure.
Department of mining; RSPCB
No of Mining operations
suspended for violations to
environmental norms
District Level Task Force shall meet once in a
month to discuss the illegal mining
/transporting /damage caused to the
environment and send report to State Level.
No of Mining areas meeting Environmental
Clearance Conditions
Department of mining; RSPCB
Closure of mines
Mining sites should be reused as recreational
land, visitor attractions, creative gardens and
lakes with the collaboration of mining
companies, investors, and land use planners
etc. to enhance the job opportunities for the
local people.
Department of mining; RSPCB
8.4 Summary
The district has mining activities related to masonry stone, marble, silica, sand, granite, chart,
soapstone, fireclay, dolomite, limestone. A total of 326 mining licenses have been authorized for the
district. The summary of mining activities and action plan for future have been provided in Table 8.5.

303
Table 8.3 Summary Table for Mining Activity Management for Alwar district
Name of
district Present Status Action Plan for future
Alwar
Type of Mining Activity -
326(masonry stone marble, silica
sand, granite, chart, soapstone,
fireclay, dolomite, limestone)
Area covered under mining-
570.2795 hect.
Area of District: 380 Km²
Sand mining: No
Area of sand Mining: Nil
● Proper policies, and regulations that govern
Environment during mining and after mine closure.
● Identification of stretches where there are chances
for illegal mining, frequent checks in those stretches
by the Taluk Level Task Force and submit reports to
District Level Task Force fortnightly.
● District Level Task Force shall meet once in a month
to discuss the illegal mining /transporting /damage
caused to the environment during mining and after
mine closure. Also send report to State Level
regarding number of Mining areas meeting
Environmental Clearance Conditions.
● Mining sites should be reused as recreational land,
visitor attractions, creative gardens and lakes with
the collaboration of mining companies, investors,
and land use planners etc. to enhance the job
opportunities for the local people.

304
9. Rural Environment Management Plan
This chapter aims to discuss the best practices for solving environmental problems in rural areas. It
also discusses the soil and land management practices and their effects.
Waste generation and other problems in urban and rural areas are different. In rural areas, services do
not exist at all in many cases and economic and social barriers prevent many people from accessing
basic services. However, realizing the value of small or intermittent waste streams also has great
potential benefits for rural communities. For example, decentralized resource recovery systems can be
developed, especially sewage, food, livestock and agricultural waste (Baguma et al., 2010). Villagers
have been recovering resources from the waste stream for a long time, but it cannot be done
systematically. Soon, population growth and improved living standards will hinder people's food,
water and energy supply. Innovation is needed to increase supply, improve distribution, reduce waste,
increase efficiency, and reduce demand in rural areas. Because the relationship between food, water
and energy is so closely intertwined, possible solutions or needs in one area are often reflected in
another area. Rural communities actively participated in cooperation with village committees and
regional administrative departments, and many successful cases were produced.
9.1 Literature Review
9.1.1 Soils of India
India is a country of varied conditions of geology, relief, climate and vegetation. Therefore, India has
a large variation in soil groups, particularly different from one another. Indian soils classification is
based on various criteria: -geology, relief, fertility, chemical composition and physical structure, etc.
The formation of the soil in a particular climate is so perfect that each climate type has its soil type.
The Indian Council of Agricultural Research (ICAR) is responsible for setting up an All-India Soil
Survey Committee in 1963 which divided the Indian soils into eight major groups: i) Alluvial soils ii)
Black soils iii) Red soils iv) Laterite and Lateritic soils v) Forest and Mountain soils vi) Arid and
Desert soils vii) Saline and Alkaline soils and viii) Peaty and Marshy soils.
These Indian soils classification has gained wide acceptance over the years.

305
Figure 9.1: Major Soil types and their percentage in India (Maps of India, 2021)
Figure 9.2 Soil Map of India (Maps of India, 2021)

306
9.1.2 Agriculture in India
India’s economic security has been majorly dependent upon the agriculture sector, and the situation is
unlikely to alter in the estimative future. At the time of independence, about 75% of the population
was dependent on agriculture and even to date, agriculture is the support system for 58% of the
population. During this period, the contribution of agriculture and the allied sector to the Gross
Domestic Product (GDP) has fallen from 61 to 19%. To date, India provides a support system to
16.8% of world’s population based on 2.3% of global land and 4.2% of the world’s water resources.
And per capita the availability of resources is about 4 to 6 times less as compared to the overall
world’s average. This is likely to further decrease due to increasing demographic pressure and
consequent diversion of the land for non-agricultural uses.
As compared to 11% of the world average, around 51% of India’s geographical area is already under
cultivation. The current value of cropping intensity of 136% has recorded an upsurge of only 25%
since independence. Also, out of the total net sown area, 65% is constituted by rain fed dry lands.
Along with the fall in the rate of growth of total factor productivity, there is also an exceptional
dilapidation of land (107 million ha) and groundwater resources. This slowing down needs to be
attended and agricultural efficiency has to be doubled to meet growing demands of the population by
2050. Efficiency-mediated upgrading in productivity is the most feasible option to raise production.
India recorded remarkable achievements in agriculture during three decades, ever since the onset of
green revolution in the late sixties, thus enabling the country to overcome extensive hunger and
starvation; achieving self-sufficiency in food; reducing poverty and bringing economic alteration in
millions of rural families. However, this situation started turning contrary for the sector around mid-
nineties, with slowdown in growth rate of output, which then resulted in inactivity or even decline in
farmers’ income leading to agrarian anguish, which is dispersing and turning increasingly serious.
The provider for sustainable production, natural resource base of agriculture, is shrinking and
degrading, and is adversely affecting production capacity of the ecosystem, however, the demand for
agriculture is rising rapidly with increase in population and per caput income and also for the growing
demand from industrial sector. Thus, there is an urgent need to identify severity of problems faced by
the agriculture sector, to re-establish its vigour and put it back on higher growth trajectory. The
problems, are however surmounted, particularly when upgraded and fresh tools of science and
technology have started proposing great opportunities for application in agriculture.
The projected production requirements of various agricultural commodities in India by 2020-21:

307
Table 9.1 Projections of various food products demand in India for 2020-2021(million tonnes)
(Ch. Srinivasa Rao & Sumanta, 2014)
Commodity Base year (2004-2005) Projection (2020-21)
Cereals 192.8 262.0
Pulses 14.2 19.1
Food Grains 207.0 281.1
Milk and Milk Products 91.0 141.5
Egg(number billion) 44.1 81.4
Meat 6.0 10.9
Fish 5.9 11.2
Edible Oilseeds 35.5 53.7
Vegetables 90.6 127.2
Fresh Fruits 52.9 86.2
Sugar (in terms of Cane) 262.3 345.3
The above table (table 9.1) indicates manifold increase in demand of various food products, primarily
owing to increase in population compared to the base year. These demands increasing the avenues of
production and agricultural yield. In order to ensure that the projected demands are met India needs
intervention strategies at national, state and local level which can drive the anticipated agricultural
development towards sustainability.
In comparison to many parts of the world, yield gaps in India have been much higher. Due to changes
in management, soil type, climatic parameters, varietal performances and many more, yield
performances of crops at diverse places may vary extensively. A yield gap equal to present national
average yield, is being faced by major cereal and pulse crops of India, as observed in multi-location
demonstrations and simulation models (ICAR, 2007).
Agricultural zones in India
As a part decision of the Seventh Plan, the Planning Commission, has divided the country into fifteen
wide-ranging agro-climatic zones based on physiography, soils, geological formation, Climate,
cropping patterns, and improvement of irrigation and mineral resources for broad agricultural
planning and developing future strategies. These zones are further divided into more homogeneous 72

308
sub-zones. In these, fourteen regions are in the main land and the remaining ones in the islands of Bay
of Bengal and the Arabian Sea.
The integration of plans of the agro-climatic regions with the state and national plans for enabling and
enhancing policy development based on techno-agro-climatic criterion and considerations, was the
main objective of the planning commission. Further sub-regionalization based on agro-ecological
parameters, is possible in the agro-climatic regional planning (PCI, 1989).
Table 9.2 Yield Gaps in dryland agriculture in India (Ch. Srinivasa Rao & Sumanta, 2014)
Crop Average Yield (t/ha) Yield Gap (t/ha)
National Demonstration National Average
Cereals
Kharif 1.40 0.78 0.62
Rabi 1.73 0.92 0.81
Millets 0.92 0.61 0.31
Pulses 0.75 0.35 0.40
Oil Seeds
Edible Oilseeds 0.60 0.34 0.26
Castor Bean 0.52 0.23 0.29
Assessing the average yield especially in dryland agriculture, India has a yield gap, this factor can be
addressed by plans and policies directed towards agricultural production enhancement and introducing
enabling technologies best suited and adopted to India context.
ICAR launched National Agricultural Research Project (NARP) for the objective of initiating
agricultural research in the agro-climatic zones of the country. The main persistence of NARP was the
setting up or up gradation of a zonal research station in every agro-climatic zone, for producing
location specific, need based research data, particularly targeting the specific agro-ecological
situations. The main focus was on scrutinizing agro-ecological conditions and cropping patterns and
emerge with a programme directly targeted to solve the major hold-ups of agricultural growth in a
particular zone, based on natural resources, major crops, farming systems, production restrictions and
socio-economic conditions dominant in the zone. More stress was implied upon the generation of
technology. As per NARP, the division of the country was into 127 agro-climatic zones.

309
Table 9.3 Agro-climatic Regions/zones in India (PCI, 1989)
S.No. Agro-climatic region / Zone States Represented
1 Western Himalayan Region Himachal Pradesh. Jammu and Kashmir, Uttarakhand
2 Eastern Himalayan Region Arunachal Pradesh, Assam, Manipur, Meghalaya, Mizoram,
Nagaland, Sikkim, Tripura, West Bengal
3 Lower Gangetic Plain Region West Bengal
4 Middle Gangetic Plain Region Uttar Pradesh, Bihar
5 Upper Gangetic Plain Region Uttar Pradesh
6 Trans Gangetic Plain Region Chandigarh, Delhi, Haryana, Punjab, Rajasthan
7 Eastern Plateau and Hills
Region
Chhattisgarh, Jharkhand, Madhya Pradesh, Maharashtra, Odisha,
West Bengal
8 Central Plateau and Hills
Region
Madhya Pradesh, Rajasthan, Uttar Pradesh
9 Western Plateau and Hills
Region
Madhya Pradesh, Maharashtra
10 Southern Plateau and Hills
Region
Andhra Pradesh, Karnataka, Tamil Nadu
11 East Coast Plain and Hills
Region
Andhra Pradesh, Odisha, Puducherry, Tamil Nadu
12 West Coast Plain and Ghat
Region
Goa, Karnataka, Kerala, Maharashtra, Tamil Nadu
13 Gujarat Plain and Hills region Gujarat, Dadra & Nagar Haveli, Daman & Diu
14 Western Dry Region Rajasthan
15 Island Region Andaman & Nicobar Islands, Lakshadweep
Agro-ecological regions by the National Bureau of Soil Survey & Land Use Planning (NBSS &
LUP):
Another classification for the agro-ecological zones was suggested by the National Bureau of Soil
Survey & Land Use Planning (NBSS&LUP) which came up with twenty zones based an integrated
criteria of soil groups and effective rainfall. Adjustment to district boundaries was done with respect
to these delineated boundaries, with a minimal number of regions. Further sub- division of these
twenty agro-ecological zones, resulted in the formulation of 60 sub-zones (PCI, 1989).

310
Figure 9.3 Agro-climatic Regions/zones in India as per the planning commission (PCI, 1989)
9.1.3 Present Scenario in Rajasthan
Soils and Agro-climatic zones of Rajasthan
Our state of Rajasthan has been divided into 10 agro-climatic zones by the Indian Council of
Agricultural Research. These zones are classified on the basis of agro-climatic parameters like
rainfall, temperature regime, topography, soil characteristics, cropping pattern and irrigation
availability.
Agriculture in Rajasthan
Being the largest state of India, Rajasthan is gifted with assorted soil and weather conditions which
comprise of several agro-climatic situations thereby helping the state to adopt differentiated and
diverse cropping and agricultural implementation pattern. Apart from being India’s largest production
house of mustard, pearl millet (bajra), Rajasthan is also the largest producer of three spices (coriander,
cumin, and fenugreek), cluster beans, and isabgol. The state is also the second-largest producer of

311
maize in the country. The state of Rajasthan encompasses a substantial area for vegetable crops. The
state also comprises of the second largest herd of livestock amongst all the other Indian state, thereby
contributing to about 10 per cent of the country’s milk and 30 per cent of the country’s mutton
produce. This diversification helps the state in the management of wide range of risks linked with
dryland agriculture. The state, however, faces many hindrances that are to be systematically addressed
for the facilitation of sustainable development of the sector (Hussain, 2015).
Figure 9.4 Land use Area (lac. Ha.) pattern in Rajasthan (as per 2016 Statistics) (DoA, 2021)
Net Cropped Area 183 lac.ha. Forest 27 lac.ha.
Not available for Cultivation 43 lac.ha. Pastures and Grazing land 17 lac.ha.
Land under Misc. trees o.21 lac.ha. Cultivale Waste land 42 lac.ha.
Fallow land 30 lac.ha.

312
Figure 9.5 Agro-climatic Regions/zones of Rajasthan (DoST, 2010)

313
Figure 9.6 Cropped area in Rajasthan (as per 2016 Statistics) (DoP, 2017)
As underlined in the Draft State Agriculture Policy, major challenges for agriculture sector in
Rajasthan are as follows: i) Death of animals, decline in productivity and reduced performance, due to
frequent droughts. ii) Climate change and global warming; iii) Strengthening of comprehensive
technology based developmental approach to promote dry land/ arid agriculture; iv) Deteriorating soil
health including imbalanced use of fertilizers, micronutrient deficiency, lack of organic matter
content, inadequate soil microbial flora and fauna etc.; v) Disparaging prices, little productivity and
virtually very little value addition, distress sales, and rising cost of cultivation; vi) Lack of efforts for
stabilization of sand dunes and for greening the desert through agro-forestry programs; vii) Missing
mechanisms of export promotion, adherence to sanitation and phyto-sanitation (SPS) standards and
measures for minimizing the export rejections; viii) Lack of integrated farming approach; xi) Lack of
up-scaling of farm-validated modern technologies and agricultural Innovations; x) Gender
mainstreaming in agriculture; and xi) Proper O&M (institutional mechanisms and organizational and
management) alterations for incapacitating the felt restrictions coming in the way of farmland
prosperity in the state (GoR, 2013).
9.1.4 Governance and Management Structure
Institutions concerning Soil management
Department of Agriculture, Co-operation and Farmers' Welfare, Government of India, Department of
Agriculture, Government of Rajasthan, Department of Science and Technology(DST), Government of
India, Ministry of Environment, Forest and Climate change, Government of India, Indian Council of
Agricultural Research(ICAR), Ministry of Agriculture and Farmer’s welfare, Department of
Agricultural Research and Education, Indian Agricultural Statistics Research Institute, NITI Aayog,
Government of India, National Bureau of Soil Survey and Land Use Planning, Indian Council of
Agricultural Research , Krishi Vigyan Kendra
64%
36%
Total Cropped Area
183 lac. Ha.
Rainfed Area 116.88 Lac.ha.
Irrigated area 66.61 lac.ha.

314
Roles and Responsibilities of various departments
Department of Agriculture, Co-operation and Farmer’s Welfare, Government of India
The Department aims towards enhancing productivity and production of agricultural commodities to
ensure food security of the Nation and also to make agriculture a sustainable and viable occupation.
The mission of the department is to achieve targeted growth rate for agriculture sector with the help of
State Governments and other Departments of the Government of India by the enhancement of
agricultural production and making sure the farmer’s welfare by effective implementation of
Ministry's schemes(DoA, 2016). As per the department’s objectives, the department aims at the
functions as provided in Table 9.4.
Table 9.4 Roles and Responsibilities of the Department of Agriculture, Govt. of Rajasthan (DoA, 2016)
Self-sufficiency achievement in food production.
Increase in Agricultural production and hence the income of farmers and farm laborers.
Promotion of viable use of Natural Resources such as Land and Water.
Incorporation and promotion of Soil Health Management and Integrated Nutrient Management applications.
Crop Diversification.
Soil and water testing, hence recommending suitable agricultural inputs.
Assurance in quality of agricultural inputs and availability.
Promotion and application of Organic Farming.
Use of Integrated Pest – Disease Management system.
Transfer and promotion of education for modern agriculture technique developed by technical institutes and
scientists.
Promoting timely agricultural operations by use of agricultural mechanization.
Promotion of mixed-intensive farming for increase in employment opportunities and income per unit area.
Development of scientific farming techniques for making agriculture more rewarding for farmers.
Increase in the production of certain agricultural commodities, ensuring availability of raw material for
industries, in order to increase exports.
Reduction in cultivation cost and striving for holistic development of farmer.
Providing crop insurances to protect farmer against monsoon failure and other natural disasters.
Initiation of various programs for helping to increase per capita income of farmers in back ward areas as well
as for scheduled castes and tribes.
Promotion of women empowerment in agriculture.
Organizing training programs on various traits of agro techniques for their mass broadcasting.
Providing quick and effective solutions of problems faced by farmers in day-to-day practices.

315
Department of Science of Technology, Government of India
With reference to Soil and Agriculture, the Department of Science and Technology aims at the
following: (i) Policy formulation for matters relating to Science and Technology. (ii) Resolving
problems and matters involving the Scientific Advisory Committee of the Cabinet (SACC). (iii) To
promote new areas of Science and Technology with distinct prominence on incipient areas. (iv)
Various processes involving research and development through its research institutions or laboratories
for development of indigenous technologies concerning bio-fuel production, its processing,
standardization and applications, in harmonization with the concerned Ministry or Department; (v)
Promoting utilization of by-products to development value-added chemicals by perusing research and
development activities in this field.
Ministry of Environment, Forest and Climate Change Government of India
The broad objectives of the Ministry are: i) Proper survey and its implementation for the conservation
of flora, fauna, forests and wildlife. ii) Prevention and control of pollution. iii) Afforestation and
regeneration of degraded areas. iv)Protection of the environment. v)Ensuring the welfare of animals.
Indian Council of Agricultural Research (ICAR), Ministry of Agriculture and Farmer’s welfare
Responsible for co-ordinating, guiding and managing research and education in agriculture, ICAR is
the top body for co-ordinating, guiding and managing research and education in agriculture and its
practices. This is one of the largest national agricultural systems in the world, with 101 ICAR
institutes and 71 agricultural universities spread across the country. With the help of its research and
technology development, the council plays a trailblazing role in marshalling Green Revolution and its
successive expansions in agriculture in India, Thus, the country has been enabled to increase the
production of various commodities such as i) Fish by 16.8 times. ii)Horticultural crops by 10.5 times.
iii) Food grains by 5.6 times. iv) Milk by 10.4 times. v) Eggs by 52.9 times. (Since 1950-51 to 2017-
18)
Thus, ICAR has been impacting the national food and nutritional security to a great extent. The
council has played a key role in endorsing excellence in higher education in agriculture. With
internationally acknowledged scientists as part of it, ICAR is involved in radical areas of science and
technology development in various fields. (ICAR, Ministry of Agriculture and Farmer’s Welfare,
Govt. of India)

316
Department of Agricultural Research and Education
The major responsibilities of the Department of Agricultural research and Education are as follows: i)
Up keeping all aspects of the agricultural research and Education such as, horticulture, natural
resources management, agriculture engineering, agricultural extension, animal science, economic
statistics and marketing and fisheries, and all agricultural practices that involves coordination between
the central and state agencies. ii) Attending to all the matters concerning expansion of new technology
in agriculture, horticulture, natural resources management, agriculture engineering, agricultural
extension, animal science, economic statistics and marketing and fisheries, as well as such functions
as plant and animal introduction and exploration and soil and land use survey and planning. iii) Co-
operation of various institutions in the field of agricultural research and education including
relationship with foreign and international agricultural research and educational institutions and
organizations, including participation in international conferences, connotations and other bodies
dealing with agricultural research and education and follow-up decisions at such international
conferences etc. iv) Applied, fundamental and operational research and higher education together with
co-ordination of such research and higher education in agriculture such as agro forestry, animal
husbandry, dairying, fisheries, agricultural statistics, economics and marketing (DoA, 2021).
Indian Agricultural Statistics Research Institute
The major responsibilities of the Indian Agricultural Statistics Research Institute are as follows: i)
Undertaking research, education and training in agricultural statistics. ii) Use of computer applications
and bioinformatics for agriculture research. iii) To arrange for advisory/consultancy services/
methodological support and computational solutions to NARES/NASS (National Agricultural
Research and Education System/ National Agricultural Statistics System) (IASRI, 2015)
Niti Aayog, Government of India
The NITI Aayog (abbreviation for National Institution for Transforming India) is a public policy think
tank of the Government of India, established to achieve sustainable development goals. The Aayog
works with cooperative federalism by adopting the involvement of State Governments of India in the
economic policy-making process using a bottom-up approach. Apart from various other enterprises,
formulation of agriculture reforms such as Model Land Leasing Law, Reforms of the Agricultural
Produce Marketing Committee Act, Agricultural Marketing and Farmer Friendly Reforms Index for
ranking states, etc., comes under the functions of Niti Aayog.
National Bureau of Soil Survey and Land Use planning, ICAR (ICAR, 2020)
The main responsibility of the National Bureau of Soil Survey and Land Use planning is to conduct
and promote research in the National Agriculture Research System in the areas of Soil Survey,

317
Pedology, Geomorphology, Remote Sensing, Geographic Information System, Cartography, Land
Evaluation, Land Use Planning.
Krishi Vigyan Kendra(s)
Usually associated with a local agricultural university, Krishi Vigyan Kendra(s) or “farm science
Centres” serve as the definitive link between the Indian Council of Agricultural Research and farmers.
These centres aim to apply agricultural research in a practical and more localized setting.
Citizens
Citizens and/or farmers are the key stakeholder with respect to the agricultural initiatives and rural
management. These stakeholders are the one who will have the most significant impact upon the
policy decisions. Hence it is vital to understand their stance and engage them by providing suitable
platform while envisaging or formulating future policies and programs. In the Indian context, public
participation is exhibited more in implementation of formulated plans and policies rather than
participation during the formulation of those policies and plans. All the policies are implemented on
or through the public, but public participation in policy formulation has not necessarily been seen as
an indispensable requirement. Hence it is imperative to engage these stakeholders such that they can
work in close coordination with above identified department and contribute towards the planned
initiatives.
9.1.5 Rules and Regulations
The Rajasthan Soil and Water Conservation Act, 1964
The Rajasthan Soil and Water Conservation Act, came into being to provide for the preservation and
enhancement of soil and water resources in the State of Rajasthan. Major regulations formulated by
the act for conservation of soil are as follows: (i) Notification of areas: The State Government may, by
notification in the Official Gazette, declare an area to be a notified area for this Act, in case it appears
to the State Government that the area is desirable to provide for soil and water conservation ; (ii)
Power to regulate, restrict or prohibit certain matters within notified areas: The State Government
may, by order published in the Official Gazette, regulate, restrict or prohibit certain activities in
respect of any notified area.
The issues to be addressed in soil and water conservation schemes are: (i) Maintaining and
constructing 'mends', 'dauls', and 'bundhis' and planting of munja, sarkanda or other soil binding
grasses or plant; (ii) Land levelling, land grading and irrigation layouts. (iii) Adaptation of contour
cultivation. (iv) Growth of row crops to be prohibited. (v) Cultivating quick-maturing leguminous
crops and close cultivating crops during rainy season; (vi) Adaptation of green manuring and
application of bulky organic manures, e.g. Compost, farm-yard manures, etc (GoR, 1964).

318
The Rajasthan Land Revenue Act, 1956
Under the act, use of Agricultural Land for Non-agricultural Purpose may be regulated as follows: (i)
No person holding any land for agriculture, and no transferee of such land or any part thereof, shall
use the same or any part thereof, by the construction of buildings thereon or otherwise for any other
purpose except with the written permission of the State Government obtained din the manner
hereinafter laid down and otherwise that in accordance with the terms and conditions of such
permission. (ii) Any such persons desiring to use such land or any part thereof for any purpose other
than that of agriculture shall apply for the requisite permission in the prescribed manner and to the
prescribed officer or authority and every such application shall contain the prescribed particulars. (iii)
The State Government shall, after making or causing to be made due inquiry in the prescribed
manner, either refuse the permission applied for or grant the same subject to the prescribed terms and
conditions (GoR, 1956).
Under the act, allotment of land for agricultural purposes may be done as follows: (i) As otherwise
provided elsewhere by this Act, lands for agricultural purposes shall be allotted by such authority and
in such manner as may be prescribed by rules made by the State Government in this behalf. (ii) All
allotment of land under this section shall be subject to the payment of rent fixed at such rates as may
be fixed according to custom or by usage or any law on the subject. (iii) If there be more than one
person requiring the same land, the allotment shall be made in the following order – (a) To co-sharer
of the holding if it forms part of a compact block or is irrigated from the same source, preference
amongst such co-sharers being given to one having land less than the area prescribed by rules made
under the Rajasthan Tenancy Act, 1955 (Rajasthan Act 3 of 1955); (b) To persons residing in the
village in which land be situated, preference amongst such persons being given to persons having no
land or less than the area prescribed by the said rules; (c) By drawing lots: Provided that the area so
taken together with the area held by him does not exceed the area prescribed by the said rules (GoR,
1955).
Notwithstanding anything here in force contained the State Government shall have power to allot land
for the purpose of an industry or for any purpose of public utility on such conditions as it deems fit.
9.1.6 Literature Case Studies
The Use of Subsidies for Soil and Water Conservation- A case Study from Western India
This paper discusses the use of subsidies for soil and water conservation (SWC) in the KRIBHCO
(Krishak Bharti Co-operative Ltd.), Indo-British Rain fed Farming Project being implemented in
degraded areas of western India. The basis for, and impact of, embracing subsidies are summarised.
Even though both project staff and farmers agree on the significance of SWC measures, only a few
farmers can meet the expense of the investment of time and money.

319
This is mainly because production in the specified area is so little that most farmers are forced to look
for off-farm work during the dry season. As this is the time when most SWC work is commenced,
there is a need to balance the opportunity cost to farmers of prior employment prospects for appliance
of SWC activities. Profits ascending from the practice of subsidies comprise priming of savings and
credit groups and a temporary decline in annual migration levels. Major disadvantages of this
approach are potential lack of equity and low level of sustainability.
The paper concludes by conversing other aid provisions including loans, differential subsidies and
other such incentives. It proposes that for private farmland, farm families are subsidised with fixed
land enhancement grants (rather than paying those who take part in the SWC work). Farmers and their
community members should discuss how the money would best be utilised. A fixed subsidy per unit
area is suggested for communal land enrichment and while watershed management is led on a village
basis. A village work plan, based on the reserves available, would be articulated by the group of
villagers in consultation with project team (Smith et al., 1999).
9.1.7 Environmental Management in rural areas
Solid and Liquid Waste Management under Swachh Bharat Mission (Gramin) (MoDWS, 2017)
Solid and Liquid Waste Management (SLWM) is one of the key components of Swachh Bharat
Mission (SBM), released to bring development in cleanliness, hygiene and the overall quality of
lifestyles in rural areas. SLWM is the collection, transportation, processing, recycling, treatment, and
disposal of waste material in a scientific manner. SBM focuses on creating and supplying community-
controlled sanitation structures. To put in force SLWM tasks economically and efficiently, ownership
at grassroot level and community involvement at all levels are critical. Information, Education, and
Communication (IEC) interventions ought to attention to SLWM to create a call for a sustainable
system. This should result in setting up structures for waste disposal in one of these manners that it
has tangible effect on the population. The community/Gram Panchayat (GP) must be recommended to
return ahead and call for one of these systems, which they could in the end operate and maintain.
Awareness and training campaigns must aim at panchayat officials, elected representatives, schools,
non - governmental organizations (NGOs) operating in villages, shop keepers, families, and general
public. The GP functionaries could be accountable for design, implementation, operation and
maintenance (O&M) of SLWM structures with support from respective state governments.
Mechanisms concerning 0.33 events in creation and control sports under GP and network supervision
may be explored. In such cases, absolute readability in the roles and duties of diverse stakeholders in
managing SLWM structures is a must. Community contribution and suitable person fees for
sustainable SLWM tasks also are desirable.

320
Solid Waste Management in Rural Area
In rural regions typically the waste material is Kitchen Waste, Agriculture Waste, Horticulture Waste
and domestic animal dung. All those substances are getting used for making manure by the farmers.
Present statistics to be had on stable waste generated in the vicinity are to be accumulated. If possible,
the existing portions of wastes – dangerous family wastes, digital wastes, biomedical and non-
dangerous generated withinside the examine are to be accumulated and presented (NIRDPR, 2016).
Sanitation Programme
The term " total sanitation programme" includes seven important elements, as provide 100% sewage
and drainage systems in all cities, and safely treat/recycle sewage that is ultimately used for irrigation,
and completely prohibit discharge into sewers/rivers. In fact, an efficient sewer system constitutes the
backbone of the urban sewer system. 100% disposal of urban and rural solid waste and final waste
recycling. The coverage rate of sanitary toilets in rural households and suburbs is 100%. All open
spaces in urban and rural communities are paved or asphalted. All streets are paved with concrete
blocks or cobblestones. Urban and rural areas do not tolerate landfills or solid waste landfills, mainly
paper and plastic. Absolutely resist the stagnation of sewage or other sewage in urban or rural areas.
Daily cleaning of streets, streets or public places in rural and urban areas.
Steps to Make a Village Open Defecation Free strongly
Following are the steps in making a village open-defecation free, the following points should be
considered: (i) Efficient fund flow system- Direct Beneficiary Transfer (DBT) and capacity building.
(ii) Community-Led Total Sanitation (CLTS) approach. (iii) Weekly review meeting of different
stakeholders by the District Magistrate. (iv) High impact campaigns and Information Education
Communication (IEC) activities. (v) Involvement of locals and preparing a list of dos and don’ts. (vi)
Identifying vulnerable people. (vii) Raise ODF sustainability as a topic in meetings. (viii) Put together
a taskforce to promote ODF sustainability (MoDWS, 2017).
Water Management
Canals, tanks, etc. must be desilted regularly during the summer months. People should be
encouraged to revive the ancient practice of protecting trees around tanks. Afforestation of barren,
hilly slopes on a war footing should be carried out. Trees withstand drought better than crops. They
check dust, replenish streams, provide shade to cattle and man and give fodder for cattle. They
provide innumerable uses for man. Denuding the land of trees without compensatory afforestation is a
suicidal and short-sighted approach to solving immediate needs. Creation of small reservoirs and
percolation tanks to hold run-off water must be implemented and maintained well.

321
Rain Water Management in Rural Areas
Rain in these regions can be irregular from season to season and from year to year. Since most rural
areas have little water storage capacity, dry periods can result in serious water shortages which
hamper development, and can create serious public health problems. Destruction of forest cover has
caused many formerly perennial streams to stop flowing in the dry season. Given the declining water
level, various structures such as recharge pits, recharge trenches, recharge shaft, Trench with recharge
well, shaft with recharge well, recharge through abandoned hand pumps, abandoned tube well,
recharge well, percolation tank, and roof top rain water harvesting systems should be promoted.
Roof water harvesting rural schools, Rainwater Harvesting (RWH) from roofs is a easy low cost
method that has been practiced for loads of years in the wilderness regions of India. A supply of
potable water, specifically during the dry season (4- five months) Year-round water provision to
enhance hygiene, e.g. low-flush public toilets.
Land Use Land Cover
In rural regions, efficient land is usually the maximum important resource for local people. It should
be used successfully to fulfil the desires of the human beings for water, food, constructing materials
and affordable quality of life, and to hold the functioning of natural systems on which a majority of
these depend. This requires complete making plans and careful allocation of land to the maximum
suitable use or aggregate of uses. Wastelands ought to be afforested on a large scale related to
neighbourhood human beings. Substitutes for furnishings material and packing instances should be
used. This might ease the stress on standing forests. Catchment regions or water-sheds should be
thickly vegetated. This would keep rain water and recharge springs, rivers, etc. Tanks should be
desilted, check dams built and small ponds created to keep run-off water. Shifting agriculture should
get replaced by settled agriculture.
This chapter introduced to discuss best practices for solving environmental problems in rural areas.
Waste generation and other problems in urban and rural areas are different. In rural areas, services do
not exist at all in many cases and economic and social barriers prevent many people from accessing
basic services. However, realizing the value of small or intermittent waste streams also has great
potential benefits for rural communities. For example, decentralized resource recovery systems can be
developed, especially sewage, food, livestock and agricultural waste. Villagers have been recovering
resources from the waste stream for a long time, but it cannot be done systematically. In the near
future, population growth and improved living standards will hinder people's food, water and energy
supply. Innovation is needed to increase supply, improve distribution, reduce waste, increase
efficiency, and reduce demand in rural areas. Because the relationship between food, water and
energy is so closely intertwined, possible solutions or needs in one area are often reflected in another

322
area. Rural communities actively participated in cooperation with village committees and regional
administrative departments, and many successful cases were produced.
For the purpose of the implementation of rural development projects/ schemes under Panchayati Raj
System, the district is divided in the 14 Panchayat Samitis (Blocks). Block Development Officer or
Vikas Adhikari is the Controlling Officer of each of the Panchayat Samiti to serve as extension and
developmental executive at block level.
9.1.8 Present Scenario for Alwar District
Table 9.5 Compositions of Panchayat Samities (GoR, 2021c)
S. No. Name of Panchayat Samiti No. of Gram
Panchayat
1 Bansue 40
2 Behror 30
3 Kathumar 42
4 Kishangarh Bas 34
5 Kotkasim 24
6 Laxmangarh 45
7 Mundawara 43
8 Neemrana 33
9 Rajgarh 31
10 Ramgarh 43
11 Remi 26
12 Thanagazi 36
13 Tijara 44
14 Umren 41
Total 14 512
Alwar district has 14 Panchayat Samiti, 512 Gram Panchayats.

323
Table 9.6 Rural Statistics (GoR, 2011)
Number of Villages Total 2,054
Population - Rural
Persons 3,01,728
Males 15,89,508
Females 14,0220
Child Population in the age group 0-6
Persons 5,02,526
Males 2,69,105
Females 2,33,421
Literates
Persons 17,07,998
Males 10,83,730
Females 6,24,268
Sex Ratio
(Number of females per 1000 males) Rural 900
Area in Square Kilometre Rural 8,146
Number of households Rural 5,11,517
No. of Villages with drinking water facilities
(Annual Progress Report- PHED) Rural 1,954
Total Workers (Main and
Marginal)
Persons 14,87,935
Males 8,16,267
Females 6,71,668
I. Main workers
Persons 9,82,840
Males 6,69,363
Females 3,13,477
II. Marginal workers
Persons 5,05,095
Males 1,46,904
Females 3,58,191
For management of rural areas District Zila Parishad is the concern department. Rural environment
also concern solid waste management, waste water treatment, drinking water supply etc. Some data
regarding these points are acquired from the Zila Parishad, Alwar.

324
Table 9.7 Rural Environment Datasheet Zila Parishad, Alwar
Action Areas Data
Environmental management practices/ policies of the
department Solid liquid waste management practices
Provisions of pollution abatement (Air/water/noise) Air and water pollution reduced by IHHL and
other SLEM activities
Updates on implementation of environment
management policies
Activities of SBM, IHHL and solid liquid
waste management practices
Budget allocated for environmental protection SBM, FFC, SFC, MNREGA
Total population of panchayat (Nos) 3020033
Total wastewater generated in panchayat samitis (Ltr) 30913369
Total wastewater treated in panchayat samitis (Ltr) 309676
Total wastewater left untreated in panchayat samitis (Ltr) 30604569
Total solid waste generated in panchayat samitis (kg) 1223438
Total solid waste treated in panchayat samitis (kg) 78040
Total solid waste left untreated in panchayat samitis (kg) 1144868
solid and liquid waste management -
Status of Drinkable water Tubewells, single phase boring, Handpump
and other soueces
Rain water harvesting (Nos) 453
management of non-bio decomposition like plastic waste -
Status of contamination water Low
current system of cow dung management Arrangement by the village at their own level
Total number of livestock 1916150

325
Figure 9.7 Road site Drainage work on Village Road (Coordinates- 27°34'01.5"N 76°47'36.2"E)
Rain Water Management in Rural Areas
Rain in these regions can be irregular from season to season and from year to year. Since most rural
areas have little water storage capacity, dry periods can result in serious water shortages which
hamper development, and can create serious public health problems. Destruction of forest cover has
caused many formerly perennial streams to stop flowing in the dry season. In view of the declining
water level, various structures such as recharge pits, recharge trenches, recharge shaft, Trench with
recharge well, shaft with recharge well, recharge through abandoned hand pumps, abandoned tube
well, recharge well, percolation tank, and roof top rain water harvesting systems should be promoted.
Roof water harvesting rural schools, Rainwater Harvesting (RWH) from roofs is a easy low cost
method that has been practiced for loads of years in the wilderness regions of India. A supply of
potable water, specifically during the dry season (4- five months) Year-round water provision to
enhance hygiene, e.g. low-flush public toilets (MoDWS, 2017).
Noise Pollution
Noise pollution is triggered in the regions of mining i.e., for the duration of the time of blasting,
operation of energy drillers and while reducing the stones. The stage of noise pollutants might also
additionally end up severe for the duration of the festive seasons. The introduction of inexperienced
belt is specifically beneficial on the perimeter of aerodromes, alongside railway traces and arterial
roads, via or beyond constructed up regions and adjacent business zone. Noise pollution is caused in
the areas of mining i.e., during the time of blasting, operation of power drillers and while cutting the
stones. The level of noise pollution may become intense during the festive seasons. The creation of

326
green belt is particularly advisable on the perimeter of aerodromes, along railway lines and arterial
roads, through or past built-up areas and adjoining industrial zone.
The Unnat Bharat Abhiyan
The Unnat Bharat Abhiyan is inspired by the vision of transformational change in rural development
processes by leveraging knowledge institutions to help build the architecture of an inclusive India.
Under the program, the knowledge base and resources of the premier institutions of the country will
be leveraged to bring in a transformational change in the rural developmental process by creating a
vibrant relationship between the society and the higher educational institutes, with the latter providing
the knowledge and technology support to improve the livelihoods in rural areas and to upgrade the
capabilities of both the public and private organisations in the society. The 11 districts of Rajasthan
where UBA is all set for a launch are Ajmer, Alwar, Bharatpur, Bundi, Dausa, Dhaulpur, Jaipur,
Karauli, Sawai Madhopur, Tonk and Sikar.
The programme will help in identifying developmental challenges and evolve appropriate solutions
for accelerating sustainable growth. The main goal of the program is to build an understanding of the
development agenda within institutes of higher education. The HRD ministry has identified IIT Delhi
as the national coordinating institution (NCI). Later, for better coordination and quick action under
this mission, NCI has identified some regional coordinating institutes (RCI). In Rajasthan, MNIT
Jaipur has been identified as the RCI (Mathrani, 2021).
9.2 Conclusion
India significant proportion of population is residing in rural setups. As per the Census 2011, the total
population of India was 1210.2 million. Of this, the rural population stands at 833.1 million and the
urban population 377.1 million. Indian rural development demands more resources and attention.
Efforts towards guided sustainable rural development will ensure food security and improved
economy for the country. It is vital to formulate acts, policies, programs and plans which would pave
the path to address rural issues. Rising urbanization has often over powered the agendas of policy
makers. It is important to acknowledge the rural environmental concerns which often have
implications on the residing population. Economic development and population growth in rural areas
have led to many problems, such as pollution, land degradation, resource depletion, loss of
biodiversity, loss of income, and health risks. In rural areas, there is often a lack of resources to take
the necessary measures. Low population density and scattered households are not enough to
implement many management strategies related to centralized and urban areas. The development of
the rural economy and environmental protection must be coordinated. Regions are strategies for
environmental, social and economic sustainability. Sustainable environmental management
development based on integrating economic, environmental and social considerations can raise

327
awareness of these environmental challenges and provide solutions, reduce nitrogen and phosphorus
losses caused by agricultural activities, adapt to climate change, and reduce greenhouse gas emissions
in rural areas. Protect the rural ecosystem, optimize and control the process of pollution reduction in
rural areas, use agricultural resources and rural land management and planning.

328
10. Forest Conservation Practices and Management Plan
10.1 Literature Review
Forest ecosystems are a critical component of the world’s biodiversity as many forests are more bio
diverse than other ecosystems. They work as environment for creatures, hydrologic stream
modulators, and soil monitors, establishing perhaps the most significance parts of the biosphere (Viña
et al., 2016). Forests cover 31 % of the global land area. Approximately half the forest area is
relatively intact, and more than one-third is primary forest (i.e. naturally regenerated forests of native
species, where there are no visible indications of human activities and the ecological processes are not
significantly disturbed). The total forest area is 4.06 billion hectares or approximately 5000 m2 (or 50
x 100m) per person, but forests are not equally distributed around the globe. More than half of the
world’s forests are found in only five countries (the Russian Federation, Brazil, Canada, the United
States of America and China) and two-thirds (66 per cent) of forests are found in ten countries
(Kimdung et al., 2013).
Figure 10.1 Share of forest in the world (Ritchie & Roser, 2021)
Deforestation and forest degradation is occurring at disturbing rates, which contributes essentially to
the continuous loss of biodiversity. Since 1990, it is assessed those 420 million hectares of woodland
have been lost through transformation to other land uses, albeit the pace of deforestation has
decreased in the course of recent many years. Somewhere in the range of 2015 and 2020, the pace of
deforestation was assessed at 10 million hectares each year, down from 16 million hectares each year

329
during the 1990s. The space of essential forests worldwide has decreased by more than 80 million
hectares since 1990. Agricultural development keeps on being the primary driver of deforestation and
forest degradation and the related loss of woodland biodiversity. Large-scale commercial agriculture
represented 40% of tropical deforestation somewhere in the range of 2000 and 2010, and nearby
means agribusiness for another 33% (Kugonza et al., 2009).
Forest gives various advantages. They bring down the air temperature by delivering water fume into
the air. At daytime trees create oxygen and store carbon dioxide, which assists with cleaning air.
Forests draws in natural life and offer food and assurance to them. Forests offer security, decrease
light reflection, offer a sound wall and help to direct wind heading and speed. Trees offer imaginative
capacities, for example, making a background, outlining a view, supplementing engineering, etc.
Well, oversaw backwoods supply better water with less contamination than water from different
assets. Some backwoods raise all out-water stream; however, this isn't valid for all timberlands,
woodlands help in controlling the level floods. Forest gives distinctive sort of wood which are utilized
for various purposes like creation of furniture, paper/pencils, etc. Forests help in keeping climate
sound and lovely. Woodlands likewise limit commotion contamination. They store carbon, help in
directing the planetary environment, refine water and moderate normal risks like floods and
avalanches. Backwoods additionally contain around 90% of the world's earthly biodiversity
(Chaudhary, 2000).
Scenario in Country
The top five states in terms of increase in forest cover in India are Karnataka (1,025 sq. km.), Andhra
Pradesh (990 sq. km.), Kerala (823 sq. km.), Jammu & Kashmir (371 sq. km.) and Himachal Pradesh
(334 sq km) (ISFR, 2019). In terms of area, Madhya Pradesh has the largest forest cover in the
country followed by Arunachal Pradesh, Chhattisgarh, Odisha and Maharashtra. In terms of forest
cover as a percentage of their total geographical area, the top five states are Mizoram (85.41 percent),
Arunachal Pradesh (79.63 percent), Meghalaya (76.33 percent), Manipur (75.46 percent) and
Nagaland (75.31 percent). The report also highlighted that there are 62,466 wetlands in the country
and amongst the states, Gujarat has the largest area of wetlands (within the RFA) in the country
followed by West Bengal. The report has identified wetlands of more than one-hectare area within the
RFAs. The ISFR 2019 also showed that the mangrove cover in the country has increased by 54 sq.
km. as compared to the previous assessment. The maximum increase was in Gujarat which recorded
an increase of 37 sq. km followed by Maharashtra (16 sq. km.) and Odisha (8 sq. km.) but it marked a
decrease of mangrove cover in Tamil Nadu (four sq. km.), West Bengal (two sq. km.) and Andaman
and Nicobar Islands (one sq. km.) (MoEFCC, 2019).
With respect to the forests, following terms are relevant: (i) Forest cover: Includes all lands having
trees more than one hectare in area with tree canopy density of more than 10%, irrespective of

330
ownership, legal status of the land and species composition of trees. (ii) Very Dense Forest: All lands
with tree canopy density of 70% and above. The relative composition of forest cover under this
category is 3.02%. (iii) Moderately Dense Forest: All lands with tree canopy density of 40% and more
but less than 70%. Forest cover under this category is 9.39%. (iv) Open Forest: All lands with tree
canopy density of 10% and more but less than 40 %. Forest cover of 9.26% falls under this category.
(v) Scrub Forest: Lands with canopy density less than 10%. Geographical area under this category is
1.41%. (vi) Non-forest: Lands not included in any of the above classes (includes water). Geographical
area under the non-forest category is 76.92% (MoEFCC, 2019).
Figure 10.2 Forest Cover in India, 2015 (ISFR, 2019)
Scenario in State
Situated in the north-western part of the country, the largest state of the country, Rajasthan covers an
area of 3,42,239 sq km, which is 10.40% of the geographical area of the country. The geographical
extent of the State is bounded by 23°4'N to 30°11'N latitude and 69°29'E to 78°17' E longitude. The
State has 4 distinct regions namely, Western Desert with Barren Hills, Level Rocky and Sandy Plains,
the Aravalli Hills and South-Eastern Plateau. The climate of the State varies from semi-arid to arid.
Western part of the State, including Thar Desert (also known as The Great Indian Desert), is relatively

331
dry and infertile whereas in the south-western part, the land is wetter, hilly, and more fertile. The
average annual temperature ranges between 0°C to 50°C and the average annual rainfall is in the
range of 500 mm to about 750 mm. The State is drained by a number of rivers which include Banas,
Chambal, Luni and Mahi (MoEFCC, 2019).
The State has 33 districts. As per the 2011 Census, Rajasthan has a population of 68.55 million
accounting to 5.66 percent of India's population. The rural and urban population constitute 75.10%
and 24.90% respectively. The population density is 200 per sq km which is much lower than the
national average of 382 persons per sq km. The 19th Livestock census 2012 has reported a total
livestock population of 57.73 million in the State. Rajasthan, ranks 15th in terms of forest deficient
State. Recorded Forest Area (RFA) in the State is 32,737 sq km of which 12,475 sq km is Reserved
Forest, 18,217 sq km is Protected Forest and 2,045 sq km is Unclassed Forests. As per the information
receive from the State during the last two years, a total of 42,633 ha of plantations were raised Five
National Parks, 25 Wildlife Sanctuaries and 11 Conservation Reserves constitute the Protected Area
network of the State covering 2.92% of its geographical area. There are 3 Project Tiger
(Ranthambhore, Sariska and Mukundra Hills) and two Ramsar (Keoladeo Ghana sanctuary and
Sambhar Lake) sites (MoEFCC, 2019).
Figure 10.3 Forest cover in Rajasthan (ISFR-b, 2019)
Based on the interpretation of IRS Resourcesat-2 LISS III satellite data of the period Oct to Dec 2017,
the Forest Cover in the State is 16,629.51 sq km which is 4.86 % of the State's geographical area. In
terms of forest canopy density classes, the State has 77.81 sq km under Very Dense Forest (VDF),
4,341.90 sq km under Moderately Dense Forest (MDF) and 12,209.80 sq km under Open Forest (OF).
Forest Cover in the State has increased by 57.51 sq km as compared to the previous assessment
reported in ISFR 2017.

332
Governance and management
Ministry of Environment, Forest and Climate Change
The Ministry of Environment, Forest and Climate Change (MoEF&CC) is the nodal agency in the
administrative structure of the Central Government for the planning, promotion, co-ordination and
overseeing the implementation of India’s environmental and forestry policies and programmes.
The Ministry also serves as the nodal agency in the country for the United Nations Environment
Programme (UNEP), South Asia Co-operative Environment Programme (SACEP), International
Centre for Integrated Mountain Development (ICIMOD) and the follow-up of the United Nations
Conference on Environment and Development (UNCED). The Ministry is also entrusted with issues
relating to multilateral bodies such as the Commission on Sustainable Development (CSD), Global
Environment Facility (GEF) and of regional bodies like Economic and Social Council for Asia and
Pacific (ESCAP) and South Asian Association for Regional Co-operation (SAARC) on matters about
the environment.
The broad objectives of the Ministry are: 1) Conservation and survey of flora, fauna, forests and
wildlife 2) Prevention and control of pollution 3) Afforestation and regeneration of degraded areas 4)
Protection of the environment and 5) Ensuring the welfare of animals. These objectives are well
supported by a set of legislative and regulatory measures, aimed at the preservation, conservation and
protection of the environment (GOI, 2021).

333
Figure 10.4 Management of forests in a region
Indian Council of Forestry Research and Education
ICFRE with its Headquarters at Dehradun is an apex body in the national forestry research system that
promotes and undertakes need based forestry research extension. The Council has a pan India
presence with its 9 Regional Research Institutes and 5 Centers in different bio-geographical regions of
the country. The regional research Institutes are located at Jodhpur, Dehradun, Shimla, Hyderabad,
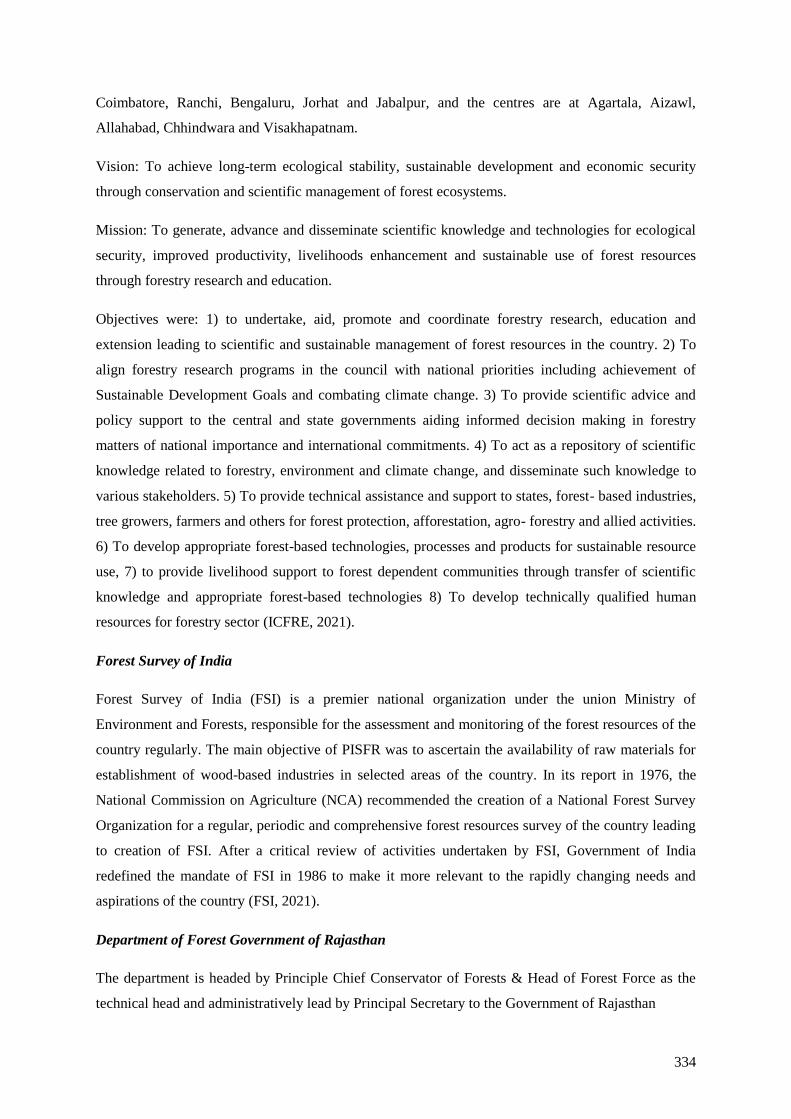
334
Coimbatore, Ranchi, Bengaluru, Jorhat and Jabalpur, and the centres are at Agartala, Aizawl,
Allahabad, Chhindwara and Visakhapatnam.
Vision: To achieve long-term ecological stability, sustainable development and economic security
through conservation and scientific management of forest ecosystems.
Mission: To generate, advance and disseminate scientific knowledge and technologies for ecological
security, improved productivity, livelihoods enhancement and sustainable use of forest resources
through forestry research and education.
Objectives were: 1) to undertake, aid, promote and coordinate forestry research, education and
extension leading to scientific and sustainable management of forest resources in the country. 2) To
align forestry research programs in the council with national priorities including achievement of
Sustainable Development Goals and combating climate change. 3) To provide scientific advice and
policy support to the central and state governments aiding informed decision making in forestry
matters of national importance and international commitments. 4) To act as a repository of scientific
knowledge related to forestry, environment and climate change, and disseminate such knowledge to
various stakeholders. 5) To provide technical assistance and support to states, forest- based industries,
tree growers, farmers and others for forest protection, afforestation, agro- forestry and allied activities.
6) To develop appropriate forest-based technologies, processes and products for sustainable resource
use, 7) to provide livelihood support to forest dependent communities through transfer of scientific
knowledge and appropriate forest-based technologies 8) To develop technically qualified human
resources for forestry sector (ICFRE, 2021).
Forest Survey of India
Forest Survey of India (FSI) is a premier national organization under the union Ministry of
Environment and Forests, responsible for the assessment and monitoring of the forest resources of the
country regularly. The main objective of PISFR was to ascertain the availability of raw materials for
establishment of wood-based industries in selected areas of the country. In its report in 1976, the
National Commission on Agriculture (NCA) recommended the creation of a National Forest Survey
Organization for a regular, periodic and comprehensive forest resources survey of the country leading
to creation of FSI. After a critical review of activities undertaken by FSI, Government of India
redefined the mandate of FSI in 1986 to make it more relevant to the rapidly changing needs and
aspirations of the country (FSI, 2021).
Department of Forest Government of Rajasthan
The department is headed by Principle Chief Conservator of Forests & Head of Forest Force as the
technical head and administratively lead by Principal Secretary to the Government of Rajasthan

335
Rajasthan State Biodiversity Board
The Convention was opened for signature at the Earth Summit in Rio de Janeiro on 5 June 1992 and
entered into force on 29 December 1993. After becoming a party to the Convention on Biological
Diversity in 1994, the Government of India has taken many important steps to further strengthen the
existing framework. The Biological Diversity Act, 2002 (No. 18 of 2003) was enacted by the Ministry
of Law and Justice, Government of India after approval of the Parliament and the assent of the
president on the 5th February 2003. This Act provides for the conservation of biological resources and
their diversity, sustainable use of its components and fair and equitable sharing of the benefits arising
out of the use of biological resources, knowledge and for matters connected therewith or incidental
thereto. In exercise of the powers conferred under subsection (1) of Section 63 of the Biological
Diversity Act, 2002, the Government of Rajasthan framed 'Rajasthan Biological Diversity Rules,
2010', vide notification dated 02 March 2010. As per provision of Section 22 of this Act, the State
Government (s) shall establish State Biodiversity Board for this Act. Accordingly, the Government of
Rajasthan has established the Rajasthan State Biodiversity Board, vide Government order number: F.4
(8) Forest/2005/Part 1 Jaipur dated: 14 September 2010 (GoR, 2021d).
Acts and rules:
Forest conservation Act, 1980
The Forest Conservation Act 1980 was enacted to help conserve the country’s forests. It strictly
restricts and regulates the de-reservation of forests or use of forest land for non-forest purposes
without the prior approval of central government. To this end the act lays down the pre-requisites for
the diversion of forest land for non-forest purposes. This act has been passed with a view to check
deforestation which has been taking place in the country on a large scale and which had cause
ecological imbalance and thus led to environmental deterioration. The president of India promulgated
the forest (Conservation) Ordinance on 25 October 1980. It simply aims at putting restriction on the
DE reservation of forests or use of forest-land for non-forest purposes. The Act is intended to serve a
laudable purpose as is evident from the statement of objects and reasons of the Act, which reads:
Deforestation causes ecological imbalance and leads to environmental deterioration. Deforestation
had been taking place on a large scale in the country and it had caused widespread concern. Intending
to check further deforestation, the president promulgated on 25Th October, 1980 the forest
(Conservation) Ordinance, and 1980 (GOI, 1980).
Indian Forest Act, 1927
The Indian Forest Act, 1927 consolidates the law relating to forests, the transit of forest-produce and
the duty liable on timber and other forest-produce. The Indian Forest Act,1927 aimed to regulate the

336
movement of forest produce, and duty leviable forest produce. It also explains the procedure to be
followed for declaring an area as Reserved Forest, Protected Forest or a Village Forest. This act has
details of what a forest offence is, what are the acts prohibited inside a Reserved Forest, and penalties
leviable on violation of the provisions of the Act. After the Forest Act was enacted in 1865, it was
amended twice (1878 and 1927) (GOI, 1927). This Act impacted the life of forest-dependent
communities. The penalties and procedures given in this Act aimed to extend the state’s control over
forests as well as diminishing the status of people’s rights to forest use. The village communities were
alienated from their age-old symbiotic association with forests. Further amendments were also made
to restrain the local use of forests mainly by forest-dependent communities. It was enacted to make
forest laws more effective and to improve the previous forest laws.
The Scheduled Tribes and Other Traditional Forest Dwellers (Recognition of Forest Rights) Act,
2006
It recognizes the rights of forest-dwelling Scheduled Tribes and other traditional forest dwellers over
the forest areas inhabited by them and provides a framework for according the same (GOI, 2006)
Rajasthan Forest Act, 1953
An Act to consolidate the law relating to forests the transit of forest produce and the duty leviable on
timber and other forest produce. Be it enacted by the Rajasthan State Legislature as follows: received
the assent of the President on 3'1st of March, 1953, published in the Rajasthan Gazette No. 10 Part. lV
A, dated the 18th April, 1953 (GoR, 1953).
Rajasthan State Forest Policy, 2010
The Rajasthan government has proposed a new draft forest policy that will drive the management and
protection of forest in the largest state of India in the next 10 years. The policy aims to have measures
to increase forest area under protected area network, control mining activities, strengthen biodiversity
conservation, increase afforestation and ensure proper management of grasslands. The forest policy
proposes to create a “secret fund to deal with organized forest crimes and illegal mining and be used
to award whistle-blowers/informers.” While promising strict action against illegal mining, it
emphasized that mining will be permitted in the forest areas only after proper clearance.
The main aim of the Rajasthan Forest policy is to: Conserve and enhance environmental resources;
Assure environmental sustainability of key economic sector; Improve environmental governance and
build capacity (GoR, 2010).

337
Table 10.1 Regulations regarding forest conservation
Law Description Requirement
Forest (Conservation) Act,
1980
The Forest (Conservation) Act prohibits the use of
forest land for non-forest purposes without the
approval of Ministry of Environment and Forests
(MoEF), Government of India
Not applicable; none of
the components of the
subproject are located in
forest.
Rajasthan Forest Act, 1953
and Rajasthan Forest Rules,
1962
This Act makes the basis for declaration of
Reserved Forests, constitution of village forest
committees, management of reserved forests and
penalties and procedures.
Not applicable
The following inferences can be drawn a) Conservation of forest is a national problem so it must be
tackled with perfect coordination between forest department and other departments; b) People’s
participation (especially that of tribal/indigenous people) in the conservation of forests is of vital
importance. So, they must be involved in this national task; c) The cutting of trees in the forests needs
to be in a controlled manner along with planting and proper management of the forests; d)
Afforestation or special programme like Van Mahotsava should be launched on grand scale; f)
Plantation forestry with proper joint forest management plan can be useful; g) Community forest
management can be benefitted and can help restore the forest land.
10.2 Present Scenario and Gap Identification
Data provided by Forest Department
The total area under forest is reported to be 72174.09 hectors, which is 14.28 per cent of total
geographical area of the district. The total number of forest block in district is 421. Out of 72174.09
hectares of forest 24936.37hectares are reserved forest, 33968.35 hectares are protected forest, and
13269.371 hectares are under unclassified forest. The forest coverage in the district is more the State
average of about 9 per cent under forest. If compared to the 13 per cent of forest area of national
average, the district comes out to be equal of the national average.

338
Table 10.2 Total Forest Area in Alwar Forest Division
Reserved Forest Protected forest Unclassifed Forest Total Forest Land
No. of
Forest Block Area
No. of
Forest Block Area
No. of
Forest Block Area
No. of
Forest Block Area
29 24936.37 245 33968.35 147 13269.37 421 72174.091
Table 10.3 Forest Cover in Alwar District (area in Sq. Kms.)
Geographical
Area
ISFR 2019 Assessment % of
GA
Change
w.r.t Scrub
Very Dense
Forest
Moderately
Dense Forest
Open Forest
(OF)
8380 59 334.96 802.7 14.28 -0.34 245.66
Table 10.4 Activity by Forest Department
Sl. No. Action Area Unit Data
1 Total Forest Area in the District Hectares 72174.091
2 Afforestation Hectare 7220.139
3 Development of Urban Forest Hectare 2.49
4 Reclaiming of Degraded Forest Land Hectare 2625.096
5 Road Side Plantation Rkm 100 Plant
6 Forestry activities to increase Nos.
7 Any other activity (District Specific)
Table 10.5 Range-wise Forest area in Alwar Forest Division
Sl. No. Name of Range Associated
Panchayat
Forest Area in Ha.
Reserved
Forest
Protected
Forest
Unclassified
Forest Total
1 Alwar
7894.45 2077.15 2196.02 12167.62
2 Thanagazi
4200.88 4081.82 122.80 8405.50
3 Rajgarh
4619.39 11476.12 3156.41 19251.92
4 Laxmangarh
1348.87 2249.53 3204.47 6802.87
5 Kishangarhbas
2465.00 6390.33 2971.35 11826.68
6 Behror
1160.94 2143.42 1338.30 4642.66
7 Tijara
3246.84 5549.03 280.97 9076.84
Total
24936.37 33967.40 13270.32 72174.09

339
The important trees found in the district are Dhok, Babool, Kumtha, Kair, Hingotia, Khejra, Shisham,
Neem etc. The main type of grasses is Bharut, Doob, Baru lapla and Munj, etc. Wild animals like
hyena, wolf, jackal, fox, bush rat, striped in a languor can be easily spotted in the hilly tract of the
district. The common mongoose and hedgehog are also seen in the entire area of the district. The main
threats to the forest land are Illegal mining and Encroachments. Afforestation activities are regularly
prepared and implement in the district.
Table 10.6 Commonly found Wild life in Alwar District (as per 2020-21 Census data)
S. No. Common Name Zoological Name Count
Carnivores
1 Jackal Canis aureus 686
2 Jungal Cat Felis chaus 22
3 Fox Vulpes Bengalensis 19
Total 727
Herbivore
4 Black buck Antelope cervicapra 0
5 Nilgai Boselaphus tragocamhis 1161
6 Chinkara gozella bennettii 0
7 Wild Pig sus scrofa 467
8 Indian crested porcupin hystrix indica 81
Total 1709
Birds
9 Peacock Pavo cristatus 1847
Total 1847
Total 13 nurseries are established in 7 ranges by the department of forest. These nurseries have a total
1,59,0000 plant raising capacity.
Table 10.7 List of Nurseries in Alwar Division
Name of
Nrusery Name of Range
Associated
Phanchyat Permanent/ Temporary
Plant raising
Capacity
Nayabas Alwar - Permanent 200000
Mungaska Alwar - Permanent 200000
Behror Behror - Permanent 100000
Neemrana Behror - Permanent 60000
Kanpura Behror - Permanent 100000
Gunj Kishangarhbas - Permanent 100000
Kotkasim Kishangarhbas - Permanent 50000
Tijara Tijara - Permanent 30000
Srinagar Rajgarh - Permanent 350000
Mahalbagh Rajgarh - Permanent 100000
Burja Laxmangarh - Permanent 50000
Ghata Thanagazi - Permanent 200000
Pratapgarh Thanagazi - Permanent 50000
Total Capacity :- 1590000

340
Total 13 nurseries are established by the forest department, where seedling of plant is done. During
2020-2021 a total number of 4,86,100 plants are prepared in these nurseries.
Table 10.8 Number of Plant Seedlings raised in Nurseries during 2020-21
S. No. Name of Nursery Name of Range Number of Plants (in Lakhs)
For Local Distribution For Department use Total
1 Nayabas Alwar 95000 0 95000
2 Mungaska Alwar 50000 0 50000
3 Behror Behror 25000 200 25200
4 Neemrana Behror 25000 1500 26500
5 Kanpura Behror 20000 1000 21000
6 Gunj Kishangarhbas 25000 0 25000
7 Kotkasim Kishangarhbas 25000 0 25000
8 Tijara Tijara 30000 0 30000
9 Srinagar Rajgarh 25000 0 25000
10 Mahalbagh Rajgarh 25000 0 25000
11 Burja Laxmangarh 15000 0 15000
12 Ghata Thanagazi 20000 55000 75000
13 Pratapgarh Thanagazi 25000 23400 48400
Total 405000 81100 486100
Table 10.9 Range-wise running plantation under different schemes from the year 2015-16 to 2021-22
Name of Range Name of Scheme Allotted Plantation works No. of Plants planted/to be planted.
Number of works Area in Ha. Planted To be planted
Alwar NABARD 5 250 105000 0
Alwar CAMPA 2 100 70000 0
Behror NABARD 4 200 55000 0
Behror CAMPA 10 657.55 388300 0
Kishangarhbas NABARD 12 600 225000 0
Kishangarhbas CAMPA 25 1051.731 651225 0
Laxmangarh NABARD 1 50 25000 0
Laxmangarh CAMPA 10 475 145000 0
Rajgarh NABARD 13 675 220000 0
Rajgarh CAMPA 21 1014.52 333772 3000
Rajgarh State Plan 5 307.232 153616 0
Thanagazi NABARD 7 325 125000 0
Thanagazi CAMPA 22 1225.106 596781 0
Tijara CAMPA 3 150 30000 0
Tijara NABARD 1 50 10000 0
Tijara Gadoj Majri-NH 1 89 62300 0
Total 142 7220.139 3195994 3000

341
For Alwar district, 7 departments are benefited for afforestation where forest department distribute
plant. A total of 2,44,532 units of plant are distributed.
Table 10.10 Distribution of Plants to different Ranges of Alwar District
Sl. No. Department
Alw
ar
Beh
ror
Tija
ra
Kish
an
ga
r
hb
as
Ra
jga
rh
La
xm
an
ga
rh
Th
an
ag
azi
Total
1 Distribution 58551 42043 18500 27000 57593 15845 25000 244532
Total 58551 42043 18500 27000 57593 15845 25000 244532
Different plantation scheme under Farm forestry, tall plant, and NAREGA are implemented.
Table 10.11 Distribution of Plants under different schemes
Scheme Target Achievement
Farm Forestry 40148 35982
Tall Plant 62956 62319
NAREGA 0 0
Total 103104 98301
Sariska Tiger Reserve
Sariska Tiger Reserve is a tiger reserve in Alwar district, Rajasthan, India. It stretches over an area of
881 km2 (340 sq mi) comprising scrub-thorn arid forests, dry deciduous forests, grasslands, and rocky
hills. It was given the status of a tiger reserve making it a part of India's Project Tiger in 1978. The
wildlife sanctuary was declared a national park in 1982, with a total area of about 273.8 km2.
The dominant tree in the forests is dhok (Anogeissus pendula). Other trees include the salar
(Boswellia serrata), kadaya (Sterculia urens), dhak (Butea monosperma), gol (Lannea coromandelica),
ber (Ziziphus mauritiana) and khair (Acacia catechu). Bargad (Ficus benghalensis), arjun (Terminalia
arjuna), gugal (Commiphora wightii) or bamboo. Shrubs are numerous, such as kair (Capparis
decidua), adusta (Adhatoda vesica) and jhar ber (Ziziphus nummularia).
Apart from the Bengal tiger, the reserve harbours many wildlife species including Indian leopard,
jungle cat, caracal, striped hyena, golden jackal, chital, sambar deer, nilgai, wild boar, small Indian
civet, Javan mongoose, ruddy mongoose, honey badger, Rhesus macaque and Northern plains gray
langur and Indian hare. Bird species present include grey partridge, white-throated kingfisher, Indian
peafowl, bush quail, sandgrouse, treepie, golden-backed woodpecker, crested serpent eagle and the
Indian eagle-owl. As of October 2018, there were 18 tigers including five cubs. By 2020, the tiger
population in the reserve has risen to 20 (Wikipedia, 2021).

342
10.3 Action Plan
The following steps should be taken for the conservation of forests:
A. Regulated and Planned Cutting of Trees: One of the main reasons of deforestation is
commercial felling of trees. According to an estimate, about 1,600 million cubic metres of wood have
been used for various purposes in the world. Although trees are considered as perennial resource,
when exploited on a very large scale, their revival cannot be possible.
Therefore, cutting should be regulated by adopting methods like:
(i) Clear cutting, (ii) Selective cutting, and (iii) Shelter wood cutting.
The clear-cutting method is useful for those areas where the same types of trees are available over a
large area. In that case, trees of same age group can be cut down in a selected area and then marked
for replantation. In selective cutting only mature trees are selected for cutting. This process is to be
followed in rotation. Shelter wood cutting is where first of all useless trees having been cut down
followed by medium and best quality timber trees. The time gap between these cuttings is helpful in
re-growth of trees. In regulated cutting only one-tenth of the forest area is selected for use and
rotational system is always followed for their protection. The forest can be managed in such a way
that a timber crop may be harvested indefinitely year after year without being depleted. This
technique is called the ‘sustained yield’ method adopted by many countries of the world
B. Control over Forest Fire: Destruction or loss of forest by fire is fairly common; because trees are
highly exposed to fire and once started it becomes difficult to control. Sometimes, the fire starts by
natural process, i.e., by lightning or by friction between trees during speedy winds, while in most
cases it is started by man either intentionally or unintentionally. In order to save forests from fire it is
necessary to adopt latest techniques of firefighting. Some of the fire suppression techniques are to
develop three metre wide five lanes around the periphery of the fire, back-fires, arrangement of water
spray, fire retardant chemicals should be sprayed from back tank and if possible, by helicopters. There
must be a trained staff of firefighters to control the fire.
C. Reforestation and Afforestation: The sustained yield concept dictates that whenever timber is
removed, either by block cutting or by selective cutting, the denuded area must be reforested. This
may be done by natural or artificial methods. Similarly, any forested land which has been destroyed
by fire or mining activities should be reforested. In rugged terrain aerial seeding is the method of
choice. Besides all this, fresh afforestation programmes should be started. New plantations will not
only increase the forest cover but also help in making up the eco-balance. For afforestation, selection
of trees should be done according to local geographical conditions and care must be taken during
initial growth of the trees.

343
D. Check over Forest Clearance for Agricultural and other purposes: Most of the present-day
agricultural land was once forested and then cleared for the use of agriculture. But now it has reached
the stage where further clearance will be dangerous for the entire ecosystem. Similarly, for the
development of villages, towns and cities, forest lands have been cleared and this process continues to
this day causing loss of forest cover. This also should be checked and green belts around cities should
be developed.
E. Protection of Forest: The existing forests should be protected. Apart from commercial cutting,
unorganized grazing is also one of the reasons. There are several forest diseases resulting from
parasitic fungi, rusts, mistletoes, viruses and nematodes which cause the destruction of trees. The
forests should be protected either by use of chemical spray, antibiotics or by development of disease
resistant strains of trees.
F. Proper Utilization of Forest Products and Forests: Generally, forests have been cut for logs and
rest of the tree – stump, limbs, branches and foliage, etc., are left out in the forest as worthless debris.
Further waste occurs at the saw-mill. There is a need to use all this waste material. Now several uses
have been developed and products like waterproof glues, board, etc., can be obtained.
G. Role of Government in Forest Conservation: Although the government of every country is very
particular about conservation of its forest resources and has several rules and laws for the protection
of forests but, they are not implemented in an effective manner. Both national and provincial
governments can take some steps in this direction, such as: (i) passing acts for the conservation of
forests, (ii) Survey of the forest resources, (iii) Categorization of forest areas and proper delimitation
of reserved forest areas, (iv) Find out the areas where reforestation can be done, (v) Regulate the
commercial use of forest products, (vi) Protect forest from fire, mining and other natural calamities,
(vii) Develop national parks, (viii) Encourage forests developmental activities like social forestry,
agro-forestry, etc., and (ix) Prepare master plans.
H. Forest Management: Management of forest resources is the key to all conservation efforts. In
forest management, the following aspects should be taken into consideration: (i) Survey of forest, (ii)
Categorization of forest. (iii) Economic use of forest, (iv) Administrative setting for forest
management, (v) Training programmes for persons engaged in forest conservation activities, (vi) Use
of forest land as tourist centers, (vii) Social and agro-forestry, (viii) Development of new techniques
for the conservation of forests, (ix) Research for efficient use and conservation of forest, and (x)
Policy decisions and their proper implementation. In brief, conservation of forest resources can be
done by cooperative efforts of the government, non-government organizations and the public through
a proper management system.

344
I. Similarly, forests can easily be used or developed as tourist centers. By using them as tourist centers
the country can earn substantial foreign exchange. This practice has been adopted by many countries,
both developed and developing.
J. The concepts of ‘national park’ and ‘game sanctuary’ have now become popular and every state has
developed its unique forest area as a ‘national park’. In India alone, there are as many as 21 national
parks. This scheme is a good method of forest conservation.
10.4 Summary
Forest preservation is the act of planting and keeping up forested regions for the advantage and
sustainability of people in the future. The protection of forest likewise stands and focuses on a speedy
change in the structure of trees species and age appropriation. Forest preservation includes the upkeep
of the regular assets inside forest that are useful to the two- people and the climate.
In any case, presently forest cover is depleting quickly because of numerous reasons like a
development of agribusiness, other land utilization, urbanization, development of roads, illegal
mining, and encroachments, comprises the greatest and extreme danger to the forest causing genuine
natural harm. In this manner, there is need of public mindfulness.
Summary of present status, future projection and action plan for forest conservation and management
Alwar district:
Table 10.12 Action Plan for Forest Conservation for Alwar District
Name of District Present scenario Action plan for future
Alwar
The total area under forest-
72174.091 hectors
Percent of total geographical
area of the district- 14.28 %
The total number of forest
block in district is 421.
Out of 72174.091hectares of
forest:
Reserved forest:24936.37
hectares,
Protected forest:
33968.35Hectare
Unclassified: 13269.371
Enforcement of acts/rules and regulation of
forest conservation
Development of Urban Forest
Reclaiming of Degraded Forest Land
Road side plantation
Commercialization of forest produces.
Development of forest as a tourist centers and
other recreational activities.
Management and monitoring of forest in the
area

345
In this way, we can conclude that, individuals as well as governments can do their part in protecting
the forests of the world. Knowledge about the importance of forest needs to be spread so that people
become aware of the danger to everyone and everything on the earth by deforestation. People's
participation in the conservation of forests is of vital importance.
Finally, it is necessary to add that the methods, strategies and measures mentioned here for the
conservation of forests are very simple so that every individual could follow them and act at their own
level in order to achieve the goal of conservation of forests. If we do not start and act now, it might
get too late for the cause of conservation of forests.

346
References
Aznar-Sánchez, J. A., García-Gómez, J. J., Velasco-Muñoz, J. F., & Carretero-Gómez, A.
(2018). Mining waste and its sustainable management: Advances in worldwide research.
Minerals, 8(7). https://doi.org/10.3390/min8070284
Babu, B. R., Parande, A. K., Rajalakshmi, R., Suriyakala, P., & Volga, M. (2009).
Management of Biomedical Waste in India and Other Countries: A Review. Journal of
International Environmental Application & Science, 4(1), 65–78.
Baguma, D., Loiskandl, W., & Jung, H. (2010). Water Management, Rainwater Harvesting
and Predictive Variables in Rural Households. Water Resources Management, 24(13), 3333–
3348. https://doi.org/10.1007/s11269-010-9609-9
Balasubramanian, M. (2018). Municipal solid waste management in India: Status, problems
and challenges. International Journal of Environment and Waste Management, 21(4), 253–
268. https://doi.org/10.1504/IJEWM.2018.093435
Bhattacharya, R. R. N. S., Chandrasekhar, K., Deepthi, M. V, Roy, P., & Khan, A. (2018).
Challenges and Opportunities: Plastic Waste Management in India. The Energy and
Resources Institute, 24(2), 3–7.
Biswas, A. (2019). An integrated approach to water quality management. India Water Portal.
https://www.indiawaterportal.org/articles/integrated-approach-water-quality-management
Biswas, A. K., & Tortajada, C. (2019). Water quality management: a globally neglected issue.
International Journal of Water Resources Development, 35(6), 913–916.
https://doi.org/10.1080/07900627.2019.1670506
BJPNT. (2021). Common Effluent Treatment Plant (9 MLD).
http://environmentclearance.nic.in/DownloadPfdFile.aspx?FileName=VBYYo7HuEqJdvuMv
/gW5nqJw0tUcHPzYb2aojfABj4BVkxSKg0tVehCYW4/Lg7IWa+8i8aBI2eXJk9gDjH7kSQ
==&FilePath=93ZZBm8LWEXfg+HAlQix2fE2t8z/pgnoBhDlYdZCxzWF1OLE6RXe5MiAh
SH8vdQ1
Brauer, M., Guttikunda, S. K., K A, N., Dey, S., Tripathi, S. N., Weagle, C., & Martin, R. V.
(2019). Examination of monitoring approaches for ambient air pollution: A case study for
India. Atmospheric Environment, 216, 116940. https://doi.org/10.1016/
j.atmosenv.2019.116940
Brueckner, S., Miró, L., Cabeza, L. F., Pehnt, M., & Laevemann, E. (2014). Methods to
estimate the industrial waste heat potential of regions - A categorization and literature review.
Renewable and Sustainable Energy Reviews, 38, 164–171.
https://doi.org/10.1016/j.rser.2014.04.078
Castonguay, A. C., Urich, C., Iftekhar, M. S., & Deletic, A. (2018). Modelling urban water
management transitions: A case of rainwater harvesting. Environmental Modelling and
Software, 105, 270–285. https://doi.org/10.1016/j.envsoft.2018.05.001
Ch. Srinivasa Rao, S. B. R. and, & Sumanta. (2014). Potassium Nutrition and Management in
Indian Agriculture Issues and Strategies. Indian J. of Fertilisers, 10(May), 58–80.
Chatterjee, N. P. P. B. P. K. (2018). Safe Disposal of Hospital Waste - A Review.
International Journal of Science and Research (IJSR), 7(1), 564–569.
https://doi.org/10.21275/ART20178686
Chaudhary, R. P. (2000). Forest conservation and environmental management in Nepal: A
review. Biodiversity and Conservation, 9(9), 1235–1260.
https://doi.org/10.1023/A:1008900216876
CPCB. (2013). Plastic waste management 2012. In Central Pollution Control Board (Issue

347
june, 2012).
CPCB. (2014). National Air Quality Report. https://app.cpcbccr.com/ccr_docs/FINAL-
REPORT_AQI_.pdf
CPCB. (2015). Inventorization of sewage treatment plants: CUPS/2015.
CPCB. (2016). Guidelines for Management of Healthcare Waste as per Biomedical Waste
Management Rules , 2016. Directorate General of Health Services Ministry of Health &
Family Welfare, 1–74.
CPCB. (2017). Guidelines on Environmental Management of C&D Waste Management in
India. Prepared in Compliance of Rule 10 Sub-Rule 1(a) of C & D Waste Management Rules,
2016, 1(February), 1–39.
CPCB. (2019a). Annual Report on Biomedical Waste Management as per Biomedical Waste
Management Rules , 2016 For the year 2019. 1–18.
CPCB. (2019b). NAMP report 2019.pdf. https://environment.rajasthan.gov.in/
content/dam/environment/RPCB/ EnvironmentalReport/NAMP report 2019.pdf
CPHEEO-Part I. (2016a). CPHEEO (Central Public Health and Environmental Engineering
Organization), Swachh Bharat Mission- Municipal Solid Waste Management Manual Part I:
An Overview. Ministry of Urban Development.
CPHEEO-Part I. (2016b). CPHEEO (Central Public Health and Environmental Engineering
Organization), Swachh Bharat Mission- Municipal Solid Waste Management Manual Part I:
An Overview. Ministry of Urban Development. http://moud.gov.in/pdf/
57f1e55834489Book03.pdf
CPHEEO. (2000). Ministry of Urban Development, Government of India. Manual on
Municipal Solid Waste Management - 2000, 12(3), 809–818.
CPHEEO. (2012). Recent Trends in Technologies in Sewerage System Ministry of Urban
Development. Ministry of Urban Development, March, 1–25.
CPHEEO. (2016a). Ministry of Urban Development, Government of India. Municipal Solid
Waste Management: A Step-Wise Guidance.
CPHEEO. (2016b). Municipal solid waste management: a step-wise guidance. In Ministry of
Urban Development, Government of India. http://cpheeo.gov.in/upload/
uploadfiles/files/Part3.pdf
DGFIZ. (2017). Training Manual on Construction and Demolition Waste Management in
India for Cities and Towns. In DEUTSCHE GESELLSCHAFT FÜR INTERNATIONALE
ZUSAMMENARBEIT (GIZ) GmbH.
Dhingra, P., Singh, Y., Kumar, M., Nagar, H., Singh, K., & Narayan, M. L. (2015). Study on
physico-chemical parameters of waste water effluents from industrial areas of Jaipur,
Rajasthan, India. International Journal of Innovative Science, Engineering & Technology,
2(5), 874–876.
DMRC. (2018). Utilisation of Recycled Produce of Construction & Demolition Waste A
Ready Reckoner.
DoA. (2016). Roles and Responsibilities of the Department of Agriculture.
https://www.rajasthandirect.com/government-departments/rajasthan-agriculture-department
DoA. (2021). Land use pattern in Rajasthan. https://www.rajras.in/rajasthan/geography/land-
use-pattern/
DOIFODE, S. K., & MATANI, A. G. (2015). Effective Industrial Waste Utilization
Technologies towards Cleaner Environment. International Journal of Chemical and Physical

348
Sciences, 4, 536–540.
DoP. (2017). Agricultural Statistics Year 2016-17. https://eands.dacnet.nic.in/PDF/Glance-
2016.pdf
DoST. (2010). 5 Agro-climatic Regions/zones of Rajasth.
https://www.rajras.in/rajasthan/geography/agro-climatic-zones/
Duan, H., Wang, J., & Huang, Q. (2015). Encouraging the environmentally sound
management of C&D waste in China: An integrative review and research agenda. Renewable
and Sustainable Energy Reviews, 43, 611–620. https://doi.org/10.1016/j.rser.2014.11.069
EPA. (2020a). Air Quality Management Process.
EPA. (2020b). Best Practices for Solid Waste Management : Best Practices for Solid Waste
Management : A Guide for Decision-Makers in Developing Countries. October, 1–166.
https://www.epa.gov/sites/default/files/2020-10/documents/master_swmg_10-20-20_0.pdf
Espíndola, J. A. G., & Presents. (2020). International Rainwater Catchment Systems
Experiences. In International Rainwater Catchment Systems Experiences.
https://doi.org/10.2166/9781789060584
Fabbricino, M. (2001). An integrated programme for municipal solid waste management.
Waste Management \& Research, 19(5), 368–379. https://doi.org/10.1177/
0734242X0101900502
FSI. (2021). Forest Survey of India. 2021. https://www.fsi.nic.in/
Fullerton, D. G., Bruce, N., & Gordon, S. B. (2008). Indoor air pollution from biomass fuel
smoke is a major health concern in the developing world. Transactions of the Royal Society of
Tropical Medicine and Hygiene, 102(9), 843–851.
https://doi.org/10.1016/j.trstmh.2008.05.028
G. Singh,. (2012). Effects of rainwater harvesting and afforestation on soil properties and
growth of Emblica officinalis while restoring degraded hills in western India. African Journal
of Environmental Science and Technology, 6(8), 300–311. https://doi.org/10.5897/ajest11.040
Gadd, G. M. (2007). Geomycology: biogeochemical transformations of rocks, minerals,
metals and radionuclides by fungi, bioweathering and bioremediation. Mycological Research,
111(1), 3–49. https://doi.org/10.1016/j.mycres.2006.12.001
Gautam, P. K., Kalla, P., Jethoo, A. S., & Harshwardhan, S. C. (2017). Dimensional Stone
Waste Characterization in Rajasthan and Suggesting their possible Remedies. International
Journal on Emerging Technologies, 8(1), 40–42.
GIZ. (2018). Best Practices on Solid Waste Management in India.
https://www.susana.org/en/knowledge-hub/resources-and-publications/library/details/2939
GOI. (1927). Indian Forest Act, 1927. A Probabilistic Perspective, 78.
http://nbaindia.org/uploaded/Biodiversityindia/Legal/3. Indian forest act.pdf
GOI. (1957). Mines and Minerals (Development and Regulation) Act, 1957 (Vol. 1957, Issue
67). http://ibm.nic.in/writereaddata/files/07102014115602MMDR Act 1957_10052012.pdf
GOI. (1974). THE WATER (PREVENTION AND CONTROL OF POLLUTION) ACT, 1974
(Vol. 1977, Issue 36). http://www.moef.nic.in/legis/water/water7.html
GOI. (1980). Forest conservation Act, 1980. 69, 1–4.
http://nbaindia.org/uploaded/Biodiversityindia/Legal/22. Forest (Conservation) Act, 1980.pdf
GOI. (1981). THE AIR (PREVENTION AND CONTROL OF POLLUTION) ACT, 1981, New
Delhi, India. https://www.indiacode.nic.in/bitstream/123456789/1389/1/a1981-14.pdf

349
GOI. (1986). The Environment (Protection) Act, 1986 Act No. 29 OF 1986, New Delhi, India.
https://www.indiacode.nic.in/bitstream/123456789/6196/1/the_environment_protection_act%
2C1986.pdf
GOI. (1999). Environment (Siting for Industrial Project) Rules-1999 (Vol. 470).
http://www.indiaenvironmentportal.org.in/files/file/Environment (Siting for Industrial
Projects) Rules, 1999.pdf
GOI. (2006). THE SCHEDULED TRIBES AND OTHER TRADITIONAL FOREST
DWELLERS ( RECOGNITION OF FOREST RIGHTS ) ACT , 2006 THE SCHEDULED
TRIBES AND OTHER TRADITIONAL FOREST DWELLERS ( RECOGNITION OF FOREST
RIGHTS ) ACT , 2006 An Act to recognise and vest the forest rights an. 1–9.
GOI. (2011). E-Waste (Mannufacturing and Handling) Rules, 2010, New Delhi, India.
https://doi.org/10.5005/jp/books/11481_83
GOI. (2016). Hazardous Waste (Management, Handling & Transboundary Movement) Rules,
2016. In The Gazette of India.
http://cpcb.nic.in/displaypdf.php?id=aHdtZC9IV01fUnVsZXNfMjAxNi5wZGY=
GOI. (2017). Report on Aquifer Mapping and Ground Water Mangement.
http://cgwb.gov.in/AQM/NAQUIM_REPORT/Rajasthan/Alwar.pdf
GOI. (2019). Plastic Waste Management Practices. In GOI (Issue March).
https://doi.org/10.1201/9780429059247-7
GOI. (2021). Ministry Of Environment, Forest and Climate Change.
https://moef.gov.in/en/about-the-ministry/introduction-8/
Gokhale, S., & Khare, M. (2007). A theoretical framework for the episodic-urban air quality
management plan (e-UAQMP). Atmospheric Environment, 41(36), 7887–7894.
https://doi.org/10.1016/j.atmosenv.2007.06.061
GoR. (1953). Rajasthan Forest Act, 1953.
https://forest.rajasthan.gov.in/content/dam/raj/forest/ForestDepartment/PDFs/The Rajasthan
Forest Act%2C 1953.pdf
GoR. (1955). 1 Rajasthan Tenany (Government) Rules, 1955: Part II- Rules & Notifications.
1955(5), 1–104.
https://landrevenue.rajasthan.gov.in/content/dam/landrevenue/revenuedepartment/Rules/Rajas
than Tenancy (Government) Rules%2C 1955.pdf
GoR. (1956). the Rajasthan Land Revenue Act , 1956 (Issue 33).
https://www.indiacode.nic.in/bitstream/123456789/15472/1/the_rajasthan_land_revenue_act.
_1956.pdf
GoR. (1964). The Rajasthan Soil and Water Conservation Act , 1964. 41(0), 0–22.
http://www.ielrc.org/content/e6406.pdf
GoR. (2010). Rajasthan State Forest Policy, 2010.pdf.
https://forest.rajasthan.gov.in/content/dam/raj/forest/ForestDepartment/PDFs/Public
Information/Forest Acts and Rules/state level/cp12.pdf
GoR. (2011). District census handbook- Alwar.
https://censusindia.gov.in/2011census/dchb/0806_PART_B_DCHB_ALWAR.pdf
GoR. (2013). Draft State Agriculture Policy.
https://agriculture.rajasthan.gov.in/content/dam/agriculture/Agriculture Department/media-
publications/draft-agriculture-policy/agriculture_policy_english.pdf.#agriculture-policy
GoR. (2019). INDUSTRIAL POTENTIAL SURVEY, Alwar (Issue 0144).
https://industries.rajasthan.gov.in/content/dam/industries/CI/pdf/2020-21/IPS_2019-20/IPS

350
ALWAR_19-20.pdf
GoR. (2021a). About Alwar. https://alwar.rajasthan.gov.in/content/raj/alwar/en/about-
alwar/geographical-and-physical-features.html
GoR. (2021b). Alwar Administration Setup.
https://alwar.rajasthan.gov.in/content/raj/alwar/en/about-alwar/administration.html#
GoR. (2021c). Alwar District. 2021. https://alwar.rajasthan.gov.in/content/raj/alwar/en/about-
alwar/statistical-handbook.html
GoR. (2021d). Rajasthan State Biodiversity Board.
https://environment.rajasthan.gov.in/content/environment/en/rajasthan-state-biodiversity-
board.html.html
GoR. (2021e). Tourist Places: Alwar.
https://alwar.rajasthan.gov.in/content/raj/alwar/en/about-alwar/tourist-places.html
GOR. (2013). Alwar Master Plan.
https://urban.rajasthan.gov.in/content/raj/udh/ctp/en/master-plan.html
GOR. (2019). Rajasthan State Solid Waste Management Policy and Strategy , 2019.
https://environment.rajasthan.gov.in/content/dam/environment/Env/Pdf_Files/Rajasthan_SW
M_Policy_Final Doc.pdf
GoSA. (2012). Mineral and Petroleum Resources Act 2002.
http://www.energy.gov.za/files/esources/pdfs/energy/liquidfuels/act28r.pdf
Greenberg, M. R., & Schneider, D. (2019). Noise management. Environmental Health and
the U.S. Federal System, Jansen 1998, 109–138. https://doi.org/10.4324/9780429264757-5
Gulia, S., Nagendra, S. M. S., Barnes, J., & Khare, M. (2018). Urban local air quality
management framework for non-attainment areas in Indian cities. Science of the Total
Environment, 619–620, 1308–1318. https://doi.org/10.1016/j.scitotenv.2017.11.123
Gulia, S., Shiva Nagendra, S. M., Khare, M., & Khanna, I. (2015). Urban air quality
management-A review. Atmospheric Pollution Research, 6(2), 286–304.
https://doi.org/10.5094/APR.2015.033
Gupta, Sakshi, & Malik, R. (2018). Civil Eng Res J The Impact of C & D Waste on Indian
Environment: A Critical Review. Review Article, 5(2).
https://doi.org/10.19080/CERJ.2018.05.555658
Gupta, Saurabh, & Boojh, R. (2006). Report: Biomedical waste management practices at
Balrampur Hospital, Lucknow, India. Waste Management and Research, 24(6), 584–591.
https://doi.org/10.1177/0734242X06068342
Hussain, M. M. (2015). Agro-Climatic Zones and Economic Development of Rajasthan.
International Journal of Humanities and Social Science Invention ISSN (Online, 4(2), 2319–
7722. http://www.ijhssi.org/papers/v4(2)/Version-2/G0422050057.pdf
IASRI. (2015). National Agricultural Research System in India-AIASA. In
https://www.rajasthandirect.com/government-departments/rajasthan-agriculture-department
(Issue 1). http://aiasa.org.in/wp-content/uploads/2015/07/NARS-India.pdf
Ibrahim Dincer Pouria Ahmadi, M. A. R. (2019). Bio-
medical_Waste_Management_Rules_2016. Journal of Chemical Information and Modeling,
53(9), 1689–1699.
ICAR. (2007). National Agricultural Scenario. https://icar.org.in/files/state-
specific/chapter/3.htm
ICAR. (2020). (NBSSLUP, ICAR, Govt. of India). https://www.nbsslup.in/

351
ICFRE. (2021). Indian Council of Forestry Research and Education. https://www.icfre.org/
IIT, K. (2020). Air Pollution Emission Inventory and Control Plan for Bhiwadi City (Issue
January).
https://environment.rajasthan.gov.in/content/dam/environment/RPCB/EnvironmentalReport/F
inal-Report-Source-Apportionmnent-Study-Jaipur-IITKanpur.pdf
ISFR-b. (2019). ISFR Report - Rajasthan “India State of Forest Report.”
https://fsi.nic.in/isfr19/vol2/isfr-2019-vol-ii-rajasthan.pdf
ISFR. (2019). Chapter- 2 Forest Cover “India State of Forest Report.” 148, 148–162.
https://fsi.nic.in/isfr19/vol1/chapter2.pdf
Jadhav, U. U., & Hocheng, H. (2012). A review of recovery of metals from industrial waste
Industrial management and organisation. Journal of Achievements in Materials and
Manufacturing Engineering, 54(2), 159–167.
Jay, J. (2019). Cost Optimization of Residential Construction Project through Waste
Management Technique. 5(8), 140–143.
Kapoor, R. (2012). Stakeholder Analysis of Air Quality Management Framework in India.
Karthikeyan, L., Suresh, V. M., Krishnan, V., Tudor, T., & Varshini, V. (2018). The
Management of Hazardous Solid Waste in India: An Overview. Environments - MDPI, 5(9),
1–10. https://doi.org/10.3390/environments5090103
Kimdung, N., Bush, S., & Mol, A. P. J. (2013). Administrative Co-management: The Case of
Special-Use Forest Conservation in Vietnam. Environmental Management, 51(3), 616–630.
https://doi.org/10.1007/s00267-012-0012-6
Kugonza, A., Buyinza, M., & Byakagaba, P. (2009). Linking local communities livelihoods
and forest conservation in Masindi district, North Western Uganda. Research Journal of
Applied Sciences, 4(1), 10–16.
Kumar, A., Datta, M., Gurjar, B. R., Nema, A. K., & Singh, R. K. (2019). Response of
groundwater contamination hazard rating systems to variations in subsoil conditions beneath
municipal solid waste (MSW) dumps in developing countries. Arabian Journal of
Geosciences, 12(13), 405. https://doi.org/10.1007/s12517-019-4560-4
Kumar, A., Datta, M., Nema, A. K., & Singh, R. K. (2016). An Improved Rating System for
Assessing Surface Water Contamination Potential from MSW Landfills. Environmental
Modeling and Assessment, 21(4), 489–505. https://doi.org/10.1007/s10666-015-9493-z
Kumar, A., Datta, M., Nema, A. K., Singh, R. K., Gurjar, B. R., & Carolina, N. (2018).
Improved Rating System for Hazard Assessment Related to Subsurface Migration of Landfill
Gas from Municipal Solid Waste Landfills and Dumps. ASCE Journal of Hazarddous, Toxic
and Radioactive Waste, 22(3), 1–10. https://doi.org/10.1061/(ASCE)HZ.2153-5515.0000393.
Lèbre, É., Corder, G. D., & Golev, A. (2017). Sustainable practices in the management of
mining waste: A focus on the mineral resource. Minerals Engineering, 107, 34–42.
https://doi.org/10.1016/j.mineng.2016.12.004
Mandal, S. K., & Dutta, J. (2009). Integrated Bio-Medical Waste Management Plan for Patna
City. Institute of Town Planners, India Journal, 6 (2)(June), 1–25.
Maps of India. (2021). Soil Map of India.
https://www.mapsofindia.com/maps/india/soilsofindia.htm
Mathrani, M. (2021). 11 districts in Rajasthan to join hands with Unnat Bharat Abhiyan.
Hindustan Times. https://www.hindustantimes.com/cities/jaipur-news/11-districts-in-
rajasthan-to-join-hands-with-unnat-bharat-abhiyan-101615185993017.html

352
Ministry of Environment, F. and C. C. (2017). C & D Waste Management Rules , 2016 -
Notification The Construction and Demolition ( C & D ) Waste Management Rules , 2016
(Issue February).
Mishra, K., Sharma, A., Ayub, S., & Abdul, A. (2016). A Study: Biomedical Waste
Management in India. IOSR Journal of Environmental Science, 10(5), 64–67.
https://doi.org/10.9790/2402-1005026467
MoDWS. (2017). SWACHH BHARAT MISSION GRAMI.
https://swachhbharatmission.gov.in/sbmcms/writereaddata/images/pdf/Guidelines/Complete-
set-guidelines.pdf
MoEF&CC. (2008). Hazardous Wastes (Management, Handling and Transboundary
Movement) Rules. Ministry of Environment and Forest (MoEF), Government of India (GOI),
1962(c), 1–40.
MoEF&CC. (2016). [Published In the Gazette of India, Part-II, Section-3, Sub-section (ii)]
Ministry of Environment, Forest and Climate Change NOTIFICATION New Delhi, the 29
(Vol. 317, Issue ii).
MoEF&CC. (2019). National clean air programme. https://moef.gov.in/wp-
content/uploads/2019/05/NCAP_Report.pdf
MoEFCC. (2016). Gazette of India, Part-II, Section-3, Sub-section (ii). 317(ii), 1–15.
https://cpcb.nic.in/displaypdf.php?id=d2FzdGUvQyZEX3J1bGVzXzIwMTYucGRm
MoEFCC. (2017). Draft Notification on E-waste (Management) Amendment Rules, 2017.
1(D).
MoEFCC. (2019). Ministry of Environment Forest and Climate Change. In India State of
Forest Report: Vol. II. http://www.fsi.org.in/cover_2011/uttarakhand.pdf%5C
MoEFCC. (2020). Annual Report 2020-21.
MoHUA. (2018). Strategy for Promoting Processing of Construction and Demolition (C&D)
Waste and Utilisation of Recycled Products. In Government of India (Issue November).
MoHUA & NITI Aayog. (2018). Draft Report: Strategy for Promoting Processing of
Construction and Demolition (C&D) Waste and Utilisation of Recycled Products.
Government of India, November.
MoM. (2008). Government of India Ministry of Mines NATIONAL MINERAL POLICY , 2008
(Vol. 2008). https://mines.gov.in/writereaddata/Content/88753b05_NMP2008[1].pdf
MoM. (2011). Final Draft of Sustainable Development Framework for the Mining Sector.
Ministory of Mines, 1–85.
https://mines.gov.in/writereaddata/UploadFile/SDF_Overview_more.pdf
MoM. (2017). Mining Tenement System.
https://mines.gov.in/writereaddata/UploadFile/ncmm17mts.pdf
Mustafa, A. (2013). Constructed Wetland for Wastewater Treatment and Reuse: A Case
Study of Developing Country. International Journal of Environmental Science and
Development, 4, 20–24. https://doi.org/10.7763/IJESD.2013.V4.296
Nandan, A., Yadav, B. P., Baksi, S., & Bose, D. (2017). Recent Scenario of Solid Waste
Management in India. World Scientific News, 66, 56–74. www.worldscientificnews.com
Nickel, E. H., & Mandarino, J. A. (1987). Procedures involving the I.M.A. Commission on
New Minerals and Mineral Names, and guidelines on mineral nomenclature. Mineralogy and
Petrology, 37(2), 157–179. https://doi.org/10.1007/BF01164189
NIRDPR. (2016). Solid Waste Management in Rural Areas A Step-by-Step Guide for Gram

353
Panchayats. National Institute of Rural Development & Panchayati Raj, May, 1–42.
http://nirdpr.org.in/nird_docs/sb/doc5.pdf
NIUA. (2019). Urban Wastewater Management in Rajasthan.
Pardikar, R. (2018). Mining Suspended in 10-km-Wide Zone Around Sariska Tiger Reserve.
The Wire. https://thewire.in/environment/mining-suspended-in-10-km-wide-zone-around-
sariska-tiger-reserve
Patidar, M., Jain, P. K., & H. N, R. (2014). Effectiveness of Structured Teaching Programme
on Bio-Medical Waste Management. IOSR Journal of Nursing and Health Science, 3(3), 60–
65. https://doi.org/10.9790/1959-03326065
Patil, G. V., & Pokhrel, K. (2005). Biomedical solid waste management in an Indian hospital:
A case study. Waste Management, 25(6 SPEC. ISS.), 592–599.
https://doi.org/10.1016/j.wasman.2004.07.011
PCI. (1989). Agro-climatic regions / zones in India (Issue I). http://jalshakti-
dowr.gov.in/agro-climatic-zones
Raveesh, A., Mona, C., & Jayveer, S. (2015). Waste Management Initiatives in India for
Human Well Being. European Scientific Journal, 7881(June), 1857–7881.
Ritchie, H., & Roser, M. (2021). Forests and Deforestation. Our World in Data.
RSPCB. (2019). Annual Report on Biomedical Waste (Vol. 1).
Sachan, S., & Chaurasia, S. (2006). Bio-medical waste and its management. Indian Journal of
Environmental Protection, 26(3), 255–259.
Scoble, M., Klein, B., & Dunbar, W. S. (2003). Mining waste: Transforming mining systems
for waste management. International Journal of Surface Mining, Reclamation and
Environment, 17(2), 123–135. https://doi.org/10.1076/ijsm.17.2.123.14129
SCU. (2017). Noise Abatement Approaches. Science for Environment Policy, 17, 3–25.
https://doi.org/10.2779/016648
Seth Block, D. (2018). The Energy and Resources Institute Measures to Control Air Pollution
in Urban Centres of India: Policy and Institutional framework CONTENTS • Background and
Objective 1 • Drivers of Air Pollution 1 • Growth of Pollutant Emissions in India 2 • Impacts
of A.
Sharma, H. D., Gupta, A. D., & Sushil. (1995). The objectives of waste management in India:
A futures inquiry. Technological Forecasting and Social Change, 48(3), 285–309.
https://doi.org/10.1016/0040-1625(94)00066-6
Sharma, M. (2020). Air Quality Assessment, Trend Analysis, Emission Inventory and Source
Apportionment Study in Jaipur City Submitted to Rajasthan State Pollution Control Board,
Jaipur.
Sharma, R. K., Yadav, M., & Gupta, R. (2017). Water Quality and Sustainability in India:
Challenges and Opportunities. In Chemistry and Water: The Science Behind Sustaining the
World’s Most Crucial Resource. Elsevier Inc. https://doi.org/10.1016/B978-0-12-809330-
6.00005-2
Sharma, S., & Mallubhotla, S. (2019). Plastic Waste Management Practices. Zero Waste,
March, 105–113. https://doi.org/10.1201/9780429059247-7
Shrivastava, S., & Chini, A. (2005). Construction Materials and C&D Waste in India.
International Journal of Environmental Research, January 2009, 72–76.
Singhai, A., Das, S., Kadam, A. K., Shukla, J. P., Bundela, D. S., & Kalashetty, M. (2019).
GIS-based multi-criteria approach for identification of rainwater harvesting zones in upper

354
Betwa sub-basin of Madhya Pradesh, India. Environment, Development and Sustainability,
21(2), 777–797. https://doi.org/10.1007/s10668-017-0060-4
Sivertsen, B., & Bartonova, A. (2012). Air quality management planning (AQMP). Chemical
Industry and Chemical Engineering Quarterly, 18, 667–674.
https://doi.org/10.2298/CICEQ120110111S
Smith, P., Parry, a, & Mishra, R. K. (1999). The Use of Subsidies for Soil and Water
Conservation: A Case Study from Western India. Participatory Watershed Development:
Challenges for the Twenty-First Century, 87, 281–297.
Sundaray et al. (2020). NCAP NATIONAL CLEAN AIR PROGRAMME.
TERI. (2014). Waste to resources: A waste management handbook. TERI Press: The Energy
and Research Institute.
TERI. (2019). Exploration and Mining in India: Time for a Deeper Look. The Energy and
Resources Institute, August, 1–40. www.teriin.org
Tong, T., & Elimelech, M. (2016). The Global Rise of Zero Liquid Discharge for Wastewater
Management: Drivers, Technologies, and Future Directions. Environmental Science \&
Technology, 50(13), 6846–6855. https://doi.org/10.1021/acs.est.6b01000
Vani, G., & Shah, J. (2020). Effective Utilization of Construction and Demolition Waste- A
Review. GIS Business, 15(4), 688–697.
Viña, A., McConnell, W. J., Yang, H., Xu, Z., & Liu, J. (2016). Effects of conservation policy
on China’s forest recovery. Science Advances, 2(3), 1–8.
https://doi.org/10.1126/sciadv.1500965
Wahid, S. S. (2013). an Optimal Design of Hazardous (Biomedical) Waste Incineration Plant.
International Journal of Industrial Engineering & Technology, 3(1), 51–62.
WHO. (2014). Safe management of wastes from healthcare activities.
Wikipedia. (2021). Sariska Tiger Reserve.
https://en.wikipedia.org/wiki/Sariska_Tiger_Reserve
Yoder and Rankin, 1998. (1998). The Role of Biological Indicators in a state water quality
management process (pp. 1–28).
Copyright © 2022 FDOKUMEN