rukungiri district local government five year district ...
290
RUKUNGIRI DISTRICT LOCAL GOVERNMENT FIVE YEAR DISTRICT DEVELOPMENT PLAN II 2015/2016-2019/2020 District Vision A prosperous Population in a sustainable and secure Environment by the Year 2040 District Theme Sustainable prosperity for all through wealth creation and employment‟‟ APRIL 2015
-
Upload
khangminh22 -
Category
Documents
-
view
1 -
download
0
Transcript of rukungiri district local government five year district ...

RUKUNGIRI DISTRICT LOCAL GOVERNMENT
FIVE YEAR DISTRICT DEVELOPMENT PLAN II 2015/2016-2019/2020
District Vision A prosperous Population in a sustainable and secure Environment by the Year 2040
District Theme Sustainable prosperity for all through wealth creation and employment‟‟
APRIL 2015

ii
LOCATION OF RUKUNGIRI DISTICT LOCAL GOVERNMENT

iii
District Vision:
A prosperous Population in a sustainable and secure Environment by the Year 2040
District Mission:
Service Delivery for Socio-Economic Development

iv
FOREWORD
The District through a participatory, bottom-up planning, process has developed a 5 Year District Development Plan (DDP) with the theme, Service Delivery for Social Economic Development. The second 5 Year District Development Plan provides a strategic planning framework for the achievement of the district‟s Vision and Goal, and consequent development for the next 5 years starting Financial 2015/16 to 2019/2020. The 5 Year District Development Plan is in line with National Development Plan (NDP) objectives and National Vision aspirations. The District in consultation with stakeholders formulated the 5 year plan. The 5 Year District Development Plan addresses structural bottlenecks in the district in order to improve service delivery and social economic development for prosperity. The 5 Year District Development Plan interventions aim at having a prosperous population in sustainable and secure environment. During the plan period, the investment priorities will include physical infrastructure development mainly in Health, Education, Works and technical Services, Water and Sanitation, tourism, facilitating availability and access to critical production inputs especially in Agriculture. I call upon the Local Government to embrace the projects and priorities stated in the DDP for the development of the District I would like to express my appreciation to all stakeholders who contributed towards the Development of the 5 Year Development Plan, especially the District Technical Planning Committee. For God and my Country Kateebire Andrewson DISTRICT CHAIRPERSON-RUKUNGIRI DISTRICT

v
ACKNOWLEDGEMENT
This Five Year District Development Plan (DDP) for Rukungiri District Local Government is for the period 2015/16 – 2019/2020. It presents the continued commitment of the District leadership of Rukungiri in joining hands with the Central Government to eradicate absolute poverty and extreme hunger as set out in the MDGs. The Five Year District Development Plan for 2015/16 – 2019/20 is the second edition of the Five Year Planning Framework under the National Development Plan, whose aspirations of the people of Rukungiri and the Council are embodied in the District Vision of having “A Prosperous population in a sustainable and secure environment by the year 2040” The plan provides a framework for guiding development direction in the next 5 years in order to achieve the above District Vision. The District Development Plan integrates plans of Lower Local Governments and Sectoral Plans, linking them with the BFP and the Annual Budget. The District is grateful to the National Planning Authority for the technical guidance and the Central Government, particularly the Ministry of Local Government for the allocation of funds especially under the Local Government Management and Service Delivery progrmme (LGMSD). I am further indebted to the District Planning Unit and the Budget Desk for facilitating the entire planning and budgeting process by way of Technical guidance, facilitation and integration of the draft sector plans into the DDP. Special thanks go to the following task force members for their contribution and efforts put in preparing the Five Year District Development Plan, 2015/2016 -2019/2020. Mr. Kabugo Deo Deputy Chief Administrative Officer Mr. Kwizera Godie District Planner Mr. Amos Gumisiriza District Population Officer Mr. Turyahumura Jackson District Education Officer Mr.Twehamye Wilson District Statistician Mr. Tiwaitu Cleophas District Community Dev‟t Officer Ms. Bathsheba Bahumwire Senior Probationn and welfare officer Mr. Rukwago Severino District Natural Resources Officer Mr. Asiimwe Joram Chief Finance Officer Mr. Ivan Tumwebaze Human Resource Officer Eng. Bagira Julius District Engineer Mr. Kamukungu Wilson Assistant Chief Administrative Officer Mr. Deus Twekwase District Water Officer Mr. Tumwebingye M. District Health Officer Mr. Oneck Pius Kwesiga Senior Agricultural Officer Ms. Florence Asiimwe Principal Internal Auditor Ms. Kamanzi Fatuma SAS/ Clerk to Council Mr. Agaba Martin District Physical Planner Mr. Twesigomwe Denis Senior Assistant Engineering Officer Mr. Dominic Muruhura Senior Accounts Assistant Ms. Komukama Annet Secretary It is my sincere hope that Rukungiri District Local Government will implement this plan, and I appeal to the Central Government, Development Partners and Stakeholders to support the implementation of this Plan. KATO K. MILTON CHIEF ADMINISTRATIVE OFFICER RUKUNGIRI DISTRICT LOCAL GOVERNMENT

vi
TABLE OF CONTENTS LOCATION OF RUKUNGIRI DISTICT LOCAL GOVERNMENT ................................................... ii District Vision: ............................................................................................................................... iii District Mission: ............................................................................................................................ iii FOREWORD ................................................................................................................................... iv ACKNOWLEDGEMENT .................................................................................................................. v TABLE OF CONTENTS ................................................................................................................. vi EXECUTIVE SUMMARY ............................................................................................................... xv Strategic objectives of Rukungiri LG ..............................................................................................xvi
FINANCING STRATEGY: ................................................................................................... xviii Projected revenues by source .......................................................................................................xix
IMPLEMENTATION STRATEGY: ......................................................................................... xx CHAPTER ONE: INTRODUCTION ................................................................................................ 1 1.1 BACKGROUND ......................................................................................................................... 1
1.1.2. HISTORICAL BACKGROUND ...................................................................................... 1 1.1.3 THE PLANNING PROCESS .......................................................................................... 2 1.1.4 Situation analysis ........................................................................................................... 2 1.1.5 Strategic Planning .......................................................................................................... 2 1.6 Formulation of the BFPs 2015/16...................................................................................... 2 1.1.7 Consolidating the District Development Plan ................................................................. 2 1.1.8 Details of the Planning Process ..................................................................................... 2
1.1.9 STRUCTURE OF THE PLAN ................................................................................................. 4 1.2. DISTRICT PROFILE ................................................................................................................. 5
1.2.1: Key Geographical Information ....................................................................................... 5 1.2.2. Administration stracture ................................................................................................. 7 1.2.3: Demograghic Characteristics ........................................................................................ 8 1.2.3.1: introduction ................................................................................................................. 8 1.2.3.2 Sex and age composition ............................................................................................ 9 1.2.3.3: Urbanization level ..................................................................................................... 10 1.2.3.4 Economic activity ....................................................................................................... 11 1.3.2.5: Implementation of Population Issues in the District ................................................. 11 1.2.3.6: Proposed future actions/ activities: .......................................................................... 11 1.2.3.7: POPULATION PROGRAM CHALLENGES AND CONSTRAINTS .......................... 11 1.2.4. Natural resources endowment .................................................................................... 12 1.2.4.1 Wetlands .................................................................................................................... 12 1.2.4.2: Wild life ..................................................................................................................... 12 1.2.4.3: Minerals resources ................................................................................................... 12 1.2.5: Social economic infrastructure .................................................................................... 12 1.2.5.1 Life Standards Indicators ........................................................................................... 12 1.2.5.2 Livelihood patterns .................................................................................................... 13 1.2.5.3: Human settlements .................................................................................................. 14 1.2.5.4: Productive resources ................................................................................................ 14 1.2.5.5 Economic activities .................................................................................................... 15 1.2.6. INFRASTRUCTURE–HOTEL FACILITIES ................................................................. 15
CHAPTER TWO ............................................................................................................................ 17 2.0 SITUATION ANALYSIS ........................................................................................................... 17 2.1. REVIEW OF SECTOR DEVELOPMEMENT SITUATION ANALYSIS ................................... 17
2.1.1. MANAGEMENT ........................................................................................................... 17 2.1.2.1: CONSTRAINTS/CHALLENGES ON LOCAL REVENUE COLLECTION AND MANAGEMENT ..................................................................................................................... 22 2.1. 3: PLANNING UNIT ........................................................................................................ 23 Recent Achievements ........................................................................................................... 23 Key emerging Issues ............................................................................................................. 24 2. 1.4. NATURAL RESOURCES ........................................................................................... 24 2.1.5 COMMUNITY BASED SERVICES ............................................................................... 29

vii
1.6.3 Membership By Gender In Saving And Credit Cooperative Organisations (SACCOS) In Rukungiri District As At 30
th April 2010(Individual Membership) ........................................... 35
2.1.6 HEALTH SERVICES .................................................................................................... 36 Mandate: ................................................................................................................................ 36 2.1.7: WORKS AND TECHNICAL SERVICES ..................................................................... 44 2.1.7.1 Roads ........................................................................................................................ 45
2.3 Challenges ............................................................................................................................... 59 2.4 Review of previous performance (Achievements, unfinished activities and emergency needs of first development plan) .......................................................................................................................... 60
2.4.2 Unfinished activities ............................................................................................... 60 2.4.3 Key issues that need to be addressed: .................................................................. 60 2.1.7.2 WATER SECTION .................................................................................................... 61 Water user Committeees in the Dist...................................................................................... 61 2.1.8 EDUCATION .................................................................................................................. 3
2.1.9 PRODUCTION AND MARKETING: ........................................................................................ 6 2.1.10: INTERNAL AUDIT ..................................................................................................... 17
2.2. Analysis of the state of crosscutting issues ............................................................................ 19 2.4. Review of the previous performance (Achievements, Unfinished activities and Emerging needs ....................................................................................................................................................... 19
2.2.0 STAKEHOLDERS ANALYSIS ............................................................................... 19 1.10.1 Rukungiri District local Government has the following stakeholders: ........................ 19
2.2: CROSS-CUTTING ISSUES .................................................................................................... 21 2.2.1: POVERTY ANALYSIS ........................................................................................... 21 2.2.1.1: Definition of Poverty: ................................................................................................ 21 2.2.1.2: Indicators of Poverty in the District and potential and actual problems that are leading people into poverty. ............................................................................................................... 21 2.2.1.3: Basic Characteristics of the poor in Rukungiri District. ............................................ 21 2.2.1.4: Geographical poverty pockets and categories of poverty affected groups. ........... 21 2.2.1.5 Poverty trends for the last five years ......................................................................... 23 2.2.1.6: Interventions/Strategies to Address Poverty. ........................................................... 25 2.2.2: GENDER ANALYSIS .................................................................................................. 26 2.2.2.1: DIVISION OF LABOUR AT HOUSEHOLD LEVEL IN PRODUCTION SECTOR .... 26 2.2.3: GENDER ANALYSIS IN TERMS OF RESOURCES ACCESS, CONTROL AND OWENERSHIP ...................................................................................................................... 27 2.2.2.3: Membership by gender in saving and credit cooperative organisations (SACCO‟s) in Rukungiri district as at 30th April 2010 (Individual membership) .......................................... 27 2.2.2.4: Main causes of poor female membership of SACCOS ............................................ 28 2.2.2.5: Possible remedies ................................................................................................. 28 2.2.2.5 DEPARTMENTAL GENDER ANALYTICAL MATRIX ............................................. 29 2.2.3: HIV/AIDS ANALYSIS .................................................................................................. 30 2.2.3.1: Drivers of the HIV/AIDS Pandemic. ......................................................................... 30 2.2.3.2: Key Funding Agencies: ............................................................................................ 31 2.2.3.3: HIV/AIDS mainstreaming in the District Development Plan. .................................... 32 2.2.3.4: Challenges facing the delivery of HIV/AIDS services in Rukungiri District include the following: ................................................................................................................................ 33
2.8 FAMILY PLANNING ANALYSIS .............................................................................................. 35 2.8.1 Family planning analysis .............................................................................................. 35 2.8.2. Challenges/constraints in family planning: .................................................................. 35 2.8.3 Interventions/strategies to address family planning issues: ......................................... 35 2.8.4 Stake holders/implementers of family planning in the District. ..................................... 35
2.9 ENVIRONMENTAL ANALYSIS ............................................................................................... 35 2.9.1 Environmental Opportunities ........................................................................................ 38 2.9.2 Environmental challenges / constraints ........................................................................ 38 2.9.3: Strategies for improved Natural Resources Management/environment sustainability 38
2.10. NUTRITION ........................................................................................................................... 39 2.10.1: Effects of malnutrition ................................................................................................ 39

viii
2.10.3: Objectives of the nutrition situation analysis. ............................................................ 39 2.10.4: Achievements by the district to fight Malnutrition ...................................................... 40 Table 2.10.4.1: Areas of concerns for possible intervention ................................................. 40 2.10.4.3: Strategies by the District to combat malnutrition .................................................... 41
2.11 TOURISM ............................................................................................................................... 44 2.12. ANALYSIS OF URBAN DEVELOPMENT ISSUE ................................................................. 46
2.12.1: The status of Physical Planning ................................................................................ 46 2.12.2: Existing and upcoming urban areas and economic activities ................................... 46
2.3: DISTRICT POCC ANALYSIS ................................................................................................. 99 2.4 REVIEW OF PAST PERFORMANCE OF DD1 (2010/11- 2014/15) ................................... 103 FINANCE...................................................................................................................................... 103 CHAPTER 3: LGDP STRATEGIC DIRECTION AND PLAN ................................................ 107 3.1. Adptation of broader National strategic Direction and Priorities ........................................... 107 3.2 Adaptation Sector Specific Strategic Directions and Priorities .............................................. 107
Health sector ....................................................................................................................... 107 Education Sector ................................................................................................................. 108 Agricultural sector ................................................................................................................ 108 Natural resources ................................................................................................................ 108 Tourism ................................................................................................................................ 109 Trade, industry and cooperative sector ............................................................................... 109 Works and transport sector ................................................................................................. 109 Information and communications technology sector ........................................................... 109 Lands and housing sector ................................................................................................... 109 Water and sanitation............................................................................................................ 110 Physical planning and urban development, ........................................................................ 110
3.3 ADAPTATION OF RELEVANT NATIONAL CROSSCUTTING POLICIES/PROGRAMS ..... 110 3.4 BROAD LOCAL GOVERNMENT DEVELOPMENT OUTCOMES AND GOALS .................. 110 District Vision: ............................................................................................................................ 110 District Mission: Service Delivery for Socio-Economic Development ................................ 110
Goal: To improve service delivery and socio-economic development for prosperity ......... 110 3.5 SECTOR – SPECIFIC DEVELOPMENT, OBJECTIVES, OUTCOMES, OUTPUTS, STRATEGIES AND INTERVENTIONS .............................................................................................................. 111 MANAGEMENTS ......................................................................................................................... 111 FINANCE...................................................................................................................................... 112 PLANNING UNIT ......................................................................................................................... 113 Vision: ......................................................................................................................................... 113 Mission: ....................................................................................................................................... 114
Goal: .................................................................................................................................... 114 Objectives ............................................................................................................................ 114 Out comes .......................................................................................................................... 114
Development Outputs ................................................................................................................ 114 Development Strategies ............................................................................................................ 114 Development Interventions ....................................................................................................... 114 NATURAL RESOURCES ............................................................................................................. 115
Vision: .................................................................................................................................. 115 Mission: ............................................................................................................................... 115 Goal: .................................................................................................................................... 115
Development Objectives: ............................................................................................................. 115 Development outputs .......................................................................................................... 115 Outcomes ............................................................................................................................ 115 Interventions ........................................................................................................................ 115
COMMUNITY BASED SERVICES .............................................................................................. 116 Vision: ................................................................................................................................. 116 Mission: .............................................................................................................................. 116 Goal: ................................................................................................................................... 116 Objectives: ........................................................................................................................... 116

ix
Strategies ............................................................................................................................ 117 Outputs ................................................................................................................................ 117 Interventions ........................................................................................................................ 117
WORKS ........................................................................................................................................ 118 Vision: .................................................................................................................................. 118 Mission: ............................................................................................................................... 118 Goal: .................................................................................................................................... 118 Objectives: ........................................................................................................................... 118 Out puts ............................................................................................................................... 118 Out comes ........................................................................................................................... 118 Strategies ............................................................................................................................ 118 Intervention .......................................................................................................................... 118
WATER ........................................................................................................................................ 119 Vision: .................................................................................................................................. 119 Mission: ............................................................................................................................... 119 Goal: .................................................................................................................................... 119 Objectives: ........................................................................................................................... 119 Outputs ................................................................................................................................ 119 Outcomes ............................................................................................................................ 119 Strategies ............................................................................................................................ 119 Interventions ........................................................................................................................ 119
PRODUCTION ............................................................................................................................. 120 Departmental Objective: ...................................................................................................... 120 Strategies: ........................................................................................................................... 120
INTERNAL AUDIT ........................................................................................................................ 122 Vision: .................................................................................................................................. 122 Mission: ............................................................................................................................... 122
A transparent and accountable population in service delivery..................................................... 122 Goal: .................................................................................................................................... 122 Departmental Objectives and Strategies: ............................................................................ 122
3.6 SUMMARY OF SECTORAL PROGRAMS/PROJECTS 2015/2016 -2019/2020 .................. 123 MANAGEMENT ................................................................................................................... 123 FINANCE DEPATMENT ..................................................................................................... 124 PLANNING UNIT ................................................................................................................. 124 NATURAL RESOURCES .................................................................................................... 126 COMMUNITY ...................................................................................................................... 128 EDUCATION ....................................................................................................................... 129 WORKS DEPARMENT ....................................................................................................... 130 PRODUCTION .................................................................................................................... 131 INTERNAL AUDIT ............................................................................................................... 132
CHAPTER 4: LGDP IMPELEMENTATION, COORDINATION AND PARTNERSHIP FRAME WORK ..................................................................................................................................................... 133 Introduction ................................................................................................................................ 133 4.1 LGDP Implementation and coordination strategy .................................................................. 133 4.2 LGDP institutional Arrangements ........................................................................................ 134 4.3 LGDP Integration and Partnership Arrangements .............................................................. 134 M&E FRAMEWORK SYSTEM .................................................................................................... 136 CHAPTER 5: LGDP FINANCING FRAMEWORKS AND STRATEGY ...................................... 137 The chapter presents overview of development resources and the projections by source as well as the resource mobilisation strategies. ................................................................................................. 137 5.1 Resource mobilization strategy .............................................................................................. 137 5.2 Overview of Development resources and projections by Source .......................................... 137 Strategies to improve local revenue generation in the district ..................................................... 139 CHAPTER 6: MONITORING AND EVALUATION FRAME WORK AND COMMUNITION STRATEGY 140 6.1 INTRODUCTION .................................................................................................................... 140

x
6.1. 2. LGDP MONITORING AND EVALUATION MATRIX ................................................ 140 COMMUNITY BASED SERVICES .............................................................................................. 144 Natural Resources ..................................................................................................................... 150
WORKS ............................................................................................................................... 152 HEALTH DEPARTMENT. ................................................................................................... 154
6.2. LGDP MONITORING AND EVALUATION ARRANGEMENTS ............................................ 157 6.2.1 LGDP PROGRESS REPORTING .............................................................................. 157 6.2.2 JONT ANNUAL REVIEW OF LGDP .......................................................................... 158 6.2.3 LGDP MID TERM EVALUATION ............................................................................... 158 6.2.4 LGDP END OF TERM EVALUATION ........................................................................ 158
6.3 LGDP COMMUNICATION AND FEEDBACK STRATEGY/ ARRANGEMENTS ................... 159 CHAPTER 7.0 DISTRIC PROJECT PROFILES ..................................................................... 161 This chapter comprises of trhe LGDP project profiles. ................................................................ 161 MANAGEMENT SUPPORT SERVICES ...................................................................................... 161 PLANNINING UNIT ...................................................................................................................... 170 NATURAL RESOURCES ............................................................................................................. 178 COMMUNITY BASED SERVICES DEPARTMENT..................................................................... 188 EDUCATION AND SPORTS........................................................................................................ 200 WORKS AND TECHNICAL SERVICES ...................................................................................... 209 WATER & SANITATION/ WORKS & TECHNICAL SERVICES .................................................. 217 PRODUCTION AND MARKETING .............................................................................................. 229 APPENDIX 5: DISTRICT ANNUALISED WORK PLANS ......................................................... 237 MANEGEMENT ........................................................................................................................... 237 NATURAL RESOURCES ............................................................................................................. 239 COMMUNIT.................................................................................................................................. 241 PLANNING UNIT ......................................................................................................................... 244 FINANCE DEPARTMENT ............................................................................................................ 247 EDUCATION ................................................................................................................................ 248 HEALTH ....................................................................................................................................... 251 WORKS & TECHNICAL SERVICES ........................................................................................... 252 WATER AND SANITATION ......................................................................................................... 254 PRODUCTION ............................................................................................................................. 256 INTERNAL AUDIT ........................................................................................................................ 258

xi
LIST OF TABLES
Table 1.1 Summary description of the planning process ................................................................. 4 Table 1.2: Administrative units by county ....................................................................................... 7 Table 1.3: Population size of Rukungiri district over years .............................................................. 8 Table1.4: Total Population by sex, Sex Ratio and Population Density by Sub-county; Rukungiri District, 2014 ................................................................................................................................................. 9 Table 1.5: Household Population by broad age groups and Sub-county; Rukungiri District, 2014 . 9 Table1.6: Working status of the population by selected age groups and Sub-county; Rukungiri District, 2014 ............................................................................................................................................... 10 Table1.7: Life indicators in the District ........................................................................................... 13 Table1.8: Major livelihood patterns in the district ........................................................................... 14 Table1.8: Hotel in Rukungiri ........................................................................................................... 15 Table1.9: Fuel Stations in Rukungiri .............................................................................................. 16 Table 2.1.1.1: Manpower statistics ................................................................................................ 18 Table 2.1.1.2: Equipment under Management Support Services .................................................. 19 Table 2.1.1.3: Status of infrastructural facilities ............................................................................. 19 Table 2.1.2.1: Departmental equipment ......................................................................................... 20 Table 2.1.2.2: Finance department - human resources ................................................................. 20 Table 2.1.2.3: Funding ................................................................................................................... 21 Table 2.1.2.4: REVIEW OF PREVIOUS PERFORMANCE ........................................................... 21 Table 2.1.3.1: Equipment in Planning Unit ..................................................................................... 23 Table 2.1.3.2: Man power structure by Gender ........................................................................... 23 Table 2.1.3.3: Key Development partners and their support ......................................................... 23 Table 2.1.4.1: Staffing of Natural Resources Department ............................................................. 25 Table 2.1.4.2: Equipment under Natural Resources sector ........................................................... 25 Table 2. 1.4.3: Lands and Survey Equipments and assets ........................................................... 26 Table 2. 1.4.4: Priority Environment issues and causes ................................................................ 28 Table 2. 1.4.5: Relevant development partners for the department .............................................. 29 Table 2.1.5.1: The department delivers services through a number of sections as elucidated below; ....................................................................................................................................................... 30 Table 2.1.5.2: staffing ..................................................................................................................... 30 Table 2.1.5.3: Distribution of facilities by subcounty ...................................................................... 30 Table 2.1.5.4: Functional Adult Literacy Programme FY 2014/15 ................................................. 31 Table 2.1.5.5: Ownership of a birth certificate for children aged less than 5 years; Rukungiri District, 2014 ....................................................................................................................................................... 31 Table 2.1.5.6: Orphan-hood and Disability Status by selected age groups and Sub-county; ....... 32 Rukungiri District, 2014 .................................................................................................................. 32 Table 2.1.5.7: Gender based violence ........................................................................................... 32 Table 2.1.5.8: The most key partners are shown in the table below ............................................. 33 Table 2.1.5.9: Equipment under Community Based Services Department: .................................. 33 Table 2.1.5.10: Funding of the Sector for FY 2014/15 was as follows: ......................................... 34 Table 2.1.5.11: Resource control, access and ownership ............................................................. 34 Table 2.1.5.10: Membership of SACCOs by gender ..................................................................... 35 Figure 2.1.5.1: Membership of SACCOs by gender ...................................................................... 35 Table 2.1.6.1: Health infrastructure by location and ownership ..................................................... 37 Figure 2.1.6.1: Rukungiri District disease burden for top ten diseases ....................................... 38 Table 2.1.6.2: Staffing in District Health Office .............................................................................. 38 Table 2.1.6.3: Health Centre IV Staffing Levels ............................................................................ 39 Table 2.1.6.4: Health Centre III Staffing Levels ............................................................................ 39 Table 2.1.6.5: Health Centre II Staffing Levels .............................................................................. 39 Table 2.1.6.6: Environmental Health Staff in the district ending April 2014 ................................... 40 Table 2.1.6.7: HIV testing 2013/2014 .......................................................................................... 41 Table 2.1.6.8: Gender and age distribution for smear positive new cases and relapse (199) ..... 42 Table 2.1.6.9: Key partners ............................................................................................................ 42 Table 2.1.6.10: Equipment inventory ............................................................................................. 42
xii
Table 2.1.6.11: Health: performance for 2014/2015 ...................................................................... 43 Table 2.1.6.12: Top five causes of morbidity ................................................................................. 43 Table 2.1.6.13: Top five causes of mortality .................................................................................. 43 Table 2.1.7.1: Staffing Technical Services department ................................................................. 44 Table 2.1.6.2: Length, condition and type of district roads ............................................................ 45 Table 2.1.6.3: District roads by Subcounty, type and status .......................................................... 46 Table 2.1.7.4: Buyanja Town Board Roads ................................................................................... 47 Table 2.1.7.5: Kebison Town Boards ............................................................................................. 47 Table 2.1.7.6: Community Access Roads ...................................................................................... 48 Table 2.1.7.7: Subcounty - Buhunga S/County ............................................................................. 49 Table 2.1.7.8: Subcounty Buyanja S/County ................................................................................. 50 Table 2.1.7.9: Sub-County Bwambara S/County ........................................................................... 52 Table 2.1.7.10: Subcounty - Nyarushanje ...................................................................................... 53 Table 2.1.7.10: Subcounty - Nyakishenyi ...................................................................................... 55 Table 2.1.7.11: Subcounty - Nyakagyeme ..................................................................................... 56 Table 2.1.7.12: Subcounty - Kebisoni ............................................................................................ 58 Table 2.1.7.13: Previous performance / achievements Works department 2010/2011- 2014/201i60 Table 2.1.7.13: Equipment under Works department: ................................................................... 60 Table 2.1: Staffing Position works department: ............................................................................. 61 Table 2.2: Equipment under Water sector: .................................................................................... 61 Table showing summary of Functionality and Management of water committees ...................... 62 Table 2.3: Location of water sources, accessibility and functionality .............................................. 2 Table 2.4: Point water source .......................................................................................................... 3 Table 2.1.8.1: Staffing Education department:................................................................................. 4 Table 2.1.8.2: Equipment under Education department .................................................................. 4 Table 2.1.8.3: School/Institutions Enrollment per Subcounty by Genger ........................................ 5 Table 2.1.8.4: Rukungiri PLE Performance 2011-2015 ................................................................... 6 Table 2.1.8.5: Rukungiri District Primary Teachers and their Qualifications ................................... 6 Table 2.1.9.1: Equipment in Production: .......................................................................................... 7 Table 2.1.9.2: Number of households involved in Agriculture ......................................................... 7 Table 2.1.9.3: Major types of crops grown by acreage and production levels ................................. 7 Table 2.1.9.4: Acreage of major crops grown per Subcounty.......................................................... 8 Table 2.1.9.5: Common pests and diseases.................................................................................... 8 Table 2.1.9.6: Number of livestock per Sub County by type ............................................................ 8 Table 2.1.9.7: Major livestock diseases by location ......................................................................... 9 Table 2.1.9.8: Number of licensed veterinary/ livestock drug shops ............................................... 9 Table 2.1.9.9: Number of veterinary doctors by sex ....................................................................... 9 Table 2.1.9.10: Production and Marketing staffing analysis ......................................................... 10 Table 2.1.9.11: Fish processing practices by volume .................................................................... 11 Table 2.1.9.12: Fish catch by species at Rweshama landing site ................................................. 11 Table 2.1.9.13: Number of fish farmers by sex and location ......................................................... 11 Table 2.1.9.14: Agro processing facilities ...................................................................................... 12 Table 2.1.9.15: Markets ................................................................................................................. 12 Table 2.1.9.16: Business units ....................................................................................................... 12 Table 2.1.9.17: Registered cooperative societies .......................................................................... 13 Table 2.1.9.18: Agricultural Cooperatives ...................................................................................... 13 Table 2.1.9.19: Other Cooperatives ............................................................................................... 16 Table 2.1.9.20: Number of farmer groups ...................................................................................... 16 Table 2.1.9.21: Number of beneficiaries by project type and sex .................................................. 17 Table 2.1.10.1: Staffing Position: ................................................................................................... 18 Table 2.1.10.2: Equipment under Internal Audit Unit. .................................................................... 18 Table 2.1.10.3: Budget and Financing Plan ................................................................................... 18 Table 2.1.10.4: Efforts/ Roles of Different stakeholders ................................................................ 19 Table 2.1.10.5: Table 1. 48: Major NGO/FBOs operating in the District ....................................... 20 Table 2.2.1: Analysis of Poverty Pockets. ...................................................................................... 22 Table 2.2.2: Rukungiri Rural Poverty rates by county and sub-county 2005 ................................ 23

xiii
Table 2.2.3: Poverty Trends for the last 5 years. (Some Indicators) ............................................. 23 Table 2.2.4: Actions undertaken and proposed by sectors and LLGs to reduce poverty .............. 24 Table 2.2.2.1: Participatory Division of Labour at Household Level in Rukungiri ......................... 26 Table 2.2.2.2: Resource control, access and ownership .............................................................. 27 Table 2.2.2:3: Membership of SACCOs by gender ....................................................................... 27 Figure 2.2.2.1: Membership of SACCOs by gender ...................................................................... 28 Table 2.2.2:4: Senior District Workforce Distribution by Gender ................................................... 29 Table 2.2.2.5: Table 2.40: Gender Analytical Matrix ...................................................................... 29 Table 2.2.3.1: Departmental actions undertaken and planned for HIV/AIDS ................................ 32 Table 2.2.3.2: PMTCT. ................................................................................................................... 33 Table 2.2.3.4: Lab Capacity: .......................................................................................................... 33 2.2.3.4: Challenges facing the delivery of HIV/AIDS services in Rukungiri District include the following: ....................................................................................................................................................... 33 Table 2.2.3.5: HIV/AIDS Core Services and Activities ................................................................... 34 Table 2.9.1: Environmental situation Analysis ............................................................................... 36 Table 2.9.2: Summary of Parish implementation plans of Rukungiri District ................................. 37 Table 2.10.4.1: Areas of concerns for possible intervention .......................................................... 40 2.10.4.3: Strategies by the District to combat malnutrition ............................................................ 41 Table 2.10.4.2: Strategies by the district to combart malnutrition .................................................. 41 Table 2.10.4.3 Nutrition Pocc analysis by sectors ........................................................................ 43 Table 2.11.1: planned tourism activites and location ..................................................................... 45 Table 2.11.2: Development of Tourism Leisure Product ............................................................... 45 TABLE: 3.6.1 SUMMARY OF SUPPORT SERVICES SECTORAL PROGRAMS/ PROJECTS AND ACTIVIES FOR THE PERIOD 2015/2016 -2019/2020 ................................................................ 123 Table 5.1 district revenue projects by source .............................................................................. 138 Table 6.1 Finance and planning M & E matrix ............................................................................. 141

xiv
ACRONYMS/ABBREVIATIONS
AAMP - Agricultural Area Based Modernization Programme
ADRA - Africa Development Relief Agency
AIDS - Anti Immune Disease Syndrome
AIM - Aids Integrated Management
ANC - Antenatal Care
BFP - Budget Framework Paper
BOQs - Bills of Quantities
CB-DOTS - Community Based Direct Observed Treatment
CBOs - Community Based Organizations
DDP - District Development Plan
DHAC - District HIV/Aids Committee
DHMT - District Health Management Team
DTC - District Technical Committee
FBOs - Faith Based Organizations
GFS - Gravity Flow Scheme
HIV - Human Immune Virus
HMIS - Health Management Information System
HSD - Health Sub-District
IGAS - Income Generating Activities
IEC - Information, Education and Communication
NDP - National Development Plan
LGDP - Local Government Development Programme
NARO - National Agricultural Research Organization
NGOs - Non-Governmental Organizations
NIDS - National Immunization Days
PAF - Poverty Action Fund
PHC - Primary Health Care
PWDs - Persons With Disabilities
PPAs - Programme Priority Areas
REPAHAC - Rukungiri Effort to Promote Adolescent Health and Aids Control
ROM - Results Oriented Management
RUDIFA - Rukungiri District Farmers Association
RUCOHE - Rubabo Community Initiative to Promote Health
RUDINET - Rukungiri District Network of people living positively with HIV/Aids
RUGADA - Rukungiri Gender and Development Association
SFG - School Facilities Grant
SMCs - School Management Committees
STDs - Sexual Transmitted Diseases
TBAs - Traditional Birth Attendants
TDMS - Teacher Development Management System
UPE - Universal Primary Education
VCT - Voluntary Counseling and Testing
WES - Water and Environmental Sanitation

xv
EXECUTIVE SUMMARY
This Five-Year Development Plan is a people centered plan, prepared through a bottom-up approach. It integrates sub-county and sectoral plans. It spells out the District Vision, Mission statement, goals, objectives and priorities. Rukungiri District will implement its second five year Development Plan (DDP II 2015/16-2019/20) in line with NDP II emphasing achieving the Uganda Vision 2040. The Vision aims at transforming Uganda from a predominantly peasant and low income country to a competitive, upper middle income country Therefore this Plan builds on the achievements registered under the first District Development Plan (DDPI 2010/11- 2014/15) and takes into consideration the challenges encountered and lessons learnt during its implementation. The Plan also seeks to leverage opportunities presented by emerging developments at the community level. DDP II aims to increase overall competitiveness, create additional wealth and employment while emphasizing inclusive and sustainable growth. Overall, the Plan prioritizes key development opportunities and fundamentals envisaged in the Uganda Vision 2040. It highlights the main cross-cutting issues like poverty, gender, environment, and integrates the activities of sub-counties, NGO‟s and CBOs into sectoral plans. It also captures the issues raised in the Five Year HIV/AIDs District Strategic Plan. In order to achieve the District mission and vision, the council has developed the following goals/strategic objectives. Identifying and collecting sufficient local revenue in order to ensure that service delivery standards are met. This will be achieved through increasing revenue mobilization campaigns, proper enumeration, assessment and tendering out market fees and licenses collection. Contributing to the sustainable growth of the economy, through increased Agricultural Production and Productivity, ensuring food security, and improvement of market systems, strengthening co-operatives, mobilizing, sensitizing and training farmers, entrepreneurs and the private sector. Increasing the level of basic education in the District, through provision of educational facilities; infrastructure, scholastic materials, training of school teachers intensifying school inspection and mobilization of parents and other stakeholders. Improving and Increasing Accessibility to basic Health Services by the Committees. This will be achieved by putting in place, Health Centre IIs at parish level, facilitating the NGO Health facilities in order to improve their service delivery standards, recruiting and training of Health workers, mobilization of the communities and civil society organizations. Improving the District Infrastructure, through increased school classrooms, staff accommodation especially for teachers and Health workers, office space and increased length of motorable road network, by rehabilitating, maintaining and opening of roads. Increasing access to safe water and sanitation through construction of boreholes, springs, community water tanks, shallow wells, gravity flow schemes and institutional pit latrines in

xvi
schools, health units, public places like markets, Community mobilization and sensitization for operation and maintenance of water and sanitation facilities. Improving democracy accountability. This will be achieved through strengthening council operations by training and sensitizing councilors, facilitating Internal Audit Systems and financial management and strengthening planning both at the District and Lower Local Governments. The District Council has the responsibility of setting priorities and objectives within the available resources focusing on local needs but in accordance with National Development Plan priorities. Stakeholder‟s and lower local governments were empowered to identify their own local needs and set feasible solutions within their means and in a democratic manner. The technical staff and Council has been able to prepare this five year Development Plan for 2015/2016 – 2019/2020 through a participatory and integrated planning process During the plan period 2015/2016 to 2019/2020 the following priorities are targeted:
Construction of District Administration Office Block.
Construction of Health Centres/Health Infrastructure
Purchase and distribution of drugs.
Delivery of all components of Uganda National Minimum health care package (UNMHCP).
Payment of salaries, allowances and terminal benefits.
Production of financial statements and accountabilities.
Vaccinations, demonstrations and follow-up visits.
Training of farmers in post harvest handling, nutrition, banana management and livestock (animal husbandry). Supply of better quality inputs
Introduction and multiplication of high value crops.
Functional Adult Literacy.
Maintenance and rehabilitation of feeder roads, community access roads and buildings.
Recruiting and maintaining a well motivated and trained manpower.
Mainstreaming environment into all development programmes.
Facilitating and coordinating the process of development planning.
Strengthening the implementation of UPE.
Strengthening the co-operative movement and micro-finance schemes.
Construction of new water sources and rehabilitation of non-functional boreholes.
Disaster management.
Supervision/monitoring of development projects.
Identifying and developing tourism sites Strategic objectives of Rukungiri LG
To promote democracy and accountability in the local government
To identify and collect sufficient revenue to ensure service delivery
To increase the level of basic education
To provide accessible health services
To improve the district infrastructure e.g. roads, bridges, buildings
To increase access to safe water and sanitation
To empower communities to set up income generating activities (IGAs)
To ensure sustainable management of natural resources
To ensure increased agricultural production and quality of output
To ensure proper allocation and utilisation of resources

xvii
Achieving these goals/strategic objectives and priorities will be mainly through attainment of the following key outputs.
Sufficient Local Revenue collected
Donor funds identified
Pupils enrolled, attending school and completing primary education,
Primary Health care services delivered
Farmers advised, trained and improved productivity
Feeder roads constructed and maintained
Crimes detected and solved
Communities participating in development planning and participatory development plans and budgets produced.
Accessible safe water sources provided.
Projects monitored and evaluated The District development plan is expected to be supported by revenue/resources that include: the locally generated revenue, the central government transfers (PAF, LGMSD) and the Donor funds/NGOs. The anticipated challenges during implementation of DDPII (2015/16 – 2019/20) include.
Inadequate staff and Low motivation levels
Inadequate funding
Rampant outbreak of diseases (FMD, BBW)
Erratic weather conditions and Prolonged dry spells
Telephone farmers who do not immediately respond to regulatory measures
New and continuously coming up pests and diseases
Fake agricultural inputs and drugs on market Erratic weather conditions
Diseases like Malaria and HIV/AIDS still very prevalent
Increasing population (poor up take of and high unmet need for family planning methods
Lack of well developed cooperatives and strong companies
Lack of awareness on market potentials and market linkages
Limited access to friendly credit facilities
Lack of entrepreneurship skills and knowledge to harness the available resources
Lack transport means for departments To address the above named challenges, the district has designed a number of strategies to address them.
Undertake Regular support supervision, monitoring, mentoring and evaluation.
Resource mobilization, timely disbursement and accountability
Stewardship, advocacy and coordination of Private-Public Partnership using the PPPH Policy.
Networking with Line Ministry and Development Partners
Identify and advocate for resources (HRH, Equipment, Communication mechanisms and Infrastructure development
Intensifying Sanitation and hygiene campaigns across the District
Mobilizing schools, Health centers lower local governments and departments to always provide for O & M and ensure that it is implemented.
Proposal writing for funding of projects
Recruit sufficient personnel at district and sub county level
Provide adequate tools to staff

xviii
Strengthen networking with development partners in the private sector.
Involve local leadership in planning, implementation, monitoring and evaluation of development activities.
Lobby for more funding from Ministry of Finance.
Create Multi-stakeholder platforms for common and major enterprises..
Timely response to women and children‟s concerns
Enhance the capacity of PWDs to engage in development activities.
Documenting success stories / achievements and challenges across the department programs
Increase Budget allocation to allow procurement of more equipment and regular maintenance
Procurement of departmental vehicles
To increase Budget allocation for improved supervision and monitoring of Local revenue Extend internet services to all departments and sub counties
Unfinished activities
Completion of District Headquarters Administration building.
Rehabilitation of Minera-Kihunga-Rwamuhima Road 16.0Km.
Completion of Kikongi HC
Completion of the admistration block
Primary Health Care Fund (PHC) is a challenge.
Local revenue to finanance council priorities.
Purchase of veichles to department.
Key issues that need to be addressed: Procurement of sound road equipment unit for the District. Government should increase on funds allocated for road works. URF releases should be as per the annual work plans. Marking of Road reserves. Revision of works department structure ( Next Cadre from the Salary Scale U1 is U4) Periodic maintenance and repair of HC buildings Government should reinstate capital development fund or do otherwise for routine
replacement activities such construction of HC latrines Regular supply of medical equipment for HCs Government should increase funds allocated to HC Government should increase on funds allocated to HC in for medicines and other
medical supplies PHC releases should be as per the annual indicative planning figures
FINANCING STRATEGY:
In line with the NDP II the District will require more innovative strategies for mobilizing resources both domestic, lobbying from central government and other development partners. The Local Revenue Enhancement Plan for the FY 2015/16-2019/2020 will guide the district in the identification of more sources of revenue, and strategies of how to collect more revenues.

xix
Projected revenues by source: Revenue by source FY
2015/2016
FY 2016/2017
FY 2017/2018
FY 2018/2019
FY 2019/2020
1. Local revenue
a)Local Hotel Tax 820,000 500,000 550,000
605,000
665,500
b)Rent & rates from other gov‟t units
41,426,000 53,176,000 58,493,600
64,342,960
70,777,256
c)Registration of businesses
11,800,000 12,320,000 13,552,000
14,907,200
16,397,920
d)Registration of births, marriage & deaths
12,460,000 13,260,000 14,586,000
16,044,600
17,649,060
e)Other licenses 9,150,000 10,555,000 11,610,500
12,771,550
14,048,705
f) Rent & rates from other private units
53,820,000 66,620,000 73,282,000
80,610,200
88,671,220
g)Local Service Tax 80,000,000 74,925,000 82,417,500
90,659,250
99,725,175
h)Park fees 4,040,000 3,660,000 4,026,000
4,428,600
4,871,460
i)Land fees 16,362,000 18,770,000 20,647,000
22,711,700
24,982,870
j)Business licenses 71,850,000 66,700,000 73,370,000
80,707,000
88,777,700
k)Application fees 16,300,000 17,300,000 19,030,000
20,933,000
23,026,300
l)Animal & crop husbandry related levies
29,550,000 45,450,000 49,995,000
54,994,500
60,493,950
m)Advertisements /billboards
900,000 1,600,000 1,760,000
1,936,000
2,129,600
n)Market/gate charges
99,960,000 113,460,000 124,806,000
137,286,600
151,015,260
o)Other fees & charges
14,950,000 7,530,000 8,283,000
9,111,300
10,022,430
p)Miscellaneous income
9,277,000 21,178,000 23,296,900
25,626,590
28,189,249
Q) Sale of non-produced goods(scraps)
7,000,000 17,500,000 19,250,000
21,175,000
23,292,500
Sub-total 479,665,000 544,504,000 598,955,500 658,851,050 724,736,155
2-Central Govt Grants
a) Urban unconditional grant-N/w
0 76,408,000 84,048,800
92,453,680
101,699,048
b) District Discretionally Development Equalization Grant
380,260,000 251,886,000 277,074,600
304,782,060
335,260,266
c) Urban Discretionally Development Equalization Grant
0 31,338,000 34,471,800
37,918,980
41,710,878
d) District unconditional grant N/w
1,304,102,000 737,164,000 810,880,400
891,968,440
981,165,284
e) Urban unconditional grant-wage
0 377,295,000 415,024,500
456,526,950
502,179,645

xx
f) District unconditional grant-wage
1,613,290,000 1,965,594,000
2,162,153,40
0
2,378,368,740
2,616,205,614
g) Pension arrears 264,392,000 290,831,200
319,914,320
351,905,752
h) Gratuity for LGs 504,405,000 554,845,500
610,330,050
671,363,055
i)Pension for LGs 2,077,502,000
2,285,252,20
0
2,513,777,420
2,765,155,162
j) Sector conditional grant wage-Education
16,706,756,000
18,377,431,6
00
20,215,174,76
0
22,236,692,236
k) Sector conditional grant wage-N/w
4,560,902,000
5,016,992,20
0
5,518,691,420
6,070,560,562
l)Transitional Development grant-Water
426,348,000 468,982,800
515,881,080
567,469,188
m)Development grant 685,211,000 753,732,100
829,105,310
912,015,841
n)District road fund grant
585,157,000 666,876,987 733,564,686
806,921,154
887,613,270
o)MoES-UNEB 12,768,000 16,155,000 17,770,500
19,547,550
21,502,305
p)MoGLSD-YLP 268,745,000 268,745,000 295,619,500
325,181,450
357,699,595
q)UWA share 50,000,000 53,500,000 58,850,000
64,735,000
71,208,500
r)MoH 450,000,000 450,000,000 495,000,000
544,500,000
598,950,000
Sub-total 1,366,670,000 30,120,477,987
33,132,525,786
36,445,778,364
40,090,356,201
3-Donor Funds
a)SDS
b)
c)
d)
Sub-total 206,292,896 267,039,000 293,742,900 323,117,190 355,428,909
Grand Total (1+2+3 and others
2,052,627,896
30,932,020,987
34,025,224,186
37,427,746,604
41,170,521,265
IMPLEMENTATION STRATEGY:
The plan will be implemented through the Medium Term Expenditure Frame Work (MTEF) through the Annual workplans, budgets framework papers and budgets. The key elements of the implementation strategy are to ensure responsibility for developing and implementing the plans under different programs
During the five years, the following will be critical for the successful implementation of the plan:
Prioritising, Profiling and sequencing of project implementation to achieve efficiency in resource use.
Use of Public Private Partnership in gearing development.
Ensuring alignment of all planning and budget instruments to the DDP II.
Emphasising Monitoring and evaluation at all levels by all stake-holders.
Ensuring good governance and physical accountability

xxi
Both participatory approach and public private partnership will be used in implementing and monitoring the implementation of the district development plan. Implementation will be coordinated by the office of Chief Administrative officer assisted by planning unit. There are number of institutions that will be involved the implementation of the district development plan that include district departments, Lower Local Governments, Civil Society organizations and the private sector. Departments, Lower Local Governments and Civil Society organizations will be responsible for initiating procurements and contracting out of projects, supervision, monitoring and reporting. While the members of private sector (contractors and service providers will be responsible for implementing the contracted works and services. The district executive committee and office of the Resident District Commissioner will oversee the implementation of the plan over the five year period.

1
CHAPTER ONE: INTRODUCTION
1.1 BACKGROUND
This first five year District Development plan ( 2015/16 – 2019/20 ) was prepared in accordance with the 1995 constitution article 125; article 176 (2b), article 190, NPA Act 2002, the local government Act cap243, The Physical planning act 2010,National population policy 1995, National NGO policy 2010 and any other piece of legislations applicable. It is aligned to the five years National Development Plan II, which is designed to propel the Economy towards middle income status by 2020 in line with the Vision 2040. In line with the Comprehensive National Development Planning Frame work (CNDPF) for government of Uganda where there is Supposed to be a 30 year national vision implemented through three 10 year development plans, 6 five year sector/ local government development plans and 30 annual plans and budgets, Rukungiri district is coming in with this 5 year development plan as part of the comprehensive national planning development frame work. This plan is a guiding tool to support implementation of the District delopment actitivies and strategies to achieve the District Vision which is “A prosperous population in a sustainable and secure environment by the year 2040”. The plan goals and objectives are linked to the National Development Plan objectives and vision aspirations of the community. In addition, the district has made consideration of the experiences gained in the implementation of the DDP I and lessons learnt. On the basis of all this and several consultations, the district was able with come up with a strategic direction. The 1st DDP implementation registered successes in the following areas: 1) Improvement in health service delivery due to recruitment of health workers for providing preventive and curative services; 2) Increased agricultural productivity. This has been due to improved extension services delivery through the NAADs programme; 3) Improvement in education service delivery due to enhanced inspection, supervision and construction of school infrastructure; 4) Maintenance of District, Urban and Community access road network with financing from the Road Fund; 5) and Increased access to safe water supply in rural areas. The main focus DDPII will to consolidate the achievement of DDPI as a highlighted and in addition to service delivery, this plan committs to promoting local economic development through public private partnership arrangements.
1.1.2. HISTORICAL BACKGROUND
At Independence in 1962, Rukungiri District was part of the Kigezi District. In 1974, Rukungiri District was created under the auspices of taking services nearer to the people. By then it was called North Kigezi District until 1980 when the name was changed to Rukungiri District. It is one of the 14 districts that were selected in 1993 for the second phase of decentralization. Since its creation and particularly after decentralization, the district has gone through significant successes to establish itself on a firm ground especially with regard to improved management, planning capacity and participation of communities in the development process. In 2001, the greater Rukungiri gave birth to Kanungu district thus reducing the district to only 2 counties; Rujumbura and Rubabo.

2
1.1.3 THE PLANNING PROCESS
The District Development Plan articulates the development priorities of the people within and out Rukungiri District. The preparation of the district development plan was undertaken through a bottom up consultative process with stake holders. This plan was developed using the new district and urban planning guidelines (2006), alongside other guidelines that were previously in use. The process involved four distinct steps including; situation analysis, strategic planning, formulation of the budget framework paper and consolidating the district development plan.
1.1.4 Situation analysis
Preparatory processes. The planning process started in July 2014 with the situation analysis which included feedback to lower local governments and an assessment of the current situation in the district. An assessment of the performance under different sectors was undertaken using the routine mentoring and evaluation reports.
Feedback visits to LLGs. The LLGs were mentored and prepared for the new planning cycle. They were also engaged in actual discussions about strategic planning and development issues.
Analysis of SWOT. This was done by updating the basic data. The cross-cutting issues were analyzed accordingly.
1.1.5 Strategic Planning
Performance review of the previous development plan. This covered achievements made in relation to national and local departmental targets.
1.6 Formulation of the BFPs 2015/16
Formulation of the budget framework papers followed the issuance of the budget circular call. Project proposal from sectors and LLGs were appraised and reviewed by the district executive committee. The BFP was compiled and presented after the district budget conference which was held on Tuesday, 6th January 2015.
1.1.7 Consolidating the District Development Plan
All the department submissions were integrated into the draft five year development plan and this process of coming up with the DDP was coordinated by the planning unit.
1.1.8 Details of the Planning Process
Rukungiri District fully embraces the Policy of Decentralization as mandated by the Constitution of the Republic of Uganda, 1995 under Article 196 and the Local Government Act (Cap 243). The District Local Government considers Decentralization as a powerful cornerstone in its efforts to implement the District Development Plan in line with the comprehensive national planning framework and vision 2040 of transforming Ugandan society from a peasant to modern and prosperous country. The District reviews and Development Plan every 2 and half years. The main aim is at achieving the District Development Goals, both the Strategic and immediate Objectives through the

3
implementation of the Medium Term Expenditure Framework (MTEF) which was derived from the Local Government Budget Frame Work Paper. The main steps undertaken in producing this Development Plan include among others the following.
The District had opportunity to take stock of the major achievements registered during the implantation of previous development plan (2010/11 – 2014/15), constraints that were encountered during the implementation of programmes and lessons learned.
The district reflected further on its strategic development framework in terms of its adequacy in responding to the development challenges and aspirations of the people.
The District set new targets for the next five years in a participatory manner including all the Stakeholders namely all the Lower Local governments, Non Governmental Organizations and Civil Society organizations that had representations during the Budget Conference that was held on Tuesday, 6th January 2015.
Rukungiri District has come up with a truly integrated and harmonised Plan which does not only take care of sectoral linkages and bottom-up priorities and needs but also be consistent with the national priority programmes, policies and standards. The problems that the district is tackling are all poverty related.
During this year, the planning process and the proposed interventions by different sectors were appraised and screened using a set of nine criteria namely;
Consistency with the district strategic and intermediate objectives;
Technical feasibility;
Availability of funds (especially for the first year)
Number of people benefiting;
Development of local potential;
Sustainability considerations including provisions for recurrent costs;
Environmental considerations
Gender responsiveness and
Political acceptability The appraisal aimed at screening and prioritizing investment proposals. It was done during the DDP 2015/16-2019/20 retreat for the DDP Task Force.

4
Table 1.1 Summary description of the planning process
Sn Objectives Activities Period Responsibility Centre
01 Promote and uphold participatory bottom up planning in the District
-Situation analysis -Dissemination of the planning guidelines and other policy issues.
September 2014 District Planning Unit
02 To have wide regional consultation on 2015/16 FY Development plans.
-Attended Regional Consultative Budget Framework workshop in Kasese (Margarita Hotel)
December 2014 MFPED
03 Allocation of indicative planning figures for 2015/16 FY
The budget circular call 2011/2012 issued out
December 2014 CFO and Budget Desk
04 To have wider consultation on 2015/16 FY Development plans priorities.
District Budget Conference 6th
January 2015 CAO and Planning Unit
05 To consult the Lower local governments and other relevant Stakeholders in Development
Receive proposals above LLGs Threshold for integration into district plans
March 2015 Planning Unit and Sub-county chiefs
06 To ensure that peoples priorities get the attention \during the planning process
LLGs priorities to be integrated in the sector development plans.
March 2015 HODs
07 Sector Working groups to consolidate department plans
-Sector technical staff came up with sector development plan proposals -Sector Committees discuss the departmental proposals and consolidate plans
March 2015 HODs Sector Committees
08 District Technical Planning Committee to review and appraisal the sector development plan proposals.
- Hold DTPC to discuss each sector proposals - A task force/team to integrate sector development plans and cross-cutting issues.
April 2015 District Planning Unit DDP Task Force and Planning Unit.
09 Blessing the Draft development plan
The development plan was presented to District Executive Committee
April 2015 District Executive Committee
10
District Stakeholders consensus on the development interventions
Presentation and approval of the District development plan
May 2015 Secretary Finance and Administration
1.1.9 STRUCTURE OF THE PLAN
This section comprises arrangement of plan. The plan comprises of seven chapters and annexes that include the detailed annual work plans, budgets and project profiles.

5
Chapter 1: Presents the Introductios Background information on the DDP, development planning process, LG profile, key geographical information, administrative structure, demographic characteristics, Natural endowment and socio economic infrastructure. Charpter 2: Contains the sector situation analysis, analysis of cross cutting issues, POCC analysis, review of previous planning performance, analysis of urban issues and standard development indicators. Charpter 3: Contains national and sector strategic directions as adopted are captured, relevant cross cutting issues, policies/ programs, district goals, objectives and outcomes, specific sector objectives, outcomes, outputs, strategies and interventions and a summary of sectoral projects Charpter 4: Contains development plan implementation, coordination and partnership Arrangements, overview of development resources and project by source. Chapter 5: Contains development plan implementation financing frameworks, coordination and partnership framework, Resource mobilization through Public private partnerships this is a contractual arrangement between the private sector and the public sector. Charpter 6: Contains monitoring and evaluation framework andcommunication strategy Chapter 7: Project development profiles and the appendices of the annual work-plans and the budgets
1.2. DISTRICT PROFILE
1.2.1: Key Geographical Information
a) Soils The soils in the district are generally sandy clay loams. The most common soil types are greyish brown sandy loams and reddish brown sands with sandy loams. Dark brown sandy clay loam is also common. The parent rock to these soils is rift valley sediments and volcanic ash. Pressure due to population increase and poor methods of soil management and the land tenure system have negatively affected the soils and degradation is rampant. b) Altitude Rukungiri District is characterized by undulating hills, which are smooth in outline, with steep fluted slopes and U shaped valleys. The hill tops continually rise to over 1,846 m above sea level. It has plateau areas, which are deeply incised particularly within the rightward drainage with local relief dropping to 615 m above sea level. c) Geomorphology The geological formation of the district indicate rocks formed between 3,000and 6,000 million years ago (pre-Cambrian era) which makes them very old. The district is characterized by undulating hills with steep fluted slopes and U shaped valleys. The hill tops continually rise to over 1,864 m above sea level. It has plateau areas which are deeply incised particular within the rightward drainage with local relief dropping to 615 m above sea level. d) Agro- Ecological Zones The district is composed of 3 Agro Ecological Zones:- The first zone is the low land type dominated by the rift valley between 900m – 1300m above sea level with rainfall of less than 700mm. It‟s a dry area, suitable for cereals and covers mainly Bwambara and Bugangari and part of Ruhinda sub-counties (Nyarwimuka).

6
The second zone is Rubosta coffee-banana farming system dominated by dissected plateau of altitude 1300-1700m above sea level with rainfall over 1000mm. The area is also dominated by cattle. The area covers Buyanja, Nyakagyeme, Kebisoni, Buhunga, Kagunga and the remaining part of Ruhinda sub-county. Low land Arabic coffee production is overtaking Robusta coffee because of coffee wilt disease. The 3rd zone is the montane type that lies over 1700m above sea level, similar to the Kabale district suitable for Irish potatoes, vegetables, sorghum and Arabic coffee and temperate fruits production. The area covers Nyarushanje and Nakishenyi sub-counties. e) Topography There are three distinctive topographic zones namely; The Highland Area: This is associated with rejuvenated landscapes. It was affected by rift valley faulting. This topography is deeply incised with steep slopes, which occur along fault lines and extend considerable distances beyond drainage basins. The hills characteristically encircle lowland embankments, which are broadly circular. This zone includes the sub-counties of Nyarushanje and Nyakishenyi. The Plateau Area: It is associated with gently undulating plains merging into Lake Edward. This area gradually rises from 9,234 m (Lake Level) to slightly over 1,169 m near the escarpment. The change in level is due to lake terracing as the water receded due to up warping during late rift movements. This zone includes the sub-counties of Kebisoni, Buyanja, Ruhinda, Buhunga, Nyakagyeme and Rukungiri Municipality. The Rift Valley Area: This is relatively flat with broad tracts of clay swamps. It is an elongated trough-like feature cutting across the district. It is extensive in Bwambara Sub-county especially the Queen Elizabeth National Park. f) Rain fall The district receives bimodal rainfall with long rains received from February-May and short rains from September-November. The mean annual rainfall ranges between 700 mm-1200 mm. Climatic changes have resulted into unpredictable heavy rainfall and prolonged drought. The erratic and cessation of rainfall as a result of climate variability makes it difficult for farmers to plan when to plant crops. There have been instances of frequent crop failures of late, hence, to reduce vulnerability to the deleterious effects of climate change and climate variability, adaptation plans including early warning systems need to be put in place. g) Relative humidity The District is generally cool with daily temperatures ranging from 150 C to 200 C. There is no readily available data on humidity and winds. h) Vegetation The district vegetation comprises of 11% Tropical High Forests, 5.5% woodland, 2.6% bush land, 21.3% grassland, 52% farmland and 7.6% open water. The district is host to some forest reserves namely Ihimbo Central Forest Reserve (CFR), South Imaramagambo CFR and Rukungiri CFR among others. Eucalyptus and pine species constitute the biggest percentage of plantation forests. Other forest reserves in the district include Bwambara, Rushaya, Rwengiri, Kagogo, Rubabo and Kebisoni with a total planted area of 355 (ha). Human activity particularly habitat destruction, deforestation, poaching and encroachment are issues of concern as they lead to loss of biodiversity.
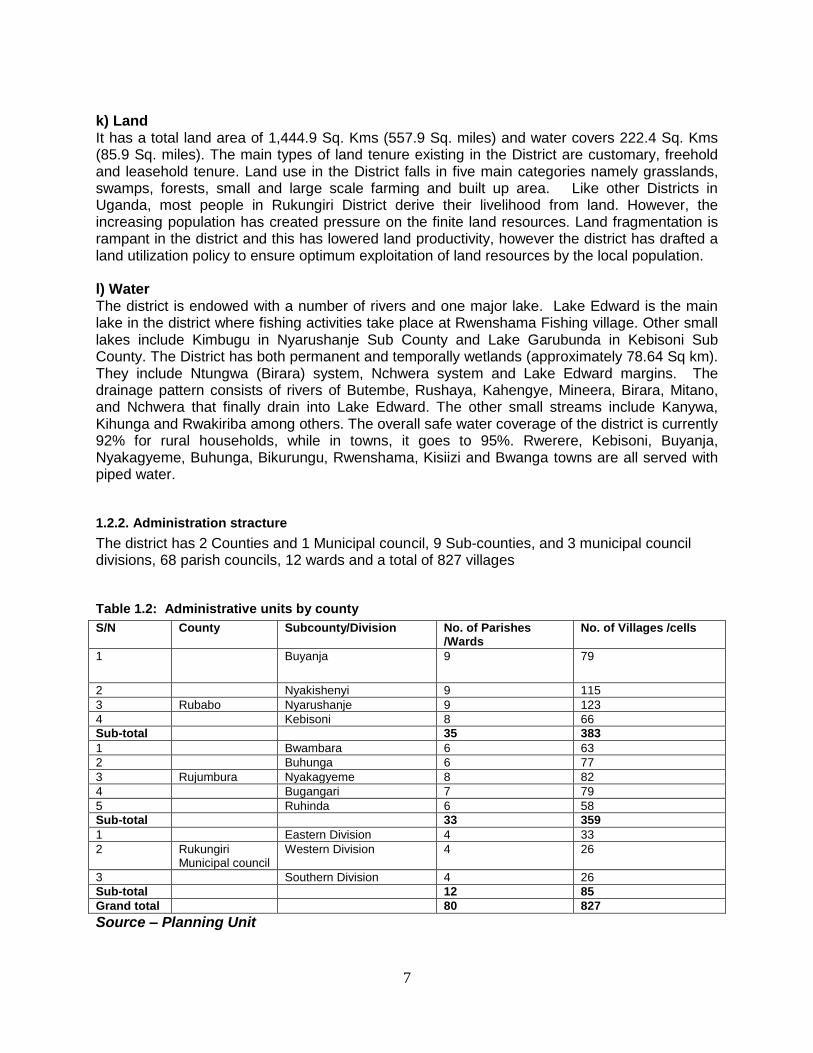
7
k) Land It has a total land area of 1,444.9 Sq. Kms (557.9 Sq. miles) and water covers 222.4 Sq. Kms (85.9 Sq. miles). The main types of land tenure existing in the District are customary, freehold and leasehold tenure. Land use in the District falls in five main categories namely grasslands, swamps, forests, small and large scale farming and built up area. Like other Districts in Uganda, most people in Rukungiri District derive their livelihood from land. However, the increasing population has created pressure on the finite land resources. Land fragmentation is rampant in the district and this has lowered land productivity, however the district has drafted a land utilization policy to ensure optimum exploitation of land resources by the local population. l) Water The district is endowed with a number of rivers and one major lake. Lake Edward is the main lake in the district where fishing activities take place at Rwenshama Fishing village. Other small lakes include Kimbugu in Nyarushanje Sub County and Lake Garubunda in Kebisoni Sub County. The District has both permanent and temporally wetlands (approximately 78.64 Sq km). They include Ntungwa (Birara) system, Nchwera system and Lake Edward margins. The drainage pattern consists of rivers of Butembe, Rushaya, Kahengye, Mineera, Birara, Mitano, and Nchwera that finally drain into Lake Edward. The other small streams include Kanywa, Kihunga and Rwakiriba among others. The overall safe water coverage of the district is currently 92% for rural households, while in towns, it goes to 95%. Rwerere, Kebisoni, Buyanja, Nyakagyeme, Buhunga, Bikurungu, Rwenshama, Kisiizi and Bwanga towns are all served with piped water.
1.2.2. Administration stracture
The district has 2 Counties and 1 Municipal council, 9 Sub-counties, and 3 municipal council divisions, 68 parish councils, 12 wards and a total of 827 villages
Table 1.2: Administrative units by county
S/N County Subcounty/Division No. of Parishes /Wards
No. of Villages /cells
1 Buyanja 9 79
2 Nyakishenyi 9 115
3 Rubabo Nyarushanje 9 123
4 Kebisoni 8 66
Sub-total 35 383
1 Bwambara 6 63
2 Buhunga 6 77
3 Rujumbura Nyakagyeme 8 82
4 Bugangari 7 79
5 Ruhinda 6 58
Sub-total 33 359
1 Eastern Division 4 33
2 Rukungiri Municipal council
Western Division 4 26
3 Southern Division 4 26
Sub-total 12 85
Grand total 80 827
Source – Planning Unit

8
1.2.3: Demograghic Characteristics
1.2.3.1: introduction
The vision of Rukungiri district state that “a healthy and wealthy population in a sustainable and secure environment”. In order to achieve the district mission and goal and strategic set objectives, the district must focus on strengthening planning as one of the main priority areas. Population attributes like fertility, levels, birth rate, death rates and migrations have had an impact on planning of delivery of services in the district. Such impacts felt in areas of health, sevices, education, provision of safe water and sanitation facilities, food, infrastructure and agriculture. Rukungiri district has a total population of 314,694 persons where males are 150,016(47.7%) persons and females 164,678 persons (52.3%) according to 2014 census results. Rukungiri district population has grown from 177,901 people in 1980 to 314,694 in 2014. At current growth rate of 1.7 per annum, the population is estimated to increase further. The increase in population would put pressure on the district‟s ability to provide social services like education, health, housing as well as pressure on Land use and protection of the environment if the country is to achieve middle income status by the year 2020
Table 1.3: Population size of Rukungiri district over years
Census Year Males Females Total
1980 85,320 92,581 177,901 1991 110,351 119,721 230,072 2002 131,052 144,110 275,162 2014 150,016 164,678 314,694
Source of data: UBOS Owing to the high population increase against fixed land, the average population Density of Rukungiri district has increased from 192 persons per square kilometers in 2002, to 219 in 2014. The high growth rate is due to high fertility levels and declining morbidity. In Rukungiri, population pressure on land has got serious implications such as land shortage since majority of the population entirely depends on the agriculture in general and subsistence farming in particular, domestic violence, land wrangles and others. Rukungiri districts population has grown from 177,901 people in 1980 to 314,694 in 2014. At current growth rate of 1.7 per annum, the population is estimated to increase further. The increase in population would put pressure on the district‟s ability to provide social services like education, health, housing as well as pressure on Land use and protection of the environment if the country is to achieve middle income status by the year 2020

9
Table1.4: Total Population by sex, Sex Ratio and Population Density by Sub-county; Rukungiri District, 2014
Sub-county
Male
Female
Total
Sex Ratio*
Land Area (Sq. Km)
Population density**
Bugangari 14,388 15,554 29,942 92.5 112.8 265
Buhunga 10,326 11,762 22,088 87.8 66.5 332
Buyanja 17,515 18,620 36,135 94.1 114.8 315
Bwambara 14,200 14,675 28,875 96.8 523.9 55
Kebisoni 12,390 13,558 25,948 91.4 77.1 337
Nyakagyeme 15,381 16,467 31,848 93.4 105.7 301
Nyakishenyi 15,911 18,222 34,133 87.3 132.4 258
Nyarushanje 20,874 24,009 44,883 86.9 167.8 267
Ruhinda 12,099 13,704 25,803 88.3 79.7 324
Rukungiri Municipality
Eastern division 5,993 6,292 12,285 95.2 27.3 450
Southern Division
4,318 4,896 9,214 88.2 16.1 572
Western Division 6,621 6,919 13,540 95.7 12.4 1092
District 150,016 164,678 314694 91.1 1436.5 219
For residential status, 43,606 persons live in urban centers while 271,088 persons live in rural areas. The District has a household population of 69,497 persons and non household of 4,240 and average house hold size of 4.5 Nyarushanje Sub County has the highest population of 44,883 while southern division has the least population according to 2014 housing census.
1.2.3.2 Sex and age composition
Sex and age composition of a population has implications for planning. Majority of the population according to the census 2014, are females as indicated by a sex ratio of 91.1 males per 100 females. The population of Rukungiri is increasingly becoming younger with the proportion of children below (below 18 years ) constituting 57% while the proportion of older persons aged 60+ constitute 5.2% of the total population.
Table 1.5: Household Population by broad age groups and Sub-county; Rukungiri District, 2014
Sub-county
0-4
0-8
0-17
6-12
13-18
18-30
14-64
60+
Bugangari 5,386 9,685 18,458 7,167 5,756 7,640 19,523 2,336
Buhunga 3,942 7,132 13,693 5,361 4,228 5,129 13,639 1,606
Buyanja 6,124 10,714 19,192 7,617 5,050 6,380 16,905 1,903
Bwambara 6,992 12,578 23,184 9,256 6,602 9,031 23,411 2,605
Kebisoni 5,018 8,934 16,246 6,365 4,552 5,696 15,379 1,605
Nyakagyeme 3,471 6,284 12,110 4,856 3,673 4,083 11,320 1,515
Nyakishenyi 5,265 9,062 15,538 6,011 3,844 5,621 14,626 1,235
Nyarushanje 4,769 8,669 16,620 6,530 5,093 6,411 17,021 2,071
Ruhinda 4,339 7,740 14,337 5,540 4,239 4,706 13,035 1,586
Rukungiri Municipality
Eastern division 1,565 2,838 5,575 2,152 1,879 2,637 6,551 647
Southern Division
1,152 1,999 3,922 1,412 1,375 2,139 5,159 502
Western Division 1,920 3,334 6,376 2,320 2,180 3,630 8,134 592
District 49,943 88,969 165,251 64,587 48,471 164,73 164,703 18,203

10
The district labourforce consists of persons aged 14-64 years who are either in paid employment, self employed or unpaid family worker. Out of 168,296 persons of working (14-64), 124,928 persons were working according to 2014 population and housing census as indicated by table below About 74% of the working persons are agriculture based with females having a higher %ge (82.7%) compared to males (64.9%). According to population census 2014, majority of people in Rukungiri of about 76.4 are engaged in agriculture UN employment rate in Rukungiri is at 5.3% compared to the national unemployment rate of 4.6%. This reflects a big utilized workforce in the district.
Table1.6: Working status of the population by selected age groups and Sub-county; Rukungiri District, 2014
Sub-county Persons Aged 15+ Years Children Aged 10-17 Years
Working Not Working Total Working Not Working Total
Bugangari 14,938 5,215 20,153 2,426 5,370 7,796
Buhunga 9,116 4,888 14,004 481 5,365 5,846
Buyanja 15,513 1,689 17,202 5,150 2,192 7,342
Bwambara 17,590 6,359 23,949 3,289 6,006 9,295
Kebisoni 11,617 4,014 15,631 881 5,581 6,462
Nyakagyeme 8,373 3,356 11,729 1,545 3,630 5,175
Nyakishenyi 12,196 2,474 14,670 2,091 3,591 5,682
Nyarushanje 12,624 4,838 17,462 949 6,123 7,07
Ruhinda 7,614 5,733 13,347 803 5,007 5,810
Rukungiri Municipality
Eastern division 5,568 1,124 6,692 1,166 1,269 2,435
Southern Division
3,653 1,620 5,273 207 1,515 1,722
Western Division 6,126 2,058 8,184 529 2,195 2,724
District 124,928 43,368 168,296 19,517 47,844 67,361
1.2.3.3: Urbanization level
The level of urbanization according to population and housing census 2014, stand at 13.9%. This indicates a slight increase as compared to census 2002. The increase in urbanization is attributed to the accreditation of Rukungiri municipality and the creation of two town councils of Kebison and Buyanja and increased rate rural to urban migration to work in the municipality and town councils. Access to health services Access to the services such as health education, water and other social services is very crucial to the population. Under utilization of such services poses the population to the greatest threat to life hence universal access to services is a key basic priority of development. Rukungiri district through the directorate of health services supported by development partners like AIM, UNICEF, AMREF, UPHOLD and TASO has been able to provide health services and reach house hold s directly on many occasions like HOMAPACK program. Other services include increased access to safe water and sanitation, strengthening primary Health care and control of HIV/AIDS. Public health in the district for both rural and urban population is provided by two private hospitals of Kisiizi and Nyakibale, 55 health centers, 17 private clinics all of which are stocked with essential drugs.

11
1.2.3.4 Economic activity
One of the objectives of poverty eradication is promotion of employment creation through labor friendly technology. Human capital is a pre -requisite for development hence raising its quality and productivity is recognized as critical factor for increasing economic growth and reducing poverty levels
1.3.2.5: Implementation of Population Issues in the District
Family Planning is integrated in PHC activities in Health Units
Integration of population factors in development planning, implementation and monitoring is an ongoing activity. Population factors have always been integrated in the DDP and Sub-County Development Plans and implementation of Projects is based on peoples‟ needs.
Adolescent Friendly Healthy Services. The youth centre at Rwamahwa was closed due to lack of funding. Adolescent services are integrated in the PHC activities. Health workers were trained under DHO‟s office
Birth and Death Registration. The District has Procured materials so that there is constant supply and continuous Registration of Birth and Death. The District materials will attract a small fee determined by the District Council from time to time.
Collection, analysis and dissemination of population data to users. Data is regularly collected and updated though with difficulty. UBOS supported the District in Capacity Building and provision of user friendly data software like Census Info, Uganda Info and Small Area Profile that have simplified retrieval of data.
Population coordination meetings. Population Meetings were integrated in the DTPC due to lack of funding. There is no longer funding from UNFPA to hold population specific meetings and monitoring activities in the area of Population and Development.
1.2.3.6: Proposed future actions/ activities:
Despite the challenges mentioned above and inadequate resources, the following are the planned activities under the population program.
Implementation of the population policy and population action plans for sustainable development
Continued integration of population factors into the development planning
Continued registration of Birth and Death.
Formulation of the district population action plan
Continued collection, analysis and management of population statistics
Coordination of population activities in the district.
1.2.3.7: POPULATION PROGRAM CHALLENGES AND CONSTRAINTS
Insufficient funds to population priorities in the district and Population office/ section. This has made it difficult for the population office to carry out important activities like population awareness campaigns in the field and on radio, birth and death registration, coordination and monitoring population activities in the District.
There is no Transport /vehicle to facilitate the implementation, coordination and monitoring of population programs. The vehicle that had been in the planning unit is currently grounded leaving the unit with no means of transport.
The District has not attracted funding for population programmes for so many years from the centre, donors and NGOs to tackle population challenges

12
1.2.4. Natural resources endowment
1.2.4.1 Wetlands
The District has both permanent and temporally wetlands (approximately 78.64 sq km). They include Ntungwa (Birara) system, Nchwera system and Lake Edward margins namely; Nchwera (6.47 sq km), Bikongozo/Ngabito (0.18 sq km), Birara(3.89 Sq km), Burombe/Nyakyera (0.37sq km), Kiruruma(3.56), Kabaranga(0.80), Kahengye (1.39), Kakindo (I)(Njororo) 2.94sq km), Kakindo (II) (Kayaga), Katenga (Kabahereyo) 1.02sq km), Kihutu (Kabaherayo)-Kamuzinzi (0.07sq km), Kishenyi (Ikona-Mubaya-Kafunjo) 1.37sq km), Mashaku (8.73sq km), Ntungu (Mitano)-Kasiga–Kinyamatojo (42.62sq km), Nyaruzinga (Kiri) 0.15sq km), Rulindo Katunga (1.76sq km), Runyamunyu (0.13sq km), Rushaya (30.17sq km), Rushoma –Rugarama (0.81 sq km) Most of the wetlands in the district are currently threatened with degradation as a result of drainage mainly for agriculture, brick making, sand extraction, over harvesting of wetland resources and other activities.
1.2.4.2: Wild life
The District is one of the few in the country endowed with a great variety of flora and fauna, found mainly in Queen Elizabeth National Park, Kigezi Wildlife Reserve and South Imaramagambo Forest Reserve. Management of the wildlife focuses on Protected Areas. Animals include Buffalos, Climbing Lions, Elephants, Uganda Kobs, Toppi and many species of reptiles, birds and other animals. These form part of the tourist attractions in the District.
1.2.4.3: Minerals resources
The situation of mineral resources in the district is not clearly established. However, some prospecting and other activities like borehole drilling, show evidence of the presence of some minerals like iron ore and tin in Rujumbura, gold and limestone in Rubabo Counties (Global PS findings). There is however, exploitation of clay and sand for construction purposes. Clay is got mainly from Nyaruzinga in Rukungiri Municipality and sand from Bwambara sub-county. Rukungiri district is also part of the Albertine Graben (AG) which is currently the most prospective area for petroleum resources in Uganda. The Graben is also the most species rich eco-region for vertebrates in Africa. 70% of all Uganda‟s Protected Areas are in the Graben. Petroleum exploration areas overlap into Queen Elizabeth National Park and some Forest Reserves. Recent exploration activities in Kikarara parish, Bwambara Sub- County and in Queen Elizabeth National Park show prospects for oil. This calls for caution during implementation of petroleum activities to ensure that the environment and biodiversity are conserved.
1.2.5: Social economic infrastructure
1.2.5.1 Life Standards Indicators
The general life standards indicators in the district are characterized by carrying degrees of poverty and some indicators show that high levels of poverty still persist. This affects the level of community contribution to the development process in the entire District. High poverty pockets are evident in the sub-counties of Nyakishenyi, Buhunga, Ruhinda and Bwambara though Bwambara sub-county is endowed with resources which if tapped would significantly improve the situation. The most vulnerable poor include: widows, vulnerable children, PDWs, the fishermen and the Banyabutumbi. The causes of poor life standards in the District include

13
diseases especially malaria and HIV/AIDS, land shortage, high illiteracy levels, ignorance, inadequate credit facilities, climate change and soil exhaustion which cause dwindling yields year after year. The table below summaries the selected indicators of life indicators in the District;
Table1.7: Life indicators in the District
National population 34.6Million
Total population 314,694
Male population 150,016
Female population 164,678
Population density 219 persons per sq. Km
Average household size 4.5 persons
No. households 70,853
Annual population growth rate 1.7%
Life expectancy at birth 56 years
Ethnic grouping Banyankole, Bahororo, Bakiga, Banyarwanda, Baganda
Commonly spoken language Runyankole and Rukiga
Population below poverty line 28.1%
Arable land 1,352.2 Km2
No. of hospitals 2 (PNFPS)
No. of Health Centre IV‟s 4 Gov‟t & 1 PNFPS
No. of health centre lll‟s 9 Gov‟ & 7 PNFPS
No. of health centre ll‟s 40 Gov‟t & 726 PNFPS
No. of licensed drug shops 77
No. of allied clinics 18
Doctor-population ratio 3 Doctors per 100,000 People
Nurse-population ratio 7 nurses per 10,000 People
Clinical population ratio 1 clinical per 10,000 People
Deliveries in health facilities 56.8%
Ratio of midwives to pregnant women 5 mid wives per 1000 Pregnant mothers per year
Disease burden by malaria 255
Latrines coverage 98% (Existence of latrine structure)
Safe water coverage 70.3%
Prevalence rate of water borne diseases 6.1%
Infant mortality rate 30/1000 live births
Maternal mortality 117/100,000 mothers
Total fertility rate 5.4 Children
Stunting 237 children per year
Polio immunization rate 84.2%
BCG immunization rate 100%
Village Health teams trained 426
HIV prevalence 5.9%
ANC coverage ANC 4TH
51.6% ANC 1ST
– 93%
Immunization coverage DPT3 – 86.4%
Teenage pregnancy rate 4.3%
HIV/AIDs testing points 25
Births with low birth weight (<2.5kg) 427
Source: Rukungiri District Statistical Abstract 2015/16
1.2.5.2 Livelihood patterns
Like other Districts in Uganda, most people in Rukungiri District derive their livelihood from land. However, the increasing population has created pressure on the limited land resources. The major causes of the deterioration the quality and the quantity of the natural resource base is associated with human activity. There is massive deforestation particularly on privately owned land. This is closely followed by wetland degradation as a result of cultivation of crops. Other

14
threats are soil erosion whose magnitude and impact has never been quantified. The figures below summarize the major livelihood patterns in the district;
Table1.8: Major livelihood patterns in the district
Agricultural labour force (women) 74.7%
Women with access/control (agricultural produce) 30%
Women who own land 10%
Population in subsistence agriculture 78.2%
Population trading in agriculture produce 61.9%
Households rearing animals 73.9%
Households fishing 428
Households trading in agriculture products 61.9%
No. of cattle 60,060
No. of goats 134,757
No of sheep 19,330
No. of SACCOs 25
Source: planning unit
1.2.5.3: Human settlements
Human settlements are a phrase used to designate any place on earth where humans live. Human settlements are an integrated combination of human activities, artifacts, and a set of facilities intended to facilitate human life on earth. Therefore they are not just houses and associated infrastructure. According to the Habitat Agenda “the sustainable development of human beings combines economic development, social development, and environmental protection with full respect for all human rights and fundamental freedoms including the right to development, and offers a means of achieving a world of greater stability and peace, be it on ethical and spiritual vision” (UNCHS 1996). Human settlements in Rukungiri district can be classified as rural settlements and urban settlements. The rural human settlements arrangements in the district can be characterized as being wasteful of land; homesteads occupy relatively large areas while urban areas are characterized by congestion and sub slums. As a result both the rural and urban poor are exposed to many environment related diseases due to the human settlement patterns. There are three types of human settlements in the district; dispersed (where inhabitants are scattered and these are common in the sub counties of Bwambara and Nyakishenyi), nucleated (clustered) located usually near certain features such as towns, religious institutions and administrative centers for example in the Municipality, Rwenshama landing site, Buyanja, Kebisoni and Nyakagyeme, and linear settlements where homesteads are strung or lined along roads for example along Rukungiri- Kagamba road, Rukungiri- Kanungu road and Kebisoni- Kisiizi road
1.2.5.4: Productive resources
Productive resources can be defined as assets that can be exploited for human welfare and livelihoods. Land by far is the most important productive resource and is finite, fragile and non-renewable. Land resources include soils which are most important for agriculture, land cover which is another important component of the environment and landscapes forming the main basis for human habitat and welfare. The land resource supports agriculture which is predominantly the back bone of the local economy of Rukungiri district and will continue to be in the medium term at least. It has at the same time been figured as the main contributing factor to environmental degradation. On the other hand forests provide a wealth of indirect environmental benefits as well as direct use benefits for many of the people surrounding them and beyond in the district. In additional people gather medicinal plants and fuel wood or derive food from the

15
forest to support their livelihood. Other productive resources in the district include livestock and wildlife. Under the livestock productive resources the most common animals include cattle, goats, sheep, pigs and poultry. Wildlife constitutes an important resource for the district- as a source of food and material, recreation, tourism, nature study and scientific research. Wildlife in Rukungiri occurs in both protected and outside protected areas in Kigezi wildlife reserve in Bwambara and Ruhinda sub counties.
1.2.5.5 Economic activities
Agriculture is the main economic activity in the district employing over 90% of the working population. Majority of farmers are small holders using traditional farming techniques. The population of Rukungiri district is either directly or indirectly dependent on primary production in agriculture, cattle keeping, timber harvesting, fishing, and small scale surface mining of sand, clay and gravel. The urban population is on the other hand engaged in small activities such as trading, food processing and construction for livelihoods. The list below summaries the economic activities common in the district; Subsistence agriculture practiced by the majority of rural households Trade and commerce Livestock rearing Small scale manufacturing and processing Artisan crafts Leisure, tourism and hospitality services Fishing and fish farming Formal and informal employment Building and construction activities Forestry and dealing in forestry products Service activities
1.2.6. INFRASTRUCTURE–HOTEL FACILITIES
The District has the following infrastructure Main Hotels which are mainly situated within Rukungiri Municipality include:-
Table1.8: Hotel in Rukungiri
Hotel Location
Rukungiri Inn Rukungiri Municipal Council Hotel Riverside Rukungiri Municipal Council Heritage Country Club Rukungiri Municipal Council Stake Inn Rukungiri Municipal Council Continental Hotel Rukungiri Municipal Council Ijumo Resort Hotel Rukungiri Municipal Council Palm Royale Rukungiri Municipal Council Rondavels Hotel Rukungiri Municipal Council Karibuni Motel Rukungiri Municipal Council Kacho Inn Rukungiri Municipal Council Garubunda Resort Kebisoni Subcounty Holiday Inn Rukungiri Municipal Council Comfort Inn Nyarushanje Trading Centre Genesis Resort Rwenshama, Bwamabara Subcounty Maphie Hotel Rukungiri Municipal Council Gesso Inn Rukungiri Municipal Council Virunga Gardens Rukungiri Municipal Council Town view Gardens Rukungiri Municipal Council Robathy Hotel Platinum Hotel
Rukungiri Municipal Council Buyanja Subcounty
Source: Works and technical services department

16
Table1.9: Fuel Stations in Rukungiri
Fuel Station Location
Total Uganda 2 fuel stations Rukungiri Municipal Council Shell 2 fuel stations Ideal Chello Petrol Uganda 2 fuel stations Buyanja 2 fuel stations Kebisoni 3 fuel stations Kisiizi Fuel 2 fuel stations Nyarushanje Bikurungu 2 fuel stations Rwerere
Rukungiri Municipal Council Rukungiri Municipal Council Rukungiri Municipal Council Rukungiri Municipal Council Buyanja Town Council Kebisoni Town Council Nyarushanje Subcounty Nyarushanje Subcounty Bwambara Subcounty Nyakagyeme Subcounty
Source: Works and technical services department

17
CHAPTER TWO
2.0 SITUATION ANALYSIS
This chapter presents review of sector situation analysis, analysis of the crossing cutting issues, POCC analysis and the review of the previous perforformance.
2.1. REVIEW OF SECTOR DEVELOPMEMENT SITUATION ANALYSIS
2.1.1. MANAGEMENT
Mandate: To coordinate, supervise and monitor the District Council, Lower Local Councils and Central Government activities, employees and departments to ensure transparency in management and delivery of services as provided for by the Constitution of the Republic of Uganda 1995, the Local Government Act Cap. 243 and any other legislation. Vision: A well-coordinated, equipped and motivated work force. Mission: Coordination of all sectors in the district for effective and efficient service delivery. Goal: To coordinate, supervise and monitor provision of services in the district. Composition: The department has sections and statutory bodies as outlined below and Lower Local Governments. Administration Human Resource Central registry Statutory Bodies (District Service Commission, District Land Board, Contracts Committee, LG Public Accounts Committee) District Council Audit Information and Public Relations Lower Local Governments The department comprises of 7 sections whose total establishment is 120 (100%) out of which filled posts are 89 (74%) while vacant posts are 31 (26%). Unfilled posts are as a result of wage bill limits. A number of them have been submitted to MOPS for clearance to be filled but are still pending and communications have come from MOPS and the President‟s Office restricting recruitment of staff in the meantime.

18
Table 2.1.1.1: Manpower statistics
Section Position Established posts
Filled Posts Vacant Posts
CAO‟s Office
CAO 1 1 0
Personal Secretary 1 0 1
Driver 1 1 0
Office Attendant 1 0 1
Subtotal 4 2 2
Administration DCAO 1 1 0
PAS 1 0 1
ACAO 2 0 2
SAS 9 9 0
Senior Office Supervisor
1 0 1
Pool Stenographer 2 0 2
Stenographer Secretary
1 1 0
Stores Assistant 2 1 1
Office Typist 1 1 0
Telephone Operator
1 0 1
Driver 2 0 2
Office Attendant 2 2 0
Parish Chiefs 68 57 11
Sub Total 93 72 21
Human Resource PHRO 1 0 1
SHRO 1 1 0
HRO 1 1 0
Stenographer Secretary
1 1 0
Office Attendant 1 1 0
Sub Total 5 4 1
Central Registry Senior Records Off 1 1 0
Assistant Records Officer
1 1 0
Records Assistant 2 2 0
Records Officer 1 1 0
Office Attendant 1 0 1
Sub Total 6 5 1
PDU Sen Proc Officer 1 1 0
Proc Officer 1 1 0
Ass Proc Officer 1 0 1
Sub Total 3 2 1
Statutory Bodies SAS 1 1 0
PHRO 1 0 1
SHRO 1 1 0
Secretary Tender Board
1 0 1

19
Table 2.1.1.2: Equipment under Management Support Services
Type No. Condition
Motor vehicles Motor vehicles Motorcycles Computers Video Camera Public Address System Heavy duty photocopier Printers
2 4 1 11 1 1 1 8
Running Grounded Grounded Operational Grounded Old Non-operational Operation
Table 2.1.1.3: Status of infrastructural facilities
Section No. of Offices Required
Available Offices Comment
Administration 5 4 One missing
Human Resource 3 2 One missing
Central Registry 2 1 The existing one is congested.
PDU 3 2 One missing
Statutory Bodies 4 4 Covered
Information and Public Relations
1 0 One missing
Lower Local Gov‟ts 9 9 All have admin blocks.
In terms of communication infrastructure, the District is covered with major telecommunication networks which include MTN, Airtel, Africell and major Radio stations being Radio Rukungiri, Kanungu Broadcasting Services and Radio West. The District has access to several TV stations both local, National and International. However for Bwambara, part of Bugangari, Ruhinda and Nyakagyeme are in Rift Valley affecting reception. Under connection to the national grid, eight out of nine Sub Counties are connected to electricity. Challenges, gaps and Implications to service delivery: Inadequate means of transport renders Monitoring & supervision of Government programs difficult hence poor service delivery. Unfilled staff positions increases workload and compromise service delivery. Inadequate and poor condition office equipments demotivate staff, put their lives at risk and hinder service delivery. Inadequate office space affects records management, equipment storage, staff health and lowers staff morale to perform their duties. Inadequate communication network limits mobilization for and information sharing with stakeholders in the District.
Secretary Land Board
1 0 1
Clerk Assistant 1 0 1
Assistant Records Officer
1 1 0
Office Attendant 1 1 0
Sub Total 8 4 4
Information and Public Relations
Information Officer 1 0 1
Sub Total 1 0 1
Grand Total 120 89 31

20
2.1.2: FINANCE DEPTMENTMENT
Mandate The mandate of the department To mobilize local and external financial resources for public expenditure To formulate policies that enhances stability in financing and development. To regulate financial management and ensure efficiency in public expenditure using new Government reforms. To oversee district planning and strategic development initiatives for social economic growth.
Vision: A most effective and efficient finance department that is capable of achieving the sustainable development. Mission: To formulate sound economic policies, maximizes revenue mobilisation, ensure efficient allocation and accountability for public resources so as to achieve sustainable economic growth and development in secure environment. Composition: The finance department is composed of 5 sections, i.e; Administration office Revenue Budgeting Accounting Expenditure Integrated financial management system(IFMS)
Table 2.1.2.1: Departmental equipment
Equipment Number Status
Motor vehicle-pickup double cabin 1 Very old/ not road worthy
18 sets of computers under IFMS 18 Functional
Server equipment 4 Functional
Printers-1 central printer and other 3 1 Functional
Other computers 2 Functional
Laptops 3 Functional
Table 2.1.2.2: Finance department - human resources
S/n Title Scale Approved posts Filled posts Vacant posts
1 Chief Finance Officer U1E 1 0 1
2 Pricipal Finance Officer U2 1 0 1
3 Principal Accountant U2 1 1 0
4 Senior Finance Officer U3 1 1 0
5 Senior Accountant U3 1 1 0
6 Accountant U4 2 0 2

21
7 Senior Accounts Assistant U5 14 14 0
8 Stenographer Secretary U5 1 1 0
9 Accounts Assistant U7 16 12 4
10 Office Attenadant U8 1 1 0
11 Driver U8 1 0 1
Total 40 31 9
Table 2.1.2.3: Funding
Source Amount Fund source
District unconditional grant –N/wage 96,052,000 GoU/ Central gov‟nt
Local revenues
21,200,000 Rukungiri DLG
District unconditional grant –Wage
213,481,000 GoU/ Central gov‟nt
PAF monitoring
11,841,000 GoU/ Central gov‟nt
Transfers to LLGs 106,509,000 GoU/ Central gov‟nt/ District
Total 449,083,000
PERFORMANCE OF THE DDP I (2010/2011 - 2014/2015) The Performance of the district development plan I is presented by Department as shown below;
Table 2.1.2.4: REVIEW OF PREVIOUS PERFORMANCE
REVENUE 2010/2011 2011/2012 2012/2013 2013/2014 2014/2015
Local Revenue 666,919,692 247,967,304 236,318,084 252,597,806 348,424,086
Government Grants 15,793,519,038 18,252,811,826 19,745,370,278 21,270,600,632 25,586,051,084
Donor Funds 78,865,400 679,883,497 173,567,460 147,240,705 135,612,857
TOTAL REVENUE 16,539,304,130 19,180,662,627 20,155,255,822 21,670,439,143 26,070,088,027
Administration 2,210,713,193 1,814,643,569 1,060,734,267 1,333,389,726 1,288,101,954
Finance 137,056,953 70,047,718 249,698,679 283,707,330 321,774,510
Statutory Bodies 265,807,548 535,825,581 595,686,631 554,077,238 568,972,931
Production 1,411,815,760 1,357,439,102 1,317,756,214 1,548,380,521 321,782,676
Health 3,126,928,929 3,401,780,356 3,665,156,782 3,682,868,785 4,148,919,668
Education 8,250,342,587 10,491,938,888 12,010,733,996 12,403,805,637 16,622,581,668
Works 753,431,226 1,127,767,870 860,678,792.53 1,052,222,541 1,330,358,170
Natural Resources 49,551,668 56,381,062 95,371,721 102,148,600 141,404,952
Community Based Services 90,734,190 123,742,461 297,692,989 312,892,010 628,860,125
Planning Unit 50,025,643 48,349,273 151,327,065 114,741,829 905,790,099
Internal Audit 9,767,250 12,396,050 57,808,575 44,422,145 54,343,980
TOTAL EXPENDITURE 16,356,174,947 19,040,311,930 20,362,645,711 21,432,656,363 26,332,890,726
Surplus/Deficit of Revenue Over Expenditure 183,129,183 -48,484,303 -207,389,889 237,317,180 262,802,699

22
2.1.2.1: CONSTRAINTS/CHALLENGES ON LOCAL REVENUE COLLECTION AND MANAGEMENT
Some tax collectors lack the basic skills and commitment in the revenue collection process. Low morale amongst revenue collectors due to poor remuneration/facilitation. Lack of reliable means of transport especially on part of parish chiefs. Political influence limits the effectiveness of field operations to collect local revenue. Low attitude of tax payers towards tax payment. Under assessment by the tax assessor. Tax avoidance by politicians for their businesses. It is very difficult for politicians to encourage the masses to pay taxes on pretext of poverty. Dishonesty of some contractors leading to high defaulting rates that resulted into accumulation of huge arrears. Some markets are not properly fenced while others are not fenced at all leading to revenue leakage. Lack of designated parking areas that lead to taxi operators not paying parking fees. Informal markets for produce eg. Matooke, rice and beans still exist which do not fetch money. Centralization of the office of the government valuer leaves a lot to be desired when her/his services are needed. Deliberate tax evasion by tax payer‟s eg. timber dealers who offload at night. Business owners with one type of license using it to trade in other businesses. . The District Contracts committee is not bound to the highest or lowest bidder when awarding contracts which makes it difficult to be guided by the reserve prices. VAT charged on local revenue leaves the district with little money to implement government programmes hence affecting service delivery. Over dependence on central government funding this is sometimes affected by budget cuts. Old departmental vehicle which has led to high departmental costs. Proposed interventions: The department will carry out the capacity building for accounts staff in form of training, sensitisation and availing relevant literature. The department will recruit staff to second the sub-accountants for efficiency and effectiveness of revenue collection and management. Lobbing the government through area members of Parliament to increase the salaries for Government employees to improve the remunerations/facilitation. Intensifying revenue mobilization and collection in the District to be able raise more revenues to fence the markets and improve on the enumeration/facilitation of revenue collectors. The district council under the leadership of District clarification lobby the Central Government (Mother Ministry and Ministry of Finance, Planning and Economic Development to provide means of transport. Think about alternative sources of Revenue like Tourism, Leasing District pieces of land and engaging tea growing to improve on the District Revenue base. Devising means of collecting Local Service Tax (LST) from Commercial farmers other than government employees only whose deductions are recovered the payroll. Lobbing the Central Government to re-instate the district to its provisions status of District Unconditional Grant Quarter possibly increase its allocation to cater for the lost revenue to Town Council thus reducing Budget cuts. Lastly setting up District Committee to write proposals to different Development partners for funding different projects which will eventually improve on the district resource envelope.

23
2.1. 3: PLANNING UNIT
Mandate Under part II of the Local Government Financial and Accounting Regulations 1998 and Sections 36-38 of the Local Act 1997, the unit is mandated to coordinate the planning process, mentor, monitor and evaluate development projects and carry out programmes that address population issues at all levels of governance in the district. Vision: „‟A centre for information manangement and planning guidance‟‟ Mission: To coordinate planning process, and provide guidance and mentoring required information management for promotion of local economic development and effective service delivery in the district. Goal: To provide an Integrated Planning for services covering sectoral plans, policies and to monitor and evaluate the implementation activities Composition: The Planning Unit has the following sectors, namely, Planning, Statistics, Population, Projects Development Planning, Management information systems operation planning, Monitoring and Evaluation.
Table 2.1.3.1: Equipment in Planning Unit
Movable Assets No Condition
Motor vehicle 1 In unroad worthy condition
Desktop Computer sets 2 1Good, 1 fair condition
Overhead Projector 1 Good
Laptops 4 2Good, 1fair
Binding Machine 1 Non funtional
Table 2.1.3.2: Man power structure by Gender
S/n Title Approved Filled Not filled Sex
District Planner 1 0 1 Male
Population Officer 1 1 0 Male
Senior Economist 1 0 1 Male
Statistician 1 1 0 Male
Stenographer Secretary 1 1 0 Female
Total 5 3 2
Table 2.1.3.3: Key Development partners and their support
Partner Contribution
UBOS Data / information and Technical support
Population Secretariat Data / information and Technical support
SDS Systems strengthening
Recent Achievements
Implementation of National population and Housing Census 2014 Reporting by using output budgeting tool Preparation of Statistical Abstracts

24
Preparation of the second Five-Year district Development Plan
Key emerging Issues
Need for transport means for planning unit one that the department has is unroadworthy condition Indqude retooling fund to procure office equipments for depmental offices Failure by most stakeholders to participate in planning issues
2. 1.4. NATURAL RESOURCES
Mandate: The Constitution of Republic of Uganda 1995, the National Environmental Act Chapter 153 and other Legislations mandate the department to coordinate, manage, supervise and ensure sustainable exploitation and conservation of natural resources in the district. Vision: District natural resources managed and conserved sustainably. Mission: To coordinate, manage, supervise and ensure sustainable exploitation and conservation of natural resources in the district for social economic development through coordinated implementation of national and local development initiatives and policies. Goal: To coordinate and manage the sustainable management and conservation of natural resources in the district. Composition: Natural Resources department comprises of the following section;
Forestry Wetlands Environment Land Management General office (administration)
Staffing: Out of the 20 approved positions for the natural resources department in the district, only 12 are filled and the rest (8) are vacant. The percentage staffing level is at 60% while the staffing gap stands at 40%. This is shown in the table below.

25
Table 2.1.4.1: Staffing of Natural Resources Department
Title Approved posts Filled Posts Vacant Posts
Natural Resources Coordinator 1 1 0
Lands Officer 1 0 1
Registrar Of Titles 1 1 0
Physical planner 1 1 0
Valuer 1 0 1
Surveyor 1 1 0
Forestry Officer 1 1 0
Forest Ranger 2 1 1
Forest Guard 3 2 1
Senior Environment Officer 1 0 1
Senior land management officer 1 0 1
Environmental Officer 1 1 0
Wetlands Officer 1 0 1
Assistant Records Officer 1 1 0
Cartographer 1 1 0
Stenographer 1 1 0
Office Attendant 1 0 1
Total 20 12 8
Source: Natural Resources Directorate, 2016 Funding: The departmental funding is UGX 198,622,000 for 2016/17 compared to UGX 183, 106,000 for 2015/16 which is 8% increase. The increase has been as a result of multi sector transfers that increased from UGX 7,294,000 to UGX 34,118,000. Equipment and machinery
Table 2.1.4.2: Equipment under Natural Resources sector
Environment equipment
Item No Status Remarks
Compaq computer 1 Functional Need servicing
CPU 1 Functional Need servicing
Mouse pad 1 Functional Need servicing
Desk jet 690c printer 1 Functional Need servicing
Monitor screen Compaq v 410
Not functional Dispose
Monitor screen 1 Sound and in use Maintain
Key board 1 Sound and in use Missing
Mouse 1 Sound and in use Missing
CPU 1 Sound and in use
UPS Power stabilizer 1 Not working Be disposed off
Mouse pad 1 Sound and in use Good
Canon LBP 800 Printer 1 Sound and in use Needs repairs
Canon 6512 photocopy 1 Not functioning Needs repair
Diesel generator 1 Not sound Needs repair
Desk 3 Sound in use
Chair Rotating chair
9 1
Sound in use Good
2 need repair Maintain
Tray shelves 2 Sound in use

26
Paper punch 1 Sound in use
Stapler 2 Sound in use
Office stamp 3 Sound in use
Ink pad 1 Sound in use
Dustbin 1 Sound in use
Glass jar 1 Sound in use
Electric kettle 1 Sound in use
Plastic basin 1 Sound in use
Good tea cups 6 Sound in use
Drinking glasses 3 Sound in use
Sugar bowel 1 Sound in use
Reference books 202 Sound in use
Filing cabinets 2 One out of use One out use
Table cloth 3 New and in use Replace
Window curtains 4 Functional but old Replace
Shelf 1 Functional
Wall clock 1 Functional
Solar batteries 2 Not sound To be repaired
Giant flask 1 Sound in use
Tea spoons 6 Functional
Plates 6 Functional
20 liter jerry can 1 Functional
5 liter jerry can 1 Functional
Plastic tray 1 Functional
Shelves 2 Functional
Cupboard 1 Functional
Old typewriter 1 Non Functional To be disposed off
Vertical filing cabinet f 1 Functional
Table 1 Functional
Chair 1 Non Functional
Table 2. 1.4.3: Lands and Survey Equipments and assets
SN Item No Remarks Remarks
1 IT Theodolite 1 Not functional Be disposed off
2 Total Station 1 set Newly acquired New
3 Steel bands 2 Broken no longer used
Be disposed off
4 Ranging rods 2 Broken Be disposed of f
5 Adding machine 2 Present, not functioning
Be disposed off
SN Item No Remarks
1 Chair for District land board 5 Functional
2 Stamps for district land board 2 Functional
3 Office desk for district land board 1 Functional
4 Minutes book for district land board 1 Functional
5 Chairs 2 Functional
6 Table 1 Functional
7 Office desks 2 Functional
8 Filing cabinets 3 Functional
9 Cupboard 1 Functional
10 Office stamp for senior survey 1 Functional
11 Trays 1 Functional
12 Stamp pad 1 Functional
13 Punch 1 Functional
14 Seal for district land board 1 Functional
Natural Resources general office equipment
Sn Item No Remarks

27
1 Counter 1 Functioning
2 Cupboard 1 Functioning
3 Tables 2 Functioning
4 Chairs 5 Functioning
5 Paid stamp 1 Functioning
6 Received stamp 1 Functioning
7 Trays 2 Functioning
8 Window curtains 3 Functioning
9 Stapling machine 2 Functioning
10 Punch 1 Functioning
11 Filing cabinets 2 Functioning
12 Form/bench 1 Functioning
13 Telephone receivers 1 Functioning
Drawing Office Equipment
SN Item No Remarks Remarks
1 Vertical plan filing cabinets 2 Functional
2 Horizontal plan filing cabinets (3 metallic and 1 sooden)
4 Functional
3 Office tables 2 Functional Be disposed off
4 Office chairs 4 Non Functional Be repaired
5 Drawing table 1 Needs repair Be disposed off
6 Plan mater 1 Non Functional Be repaired
7 Print making glass frame 1 Needs repair Be repaired
8 Ammonia fumes box 1 Needs repair Be repaired
9 Bench 1 Functional
10 High stool 2 Functioning
11 Property register (Kramazoo) 1 Functioning
12 1/s record register 1 Functioning
13 Subdivision register 1 Functioning
14 Straight edges (metallic) 2 Functioning
15 Prints register 1 Present
16 Cadastral fair drawing sheet 1100 Present
17 Topographical maps record 27 Present
18 Township lay out R.T.C 1 Present
19 Town lay out-Kihihi T.C 1 Present
20 Boundary description plan-R.T.C 1 Present
21 Ishasha town cadastral plot 1 Present
22 Book shelf 1 Present but old Be disposed off
Forestry Office Equipment
No Item No Remarks
1 Printer 1 Functional
2 UPS 1 Functional
3 CPU 1 Functional
4 Monitor 1 Functional
5 Photocopy 1 Functional
6 Office desk 1 Functional
7 Dictionary 1 New and present
8 Dust bin 1 Functional
9 Calculator 1 Faulty Be disposed off
10 Drawers 1 Sound
11 Wooden desk 1 Old present Be painted
12 Office chairs 4 Functional
13 Money safes 1 Destroyed
14 Sitting form 1 Sound
15 Rotating chairs 1 Functional
16 Office trays 2 Functional
17 Giant filing cabinet 1 Functional

28
18 Helmets 3 Functional
19 Stapling machine 2 Functional
20 Punching machine 1 Functional
21 Harmers 3 Functional
22 Library books (assorted) 34 Good condition
23 Office stamp 1 Functioning
24 District emblem 1 Good condition
25 Wheel barrow 3 Available at tree nursery sites
26 Watering can 1 Available at tree nursery sites
19 Stapling machine 2 Functional
20 Uniports 2 Being used by RMC
Natural Resources Department Vehicles and Motorcycles
Section Vehicle Made No Remarks
Forest Motorcycle “ “
Honda XL “ “
UG 1599s UG 1597s UG 1598s
Functioning Functioning Functioning
Natural Resources Double cabin Toyota Hilux pick up
UAA 284x Un-roadworthy
Environment Motorcycle Suzuki UG1398S Un-roadworthy
Source: District Board of Survey Report 2015
Departmental challenges Persistent environmental degradation activities Inadequate funding for sector activities Lack of viable transport means Land fragmentation Reduced forest cover Unplanned urbanization Lack of appropriate equipment to aid in land management and administration Unsustainable utilization of Natural resources
Table 2. 1.4.4: Priority Environment issues and causes
Environmental challenges / Issues
No of LLGs Location Causes
Petroleum development issues
1 Bwambara Petroleum exploration activities
Human- wildlife conflicts
2 Bwambara and Ruhinda Sub Counties
Habitat disturbance.
Wetland degradation
12 Nyakishenyi, Bwambara, Nyarushanje, Bugangari, Nyakagyeme, Buyanja, Kebisoni, Ruhinda, Buhunga, Western division, Southern division, Eastern division
-Lack of adequate land -Unsustainable farming methods -Over harvesting of resources
Soil degradation (fertility loss, erosion)
12 Nyakishenyi, Bwambara, Nyarushanje, Bugangari, Nyakagyeme, Buyanja, Kebisoni, Ruhinda, Buhunga, Western division, Southern division, Eastern division
-Poor farming methods -Over stocking -Land fragmentation
Deforestation 12 Nyakishenyi, Bwambara, Nyarushanje, Bugangari, Nyakagyeme, Buyanja, Kebisoni, Ruhinda, Buhunga,
-Timber / charcoal making -Creation of farm lands -Fuel wood demand

29
Western division, Southern division, Eastern division
Over grazing 11 Nyakishenyi, Nyarushanje, Bugangari, Nyakagyeme, Buyanja, Kebisoni, Ruhinda, Buhunga, Western division, Southern division, Eastern division
-Over-stocking
Water pollution /lack of clean water
12 District – wide but mostly in municipality
-Un compliant developers -Non-protection of water sources and points - Poor waste management
Poor sanitation/poor refuse disposal
12 In most townships across the district
-Inadequate refuse / waste bankers -Poor culture of waste generation and management.
Table 2. 1.4.5: Relevant development partners for the department
Partner Coverage Scope of work (Activities)
Areas served
Literacy Action development Agency (LADA)
Southern Division
Water and Sanitation, Environmental conservation
Bwambara, Nyakishenyi, Ruhinda, Buyanja, Kebisoni, Bugangari and Southern Division
USAID-Uganda Mission District wide Environment management
Bwambara, Nyakishenyi, Ruhinda, Buyanja, Kebisoni, Bugangari and Southern Division
Rukungiri Revival Mission Eastern Division
Environment, Waste Management
Eastern, Western and Southern Divisions
Rukungiri Women Integrated Development Foundation (RWIDF)
Ruhinda Environment, Water and Sanitation
Ruhinda, Nyakagyeme and Buhunga
North Kigezi and Kinkizi Dioceses Water and Sanitation Programme (NKKD-WATSAN)
Western Division
Environment, Water and Sanitation
Nyakishenyi, Nyarushanje and Nyakagyeme
Rukungiri District Farmers Association (RUDFA)
Eastern Division
Environment, Crop and animal production
Bwambara, Bugangari, Buhunga, Buyanja and Kebisoni
2.1.5 COMMUNITY BASED SERVICES
Mandate: The Department is responsible mainly for ensuring protection and proper development of children; empowerment of special interest groups vis, Youth, Women, PWDs and Elderly, as well as ensuring harmonious industrial relations. The department is also responsible for community mobilization for development. This is pursuant to provisions in the Constitution of the Republic of Uganda 1995, the Local Governments Act, the Probation Act, the Children‟s Act, the Labour Legislations, the National Youth Policy, the Uganda Gender Policy 2007 the National OVC Policy 2004, other policies and legislations that aim at empowering special interest groups. Key Services

30
Table 2.1.5.1: The department delivers services through a number of sections as elucidated below;
S/N Section Services
1. Administration Departmental Coordination
2. Probation, Youth and Children Affairs Child protection and youth development programs
3. Gender and Culture Gender main streaming Preservation and promotion of positive cultural values
4. Disability and Elderly Social rehabilitation and economic empowerment of the special interest groups
5. Labour, Employment and Industrial relations Inspection and enforcement of labour legislation
6. Community Development Implementation of Functional Adult Literacy Activities Community mobilization for development programs.
Table 2.1.5.2: staffing
Post Approved Filled Vacant
District Community Development Officer 1 1 -
Senior Community Devekopment Officer 2 2 -
Senior Probation and Welfare Officer 1 1 -
Labour Officer 1 1 -
Assistant Probation and Welfare Officer 1 1 -
Community Development Officer 9 7 2
Assistant Community Development Officer 9 9 -
Senior Accounts Assistant 1 1 -
Office Typist 1 1 -
Driver 1 1 -
Office attendant 1 1 -
Distribution of facilities by subcounty The only facilities available for use under departmental programs are community Rresource centres .These are Multipurpose halls constructed and run buy subcounty authorities, spread in sub counties. As indicated in the table below.
Table 2.1.5.3: Distribution of facilities by subcounty
S/N Subcounty Condition of Community Centre
1 Nyakagyeme Good
2 Bugangari Good
3 Bwambara Good
4 Nyarushanje Dilapidated-Should be Replaced
5 Buyanja Good
6 Kebisoni Good
7 Ruhinda Good
8 Nyakishenyi No community centre
9 Buhunga No Community Centre
10 Western Division (Rukungiri Municipality) No community centre
11 Eastern Division (Rukungiri Municipality No community centre
112 Southern Division (Rukungiri Municipality No community centre

31
Table 2.1.5.4: Functional Adult Literacy Programme FY 2014/15
Subcounty No. of classes
Enrolment
Male Female Total
Nyakagyeme 5 4 82 86
Bwambara 5 23 69 92
Buhunga 2 4 35 39
Ruhinda 5 11 79 90
Nyakishenyi 9 47 312 359
Bugangari 2 5 28 33
Buyanja 3 1 57 58
Nyarushanje 22 7 385 392
Kebisoni 7 15 108 123
Total 60 117 1155 1272
Source: Department of community Based services Rukungiri District- March 2015 The Functional Adult literacy programme, as an entry point for mobilization for a number of other programmes,is quite important. It should therefore be given emphasis especially through improving facilitation of Community Development officers. Right now, Community development officers have no means of transport to effectively mobilise for and supervise this important programme.
Table 2.1.5.5: Ownership of a birth certificate for children aged less than 5 years; Rukungiri District, 2014
Source: National Population and Housing Census 2014
Child registration is a mandatory legal requirement. A child must be registered by the 3rd month from birth. It is a very big gap for 69% of children below age 5 not to have had birth certificates.

32
Protecting children who have been sexually abused is a challenge since age of the child is critical in determining the offence.
Table 2.1.5.6: Orphan-hood and Disability Status by selected age groups and Sub-county;
Rukungiri District, 2014
Source: National Population and Housing Census 2014 Orphans of the shown magnitude require deliberate effort to ensure that they are cared for and protected. The care and protection hitherto given by the extended family system is no longer automatically available as society has moved towards individualism. A good number of these orphans are under the care of old and poor grandparents who themselves are in need of help. While a number of Civil Society Organisations are offering varied support to Orphans, still a big section of the orphans and other vulnerable children (OVC) remain unsupported.
Table 2.1.5.7: Gender based violence
YEAR
2011 2012 Total cases reported
Cases reported by men 57 50 107
Cases reported by women 127 135 162
Total 187 185 372
At the Distinct level police station, for the 2 years, 5 cases were reported by men while 48 were reported by women bringing out a total of 53 cases. The majority of the cases do not reach the district level. This is a tip of the iceberg as most cases are not reported to authorities or are reported at lower levels of government such as the subcounty and village. The reasons for domestic violence are varied. The age old practice of wife battering has not quite disappeared. Another cause of domestic violence is early marriages where some people enter into marriage quite early and unprepared to take up the responsibilities that come with marriage.

33
Too much consumption of alcohol is also contributing to domestic violence. Poverty has also been found to contribute to domestic violence. When providing for the family becomes difficult, at times the frustration erupts into violence. There is also, because of culture, lack of equality in marriage and family life between man and woman, with man in most cases imposing himself as superior and some times the woman refusing to acknowledge this. Domestic also arises as a result of disagreements over property and resources generally. Key Partners As the department implements programs, it collaborates with partners from civil society organisations mainly NGOs and CBOs as shown in the table below:
Table 2.1.5.8: The most key partners are shown in the table below
Sn Name Indigenous/ international/ngo/cbo
Major activities/field of operation
1 Rural Gender and Development Association (RUGADA)
Indigenous NGO Advocacy for gender equity, Skills training for the girl child, HIV/AIDS Prevention
2 The Aids Support Organisation (TASO)
Indigenous NGO HIV/AIDS Services, Psycho social support t
3 Literacy Action and Development Agency (Lada)
Indigenous NGO Water Provision , SUPPORT to households which have Orphans and Vulnerable Children , Support to OVC
4 Uganda Red Cross Society Indigenous NGO Response To Disasters; OVC Care And Support
6 Bridge of Hope Children‟s Ministry
Indigenous NGO (childrens, home) and Support to resettled Childrn
7 BRAC Uganda Indigenous NGO Poverty Eradication; Women Empowerment Tthru micro-credit; education scholarships
8 FOWODE Indigenous NGO Empowerment Of Vulnerable Women
9 Rukungiri District Farmers Association (RUDFA)
Indigenous NGO Mobilising communities for soci-economic development
10 Peerlink initiative -Uganda Indigenous NGO Empowering vulnerable youth with vocational skills
11 AGAPE Indigenous.CBO Holistic care for children from vulnerable households
12 Child Development Centres (CDCs)
Indigenous CBOs Holistic care for children from vulnerable households.
Table 2.1.5.9: Equipment under Community Based Services Department:
Item No Condition
Double Cabin Pick-ups 1 Not roadworthy
Motorcycles 1 Fair
Computers 5 Good
Photocopier 1 Non functional
Financing of the sector The department is financed by the district local government, Government of Uganda and development partners. Most of the funding is from the government of Uganda.
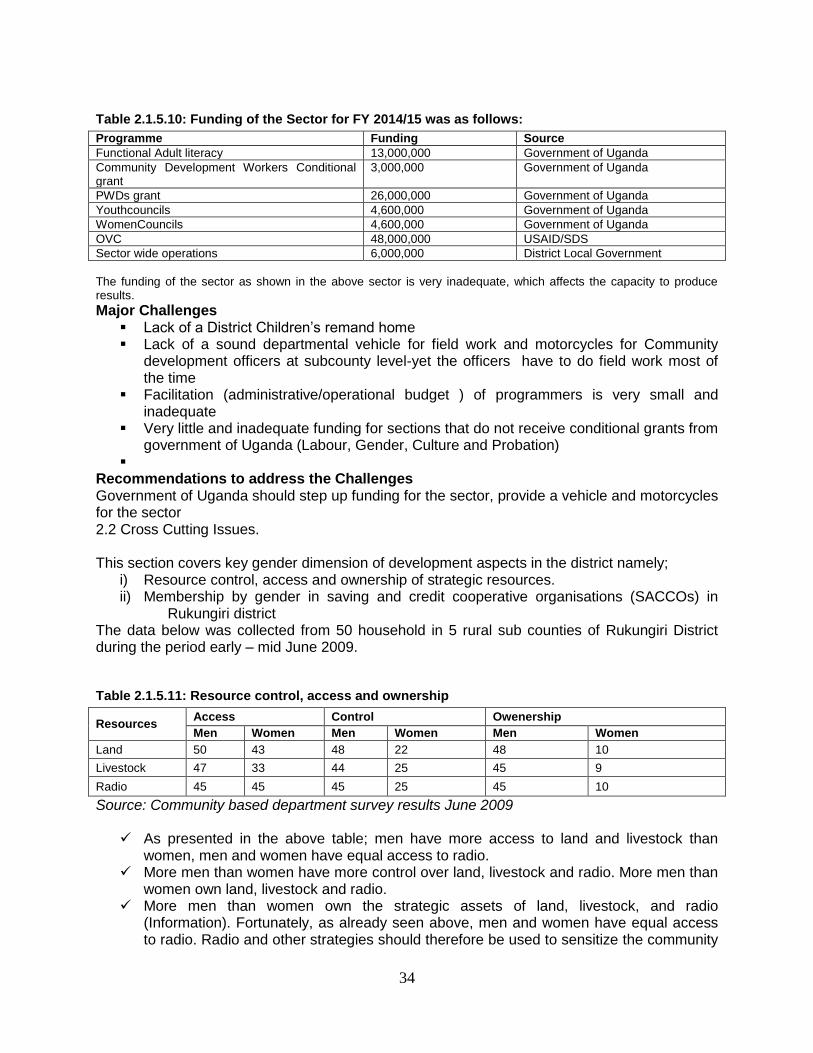
34
Table 2.1.5.10: Funding of the Sector for FY 2014/15 was as follows:
Programme Funding Source
Functional Adult literacy 13,000,000 Government of Uganda
Community Development Workers Conditional grant
3,000,000 Government of Uganda
PWDs grant 26,000,000 Government of Uganda
Youthcouncils 4,600,000 Government of Uganda
WomenCouncils 4,600,000 Government of Uganda
OVC 48,000,000 USAID/SDS
Sector wide operations 6,000,000 District Local Government
The funding of the sector as shown in the above sector is very inadequate, which affects the capacity to produce results.
Major Challenges Lack of a District Children‟s remand home Lack of a sound departmental vehicle for field work and motorcycles for Community
development officers at subcounty level-yet the officers have to do field work most of the time
Facilitation (administrative/operational budget ) of programmers is very small and inadequate
Very little and inadequate funding for sections that do not receive conditional grants from government of Uganda (Labour, Gender, Culture and Probation)
Recommendations to address the Challenges Government of Uganda should step up funding for the sector, provide a vehicle and motorcycles for the sector 2.2 Cross Cutting Issues. This section covers key gender dimension of development aspects in the district namely;
i) Resource control, access and ownership of strategic resources. ii) Membership by gender in saving and credit cooperative organisations (SACCOs) in
Rukungiri district The data below was collected from 50 household in 5 rural sub counties of Rukungiri District during the period early – mid June 2009.
Table 2.1.5.11: Resource control, access and ownership
Resources Access Control Owenership
Men Women Men Women Men Women
Land 50 43 48 22 48 10
Livestock 47 33 44 25 45 9
Radio 45 45 45 25 45 10
Source: Community based department survey results June 2009
As presented in the above table; men have more access to land and livestock than women, men and women have equal access to radio.
More men than women have more control over land, livestock and radio. More men than women own land, livestock and radio.
More men than women own the strategic assets of land, livestock, and radio (Information). Fortunately, as already seen above, men and women have equal access to radio. Radio and other strategies should therefore be used to sensitize the community

35
that both men and women should strive to own the strategic assets of land, livestock and radio so that they can invest, produce and make money and become equal partners in prosperity for all.
1.6.3 Membership By Gender In Saving And Credit Cooperative Organisations (SACCOS) In Rukungiri District As At 30
th April 2010(Individual Membership)
Table 2.1.5.10: Membership of SACCOs by gender
Subcounty Male % Female % Total
Bwambara 2041 68 953 32 2994
Bugangari 2489 67 1213 32 3702
Nyakagyeme 2342 65 1287 35 3629
Ruhinda 1361 57 1042 43 2403
Buhunga 1060 60 695 40 1755
Western 2292 64 1250 35 3542
Buyanja 1456 49 1517 51 2973
Kebisoni 1440 58 1024 42 2464
Nyarushanje 2720 73 966 26 3686
Nyakishenyi 482 74 171 26 653
TOTAL 17683 63 10118 36 27,801
Source: District Commercial Office Rukungiri District 2014
Figure 2.1.5.1: Membership of SACCOs by gender
As can be seen from the table and graph above, there is less participation in SACCOS by women compared to men. Female membership is at 36%. However, women in Buyanja sub-county must be commended for participating at more or less the same level as men in terms of membership. Buyanja with a very vibrant SACCO initially founded by mostly women has a women proportion of only 28%

36
It is rather depressing to note that: Nyarushanje sub-county which has the oldest and biggest SACCO in the District
(Rubabo Peoples SACCO) has the lowest proportion of female membership at 26% just like Nyakishenyi.
Nyakishenyi is not very vibrant SACCO, it has a women proportion of only 26% and least membership of 653
Main causes of poor female membership of SACCOS 1. People not having sufficient trust in SACCOs to keep their money safely and securely
reports of mismanagement in a number of SACCOs are not good attraction to people to join.
2. Cumbersome procedures for opening accounts- for example in the typical rural African setting, a woman does not have extra time to move to studios to have photos taken, the go back to pick the later the woman‟s daily activity schedule does not permit this.
3. Women who are illiterate consider banking a business of the literate, and do not want to bother themselves with documents which they are unable to read, write or comprehend.
4. The traditional mentality that it is men who should handle issues to do with money Possible remedies
1. Improving management of SACCOs so as to raise the confidence of the population 2. SACCOs should go to the people instead of waiting for people to go to them. Accounts
can be opened at places of public assembly like at churches after service and photos can be taken at the places instead of people moving to studios.
3. SACCO management must popularize the business through promotional activities and community sensitization. Women should be reassured that they are eligible to use SACCOS regardless of their literacy status
2.1.6 HEALTH SERVICES
Mandate: policy formulation and policy dialogue with Health Development Partners, resource mobilization and budgeting, strategic planning, regulation, advising other ministries on health matters, setting standards and quality assurance, capacity development and technical support, provision of nationally coordinated services such as epidemic control, coordination of health research and monitoring and evaluation of the overall sector performance. Vision: To have a healthy and productive population that contributes to economic growth and national development Mission: To facilitate the attainment of a good standard of health by all people of Uganda in order to promote a healthy and productive life. Goal: To accelerate movement towards universal health coverage with essential health and related services needed or promotion of a healthy and productive life. Composition The district health department is composed of sections namely administration, environmental health, MCH & nursing, Health Education, HMIS, and medicine management & stores

37
Table 2.1.6.1: Health infrastructure by location and ownership
SN Health centre level HCII
HCIII
HCIV HCII
HCIII
HCIV Hospital
Sub County Name Gov‟t NGO
1 Buyanja 4 1 0 5 0 0 0
2 Kebisoni 4 0 1 2 1 0 0
3 Nyakishenyi 5 1 0 0 1 0 0
4 Nyarushanje 8 1 0 1 1 0 1
5 Bugangari 3 0 1 2 1 0 0
6 Bwambara 2 3 0 1 0 0 0
7 Buhunga 2 0 1 3 2 0 0
8 Nyakagyeme 4 1 0 6 0 0 0
9 Ruhinda 2 1 0 3 1 0 0
10 Southern Division 1 1 0 0 0 0 1
11 Western Division 2 0 0 0 0 0 0
12 Eastern Division 3 0 1 3 0 1 0
Total 40 9 4 26 7 1 2
Source: District Health Office Databank 2015 All the health units are distributed all over the district in the sub-counties and parishes. They are staffed with fairly motivated health workers. Apart from the newly refurbished health units [Kebisoni HC IV, Buhunga HC IV, Nyakishenyi HC III, Bugangari HC IV, Nyakagyeme HC III, Rwenshama HC III and Kikongi HC II] and a few newly built ones most of others need renovation and latrine replacement. Note that h/units in state of disrepair will not offer quality services. Medical equipment used in the health units its availability and functionality varies from health unit to health unit; there are some with adequate numbers; and others without. This is related to duration of use and when they were supplied. Accessibility of health services The district has 53 Government and 36 NGOs health facilities which are evenly distributed within all the Sub-Counties in the district. The health care department in the district serves both rural and urban population is provided by two private hospitals namely Kisiizi and Nyakibale hospitals, 87 Health Centers, 27 private clinics and 70 drug shops; and the District health office based staff. The public health department has 6 doctors, 117 nurses and 137 health staff of other categories. OPD Utilization: 519318 [165%] Deliveries in health facility: 9648 [61.3%]. With regard to HIV/AIDS services 42.1 percent of individuals were counseled and received an HIV test in the last 12 months and the national target is 70 percent. 46.3 percent of mothers of children 0-11 months attended ANC at least 4 times during last pregnancy (LQAS 2014).
Health service accessibility indicators
Practicing Doctor: population ratio: 3:100,000 people per year
Nurse: Population ratio: 7:10,000 people per year
Clinical Officer: Population ratio: 1:10,000 people per year
Midwives: pregnant women (15-49) ratio: <5 midwives per 10000pregnant mothers per year
Morbidity and causes of ill health This section details the frequency of disease, illness, injuries, and disabilities in a population within a district. Morbidity is the incidence or frequency and severity of sickness and accidents in a well-defined class or classes of people. No pneumonia-Cough or cold is the leading disease with 27.6% and Malaria is now the second at 24.2% in the district as shown in the table below.

38
Figure 2.1.6.1: Rukungiri District disease burden for top ten diseases
Source: HMIS annual report 2013/2014
Malaria still a big problem second only to no pneumonia /cough
Human Resource for Health
This section categorizes the staffing in the district within a health sector with intentions of determining the manpower gaps within the health sector. Health staffing norms and gaps Staffing norms at most of health units is at 71%; however technical staffing norm is around 45%. This because all staffs who are not medical but work in the department are counted on the department. In additional nursing assistants are counted and they constitute about 20 % of all health staff
Table 2.1.6.2: Staffing in District Health Office
Cadre Approved Filled Gaps
1 District Health Officer 1 0 1
2 Assistant District Health Officer (Environmental health) 1 0 1
3 Assistant District Health Officer (Maternal Child Health/Nursing)
1 0 1
4 Senior Environmental Health Officer 1 1 0
5 Bio-statistician/Health Information Scientist 1 1 0
6 District Health Educator 1 1 0
7 Cold Chain Technician 1 1 0
8 District TB/Leprosy Supervisor 1 0 1
9 District Assistant Drug Inspector 0 1 0
10 Vector Control Officer 0 1 0
11 Office Attendant 1 2 -1
12 Stenographer Secretary 1 1 0
13 Stores Assistant 1 1 0
14 Driver 1 2 0
Total 13 12 4
Source: District Health Office Databank 2014

39
Table 2.1.6.3: Health Centre IV Staffing Levels
Service Provider Category Approved Filled Gap
1 Medical officer 8 5 3
2 Senior Clinical Officer 4 6 0
3 Clinical officers 8 6 2
4 Senior Nursing Officer 4 2 2
5 Nursing officers 12 12 0
6 Health inspectors 4 3 1
7 Enrolled nurses 12 6 6
8 Enrolled midwives 12 12 0
9 Laboratory personnel 8 8 0
10 Health assistants 4 3 1
11 Nursing assistants 20 13 7
12 Health Information assistant 8 8 0
13 Cold Chain Assistant 4 3 1
14 Others 10 21 0
Source: District Health Office Databank 2014 A Health Centre III serves the basic peripheral unit in the sub county where it is located while at the same time performing the supervisory function for all HCIIs in the Sub-County.
Table 2.1.6.4: Health Centre III Staffing Levels
Service Provider Category Approved Filled Gap
1 Senior Clinical Officer 9 4 5
2 Clinical officers 9 10 0
3 Nursing officers 9 5 4
4 Enrolled nurses 27 28 0
5 Enrolled midwives 18 19 0
6 Laboratory personnel 18 15 3
7 Health Information Assistant 9 9 0
8 Health assistants 9 8 1
9 Nursing assistants 27 22 5
10 Health Inspector 0 2 0
11 Others 36 22 14
Total 171 144 32
Source: District Health Office Databank 2014 Health Centre II is the unit that serves as the interface between the health care system and the community at parish level which is in principle is close to the clients.
Table 2.1.6.5: Health Centre II Staffing Levels
Service Provider Category pproved Filled Gap
1 Enrolled nurses 48 43 5
2 Enrolled midwives 38 3 35
3 Health assistants 38 2 36
4 Nursing assistant 76 63 13
5 Askari 76 12 64
6 Porter 76 28 48
7 Nursing Officer 0 1 0
Total 342 152 196
Source: District Health Office Databank 2014
Environmental Health The district has one senior environmental health officer based at District Health Office who is responsible for the sanitation and hygiene in the whole district. He is responsible for supervising

40
other environmental health staff in different Sub-Counties of the district. The Lot Quality Assurance Sampling (LQAS) survey that was conducted in 2014 shows that 50.5% of women 15-49 years of age, 41.1% of mothers of children 0-11months, 51.6% of men of age 15-54 years and 35.8% of OVC of age 5-17 years wash hands with soap after visiting the latrine. Latrine coverage was at 98.9%. However, personal, community and institutional hygiene and sanitation remain a very big problem because most of the diseases are sanitation related.
Table 2.1.6.6: Environmental Health Staff in the district ending April 2014
Environmental Health Staff by HSD
Health inspectors Health assistants
Rubabo 1 3
Kebisoni 1 2
Bugangari 2 2
Rujumbura 2 5
Total 6 12
Safe Water Coverage The percentage of safe water coverage is at 70.3% (LQAS 2014) and the distribution of water in the district is even. The prevalence of water borne diseases is at 5.8% (HIMS databank 2014) Latrine coverage The percentage of latrine coverage is at 98.9 and the national target is 72 percent of which the households using hand-washing facilities with water and soap stands at 47.1 while the national target is 50 percent (LQAS 2014). Maternal and Child Health (MCH) The section gives information relating to maternal and child health indicators as highlighted below for the year 2014/2015 Number of mothers receiving antenatal: 13110 Number of mothers receiving postnatal services: 9546 Number of supervised deliveries by skilled personnel: 9648 Number of mothers practicing family planning: 14520 new users and 29964 revisits Infant mortality rate: 30/1000 live births (HMIS annual report Maternal mortality rate: 117/100,000 mothers Total Fertility rate: 5.4 Prevention of Mother to Child Transmission of HIV (PMTCT) The district has 25 facilities offering PMTCT services ranging from antenatal care, maternity and HCT services as shown below; PMTCT indicators 2014/2015 Pregnant women who attended antenatal care 13127 Pregnant women counseled, tested and received HIV results 12,979 Pregnant women positive for HIV 422 Deliveries HIV positive in health units 566 Exposed infants tested for HIV below 18 months (1st PCR) 731

41
Exposed infants testing HIV positive below 18 months 41 Exposed infant given Septrin for prophylaxis within 2 months after birth 619 Note: Not all mothers who test HIV positive during antenatal care come to deliver in health units HIV Counseling and Testing services
Table 2.1.6.7: HIV testing 2013/2014
Indicator 0-<2 Yrs 2-<5 Yrs
5-<15 Yrs
15-49 Yrs >49 Yrs
Male Female Total
1 No of Individuals counseled and Tested for HIV
369 756 5728 49411 5944 26797 35411 62208
2 No of Individuals who received HIV test results
360 747 5626 49219 6113 26697 35368 62065
3
No of individuals who received HIV results for the first time in this financial year
316 604 4278 31795 3531 17922 22602 40524
4 No of Individuals who tested HIV positive
27 34 98 2451 230 277 1643 1920
5 HIV positive individuals with suspected TB
3 17 668 70 327 431 758
6 HIV positive cases started on Cotrimoxazole (CPT)
14 24 83 1899 176 929 1257 2186
Source: HMIS annual report 2013/2014 Note: With support from STA-SW, Global Fund, Uganda Aids Commission e.t.c, many interventions have been put in place but HIV prevalence rate is still high at 4.6% from 5.9% the previous financial year. Vector control The objective of these activities is to mobilize the community for vector identification and vector borne disease control. The district conducted mass distribution of mosquito nets in all Sub-Counties in the district with support from Global Fund. Also mosquito nets were distributed to ANC mothers and EPI children in 55 health units. Sensitization on malaria control was done by radio talk shows and in community gatherings in the district. Training VHTs on malaria management was done in Sub-Counties of Nyakagyeme, Bwambara and Buhunga with support from Global Fund. There was mass treatment of Bilharzia among all primary schools pupils of Bwambara Sub-county. Tuberculosis/Leprosy control Rukungiri District has 16 T.B treatment and diagnostic health units that are distributed all over in the Sub-Counties. In a period of January to December 2014 a total of 442 T.B Cases have been reported. Out of 442T.B cases, 360 T.B cases are Category1, 39 T.B cases are Category II and 43 T.B cases are Category III.

42
Table 2.1.6.8: Gender and age distribution for smear positive new cases and relapse (199)
Age (Years) Male Female
0-4 1 1
5-14 2 4
15-24 19 11
25-34 34 14
35-44 32 17
45-54 26 10
55-64 15 1
65& above 10 2
Source: Annual T.B/Leprosy report 2014 100% of co-infected patients accessed ART services. The case detection rate (CDR) stands at 71% for 2014 compared to national target of 70%. The treatment success rate (TSR) stands at 84% compared to national target of 100%. On Leprosy control, one male adult case was released from treatment and no new case of leprosy was identified, 14 people disabled no longer on treatment and have insensitive feet.
Table 2.1.6.9: Key partners
Partner Area of intervention
1 USAID RHITES SW HIV/AIDS, TB,EMTCT, FP,
2 Green Label Services Healthcare waste collection
3 SDS Systems strengthening
4 PACE Positive living project [HIV/AIDS]
5 JHPEIGO Long term family planning
6 UHMG FP, HTS
7 Global Fund TB, Malaria
Table 2.1.6.10: Equipment inventory
Description of items Location Status Other comments
1 Vehicles DHO‟s office Functional 1, unfunctional 2
2 Buhunga HC IV Functional 2 One ambulance, 1 double can pickup
3 Kebisoni HC IV Functional 1, unfunctional 1 One ambulance, 1 double can pickup
4 Bugangari HC IV unfunctional 1 double can pickup
5 Nyakishenyi HC III unfunctional 1 Maruti car
6 Motor cycles 8 new supplied to the district Distributed in different HCs
Source: District health dept Equipment inventory 2014/2015 Key problems in Health:
Inadequate funding contributed much on poor performance.
HUMC do not perform their work satisfactorily due to lack of training and facilitation.
Only 17.2% of VHTs are trained (ie 426 out of 2381)
Lack of transport for outreaches and field work
Inadequate Health infrastructure and accommodation for health workers
Stock outs of some medicines and other medical supplies including some vaccines
Lack of Government Hospital in the district
Delayed delivery of medicines and medical supplies

43
Delayed EPI medicines and supplies
Low CPR in Family Planning. Lessons learnt in Health
Funds have been found to be a major factor to the success of the DDP
Poorly motivated human resource impact negatively on performance.
Table 2.1.6.11: Health: performance for 2014/2015
Output Planned target Achieved Percentage performance
1 OPD attendance 47204 [150%] 507259 165%
2 ANC 4th
visit 15735 6831 43.4%
3 IPT2 15735 7571 48.1%
4 Health facility deliveries 15735 10168 64.6%
5 BCG vaccination 13532 14358 106.1%
6 Pentavalent vaccination 1 13532 12028 88.9%
7 Pentavalent vaccination 3 13532 11958 88.4%
8 Measles vaccination 13532 11053 81.7%
9 Inpatient admissions - 36332 -
Source: Rukungiri district HMIS Annual Report 2014/2015
Table 2.1.6.12: Top five causes of morbidity
Diseases No of cases Percentage
1 Non-pneumonia 194820 30.9%
2 Malaria 115824 18.4%
3 Gastrointestinal disorders 34471 5.5%
4 Intestinal worms 28260 4.5%
5 Diarrhea acute 20485 3.2%
Total diagnoses 630919
Source: HMIS Annual Report 2014/2015
Table 2.1.6.13: Top five causes of mortality
Diseases No of deaths Percentage
1 Malaria 93 39.9%
2 TB [bacteriologically confirmed ]
49 21%
3 Pneumonia 45 19.3%
4 Injuries 22 9.4%
5 Anaemia 14 6.0%
Total deaths 233 100
Source: HMIS Annual Report 2014/2015 Recent developments
Construction of Kikongi HC II
Renovation of Buyanja HC III Maternity /General ward and
Renovation of water systems , incinerator and installation of gutters annex at Kebisoni and Bugangari HC IVs
Installation of water tank at Rugando HC II
Polio, measles and yellow fever vaccination campaigns

44
2.1.7: WORKS AND TECHNICAL SERVICES
Goal: mandate, composition objectives and objectives and strategies about the district. Mandate: The Constitution of the Republic of Uganda 1995, the Local Government Act 1997 and other Legislations mandate the department to construct and maintain civil infrastructure, water development, and plant and vehicle maintenance. Composition Sections
Roads
Buildings
Mechanical
Water
Table 2.1.7.1: Staffing Technical Services department
Designation Approved Filled Vacant
District Engineer 1 0 1
Senior Engineer 2 0 2
Superintendent of Works 1 1 0
District Water officer 1 1 0
Senior Assistant Engineering Officer (Roads) 1 1 0
Senior Assistant Engineering Officer (Civil) 1 0 1
Senior Assistant Engineering Officer (Mechanical) 1 0 1
Senior Assistant Engineering Officer (Water) 1 0 1
Community Development Officer (Water) 1 1 0
Health Inspector (Water) 1 1 0
Assistant Engineering Officer (Civil) 3 0 3
Assistant Engineering Officer (mechanical) 1 1 0
Assistant Engineering Officer (Roads) 1 0 1
Assistant Engineering Officer (Water) 1 0 1
Road Inspector 3 3 0
Foreman of works (Electrical) 1 1 0
Pool Stenographer 1 1 0
Plant Operator 3 1 2
Motor vehicle attendant 3 0 3
Office attendant 2 2 0
Driver 3 3 0
From the above table road equipment is demanding to make roads motorable.

45
2.1.7.1 Roads
Table 2.1.6.2: Length, condition and type of district roads
Roads Length
Total length of District roads 316.7Km
Road length in good condition 194 Km
Road length in poor condition 132.7Km
Length of community roads 845Km
Total length of trunk roads central Gov‟t 208.2Km
Total length of tarmac roads 20.3 m
Source: Works and technical services department

46
Table 2.1.6.3: District roads by Subcounty, type and status
S/N Road Number
Road Name Road length (Km)
Surface Type
Road Status
Location by Sub-County
1 41201001 Buyanja_Nyakagyeme Rd 18.11 Earth Fair Buyanja and Nyakagyeme
2 41201011 Kagashe_Rwakanyegyero Rd 8.06 Earth Fair Buyanja and Kebisoni
3 41202002 Kigaaga_Birara Rd 8.45 Earth Fair Nyakagyeme
4 41202005 Rwamahwa_Kakindo Rd 10.27 Earth poor Nyakagyeme and Bugangari
5 41203027 Kazindiro_Kyaburere Rd 10.92 Earth Fair Bugangari
6 41204006 St Francis_Ikuniro Rd 3.52 Earth Fair Buhunga
7 41204007 Ikuniro_Rutooma Rd 2.82 Earth poor Buhunga
8 41204008 Kihanga_Rwemburara Rd 3.56 Earth fair Buhunga
9 41204009 Buhunga_Rwemburara Rd 5.34 Earth poor Buhunga
10 41204010 Kagashe_Ikuniro_Buhunga Rd 5.52 Earth Fair Buhunga
11 41204017 Omukikunika_Rusheshe Rd 4.16 Earth poor Buhunga
12 41205012 Rwakanyegyero_Kihanga Rd 2.31 Earth fair Buhunga and Kebisoni
13 41205013 Kakinga_Ahamuyanja Rd 6.48 Earth Fair Kebisoni
14 41205014 Kebisoni_Kabingo_Mabanga Rd 6.12 Earth Fair Kebisoni
15 41205015 Mabanga_Kahenge Rd 5.30 Earth poor Kebisoni
16 41206018 Kashenyi_Rusheshe Rd 4.90 Earth poor Ruhinda and Buhunga
17 41206019 Kashenyi_Rwengiri Rd 10.50 Earth poor Ruhinda and Bugangari
18 41206020 Ruhinda_Rwengiri Rd 9.49 Earth poor Ruhunda and Bugangari
19 41206021 Joshwa stage_Rweshama PS Rd 4.17 Earth Fair Ruhinda
20 41206022 Nyondo_Rwenshaka Rd 2.36 Earth fair Ruhinda
21 41206023 Kyomera_Ihindiro_Nyabukumba Rd
10.48 Earth Fair Ruhinda and Bwambara
22 41206028 Rwenshaka_Burombe_Bwanda Rd
7.93 Earth poor Ruhinda
23 41207024 Bikurungu_Kakoni Rd 6.24 Earth Fair Bwambara
24 41207026 Bwambara_Ntungwa Rd 5.13 Earth poor Bwambara
25 41208030 Omukishanda_Ndago Rd 4.72 Earth Fair Nyarushanje
26 41208031 Omukinyinya_Omukishanda Rd 7.75 Earth Fair Nyarushanje
27 41208037 Omukiyenje_Ikona Rd 11.09 Earth Fair Nyarushanje
28 41208038 Omukiyenje_Aharugyera Rd 2.08 Earth Good Nyarushanje
29 41209032 Kisiizi_Nyarurambi_Kamaga Rd 10.38 Earth poor Nyarushanje and Nyakishenyi
30 41209033 Bikongozo_Kirimbe Rd 4.11 Earth Fair Nyakishenyi
31 41209034 Kirimbe_Katonya_Kagana_Nyakisoroza Rd
12.18 Earth Fair Nyakishenyi
32 41209035 Kabaranga_Murago_Nyakisoroza 11.70 Earth poor Nyakishenyi

47
Rd
33 41209036 Nyakishenyi_Marashaniro_Kyabamba Rd
11.09 Earth poor Nyakishenyi and Nyarushanje
34 41201029A Rukungiri_Rubabo_Nyarushanje Rd
1.54 Earth poor Buyanja and Nyarushanje
35 41201029B Rukungiri_Rubabo_Nyarushanje Rd
26.38 Earth poor Buyanja and Nyarushanje
36 41202003A Nyabikuku_Rwakigaju Rd 3.65 Earth Fair Nyakegyeme and Bugangari
37 41202003B Nyabikuku_Rwakigaju Rd 5.98 Earth Fair Nyakegyeme and Bugangari
38 41203004A Bugangari_Nyabitete Rd 2.00 Earth Fair Bugangari
39 41203004B Bugangari_Nyabitete Rd 7.46 Earth poor Bugangari
40 41205016A Kebisoni_Mabanga_Kihanga Rd 0.44 Earth Good Kebisoni and Buhunga
41 41205016B Kebisoni_Mabanga_Kihanga Rd 17.47 Earth Good Kebisoni and Buhunga
42 41207025A Kikarara_Garuka_Kyabahanga Rd
11.15 Earth poor Bwambara
43 41207025B Kikarara_Garuka_Kyabahanga Rd
1.54 Earth poor Bwambara
44 Rushararazi_Ihimbo Rd 1.8 Earth Fair Bwambara
Total - District roads net work 316.7
Table 2.1.7.4: Buyanja Town Board Roads
S/N Road Number
Road Name Road length (Km)
Surface Type
Road Condition
1 Buyanja Lower Street Rd 2 Earth Fair
2 Town Cell-Kitanda-Kakiri 1.99 Earth Fair
3 Rwenkureijo-Kyamakanda Rd 1.15 Earth Fair
4 Buyanja-Kibombo Rd 1.38 Earth Fair
5 Buyanja- Nyakaina 1.38 Earth Fair
6 Mbunda-Kaagati 1.56 Earth Fair
7 Buyanja-Bagarame-Omubwehindiriro 1.94 Earth Fair
8 Katojo-Kagarame 2.61 Earth Fair
9 Katojo-Nyabicence 2.28 Earth Fair
10 Rugyendwa-Rwobusisi 2.2 Earth Fair
11 Kanywa-Omubwehindiriro 1.9 Earth Fair
Total 23.71 23.71
Table 2.1.7.5: Kebison Town Boards
S/N Road Number
Road Name Road length (Km)
Surface Type
Road Condition
1 Kebisoni-Ring Street Rd 2 Earth Fair
2 Nyakabale -Rumbugu Rd 1 Earth Fair
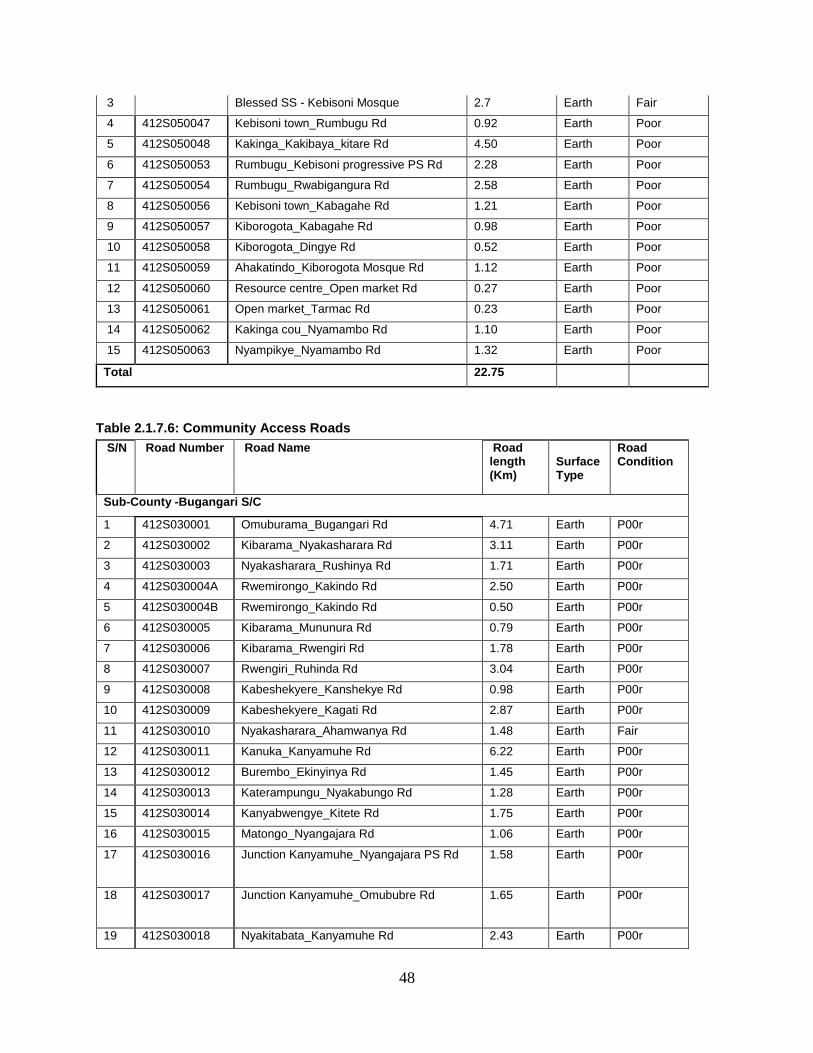
48
3 Blessed SS - Kebisoni Mosque 2.7 Earth Fair
4 412S050047 Kebisoni town_Rumbugu Rd 0.92 Earth Poor
5 412S050048 Kakinga_Kakibaya_kitare Rd 4.50 Earth Poor
6 412S050053 Rumbugu_Kebisoni progressive PS Rd 2.28 Earth Poor
7 412S050054 Rumbugu_Rwabigangura Rd 2.58 Earth Poor
8 412S050056 Kebisoni town_Kabagahe Rd 1.21 Earth Poor
9 412S050057 Kiborogota_Kabagahe Rd 0.98 Earth Poor
10 412S050058 Kiborogota_Dingye Rd 0.52 Earth Poor
11 412S050059 Ahakatindo_Kiborogota Mosque Rd 1.12 Earth Poor
12 412S050060 Resource centre_Open market Rd 0.27 Earth Poor
13 412S050061 Open market_Tarmac Rd 0.23 Earth Poor
14 412S050062 Kakinga cou_Nyamambo Rd 1.10 Earth Poor
15 412S050063 Nyampikye_Nyamambo Rd 1.32 Earth Poor
Total 22.75
Table 2.1.7.6: Community Access Roads
S/N Road Number Road Name Road length (Km)
Surface Type
Road Condition
Sub-County -Bugangari S/C
1 412S030001 Omuburama_Bugangari Rd 4.71 Earth P00r
2 412S030002 Kibarama_Nyakasharara Rd 3.11 Earth P00r
3 412S030003 Nyakasharara_Rushinya Rd 1.71 Earth P00r
4 412S030004A Rwemirongo_Kakindo Rd 2.50 Earth P00r
5 412S030004B Rwemirongo_Kakindo Rd 0.50 Earth P00r
6 412S030005 Kibarama_Mununura Rd 0.79 Earth P00r
7 412S030006 Kibarama_Rwengiri Rd 1.78 Earth P00r
8 412S030007 Rwengiri_Ruhinda Rd 3.04 Earth P00r
9 412S030008 Kabeshekyere_Kanshekye Rd 0.98 Earth P00r
10 412S030009 Kabeshekyere_Kagati Rd 2.87 Earth P00r
11 412S030010 Nyakasharara_Ahamwanya Rd 1.48 Earth Fair
12 412S030011 Kanuka_Kanyamuhe Rd 6.22 Earth P00r
13 412S030012 Burembo_Ekinyinya Rd 1.45 Earth P00r
14 412S030013 Katerampungu_Nyakabungo Rd 1.28 Earth P00r
15 412S030014 Kanyabwengye_Kitete Rd 1.75 Earth P00r
16 412S030015 Matongo_Nyangajara Rd 1.06 Earth P00r
17 412S030016 Junction Kanyamuhe_Nyangajara PS Rd 1.58 Earth P00r
18 412S030017 Junction Kanyamuhe_Omububre Rd 1.65 Earth P00r
19 412S030018 Nyakitabata_Kanyamuhe Rd 2.43 Earth P00r

49
20 412S030019 Rumira_Omukishaha Rd 0.72 Earth P00r
21 412S030020 Omukarere TC_Nyamiyaga Rd 5.38 Earth P00r
22 412S030021 Nyamiyaga_Kazindiro Rd 0.69 Earth P00r
23 412S030022 Kazindiro_Rukonkoma Rd 1.64 Earth P00r
24 412S030023 Kazindiro_Kateramo Rd 2.23 Earth P00r
25 412S030024 Bugangari COU_Kateramo Rd 2.01 Earth P00r
26 412S030025 Nyakariro TC_Rwengwe Rd 1.19 Earth P00r
27 412S030026 Nyakariro _Rwengwe_Rwanyanja Rd 2.20 Earth P00r
28 412S030027 Kyenziro_Nyakanengo Rd 0.95 Earth P00r
29 412S030028A Kashayo_Nyankoro Rd 1.80 Earth P00r
30 412S030028B Kashayo_Nyankoro Rd 0.72 Earth P00r
31 412S030029 Rukonkoma_Kashararazi Rd 0.89 Earth P00r
32 412S030030 Ruhiira_Rugomera Rd 1.58 Earth P00r
33 412S030031 Ruhiira_Rushara Rd 1.12 Earth P00r
34 412S030032 Rwenyerere Rd 1.34 Earth P00r
35 412S030033 Bugangari_Kanyacende Rd 3.69 Earth P00r
36 412S030034 Rumira_Kiragiro Rd 1.87 Earth P00r
37 412S030035 Runyamonyo_Runyamonyo Catholic Church Rd
0.89 Earth P00r
38 412S030036 Katonya_Kashenyi Rd 2.39 Earth P00r
39 412S030037 Katete_Kyomera Rd 4.96 Earth P00r
40 412S030038 Kanyacende_Karama Rd 2.02 Earth P00r
41 412S030039 Burembo_Kakyekyeyo Rd 2.11 Earth P00r
42 412S030040 Nyabiteete_Kanyorobano_Ruhinda Rd 2.12 Earth P00r
43 412S030041 Kanyorobano_Mabungo Rd 2.14 Earth P00r
44 412S030042 Mabungo_Nyamabare Rd 1.48 Earth P00r
45 412S030043 Burembo PS_Burambira Rd 3.26 Earth P00r
46 412S030044 Kashenyi_Keita Rd 1.27 Earth P00r
Total - Subcounty – Bugangari 93.50
Table 2.1.7.7: Subcounty - Buhunga S/County
S/N Road Number Road Name Road length (Km)
Surface Type
Road Condition
1 412S040001 Mugamba_Omuritano_KakambaJcn 5.23 Earth poor
2 412S040002 Karangara_Omukagashe_Bwanda 3.52 Earth poor
3 412S040003 Kagando_BusiikaA 3.79 Earth poor
4 412S040004 Omukiyenje_BwandaCatholicChurh 1.04 Earth poor
5 412S040005A Rwabwingi_Rwakiriba 2.60 Earth poor
6 412S040005B Rwabwingi_Rwakiriba 0.51 Earth poor

50
7 412S040006 Rwabwingi_Rwebiriba 1.65 Earth poor
8 412S040007 Kempunguz_Kashenyi 1.84 Earth poor
9 412S040008 Ryarugambwa_Nyamabare_Kibara 2.88 Earth poor
10 412S040009 MitoomaCOU_Mabunu 1.34 Earth poor
11 412S040010A Rutooma_Kagorogoro 1.70 Earth poor
12 412S040010B Rutooma_Kagorogoro 2.20 Earth poor
13 412S040011 Kahuri_Kagorogoro 1.72 Earth poor
14 412S040012 Kibara_Kibirizi 0.72 Earth poor
15 412S040013 Rugorogoro_Kirimbi 1.35 Earth poor
16 412S040014 Runyinya_Kibirizi 0.78 Earth poor
17 412S040015A Tiivi_Nyarubare_Mahambo 2.60 Earth poor
18 412S040015B Tiivi_Nyarubare_Mahambo 0.43 Earth poor
19 412S040016 Nyarubare_Nyamuniga 1.38 Earth poor
20 412S040017 Tiivi_Kigariko 2.09 Earth poor
21 412S040018 Mizikuzimu_Rwabararira 2.92 Earth poor
22 412S040019 Mugamba_Katwekamwe 1.06 Earth poor
23 412S040020 Nyarubira_Rugando_Kankungu 3.00 Earth poor
24 412S040021 Omukatooke_Rutooma 1.40 Earth poor
25 412S040022 Mutanoga_Karangara 2.94 Earth poor
Total - Subcounty -Buhunga S/C 50.7
Table 2.1.7.8: Subcounty Buyanja S/County
S/N
Road Number Road Name Road length (Km)
Surface Type
Road Condition
1 412S010001 Ruhazo_Rusoroza_Rwempuga Rd 1.31 Earth poor
2 412S010002 Katungu_Kyato_Marembo Rd 2.53 Earth poor
3 412S010003 Kyato_Kentome_Rwere Rd 1.07 Earth poor
4 412S010004 Katungu_Nyakacwamba_Mate Rd 2.11 Earth poor
5 412S010005 Nyarutooma_Rurengye_Katungu Rd 3.09 Earth poor
6 412S010006 Omubusheregyenyi_Omwirwaniro Rd 3.97 Earth poor
7 412S010007 Omukabati_Kitojo_Omwirwaniro _Omwirwaniro Rd
5.14 Earth poor
8 412S010008 Rugongo_Nyakiju_Rwere Rd 4.82 Earth poor
9 412S010009 Omukikoona_Rwere Rd 3.19 Earth poor
10 412S010010 Omukashenyi_Kihengamo_Omukatojo Rd 4.81 Earth poor

51
11 412S010011 Minera_Omukashenyi_Katojo Rd 9.31 Earth poor
12 412S010012 Omukiragiro_Kagaana_Omukashenyi Rd 3.42 Earth poor
13 412S010013 Omukashenyi_Ibumba_Rusharara Rd 1.83 Earth poor
14 412S010014 Kyamabare_Omukikona_Kagarama Rd 2.90 Earth poor
15 412S010015 Nshungyezi_Rubanga COU Rd 1.03 Earth poor
16 412S010016 Omukabingo_Kahunga_Kagaana Rd 3.03 Earth poor
17 412S010017 Kagaana_Ahishaza Rd 3.63 Earth poor
18 412S010018 Kagaana_Kabagahe Rd 1.41 Earth poor
19 412S010019 Kagaana_Kaborogota Rd 1.30 Earth poor
20 412S010020A Rwentuha_Kyakagyengyera Rd 1.22 Earth poor
21 412S010020B Rwentuha_Kyakagyengyera Rd 0.59 Earth poor
22 412S010021 Buyanja_Nyakeina Rd 1.38 Earth poor
23 412S010022 Nyakeina_Kagaati Rd 2.23 Earth poor
24 412S010023A Kaborogota_Kaagati_Nyakibungo Rd 1.18 Earth poor
25 412S010023B Rwenkurijo_Kaagati_Nyakibungo Rd 1.00 Earth poor
26 412S010024 Kagando_Kaata_Nyabiteete Rd 2.86 Earth poor
27 412S010025 Mishenyi_Nyarutntu Rd 1.95 Earth poor
28 412S010026 Rushaka_Kyeshero Rd 2.66 Earth poor
29 412S010027 Buguma_Rwenanura Rd 1.80 Earth poor
30 412S010028 Buguma_Kafunjo_Rwenkurijo Rd 4.22 Earth poor
31 412S010029 Town cell_Kitanda_Kakiri Rd 1.99 Earth poor
32 412S010030 Rwenkurijo_Kyamakanda Rd 1.15 Earth poor
33 412S010031 Rugyendwa_Rwobusis Rd 2.23 Earth poor
34 412S010032 Kihunga _Rwamuhima Rd 2.88 Earth poor
35 412S010033 Rukiri_Kyashamaire Rd 3.04 Earth poor
36 412S010034 Buyanja_Kyamakanda_Makerere Rd 1.06 Earth poor
37 412S010035 Katojo_Nyabicence Rd 2.28 Earth poor
38 412S010036 Katojo_Kagarama Rd 2.61 Earth poor
39 412S010037 Kanywa_Omubwehindiro Rd 1.92 Earth poor
40 412S010038 Buyanja_Bagarame_Omubwehindiro Rd 1.94 Earth poor
41 412S010039 Mbunda_Kaagati Rd 1.56 Earth poor
42 412S010040 Buyanja _Kibombo Rd 1.38 Earth poor
Total - Subcounty –Buyanja 105.0

52
Table 2.1.7.9: Sub-County Bwambara S/County
S/N Road Number Road Name Road length (Km)
Surface Type
Road Condition
1 412S070001 Police HQ_Renshama HC lll Rd 0.32 Earth poor
2 412S070002 Kikarara PS_Nyakabungo Rd 1.09 Earth poor
3 412S070003 Nyakabungo_Sadik Rd 1.26 Earth poor
4 412S070004 Burambira TC_Mukahanje Rd 2.15 Earth poor
5 412S070005 Kashenyi_Garuka Rd 2.06 Earth poor
6 412S070006 Rushaya_Kashenyi Rd 2.36 Earth poor
7 412S070007 Rushaya_Kikarara Rd 1.97 Earth poor
8 412S070008 Rwensijiro COU_Kashojwa Rd 2.42 Earth poor
9 412S070009 Bwambara TC_Omukambugu Rd 1.56 Earth poor
10 412S070010 Rushaya_Kyehunde Rd 1.90 Earth poor
11 412S070011 Jinja TC_School mission Rd 1.41 Earth poor
12 412S070012 Kayaga_Ntungamo Rd 5.73 Earth poor
13 412S070013 Kyabahanga_Kagorogoro Rd 1.34 Earth poor
14 412S070014 Bwambara TC_Kagorogoro_Ntungwa Rd 2.51 Earth poor
15 412S070015 Bwambara_Kinyamatovu Rd 1.48 Earth poor
16 412S070016 Bwambara_Rushaya ARd 1.21 Earth poor
17 412S070017 Omukabaho_Rushaya Rd 1.59 Earth poor
18 412S070018 Kirama_Kinyamatojo Rd 3.61 Earth poor
19 412S070019 Nyabubare_Rugyera Rd 2.45 Earth poor
20 412S070020 Nyabubare_Rutooma_Kakoni Rd 2.95 Earth poor
21 412S070021 Kanyankwanzi_lvan Rd 2.13 Earth poor
22 412S070022A Nanga_Ntungwa Rd 4.56 Earth poor
23 412S070022B Nanga_Nyabihuku_Kateramo Rd 2.16 Earth poor
24 412S070023 Omukabaho_Omukomo_Ntungwa Rd 3.08 Earth poor
25 412S070024 Bukurungu market_Mirozi Rd 3.00 Earth poor
26 412S070025 Nyamitooma_Gileon Rd 2.19 Earth poor
27 412S070026 Nyamitooma_Rwandandari Rd 0.56 Earth poor
28 412S070027 Nyamitoma_Kanshekye Rd 2.01 Earth poor
29 412S070028 Kakoni_Kagati Rd 1.37 Earth poor
30 412S070029 Nyakarambi_Bukaka Rd 1.53 Earth poor
31 412S070030 Kakoni TC _Omukirajiro Rd 1.07 Earth poor
32 412S070031 Kakoni TC _Nyarwimuka Rd 1.32 Earth poor
33 412S070032 Rwemisinga_Rwantare Rd 2.24 Earth poor
34 412S070033 Bukurungu_Kamurema Rd 0.36 Earth poor
35 412S070034 Kamurema_Nyakatunguru Rd 0.61 Earth poor
36 412S070035 Omukarere_Mironzi Rd 1.70 Earth poor

53
37 412S070036 Kateramo_Mironzi Rd 1.37 Earth poor
38 412S070037 Kateramo_Ihimbo Rd 1.93 Earth poor
39 412S070038 Kikongi TC_Omukabingo_Omukafene Rd 4.63 Earth poor
40 412S070039 Karyamacomo_Rushebeya Rd 1.80 Earth poor
41 412S070040 Ruguragure COU_Kempazi Rd 1.06 Earth poor
42 412S070041 Ihimbo_Nyaruhungye Rd 1.67 Earth poor
43 412S070042 Omukabingo_Rushararazi Rd 2.36 Earth poor
44 412S070043 Rushararazi_Bugangari Rd 1.59 Earth poor
45 412S070044 Omukarere_Kateramo_Omukabingo Rd 5.20 Earth poor
46 412S070045 Kikongi_Nyakarama Rd 0.67 Earth poor
47 412S070046 Karyamacomo_Bugangari Rd 1.03 Earth poor
48 412S070047 Omukarere_Musa Rd 0.56 Earth poor
Total - Subcounty –Bwambara 95.2
Table 2.1.7.10: Subcounty - Nyarushanje
S/N Road Number Road Name Road length (Km)
Surface Type
Road Condition
1 412S080001 Kimbugu_Ahakijurirabusha Rd 0.43 Earth poor
2 412S080002 Kembeho_KabasheinyaRd 2.30 Earth poor
3 412S080003 Kembeho_Mukashanda Rd 1.15 Earth poor
4 412S080004 Mutojo_Bujarwe COU Rd 0.93 Earth poor
5 412S080005 Mutojo_Kabumba Rd 1.75 Earth poor
6 412S080006 Nyakihanga B_Mukashanda Rd 1.20 Earth poor
7 412S080007 Rubabo_Nyabushenyi lower PS Rd 3.66 Earth poor
8 412S080008 Rutunga_Rubabo Catholic Church Rd 0.61 Earth poor
9 412S080009 Mukashanda_Rwere Rd 1.41 Earth poor
10 412S080010 Mukashanda_Kiganga_Minera Rd 5.38 Earth poor
11 412S080011 Kiganga_Bwanga Rd 5.98 Earth poor
12 412S080012 Mukentomi_Katoogo Rd 1.69 Earth poor
13 412S080013 Main road_Nyarushoko Rd 1.24 Earth poor
14 412S080014 Kigina_Kyarushongyera Rd 0.95 Earth poor
15 412S080015 Shenga_Kahihi Rd 0.85 Earth poor
16 412S080016A Mukiyenje_Mukibirizi Rd 1.45 Earth poor
17 412S080016B Mukiyenje_Mukibirizi Rd 2.31 Earth poor
18 412S080017 Mukibirizi_Kidandari TC_Genesis PS Rd 1.58 Earth poor
19 412S080018 Nyakazinga_Katoogo Rd 3.68 Earth poor
20 412S080019A Kyaruhotora_Kyafoora Rd 2.05 Earth poor
21 412S080019B Kyaruhotora_ Kyafoora Rd 0.81 Earth poor
22 412S080020 Kyaruhotora_ Kakanena Rd 0.87 Earth poor
23 412S080021 Kyaruhotora_ Kajungu Rd 0.88 Earth poor
24 412S080022 Nyakagyera_Burora HC II_Kyaruhotora PS Rd 4.08 Earth poor

54
25 412S080023 Burora HC II_Nyamakukuru Rd 1.36 Earth poor
26 412S080024 Nyamakukuru B_Rwempanga Rd 2.10 Earth poor
27 412S080025 Rwempanga_ Kinanira_Nyarwanya Rd 3.05 Earth poor
28 412S080026 Nyakatunga_Ndago Rd 0.90 Earth poor
29 412S080027 Nyakatunga_Rwenkyerere Rd 2.28 Earth poor
30 412S080028 Kakomero_Kimira_Katunga Rd 8.27 Earth poor
31 412S080029 Nyabushenyi_Kiganga_Minera 5.30 Earth poor
32 412S080030 Omukebishuba_Kasharara_Omwinero Rd 1.79 Earth poor
33 412S080031 Kasharara_Subcounty HQ Rd 1.14 Earth poor
34 412S080032 Ibanda_Kikyubanyungu Rd 0.28 Earth poor
35 412S080033 Ibanda_Kikyubanyungu_Ngarama Rd 0.98 Earth poor
36 412S080034 Ngarama_Kyakabarisinga Rd 0.59 Earth poor
37 412S080035 Nyarushanje TC_Kyakabarisinga Rd 1.44 Earth poor
38 412S080036 Mushunga TC _Kabuhemba Rd 2.28 Earth poor
39 412S080037 Nyakazinga_Karisizo_Kisiizi Rd 6.28 Earth poor
40 412S080038 Katunga_KyarukambaRd 1.36 Earth poor
41 412S080039 Rwenshekye_Karere Rd 1.74 Earth poor
42 412S080040 Karere_Omukishanda Rd 1.47 Earth poor
43 412S080041 Omukishanda_Katobotobo Rd 1.70 Earth poor
44 412S080042 Kitokye_Kamira Rd 0.78 Earth poor
45 412S080043 Kikoni_Kyanika Rd 1.87 Earth poor
46 412S080044 Kyanika_Nyamakukuru Rd 0.88 Earth poor
47 412S080045 Karukata PS _Kyanju Rd 0.85 Earth poor
48 412S080046 Kyanju_Buhesi Rd 2.77 Earth poor
49 412S080047 Nyamikyukyu_Katozi Rd 0.44 Earth poor
50 412S080048 Ahakatojo_Nyarurwambu Rd 1.82 Earth poor
51 412S080049 Katamire_Kishunjure Rd 1.08 Earth poor
52 412S080050 Karama PS_Buhesi Rd 1.74 Earth poor
53 412S080051 Ihambiro_Kiteme Rd 0.38 Earth poor
54 412S080052 Ihambiro_Mugyera_Kazinga Rd 3.91 Earth poor
55 412S080053 Omukarere_Nyamabare Rd 0.63 Earth poor
56 412S080054 RukungiriVocationalSchoo_KigangoRd 0.47 Earth poor
57 412S080055 Kikazi_St jude_Kibishamwika Rd 1.33 Earth poor
58 412S080056 Omukatooma_Omukinyinya Rd 3.07 Earth poor
59 412S080057 Rwakaraba_Karisizo Rd 1.68 Earth poor
60 412S080058 Karisizo_ Kyayanga Rd 2.14 Earth poor
Total - Subcounty –Nyarushanje 117.4

55
Table 2.1.7.10: Subcounty - Nyakishenyi
S/N Road Number Road Name Road length (Km)
Surface Type
Road Condition
1 412S090001 Mabindi_Katate_Birari Rd 5.40 Earth poor
2 412S090002 Kabuhome_Kirimbe PS Rd 1.98 Earth poor
3 412S090003 Bikongozo PS_Birari Rd 1.92 Earth poor
4 412S090004 Byongo_Kabale boarder Rd 1.12 Earth poor
5 412S090005 Kabijaga_Kafunjo PS Rd 3.38 Earth poor
6 412S090006 Mubande_Nyaruziba_Mukitooma Rd 1.00 Earth poor
7 412S090007 Bugandaza PS_Katonya Rd 2.76 Earth poor
8 412S090008 Bugandaza_Nyabisaki Rd 1.98 Earth poor
9 412S090009 Nyakabare TC_Nyarubira Rd 1.61 Earth poor
10 412S090010 Mabindi PS_Bushunga_Muhindi Rd 8.84 Earth poor
11 412S090011 Mundeba_Nyarubira TC Rd 1.70 Earth poor
12 412S090012 Ruhonwa_Mukarere TC_Bugarama Rd 2.31 Earth poor
13 412S090013 Mukajagiro_Bugarama TC Rd 0.84 Earth poor
14 412S090014 Mukanihiro_Rujoka Rd 2.08 Earth poor
15 412S090015 Kagaana TC_Ndaragye Rd 2.76 Earth poor
16 412S090016 Kagaana TC_Makiro Rd 1.20 Earth poor
17 412S090017 Kabaranga_Kisya Rd 2.16 Earth poor
18 412S090018 Buremera_Rutezo_Shogashoga Rd 4.32 Earth poor
19 412S090019 Rutooma_Kamira Rd 0.68 Earth poor
20 412S090020 Nyakisoroza_Kababaji_Burambira Rd 0.93 Earth poor
21 412S090021 Nyamikokye_Burambi Rd 1.25 Earth poor
22 412S090022 Kyondo_Kagaana Rd 0.20 Earth poor
23 412S090023 Bugamba_Rwanyundo PS Rd 1.74 Earth poor
24 412S090024 Kahara_ Rugoma Rd 1.08 Earth poor
25 412S090025 Kamaga_Nyabitekyere Rd 0.84 Earth poor
26 412S090026 Rwanjeru_Nyakitukura Rd 0.53 Earth poor
27 412S090027 Rwanjeru_Nyabubare Rd 1.78 Earth poor
28 412S090028 Nyakishenyi high school_Kitebwe Rd 0.94 Earth poor
29 412S090029 Nyarurambi_Kibeho Rd 1.74 Earth poor
30 412S090030 Kitugunda_Mukati Rd 3.30 Earth poor
31 412S090031 Kiragiro TC_S/C head quarter Rd 0.91 Earth poor
32 412S090032 Numba_Rwonyo COU Rd 0.86 Earth poor
33 412S090033 Bandebaho_marasani Rd 0.38 Earth poor
34 412S090034 Marashani PS_Kibishamwika Rd 0.90 Earth poor
35 412S090035 Nyarutuntu_Nyarubare_Nyarugando Rd 1.62 Earth poor
36 412S090036 Mukashojwa_Runyinya Rd 1.68 Earth poor
37 412S090037 Nyarurambi_Rwanama Rd 3.92 Earth poor

56
38 412S090038 Mukarere TC_Nyabisoni Rd 0.98 Earth poor
39 412S090039 Nyabisoni_Kakyenkye Rd 2.28 Earth poor
40 412S090040 Mukidandari_ Ngoma PS Rd 1.27 Earth poor
41 412S090041 Rwakaraba TC_Murutooma_Kibeho Rd 2.21 Earth poor
42 412S090042 Nyarurambi COU_Numba Rd 1.65 Earth poor
43 412S090043 Nyakabare_Numba Rd 1.38 Earth poor
44 412S090044 Nyamabare_Mukitooma Rd 1.30 Earth poor
Total - Subcounty –Nyakishenyi 83.7
Table 2.1.7.11: Subcounty - Nyakagyeme
S/N Road Number Road Name Road length (Km)
Surface Type
Road Condition
1 412S020001A Kamwekamwe_KiriteRd 1.53 Earth poor
2 412S020001B Kamwekamwe_KiriteRd 3.71 Earth poor
3 412S020002 Kirite2_NyabiteeteRd 4.48 Earth poor
4 412S020003A Nyamabare_NyabiteteRd 2.86 Earth poor
5 412S020003B Nyamabare_NyabiteteRd 1.16 Earth poor
6 412S020004 Rwamunyonyo_NyabiteteRd 3.65 Earth poor
7 412S020005 Bushorero_BurambiraTCRd 1.77 Earth poor
8 412S020006 Kyabugashe_RwemiringaRd 3.61 Earth poor
9 412S020007 Katonya_KarambikirizoRd 2.90 Earth poor
10 412S020008A NyabikukuTC_RwembogoRd 2.76 Earth poor
11 412S020008B NyabikukuTC_RwembogoRd 0.33 Earth poor
12 412S020009 Burera_NyabikukuTCRd 2.32 Earth poor
13 412S020010 Karambikrizo_KatoboRd 2.80 Earth poor
14 412S020011 Kirehe_NyaburondoRd 0.77 Earth poor
15 412S020012A Kasoroza_NyabikukuRd 1.27 Earth poor
16 412S020012B Kasoroza_NyabikukuRd 1.45 Earth poor
17 412S020013 Kasoroza_RushararaRd 1.03 Earth poor
18 412S020014A Kagunga_Bucence_MaribaRd 2.55 Earth poor
19 412S020014B Kagunga_Bucence_MaribaRd 0.74 Earth poor
20 412S020015 Kabahirayo_KasorozaRd 1.57 Earth poor
21 412S020016 Nyakiziba_OmukayagaRd 2.76 Earth poor
22 412S020017 Nyakiziba_BucenceRd 0.78 Earth poor
23 412S020018 KyamurariSignpost_KyamurariPSRd 0.64 Earth poor
24 412S020019 Kasoroza_KaburaRd 1.57 Earth poor
25 412S020020 Kijuri_Ruteete_KabareRd 5.26 Earth poor
26 412S020021 Kijuri_KabareRd 2.36 Earth poor
27 412S020022 Ntirimba_KahendaTCRd 2.00 Earth poor

57
28 412S020023 Kijuri_KagorogoroRd 1.10 Earth poor
29 412S020024 Kashenyi_KitemeRd 1.69 Earth poor
30 412S020025 Kashenyi_Rwamashunshu 2.33 Earth poor
31 412S020026 Kashenyi_KiguhaBridge 7.63 Earth poor
32 412S020027 Kinyamahwa_BugaramaRd 1.25 Earth poor
33 412S020028 HalfLondon_RubamburaRd 0.95 Earth poor
34 412S020029 Rwereretown_RwakiribariverRd 2.80 Earth poor
35 412S020030 Rwakashanda_BigaagaRd 1.29 Earth poor
36 412S020031 Rwakashanda_KahihiRd 1.60 Earth poor
37 412S020032 Kagugu_RwakagoroRd 1.47 Earth poor
38 412S020033 Kagugu_MukurukeenengoRd 0.88 Earth poor
39 412S020034A Kantojo_Nyakacwamba_KahokoPSRd 2.39 Earth poor
40 412S020034B Kantojo_Nyakacwamba_KahokoPSRd 0.86 Earth poor
41 412S020035 Katerere_KashekuRd 4.19 Earth poor
42 412S020036 Rwenkuba_BugaramaRd 2.19 Earth poor
43 412S020037 Kyamurari_NyakarundiRd 4.32 Earth poor
44 412S020038 Kyamurari_KahokoPSRd 2.02 Earth poor
45 412S020039 Kahoko_EnonkoRd 2.06 Earth poor
46 412S020040 Katooma_OmukinoniRd 1.42 Earth poor
47 412S020041 Katungu1_RugundaRd 1.58 Earth poor
48 412S020042 Kifunjo_KarunoniRd 2.10 Earth poor
49 412S020043 Kifunjo_BishakaRd 1.03 Earth poor
50 412S020044 Jim_KamuhokoRd 3.67 Earth poor
51 412S020045 Kamuhogo_KireheRd 1.97 Earth poor
52 412S020046A Kirehe_RugandoCOURd 1.23 Earth poor
53 412S020046B Kirehe_RugandoCOURd 0.18 Earth poor
54 412S020047 Kahihi_KireheRd 1.47 Earth poor
55 412S020048 Omukishenyi_RugandoHCIIRd 2.77 Earth poor
56 412S020049A Kamuhoko_Mutanyata_NyakayagaRd 2.02 Earth poor
57 412S020049B Kamuhoko_Mutanyata_NyakayagaRd 2.29 Earth poor
58 412S020050 Mukayembe_RugandoRd 0.79 Earth poor
59 412S020051 Rugando_MutanyataRd 1.98 Earth poor
60 412S020052 Nyakanengo sign post_OmukembehoRd 0.79 Earth poor
Total - Subcounty –Nyakagyeme 125.0

58
Table 2.1.7.12: Subcounty - Kebisoni
S/N Road Number Road Name Road length (Km)
Surface Type
Road Condition
1 412S050001 Kiborogota_Akatesani Rd 2.28 Earth Poor
2 412S050002 Kataramire_Omukibare Rd 1.66 Earth Poor
3 412S050003 Omukibare_Kishunju Rd 0.36 Earth Poor
4 412S050004 Omukatogo_Kishunju Rd 1.93 Earth Poor
5 412S050005 Omukatogo_Kitenga Rd 1.04 Earth Poor
6 412S050006 Garuhunda PS_Kijungu Rd 1.37 Earth Poor
7 412S050007 Omukatenga_Kanywa Rd 1.85 Earth Poor
8 412S050008 Kanywa_Butinde Rd 1.09 Earth Poor
9 412S050009 Biguri_Butinde_Kaborogota Rd 1.90 Earth Poor
10 412S050010 Kyamutereiga_Butinde COU Rd 1.05 Earth Poor
11 412S050011 Kanywa_Biluhuko Rd 1.00 Earth Poor
12 412S050012 Kyamutereiga PS_Bikungu Rd 0.67 Earth Poor
13 412S050013 Bikungu_Temba Rd 1.45 Earth Poor
14 412S050014 Akatesani_Katungu Rd 0.88 Earth Poor
15 412S050015 Kanyabuhanga_Ntukura Rd 0.52 Earth Poor
16 412S050016 Ahamukambo_Biruhuko Rd 1.95 Earth Poor
17 412S050017 Kahangiro_Ntabarutaba Rd 0.89 Earth Poor
18 412S050018 Nyamubogore_Rwabihuwa Rd 0.64 Earth Poor
19 412S050019 Katenga_Ahamuhambo Rd 1.97 Earth Poor
20 412S050020 Nyeibingo_Baribuhasha Rd 0.99 Earth Poor
21 412S050021 Katenga_Maguma_Ezra Rd 2.08 Earth Poor
22 412S050022 Maguma_Ahamuhambo Rd 1.22 Earth Poor
23 412S050023 Ahakayaga_Maguma Rd 0.84 Earth Poor
24 412S050024 Makiro_Omukidiba Rd 1.04 Earth Poor
25 412S050025 Kagaana_Kabubuzooba Rd 1.06 Earth Poor
26 412S050026 Kiigiro_Kabubuzooba Rd 0.45 Earth Poor
27 412S050027 Rwemiyaga_Nyamizumbi Rd 1.20 Earth Poor
28 412S050028 Kitoha_Kahembe Rd 1.13 Earth Poor
29 412S050029 Itaano_Nyamijumbi_Kigango Rd 2.69 Earth Poor
30 412S050030 Itaano_Omukatenga Rd 1.85 Earth Poor
31 412S050031 Itaano_Kabamushweere_Rwabigangura Rd 3.16 Earth Poor
32 412S050032 Omukidiba_Omukayenje_Kamulindwa Rd 3.46 Earth Poor
33 412S050033 Mabanga PS_Kyondo Rd 2.91 Earth Poor
34 412S050034 Rugorogoro_Bagarame_Kitojo Rd 1.51 Earth Poor
35 412S050035 Omukidiba_Kigango Rd 1.59 Earth Poor
36 412S050036 Kigango_Omukatookye_Nyakazinga Rd 3.66 Earth Poor

59
37 412S050037 Kahengye_Omukatookye Rd 1.70 Earth Poor
38 412S050038A Kanonko_Kahengye PS Rd 0.44 Earth Poor
39 412S050038B Kanonko_Kahengye PS Rd 1.18 Earth Poor
40 412S050039 Omukatookye_Karuhembe PS Rd 1.18 Earth Poor
41 412S050040 Omukatookye_Omukatojo Rd 1.68 Earth Poor
42 412S050041 Kahengye_Omukatojo Rd 2.20 Earth Poor
43 412S050042 Aharuberera_Kabingo COU Rd 1.12 Earth Poor
44 412S050043 Omukatojo_Omukatazaana Rd 0.87 Earth Poor
45 412S050044 Kabingo COU_Kabamucweere Rd 0.73 Earth Poor
46 412S050045 Rwabigangura_Omukagaana_Kahengye Rd 3.16 Earth Poor
47 412S050046 Rwabigangura_KakibayaRd 2.39 Earth Poor
48 412S050047 Kebisoni town_Rumbugu Rd 0.92 Earth Poor
49 412S050048 Kakinga_Kakibaya_kitare Rd 4.50 Earth Poor
50 412S050049 Kakibaya COU_Kanyakiru Rd 1.66 Earth Poor
51 412S050050 Ahakikoona_Ruboroga Rd 2.27 Earth Poor
Total - Subcounty – Kebisoni 81.3
2.3 Challenges
Encroachment on road reserves.
Deliberate blockages of side drains and offshoots by some people leading to carriage ways being washed away by surface run off.
Frequent break down of vehicles, machines/plants, hence delay caused to meet planned targets.
Distances traversed by road gang workers are quite long, hence much of the time is not effectively utilized.
Mbarara Regional mechanical workshop mandated to handle major repairs takes long time to respond to our call in case of repairs of emergency nature.
Extraction of sand from road sides and near drainage structures.
Limited Funds allocated to road sector.
Funds not released as per the annual work plan.
Budget cutbacks from the center.
Limited funds allocated to maintenance of buildings, Compound and flower beds due to limited local revenue

60
2.4 Review of previous performance (Achievements, unfinished activities and emergency needs of first development plan)
Table 2.1.7.13: Previous performance / achievements Works department 2010/2011- 2014/201i
Interventions by sector LG ANNUAL PERFORMANCE
2010/11 to 2014/2015 %ge
Performance
Planned/ Target Achievement
Routine Mechanised maintenance 982 586 60
Routine Manual maintenance 1043 667 64
Addressing road bottle necks on Community
Access Roads (CARs) in 9 Sub-counties of
Bugangari, Buhunga, Buyanja, Bwambara,
Kebisoni, Nyakagyeme, Nyakishenyi,
Nyarushanje, Ruhinda
9 9 100
Supply and installation of Culverts 224 224 100
Production of Quarterly monitoring Reports 20 20 100
Production of Quarterly Accountability Reports 20 20 100
Supporting of the LLGs in participatory
planning and production of Development
Plans.
9 9 100
Construction of District Administration Building
Phases
Phase VIII Phase VIII Ongoing
From the above table the targets for road maintenance could not be 100% because of poor road equipment, budget shortfall.
2.4.2 Unfinished activities
Completion of District Headquarters Administration building.
Rehabilitation of Minera-Kihunga-Rwamuhima Road 16.0Km.
2.4.3 Key issues that need to be addressed:
Procurement of sound road equipment unit for the District. Government should increase on funds allocated for road works. URF releases should be as per the annual work plans. Marking of Road reserves. Revision of works department structure ( Next Cadre from the Salary Scale U1 is U4)
Table 2.1.7.13: Equipment under Works department:
Item Description Quantity Condition
1 Computer sets 2 Functional
2 Lap top 2 Functional
3 Bulldozer 1 Fair
4 Grader 2 Fair, Poor
5 Wheel Loader 1 Not road worthy
6 Roller 1 Not road worthy
7 Tipper 3 Good, Poor, Poor
8 Supervision pickup 3 Not road worthy
9 Motor cycle 6 Good, Good, Poor, Poor, Poor, Poor.
Source of Funding: Uganda Road Fund (URF) and local revenue

61
2.1.7.2 WATER SECTION
Vision: Well-maintained safe water network and clean sanitation for all the people of Rukungiri district by 2020 Mission: Construction and extension of piped water supply system and construction of sanitation facilities in public places. Goal: To reduce water and sanitation related diseases by 40%by the year 2020 Composition:
1. Hard ware- Construction works 2. Software – Sanitation and hygiene
District water office Staffing
Table 2.1: Staffing Position works department:
Designation Approved Filled Vacant
Senior Engineer 1 0 1
District Water Officer 1 1 0
Assistant District Water Officer (Water Supply) 1 1 0
Assistant District Water Officer (Mobilisation) 1 1 0
Accounts Assistant 1 1 0
Secretary 1 1 0
Driver 1 1 0
Office attendant 1 1 0
Table 2.2: Equipment under Water sector:
Item Description Quantity Condition
1 Computer sets 3 Functional
2 Lap top 3 Functional
3 Camera 1 Good
4 GPS Machine 1 Good
5 Supervision pickup 1 Good
6 Motor cycle 2 Good, Poor.
Water user Committeees in the District Under software, there has been appositive improvement in management of point water sources by having water user committees that are gender sensitive.The sector performance report 2015showed that the district had 79%, of the water sources having management committees and further indicated that 80% of the committees had women holding key positions.

62
Table showing summary of Functionality and Management of water committees
S/N Sub county O&M committees for Gravity Flow schemes
Management by Gender
Functionality
1 Kebisoni 2 M- 7 F- 3 T/L: 10
All functional
2 Buyanja 1 M- 2 F- 3 T/L: 5
Functional
3 Bwambara 1 (Small towns water project under umbrella)
M- 3 F- 2 T/L: 5
Functional but with issues of pumping as a result of solar failure
4 Bugangari 2 ( Katabushera and Kashenyi)
M- 4 F- 6 T/L: 5
Functional
5 Nyakagyeme 3 M- 4 F- 11 T/L: 15
Functional
6 Buhunga 3 M- 10 F- 5 T/L: 15
Functional
7 Ruhinda 1 M- 4 F- 1 T/L: 5
Functional
8 Nyarushanje 4 M- 11 F- 9 T/L: 20
All functional
9 Nyakishenyi 4 M- 15 F- 5 T/L: 20
All functional
Total 87% 79% 86%
For every point water source, 5 people are selected by the community to take charge of its Operation and Mantainence. That is Chairperson, Vice Chairperson, Secretary, Treasurer, Mobiliser. The local council chairperson and the source care taker / scheme attendant are ex-officials.

1
Recent developments
Construction and extensions of GFS
Launching of a multi -billion of Rukungiri water project from Kahengye to areas of Kebisoni, Buyanja and Nyakagyeme
Rehabilitation of boreholes and shallow wells
Construction of public latrines
Community Led Total sanitation
Household sanitation visits and hygiene improvement Analysis of Development Partners
North Kigezi and Kikiizi Dioceses(NKKD) Watsan involved in construction of Gravity Flow Schemes, Construction of protected springs, construction of rain water harvesting tanks, constriction of VIP latrines for schools and churches, construction of Ecological Sanitation facilities, household sanitation improvement campaigns.
Literacy Action Development Agency (LADA) involved in construction of Construction of protected springs, construction of shallow wells, construction of rain water harvesting tanks, constriction of VIP latrines for schools, household sanitation improvement campaigns.
Rukungiri women Integrated Development Foundation (RWIDF) involved in construction of Construction of protected springs, construction of rain water harvesting tanks, constriction of VIP latrines for schools, household sanitation improvement campaigns.
Challenges
Land acquisition for water projects
Decreasing ground water potentials
Non functionality of community based maintenance system in the district
Pollution of water sources.
Inadequate community participation in water and sanitation activities.
Low political will and community attitude.

2
Table 2.3: Location of water sources, accessibility and functionality
% Access % Functional Protected springs shallow wells Deep B/H
Administrative Unit
Ru
ral
Urb
an
To
tal
Ru
ral
Urb
an
WF
P
Fu
nc
tio
na
l
No
n-f
un
cti
on
al
To
tal
Fu
nc
tio
na
l
No
n-f
un
cti
on
al
To
tal
Fu
nc
tio
na
l
No
n-f
un
cti
on
al
To
tal
1. Buyanja 95 0 95 80 0 0 102 13 115
8 0 8 13 11 24
2. Kebisoni 95 0 95 75 0 0 90 23 113
11 5 16 9 2 11
3. Nyakishenyi 95 0 95 82 0 100 121 14 135
4 1 5 1 0 1
4. Nyarushanje 95 0 95 74 0 75 12 87
5 5 10 4 11 15
5. Bugangari 95 0 95 84 0 0 106 10 116
12 3 15 3 2 5
6. Buhunga 95 0 95 87 0 0 133 9 142
3 2 5 1 1 2
7. Bwambara 77 0 77 64 0 0 53 21 74
7 4 11 0 0 0
8.Nyakagyeme 95 0 95 87 0 0 153 21 174
7 2 9 4 0 4
9. Ruhinda 95 0 95 87 0 0 153 15 168
5 1 6 1 0 1
10. Rukungiri MC 95 95 87 0 35 1 36
0 0 5 2 7
Total 92 95 92 84 87 0 734 89 823
34 15 49 21 6 27
District 93 95 93 81 87 100 1,121 151 1,272
59 27 86 37 31 68
Urban areas 95 95 87 0 35 1 36
0 5 2 7
Rural areas 93 0 93 81 0 100 1,086 150 1,236
59 27 86 32 29 61

3
Table 2.4: Point water source
% Access % Functional RWHT PSP/Kiosk Tap stands
Administrative Unit R
ura
l
Urb
an
To
tal
Ru
ral
Urb
an
WF
P
Fu
nc
tio
na
l
No
n-f
un
cti
on
al
To
tal
Fu
nc
tio
na
l
Ya
rd t
ap
Ho
us
eh
old
co
nn
ec
tio
n
Ins
titu
tio
na
l
co
nn
ec
tio
n
1. Buyanja 95 0 95 80 0 0 13 2 15 0 0 47 19
2. Kebisoni 95 0 95 75 0 0 16 8 24 0 0 38 10
3. Nyakishenyi 95 0 95 82 0 100 7 4 11 1 0 25 10
4. Nyarushanje 95 0 95 74 0 14 10 24 0 0 183 28
5. Bugangari 95 0 95 84 0 0 28 8 36 0 0 7 7
6. Buhunga 95 0 95 87 0 0 9 9 18 0 0 186 39
7. Bwambara 77 0 77 64 0 0 35 18 53 0 0 6 7
8. Nyakagyeme 95 0 95 87 0 0 23 5 28 0 0 3 0
9. Ruhinda 95 0 95 87 0 0 28 9 37 0 0 6 3
10. Rukungiri MC 95 95 87 0 35 6 41 0 0 0 0
Total 92 95 92 84 87 0 138 58 196 0 0 226 59
District 93 95 93 81 87 100 210 82 292 1 0 519 126
Urban areas 95 95 87 0 32 6 38 0 0 0 0
Rural areas 93 0 93 81 0 100 178 76 254 1 0 812 126
District Functionality 87% District Access 93.1% District Functionality 86% Water coverage The overall safe water coverage of the district is currently 93% at household level. The ministry also has plans to construct bulk water system from Kabale stream in Bugangari/Nyakagyeme to supply communities in Bwambara and Bugangari subcounties and supply Rukungiri Municipality with surface water supply system from Kahengye stream which is 20 km from the town.
2.1.8 EDUCATION
Mandate: To improve Universal Primary Education and develop sports activities in schools and communities as provided for in the Education white paper of 1991 the Uganda Constitution of 1995, the Local Government Act, Chapter 248 and the National Guidelines on the implementation of Universal Primary Education. Composition: The department has 4 sections:-
- Administration

4
- Inspectorate - Sports
- Special Education.
Table 2.1.8.1: Staffing Education department:
Designation Approved Filled Vacant
District Education Officer 1 0 1
Principal education officer 1 0 1
Senior Education Officer 1 0 1
Senior Inspector of Schools 1 1 0
Inspector of Schools 3 3 0
District Sports Officer 1 0 1
Senior Accounts Assistant 1 1 0
Records Officer 1 1 0
Office Typist 1 1 0
Driver 1 1 0
Office Attendant 1 1 0
Table 2.1.8.2: Equipment under Education department
Type No Condition/Status
Double Cabin Pick-up 1 Not road worthy
Single Cabin Pick-up 1 Not road worthy
Photocopiers 2 Non functional
Computers 7 4 functional, 3 non functional
Laptop 1 Functional
Motorcycles 4 3 Old but functional, 1 grounded
Generator 1 Old but repairable
Public address system 1 Non Functional
Key services
Prevision of support supervision to teachers and instructors
Ensure policy implementation eg adherence to education act, utilization of government grants
Facilitating workshops and refresher courses
Coordination of education service activities in the district
Guiding and helping private schools on how to have their licensed and registered.
Ensure of Provision of quality education by both government aided private schools
To identify the schools which need immediate interventions in terms of infrastructure?

5
Table 2.1.8.3: School/Institutions Enrollment per Subcounty by Genger
S/N Location Category No. of Schools Enrolment
Ownership Boys Girls Total
1 Bugangari Government Private Total
Primary 13 15 28 4605 4944 9549
Secondary 2 1 3
439 386 825
Tertiary - - - - - -
2 Buhunga
Primary 14 08 22 3154 3227 6381
Secondary 2 - 02 482 630 1112
Tertiary - - - - - -
3 Bwambara
Primary 12 20 32 33381 3539 6920
Secondary 1 2 3 197 164 361
Tertiary - - - - - -
4 Nyakagyeme
Primary 21 08 29 3950 34092 38042
Secondary 3 2 5 551 601 1152
Tertiary - - - - - -
5 Ruhinda
Primary 17 11 28 3155 3275 6430
Secondary 3 1 4 753 734 1486
Tertiary - - - - - -
6 Buyanja
Primary 21 10 31 4550 4605 9155
Secondary 3 5 8 1490 1649 3139
Tertiary 2 - 02 204 186 390
7 Kebisoni Primary 18 10 28 3969 4190 8159
Secondary 2 3 5 1239 1488 2727
Tertiary - - - - - -
8 Nyakishenyi Primary 21 17 38 6040 7607 13647
Secondary 2 1 3 391 364 755
Tertiary
9 Nyarushanje
Primary 25 25 50 6282 6581 12863
Secondary 4 3 7 1114 1114 2118
Tertiary 01
- 01 99 21 120
From the table above, Private institutions have low enrolment compared to government aided ones because they pay a lot of money and this is afforded by a few parents. The number of males to female in technical institutions is very high because most of the activities of the courses need much strength. Such courses include; brick/block laying, carpentry, plumbing etc. The few girls that join do tailoring, knitting, hair dressing and others that do not need a lot of strength.

6
Table 2.1.8.4: Rukungiri PLE Performance 2011-2015
Year Div.1 Div.2 Div.3 Div.4 Div. U Div. X Total
2011 679 2,905 1,195 551 153 153 5,636
2012 936 3,135 1,010 291 67 152 5,591
2013 754 2,835 1,424 471 158 138 5,780
2014 837 2,981 1,255 414 127 114 5,728
2015 547 2,861 1860 768 309 105 6450
The average failure rate for the last five years was at 2.4% as indicated from the table.
Table 2.1.8.5: Rukungiri District Primary Teachers and their Qualifications
Sub-County Graduate GV GIII GII LTS Total
1 Bugangari 3 57 147 01 208
2 Buhunga 5 38 127 170
3 Bwambara 9 47 99 155
4 Nyakagyeme 8 50 108 166
5 Ruhinda 11 61 146 218
6 Buyanja 15 64 130 212
7 Kebisoni 26 55 172 253
8 Nyakishenyi 3 33 105 02 143
9 Nyarushanje 12 53 104 168
Total 92 458 1141 01 02 1695
Sub-Counties like Buyanja, Kebisoni, Nyarushanje and Ruhinda have big number of graduates because being near the centre of the district, they easily access the information. Sub-counties like Nyakishenyi and Bwambara have very few numbers because teachers are interested in petty jobs like lumbering , rice growing/ harvesting hence no time for further. 2.1.9 PRODUCTION AND MARKETING: MANDATE: Under the Constitution of Republic of Uganda 1995 Local Government act 1997 and other related National Law mandate the department, to promote and facilitate increased production and productivity in Agriculture, Commerce and Industry for Social and Economic Development of the District. Composition: The department is composed of;
- Production Office
- Agriculture - Veterinary
- Fisheries - Entomology
- Commercial services and trade. And now; - OWC officers

7
Table 2.1.9.1: Equipment in Production:
Type No. Condition
Vehicle 1 Not worth to be on the road (very old)
Motorcycles 19 Running
Computer sets 3 Operational
Artificial Insemination Kits 1 Not complete
vaccine carriers 10 Operational
Photocopier 1 Not operational
Cyclostring Machine 1 Not operational
Lap top 1 Operational
Generators 2 Operational
Cold Chain (Fridges) 2 Operational
Camera 1 Operational
Modem 1 Operational
Tent for plant clinic 1 Operational
Soil test kit 12 Operational
Colored printer 1 Operational
Production and marketing key agricultural interventions, disaggregated data by subcounties
Table 2.1.9.2: Number of households involved in Agriculture
Source: Planning Unit Rukungiri District
Table 2.1.9.3: Major types of crops grown by acreage and production levels
Major crops Area in hectares Production Metric tons/year Average yield kg/ha
Bananas 22759 329400 6400
Coffee 21960 71280 5500
Beans 20970 31455 800
Sweet potatoes 5720 34320 6100
Maize 3693 66474 1800
Millet 2235 1788 800
Sorghum 1559 1403 900
Field peas 809 634 800
Ground nuts 1225 5265 1200
Irish potatoes 950 5700 6900
Cassava 13030 58635 4500
Rice 6900 14490 1500
Source: Foodnet annual reports & Production and Marketing department
Sub county Number of households involved in Agriculture
Bugangari 5474
Buhunga 3976
Buyanja 6020
Bwambara 6110
Kebisoni 4524
Nyakagyeme 6173
Nyakishenyi 5977
Nyarushanje 7451
Ruhinda
4709

8
Table 2.1.9.4: Acreage of major crops grown per Subcounty
Subcounty Banana
Coffee
Maize
Beans
Cassava
sweet potatoes
Irish potatoes
G.nuts
Rice
Millet
Sorghum
Nyakishenyi 1600 2350 350 350 235 850 610 10 - 55 350
Nyarushanje 4083 3650 250 230 435 540 310 10 - 62 450
Kebisoni 3165 2100 163 1000 700 300 30 80 - 556 -
Buyanja 3387 1450 95 800 900 300 - 80 - 432 -
Nyakagyeme 4094 2950 235 1000 900 500 - 80 - 137 -
Bugangari 1828 4300 800 1460 1440 900 - 950 2500
248 150
Bwambara 500 1500 900 2000 1500 1260 - 1200 3500
124 249
Buhunga 2143 2110 500 400 600 400 - 400 - 323 -
Ruhinda 1959 1620 400 700 600 700 - 700 900 297 05
Total 22759
21960 3693 20970
13030 5720 950 3500 6900
2235 1559
Source: District Agriculture Office
Table 2.1.9.5: Common pests and diseases
Common diseases Common pests
Coffee wilt Banana bacterial wilt Banana sigatoka Cassava brown streak disease Cassava Mosaic Disease Late blight Bacterial wilt in Irish potatoes Rice blast
Black Coffee twig borer Banana weevils Nematodes Aphids Mealy bugs Maize stalk borer Birds -
Source: District Agriculture Office
Livestock and Veterinary services
Table 2.1.9.6: Number of livestock per Sub County by type
Sub county Cattle Goats Sheep Pigs Chicken Dogs Cats Rabbits
Bugangari 4771 12097 1179 1399 6687 402 108 207
Buhunga 3908 5824 1473 2984 5789 700 164 970
Buyanja 16657 9854 713 903 8057 932 135 493
Bwambara 457 10740 419 979 9780 333 128 184
Kebisoni 15744 5303 1112 2494 5004 398 434 449
Nyakagyeme 8239 7041 793 2397 6284 1088 399 371
Nyakishenyi 3307 6027 1676 726 5721 422 108 380
Nyarushanje 5902 16031 1729 1777 6779 891 321 448
Ruhinda 3916 4579 1660 1539 5349 328 193 790
Total 62,901 77,496 10,754 15,198 59,450 5,494 1,990 4,292
Source: District Production Department

9
Table 2.1.9.7: Major livestock diseases by location
No Major livestock diseases Location
1 East coast fever Kebisoni, Nyarushanje, Bugangari, Buyanja, Municipal council Ruhinda, Buhunga, Bwambara, Nyakagyeme, Nyakishenyi,
2 Lumpy skin disease Kebisoni, Nyarushanje and Buyanja
3 Mastitis District wide
4 New Castle Disease District wide
5 Brucellosis Nyarushanje
6 Eyes infections District wide
7 Rabies District wide
Source: District Production Department
Table 2.1.9.8: Number of licensed veterinary/ livestock drug shops
Subcounty No of licensed veterinary/livestock drug shops
Bugangari 3
Buhunga 0
Buyanja 2
Bwambara 1
Kebisoni 3
Nyakagyeme 2
Nyakishenyi 0
Nyarushanje 2
Ruhinda 1
Total 14
Source: District Production Department
Table 2.1.9.9: Number of veterinary doctors by sex
No of veterinary doctors
Male Female
2 0
Source: District Production Department

10
Table 2.1.9.10: Production and Marketing staffing analysis
Post title Scale No. of approved posts
No. of filled posts
No. of vacant posts
No. of filled posts by gender
M F
District Production and Marketing Officer U1E 1 1 0 1
Senior Agricultural Officer U3 1 1 0 1
Senior Veterinary Officer U3 1 1 1 1
Senior Fisheries Officer U3 1 0 1
Senior Commercial Officer U3 1 0 1
Senior Entomologist U3 1 0 1
Senior Agricultural Engineer U3 1 0 1
Vermin Control Officer U4 1 0 1
Entomologist U4 1 1 0
1
Commercial Officer U4 1 0 1
Fisheries Officer U4 1 1 0 1
Assistant Fisheries Development Officer U5 4 0 4
Laboratory Technician U5 1 0 1
Stenographer Secretary U5 1 0 1
Pool Stenographer U7 1 0 1
Office Attenadant U8 2 1 1 1
Driver U8 2 0 2
Veterinary Officer U4 9 9 0 9
Agricultural Officer U4 9 8 1 5 3
Assistant Agricultural Officer U5 9 0 9
Assistant Animal Husbandry Officer U5 9 0 9
Total
58 23 35 19 4
Post Structure In post Location
Males Females
District Production & Marketing officer 1 1 District head quarters
Principal Agricultural Officer 1 0 0 District head quarters
Principal Veterinary Officer 0 0 0 District head quarters
Principal Fisheries officer 0 0 0 District head quarters
Principal Commercial Officer 0 0 0 District head quarters
Principal Entomologist 0 0 0 District head quarters
Senior Agricultural Officer 1 1 District head quarters
Senior Veterinary Officer 1 1 0 District head quarters
District Fisheries Officer 1 1 0 District head quarters
District Entomologist 1 0 1 District head quarters
Commercial Officer 1 00 1 District head quarters
Office Typist 1 0 1 District head quarters
Office Attendant 1 0 1 District head quarters
Senior Accounts assistant 1 1 0 Production
Agricultural officers 9 5 3 Sub county
Assistant Animal husbandry officer 9 9 0 Sub county

11
Livestock production levels In the whole district, milk production is estimated at 4.01 million litres per annum. Hides and skins production is estimated at 1,391kgs, 41,329pieces of goatskins and 40,910 pieces of sheep skins per annum respectively.
Fisheries Number of Beach Management Units 1 No. Major diseases and predators Snakes (cobras) & Kingfisher Types of fish stocked in ponds Nile tilapia, African catfish
Table 2.1.9.11: Fish processing practices by volume
No. Fish processing practice Kgs processed weekly
1 Salting 8,700
2 Frying 410
3 Smoking 540
Source: February 2015 Report by Fisheries Officer
Table 2.1.9.12: Fish catch by species at Rweshama landing site
No. Fish species Catch (kgs) monthly Monthly value of catch (U. Shs)
1 Tilapia 24,158.3 150,989,375
2 Clarias 2,383.9 121,578,900
3 Bagrus 39,875.3 239,251,800
4 Protopterus 1,320.6 8,319,780
5 Barbus 1,227.6 2,209,680
6 Lung fish 28,523.9 159,733,840
Total 97,489.6 682,083,375
Source: February 2014 Report by Assistant Fisheries Officer
Table 2.1.9.13: Number of fish farmers by sex and location
Location (subcounty)
No of fish farmers Number of fish ponds
Males Females Stocked Unstocked
Bugangari 8 2 10 3
Buhunga 2 5
Buyanja 4 12
Bwambara 9 15 3
Kebisoni 11 13 3
Nyakagyeme 13 10 7
Nyarushanje 2 5
Ruhinda 1 5
Total 50 2 73 18
Source: Production and Marketing department
Commercial Services

12
Table 2.1.9.14: Agro processing facilities
Subcounty No of grain millers
Coffee processing facilities
Milk coolers
Bakeries Rice hullers
Buyanja 12 02 01 01
Kebisoni 06 03
Nyarushanje 18
Nyakishenyi 10 01
Nyakagyeme 10 01
Bugangari 12 01
Bwambara 19 13
Ruhinda 12 2
Buhunga 13 02 01
Total 112 12 02 01 13
Source: District Production Department
Table 2.1.9.15: Markets
Subcounty Market Location Grade Regularity
Bwambara Bikurungu Bikurungu Tc A Weekly
Rweshama Rweshama FU B Daily
Kikarara Kikarara Tc B Weekly
Bwambara Bwambara Tc C Daily
Nyarushanje Nyarushanje S/c Hqts A Bi-monthly
Bwanga Bwanga Tc B Weekly
Kisiizi Kisiizi Hospital B Daily
Rubabo Rubabo C Bi-monthly
Omwashande Omwashande Tc C Weekly
Kebisoni Kakinga Kebisoni Tc A Bi-monthly
Omukidiba Omukidiba Tc C Weekly
Bus stop road side Kebisoni Tc - Daily
Nyakishenyi Nyakishenyi S/c Hqts B Monthly
Bugangari Kashenyi Kashenyi Tc B Weekly
Bugangari Bugangari Tc B Weekly
Campbell Campbell Junction C Weekly
Buhunga Rwemburara Rwamburara C Bi monthly
Ruhinda Kashenyi Kashanyi Tc B Bi monthly
Rweshaka Rweshaka Tc B Bi monthly
Nyakagyeme Kiteme S/c Hqts B Bi monthly
Rwerere Rwerere Tc C Weekly
Buyanja Buyanja Buyanja Tc C Weekly
Nyakabungo Nyakabungo Tc C Weekly
Matooke-Buyanja Buyanja Tc - Daily
Source: Commercial Office Rukungiri
Table 2.1.9.16: Business units
Sub county Number
Bwambara 441
Ruhinda 286
Nyarushanje 119
Bugangari 237
Nyakishenyi 145
Kagunga 97
Buhunga 218
Nyakagyeme 381
Kebisoni 104
Total 2,180
Source: Commercial Office Rukungiri

13
Table 2.1.9.17: Registered cooperative societies
Type Number Active Semi-active Dormant
Coffee marketing 12 4 0 8
Tobacco marketing 5 0 4 1
SACCOs 24 10 5 9
Livestock: Diary 8 7 0 1
Livestock: Grazing 4 0 2 2
Multipurpose 2 1 0 1
Total 55 22 11 22
Source: District commercial office
Table 2.1.9.18: Agricultural Cooperatives
No
Name Type Reg.No.
Date location Products/ services
Performance
Identified problem
1 Rubabo Bariisa
livestock Grazing
3448 18-1-81 Nyarushanje S/C
No business
Battling with court case
Land case with the District not yet resolved since 1983
2 Rubabo Bajoki
Bee keeping
4141 29-10-82
Nyarushanje S/C
No business
In active Not traceable
3 Minera Bariisaa
Grazing 4393 14-3-83 Nyarushanje S/C
No business
Dormant Untraceable
4 Nyarwambu Grazing 5608 20-11-89
Nyurushanje S/C
Grazing Moderate Shared land for Grazing.
5 Kasheshe Farmers
Dairy 5924 18-5-93 Buyanja S/C No business
Moderate Not traceable
6 Mugamba Dairy 5960 16-8-93 Buhunga S/C
Zero Grazing
Active Membership mobilization training.
7 Ndago Kweterana
Grazing P.572 2-12-94 Nyarushanje S/C
Grazing Moderate Poor use of land no meetings
8 Buyanja Dairy Farmers
Dairy 6756 5-6-03 Buyanja S/C Milk Marketing
Active Few members No meetings.
9 Nyakagyeme Dairy 6756 8-7-03 Nyakagyeme S/C
Milk Marketing
Active Few members No. meeting
10 Bwanga Dairy 6808 4-8-03 Nyarushanje S/C
Milk Marketing
Active Few member No. meeting
11 Kebisoni Dairy 6809 4-8-03 Kebisoni S/C Milk Marketing
Active Few members No. meeting
12 Rujumbura Dairy 7286 23-3-05 R.M.C Milk Marketing
Active Few members.
13 Rukungiri Dairy Farmers C-Union ltd.
Milk marketing
7336 31-5-05 Whole Rukungiri district
Milk Marketing
Active Mobilization of member‟s i.e. member societies.
14 Rwakitojo Farming
Dairy 5942 11-6-93 Buyanja S/C No business
No business Not traceable.
15 Bugangari Coffee 1883 5-10-61 Bugangari S/C
Coffee marketing
No .business Members sensitization
16 Nyakishanje Coffee Marketing
1889 11-11-61
Nyakishenyi S/C
Coffee marketing
Coffee pulpery land leased and now wet
Mobilization of members

14
processing in progress.
17 Kigezi G.C.U ltd
Coffee marketing
1888 13-11-61
R.M.C Coffee marketing
Moderate Members training & mobilization
18 Nyakagyeme Coffee Marketing
1906 15-2-62 Nyakagyeme S/C
Coffee Marketing
Dormant Mobilization of members, No AGMs, Management problems
19 Kebisoni Coffee Marketing
1920 1-6-62 Kebisoni S/C Coffee Marketing
Dormant Membership mobilization
20 Buyanja Coffee Marketing
1921 Buyanja
Buyanja S/C Coffee marketing
Dormant Land case in court with the sub county
21 Kagunga Coffee Marketing
1922 1-6-62 R.M.C Coffee Marketing
Dormant Membership mobilization
22 Ruhinda Coffee Marketing
1923 1-6-62 Ruhinda S/C Coffee Marketing
Rents its store
Mobilization of members .
23 Nyarushanje Agric Marketing
1925 11-4-62 Nyarushanje S/C
Coffee Marketing
Dormant Membership mobilization.
29 Bwambara Agric marketing
2675 30-8-71 Bwambara S/C
Coffee marketing
No. business Membership mobilization
30 Rwengiri Agric marketing
3456 28-2-80 Bugangari S/C
Coffee marketing
Moderate Membership mobilization
31 Rwabigangura
Agric marketing
3788 27-1-82 Kebisoni S/C Coffee processing
No .business Sold all the property and shared
32 Buhunga Agric marketing
4205 25-11-82
Buhunga S/C
Coffee marketing
Dormant Few members
33 Buhunga farming
Agric marketing
4256 25-11-82
Buhunga S/C
Coffee processing
Moderate Very few members left
34 Kihanga kweterana
Agric marketing
4246 13-12-82
Buhunga S/C
Coffee processing
No business Sold all property and shared proceeds
35 Kakinga farmers
Agric marketing
4705 8-11-83 Kebisoni S/C Coffee processing
No . business
Mobilization prolonged court case
36 Butagatsi Agric marking
5032 24-8-84 R.M.C Coffee marking
No. business Member have destaprated while others have died
37 kitanda Agric marking
5380 25-2-88 Buyanja S/C Coffee marking
No. business Membership mobilization.
38 Nyabungado Agric marking
5362 16-12-87
Nyakagyeme S/C
Coffee marking
No . business Membership mobilization for collective marking
39 Kizahi Agric marking
5552 13-7-89 Bugangari S/C
Produce marking
Good Membership training changes in governance
40 Bwanda Agric 5599 31-10- Ruhinda s/c Coffee Dormant Membership

15
marking 89 marking mobilization
41 kanyinya Agric marking
5616 16-1-90 R.M.C Coffee marking
Dormant Membership mobilization
42 Kisiizi Coffee marking
5691 27-6-90 Nyarushanje S/C
Coffee marking
Dormant Mobilization
43 Kasoroza Coffee marking
5734 22-10-90
Nyakagyeme S/C
Coffee processing
Active Very few members
44 Rwemiringa Coffee marking
5780 27-3-91 Bugangari S/C
Coffee marking
Dormant Mobilization and sensitization
45 Kanyakwanzi Coffee marking
5788 14-5-91 Bwambara Coffee marking
Dormant Mobilization and sensitization
46 Kirimbe farmers
Produce 5824 19-9-91 Nyakishenyi Multi-purpose
Active Training
47 Twekare Coffee marking
5921 29-3-93 Bwambara S/C
Coffee marking
Dormant No traceable
48 Katobo rural Tree planting
6064 25-01-95
Nyakagyeme
Tree growing
Active Very few members
49 Bunono Coffee marking
p.594 11-7-95 Nyarushanje S/C
Coffee marking
Dormant Very few members
50 Kitazigurukwa Tree planting
9642 R.M.C Tree growing
Active Management of the land
51 Kiteme Produce processing
6165 24-10-96
Nyakagyeme S/C
Multi-purpose
Dormant Very few members no meetings
52 Rwakirungura farmers
Produce 6998 5-4-04 Buyanja Multi-purpose
Active Have not followed the bye laws depute the adduce
Source: District Commercial office

16
Table 2.1.9.19: Other Cooperatives
1 Kafunjo Tubehamwe
Multi-purpose
4381 10-3-83 Nyakagyeme Multi-purpose Dormant No meeting, no accounts and balance sheet.
2 Murama -Kafunjo
Multi-purpose
4438 12-3-83 Nyakageyeme Farming Moderate No meeting and Accounts Land use
3 Kiborongota Multi-purpose
4758 5-1-84 Kebisoni Savings coffee marketing
Dormant Very few members
4 Kabaranga Farming 4882 17-4-84 Nyakishenyi Farming Dormant No AGMs, No accounts, management problems
5 Karimbanyo Farming 4920 25-5-84 Nyakisheyi Deal in general produce
Active Land used by individual members
6 Rugango - Bakyala
Multi-purpose
6048 23-11-84 Buyanja Multipurpose No reports No meetings Membership training
7 Rukungiri transporters
Transport P.3072 20-3-2012
Rukungiri Municipal Council
Transport services tendering
Active Training on cooperative business
Source: District Commercial Office Agricultural projects
Table 2.1.9.20: Number of farmer groups
Subcounty No of farmer groups
Members with no disability Members with disability Total
Adult Youth Adult Youth
M F M F M F M F
Bugangari 159 896 1416 21 1 18 23 1 00 2403
Buhunga 70 965 134 76 8 13 16 8 00 1430
Buyanja 78 616 828 79 9 25 77 9 1698
Bwambara 58 507 624 10 0 2 3 0 1172
Kebisoni 69 399 587 147 0 74 77 0 1437
Nyakagyeme 62 520 636 21 5 63 7 5 1303
Nyakishenyi 148 1193 1753 65 1 0 0 1 3015
Nyarushanje 121 1541 2203 432 18 55 39 18 2984
Ruhinda 96 765 964 56 9 13 16 9 1840
Total 861 7402 9145 907 51 250 258 51 00 17282
Source: District NAADS Office

17
Table 2.1.9.21: Number of beneficiaries by project type and sex
Subcounty Enterprise Type of technology No of technologies established
Number of beneficiaries
Male Female
Bwambara G. Nuts High yielding varieties
136 59 77
Hoes 210 86 124
Irish potatoes seed
High yielding varieties
14 3 11
Beans High yielding varieties
31 6 25
Ruhinda Irish potatoes seed
High yielding varieties
172 55 117
Hoes 190 67 123
NPK fertilizer 150 41 109
Agrozeb 153 44 109
Rice High yielding varieties
42 25 17
Cassava cuttings
High yielding varieties
61 34 27
Source: District NAADS report Quarter 3 2013/2014 Challenges faced by the department
Food insecurity and low household incomes Fluctuating rain fall received resulted in poor performance of crops planted and animals Poor mechanical condition of the vehicle with minimal funds for maintenance Lack of facilitation for extension workers to execute their duties efficiently Animal and Crop pests and disease Low produce prices Laxity in enforcement of rules and regulations Expensive farm inputs including water harvesting and irrigation equipment.
2.1.10: INTERNAL AUDIT
Mandate: Section 90 of the Local Governments Act Cap 243, the Public Finance Management and Accountability Act 2015 section 48 The Local Government Financial and Accounting Regulations 2007 section 12 and the Internal Audit Manual 2007. Internal Audit involves continuous mentoring, inspection of departments, sub-counties, schools, health units to enhance financial discipline. It will also involve regular visits to local governments and other institutions to examine books of accounts and visit sites of projects under implementation. Ever since the decentralization policy started in 1993, the central government has continuously been committed to developing Local Governments through development programs such as LGMSD, PAF, and NAADS. All these programs have rules regulations and guidelines which must be complied with before accessing them. The internal audit function carries out audit procedures to verify compliance to the guidelines, regulations and laws, and then provide assurance to management by reporting the condition in a regular and timely manner. Management needs to be advised on the course of events on time so that necessary action is taken. Therefore there is need to report on those issues quarterly and when necessary.The Internal Audit function is to provide independent objective assurance and consultancy services designed to add value and improve the local government‟s operations so that it can accomplish its objectives by bringing a systematic, disciplined approach to evaluate and improve the effectiveness of risk management, control and governance processes.

18
Table 2.1.10.1: Staffing Position:
Established post No of positions Filled Vacant
Principal Internal Auditor 1 1 1
Senior Internal Auditor 1 - 1
Internal Auditor 1 1 -
Audit Assistants/EAAs 2 1 1
Office Typist 1 1 -
Driver 1 1 -
Table 2.1.10.2: Equipment under Internal Audit Unit.
Equipment No Condition
Motor vehicle 1 Not Road worthy
Motor cycles 2 Very old
Computer and accessories 2 Old
Printers 2 Old
Digital camera 1 Operational
Filing cabinet 1 Operational
Table 2.1.10.3: Budget and Financing Plan
Source of Funding Expenditure by quarters Shs (000’s) Total (000’s)
Q1 Q2 Q3 Q4
Unconditional grant
(non-wage)
4,000 4,000 4,000 4,000 16,000
PAF 744 744 744 744 2,977
Local revenue 2,000 2,000 2,000 2,000 8,000
Unconditional grant
(wage)
9,647 9,647 9,647 9,647 38,590
Total 16,391 16,391 16,391 16,391 65,567
Departmental Challenges
1. Inadequate funding 2. Lack of appropriate transport means; the vehicle used by the Department is too old and
susceptible to frequent break downs 3. Existence of out dated auditing systems 4. Lack of modern audit computer programs technical skills especially CAATS to audit
electronic systems such as IFMS and IPPF 5. Lack of adequate and modern office space 6. Constant budget cuts in Government grants 7. Increase in the areas to be audited District wide

19
2.2. Analysis of the state of crosscutting issues
2.4. Review of the previous performance (Achievements, Unfinished activities and Emerging needs
2.2.0 STAKEHOLDERS ANALYSIS
Local Government service delivery and development are comprehensive and needs efforts of stakeholders. Stakeholders are people who are affected by the impact of activities and those who can influence the impact of the activities in a given area and period. Stakeholder management is critical to the success of every project in an organization.
1.10.1 Rukungiri District local Government has the following stakeholders:
- Rukungiri District Local Community - NGOs, CBOs and FBOs - Political Leadership - Private sector - District public servants - Central Government - Donor community
Table 2.1.10.4: Efforts/ Roles of Different stakeholders
Stakeholders category
Roles/activities Remarks Intervention
Rukungiri District local community
-Participate as beneficiaries especially in operation and maintenance -Provide community contribution - Provide Co-funding
-Poor attitude towards co-funding and O&M - Poor attendances in the planning meetings
Mobilization and Sensitization
NGOs, CBOs and FBOs
-Funding and Implementation -Mobilization and advocacy
Supplements implementation and service delivery.
-Integrate their plans in the DDP -Enhance coordination of NGOs in the District - Monitoring their programs by the District is required.
Political Leadership
-Mobilization of the community -Approval of plans, policies and laws - Monitoring and evaluation.
Good leaders enhance development
Lobby for new projects/ stakeholders in the District
Private sector
Contracting works and services
-Promote Value for money
Supervision and monitoring of service providers by the district should be strengthened.
District public servants
Implementation -Supervision of service providers
Encourage efficiency and effectiveness in service delivery
Improve supervision
Central Government
Funding and support supervision
Inadequate funding from the centre disables the District development
-Increase funding -Timely transfer of funds
Donor community
Funding Few donors in the district.
Increase Funding

20
Table 2.1.10.5: Table 1. 48: Major NGO/FBOs operating in the District
Key Stakeholder Category Major Activities Area of Operation
Rukungiri Gender and Development Association (RUGADA)
NGO HIV/ AIDs activities/ services District wide
North Kigezi Diocese FBO -Management of Disabilities. Paying school fees for disabled children(PAPSAC) - Water Supply and Sanitation improvements (NKKD WATSAN) -Education services ( primary, secondary and Tertiary Institutions) -Health services ( Kisiizi Hospital, Rugarama and Other Health centres) - OVC Support (whole package)
District Wide
Compassion International (in partnership with Local churches in the District)
NGO Education support to OVCs
IGAs to OVC families
Psychosocial support
Medical care (children are taken to health centers)
HIV Counseling
MDD
District wide
TASO Uganda Ltd NGO HIV/AIDS services
Income generating activities amongst their clients
Scholastic support to children of TASO clients.
District wide
Kabale Diocese FBO Health services (Nyakibale Hospital and other Health centres)
Education services(primary, secondary and tertiary institutions)
OVC Support (whole package)
Micro finance ( several credit institutions)
District wide
Health related NGOs have contributed a lot in supplementing Government efforts to fighting mortality and mobility especially in combating malaria and HIV/AIDS in Rukungiri Credit goes to Nyakibale Hospital (Kabale Diocese) Kisiizi Hospital (North Kigezi Diocese), TASO and RUGADA in providing both care, support and treatment of HIV/AIDS and Malaria in the District. In the area of orphans and vulnerable children, the efforts of NGOs and FBOs can not be under established NGOs like Compassion International in partnership with local churches is supporting OVCs by paying school fees and offering social support to over 2,000 pupils/students in the District in both Primary and Secondary schools. There is a problem inadequate accessibility to Micro-Finance Services in the rural areas. On this note, Rukungiri District is grateful to the SACCOs that have come up in rural sub-counties and are offering credit to the population especially Rubabo, Nyarwanya, Rwerere, RUDECs, Rwenshaka to mention a few. The District is grateful to CBOs/NGOs operating in Rukungiri and their efforts in supplementing Government efforts and in serving communities. However, as seen above, there are few NGOs, FBOs and CBOs in the District. The District calls upon other development partners to work and collaborate with Rukungiri District Local in order achieve the district vision and mission. The biggest challenges are in the areas of Agro processing and marketing, Energy, Health, Education, Population and Natural resource management.

21
2.2: CROSS-CUTTING ISSUES
2.2.1: POVERTY ANALYSIS
2.2.1.1: Definition of Poverty:
The state of existing in amounts that are too small or lack. The inability to provide the basic necessities of life. The definition of Poverty embraces various aspects of the failure to defray the costs of a genuine human life, hunger, sub-standard housing, disease, inability to participate freely in the life of the community because of the accumulated burden of handicaps, exploitations/humiliations, abandonment of any ideas of a future, inability to build a future and in ability to build the future generally. In order to address poverty effectively, it is important to understand the nature and extent of the problem that affects the livelihood of the population. This section presents and characterizes the key development challenges and poverty issues, their causes and effects from the district view point. They are derived from the numerous studies conducted by the district in collaboration with UBOS and other agencies. It also derives from the numerous other reports available in the district.
2.2.1.2: Indicators of Poverty in the District and potential and actual problems that are leading people into poverty.
- High illiteracy levels -Poor academic performance - High disease incidence -Poor housing/accommodation - Food insecurity -Early marriage - Dependency -Low life expectancy - Poor hygiene and sanitation -High infant mortality
The general poverty situation in the District is not empirically defined but some indicators show that high levels of poverty still persist. This affects the level of community contribution to the development process in the entire District. However, there are diverging levels of poverty from sub-county to sub-county.
2.2.1.3: Basic Characteristics of the poor in Rukungiri District.
Have insufficient basic items such as food, shelter, technical and business skills. Depend on the bounty of nature Indulge in excessive Alcohol Consumption Lack of basic hygiene facilities Are essentially functionally illiterate Do not practice family planning methods Majority depend on casual labour for livelihood Have no savings and usually default paying taxes Have high incidence of communicable diseases.
2.2.1.4: Geographical poverty pockets and categories of poverty affected groups.
High poverty pockets are evident in the sub-counties of Nyakishenyi, Buhunga, Ruhinda and Bwambara though Bwambara sub-county is endowed with resources which if tapped would

22
significantly improve the situation. The most vulnerable poor include: widows, vulnerable children, PDWs, the fishermen and the Banyabutumbi. The causes of poverty in the District include diseases especially malaria and HIV/AIDS, Land shortage, high illiteracy levels, ignorance, inadequate credit facilities and exhausted soils which cause dwindling yields year after year. Basing on the selected indicators of poverty in the District, it is clear that the most affected areas and groups exist in the poverty pockets below in the table.
Table 2.2.1: Analysis of Poverty Pockets.
Poverty pockets (sub-counties)
Common characteristics
Causes Effects Strategies to reduce the poverty issues
Nyakishenyi Ruhinda Buhunga Kagunga Bwambara (especially the Banyabutumbi in Kikarara Parish and Rweshama Fishing Village)
Loss of Soil fertility
Poor productivity of land and Human Resource
Concurrent food shortage over the years
High incidences of morbidity
Very low incomes
Poorly accessed by transport communication and facilities
Inadequate basic infrastructure.
Soil and environmental degradation
Population pressure
Fragmented land
Low participation of men in production activities.
Low incomes to household level
Low agriculture productivity
Illiteracy Poor
leadership Ignorance Poor
farming methods
Infections e.g. malaria, HIV/AIDS, Diarrhea etc.
Poor infrastructure
Idleness/ drunkardness
School dropouts.
Poor revenue collection.
Stunted growth among children.
High incidence of diseases.
Inadequate service delivery.
Low agricultural productivity.
Inaccessibility to essential services.
High infant mortality rate and stunted growth.
High morbidity and mortality.
Poor performance of school children.
Increased number of school dropouts.
High illiteracy rate.
Increased poverty.
Lack of employment.
Poor feeding.
Equip peasant with farming skills to the people.
Encourage family planning.
Community mobilization and sensitization.
Construction of roads.
Introduce IGAs. Improve health
services delivery.
Home improvement campaigns.
Emphasis of life skills education.
Improve revenue.
Extension services to communities.
Promote functional adult literacy.
Support UPE Provision of
income generating projects.
The table only gives the geographical poverty pockets but there are poverty categories in the District like orphans, widows, people who are terminally sick like people living with HIV/AIDS. It should be noted that, most of the above characteristics affect all sub-counties as poverty though at different levels.

23
2.2.1.5 Poverty trends for the last five years
This section provides an overview of recent developments in poverty in the district and patterns across different groups. The proportion of the population whose expenditures are below the poverty line.
Table 2.2.2: Rukungiri Rural Poverty rates by county and sub-county 2005
Regional/District/County/Sub-county
Individual Headcount Index (%of individuals below poverty line)
Estimated No. of pIndividuals 2005
Estimated No. of individuals
Rukungiri district 28.06 7,939 267,067
Rubabo county 13.27 16,324 123,018
Nyarushanje 13.29 4,963 37,346
Nyakishenyi 16.73 4,915 29,376
Buyanja 12.37 4,002 32,355
Kebisoni 10.21 2,444 23,941
Rujumbura county 14.99 21,832 145,646
Bugangari 17.7 4,666 26,362
Buhunga 17.18 3,661 21,309
Bwambara 16.8 4,366 25,987
Nyakagyeme 11.9 1,459 32,052
Ruhinda 16.03 3,814 23,796
Source: UBOS-Uganda Rural Poverty rates2005 The rate is approximately between 31%-38%. This section also provides an overview of recent developments in poverty in the district and patterns across different groups. The proportion of the population whose expenditures are below the poverty line is approximately between 20% -30% as per statistics from UBOS 2008, in the national Development Plan. The poverty levels are significantly reducing as the District strives to mitigate the causes of poverty and thus the resultant effect is improved quality of life of the population in the District. The table below indicates, using certain indicators the trends in poverty in the district over the last 5 years.
Table 2.2.3: Poverty Trends for the last 5 years. (Some Indicators)
Year P.L.E First Grade (%)
P.L.E Pass rate (%)
OPD Attendances (Patients)
2011 12.0 97.2 437,000
2012 16.7 98.8 513647
2013 13.0 97.7 519318
2014 14.6 97.7 507259
From the table, there has been an improvement in the pass rate at PLE, since 2010 which is over 95% in all the years, with first grades ranging from 12% in 2011 which is the lowest to the highest of 16.7% in 2012.

24
The ways in which people earn incomes are changing, through participation in NAADS/Wealth Creation and other Programmes. Households are moving out of relying solely or mainly on crop growing into non-agricultural enterprises which has led to increase in income and reduction in income inequalities in the District. In regards to human development, recent years have seen major improvements in education and literacy. The Health attendances dropped implying an improvement in health services evidenced by reductions in attendances from 519318 in 2005 to 507259 in 2014, though HIV/AIDS remains among the cause of death within the most productive age ranges of 15-49, action is required to reverse these trends, and mitigate the impact of HIV/AIDS.
Table 2.2.4: Actions undertaken and proposed by sectors and LLGs to reduce poverty
Sector Poverty Concern/Issues Actions Undertaken Proposed Actions
Management Inadequate capacity for the various stakeholders.
Developing skills of LLGs, district, and other stakeholders through training.
Build capacity of District Officials and other stakeholders to facilitate service delivery.
Low incomes among the population.
Award of contracts to prospective local contractors for goods, services and works.
Award of contracts to prospective local contractors.
Trained leaders of women, youth, and PWDs in project proposal writing and management of IGAs
Training in business skills and entrepreneurship.
Finance Low local Revenue Mobilization and sensitization of stakeholders on new revenues and their roles.
Revenue enhancement for increased local revenues.
Production - Food insecurity in the District - Low incomes of Agricultural Farmers.
- Promote famine crops like cassava - Provision of high quality inputs to increase productivity of crops and hence profits. - Training of farmers on crop pests and diseases. - Provision of Advisory and Technology Development Services - Livestock Improvement.
- Access to high quality inputs - Control of animal and crop pests and diseases. - improved storage infrastructure - Provision of high quality inputs to increase productivity of crops and hence profits. - Training of farmers on crop pests and diseases. - Provision of Advisory and Technology Development Services - Livestock Improvement.
Works and Technical Services
- Inaccessibility to markets. - Poor Hygiene and sanitation - inadequate transport and communication facilities. - Unplanned urbanization
- Opening up new roads. - Routine maintenance of the existing roads. - Construction of safe water systems. - Sensitization of communities on O&M and ownership of facilities.
- Opening up new roads. - Routine maintenance of the existing roads. - Construction of safe water systems. - Sensitization of communities on O&M and ownership of facilities.
Education and Sports
- High illiteracy levels - High school dropouts.
- Mainstreaming education policies. - Improved infrastructure. - Implementation of UPE and USE. - Purchase of instructional materials to reduce the burden of poor parents. - Payment of capitation grants to schools. - Construction of pit latrines.
Mainstreaming education policies. - Improved infrastructure. - Implementation of UPE and USE. - Purchase of instructional materials to reduce the burden of poor parents. - Payment of capitation grants to schools. - Construction of pit latrines.

25
- Senisitisation of education stakeholders. - Support suspervision and inspection of schools.
- Senisitisation of education stakeholders. - Support suspervision and inspection of schools.
Health Department
- High disease incidence/high level of diseases. - Dependency - Poor Hygiene and sanitation. - Inadequate medical care.
- Improving of health infrastructure. - Construction and completion of Health centres. - Control of HIV/AIDS, STI and TB. Delivery of the minimum Health Care package.
- Improving of health infrastructure. - Construction and completion of Health centres. - Control of HIV/AIDS, STI and TB. Delivery of the minimum Health Care package
Community Based Services
- Early marriages - Unemployed
youth. - High illiteracy
levels.
- Implementation of the prgrammes that holistically empower OVC
- Supporting Youth and
PWDs groups with start –up capital
- Implementation of the Functional Adult Literacy programe
- Training Women, Youth and PWDs in IGAs.
- Implementation of the prgrammes that holistically empower OVC
- Supporting Youth and
PWDs groups with start –up capital
- Implementation of the Functional Adult Literacy programe
- Training Women, Youth and PWDs in IGAs.
Natural Resources department
- Unsustainable utilization of Natural Resources.
- Low farm incomes.
- Food insecurity. - Reduced forest
cover. - Land
fragmentation - Lack of land titles. - Loss of soil
facility. - Reduced water
sources. - Siltation of water
bodies.
- Sustainable wetlands utilization and management.
- Tree planting campaigns to protect the water catchments.
- Area and agro-forestry.
- Soil and water conservation.
- Farm income enhancement and forestry conservation.
- Sustainable wetlands utilization and management.
- Tree planting campaigns to protect the water catchments.
- Area and agro-forestry.
- Soil and water conservation.
- Farm income enhancement and forestry conservation.
District Planning Unit
- Inadequate Development Planning in LLGs and the Population.
- Mainstreaming of cross cutting issues in all Development processes. - Strengthening vital registration.
- Mainstreaming of cross cutting issues in all Development processes. - Strengthening vital registration.
2.2.1.6: Interventions/Strategies to Address Poverty.
Though poverty is still rampant in the poverty areas/pockets, elsewhere in the District there is an indication of a positive change out of poverty as a result of different strategic interventions put in place.
This is manifested by rapid growth of urban centres like Rukungiri Municipal Council, Buyanja, Kisiizi, Kebisoni, Bikurungu town boards and many others in the country side whose number of buildings, shops, bars and agriculture processing plants have increased.

26
Beside the number of markets in the District has increased for instance the establishment of new markets of Buhunga, Kiteeme and Kikarara which show, improvement in marketing of increased commodities.
Social services in the District have improved through a number of projects vis:- construction of classrooms, staff houses, water and sanitation facilities, health centres, TASO, NAADS and Compassion activities. Functional Adult Literacy has increased the level of literacy among the population. Primary Health Care services, the fight against malaria and HIV/AIDS have gone along way to mitigate the poverty problems.
Agricultural production has increased coupled with the stocking of fish ponds and minor lakes like Kimbugu and Garubunda. Rice production has intensified in Bwambara, Bugangari and Ruhinda the hither to poverty pockets and is bringing income to the people, hence a movement out of the absolute poverty situation. Other high value crops like Molinga, Vanilla, Horticultural crops have been introduced. Improved crop varieties like Bananas, Cassava, Fruits, Sweet potatoes, Vegetables are being grown. Livestock husbandry has improved through increased pigs, introduction of new breeds of poultry and goats through PAF, LGDP, LGMSD and NAADS funded activities.
Mainstreaming of cross-cutting issues of gender, environment and HIV/AIDS in all the development process will go a long way in alleviating poverty in the District.
2.2.2: GENDER ANALYSIS
The Uganda Gender Policy (2007) recognizes “Gender” as a development concept and also recognizes that sustainable development necessitates maximum and equal participation of both gender (males and females) in economic, political, civil and social-cultural development. In this district, workload, access to and control of resources is still skewed in favour of men. Women do bulk of work but men control most of the fruits of production.
2.2.2.1: DIVISION OF LABOUR AT HOUSEHOLD LEVEL IN PRODUCTION SECTOR
During June 2009, data was collected from 50 households in 5 rural subcounties of Rukungiri District in order to determine division of labour in the production sector at household level. Six major crops grown in the District were considered. The findings are presented in the table below:
Table 2.2.2.1: Participatory Division of Labour at Household Level in Rukungiri
Crop variety Participation
Planting, weeding & harvesting Selling
Sweet Potatoes Women 50 Women 34
Men 16 Men 11
Maize Women 50 Women 33
Men 26 Men 27
Beans Women 50 Women 27
Men 24 Men 22
Bananas Women 50 Women 12
Men 44 Men 28
Millet Women 48 Women 27
Men 17 Men 16
Coffee Women 11 Women 11
Men 40 Men 40
Source: Community based department survey results June 2012

27
It is only in respect of coffee that more men than women participated in planting, weeding & harvesting. For the rest of the crops more women than men participated. When it came to selling; more men than women participated in respect of two crops which bring in the biggest income i.e. bananas and coffee. This partly has got to do with control and ownership of land which is analyzed below.
2.2.3: GENDER ANALYSIS IN TERMS OF RESOURCES ACCESS, CONTROL AND OWENERSHIP
The data below was collected from 50 household in 5 rural sub counties of Rukungiri District during the period early – mid June 2009.
Table 2.2.2.2: Resource control, access and ownership
Resources Access Control Owenership
Men Women Men Women Men Women
Land 50 43 48 22 48 10
Livestock 47 33 44 25 45 9
Radio 45 45 45 25 45 10
Source: Community based department survey results June 2009 As presented in the above table; men have more access to land and livestock than women, men and women have equal access to radio. More men than women have more control over land, livestock and radio. More men than women own land, livestock and radio. More men than women own the strategic assets of land, livestock, and radio (Information). Fortunately, as already seen above, men and women have equal access to radio. Radio and other strategies should therefore be used to sensitize the community that both men and women should strive to own the strategic assets of land, livestock and radio so that they can invest, produce and make money and become equal partners in prosperity for all.
2.2.2.3: Membership by gender in saving and credit cooperative organisations (SACCO’s) in Rukungiri district as at 30th April 2010 (Individual membership)
Table 2.2.2:3: Membership of SACCOs by gender
Subcounty Male % Female % Total
Bwambara 2041 68 953 32 2994
Bugangari 2489 67 1213 32 3702
Nyakagyeme 2342 65 1287 35 3629
Ruhinda 1361 57 1042 43 2403
Buhunga 1060 60 695 40 1755
Western 2292 64 1250 35 3542
Buyanja 1456 49 1517 51 2973
Kebisoni 1440 58 1024 42 2464
Nyarushanje 2720 73 966 26 3686
Nyakishenyi 482 74 171 26 653
Total 17683 63 10118 36 27,801
Source: District Commercial Officer Rukungiri District 2014

28
Figure 2.2.2.1: Membership of SACCOs by gender
As can be seen from the table and graph above, there is less participation in SACCOS by women compared to men. Female membership is at 36%. However, women in Buyanja sub-county must be commended for participating at more or less the same level as men in terms of membership. Buyanja with a very vibrant SACCO initially founded by mostly women has a women proportion of only 28%
It is rather depressing to note that:
Nyarushanje sub-county which has the oldest and biggest SACCO in the District (Rubabo Peoples SACCO) has the lowest proportion of female membership at 26% just like Nyakishenyi.
Nyakishenyi is not very vibrant SACCO, it has a women proportion of only 26% and least membership of 653
2.2.2.4: Main causes of poor female membership of SACCOS
1. People not having sufficient trust in SACCOs to keep their money safely and securely.-
reports of mismanagement in a number of SACCOs is not good attraction to people to
join.
2. Cumbersome procedures for opening accounts- for example in the typical rural African
setting, a woman does not have extra time to move to studios to have photos taken, the
go back to pick the later –the woman‟s daily activity schedule does not permit this.
3. Women who are illiterate consider banking a business of the literate, and do not want to
bother themselves with documents which they are unable to read, write or comprehend.
4. The traditional mentality that it is men who should handle issues to do with money
2.2.2.5: Possible remedies
1. Improving management of SACCOs so as to raise the confidence of the population
2. SACCOs should go to the people instead of waiting for people to go to them. Accounts
can be opened at places of public assembly like at churches after service and photos
can be taken at the places instead of people moving to studios.

29
3. SACCO management must popularize the business through promotional activities and
community sensitization Women should be reassured that they are eligible to use
SACCOS regardless of their literacy status
Table 2.2.2:4: Senior District Workforce Distribution by Gender
Category M F
Chief Administrative Officer and Assistant Chief Administrative Officers 4 0
Heads of Departments 7 0
Subcounty chiefs (Senior Assistant Secretaries) 7 2
Source: Human Resource Department, April 2015 As can be seen from the table above decision making positions in the District Public Service are dominated by men which may result in lack of attention to Gender mainstreaming in Government Departments.
2.2.2.5 DEPARTMENTAL GENDER ANALYTICAL MATRIX
During the participatory planning and gender consultations, stakeholders identified various sectoral gender issues, outlined below by sectors, along with the development concerns and strategies to mitigate the gender issues as shown in the table below.
Table 2.2.2.5: Table 2.40: Gender Analytical Matrix
Sector Gender issue Development concern Strategies
Management support services
More males than female staff are employed in the public sector.
-Less participation of women in decision making. -Potentials and skills of qualified Women are not utilized -Role models for women are missed out.
Career development for female employees should be promoted.
Finance -Abolition of G.Tax has led to many tax payers (men) being redundant and have resorted to drinking alchol
-Low revenue collection. -Males selling their spouses produce to drink.
-Mobilization, sensitization of the population on the effects of alcoholism. -Diversifying sources of income.
Production and marketing
Limited participation of women in Government initiated production programmes like SACCOs.
- Less production - Less family incomes
- Support both men and women to benefit from Government Programmes (Sensitization)
Community based services
Women overworked in agricultural activities. .
- Reducing opportunity available to men for adopting programmes and earning income therefore reduce their capacity to contribute to Development
- Gender Awareness training for both men and women
Child labour in respect of boys Drop out of school before any skills for life
Enforcement of legislation against child labour
Violence against women - Family break down - death - Child neglect hence under development
- Education - Sensitization - Enforce the law.
Illiteracy especially among women
Limited capacity of may women to comprehend or undertake development initiatives
Implementation of the Funcional Adult literacy programme
Works and technical services
Most District Contracts are taken by men (Women-11 contracts, Men-52 contracts in 2009/10 FY under routine road
Less income available to women and therefore less affordability of necessities for better standard of living.
-Sensitization of the community. -Affirmative action in favour of women while awarding contracts. -Women should be encouraged to

30
maintenance)
apply.
Education and sports
- Inadequate sanitation facilities for the girl child in schools. - Senior Women Teachers do not have adequate knowledge on counseling requirements of the girl child. - There are not enough Senior women teachers
- Contributes to absenteeism and drop out of the girl child. - Girls not adequately guided and counseled.
- Provision of sanitation facilities in schools. - Training of Senior Women Teachers.
- Child labour in respect for boys
Boys dropping out of schools before acquiring any life supporting skills
Enforcement of legislative against child labour.
Violence against women Family break down, death and child neglect hence under development.
Natural resources
- Women degrading the environment through soil burning and poor farming methods - depletion of vegetation cover due to use of wood fuel
Soil deterioration and less productivity, less food and lower incomes.
-Community sensitization. -use of alternative sources of energy -Tree planting
Health services
- Men not showing interest in family planning.
Inappropriate family size, poor maternal health and poverty
Sensitization of males on family planning.
2.2.3: HIV/AIDS ANALYSIS
HIV/AIDS is one of the top causes of morbidity and mortality in the district thus impacting on the poverty levels. The number of orphans, widows and widowers has increased because of HIV/AIDS. The amount of time lost during funerals, looking after the terminally sick, expenditure on medication etc. lead to an increase in the number of people becoming poor in the district. Potential for reducing the risk of HIV/AIDS
Scaling up of HCT services to HCs II.
Health workers trained in HCT and PMTCT.
Global fund and UAC support to HIV/AIDS activities in the district.
Scaling up ART services to lower government Health centres IV.
Committed NGOs, CBOs and FBOs in the district.
Mainstreamed HIV/AIDS activities.
Implementation of HIV/AIDS Policy at work place.
2.2.3.1: Drivers of the HIV/AIDS Pandemic.
1. Individual behaviours influencing risk of sexual transmission. 2. Discordance with partner. 3. Occupations associated with greater risk of transmission e.g fishing activity at lake Edward
at Rwenshama and bar attendants. 4. Changing role of the family, cultural obligations and practices, age at first marriage. Age
difference with partner. 5. Medical and biological factors associated with transmission risk. 6. Human Tapuloma Virus (HTV) STI, Ulcers. 7. Geographical locations associated with greater risk of transmission e.g IDPs. 8. Nutrition – food insecurity.

31
The District in an attempt to mitigate these effects of HIV/AIDS has come up with an HIV/AIDS strategic plan with support from Global Fund.
2.2.3.2: Key Funding Agencies:
MOH
Rukungiri District Local Government
TASO-Rukungiri
NGO Hospitals
Community
Global Fund
Germany Leprosy/TB Relief Association (GLTLA)
International HIV/AIDS Alliance
Uganda AIDS Commission (UAC)

32
2.2.3.3: HIV/AIDS mainstreaming in the District Development Plan.
Table 2.2.3.1: Departmental actions undertaken and planned for HIV/AIDS
Department Actions undertaken Actions planned
Management -Redeployment near health services and homes -Provide sick leaves and off for medication and care -Dissemination of HIV/AIDS policy
-Cascade the HIV/AIDS policy to LLGs -Training in employee counseling and management of HIV/Aids at the work place.
Community Based Services -Sensitize on HIV/AIDS in FAL program -Training in Life skills involves HIV/AIDS prevention
-To continue with the mentioned activities.
Production - Home gardening lessons to HIV/AIDS affected homes
Food security and Nutrition education.
Natural Resources -Sensitizing environment committees on HIV/IDS -Promotion of tree nursery management among the victims -Proper waste disposal to keep hygiene - Training communities in wetland laws - More co-ordination with LLGs - Formation of watershed committees - Enforcement of wetland laws and policies. - Inspection and monitoring wetlands - Compilation of up-to-date wetlands data - Ensuring compliance to standards - Reviewing of all project E.I.A reports - Close monitoring of resources - Sensitizations on environment issues - Ensuring the implementation of mitigation measures
-More activities related to environment management - Routine Inspections - More trainings - Compliance ensurance - More enforcements - Routine Inspections - More sensitizations - Integration into DDP & BoQs
Technical services Supply of safe and clean water and sanitation facilities to reduce water and sanitation diseases/ optimistic diseases. Sensitization of water user committees on HIV/AIDS
Education -PIASCY programs in schools -Peer educators -Training teachers in counseling -Organising MDDs on HIV/AIDS
Continue the mentioned activities.
Health Training of Health workers in HCT, PMTCT and STI Management. -Scaling up of HCT and PMTCT services to HC IIIs -Scaling up ART services to cover all HCs IIIs. -Distribution of medicines, condoms and other supplies to lower H/Units. -Organising Radio talk shows on HIV/AIDS, TB. -Distribution of HIV test kits to lower H/Units. -Distribution of IEC materials. -Film/Video shows on HIV/AIDS/TB. -Organising MDDS on HIV/AIDS/TB. -Review HIV/AIDS performance with District leaders.
-Training of newly recruited staff -Holding refresher courses for Health workers. -Monitoring and provision of support supervision services to all sites providing the services. -Distribution of medicines and other supplies on quarterly basis. -Supply HIV test kits to lower H/Units. -Organise Radio talkshows on VOD. -Dissemination of messages on HIV/AIDS/TB through music, Dance and Drama. -Film/Video shows on HIV/AIDS/TB. -IEC materials distribution -Establishment of nutrition Demonstration gardens at Health Units

33
Observations/Comments: - Treatment success rate (TSR) – 84% - Case Detection Rate 71% - Cure Rate 66%
Table 2.2.3.2: PMTCT.
Years 2012/2013 2013/2014 2014/2015
ANC new att. 14943 13110 13127
No. Counseled for HIV. 12981 12781 12797
No. Tested. 12981 12781 12979
No. on ARVs. 674 403 422
Source: HMIS report 2012-2015
Table 2.2.3.4: Lab Capacity:
Years 2012/2013 2013/2014 2014/2015
HIV testing 43092 62208 79084
TB Sputum Microscopy
1684 1792 2408
Syphilis testing 5303 2747 3318
Malaria slide 27233 33557 32545
Source: District HMIS Reports
2.2.3.4: Challenges facing the delivery of HIV/AIDS services in Rukungiri District include the following:
The increasing number of orphans.
Limited HIV/AIDS testing kits.
Laboratory facilities not well established and facilitated
Limited access to ant-retriviral drugs.
Stigma amongst victims
Increasing number of rape and defilement
Most women are not yet empowered to say “NO” to unprotected sex
Treatment of opportunistic infections is expensive
Condom distribution channels not convenient for certain groups especially youths.
Under funding.
ARV, HCT, PMTCT Coverage still low.
Inadequate transport.
Poor male involvement.
Low TB case detection rate and CB-dots coverage.
Orphan care inadequate. Recommendations:
Improve funding.
Expanding of ART, HCT and PMTCT coverage.
Community mobilization.
More support for orphans.
Transport for DHAC.
District to continue lobbying for HIV funding.
Male medical circumcision

34
The plan highlights the following core services and activities to address the above effects and challenges, as shown in table below.
Table 2.2.3.5: HIV/AIDS Core Services and Activities
Cores services Key activities Key implementers Target group
VCT/HCT -Training/Operation - Procurement - Counseling & testing - IEC
HCs Nyakibale Hospital Kisiizi Hospital MOH
MO, CO, Nurses, M/W, Lab. Staff, Community
PMTCT -Training - Procurement - Treatment - Counselling & testing - Feeding
DLG MOH Nyakibale Hospital Kisiizi Hospital H/Centres (4,3)
HIV+ Pregnant women and infants
OI Management - Training - Procurement - Distribution - Clinical mgt
DLG TASO MOH HSD HCs
AIDS patients
STI management - Training - Procurement - Distribution - Clinical mgt
DLG TASO MOH HSD HCs
STI patients
Laboratory capacity - Training - Procurement - Distribution
DLG TASO MOH HSD HCs
HSD, HC IV, HC III Lab. Staff
Community and home based care
- Training - Procurement - Distribution - Home visiting - Patient care
DLG MOH HSD All HCs NGOs, FBOs, CBOs TASO
AIDS patients and their families
TB management - Training - Procurement - Distribution - Counseling & testing - CB-dots
DLG MOH GLRA HSD All HCs TASO
TB patients
OVC Programmes (orphans Vulnerable Children)
- Provision of Scholastic materials - School dues - Clothing - Feeding - Counseling IGAs - IEC
DLG, NGOs, CBOs, FBOs, TASO
Orphans and vulnerable children
Adolescent Programmes
- Training - AFHS - Procurement - School Health Services - Recreation centres - Resource centre
DLG NGOs, FBOs CBOs
Adolescents in and out of school
ARVs - Training. - Procurement - Distribution - Patient Care
DLG Hospitals HCIVs TASO MOH
AIDS Patients

35
2.8 FAMILY PLANNING ANALYSIS
2.8.1 Family planning analysis
Current situation analysis of family planning: Coverage of family planning among women of reproductive age is estimated at 42% (contraceptive prevalence rate) for the whole district. A community Survey Lot Quality Assuarance Sampling put the coverage of district at 41% in 2013. According to the survey, factors affecting family planning are education status, religion and tribe.The most preferred method of family planning is injectable Depo provera.
2.8.2. Challenges/constraints in family planning:
There are frequent stock outs of family planning methods in the health facilities especially the injectable methods which in fact are the most preferred methods
There is low male involvement in family planning. Some men are indeed opposed to family planning practice by their spouses. Uptake of male methods of family planning is minimal.
Some health facilities belong to religious denominations that are opposed to modern family planning methods which limits access to these services to the communities.
Long term permanent methods of family planning can only be administered at the two hospitals of Nyakibale and Kisiizi because there are no qualified staff at the health centre IVs to render this service. However, the services at the hospitals are not free. This therefore limits access of these services to the community.
2.8.3 Interventions/strategies to address family planning issues:
Health education has been ongoing to encourage the population to take up family planning and also to counter the negative beliefs and attitudes towards family planning. Health workers have continuously been trained and updated on family planning.
2.8.4 Stake holders/implementers of family planning in the District.
The key stakeholders in family planning in the district are Government through the network of government health centres, the private not for profit health facilities under the churchs, community based organizations such as Rukungiri Women Development Company (RWODEC) and Burombe community development organization, the private sector through private clinics, drug shops and private maternity centres
2.9 ENVIRONMENTAL ANALYSIS
This section deals with an analysis of the environment and integration of district environment action plans. It also deals with the environment opportunities available in the district, the challenges and constraints, and gives a suggestion to strategies that can deliver environmental sustainability.

36
Table 2.9.1: Environmental situation Analysis
Environmental challenges and Issues
Location Causes Impacts Intervention
Soil erosion District - wide -Poor farming methods -Land fragmentation
- Reduced crop yield - Gulleys
Application of Soil and water management technologies
Over fishing Bwambara Sub County and from Bugangari Sub County wetlands
Lack of alternative sources of fish.
-Inadequate fish supply in the district.
Encouraging fish farming& sustainable fishing
Tree cover loss District wide Deforestation to provide for fuel wood and timber
Lack of affordable alternative sources of energy
Increased tree planting
Conflict with problem animals
Bwambara and Ruhinda Sub Counties
Neighbourness of communities with protected area
-Crop damage -Livestock loss -Loss of lives
-Implementation of problem animal management technologies -Revenue sharing
Bush / soil burning District - wide -Need for new pasture -Errant individuals -Preparation for cultivation
-Loss of biodiversity -Soil erosion -Loss of soil fertility
-Implementation of relevant laws -Soil fertility enhancement technologies
Wetland degradation District - wide -Lack of adequate land -Over harvesting of resources
-Loss of surface water -Climate deterioration -Loss of biodiversity.
-Wetlands restoration -Enforcement of wetland laws -Sensitization of communities
Soil fertility loss District - wide -Poor farming methods -Over stocking -Land fragmentation
-Reduced crop yield -Famine -Less income
Application of Soil and water management technologies
Deforestation District - wide -Timber -Creation of farm lands -Fuel wood demand
-Loss of biodiversity -Soil erosion -Loss of soil fertility
-Re-forestation of deforested areas -Sensitization on tree planting
Over grazing In all Sub Counties except Bwambara
-Over-stocking -Loss of biodiversity -Soil erosion -Loss of soil fertility -Degradation of soil structure
-Sensitization on carrying capacity -Implementation of carrying capacity laws
Water pollution /lack of clean water
District – wide but mostly in Town council
-Un compliant developers -Non-protection of water sources and points
-Water-borne diseases
-Protection of water points -Being compliant with water standards
Poor sanitation/poor refuse disposal
In most townships across the district
-Inadequate refuse / waste bankers -Poor culture on waste generation
-Sanitation-related diseases
-Increase in sanitation facilities
Air and noise pollution
In most townships across the district but most in Town council
-Discos -Vehicles -Industries
-Pollution stress -Pollution – related diseases
-Pollution management techniques such as silencers, mufflers, etc.
Source: Natural Resources Department, 2010.

37
Table 2.9.2: Summary of Parish implementation plans of Rukungiri District
PIP from SEAP S/Counties affected
Causes Desired Situation
Soil Erosion 11 Bush burning Overstocking Soil, clay and murram extraction Cultivation of river banks Deforestation Road construction Permanent animal tracks Over-cultivation
Increased yields and vegetation cover all year round
Loss of tree cover 10 Charcoal burning Pit sawing Extraction for building poles
Sustainable utilization of trees and forest products.
Bush/Soil Burning 10 Traditional practices Search for fresh pastures Clearance by hunters Poor law enforcement
Soil burning stopped and natural vegetation regenerating
Loss of soil Fertility
10 Over-cultivation Mono-cropping Leaching Overgrazing Population pressure Bush and soil burning Poor farming practices
Practicing of sound soil and water conservation for enhanced soil fertility.
Overgrazing 8 Overstocking Land shortage
Observation of carrying capacity of different lands for livestock.
Poor Sanitation/Refuse Disposal
11 Unstable soil structure Poor latrine coverage Ignorance Poor waste disposal Laxity in law enforcement Lack of alternative and affordable materials.
Proper waste management for a clean and healthy environment
Air and Noise pollution
1 Poor physical planning Dust from factories Noise from factories
Noise generation should be in accordance with the allowed levels.
Water pollution/Lack of Clean Water
10 Contamination by feacal matter siltation Poor water sources maintenance Mis-use of agrochemicals Washing and bathing in water bodies Car washing
Healthy population in clean settlements having adequate clean water sources and sufficient latrine coverage
Deforestation
8 Charcoal burning Shortage of agricultural land Extraction for building poles Fire for domestic use Tobacco curing
Forests with closed canopy, rich in plant, animal life and habitat
Wetland Degradation
9 Brick making cultivation Over-harvesting resources Effluent Overgrazing Burning
Restored wetland with raised water levels, rich in plant and animal live
Conflict with PA/Problem Animals
3 Poor PA management Search for food Encroachment on Pas Ignorance on park policies Negligent farmers Poaching
Protected national parks and wildlife reserves with increased number of animals and plant species and variety of habitats.
Over-fishing 1 Illegal fishing gear Unlicensed fishermen Outdated laws
Lakes and rivers with plenty of fish.
Source: Natural resourcesdepartment

38
2.9.1 Environmental Opportunities
There are still a number of environmental resources which can be developed for environmental development. For example, there are a number of waterfalls which can be developed into tourist centers. From here, revenues can be generated for environmental conservation.
The presence of hot springs is a blessing to the district. Most of these springs are in areas that can be developed for ecotourism purposes. Through that, revenues for environment management can be created and at the same time adding value to nature.
There a number of places with enough water in the district that can be used for fish farming. This would reduce on the burden of over fishing from the few lakes and other small water bodies in the district.
The presence of unsettled areas in most of the hilly sub counties makes it more applicable for tree planting and other conservation activities. Tree planting would improve on the micro climate of an area and also improve on the environmental status of the district
2.9.2 Environmental challenges / constraints
There is still poor and inadequate funding for environment management activities
There is population increase hence increased pressure on environmental resources
Some resources such as wetlands seem to belong to everybody or nobody thus rendering them prone to over exploitation.
Some community individuals are still adamant and pay no respect to natural resources
There is poor enforcement of environmental laws and policies
Conservationists are still envisaged by communities as saboteurs and anti-development especially when they are ensuring environmental compliance
Poverty is on the increase and people are resorting to natural resources as the only means of survival
High demand and ready market for these resources such as the demand for mud fish as a bait in major fishing areas makes it hard to control mud fish exploitation
Lower local governments still seem not to appreciate that they have full responsibility over natural resources management in their areas of jurisdiction.
Encroachment on some resources such as wetlands
Fish poisoning
Some developers want to carry out development outside specified standards
2.9.3: Strategies for improved Natural Resources Management/environment sustainability
Need to increase the budget for environmental activities
Need for sensitization campaigns on population growth and resources availability.
Communities that entirely depend on natural resources such as brick makers need to be availed with alternative sources of livelihood e.g accessing credit facilities.
Passing of ordinances over the management and use of certain environmental resources
Need for good collaboration between politicians and civil servants
Serious enforcement of environmental laws and policies.
Increased participation of stakeholders in the field of environment and natural resources management such as tree planting, wetlands management, hilly and mountainous areas management and waste management.
Practice soil & water conservation.

39
2.10. NUTRITION
Nutrition: is the process of taking in food into the body and how this food is absorbed and utilized in the body.
2.10.1: Effects of malnutrition
The mainly affected groups are the unborn child, the underfive children, the school going age children, the pregnant mothers, the HIV/AIDS patients and the healthcare system
Poverty: Malnutrition leads to procreation of less productive and weak people who are unable to work and be developmental.
Reduced performance at school since malnutrition leads to retarded brain development. Increased maternal and child mortality due to wasting and anemia. Malnutrition leads to increased expenditure both at house hold and government
level/healthcare system on medication to treat and manage malnutrition; and time spent caring for malnourished cases
2.10.3: Objectives of the nutrition situation analysis.
Improve access to and utilization of services related to maternal, infant and young child nutrition.
To enhance consumption of diverse diet.
To improve nutrition in schools
To address gender and social cultural issues that affect nutrition.
To Strengthen and harmonize multi-sectoral coordination frame work for nutrition The households of Rukungiri district produce a variety of foodstuffs such as matoke, millet, maize, rice, potatoes, cassava, beans, milk, beans, groundnuts, and a variety of vegetables which are used for domestic consumption; and the surplus is sold for cash. Also households rear animals such as cattle, goats, sheep, pigs, chicken and rabbits for meat, milk and eggs and sale. However at times some households sell the foods and leave nothing for home consumption for the near future; the need for cash overriding provision for nutrition. Thus food security is compromised; on the other hand food security is compromised by inadequate food production due to infertile soils that have been cultivated over and over without rest or fertilization. Therefore this leads to underproduction and therefore consumption of inadequate and unbalanced diet. It is thus found that some families eat less than five meals a day. The result of all these is that the vulnerable in the family namely, toddlers and under five children, the school going, the pregnant mothers, the elderly, the sick especially HIV/AIDS patients suffer the greatest brunt. Cases of stunting and underweight and full blown malnutrition among the underfive children are a big indicator of poor nutrition and food insecurity: how our communities utilize available foods. Stunting and underweight among the underfive children nationally stand at 33% and 14% respectively; Rukungiri district figures could be worse than these. Services related to maternal, infant and young child nutrition are not readily available at health units unless it is full blown malnutrition. However of recent with the help of implementing partners some H/units have started assessing patients for nutrition status; this will go a long way to improve nutrition status through counseling and provision nutrition services. Another area of concern is the school going children; because where there is inadequate food in the home there is more likelihood that the child going to school will not get food for lunch

40
thereby compromising his ability to study and grow. Parents and caretakers need to be encouraged to provide for their school going children while government should come up with the policy of doing the same. On the other hand are there gender and social cultural issues that affect nutrition? The age-old food taboos barring women and children from eating such foods as eggs, goats‟ meat and chicken are still at play in certain homes. Also the fact that men are controllers of finances in the households still restrains free access to certain foods. The fact that men are the bread winners of the most households restricts the availability of food to the vulnerable in the family. However women emancipation and affirmative action for women have paved a way for accessing a variety of foods to women and children. There is need to strengthen and harmonize multi-sectoral coordination frame work for nutrition. The main sectors here to note are health, agriculture, community and administration. The production of food is managed and overseen in agricultural department; the identification and management of malnutrition is done in health department. Therefore this calls for collaborative efforts to work together to address the issue of malnutrition and its management. Assessment for nutrition status and giving health messages on nutrition should be available everywhere so that the community members can learn how to prevent, manage and address malnutrition. Malnourished cases for children less than five years were 258 for 2014/201
2.10.4: Achievements by the district to fight Malnutrition
Establishment of multisectoral Nutrition Coordination committees ie the DNCC at the district though dormant. Whose roles and responsibilities are to promote, coordinate, plan, implement, monitor and evaluate nutrition activities in the District and also enhance understanding and appreciation of the nutrition situation in the district.
It has provided advisory services and improved agricultural inputs to farmers through NAADS program. The inputs include Tea, Coffee, beans, maize, cassava, irish potatoes
Implementation of child survival activities ie child health days, emtct , ANC services, immunisation ,post natal care activities etc
Provision of safe water
VHT strategy in two sub counties in the district
Availability of reproductive health services down to health centre III
Table 2.10.4.1: Areas of concerns for possible intervention
Areas of concerns Possible interventions
1 Assessment for nutrition status at HUs Mentorship of h/workers
2 Health messages on nutrition Mentorship of h/workers
3 Lack of knowledge by community of proper use of foodstuffs
Health messages by h/workers
4 Malnourished children, mothers, HIV/AIDS patients Provision of RUTF at h/centres
5 Food taboos, men controlling food use at household level
Empowering women, educating men
6 School children not getting meals at school Provision food at school
7 Lack of expert knowledge on nutrition and cookery Recruit a district Nutritionist
8 Dormant district nutrition coordination committee Functionalize the DNCC

41
2.10.4.3: Strategies by the District to combat malnutrition
Table 2.10.4.2: Strategies by the district to combart malnutrition
Strategy Sector
responsible Activities Outcomes
1-Promote and support health and nutrition education
Health
-Hold radio talk shows -Integrate nutrition information in all health talks -procure and distribute IEC materials on nutrition
Increased level of awareness about good nutrition. Increased access to and utilization of information, education and communication materials and messages to target beneficiaries
2-promote integration of nutrition services in all routine and outreach health services and programmes targeting children and mothers
Health -Assess nutrition status of expectant mothers,teenagers, children below 2 years -Growth monitoring for children below 2 years -Provide vitamin A supplementation for children under 5 -Provide iron folic acid supplementation for pregnant women -Undertake deworming of all age groups -Nutrition screening of pregnant women -Procure equipment and supplies for nutrition activities -Integrate nutrition during support supervision.
Growth monitoring and promotion and other nutrition services integrated in all routine and outreach health services. Increased access to and utilization of nutrition services.
3-management of nutrition for sick children, pregnant women, lactating mothers and other women of reproductive age
Health -Screening, referrals and management of acute malnutrition through routine health services -Treatment of severe and moderate acute malnutrition -Provide therapeutic zinc supplementation -Establish follow-up system for the identified cases of malnutrition
Increased access to and intake of nutritious foods by sick children, pregnant women, lactating mothers and other women of reproductive age
4-promote utilsation of antenatal care and postnatal care services among all pregnant women and lactating mothers
Health -Identification and referral of all pregnant mothers for ANC and new mothers for PNC
Increased number of mothers attending antenatal and post- natal care services
5-promote appropriate infant and young child feeding practices
Health and community
-Support to breast feeding policies, programs and initiatives -Support mother to mother support groups for breast feeding -Promotion of and support to appropriate complementary feeding practices -Provide multiple micronutrient powders to children under 2 years -Support to iron fortification of staple foods -Provide iodine supplements
Increased number of exclusively breastfed babies Increased number of „baby –friendly‟ work places, communities and health facilities both public and private Increased number of employers and institutions/agencies implementing the maternity and paternity law
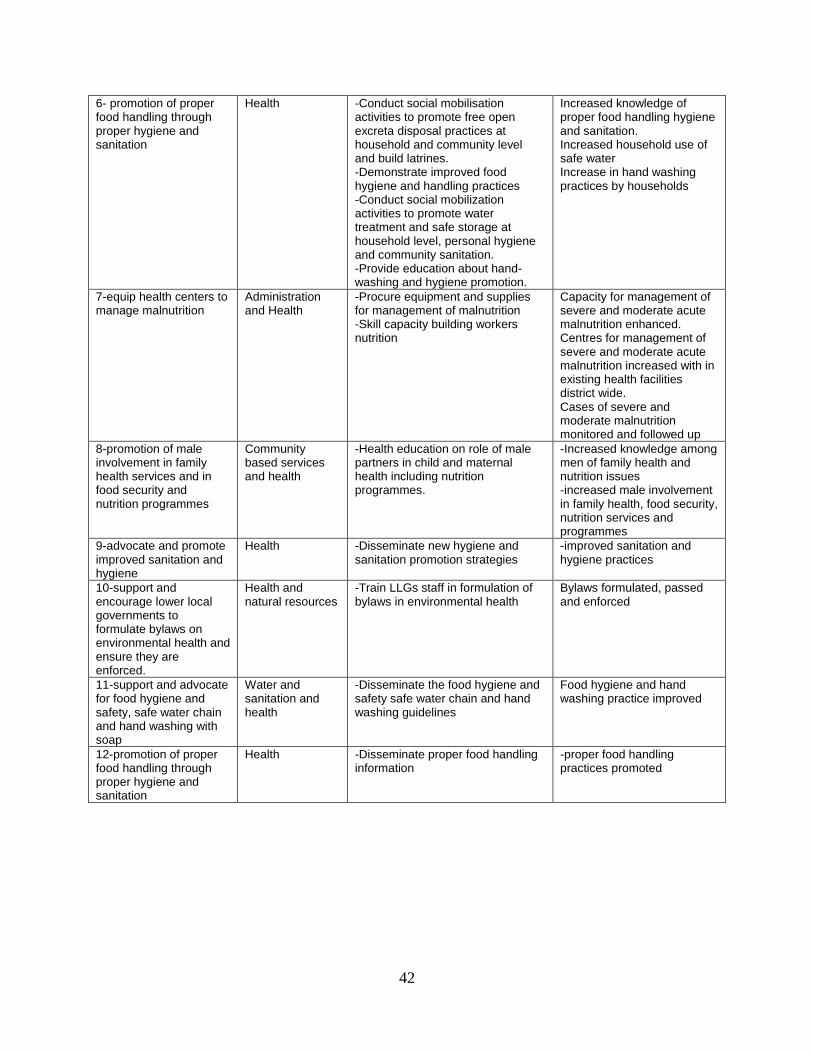
42
6- promotion of proper food handling through proper hygiene and sanitation
Health -Conduct social mobilisation activities to promote free open excreta disposal practices at household and community level and build latrines. -Demonstrate improved food hygiene and handling practices -Conduct social mobilization activities to promote water treatment and safe storage at household level, personal hygiene and community sanitation. -Provide education about hand-washing and hygiene promotion.
Increased knowledge of proper food handling hygiene and sanitation. Increased household use of safe water Increase in hand washing practices by households
7-equip health centers to manage malnutrition
Administration and Health
-Procure equipment and supplies for management of malnutrition -Skill capacity building workers nutrition
Capacity for management of severe and moderate acute malnutrition enhanced. Centres for management of severe and moderate acute malnutrition increased with in existing health facilities district wide. Cases of severe and moderate malnutrition monitored and followed up
8-promotion of male involvement in family health services and in food security and nutrition programmes
Community based services and health
-Health education on role of male partners in child and maternal health including nutrition programmes.
-Increased knowledge among men of family health and nutrition issues -increased male involvement in family health, food security, nutrition services and programmes
9-advocate and promote improved sanitation and hygiene
Health -Disseminate new hygiene and sanitation promotion strategies
-improved sanitation and hygiene practices
10-support and encourage lower local governments to formulate bylaws on environmental health and ensure they are enforced.
Health and natural resources
-Train LLGs staff in formulation of bylaws in environmental health
Bylaws formulated, passed and enforced
11-support and advocate for food hygiene and safety, safe water chain and hand washing with soap
Water and sanitation and health
-Disseminate the food hygiene and safety safe water chain and hand washing guidelines
Food hygiene and hand washing practice improved
12-promotion of proper food handling through proper hygiene and sanitation
Health -Disseminate proper food handling information
-proper food handling practices promoted

43
Table 2.10.4.3 Nutrition Pocc analysis by sectors
S/NO. DEVELOPMENT
ISSUE POTENTIAL OPPORTUNITIES CONTRAINTS CHALLENGES
Food insecurity and low household incomes
The district expriences two rain seasons a year allows crop and animal for production throughout the year Urban centres which provide market for our produce Availability of financial institutions to provide credit to invest in Agriculture production Fertile soils throughout the district which favor crop and animal production Availability wetlands, rivers and springs that provide water for aquaculture and irrigation Availability of enough land
The two raiseasons a year allows crop and animal for production throughout the year Urban centres which provide market for our produce Availability of financial institutions to provide credit to invest in Agriculture production Fertile soils throughout the district which favor crop and animal production Availability wetlands, rivers and springs that provide water for aquaculture and irrigation Availability of enough land
Unfenced markets and markets operating on private land. Poor attitude towards work and poor work environment Land fragmentation and land degradation
Un predictable weather conditions Low prices for agricultural products outbreak diseases (FMD, BBW) New and continuously coming up pests and diseases Fake agricultural inputs and drugs on markets
2. High levels of un employment
Availability of vocatinal institutions equip the population with the relevant skills Strong private sector Availability of programmes supporting youth activities such as youth livelihood fund. Availability of functional labour office Political commitment.
Enabling government policies such as LED policy and PPP. Entrepreneurship training in secondary and post-secondary Education
- Lack of business incubators Failure to commercialize agriculture
- Lack of land reserved for investors Youth failure to embrace agriculture
Seasonal nature of district roads and adverse terrain some areas.
Availability of road equipments and plants Availability of staff in Engineering department
Enabling government policies Central Government Funding
Low pay for road gangs Encroachment of road reserves
Failure to attract and retain highly trained staff Scarcity of spare parts and skilled personnel to repair the road equipments
Inadequate school infrastructure
Existence of Engineering staff for supervision Committedpolitical
Central Government funding Enabling government policies
Central Government funding Enabling
Inadequate funding from the centre

44
leadership Some local revenue available to support development of school infrastructure
Communities willingness to provide land
government policies Communities willingness to provide land
Inadequate tax base and low business activity
Good communication structure with good roads mobile phone for easy movement of information, people and produce Availability of financial institutions to provide credit Urban centers which provide market for our produce The District has a big population to consume the local products Improved road network makes every point of district accessible for any business deals. Availability of training institutions equip the population with the relevant skills
Enabling government policies Good governance and political stability Strong private sector Rural electrification
Poor attitude towards work and poor work environment Unfenced markets and markets operating on private land Lack of sanitary facilities in most markets and Garbage accumulation in markets Lack of business incubators
Large informal sector Large subsistence sector
2.11 TOURISM
The strategic objective of tourism development in Rukungiri District is: To have well developed and diversified tourism sites, having the potential to spur economic and social activities where they are located in Rukungiri District. The main objectives of tourism development in Rukungiri District are to:
1. Increase local community involvement initiative as an engine to spur domestic tourism in the Rukungiri district
2. Identify tourism sites for more tourism attraction diversification in Rukungiri District 3. Increase House hold income among communities around tourism attraction sites 4. Improve on housing and road infrastructure connecting tourism attraction sites 5. Preserve cultural heritage within communities of Rukungiri district
Tourism sites: Rukungiri district tourism Development Patterners
1. UWA- Uganda Wild Life Authoity 2. UTB- Uganda tourism Board 3. MOT- Ministry of tourism, Wildlife and Antiquities 4. KHSTA Kigezi Home Stay Tourism Association 5. Kisiizi Hospital 6. Tourism transport Operators (Kampala, Kisoro, Kabale, Kanungu, Rukungiri) 7. Hoteliers 8. Rukungiri District Local Government 9. Kabale University 10. Kasese District Local Government

45
11. Kigezi Tourism Cluster Platform
Table 2.11.1: planned tourism activites and location
Planned Tourism Activity Location
Nyabugoto cave tourism site Nyakishenyi subcounty
Bukaata cold water spring Bwambara subcounty
Excavated animal trenches Kikarara in Nyakabungo and Rwensigiro villages
Rwensham water canoeing tourism Rwensham landing site in Rwenshama
Formation and sensitisation of
tourism
Kisiizi water fall
Development of Tourism Products in Rukungiri District
The Tourism products in the district include:
Tourism Leisure products
Community Based Tourism Products
Cultural Tourism Products
Table 2.11.2: Development of Tourism Leisure Product
Objective Planned tourism activity Location Indicator Activities budget U. Shs 3,000,000
Identify, promote and package the tourism attractions in Rukungiri district for the domestic, regional and international market.
Profiling, filming and production of Brochure of Nyabugoto cave tourism site
Nyakishenyi Sub-county
No of Tourists attracted by their –product No.-of functional Tourism Product in the district
Profiling tourism sites Production of Brochures Beatification of the Hot and Cold Water springs Signing MOU with private sector on dev‟t of tourism sites
Profiling, filming and production of Brochure of Bukaata cold water spring
Bwambara sub-county
Profiling, filming and production of Brochure of Ihimbo Tourism site
Bwambara sub-county
Profiling, filming and production of Brochure of of animal trenches
Kikarara in Nyakabungo and Rwensigiro villages
Profiling, filming and production of Brochure of Rwenshama water canoeing tourism
Water Canoeing at Rwenshama landing site in Rwenshama
Profiling, filming and production of Brochure of of Kisiizi Water Falls
Kisiizi Hospital In Nyarushanje SC
Installing sign posts on Tourism Sites
Development of of Community Based Tourism Products 2,000,000
Mobilize and engage the local communities to appreciate, conserve and develop tourism attractions in Rukungiri district.
Registration Traditonal Healers, Dance and Dramma Groups Interaction with elder Handcrafts Trucking Cookery Farmed Groups Homestay Formation and training Primary School and Sec Tourism Clubs
No of formed and registered Community Based groups in the district

46
2.12. ANALYSIS OF URBAN DEVELOPMENT ISSUE
2.12.1: The status of Physical Planning
Physical Planning is currently guided by the National Physical Planning Act 2010, and the National Physical Planning Standards and Guidelines 2011. It involves the making of physical development plans as a basis for sustainable land management, planned urban and rural developments and decent housing for all. With the coming into force of the Physical Planning Act 2010, the entire country is declared a planning area and all developments on land ought to seek approval of the respective physical planning committee. Section 25 grants the district physical planning committee powers to cause to be prepared physical development plans at the request and cost of a local government. The Physical Planning Act 2010 provides for the establishment of the physical planning committees, an urban physical planning committee for the municipality and local physical planning committees for sub counties and small towns. Rukungiri district has one municipality, two town councils, two town boards and several trading centers. Physical planning is an ongoing process at various levels. While the physical development plans for several wards in the municipality have been completed and are up to date, other towns and trading centers do not have physical development plans due to financial/budget constraints.
2.12.2: Existing and upcoming urban areas and economic activities
The revised Local Government Act 2002 gazette certain areas as urban, irrespective of the population concentration. The table below shows the existing and upcoming urban areas in the district.

99
Table 2.12.1 Existing and upcoming urban areas in Rukungiri District
Subcounty/Municipality Urban Areas
Rukungiri Municipality a. Eastern Division
b. Western Division
c. Southern Division
d. Eastern Division
Buyanja Sub County a. Buyanja
b. Nyakaina
c. Buhandagazi
d. Nyabitete
e. Omwirwaniro
Bugangari Sub County
a. Bugangari
b. Camp Bell- Bagahwe
c. Kashenyi
d. Kazindiro
e. Nyakariro
f. Burama
g. Kyomera
Buhunga Sub County a. Karisizo
b. Rusheshe
c. Rutooma/Kihanga
Bwambara Sub County a. Bwambara
b. Bikurungu
c. Rwenshama
d. Kikongi
e. Kikarara
Kebisoni Sub County a. Kebisoni
b. Rwabigangura
c. Garubunda
d. Mabanga
Nyakagyeme Sub County a. Rwerere
b. Kasoroza
c. Nyabikuku- Rushasha
d. Masya
e. Nyabugando
f. Kahoko
g. Nyakinengo
Nyarushanje Sub County a. Nyarushanje (Stage)
b. Omukishanda
c. Omukiyenje/Bwanga
d. Kisizi
e. Nyabushenyi
Nyakishenyi Sub County a. Nyakishoroza
b. Omukagana
c. Nyarurambi
d. Kamaga
e. Murama
f. Katonya
Ruhinda Sub County a. Rwenshaka
b. Kengoma
c. Joshua Stage
d. Kashenyi (Go Down)
e. Rwoya
f. Rutabago- Kajunju
g. Katokye
h. Nyaruzinga
Source: Physical Planning office 2016

100
The major economic activities in these urban areas include; Subsistence agriculture which is practiced by the majority of rural households Trade and commerce which includes both retail and whole sale of goods Livestock rearing and trade Small scale manufacturing and processing Artisan crafts which includes metal fabrication, pottery, Leisure, tourism and hospitality services Fishing and fish farming especially at Lake Edward at Rwenshama fishing village Formal and informal employment both in the public and private sector Building and construction activities Forestry and dealing in forestry products such as timber, charcoal and pit sawing Service activities such as salons

99
2.3: DISTRICT POCC ANALYSIS
S/no. Development Issue
Potential Opportunities Contraints Challenges
1 Gender based violence
Well trained social workers and parasocial workers who can sensitize communities
Civil society actors who can complement government effort to address the issue.
Limited funding to responsible district department
Cultural stereotyping and prejudice n gender issues.
2 Youth Unemployment
Staff who can give adequate guidance
Government youth livelihood program
Limited resources to reach the youth within the community
Poor preparation of the young people for the world of work.
3 Weak Legal framework
Existing council ordinances and bylaws
Legal framework (Physical Planning Act, National physical Planning standards and guidelines)
Poor enforcement mechanisms
Legislation gaps on land use and ownership
4 Indquate Housing infrastructure
Private sector led housing initiatives
Low cost housing technologies Growth of informal settlements/slums
Absence of national housing strategy
5 Infrastructural development
Thriving local economy (businesses) Technical expertise
Government grants Donor funded urban infrastructural development projects (markets, roads, schools, health facilities among others)
Absence of appropriate machinery Compensation challenges for land and property affected Budget constraints
Weak land acquisition policy
6 Informal/ un planned settlements
Social-economic amenities such as electricity, piped water, security, entertainment among others)
Upgrading and redevelopment initiatives of informal settlements by the government and donors
HIV/AIDS scourge Insecurity
Civil society pressure groups lobbying for informal settlements
7 Low Urbanization growth rate and the environment al factors
Availability of technical staff
Institutional capacity, policies, laws and regulations (NEMA)
Weak law enforcement mechanisms Wetland encroachment Poor waste disposal Pollution (water and air)
Invasion of ecologically sensitive areas by investors
8 Physical Planning
Technical expertise Technical and material support by the MoLHUD
Urban sprawl Unplanned infrastructural development
Urban- Rural migration and
9 Food insecurity and low household incomes
The district expriences two rain seasons a year allows crop and animal for production throughout the year Urban centres which provide market for our produce Availability of financial
The two rain seasons a year allows crop and animal for production throughout the year Urban centres which provide market for our produce Availability of financial institutions to provide credit to invest in Agriculture production Fertile soils throughout the district
Unfenced markets and markets operating on private land. Poor attitude towards work and poor work environment Land fragmentation and land degradation
Un predictable weather conditions Low prices for agricultural products Rampant outbreak diseases (FMD, BBW) New and continuously coming up pests and diseases

100
institutions to provide credit to invest in Agriculture production Fertile soils throughout the district which favor crop and animal production Availability wetlands, rivers and springs that provide water for aquaculture and irrigation Availability of enough land
which favor crop and animal production Availability wetlands, rivers and springs that provide water for aquaculture and irrigation Availability of enough land
Fake agricultural inputs and drugs on markets
10 High levels of un employment
Availability of vocatinal institutions to equip the population with the relevant skills Availability of programmes supporting youth activities such as youth livelihood fund. Availability of functional labour office Political commitment.
Enabling government policies such as LED policy and PPP. Entrepreneurship training in secondary and post secondary Education
Lack of business incubators and weak manufacturing sector Failure to commercialize agriculture
Lack of land reserved for investiments Youth failure to embrace agriculture
11 Seasonal nature of district roads and adverse terrain some areas.
Availability of road equipments and plants Availability of staff in Engineering department Availability of technical Institutions and Universities in and around the district
Enabling government policies Central Government Funding
Low pay for road gangs Encroachment of road reserves
Failure to attract and retain highly trained staff Scarcity of spare parts and skilled personnel to repair the road equipments
12 Inadequate school infrastructure
Existence of Engineering staff for supervision Committed political leadership
Central Government fundingEnabling government policies Communities willingness to provide land
Central Government funding Enabling government policies Community‟s un willingness to provide land. Inadquate local revenue available to support development of school infrastructure
Inadequate funding from the centre

101
13 Inadequate tax base and low business activity
Good communication structure with good roads mobile phone for easy movement of information, people and produce Availability of financial institutions to provide credit Urban centers which provide market for our produce The District has a big population to consume the local products Improved road network makes every point of district accessible for any business deals. Availability of training institutions equip the population with the relevant skills
Enabling government policies Good governance and political stability Strong private sector Rural electrification
Poor attitude towards work and poor work environment Unfenced markets and markets operating on private land Lack of sanitary facilities in most markets and Garbage accumulation in markets Lack of business incubators
Large informal sector Large subsistence sector
14 Inadequate funds to extend supply of Piped Water System all parts of the district
Availability of Water Sources of high yielding potentials
Some of the Designs of water projects are in progress
Environmental degradation Reduction of ground water resources Climate change
Planting of eucalyptus trees near water sources Shrinking Financial resource envelope Failure to enforce laws industrialization
15 Lack of enough f public sanitation facilities
Many upcoming rural growth centers and market places
Resources are available WB funded projects
Securing of land Poor misuse of latrines

103
2.4 REVIEW OF PAST PERFORMANCE OF DD1 (2010/11- 2014/15)
MANAGEMENT Out put planned Achieved %ge achieved
Staff recruited & Developed 831 768 92%
Salaries for staff & Political leaders paid 100% 99.4% 99.4%
Pensions & Gratuities for retired staff paid 100% 95% 95%
Intervention 3: Staff trained 966 839 86.9%
Political leaders and other stakeholders trained 190 172 90.5%
Gov‟t programs monitored & supervised 20 20 100%
DTPC meetings held 60 60 100%
LG PAC meetings held 20 20 100%
Council and standing committee meetings held 30 30 100%
DSC Meetings held 20 20 100%
Public functions organized 25 25 100%
Mandatory notices posted 20 20 100%
Performance management of staff carried out 100% 98% 98%
Goods and services procured 20 20 100%
Law ,order and security promoted 20 20 100%
Planning unit
Issuance of the Budget call circular for planning purposes
5 5 100
Holding of the Budget Conference (Data) 5 5 100
Production and submission of the BFP to LGBC (Data)
5 5 100
Production of Quarterly monitoring Reports 60 60 100
Production of DDP and LLGs Development Plans. 5 5 100
Production of Statistical Abstract 5 5 100
Supporting of the LLGs in participatory planning and production of Development Plans.
5 5 100
Integration of population factors in development planning process and production of population statistics
5 5 100
Production of Quarterly Accountability Reports 60 60 100
Internal assessment 5 5 100
FINANCE Output 2010/11-2014/15
Planned/Target achieved %age Performance
Annual budget and work plans prepared and presented to council.
5 5 100
Revenue enhancement plan and charging policy prepared and submitted to council
5 5 100
Financial statements for both District and 9 LLGs prepared and submitted to OAG and Accountant General.
5 5 100
Departmental computers, printers and photocopiers serviced. 5 5 100
Quarterly Financial accountabilities and activity reports reviewed and verified.
20 20 100
Responses to the queries raised by OAG and Internal Auditor prepared and submitted.
5 5 100
Radio talk shows and presentations on Radio Rukungiri 20 20 100
Sensitization and mobilization seminars conducted in major trading centres and portion tax payers indentified.
5 5 100
Monthly Revenue meetings conducted. 60 60 100
Revenue collections in 9 sub counties and at district headquarters conducted
5 5 100

104
PLANNING UNIT Issuance of the Budget call circular for planning purposes
5 5 100
Holding of the Budget Conference (Data) 5 5 100
Production and submission of the BFP to LGBC (Data) 5 5 100
Production of Quarterly monitoring Reports 60 60 100
Production of DDP and LLGs Development Plans. 5 5 100
Production of Statistical Abstract 5 5 100
Supporting of the LLGs in participatory planning and production of Development Plans.
5 5 100
Integration of population factors in development planning process and production of population statistics
5 5 100
Production of Quarterly Accountability Reports 60 60 100
Internal assessment 5 5 100
WORKS DEPARTMENT Routine Mechanised maintenance 982 586 60
Routine Manual maintenance 1043 667 64
Addressing road bottle necks on Community Access Roads (CARs) in 9 Sub-counties of Bugangari, Buhunga, Buyanja, Bwambara, Kebisoni, Nyakagyeme, Nyakishenyi, Nyarushanje, Ruhinda
9 9 100
Supply and installation of Culverts 224 224 100
Production of Quarterly monitoring Reports 20 20 100
Production of Quarterly Accountability Reports 20 20 100
Supporting of the LLGs in participatory planning and production of Development Plans.
9 9 100
Construction of District Administration Building Phases Phase VIII Phase VIII Ongoing
AUDIT Books of accounts and projects audited 20 20 100
Value for money reviews of constructed projects, carried out
20 20 100
Quarterly Audit reports prepared 20 20 100
Workshop and AGM Attended 20 20 100
HEALTH OPD attendance 47204 [150%] 507259 165%
ANC 4th
visit 15735 6831 43.4%
IPT2 15735 7571 48.1%
Health facility deliveries 15735 10168 64.6%
BCG vaccination 13532 14358 106.1%
Pentavalent vaccination 1 13532 12028 88.9%
Pentavalent vaccination 3 13532 11958 88.4%
Measles vaccination 13532 11053 81.7%
Inpatient admissions - 36332 -

105
COMMUNITY BASED SERVICES DEPARTMENT OUT PUT PLANNED/
TARGET ACHIEVED %age
PERFORMANCE
Functional Ault literacy learners passed out 15,600 14,547 93
Conducting court enquiries for children in contact with ththe law
16 12 75
Child maintenance orders issued 200 136 68
No. of Women, Youth and PWDs mobilized and sensitized 2,500 2250 90
No. of CBOs registered 150 218 145
District Cultural Festival 1 -
No. of PWDs Groups funded 50 47 94
No. of Youths sponsored for vocational training 60 51 85
No, of Youth Groups funded 20 31 310
No. of social welfare cases handled 1000 1,502 300
Remand home established 1 -
No. of labour disputes handled 50 44 91
No. of workplaces inspected 24 27 112
Skills training for Women, Youth and PWDs (No. of peoples trained)
60 85 141
No. of OVC service providers support supervision/monitoring visits conducted
200 200 100
No. of District OVC coordination meetings held 20 20 100
No. of Sub-County OVC Coordination committee meetings 180 180 100
No. of Children resettled 50 40 80
No. of Gender trainings done 5 5 100
No. of Gender Focal Point Officers mentored 38 29 76
No. of Women Council meetings held 5 5 100
No. of Celebrations held (Women‟s Day) 5 5 100
No. of District Disability Council meetings held 5 5 100
No. of Women supported to start IGAs by District Women Council
2 2 100
No. of Youth Council meetings held 5 5 100
No. of Community Groups which have received the CDD Grant 160 152 95
NATURAL RESOURCES Interventions by Sector
LG Annual performance Remarks
2012/13 2013/14 2014/15
Target Achievement
Target Achievement
Target Achievement
Administration
12 meetings. 25 projects to review. 19 staff to appraise.
6 meetings. 15 projects reviewed. 13 staff appraised
6 meetings. 30 projects to review. 15 staff to appraise
6 meetings. 40 projects reviewed. 19 staff appraised.
6 meetings. 30 projects to review. 13 staff to appraised,
6 meetings. 30 projects reviewed. 13 staff appraised.
Meetings were held twice a month. Reviews were made. Understaffing and labour turn over rate was high

106
Environment and Wetlands
10 environm-ent plans. 11 wetlands to be protected. 1500 framers to be trained.
5 plans made. 7 wetlands protected, 1000 farmers trained.
15 environment management plans. 30 wetlands protected to. Train 4000 farmers.
12 environment plans. 20 protected wetlands. 3000 farmers trained.
20 environment plans to make. 30 wetlands to be protected. 5000 farmers to be trained.
15 plans made. 25 wetlands protected. 4500 farmers trained.
PAF for wetlands activities availed. Under funding and understaffing. Low trainee turn up.
Forestry 300000 trees to be planted. 7 nursery beds.
170,000 trees planted. 2 nursery beds.
To plant 2m trees. To raise 11 nursery beds.
1 million trees planted. 5 nursery beds raised.
2m trees to be planted. 11 nurseries to be raised.
1.5m trees planted. 5 nursery beds maintained.
Presence of FIEFOC project. Ministry supplies seed and seedlings.
Lands 400 disputes. 100 surveyed. 150 plans.
100 titles. 300 disputes. 78 surveyed land. 50 plans.
150 titles to be processed. All government land to be surveyed. 100 physical plans to be made.
130 titles made. 100 lands surveyed. 70 plans made.
Lands had no staff at first. Staffs were recruited. People were sensitized. Under funding.

107
CHAPTER 3: LGDP STRATEGIC DIRECTION AND PLAN
This chapter presents the LGDP strategic direction, adaptation of broader National Strategic Direction, adaptation of sector specific strategic direction (National) adaptation of relevant national cross cutting policy/programme, broader LGDP outcomes and goals and sector specific development outcomes, outputs strategies and interventions and a summary of local government programs for five years. This Five-Year Development Plan is a people centered plan, prepared through a bottom-up approach. It integrates sub-county and sectoral plans. It spells out the District Vision, Mission statement, goals, objectives and priorities.The District Development strategy of this five year development Plan (FY 2015/2016 -2019/2020) has been developed to enhance vision based planning and is aligned to National Vision
3.1. Adptation of broader National strategic Direction and Priorities
The broad national development strategic direction will always be given by the National Vision and the NDPs which will be emphasized by the plan call circulars. For that reason, it will be uniform for all LGs. Upon receipt of the broad national development strategic direction: HLGs willtakethe responsibility to communicate the national development strategic direction to all LLGs, CSOs, and private sector and other development partners in the area of jurisdiction of a HLG The district local Government has adopted the national vision of transforming Ugandan society from a peasant to a modern and prosperous country with in a period of 30 years and with the NDP II theme of strengthening Uganda‟s Competitiveness for Sustainable Wealth Creation, Employment and Inclusive Growth. The district will pursue the above vision and theme through Operation wealth creation, promotion of local economic development and public private partnerships.
3.2 Adaptation Sector Specific Strategic Directions and Priorities
In an attempt to contribute towards realization of national and sectoral strategic objectives and priorities, the district has adopted them from the second national development plan.
Health sector
Interventions to improve health service delivery include;
Contributing to the production of a health Human capital through the provision equitable, safe and sustainable health services by increasing OPD attendances, care and treatment. Providing services to pregnant mothers who attend ANC care, immunization children below one year DPT/HIB/HEB/PCV 10/measles and improving pregnant mothers‟ deliveries.
Operationalization of theatres at all HC IVs in the district.
Improving hygiene and sanitation through construction of pit latrines. This will be achieved through advocating for community led total sanitation and enforcing public health Act
Intensifying disease surveillance and response to improve alertness against any disease outbreak.

108
Insuring a comprehensive HIV/AIDS care and support services including provision of ARVs and maintaining key registers.
Improving staff capacity by recruiting more Doctors and other key health workers to improve health service delivery.
To extend health service provision to the village level by mobilizing village health teams, train them and orient in community health service provision.
Strengthening and support supervision at all levels to improve staff efficiency in the provision of health services.
To improve health infrastructure through renovation of existing health facilities and equipments.
Education Sector
The district has adopted the NDP II education sector priorities through;
Ensuring equitable access to quality education by implementing UPE, USE policy guidelines, monitoring the functionality of school management committees, teacher/pupil absenteeism to improve school performance
Construction of classroom blocks, teacher houses, latrines at various schools to increase pupil enrollment, enable teachers to stay at their work stations and improve hygiene and sanitation.
Strengthen the school monitoring and inspection at all levels to improve staff performance and effectiveness
Re-orient school management committees in their roles and responsibilities so that they become more active in their activities
Promote games and sports and co-curricular activities Agricultural sector,
The district has adopted the objective of increasing agriculture production and productivity through;
Support access to agricultural finance mainly through the SACCOs.
Increasing market access by making available information on prices and markets for Agricultural produce.
Promotion of value addition and agro-processing
Control pests, diseases and vectors
Promote commercialization of agriculture particularly amongst small holder farmers.
Strengthen farmer groups formation and cohesion including commodity associations, platforms, federations and co-operatives
Promotion of strategic enterprises like tea growing in the district
Natural resources
The district in a bid to ensure sustainable social economic development and avert environmental degradation and climate change has adopted the following;
Enforce compliance with environmental and natural resources legislation and standards at all levels
Develop and implements a program on integrated ecosystems assessments
Develop and implement ecosystem management and restoration plans
Restore the degraded fragile ecosystems (river banks, bare hills)
Demarcate restore and gazette wetland eco-systems country wide.
Develop wetland management plants for equitable utilization of wetland resources country wide

109
Expand knowledge base of ecological and socioeconomic value of wetlands among stakeholders.
Integrate and implement the National Climate Change Policy (NCCP) including awareness creation in all local government as well as CSOs and private sector
Develop district wide community based and institutional tree planting initiatives.
Promote sustainable development of commercial forest plantations and industry including value addition
Tourism
In order for the district to the sector‟s contribution to wealth creation and employment the district direct efforts twords increasing and diversifying the stock of tourism products, aggressive marketing through;
Increasing local community involvement initiative as an engine to spur domestic tourism in the Rukungiri district
Identifying tourism sites for more tourism attraction diversification in Rukungiri District
Increase House hold income among communities around tourism attraction sites
Improve on housing and road infrastructure connecting tourism attraction sites
Preserve cultural heritage within communities of Rukungiri district Trade, industry and cooperative sector, The district has adopted the following interventions;
Popularize, disseminate and implement the National Cooperative Development Policy implementation strategy to empower and guide cooperatives.
Promotion of industrialization through construction of Buyanja milk processing plant Beverages
Works and transport sector,
The district has adopted the intervention of developing and maintaining the roads to wildlife, tourism, oil and agriculture producing areas.
Construction of Rukungiri kihiihi – ishasha kanungu road Information and communications technology sector, The district has adopted;
The objective of increasing access to ICT infrastructure to facilitate exploitation of development priorities through extending internet services to all departments and sub counties.
Enhancing the usage and application ICT services in service delivery and will attempt to train staff in ICT related issues.
Increasing job creation by promoting research and innovation by way of establishing a business incubation centre and improving information security through the implementation of district ICT policy.
Lands and housing sector, The district has adopted the following;
Promoting public private partnership for investment in constructing appropriate housing estates in the district in planned urban and rural areas.
Implementing the national land policy and land use policy
Ensuring proper land use practices that comply with sound environmental and natural resources management.

110
Identify, assess, inventory and register government lands.
Improve accessibility to and functioning of land sales and rental market
Water and sanitation, The district has adopted the following in this DDP II;
Construct, operate and maintain appropriate community water supply systems in rural areas focusing on un-served areas.
Target investments in water stressed areas abstracting from production well as well as large GFS where appropriate to serve the rural areas.
Promote and scale up rainwater harvesting at household public institutions and community level with particular focus on climate change.
Promote WASH humanitarian preparedness and response to avert possible outbreaks of water related diseases especially in settlements for poor communities and as well as refugees and displaced persons.
Improve functionality, sustainability and resilience of water supply systems in rural areas.
Promote Public Private Partnership arrangements to increase accessibility of water sources.
Physical planning and urban development,
The district intends to;
Operationalising the physical planning Act 2010 and
Prepare physical plans for each town board and its land at the district headquarters.
3.3 ADAPTATION OF RELEVANT NATIONAL CROSSCUTTING POLICIES/PROGRAMS
The district has encouraged all departments/sectors and stakeholders to mainstream all the cross cutting issues indicated in the new planning guidelines which include gender, environment and HIV/AIDS, human rights, Disability, Nutrition, governance, population, science and innovation, child health, social protection, climate change, disaster preparedness and culture and mind set. Mainstreaming all these issues is a challenge. This will be achieved through training of heads of department by the various focal persons during the technical planning committee meetings.
3.4 BROAD LOCAL GOVERNMENT DEVELOPMENT OUTCOMES AND GOALS
District Vision: “A prosperous population in a sustainable and secure environment by the year 2040” District Theme: ‟Sustainable prosperity for all through wealth creation and employment‟‟ District Mission: Service Delivery for Socio-Economic Development Goal: To improve service delivery and socio-economic development for prosperity Strategic objectives of Rukungiri LG
To identify and collect sufficient revenue to ensure service delivery
To promote democracy and accountability in the local government

111
To increase the level of basic education
To provide accessible health services
To improve the district infrastructure e.g. roads, bridges, buildings
To increase access to safe water and sanitation
To empower communities to set up income generating activities (IGAs)
To ensure sustainable management of natural resources 3.5 SECTOR – SPECIFIC DEVELOPMENT, OBJECTIVES, OUTCOMES, OUTPUTS, STRATEGIES AND INTERVENTIONS
MANAGEMENTS
Vision: A well-coordinated, equipped and motivated work force. Mission: Coordination of all sectors in the district for effective and efficient service delivery. Goal: To coordinate, supervise and monitor provision of services in the district. Objectives: Departmental objectives, strategies and activities Objectives:
To have in place sufficient, motivated, well equipped and trained manpower.
To ensure proper utilization and accountability of resources.
To promote democratic governance and public relations.
To protect peoples‟ lives and property.
To establish an effective and efficient management system.
To increase public awareness on important development issues. Outputs:
Manpower recruited, equipped and motivated.
Resources properly utilized and accounted for.
Democratic governance and public relations promoted.
Peoples‟ lives and property protected.
Effective and efficient management system established.
Public awareness on important issues enhanced. Outcomes:
Improved service delivery
Improved efficiency and effectiveness.
Public trust enhanced.
Improved security and participation in development activities.
Increased participation in government programs. Strategies:
Man power analysis and planning
Faciliating Recruitment to fill all key vacant positions.
Routine induction and mentoring of staff.
Strengthening support supervision and monitoring.
Increasing budget for retooling items.

112
Facilitate formulation and implementation of policies, ordinances and by laws.
Ensure communication and involvement of stakeholders in implementation of policies and programs.
Conducting periodic meetings (monthly, quarterly and annual).
Conflict/dispute management and resolution
Conducting public functions.
Interventions:
Recruitment of staff
Staff development
Public awareness through Public Baraza, display of mandatory notices on Public notice boards
Legislation by council on policies, byelaws and council.
Procurement of office equipments
Acquisition of adequate office space.
Cordination of periodic meetings.
Timely and prompt payment of staff salaries, allowances and terminal benefits.
Monitoring and evaluation of projects and programs.
Posting and displaying of mandatory notices.
Study tours.
Enhancement of transparence and accountability of public resources
FINANCE
Composition: The finance department is composed of 5 sections, i.e;
Administration office
Revenue
Budgeting
Accounting
Expenditure
Integrated financial management system(IFMS) Mission: To promote proper management and accountability of the financial resources of the district in accordance with the LG financial and accounting regulation 2007 and its manual, PFMA 2015 and other relevant laws. Goal: a) Improved welfare and high standard of living of its people. b) Reduced poverty among the population. c) Sustainable development. Objectives and strategies:
a) To improve the amount of revenue collected from local sources and its Management Strategies Conduct tax education on trading licenses, Market dues, Parking / stage fees and others. Conduct timely tax enumeration, assessment and collection seminars. Hold radio talk shows to inform tax payers of their obligation in paying taxes.

113
Carryout Tax Audit of key Institutions to ascertain their compliance. b) To establish actual local revenue potential of all local revenue sources. Strategies Monitor and evaluate revenue sources to minimise defaulting by tax payers and Local
revenue collection contractors.
Carryout a survey of business enterprises.
Regular updating of local revenue inventory in the revenue enhancement Plan thru‟ regular
enumeration and assessment of all revenue sources.
b) To gather data on tax payers and taxable items to enable increase in revenue
collected Strategies
Register all revenue sources in the District. Establishment of Local Revenue Enhancement monitoring Desk officers. Computerise business enterprises at the sub-county and revenue centres. Make business apply for licensing to establish level of business and compliance.
c) To have improved modes of collection of taxes.
Strategies Tender out collection of Market fees, slaughter fees, Parking /stage and beer brewing
fees. Purchase and distribute counterfoils and accountability materials in time. Tender out other local revenue collection other than licenses, landing fees and park fees
semi annually. Issue Demand notes to tax payers in time. Give revenue collectors support in form of manpower and political will. Streamline the license collection in line with the licensing Act Cap 110. Hold consultative meetings with stakeholders.
d) To create conducive environment for local revenue collectors
Strategies Sensitise and train community in enterprise selection which enhances their
income(IGAs) Penalise revenue contractors who default. Recognise revenue collector‟s performance through rewards. Hold tax payers day every year to give accountability to the public. Support from the political and sub-county authorities in form of law enforcement.
PLANNING UNIT
Mandate: Under part II of the Local Government Financial and Accounting Regulations 1998 and Sections 36-38 of the Local Act 1997, the unit is mandated to coordinate the planning process, mentor, and monitor and evaluate development projects and carry out programmes that address population issues at all levels of governance in the district. Vision: „‟A centre for information manangement and planning guidance‟‟

114
Mission: To coordinate planning process, and provide guidance and mentoring required information management for promotion of local economic development and effective service delivery in the district.
Goal:
To provide an Integrated Planning for services covering sectoral plans, policies and to monitor and evaluate the implementation activities
Objectives
To coordinate the entire district planning process.
To coordinate investiments determination for departments
To collect, process and disseminate statistical information for planning and decision
making.
To coordinate monitoring and supervision of District Plan Implementation
To increase access, usage and application of ICT infrastructures and services
Out comes
Increased local economic development Effective planning and decision making Increased ICT awareness and usage in the district
Development Outputs
Relevant Planning, budgeting, documents and reports generated and disseminated. Higher and lower local governments provided with technical guidance in development
planning. Departments/ Sub Counties gain increased access to ICT use and application Training and mentoring in planning and data management, ICT Use and application Extend internet services to all departments and sub counties Develop local capacity to create businesses and offer skills and knowledge Development Interventions Providing guidance to departments and lower local governments in planning, budgeting,
and reporting and data management. Conduct staff training for skills development and knowledge acquisition Promote Public awareness through participatory M+E sharing of lessons publications
Development Strategies
Extend internet services to all departments and sub counties Develop local capacity to create businesses and offer skills and knowledge Training and mentoring in planning and data management, ICT Use and application
Development Interventions
Providing guidance to departments and lower local governments in planning, budgeting, and reporting and data management.
Conduct staff training for skills development and knowledge acquisition Promote Public awareness through publications, media and electronic resources

115
NATURAL RESOURCES
Vision:
District natural resources managed and conserved sustainably.
Mission:
To coordinate, manage, supervise and ensure sustainable exploitation and conservation of natural resources in the district for social economic development through coordinated implementation of national and local development initiatives and policies.
Goal:
To coordinate and manage the sustainable management and conservation of natural resources in the district.
Development Objectives:
1. To promote sustainable utilization and management of wetlands in the district. 2. To promote sustainable and sound environment management in the district 3. To ensure sustainably managed and adequate forest cover in the district. 4. To manage orderly, lawful and sustainable land development in the District.
Development outputs
District natural resources exploited sustainably National Policies and regulations on Natural Resources Management implemented Bye laws and ordinances on natural resources management initiated Provision of extension services on natural resources coordinated and managed Security of land tenure ownership and lease holdings managed Technical proposals appraised and environment impact assessment done Work plans and budgets for the Natural Resources sub sector prepared, submitted and
managed Advice on natural resources tendered Departmental staff supervised and appraised Performance reports prepared and presented to District Council and other stakeholders.
Outcomes
- Sustainably exploited district natural resources - Implemented National Policies and regulations on natural Resources Management - By laws and ordinances on natural resources management - Coordinated and managed extension services on natural resources - Properly managed security of land tenure ownership and lease holdings - Appraised and environment impact assessments - Work plans and budgets for the Natural Resources sub sector prepared, submitted and
managed - Supervised and appraised departmental staff - Departmental Performance reports
Interventions
- Mobilization and sensitization of communities on sound wetlands management practices and laws.
- Tree planting campaigns to protect the water catchments area

116
- Forming and training locally adjacent wetlands committees - Training farmers on good farming practices.
- Training farmers on water and soil conservation methods - Formation of watershed management committees
- Ensuring routine monitoring and inspection of wetland resources. - Mobilization and sensitization of communities on sound environmental practices and
laws. - Tree Planting
- Forming and training Local Environment Committees - Training farmers on good farming practices
- Training farmers on water and soil conservation methods - Waste management campaigns
- Developing and ensuring the implementation of the District Environment Action Plan. - Preparing reports on the state of the Environment in the District. - Monitoring and supervising activities relating to the environment in the District
- Reviewing of development project EIA reports. - Sensitizing communities on tree growing
- Establishment of tree nurseries in 14 sub-counties - Purchase and distribution of seed and tree seedlings
- Giving technical back-up to private sector forestry investors. - Physical planning of all urban centers
- Production of maps, cadastral sheets, title deeds for all surveyed land - Resolution of land disputes
- Survey and demarcation of all government lands.
COMMUNITY BASED SERVICES
Vision: An empowered and prosperous community in which Women, Youth, PWDs and elderly actively participate and benefit from development undertakings, and where children are safe and secure. Mission: To empower the community to undertake and benefit from development initiatives, particularly youth, women, PWDs, and Elderly through mobilization and sensitization and training, and to ensure that there is conducive environment for proper child care and development Goal: Having a community where all people participate and benefit from development undertakings, and where there is proper child care and protection
Objectives:
To Promote of positive cultural values, norms and practices To Institute social protection measures that reduce vulnerability and enhance productivity of the people To enhance the capacity of families and communities to protect and care for children. To Promote Gender equity and Women Empowerment To Ensure respect and promotion of Human Rights

117
To ensure effective community mobilization and community participation in development initiatives
Strategies
Training of stakeholders on various areas of concern Mobilisation and Sensitisation of community members Advocacy for funding and programming for special interest groups Collaboration and networking with Civil society organizations and other development partners Enforcement of labour laws
Outputs
Cultural groups supported Annual Cultural festivals held Elderly people benefiting from cash transfer, PWDs benefitting from Livelihood grants PWDs provided with Assistive devices Women benefitting from Livelihood revolving loans Youth benefitting from Livelihood revolving loans Women council meetings held Youth Council meetings Held PWDSCouncil meetings held Communities mobilized for development activities Remand home in place and operational Gender issues highlighted in plans and budgets Human rights sensitization meetings and trainings done Public library in place and operational Youths trained in vocational skills Communities sensitized and mobilized to provide protection to children. OVC service providers supported Outcomes
More Youths, Women, and PWDs and Elderly participating and benefiting from development undertakings and starting their own development initiatives/projects
Reduced cases of gender based violence in the District
Gender responsive plans and budgets in all programmes and sectors
Increased number of OVC household graduating out of vulnerability
Improved literacy and numeracy in the Community
Interventions
Giving Financial Support to cultural groups to participate in cultural events
Organize Annual District cultural Festivals
Implement cash transfer programme to the identified poorest section of the population
Support OVCs, Old Persons, and Widows
Holding Advocacy, Sensitisation meetings, and support supervision of OVC service providers
Handling Children‟s welfare cases
Providing PWDs with assistive devices
highlighting Gender issues in plans and budgets
sensitising communities on Human rights

118
Supporting Youths to acquire marketable skills
Supporting apprenticeship centres
Conducting Functional Adult Literacy classes
Providing Elderly people with cash transfer,
WORKS
Vision:
Adequate provision, operation and maintenance of infrastructure.
Mission:
To provide and maintain a sustainable infrastructure network for effective and efficient service delivery.
Goal:
To have a sustainable infrastructure network in the District.
Objectives:
To effectively coordinate implementation of district and lower local government projects. To ensure timely completion of district and lower local government projects. To ensure timely preparation of plans, reports and accountabilities. To maintain infrastructure, vehicle fleet, plants and equipment.
Out puts
Roads maintained. Drainage Structures Constructed/ maintained. Administration building constructed. Buildings maintained. Plants and vehicle fleet maintained.
Out comes
Improved road network. Improved road drainage structures. Increased office space. Improved outlook of existing building structures. Improved access to hard to reach areas (Kabuga Nyarushanje S/C) Undertake 25 km of Community Access roads Rehabilitated to District Feeder Roads.
Strategies
Proper and timely planning of projects. Ensuring that the staffs are technically competent, well-motivated and facilitated. Regular supervision and monitoring of the projects under implementation. Ensuring that road plants, equipment and vehicles are mechanically sound and infrastructure maintained.
Intervention
Routine Mechanised and manual maintenance of District feeder and Community Access Roads. Construction and maintenance of Road drainage structures. Construction of District Administration Building.

119
Maintenance of Buildings. Maintenance of vehicles and plants.
WATER
Vision: Well maintained safe water network and clean sanitation for all the people of Rukungiri district by 2020 Mission: Construction and extension of piped water supply system and construction of sanitation facilities in public places. Goal: To reduce water and sanitation related diseases by 40% by the year 2020. Objectives:
Increase access of safe water coverage from 93% to 100% in rural areas Increase access to improved sanitation rural areas Increase monitoring of urban safe and clean water and hygienic sanitation facilities for
domestic, industrial and commercial use. The sector is composed Give technical direction in water and sanitation projects in the district before, during and
after construction. Outputs
Five Piped Water Supply Systems constructed by end of 2019/2020 financial year Thirteen Piped Water Supply Systems extended by end of 2019/2020 financial year Thirty eight springs protected by end of 2019/2020 financial year One thirty five boreholes rehabilitated by end of 2019/2020 financial year
Outcomes
Reduction of water and poor sanitation related diseases Increased household incomes Reduction in late coming by school children since they are the most involved in fetching
water from long distances Increased time for other developmental activities Improved personal and household sanitation and hygiene
Strategies
Target investments in water stressed areas by constructing Gravity Flow Scheme (GFS), springs protection. Promote and scale up rainwater harvesting at household, public institutions and community level.
Improve functionality, sustainability, resilience and source protection of water supply systems in rural areas
Promote Public Private Partnership arrangements to increase accessibility of water sources
Implement demand led sanitation and hygiene through Community Led Total Sanitation and promotion of hand-washing campaigns
Enforce laws regarding operation and maintenance of water and Sanitation projects
Interventions Construction and extension of piped water systems Construction of springs

120
Rehabilitation of boreholes Construction of public latrines and toilets Formation, training water and sanitation committees Advocacy meetings Post construction support supervision
Under software, there has been appositive improvement in management of point water sources by having water user committees that are gender sensitive.
PRODUCTION
Departmental Objective:
To increase farmers and entrepreneurs‟ income through promotion of agricultural market orientated enterprises.
Strategies:
Mobilization, sensitization and training of farmers and entrepreneurs.
Developing and strengthening the provisions of sustainable rural financial services.
Promoting value addition for agricultural products.
Sector Objectives and strategies:
To enhance Agricultural Production & productivity through Sensitizing & farmers training,
Surveillance of Diseases & pests and operation of plant clinics
To promote fish production & productivity through training farmers in aquaculture
To address cross cutting issues into production through Sensitization for Gender
mainstream PWDs, Youth HIV/AIDS
To enhance production of quality inputs and agriculture products through procurement of
improved crop varieties
Objective:
To provide advisory services and information to farmers and entrepreneurs
Strategies:
Mobilizing and train farmers including orphans and vulnerable Children (OVC) care
givers and people with Disability (PWDs) on various profitable enterprises and
management.
Providing market information and link farmers to various key players and strengthening
agricultural data base at all levels in LGs.
Sensitizing, training farmers and staff in land use and management (soil & water
facilities)

121
To update of agricultural statistics by updating existing data of Agro Processing and
production trends
Objective: To ensure food security by increasing food production and storage. Strategies:
To provide and support farmers including orphans and vulnerable Children (OVC) care
givers and PWDs to access high quality technologies that appropriate to the conditions
of the district. Provision of improved planting materials through OWC officers and
monitoring utilization by beneficiaries.
Link farmers to financial institutions to access agricultural loans for agricultural
investment.
Control of crop and animal diseases.
Ensure high quality services and inputs and agricultural products through inspection and
certification systems.
Reduce post harvesting losses.
Encourage value addition to agricultural products.
Establish demonstration centre e.g Bwanga Farm for Farmer hands on training.
Promote min-irrigation systems
Revitalization of banana task forces in the whole District.
Provide knowledge and skill to famers through farmer field schools and demonstrations
among other methods of extension.
Surveillance of Diseases & pests and operation of plant clinics
Objective:
Improving access to critical farm inputs
Promoting agriculture mechanization
Improving access to high quality seed and planting material and animal breeds
Increasing access to water for agriculture production
Enhancing access and use of fertilizers by all categories of farmers.
Controlling pests, vectors and diseases.

122
Objective:
Improving agricultural markets and value addition for prioritized commodities
Promoting value addition and storage as means to increase access to markets
Promoting appropriate technologies and practices for minimizing post harvest market losses
Developing and expanding a sustainable market information system
Development and improving food handling, marketing and distribution systems.
Strengthening capacity for quality assurance, regulation and safety standards to promote increased trade at all levels in the district.
INTERNAL AUDIT Vision: An independent and objective Internal Audit function within 30 years. Mission: A transparent and accountable population in service delivery Goal: To improve accountability and transparency in service delivery. Departmental Objectives and Strategies: Objective 1 To improve financial management and accountability to promote compliance with the Local Government Act and The Local Government Financial and Accounting Regulations and other existing laws Strategies
. Regular audit visits to departments and institutions funded by Government
. Regular site visits to implemented construction of government projects
. Attending trainings on internal audit professional practice in order to keep astride with changes
Objective 2 To provide assurance and consultancy services on the adequacy and effectiveness of the control, risk management and governance processes so as to add value. Strategies Regular appraisal of controls, governance and risk in the district systems Championing the production of the risk management, control and governance policies of the district Regular audit of books, documents and systems of the district Objective3 To review value for money in the provision of goods and services in the district Strategies Regular site visits to implemented construction of government projects Regular audit of books, documents and systems of the district Attending trainings on internal audit professional practice in order to keep astride with changes

123
3.6 SUMMARY OF SECTORAL PROGRAMS/PROJECTS 2015/2016 -2019/2020
TABLE: 3.6.1 SUMMARY OF SUPPORT SERVICES SECTORAL PROGRAMS/ PROJECTS AND ACTIVIES FOR THE PERIOD 2015/2016 -2019/2020
MANAGEMENT
Activity/Project Name
Annual budget (000) GoU budget
LG Budget
Dev’t partners off budget
Unfunded Total
Year 1 Year 2 Year 3 Year 4 Year 5
SECTOR ; MANAGEMENT SUB SECTOR: HUMAN RESOURCE MANAGEMENT
Training of staff 60,646 63,678 66,862 70,205 73,715 335,107 335,107
Recruitment of staff
61,640 61,640 61,640 61,640 308,200 308,200
SUB SECTOR: PROCUREMENT
Procurement Of Goods & Services
8,400 8,820 9,261 9,724 10,210 46,415 46,415
SUB SECTOR: COUNCIL AND STATUTORY BODIES
Management Of Land Issues
11,987 12,586 13,215 13,876 14,570 52,359 52,359
Facilitating Legislation function of council
12,000 12,600 13,230 13,891 14,586 66,307 66,307
SUB SECTOR: ADMINISTATION
Promotion Of Participatory Democracy & Good Governance
62,000 65,100 68,355 71,772 75,361 342,589 342,589
Promotion Of Accountability Of Resources & Evaluation Of Projects
23,059 24,211 25,422 26,693 28,028 127,415 127,415
SUB SECTOR: INFORMATION AND PUBLIC RELATIONS.
Information Management Systems
120,380 126,399 132,718 139,354 146,322
665,175 665,175
Updating District Website
15,000 15,750 16,537 17,369 18,237 82,894 82,894

124
FINANCE DEPATMENT
PROJECT NAME
TIME FRAME (000) GoU Budget
LG Budget
DEV’T Partners Budget
UNFUNDED
TOTAL (000)
Yr 1 2015/16
Yr 2 2016/2017
Yr3 2017/2018
Yr 4 2018/2019
Yr 5 2019/2020
Financial management services
71,165
48,448
53,293
58,622
64,484
296,012
296,012
Revenue Management and Collection Services
20,200
16,500
18,150
19,965
21,962
96,777
96,777
Procurement of a vehicle
150,000 150,000 150,000
Budgeting and Planning Services coordinated
15,250
12,250
13,475
14,823
16,305
72,103
72,103
Local Government Accounting services coordinated
15,476
15,476
17,023
18,725
20,597
87,297
87,297
Expenditure management services coordinated
7,000
10,000
11.000
12,100
13,310
53,410
53,410
Integrated Financial management system (IFMS)operated
30,000
30,000
33,000
36,300
39,930
169,230
169,230
PLANNING UNIT
Project Name
Time frame (000) GoU Budget
LG Budget
Devt Partners Budget
Unfunded Total (000)
Yr1 Yr2 Yr3 Yr4 Yr5
Holding of the Budget Conference
18,200 18,850 20,500 22,553 22,270 102,373 102,373
Preparation and formulation of BFP
2,683, 2,818, 2,959 3,106 3,262 14,828 14,828
Procurement & supply of stationary
8,000 8,200 8,210
8,450 8,725 41,585 41,585
Consolidating the 2,100 2,205 2,315 2,431, 2,552 11,603 11,603

125
district Annual work plan
Preparation of a District Statistical Abstract
4,500 4,700 5,000 5,500 6,000 25,700 25,700
Monitoring and Evaluation of District projects and activities
18,405 19,101 20,293 21,487 22,980 102,266 102,266
Mentoring LLGs in mainstreaming crosscutting issues, Planning and budgeting
12,228 12,840 13,482 14,156 14,864 67,570 67,570
Carry out internal assessment
4,000 4,350 4,717 5,103 5,598 23,768 23,768
Preparation and submission of quartery performance Reports
6,450 6,922 7,418 7,939 8,486 37,215 37,215
Holding TPC and budget desk meetings
4,307 4,307 4,472 4,646 4,828 22,560 22,560
General office management
14,128 14,735 15,375 16,040 16,742 77,020 77,020
Purchase of equipments under retooling (LGMSD)
9,487 9,862 11,255
11,668 12,101 54,373 54,373
Monitoring of LGMSD projects
10,760 11,298 11,862 12,456 13,078 59,454 59,454
Partcipatory planning & investments services for LGMSD projects
7,487 7,862 8,255 8,668 9,101 41,373 41,373
Preparation of annual and quarterly work plans and budgets attending workshops and seminars
4,000 4,100 4,205 4,313 4,429 21,047 21,047
Internent sub-scription
4,205 4,313 4,429 12,947 12,947
Repair and maintenance of office equipments and veichles
6,500 9,620 12,766 12,894 13,000 54,780 54,780
Holding of district management meetings
2,500 2,500 3,000 3,500 3,700 15,200 15,200
LLGs and sectors assisted in intergrating
4,000 4,100 4,205 4,313 4,429 19,250 19,250

126
population issues in development planning process
Community sensitization about population issues
3,000 3,250 3,500 4,000 5,500 19,250 19,250
NATURAL RESOURCES
Project name Yr 1 (‘000)
Yr 2 (‘000)
Yr 3 (‘000)
Yr 4 (‘000)
Yr 5 (‘000)
GoU Budget („000)
LG Budget („000)
Devt Partners off Budget („000)
Unfunded („000)
Total
Sector: Natural Resources
Sub-Sector: Administration
Conduct departmental meetings, mentoring sessions and prepare reports
150 250 300 450 550 0 1,700 0 0 1,700,000
Prepare work plans and budgets
100 135 136 140 142 0 0 0 653 653,000
Appraise the performance of staff
0 0 125 125 130 0 0 0 380 380,000
Payment of staff salaries and wages
125,503 142,047 153,030 160,450 168,890 749,920 0 0 0 749,920,000
Sub-Sector: Environment
Monitoring and evaluation of environment compliance
0 500 550 585 600 0 0 0 2,235 2,235,000
Participate in review of EIAs
0 650 680 700 750 0 0 0 2,780 2,780,000
Environmental screening of projects
1,500 2,000 2,250 2,500 2,750 0 0 0 11,000 11,000,000
Sub-Sector: Wetlands
Community training in wetland management
1,800 1,450 1,550 1,680 1,700 8,180 0 0 0 8,180,000
River bank and wetland restoration
1,196 3,859 3,980 4,050 4,150 17,235 0 0 0 17,235,000
Sub-Sector: Land Management
Surveying of governed land
0 19,000 22,005 19,870 14,500 0 0 0 75,375 75,375,000
Physical Planning of urban centers
0 16,000 18,670 22,000 11,000 0 0 0 67,670 67,670,000
Processing of 5,000 6,500 7,120 7,805 8,140 34,565 0 0 0 34,565,000

127
land application files for titling
Sub-Sector: Forestry
Tree Planting and afforestation
9,059 6,600 9,059 10,125 11,105 45,948 0 0 0 45,948,000
Training in forestry management
2,753 1,000 2,753 2,950 3,105 12,561 0 0 0 12,561,000
Forestry regulation and inspection
4,000 2,000 4,000 4,250 4,500 18,750 0 0 0 18,750,000

128
COMMUNITY
Activity/Project Name
Annual budget (‘000) GoU budget
LG Budget
Dev’t partners off budget
Unfunded
Total
Year 1 Year 2 Year 3 Year 4 Year 5
SECTOR : COMMUNITY BASED SERVICES
Child Protection 270,000 245,000
250,000
280,000
195,000
15,000 1,075,000 110,000 1,200,000
Cultural Development
20,000 20,000 20,000 20,000 20,000 - 2,500 - 97,500 100,000
Community Based rehabilitation
52000 52000 52,000 52,000 52,000 134,000
6,000 120,000 260,000
Community Mobilization and Empowerment
40,000 40,000 40,000 40,000 40,000
16,000
- - 184,000 200,000
Functional Adult Literacy
50,000 50,000 50,000 50,000 50,000 60,000
- 140,000 200,000
Gender mainstreaming
10,000 10,000 10,000 10,000 10,000 -
10,000 - 40,000 50,000
Labour and Industrial relations
10,000 10,000 10,000 10,000 10,000
10,000 40,000 50,000
Youth development 230,000 520,000
520,000
520,000
520,000
2,200,000
110,000,
2,310,000
Women Empowerment
10,000 210,000
210,000
210,000
210,000 769,000
- 81000 850,000

129
EDUCATION
Development Outs
Time frame (‘000) GoU budget
LG Budget
Dev’t partners off budget
Unfunded Total (000)
Year 1 Year 2 Year 3 Year 4 Year 5
Gains made in academic performance in the previous years from 98-99% consolidated and improved.
32,631 35,894 39,483 43,431 47,775 199,215 199,215
Primary schools constructed.
3,500,000
World Bank
3,500,000
3,500,000
Community involvement in education to ensure support to teachers and pupils enhanced.
5,000 5,500 6,050 6,655 7,320 30,525 30,525
Strengthening the management of 162 Government Aided Primary schools and other educational institutions improved.
440,781 484,859 533,345 586,679 645,347 705,4752 705,4752
Participation in sports, music Dance and drama scouting and girl guiding improved.
106,292 116,922 128,614 141,475 155,623 648,928 648,928
Educational opportunities for children with (SNE) Increased
1,000 1,100 1,210 1,331 1,464 6,105 6,105
The quality of teaching and learning) enhanced.
100,000 110,000 121,000 133,100 146,410 331,279 331,279
Effective Routine supervision (transport means)
0
160,000
0
0
0
160,000
160,000

130
WORKS DEPARMENT
Project name Yr 1
(‘000) Yr 2 (‘000)
Yr 3 (‘000)
Yr 4 (‘000)
Yr 5 (‘000)
GoU Budget (‘000)
LG Budget (‘000)
Devt Partners off Budget (‘000)
Unfunded (‘000)
Total
Sector: Works
Sub-Sector: Roads
Routine Mechanised maintenance of Roads (1,008Km)
297,220 320,000 410,000 500,000 590,000 2,117,220 2,117,220
Routine Manual maintenance of Roads (580km)
106,930 89,930 106,930 106,930 106,930 517,650
517,650
Addressing road bottle necks on Community Access Roads (CARs) in 9Sub-Counties
88,850 213,850 300,000 405,000 446,550 1,354,250
100,000
1,454,250
Procurement of 440 Culverts, Maintenance of 13 No. drainage structures, Embankment fillings 17No.
38,000 48,674 113,470 129,470 139,736 469,350
469,350
Construction of 3 No. Bridges
0 0 1,066,667
1,566,667
1,566,666
4,200,000
4,200,000
4,200,000
Sub-Sector: Buildings
Construction of District Administration Building
688,700 218,700 318,700 418,700 318,700 1,813,500 150,000
1,963,500
Maintenance of Buildings and Compound cutting
20,750 20,750 25,750 25,750 25,750
118,750
118,750
Construction 4No. VIP Latrines
21,000
0
21,000
21,000
21,000
84,000
84,000
Sub-Sector Office
Procurement of Supervision/ Service vehicle and fleet maintenance
78,383 78,383 238,383 85,390 85,390
565,929
565,929
Procurement of Furniture
0 1,075
2,075
2,075
1,075
3,150
3,150
6,300
Procurement of Photocopier, Printer, UPS
0 0 5,250 5,250 5,250 15,750
15,750

131
PRODUCTION
Activity/Project Name
Annual budget GoU budget (000)
LG Budget (000)
Dev’t partners off budget
Unfunded (000)
Total (000)
Year 1
Year 2 (000)
Year 3 (000)
Year 4 (000)
Year 5 (000)
Rice seed NERICA 4 Gold
8,000 8,800 9,680 10,648 37,128,
37,128,
Mangoes grafted seedlings
6,000 6,600 7,260 7,986,
27,846
27,846
Avocado grafted seedlings
3,000 5,000 5,500 6,050 19,550
19,550
Procurement of banana suckers and demo establishments
5,000 5,500 6,050 6,655
23,205
Establishment of tea, apple, banana & coffee Demos
30,000 33,000 36,300
39,930 139,230
139,230
Fish pond demonstration established
6,000 6,600 7,260 7,986
27,846
27,846
Procurement of water testing kit and maintenance
0 6,000 60,000 70, 000
6,060
6,060,000
Procurement of fishing gears
0 5,000 5,500 6,050 16,550
16,550
Construction fish handling facility and maintenance
10,000 200,000 220,000
10,420
10,420
Procuring yearling bulls
7,500 8,250 9,075 9,98 24,825
24,825
Procurement of rabies vaccine
3,500 3,850 4,235 4,658 16,243
16,243
Construction of slaughter slabs
16,675 18,342 20,176 22,194 77,388
77,388
Procurement of pigs
18,000 19,800 21,780 59,580
59,580
Maintenance and improvement of Bwanga stock farm
18,342 20,176 22,194
60,713
60,713
Procurement and distribution of birds
40,000 44,000 48,400
53,240 190,964
40,000
190,964
Procurement of heifers and distribution to farmers
450,000 495,000 544,500 598,950
2,088,450
0 0 0
2,088
Procurement bee hives
4,500 4,950 5,445 5,989 20,884
20,884
Procurement of 8,000 8,800 9,680, 10,648 37,128 37,128

132
assorted honey harvesting gears
Procurement of assorted processing equipment
8,800 9,680 10,648
29,128
29,128
Procurement of tsetse fly traps
5,000 5,500 6,050 16,550
16,550
Establishment of apiary demonstration site.
16,675 18,342 20,176 22,194,
77,388
77,388
INTERNAL AUDIT
Activity/Project Name
Annual budget shs ‘000 GoU budget
LG Budget
Dev’t partners off budget
Unfunded Total
Year 1 Year 2 Year 3 Year 4 Year 5
Internal Auit
Routine audit of depts, institutions and projects
14,700 14,700
14,700
14,700 14,700 68,500 5,000 73,500
Value for money reviews of constructed projects, provision of goods and services
7,400 7,400 7,400 7,400 7,400 34,500 2,500
37,000
Preparation and submission of quarterly reports
1,800 1,800
1,800 1,800 1,800 1,000 9,000
Procurement of motor vehicle
150.000
150,000
ATTENDING WORKSHOPS AND AGMS
2,900 2,900 2,900 2,900 2,900 1,500 14,5
Procurement of laptops
3,000 6,000 6,000

133
CHAPTER 4: LGDP IMPELEMENTATION, COORDINATION AND PARTNERSHIP FRAME WORK
Introduction
The chapter presents LGDP implementation and coordination strategy, institutional arrangments, integration and paternship arraignments and the pre-requisites for successful implementation of the plan. The main purposes of this Chapter is to provide strategic guidance on the required institutional policies and a number of pre-conditions that will be required to be in place for successful implementation of the LGDP. Meaningful planning and consequently development can only be realized through a multi-sectoral approach. All sectoral objectives and strategies should hinge on achieving the District Vision and mission. Under this chapter therefore, a range of sectoral activities / strategies and the respective objectives are highlighted. The chapter comprise of LGDP implementation and coordination strategy, institutional arrangement, Intergration and partenship arrangments and pre-requisite for successful LGDP implementation.
4.1 LGDP Implementation and coordination strategy
The plan will be implemented through the Medium Term Expenditure Frame Work (MTEF) through the Annual workplans, budgets framework papers and budgets. The key elements of the implementation strategy are to ensure responsibility for developing and implementing the plans under different programs. Both participatory approach and public private partnership will be used in implementing and monitoring the implementation of the district development plan. Implementation will be coordinated by the office of Chief Admini There are number of institutions that will be involved the implementation of the district development plan that include district departments, Lower Local Governments, Civil Society organizations and the private sector. Departments, Lower Local Governments and Civil Society organizations will be responsible for initiating procurements and contracting out of projects, supervision, monitoring and reporting. While the members of private sector (contractors and service providers will be responsible for implementing the contracted works and services. The district executive committee and office of the Resident District Commissioner will oversee the implementation of the plan over the five year period. The district development plan will integrate interventions from all stakeholders most especially interventions from lower local governments, departments and civil society organizations. This will be done by sequencing activities and projects in such way that there are clear linkages between projects that will require inputs, work in progress from other department s or lower local governments. The higher local governments will also take care of lower local governments‟ projects that may have financial implications on the higher local governments. The district intends to focus its attention on both service delivery and local economic development/wealth creation. This will be achieved through engagement both public led approach and public private partnership.

134
There is need for operationalising the production and marketing sector structure and Ensuring filling of key staff positions of all departments both the district and lower local governments. For this plan to be successfully implemented there is need for mobilizing adequate financial resources and equipments (road equipment and equipments for establishment of valley dams). Central Government should make available road equipments and machinery for excavating valley dams for water for production. The district can also seek for donations through proposal writing and public private partnership. All the stakeholders need to work as a team and with commitment if the objectives of this plan are to be realized. The office of the Chief Administrative Officer and Chairperson LC V need to build team work and push the transformation process forward. This will require attitude change and better work ethics.strative officer assisted by planning unit in order to enhance efficiency and effectiveness in implementation of this plan for sustainable achivements of targets, goal and objectives.
4.2 LGDP institutional Arrangements
The district will continue to conduct weekly senior management meetings, monthlyTechinical planning meetings, at district level and Lower Local government levels, mothly revenue meeting at district level, distrct executive committee meetings and councils meetings, quarterly review mideeting, district management meeting (DMC) with implementing parternrs on a quarterly basis, pre- bid conference with service providers and any other stakholders in course of implementing this plan. The number of institutions that will be involved the implementation of the district development plan include district departments, Lower Local Governments, Civil Society organizations and the private sector. Departments, Lower Local Governments and Civil Society organizations will be responsible for initiating procurements and contracting out of projects, supervision, monitoring and reporting. While the members of private sector (contractors and service providers will be responsible for implementing the contracted works and services. The district executive committee and office of the Resident District Commissioner will oversee the implementation of the plan over the five year period.
4.3 LGDP Integration and Partnership Arrangements
The district development plan will integrate interventions from all stakeholders most especially interventions from lower local governments, departments and civil society organizations especilally conducting annual budget stakeholder consultatative conference, district management committee meeting with implementing parteners. This will be done by sequencing activities and projects in such way that there are clear linkages between projects that will require inputs, work in progress from other department s or lower local governments. The higher local governments will also take care of lower local governments‟ projects that may have financial implications on the higher local governments. The district intends to focus its attention on both service delivery and local economic development/wealth creation. This will be achieved through engagement both public led approach and public private partnership. The district will to ensure that jont monitoring with implanting parterners, sharing our BFPs, workplans and annual budget but the district and implementing parterners as well as participatory planning meeting and interterface meeting with community members.

135
4.4 Pre-Requisites for Successful LGDP Implementation Financing There is need to undertake infrastructures to mobilize resources for operationalizing the plan. There is need to search support from the Development partners and the District own locally generated sources of financing and other support from the central government. Structure and staffing: There is need for insuring that there is the filling of key staff positions of all departments both the district and lower local governments especially in health, community and administration. This can be achieved by the ministry of public service operationalising the structure of health, production and other department, advertising for un filled key positions and head hunting for those that may be difficult to get through the normal recruitment procedures. Equipments: For this plan to be successfully implemented there is need for mobilizing adequate financial resources to procure equipments (road equipment and equipments for excarveting rocky and un friendly terrain like kabuga and Nyarwimuka in Nyarushanje and Ruhinda sub-counties respectively). Central Government should make available new road equipments and machinery since the exisiting ones exprience frequent breakdowns. The district can also seek for donations through proposal writing and public private partnership. Team work and commitment: All the stakeholders need to work as a team and with commitment if the objectives of this plan are to be realized. The office of the Chief Administrative Officer and Chairperson LC V need to build team work and push the transformation process forward. This will require attitude change and better work ethics. In order to foster collaboration and comprementarities in the district planning process CSOs/NGOs, CBOs, FBOs Private sector will play key roles including;
Participating in planning and budgeting meetings of the district.
Making available their plans and budgets for intergration into the district budgets
Providing information about their on going and planned interventions for intergration in the LG development
Contributing funding towards the implantation of LGDP
Bringing in their expertise to facilitate the district in planning process like SDS under USAID perterhip.
Private sector Creating an effective support system for emerging entrepreneurs is a multi-faceted endeavour requiring a range of regulatory changes and programmatic support at a variety of institutional levels For this reason, it is useful to use the LED framework and Capacity building of the staff to be to mentor busseness community in oder Contribute to sustainable development business practices This approach suggests ten pillars towards promoting effective interventions
Establishment, management and operation of business enterprises to the benefit of enterprise and community at large.

136
An enabling environment which provides for an attractive investment climate and dynamic entrepreneurship.
Adequate mechanisms, processes, and structures that address local needs.
Active private sector institutions and linkages.
Functioning and effective infrastructure.
Access to effective and efficient support services and resources.
Adaptive management capacity and entrepreneurial competence within business and enterprises.
Local organisations, groups and associations representing the poor.
Active participation and ownership of development processes by well-linked stakeholders
Sustainable employment creation, income generation and investment as part of the execution of the business practices
Ongoing learning from success and failure by all stakeholders (sharing lessons learned).Access to open and integrated markets.
M&E FRAMEWORK SYSTEM
The M&E for this plan to successed, the M&E framework will have the following policy implications.
Integration of the existing management information systems.
Refinement of the existing monitoring and information management systems to ensure that they provide a harmonized, objective and rational basis for effective tracking evaluation and feedback on the DDP Actions and result framework.
Fully functionalizing the District Planning Unit in terms of staffing and other logistical requirements like reliable internet, veichle and computers and lap top digital camara and others.
Adequate resourcing of data collection and M&E activities by establishing for M&E and data collection.
Local Governments: The District will be responsible for monitoring service delivery and accountability for results. The District departments will be responsible for reporting on progress of implementation and achievement of planned outputs. This will involve reporting on the process of implementation focusing on implementation constraints and challenges. Community Level actors: These comprise of sub-counties, community based NGOs, administrative units. They will provide information on delivery of various services, transparency of resources given and challenges and gaps experienced in delivery of various services. They also validate outcomes of implementation of the DDP in their respective areas. Household actors: These comprise of individual citizens and constitute the primary beneficiaries of the DDP strategies and initiatives. The role of citizens is to provide information on the DDP implementation and delivery of target outputs as well as validating results for better service delivery and accountability mainly through the sub-county Baraza‟s. Development partners: These will support the implementation of M&E activities, capacity building for M&E and use of M&E products.

137
CHAPTER 5: LGDP FINANCING FRAMEWORKS AND STRATEGY
The chapter presents overview of development resources and the projections by source as well as the resource mobilisation strategies. It comprise and shows mechanism and strategy the district will use to use finance the including the Resource mobilisation strategy.
5.1 Resource mobilization strategy
The District has developed a Revenue enhancement plan that serves as the key framework for revenue mobilization and clearly spells out the modalities to be used, lists the major expected sources and strategies as well as key stakeholders. The anticipated challenges and how they will be tackled are also indicated. Other revenue mobilization strategies include lobbying of development partners including Donors, Central Government Ministries and Agencies, as well as indigenous NGOs, CBOs and CSOs
5.2 Overview of Development resources and projections by Source
The following table indicates Development resource projections by source:

138
Table 5.1 district revenue projects by source
REVENUE BY SOURCE FY
2015/2016
FY
2016/2017
FY
2017/2018
FY
2018/2019
FY
2019/2020
1. Local revenue
a)Local Hotel Tax 820,000 500,000 550,000 605,000 665,500
b)Rent & rates from other gov‟t units
41,426,000 53,176,000 58,493,600 64,342,960 70,777,256
c)Registration of businesses
11,800,000 12,320,000 13,552,000 14,907,200 16,397,920
d)Registration of births, marriage & deaths
12,460,000 13,260,000 14,586,000 16,044,600 17,649,060
e)Other licenses 9,150,000 10,555,000 11,610,500 12,771,550 14,048,705
f) Rent & rates from other private units
53,820,000 66,620,000 73,282,000 80,610,200 88,671,220
g)Local Service Tax 80,000,000 74,925,000 82,417,500 90,659,250 99,725,175
h)Park fees 4,040,000 3,660,000 4,026,000 4,428,600 4,871,460
i)Land fees 16,362,000 18,770,000 20,647,000 22,711,700 24,982,870
j)Business licenses 71,850,000 66,700,000 73,370,000 80,707,000 88,777,700
k)Application fees 16,300,000 17,300,000 19,030,000 20,933,000 23,026,300
l)Animal & crop husbandry related levies
29,550,000 45,450,000 49,995,000 54,994,500 60,493,950
m)Advertisements /billboards
900,000 1,600,000 1,760,000 1,936,000 2,129,600
n)Market/gate charges 99,960,000 113,460,000 124,806,000 137,286,600 151,015,260
o)Other fees & charges 14,950,000 7,530,000 8,283,000 9,111,300 10,022,430
p)Miscellaneous income 9,277,000 21,178,000 23,296,900 25,626,590 28,189,249
q)Sale of non-produced goods(scraps)
7,000,000 17,500,000 19,250,000 21,175,000 23,292,500
Sub-total 479,665,000 544,504,000 598,955,500 658,851,050 724,736,155
2-Central Govt Grants
a)Urban unconditional grant-N/w
0 76,408,000 84,048,800 92,453,680 101,699,048
b)District Discretionally Development Equalization Grant
380,260,000 251,886,000 277,074,600 304,782,060 335,260,266
c)Urban Discretionally Development Equalization Grant
0 31,338,000 34,471,800 37,918,980 41,710,878
d)District unconditional grant N/w
1,304,102,000 737,164,000 810,880,400 891,968,440 981,165,284
e) Urban unconditional grant-wage
0 377,295,000 415,024,500 456,526,950 502,179,645
f) District unconditional grant-wage
1,613,290,000 1,965,594,000 2,162,153,400
2,378,368,740 2,616,205,614
g)Pension arrears 264,392,000 290,831,200 319,914,320 351,905,752
h)Gratuity for LGs 504,405,000 554,845,500 610,330,050 671,363,055
i)Pension for LGs 2,077,502,000 2,285,252,200
2,513,777,420 2,765,155,162
j)Sector conditional grant wage-Education
16,706,756,000 18,377,431,600
20,215,174,760 22,236,692,236
k) Sector conditional grant wage-N/w
4,560,902,000 5,016,992,200
5,518,691,420 6,070,560,562
l)Transitional Development grant-Water
426,348,000 468,982,800 515,881,080 567,469,188
m)Development grant 685,211,000 753,732,100 829,105,310 912,015,841
n)District road fund grant 585,157,000 666,876,987 733,564,686 806,921,154 887,613,270
o)MoES-UNEB 12,768,000 16,155,000 17,770,500 19,547,550 21,502,305

139
p)MoGLSD-YLP 268,745,000 268,745,000 295,619,500 325,181,450 357,699,595
q)UWA share 50,000,000 53,500,000 58,850,000 64,735,000 71,208,500
r)MoH 450,000,000 450,000,000 495,000,000 544,500,000 598,950,000
Sub-total 1,366,670,000 30,120,477,987 33,132,525,786
36,445,778,364 40,090,356,201
3-Donor Funds
Sub-total 206,292,896 267,039,000 293,742,900 323,117,190 355,428,909
Grand Total (1+2+3 and others
2,052,627,896
30,932,020,987 34,025,224,186
37,427,746,604 41,170,521,265
Strategies to improve local revenue generation in the district
The department will carry out the capacity building for accounts staff in form of training, sensitisation and availing relevant literature.
The department will recruit staff to second the sub-accountants for efficiency and effectiveness of revenue collection and management.
Lobbing the government through area members of Parliament to increase the salaries for Government employees to improve the remunerations/facilitation.
Intensifying revenue mobilization and collection in the District to be able raise more revenues to fence the markets and improve on the enumeration/facilitation of revenue collectors.
The district council under the leadership of District clarification lobby the Central Government (Mother Ministry and Ministry of Finance, Planning and Economic Development to provide means of transport.
Think about alternative sources of Revenue like Tourism, Leasing District pieces of land and engaging tea growing to improve on the District Revenue base.
Devising means of collecting Local Service Tax (LST) from Commercial farmers other than government employees only whose deductions are recovered the payroll.
Lobbing the Central Government to re-instate the district to its provisions status of District Unconditional Grant Quarter possibly increase its allocation to cater for the lost revenue to Town Council thus reducing Budget cuts.
Lastly setting up District Committee to write proposals to different Development partners for funding different projects which will eventually improve on the district resource envelope.

140
CHAPTER 6: MONITORING AND EVALUATION FRAME WORK AND COMMUNITION STRATEGY
6.1 INTRODUCTION
This section provides an overview of the measurements, analysis and reporting needed to monitor and evaluate the DDP. The detailed monitoring and evaluation (M&E) strategies, including the results and M&E framework, the plan for data collection, analysis and storage, reporting flows and formats, the plan for the communication of DDP results and review, the capacity building plan as well as the implementation schedule. M&E is essential part of the implementation of the plan because it guides the district in measuring performance and assess the efficiently and effectiveness of implementing Government Programmes and taking corrective action and introducing changes where necessary in order to achieve the intended objectives. The purpose of monitoring and evaluation is to collect and manage data to be used for the regular and periodic assessment of the LGDP in order to ensure effective and efficient implementation of various priority actions in addressing the Development Plan. Monitoring and evaluation of the DDPII will be carried out using participatory approaches. The responsibility of M&E is assigned to the Chief Administrative officer assisted by the planning unit to everyone in the district with the District having primary responsibility of ensuring its implementation. Major assumptions in Monitoring and Evaluation The key assumptions of this system are that the district treats DDPII implementation as a priority and that the district will provide budgetary support for commitment for LGDP implementation. Operational arrangements and skills already exist to collect the required information, compile it in the recommended format and to disseminate it as appropriate. District development planning and the statutory LGDP review period are also assumed to be not less than two and half years and the operational plans and budgets are revised annually. It is further assumed that because of the conditions whose existence made the activities necessary in the first place, the progress being monitored will actually take place
6.1. 2. LGDP MONITORING AND EVALUATION MATRIX
To facilitate alignment with the NDP monitoring and evaluation framework, the district adopted the same monitoring and evaluation matrix as that of the NDP. The departments and LLGs implementing district activities completed a monitoring and evaluation matrix for the activities under its jurisdiction to be implemented for financial years 2015/2016 – 2019/2020. The matrix below will be the primary guide for implementing the district M&E strategy.

141
Table 6.1 Finance and planning M & E matrix
Specific Ob Jective
Strategy Intervention
Output Information Needs & Indicators
Baseline Information
Data Gathering Methods
Frequency
Resources
Reporting and Feedback
Responsibility Centre
To improve Data management systems, data usage for planning and decision making at all levels improved and strengthened
Preparation and production of the District Statistical Abstract. Training in Data management. -Establishing of Data Banks
Conduct staff training for skills development and knowledge acquisition Promote Public awareness through publications, media and electronic resources
District Statistical Abstract. produced Training in Data management. - Data Banks establshed
Census roports OBT database and departmental targets. Quarterly performance targets
Interviews, M & E reports and obervations Surveys
anualy Compunters Internet Veichle Human resouce
Annual joint review Quarterly review Mid term and end term evaluation
Planning unit
To facilitate and improve financial management, local revenue expansion and accountability.
Human skills development
Human resource trainings Capacity building and technical backstopping
No of staff covered in 22LLGs and District departments‟ Local revenue mobilized aincreasingRevenue best practices implemented Level of Tax base widened New potential taxes identified.
Level of transformation of skills development programmes. Level of enhancement of capacity training centers
Administrative data, Spot Checks and rapid head count
Quarterly Annually
Human resource Funds
Monthly, Quarterly and annual reports
Finance, Planning and human resource

142
To mobile assess and improve local revenue collections
Mobilize assess and collect local revenues
Identify and Develop tax payers‟ register.Create public awareness on taxes.
Tax register Revenue enhancement plan
Level of compliancy amongst tax payers. Scline in the levels of tax Evasion.
Administrative data, Surys
Quarterly Bi annual
Human resource Funds
Reports Finance
To prepare, coordinate, analyze and appraise the lower local councils and district development activities.
Harmonized and Integrated development planning and budgeting process. Harmonized & integrated budgeting reporting.
Conduct consultative meetings with LLGs, NGOs, Budget desk & HoDs on budgeting and planning issues. Conduct meetings to complete quarterly and annual reports.
Plans and Budgets that address population issues at all levels formulated and approved generated under OBT. Quarterly and annual reports completed
OBT database and departmental targets. Quarterly performance targets.
Survey Stakeholder Meetings and Workshops Administrative Records
Quarterly
Human resource Funds
Ministries Councils De partments Development Partners
Planning Unit
To develop capacity of staff in use an utilsation of ICT
Human Skills development in ICT, data collection, storage and utilization.
Capacity needs assessment. Training of staff in data collection, storage & storage. Hand on training in
No of LLGs, staff and departments covered. Number of staff trained.
reports on performance gap
Needs assessment tool
Annual and quaterly
Humana Funds
Office equipments
Internal assement Annual and quarterly reviews
Planning Unit Human Resource Dept

143
Management
Specific Ob Jective
Strategy Intervention Output Information Needs & Indicators
Baseline Information
Data Gathering Methods
Frequency Resources Reporting and Feedback
Responsibility Centre
To ensure compliance with financial and accounting regulations and the Local Government Act.
Auditing and inspection, support supervision and mentoring.
Regular internal audits, support supervision and mentoring.
No. of LLGs /Departments that are compliant to Financial and Accounting Regulations and the; Local Government Act.
Less Audit Queries
9 Sub-counties
Reports and review Meetings
Monthly Funds, Human resource
Minutes and Assessment Reports
CAO‟S Office
Support supervision monitoring and evaluation.
Support supervision, monitoring and evaluative
No of field support supervision, monitoring and evaluation visits conducted
Field support supervisions, monitoring and evaluation visits conducted.
All Gov‟t Programs
Reports Monthly Funds, Human resource
Reports and Joint Meetings
CAO HoDs/Sections
To ensure staff motivation.
payment of salaries, promotion of staff, annual increments, Issuance of monthly pay slips.
Timely payment of salaries, promotion of staff, annual increments and Issuance of monthly pay slips
All staff on payroll, paid salaries promptly and pay slips issued
All staff on payroll, paid salaries promptly and given pay slips
All staff Monthly payroll registers and reports
Monthly Funds, Human resource
Monthly payroll registers and reports
HRM/ CFO
To gather and disseminate information
gathering and dissemination of information
Regular gathering and dissemination of information
Gathered and disseminated information
Public notices and electronic messages saved
9 sub-counties
Note taking and recording
4 Funds and other logistics
Public notices and electronic messages saved
CAO RDC DIO

144
To ensure proper coverage of district events
Video and tape recording and photo shooting
Video and tape recording and photo shooting of every event
No. District events covered
Recorded CD‟s, News items and Reports
9 sub-counties
Note taking and recording
All events Funds and other logistics
Recorded CD‟s, News items and Reports
CAO RDC DIO
To ensure coordination of radio and TV programs
Meetings and programming
Schedules for talk shows And Regular meetings
Radio programs coordinated
Coordinat radio programs
All radio programs
Joint meetings and planning
All programs
Funds and other logistics
Reports and review meetings
CAO RDC DIO
COMMUNITY BASED SERVICES
Specific Objectives
Strategy Intervention Output Indication Baseline information
Data gathering methods
Frequency Resources Reporting and feed back
Reporting centre
To ensure proper child care and development
sensitisation sensitising communities on Children‟s rights and responsibilities
Communities sensitized to provide protection to children.
No. of sensitisation events
Review of Activity reports Monitoring reports
Quarterly Annually
Funds Personnel Transport
Review meetings Submitting reports
Disrict Community Development Oficer Chief Administrative officer
support supervision of OVC service providers
OVC service providers supervised
No.of supervision visits made
Review of Activity reports Monitoring reports
Annually
Funds Personnel Transport
Quarterly review meetings
Disrict Community Development Oficer
Enforcement counseling
Handling Children‟s welfare cases
Children‟s welfare cases handled
No. of Children‟s welfare cases handled
Report reviews
Annually Quarterly
Funds Personnel Transport
Review meetings Submitting reports
Disrict Community Development Oficer
Tracing and resettlement of lost and street children
lost and abandoned children resettled
lost and abandoned children resettled
Review of Activity reports Monitoring reports
Annually Quarterly
Funds Personnel Transport
Review meetings Submitting reports
Disrict Community Development Oficer

145
Holding OVC coordination meetings
OVC coordination meetings held
No. of OVC coordination meetings held
Review of Activity reports Monitoring reports
Annually Quarterly
Funds Personnel Transport
Review meetings Submitting reports
Disrict Community Development Oficer
Completion and establishment of a children‟s remand home
children‟s remand home Completed and establishment
children‟s remand home in operation
Review of Activity reports Monitoring reports
Annually Quarterly
Funds Personnel
Review meetings Submitting reports
Disrict Community Development Oficer
To Promote positive cultural values, norms and practices
sensitisation -Providing Financial support to cultural groups
Cultural groups supported
No. of Cultural groups supported
Review of Activity reports Monitoring reports
Annually Quarterly
Funds Personnel
Review meetings Submitting reports
Disrict Community Development Oficer
Holding Annual Cultural Festivals
Annual Cultural festivals held
NO. of Annual Cultural festivals held
Review of Activity reports Monitoring reports
Annually Quarterly
Funds Personnel Transport
Review meetings Submitting reports
Disrict Community Development Oficer
To increase the level of literacy in the District
training Purchase of blackboards and Chalk
Blackboards and chalk procured
NO. of Blackboards and chalk procured
Review of Activity reports Monitoring reports
Annually Quarterly
Funds Personnel
Review meetings Submitting reports
Disrict Community Development Oficer
Holding Functional Adult Literacy review meetings at subcounty and District
Programme review meetings held
NO. of Programme review meetings held
Review of Activity reports Monitoring reports
Annually Quarterly
Funds Personnel Transport
Review meetings Submitting reports
Disrict Community Development Oficer
Carrying out support supervision visits to FAL
Support supervision of FAL programme
NO. of Support supervision visits of FAL
Review of Activity reports Monitoring
Annually Quarterly
Funds Personnel Transport
Review meetings Submitting reports
Disrict Community Development Oficer

146
Classes done programme done
reports
Financial incentive to FAL Instructors
Financial incentive given to FAL Instructors
No. of times Financial incentive given to FAL Instructors
Review of Activity reports Monitoring reports
Annually Quarterly
Funds Personnel
Review meetings Submitting reports
Disrict Community Development Oficer
Equipping a public library
Public library equipped
Amount of Public library equipment in place
Review of Activity reports Monitoring reports
Annually Quarterly
Funds Personnel
Review meetings Submitting reports
Disrict Community Development Oficer
Managing a public library
Public library staff recruited and facilitated
No of Public library staff recruited and facilitated
Review of Activity reports Monitoring reports
Annually Quarterly
Funds Personnel
Review meetings Submitting reports
Disrict Community Development Oficer
To mainstream gender in Government programmes
Collecting data on gender issues
Data on gender issues collected
Amount of Data collected
Review of Activity reports Monitoring reports
Annually Quarterly
Funds Personnel Transport
Review meetings Submitting reports
Disrict Community Development Oficer
training Mentoring staff on Gender issues
Public officials mentored on Gender issues
No. of Public officials mentored
Review of Activity reports Monitoring reports
Annually Quarterly
Funds Personnel Transport
Review meetings Submitting reports
Disrict Community Development Oficer
To ensure community participation in development initiatives, and positive
sensitisation Community mobilization and sensitisation
Communities sensitized on income generating activities, government programmes, leadership, and human rights
No. of sensitisation events held, leadership, and human rights
Review of Activity reports Monitoring reports
Annually Quarterly
Funds Personnel Transport
Review meetings Submitting reports
Disrict Community Development Oficer

147
mindset in the communities
training Training of community-based organizations
community-based organizations trained
Review of Activity reports Monitoring reports
Annually Quarterly
Funds Personnel Transport
Review meetings Submitting reports
Disrict Community Development Oficer
training Facilitation of Participatory planning in parishes
Participatory planning in parishes facilitate
No.of Participatory planning meetings in parishes facilitated
Review of Activity reports Monitoring reports
Annually Quarterly
Funds Personnel Transport
Review meetings Submitting reports
Disrict Community Development Oficer
counseling Family counseling.
Family counseling done
Family counseling done
Review of Activity reports Monitoring reports
Annually Quarterly
Funds Personnel Transport
Review meetings Submitting reports
Disrict Community Development Oficer
training Training women, youth and PWDs in income generating activities and leadership skills
women, youth and PWDs trained in income generating activities
NO. of women, youth and PWDs trained in income generating activities and leadership skills done
Review of Activity reports Monitoring reports
Annually Quarterly
Funds Personnel Transport
Review meetings Submitting reports
Disrict Community Development Oficer Chief Administrative officer
Cash transfer Providing Start –up capital to Persons With Disabilities
PWDs benefitting from Livelihood grants
NO. of PWDs benefitting from Livelihood grants
Review of Activity reports Monitoring reports
Annually Quarterly
Funds Personnel
Review meetings Submitting reports
Disrict Community Development Oficer Chief Administrative officer
Providing grants to the elderly people
The Elderly supported with grants
NO. of The Elderly people supported
Review of Activity reports Monitoring
Annually Quarterly
Funds Personnel
Review meetings Submitting reports
Disrict Community Development Oficer

148
with grants reports
Chief Administrative officer
Providing Assistive devices to PWDs
PWDs provided with Assistive devices
No.of PWDs provided with Assistive devices
Review of Activity reports Monitoring reports
Annually Quarterly
Funds Personnel
Review meetings Submitting reports
Disrict Community Development Oficer Chief Administrative officer
Holding PWDs Council meetings
Holding PWDs Council meetings
NO. of PWDs Council meetings held
Review of Activity reports Monitoring reports
Annually Quarterly
Funds Personnel
Review meetings Submitting reports
Disrict Community Development Oficer Chief Administrative officer
To promote socio-economic development of persons with disabilities
Routine assessment, management and referral of disability cases.
assessment, management and referral of disability cases.done
No. of PWDs assessed,managed,and referred
Review of Activity reports Monitoring reports
Annually Quarterly
Funds Personnel Transport
Review meetings Submitting reports
Disrict Community Development Oficer Chief Administrative officer
Training Training of people with disabilities and Parents/ helpers on disability management
people with disabilities and Parents/ helpers trained on disability management
NO. of people with disabilities and Parents/ helpers trained on disability management
Review of Activity reports Monitoring reports
Annually Quarterly
Funds Personnel Transport
Review meetings Submitting reports
Disrict Community Development Oficer Chief Administrative officer
Support supervision of staff
Support supervision of staff done
NO. of Support supervision visits made
Review of Activity reports Monitoring reports
Annually Quarterly
Funds Personnel Transport
Review meetings Submitting reports
Disrict Community Development Oficer Chief Administrative officer
To promote
Inspection of workplaces
Workplaces inspected
No. of Workplaces
Review of Activity
Annually Quarterly
Funds Personnel
Review meetings
Disrict Community

149
adherence to labor laws
inspected reports Monitoring reports
Transport Submitting reports
Development Oficer Chief Administrative officer
sensitisation Sensitising employees and employers
Sensitisation of employees and employers done
NO. of Sensitisation events
Review of Activity reports Monitoring reports
Annually Quarterly
Funds Personnel Transport
Review meetings Submitting reports
Disrict Community Development Oficer Chief Administrative officer
enforcement Handling labour complaints and enforcing labour laws
labour complaints handled and labour laws enforced
NO. of labour complaints handled
Review of Activity reports Monitoring reports
Annually Quarterly
Funds Personnel
Review meetings Submitting reports
Disrict Community Development Oficer Chief Administrative officer
Providing a revolving loan to Youth groups
Youth benefitting from Livelihood revolving loans
NO. of Youth benefitting from Livelihood revolving loans
Review of Activity reports Monitoring reports
Annually Quarterly
Funds Personnel
Review meetings Submitting reports
Disrict Community Development Oficer Chief Administrative officer
Holding Youth Council meetings
Youth Council meetings held
NO. of Youth Council meetings held
Review of Activity reports Monitoring reports
Annually Quarterly
Funds Personnel
Review meetings Submitting reports
Disrict Community Development Oficer Chief Administrative officer
Mobilisation of youth and monitoring youth projects
Youth mobilized and youth projects monitored
No. of mobilisation and and monitoring visits
Review of Activity reports Monitoring reports
Annually Quarterly
Funds Personnel Transport
Review meetings Submitting reports
Disrict Community Development Oficer Chief Administrative officer
Providing a revolving loan to Women groups
Women benefitting from Livelihood
NO. of Women benefitting from
Review of Activity reports Monitoring
Annually Quarterly
Funds Personnel
Review meetings Submitting reports
Disrict Community Development Oficer

150
revolving loans
Livelihood revolving loans
reports
Chief Administrative officer
Holding women council meetings
Women council meetings held
NO. of Women council meetings held
Review of Activity reports Monitoring reports
Annually Quarterly
Funds
Review meetings Submitting reports
Disrict Community Development Oficer Chief Administrative officer
Holding women council study visits
Study visits by Women Councils held
No. of Study visits done
Review of Activity reports Monitoring reports
Annually Quarterly
Funds Personnel
Disrict Community Development Oficer Chief Administrative officer
Natural Resources
Supervise, coordinate and monitor operations of the department
Improving performance. Transparent operations Corrective measures.
Staff mentoring and appraisals
Work plans and Reports No. of staff recruited
- Inspection, Progressive reports, Monitoring
Annually Quartery Monthly
Funds, Personnel, Stationery, Vehicles and enforcement
Weekly, Monthly, Quarterly and annual reports
Management Services, Finance Dept. and Natural Resources Directorate
Ensure sustainable management and use of environmental resources
Ensuring community & develop compliancy to environmental laws and standards.
Mobilization and sensitization of communities on sound wetlands management practices and laws.
Percentage increase in vegetation cover Reports /records
.
Inspection, Progressive reports, Monitoring
Annually Quarterly Monthly
Funds, Personnel, Stationery, Vehicles and enforcement
Weekly, Monthly, Quarterly and annual reports
MoWE. and Natural Resources Directorate (Environment Section)
Ensure sustainable management and use of wetland
Promote wetland resource users compliancy to guidelines, laws
Forming and training locally adjacent wetlands committees
No. of functional wetlands management committees in
Inspection, Progressive reports,
Annually Quarterly Monthly
Funds, Personnel, Stationery, Vehicles and enforcement
Weekly, Monthly, Quarterly and annual
MoWE. and Natural Resources Directorate (Wetlands
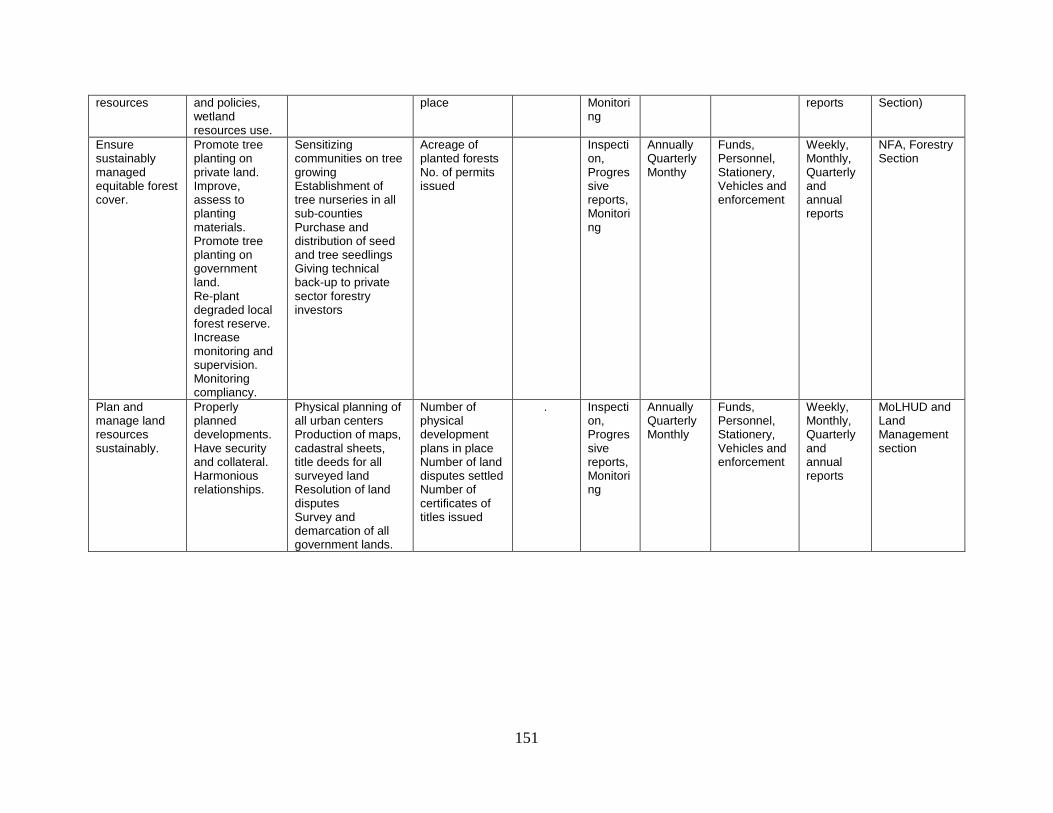
151
resources and policies, wetland resources use.
place Monitoring
reports Section)
Ensure sustainably managed equitable forest cover.
Promote tree planting on private land. Improve, assess to planting materials. Promote tree planting on government land. Re-plant degraded local forest reserve. Increase monitoring and supervision. Monitoring compliancy.
Sensitizing communities on tree growing Establishment of tree nurseries in all sub-counties Purchase and distribution of seed and tree seedlings Giving technical back-up to private sector forestry investors
Acreage of planted forests No. of permits issued
Inspection, Progressive reports, Monitoring
Annually Quarterly Monthy
Funds, Personnel, Stationery, Vehicles and enforcement
Weekly, Monthly, Quarterly and annual reports
NFA, Forestry Section
Plan and manage land resources sustainably.
Properly planned developments. Have security and collateral. Harmonious relationships.
Physical planning of all urban centers Production of maps, cadastral sheets, title deeds for all surveyed land Resolution of land disputes Survey and demarcation of all government lands.
Number of physical development plans in place Number of land disputes settled Number of certificates of titles issued
. Inspection, Progressive reports, Monitoring
Annually Quarterly Monthly
Funds, Personnel, Stationery, Vehicles and enforcement
Weekly, Monthly, Quarterly and annual reports
MoLHUD and Land Management section

152
WORKS
To increase main tenable district road network
Maintenance of roads
Routine labour based road maintenance using Road gang.
No. of Km maintained manually
Roads worked on, kilometers maintained
Inspection, Progressive reports, Monitoring.
Weekly, Monthly, Quarterly, annual.
Funds, Personnel, Plants and equipment,
Weekly, Monthly, Quarterly, annual.
Human resource Department, Finance and works
To increase maintainable district road network
Maintenance of roads
Routine Mechanised road maintenance
No. of Km maintained mechanically.
Roads worked on, kilometers maintained
Inspection, Progressive reports, Monitoring.
Weekly, Monthly, Quarterly, annual.
Funds, Personnel, Plants and equipment,
Monthly, Quarterly, annual.
Procurement, Finance and works
To increase maintainable district road network
Maintenance of roads by construction and maintenance of crossings, embankment filling.
Construction of bridge and construction of head/wing walls on existing crossings, Procurement of culverts, embankment filling, Nyakanyinya
No. of head/wing walls constructed, Linear meters of culverts procured, Number of embankment filling done
Roads crossings worked on, culverts supplied and installed, embankments filled.
Inspection, Progressive reports, Monitoring.
Weekly, Monthly, Quarterly, annual.
Funds, Personnel, Plants and equipment,
Weekly, Monthly, Quarterly, annual.
Procurement, Finance and works
To increase maintainable district road network
Maintenance of roads by Construction of Bridges.
Construction of Bridges Ruboroga, Bisika, Kabare, Nyabutegure, Nyampikye, Ntungwa, Kyabahanga,
Number of bridges Constructed
Number of bridges Constructed
Inspection, Progressive reports, Monitoring.
Weekly, Monthly, Quarterly, annual.
Funds, Personnel, Plants and equipment,
Weekly, Monthly, Quarterly, annual.
MoWT, Procurement, Finance and works
To increase maintainable district road network
Maintenance of roads
Addressing road bottle necks on Community Access Roads (CARs) in 9Sub-Counties.
No. of Km maintained manually, mechanically and number of crossings maintained.
Roads worked on, kilometers maintained, no. of crossings maintained.
Inspection, Progressive reports, Monitoring.
Weekly, Monthly, Quarterly, annual.
Funds, Personnel, Plants and equipment,
Monthly, Quarterly, annual.
LLGs, Procurement, Finance and works

153
To improve housing/office infrastructure in the district
Construction and maintenance of housing infrastructure
Construction of administration block
Completed administration Block
Construction of administration block phase by phase.
Inspection, Progressive reports, Monitoring.
Weekly, Monthly, Quarterly, annual.
Funds, Personnel.
Monthly, Quarterly, annual.
Procurement, Finance and works
To maintain vehicle fleet, plant and equipment
To hire specialized people to maintain vehicles and road equipment. Procure supervision vehicle
Maintenance of vehicles and road equipment and procurement of tyres, Vehicle procured.
Vehicles and road equipment maintained and tyres procured. Vehicle procured.
Vehicles and road equipment maintained Vehicle procured.
Inspection, Progressive reports, Monitoring.
Weekly, Monthly, Quarterly, annual.
Funds, Personnel.
Monthly, Quarterly, annual.
Procurement, Finance and works
To increase office work efficiency
Monitoring and supervision
Holding meetings and evaluating projects performance
No. of meetings held, projects performance evaluated and minutes recorded.
Improving Housing
Construction and maintenance of housing infrastructure
Maintenance of district buildings
No. of Buildings maintained
No. of Buildings maintained
Inspection, Progressive reports, Monitoring.
Weekly, Monthly, Quarterly, annual.
Funds, Personnel.
Monthly, Quarterly, annual.
Procurement, Finance and works
Improving Housing
Construction and maintenance of housing infrastructure
Improve hygiene Construction 4No. VIP Latrines
No. of VIP Latrines constructed at District head quarters
No. of VIP Latrines constructed
Inspection, Progressive reports, Monitoring.
Weekly, Monthly, Quarterly, annual.
Funds, Personnel.
Monthly, Quarterly, annual.
Procurement, Finance and works
Improving Housing
Supply of Furniture
Improve working environment
No. of furniture supplied to Engineering department.
No. of furniture supplied
Inspection, Progressive reports, Monitoring.
Weekly, Monthly, Quarterly, annual.
Funds, Personnel.
Monthly, Quarterly, annual.
Procurement, Finance and works
To increase office work efficiency
Monitoring and supervision
Preparation of reports.
Procurement of Photocopier, Printer, UPS done
Photocopier, Printer, UPS supplied
Inspection, Progressive reports, Monitoring.
Weekly, Monthly, Quarterly, annual.
Funds, Personnel.
Monthly, Quarterly, annual.
Procurement, Finance and works
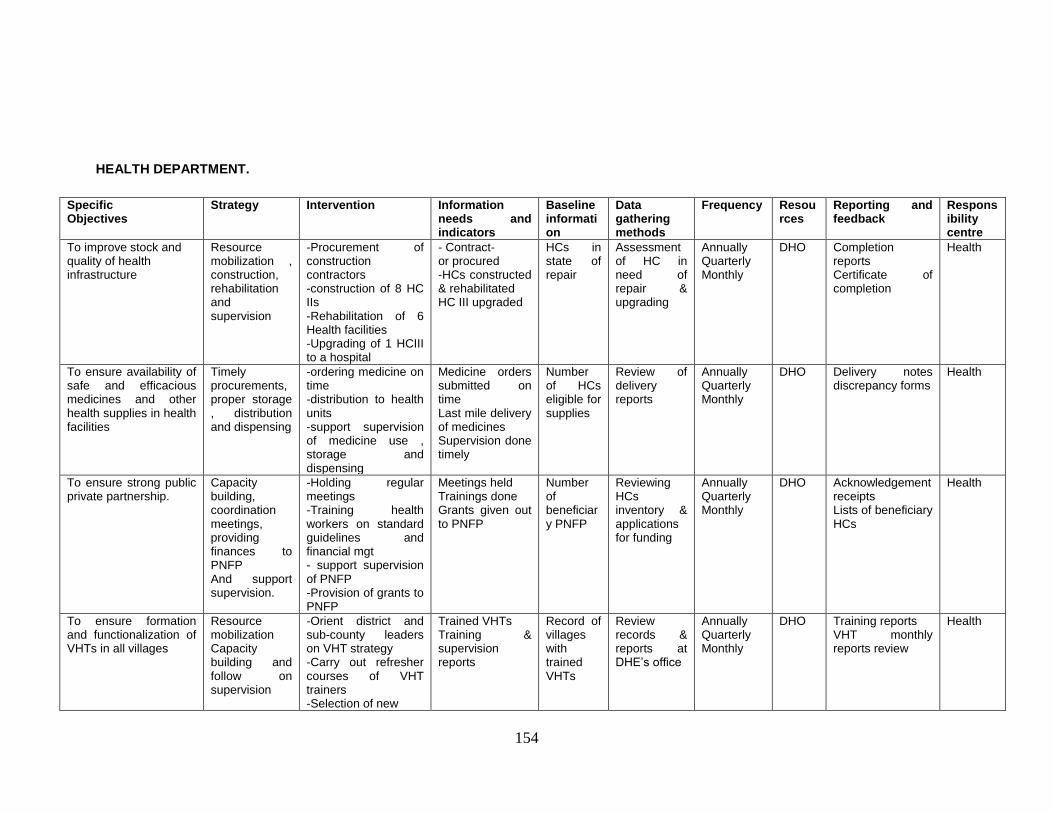
154
HEALTH DEPARTMENT.
Specific Objectives
Strategy Intervention Information needs and indicators
Baseline information
Data gathering methods
Frequency Resources
Reporting and feedback
Responsibility centre
To improve stock and quality of health infrastructure
Resource mobilization , construction, rehabilitation and supervision
-Procurement of construction contractors -construction of 8 HC IIs -Rehabilitation of 6 Health facilities -Upgrading of 1 HCIII to a hospital
- Contract- or procured -HCs constructed & rehabilitated HC III upgraded
HCs in state of repair
Assessment of HC in need of repair & upgrading
Annually Quarterly Monthly
DHO Completion reports Certificate of completion
Health
To ensure availability of safe and efficacious medicines and other health supplies in health facilities
Timely procurements, proper storage , distribution and dispensing
-ordering medicine on time -distribution to health units -support supervision of medicine use , storage and dispensing
Medicine orders submitted on time Last mile delivery of medicines Supervision done timely
Number of HCs eligible for supplies
Review of delivery reports
Annually Quarterly Monthly
DHO Delivery notes discrepancy forms
Health
To ensure strong public private partnership.
Capacity building, coordination meetings, providing finances to PNFP And support supervision.
-Holding regular meetings -Training health workers on standard guidelines and financial mgt - support supervision of PNFP -Provision of grants to PNFP
Meetings held Trainings done Grants given out to PNFP
Number of beneficiary PNFP
Reviewing HCs inventory & applications for funding
Annually Quarterly Monthly
DHO Acknowledgement receipts Lists of beneficiary HCs
Health
To ensure formation and functionalization of VHTs in all villages
Resource mobilization Capacity building and follow on supervision
-Orient district and sub-county leaders on VHT strategy -Carry out refresher courses of VHT trainers -Selection of new
Trained VHTs Training & supervision reports
Record of villages with trained VHTs
Review records & reports at DHE‟s office
Annually Quarterly Monthly
DHO Training reports VHT monthly reports review
Health

155
VHTs -Procure tools for VHTs -monitoring and follow supervision of VHTs
To ensure access to Uganda National Minimum Health Care Package
Strengthen HPE, provide MCH services, control of communicable and non communicable diseases, improve CBDOTS, case detection, supply of ILLTN, improve vector control, strengthen HIV prevention and care and support supervision.
MCH-ANC , conducting safe deliveries, PMTCT, HCT, Immunisation, TM of diseases in pregnancy , IMCI, Adolescent friendly health services, care of new born, HPE-procurement of IEC materials and distribution, radio talk shows, mentoring school health workers promotion, prevention of mental illness and oral conditions
Timely HMIS reports at district Client satisfaction index Immunisable diseases controlled
Reporting rates against number of HCs in district Occurrence of immunisable diseases
Use of standard HMIS report forms
Annually Quarterly Monthly Weekly
DHO Appraisal of HMIS reports Analysis of & Summarise selected /core performance indicators
Health

156
To ensure the functionality of health care system in the district
Planning, supervision, capacity building, coordination, data mgt and compilation, analysis and reporting.
-support supervision, -procurement of 5 computers, -installation of internet -review meetings -training of staff -M&E
Work plans, minutes, HMIS reports, performance reports, status reports Operational office
Inventory of functional & reporting HCs Appraisal of HRH norms & gaps
Review of reports on HCs status, staffing levels HMIS & performance reports
Annually Quarterly Monthly Weekly
DHO Appraisal of HMIS reports &performance indicators Appraisal of HRH
Health

157
6.2. LGDP MONITORING AND EVALUATION ARRANGEMENTS
In order to establish a well coordinated district wide system for tracking efficiency and effectiveness in service delivery and enhancing transparency and accountability in use of Public Resources, the the district M&E system will comprise of the managemement information system (MIS) established at the District level and lower local governments. The M&E strategy will link the district standard management information system to the national MIS system. The M&E plan will be (with a full list of indicators per department, data collection methods, timelines and responsibilities. The M&E plan will also contain an evaluation plan detailing specific policy and programme reviews to be conducted during the life of this DDP. The schedule of national surveys by UBOS as key sources of information conducted in the five years will be included. Overall, M&E Strategy is in place but not performing to the expected standards because of inadequate funding. All institutions will be coordinated, conduct periodic performance reviews, share information with all stakeholders involved in the implementation process will be intensified during the period of implementation.
6.2.1 LGDP PROGRESS REPORTING
A well coordinated district wide M&E system for effective tracking evaluation and feedback on DDP implementation and results will be established. Aparticipatory approach that entails the involvement of all key actors to fully internalize and own the system as well as use the results framework to inform their actions. This will be done periodically during District joint quarterly performance Reviews, involving political leaders at all levels of governance, district and sub-county technical staff. The district will continue to spear head and conduct district management committee meetings (DMC) where all Participating development partners at sectoral level will be required to report on progress to the district leaders, share their workplans and budgets or development activities within the district for purposes of harmonization of such program activities and for intergration into the broader distrct sectoral or development plans. This allows making management decisions on course of action towards interventions under implementatioon. It should be noted that reporting requirements will largely include progress reports -monthly, quarterly and annual reports, emergency reports and donor specific reports where necessary. There will be mainly two reporting processes namely; physical progress reporting and budget performance reporting. For physical progress reporting the entire district development plan implementing agencies will submit activity progress reports based on the LGDP M&E reporting matrix. These will will be supplemented by the by field spot visist to ascertain value for money. On the other hand budget performance reports will cover quarterly and annual financial performance (revenue and expenditure) from the governmement and non – government actors. The district budget performance will be generated from computerized output budget tool (OBT). The ombined district quarterly performance reports will be submitted to MoFPED, OPM, MoLG and NPA.

158
6.2.2 JONT ANNUAL REVIEW OF LGDP
These will be prepared by different departments and will include the progress of implementation of the DDP, challenges and lessons learnt and corrective strategies to be implemented in order to improve on its implementation. The reports will be submitted to the district council for discussion, Ministry of Local Government, development partners and Lower Local Governments. This annual performance report shall be produced by August 31st of every year. The district will under takeregular appraisal of pregress across all the district development plan with the view of bringing togather all the local government development plan stakeholders.This will be done during annual District Joint Budget Performance Reviews and district budget conference involving political leaders at all levels of governance, district and sub-county technical staff as well as Participating development partners. This allows to make planning and budgeting decisions regarding resource allocation where there mostly needed to avoid duplication of scarce resources. It‟s anticipated that this will involve desk review of planned activities and thereafter get evidence from the field. Annual joint review for all local level HDDP stakeholders will be organized in July/ August to review progress across all district activities and in oder to inform Government Annual Performance (Report GAPR). The review will be based on the cumulative quarterly performance reports produced by District Planning Unit as well as on the first-hand experiences shared by plan implementing agencies. The annual joint review meetings will be attended by representatives of Municipal and Lower Local Governments, CivilSociety Organisations (CSO), Faith Based Organisations (FBOs), Community Based Organisations (CBOs), Private Sector Organisations (PSOs, and selected citizens interest groups (youth groups, women groups, People Living With HIV/AIDs(PLAs), PLWD, etc)
6.2.3 LGDP MID TERM EVALUATION
Midterm review of the district development plan for two and half years will be conducted through a highly participatory approach involving all stakeholders in the entire process. The report will be presented to the district leadership including the district technical planning committee (DTPC), district executive committee (DEC) and council. In addition the report will also be discussed by joint annual LGDP meetings and acopy will be presented to NPA and sector ministries to inform the production of the NDP and sector development plans. The purposes of Midterm review of the district development plan for two and half years will be to review and assess the challenges that could be inhibit the implantation of the priority interventions identified, document lessons learned to improve implementation of the remaing period of the district development plan and to inform production of the next LGDP.
6.2.4 LGDP END OF TERM EVALUATION
The end term evaluation review of the district development plan for the entire 5 years will be conducted through a highly participatory approach involving all stakeholders in the entire process. The steps to follow will be the same as above but here the period under review will be for 5 years and which directly will inform the next development plan 2020/2021-2014/2025.

159
6.3 LGDP COMMUNICATION AND FEEDBACK STRATEGY/ ARRANGEMENTS
Creation of awareness on the expected roles of stakeholders in the implementation of the plan and promotion of dialogue and generation of feedback on the performance of the District. Communication plays a vital role in providing knowledge, changing people‟s attitudes and norms. It can play an important role in initiating or accelerating the changes that are already underway as well as in reinforcing and supporting change that has occurred. Effective communication can also result in supportive policies, positive legislature and increased resource allocation. To be effective, strategy must take three factors into account simultaneously and these include; your goals and objectives, Operational constraints and imperatives i.e. things you must do and things you cannot do and Pertinent conditions in the environment. The Rukungiri district will employ five Management Decisions to ensure that each stakeholder is reached and these include;
Audience: Who needs to be reached?
Behavior: What change in behavior is required?
Messages: What messages will be appropriate?
Channels: Which channels of communication will be most effective in reaching your audiences?
Evaluation: How will the success/failure of the communication strategy are measured?
An effective Communication strategy is an essential element of the DDP implementation and monitoring and evaluation frameworks. With regard to DDP implementation framework, it is crucial that all stakeholders in the DDP process are adequately informed and mobilized to understand and comply with the district vision, objectives, the targeted long-term outcomes and the strategic directions pursued in the DDP. But an effective Communication strategy will also serve to actualize the required bottom-up influences presumed in the DDP conceptual framework where local government priorities are expected to inform the selection of national sector development priorities.
With regard to the monitoring and evaluation framework an effective communication strategy will facilitate the transmission of monitoring and evaluation findings and recommendations to the respective centres where actions can be taken to address the issues that will be raised. Consequently, DDP formulation at both the district and Municipality and LLG levels will include a description of the communication strategies that should:
Outline the objective/goals of the communication,
identify stakeholders,
define key messages,
Pinpoint potential communication methods and vehicles for communicating information for a specific purpose, and specify the mechanisms that will be used to obtain feedback on the strategy.
The DDP will be disseminated to the various stakeholders by the District through a number of means which shall include, print media, broadcast, workshops, seminars, meetings, mandatory notices and the District Website. The sector of information shall take the leading role in popularizing and disseminating the information in the DDP to the stakeholders. On the use print media, the district shall secure funding airtime for radio talksows.

160
The District will also use the Local Radio every quarter to explain to the audience in the district about the salient issues of the DDP, its implementation and allow phone –in-calls to get a feedback. Other methods shall be sensitized of the stakeholders such as the district council, sub-county councils and the technical personnel plus posting of mandatory notices, pin conferences The Importance of an effective Communication and feedback strategy in the DDP framework
There are a number of merits that a communication strategy in the DDP framework will serve. The major ones include:
Disseminating district programmes, projects and progress reports to inform/create awareness, including LLGs
Creating awareness on the expected roles of the stakeholders in the implementation of the district programmes, including LLGs, CSO, and community members
Promoting dialogue and generate feedback on the performance of LGs
Effective management of people‟s expectations with regard to public services of the district.
Effective communication framework will help of the people involved in the plan implementation process to understand fully the plan and its implementation strategy thus preventing misunderstandings
Strengthen relationships with the people involved in the plan implementation process and these leads to achieving the set targets of the plan.
Strengthens ownership of the plans

161
CHAPTER 7.0 DISTRIC PROJECT PROFILES
This chapter comprises of trhe LGDP project profiles.
MANAGEMENT SUPPORT SERVICES
SECTOR MANAGEMENT SUB-SECTOR HUMAN RESOURCE MANAGEMENT CODE 550/01/15/8001 PROJECT TITLE TRAINING IMPLEMENTING AGENCY RUKUNGIRI DISTRICT COUNCIL LOCATION DISTRICT HEADQUARTERS PLANNED EXPENDITURE 335,107,431 SECURED FUNDS 335,107,431 FUNDING GAP NIL RECURRENT/EXPENDITURE START DATE: .1ST JULY 2015 COMPLETION DATE.30TH JUNE 2020 Objective
To build capacity of District officials and other stakeholders To facilitate implementation of government programmes
Targeted Beneficiaries: Staff, political leaders, NGOs/CBOs and other stakeholders Project Background and Justification With decentralization a number of programmes have been devolved to Local Governments, moreover the responsibility of quality service delivery and strategic decision making has been put to the Local Government Officials. Government policy emphasizes participation of communities and stakeholders in planning, decision making, supervision and monitoring. For this to be effected, capacity must be built for the various players. Technical description The following types of capacity building will be done and these are career development, discretionary capacity building and skills development. This will be done through: Workshops, Seminars and refresher courses will be organized for the various sectors. Professional short courses will be facilitated to boost performance of officials. Study Tours will be facilitated to enable district officials learn from other players. Project workplan and Budget
Activity Budget Total
YR1 YR2 YR3 YR4 YR 5
Training 60,646,000 63,678,300 66,862,215 70,205,325 73,715,591 335,107,431
Total 60,646,000 63,678,300 66,862,215 70,205,325 73,715,591 335,107,431
Monitoring and Evaluation Strategy: Monitoring of activities under capacity building will be done by the council committee of finance and administration.

162
Operation and Maintenance: Capacity building activities will be carried out by pre-qualified firms, recognized institutions of learning and the District human resource pool. Environmental Impact/Assessment: N/A SECTOR MANAGEMENT SUB-SECTOR HUMAN RESOURCE MANAGEMENT CODE 550/01/15/8001 PROJECT TITLE RECRUITMENT OF STAFF IMPLEMENTING AGENCY RUKUNGIRI DISTRICT COUNCIL LOCATION DISTRICT HEADQUARTERS PLANNED EXPENDITURE: 308,200,000 SECURED FUNDS 308,200,000 FUNDING GAP NIL RECURRENT/EXPENDITURE START DATE: . 1st JULY 2015 COMPLETION DATE.30th JUNE 2020 Objective To have adequate human resource for effective delivery of services Targeted Beneficiaries: Communities we deliver services to, Recruited staff and line departments. Project Background and Justification The staff structure for the district as per Ministry of Public Service provides for a number of positions which should be filled in order to effectively and efficiently to full fill the mandate of district local government. The district for the last years has recruited staff in critical and non critical positions. However due to high labour turnover, and in same cases, failure to attract potential appilicants, the manpower gaps is high,therefore a need to recruit . Technical description Man Power analysis will be carried out to establish the existing gaps, submitted to council for approval, seek fror permission to recruit from Ministry of Public Service based on the wage allocation for the District. Once approved recruitment process will be undertaken. Project workplan and Budget
Activity Budget Total
YR1 YR2 YR3 YR4 YR 5
Recruitment of staff
61,640,000 61,640,000 61,640,000 61,640,000 61,640,000 308,200,000
Total 61,640,000 61,640,000 61,640,000 61,640,000 61,640,000 308,200,000
Monitoring and Evaluation strategy: This will be carried out by the CAO‟s office using minutes and reports from the DSC.

163
Operation and Maintenance plan: N/A Environment Impact Assessment and Mitigation plan: N/A SECTOR MANAGEMENT SUB-SECTOR DISTRICT CONTRACTS COMMITTEE CODE 550/01/15 /8002 PROJECT TITLE PROCUREMENT OF GOODS AND SERVICES IMPLEMENTING AGENCY RUKUNGIRI DISTRICT LOCATION RUKUNGIRI DIST. HEADQUARTERS PLANNED EXPENDITURE 8,400,000 SECURED FUNDS 8,400,000 FUNDING GAP NIL RECURRENT EXPENDITURE START DATE: 1st JULY 2015 COMPLETION DATE: 30th JUNE 2020 Objective To procure goods, services and works in conformity with public procurement and disposal of public accounts. Targeted Beneficiaries: Communities, District local government and service providers Project Background and Justification Under the Local Government Public Procurement and Disposal of Public assets, regulation 2007, District Contracts Committee have come in place in accordance with the local government Act to handle the procurement and disposal of assets in the District. Technical Description Advertising for good, services and works Technical evaluation of tenders Awarding of tenders Monitoring and evaluation of projects Plan of Operation: The District Contracts Committee members in liaison with the procurement and disposal unit and the Evaluation Committee will implement the activities. Project workplan and Budget
Activity Budget Total
YR1 YR2 YR3 YR4 YR5
Procurement of goods & services
8,400,000 8,820,000 9,261,000 9,724,050 10,210,252 46,415,302
Total 8,400,000 8,820,000 9,261,000 9,724,050 10,210,252 46,415,302
Monitoring and Evaluation: Monitoring of activities under Contracts Committee will be done by the council committee of finance and administration.

164
Operation and Maintenance Plan: N/A Environmental Impact Assessment/Concerns: N/A SECTOR MANAGEMENT SUB-SECTOR DISTRICT LAND BOARD CODE 550/01/15/8003 PROJECT TITLE MANAGEMENT OF LAND ISSUES IMPLEMENTING AGENCY RUKUNGIRI DISTRICT LOCATION RUKUNGIRI DIST. HEADQUARTERS PLANNED EXPENDITURE 11,987,000 SECURED FUNDS 11,987,000 FUNDING GAP NIL RECURRENT EXPENDITURE START DATE: 1st JULY 2015 COMPLETION DATE: 30th JUNE 2020 Objective: To promote effective and efficient management of land matters. Tarteged Beneficiaries: Members of Land Board, Area land committee and the general public. Project Background and Justification District Land Board was established to manage land matters involving the setting of land disputes in the District, and mobilizing and sensitizing the masses on land matters for effective and efficient management of land matters in the district, there is thus need for this project. Technical Description Settling land disputes. Handling new applications for registration of land Renewal and extension of land sites Mobilization and sensitization of the masses on land matters

165
Project workplan and Budget
Activity Budget Total
YR1 YR2 YR3 YR4 YR5
Mgt of land issues
11,987,000 12,586,350 13,215,667 13,876,450 14,570,272 52,359,289
Total 11,987,000 12,586,350 13,215,667 13,876,450 14,570,272 52,359,289
Monitoring and Evaluation Plan: Monitoring will be carried out by the Executive Committee and the Chief Administrative officer. Operation and Maintenance The District Land Board will be facilitated by the central government transfers. Environmental Impact Assessment/Concerns: N/A DEPARTMENT MANAGEMENT SUPPORT SERVICES SUB-SECTOR COUNCIL & STATUTORY BODIES CODE 550/01/15/8003 PROJECT TITLE FACILITATING LEGISLATION FUNCTION OF COUNCIL IMPLEMENTING AGENCY RUKUNGIRI DISTRICT LOCATION RUKUNGIRI DIST. HEADQUARTERS PLANNED EXPENDITURE 66,307,575 SECURED FUNDS 66,307,575 FUNDING GAP NIL RECURRENT EXPENDITURE START DATE: 1ST JULY 2015 COMPLETION DATE: 30TH JUNE 2020 Objective: To formulate byelaws and ordinances for implementation of Government programs. Targeted beneficiaries: LLGs, Communities, Political leaders, NGOs/ CSOs, Technical staff. Project Background and Justification The decentralization policy provides for legislation as a form of devolved power to Local Governments. This is operationalised by the Local Government Act Cap 243 which mandates Local Governments to formulate byelaws and ordinances for implementation of Government programs. Technical Description Consultations with stakeholders Drafting bill of an ordinance Presentation to council for approval Submission to Minister of Justice and Constitutional affairs for gazettee.

166
Project workplan and Budget
Activity Budget Total
YR1 YR2 YR3 YR4 YR5
Facilitating Legislative Function of Council
12,000,000 12,600,000 13,230,000 13,891,500 14,586,075 66,307,575
Total 12,000,000 12,600,000 13,230,000 13,891,500 14,586,075 66,307,575
Monitoring and Evaluation Plan: Monitoring and evaluation will be carried out by the Executive Committee, CSOs like ACODE, Community. Operation and Maintenance The District Land Board will be facilitated by the central government transfers. Environmental Impact Assessment: N/A SECTOR MANAGEMENT SUB-SECTOR COUNCIL AND STANDING COMMITTEES CODE 550/01/15/8004 PROJECT TITLE PROMOTION OF PARTICIPATORY DEMOCRACY AND GOOD GOVERNANCE IMPLEMENTING AGENCY RUKUNGIRI DISTRICT LOCATION RUKUNGIRI DIST. HEADQUARTERS PLANNED EXPENDITURE 342,589,137 SECURED FUNDS 342,589,137 FUNDING GAP NIL RECURRENT EXPENDITURE START DATE: 1st JULY 2015 COMPLETION DATE: 30th JUNE 2020 Project Objective: To deliberate, formulate, polices and make decisions Targeted Beneficiaries: Councilors, staff and the general public Project Background andjustification Under the LGS Act CAP 243, and the Constitution of the Republic of Uganda 1995, District and Lower Local Government Councils are established to exercise all political and executive powers and functions; provide services, project the constitution and other laws of Uganda and promote democratic governance and ensure the implementation and compliance with government policy. Technical Description Formulation of bye laws, policies and ordinances Overseeing the enforcement of bye laws and ordinances Approving budgets and plans Appointment of members of statutory bodies Monitoring and evaluation of government and donor projects

167
Project workplan and Budget Activity Budget Total
YR1 YR2 YR3 YR4 YR5
Promotion of participatory & good governance
62,000,000 65,100,000 68,355,000 71,772,750 75,361,387 342,589,137
Total 62,000,000 65,100,000 68,355,000 71,772,750 75,361,387 342,589,137
Monitoring and Evaluation Strategy: Monitoring will be carried out by the Executive committee and the Chief Administrative officer. Operation and Maintenance plan The project will be facilitated by funding from the locally generated funds and central government, unconditional grants. Environmental Impact Assessment/Concerns: N/A SECTOR MANAGEMENT SUB-SECTOR PUBLIC ACCOUNTS COMMITTEE CODE 550/01/15/8005 PROJECT TITLE PROMOTION OF ACCOUNTABILITY OF PUBLIC RESOURCES & EVALUATION OF PROJECTS IMPLEMENTING AGENCY RUKUNGIRI DISTRICT LOCATION RUKUNGIRI DIST. HEADQUARTERS PLANNED EXPENDITURE 127,415,643 SECURED FUNDS 127,415,643 FUNDING GAP NIL RECURRENT EXPENDITURE START DATE: 1st JULY 2015 COMPLETION DATE:30th JUNE 2020 Project Objective: To promote accountability and efficient utilization of resources. Targeted Beneficiaries: Members of Public Accounts Committee, Accounting officers. Project Background: and justification. Under the LG Act CAP 243, section 89 (1) (7) and the LG Financial and Accounting regulations 1998, section 152, Public Accounts Committee is mandated to examine reports of the Auditor General, Chief Internal Auditor and any reports of commissions of inquiry to find out if there is any mismanagement of other Anomalies in the management of Public Resources. Technical Description Examination of reports of the Auditor General, Chief Internal Auditor and other reports. Preparation and submission of reports to council and Ministry of Local Government.

168
Project workplan and Budget Activity Budget Total
YR1 YR2 YR3 YR4 YR5
Promotion of accountability of resources & evaluation of projects
23,059,021 24,211,972 25,422,570 26,693,698 28,028,382 127,415,643
Total 23,059,021 24,211,972 25,422,570 26,693,698 28,028,382 127,415,643
Monitoring and Evaluation Plan: Monitoring will be carried out the Executive committee and the Chief Administrative officer. Operation and Maintenance Plan: The Public Accounts Committee will be facilitated by the central government grants from the consolidated fund annually. Environmental Impact Assessment/Concerns: N/A SECTOR MANAGEMENT SUB-SECTOR INFORMATION AND PUBLIC RELATIONS CODE 550/01/15/8006 PROJECT TITLE INFORMATION MANAGEMENT SYSTEMS IMPLEMENTING AGENCY RDLG LOCATION RUKUNGIRI DIST. HEADQUARTERS PLANNED EXPENDITURE 665,175,488 SECURED FUNDS 665,175,488 FUNDING GAP NIL RECURRENT EXPENDITURE START DATE: 1st JULY 2015 COMPLETION DATE: 30th JUNE 2020 Project Objectives: To provide access to timely and reliable information to both the local and business communities in the district to enable them make the best economic decision. To develop ICT usage in the district. Targeted Beneficiaries: District staff Political leaders Communities Project Background and Justification The world is witnessing technological advancement at a scale and speed unprecedented in human history. There is therefore need for people to access ICT opportunities. The creation of the district business and information centre (DBIC) is thus a response to challenge of enhancing digital marginalization especially among the business people and the rural communities. Technical Description The Ministry of Information and Communications technology will provide equipment to establish a district business and information centre (DBIC) in a private public partnership model. The

169
equipment will include: 5 computers, internet connectivity, printers, scanners, fax machines, photocopiers and other accessories. The district will identify and work with a private partner to work within the implementation of the project. The district will put in place in a committee to supervise and oversee the performance of the project. The private partner will make quarterly reports to the committee. Project work and Budget Activity Budget (000’s) Total
YR1 YR2 YR3 YR4 YR5
Information Management systems
120,380,000 126,399,000 132,718,950 139,354,897 146,322,641
665,175,488
Total 120,380,000 126,399,000 132,718,950 139,354,897 146,322,641
665,175,488
Monitoring and Evaluation Plan: N/A Monitoring will be carried out the Executive committee and District Technical Committee headed by Chief Administrative Officer. Operation and Maintenance Plan: N/A Environmental Impact Assessment/Concerns: N/A SECTOR MANAGEMENT SUB-SECTOR INFORMATION AND PUBLIC RELATIONS CODE 550/01/15/8006 PROJECT TITLE UPDATING DISTRICT WEBSITE IMPLEMENTING AGENCY RDLG LOCATION RUKUNGIRI DIST. HEADQUARTERS PLANNED EXPENDITURE 82,894,718 SECURED FUNDS 82,894,718 FUNDING GAP NIL RECURRENT EXPENDITURE START DATE: 1st JULY 2015 COMPLETION DATE: 30th JUNE 2020 Objective:
- To provide access to timely and reliable information at local, national and international level.
- To develop ICT usage in the district. Targeted Beneficiaries: Rukungiri District Local Government, Central Government, Business Community, Private sector and the International community. Project Background & justification. The Ministry of Information Communication and Technology developed a policy which requires Ministries, Departments and Agencies to have active websites for the promotion of information sharing.

170
This is justified by the fact that the world is witnessing technological advancement at a scale and speed unprecedented in human history. There is therefore need for people to access and share information about Ditsrict programs and utilize ICT opportunities. The development and update of the District website will link the District to the wider community for networking and promoting sectoral developments such as tourism. Technical Description District and Central government will provide equipment and facilities to the information office. Benchmarking from other Ministries, Local Governments and Private sector with functional websites. Procurement of equipment and facilities. Data collection, analysis, interpretation and management. Project workplan and Budget
Activity Budget Total
YR1 YR2 YR3 YR4 YR5
Updating District website
15,000,000 15,750,000 16,537,500 17,369,375 18,237,843 82,894,718
Total 15,000,000 15,750,000 16,537,500 17,369,375 18,237,843 82,894,718
Monitoring and Evaluation Plan: N/A Monitoring will be carried out by the Ministry of Information and Communication Technology, Executive committee and District Technical Committee headed by Chief Administrative Officer. Operation and Maintenance Plan: The District Council will allocate funds towards operation and maintenance of the equipment, facilities and the system. The information Officer will be responsible person. The Board of survey conducted at the end of every financial year to establish the status of equipment and facilities. Environmental Impact Assessment/Concerns: N/A
PLANNINING UNIT
SECTOR PLANNING SUB SECTOR POPULATION CODE 550/22/8001 PROJECT TITLE integrating population issues in development planning process IMPLEMENTING AGENCY RUKUNGIRI DISTRICT LOCATION DISTRICT WIDE PLANNED EXPENDITURE UGX 40,297,000 SECURED FUNDS UGX 40,297,000 FUNDING GAP NIL START DATE: 1ST JULY 2015 COMPLETION: 30TH JUNE 2020

171
Objectives: i) To enhance the importance and integration of Population factors in Development
programmes Background: Demographic data collection is of significance in planning, budgeting and decision making. Vital registration had for a long time not been taking place, until the 2002 population and housing census when it was launched in the Country. However, up to now it‟s not moving on smoothly. The registration aims at tracking the population changes and will be continuous, thus a need to update births and deaths information. Population and development are related and hence the need to inform the population to make the right decisions. Technical description:
Sensitizing and training of LC‟s and Parish Chiefs
Monitoring and support supervision
Equipping sub-counties with registration certificates and registration forms
Data collection, entry, analysis and dissemination
Increased public awareness on the relationship between population and development
Population coordination meetings Benefits: Enhances integration of population factors in Development Programmes. Beneficiaries: The Community/population, local councils, parish chiefs Feasibility Study: The population and housing census 2002 and 2014 revealed the importance of this project. Plan of Operation: The population officer shall implement the project in liaison with heads of departments, sub county chiefs, LC‟s and Parish Chiefs. Budget and Financing plan:
Activities Expenditure by financial year( Total(000‟)
YR 1 YR2 YR 3 YR 4 YR 5
LLGs and sectors assisted in integrating population issues in development planning process
4,000 4,100 4,205 4,313 4,429 21,047
Population factors in Development planning programs
3,000
3,250 3,500 4,000 5,500 19,250
Total 40,297

172
Monitoring and Evaluation Plan: Project Activity Output Means of
verification Source of verification
Time Frame
Responsible officer
Registration of birth and deaths
Data collection, entry, analysis and dissemination
Public awareness on the relationship between population and development
Population coordination meetings
Promote research on the causes of high population growth rate.
Conducting review meetings.
Holding of regular population coordination meetings.
Prepare and produce a District specific Population Action Plan.
Registration,
collection, analysis and dissemination of vital statistics (Birth and Death)
Prepare and produce a District specific Population action plan
No. of registration certificates issued
Data on population collected
Population meetings held
Distinct population action plan produced.
Departments assisted in integrating population issues
Number of children registered at birth.
- Registration copies - Reports
District Population Office
Annually District Population Officer, District Planner, Chief Administrative Officer District statistician
Operation and Maintenance Plan Information on vital statistics will be updated on a continuously throughout the year Environmental Impact Assessment/Concerns: There are no environmental concerns and the project does not require an environmental impact assessment. Supervision and Certification Arrangement: The project will be supervised by the District Population Officer

173
SECTOR PLANNING SUB SECTOR Development Planning CODE 550/22/8001 PROJECT TITLE Development Planning and Budgeting IMPLEMENTING AGENCY RUKUNGIRI DISTRICT LOCATION DISTRICT WIDE PLANNED EXPENDITURE UGX 270,092,000 SECURED FUNDS UGX 270,092,000 FUNDING GAP NIL RECURRENT EXPENDITURE NIL START DATE: 1ST JULY 2015 COMPLETION: 30TH JUNE 2020 Objectives:
i) To develop an efficient and effective internal assessment system at all levels of local government to ensure quality works and value for money.
ii) To ensure the district departments and sub counties satisfy the minimum conditions and performance measures
iii) To facilitate and co-ordinate the process of development planning and budgeting both at the district and sub-county levels
Background: With increased responsibility to Budget, plan and co-ordinate development programmes, there is need for enhancing capacity to do so. There is lack of co-ordination and planning capacity at sub-counties as reflected in their plans, hence the need to strengthen them. Technical Description:
Production of plans and budgets
Revision/rolling over of the plans
Integration of sub-county plans
Production of the budget frame work papers
Holding of the budget conference
Revision and production of sub-county Development Plans Benefits: Funding for the priority projects in the District and their implementation Beneficiaries: The community/population, civil society organizations, political leaders and technical officers Feasibility Study: No feasibility study has been made Plan of Operation: The District Planning Unit shall implement the project in liaison with Head of departments and sections, NGOs and lower local government councils

174
Budget and Financing plan Activities Expenditure by quarters(000’) Total (000’s)
Yr1 Yr2 Yr3 Yr4 Yr5
Procurement of office retooling equipment
10,606 10,800 10,900 11,000 11,500 54,806
Internal assessment at district department levels and at lower local government
10,606
10,800 10,900 11,000 11,500 54,806
LLGs visited to monitor government programmes, projects and activities
8,405 19,101 20,937 21,487, 22,980, 92,910
LLGs and sectors mentored in Development planning
12,228 12,840 13,482 14,156 14,864 67,570
Grand total 270,092

175
Monitoring and Evaluation Plan: Project Activity Output Means of
verification Source of verification
Time Frame
Responsible officer
Production of Development Plans and Budgets, BFPs and Holding of the Budget Conference
-Guidance of
Hold lower local government consultative meetings and appraisal of projects for the DDP and LLG development plans
Conducting multi sect oral monitoring for LDG and PAF projects in LLGs
Field visits
Data entry
Report writing and editing
Carrying out LGMSD assessment in LLGs and HLG sectors, Preparation of quarterly performance review reports
Dissemination of the findings to stakeholders
Conducting Planning meetings.
Conducting consultative meetings.
Organizing and holding the District Budget conference.
Coordinating the preparation of Annual Work plans.
Coordinating the preparation of BFP and submission
Supply of office of retooling items
Mentoring / training of assessors
Assessment of district departments
Assessment of sub counties
Producing
Assessment reports
Submitting assessment reports to MOLG
- Dissemination of reports and findings of assessment exercise to stakeholders
DDP
BFPs
Budget
Confer ence held
Assessment made
Monitoring made
Development
Plans,
BFPs produced and
Conference reports and minutes/resolutions.
DTPC minutes
Monitoring reports
District Planning Unit
Annually District Planner

176
Operation and Maintenance Plan: The exercise will be done annually and reports will be produced. The district planning units will coordination the activity to make sure those departments and sub counties prepare for and implement the assessed activity indicators. Environmental Impact Assessment/ Concerns: There are no environmental concerns and no environmental impact assessment was done Supervision and Certification Arrangement: The project will be supervised by the Head of District Planning Unit. SECTOR PLANNING SUB SECTOR STATISTICS CODE 550/22/8001 PROJECT TITLE Updated data bank management for information and proper decision making IMPLEMENTING AGENCY RUKUNGIRI DISTRICT LOCATION DISTRICT WIDE PLANNED EXPENDITURE UGX 72,500, 000 SECURED FUNDS UG X 72,500,000 UGX FUNDING GAP NIL RECURRENT EXPENDITURE NIL START DATE: 1ST JULY 2015 COMPLETION: 30TH JUNE 2020 Objectives
i) To have an updated data bank for information and proper decision making ii) To establish a community based management Information system, a data bank and
establishment of LOGICS. Background The implementation of district programmes requires the establishment of an effective and efficient data collection and analysis mechanism. The existing data has to be updated from time to time for information and proper decision-making. A statistical abstract is now one of the areas of assessment by the Ministry of local government hence the need for the project. Technical Description Data collection from departments and sub counties Data entry and analysis Dissemination of results/reports and findings to stakeholders including Uganda Bureau of statistics (UBOS) Benefits: Enriched data bank and quick access to information for decision making by all stakeholders Beneficiaries: The community, political leaders and technical officers Feasibility study: No feasibility studies have been made, however internal assessment is fundamental for better performance in the district and sub counties

177
Plan of Operation/Implementation Plan: The District Planning Unit will implement the project in liaison with, Heads of departments and sections and lower Local Government staff. Data collection is a continuous process and therefore shall be carried out throughout the year. The district planning unit shall coordination the activity. Budget and Financing plan Activity Expenditure by years(000’) Total
(000’s) Yr 1 Yr 2 Yr3 Yr4 Yr 5
Establishment a community based management Information system, a data bank and establishment of LOGICS.
7,000
9,000 10,000 11,000 12,000 49,000
Data management systems, data usage for improved planning and decision making at all levels improved and strengthened
4,000
4,500 4,800 5,000 5,200 23,500
Grand total 72,500
Monitoring and Evaluation Plan: Project Activity Output Means of
verification Source of verification
Time Frame
Responsible officer
Data collection, entry, analysis and compilation of statistical abstract
Preparation and production of the District Statistical Abstract.
Training in Data management.
Establishing of Data Banks
Establishing and coordination of MIS
- LOGICs data Collection from all departments
Statistical abstract reports
Data collected
Maintenance of IT equipment including computers, photocopier, printers/scanner
Statistical abstract reports
District Planning Unit
Annually District Statistician District planner
Operation and Maintenance Plan: Data collection, analysis and compilation of the statistical abstract will be carried out by a multidisciplinary team. This will be done throughout the year and reports will be produced. The district planning units will coordination the activity. Environmental Impact Assessment/ Concerns: There are no environmental concerns and no environmental impact assessment was done Supervision and Certification Arrangement: The project will be supervised by the District Statistician.

178
NATURAL RESOURCES
DEPARTMENT: NATURAL RESOURCES SUB-SECTOR: ADMINISTRATION (GENERAL OFFICE) CODE: 550/ TITLE OF THE PROJECT: STREAMLINING DEPARTMENTAL MANAGEMENT ACTIVITIES AND OPERATIONS IMPLEMENTING AGENCY: RUKUNGIRI DISTRICT LOCAL GOVERNMENT LOCATION: DISTRICT WIDE TOTAL PLANNED EXPENDITURE: 752,653,000 FUNDS SECURED: 749,920,000 FUNDING GAP: 2,733,000 RECURRENT EXPENDITURE: 752,653,000 START DATE: 1ST JULY, 2015. COMPLETION DATE: 30TH JUNE, 2020. Project objective To coordinate and manage the sustainable management and conservation of natural resources in the district Targeted beneficiaries Departmental Staff Project background and justification The Constitution of Republic of Uganda 1995, the National Environmental Act Chapter 153 and other Legislations mandate the department to coordinate, manage, supervise and ensure sustainable exploitation and conservation of natural resources in the district. The department coordinates, manages, supervises and ensures sustainable exploitation and conservation of natural resources in the district for social economic development through coordinated implementation of national and local development initiatives and policies. Technical description
- Implementation of National Policies, Rules, Regulations and Council byelaws on sustainable exploitation of natural resources
- Supervising development partners (CBO‟s and NGO‟s) involved in extension services on natural resources
- Preparing and submitting work plans and budgets for the Natural Resources subsector; - Advising the District Council and other stakeholders on sustainable exploitation of
Natural resources - Initiating and advising district Council on natural resources bye laws and ordinances
- Supervising and appraising the performance of the departmental staff - Preparing and presenting departmental performance reports

179
Project work plan and budget: Activity Budget Total Operation
and recurrent costs
Yr 1 (‘000)
Yr 2 (‘000)
Yr 3 (‘000)
Yr 4 (‘000)
Yr 5 (‘000)
Conduct departmental meetings, mentoring sessions and prepare reports
150 250 300 450 550 1,700,000
Prepare work plans and budgets
100 135 136 140 142 653,000
Appraise the performance of staff
0 0 125 125 130 380,000
Payment of staff salaries and wages
125,503 142,047 153,030 160,450 168,890 749,920,000

180
Monitoring and evaluation
Activity Indicator/Output Means of verification
Source of verification
Time frame Responsible officer
Conduct departmental meetings, mentoring sessions and prepare reports
Meetings Mentoring sessions
Minutes Reports
Monthly Quarterly Annually
DNRO CAO
Prepare work plans and budgets
Budget and work plan documents
Minutes Quarterly and annually
DNRO
Appraise the performance of staff
Appraisal forms and files
Reports Quarterly CAO
Payment of staff salaries and wages
Salaries and wages paid
Pay slips Monthly DNRO
Operation and mantainence plan
Project Out put What is to be done Responsible person
Cost Remarks
Streamlining departmental management and operations
Hold Meetings and Mentoring sessions Prepare Budget and work plan documents Appraise departmental staff Pay Salaries and wages for departmental staff
DNRO CAO
752,653,000 The project runs for a period of five years
Environment Impact Assessment and Mitigation The project does not include activities that are likely to have negative environmental implications. DEPARTMENT: NATURAL RESOURCES SUB-SECTOR: ENVIRONMENT CODE: 550/ TITLE OF THE PROJECT: SUSTAINABLE ENVIRONMENTAL MANAGEMENT IMPLEMENTING AGENCY: RUKUNGIRI DISTRICT LOCAL GOVERNMENT LOCATION: DISTRICT WIDE TOTAL PLANNED EXPENDITURE: 16,015,000 FUNDS SECURED: 0 FUNDING GAP: 16,015,000 RECURRENT EXPENDITURE: START DATE: 1ST JULY, 2015. COMPLETION DATE: 30TH JUNE, 2020. Project objective To promote sustainable and sound environmental management Targeted Beneficiaries All residents of Rukungiri district

181
Project background and justification Rukungiri District is a mountainous and hilly area and most of these hill are bare thus prone to erosion whenever it rains. More so, as a result of increased population, the pressure on ecologically fragile areas such as wetlands, river banks, steep slopes and lake shores have been encroached on. There is therefore urgent need to protect these areas so that communities can sustainably derive their survival without degrading the environment. Technical Description
- Public sensitization on environmental policies, laws and programmes on conservation of the environment;
- Training and sensitizing local communities and district officials on matters pertaining to the proper management of the environment
- Enforcing the implementation of the National and District environmental action plans - Preparing and submitting reports on the state of the environment in the District
- Providing technical support to local environment committees on the implementation of environmental policies and programmes.
- Supporting community initiatives for the renewal and sustainable exploitation of the natural environment

182
Project work plan and budget: Activity Budget Total Operation
and recurrent costs
Yr 1 (‘000)
Yr 2 (‘000)
Yr 3 (‘000)
Yr 4 (‘000)
Yr 5 (‘000)
Monitoring and evaluation of environment compliance
0 500 550 585 600 2,235,000
Participate in review of EIAs
0 650 680 700 750 2,780,000
Environmental screening of projects
1,500 2,000 2,250 2,500 2,750 11,000,000
Monitoring and evaluation Activity Indicator/Output Means of
verification Source of verification
Time frame Responsible officer
Monitoring and evaluation of environment compliance
Number of inspections conducted
Inspection reports
Monthly Quarterly
DEO DNRO
Participate in review of EIAs
Number of EIAs reviewed
EIA reports Monthly DEO
Environmental screening of projects
Number of projects reviewed
Review reports Quarterly DNRO
Operation and mantainence plan Project Out put What is to be
done Responsible person Cost Remarks
Sustainable environmental management
Monitoring and evaluation of environment compliance Participate in review of EIAs Environmental screening of projects
DNRO DEO DWO
16,015,000 The project will ensure good environmental practices for five years
Environment Impact Assessment and Mitigation The project does not include activities that are likely to have negative environmental implications. DEPARTMENT: NATURAL RESOURCES SUB-SECTOR: WETLANDS CODE: 550/ TITLE OF THE PROJECT: SUSTAINABLE WETLAND UTILIZATION AND MANAGEMENT IMPLEMENTING AGENCY: RUKUNGIRI DISTRICT LOCAL GOVERNMENT LOCATION: DISTRICT WIDE TOTAL PLANNED EXPENDITURE: 25,415,000 FUNDS SECURED: 0 FUNDING GAP: 25,415,000

183
RECURRENT EXPENDITURE: START DATE: 1ST JULY, 2015. COMPLETION DATE: 30TH JUNE, 2020. Project Objectives To promote sustainable utilization and management of wetlands in the district Targeted Beneficiaries Community members living close to wetlands in the entire district Project Background and Justification Rukungiri District is a mountainous and hilly area and most of these hill are bare thus prone to erosion whenever it rains. More so, as a result of increased population, the pressure on ecologically fragile areas such as wetlands, river banks, steep slopes and lake shores have been encroached on. There is urgent need to protect them so that the communities can sustainably derive their livelihood without degrading the environment. Technical Description
- Identifying opportunities and constraints to optimal use of wetland resources
- Compiling reports on environment degradation activities and practices.

184
Project work plan and budget:
Activity Budget Total Operation
and
recurrent
costs
Yr 1
(‘000)
Yr 2
(‘000)
Yr 3
(‘000)
Yr 4
(‘000)
Yr 5
(‘000)
Community
training in
wetland
management
1,800 1,450 1,550 1,680 1,700 8,180,000
River bank
and wetland
restoration
1,196 3,859 3,980 4,050 4,150 17,235,000
Monitoring and evaluation Activity Indicator/Output Means of
verification Source of verification
Time frame Responsible officer
Community training in wetland management
Number of community trainings held
Minutes Reports
Monthly\ Quarterly
DNRO DWO DEO
River bank and wetland restoration
Acreage of wetlands restored
Minutes Reports
Monthly\ Quarterly
DNRO DWO DEO
Operation and mantainence plan Project Out put What is to be done Responsible person Cost Remarks
Sustainable utilization and management of wetlands
Community training in wetland management River bank and wetland restoration
DNRO DWO DEO
25,415,000 The project to run for a period of five years.

185
Environment Impact Assessment and Mitigation The project does not include activities that are likely to have negative environmental implications. DEPARTMENT: NATURAL RESOURCES SUB-SECTOR: LAND MANAGEMENT CODE: 550/08/34/8004 TITLE OF THE PROJECT: ORDERLY, LAWFUL AND SUSTAINABLE LAND DEVELOPMENT IN THE DISTRICT IMPLEMENTING AGENCY: RUKUNGIRI DISTRICT LOCAL GOVERNMENT LOCATION: DISTRICT WIDE TOTAL PLANNED EXPENDITURE: 177,610,000 FUNDS SECURED: 0 FUNDING GAP: 177,610,000 RECURRENT EXPENDITURE: START DATE: 1ST JULY, 2015. COMPLETION DATE: 30TH JUNE, 2020. Project Objective To manage orderly, lawful and sustainable land development in the District. Targeted Beneficiaries Communities in the entire district Project Background and Justification Most land holdings in the district are neither surveyed nor mapped, thus possess no title deeds. Urban centers are not planned and this has led to haphazard developments in these urban centers. Proper land management including surveying, physical planning and titling is the way to go to free land for public investments such as roads. Technical Description
- Disseminating national policies, strategies, programmes and guidelines on land, housing and urban development within the District
- Coordinating the development of District Council bye-laws and Ordinances on sustainable use and development of land
- Implementation of national lands, housing and urban development initiatives and policies in the District
- Preparing and registering all lease documents in the District
- Revitalization of physical planning committees functions in the district - Enforcing the Physical Planning Act, 2010 and other relevant laws
- Guiding District Authorities on balanced development - Surveying of Local Government land as requested by the relevant authorities
- Providing technical support in solving land disputes;

186
Project work plan and budget: Activity Budget Total Operation
and recurrent costs
Yr 1 (‘000)
Yr 2 (‘000)
Yr 3 (‘000)
Yr 4 (‘000)
Yr 5 (‘000)
Surveying of governed land
0 19,000 22,005 19,870 14,500 75,375,000
Physical Planning of urban centers
0 16,000 18,670 22,000 11,000 67,670,000
Processing of land application files for titling
5,000 6,500 7,120 7,805 8,140 34,565,000
Monitoring and evaluation
Activity Indicator/Output Means of verification
Source of verification
Time frame Responsible officer
Surveying of governed land
Surveyed and titled government land
Cadastral sheets Deed plans
Monthly Quarterly Annually
DSS SLMO
Physical Planning of urban centers
Planned urban centers
Structure and detailed plans
Monthly Quarterly Annually
DPP SLMO
Processing of land application files for titling
Number of Land titles issued
Physical searches Certificates of Land titles
Monthly Quarterly
DROT SLMO
Operation and mantainence plan
Project Out put What is to be done Responsible person Cost Remarks
Orderly, lawful and sustainable land development in the District
Surveying of governed land Physical Planning of urban centers Processing of land application files for titling
DNRO SLMO DROT DSS DPP
Project to run for five years
Environment Impact Assessment and Mitigation The project does not include activities that are likely to have negative environmental implications. DEPARTMENT: NATURAL RESOURCES SUB-SECTOR: FORESTRY SERVICES CODE: 550/08//34/8003 TITLE OF THE PROJECT: TREE PLANTING AND AGROFORESTRY IMPLEMENTING AGENCY: RUKUNGIRI DISTRICT LOCAL GOVERNMENT LOCATION: DISTRICT WIDE TOTAL PLANNED EXPENDITURE: 77,259,000 FUNDS SECURED: 77,259,000

187
FUNDING GAP: 0 RECURRENT EXPENDITURE: START DATE: 1ST JULY, 2015. COMPLETION DATE: 30TH JUNE, 2020. Project Objectives To ensure sustainably managed and adequate forest cover in the district. Targeted Beneficiaries Private forest investors and local communities Project Background and Justification Wood fuel is the major source of energy to most household both in rural and urban areas. There is increasing need for forest products and the existing forests are being depleted to create land for cultivation, building construction and human settlements. Tree planting and agroforestry is the only solution to meet the current forestry products requirement for both domestic and commercial use. More so agro forestry increases fertility and water conservation and improves household incomes and livelihoods for the local people. Technical Description
- Sustainable management of forest Sub-sector programmes in the District
- Enforcing the observance of National Forestry and Tree planting Act 2003 - Supervising the establishment of tree nursery beds in the District
- Providing technical guidance and forestry extension services to Council and the communities
- Providing technical support to the wood based industries in the District
- Providing forest extension services to farm and plantation developers - Supporting the development of ecotourism
- Sensitizing communities about the benefits of sustainable exploitation of forest resources
- Identifying degraded natural forests and supervising enrichment planting Project work plan and budget: Activity Budget Total Operation
and recurrent costs
Yr 1 (‘000)
Yr 2 (‘000)
Yr 3 (‘000)
Yr 4 (‘000)
Yr 5 (‘000)
Tree Planting and afforestation
9,059 6,600 9,059 10,125 11,105 45,948,000
Training in forestry management
2,753 1,000 2,753 2,950 3,105 12,561,000
Forestry regulation and inspection
4,000 2,000 4,000 4,250 4,500 18,750,000

188
Monitoring and evaluation Activity Indicator/Output Means of
verification Source of verification
Time frame Responsible officer
Tree Planting and afforestation
Acreage of land planted with trees
Reports
Monthly Quarterly
DFO DNRO
Training in forestry management
Number of meeting conducted
Minutes Reports
Monthly Quarterly
DFO DNRO
Forestry regulation and inspection
Number of inspections conducted
Reports Monthly Quarterly
DFO DNRO
Operation and mantainence plan Project Out put What is to be done Responsible person Cost Remarks
Tree planting and agroforestry
Tree Planting and afforestation Training in forestry management Forestry regulation and inspection
DFO DNRO
77,259,000 The activity will be conducted for the period of five years
Environment Impact Assessment and Mitigation The project does not include activities that are likely to have negative environmental implications.
COMMUNITY BASED SERVICES DEPARTMENT
DEPARTMENT COMMUNITY BASED SERVICES SUB-SECTOR COMMUNITY DEVELOPMENT CODE 550/07/71/8001 TITLE OF PROJECT FUNCTIONAL ADULT LITERACY IMPLEMENTING AGENCY RUKUNGIRI DISTRICT LOCAL GOVERNMENT LOCATION DISTRICT WIDE TOTAL PLANNED EXPENDITURE 200,000,000 FUNDS SECURED 60,000,000 FUNDING GAP 140,000,000 RECURRENT EXPENDITURE 200,000,000 START DATE JULY 2015 COMPLETION DATE JUNE 2020 PROJECT OBJECTIVES: To increase the level of literacy in the District TARGETED BENEFICIARIES: Illiterate people aged 18 years and above PROJECT BACKGROUND AND JUSTIFICATION The literacy rate in the District is still low. There is need to strengthen Functional Adult Literacy Programme to enable the whole District population read and write with understanding. This will contribute to the population to transform from a peasant society to a modern society.

189
TECHNICAL DESCRIPTION
Conducting review meetings.
Carrying out instruction of Functional Adult Literacy Learners
Testing Adult learners
District Supervision of FAL activities.
Purchase of chalk boards and chalk POJECT WORKPLAN AND BUDGET Activity
BUDGET(‘000) Total Recurrent/operational
cost
YEAR 1 YEAR 2
YEAR 3 YEAR 4 YEAR 5
Purchase of blackboards and Chalk
6,000 6,000 6,000 6,000 6,000 30,000
Holding Functional Adult Literacy review meetings at subcounty and District
6,000 6,000 6,000 6,000 6,000 30,000 30,000
Carrying out support supervision visits to FAL Classes
8,000 8,000 8,000 8,000 8,000 40,000 40,000
Financial incentive to FAL Instructors
20,000 20,000 20,000 20,000 20,000 100,000 100,000
MONITORING AND EVALUATION STRATEGY The project will be monitored through site visits by District Level Staff, the District TPC and the Standing committee of the District Council responsible for the Community based services Department. Annual evaluation will be done by the implementers and the District Technical planning committee. OPERATION AND MAINTENANCE The Functional Adult literacy Instructors will look after instructional materials under their charge ENVIRONMENTAL IMPACT ASSESSMENT AND MITIGATION PLAN Environmental concern Mitigation measure Cost Source of funding
Poor waste disposal of bottles and other liter at FAL classes venue
Putting in place a compost pit
50,000 shs. District Local Government
DEPARTMENT COMMUNITY BASED SERVICES SECTOR SOCIAL REHABILITATION CODE 550/07/71/8001 TITLE OF PROJECT COMMUNITY BASED REHABILITATION IMPLEMENTING AGENCY RUKUNGIRI DISTRICT LOCAL GOVERNMENT LOCATION DISTRICT WIDE TOTAL PLANNED EXPENDITURE 260,000,000 FUNDS SECURED 140,000,000 FUNDING GAP 120,000,000 RECURRENT EXPENDITURE 260,000,000 START DATE JULY 2015 COMPLETION DATE JUNE 2015

190
PROJECT OBJECTIVES: To promote socio-economic development of persons with disabilities TARGETED BENEFICIARIES: People with Disabilities in Rukungiri District PROJECT BACKGROUND AND JUSTIFICATION People With disabilities are stigmatized, poor, Lack appropriate appliances, skills and capital. Therefore there is need to identify key concerns of the people with disabilities so as to empower them and promote integration of their concerns into the development process. TECHNICAL DESCRIPTION
Routine assessment, management and referral of disability cases.
Training of people with disabilities and Parents/ helpers on disability management
Training of PWDs in income Generating activities.
Provision of grants to PWDs groups
Provision of appropriate appliances.
District level Support supervision POJECT WORKPLAN AND BUDGET Activity BUDGET(‘000) Total
YEAR 1 YEAR 2 YEAR 3 YEAR 4 YEAR 5 Recurrent/operational cost
Routine assessment, management and referral of disability cases.
6,000 6,000 6,000 6,000 6,000 30,000 30,000
Training of people with disabilities and Parents/ helpers on disability management
6,000 6,000 6,000 6,000 6,000 30,000 30,000
Provision of grants to PWDs groups
20,000 20,000 20,000 20,000 20,000 100,000 100,000
Provision of appropriate appliances.
5,000 5,000 5,000 5,000 5,000 25,000 25,000
Support supervision 5,000 5,000 5,000 5,000 5,000 25,000 25,000
MONITORING AND EVALUATION STRATEGY
The project will be monitored through site visits by District Level Staff, the District Technical planning Committee and the Standing committee of the District Council responsible for the Community based services Department. Annual evaluation will be done by the implementers and the District Technical planning committee. OPERATION AND MAINTENANCE
The People with Disabilities will maintain their appliances and projects

191
ENVIRONMENTAL IMPACT ASSESSMENT AND MITIGATION PLAN
Environmental concern Mitigation measure
Cost Source of funding
The concerns will depend on the nature of the projects
Mitigation will depend on the nature of the projects
- Benefiting People with Disabilities
DEPARTMENT COMMUNITY BASED SERVICES SECTOR WOMEN PROGRAMMES CODE 550/07/71/8001 TITLE OF PROJECT WOMEN EMPOWERMENT IMPLEMENTING AGENCY RUKUNGIRI DISTRICT LOCAL GOVERNMENT LOCATION DISTRICT WIDE TOTAL PLANNED EXPENDITURE 2,310,000,000 FUNDS SECURED 2,200,000,000 FUNDING GAP 110,000,000 RECURRENT EXPENDITURE 2,310,000,000 START DATE JUL 2015,000 COMPLETION DATE June 2020,000 PROJECT OBJECTIVES: To enhance youth participation in Social Economic Development TARGETED BENEFICIARIES: Youth in Rukungiri District PROJECT BACKGROUND AND JUSTIFICATION The Youth generally lack access to productive resources and skills for participation in Socio Economic development. As a result a large number of them are unemployed, dependent and involved in unproductive activities such as substance abuse, hence; need to empower them with productive skills and capital TECHNICAL DESCRIPTION
Mobilisation of youth
Provision of startup materials/capital to the youth for IGAs
Holding youth council meetings

192
Activity BUDGET(‘000) Total
YEAR 1 YEAR 2
YEAR 3 YEAR 4 YEAR 5 Recurrent/operational cost
Providing a revolving loan to Youth groups
210,000 500,000 500,000 500,000 500,000 2,210,000 2,210,000
Holding Youth Council meetings
10,000 10,000 10,000 10,000 10,000 50,000 50,000
Mobilisation of youth and monitoring youth projects
10,000 10,000 10,000 10,000 10,000 50,000 50,000
MONITORING AND EVALUATION STRATEGY The project will be monitored through site visits by District Level Staff, the District TPC and the Standing committee of the District Council responsible for the Community based services Department. Annual evaluation will be done by the implementers and the District Technical planning committee. OPERATION AND MAINTENANCE Youth groups will be responsible for operation and maintenance of their projects. ENVIRONMENTAL IMPACT ASSESSMENT AND MITIGATION PLAN Environmental concern Mitigation measure Cost Source of funding
Environmental concerns will depend on the nature of projects to be undeertaken
Environmental concerns will depend on the nature of projects
- Youthgroups own project funds
DEPARTMENT COMMUNITY BASED SERVICES SECTOR SOCIAL REHABILITATION CODE 550/07/71/8001 TITLE OF PROJECT SUPPORT TO THE ELDERLY IMPLEMENTING AGENCY RUKUNGIRI DISTRICT LOCAL GOVERNMENT LOCATION DISTRICT WIDE TOTAL PLANNED EXPENDITURE 640,0000 FUNDS SECURED - FUNDING GAP 6 40,000,000 RECURRENT EXPENDITURE 6 40,000,000 START DATE JULY 2015 COMPLETION DATE JUNE 2020 PROJECT OBJECTIVES: To promote socio-economic development of the elderly people TARGETED BENEFICIARIES: The poorest of the Elderly people aged 6 5 years and above in Rukungiri District

193
PROJECT BACKGROUND AND JUSTIFICATION The elderly lack care and support and are burdened by orphans hence programmes to cater for their Socio-economic needs TECHNICAL DESCRIPTION
Needs assessment Provision of a cash transfer grant to Elderly people
POJECT WORKPLAN AND BUDGET Activity
BUDGET(‘000) Total
YEAR 1 YEAR 2
YEAR 3 YEAR 4 YEAR 5 Recurrent/operational cost
Making cash transfers to the Elderly
150,000 150,000 150,000 150,000 600,000 600,000
Mobilising the elderly people
10,000 10,000 10,000 10,000 40,000 40,000
MONITORING AND EVALUATION STRATEGY The project will be monitored through site visits by District Level Staff, the District TPC and the Standing committee of the District Council responsible for the Community based services Department. Annual evaluation will be done by the implementers and the District Technical planning committee. OPERATION AND MAINTENANCE The elderly people will be responsible for operation and maintenance of their projects. ENVIRONMENTAL IMPACT ASSESSMENT AND MITIGATION PLAN Environmental concern Mitigation measure Cost Source of funding
Environmental concerns will depend on the nature of Elderly projects to be undeertaken
Mitigation will depend on the nature of the projects
- The ELderly own project funds

194
DEPARTMENT COMMUNITY BASED SERVICES SECTOR COOMUNITY DEVELOPMENT CODE 550/07/71/8001 TITLE OF PROJECT CULTURE AND THEATRE DEVELOPMENT IMPLEMENTING AGENCY RUKUNGIRI DISTRICT LOCAL GOVERNMENT LOCATION DISTRICT WIDE TOTAL PLANNED EXPENDITURE 100,000 FUNDS SECURED 97,500 ,000 FUNDING GAP 2,500,000 RECURRENT EXPENDITURE 100,000,000 START DATE JUL 2015 COMPLETION DATE JUNE 2016 PROJECT OBJECTIVES: To preserve and promote positive cultural values, at the same time sensitising the communityon development issues TARGETED BENEFICIARIES: The general community of Rukungiri District PROJECT BACKGROUND AND JUSTIFICATION The Communities had positive cultural values that are slowly dying out. In addition to providing entertainment and recreation, Music, dance and drama shall be used to deliver development messages e.g. poverty eradication TECHNICAL DESCRIPTION The District will support cultural festivals or competitions and also support a cultural troupe representing the district POJECT WORKPLAN AND BUDGET
Activity BUDGET (‘000)
Total
YEAR 1
YEAR 2
YEAR 3
YEAR 4
YEAR 5
Recurrent/operational cost
-Providing Financial support to cultural groups
5,000
5,000
5,000 5,000
5,000 25,000 25,000
-Conducting Annual Cultural Festivals
15,000 15,000 15,000 15,000 15,000 75,000 75,000
MONITORING AND EVALUATION STRATEGY The project will be monitored through site visits by District Level Staff, the District TPC and the Standing committee of the District Council responsible for the Community based services Department. Annual evaluation will be done by the implementers and the District Technical planning committee.

195
OPERATION AND MAINTENANCE Cultural groups will be responsible to operate and maintain their own equipmentwill be responsible for operation and maintenance of their projects. ENVIRONMENTAL IMPACT ASSESSMENT AND MITIGATION PLAN
Environmental concern Mitigation measure
Cost Source of funding
Poor waste disposal of bottles and other liter at Cultural festivals sites
Putting in place a compost pits or utilizing wast disposal systems already in place at the sites
50,000 shs. District Local Government
DEPARTMENT COMMUNITY BASED SERVICES SECTOR COMMUNITY DEVELOPMENT CODE 550/07/71/8001 TITLE OF PROJECT GENDER PROGRAMME IMPLEMENTING AGENCY RUKUNGIRI DISTRICT LOCAL GOVERNMENT LOCATION DISTRICT WIDE TOTAL PLANNED EXPENDITURE 50,000 ,000 FUNDS SECURED 10,000,000 FUNDING GAP 40,000,000 RECURRENT EXPENDITURE 50,000,000 START DATE JUL 2015 COMPLETION DAT JUNE 2016 PROJECT OBJECTIVES: To mainstream gender in Government programmes TARGETED BENEFICIARIES: Senior public officers in Government departments PROJECT BACKGROUND AND JUSTIFICATION There is low level of awareness on Gender issues in the Higher and lower local governments. TECHNICAL DESCRIPTION Collect, analyze and disseminate Gender disaggregated data Mentor Staff in how to address Gender issues POJECT WORKPLAN AND BUDGET
Activity BUDGET(‘000)
Total
YEAR 1
YEAR 2
YEAR 3
YEAR 4
YEAR 5
Recurrent/operational cost
Collecting data on gender issues
5,000 5,000 5,000 5,000 5,000 25,000 25,000
Mentoring staff on Gender issues
5,000 5,000 5,000 5,000 5,000 25,000 25,000

196
MONITORING AND EVALUATION STRATEGY The project will be monitored through the participation of the Chief Administrative officer and submitted reports. Annual evaluation will be done by the implementers and the District Technical planning committee. OPERATION AND MAINTENANCE The project does not have operation and maintenance issues DEPARTMENT COMMUNITY BASED SERVICES SECTOR PROBATION AND SOCIAL WELFARE CODE 550/07/71/8001 TITLE OF PROJECT CHILD CARE AND PROTECTION IMPLEMENTING AGENCY RUKUNGIRI DISTRICT LOCAL GOVERNMENT LOCATION DISTRICT WIDE TOTAL PLANNED EXPENDITURE 1,200,000 FUNDS SECURED 1,090,000 FUNDING GAP 110,000,000 RECURRENT EXPENDITURE 1,150,000 START DATE JUL-2015 COMPLETION DATE pro JUNE 2016 PROJECT OBJECTIVES: To promote proper Child care and Protection and juvenile justice TARGETED BENEFICIARIES: Children in Rukungiri District PROJECT BACKGROUND AND JUSTIFICATION Children Constitute 57% of the total District Population The majority of the adults are not aware of the children‟s rights. Children themselves are Equally not aware of their rights, hence they are abused with impunity. The abuses include defilement, child neglect, and property dispossession. This contributes to increased juvenile delinquency and greatly contributes to vulnerability of children in the District TECHNICAL DESCRIPTION
Tracing and resettlement of lost and street children
Handling social welfare cases
Holding OVC coordination meetings
sensitising communities on Children‟s rights and responsibilities
Support supervision for OVC activities
Establishing a remand home

197
POJECT WORKPLAN AND BUDGET Activity BUDGET(‘000) Total
YEAR 1 YEAR 2 YEAR 3 YEAR 4 YEAR 5 Recurrent/operational cost
sensitising communities on Children‟s rights and responsibilities
60,000 75,000 70,000 90,000 5,000 300,000 300,000
support supervision of OVC service providers
60,000 60,000 70,000 80,000 80,000 350,000 350,000
Handling Children‟s welfare cases
30,000 30,000 30,000 30,000 30,000 150,000 150,000
Holding OVC coordination meetings
20,000 20,000 20,000 20,000 20,000 100,000 100,000
Tracing and resettlement of lost and street children
10,000 10,000 10,000 10,000 10,000 50,000 50,000
Completion and establishment of a children‟s remand home
50,000 50,000 50,000 50,000 50,000 250,000 250,000
MONITORING AND EVALUATION STRATEGY The project will be monitored through the participation of the Chief Administrative officer and submitted reports. Annual evaluation will be done by the implementers and the District Technical planning committee. DEPARTMENT COMMUNITY BASED SERVICES SECTOR LABOUR AND INDUSTRIAL RELATIONS CODE 550/07/71/8001 TITLE OF PROJECT PROMOTION AND PROTECTION OF LABOUR RIGHTS IMPLEMENTING AGENCY RUKUNGIRI DISTRICT LOCAL GOVERNMENT LOCATION DISTRICT WIDE TOTAL PLANNED EXPENDITURE 50,000,000 FUNDS SECURED 10,000,000 FUNDING GAP 40,000.000 RECURRENT EXPENDITURE 50,000.000 START DATE COMPLETION DATE pro PROJECT OBJECTIVES: To promote adherence to labor laws TARGETED BENEFICIARIES: Children in Rukungiri District PROJECT BACKGROUND AND JUSTIFICATION Quite often there are workers who serve under undefined and unsafe working conditions and terms, at the mercy of the employers.They are subject to exploitation. TECHNICAL DESCRIPTION
Mobilization and sensitization of employees and employers
Enforcement of Labor laws and good working environment.
Inspection of work places.

198
POJECT WORKPLAN AND BUDGET Activity
BUDGET(‘000) Total
YEAR 1 YEAR 2
YEAR 3
YEAR 4
YEAR 5 Recurrent/operational cost
Inspection of workplaces
5,000 5,000 5,000 5,000 5,000 25,000 25,000
Sensitising employees and employers
3,000 3,000 3,000 3,000 3,000 15,000 15,000
Handling labour complaints and enforcing labour laws
2,000 2,000 2,000 2,000 2,000 10,000 10,000
MONITORING AND EVALUATION STRATEGY The project will be monitored through quarterly meetings and submitted reports. Annual evaluation will be done by the implementers and the District Technical planning committee. DEPARTMENT COMMUNITY BASED SERVICES SECTOR COMMUNITY DEVELOPMENT CODE 550/07/71/8001 TITLE OF PROJECT COMMUNITY MOBILISATION AND EMPOWERMENT IMPLEMENTING AGENCY RUKUNGIRI DISTRICT LOCAL GOVERNMENT LOCATION DISTRICT WIDE TOTAL PLANNED EXPENDITURE 200,000,000 FUNDS SECURED 16,000 FUNDING GAP 184,000 RECURRENT EXPENDITURE 200,000,000 START DATE JULY 2015 COMPLETION DATE JUNE 2020 PROJECT OBJECTIVES: To improve social economic wellbeing of communities. TARGETED BENEFICIARIES: The general communities in Rukungiri District PROJECT BACKGROUND AND JUSTIFICATION The level of poverty and diseases is still high among communities hence poor quality of life Interventions are therefore needed to improve their social economic well being TECHNICAL DESCRIPTION
Community mobilization and sensitisation
Training of community-based organizations
Facilitation of Participatory planning in parishes
Family counseling.
Training women, youth and PWDs in income generating activities and leadership skills.

199
POJECT WORKPLAN AND BUDGET Activity
BUDGET(‘000) Total
YEAR 1
YEAR 2
YEAR 3
YEAR 4
YEAR 5
Recurrent/operational cost
Community mobilization and sensitization
5,000 5,000 5,000 5,000 5,000 25,000 25,000
Training of community-based organizations
10,000 10,000 10,000 10,000 10,000 50,000 50,000
Facilitation of Participatory planning in parishes
10,000 10,000 10,000 10,000 10,000 50,000 50,000
Family counseling.
5,000 5,000 5,000 5,000 5,000 25,000 25,000
Training women, youth and PWDs in income generating activities and leadership skills
10,000 10,000 10,000 10,000 10,000 50,000 50,000
MONITORING AND EVALUATION STRATEGY The project will be monitored through quarterly meetings and submitted reports. Annual evaluation will be done by the implementers and the District Technical planning committee. DEPARTMENT COMMUNITY BASED SERVICES SECTOR WOMEN PROGRAMMES CODE 550/07/71/8001 TITLE OF PROJECT WOMEN EMPOWERMENT IMPLEMENTING AGENCY RUKUNGIRI DISTRICT LOCAL GOVERNMENT LOCATION DISTRICT WIDE TOTAL PLANNED EXPENDITURE 850,000 ,000 FUNDS SECURED 769,000,000 FUNDING GAP 81,000,000 RECURRENT EXPENDITURE 850,000,000 START DATE JUL 2015,000 COMPLETION DATE June 2020,000 PROJECT OBJECTIVES: To promote women participation in Socio- economic Development programmes TARGETED BENEFICIARIES: Women in Rukungiri District PROJECT BACKGROUND AND JUSTIFICATION Most women lack knowledge about their rights, leadership and entrepreneurship skills. They spend a lot of time on household chores. There is need for advocacy for women. In addition, most women do not have capital to start on income generating activities

200
TECHNICAL DESCRIPTION Technical Description:
Carrying out women council sudy visits
Mobilization and Sensitization of women
Holding women council meetings
Providing a revolving loan to women groups POJECT WORKPLAN AND BUDGET Activity BUDGET(‘000) Total
YEAR 1 YEAR 2
YEAR 3 YEAR 4 YEAR 5 Recurrent/operational cost
Providing a revolving loan to Women groups
200,000 200,000 200,000 200,000 800,000 800,000
Holding women council meetings
6,000 6,000 6,000 6,000 6,000 30,000 30,000
Carrying out women council study visits
4,000 4,000 4,000 4,000 4,000 20,000 20,000
MONITORING AND EVALUATION STRATEGY The project will be monitored through site visits by District Level Staff, the District TPC and the Standing committee of the District Council responsible for the Community based services Department. Annual evaluation will be done by the implementers and the District Technical planning committee. OPERATION AND MAINTENANCE Women groups will be responsible for operation and maintenance of their projects. ENVIRONMENTAL IMPACT ASSESSMENT AND MITIGATION PLAN Environmental concern Mitigation measure Cost Source of funding
Environmental concerns will depend on the nature of women projects to be undeertaken
Environmental concerns will depend on the nature of women projects
- Women groups own project funds
EDUCATION AND SPORTS
SECTOR EDUCATION SUB /SECTOR PRIMARY EDUCATION PROJECT TITLE CORDINATION OF EDUCATION ACTIVITIES PROJECT CODE 550/5/051/8001 LOCATION RUKUNGIRI DISTRICT IMPLEMENTATION AGENCY RUKUNGIRI DISTRICT LOCAL GOVERNMENT PLANNED EXPENDITURE 8,270,804,000 FUNDS SECURED 8,270,804,000 FUNDING GAP Nil START DATE 1st JULY 2015 COMPLETION DATE 30th JUNE 2020 OBJECTIVE To ensure effective delivery of Education services in the district.

201
BACKGROUND In order to ensure proper coordination, there is need for departmental meetings for staff, maintenance of plant and equipment and quarterly coordination with the Ministry. TECHNICAL DESCRIPTION Monthly and Term meetings Quarterly submission of Work plans, Accountability and reportProcurement of double cabin pickup Maintenance of Vehicles, Motorcycles and Computers BENEFITS: All Education Department Staff, head teachers will be coordinated through meetings. BENEFICIARIES: All Education Department Staff and head teachers. SUPERVISION: The CAO will supervise the DEO through Monthly and Quarterly reports. IMPLEMENTATION PLAN: The District Education Officer will coordinate the implementation of the activities OPERATION & MAINTENANCE: N/A FINANCING: These activities will be funded by Local Revenue. FINANCING PLAN 2015/2016 -2019/2020
Activity Budget Total ‘000’
Yr 1 ‘000’
Yr 2 ‘000’
Yr 3 ‘000’
Yr 4 ‘000’
Yr 5 ‘000’
Primary Education management and administration
289,704 954,275 829,702 912,671 1,003,939 8,470,804
Total 289,704 954,275 829,702 912,671 1,003,939 8,470,804
Central Government
289,704 954,275 829,702 912,671 1,003,939 8,470,804
Secured Funds 289,704 954,275 829,702 912,671 1,003,939 8,470,804
Un-Secured Funds 0 0 0 0 0 0
Total 289,704 954,275 829,702 912,671 1,003,939 8,470,804
Supervision and inspection arrangement: Supervision shall be conducted by the Education inspectorate under the District Education Officer SECTOR EDUCATION SUB/SECTOR PRIMARY EDUCATION /INSPECTORATE CODE 550/5/51/8005 PROJECT TITLE CONSTRUCTION OF CLASSROOMS IMPLEMENTING AGENCY RUKUNGIRI DISTRICT LOCAL GOVERNMENT LOCATION DISTRICT WIDE PLANNED EXPENDITURE 3,500,000,000 SECURED FUNDS - FUNDING GAP 3,500,000,000

202
START DATE 1st JULY 2015 COMPLETION DATE 30th JUNE 2020 Objective: To improve school structures and create adequate and conducive learning environment Background: The classrooms in existence were in a sorry state. Learners were not comfortable due to inadequate and un-conducive classroom environment Technical Description: Regular monitoring by DEO, head teachers and Parents. Submission of quarterly reports to CAO DEO reporting to CAO Benefits: Better structures, adequate classrooms and conducive classroom environment. Beneficiaries: Pupils, teachers, parents and community Implementation Plan: The District Education Officer will coordinate the project and involve inspectors of schools in monitoring Financing Plan FINANCING PLAN 2016/2017
Activity Budget Total ‘000’
Yr 1 ‘000’
Yr 2 ‘000’
Yr 3 ‘000’
Yr 4 ‘000’
Yr 5 ‘000’
Construction of Classroms
0 3,500,000 0 0 0 3,500,000
Total 0 3,500,000 0 0 0 3,500,000
Central Government
0 3,500,000 0 0 0 3,500,000
Secured Funds 0 0 0 0 0 0
Un-Secured Funds 0 3,500,000 0 0 0 3,500,000
Total 0 3,500,000 0 0 0 3,500,000
Supervision and Certification arrangement: Supervision shall be conducted by the Engineering staff under the District Engineer and District Education Officer. HEALTH SERVICES SECTOR HEALTH SERVICES SUB SECTOR ENVIRONMENTAL HEALTH PROJECT CODE: 550/08/81/8007 PROJECT TITLE ENVIRONMENTAL HEALTH ISPECTIONS IMPLEMENTING AGENCY RUKUNGIRI DISTRICT LOCAL GOVERNMENT LOCATION 9 SUB-COUNTIES AND 3 MUNICIPAL DIVISIONS PLANNED EXPENDITURE 150,000,000 FUNDS SECURED 150,000,000

203
FUNDING GAP NIL START DATE: JULY 2017 COMPLETION DATE: JUNE 2018 Objectives: Reduce environmental health related diseases such as diarrheal diseases, malaria, intestinal worms, HIV/AIDS & TB cases, morbidity, and mortality and improve the quality of the environment where people live. Background: The incidence of diseases such as diarrheal diseases, malaria, intestinal worms, HIV/AIDS & TB cases; and there is high morbidity and mortality and the quality of the environment where people live is contaminated with disease causing organisms. HIV prevalence in the district has remained high at 4.6%. No Pneumonia cold or cough is the leading disease at 29.5% and malaria being the second with 17.0% for the year 2014/2015. The infant mortality rate has constantly remained high at 30 children per 1000 live births and Maternal Mortality ratio at 117 per 100000 people. TB case detection is low at 70%. Hence the need for continuous support from implementing partners in order to reduce the incidence of these conditions. Technical Description: Health inspection for health promotion is important in identifying and abating nuisances that lead to diseases. Benefits: To reduce disease causing nuisances in the district. Beneficiaries: Community members, health workers and community leaders. Feasibility Study: Data from Health Management Information System (2013/2014) indicated that incidence of communicable diseases is high eg No Pneumonia cold or cough is the leading disease at 29.5% and malaria being the second at 17.0%. TB case detection and CB-DOTS require continuous and active surveillance and automatically funding. Financing: The project will be funded by DLG, MOH and EGPAF RHITES SW Financing Plan:
Source of funds Expenditure by quarters Total
Q1 Q2 Q3 Q4
000 000 000 000
DLG,MOH & EGPAF RHITES SW
30000 30000 30000 3000 150,000,000
Total funds secured 30000 30000 30000 30000 150,000,000
Total 30000 30000 30000 30000 150,000,000

204
Monitoring and Evaluation Plan:
Activity Output Indicator
Means of Verification
Source of Verification
Time Frame
Responsible Office
Reduce disease causing nuisances lowering morbidity and mortality in the district
-Reduced prevalence of communicable and TB cases -Reduced mortality &morbidity rates
Reports from DHIS2 software
DHO‟s Office
July 2017 to June 2018
DHO
Operation and Maintenance Plan:
Project Output What is to be done Responsible Officers
Cost Remarks
Reduce disease causing nuisances Reduced mortality &morbidity rates
-Timely accountability -Timely planning and budgeting. -Timely HMIS reporting both weekly and monthly
Senoir Environmental health officer -TB/leprosy Supervisor -District Biostatistician
Environmental Impact Assessment/Concerns:
Environmental component affected
Nature of environment concerns
Mitigation measures
Settlement area -Health care Waste generation expired medicines
-Provide waste bins for management of HCW -Provide medical waste pits.
Supervision and Certification Arrangement: The DHT and HSDs will supervise the project implementation.

205
SECTOR HEALTH SERVICES SUB SECTOR ADMINISTRATION PROJECT CODE: 550/08/81/8006 PROJECT TITLE IMPROVEMENT OF GOVERNMENT BASIC HEALTH SERVICES IMPLEMENTING AGENCY ALL PUBLIC HEALTH FACILITIES LOCATION 9 SUB-COUNTIES AND 3 MUNICIPAL DIVISIONS PLANNED EXPENDITURE 118,091,526 FUNDS SECURED 118,091,526 FUNDING GAP NIL START DATE: JULY 2015 COMPLETION DATE: JUNE 2016 Objective: To improve performance of basic health services for Government HCIVs, HCIIs, and HCIIs. Background: Public health facilities play an important role in health care delivery. However donor funding to this sector has continued to decline hence the need for increased Government funding. Support to this sector will reduce the medical conditions of patients like malnutrition, HIV/AIDS, malaria Technical Description: Funding will be made directly to basic lower Government health centers to improve performance. Benefits: Improved service delivery of public health facilities Beneficiaries: The community members served by the health facilities in all the sub counties and municipal divisions Feasibility Study: Reports from public health facilities and community complaints indicated the continuous need for Government funding to the Government health facilities. The Government put in a push system for drugs to help patient easily access the services at zero cost. Financing: The project will be financed by Ministry of Health under PAF.

206
Budget and Financing Plan: Source of funds Expenditure by quarters Total
Q1 Q2 Q3 Q4
PAF
Total funds secured 29,522,882 29,522,882 29,522,882 29,522,882 118,091,526
Total unsecured
Total 29,522,882 29,522,882 29,522,882 29,522,882 118,091,526
Monitoring and Evaluation Plan: Project Activity Output
Indicator Means of Verification
Source of Verification
Time Frame Responsible Office
Improving public health service delivery
Public health service delivery improved
-HMIS reports -Accountability reports
DHOs Office July 2017 to June 2018
DHO
Operation and Maintenance Plan:
Project Output What is to be done Responsible Officer
Cost Remarks
Improved public health service delivery
-Timely accountability. -Timely submission of HMIS reports
DHO -
Environmental Impact Assessment/Concerns: Environmental component affected
Nature of environment concerns Mitigation measure
Settlement areas -Waste generation -Poor sanitation
-Provide medical waste pits. -Cater for sanitation and hygiene
Supervision and Certification Arrangement The District Health team and health sub-districts will supervise the services to ensure conformity with National Health Service delivery standard. SECTOR HEALTH SERVICES SUB SECTOR HEALTH EDUCATION PROJECT CODE: 550/08/81/8007 PROJECT TITLE HEALTH PROMOTION IMPLEMENTING AGENCY RUKUNGIRI DISTRICT LOCAL GOVERNMENT LOCATION 9 SUB-COUNTIES AND 3 MUNICIPAL DIVISIONS PLANNED EXPENDITURE 450,000,000 FUNDS SECURED 450,000,000 FUNDING GAP NIL START DATE: JULY 2017 COMPLETION DATE: JUNE 2018 Objectives: Reduce HIV/AIDS & TB related cases, morbidity, mortality and improve the quality of services Background: HIV prevalence in the district has remained high at 4.6%. No Pneumonia cold or cough is the leading disease at 29.5% and malaria being the second with 17.0% for the year 2014/2015. The infant mortality rate has constantly remained high at 30 children per 1000 live births and

207
Maternal Mortality ratio at 117 per 100000 people. TB case detection is low at 70%. Hence the need for continuous support from implementing partners. Technical Description: PMTCT and HIV counseling and testing will be strengthened at all HC IIIs and HC IVs. Staff will be trained in case management for AIDS, HIV/TB collaboration activities will be strengthened. Laboratories will be strengthened for case detection. New ART guidelines will be rolled out to all Option B+ sites to offer HIV care at HC IIIs. Benefits: To control HIV/AIDS, TB problems and other diseases in the district. Beneficiaries: Community members, health workers and community leaders. Feasibility Study: Data from Health Management Information System (2013/2014) indicated that HIV prevalence has remained high at 4.6%. Maternal mortality ratio has remained high at 117 per 100,000 live births. TB case detection and CB-DOTS require continuous funding. Financing: The project will be funded by DLG, MOH, SDS and EGPAF RHITES SW Financing Plan:
Source of funds Expenditure by quarters Total
Q1 Q2 Q3 Q4
000 000 000 000
DLG,MOH,SDS & EGPAF
112,500 112,500 112,500 112,500 450,000,000
Total funds secured 112,500 112,500 112,500 112,500 450,000,000
Total 112,500 112,500 112,500 112,500 450,000,000
Monitoring and Evaluation Plan: Activity Output
Indicator Means of Verification
Source of Verification
Time Frame Responsible Office
Controlling HIV/AIDS &reducing morbidity and mortality in the district
-Reduced prevalence of HIV/AIDS & TB cases -Reduced mortality &morbidity rates
Reports from DHIS2 software
DHO‟s Office July 2017 to June 2018
DHO
Operation and Maintenance Plan: Project Output What is to be done Responsible
Officers Cost Remarks
Controlling HIV/AIDS and TB Reduced mortality &morbidity rates
-Timely accountability -Timely planning and budgeting. -Timely HMIS reporting both weekly and monthly
-District HIV/AIDS Focal Person -TB/leprosy Supervisor -District Biostatistician

208
Environmental Impact Assessment/Concerns: Environmental component affected
Nature of environment concerns Mitigation measures
Settlement area -Waste generation especially medicine containers and expired medicines
-Provide medical waste pits. -Retrieve expired medicines to DHO‟s stores
Supervision and Certification Arrangement: The DHT and HSDs will supervise the project implementation. SECTOR HEALTH SERVICES SUB SECTOR MATERNAL AND CHILD HEALTH SERVICES PROJECT CODE: 550/08/81/8008 PROJECT TITLE INTRODUCTION OF INACTIVATED POLIO VACCINE (IPV) AND ONE DOSE OF MEASLES IMPLEMENTING AGENCY RUKUNGIRI DISTRICT LOCAL GOVERNMENT LOCATION ALL SUB-COUNTIES AND MUNICIPAL DIVISIONS PLANNED EXPENDITURE 170,307,100 SECURED FUNDS 170,307,100 FUNDING GAP NIL START DATE: JULY 2018 COMPLETION DATE: JUNE 2019 Objective: To immunize all children 0-59 months in the district Background: Countrywide measles campaign targeting all children aged 6-59 months with one dose of the measles vaccine will be conducted in August 2018. Also joining global efforts to eradicate polio disease, the Ministry of Health had introduced one dose of the inactivated polio vaccine (IPV) at 14 weeks to children less than one year in October 2015. Technical Description: Health workers in both Government and PNFPs facilities will give one dose of inactivated polio vaccine after the retraining has been done. All children aged 6-59 months will receive one dose of measles vaccine during the measles campaign. Also inactivated polio vaccine (IPV) at 14 weeks will be given to children below one year. Benefits: Eradicate childhood immunisable diseases Beneficiaries: Children of age 0-59 months in Rukungiri District. Feasibility Study: Polio outbreaks were confirmed in Somalia, Congo and to the neighboring district such as Ntungamo, Kanungu, Sheema, Mitooma have had measles outbreaks and this calls for the campaign. Financing: The project will be financed by Ministry of Health, World Health Organization and UNICEF.

209
Budget and Financing Plan: Source of funds Expenditure by quarters Total
Q1 Q2 Q3 Q4
UNICEF 120,000,000 50,307,100 - - 170,307,100
Total secured funds 120,000,000 50,307,100 - - 170,307,100
Total 120,000,000 50,307,100 - - 170,307,100
Monitoring and Evaluation Plan Activity Output
Indicator Means of Verification
Source of Verification
Time Frame Responsible Office
Immunizing all children 0-59 months
All children immunized
-HMIS reports -Activity reports
DHO‟s office July 2018 to June 2019
DHO
Operation and Maintenance Plan: Project Output What is to be done Responsible
Officer Cost Remarks
Children immunized with polio and measles during the campaign
-Timely planning and budgeting. - Strengthen routine immunization -Timely accountability.
DHO
-
Environmental Impact Assessment/Concerns: Environmental component affected
Nature of environment concerns Mitigation measures
Nil
None None
Supervision and Certification Arrangement: The District health team and the health sub-districts will supervise the project implementation
WORKS AND TECHNICAL SERVICES
SECTOR : WORKS, WATER & ROADS SUB-SECTOR : ROADS AND BRIDGES CODE : 550/ TITLE : ROADS MAINTENANCE IMPLEMENTING AGENCY : RUKUNGIRI LOCAL GOVERNMENT LOCATION : DISTRICT WIDE PLANNED EXPENDITURE : 4,296,509,000 = FUNDS SECURED : 4,296,509,000 = FUNDING GAP : NIL OPERATION EXPENDITURE` 217,070,000= START DATE: 1ST JULY, 2015. COMPLETION DATE: 30TH JUNE, 2020. Objective: To ensure that roads are regularly maintained in motorable conditions to foster social economic development of the people through easy access to social services and markets for their agricultural produce and goods.

210
Background Experience has shown that when a road is rehabilitated or periodically maintained and no routine maintenance is done, its general condition depreciates very fast. This has been proved by observations on some rehabilitated roads. It was realized that there is a big difference between sections where there is routine maintenance and where it is not. This has therefore, made us undertake routine maintenance of District roads with priority given to newly rehabilitated and major roads. Some roads are beyond maintenance using manual labour. We have therefore, planned to do mechanized maintenance. Technical Description
Road condition assessment of all District roads (feeder roads) in addition to minor and spot repair inventory.
Culvert and bridge inventory on all district roads.
Preparation of the cost estimates submitted to District Contracts Committee for approval.
Road maintenance inputs supplied by the pre-qualified Suppliers under frame work contract.
Execution of works using force account mechanism.
Inspection, Spot Supervision and monitoring with compilation of field activity reports. Benefits:
Easy access to markets.
Less maintenance costs on vehicles, motor cycles and bicycles.
Easy access to social amenities by service providers/ seekers and supervisors
Reduction of time waste by road users to get to their destinations.
Increase on traffic flow / attraction of new vehicles Beneficiaries:
The district community and other road users. Feasibility study: Not applicable. Plan of operation This project will start with Assessment of roads and compilation of culverts and bridge inventory by the Works Department, and preparation of cost estimates and specifications for the road maintenance inputs. Procurement requisition form 1 with appended cost estimates for road maintenance inputs shall be submitted to District Contracts Committee for approval. After approval road maintenance inputs shall be supplied by the pre-qualified Suppliers under frame work Contract followed by execution using force account mechanism. For manual routine road maintenance, we shall have road gangs recruited and supervised by the headmen and Road inspectors. Inspection, Monitoring, and Supervision shall be routine using standard forms for reporting by Road Inspectors with the compilation of field activity reports.

211
Operation and Maintenance: This activity will be monitored / supervised from time to time to ensure that all the loopholes are curtailed during implementation to ensure that the right job for effective results is achieved. Project Work plan and budget Activity Budget
Total ‘000’
Operation and recurrent costs
Yr 1 „000‟
Yr 2 „000‟
Yr 3 „000‟
Yr 4 „000‟
Yr 5 „000‟
Routine Mechanised maintenance of Roads (1,008Km)
368,600 247,800 400,000 500,000 500,000 2,016,400
100,820
Routine Manual maintenance of Roads (580km)
102,000 85,000 102,000 102,000 102,000 493,000
24,650
Addressing road bottle necks on Community Access Roads (CARs) in 9Sub-Counties of Buyanja, Kebisoni, Nyarushanje, Nyakishenyi, Nyakagyeme, Bugangari, Ruhinga, Buhunga, Bwambara
95,000 220,000 220,000 425,000 425,000
1,385,000
69,250
Procurement of 440 Culverts, Maintenance of 13 No. drainage structures, Embankment fillings 17No. 27,905 44,204 99,000 105,000 126,000 402,109
22,350
Total 593,505 597,004 821,000 1,132,000 1,153,000 4,296,509 217,070
Central Government URF
593,505 597,004 821,000 1,132,000 1,153,000 4,296,509 217,070
Secured Funds 593,505 597,004 821,000 1,132,000 1,153,000 4,296,509 217,070
Un-Secured Funds 0 0 0 0 0 0 0
Total
593,505 597,004 821,000 1,132,000 1,153,000 4,296,509 217,070
Operation and Maintenance Plan Project Output What is to be done Responsible
officers Cost Remarks
Maintained roads
-To conduct regular site inspections on the maintained roads to ascertain any occurrence of any bottleneck.
-DE -SAEO -AEO -RIs
217,070,000 If any bottleneck is found it should be fixed immediately before any further accumulation.
Environmental Concerns: Environmental component affected
Nature of the environmental concern
Mitigation measures
Land -Soil erosion -Loss of vegetation cover
-Open many off shoots -Grub when rains are not too heavy -Plant creeping grass

212
Supervision and Certification arrangement: Supervision shall be conducted by the Engineering staff under the District Engineer. SECTOR : WORKS, WATER & ROADS SUB-SECTOR : ROADS AND BRIDGES CODE : 550/ TITLE : CONSTRUCTION OF BRIDGES IMPLEMENTING AGENCY: RUKUNGIRI LOCAL GOVERNMENT LOCATION : DISTRICT WIDE PLANNED EXPENDITURE: 4,000,000,000= FUNDS SECURED : NIL FUNDING GAP : 4,000,000,000= OPERATION EXPENDITURE` 200,000,000= START DATE: 1ST JULY, 2015. COMPLETION DATE: 30TH JUNE, 2020. Objective: To ensure that roads are regularly maintained in motorable conditions to foster social economic development of the people through easy access to social services and markets for their agricultural produce and goods.

213
Background Experience has shown that when a road is rehabilitated or periodically maintained and no major bridges constructed because of constrained budget and access is restricted to the rich growing and productive centers. Technical Description
Road condition assessment of all District roads (feeder roads) in addition to minor and spot repair inventory.
Culvert and bridge inventory on all district roads.
Preparation of the cost estimates submitted to District Contracts Committee for approval.
Road maintenance inputs supplied by the pre-qualified Suppliers under frame work contract.
Execution of works using force account mechanism.
Inspection, Spot Supervision and monitoring with compilation of field activity reports. Benefits:
Easy access to markets.
Less maintenance costs on vehicles, motor cycles and bicycles.
Easy access to social amenities by service providers/ seekers and supervisors
Reduction of time waste by road users to get to their destinations.
Increase on traffic flow / attraction of new vehicles Beneficiaries:
The district community and other road users. Feasibility study: Not applicable. Plan of operation This project will start with Assessment of roads and compilation of culverts and bridge inventory by the Works Department, and preparation of cost estimates and specifications for the road maintenance inputs. Procurement requisition form 1 with appended cost estimates for road maintenance inputs shall be submitted to District Contracts Committee for approval. After approval road maintenance inputs shall be supplied by the pre-qualified Suppliers under frame work Contract followed by execution using force account mechanism. For manual routine road maintenance, we shall have road gangs recruited and supervised by the headmen and Road inspectors. Inspection, Monitoring, and Supervision shall be routine using standard forms for reporting by Road Inspectors with the compilation of field activity reports. Operation and Maintenance: This activity will be monitored / supervised from time to time to ensure that all the loopholes are curtailed during implementation to ensure that the right job for effective results is achieved.
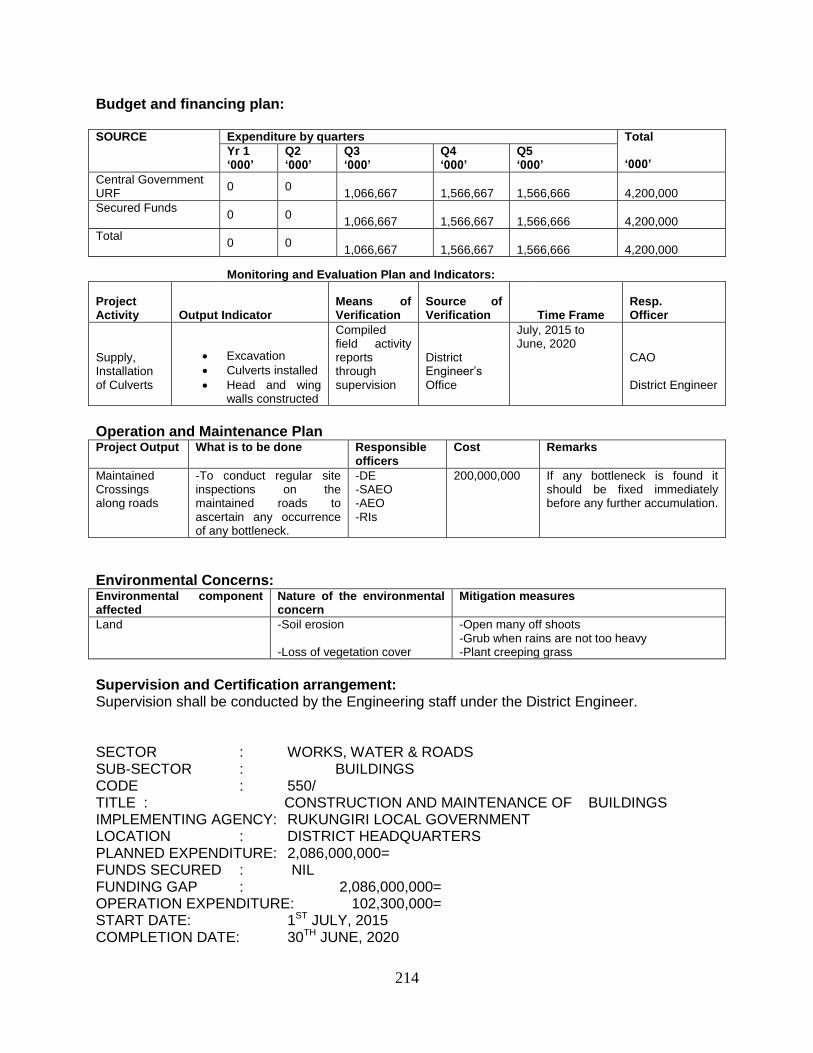
214
Budget and financing plan: SOURCE Expenditure by quarters Total
‘000’
Yr 1 ‘000’
Q2 ‘000’
Q3 ‘000’
Q4 ‘000’
Q5 ‘000’
Central Government URF
0 0 1,066,667
1,566,667
1,566,666
4,200,000
Secured Funds 0 0
1,066,667
1,566,667
1,566,666
4,200,000
Total 0 0
1,066,667
1,566,667
1,566,666
4,200,000
Monitoring and Evaluation Plan and Indicators:
Project Activity Output Indicator
Means of Verification
Source of Verification
Time Frame Resp. Officer
Supply, Installation of Culverts
Excavation
Culverts installed
Head and wing walls constructed
Compiled field activity reports through supervision
District Engineer‟s Office
July, 2015 to June, 2020 CAO
District Engineer
Operation and Maintenance Plan Project Output What is to be done Responsible
officers Cost Remarks
Maintained Crossings along roads
-To conduct regular site inspections on the maintained roads to ascertain any occurrence of any bottleneck.
-DE -SAEO -AEO -RIs
200,000,000 If any bottleneck is found it should be fixed immediately before any further accumulation.
Environmental Concerns: Environmental component affected
Nature of the environmental concern
Mitigation measures
Land -Soil erosion -Loss of vegetation cover
-Open many off shoots -Grub when rains are not too heavy -Plant creeping grass
Supervision and Certification arrangement: Supervision shall be conducted by the Engineering staff under the District Engineer. SECTOR : WORKS, WATER & ROADS SUB-SECTOR : BUILDINGS CODE : 550/ TITLE : CONSTRUCTION AND MAINTENANCE OF BUILDINGS IMPLEMENTING AGENCY: RUKUNGIRI LOCAL GOVERNMENT LOCATION : DISTRICT HEADQUARTERS PLANNED EXPENDITURE: 2,086,000,000= FUNDS SECURED : NIL FUNDING GAP : 2,086,000,000= OPERATION EXPENDITURE: 102,300,000= START DATE: 1ST JULY, 2015 COMPLETION DATE: 30TH JUNE, 2020

215
Objective: To provide structurally sound, sufficiently dressed offices for effective and efficient service delivery Background: Rukungiri District Broke away from the former Kigezi District in 1974, it inherited scattered small residential houses, which it converted into offices some of which have slightly been improved upon since then. With decentralization, the district received more staff from the central government with no provision for office accommodation for them by the centre. This complicated further the office accommodation problem. It is against this Background that this project is earmarked to address this problem. Technical Description:
Taking measurements for the proposed works under phase VIII
Preparation of Bills of quantities and bid documents
Procurement of contractors
Supervision and monitoring Benefits:
Increased office space
Efficient service delivery
Reduction in time waste associated with movements to other scattered offices
Revenue enhancement by hiring out some of the office space. Beneficiaries:
The district staff and political leaders Feasibility study: Was done by the district Plan of operation The works department will implement the project. Supervision shall be done by the office of the District Engineer. Operation and Maintenance: The District through the District Engineer will maintain the building by inspecting and making good any defects that shall become apparent. Project Work plan and budget Activity Budget
Total ‘000’
Operation and recurrent costs Yr 1
‘000’ Yr 2 ‘000’
Yr 3 ‘000’
Yr 4 ‘000’
Yr 5 ‘000’
Construction of District Administration Building
670,000
200,000
300,000
400,000
300,000
1,870,000
93,500
Maintenance of Buildings and Compound cutting
20,000 20,000 25,000 25,000 25,000
115,000
3,750
Construction 4No. VIP
20,000 0 20,000 20,000 20,000 80,000
4,000

216
Latrines
Procurement of Furniture
1,000 2,000 2,000 1,000
6,000
300
Procurement of Photocopier, Printer, UPS
0 0 5,000 5,000 5,000
15,000
750
Total 710,000 221,000 352,000 452,000 351,000 2,086,000 104,300
Central Government URF 710,000 221,000 352,000 452,000 351,000
2,086,000
104,300
Secured Funds 710,000 20,000 0 0 0 0 0
Un-Secured Funds 0 190,000 352,000 452,000 351,000
2,086,000
104,300
Total 710,000 221,000 352,000 452,000 351,000
2,086,000
104,300
Monitoring and Financing Plan Project Activity Output
Indicator Means of Verification
Source of Verification
Time Frame Resp. Officer
Construction of Administration Complex, and VIP Latrines, Buildings maintenance, compound cleaning, procurement of furniture, procurement of Photocopier and UPS.
Administration Complex, and VIP Latrines, Buildings maintenance, compound cleaning, procurement of furniture, procurement of Photocopier and UPS done.
Compiled field activity reports through regular Supervisions.
District Engineer‟s office
July, 2015 to June, 2020 CAO District Engineer
Operation and Maintenance Plan: Project Output
What is to be done Responsible officer
Cost Remarks
Completed Office block
-Conducting regular inspections to ascertain any occurrence of defects and if found, remedy them immediately and ensure that there is maintenance schedule put in place.
CAO -District Engineer
104,300,000
Mechanical, Electrical installation, Plastering, painting, Furniture on Administration Complex, and VIP Latrines, Buildings maintenance, compound cleaning, procurement of furniture, procurement of Photocopier and UPS done..

217
Environmental Concerns: Environmental component affected
Nature of the environmental concern
Mitigation measures
Land Vegetation
-Soil erosion -Accumulation of debris -Removal of vegetation
-Down water pipes should be put in place for safe water discharge into the storm water channel. -Cartaway debris from site from time to time. -Plant shade trees and creeping grass.
Supervision and Certification arrangement: Supervision and certification of executed works shall be conducted by the District Engineering staff.
WATER & SANITATION/ WORKS & TECHNICAL SERVICES
SECTOR : WATER& SANITATION
CODE : 550/04/45/8001
TITLE : CONSTRUCTION OF PIPED WATER SYSTEMS
IMPLEMENTING AGENCY: RUKUNGIRI LOCAL GOVERNMENT
LOCATION : DISTRICT WIDE
TOTAL PLANNED EXPENDITURE: 31,007,000,000
FUNDS SECURED : 237,000,000
FUNDING GAP : 30,770,000,000
RECURRENT EXPENDITURE 800,000,000
START DATE: JULY 2015.
COMPLETION DATE: JUNE 2020.
OBJECTIVES:
To provide clean and safe water to the community.
Increase access of safe water
Reduction of water and sanitation related diseases

218
TARGETED BENEFICIARIES
Rukungiri district community
PROJECT BACKGROUND AND JUSTIFICATION
Rukungiri district has many areas that have little water supplies that need water supply interventions.
Bwambara and Bugangari sub counties are the least served areas in the district with low natural ground water sources and this has resulted into limited springs and boreholes and only left with the option of rain water harvesting, seasonal open wells and streams. This has culminated into walking long distances and spending a lot of time on water collection. Diseases result from drinking unsafe water.
TECHNICAL DESCRIPTION
Mobilization of funds by ministry
Mobilization of the community.
Construction of the reservoir dam at Kabale water stream
Source protection
Construction and installation of the pumping system
Construction of Reservoir tanks
Water pipeline
Supervision and monitoring

219
BENEFITS
Access to safe water
Reduction of unsafe water related Diseases
Increased family incomes
Development of infrastructure
FEASIBILITY STUDY
Feasibility study was carried out in 2014/15 FY
PLAN OF OPERATION
The scheme shall be tendered out. The successful contractors shall be sent to Bwambara and Bugangari sub counties to start work.
OPERATION AND MAINTENANCE
On completion of the project, the ministry shall appoint an operator to take over the responsibility of maintaining the project. The District technical staff will continue providing technical support.
Project Implementation Workplan and Budget
Activity Budget Total
(‘000,000)
Operation and Recurrent Cost (000’) YR 1
(‘000,000) YR2
(‘000,000)
YR 3 (‘000,000)
YR 4 (‘000,000)
YR 5 (‘000,000)
Bwambara-Bugangari Water Supply Project
28,000 28,000 200,000
Bugarama Gravity Flow Scheme
140 237 350 727 15,000
Nyarwimuka GFS 520 520 14,000
Omukatoma GFS 130 550 680 14,200
Ruhonwa GFS 550 550 14,010
Karunoni GFS 530 530 14,005
Total 140 237 28,139 1,620 880 31,007 271,215

220
Monitoring and Evaluation Strategy
The construction of piped water systems shall be monitored& evaluated during and after construction. There shall be monitoring & supervision & monitoring by the ministry staff, district water office technical staff,district engineer, technical support unit, district council members, technical planning committee, members of district PAF monitoring committee, district internal audit office, Auditor General‟s office staff, office of resident district commissioner and state house team and development partners(NGOs) in water and sanitation sector
OPERATION AND MAINTENANCE PLAN
Project Output
What is to be done Responsible officer
Cost Remarks
Functional tap stands
-formation of water and sanitation committees
-training in financial ,management
-advocacy meetings
-exchange visits
-training of water user committees
-hiring of the scheme operator
Contractor
&
District technical staff
230,000,000 The user community to be empowered & trained to operate and maintain the project.
ENVIRONMENTAL IMPACT ASSESSMENT AND MITIGATION PLAN (EIA)
Environmental concern Mitigation measures
Cost Source of funding
Water Source Ensure the natural preservation of the catchment
Abstract not more than 60% of the natural flow
At least 1% of the project cost
Project funds
Treatment works Restoring the vegetation and soil.
At least 0.5% of the project cost
Project funds

221
Continuous motoring of effluents
Pipeline Proper restoration of soil backfilling and vegetation
At least 0.5% of the project cost
Project funds
Reservoir tanks Restoring the vegetation and soil.
At least 0.5% of the project cost
Project funds
Public taps Fencing off the public tap water points.
At least 1% of the project cost
Project funds
DEPARTMENT : WORKS & TECHNICAL SERVICES
SECTOR : WATER
CODE : 550/04/45/8001
TITLE : EXTENSIONS OF GRAVITY FLOW SCHEMES
IMPLEMENTING AGENCY: RUKUNGIRI LOCAL GOVERNMENT
LOCATION : DISTRICT WIDE
PLANNED EXPENDITURE: 2,560,000,000
FUNDS SECURED : 51,000,000
FUNDING GAP : 2,509,000,000
OPERATION EXPENDITURE 20,000,000
START DATE: JULY 2015.
COMPLETION DATE: JUNE 2020.
PROJECT OBJECTIVES:
To provide clean and safe water to the Community.
To reduce unsafe water related Diseases
To Increase family incomes
To improve Development of infrastructure

222
TARGETED BENEFICIARIES
Community within service area of the scheme
PROJECT BACKGROUND AND JUSTIFICATION
Rukungiri district has many piped water schemes that are able to serve Communities in the nearby vicinity of these schemes. This will reduce walking distances and spending a lot of time on water collection. Diseases result from drinking unsafe water will be reduced. Some areas in the have limited perennial water sources which necessitates the development of the few existing ones.
TECHNICAL DESCRIPTION Mobilization of the community.
Supply and installation of pumping system
Construction and renovation of Reservoir tanks
Water pipeline extension and repair
Supervision and monitoring
PROJECT WORK PLAN AND BUDGET: Activity Budget Total Operation &
Recurrent Costs Y1’(000) Y2’(000) Y3’(000) Y4’(000) Y5’(000)
Extension of Kashenyi GFS Phase I& II
49,000 31,000 80,000
Rwamaregye GFS Buhunga
20,000 90,000 110,000
Rwamaregye GFS Ruhinda
180,000 180,000
Kiniogo GFS Nyakishenyi
190,000 190,000
Katabushera GFS 150,000 250,000 400,000
Kareerema GFS 340,000 340,000
Nyabushenyi GFS 450,000 450,000
Kabutega GFS 370,000 370,000
Nyakabingo 170,000 170,000
Mugyera GFS 270,000 270,000
Nyarushanje GFS 370,000 270,000 640,000
Total 49,000 51,000 640,000 1,590,000 780,000 3,090,000

223
Monitoring and Evaluation Strategy
The extension and rehabilitation of piped water systems shall be monitored& evaluated during and after construction of the works. There shall be monitoring & supervision & monitoring by the ministry staff, district water office technical staff,district engineer, technical support unit, district council members, technical planning committee, members of district PAF monitoring committee, district internal audit office, Auditor General‟s office staff, office of resident district commissioner and state house team and development partners(NGOs) in water and sanitation sector
OPERATION AND MAINTENANCE PLAN
Project Output What is to be done Responsible officer
Cost Remarks
Functional tap stands
-formation of water and sanitation committees
-training in financial ,management
-advocacy meetings
-exchange visits
-training of water user committees
District Water Officer
District Natural Resources Officer
40,000,000 The user community to be empowered & trained to operate and maintain the project.
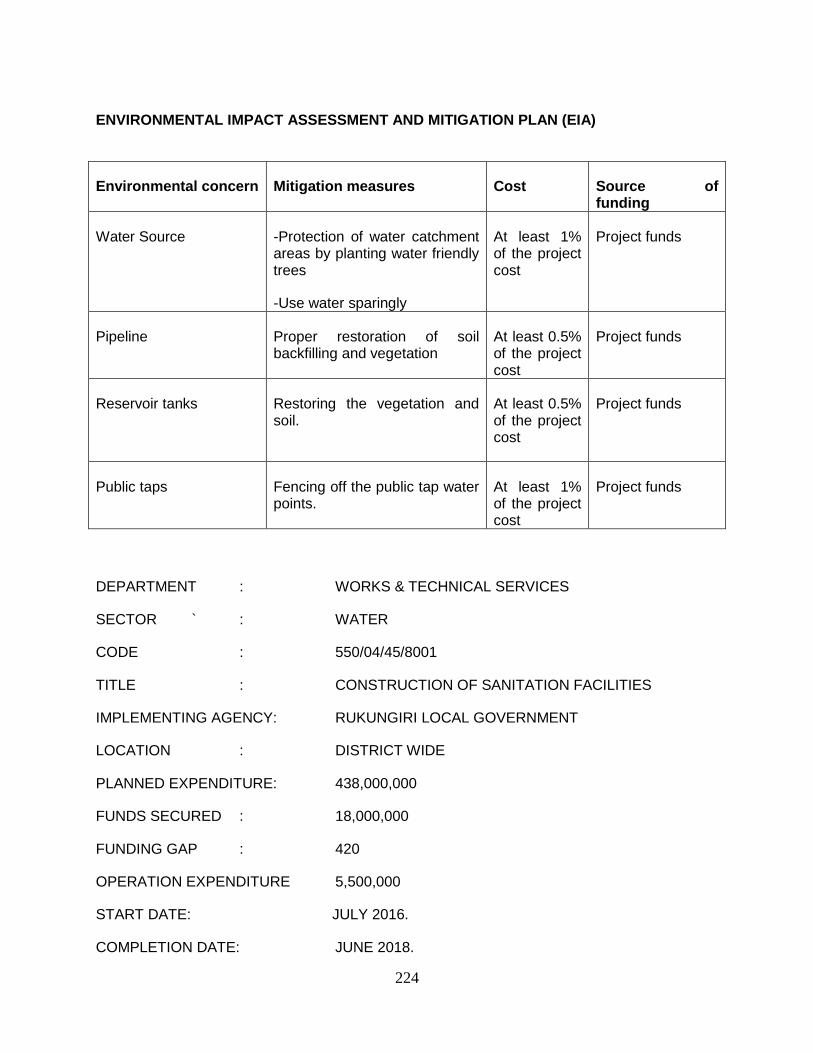
224
ENVIRONMENTAL IMPACT ASSESSMENT AND MITIGATION PLAN (EIA)
Environmental concern Mitigation measures Cost Source of funding
Water Source -Protection of water catchment areas by planting water friendly trees
-Use water sparingly
At least 1% of the project cost
Project funds
Pipeline Proper restoration of soil backfilling and vegetation
At least 0.5% of the project cost
Project funds
Reservoir tanks Restoring the vegetation and soil.
At least 0.5% of the project cost
Project funds
Public taps Fencing off the public tap water points.
At least 1% of the project cost
Project funds
DEPARTMENT : WORKS & TECHNICAL SERVICES
SECTOR ` : WATER
CODE : 550/04/45/8001
TITLE : CONSTRUCTION OF SANITATION FACILITIES
IMPLEMENTING AGENCY: RUKUNGIRI LOCAL GOVERNMENT
LOCATION : DISTRICT WIDE
PLANNED EXPENDITURE: 438,000,000
FUNDS SECURED : 18,000,000
FUNDING GAP : 420
OPERATION EXPENDITURE 5,500,000
START DATE: JULY 2016.
COMPLETION DATE: JUNE 2018.

225
OBJECTIVES: To provide sanitation facilities to the Community.
TARGETED BENEFICIARIES Community in the project area
BACKGROUND:
The community in rukungiri district is using both government land, community land which was leased to the community for construction of commercial houses and other economic activities. In case of commercial houses such plots have no space for construction of individual latrines for each household and in market areas. In order to prevent the possible disease break out the community needs a public latrines.
TECHNICAL DESCRIPTION
Mobilization of the community.
Construction of the latrine
Preparation of bid documents
Project Implementation Work Plan and Budget
Activity Budget Total
(‘000,000)
Operation and Recurrent Cost (000’) YR 1
(‘000,000) YR2
(‘000,000)
YR 3 (‘000,000)
YR 4 (‘000,000)
YR 5 (‘000,000)
Construction of public latrines
20,000,000 18,000,000 140,000 140,000 140,000 438,000 20,000
Total 20,000,000 18,000,000 140,000 140,000 140,000 438,000 20,000
Monitoring and Evaluation Strategy
The construction of public latrines shall be monitored& evaluated during and after construction. There shall be monitoring & supervision & monitoring by the ministry staff, district water office technical staff,district engineer, technical support unit, district council members, technical planning committee, members of district PAF monitoring committee, district internal audit office, Auditor General‟s office staff, office of resident district commissioner and state house team and development partners(NGOs) in water and sanitation sector
PLAN OF OPERATION
The project shall be tendered out. The successful contractors shall be sent to in Bugangari sub county to start work.

226
OPERATION AND MAINTENANCE PLAN
Project Output
What is to be done Responsible officer
Cost Remarks
Latrine -formation of sanitation committees
-training in financial ,management
-training of water user committees
District Water Officer
District Natural Resources Officer
20,000,000 The user community to be empowered & trained to operate and maintain the project.
ENVIRONMENTAL IMPACT ASSESSMENT AND MITIGATION PLAN (EIA)
Environmental concern Mitigation measures Cost Source of funding
Land -control soil erosion
-planting of trees on every water and sanitation project
At least 1% of the project cost
Project funds
Bad smell -Formation of sanitation committee
-sensitization of users
At least 0.5% of the project cost
Project funds
DEPARTMENT : WORKS & TECHNICAL SERVICES
SECTOR : WATER
CODE : 550/04/45/8002
TITLE : PROGRAMS FOR SUSTAINABILITY OF WATER PROJECTS
IMPLEMENTING AGENCY: RUKUNGIRI LOCAL GOVERNMENT
LOCATION : DISTRICT WIDE
TOTAL PLANNED EXPENDITURE: 910,000,000
FUNDS SECURED : 296,000,000
FUNDING GAP : 762,000,000

227
OPERATION EXPENDITURE
START DATE : JULY 2016.
COMPLETION DATE: JUNE 2020.
Objectives
To make sure that all the investments in water and sanitation are operated and maintained sustainably
Targeted Beneficiaries
Local Government staff
Community
District Water Office
Project Background and Justification
This project is comprised of such activities that are aimed at improving on the sustainability of projects. These are the activities aimed at ownership of projects. They include the following:- coordination meetings, monthly meetings, quarterly review meetings, operational costs National consultations, planning and advocacy, sanitation week radio programs, water quality testing, regular collection and update of MIS data and monitoring of the construction of water and sanitation facilities.
Technical Description
Meetings.
Radio talk shows
Data collection and analysis
Advocacy
Trainings and workshops

228
Project Implementation Work Plan and Budget
Activity Budget Total
(,000)
Operation and Recurrent Cost (000’) YR 1 (,000) YR2
(,000)
YR 3 (,000) YR 4 (,000) YR 5 (,000)
Programs for sustainability of water projects(advocacy, formation & training of WUCs, CLTS, media publicity, w/shops …..etc)
148,000 148,000 204,000 204,000 204,000 910,000 24,000
Total 148,000 148,000 204,000 204,000 204,000 910,000 24,000
Monitoring and Evaluation Strategy
The activities for sustainability of water ptojects shall be monitored& evaluated during implementation. There shall be monitoring & evaluation shall be led by the CAOs office, technical support unit, district council members, members of district PAF monitoring committee, district internal audit office, Auditor General‟s office staff, office of resident district commissioner.
Operation and Maintenance Plan
Project Output What is to be done Responsible officer
Cost Remarks
Water and sanitation facilities in good working conditions.
-formation of water and sanitation committees
-training in financial ,management
-advocacy meetings
District technical staff
790,000,000 The user community to be empowered & trained to operate and maintain the project.
ENVIRONMENTAL IMPACT ASSESSMENT AND MITIGATION PLAN (EIA)
Environmental concern Mitigation measures
Cost Source of funding
Misuse of water (broken taps…)
Formation of committees
At least 1% of the project cost
Project funds
229
PRODUCTION AND MARKETING
DEPARTMENT PRODUCTION AND MARKETING SUB-SECTOR: AGRICULTURE CROP CODE : 550/03/31/ TITLE: PROMOTION OF CROP ENTERPRISE IMPLEMENTING AGENCY: RUKUNGIRI LOCAL GOVERNMENT LOCATION: DISTRICT WIDE PLANNED EXPENDITURE 238,973, 000= FUNDS SECURED: 000= FUNDING GAP: 238,973,000= TIME FRAME JULY 2015/16 - JUNE 2019/20 Objectives: To increase farmers income through improvement of nontraditional and traditional crops‟ production and productivity Benefits: Increased household income and government revenue Targeted Beneficiaries: Crop nursery operators, farmers, buyers/trader, processors and exporters Operational costs: Allowances for staff, fuel, demonstration kits, vehicle maintenance, office equipment and stationery Project Back ground and Justification Coffee and tea fruits, legumes and cereal remain major source of income and food in the district for rural farmers. Activities focusing at promoting implementation of modern agronomic practices, commercializing, processing and marketing will enhance houseld incomes and generate revenue to the government Production however, went down due to coffee wilt disease that attacked Robusta coffee at the same time the surviving coffee shambs are very old (over forty years) hence resulting into low productivity. Tea being a new enterprise is passing through by categories of adoption from best, early majority, late majority to laggards. When tea demonstration gardens are established may affect farmers‟ attitudes to speed up adoption. Revitalizing coffee industry require a comprehensive coffee replanting programme and promotion of high levels of crop husbandry and post harvest practices, introduction of resistance Robusta coffee will be apriority. Nutrition is key in growth and development children mind and immunity of human beings. Therefore promoting increased fruits production and productivity will reduce of ill health and boost housel‟s‟ incomes. Technical Description
- Mobilization and sensitization of civic leaders and farmers. - Training farmers on coffee and tea nursery management and field establishment - Procurement and distribution of seedlings to farmers and famer groups. - Train farmers on agronomic practices / disease, pest control - Establishing demonstration gardens - Monitor and supervision
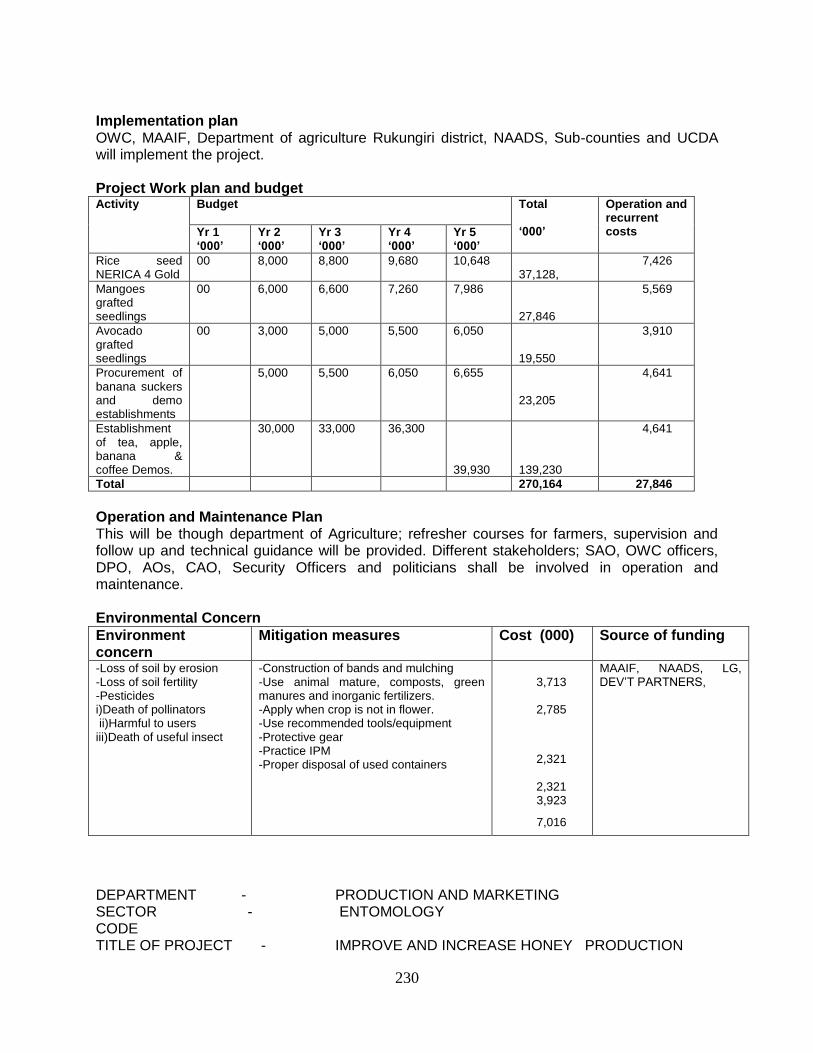
230
Implementation plan OWC, MAAIF, Department of agriculture Rukungiri district, NAADS, Sub-counties and UCDA will implement the project. Project Work plan and budget Activity Budget
Total ‘000’
Operation and recurrent costs Yr 1
‘000’ Yr 2 ‘000’
Yr 3 ‘000’
Yr 4 ‘000’
Yr 5 ‘000’
Rice seed NERICA 4 Gold
00 8,000 8,800 9,680 10,648 37,128,
7,426
Mangoes grafted seedlings
00 6,000 6,600 7,260 7,986
27,846
5,569
Avocado grafted seedlings
00 3,000 5,000 5,500 6,050
19,550
3,910
Procurement of banana suckers and demo establishments
5,000 5,500 6,050 6,655
23,205
4,641
Establishment of tea, apple, banana & coffee Demos.
30,000 33,000 36,300
39,930 139,230
4,641
Total 270,164 27,846
Operation and Maintenance Plan This will be though department of Agriculture; refresher courses for farmers, supervision and follow up and technical guidance will be provided. Different stakeholders; SAO, OWC officers, DPO, AOs, CAO, Security Officers and politicians shall be involved in operation and maintenance. Environmental Concern
Environment concern
Mitigation measures Cost (000) Source of funding
-Loss of soil by erosion -Loss of soil fertility -Pesticides i)Death of pollinators ii)Harmful to users iii)Death of useful insect
-Construction of bands and mulching -Use animal mature, composts, green manures and inorganic fertilizers. -Apply when crop is not in flower. -Use recommended tools/equipment -Protective gear -Practice IPM -Proper disposal of used containers
3,713
2,785
2,321
2,321
3,923
7,016
MAAIF, NAADS, LG, DEV‟T PARTNERS,
DEPARTMENT - PRODUCTION AND MARKETING SECTOR - ENTOMOLOGY CODE TITLE OF PROJECT - IMPROVE AND INCREASE HONEY PRODUCTION

231
AND CONTROL TSETSE FLIES LOCATION - DISTRICT HEADQUARTERS SUB COUNTIES AND
AREAS ADJACENT QUEEN ELIZABETH NATIONAL PARK.
IMPLEMENTING AGENCY: RUKUNGIRI DISTRICT LOCAL GOVERNMENT TIME FRAME - JULY 2015 - JUNE 2020 PLANNED EXPENDITURE 181,079,175 FUNDS SECURED - 8,000,000 FUNDING GAP - 173,079175 RECURRENT EXPENDITURE - 29,175,000 START DATE 2016 COMPLETION DATE 2020 Project objectives Increase and improve the quantity and quality of honey and other bee products produced Reduce the spread of trypanasomiasis through control of tsetse flies. Targeted beneficiaries Beekeepers and communities adjacent to Queen Elizabeth National Park, trader‟s processors, and exporters Project background and justification: Bee farmers in the district generally produce little honey because they use to a large extent local hives, which are not properly maintained. The honey they produce is poorly handled leading to low quality honey. This leads to low demand for honey and low prices for the low quality honey and bees wax. There is little knowledge on modern bee keeping methods hence production of low quality honey, bees wax and propolis. Very few farmers are processing their honey due to expensive honey processing equipment. The acquisition of honey processing tank shall be used to enhance the quality of the honey processed. Tsetse flies transmit trypanosomes, which cause trypanasomiasis both to man and livestock. There is therefore a need to control these tsetse flies. Technical description The project will involve training of beekeepers in quality assurance of bee products, disease & pest control, and collection of data on honey production and other hive products, setting up an apiary demonstration site, procurement of modern processing equipment, harvesting gears and hives. Training of beekeepers on honey processing

232
Project Work plan and budget
Training of community members and livestock farmers in areas adjacent to queen Elizabeth national park in tsetse fly control and procurement of tsetse fly traps for deployment in the affected areas Implementation plan The department of entomology in collaboration with other departments, Sub-counties and sub-county extension staff and will execute the implementation of the projects Environmental Concern Environmental component affected
Nature of the environmental concern
Mitigation measures
Land Vegetation Ecological niche
Soil erosion Accumulation of weed in apiary site Ecological imbalance due to removal of tsetse flies
Opening water bands and planting stabilizing grass for safe water discharge from apiary site. Slash weed away from apiary site from time to time. Controlled trapping, living some that do not cause economic damage.
DEPARTMENT PRODUCTION AND MARKETING SECTOR FISHERIES CODE IMPLEMENTING AGENCY RUKUNGIRI DISTRICT LOCATION DISTRICT HEADQUARTERS AND SUB-
COUNTIES PROJECT TITLE INCREASE FISH PRODUCTION AND PRODUCTIVITY PLANNED EXPENDITURE 60,946,000 SECURED FUNDS Nil RECURRENT EXPENDITURE 6,400,000 START DATE: JULY 2015 COMPLETION DATE: JUNE 2020
Activity Budget (000) Total Operation and recurrent costs
Year 1
Year 2 Year 3 Year 4 Year 5 (000)
Procurement of beehives
00 4,500 4,950 5,445 5,989 20,884 9,398
Procurement of assorted harvesting gears
00 8,000 8,800 9,680 10,648 37,128 16,708
Procurement of assorted processing equipment
00 00 8,800 9,680 10,648 29,128 13,108
Procurement of tsetsefly traps
00 00 5,000 5,500 6,050 16,550 7,448
Establishment of apiary demonstration site
16,675 18,342 20,176 22,194 77,388 34,825

233
Objective To increase fish production through sustainable management of fisheries resources and fish farming Background The fish stocks in Uganda have reduced drastically due to over fishing caused by the ever increasing population and over fishing. The only hope of reviving the fish stocks is to reduce the fishing effort and encouraging fish farming to bridge the deficit gap Technical Description The project will involve reduction in post harvest losses and control of fishing effort on natural water bodies and encouraging fish farming through provision of quality fish seed and feeds and giving technical advice to fish farmers. Benefits: The population will benefit by getting fish which is rich in proteins, money got from the sale of fish. The country will earn foreign exchange and citizens will get jobs. Beneficiaries: Rukungiri District Local Government, Sub-counties, trader‟s processors and the fishing communities. Plan of Operation: The fisheries office will do routine training of fish farmers, sensitization of fishing communities and law enforcement on the lake and markets

234
Project Work plan and Budget Activity Budget (000) Total Operation and
recurrent costs
Y1 Y2 Y3 Y4 Y5
Fish pond demonstration established
0 6,000 6,600 7,260 7,986
27,846 12,531
Procurement of water testing kit and maintenance
0 0 60,000 6,000 7, 000
73,000 32,850
Procurement of fishing gears 0 5,000 5,500 6,050
16,550 7,448
Construction fish handling facility and maintenance
10,000 200,000 220,000
430,000 193,500
Total
547,396 246,328
Monitoring and Evaluation Plan: Project Activity
Indicator Means of verification Source of verification
Time Frame
Responsible officer
Establishment of fish demonstration ponds
No. of demonstration ponds established
Demonstration pond established
Sites visited Yearly Fisheries officer
Procurement of water testing kit
No. of kits procured
Water testing kit procured Water testing kit procured
Year 2 Fisheries officer
Procurement of fishing gears
Number of gears procured
Fishing gears procured Fishing gears procured
Year 2,3,4 Fisheries officer
Construction of fish handling facility
Fish handling facility constructed
Fish handling facility constructed
Fish handling facility constructed
Year 2 Fisheries officer
Environmental Concerns: Environmental component affected
Nature of the environmental concern
Mitigation measures
Land Vegetation Aquaculture
-Soil erosion -Accumulation of debris -Removal of vegetation around lake/river banks
Provide gutters and place for safe water discharge into the storm water channel. -Remove debris from site from time to time. -Plant shade trees and creeping grass. “
Supervision and Certification arrangement: Supervision and certification of executed works shall be conducted by the District Engineering staff.

235
SECTOR - PRODUCTION AND MARKETING SUB-SECTOR - VETERINARY CODE 550/03/31 TITLE LIVESTOCK IMPROVEMENT IMPLEMENTING AGENCY - RUKUNGIRI LOCAL GOVERNMENT LOCATION DISTRICT WIDE PLANNED EXPENDITURE - 3,236,306,730/- FUNDS SECURED 3,236,306,730/- FUNDING GAP - Nil TIME FAME JULY 2015-JUNE 2020 Objective: - - To improve livestock production and productivity in the district Benefits: - - Increased House Hold Income and reduced poverty levels in communities. Targeted Baneberries:- -Livestock farmers, processors and traders of livestock and livestock products Operation costs:- - Allowances for staffs and Bwanga Stock Farm Committee Members, Fuel, Vaccines, vehicle maintenance, Office Equipments and Stationery. Background and Justification:- - Most livestock farmers in the district practice traditional farming that is largely subsistence with less emphasis on commercial livestock husbandry hence low production and incomes. Practices such as tethering and communal grazing and use of local breeds of livestock on poor pasture are common hence a need to sensitize farmers to change from traditional to modern livestock husbandry. - Livestock breeds kept are of low grades hence need for upgrading them to increase on production. - Local poultry farmers hardly get any capacity building from government and they are majority in the district hence need to build their capacity. - There is problems of zoonotic diseases in the district, which are controlled by certification of livestock products before consumed. Technical Description.
- Conducting seminars, meetings and workshops - Disseminate information through mass media - Carrying out vaccinations - Field visits/ demonstrations. - Treatment of livestock - Procurement of improved livestock breeds. - Record keeping at farm level - Control of livestock movements - Procurement of livestock vaccines - Quality assurance of livestock and livestock products. - Monitoring and support supervision.

236
Implementation plan:- - Veterinary staff in-charge sub-counties will be responsible for implementation and the district veterinary officer will be responsible for monitoring and supervision. Project Work Plan and Budget: Activities Expenditure by financial year Total (000’) Operation
and recurrent Expenditure
YR 1 (000)
YR2 (000)
YR 3 (000)
YR 4 (000)
YR 5 (000)
Procurement of heifers and distribution to farmers
450,000 495,000 544,500 598,950
658,845 2,747,295
1,236,283
Procurement and distribution of birds
00 40,000 44,000 48,400 53,240 185,640
83,538
Procurement and distribution of pigs and goats.
00 18,000 20,176
22,194 25,127 85,497
38,474
Construction of slaughter slabs
16,675 18,342 20,176 22,194 24,413 101,800
45,810
Procurement of animal vaccines
3,500 3,850 4,235 4,658 5,123.8 21,336.8
9,602
Procuring yearling bulls
7,500 8,250 9,075 9,982.5 10,980.75 45,788.25
20,605
Maintenance and improvement of Bwanga stock farm
15,172.5 7,278 8,005.8 8,806.38
9,687 48,949.68
22,027
Total 492,847.5 594,720 650,167.8 715,184.88 787,305.55 3,236,306.73
1,456,338
Operational and Maintenance Plan
Project out put What is to be done Responsible Persons Cost (0,,00) Remarks
Livestock production
and productivity
improved
Procurement of farm
inputs and vaccine
Training of farmers.
District Veterinary
Officer, OWC officers
and
Sub-county staff
323,6130.67 Poverty Levels
Reduced in
communities.
Environmental Concern
Environmental component
affected
Nature of environment concern Mitigation measures
-Land/ Farmland
- Accaracides use
-Loss of soil by erosion if there is
overgrazing.
- Environmental Pollution
-Farmers to stock according to carrying capacity
of their lands.
- Proper of accaracides

237
APPENDIX 5: DISTRICT ANNUALISED WORK PLANS
MANEGEMENT
Dev’t Outputs Planned Activities (Projects)
Time frame Responsible parties
Planned Budget (000)
YR1 YR2 YR3 YR4 Y5 Source Amount
Sector: Management Support Services
Sub Sector: Human Resource Management
Staff trained Training Needs Assessment, identification of trainers, procurement of stationery, facilitation of trainers
60,646 63,678 66,862 70,205 73,715 CAO, HR CBG 335,107
Staff recruited Manpower analysis, submission of recruitment plan, advertising, short listing, interviewing, selection and posting
61,640 61,640 61,640 61,640 61,640 CAO, HR 308,200
Sub Sector: Council and Statutory Bodies
Goods & services procured
Advertising, receiving bids, opening & evaluation of bids, awarding tenders
8,400 8,820 9,261 9,724 10,210 PDU, Contracts Committee
46,415
Land issues managed
Mobilization, sensetization, Registration, settling land disputes
11,987 12,586 13,215 13,215 14,570 Secretary DLB,
52,359
Legislation function of Council facilitated
12,000 12,600 13,230 13,891 14,586 12,000 SAS Statutory Bodies, District Speaker
66,307
Good governance promoted
Formulation of byelaws, overseeing law enforcement, approving plans & budgets, monitoring & evaluation
62,000 65,100 68,355 71,772 75,361 CAO 342,589
Accountability of Resources promoted
PAC Meetings, Monitoring & Evaluation
23,059 24,211 25,422 26,693 28,028 SAS Statutory Bodies
127,415
Information Management
Posting mandatory
120,380 126,399 132,718 139,354 146,322
Information Officer, CAO
665,175

238
Systems established
notices, Radio talk shows, holding public Barazas, article publication
District website updated
Benchmarking, procurement of equipment & Data management, servicing.
15,000 15,750 16,537 17,369 18,237 82,894 82,894

239
NATURAL RESOURCES
Development Outs
Planned activities (Project)
TIME FRAME Responsible parties
Planned budget
Yr 1 (‘000)
Yr 2 (‘000)
Yr 3 (‘000)
Yr 4 (‘000)
Yr 5 (‘000)
Sources of funds
Amount
Sector: Natural Resources
Sub-Sector: Administration
Departmental meetings, mentoring sessions and reports prepared
Conduct departmental meetings, mentoring sessions and prepare reports
150 250 300 450 550 DNRO CAO
RGLG 1,700,000
Work plans and budgets prepared
Prepare work plans and budgets
100 135 136 140 142 CAO, District Engineer
RDLG 653,000
Staff performance appraised
Appraise the performance of staff
0 0 125 125 130 CAO, District Engineer
RDLG
380,000
Staff salaries and wages paid
Payment of staff salaries and wages
125,503 142,047 153,030 160,450 168,890 CAO DNRO PHRO CFO
MoFPED 749,920,000
Sub-Sector: Environment
Monitoring and evaluation of environment compliance conducted
Monitoring and evaluation of environment compliance
0 500 550 585 600 DEO DNRO
MoWE RDLG
2,235,000
EIAs of projects reviewed
Participate in review of EIAs
0 650 680 700 750 DEO DNRO
MoWE RDLG
2,780,000
Environmental screening of projects conducted
Environmental screening of projects
1,500 2,000 2,250 2,500 2,750 DEO DNRO
MoWE RDLG
11,000,000
Sub-Sector: Wetlands
Communities trained in wetland management
Community training in wetland management
1,800 1,450 1,550 1,680 1,700 DEO DNRO
MoWE RDLG
8,180,000
River banks and wetlands restored
River bank and wetland restoration
1,196 3,859 3,980 4,050 4,150 DEO DNRO
MoWE RDLG
17,235,000
Sub-Sector: Land Management
Governed land surveyed in all sub counties
Surveying of governed land
0 19,000 22,005 19,870 14,500 SLMO DSS
RDLG MoLHUD
75,375,000
Urban centers planned in all sub counties
Physical Planning of urban centers
0 16,000 18,670 22,000 11,000 DPP SLMO
RDLG MoLHUD
67,670,000
Land Processing of 5,000 6,500 7,120 7,805 8,140 DROT RDLG 34,565,000

240
application files for titling processed
land application files for titling
SLMO SDLB
MoLHUD
Sub-Sector: Forestry
Trees planted under afforestation in all sub counties
Tree Planting and afforestation
9,059 6,600 9,059 10,125 11,105 DFO DNRO
RDLG NFA MoWE
45,948,000
Communities trained in forestry management
Training in forestry management
2,753 1,000 2,753 2,950 3,105 DFO DNRO
RDLG NFA
12,561,000
Regulation and inspection of forestry activities conducted
Forestry regulation and inspection
4,000 2,000 4,000 4,250 4,500 DFO DNRO
RDLG NFA
18,750,000
Lands
400 disputes. 100 surveyed. 150 plans.
100 titles. 300 disputes. 78 surveyed land. 50 plans.
150 titles to be processed. All government land to be surveyed. 100 physical plans to be made.
130 titles made. 100 lands surveyed. 70 plans made.
Lands had no staff at first. Staffs were recruited. People were sensitized. Under funding.

241
COMMUNITY Devt Outputs Activity/Project
Name Annual budget (‘000) Source of
funding Total
Year 1 Year 2 Year 3 Year 4 Year 5
SECTOR: COMMUNITY BASED SERVICES
Subsector: Probation and Social Welfare
Communities sensitized to provide protection to children.
sensitising communities on Children‟s rights and responsibilities
60,000 75,000 70,000 90,000 110,000 Development partners District Local Govt
405,000
OVC service providers supervised
support supervision of OVC service providers
60,000 60,000 70,000 80,000 100,000 Development partners District Local Govt
370,000
Social Welfare cases handled
Handling Children‟s welfare cases
30,000 60,000 70,000 80,000 100,000 Development partners District Local Govt
340,000
resettlement of lost and abandoned children done
Tracing and resettlement of lost and abandoned children done
10,000 10,000 10,000 10,000 10,000 Development partners District Local Govt
50,000
OVC coordination meetings held
Holding OVC coordination meetings
20,000 20,000 20,000 20,000 20,000 Development partners District Local Govt
100,000
a children‟s remand home operational
Completion and establishment of a children‟s remand home
50,000 50,000 50,000 50,000 50,000 Development partners District Local Govt
250,000
Subsector: Community Development
Cultural groups supported
-Providing Financial support to cultural groups
5,000
5,000
5,000 5,000
5,000
District Local Govt GOU
25,000
Annual Cultural festivals held
-Conducting Annual Cultural Festivals
15,000 15,000 15,000 15,000 15,000 District Local Govt GOU
75,000
Blackboards and chalk procured
Purchase of blackboards and Chalk
6,000 6,000 6,000 6,000 6,000 District Local Govt GOU
30,000
Programme review meetings held
Holding Functional Adult Literacy review meetings at subcounty and District
6,000 6,000 6,000 6,000 6,000 District Local Govt GOU
30,000
Support supervision of
Carrying out support
8,000 8,000 8,000 8,000 8,000 District Local Govt
40,000

242
FAL programme done
supervision visits to FAL Classes
GOU
Financial incentive to FAL Instructors given
Financial incentive to FAL Instructors
20,000 20,000 20,000 20,000 20,000 District Local Govt GOU
100,000
Public library equipped
Equipping a public library
20,000 20,000 20,000 20,000 District Local Govt GOU
80,000
Public staff recruited and facilitated
Managing a public library
20,000 20,000 20,000 20,000 District Local Govt GOU
80,000
Data on gender issues collected
Collecting data on gender issues
5,000 5,000 5,000 5,000 5,000 District Local Govt GOU
25,000
Public officials mentored on Gender issues
Mentoring staff on Gender issues
5,000 5,000 5,000 5,000 5,000 District Local Govt GOU
25,000
Communities sensitized on income generating activities, government programmes, leadership, and human rights
Community mobilization and sensitization
5,000 5,000 5,000 5,000 5,000 District Local Govt GOU
25,000
community-based organizations trained
Training of community-based organizations
10,000 10,000 10,000 10,000 10,000 District Local Govt GOU
50,000
Facilitation of Participatory planning in parishes done
Facilitation of Participatory planning in parishes
10,000 10,000 10,000 10,000 10,000 District Local Govt GOU
50,000
Family counseling done
Family counseling.
5,000 5,000 5,000 5,000 5,000 District Local Govt GOU
25,000
women, youth and PWDs trained in income generating activities and leadership skills
Training women, youth and PWDs in income generating activities and leadership skills
10,000 10,000 10,000 10,000 10,000 District Local Govt GOU
50,000
Subsector: Social Rehabilitation
PWDs benefitting from Livelihood grants
Providing Start –up capital to Persons With Disabilities
30,000 30,000 30,000 30,000 30,000 District Local Govt GOU
200,000
The Elderly supported with grants
Providing grants to the elderly people
160,000 160,000 160,000 160,000 GOU 640,000
PWDs provided with Assistive devices
Providing Assistive devices to PWDs
4,000 4,000 4,000 4,000 4,000 District Local Govt GOU
16,000
Holding PWDs Council meetings
Holding PWDs Council meetings
6,000 6,000 6,000 6,000 6,000 District Local Govt GOU
30,000
Assessment, Routine 6,000 6,000 6,000 6,000 6,000 30,000

243
management and referral of disability cases. done
assessment, management and referral of disability cases.
people with disabilities and Parents/ helpers trained on disability management
Training of people with disabilities and Parents/ helpers on disability management
6,000 6,000 6,000 6,000 6,000 30,000
Support supervision of staff
6,000 6,000 6,000 6,000 6,000 30,000
Subsector: Labour and Industrial relations
Workplaces inspected
Inspection of workplaces
5,000 5,000 5,000 5,000 5,000 District Local Govt GOU
25,000
Sensitisation of employees and employers done
Sensitising employees and employers
3,000 3,000 3,000 3,000 3,000 District Local Govt GOU
25,000
labour complaints handled and labour laws enforced
Handling labour complaints and enforcing labour laws
2,000 2,000 2,000 2,000 2,000
Subsector: Youth Affairs
Youth benefitting from Livelihood revolving loans
Providing a revolving loan to Youth groups
210,000 500,000 500,000 500,000 500,000 District Local Govt GOU
2,210,000
Youth Council meetings held
Holding Youth Council meetings
10,000 10,000 10,000 10,000 10,000 District Local Govt GOU
50,000
Mobilisation of youth and monitoring youth projects done
Mobilisation of youth and monitoring youth projects
10,000 10,000 10,000 10,000 10,000 50,000
Subsector: Women programmes
Women benefitting from Livelihood revolving loans
Providing a revolving loan to Women groups
200,000 200,000 200,000 200,000 District Local Govt GOU
810,000
Women council meetings held
Holding women council meetings
6,000 6,000 6,000 6,000 6,000 District Local Govt GOU
30,000
Study visits by Women Councils hdone
Carrying out women council study visits
4,000 4,000 4,000 4,000 4,000 District Local Govt GOU
16,000

244
PLANNING UNIT
Development Output
Planned Activities
Time frame Responsible parties)
Source of Funds
Amount (‘000)
Yr 1 2015/16
Yr 2 2016/17
Yr 3 2017/18
Yr.4 2018/ 19
Yr.5 2019/20
DEVELOPMENT PLANNING SECTOR
1..Development Planning and Budgeting both at the District and Sub-County Levels processes coordinated
-Conducting Planning meetings. Conducting consultative meetings. -Organising and holding the District Budget conference. - Coordinating the preparation of Annual Work plans. - Coordinating the preparation of BFP and submission
18,200
18,850 20,050 20,553 22,270 CAO PLANNER
99,923
Procurement of office retooling equipment
Supply of office of retooling items
12,500
13,120 13,780 14,470 15,190 69,060
2. Internal assessment at district department levels and at lower local government conducted to ensure quality works and value for money and compliance to guidelines
- Examining District departmental records and sub county records - Field visits - Data entry - Report writing and editing - Carrying out LGMSD assessment in LLGs and HLG sectors, Preparation of quarterly performance review reports Dissemination of the findings to stakeholders
10,606
10,800 10,900 11,000 11,500 CAO PLANNER
54,806
LLGs visited to monitor government programmes, projects and activities
Conducting multi sect oral monitoring for LDG and PAF projects in LLGs
8,405
19,101 20,937 21,487,
22,980, 102,268
LLGs and Hold lower local 12, 12,840 13,482 14,156 14,864 CAO 67,571

245
sectors mentored in Development planning
government consultative meetings and appraisal of projects for the DDP and LLG development plans
228 PLANNER
STASTISTICS SECTOR
1. Establishment a community based management Information system, a data bank and establishment of LOGICS.
Establishing and coordination of MIS - LOGICs data Collection from all departments.
7,000
9,000 10,000 11,000 12,000 CAO PLANNER Statistician
49,000
2.Data management systems, data usage for improved planning and decision making at all levels improved and strengthened
Preparation and production of the District Statistical Abstract. Training in Data management. -Establishing of Data Banks
4,000
4,500 4,800 5,000 5,200 CAO PLANNER Statistician
23,500
3.To have an updated data bank for information and proper decision making
- Conducting review meetings.
- Holding of regular population coordination meetings.
- Holding of regular population coordination meetings.
- Prepare and produce a District specific Population Action Plan.
- Registration, - collection,
analysis and dissemination of vital statistics (Birth and Death)
Prepare and produce a District specific Population Action
4,000
4,200 4,400 4,600 4,000 CAO PLANNER Statistician
21,200

246
4.Data for planning activities collected, analyzed, stored and disseminated
Guidance of DTPC members and LLG staff in data collection, update, interpretation and storage as well as utilization. Maintenance of IT equipment including computers, photocopier, printers/scanner
2,500
2,700 3,000 3,000 3,000
CAO PLANNER Statistician
14,200
POPULATION SECTOR
1.LLGs and sectors assisted in integrating population issues in development planning process
- Dissemination of population data to all stakeholders.
- Holding of regular
- Population coordination meetings.
- Prepare and produce a District specific Population Action Plan
4,000
4,100 4,205 4,313 4,429 CAO PLANNER DPO
19,047
1. community sensitization on population related issues
- Promote research on the causes of high population growth rate.
- Conducting review meetings.
- Holding of regular population coordination meetings at LLGs
- Registration, - collection,
analysis and dissemination of vital statistics (Birth and Death)
- Prepare and produce a District specific Population
- Community mobilization and education
3,000
3,250 3,500 4,000 5,500 CAO PLANNER DPO
19,250

247
about population issues
- Radio talk shows
FINANCE DEPARTMENT
Development Output
Planned Activities
Time frame
Responsible Parties
Source of Funds
Amount (000’s)
Yr 1 2015/16
Yr 2 2016/2017
Yr3 2017/2018
Yr 4 2018/2019
Yr 5 2019/2020
FINANCE DEPARTMENT
Revenue Management and Collection Services
Monthly Revenue meetings conducted. Sensitization and mobilization seminars conducted in major trading centres and portion tax payers indentified. Radio talk shows and presentations on Radio Rukungiri Revenue collections in 9 sub counties and at district headquarters conducted Supervising and monitoring visits conducted district wide. Business registration and assessment
20,200
16,500
18,150
19,965
21,962
CFO SFO Finance Committee
RDLG
96,777
Financial management services
date today office running
71,165 48,448
53,293
58,622
64,484
296,012
Departmental Vehicle procured
Procurement of a vehicle
150,000 150,000
Budgeting and Planning Services coordinated
Annual budget and work plans prepared and presented to council. Revenue enhancement plan and charging policy
15,250
12,250
13,475
14,823
16,305
CFO SFO Budget Desk
Central Gov‟t (GOU)
72,103

248
prepared and submitted to council
Local Government Accounting services coordinated
Financial statements for both District and 9 LLGs prepared and submitted to OAG and Accountant General. Departmental computers, printers and photocopiers serviced. Quarterly Financial accountabilities and activity reports reviewed and verified. Responses to the queries raised by O AG and Internal Auditor prepared and submitted.
15,476
15,476
17,023
18,725
20,597
CFO SFO Sub County Accountants and Sector Accountants
GOU
87,297
Expenditure management services coordinated
VAT,WHT, PAYE returns filed and submitted to the URA. VAT on contracted markets and other local revenues paid.
7,000
10,000
11.000
12,100
13,310
CFO SA
GOU
53,410
Integrated Financial management system (IFMS)operated
IFMS equipments maintained. IFMS operations implemented.
30,000
30,000
33,000
36,300
39,930
CFO Superviser Sector Accountants and HODs
GOU
169,230
EDUCATION
Development output
Planned Activities
Time frame (‘000) Responsible parties
Planned Budget
Yr 1 Yr 2 Yr 3 Yr 4 Yr 5 Source Amount (000)
Sector
1) Consolidating and Improving on gains made in academic performance in the previous years from 98-99%
Regular monitoring supervision and inspection of schools -Evaluating performance of teachers and pupils through out the term and end year examinations.
2,380,982
2,380,982 2,380,982 2,380,982 2,380,982 11,904,910

249
-Provision of instructional materials
2) community involvement in education to ensure support to teachers and pupils ) Enhanced
-Sensitization workshops for SMC,PTA and other stake holders
12,9700 12,970 12,970 12,970
12,970 64,850
5 primary schools constructed.
Awarding of contract Contract Agreement signing Monitoring and evaluation Preparation of completion certificate Payment of contractor
3,500,000
World Bank MoFPED District Engineer CAO DEO
World Bank
3,500,000
3 Management of 162 Government Aided Primary schools and other educational institutions. Improved and strengthened
-Conducting workshops and seminars for head teachers and SMCs, BOGs for stakeholders - Distribution of capitation grants to primary schools and other institutions
655,509 655,509 655,509 655,509 655,509 3,277,545
4) Effective and efficient office operations ensured
- Procurement of double cabin pickup - Maintenance and servicing of Vehicles, motor cycles and computers
113,348 313,348 113,348 113,348 113,348 766,740
5) School learning environment improved
Construction of classrooms -Construction of toilets -Provision of furniture -Construction of teachers houses
159,805 159,805 159,805 159,805 159,805 799,825

250
6) Educational opportunities for children with SNE Increased.
Training of more SNE Teachers Establishment of SNE Units in schools Provision of SNE equipments
429,174 429,174 429,174 429,174 429,174 2,145,870
7 participation in sports, music Dance and drama scouting and girl guiding .Improved.
Train teachers Organize school competitions in co curricular activities at zones /districts & national levels
29,358 29,358 29,358 29,358 29,358 146,790
8) Quality of teaching and learning enhanced.
Expand the teachers resource centre Equip the TRC conducting workshops & seminars
28,678 28,678 28,678 28,678 28,678 143,390

251
HEALTH
S Planned Activities Time Frame Planned Budget
Source of Fund
Amount (000)
Y1
Y2
Y3
Y4
Y5
Amount in million [000]
Health centres renovated
-Signing of contract agreements -Implementation -Supervision and monitoring
300000 350000 400000 400000 450000 GOU 1900000
Office equipment procured and maintained
-Raise procurement requisition form -Maintenance and servicing of computers -effecting payment
5000 5500 6000 6500 7000 GOU 135000
Medical Equipment procurement for use in HFs and maintenance done
-raise equipment gaps orders -maintenance of equipment
20000 25000 25000 30000 35000 GOU 22200
Data management and information dissemination carried out
-Raise procurement requisition for HMIS forms -compiling and analyzing reports -sending reports to appropriate levels
4000 4200 4500 4500 5000 GOU 840000
Medicine & medical supplies procurement made
-raising medicine orders -sending them to NMS -receiving medicines & documenting them
160000 160000 170000 170000 180000 GOU 244000
Health education and promotion carried out
-raising orders for IEC materials -distributing IEC materials -radio talk shows presentation -sensitisation of communities, schools, & other gatherings -Health education talks at HUs
4000 4500 5200 5200 5500 GOU 16300
Environmental health services delivered
-inspection of schools, urban places, institutions, food places, -home visiting for home improvement -health education talks to & sensitization of communities
3000 31000 32000 3500 3500 GOU 420000
Polio vaccination campaigns
-Procuring vaccines and vaccination
- 200000 - - 220000 GOU 500000

252
implemented materials & distributing them -training h/workers -organizing & conducting coordination meetings -sensitizing community leaders
Measles vaccination campaigns implemented
-Procuring vaccines and vaccination materials & distributing them -training h/workers -organizing & conducting coordination meetings -sensitizing community leaders -implementation & monitoring -report making & reporting
- 240000 - 260000 - GOU 20800
Support supervision and other managerial activities done
-developing supervision tools Implementation - report making & reporting -convening and conducting various types of meetings
4000 4000 42000 42000 46000 GOU 1900000
WORKS & TECHNICAL SERVICES
Development Outs
Planned activities (Project)
TIME FRAME Responsible parties
Planned budget
Yr 1 (‘000)
Yr 2 (‘000)
Yr 3 (‘000)
Yr 4 (‘000)
Yr 5 (‘000)
Sources of funds
Amount
Sector: Works
Sub-Sector: Roads
No. of Km maintained manually
Routine Mechanised maintenance of Roads (1,008Km)
368,600
247,800
400,000
500,000
500,000
CAO, District Engineer
URF
2,016,400
No. of Km maintained mechanically.
Routine Manual maintenance of Roads (580km)
102,000
85,000 102,000 102,000 102,000
CAO, District Engineer
URF 493,000
Community Access Roads (CARs) in 9Sub-Counties of Buyanja, Kebisoni, Nyarushanje, Nyakishenyi, Nyakagyeme, Bugangari, Ruhinga,
Addressing road bottle necks on Community Access Roads (CARs) in 9Sub-Counties
75,000 200,000 200,000 405,000 405,000
CAO, District Engineer
URF, UWA
1,385,000

253
Buhunga, Bwambara
Linear meters of culverts procured
Procurement of 440 Culverts
16,944
17,204
24,000
30,000
36,000
CAO, District Engineer
URF
132,000
No. of Bridges, No. of head/wing walls constructed
Maintenance of 13 No. drainage structures
10,961
22,000
45,000
45,000
60,000
CAO, District Engineer
URF
210,000
Number of Embarkment filling done
Embankment fillings 17No.
0 5,000 30,000 30,000 30,000
CAO, District Engineer
URF
105,000
Number of bridges Constructed
Construction of 3 No. Bridges
0 0 1,000,000
1,500,000
1,500,000
CAO, District Engineer
MoWT, URF, MoLG
4,000,000
Sub-Sector: Buildings
Completed works on the administration Block
Construction of District Administration Building
670,000
200,000
300,000 400,000 300,000
CAO, District Engineer
MoFPD, RDLG
1,870,000
No. of Buildings maintained
Maintenance of Buildings
10,000 10,000 15,000 20,000 20,000
CAO, District Engineer
RDLG
75,000
No. of VIP Latrines constructed at District head quarters
Construction 4No. VIP Latrines
20,000 0 20,000 20,000 20,000
CAO, District Engineer
RDLG 80,000
Sub-Sector Office
- Vehicles and road equipment maintained
Procurement of Supervision/ Service vehicle and fleet maintenance
72,993 72,993 232,993 80,000 80,000
CAO, District Engineer
URF
538,979
No. of furniture supplied to Engineering department.
Procurement of Furniture
0 1,000
2,000
2,000
1,000
CAO, District Engineer
RDLG
6,000
No. of Projects monitored, supervised and Reports compiled
Procurement of Photocopier, Printer, UPS
0 1,000 1,000 3,000 1,000
CAO, District Engineer
URF
6,000

254
WATER AND SANITATION
Project Name
Time frame Responsible Parties
Planned Budget
Yr 1 ‘000’
Yr 2 ‘000’
Yr 3 ‘000’
Yr 4 ‘000’
Yr 5 ‘000’
Source Amount
Sector Water
Construction of Bwambara- Bugangari Water Supply and Sanitation Project
28b GoU 28b
Construction of Bugarama GFS Phase I,1I & III–Nyakagyeme S/C
140,000
150,000 350,000 GoU 640,000
Construction of Nyarwimuka GFS
520,000 GoU 520,000
Construction of Omukatooma GFS Phase I& II in Nyakishenyi S/C
300,000 250,000 GoU 550,000
Construction of Ruhonwa GFS Phase I& II Nyakishenyi S/C
300,000 250,000 GoU 550,000
Construction of Karunoni GFS Phase I& II Nyakagyeme S/C
200,000 330,000 GoU 530,000
Extension of Kashenyi GFS Phase I& II Bugangari S/C
49,000
51,000 190,000 GoU 290,000
Extension of Rwamaregye GFS Buhunga S/C
30,000 GoU 30,000
Extension of Rwamaregye Nyarurambi GFS Buhunga S/C
180,000 GoU 180,000
Extension of Kiniogo GFS Nyakishenyi S/C Phase I& II
70,000 80,000 GoU 150,000
Extension of Kahama GFS Nyakagyeme S/C
190,000 GoU 190,000
Extension of Katabushera GFS Bugangari S/C
150,000 250,000 GoU 400,000

255
Extension of Kareerema GFS Bugangari S/C
340,000 GoU 340,000
Extension of Nyabushenyi GFS Nyarushanje S/C
450,000 GoU 450,000
Extension of Kabutega GFS Nyarushanje S/C
370,000 GoU 370,000
Extension of Nyakabingo GFS Nyarushanje S/C
170,000 GoU 170,000
Extension of Mugyera GFS Nyarushanje S/C
270,000 GoU 270,000
Extension of Nyarushanje GFS Nyarushanje S/C
370,000 270,000 GoU 640,000
Spring Protection
4,000 12,000 30,000 30,000 40,000 GoU & LR 116,000
Shallow Well Protection
8,000 40,000 50,000 GoU LGMSD
98,000
Borehole Rehabilitation
42,000
35,000 80,000 120,000 140,000 GoU
Latrine and Toilet Construction in Rural Growth Centers
20,000
18,000 130,000 130,000 140,000 GoU
Procurement of computers
2,000 2,000 4,000 20,000 GoU
Procurement of Vehicles
250,000 GoU
Procurement of Water testing equipments
50,000 GoU
Procurement of Motorcycles
15,000 25,000 GoU
Programs for Sustainability of Water Project
148,000
148,000 148,000 158,000 158,000 GoU

256
PRODUCTION
Development outputs
Activities Time frame Responsible parties
Planned Budget
Yr1 Y2 Y3 Y4 Y5 Source Amount
Farmers trained in tea husbandry
Establishing Demos
0 6,000 6,500
7,000
7,500 DPO MAAIF/NAADS
27,000
Planning & Review done
Drawing work plans, budgeting and conducting quarterly/ annual reviews.
2,800 3,400 4,000 4,800 DPO MAAIF
15,000
Gender mainstreamed and integrated
Sensitizing and supporting women, councils, PWD, Youth leaders & HIV/AIDS
4,000 4,400 5,000 5,500 DPO MAAIF
18,900
Farmers trained in soil and water mgt
Training farmers and staff in land use and mgt (soil & water facilities) Training farmers on small scale water harvesting and irrigation system. Develop ToR for irrigation structures Follow ups
3,000 3,300 3,770 4,000 SAO MAAIF
14,070
Quality inputs procured
Generate specifications, verifying inputs before and after delivery.
3,000 3,550 4,000 4,500 SAO, DFO, DVO, DE
MAAIF
15,050
Staff monitored and supervised
Monitoring and supervising staff
2,500 2,800 3,200 3,800 DPO MAAIF
12,300
Fish Demos established and stocked
Establishing of fish demonstration ponds
6,000 6,500 6,800 7,000 DFO MAAIF
26,300
Animal diseases controlled
Spraying of animals. Treatment and vaccination of
2,500 2,800 3,200 3,800 DVO, DPO MAAIF
12,300

257
animals
Infrastructure built and maintained.
Building and repair of infrastructure.
2,500 2,800 3,200 3,800 DPO, DE MAAIF
12,300
Zoonotic diseases controlled.
Veterinary inspection & certification of animals‟ products.
3,200 3,520 3,872 4,000 DVO MAAIF
14,592
Agricultural statistical data collected
Collecting agricultural stat data.
3,200 3,520 3,872 4,000 SAO MAAIF
14,592
Vehicle serviced & repaired
5,600 6,160 7, 200
7,500 DPO MAAIF
19,260
Monitoring & supervision done
Holding management committee meetings
3,200 3,520 3,872 4,000 DPO MAAIF
14,592
BMU Meetings held and Minutes recorded
Training meetings with BMUs
1,300 1,400 1,600 2,000 DFO MAAIF
6,300
Water patrols and monitoring lake landing site done
Monitoring, control and surveillance
3,200 3,520 3,872 4,000 DFO MAAIF
14,592
Work plans and reports done
Compiling and Submitting reports & work plans
1,188 1,188 1,188 1,188 SAO MAAIF
4,752
Animal diseases controlled
Vaccination against FMD, rabies, Animal diseases surveillance. Issue livestock health certificates. Hold staff
3,200 3,520 3,872 4,000 DVO MAAIF
14,592

258
INTERNAL AUDIT
Development Out put
Planned Activities
Time frame Responsible parties
Planned Budget shs’000
Yr1 Y2 Y3 Y4 Y5 Source Amount
2015/2016
2016/2017
2017/2018
2018/2019
2019/2020
Audit staff
-Local Revenue -PAFF -Non wage
134,885
Books of accounts and projects audited
Examination of vouchers ,bank reconciliations and work plans to be done
26,977 26,977 26,977 26,997 26,977 ,, ,, 134,885
Value for money reviews of constructed projects, carried out.
Examination of BOQs, Site visits to be carried out.
26,977 26,977 26,977 26,997 26,977 ,, ,, 134,885
Quarterly Audit reports prepared
4 quarterly Audit reports to prepared and submitted to relevant Authorities.
26,977 26,977 26,977 26,997 26,977 ,, ,, 134,885
Workshops And AGMS Attended
Attending Annual general meetings and workshops for new skills development.
26,977 26,977 26,977 26,977 26,977 ,, ,, 134,885