2013 Five-Year Business Plan and Budget
203
2013 Five-Year Business Plan and Budget Fiscal Years 2013-2017 Planning to ensure a reliable future.
-
Upload
khangminh22 -
Category
Documents
-
view
0 -
download
0
Transcript of 2013 Five-Year Business Plan and Budget

2013 Five-Year Business Plan
and BudgetFiscal Years 2013-2017
Planning to ensure a reliable future.

i
CHAPTER 1 – FIVE YEAR BUSINESS PLAN AND BUDGET ........................ 1
Introduction ......................................................................................... 1
Executive Summary ................................................................................ 1
Background .......................................................................................... 2
The “New Normal” ................................................................................. 2
Deficit Elimination Plan ........................................................................... 3
Purpose of the 2013–2017 Business Plan and Budget ....................................... 3
Five Year Rolling Plan ............................................................................. 5
Operational Efficiency ............................................................................. 6
Workforce Partnership ............................................................................ 6
Memorandum of Understanding (MOU) ........................................................ 6
Customer Involvement and Notification ....................................................... 6
CHAPTER 2 – WATER RESOURCES DEVELOPMENT ............................... 7
Introduction ......................................................................................... 7
Water Supply, Demands and Recycled Water Opportunities .............................. 8
Water Resources Development FY 2013-2017 ............................................... 9
Pursue Planning Projects ......................................................................... 9
Funding for Planning Projects .................................................................. 12
Future Regulatory Considerations ............................................................. 13
CHAPTER 3 – STRATEGIC PLAN ................................................... 16
Introduction ........................................................................................ 16
Strategic Plan Goals ............................................................................... 16
Implementation .................................................................................... 17
Tracking & Monitoring ............................................................................ 17
Why We Need a Strategic Plan .................................................................. 18
CHAPTER 4 – PREVENTIVE & PREDICTIVE MAINTENANCE PROGRAMS ..... 19
Mission ............................................................................................... 19
Methodology ........................................................................................ 19
Preventive & Predictive Maintenance ......................................................... 19
Department Overview ............................................................................ 19
Current Maintenance Programs ................................................................ 24
Planned Projects .................................................................................. 25
Contingencies ...................................................................................... 30

ii
CHAPTER 5 – CAPITAL IMPROVEMENT PROGRAM .............................. 31
Introduction ........................................................................................ 31
The Sobering Truth about Infrastructure ..................................................... 31
Status of Padre Dam's Infrastructure .......................................................... 32
Overview of the Proposed 5 Year CIP ......................................................... 35
Potential Challenges .............................................................................. 36
CIP Funding Plan ................................................................................... 37
Summary ............................................................................................ 40
CHAPTER 6 – INFORMATION TECHNOLOGY ..................................... 41
Introduction ........................................................................................ 41
Core Information Services ....................................................................... 41
The Next Five Years .............................................................................. 42
Strategic Technology Plan ....................................................................... 42
CIS/FHRIS/EDMS Software Implementations .................................................. 42
Mobility .............................................................................................. 43
Staffing .............................................................................................. 43
Expenses Related to Initiatives ................................................................. 43
Technological Unknowns ......................................................................... 44
CHAPTER 7 - EMPLOYEE RETENTION, RECRUITMENT AND SUCCESSION PLANNING IN A CHANGING WORLD ............................. 45
CHAPTER 8 – COST CONTROL MEASURES ....................................... 49
Introduction ........................................................................................ 49
Deficit Elimination Plan .......................................................................... 49
Employee Cost Savings ........................................................................... 49
Prior Cost Control Measures ..................................................................... 50
Conclusion .......................................................................................... 51
CHAPTER 9 – INCREASED CUSTOMER SERVICE AND FOCUS .................. 52
Customer Service Team .......................................................................... 52
CIS Software Implementation ................................................................... 52
Monthly Billing ..................................................................................... 53
IVR Implementation ............................................................................... 53
Proactive Customer Communications ......................................................... 53

iii
CHAPTER 10 – DEPARTMENT SUPPORT PLANS ................................. 55
Administration ..................................................................................... 55
Finance Department .............................................................................. 60
Human Resources ................................................................................. 63
Engineering and Planning Department ........................................................ 67
Operations and Water Quality .................................................................. 72
Santee Lakes Recreation Preserve ............................................................. 74
CHAPTER 11 – FIVE YEAR WATER AND SEWER RATE PLAN .................. 79
Typical Monthly Water Customer Bill.......................................................... 80
Typical Monthly Sewer Customer Bill ......................................................... 80
CHAPTER 12 - SANTEE LAKES FIVE-YEAR BUSINESS PLAN ................... 83 CHAPTER 13 – APPENDICES: OPERATING, CAPITAL EQUIPMENT AND
CAPITAL IMPROVEMENT PLAN BUDGET, AND JOB CLASSIFICATION & SALARY SCHEDULE FOR YEARS 1 THROUGH 5 OF FISCAL YEARS 2013-2017 (TO BE APPROVED ANNUALLY PRIOR TO EACH FISCAL YEAR)

iv
This page intentionally left blank

2013-2017 Business Plan & Budget | Page 1
Chapter 1 – Five Year Business Plan and Budget
Introduction The Five Year Business Plan and Budget for fiscal years 2013–2017 (Plan) is a comprehensive roadmap to achieve operational performance, capital replacements and preventive maintenance for the benefit of District customers over the next five years. The Plan identifies the work to be performed and the related rates to produce necessary revenues to achieve the Plan’s goals. It is modeled after the District’s very successful 2008–2012 Five Year Business Plan and Budget (2008 Plan).
Executive Summary The Plan covers the first five years of the 2012-2022 Strategic Plan and provides mechanisms to ensure compliance with that plan. The Plan is responsive to the needs of the customers by providing essential services in the most cost-effective manner possible as dictated by Padre Dam’s mission statement. It includes a reliable revenue stream that provides sufficient funding to both maintain and replace the aging infrastructure necessary to provide the requisite customer services. The full extent of the tasks will only be realized to the extent of the revenues generated from customer rates and other sources. If rates are restricted, then work will be curtailed or projects reprioritized so that spending matches revenues. A reasonable level of rate stabilization funds can be used to smooth out temporary revenue swings such as from weather cycles. By necessity, flexibility needs to be factored in over the five years. While all current factors will be considered, new conditions and requirements are bound to occur over such an extended time period. The intent is to stay within the overall revenue generated from rates so any demands for spending over what is budgeted will have to be offset. The need to reprioritize operational spending is probable. The need to reprioritize capital projects and preventive maintenance projects from changing conditions is also probable. Routine changes will be communicated to the Board of Directors periodically while any significant, high cost adjustment will be presented to the Board for their consideration when it occurs. Staff would only request additional funding for a major unforeseen necessity or significant system failure. The following basic elements of the Plan will be more fully described in separate sections:
Five Year Employee Memorandum of Understanding (MOU) Five Year Preventive & Predictive Maintenance program Five Year Capital Improvement Program (CIP) Five Year Technology Plan Five Year Departmental Support Plan Five Year Water and Sewer Rate Five Year Park Plan Five Year process improvement and efficiency plan

2013-2017 Business Plan & Budget | Page 2
Background 2008 Plan Padre Dam adopted its first Five Year Business Plan and Budget for fiscal years 2008-2012 in June 2007. Although multi-year budgets had been used before, this was an innovative concept with a long range focus. There was flexibility in the 2008 Plan that hadn’t existed before. It also included a five year MOU and an approved rate ramp to add stability and assist in planning. The success of the 2008 Plan can be linked directly to its flexibility and accountability. Managers kept a close eye on expenditures and only spent what was necessary without worrying whether funds would be available later when needed. The result was significant operational expense savings which was vital because during the same period, the District experienced drastic water sales reductions due to drought and the recession. Active management, hiring delays, reduced expenditures and staff reductions helped to offset the loss of revenue but did not eliminate its toll on the District. Predictions that the District’s Water Operation would be financially stable by the end of the 2008 Plan did not materialize. By the end of the five years, it was projected that smaller rate increases would be needed as the District would have recovered from prior years of no rate increases and would have caught up on some major capital projects. Unfortunately, because of circumstances beyond the District’s control, that has not happened. Retail Water’s change in net assets is projected to be at a loss for the third straight year. The 2008 Plan had assumed losses in the earlier years with a recovery by the end of the plan. Unfortunately the opposite is true – actual results in the first two years were positive but once the drought and recession hit, change in net assets decreased considerably. By the end of the 2008 Plan, the Retail Water Operation is running a significant deficit, even after one time revenue infusions. Likewise, fund balance levels are lower than projected because of the revenue losses and reduced developer fees.
The “New Normal” As mentioned above, much has changed since the 2008 Plan was adopted. Since that time, Padre Dam has experienced a 34 percent reduction in water sold. The cost of water from the District’s sole provider has increased significantly due to regulatory and demand issues. This cost must be passed on to Padre Dam customers resulting in considerable rate increases. The water and wastewater businesses require expensive infrastructure. Substantial fixed costs related to financing and maintaining these systems must be covered regardless of the amount of water sales or sewer services. As sales have declined, rates have increased in order to cover these costs. Customers are now paying more for less water and are experiencing severe rate fatigue. Customers have made permanent lifestyle changes and, as a result, more than 80 percent of the District’s customers say they will use the same or less water in the future. This Plan was developed with the understanding that a “New Normal” exists and that the District must adapt its operations to the changed environment.

2013-2017 Business Plan & Budget | Page 3
Deficit Elimination Plan Before a new business plan could be developed, significant adjustments needed to be made in order for the District to operate efficiently and effectively under the “New Normal”. The Deficit Elimination Plan presented to the Board in July 2011 was designed to address financial conditions created by the economic recession and extraordinary conservation. Faced with unprecedented financial and operational challenges, the District’s General Manager and Management Team worked together to develop a plan to reduce expenses, defer capital expenditures and rightsize the District in order to operate effectively with significantly less revenue. The initiatives outlined in the Deficit Elimination Plan helped to correct the District’s deficit spending situation while ensuring the quality and efficient deployment of essential services. The Deficit Elimination Plan successfully met the following targets:
19 percent reduction in workforce (26 positions) Reduced CIP spending by $12 million Reduced capital equipment expenditures by $270,000 Cut operating expenses by approximately $1.7 million Retail Water Fund stabilized
Purpose of the 2013–2017 Business Plan and Budget The purpose of the Plan is to maintain reliable customer services over the long term. An overarching goal will be to provide water and sewer services at reasonable prices given consideration to all the factors including age of the infrastructure, risk tolerance, and public perception. This goal is consistent with the District’s mission to “provide quality water, recycled water, park and recreational facilities and wastewater management services…in the most cost-effective manner possible…earning customer and community respect.” The Plan includes the following objectives:
Avoid spills, breaks and surprises Avoid interruption of water and sewer services Achieve water quality and system reliability Water reliability during droughts Provide reliable sewer service Promote use of recycled water Achieve efficient & effective business operations Promote transparency and openness with customer Adopt reasonable rate increases and avoid rate spikes Continuous cost management Match spending to revenues Reduce staffing by an additional 5 FTEs through attrition Increase CIP funding Maintain District reserves and increase to recommended levels if possible Increase park and recreation opportunities at Santee Lakes

2013-2017 Business Plan & Budget | Page 4
To achieve the Plan, all of the following operational components are needed:
Predictable revenue stream Continuous preventive maintenance program Renewal and replacement of aging infrastructure Customer focus and service Continue with reasonable security measures Succession planning & employee retention Park self sufficiency Workforce Partnership Increased focus on Information Technology Departmental support
Critical Elements of the Plan
The Plan covers fiscal years 2013 through 2017. The Plan anticipates the Board of Directors’ approval of rates and charges for the
next five years, following a Proposition 218 process. Approved rates will not change unless unexpected and extraordinary situations occur. Any such changes must be approved by the Board of Directors through a Proposition 218 process. Examples of “extraordinary” items might be long-term and severe water restrictions due to drought, significant new regulatory requirements and major infrastructure system failures not anticipated in the CIP Plan.
“Typical Customer” billing information is presented for illustrative purposes. Actual customer bills depend on the specific amount of water or sewer service used which varies from customer to customer.
Spending over the next five years shall match revenues generated from rates, fees
and interest earnings (see Tab 12 for rate impacts). Reserves may be used to mitigate fluctuating cash flow needs while being consistent with Board approved minimum and maximum fund levels.
The Plan includes staff’s recommended Operating and Capital Equipment Budget
(see Tab 13) and Capital Improvement Program Budget (see Tab 14) for each of the five years. Spending patterns will need to be modified over the five year period. Staff will present the Board of Directors with revised priority lists of modified budgeted line items within the following parameters:
a. Unspent budgeted amounts in earlier years may be carried forward to
subsequent years within Plan. Overspending in earlier years will have to be made up by savings in subsequent years.
b. The CEO/General Manager and the CFO/Director of Finance are responsible
for ensuring that spending does not exceed the total five years’ budgeted expenditures.
c. Before each fiscal year begins, the CEO/General Manager shall provide the
Board of Directors with the status of expenditures in relation to the Plan and recommend any necessary changes.

2013-2017 Business Plan & Budget | Page 5
d. The Board of Directors shall adopt a Resolution before the beginning of
each fiscal year of the Plan to reaffirm the Plan for the remaining years, including reprioritized expenditures and carryovers.
The CEO/General Manager Authority & Direction
a. The CEO/General Manager is directed to execute the Plan.
b. The CEO/General Manager is authorized to approve and execute contracts
and other expenditures, including contracts for public works and capital improvements that are consistent with budgeted amounts in the Plan, in accordance with District Standard Practices and state laws.
c. The CEO/General Manager is directed to report to the Board of Directors
the status and progress of budgeted items and projects outlined in the Plan.
The Board, PDEA and MMCA approved Memoranda of Understanding (“MOUs”)
are an integral part of this Plan. As such, they are incorporated as an official element of the Plan.
Budgeted salaries, wages and employee benefits reflect staffing levels needed to complete the projects and activities listed in the Plan. The budget was based on current staff with assumptions about future changes in compensation and benefits based on the approved MOUs and the reduction of 5 FTE through attrition during the course of the plan. The Job Classification Schedule for all employees listing minimum, midpoint and maximum salaries for the first year of the Plan is attached to the Operating Budget in Tab 13.
Subsequent years’ salary schedules will depend on the Consumer Price Index-Wage Earners (CPI-W) published annually in February and will be presented to the Board for approval as soon as it is available.
The CEO/General Manager is authorized to adjust Job Classifications as needed in order to fulfill the staffing levels of the Plan. All staffing levels will comply with the financial constraints of the Plan and will be reported to the Board of Directors as a part of monthly financial statements.
Five Year Rolling Plan Each year, an updated spending plan for capital replacements & improvements and preventive maintenance will be presented to the Board with a staff analysis of why projects have been reprioritized. Departmental budgets will likewise be updated annually to accommodate any operational changes or unforeseen events. Spending levels and priorities within each year will be flexible but overall spending for the full five years will not change. Funding for budgeted expenses not used in earlier years will be available in future years. Likewise, any overspending in earlier years will have to be made up in subsequent years. This innovative approach was one of the reasons the 2008 Plan was so successful; savings realized in the beginning of that plan helped the District offset significant revenues losses due to the recession and drought.

2013-2017 Business Plan & Budget | Page 6
Operational Efficiency Over the course of the Plan, staff will continue to look for operational efficiencies and process improvements; technology will play a vital role in this. Innovative thinking and deviations from the status quo will be encouraged to capitalize on cost saving opportunities. Organizational structure will continually be evaluated to take advantage of staffing efficiencies. These approaches have proven successful in achieving real savings at Padre Dam in the past. As previously mentioned, significant operational cost savings in the early years of the 2008 Plan helped offset substantial revenue losses. More recently, the Deficit Elimination Plan helped to reduce operational costs and rightsize the District for a reduced level of sales and development. Under the new Plan, the quest for improvements and cost savings will continue.
Workforce Partnership Our Workforce Partnership is a key component in the success of this Plan. The Workforce Partnership creates a work environment that values employees and clearly establishes the accountability of labor, management and the Board to each other and Padre Dam's customers. Collaboration between employees, management and the Board is pivotal in the accomplishment of the goals outlined in this Plan. Among the options available to the Workforce Partnership are Department Meetings, Link Pins and the Employee Involvement Team. It is crucial that our employees are fully engaged in providing the critical services for our customers and that we utilize all means of communication with them to meet our goals. The result of the Workforce Partnership is that Padre Dam’s performance, quality and service standards are what most people desire in a well-run business, but do not expect to find in government.
Memorandum of Understanding (MOU) When looking out five years, it is important to have stability and predictability whenever possible. To assist with this stability and predictability, we have negotiated five year agreements with our two employee associations – Padre Dam Employees Association (PDEA) and Mid-Management & Confidential Association (MMCA) that will expire June 30, 2017. We believe these agreements will provide us with the tools to attract, recruit and retain the best talent. In addition, we believe these agreements are financially prudent and responsible to the benefit of our customers. Both agreements are available for view through the Human Resources Department.
Customer Involvement and Notification It is the intent of Padre Dam to be transparent to its customers in all significant areas. Accordingly, the customers will be notified of the purpose and intent of the 5-Year Business Plan and Budget through a “Proposition 218” notice mailed to all customers and property owners. Sufficient detail will be provided to customers to indicate the plans for the next five years, and the expected customer benefits coupled with rate impacts. Depending on customer response, additional community meetings may be held to further explain the Plan.

2013-2017 Business Plan & Budget | Page 7
Chapter 2 – Water Resources Development
Introduction Padre Dam imports 100 percent of its potable water supply from the San Diego County Water Authority (SDCWA). SDCWA receives a substantial portion of its supply from the Metropolitan Water District of Southern California (MWD). The majority of MWD water comes from the State Water Project (SWP) and the Colorado River Aqueduct. Water travels through over 600 miles of aqueducts and 1,100 miles of pipeline to get to San Diego County. The Delta is at the center of the State Water Project (SWP). Since 2008, water deliveries from the Delta to Southern California have been limited by federal pumping restrictions enacted to protect the endangered Chinook Salmon, Delta Smelt and Longfin Smelt. In 2010, the Delta only supplied 18 percent of San Diego County’s water supply. Stakeholders are currently developing plans for new water conveyance systems that will protect and restore the Delta’s ecosystem. Another factor with the Delta and the SWP is the potential for a long interruption of service should any of the conveyance systems be damaged due to natural disasters. The Colorado River flows from the Rocky Mountains in Colorado to the Gulf of California and is a major water resource for Wyoming, Colorado, Utah, Nevada, California, Arizona and New Mexico. The river’s annual flow was allocated among the seven states in the 1922 Colorado River Compact. Ten consecutive years of drought in the Colorado River Basin, from 1999 to 2009, have reduced Lake Mead to 43 percent of its water storage capacity. In 2010, the Colorado River provided 61 percent of San Diego County’s water supply including allocations from the Quantification Settlement Agreement (QSA). In the past California has taken a higher percentage of water than allocated in the 1922 Compact because water was available. As other states in the Compact continue to use more water, California will receive less than past years. The San Diego County Water Authority was 95 percent reliant on MWD water during the 1990’s. This made San Diego County extremely vulnerable to water supply shortages. At that time, SDCWA launched a plan to develop a diversified portfolio of water resources by 2020. In 2011 the allocation from MWD was 47 percent of the SDCWA’s total demand; by 2020 it is anticipated the allocation will be further reduced to 29 percent of the total demand. Recycled water is an important part of San Diego County’s future water supply strategy. Every drop of recycled water used for non-potable use saves drinking water sources.

2013-2017 Business Plan & Budget | Page 8
Water Supply, Demands and Recycled Water Opportunities The District’s water supply can be categorized as potable (which is all purchased from the SDCWA) and non-potable, which is produced at the Ray Stoyer Water Recycling Facility (WRF). Table 1 shows the volumes Padre Dam received in 2010 and the volumes required to meet future normal water year demands, assuming Padre Dam’s compliance with 2015 and 2020 water use targets mandated by Senate Bill X7-7.
Table 1
Padre Dam’s Water Supply (Source: Padre Dam’s Urban Water Management Plan)
Units are in Acre Feet
Source/Year 2010 2015 2020 2025 2030 2035 San Diego Co. Water Authority 15,772 14,810 15,910 17,215 17,967 18,881 Ray Stoyer WRF (Title 22 Water) 1,874 2,016 2,016 2,016 2,016 2,016 Currently, the District treats and recycles about 40 percent of its total wastewater flows. The WRF processes two million gallons per day (MGD) (2,240 AFY) of wastewater to provide Title 22 recycled water to support the Santee Lakes and up to 890 AFY (0.8 MGD) for irrigation use in Santee. Note there is an approximate 10 percent process loss of the influent wastewater through the treatment processes in the form of sludge & solids. Sludge & solids are pumped to Point Loma for treatment and disposal. Excess water is discharged into the Sycamore Creek. Currently, the District is the only entity in San Diego that is allowed to discharge effluent into an inland water body by the Regional Water Quality Control Board (RWQCB). The National Pollutant Discharge Elimination System Permit (NPDES) issued by the RWQCB is essential for the long term sustainability of Santee Lakes Recreational Preserve. Based on the available wastewater generated in the District’s service area (see Table 2), the WRF could be expanded from an influent flow from 2 MGD (2,240 AFY) up to 4.8 MGD (5,380 AFY). The expanded facility would provide approximately 2 MGD (2,240 AFY) of full advanced treated (FAT) recycled water to be used for indirect potable reused (IPR) and meet all projected future demands for non-potable reuse within Santee and the Santee Lakes Recreational Preserve (~2 MGD).
Table 2 Padre Dam’s Raw Wastewater Available in Service Area (Source: Padre Dam’s Urban Water Management Plan)
Units are in Acre Feet
Source/Year 2010 2015 2020 2025 2030 2035 Raw Waste Water Generated in Padre Dam Service Area 5,264 6,076 6,517 6,801 7,032 7,083

2013-2017 Business Plan & Budget | Page 9
Water Resources Development FY 2013-2017 The proposed Capital Improvement Program (CIP) budget is structured to bridge the short term funding gap without undue burden to ratepayers while positioning the District to have a long term and sustainable infrastructure replacement plan. As it relates to the newly adopted 2012 Strategic Plan, the proposed CIP would facilitate multiple key success measures contained in Goal One – provide safe and reliable water, recycled water, and sewer services. In order to achieve the objectives of Goal Four of increasing water, sewer, and energy independence, additional funding is required above and beyond the budget presented within this business plan. Furthermore, it would be necessary for the District to develop strategic partnerships to solve these regional issues. With the continual uncertainties associated with regional water supply and wastewater treatment, it is envisioned that these goals will be tackled in a subsequent multi-year business plan. With the future of imported water & regional wastewater treatment becoming more expensive and/or more unreliable, increasing local controls of these valuable resources is an important initiative by the District. Current plans over the next five years are to:
1. Establish and Maintain Strategic Partnerships 2. Pursue Planning Projects maximizing existing grants
a. Demonstration of Full Advanced Treatment (FAT) technologies at the WRF
b. Study of the Santee Basin Aquifer Groundwater Recharge & Replenishment Project (Santee GRRP)
3. Secure grant funding for additional planned projects a. Santee GRRP Demonstration Project b. Combined Solids Handling Facilities With Enhanced Bio-gas Generation c. Establish Nitrification Reliability for Water Reuse
In order to develop a new recycled water project in the region, it is important to establish and maintain strategic relationships and partnerships with multiple agencies to gain support and regulatory approvals. Planned projects (listed above) over the next five years are intended to gain support and/or regulatory approvals from the following agencies:
1. California Department of Public Health (CDPH); 2. Regional Water Quality Control Board (RWQCB); 3. Bureau of Reclamation (BOR) ; 4. San Diego County Water Authority (CWA); 5. Department of Water Resources (DWR), State of California; 6. City of San Diego (CSD); 7. San Diego Metropolitan Wastewater Joint Power Authority (Metro JPA).
Other strategic partners include County of San Diego (County), City of El Cajon (El Cajon) and Helix Water District.
Pursue Planning Projects There is limited CIP budget available for development of a new water supply within the District over the next five years. However, in order to advance the use of recycled water during this period, two projects are planned to be accomplished utilizing existing grants: 1) Demonstration of FAT technologies at the WRF and 2) Study of the Santee GRRP.

2013-2017 Business Plan & Budget | Page 10
1. Demonstration of FAT Technologies at the WRF The State of California is in the process of finalizing the recycled water regulations and will publish them later this year. The draft recycled water regulations reflect the CDPH’s current thinking on the regulation of recharge of groundwater with FAT recycled water. The draft recycled water regulations will require all future IPR projects utilizing groundwater aquifers to demonstrate the effectiveness of FAT processes utilizing the source water actually intended to be used for each project. The ultimate goals of this demonstration project are to reduce the regulatory requirements of recycled water contribution and residence time for the Santee GRRP. In the latest draft recycled water regulation, the CDPH requires an initial recycled water contribution of 50 percent and a minimum aquifer retention time of 6 months. However, if the demonstration project can prove sufficient log removal of crypto, giardia, and viruses, it could reduce the recycled water contribution and aquifer retention time requirements. Ultimately, this demonstration project could maximize the yield of the Santee Basin Aquifer and reduce initial operating costs of the Santee GRRP significantly. The current draft recycled water regulation contemplates a 10 log removal of crypto and giardia, and 12 log removal of viruses through the treatment processes. Table 3 shows pathogen log removals for a project that does not use FAT technology; therefore, a 6 month aquifer retention time is required representing 6 log removal of pathogens. Table 4 shows pathogen removals for a project that uses FAT technology where a 2 month aquifer retention time is possible.
Table 3 Pathogen Log Removal – For a Non-FAT Project
Organism Log
Reduction Required
Log Reduction Obtained
Biological and
Tertiary Treatment
Membrane Filtration
Reverse Osmosis
UV Disinfection
Advanced Oxidation
Aquifer Retention
Crypto 10 14 4 6 6 Giardia 10 14 2 6 6 Viruses 12 12 0 6 6
Table 4
Pathogen Log Removal – For a Project with FAT
Organism Log
Reduction Required
Log Reduction Obtained
Biological and
Tertiary Treatment
Membrane Filtration
Reverse Osmosis
UV Disinfection
Advanced Oxidation
Aquifer Retention
Crypto 10 17 2 4 3 6 2 Giardia 10 15 2 2 3 6 2 Viruses 12 15 2 0 3 6 2
The proposed project will provide planning, design, and construct a 0.1 MGD demonstration plant using FAT technologies (Microfiltration/Reverse Osmosis (MF/RO), advanced oxidation) at the WRF. The demonstration project will provide valuable information to gain regulatory acceptance that will support future expansion of the WRF. If the full expansion of the WRF up to 4.8 MGD is achieved, it could provide approximately 2,240 AFY (2 MGD) of local, drought-resistant water, representing approximately 15-20 percent of current potable demands. Implementation of this demonstration project will also address potential

2013-2017 Business Plan & Budget | Page 11
public concern over safety of indirect potable reuse and provide public education by demonstrating an innovative and efficient solution to the water supply issue. Figure 1 at the end of this chapter is a site map of the expanded WRF including the location of the proposed FAT facility. 2. Study of the Santee GRRP The purpose of this project is to evaluate the feasibility of injecting and extracting FAT recycled water into the Santee Basin aquifer and the development of the resource as a potable water source to lessen the District’s reliance on imported water. This project specifically targets characterization of the hydraulic capabilities of the basin for injection and extraction of water. Additionally, this study will evaluate the hydraulic connectivity of the basin with the San Diego River. This information will be valuable for assessing the influence of surface water on the groundwater basin, and for determining possible impacts on water rights. The proposed site of the Santee GRRP project lies within a portion of the Santee Basin aquifer generally bound on the west by Cuyamaca Street, on the north by Riverwalk Drive, on the east by Magnolia Avenue, and on the south by Riverview Office Park as depicted on Figure 2 at the end of this chapter. The study of the Santee GRRP is a joint partnership between the District and the BOR. To date, a table top study has been completed to show that there is a potential to use the proposed site for a GRRP. Additionally, several stakeholders’ meetings related to this project have been held. The next phase of this study includes:
Perform geophysical investigation to determine the extent and thickness of the alluvium at the project site.
Install a test well and perform testing to determine local hydraulic conductivities of the aquifer.
The preliminary geophysical work using electrical resistivity to help define the alluvial thickness and extent, and underlying bedrock topography has been recently completed. The results of the test are expected to be available at the end of June 2012. Once the geophysical tests are completed, test and monitoring wells will be installed to assess groundwater quality and hydraulic conductivities. The information obtained from the test and monitoring wells will be used to develop a preliminary groundwater model in support of GRRP in the Santee Basin Aquifer. 3. Future Projects
Santee Aquifer GRRP Demonstration Project
This goal of this demonstration project is to determine actual retention time of the Santee Basin Aquifer. It is envisioned that this demonstration project would help with the development and refinement of the injection/extraction strategies that would optimize aquifer retention time and maximize yield of the aquifer.
Combined Solids Handling Facilities With Enhanced Bio-gas Generation The intent of this project is to study the viability of constructing a combined bio-gas generation facility within Sycamore Landfill. Sycamore Landfill is in the process of developing an extensive landfill gas extraction facility to maximize the energy potential from their off-gas recovery system. Additionally, Sycamore Landfill is

2013-2017 Business Plan & Budget | Page 12
evaluating the viability of separating its organic wastes and digest them to produce more bio-gas for energy recovery. With this project, the District could develop a partnership with the landfill where sludge and solids from the WRF could be co-digested with organic wastes from the landfill. The bio-gas would be recovered from the digesters and sold to SDG&E to be used as an energy source. If proven viable, this project could reduce the sludge and solids handling and reduce solids disposal costs for the District without constructing solids handling facility at the WRF as part of the future expansion.
Establish Nitrification Reliability for Water Reuse
When California developed the current Title 22 Recycling Criteria, the chlorine disinfection requirements were based on results of a not well understood and controlled nitrification processes. As a result, no regulatory distinction was made between disinfection with chloramine and chlorine gas. The intent of this study is to document the reliability of the nitrification process at the WRF giving the District proper credit for disinfecting with chlorine gas. Potentially, this study could lessen the chlorine gas needed to properly disinfect Title 22 water or reduce the need to expand the current disinfection facility in the future.
Funding for Planning Projects 1. FAT Demonstration Project at the WRF The demonstration project is projected to be funded by the Proposition 50 grant secured from DWR for $3 million via the Integrated Regional Water Management (IRWM) Program. This grant was originally awarded to expand the WRF from 2.0 MGD to 4.4 MGD including advanced treatment facilities for the joint project with Helix Water District. The grant is currently being amended with the DWR to cover the cost of the demonstration project at the WRF. 2. Study Santee GRRP The Santee GRRP Study is a joint venture with the BOR. Total cost of the project is $600,000 with BOR and Padre Dam sharing the costs equally through a planning grant funded by the Department of Interior.
3. Funding for additional studies related to WRF and Santee GRRP Funding for additional studies is planned to be fully or partially funded by Proposition 84 funding from DWR, WaterSmart Grant Program from BOR, and grants from Water Reuse Foundation. Currently, no CIP budget is allocated for the District’s matching portion of these grants because the matching percentage is unknown at this time and funding is limited.

2013-2017 Business Plan & Budget | Page 13
Future Regulatory Considerations 1. Padre Dam Live Stream Discharge (NPDES) Permit This permit was last renewed in 2009. The purpose of the permit is to continue to allow Padre Dam to discharge recycled water from the Santee Lakes to the adjacent Sycamore Creek, a tributary of the San Diego River. Padre Dam is the only agency in San Diego County with an inland live stream discharge permit due largely in part to our impeccable compliance record and excellence in water recycling facility operations. During the last permit renewal, the RWQCB included performance goals for several contaminants of emerging concern. To date, Padre Dam is able to meet these performance goals; however, additional future regulatory requirements may become more stringent where the existing treatment processes will be unable to meet the compliance requirements and significant investments in the treatment processes will be required. Funding for these potential compliance related capital investments is not included in 2013/17 Five Year Plan due to the limited knowledge of the future permit requirements. 2. Upgrades at City of San Diego Point Loma Wastewater Treatment Plant The waiver to upgrade Point Loma to a full secondary treatment plant in compliance with EPA’s Clean Water Act is up for review and consideration in 2015. Earlier this year, the City of San Diego completed their recycled water study which evaluated several options to offload wastewater from Point Loma in order to meet the EPA compliance requirements. This study is the first step outlining strategies to reuse the wastewater currently discharged into the Pacific Ocean to increase local water supply. The cost of this plan is currently estimated to be in the range of 1 to 2 billion dollars. Padre Dam’s portion of this upgrade cost is approximately 3%. Funding for this potential liability is not included in the 2013/17 Five Year Plan as the City is in the process of preparing an implementation strategy and cost allocation model for the proposed upgrade. Staff will continue to monitor the progress and status of the potential costs to Padre Dam and when appropriate will develop and provide recommended strategies that minimize the financial impacts to Padre Dam's ratepayers.

2013-2017 Business Plan & Budget | Page 14

2013-2017 Business Plan & Budget | Page 15

2013-2017 Business Plan & Budget | Page 16
Chapter 3 – Strategic Plan
Introduction The Padre Dam Board of Directors adopted the District’s new 2012-2022 Strategic Plan on April 30, 2012. The 2012-2022 Strategic Plan presents six strategic goals to address the current and future challenges facing the District to ensure our continued success. The plan puts Padre Dam in a position to have a positive impact on our service areas and ensures our systems will be maintained and developed for the continued benefit of our customers. The Strategic Plan guides the District in making decisions which foster the mission of the District. Well known author and time management expert, Alan Lakein, once said: “Planning is bringing the future into the present so you can do something about it now.” With a $53 million dollar annual operating budget and nearly one billion (replacement costs) in infrastructure, Padre Dam MWD must maintain a comprehensive strategic plan that ensures operational effectiveness and quality of service. Padre Dam MWD’s aging systems require planning and attention only achieved through a strategic planning process, which meet the mission and vision of the District.
Strategic Plan Goals The 2012 Strategic Plan takes on the challenge of planning the District’s future for the next ten years. This plan is not an event or a static document. It is a living plan that will be used for focus, guidance, decision-making, and monitoring progress. Execution requires balancing movement toward the District vision while living within the financial constraints identified during budgeting. Padre Dam recognizes this challenge and is committed to being realistic in its execution, given the increasing uncertainty in our external environment. The strategies, objectives, and goals of this plan will guide the future of our District. They are the foundation for the District’s Five-Year Business Plan and Budget. The Strategic Plan and the Five-Year Business Plan & Budget must be in alignment with each other. The Strategic Plan provides the “overarching” goals while the Five-Year Business Plan & Budget, through specific tasks, places the District on a path to achieve those goals.

2013-2017 Business Plan & Budget | Page 17
The following are the goals for the 2012 Strategic Plan. Each goal has specific initiatives with identified Key Success Measures and Activities.
1. Provide Safe, Reliable Water, Recycled Water, and Wastewater Services
2. Ensure Fiscal Health and Competitively Sustainable Rates
3. Enhance Customer Communications and Education
4. Increase Water, Wastewater and Energy Independence
5. Maintain Workforce Excellence
6. Expand Park and Recreation Opportunities
Implementation The Strategic Plan was deployed initially to the public through a variety of means, including but not limited to the District website, District newsletter, press release, Administration Building lobby display, and email notifications. The Plan was deployed to the Padre Dam MWD workforce through all-staff Dialogue Sessions, email, Departmental meetings and the intranet. It will be administered by the Management Team and all employees. Each Goal is assigned a “Champion” who is responsible for ensuring their Goal is achieving steady progress and assigned initiatives and/or activities are being accomplished. Initiatives that support our Strategic Goals are contingent on appropriate funding levels which may or may not be available at the time of planned implementation. The Strategic Plan is inherently flexible, dynamic and responsive to external and internal developments.
Tracking & Monitoring The Strategic Plan will be continually monitored. Staff will provide scorecard updates to the Board of Directors and the public twice per year. It will also receive a review and update annually. Scorecard results will be posted and made available to the public through the District website and in hard copy upon request. It is our intent to make the progress and challenges associated with the plan transparent and available for continuous review.

2013-2017 Business Plan & Budget | Page 18
Why We Need a Strategic Plan The “game” has changed dramatically over the last five years. We have seen dramatic shifts in regulatory compliance, environmental restrictions, water supply reliability, water use levels and conservation. Padre Dam experienced a 34 percent reduction in water sales over the last five years. These dramatic changes have created what we call the “New Normal”. The Strategic Plan was developed using the assumptions defined at “The New Normal” shown below. Water Demand
More than 80 percent of residential customers say they will use less water or the same amount. The District has already experienced a 34 percent reduction in water sales from FY 07 to FY 11.
More than 85 percent of customers are satisfied with Padre Dam as of September 2011.
Customers want more local control of water resources and will support development of increased local water sources, wastewater services and energy independence.
Water Supply Costs for importing water are expected to increase significantly over the next ten
years, a situation outside of Padre Dam’s control. The cost of doing business as a public utility continues to increase. According to SBx7-7, the 2009 legislative package requiring a statewide 20 percent
reduction in urban per capita water use by 2020, Padre Dam is limited to providing 142 GPCD (gallons per capita daily) for our service area.
Wastewater Treatment Environmental and regulatory requirements will be even more stringent. The City of San Diego’s Pt. Loma Waste Water Treatment Plant requires an
estimated $2 billion in upgrades that will impact all San Diego residents including Padre Dam ratepayers.
Treatment technology will continue to evolve.
Infrastructure The majority of the infrastructure is over 40 years old and will continue to degrade
over time. The District’s primary transmission pipeline dates back to pre-World War ll. Capital investments are required to upgrade, maintain and replace infrastructure.
Employees
The “new normal” means continued cost-controlling will be required in an environment of declining water usage.
Commitment to the Workforce Partnership as evidenced by employees voluntarily opening their contract and reducing benefits.
Regulatory requirements mandate additional certifications to perform key roles. Planning is a critical piece to ensuring the continued reliability of our water system now and into the future. The complete Strategic Plan is available online at www.padredam.org.

2013-2017 Business Plan & Budget | Page 19
Chapter 4 – Preventive & Predictive Maintenance Programs Mission To provide sufficient maintenance of existing infrastructure systems to promote efficient operations and minimal customer service outages while avoiding emergency repairs and ensuring that the water and sewer systems are maintained for future customers/ratepayers. Methodology Identify operational and maintenance projects to achieve the mission of preventive and predictive maintenance. The list of projects is included in this chapter. Preventive & Predictive Maintenance The Operations Department is looking forward to continuing a focused preventive and predictive maintenance program in the new Plan. In past budget cycles, there was inadequate allocation of resources to stay on track with necessary maintenance programs. This caused maintenance to be cutback or permanently curtailed in some budget years. This Plan allows efficient planning and implementation of preventive and predictive maintenance programs by providing a known funding source for these activities. This will continue to provide the most effective use of ratepayers’ money. Even though the District experienced significant revenue losses from reduced water sales during the previous Five Year Plan, the Operations Department was still able to make significant progress on preventive maintenance projects. Crews previously dedicated to the maintenance initiatives were moved around as needed to meet goals. The efficient use of staff also enabled the District to respond to many emergencies in the last Five Year Plan. City infrastructure relocation and other projects requiring more immediate responses will continue to come up and will need to be factored in and adjusted for in this new Plan. The 2011 Deficit Elimination Plan resulted in the elimination of 26 positions District-wide, 8 of which were in the Operations Department. Department Overview The primary responsibilities of the Department are delivery of sufficient high quality water, maintenance of an emergency supply of water, collection of sewer, recycling of water, and maintenance of water, sewer collection and recycled water system facilities. The functions of the Department are separated into three divisions: Systems Maintenance and Construction, Water Operations, and Water Recycling; and two sections: Laboratory and Warehouse. The functions performed by the Department are described below.

2013-2017 Business Plan & Budget | Page 20
Water System Operations The main objective of the Water System Operations group is to ensure that there is an adequate supply of quality water delivered to the District’s customers. Services provided:
Ordering water from the wholesale supplier. Operating the water distribution system including pumps, storage, and water
quality process. Distribution pipe and fire hydrant flushing. Maintenance of fire hydrants. Valve turning (maintenance). Air-vac maintenance. Meter replacements. Influent sewer pump station operations. Sewer lift station maintenance. Electrical and instrumentation maintenance. Supervisor Control and Data Acquisition (SCADA) maintenance. Meter reading and Advanced Meter Infrastructure (AMI) operations and
maintenance. Pump station maintenance. Correcting water quality problems when they arise. Operating recycled water distribution system. Customer response. Breakage and repair. Monitor water quality and nitrification issues. Clean and chlorinate reservoirs. Weekly, monthly and quarterly system water samples.
Collection System Operations This team operates and maintains the sewage collection system and small sewage lift stations. They provide scheduled cleaning of the entire collection system and frequent cleaning of problem areas. A program of video inspection of the system using closed-circuit television (CCTV) is being done to ensure that the collection system is in good physical condition. The videos are reviewed by Operations staff to determine if immediate repairs are needed. The data gathered from the CCTV program is also sent to the Engineering Department and reviewed periodically. The video is assessed to determine what needs to be replaced or repaired. This data is a key part of the planning and prioritization process of the sewer Capital Improvement Program (CIP). The sewer group also plays a large role in the implementation of the District’s Sewer System Management Plan (SSMP). This document addresses the many aspects of the District’s collection system from the management of the system to operations and maintenance to spill response activities. Some of the main goals of the SSMP are to minimize Sanitary Sewer Overflows (SSOs) and to ensure that proper maintenance is conducted and adequate funding is available for these activities and the sewer system. The sewer group has an aggressive maintenance schedule to ensure compliance and to minimize any problems in the sewer system.

2013-2017 Business Plan & Budget | Page 21
Services provided:
Cleaning of sewer mains and manholes through the system every 2 years. Frequent cleaning of problem areas or “hot spots.” CCTV inspection of sewers at a rate of 50-75 miles/year. Customer response. Quick response to sewer line breaks, SSOs, containment and repair. Repairs to sewer system mains, manholes and laterals. Continued implementation of the District’s SSMP. Wastewater crews are responsible for rainfall collection samples and storm water
runoff protection measures. Dedicated repair crew for pipeline and break replacement. Monitoring and executing the BMPs for the storm water program in the Operation’s
Yard and filing storm water reports with the Regional Water Quality Control Board for regulatory compliance.
Maintenance and Construction Crews This crew is responsible for installing water services, irrigation services, fire hydrants, fire services, small sewer and water pipeline projects and related appurtenances. They also make wet taps for system extensions, maintain the pipelines in the water distribution system, maintain the recycled water system, maintain and repair the sewer collection system and laterals, and perform preventive maintenance of valves, valve replacement, pressure reducing stations, turnouts, and tanks. Maintenance Service Maintenance services are provided for 388 miles of water pipe, 33 miles of recycled water pipe, 167 miles of sewer pipe, 29 reservoirs, 16 water pump stations, one major wastewater lift station, other minor installations, and all appurtenances in the infrastructure. Water System Maintenance Services provided:
Repair leaks and pipeline breaks. Replace fittings and appurtenances. Move, or assists in moving pipelines for other public works projects. Provide new installations and connections for developer and contractor projects.
Telemetry and Electrical Maintenance Services provided:
Support SCADA system. Repair and maintain motors and other electrical equipment at pump stations,
tanks, turnouts, Water Recycling Facility (WRF), and buildings.
Pump Maintenance Performs maintenance and repairs to pumps, valves and controllers, pressure regulating stations, chlorine generation units, and surge arresters.

2013-2017 Business Plan & Budget | Page 22
Valve Turning Crew This crew is responsible for exercising valves throughout the system in accordance with prescribed procedures. They also monitor and chlorinate reservoirs when needed and assist with line and dead end flushing. The valve crew plays an essential role in the valve replacement program by planning and executing pipeline shutdowns for the construction crews. They also isolate pipelines during main breaks. This requires quick planning and action on their part. Crews must be familiar with the various pressure zones throughout the service area to conduct shutdowns safely and effectively. Mechanics The mechanics group maintains a fleet of 76 vehicles, 9 tractors, and other District equipment. They also perform many maintenance related tasks including: welding and fabrication; sewage lift station repairs; and pump station repairs. They also purchase and maintain a wide variety of pneumatic and hydraulic equipment. Industrial Code Compliance Services provided:
Fats Oil Grease (FOG) program monitoring and reporting of fats, oils, and grease sources within the Collections System. Inspections on an annual basis are required of all FOG generators. An important aspect of this program is to ensure that businesses understand what is required of them. The District considers itself a partner with these establishments with education of the program as a top priority and enforcement actions as a last resort for failure to comply.
Fuel station and generator permits regulated by the Air Pollution Control District. Hazardous materials/asbestos handling and disposal, in accordance with the
Department of Environmental Health regulations. Groundwater contamination monitoring open cases and ensuring that the District is
well represented in any cases. Cathodic Protection Services provided:
Monitor and install protective measures to reduce corrosion of metal infrastructure.
Monitor and apply appropriate protective coatings for District infrastructure and appurtenances. An ongoing program of monitoring, maintaining, and reapplying coatings on District infrastructure helps to protect and extend the life of our system. A program of inspections and tracking of infrastructure will be established during this Plan.
Inspect coatings on pipes and valves as they arrive in the yard for ongoing Operations’ projects.
Inspect valves and field coatings for the Engineering Department on developer and District projects.
Assess pipe and soil conditions during steel main breaks and follow-up with written reports to document the pipe condition. Maintain organized records of all main breaks.

2013-2017 Business Plan & Budget | Page 23
Lead the inspections of the District’s reservoirs, and maintain an inspection
schedule as well as documentation of completed inspections with recommendations for improvements, modifications or repairs. Advise management on the condition of reservoirs to assist in the planning of rehabilitation or repairs.
Water Recycling The Water Recycling division is responsible for the safe and economical production of recycled water from the District’s wastewater flows. Two million gallons per day (MGD) (88 L/s) are treated to provide water to support the Santee Lakes, which are the key attraction at the Park, and to supply up to 1,000 acre feet per year (9.3 million cubic meters) for irrigation use in Santee. The system treats and recycles about 40 percent of District sewer flows. Operation and maintenance of the Water Recycling Facility is necessary to produce high quality recycled water and to meet requirements of the National Pollutant Discharge Elimination System Permit and discharge requirements for recycled water used for irrigation. Separated sludge is pumped to Metro for treatment and disposal. Other services provided are backup support for the laboratory. Laboratory The laboratory function is essential to the operation of the Water Recycling Facility, providing physical, chemical, and biological tests for the process. Analyses are provided for influent and effluent monitoring, lake water quality monitoring, and river water quality monitoring connected with discharges to the San Diego River Basin. The laboratory also provides routine bacteriological and water quality testing of the potable water distributed by the District to ensure the safety of the product and compliance with state and federal regulations. Cross Connection Control This section is responsible for the cross connection control and backflow prevention program; industrial waste pretreatment compliance in cooperation with the City of San Diego; and coordination with recycled water customers. Meter Technicians Meter reading personnel obtain water consumption data for customer billings; investigate customer complaints; install meters, test, and repair meters to ensure accuracy; replace old meters; and provide water meter related information and education to customers. This department has been reorganized due to the AMI program that was installed during the last 5-Year Business Plan. Services provided:
Meter reading and reporting data to the Finance and Customer Service Departments.
Meter replacements.

2013-2017 Business Plan & Budget | Page 24
Meter box replacements. Oversee daily operations of AMI infrastructure. Responding to customer calls, leaks, low pressure, damaged meter boxes, high
consumption. Return to sewer audits. Notify customers of shut-off for nonpayment (450 to 500 per month). Construction meter sets and retrievals.
Facilities Maintenance The Facilities Maintenance section preserves and maintains District facilities in a safe and aesthetically pleasing way, which meets the expectations of internal and external customers. This service is provided for the Administration Building, Field Operations Yard, Water Recycling Facility, and seventy-seven (77) off-site locations (29 reservoirs, 16 pump and lift stations, and 37 turnout and sample stations). This department also oversees the contract (outsourced) for landscape maintenance for District facilities. Under the Deficit Elimination Plan, staffing levels for this department were reduced from six to three full time employees. This department has also been reorganized going into the new 5-Year Business Plan. More outsourcing will be employed with contract management for meeting future demands in this department due to the staffing reductions. Services provided:
Landscape maintenance and outsourced contract management (excluding Park). Janitorial management for office buildings on all District facilities (excluding Park). Building maintenance services – roofs, painting, doors, locks, windows, plumbing,
etc. Management and maintenance of all District heating and cooling systems. All general District facility issues.
Operations and Water Quality Administration This group manages the activities of the department. They are responsible for preparing reports, correspondence, contracts, assisting with financing, and establishing quality and performance standards. This department coordinates emergency responses, monitors and controls telephone and radio communications, ensures water quality standards, manages operations, maintenance, and construction. They provide support to all department staff and District management, and represent the District at the San Diego County Water Authority, Metropolitan Wastewater Joint Powers Authority, and other organizations. Current Maintenance Programs Below is a list of the current maintenance programs Operations will focus on during the Plan:
Valve Replacement Valve Exercising Meter Replacement Sewer Line CCTV & Inspection Sewer Line Cleaning Fleet Maintenance & Replacements Equipment Maintenance & Replacements

2013-2017 Business Plan & Budget | Page 25
Pumps Maintenance & Replacements Pressure Reducing Station Maintenance Water Recycling Facility (WRF) Water Main Flushing
Planned Projects The Operations Department will focus on a number of important projects during the Plan. Note that new requirements and changing conditions are expected to result in reprioritization over the five-year period. Therefore, the Plan will be updated to reflect changes which will be provided to the Board of Directors annually with periodic updates when appropriate. However, staff will strive to focus on completing the bulk of the projects, deferring only those that end up taking a lower priority in relation to new, unexpected projects. The intent is to manage the budget committed over the five-year period in the most cost-effective and efficient manner. The following are the major preventive maintenance projects planned:
1. Pump/Motor Maintenance/Replacement Program 2. Main Flushing Program 3. Fire Hydrant Maintenance Program 4. Valve Replacement Program 5. RTU/SCADA Field Replacement Program 6. WRF Capital Equipment Replacement Program 7. WRF Capital Improvements 8. Infrared Camera Monitoring
1. Pump/Motor Maintenance/Replacement Program The distribution system utilizes large pumps to move water and requires periodic
maintenance and eventually replacement. During the previous Five Year Plan, through an aggressive maintenance program, nearly thirty pumps were reconditioned resulting in a much more reliable system than existed prior to the 5-Year Business Plan. The maintenance that is done ranges from the replacement of bushings, ensuring that the pumps are running to the highest possible efficiencies, to the final epoxy coating applied to the wetted parts that helps to extend the life of the metals that the coating protects. The current maintenance interval is a total recondition every eleven years. This scheduled interval results in a savings over time, as it costs substantially less money for a recondition as opposed to an emergency repair. Having this maintenance scheduled creates a more reliable system and ensures that the maximum number of pumps are in working order during the peak demand season. It also ensures that the pumps are running at the peak efficiency, saving money through reduced electric bills.
Electric Motor Maintenance Performing Electric Motor Maintenance is key to the longevity of the large motors that
drive the pumps in the distribution system. Heat, dust, and long running hours take a toll on motors. In order to extend the life of the motors and prevent catastrophic failures, they need to be taken out of service occasionally and reconditioned. This consists of disassembly, inspection, repair of worn parts, replacement of bearings, steam cleaning and a dip and bake. During the previous Five Year Plan, many motors were maintained leaving the District with a more reliable system than existed prior to the 5-Year Business Plan.

2013-2017 Business Plan & Budget | Page 26
The Influent Pump Station (IPS) requires similar maintenance of the motors and pumps. The required maintenance is similar to that of the potable water pumps, but differs in the interval that they must be maintained. Due to the harsh conditions that the pumps operate under, they must be reconditioned every five years.
The IPS is equipped with sewage grinders in the upstream portion of the station. The
grinders consist of a heavy duty screen and a hydraulically driven grinding section that shreds any debris that comes into contact with it. The most common items that get shredded are rags and clothing. Although rare, items such as two by fours and traffic cones have gone through the grinders. The grinders live in an extremely harsh environment and have a life of approximately one year and need to be reconditioned. The screen portion is reconditioned every three years. These systems are nearing the end of their life, and are planned to be replaced as the CIP budget permits.
Mechanical maintenance costs discussed above are listed in the following tables:
Potable Pumps Year 1 Year 2 Year 3 Year 4 Year 5 Total Pump & Motor
Maintenance $ 70,000 $ 110,000 $105,000 $ 70,000 $ 70,000 $ 425,000
IPS Maintenance Year 1 Year 2 Year 3 Year 4 Year 5 Total
Pump & Motor Maintenance $39,000 $56,500 $41,500 $44,000 $44,000 $225,000
2. Main Flushing Program The main flushing program has been established and data is being collected to find
“hot spots” that will require more frequent flushing. The flushing program is a task required by the California Department of Public Health (DPH), and the Operations Department ensures that high quality water is supplied to the District’s customers. The flushing program is labor intensive. This practice arouses the curiosity of customers and gives staff the opportunity to educate them on the steps the District takes to assure the delivery of high quality water. The necessary evil of this practice is that customers also see staff “running water down the street.” When customers are informed of the purpose, they usually understand the good that it brings. One issue that needs to be addressed with the flushing program is the need to repair or install flushing connections at the end of water mains. There is an ongoing effort by the construction crews to install flushing connections and repair the connections that are not working. Crews excavate and install the needed taps, valves and piping.
3. Fire Hydrant Maintenance Fire hydrant maintenance is currently being done, and every hydrant in the District has
been maintained at least once since the program started. The Operations Department has determined that after the initial maintenance was performed, the hydrants did not require annual maintenance. The hydrants are now spot checked to monitor their performance. Currently, the Operations Department plans to fully maintain every hydrant on a four-year rotation.
4. Valve Replacement Program Replacing dilapidated and non-operating valves is an essential element that makes it
possible to isolate portions of the system for emergency shutdowns and preventive maintenance. Deferment of this work makes future shutdowns more costly and requires shutting off water to a greater number of customers in repair or emergency situations.

2013-2017 Business Plan & Budget | Page 27
This program is vital to the operation of the distribution system and will ensure the reliable and efficient operation of the District’s water distribution system well into the future.
5. Supervisory Control And Data Acquisition (SCADA) Field Replacement Program The District’s RTU/SCADA upgrade is nearing completion. During the previous 5 Year
Plan, a SCADA Technician was hired to plan and construct a completely new SCADA system. Everything from the communications system to Programmable Logic Controllers (PLC) to the Human Machine Interface (HMI) systems are being replaced. The system should see substantial completion in year one of the new 5-Year Business Plan. Fine tuning of the system and some new features will be added to the SCADA system during the course of this plan. Some of the tasks ahead are listed below:
Operations’ SCADA Tasks: As-built drawings completed and sent to Engineering for District
documentation. Software documentation and comments completed, program changes addressed
and approved. Operator Instruction Manual completed, including screen captures with notes,
sequence of operations, printed and installed. Historian software installation. Any older cables not changed out due to part availability and time to replace
will be addressed and corrected, i.e. antenna cables, short analog cables, etc. PLC direct read of flow data and removal of Act-Paks from all sites. Generator inputs and outputs tested and programmed, including serial MODBUS
communications where needed. Final graphic changes based on operator’s needs. Work with Electricians through quarterly calibration of pressure transmitters to
verify PLC is calibrated to same readings of analog inputs. Spare parts analysis, purchase and storage for 5-year support. Final asset list of all parts and serial numbers delivered to Safety/Risk Manager. Work with One-Source/Rockwell for best pricing on a contract renewal (expires
6/2013). Update all Operations’ PLCs with current firmware. (Before 6/2013) Update all Factory Talk Software to latest version. (Before 6/2013) WRF SCADA Tasks: Evaluate all parts and operations of all PLCs and HMI for stability and
functionality. Replace graphic system of IPS with Factory Talk System. Replacement of Modbus + cards in PCs. Develop a sequence of operation for each PLC at WRF and IPS. Plan a replacement program of all Modicon PLCs. Update all Factory Talk Software to latest version. Complete drawings for IPS Replacement. Replace IPS Modicon PLC with A/B ControlLogix and re-write software. Start drawings for WRF replacement. Update all Factory Talk Software to latest version. (Before 6/2013) Replacement of all PLCs at the WRF.

2013-2017 Business Plan & Budget | Page 28
6. WRF Capital Equipment Replacement Program Time and a harsh environment have taken a toll on the Water Recycling Facility.
Equipment is reaching the end of its useful life and will need to be replaced. These replacements include blowers, mixers, flow meters, valves, pumps, air compressors and instrumentation to name a few. This equipment is crucial to the reliability and compliance of the treatment plant.
Year 1 Year 2 Year 3 Year 4 Year 5 Total
A/C Units $ 5,000 $ 5,000 $ 5,000 $ 15,000 Pumps 30,500 27,000 35,000 27,000 143,000 262,500 Filter Sand 35,000 35,000 35,000 35,000 140,000 Meters & Analyzers 26,000 25,000 11,000 12,000 6,000 80,000 Valves & Equipment 10,000 5,000 10,000 5,000 30,000 Rag Removal Belt 5,000 5,000 Chlorine Scrubber Rehabilitation 28,000 28,000
Mixers 5,000 10,000 5,000 5,000 13,500 38,500 SCADA System 44,500 8,400 8,400 51,500 24,500 137,300 Motors & Equipment 5,500 35,000 13,000 15,000 21,500 90,000 Plate Settlers 25,000 25,000 Solar Panel (Lake #7 Meter) 8,500 8,500
TOTAL $161,500 $145,400 $188,900 $150,500 $213,500 $859,800
7. WRF Capital Improvements
Several projects are proposed in order to improve the efficiency and reliability of the WRF. These projects include:
Replacing the Generator Transfer Switch. This switch is necessary to ensure that the generator power will be transferred during a power outage. The transfer switch was installed with the last upgrade in 1997 and has lasted far beyond the 10 year life expectancy.
Installing new valves at the WRF influent control area. These valves will enable the staff to properly control the flow into and around the rag removal system and influent flow meter.
Upgrading the BNR Diffuser panels. The current diffusers are original with the upgrade in 1997. They have far outlasted their useful life and will need to be replaced with modern and more efficient aerating panels.
Upgrading and replacing both the primary and secondary clarifier flights, gears, and bearing housings. The current equipment design is original with the plant from the early 1960’s and needs to be upgraded with modern and more reliable equipment.
Upgrading the valves and overflow system between the storage ponds. The current equipment is original with the plant from the early 1960’s and no

2013-2017 Business Plan & Budget | Page 29
longer functions as designed. This upgrade will optimize control and flow between the ponds and the lakes.
Upgrading the primary sedimentation tank covers. This upgrade will replace the original covers that were installed over the tanks in the early 1960’s. The new covers will improve odor control and reduce sulfide concentrations around the tanks. Controlling sulfides will also reduce the corrosion of equipment in the vicinity of the tanks.
Year 1 Year 2 Year 3 Year 4 Year 5 Total
Generator Transfer Switch $85,000 $85,000
WRF Influent Valves 100,000 100,000
Diffuser Panels 120,000 120,000
Primary Flights & Gear Replacement 100,000 100,000
Secondary Flights & Gear Replacement
100,000 100,000
Valves between the Oxidation Ponds
195,000 195,000
Primary Covers 100,000 100,000
Total $85,000 $100,000 $120,000 $100,000 $395,000 $800,000
8. Infrared Camera Monitoring of Electrical Equipment The practice of monitoring the electrical system is done on an annual basis, as it will
alert staff to potential costly problems before they occur. Some of our more critical systems have a more aggressive monitoring schedule. The electrical equipment at the various pump stations is very expensive to repair or replace and electrical failures can be detrimental on the ability to supply water to customers. The IR camera captures an infrared photograph of electrical equipment and will show hot spots (potential arcing points) that can then be addressed/repaired by electrical maintenance staff. As an example, prior to the District purchasing an IR camera and monitoring the electrical system, the use of this equipment would have discovered a problem with a motor contactor that cost the District over $32,000 to repair. This electrical breakdown was also compounded by the fact that these problems usually occur during the hot, peak demand time of year, hindering the ability to deliver water with one less pump available at the pump station. This equipment is used to monitor all of the pumping stations’ electrical systems, the WRF and sewer pumping stations. This tool is also used to monitor problems on an as needed basis where problems may be suspected. Prior to the purchase of the IR camera, a survey of only pump stations was done by an outside vendor at a cost of approximately $7,500.

2013-2017 Business Plan & Budget | Page 30
Planned Projects – Quarterly Goals
Contingencies Any plan which extends over a five-year period will need some flexibility. Therefore, resources include a contingency category to cover unknowns. These unknowns could include changes in regulatory requirements, unexpected system failures and reprioritization of planned replacements. In the past, operational budgets have been hit hard and have gone negative just months into a budget cycle due to unforeseen system failures and inadequate funding of line items. Summary The Operations Department is a 24-7-365 day operation. There are facilities that are operational 24-hours a day with complicated and expensive equipment in the delivery and collection of water/wastewater in the service of the District’s customers. The Operations staff currently does an excellent job operating and maintaining these facilities, and will continue this trend with this new Plan. It is a challenge to predict with nominal accuracy 1,825 days into the future what may happen operationally and financially in this period of time. The last Five Year Plan worked very well with management’s oversight and tracking on a monthly basis. The Operations Department is looking forward to this challenge once more.

2013-2017 Business Plan & Budget | Page 31
Chapter 5 – Capital Improvement Program
Introduction The Capital Improvement Program (CIP) is the foundation of the District’s long-range capital investment and financial planning. The development of a multi-year business plan and the separate but inter-related annual CIP update are integral to sound financial planning. The Plan establishes a specific list of projects to be completed for capital replacements and improvements, and preventive maintenance. The approval and funding of projects through the operating budget minimizes uncertainties in financial decision making and maximizes control over financial resources. Looking ahead through the CIP provides an opportunity to prioritize capital expenditures, manage cash flows, project reserve balances, and establish future revenue requirements that ultimately determine rates, fees and charges necessary to maintain the facilities for potable water, recycled water, wastewater collection and treatment and the Park. These facilities include:
580 miles of water, sewer, and recycled water mains 29 reservoirs 16 pump stations serving elevations ranging from 629 to 2,646 feet 13 pressure reducing stations Over 24,000 active service connections 3 chloramination stations 4 sewer lift stations 2 MGD Title 22 water recycling facility
The estimated replacement value for these facilities is approximately $800 million with an aggregate service life of 75 years. This service life is consistent with American Water Works Association (AWWA) documents for infrastructure installed post World War II. Prior to the 2008 Plan, the District was limited in its ability to replace infrastructure at an appropriate rate due to a lack of funding. With the 2008 Plan (2008-2012), the District was able to use a combination of systematic rate increases and debt service to fund some high priority CIP projects. However, due to the deep and prolonged recession and an unprecedented and prolonged drop in water sales the CIP was reduced to facilitate the District’s deficit elimination plan. As the District moves into the next multi-year business plan it is important that a reliable revenue stream is in place to fund strategic capital projects.
The Sobering Truth about Infrastructure More than a decade ago in its report “Dawn of the Replacement Era” the American Water Works Association (AWWA) announced that a new era was dawning: the replacement era, in which our nation would need to begin rebuilding the water and wastewater systems bequeathed to us by earlier generations. The report demonstrated that significant investments will be required in coming decades if we are to maintain the water and wastewater systems that are so essential to our way of life. The recently released AWWA report “Buried No Longer: Confronting America’s Water Infrastructure Challenge” is a call to action for utilities, consumers, and policy makers and recognizes that the need to replace pipe in the ground “puts a growing stress on communities that will continue to increase for decades to come.” Some of the key findings in “Buried No Longer” include:

2013-2017 Business Plan & Budget | Page 32
The needs are large - the cost of replacing pipes at the end of their useful lives will total more than $1 trillion nationwide between 2011 and 2035 and exceed $1.7 trillion by 2050.
There are important regional differences - the growing national needs affect different regions in different ways, with growth concerns greater in the South and West and replacement concerns greater in the Northeast and Midwest.
There are important differences based on system size - as with many other costs, small communities with fewer people to share in the costs face the biggest challenge.
The costs keep coming - infrastructure renewal investments are likely to be incurred each year over several decades. For that reason, many utilities may choose to finance infrastructure replacement on a "pay-as-you-go" basis rather than through debt financing.
Household water bills will go up - although water bills will vary by community size and geographic region, for some communities the infrastructure costs alone could triple the size of a typical family’s bill.
Postponing investment only makes the problem worse. Postponing infrastructure investment in the near-term raises overall costs and increases the likelihood of water main breaks and other infrastructure failures.
Status of Padre Dam's Infrastructure In Padre Dam's case, for nearly a decade prior to 2007, CIP investments were curtailed and many critical CIP projects and priorities were repeatedly deferred in order to defer rate impacts. For example, annual postponement of the required and Health Department mandated reservoir roof replacements ultimately resulted in the collapse of the West Victoria Reservoir Roof. Similar deferment of the replacement of aging infrastructure is now manifesting itself in the form of leaks in the Eastern Service Area (ESA) water transmission main (backbone system). Most of this system was installed just after World War II and is approaching 50-60 years in age. Beyond the costs required to repair these facilities is the impact to District customers who not only rely on, but demand, safe and reliable services. The approach changed for the better with the adoption and initiation of the 2008 Plan. That plan used a combination of systematic rate increases and debt service to fund some high priority CIP projects. It provided a reliable revenue stream and flexible budget to allow the District to begin replacing aging infrastructure. The 2008 Plan included an influx of $45M through the issuance of Certificates of Participation (COP) to fund essential capital projects. In essence this resulted in funding capital projects and maintenance that was deferred during the previous years where little to no rate increases were realized. Specifically, projects such as the ESA Secondary Connection and the Five Reservoir Retrofit Program were able to get started. Despite major unforeseen obstacles such as the deep and prolonged recession, unprecedented and prolonged drop in water sales, litigation associated with Native American Cultural Resources, and lower than planned rate increases, many high priority projects were accomplished due to the financial stability provided by the 2008 Plan (see Figures 1 & 2 below).

2013-2017 Business Plan & Budget | Page 33
Figure 1: Western Service Area Accomplishments

2013-2017 Business Plan & Budget | Page 34
Figure 2: Eastern Service Area Accomplishments

2013-2017 Business Plan & Budget | Page 35
Looking ahead to the next five years and beyond, the remaining balance of the COP should be spent within two years. At that time, the CIP will revert back to pay-go funding for all its projects – high priority planned projects, low priority but mandated compliance projects, recurring capital projects, and the urgent unplanned projects. Pay-go funding will also be used to fund capitalized operations, projects mandated by external agencies, and a portion of the debt issued in 2009. With respect to pay-go funding the question becomes: will we revert back to pre-2007 and eliminate or minimize potential rate increases to customers by delaying new facilities, additional maintenance, and critical programs or does the District move in a direction that will allow us to invest in our infrastructure and maintain the systems that are so essential to the communities that we serve? As we move into a new multi-year business plan one of the goals must be to develop long term sustainable capital improvement/investment strategies and funding plan. Understanding we cannot change the current funding situation overnight, we must take the approach that we will bridge the gap over the next five years. This approach, however, does not come without its own challenges. Along the way, there is no doubt that critical capital projects will continue to get “pushed” to future years and inflationary forces will continue to erode the buying power as these projects are deferred.
Overview of the Proposed 5 Year CIP The long term goal is for strategy to drive the CIP funding. However, for the next five years and possibly beyond, available funding will dictate the CIP strategy as the District recovers from the drought and the recession. In order to fund high priority projects and maintain adequate service levels without undue burden on the rates, CIP over the next five years is designed to meet the following guidelines:
The average CIP funding from rates will increase to approximately $8M per year over the next five years with a year 5 funding value of $10M (including inflation). The replacement value of the District’s existing facilities, if everything were to be replaced today, is approximately $800M. Investing $10M/year would replace the system every 80 years. The average end of useful life for water industry facilities is approximately 75 years (AWWA).
Assume minimal revenues from capacity fees due to slower economic recovery and reduced growth. The CEF portion of CIP projects would be drawn primarily from existing CEF reserves, which are approximately $7M.
The total CRF to be spent over the next 5 years is approximately $40M. The total CEF to be spent over the next 5 years is approximately $8M. The remaining balance in the COP will be used to complete the emergency
generator projects, the West Victoria Reservoir Retrofit, Sunrise Reservoir site improvements, and a majority of the ESA Secondary Connection project.

2013-2017 Business Plan & Budget | Page 36
Potential Challenges In addition to the above funding guidelines, there are outside forces and issues that directly affect the CIP and associated projects often forcing staff to re-prioritize and push projects into the future. Oftentimes these issues add significant costs that negatively impact the cost-benefit ratio of a project. Issues that are anticipated to impact or continue to impact the District’s CIP include the following:
Litigation associated with Native American Sacred Sites: this has reduced available funds and directly delayed the construction of the two most critical projects identified in the 2008 Plan: ESA Secondary Connection and Blossom Valley Reservoir Roof Replacement.
Dramatic (>30 percent) decrease in water sales: due to extraordinary conservation and the poor economy, revenue has been reduced and forced the District to spend down its reserves and reduce its CIP spending.
Drastic reduction in regional water supply: Padre Dam imports 100 percent of its potable water from the San Diego County Water Authority. In the last two years, water supply to the region has been drastically reduced due to drought and environmental issues affecting the Bay Delta. The State has also mandated that local water districts reduce their water consumption 20 percent by 2020.
Economic Downturn: development has greatly slowed, resulting in less than anticipated income from capacity fees. Capacity fees fund both the Capital Replacement Fund (CRF) through the “buy-in” portion of the fee and the Capital Expansion Fund (CEF).
External agency costs: District resources are often required to spend time and money on non-district, external agency projects because of jurisdictional and compliance constraints. Currently, the District’s CIP absorbs these costs and impacts the rate portion of the funding which in turn negatively impacts the District’s internal CIP budget and spending levels.
Increased project soft costs: current observations indicate an increased percentage in costs associated with environmental compliance. Compared to 2001 when the last Integrated Facilities Plan was completed, costs are up an additional 7percent.
Ongoing and prolonged State budget crisis: previously the State has taken property taxes from local agencies to cover its obligations. Any future similar action would negatively impact the District’s water fund.
In addition to issues listed above and the economic realities challenging local governments and utility managers, the list of regulatory requirements continues to grow. The onslaught of unfunded mandates forces Padre Dam to defer necessary operation and maintenance costs or non-regulatory, but planned, priorities until mandated work is completed. Many of these mandates force utilities to invest in costly infrastructure solutions that require significant rate increases on already financially strapped citizenry or take on added debt loads that are not sustainable for a community. Public agencies like Padre Dam continue to reduce or eliminate services and postpone or cancel critical infrastructure projects. Each of the issues above presents its own challenges, but the common denominator for all of these is appropriate and sustainable funding will provide staff the flexibility to adjust priorities and also allow staff to move projects forward in spite of these factors that negatively impact the CIP.

2013-2017 Business Plan & Budget | Page 37
CIP Funding Plan Overall objectives of the CIP include:
1) Appropriate replacement of aging and at-capacity sewer and water facilities including condition assessment;
2) Ensuring safe and reliable water and sewer facilities; 3) Compliance with regulatory mandates.
Furthermore, in response to the devastating Cedar Fire of 2003, the District adopted the following additional strategic objectives to ensure safety and reliability to its customers:
Construction of a redundant transmission system through the Eastern Service Area including pipelines, reservoirs and pump stations;
Backup emergency generators at all pump stations; Two reservoirs for every pressure zone to ensure storage reliability throughout the
District; Pump stations sized to supply fire flow.
Additional priorities include condition assessment of all facilities, replacement of outdated hardware and software systems, and ongoing capitalized operations projects. By the end of the Plan, the projects shown below in Table 1 are anticipated to be completed assuming there are no major unforeseen challenges or funding issues. Table 1: Projects Anticipated to be Completed
Project Name Estimated Completion ESA Secondary Connection 2015 5 Reservoirs Retrofit, Phase 3 (West Victoria Reservoir and Pump Station)
2013
Customer Service Center, Phase 2 – Operations Yard 2014 Flinn Springs Standby Generator 2013 Rios Canyon Standby Generator 2013 District Wide Computer Systems Upgrade 2014 Rios Canyon Pipeline Rehabilitation/Replacement 2014 Braverman Sewer Rehabilitation, Phase 2 2014 Sewer Diversion Structure Upgrades 2016 Asset Management System / CMMS 2017 Capitalized Operations Projects Ongoing Annual Steel Pipe Condition Assessment Ongoing Annual Almost every District project is funded either from the Capital Replacement Fund (CRF), the Capital Expansion Fund (CEF) or a combination of the two. The CRF is funded by rates charged to existing customers and by a portion of capacity fees paid by developers. CRF funds may only be used to benefit existing customers. The CEF is funded by the remaining portion of developer-paid capacity fees and can only be used to fund projects required by growth. Even when projects are funded with debt, the debt service is paid out of one or these two funds. Park projects are funded by revenue generated from user fees of park facilities and events, grants and donations. It is important to understand that even though projects are typically funded by a combination of CRF and CEF, both funds are essentially restricted and cannot be used to

2013-2017 Business Plan & Budget | Page 38
supplement shortages in either fund balance. Great care is taken to assure that ratepayers are not funding developer projects and vice versa. Total projected expenditures are anticipated to be approximately $72 million for the next five years. With $4.5 million of debt service allocated for automatic meter infrastructure (AMI) and the 2009 COP, total project costs are projected to be $68 million over the five year period, of which $41 million is required from CRF, $8 million from CEF and the remaining from unspent COP proceeds and grants. A summary of the projected annual expenditures and sources of funding is provided in the table below.
Table 2: Summary of Expenditures and Funding Sources

2013-2017 Business Plan & Budget | Page 39
Figures 3 and 4 summarize CIP expenditures in the proposed Plan by project type and facility type. A detailed list of all projects and annual expenditures is shown in the Appendices.
Figure 3: Five Year CIP by Project Type (millions)
Figure 4: Five Year CIP by Facility Type (millions)

2013-2017 Business Plan & Budget | Page 40
Summary In summary, the proposed CIP budget is structured to bridge the short term funding gap without undue burden to the ratepayers while positioning the District to have a long term and sustainable replacement plan. As is relates to the newly adopted 2012 Strategic Plan, the proposed CIP would facilitate multiple key success measures contained in Goal One – Provide Safe and Reliable Water, Recycled Water, and Sewer Services. In order to achieve the objectives of Goal Four of increasing water, sewer, and energy independence additional funding is required above and beyond the budget presented above. Furthermore, it would be necessary for the District to develop strategic partnerships to solve these regional issues. With the continual uncertainties associated with regional water supply and sewer treatment, it is envisioned that these goals will be tackled in a subsequent multi-year business plan.

2013-2017 Business Plan & Budget | Page 41
Chapter 6 – Information Technology
Introduction The goal of the Information Systems (IS) team is to provide information technology infrastructure, solutions and services that support the mission, vision and values of Padre Dam.
To meet this goal during the Plan, IS has developed the following objectives:
Develop and maintain an IS team that is technically and functionally competent to respond to technological requirements.
Develop and maintain an effective data and telecommunications network throughout District locations.
Provide an adequate and reliable technology base to support current and future technology needs.
Process IS requests in a timely, accurate and efficient manner. Provide end users simple and secure access to District information.
Core Information Services
IS maintains a network, server, computing and domain environment that provides infrastructure for the following services and resources:
Electronic file storage and document management E-mail Phone systems Mobile phones Databases Remote access Customer and utility billing system Financial information systems Engineering applications Desktop applications Internet access Printing Faxing Point of sale SCADA applications Site access and video security
If any of the above systems fail, one or more departments can be adversely affected resulting in productivity interruption.

2013-2017 Business Plan & Budget | Page 42
The Next Five Years The Plan sustains the core infrastructure of the District as well as invests in expanded service and new technology. Project initiatives over the next five years include the following:
Maintain network, server, computing and domain environment - “keeping the
lights on” Develop a technology strategic plan Prepare infrastructure for new CIS/FHRIS/EDMS software implementations SharePoint development as an enhancement to the new CIS/FHRIS/EDMS
software packages Increase “mobility” support Implementation of virtual desktop technology Supplement IS staffing with contracted support Phone system replacement Data backup and recovery improvements Disaster recovery and business continuity improvements Implementation of Wireless Local Area Network
Strategic Technology Plan Information technology will play a vital role for Padre Dam over the next five years and beyond. Because technology is evolving at such a rapid pace, many of the goals identified in the 2008 Plan are now either obsolete or no longer desired by the District. In addition to the initiatives listed above, IS will be identifying other projects to assist staff and improve the District’s business processes. A complete impartial review of our current technologies is needed to help align our technology infrastructure with the District’s strategic goals. The result will be a new Strategic Technology Plan that will guide the District into the future. Metrics for the review should include:
Current information systems strengths and weaknesses How IS strategies are aligned to district strategies Current procedures and policies for using technology How district staff use technology How well does IS meet the needs of the district Availability of technology to staff Effectiveness of current infrastructure and telecommunications systems
CIS/FHRIS/EDMS Software Implementations One of the biggest impacts to the IS staff will be the implementation of the new CIS/FHRIS/EDMS software packages. IS’s role will be to ensure the infrastructure is in place and ready to support the new software packages. To accomplish this, IS will leverage the flexibility of our virtualized environment and scale out the core systems as necessary to support the new systems. This will involve standardizing on Microsoft SQL Server for the District’s database needs, adding additional data storage capacity and ensuring these systems are redundant and secure. The new software packages can be implemented with virtual servers that can be provisioned within the virtual environment reducing the need for additional server hardware.

2013-2017 Business Plan & Budget | Page 43
Mobility Mobility will be a key factor for this Plan. Expanded support for mobile devices is needed as personnel demand to stay connected to their resources. IS will implement generic systems that will be able to support multiple devices from multiple vendors. Examples include:
Apple devices – iPhones and iPads Android devices – Droid phones and tablets Microsoft devices - Laptops, phones, and tablets
Network modifications will be needed to support this array of equipment, specifically with the implementation of a secure wireless local area network (WLAN). Providing the end user with a consistent user interface no matter what computer, laptop, or tablet is used is a goal of virtual desktop technology.
Phone system replacement: The current digital/IP hybrid phone system is due for replacement. A full voice over internet protocol (VOIP) phone system will be specified to replace the current system. A VOIP system will provide added flexibility and features not available currently. Features include unified communications, contact center, IM, phone/desktop interfaces and video.
Staffing IS staffing needs will remain the same until the new software is implemented. Post implementation, the skill set requirements needed to support CIS and FHRIS may shift. Reliance on programming skill sets will be reduced. SQL database query and report writing skills will be needed to support the new software. Ensuring that all District data is available for analysis and review will be key. Current core system staff levels can remain the same. If additional skill sets or support hours are needed, IS staff can be supplemented utilizing readily available IS contract services.
Expenses Related to Initiatives Incremental Expenses
WLAN - $17,000 initial cost in Year 3 Backup and Recovery - $40,000 initial cost in Year 3 Strategic Technology Plan - $40,000 in Year 3 Helpdesk contract - $1,200 per month Mobility Support - $4,000 in Year 1 System Upgrade Services - $25,000 in Year 5 New software maintenance – EDMS, CIS, FHRIS- $500K for 5 years. (JDE
maintenance remains in Years 1-2 at $100,000) Network Switches - $42,000 in Year 5

2013-2017 Business Plan & Budget | Page 44
Capital Equipment requests
Storage Area Network (SAN) expansion - $15,000-$50,000 in Year 1 Phone system replacement - $44,000-$110,000 in Year 2 VMware host replacements - $31,000 in Year 5 Backup tape library/loader - $11,000 in Year 2 Data backup and recovery improvement - $40,000 in Year 3 Computer Equipment - $40,000 per year
Technological Unknowns The 2008 Plan contained a paragraph on “future vision” which identified projects such as automated meter reading (AMR), online bill payments and computerized maintenance and management (CMMS). This “future vision” was based on things we already knew about and wanted to implement within the five year period. What it did not contain, obviously, were the things that were unknown. Technological advances are still being developed at a rapid pace. At the beginning of the 2008 Plan, technology such as server virtualization was still in its infancy. We did not know what “virtualization” was or what the technology could do for the District. We did not know what IPADs were until the first one was released in April 2010. Dramatic technical changes will continue. This means that the IS plan and budget needs to be flexible to respond to this rapid development. This flexibility will allow the District to implement new technology as it becomes available and proves beneficial.

2013-2017 Business Plan & Budget | Page 45
Chapter 7 - Employee Retention, Recruitment and Succession Planning in a Changing World “Change is inevitable.” (Anonymous) “When you're finished changing, you're finished.” (Benjamin Franklin) “It is not the strongest of the species that survives, nor the most intelligent. It is the one that is the most adaptable to change.” (Charles Darwin) “Change is the only constant” (Proverbs) “To change is difficult. Not to change is fatal.” (Anonymous) Except for the word “change,” all other things in this world are subject to change. It is an inseparable part of life. Some changes bring progress while some do not but there is no power that can stop the process of changing. Wise people make the best use of change and take it as an opportunity while the rest stare helplessly at the change taking place. As Winston Churchill pointed out, if one wants to attain perfection, he or she has to change very often, which is an inevitable part of life and if you fail to change yourself, and remain stubborn in the past, you will not be a part of future. Change is inevitable, change brings about a change in life, and change should be welcomed and cherished and not despised. Life is constantly changing and all things are subject to change. Sometimes change is essential to progress in life, while in other situations, the opposite is true and the change is not beneficial. Seeing change as an opportunity is an important first step in moving toward a better future. CHANGE. If anything describes the past two years and the next five years, that one word says it all -- Change. In looking to the future, it is important that Padre Dam create an environment that can be flexible and change with the world around us. In the previous Five Year Plan, the issues that Padre Dam faced in the area of personnel/human resources were:
Attracting and retaining skilled employees Compensation that allows Padre Dam the flexibility to attract and retain skilled
employees Benefits – what the changing workforce will be looking for rather than what is
traditionally offered Employee development
Those are the same issues that Padre Dam faces in the next five years, combined with the challenge created by two dramatic shifts:
Changing Demographics Changing Economy
Thus, the issues Padre Dam faces during the next five years can be expressed as:
Attracting and retaining skilled employees in the face of changing demographics
Compensation that allows Padre Dam the flexibility to attract and retain skilled employees in response to a changing economy

2013-2017 Business Plan & Budget | Page 46
Benefits – what the changing workforce will be looking for rather than what is traditionally offered and what is sustainable during a changing economy
Employee development in light of anticipated changes in staffing In 2007, we reported that population trends and job creation projections pointed to a continued shortage of qualified workers, a decrease in available workers and an increase in jobs through 2011. Those projections indicated a 12.6 percent decrease in the labor force between 1988 and 2008 and a 12.5 percent increase in the over-40 age group during the same period. The projected decrease in the work force was attributed to two points: (1) Baby Boomers hitting retirement age (the oldest baby boomer turned 60 in 2006) and (2) After the baby boom, the birth rate dropped sharply. This “baby bust” has resulted in a shortage of entry-level workers in the latter 1990s which will lead to similar shortages in mid-level and executive employees. Today we know that in 2011, the first Baby Boomers turned 65 and many retired from the workplace. The retirements of Baby Boomers were delayed due to the recession of 2008, however, it appears that Boomers have weathered the recession and are now able to stop working. Interesting to note that these individuals consider themselves healthy, thus health was not a reason for retirement. In addition, an overwhelming number of Baby Boomers like retirement, some like it a lot. While the retirements of Baby Boomers were slightly delayed, between 2008 and 2009, the United States hit a 20 year low in job gains and high in job losses. In 2007 we were predicting a drop in available applicants; in reality the opposite occurred. At the same time, the country faced “The Great Recession of 2008”. Unemployment climbed from 4 percent in 2006 to 10 percent by the end of 2011. Foreclosures doubled between 2007 and 2008 and only recently have stabilized back to the 2007 levels. What impact does this have on staffing levels? We are predicting that within the next five years, 27 employees will retire from Padre Dam. Due to the high unemployment rates, we believe the outside applicant pool will remain robust and there will be significant competition with our staff for future openings. However, Padre Dam remains committed to preparing our employees for future openings. In the current Strategic Plan, two of the initiatives under the goal of “Maintain Workforce Excellence” address this commitment. One more initiative addresses attracting the best applicants for our openings. 5.1 Develop and Train our Future Leaders 5.2 Aggressive Succession Plan 5.6 Recruit and Retain The activities that Padre Dam has pledged to engage in to attain these initiatives include:
Create a list of competencies required for promotional opportunities Define “leader” with list of competencies Create a list of key trainings for employee development Create Padre Dam University with classes needed for various competencies Publish potential retirements by title and timing Identify potential replacements and cross-train them for future openings Encourage informational interviewing and job shadowing to help employees
identify career path choices Get involved in the community to develop an interest in future careers at
Padre Dam

2013-2017 Business Plan & Budget | Page 47
Regularly review compensation package for competitiveness Regularly review benefits package for sustainability Advertise and market Workforce Partnership in discussing careers at Padre Dam Attend Career Fairs
Padre Dam believes in the concept of “Total Rewards.” WorldatWork, the leading association for compensation and benefits defines “Total Rewards” as follows: There are five elements of total rewards, each of which includes programs, practices, elements and dimensions that collectively define an organization’s strategy to attract, motivate and retain employees. These elements are: Compensation, Benefits, Work-Life, Performance and Recognition and Development and Career Opportunities. These elements are included within the Strategic Plan as listed above. (See Padre Dam’s Strategic Plan 2012-2022 for more detailed information.) Since the number of potential job candidates is shrinking with the Baby Boomers retirement, it is imperative to identify the skills needed to move Padre Dam forward. A 2012 survey done by the Society for Human Resource Management indicates what are believed to be the greatest basic skills and applied skills gaps between workers ages 31 and younger compared with workers ages 50 and older. The survey found that for basic skills, older workers have stronger writing, grammar and spelling skills in English. The survey further found that for applied skills, older workers exhibit stronger professionalism/work ethic. Thus when Padre Dam is looking at the various trainings listed above, it is important to identify the gaps in basic and applied skills that exist in our organization and to offer training to address those gaps. After Padre Dam has spent exhaustive time and money to cross-train and prepare our staff for future advancement, it is important that we retain those individuals and that they not feel the need to move to another organization. Likewise, after time and effort has been put into hiring what we believe to be the most qualified and competent employees, we want a return on our investment by having a long-term, productive employee. How do we achieve that retention? We believe that our Workforce Partnership is key to this retention and that our Strategic Plan specifically addresses how we go about creating the type of culture where people want to come to work. A recent article on the Top Ten Ways to Retain Your Great Employees describes the top ten retention tips. We believe this is what our Workforce Partnership and Strategic Plan attempts to achieve here at Padre Dam. The list of the top ten ways to retain great employees is:
1. A satisfied employee knows clearly what is expected from him/her every day at work.
2. The quality of the supervision an employee receives is critical to employee retention.
3. The ability of the employee to speak his or her mind freely within the organization.
4. Talent and skill utilization is an environmental factor key employees seek in the workplace.
5. The perception of fairness and equitable treatment is important in employee retention.
6. Tools, time and training to do their job well. 7. The best employees seek frequent opportunities to learn and grow in their
careers, knowledge and skill. 8. Employees feel that senior management know they exist. 9. Regardless of the circumstances, employees do not feel that their job or
income is threatened. 10. Employees feel rewarded, recognized and appreciated.

2013-2017 Business Plan & Budget | Page 48
References “Transitioning Into Retirement: The MetLife Study of Baby Boomers at 65”, April 2012 “Contrary to Predictions, Boomers are Retiring,” WorldAtWork, April 5, 2012 “California Foreclosure Statistics,” Default Research, Inc., April 2012 “Gross Job Gains and Losses, Third Quarter 2011,” The Editor’s Desk, U.S. Bureau of Labor Statistics, May 2, 2012 “What is Total Rewards?” WorldAtWork “Organizations Concerned About Boomer Retirements, Skills Gap,” WorldAtWork, April 10, 2012 “Top Ten Ways to Retain Your Great Employees” by Susan M. Heathfield, About.com Human Resources

2013-2017 Business Plan & Budget | Page 49
Chapter 8 – Cost Control Measures
Introduction Padre Dam practices an everyday commitment to working efficiently and reducing costs in every way possible while continuing our dedication to superior customer service and infrastructure investment. We believe rate increases can only be justified if we are doing our part and continuously looking for operational efficiencies. We have implemented several cost-cutting elements that have reduced overall operational expenses by $13 million since 2006.
Deficit Elimination Plan
Padre Dam developed a Deficit Elimination Plan in 2011 in response to a 34 percent loss in water sales compared to budget. Padre Dam’s gross revenue has been reduced by $28 million over the past five years compared to budget. The two driving factors behind this shift include extraordinary water conservation and the poor economy. The loss of revenue resulted in a $1.9 million net loss for the Retail Water Operation in FY 11 and a budgeted $1.0 million new loss in FY 12, reducing the retail water fund balance to below what had been projected in the 2008 Plan. The District was faced with two choices. One was to ask our ratepayers to pick up the bill in the form of water rate increases used specifically for the removal of the deficit. The second choice was to cut costs from our operating budget and reduce staff. The District made the difficult choice to cut the budget and reduce its workforce. The Deficit Elimination Plan was developed and helped Padre Dam work towards the ‘new normal’. Water sales are expected to remain low from changed behavior and legislation requiring lower use. Over 80 percent of customers have said they will not return to prior water use levels. The Deficit Elimination Plan assisted Padre Dam in achieving financial stability for the District while remaining true to our values and providing quality service to our customers. Key elements of the Deficit Elimination Plan include:
19 percent workforce reduction (26 positions) $270,000 in capital equipment deferral $12.6 million in capital improvement deferral (13 projects) $1.2 million in operating expense reductions Water rate adjustment in the FY 13-17 Business Plan
Employee Cost Savings
Padre Dam employees recognize the need for the District to keep costs as low as possible. As proof of their understanding our employees opened their prior contract with the District in the middle of the term and agreed to reduce their retirement benefits. When the time came to negotiate a new Memorandum of Understanding (MOU) with the District in 2012 our employees made several changes that will help Padre Dam save money. Highlights of the MOU cost saving initiatives include:

2013-2017 Business Plan & Budget | Page 50
All District employees will pay the entire eight percent of the CalPERS contribution, by 2014. This will save the District approximately $750,000 annually. Newly hired employees will pay the full eight percent immediately.
District employees will pay 10 percent of their dependent healthcare coverage beginning in 2015. Previously, employees did not contribute to healthcare coverage. Newly hired employees will pay ten percent of their dependent healthcare coverage immediately.
Elimination of sick leave payout at resignation.
Reduction in the bottom end of the salary structure by 10 percent for
all positions.
No guaranteed cost of living adjustments (COLA). Any COLA will be based on the San Diego Consumer Price Index with a cap. It also includes triggers to eliminate COLA adjustments during periods of financial difficulty.
In addition, management will continue to look for operational savings through restructuring and cross training whenever possible. The Plan contemplates a reduction of 5 FTEs over the next five years through attrition.
Prior Cost Control Measures
Cost cutting is not new to Padre Dam. Staff has been diligent in their efforts to provide customers with exceptional services at the lowest possible price. The District has embarked on several expense reduction initiatives in the past including the “Competitive Challenge” from 1999-2005; and “Cost Containment” during FY 07. Both initiatives were extremely successful saving ratepayers an estimated $12.8 million dollars. Through active management and operating efficiencies, staff saved an additional $10.7 million during the 2008 Plan. Eliminated costs were accomplished through a number of cost saving measures including:
SALARIES AND BENEFITS - $6.4 MILLION SAVINGS • Delayed hirings • Reduced staffing levels • Reduction in Management Team salaries • Addition of second PERS tier for new hires • Cross training • More favorable insurance premiums • Increasing co-pays • Requiring employees to pay more for higher cost insurance • Positive Worker’s Compensation experience & rates • Limiting merit increases • Use of part-time & temp employees

2013-2017 Business Plan & Budget | Page 51
OTHER COST SAVING MEASURES - $4.3 MILLION SAVINGS • Delaying capital equipment purchases • Foregoing budgeted equipment • Internally developed equipment vs. expensive alternative • Utilize staff for CIP projects versus outsourcing • Maximizing incentive points to reduce insurance costs • Actively managing material and supply inventories • Lower bids on job estimates and capital replacements • Lower than anticipated fuel costs • Maximizing vendor discounts • Negotiating reductions for contracts
The following chart shows the annual savings achieved by staff during the last Five Year Business Plan and Budget.
Conclusion
Padre Dam has a long history of providing exceptional service to our customers and creating an outstanding environment for our employees to succeed and thrive. Our goal over the course of the new Plan is to continue to look for efficiencies and ways to cut costs. We believe technology will play a significant role in managing our workflow, improving data access and increasing operating efficiencies. Organizational restructuring will continue to be evaluated at every opportunity.

2013-2017 Business Plan & Budget | Page 52
Chapter 9 – Increased Customer Service and Focus Padre Dam is committed to superior customer service. During the next five years, the District plans to increase services to customers while improving efficiencies by focusing on the following 4 goals: CIS Software Implementation, Monthly Billing, Hosted Interactive Voice Response (“IVR”) Implementation and Proactive Customer Communications.
Customer Service Team The Customer Service Team (CST) is the primary point of contact for customers in the Padre Dam Municipal Water District. The CST is responsible for serving each and every customer in a caring and gracious manner while providing timely, efficient, and cost effective support. Operating under the Finance Department, Customer Service provides information to customers impacted by various District activities; maintains account updates; processes billing and collections; tracks installations, handles prepaid capacity and daily receipts; balances billing and cash receipts; provides statistical reporting; educates customers regarding water use, conservation, rates and services; handles general lobby and internet traffic, district phones and mail distribution.
CIS Software Implementation Efficiency is a high priority for the District as staff continually seeks new ways to reduce cost, streamline workflow processes, improve customer service and ensure accuracy. One way to accomplish these priorities is to take advantage of proven new technologies. The District currently utilizes a “home grown” utility billing system. However, since that time, there have been significant improvements in utility billing technology. This software replacement project is necessary to improve mission-critical, day-to-day utility billing services and ensure these services are provided in an efficient, reliable and cost effective manner. The new software will be much more intuitive and user friendly, significantly decreasing the amount of training and start-up time necessary for new hires. It will also reduce repetitive tasks, increase efficiency and enhance customer service. Several manual processes including e-mails and letters to customers, service orders, financial transactions, reporting, reconciliations, etc. will be automated through workflows and system improvements. TARGETS for CIS Software Implementation
Automation of bill cycle process Connect cash register process to system data bases Streamline multi-departmental new-service process Simplify rate and billing methodology Simplify and automate bad debt, credit risk and collection process Incorporate mobile functionality for service orders Reduce staff training time and eliminate workforce fragmentation

2013-2017 Business Plan & Budget | Page 53
Monthly Billing District customers have expressed a desire for monthly billing in order to better manage their household budgets. The new CIS software will allow the CST to transition to monthly billing. TARGETS for CIS Monthly Billing
Better alignment with other bill schedules A more timely account of water use, allowing customers to make adjustments as
needed to avoid higher water bills, especially during the summer The ability to discover service line, plumbing or irrigation system leaks sooner,
allowing for prompt repairs and reducing the magnitude of a high bill caused by leaks
IVR Implementation The District receives requests to make credit card payments for water and sewer bills over the telephone. As would be expected, the number of requests increases closer to payment due dates. On the last day to pay, before penalties are assessed and on water shutoff days, these calls increase so much that telephone lines get backed up and multiple staff are needed to handle the volume. A hosted IVR system that accepts credit card payments over the phone 24/7 would offer customers another way to pay their utility bills and would free up staff to answer other customer calls and perform their essential job duties. TARGETS for Hosted IVR Implementation
Process integration, training, telecommunications, security, licensing, and 24/7 live customer support.
A hosted platform permitting outbound automated use of IVR technology, whereby the District may send automated outbound messages to customers for payment reminders, High Usage Notifications (HUNs), service outage information or emergency messaging.
Meet the District’s PCI compliance requirements at PCI Level One certified. The IVR will be a completely automated service that that can be provided in both
English and Spanish. The hosted system will integrate with the District’s online credit card payment
process and provide financing with same-day credit card processing reconciliation.
Proactive Customer Communications Prior to 2011, the District gathered water consumption data manually. Excessive system gaps, paper tracking, high billing exceptions, manual processes, and increased staffing requirements drove up costs and frustrated customers. In response, the District purchased an Advanced Meter Infrastructure (“AMI”) system to provide better customer service and obtain more timely and accurate billing data. Because of AMI, the District is now able to provide its customers with access to current, on-line consumption data. AMI also gives the CST more timely, useful and accurate data to help answer customer inquiries. The final

2013-2017 Business Plan & Budget | Page 54
piece of the District vision for the AMI system is the implementation of a High Usage Notification process. This process will trigger an alert when average daily water use over a specified time exceeds the annual daily average usage by a certain percentage or ratio. Another customer-centric goal is to create and provide an on-line editable and cost effective “New Customer Welcome Kit”. Through research into private enterprises with a similar concept, the CST will be able to provide important and timely information to all new customers without incurring printing and mailing costs. Additionally, as part of the new CIS software integration plan, a workflow that includes automated telephone alerts will be implemented through an IVR system prior to customer shut off. TARGETS for Customer Communications
High Usage Alerts Web Welcome Kit IVR Automated Shut Off Notifications

2013-2017 Business Plan & Budget | Page 55
Chapter 10 – Department Support Plans
Administration
Mission Under the policy direction of the Board of Directors, the CEO/General Manager is responsible for leading, directing and managing Padre Dam’s operations of providing water, recycled water, recreational services, and wastewater management to its customers. The Administration Department serves multiple functions consisting of the Board of Directors, CEO/General Manager, Board Secretary, a part-time Administrative Assistant, Communications Officer, and Legal Counsel. The five-member elected Board of Directors is responsible for ensuring the District is well managed and responsive to the interests of its customers, to safeguard the assets of the District and to determine the objectives and policies of the District. The CEO/General Manager manages the day-to-day operations of the District and the Department provides policy, administrative and staff support for successful implementation of programs and projects necessary to achieve operational performance, capital replacements and preventive maintenance in accordance with District policy to the benefit of our customers. The Board of Directors, CEO/General Manager, Operating Managers and employees are all subject to a formally adopted Code of Ethics and Ethical Behavior which guides them in making appropriate choices in safeguarding the District’s assets and promoting a positive public reputation for Padre Dam. They are also guided by the following five values adopted by the workforce partnership:

2013-2017 Business Plan & Budget | Page 56
> Trust > Integrity > Competence > Accountability > Service
Methodology The CEO/General Manager is responsible for directing and reviewing the preparation of the District’s budget, including preventive maintenance and capital replacements. Operating in a highly regulated industry with strict public health and safety requirements, the CEO/General Manager supervises the work of the “Management Team” in successfully meeting the needs of District customers while implementing Board policies. The CEO/General Manager is responsible for implementing policies and directives of the board, managing resources in an environmentally responsive manner, leading long range and strategic planning activities, facilities planning, establishing high priority goals and objectives, monitoring employee relations, and advising the Board of Directors on major issues. The CEO/General Manager serves on the Employee Involvement Team of the Workforce Partnership which is a collaborative decision-making process at the staff level. The CEO/General Manager also participates in inter-governmental and lobbying activities and is responsible for the enforcement of District Rules & Regulations, Standard Practices and Policies, the Memoranda of Understanding with the Employees’ Associations, and the enforcement of contracts and other legal obligations. The CEO/General Manager and Board Secretary facilitate governance and decision making by the five-member elected Board of Directors. Procedures and programs in support of the governance of the District are developed to implement Board policies and directives. The Board Secretary and Administrative Assistant provide direct support to the Board of Directors in developing Board and Committee agendas and minutes, coordinating meetings and travel arrangements, and other statutory duties including Conflict of Interest filings and publication of required legal notices. Support is also provided to the Management Team and other departments to ensure a cohesive organization responsible for carrying out Board policies. The Communications Officer builds customer awareness, trust and support by providing continuous information to customers regarding Padre Dam’s mission, objectives and performance. Communications provides support to the Board, General Manager and all other departments.
Projects The primary goal of the Administration Department will be to implement the Board approved Five Year Business Plan and Budget for 2013-2017. This Plan will continue to ensure high caliber customer service of potable and recycled water, wastewater management, and recreational services well into the future. The Plan creates a process designed to control spending while still providing for needed infrastructure maintenance and replacement, and promotes operational efficiencies to control customer rates. While customer rates may be higher, customers will get their money’s worth in system reliability of water, sewer, recycled water and recreation services. The saying, “You get what you pay for” applies to water and sewer agencies. Agencies that defer infrastructure maintenance and replacement face water and sewer line breaks, customer outages and health department fines. While flat rates are temporarily nice for customers, future rate spikes, water breaks, and fines end up being more significant than reasonable rate ramps.

2013-2017 Business Plan & Budget | Page 57
Resource Plan The total budget for the next five years beginning in FY 13 follows:
FY 13 $1,408,322 FY 14 $1,447,581 FY 15 $1,507,983 FY 16 $1,546,108 FY 17 $1,657,626
This compares to $1,536,844 forecasted for FY 12. The schedule below provides estimated spending by category over the next five years. Staffing: Current staffing levels will be maintained over the next five years. Budget:
FY 12 Forecast*
FY 13 Budget
FY 14 Budget
FY 15 Budget
FY 16 Budget
FY 17 Budget
FTEs** 8.8 8.8 8.8 8.8 8.8 8.8
Salary & Wages $652,055 $515,333 $543,425 $565,514 $588,417 $612,299
Employee Benefits 383,686 334,746 344,723 359,303 377,084 405,595
Professional Svcs. 202,099 196,255 186,353 197,185 195,994 228,616
Materials & Supp. 40,494 65,733 75,672 64,312 64,009 68,349
Utilities 130,188 130,188 136,392 142,923 149,800 157,040
Admin. Expenses 135,270 166,066 161,015 178,746 170,805 185,727
Billing Credits (6,948) - - - - -
Department Total: $1,536,844 $1,408,322 $1,447,581 $1,507,983 $1,546,108 $1,657,626
* Forecast is July’11-April‘12 actuals plus May & June Budget ** Includes five Board Members, Administrative Assistant four days per week equals 0.8 FTEs (shared with Ops) The services to be provided by the Administration Department over the next five years are summarized below: Administration Board of Directors and District Support Implement and communicate Board policies & directives Provide support for Board and Committee Meetings, Board Reports, Annual Filings,
Orientation, Board inquiries & follow-up, scheduling and travel arrangements Manage organization performance Manage outside legal services Coordinate legislative activities Oversee initiatives and report progress of the 2012 Strategic Plan Oversee and report progress of the 2013-2017 Business Plan and Budget

2013-2017 Business Plan & Budget | Page 58
Participate in Workforce Partnership Implement new records management and agenda management systems Maintain District policies Supply Chain Management/Oversight San Diego County Water Authority Metro Wastewater Joint Powers Authority City of San Diego County of San Diego Water Conservation Relationship Management Management and Employees Customer Relations & Communications Interagency relations Public Media Transparency Communications The key messages Communications will focus on during this Plan will cover the rising cost of water, water quality, the value of water and the need for reliability and investment in our infrastructure. Messages and programs will help address the communications and customer service education goals in the District’s Strategic Plan.
Rising Cost of Water Low and competitive water and sewer rates are a top priority to our customers. It is the goal of communications to provide the education and materials necessary for customers to understand and trust how Padre Dam bills them and what funds are used for. Many customers do not understand our relationship to the San Diego County Water Authority and Metropolitan Water District and how their rates impact ours. The District needs to increase customer understanding of water costs and the impact on rates. Educating customers on the need for investment in infrastructure will also help to communicate what water rates pay for. We also need to communicate what Padre Dam has done and continues to do to control costs. 2013-2017 Deliverables Messaging campaign on the value of water and why costs continue to rise New bill design to include external vs. internal cost explanations Rates fact sheets Annual Customer Report Monthly billing implementation marketing Prop 218 for rates Water Quality Safe drinking water is a top priority of Padre Dam customers. Padre Dam has an excellent record of providing high quality, safe drinking water to our customers. We will continue to promote water quality standards to customers on an annual basis. As the District explores new water supply sources, such as Indirect Potable Reuse, we will need to educate customers on the benefits of this water supply and communicate the high standards of water quality we will have for any new water supply sources. The goal is for customers to believe and trust that Padre Dam is providing high quality tap water regardless of the water supply source.

2013-2017 Business Plan & Budget | Page 59
2013-2017 Deliverables Annual Water Quality Report Indirect Potable Reuse messaging Full Advanced Treatment messaging Reliability and Investment in Infrastructure Communications will focus customer attention on reliability issues and the need to maintain aging infrastructure. Justifying the need for infrastructure investment is essential to justifying the need for rate increases while maintaining customer trust. Because it is underground, the size and complexity of Padre Dam’s water and sewer infrastructure is largely unknown to customers; it is time to move the conversation about the value of this infrastructure “above ground” and develop customer support for capital investment. 2013-2017 Deliverables CIP Notifications for Customers Adjacent to Project Presentation on Infrastructure Issues and Investment Customer Tours of Facilities and Construction Presentation on Wastewater Management 2015 Urban Water Management Plan Santee Basin and other water resources project messaging
Departmental Support Communications also provides support to all other departments for customer messaging. One of the largest messaging tools communications redeveloped during the previous Five Year Plan was the District’s website. The site is now more intuitive and user-friendly. During this Plan, communications will develop or continue the use of messaging through the methods shown below. 2013-2017 Deliverables Customer Newsletter Website updates and additions High Use Notification Messaging Web videos on hot topics Social Media Updates Service Interruption Notices Legislative Affairs Vehicle Signage CIP Project Notifications E-billing promotional campaign Bill messages and inserts

2013-2017 Business Plan & Budget | Page 60
Finance Department
Mission The Finance Department provides financial services to the District and the ratepayers including general accounting, financial management, information systems, and customer services. We deliver these services with commitment to teamwork and excellence in communications. Methodology The Finance department is a support function, assisting Padre Dam employees, customers and the Board. The Finance department is comprised of the Finance/Accounting function, the Customer Service function and the Information Systems function. Each function is described separately below. The CFO/Director of Finance is responsible for overseeing all three functions and reports directly to the CEO/General Manager. Budget The total budget for the Finance Department for the next five years beginning in FY 13 is as follows:
FY 13 $3,299,554 FY 14 $3,293,117 FY 15 $3,332,188 FY 16 $3,456,469 FY 17 $3,728,542
This compares to $3,219,975 forecasted for FY 12. The following schedule provides estimated spending by category over the next five years.

2013-2017 Business Plan & Budget | Page 61
FY 12 Forecast*
FY 13 Budget
FY 14 Budget
FY 15 Budget
FY 16 Budget
FY 17 Budget
FTEs** 20 20 19 19 19 19
Salary & Wages $1,635,890 $1,681,431 $1,678,875 $1,756,748 $1,835,566 $1,922,535
Employee Benefits 920,349 960,512 963,259 994,700 1,052,470 1,128,145
Professional Svcs. 277,243 200,836 147,486 184,365 153,248 182,648
Materials & Supp. 179,268 257,297 307,815 202,574 207,370 294,197
Utilities 31,073 17,032 17,263 17,501 17,747 17,989
Admin. Expenses 178,707 182,445 178,420 176,298 190,068 183,029
Billing Credits (2,555) - - - - -
Department Total: $3,219,975 $3,299,554 $3,293,117 $3,332,188 $3,456,469 $3,728,542
* Forecast is July-April actuals plus May & June Budget ** IS employee moving to Operations in Year 2 (shared resource), 1 temporary Customer Service Rep. Finance/Accounting: 6.0 FTE employees The Finance/Accounting function provides payroll services, accounts payable, audits, financial reporting, internal control, investments & cash management, cash deposit input, fixed asset system maintenance, budgeting, fund management, rate and fee development, and debt issuance. In addition to funding for the tasks mentioned above, the budget for the Finance/Accounting function includes recurring expenditures for financial consultants, an investment manager, GASB 45 compliance, custodian and wire fees, licenses, check stock/W2/1099 forms, and employee development. New goals planned for the upcoming Plan include the production of a Comprehensive Annual Financial Report (CAFR) for the District, preparation of a single audit for grant funding, revising the District’s allocation model, implementation and training for a new financial software package. Resource Plan Staffing: Staffing levels are expected to remain at current levels for the next five years except for the use of temporary help during the Finance and HR Computer System Replacement Project. The department no longer relies on temporary part-time help as was the case during the 2008 Plan. Salary level increases are based on the 2012 MOU. All other operating expenses: Expected to remain consistent with prior years, with adjustments for inflation and funding for new goals mentioned above. Software/hardware changes: The current JD Edwards financial and HR package will be replaced with a new, integrated, windows based software program. The new Finance and Human Resources Information Systems (FHRIS) will be more efficient and will help facilitate

2013-2017 Business Plan & Budget | Page 62
data access and reporting. The purchase and implementation of the FHRIS will be capitalized. Customer Service: 9.0 FTE employees Customer Service provides customer accounts maintenance, billing and collection, tracking installations and prepaid deposits, daily receipts collection and balancing, statistical reporting, walk-in customer assistance, and mail distribution for the District. More information about the responsibilities and goals of the Customer Service Function are covered in Chapter 9. Resource Plan Staffing: Staffing levels are expected to remain at current levels for the next five years except for the use of temporary help during the new Customer Information System (CIS) Replacement Project. Salary level increases are based on the 2012 MOU. All other operating expenses: Expected to remain consistent with prior years, with adjustments for inflation. Software/hardware changes: The current “home-grown” customer billing system will be replaced in Year 1 of the Plan. The new CIS will be more user-friendly and will facilitate data access and reporting. It will also be integrated with the new FIS thereby reducing current manual processes. The purchase and implementation of the CIS will be capitalized. Information Systems: 5.0 FTE employees The goal of the Information Systems (IS) team is to provide information technology infrastructure, solutions and services that support the mission, vision and values of Padre Dam. IS supports all aspects of Padre Dam’s operations including the Water, Recycled Water and Sewer operations and Santee Lakes. More information about the responsibilities and goals of the IS function are covered in Chapter 6. Resource Plan Staffing: Staffing levels are expected to remain constant for the near term. Any workload requirements that may exceed current staffing during this budget cycle will be addressed using contract services. Salary level increases are based on the 2012 MOU. All other operating expenses: Expected increase in the budget due to support and licensing requirements of the new CIS/FHRIS/EDMS software packages. All other expenses expected to remain consistent with prior years, with adjustments for inflation. Software/hardware changes: IS will start the new Plan with a recent hardware refresh applied to the core infrastructure. The infrastructure will support electronic processing, storage and messaging needs throughout the Plan as well as provide the additional resources needed to support the implementation of the new CIS/FHRIS/EDMS software packages. See Chapter 6 for a list of specific projects targets for Plan.

2013-2017 Business Plan & Budget | Page 63
Human Resources
Mission The Human Resources Department’s mission is to recruit, hire and retain a competent workforce to staff Padre Dam in such a way as to ensure Padre Dam fulfills its mission of service to its customers. The mission of the Safety & Risk Management division of Human Resources is to provide loss control, wellness and other risk management programs to reduce and prevent losses to Padre Dam. Methodology Human Resources is a support function – we support all of the other departments. We offer that support by providing quality customer service and expertise that allows the other departments to meet their goals with productive staff. We do that by working with departments to analyze issues and solutions, utilizing technology vs. additional staffing and by constantly looking at the cost of doing business and how we can help departments do business at the most efficient cost. The Strategic Plan drives our goals and plans for the next five years. Based on the Strategic Plan, the Human Resources Department goals are: Human Resources 1. Develop and train our employees in leadership and competencies required for
promotions. 2. Continue aggressive succession planning by identifying retirements and encouraging
employees to prepare for openings. 3. Continue encouraging and being a champion of the Workforce Partnership through
participation in the EIT and identifying ways to collaborate among departments and all employees.
4. Cultivate and maintain a positive culture and teamwork where employees feel engaged and valued.
5. Encourage communication with employees on a regular basis about all aspects of our business and treat employees like our business partner and public relations representative to our customers.
6. Create and maintain the viability of the District to seek out, recruit and retain quality individuals who will support and advocate our company culture and legacy.

2013-2017 Business Plan & Budget | Page 64
Safety & Risk Management 1. Continue to develop security plans at remote facilities. 2. Increase our ability to respond to emergencies through tabletop training exercises,
After Action – Improvement Plan Reports, expansion of the Business Continuity Plan and ICS/NIMS/SEMS training.
3. Aggressively mitigate Workers’ Compensation claims, property and liability claims through early intervention to minimize district claim and litigation costs.
4. Reduce injury rates through safety training, promoting a “Safety First” culture, investigating and implementing new safety methods, processes and procedures to ensure a safe workplace and adherence to safety rules.
5. Continue to promote a healthy workplace through stretching, flu-shots, healthy foods commitment and wellness education.
6. Implement a smoke free campus by Dec 31, 2013 7. Continue to actively implement our ADA transition plan to ensure that all new
construction and remodeling is ADA compliant and all programs are accessible. Resource Plan Staffing: Over the next five years, it is believed that all of the above goals can be met with current staffing (2 HR employees and 1 Safety & Risk employee); no additional employees will be requested. The department will see significant turnover during this time due to two retirements – Safety & Risk Manager and Director of Human Resources. Because new individuals will occupy these positions in the future, it may be necessary to utilize consultants to assist with the work. In determining the budget needed to meet the mission of the Human Resources Department, it was estimated that we will have approximately 27 retirements over the next five years. In addition to those retirements, we normally have regular attrition that occurs. While not all positions may be replaced, we have budgeted for 43 recruitments which, together with the retirements, is reflective of current staffing. Budget
FY 12 Forecast*
FY 13 Budget
FY 14 Budget
FY 15 Budget
FY 16 Budget
FY 17 Budget
FTEs** 3 3 3 3 3 3
Salary & Wages $394,563 $348,135 $344,733 $345,362 $360,545 $377,022
Employee Benefits 223,469 252,632 207,529 206,667 218,941 233,853
Professional Svcs. 29,533 22,517 34,032 28,282 25,464 27,002
Materials & Supp. 28,311 35,307 42,375 34,833 35,549 35,057
Utilities 812 1,032 1,682 1,812 1,812 1,812
Admin. Expenses 277,693 313,849 332,083 347,046 364,033 384,636
Billing Credits (397) - - - - -
Department Total: $953,984 $973,472 $962,434 $964,002 $1,006,345 $1,059,383
* Forecast is July’11-April‘12 actuals plus May & June Budget
** 0.1 FTE for overlap with old/new Director of HR

2013-2017 Business Plan & Budget | Page 65
Items that will need to be paid out of budget funds to meet the projects listed above are:
FY 13 FY 14 FY 15 FY 16 FY 17
Human Resources
Unemployment Insurance related to Exit Incentive Program
$60,000
$12,000
$12,000
$12,000
$12,000
Professional Services: Best Best & Krieger IGOE Recruitments (background
checks)
$2,000 $3,015 $438
$3,000 $3,120 $1,022
$3,000 $3,300 $1,022
$3,000 $3,450 $1,314
$3,000 $3,600 $2.482
Telephone: Smartphone for new HR Director
$650
$780
$780
$780
Expendable Equipment: Laptop, monitor and scanner for
new HR Director Computer for HR Specialist Printer for Department
$800
$3,000
$1,500
Printing/Copying: Recruitment materials
$3,000
Materials/Supplies: ID Badge supplies
$1,000
$1,000
$1,000
Employee Development: Retirement Checks Seminars/Webinars/Conferences Training requested by CEO/GM Padre Dam University (as per
Strategic Plan)
$500
$1,300 $2,500 $1,000
$1,250 $1,400 $2,500 $1,000
$1,000 $1,600 $2,500 $1,000
$1,250 $1,600 $2,500 $1,000
$3,750 $1,600 $2,500 $1,000
Advertising & Marketing: Recruitment ads Career Fairs
$786 $200
$2,758 $200
$2,272 $200
$2,558 $200
$3,144 $200
Meetings & Conventions: Monthly IPMA meetings
$550
$550
$550
$550
$550
Licenses, Permits & Fees: Org Chart program (Visio or
OrgPlus)
$600

2013-2017 Business Plan & Budget | Page 66
Safety & Risk Management
Professional Services: Safety physicals
Annual fire extinguisher
maintenance DOT compliance Tracer Consultants -- Risk
Management Plan Revalidation Tracer Consultants – Risk
Management Plan Audit Tracer Consultants – Local
Hazard Mitigation Plan update
$9,054
$2,300
$3,000
$9,150
$2,300
$3,100 $6,130
$3,500
$9,270
$2,300
$3,200
$3,480
$9,390
$2,300
$3,300
$9,510
$2,300
$3,400
Equipment Rental: Dish Network for EOC
$300
$324
$324
$336
$336
Expendable Equipment: Laptop, monitor and UPS
$2,550
Safety Material & Supplies: Safety shoes and jackets Safety equipment and supplies
$10,000 $19,992
$12,500 $17,496
$10,000 $19,992
$12,500 $17,496
$10,000 $19,992
Employee Development: Seminars, webinars, conferences
and lunch meetings Training requested by CEO/GM
$950
$1,500
$950
$1,500
$950
$1,500
$950
$1,500
$950
$1,500
Liability Insurance
Administrative Expenses: Liability & Property Insurance
$297,492
$312,242
$327,730
$343,991
$361,066

2013-2017 Business Plan & Budget | Page 67
Engineering and Planning Department
Mission
The Engineering and Planning Department’s mission is to deliver quality utility design, inspection, and customer and information services to the community and District with continued professional development, dedicated leadership, and a positive team approach.
Introduction The Engineering and Planning Department has five main functions: capital projects, development services, field engineering (inspection), right-of-way, and mapping. The department is organized into two divisions:
Planning and Design - This division is responsible for the planning, design and construction of Padre Dam’s capital projects. This includes the implementation of the District's Master Plan for planned growth and development of local water supply. The goal of this division is to manage capital projects efficiently to ensure District standards are achieved within budget.
Development Services & Inspection – This division is responsible for reviewing
local development plans and assisting developers, engineers, and private property owners through the approval, installation, and inspection of new water and sewer facilities. Additionally, this division is also responsible for the mapping of District facilities and protecting the District’s right-of-ways.

2013-2017 Business Plan & Budget | Page 68
Resource Plan Staffing: The Engineering & Planning Department serves both the Development community as well as maintains the Capital Improvement Program (CIP). The workload for the department can fluctuate due to external factors such as: economic and development recovery, regulatory mandates and unforeseen capital replacements. Much of this workload fluctuation can be accommodated with the use of consultants to get over “peak” loads. The Engineering & Planning Department has experienced significant changes since the implementation of the District’s deficit elimination plan. Staffing in the department has reduced from 27 to 15 and was reorganized from three divisions to two. Staffing is expected to decrease by 1 full time employee (FTE) over the next five years as part of ongoing cost cutting and efficiency improvements. Figure 1 shows the projected staffing level over the next five years compared to the last 5-year business plan. Figure 2 shows projected salary and benefits for the department over the next five years.
Figure 1 – Projected Engineering Staffing

2013-2017 Business Plan & Budget | Page 69
Figure 2 – Engineering Wages and Benefits
The projected expenditures for the department are expected to increase compared to the last five year business plan. Many of these increases are directly offset by reduced salary and wages in providing these services by staff. Figure 3 shows the anticipated expenditures for the department over the next five years.
Figure 3 – Engineering expenditures

2013-2017 Business Plan & Budget | Page 70
Major reasons that the planned expenditures for the Engineering Department are projected to increase include:
Projected increase in legal costs Increase in professional services (environmental, survey, and permitting) Increase in training to enhance skill sets and allow flexibility in staffing
It is projected that billing credits will be reduced significantly due to reduced development activities and less staff charging against CIP for project development. Billing credits are a way to capture monies that are paid for by developers for engineering services, or to capitalize staff time for work that is spent on long term capital projects (charge against the CIP). Professional services that are contracted for assistance on most capital projects are charged directly to the specific project that is being worked on and is included in the CIP. It should be noted that a significant amount of staff time and resources is required to manage consultants when used. When work is outsourced staff must still prepare and manage the scope of services, administer contracts, provide all required information, review submittals and verify all results. Figure 4 below shows the projected billing credits over the next five years for the department.
Figure 4 – Engineering Billing Credits

2013-2017 Business Plan & Budget | Page 71
Budget
FY 12 Forecast*
FY 13 Budget
FY 14 Budget
FY 15 Budget
FY 16 Budget
FY 17 Budget
FTEs** 15 15 15 15 14 14
Salary & Wages $2,097,368 $1,702,217 $1,781,804 $1,863,523 $1,747,615 $1,832,660
Benefits 1,109,677 871,870 924,117 949,711 915,514 984,066
Professional Svcs. 77,151 73,396 74,312 77,052 77,992 81,464
Vehicle & Equip. 13,624 8,740 8,740 8,740 8,860 8,860
Materials & Supplies 59,034 73,376 74,332 71,987 74,547 75,887
Utilities 8,244 8,240 8,612 9,020 9,416 9,800
Admin. Expenses 29,377 49,685 45,286 55,417 56,618 58,136
Less Billing Credits (1,347,244) (1,275,000) (1,313,250) (1,352,648) (1,330,000) (1,369,900)
Department Total $2,047,231 $1,512,524 $1,603,953 $1,682,802 $1,560,562 $1,680,973
* Forecast is July’11-April‘12 actuals plus May & June Budget ** Summer Intern program will be evaluated annually

2013-2017 Business Plan & Budget | Page 72
Operations and Water Quality
Mission To provide sufficient maintenance of existing infrastructure systems to promote efficient operations and minimal customer service outages while avoiding emergency repairs and ensuring that the water and sewer systems are maintained for future customers/ratepayers. Methodology Identify operational and maintenance projects to achieve the mission of preventive and predictive maintenance. The list of projects is included in this chapter. Department Overview The primary responsibilities of the department are delivery of sufficient high quality water, maintenance of an emergency supply of water, collection of sewer, recycling of water, and maintenance of water, sewer collection and recycled water system facilities. The functions of the Department are separated into three divisions: Systems Maintenance and Construction, Water Operations, and Water Recycling; and two sections: Laboratory and Warehouse. The structure of the department is shown on the following page. More information about the responsibilities and goals of the Operations department are covered in Chapter 4.

2013-2017 Business Plan & Budget | Page 73
Budget
FY 12 Forecast*
FY 13 Budget
FY 14 Budget
FY 15 Budget
FY 16 Budget
FY 17 Budget
FTEs ** 78.2 77.2 76.2 75.2 75.2 75.2
Salary & Wages $6,476,381 $6,442,680 $6,664,921 $6,879,516 $7,188,618 $7,517,837
Benefits 4,201,205 4,111,358 4,303,465 4,414,441 4,693,236 5,039,135
Professional Svcs. 282,863 235,220 357,560 446,867 439,329 456,737
Vehicle & Equip. 574,893 669,043 699,919 703,145 737,164 742,034
Materials & Supplies 1,608,487 2,418,621 2,384,029 2,600,970 2,625,884 2,655,267
Utilities 497,898 503,238 517,386 530,926 544,324 557,009
Admin. Expenses 204,213 268,320 262,621 271,846 281,021 269,566
Less Billing Credits (1,858,638) (1,605,995) (1,654,175) (1,703,800) (1,754,914) (1,807,562)
Department Total $11,987,302 $13,042,485 $13,535,726 $14,143,911 $14,754,661 $15,430,024
* Forecast is July’11-April‘12 actuals plus May & June Budget ** Wastewater Systems Worker moved to IS in Year 1 moving back to Ops in Year 2, Warehouse Worker position eliminated in Year 1, , Custodian and ICC Specialist positions eliminated in Year 2, Cons. Equip. Operator position eliminated in Year 3, two part time Utility Workers (1 FTE) each year, Administrative Assistant one day per week at 0.2 FTEs (shared with Admin)

2013-2017 Business Plan & Budget | Page 74
Santee Lakes Recreation Preserve
Mission Padre Dam’s Santee Lakes Recreation Preserve (Santee Lakes) enhances our community through the delivery of exceptional recreation opportunities, the restoration and protection of environmental assets, and the re-investment in our park and campground for the benefit of people. Methodology With the approval of the Five-Year Business Plan in 2007, Santee Lakes set out on a path of facility improvement through park enhancements to increase the number of visitors to its facility. Staff will continue that trend under the new Plan while developing innovative ideas to meet the changing landscape of recreation. Santee Lakes has operated as an independent Enterprise Fund, receiving no ratepayer fees or subsidized tax revenue, since the 1990s. Over the years staff has implemented many changes to streamline services to help improve the bottom line and better serve its patrons. In FY 2011 staff maintained daily operations of the Park and Campgrounds for a

2013-2017 Business Plan & Budget | Page 75
staggering 650,000 visits. Over the next five years Santee Lakes will position itself to accommodate even more visits and offer additional services and attractions to enhance the customer experience. Budget
FY 12 Forecast*
FY 13 Budget
FY 14 Budget
FY 15 Budget
FY 16 Budget
FY 17 Budget
FTEs ** 14.7 15.6 15.6 15.6 16.4 16.6
Salary & Wages $836,873 $921,980 $965,091 $1,009,009 $1,095,725 $1,167,290
Employee Benefits 498,215 554,251 589,282 611,663 660,626 714,380
Professional Svcs. 118,092 277,666 267,922 271,187 247,042 246,791
Materials & Supp. 672,689 533,652 563,352 584,919 613,749 600,405
Utilities 517,059 421,184 437,556 456,000 474,808 494,600
Admin. Expenses 111,526 163,556 167,780 166,360 170,320 158,120
Billing Credits (24,592) (30,000) (15,000) (20,000) (10,000) (10,000)
Department Total: $2,729,862 $2,842,289 $2,975,983 $3,079,138 $3,252,270 $3,371,586
* Forecast is July’11-April‘12 actuals plus May & June Budget ** Eleven full-time and seven part-time employees equaling 4.6 FTEs in Years 1-3 with increases in Years 4 & 5 for new Special Events Coordinator position. Santee Lakes Five Year Plan The basic components of Santee Lakes’ Five Year Business Plan are practices that have been used for many years to maintain its status of being a self-sustaining facility:
Develop a New Master Plan – Staff will utilize internal and external resources to create new opportunities to enhance the facility.
Capital Improvement Plan – Invest so facilities remain enticing for customers.
Advertising and Marketing – Reach out to the local community and those outside the city to bring in new customers.
Budgeting and Rate Analysis – Offer an exceptional product at a reasonable price; be aware of the local economy while maintaining a positive bottom line.
Recreation Programs/Events – Be accessible for local and regional events; be accessible to the community.
Preventive & Predictive Maintenance – Be proactive in maintenance and facility upkeep and make resources available when the unexpected happens.

2013-2017 Business Plan & Budget | Page 76
Trends and Projections – See what to offer, how to offer and know when it is time to offer something different.
Grants & Fundraising Programs – Identify local, state, national and foundation funds to assist with capital improvements and maintenance.
Development of a New Master Plan In 2007, Park management began an aggressive and innovative development program to expand the facilities and increase Santee Lake’s status in the Park and Campground communities. Known as the 21/21 Plan, the plan identified 21 projects for the 21st Century. The last project from the 21/21 Plan that will be undertaken (Park Shelter Project) will be completed in the summer of 2012, with some projects deferred. Staff is looking at this opportunity to build on the successes of the 21/21 Plan and create a new roadmap. Staff will be working with residents and the Park Committee, in addition to pulling resource information from national studies, to develop an inclusive master plan for the next ten years. Capital Improvement Plan The Capital Improvement Plan is a living document, changing focus as direction and resources change. It coincides with the development and implementation of the new master plan and includes ongoing facility preventive and predictive maintenance projects to keep Santee Lakes operating at a high customer satisfaction rating, while maintaining a healthy Park reserve fund. Planned projects include replacement of the fencing around Santee Lakes, asphalt repaving throughout the Park, meeting ADA requirements as repairs and replacements are made and landscape enhancements. The Capital Improvement Plan is re-visited and updated annually as needs change or opportunities arise. Advertising and Marketing During the 2008 Plan, marketing and advertising of projects, programs and activities at Santee Lakes took on many looks. Using traditional methods, staff took advantage of opportunities to place information in schools, fliers and emails to local groups and businesses to promote our product in the community. We received national exposure through guides such as Woodalls and Trailer Life, and membership in ARVC and Work Camper magazine. Under the new Plan, as we move further into the “digital age”, we will continue to make changes to the website (www.santeelakes.com) giving visitors a virtual glimpse into Park activities. Today, the Park utilizes social media for immediate communications with visitors through Facebook, mass email blasts and viral videos created in-house or through a contractor that are placed on YouTube and the Santee Lakes website. We plan to enhance our website and increase interactivity for people searching for a West Coast destination for their camping needs. Budgeting and Rate Analysis Santee Lakes is operated as an enterprise fund which means it relies entirely on fees charged to its customers and receives no financial support from taxpayers or Padre Dam ratepayers. Consequently its rate structure is developed to generate positive cash flow to meet all operating costs and fund its aggressive Capital Improvement Plan.

2013-2017 Business Plan & Budget | Page 77
Projections for the 2013 Five Year Plan are based on financial experience gained over many years of operating the facility. Expenses are continuously monitored and opportunities for financial savings through volunteerism (Camp Host), bulk purchases or other processes are identified and implemented as necessary. Likewise, revenue opportunities are constantly being explored to maximize the use of Santee Lakes. Investments made in capital improvements, the fishing program, and facility maintenance assist staff in creating an environment that increases daily and long term participation by our customers. Recreation Programs/Events As a community enhancement, Santee Lakes will maintain its collaborations with local and regional programming over the new Plan. From traditional annual events like the Eggstravaganza, with over 8,000 visitors, to the very popular “Movies at the Lakes” which has over 10,000 attendees, Santee Lakes will continue to bring the community together. For community based programs, staff worked closely with various groups to achieve success for their organizations. For Camps, the Teen Center and other community based camps utilized the value of Santee Lakes by adding camping to their summer and holiday break programs. The self-operated Community Group programs also experienced an increase with organizations like the Lions Breakfasts and Fishing Derby adding to their successful programs. These efforts will be maintained during the new Plan and staff will research other avenues to increase programming opportunities. Preventive and Predictive Maintenance Similar to other Padre Dam operations, Santee Lakes will be proactive during the Plan, preparing not only for what can be expected but also for unforeseen events that may occur when operating a 190 acre facility. Staff will continue to use the Land Logic tracking system to monitor, replace and repair assets on a routine basis to keep the operation running efficiently. Staff will strive to meet or exceed annual goals for cleanings, inspections and maintenance. The due diligence of ongoing inspections and maintenance prolongs the life of assets and decreases the amount of equipment and material replacements needed for facility operations. Trends and Projections Staff will continue to monitor and track all aspects of the Santee Lakes operations on a daily, monthly and annual basis. Information gathered in the past has assisted in making decisions to increase certain services while altering or reducing others. Santee Lakes’ established reputation in the local community and beyond will enable it to meet the goals of the Plan and expand in the future. Grants and Funding Programs With the large number of projects identified in the Plan, staff will continue to look for opportunities to partner with other community groups or obtain outside funding to help offset project costs and assist with preventive and predictive maintenance. We will aggressively seek out grants (matching, no match and in-kind) that will help to achieve the Plan’s goals. To date, Santee Lakes has received over $253,000 in grant funding to help offset the cost of many projects including enhancement of the recycling program, the successful Cabin Project and the Photovoltaic Solar Project.

2013-2017 Business Plan & Budget | Page 78
Conclusion Santee Lakes will continue to evolve during the Plan by reviewing and meeting objectives while remaining open to altering focus when new opportunities arise. Reasonable fees and charges will help provide the revenue to allow staff to keep the facility new and exciting for the daily and long-term visitors on a constant basis. A more definitive overview of Plan implementation is available in Chapter 11. We will continue to utilize the talents of our greatest resource - our staff, and their ability to communicate and gather information from our patrons to meet the recreational needs of our community and those who visit from outside Santee.

2013-2017 Business Plan & Budget | Page 79
CHAPTER 11 – Five Year Water and Sewer Rate Plan One of the most important components of the Plan is a reliable revenue stream to enable staff to accomplish the Plan goals. Staff is requesting the Board approve rate increases at the outset of the Plan for all five years as was the case with the last five year plan. This rate increase will cover Padre Dam’s operating expenses, debt service, capital equipment, and capital improvement projects. Direct cost increases from Metropolitan Water District, County Water Authority, SDG&E, etc. will be passed through as separate rate increase under a Board “pass-through authorization.” Rates and typical customers shown below are for Padre Dam’s rate increases only. Staff did not attempt to project future rate increases from external sources. Staff took many steps prior to developing rates needed to fund the Plan. Staff felt these steps were necessary before proposing rate increases to the Board to ensure they only asked for what was absolutely necessary. These steps included: 1) Deficit Elimination Plan which resulted in significant operational savings and a 19% workforce reduction 2) Strategic Plan development to identify the important goals for the District 3) Negotiated five year contracts with the District’s two employee associations which include significant savings through employee cost sharing 4) Multiple iterations of CIP planning to derive the recommended scenario 5) A thorough budget request process:
Five years’ worth of actual data was analyzed to help forecast needs over the next five years
Departmental budget requests were scrutinized and fine tuned Department heads were required to present and explain their budget
request to the GM and CFO After all departmental budgets were combined, departments were asked to
find additional reductions that amounted to over $600K The rates were then derived using a very sophisticated rate model developed by HDR Consulting and included the following goals: 1) Cover operating costs 2) Cover the remaining deficit in the Retail Water operation 3) Increase CIP spending to recommended levels 4) Maintain fund balances Major assumptions in the model include: 1) Salaries and benefits were based on the approved MOU 2) Water sales and sewer collection will remain flat 3) Property taxes will increase 1% each year 4) CIP expenditures are based on staff recommended scenario 5) Debt service is based on existing amortization schedules 6) Expenses were allocated to operations based on the current cost allocation (DMG) model 7) PERS employer rates are based on current valuation projections with an adjustment for expected increase for change in assumed rate of return 8) Staff will be reduced by 5 FTE over the five years through attrition 9) No new borrowing is assumed in the budget but will be considered if it makes financial sense.

2013-2017 Business Plan & Budget | Page 80
10) Forecasted revenues, expenses, CIP and fund balances were based on actual expenses through March 31, 2012 plus a projection for the remaining three months of the fiscal year 11) Metro direct sewer costs were based on amounts currently billed 12) Direct cost increases will be passed through and so were kept flat for rate calculation
Typical Monthly Water Customer Bill The District’s current water rate structure is designed to fairly allocate water to its customers. Customers are classified as either residential or non-residential. Residential customers are further broken down into 5 single-family service types based on their lot size and purchased EDUs (RES1-RES5) and one multi-family service type that include mobile home parks, multiple dwelling units and condominiums. Non-residential service types include Commercial/Government, Irrigation (Potable and Recycled), Construction (Potable and Recycled) and Agriculture. The District receives property tax revenue. A portion of that revenue is collected from all customers and is used to reduce water rates. The remainder relates only to amounts collected from Eastern Service Area customers and so a credit is provided for water used by those customers. Water use declined significantly during the last five year plan due to drought and the economic recession. By the end of FY ’12, the District is projected to sell 34% less water than was budgeted in the prior five year plan. As a result, the “typical customer” that had been used historically was no longer valid. In order to calculate a current typical customer bill, staff analyzed current water use to determine which residential type to use and what amount of water use to assume. The District plans to move to monthly billing within the next year so the typical bills were calculated to reflect that change. For the Western service area, RES 2 had the most number of accounts and the average water use of all Western customers was 10.38 HCF. For the Eastern service area, RES 4 had the most number of accounts and the average water use of all Eastern customers was 16.04 HCF. Customers’ bills are made up of the variable portion based on water use, a fixed monthly charge for Padre Dam (systems charge) and a fixed monthly charge from CWA (IAC). Eastern service area customers are also charged for pumping depending on their elevation.
Typical Monthly Sewer Customer Bill The District’s current sewer rate structure is designed to fairly allocate the costs of sewer collection and treatment among its customers. There is no exact method to bill sewer customers since flow is not metered. As a result, the methodology the District employs was created to arrive at a reasonable estimation of sewer flow by looking at a customer’s lowest 60-day water consumption period from the previous calendar year. Their bill is then based on that water usage along with a fixed monthly fee. Customers are re-evaluated every January.

ACTUAL
RATES (per HCF) 3/1/2012 1/1/2013 1/1/2014 1/1/2015 1/1/2016 1/1/2017
Tier 1 Rate 4.5787$ 4.75$ 4.98$ 5.22$ 5.47$ 5.73$
Tier 2 Rate 4.8688 5.27 5.52 5.78 6.05 6.34
Tier 3 Rate 5.5003 6.00 6.29 6.59 6.90 7.23
Tier 4 Rate 6.0171 6.55 6.86 7.19 7.53 7.89
Tier 5 Rate 6.5357
FIXED (Monthly)
Padre Dam Systems Charge 23.50 25.85 27.10 28.40 29.75 31.15
CWA IAC Charge 2.60 2.60 2.60 2.60 2.60 2.60
ALLOCATION HCF/Month
Tier 1 9 9 9 9 9 9 9
Tier 2 8 2 2 2 2 2 2
Tier 3 8 0 0 0 0 0 0
Tier 4 8 0 0 0 0 0 0
Total HCF/Month 11 11 11 11 11 11
ESTIMATED MONTHLY BILL
Tier 1 $ 41.21 $ 42.75 $ 44.82 $ 46.98 $ 49.23 $ 51.57
Tier 2 9.74 10.54 11.04 11.56 12.10 12.68
$ 50.95 $ 53.29 $ 55.86 $ 58.54 $ 61.33 $ 64.25
Padre Dam Systems Charge 23.50 25.85 27.10 28.40 29.75 31.15
CWA IAC Charge 2.60 2.60 2.60 2.60 2.60 2.60
Monthly Water Bill* $ 77.05 $ 81.74 $ 85.56 $ 89.54 $ 93.68 $ 98.00
Overall Bill Effect* 6.09% 4.67% 4.65% 4.62% 4.61%
* Excludes future external passthrough increases.
ACTUAL
3/1/2012 1/1/2013 1/1/2014 1/1/2015 1/1/2016 1/1/2017
SINGLE FAMILY
Variable Rate (per HCF) $ 3.42 $ 3.47 $ 3.52 $ 3.57 $ 3.62 $ 3.68
Base Fee (per month) 27.34 27.60 28.05 28.50 28.95 29.40
Typical Customer Low Use (H 8.20 8.20 8.20 8.20 8.20 8.20
ESTIMATED MONTHLY BILL*
Variable $ 28.01 $ 28.45 $ 28.86 $ 29.27 $ 29.68 $ 30.18
Base Fee 27.34 27.60 28.05 28.50 28.95 29.40
Monthly Water Bill* $ 55.35 $ 56.05 $ 56.91 $ 57.77 $ 58.63 $ 59.58
Overall Bill Effect* 1.28% 1.53% 1.51% 1.49% 1.61%
* Excludes future external passthrough increases.
COMBINED WATER/SEWER BILL $ 132.39 $ 137.79 $ 142.47 $ 147.31 $ 152.31 $ 157.58
OVERALL BILL INCREASE 4.08% 3.40% 3.40% 3.39% 3.45%
Typical Monthly Sewer BillBudget FY '13 - FY '17
PROPOSED / BUDGET
WESTERNTypical Monthly Water Bill
Budget FY '13 - FY '17
PROPOSED / BUDGET
Estimated Hundred Cubic Feet (HCF) Used per Month
2013-2017 Business Plan & Budget | 81

ACTUAL
RATES (per HCF) 3/1/2012 1/1/2013 1/1/2014 1/1/2015 1/1/2016 1/1/2017
Tier 1 Rate 4.3988$ 4.75$ 4.98$ 5.22$ 5.47$ 5.73$
Tier 2 Rate 4.6740 5.27 5.52 5.78 6.05 6.34
Tier 3 Rate 5.2760 6.00 6.29 6.59 6.90 7.23
Tier 4 Rate 5.7685 6.55 6.86 7.19 7.53 7.89
Tier 5 Rate 6.2625
Pumping to Zone 3* 0.8220 0.8220 0.8220 0.8220 0.8220 0.8220
ESA Credit (0.56) (0.56) (0.57) (0.57) (0.58)
FIXED (Monthly)
Padre Dam Systems Charge 23.50 25.85 27.10 28.40 29.75 31.15
CWA IAC Charge* 2.60 2.60 2.60 2.60 2.60 2.60
ALLOCATION HCF/Month
Tier 1 9 9 9 9 9 9 9
Tier 2 15 6 6 6 6 6 6
Tier 3 11 0 0 0 0 0 0
Tier 4 11 0 0 0 0 0 0
Total HCF/Month 15 15 15 15 15 15
ESTIMATED MONTHLY BILL
Tier 1 39.59$ 42.75$ 44.82$ 46.98$ 49.23$ 51.57$
Tier 2 28.04 31.62 33.12 34.68 36.30 38.04
Pumping* 12.33 12.33 12.33 12.33 12.33 12.33
ESA Credit - (8.40) (8.40) (8.55) (8.55) (8.70)
79.96$ 78.30$ 81.87$ 85.44$ 89.31$ 93.24$
Padre Dam Systems Charge 23.50 25.85 27.10 28.40 29.75 31.15
CWA IAC Charge* 2.60 2.60 2.60 2.60 2.60 2.60
Monthly Water Bill* $ 106.06 $ 106.75 $ 111.57 $ 116.44 $ 121.66 $ 126.99
Overall Bill Effect* 0.65% 4.52% 4.36% 4.48% 4.38%
* Excludes future external passthrough increases.
Estimated Hundred Cubic Feet (HCF) Used per Month
EASTERNTypical Monthly Water Bill
Budget FY '13 - FY '17
PROPOSED / BUDGET
2013-2017 Business Plan & Budget | 82

Page 83
CONTENTS I. Introduction 1. Team Members 2. Organization Chart 3. Strategic Plan Goal and Initiatives: FY 13 - 17 4. Five Year Business Plan: FY 13 - 17
A. Capital Improvement Program B. Advertising & Marketing C. Budget & Rates D. Recreation Programs & Events E. Preventative & Predictive Maintenance F. Trends & Projections G. Grant & Fundraising Programs
SANTEE LAKESFIVE-YEAR BUSINESS PLAN
2013-2017

2013-2017 Business Plan and Budget | Page 84
Santee Lakes Five-Year Business Plan: FY 13 - 17 I. Introduction: The Santee Lakes Recreation Preserve’s (Santee Lakes) staff is responsible for the effective, efficient operation and promotion of Santee Lakes. The staff is committed to providing park, camping and recreational services preferred by the public, and keeping Santee Lakes operationally self-sufficient. Santee Lakes is also committed to hosting several community celebration events to promote recreational opportunities and build District and community goodwill.
The Five Year Business Plan and Budget for Fiscal Years 2007–2012 (2007 Plan) was a roadmap to maintain park efficiencies while laying the groundwork for expansion in the future. From its adoption in 2007, Santee Lakes’ staff has achieved many of the plan’s goals while altering others to suit the expectations of its patrons and guests. Similar to the 2007 Plan, the new Five Year Business Plan for Fiscal Years 2013-2017 (Plan) seeks to position Santee Lakes as an industry leader in community service, environmental stewardship and park & recreation management. The successful achievement of these goals along with a strengthened connection between Santee Lakes and Padre Dam Municipal Water District (Padre Dam) will continue to serve as a testament to the benefits of water recycling and innovative park and recreation planning.
Santee Lakes is an impressive symbol of Padre Dam’s pioneering efforts in recycled water, dating back to 1959. It is a water management, conservation and recreation model for communities worldwide. As a leader in the recreation and campground industry, Santee Lakes provides a variety of services to the local and broader community. Santee Lakes was placed “on the map” in the early sixties for its water recycling success. The intent is to place Santee Lakes “on the map” for world-class customer service, recreation programming, campground management and state-of-the-art facilities.
Managing and developing Santee Lakes as an enterprise operation is at the core of this Plan. Each phase must consider self-sufficiency as the primary goal. With that in mind, community events and programs, development projects, preventive and predictive maintenance, advertising and long-term planning will employ strategies that center around entrepreneurial public administration. 1. Team Members: Johnathan Skinner (Park & Recreation Director), Cindy Smith (Park & Recreation Supervisor), Bryan Hague (Park & Recreation Supervisor), Shawna Fakhouri (Grant Writer), Kevin Woo (Accounting Manager), Greg Even (Park and Recreation Coordinator) and Therese Pepin (Park and Recreation Coordinator).

2013-2017 Business Plan and Budget | Page 85
2. Organization Chart:

2013-2017 Business Plan and Budget | Page 86
3. Strategic Plan Goals and Initiatives: In April 2012, the Board of Directors approved the District’s Strategic Plan for the next ten years. For Santee Lakes, it will be the catalyst to maintain and enhance the recreational experience at our facility. The mission of Santee Lakes is “to develop Santee Lakes into a world-class park and campground with input from stakeholders while utilizing the highest design standards”. Based on this mission, the goal is to “Expand Park and Recreation Opportunities” at Santee Lakes. This will be accomplished through six initiatives that will be the roadmap for our continued success. Initiative #1: DEVELOP NEW MASTER PLAN FOR SANTEE LAKES
Key Success Measures Completion of preliminary plan research. Develop new Master Plan. Maintain financial self-sufficiency. Publish and implement plan.
Initiative #2: ENHANCE FACILITIES
Key Success Measures Develop and implement CIP schedule based on new Master Plan and preventive and
predictive maintenance process. Complete current improvements. Identify funding sources to secure grants. Research opportunities to enhance facilities while being fiscally responsible.
Initiative #3: INCREASE PARK SERVICES AND RECREATION PROGRAMS
Key Success Measures Improve Wi-Fi services within the park by 30%. Expand product variety at the General Store. Provide rental transportation for campground guests. Evaluate campground expansion opportunities. Evaluate and implement new picnic program to increase revenue by 10%. Develop relationships with the City of Santee and other municipalities to offer joint
programming. Initiative #4: CONDUCT MARKETING AND COMMUNITY OUTREACH
Key Success Measures Develop marketing strategies to new customers. Meet with community groups once per year.
Initiative #5: MAINTAIN COMMITMENT TO SUSTANABILITY
Key Success Measures Maintain current recycling policies and procedures. Utilize green services in park designs. Convert day use restrooms to solar power. Educate guests and the community of the Park’s efforts to remain sustainable with
presentations once per year and development of sustainable educational media. Initiative #6: CONDUCT PREVENTIVE AND PREDICTIVE MAINENTANCE
Key Success Measures Implement and maintain an aggressive equipment replacement process.

2013-2017 Business Plan and Budget | Page 87
Review “best practices” of similar agencies to stay up to date with current trends. Continue preventive and predictive maintenance program using GIS based software.
4. Five-Year Business Plan FY13-17 Over the next five years, staff will use proven methods of capital improvement planning, advertising and marketing, budgeting and rate analysis, recreation programs and events, preventive and predictive maintenance, and grant and fundraising opportunities to achieve the six initiatives outlined above.
A) CAPITAL IMPROVEMENT PROGRAM (CIP) AND CAPITAL EQUIPMENT PLAN (CEP)
OBJECTIVES Select development projects that meet visitor needs while providing revenue
generating opportunities. Meet project target dates. Maintain reserves at or near $500,000; use cash from operations and grant funding
to support the CIP.
CAPITAL IMPROVEMENT PROGRAM SCHEDULE Project FY 13 FY 14 FY 15 FY 16 FY 17 Total
Lake 5 Shelter Replacement $456K
Park Admin Office Expansion $200K
Campground Restroom/Shower $200K
Park Clubhouse Expansion $150K
Park CUP Amendment 3 $50K
Park Day Use Landscape Improvement $150K
Park Day Use Restroom Renovation $150K
ADA Compliance (On-Going) $75K
Paving (On-Going) $100K
Santee Lakes Master Plan $75K
Park Fence Replacement (On-Going) $100K
Annual CIP Budget $686K $255K $330K $255K $180K $1.706M
Design/Approval
Construction
The Capital Improvement Program Schedule is a template for potential project implementation for the next five years. The current items listed are a compilation of some previously planned projects, and includes tools to go forward into the future. The Santee Lakes Master Plan, the Conditional Use Permit (CUP), along with the Padre Dam Strategic Plan will give better guidance on opportunities for larger enhancements of the facility on a longer term basis and could identify expansion. As the 21/21 Plan of 2007 brought ideas such as the RV Storage Yard and the Cabin projects to reality, the new Santee Lakes Master Plan has the opportunity to also give that roadmap for growth.

2013-2017 Business Plan and Budget | Page 88
CAPITAL EQUIPMENT PLAN SCHEDULE Project FY 13 FY 14 FY 15 FY 16 FY 17 Total
Computer Server $25K
Gator Maintenance $10K
Maintenance Yard Car Port $10K
Peddle Boats $50K
Pontoon Boat Replacement/Repair $20K
Replace B-14 Patrol Truck Replacement $30K
Replace B-26 Patrol Truck Replacement $30K
Replace B-44 Van Replacement $20K
Replace B27 (Explorer) $30K
Tractor Replacement $35K
WiFi Systems $37K
AC – Park Building $40K
Lake 1 Dock $35K
Cabins AC Units $30K
Trash Receptacle Lids $10K
Storage Unit\Container $30K
Radio System Upgrade $7K
Copiers $20K
Generator Installation $75K
Golf Cart Replacement $30K
Annual CEP Budget $214K $80K $117.5K $95K $67.5K $574K
* The above CIP and CEP schedules are aggressive. It is important to note that the Plan does not call for debt financing and that the goal is to maintain reserves at or near $500,000. As a result, projects and equipment purchases will be delayed if sufficient funds from operations cannot cover expenses. Staff will aggressively pursue grant funding to bridge the gap between project costs and available funds from operations.

2013-2017 Business Plan & Budget | Page 89
B) ADVERTISING AND MARKETING
OBJECTIVES: Develop advertising programs to maximize participation in the campground and the
day use area. Outsource design services where appropriate. Establish connections between Padre Dam and Santee Lakes in the overall
marketing plan. Research new avenues for marketing and advertising. Utilize technology in the development and delivery of marketing materials.
Organization Affiliations: San Diego Visitor’s Bureau San Diego East Visitor’s Bureau California Park & Recreation Society National Recreation & Parks Association California Travel Park Association National Association of RV Parks and Campgrounds Santee Kiwanis Club Santee-Lakeside Rotary Club Rancho Santee Lions Club Sample Designs:
AAA
POST CARD
BROCHURE SPECIALTY
TRAIL LIFE

2013-2017 Business Plan & Budget | Page 90
ANNUAL MARKETING SCHEDULES
CAMPGROUND DAY USE – GENERAL
Publication/Area Distribution Size Annual Renewal Date
Quarter Implemented Each Year:
1 2 3 4 California Visitor’s Guide 50,000 January
County of San Diego Park & Rec Guide 10,000 June
San Diego East Visitor’s Bureau Map 250,000 January
Western Outdoor News 100,000 June
San Diego Visitor’s Bureau 10,000 January
San Diego Family Magazine 120,000 Varies
Direct Mail – General Marketing 10,000 Varies
Smartpages.com 90,000 August
E-Mail Promotions 50,000 Varies
Cable TV Commercials 250,000 homes Varies
Newspaper Ad 1,000,000 Varies
Special Event Specific Promotion 10,000 Varies
Fishing Specific Promotion 10,000 Varies
Santee Lakes Website Updates 7,500 hits/month avg Monthly
C) BUDGETING AND RATE ANALYSIS
OBJECTIVES: Establish rates based on market comparisons with consideration given to CPI. Analyze programs and services on a regular basis to determine cost effectiveness. Implement process improvements to achieve greater efficiency and productivity. Achieve a positive change in net assets every year. Maintain reserves at or near $500,000. Staffing levels: 10 full-time with between 10 and 15 part-time. In year 2 convert
one 3/4-time staff person to full-time.
Publication/Area Distribution Size Annual Renewal Date
Quarter Implemented Each Year:
1 2 3 4 Trailer Life Directory 300,000 January RV Journal 140,000 January Yellow Page Ads 800,000 August Work Camper Magazine 16,000 February CTPA Camping Guide 50,000 2 times/year CTPA Rack Card Distribution Program 1,150 January Certified / Nationwide Rack Cards 100,000 Varies ARVC – Go Rving Campaign Natl. Ad Campaign September Sunset Travel Magazine Ad 300,000 July Direct Mail – Fall Special 10,000 Varies Trailerlifedirectory.com 1,004,391 January GoCampingAmerica.com 200,000 NA

2013-2017 Business Plan & Budget | Page 91
FIVE-YEAR BUDGET:
FY 12 FY 13 FY 14 FY 15 FY 16 FY 17
Projection Yr 1 Yr 2 Yr 3 Yr 4 Yr 5
Entrance Fees 304,622 290,435 291,880 293,325 294,770 296,215
Reserved Area Fees 119,100 145,015 163,605 171,990 171,990 171,990
Fishing Fees 274,860 284,991 286,409 287,827 289,245 290,663
Boat Rental 68,636 77,393 77,778 78,163 78,548 78,933
Community Recreation Fees 36,544 43,020 43,020 43,020 43,020 43,020
RV & Tent Sites 2,568,470 2,512,359 2,642,394 2,738,429 2,920,464 3,033,500
Cabin Fees 338,299 254,430 256,616 258,801 260,987 263,172
RV Storage 370,540 417,893 417,893 417,893 417,893 417,893
Propane 7,052 5,409 5,409 5,409 5,409 5,409
Utilities 110,189 91,116 91,116 91,116 91,116 91,116
Laundry 25,244 23,222 23,222 23,222 23,222 23,222
Other Revenues 17,184 0 0 0 0 0
Store Sales/Concession Fees 239,816 245,965 245,965 245,965 245,965 245,965
Total Revenue 4,480,556 4,391,248 4,545,307 4,655,160 4,842,629 4,961,098
Salaries & Wages 836,853 921,980 965,091 1,009,009 1,095,725 1,167,290
Employee Benefits 498,215 554,251 589,282 611,663 660,626 714,380
Professional Services 118,689 277,666 267,922 271,187 247,042 246,791
Vehicle and Equipment 74,967 66,170 74,760 77,760 81,012 84,288
Building, Materials/Repairs, etc. 597,744 467,482 488,592 507,205 532,737 516,117
Administrative 111,511 163,556 167,780 166,314 170,320 158,120
Utilities 517,060 421,184 437,556 456,000 474,808 494,600
Direct Costs 274,589 252,760 253,296 253,833 254,370 254,907
Billing Credits -24,592 -30,000 -15,000 -20,000 -10,000 -10,000
Overhead 119,317 116,174 119,558 121,963 127,149 134,594
Total Expense 3,124,353 3,211,223 3,348,837 3,454,934 3,633,789 3,761,087
Operating Income (Loss) before deprec 1,356,203 1,180,025 1,196,470 1,200,226 1,208,840 1,200,011
Depreciation-direct -673,604 -765,702 -810,843 -830,684 -852,812 -858,454
Depreciation-indirect -82,219 -84,450 -134,528 -138,976 -142,612 -149,367
Amortization -12,626 -12,798 -12,798 -12,798 -12,798 -12,798
Operating Income (Loss) after deprec 587,754 317,075 238,301 217,768 200,618 179,392
Interest Income 9,730 4,738 4,670 11,585 13,787 25,483
Interest Expense -256,571 -250,043 -236,809 -222,615 -207,568 -191,615
Interest Assessment 0 0 0 0 0 0
Other Income/(Expense) -100,000 0 0 0 0 0
Total Non-Operating Income/(Expenses) -346,841 -245,305 -232,139 -211,030 -193,781 -166,132
Change In Net Assets 240,913 71,770 6,162 6,738 6,837 13,260

2013-2017 Business Plan & Budget | Page 92
Revenue Assumptions and Adjustment Information: In calculating revenue projections for the Plan, working within the pre-approved fee ranges, staff utilized the following information to develop the revenue assumptions: Entrance Fees: No fee increases scheduled during the Plan. However, using a two year average (FY 10 and FY 11), the budgeted attendance is increased by .5% per year (i.e. FY 13 is higher than average, FY 14 is 1.0% higher than average, etc.) Reserved Area Fees: Fee increases are scheduled in years 1 and 2 only. With the completion of the three shelters in the Day Use areas, fees have been adjusted 15 percent annually for the first two years. Larger increases are for “All Area” rentals used mainly by corporations, businesses, and unions. All reserved area fees are for a full day rental. The previous fee increase in the reserved areas occurred in 2010 and was an average increase of 20%. Fishing Permits: No fee increases are scheduled during the Plan. This is based on Santee Lakes fees compared to the market rate of similar facilities. Fishing total revenue is anticipated to increase due to increased participation. The budgeted participation increase is based on a two year average (FY 10 and FY 11), and increased by .5% per year. Boat Rental: No fee increases are scheduled during the Plan. Addition of sailboats based on cost recovery with 200 uses per year for three years. Boating total revenue is anticipated to increase due to increased participation. The budgeted participation increase is based on a two year average (FY 10 and FY 11), and increased by .5% per year. Community Recreation Fees: No fee increases are scheduled during the Plan. There is a small increase in total revenue in the first year of the plan compared FY 12 then remains flat during the 5 years. RV & Tent Sites: Fees are scheduled to increase $1 per night every January 1 per site. This has been past practice for the previous ten years of Park operations. Cabin Fees: Fees are scheduled to increase $1 per night every January 1 per unit. This practice will model the existing Campground fee adjustment practice. A fee for low income visitors and a cleaning fee for one night stays have been added. RV Storage: No fee increases are scheduled during the Plan. This program is currently operating at 95% capacity. Propane: No fee increases are scheduled during the Plan. Utilities: No fees increases are scheduled during the Plan. The budget assumed an average of FY 10 and FY 11 revenue and remains flat during the Plan. Laundry: No fees increases are scheduled during the Plan. The budget assumed an average of FY 10 and FY 11 revenue and remains flat during the Plan. *See next page for detailed assumption number and data.

2013-2017 Business Plan & Budget | Page 93
Budge
t A
ssum
pti
ons
(Yr
1)
FY
E's
June
30,
2013-2
017
Des
crip
tion
Not
esFY
13
FY 1
4FY
15
FY 1
6FY
17
Tot
al
Entr
ance
- V
isit
ors
(pai
d)(1
.)
7
4,95
8
7
5,33
1
7
5,70
4
7
6,07
7
7
6,45
0 37
8,52
1
Re
serv
e Ar
ea -
Wee
kday
15.0
%15
.0%
15.0
%15
.0%
15.0
%--
-Re
serv
e Ar
ea -
Wee
kend
25.0
%25
.0%
25.0
%25
.0%
25.0
%--
-Fi
sh P
erm
its
(1.)
39,
970
40,
169
40,
368
40,
567
40,
766
201,
840
Boat
Per
mit
s(1
.)
6
,707
6
,740
6
,774
6
,807
6
,840
33
,868
Cam
ping
Nig
hts
- To
tal (
site
s av
aila
ble)
1
09,5
00
1
09,5
00
109,
500
1
09,5
00
1
09,5
00
547,
500
Cam
ping
Nig
hts
- Ex
isti
ng (
site
s av
aila
ble)
61,
320
61,
320
61,
320
61,
320
61,
320
306,
600
Cam
ping
Nig
hts
- N
ew (
site
s av
aila
ble)
48,
180
48,
180
48,
180
48,
180
48,
180
240,
900
Cam
ping
- T
otal
Occ
upan
cy %
(2.)
82.1
%82
.1%
82.1
%82
.1%
82.1
%--
-Ca
mpi
ng -
Exi
stin
g O
ccup
ancy
%(2
.)77
.8%
77.8
%77
.8%
77.8
%77
.8%
---
Cam
ping
- N
ew O
ccup
ancy
%(2
.)87
.6%
87.6
%87
.6%
87.6
%87
.6%
---
Cam
ping
Nig
hts
- To
tal (
sold
)
8
9,91
3
8
9,91
3
8
9,91
3
8
9,91
3
8
9,91
3 44
9,56
3
Ca
mpi
ng N
ight
s -
Exis
ting
(so
ld)
47,
707
47,
707
47,
707
47,
707
47,
707
238,
535
Cam
ping
Nig
hts
- N
ew (
sold
)
4
2,20
6
4
2,20
6
4
2,20
6
4
2,20
6
4
2,20
6 21
1,02
8
Ca
bins
Nig
hts
- O
ccup
ied
(10
site
s, 3
,650
tot
al)
2,1
85
2,1
85
2,1
85
2,1
85
2,1
85
10,9
27
Ca
bins
- O
ccup
ancy
%59
.9%
59.9
%59
.9%
59.9
%59
.9%
---
RV S
tora
ge S
ites
- O
ccup
ied
(313
sto
rage
sit
es,
3,75
6 to
tal)
3,5
88
3,
588
3,5
88
3,5
88
3,5
88
17,9
40
RV
Sto
rage
Sit
es -
Occ
upan
cy %
(3.)
95.5
%95
.5%
95.5
%95
.5%
95.5
%--
-Pr
opan
e, U
tilit
ies,
& L
aund
ry R
even
ues
aver
age
of 2
009/
10 &
av
erag
e of
200
9/10
&
aver
age
of 2
009/
10 &
av
erag
e of
200
9/10
&
aver
age
of 2
009/
10 &
Entr
ance
(w
eekd
ay /
wee
kend
)(4
.) $
3 /
$5
$3
/ $5
$
3 /
$5
$3
/ $5
$
3 /
$5
---
Rese
rve
Area
incr
ease
d on
Jan
1 (
ever
y FY
), p
er p
rk c
omm
ttee
in
crea
sed
on J
an 1
(ev
ery
FY),
per
prk
com
mtt
ee
kep
t sa
me
as 2
013/
14
kep
t sa
me
as 2
013/
14
kep
t sa
me
as 2
013/
14
---
Fish
Per
mit
s (a
dult
/ j
unio
r /
extr
a)(4
.) $
9 /
$6 /
$4
$9
/ $6
/ $
4 $
9 /
$6 /
$4
$9
/ $6
/ $
4 $
9 /
$6 /
$4
---
Boat
Per
mit
s(4
.) $
8 -
$15
$8
- $1
5 $
8 -
$15
$8
- $1
5 $
8 -
$15
---
Cam
ping
in
crea
sed
$1/n
ight
on
Jan
1 (e
very
FY)
in
crea
sed
$1/n
ight
on
Jan
1 (e
very
FY)
in
crea
sed
$1/n
ight
on
Jan
1 (e
very
FY)
in
crea
sed
$1/n
ight
on
Jan
1 (e
very
FY)
in
crea
sed
$1/n
ight
on
Jan
1 (e
very
FY)
--
-
Cabi
ns in
crea
sed
$1/n
ight
on
Jan
1 (e
very
FY)
in
crea
sed
$1/n
ight
on
Jan
1 (e
very
FY)
in
crea
sed
$1/n
ight
on
Jan
1 (e
very
FY)
in
crea
sed
$1/n
ight
on
Jan
1 (e
very
FY)
in
crea
sed
$1/n
ight
on
Jan
1 (e
very
FY)
RV
Sto
rage
Sit
es
(4.)
$55
- $
125
$55
- $
125
$55
- $
125
$55
- $
125
$55
- $
125
---
Prop
ane,
Fis
h, &
Sto
re P
urch
ases
(Di
rect
Cos
t)(5
.)ra
tio
of d
irec
t co
st t
o ra
tio
of d
irec
t co
st t
o ra
tio
of d
irec
t co
st t
o ra
tio
of d
irec
t co
st t
o ra
tio
of d
irec
t co
st t
o Re
gula
r
1
1.00
1
1.00
1
1.00
1
1.80
1
2.00
--
-Te
mps
4
.60
4
.60
4
.60
4
.60
4
.60
---
Tota
l FTE
's
1
5.60
1
5.60
1
5.60
16.4
0
1
6.60
O
verh
ead
5%
Acct
g &
Adm
in,
6% H
R,
5%
Acct
g &
Adm
in,
6% H
R,
5%
Acct
g &
Adm
in,
6% H
R,
5%
Acct
g &
Adm
in,
6% H
R,
5%
Acct
g &
Adm
in,
6% H
R,
---
Depr
ecia
tion
(6.)
Calc
ulat
edCa
lcul
ated
Calc
ulat
edCa
lcul
ated
Calc
ulat
ed--
-In
tere
st E
xpen
se (
2004
CO
P &
Cab
ins)
(7.)
Amor
tiza
tion
Tab
leAm
orti
zati
on T
able
Amor
tiza
tion
Tab
leAm
orti
zati
on T
able
Amor
tiza
tion
Tab
le--
-
(1.)
= T
he n
umbe
r of
cus
tom
ers
used
for
bud
get
star
ts w
ith
two
year
ave
rage
of
actu
al F
Y 10
& 1
1, a
nd in
crea
ses
by .
5% p
er y
ear
(ie
. FY
13
is .
5% h
ighe
r th
an a
vera
ge,
FY 1
4 is
1.0
% hi
gher
tha
n av
erag
e, e
tc.)
.(2
.) =
The
cam
psit
e oc
cupa
ncy
rate
use
d fo
r bu
dget
is a
thr
ee y
ear
aver
age
of a
ctua
l FY
09 -
FY
11.
(3.)
= T
he r
v st
orag
e oc
cupa
ncy
rate
is b
ased
on
curr
ent
occu
panc
y (c
urre
ntly
onl
y 14
sit
es a
re v
acan
t).
(4.)
= T
he r
ates
/fee
s us
ed f
or b
udge
t (l
iste
d) a
re b
ased
on
curr
ent
park
rat
es/f
ees
(ie.
no
incr
ease
in r
ate/
fee
budg
eted
ove
r FY
13-
17).
(5.)
= T
he d
irec
t co
st (
prop
ane,
fis
h, &
sto
re p
urch
ases
) is
a r
atio
of
rela
ted
purc
hase
s to
rev
enue
s. T
he r
atio
is c
alcu
late
d fr
om F
Y 11
FS
and
then
app
lied
to b
udge
ted
reve
nue
for
prop
ane,
fis
h, &
sto
re s
ales
.(6
.) =
The
dep
reci
atio
n in
clud
es d
irec
t/in
dire
ct.
Dir
ect
is b
ased
on
curr
ent
park
ass
ets
plus
pro
ject
ion
for
new
ass
ets
from
clo
sing
of
CIP.
Ind
irec
t is
par
k's
shar
e of
adm
in d
epre
ciat
ion
shar
ed b
y al
l ope
rati
ons.
(7.)
= T
he in
tere
st e
xpen
se is
"ab
ove
line"
and
aff
ects
bot
tom
line
net
inco
me.
The
pri
ncip
al p
orti
on o
f "d
ebt
serv
ice"
is "
belo
w li
ne"
(sim
ilar
to C
IP/e
quip
men
t).

2013-2017 Business Plan & Budget | Page 94
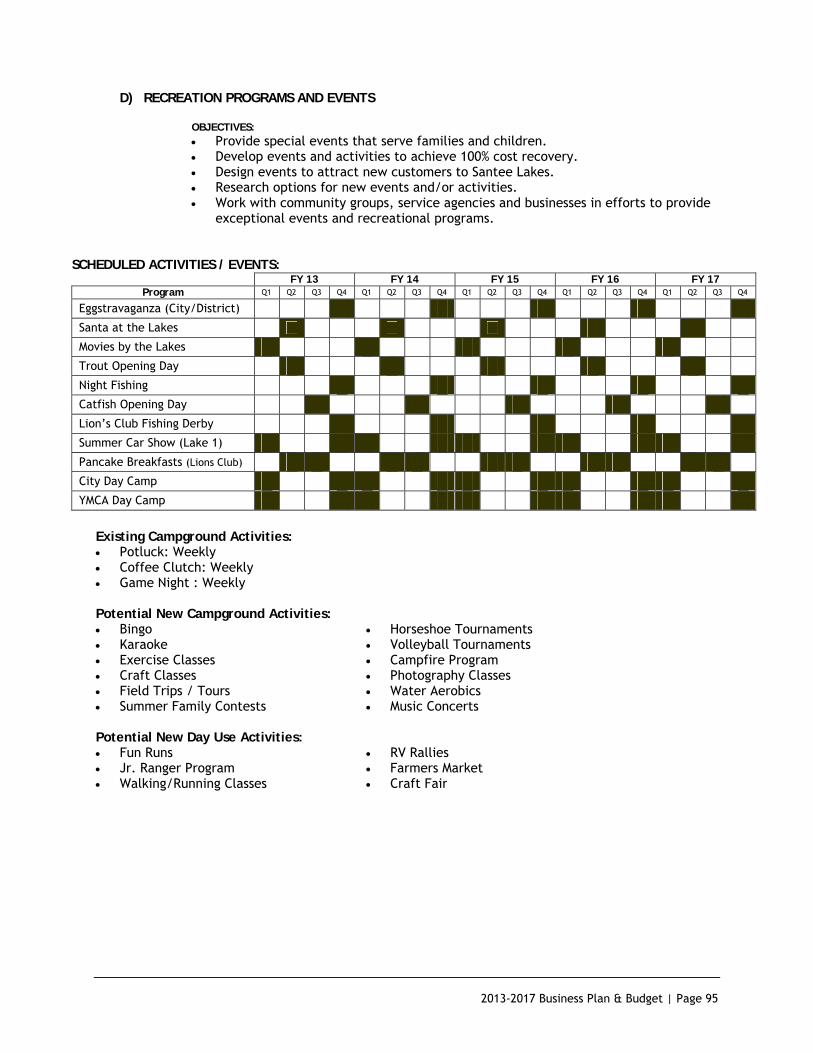
2013-2017 Business Plan & Budget | Page 95
D) RECREATION PROGRAMS AND EVENTS
OBJECTIVES: Provide special events that serve families and children. Develop events and activities to achieve 100% cost recovery. Design events to attract new customers to Santee Lakes. Research options for new events and/or activities. Work with community groups, service agencies and businesses in efforts to provide
exceptional events and recreational programs.
SCHEDULED ACTIVITIES / EVENTS: FY 13 FY 14 FY 15 FY 16 FY 17
Program Q1 Q2 Q3 Q4 Q1 Q2 Q3 Q4 Q1 Q2 Q3 Q4 Q1 Q2 Q3 Q4 Q1 Q2 Q3 Q4
Eggstravaganza (City/District) Santa at the Lakes Movies by the Lakes Trout Opening Day Night Fishing Catfish Opening Day Lion’s Club Fishing Derby Summer Car Show (Lake 1) Pancake Breakfasts (Lions Club) City Day Camp YMCA Day Camp
Existing Campground Activities: Potluck: Weekly Coffee Clutch: Weekly Game Night : Weekly Potential New Campground Activities: Bingo Horseshoe Tournaments Karaoke Volleyball Tournaments Exercise Classes Campfire Program Craft Classes Photography Classes Field Trips / Tours Water Aerobics Summer Family Contests Music Concerts Potential New Day Use Activities: Fun Runs RV Rallies Jr. Ranger Program Farmers Market Walking/Running Classes Craft Fair

2013-2017 Business Plan & Budget | Page 96
E) PREVENTIVE AND PREDICTIVE MAINTENANCE
OBJECTIVES: Map and inventory assets utilizing the new asset management software system,
Land Logic. Establish maintenance schedules for each asset. Establish a replacement schedule for each asset. Conduct regular inspections to avoid asset failure. Develop systems to implement the maintenance program and continued updates to
Land Logic. Land Logic: Land Logic is an asset management program purchased in 2006. It is a map-based asset management software system which allows staff to do the following: Monitor workload by person or workgroup Redirect tasks & priorities Ensure completeness Assess performance Mitigate risk Provide a central focus for planning & budgeting Improve the consistency and effectiveness of operations Locate assets Assess condition Capture identifying information (serial number, ID's, etc.) Determine quantity (area, linear feet, etc.) Asset inventories Material consumption Man-hours consumed Average completion time Average maintenance costs Capital replacement costs
Santee Lake’s staff has mapped all assets (i.e. buildings, mechanical systems, trees, landscape areas, playgrounds, picnic areas, turf areas, etc.). Staff input data for each asset, assign a maintenance and replacement schedule, assign staff to tasks and provide valuation for each asset.

2013-2017 Business Plan & Budget | Page 97
PREVENTIVE MAINTENANCE SCHEDULE FY13-17
FY 13 FY 14 FY 15 FY 16 FY 17
Program Q1 Q2 Q3 Q4 Q1 Q2 Q3 Q4 Q1 Q2 Q3 Q4 Q1 Q2 Q3 Q4 Q1 Q2 Q3 Q4 Playground Inspections (6 ) 18 18 18 18 18 18 18 18 18 18 18 18 18 18 18 18 18 18 18 18 Playground Cleaning (6) 72 72 72 72 72 72 72 72 72 72 72 72 72 72 72 72 72 72 72 72 Playground Sand Maintenance 72 72 72 72 72 72 72 72 72 72 72 72 72 72 72 72 72 72 72 72 HVAC Unit Inspections (5 Units) 5 5 5 5 5 5 5 5 5 5 5 5 5 5 5 5 5 5 5 5 HVAC Replacement 1 1 General Building Inspections (4) 52 52 52 52 52 52 52 52 52 52 52 52 52 52 52 52 52 52 52 52 Roof Replacement 1 1 1 1 Preserve Utilities Inspections 13 13 13 13 13 13 13 13 13 13 13 13 13 13 13 13 13 13 13 13 Fishing Pier Inspections (4) 52 52 52 52 52 52 52 52 52 52 52 52 52 52 52 52 52 52 52 52 Fishing Pier Cleaning (4) 12 12 12 12 12 12 12 12 12 12 12 12 12 12 12 12 12 12 12 12 Trees Serviced 3 3 3 3 3 3 3 3 3 3 3 3 3 3 3 3 3 3 3 3 Aerate and Fertilize 1 2 1 2 1 2 1 2 1 2 Weed Abatement 13 6 20 30 13 6 20 30 13 6 20 30 13 6 20 30 13 6 20 30 Turf Area Overseed 1 1 1 1 1 Irrigation System Inspections 91 91 91 92 91 91 91 92 91 91 91 92 91 91 91 92 91 91 91 92 Picnic Area Inspections (18) 234 234 234 234 234 234 234 234 234 234 234 234 234 234 234 234 234 234 234 Preserve Safety Inspections 91 91 91 92 91 91 91 92 91 91 91 92 91 91 91 92 91 91 91 92 Lake Monitoring (7) 182 182 182 182 182 182 182 182 182 182 182 182 182 182 182 182 182 182 182 182 Lake Weed Removal (7) 22 7 0 7 22 7 0 7 22 7 0 7 22 7 0 7 22 7 0 7 Lake Weed Chem. Applications 6 3 1 15 6 3 1 15 6 3 1 15 6 3 1 15 6 3 1 15 Campground Stream Cleaning 12 12 12 12 12 12 12 12 12 12 12 12 12 12 12 12 12 12 12 12 Golf Cart Inspections (10) 130 130 130 130 130 130 130 130 130 130 130 130 130 130 130 130 130 130 130 130 Golf Cart Replacement 1 1 1 1 1 1 Restroom Inspections (9) 117 117 117 117 117 117 117 117 117 117 117 117 117 117 117 117 117 117 117 117 Restroom Cleaning (9) 819 819 819 820 819 819 819 820 819 819 819 820 819 819 819 820 819 819 819 820 Preserve Office Cleaning 91 91 91 92 91 91 91 92 91 91 91 92 91 91 91 92 91 91 91 92 PRC Office Cleaning 12 12 12 12 12 12 12 12 12 12 12 12 12 12 12 12 12 12 12 12 Clubhouse Cleaning 39 39 39 39 39 39 39 39 39 39 39 39 39 39 39 39 39 39 39 39 Laundry Room Cleaning 91 91 91 92 91 91 91 92 91 91 91 92 91 91 91 92 91 91 91 92 Exterior Building Cleaning (13) 169 169 169 169 169 169 169 169 169 169 169 169 169 169 169 169 169 169 169 169 Cabin Cleaning (10) 175 150 150 175 175 150 150 175 175 150 150 175 175 150 150 175 175 150 150 175 Cabin Inspections (10) 175 150 150 175 175 150 150 175 175 150 150 175 175 150 150 175 175 150 150 175 Carpet Cleaning (2) 2 2 2 2 2 Interior Structure Painting (8) 2 2 2 2 Exterior Structure Painting (13) 3 3 3 3 Floor Surfacing (12) 1 2 2 2 2 Pool Inspections (3) 273 273 273 273 273 273 273 273 273 273 273 273 273 273 273 273 273 273 273 273 Pool Filter Service 2 1 2 1 2 1 2 1 2 1 Boat Inspections (31) 403 403 403 403 403 403 403 403 403 403 403 403 403 403 403 403 403 403 403 403 Picnic Table Inspections (500) 250 250 250 250 250 250 250 250 250 250 250 250 250 250 250 250 250 250 250 250 Picnic Table Replacement 50 50 50 50 50 50 50 50 50 50 BBQ Inspections (18) 234 234 234 234 234 234 234 234 234 234 234 234 234 234 234 234 234 234 234 234 BBQ Replacement (18) 2 2 2 2 2 BBQ Clean Out 325 210 90 325 325 210 90 325 325 210 90 325 325 210 90 325 325 210 90 325 Hot Coal Container Inspection/Clean 182 182 182 182 182 182 182 182 182 182 182 182 182 182 182 182 182 182 182 182 Hot Coal Cont. Replacement 1 1 1 1 Campground Inspections 91 91 91 92 91 91 91 92 91 91 91 92 91 91 91 92 91 91 91 92 Campground Safety Inspections 91 91 91 92 91 91 91 92 91 91 91 92 91 91 91 92 91 91 91 92 Dumpster Enclosure Cleaning 156 156 156 156 156 156 156 156 156 156 156 156 156 156 156 156 156 156 156 156 RV Storage Inspections 3 3 3 3 3 3 3 3 3 3 3 3 3 3 3 3 3 3 3 3

2013-2017 Business Plan & Budget | Page 98
F) TRENDS AND PROJECTIONS
OBJECTIVES: Establish five year projections for campground occupancy, gate admissions, fishing
permits, boat rentals and picnic reservations. Establish future projections based on past use trends. Maintain the Santee Lakes Performance Report. Effectively communicate trends with the General Manager, Park Committee and
Board. Charts below reflect actual data from FY 08–FY11 and projections for FY 13-17.

2013-2017 Business Plan & Budget | Page 99
G) GRANT AND FUNDRAISING PROGRAMS
OBJECTIVES: Aggressively seek and research grant opportunities. Prepare thorough and competitive proposals to obtain funding. Participate in grant/funding trainings as they become available. Engage the local business community and invite them to participate in the
improvement projects as well as special event sponsorship. Use networking to establish relationships that will enhance the ability to obtain
funding.
GRANT SUBMITTAL SCHEDULE: Grant FY 13 FY 14 FY 15 FY 16 FY 17
Land and Water Conservation Fund Joint Foundation Grants Recycling Grants Miscellaneous Grants
Preparation Submittal
Opportunities to improve Santee Lakes’ ability to secure grant funding: Expand our existing Internet research tools. Continue attendance at local grant workshops. Use consultants to review applications prior to submittal. Maintain the County Grant Opportunities Email Alert system. Continue networking with professionals in field.


EXHIBIT A
OPERATING BUDGET
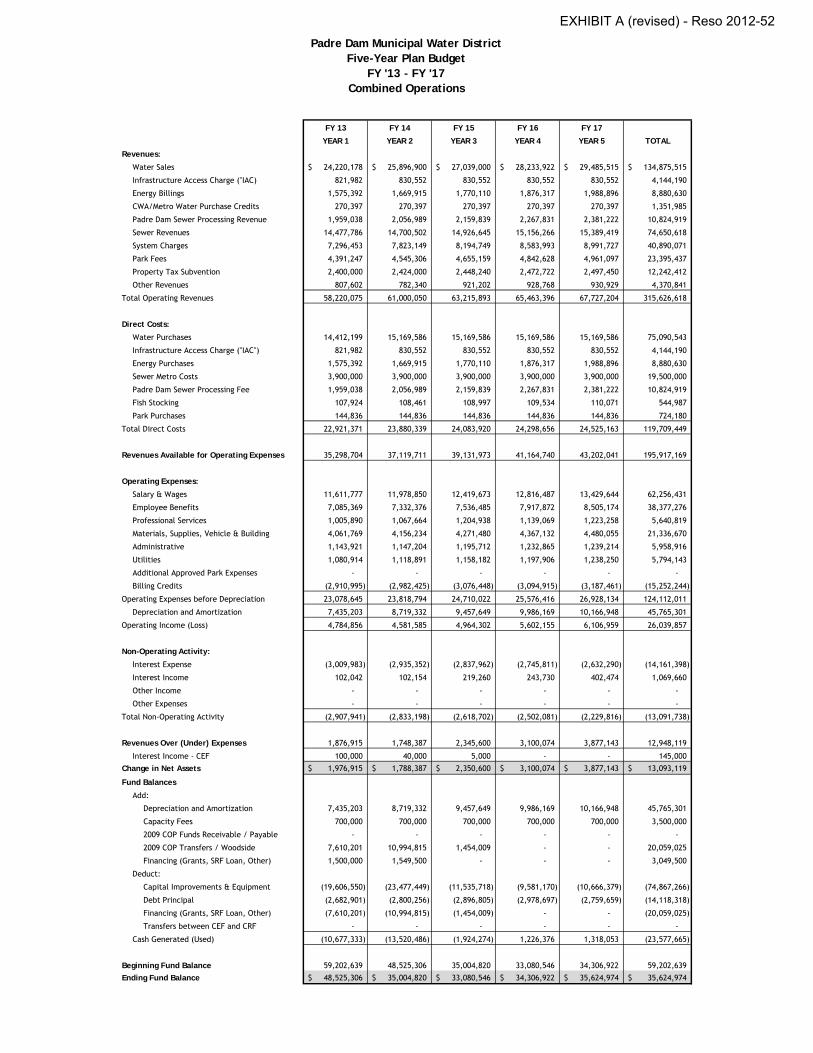
Padre Dam Municipal Water DistrictFive-Year Plan Budget
FY '13 - FY '17Combined Operations
FY 13 FY 14 FY 15 FY 16 FY 17
YEAR 1 YEAR 2 YEAR 3 YEAR 4 YEAR 5 TOTAL
Revenues:
Water Sales 24,220,178$ 25,896,900$ 27,039,000$ 28,233,922$ 29,485,515$ 134,875,515$
Infrastructure Access Charge ("IAC) 821,982 830,552 830,552 830,552 830,552 4,144,190
Energy Billings 1,575,392 1,669,915 1,770,110 1,876,317 1,988,896 8,880,630
CWA/Metro Water Purchase Credits 270,397 270,397 270,397 270,397 270,397 1,351,985
Padre Dam Sewer Processing Revenue 1,959,038 2,056,989 2,159,839 2,267,831 2,381,222 10,824,919
Sewer Revenues 14,477,786 14,700,502 14,926,645 15,156,266 15,389,419 74,650,618
System Charges 7,296,453 7,823,149 8,194,749 8,583,993 8,991,727 40,890,071
Park Fees 4,391,247 4,545,306 4,655,159 4,842,628 4,961,097 23,395,437
Property Tax Subvention 2,400,000 2,424,000 2,448,240 2,472,722 2,497,450 12,242,412
Other Revenues 807,602 782,340 921,202 928,768 930,929 4,370,841
Total Operating Revenues 58,220,075 61,000,050 63,215,893 65,463,396 67,727,204 315,626,618
Direct Costs:
Water Purchases 14,412,199 15,169,586 15,169,586 15,169,586 15,169,586 75,090,543
Infrastructure Access Charge ("IAC") 821,982 830,552 830,552 830,552 830,552 4,144,190
Energy Purchases 1,575,392 1,669,915 1,770,110 1,876,317 1,988,896 8,880,630
Sewer Metro Costs 3,900,000 3,900,000 3,900,000 3,900,000 3,900,000 19,500,000
Padre Dam Sewer Processing Fee 1,959,038 2,056,989 2,159,839 2,267,831 2,381,222 10,824,919
Fish Stocking 107,924 108,461 108,997 109,534 110,071 544,987
Park Purchases 144,836 144,836 144,836 144,836 144,836 724,180
Total Direct Costs 22,921,371 23,880,339 24,083,920 24,298,656 24,525,163 119,709,449
Revenues Available for Operating Expenses 35,298,704 37,119,711 39,131,973 41,164,740 43,202,041 195,917,169
Operating Expenses:
Salary & Wages 11,611,777 11,978,850 12,419,673 12,816,487 13,429,644 62,256,431
Employee Benefits 7,085,369 7,332,376 7,536,485 7,917,872 8,505,174 38,377,276
Professional Services 1,005,890 1,067,664 1,204,938 1,139,069 1,223,258 5,640,819
Materials, Supplies, Vehicle & Building 4,061,769 4,156,234 4,271,480 4,367,132 4,480,055 21,336,670
Administrative 1,143,921 1,147,204 1,195,712 1,232,865 1,239,214 5,958,916
Utilities 1,080,914 1,118,891 1,158,182 1,197,906 1,238,250 5,794,143
Additional Approved Park Expenses - - - - - -
Billing Credits (2,910,995) (2,982,425) (3,076,448) (3,094,915) (3,187,461) (15,252,244)
Operating Expenses before Depreciation 23,078,645 23,818,794 24,710,022 25,576,416 26,928,134 124,112,011
Depreciation and Amortization 7,435,203 8,719,332 9,457,649 9,986,169 10,166,948 45,765,301
Operating Income (Loss) 4,784,856 4,581,585 4,964,302 5,602,155 6,106,959 26,039,857
Non-Operating Activity:
Interest Expense (3,009,983) (2,935,352) (2,837,962) (2,745,811) (2,632,290) (14,161,398)
Interest Income 102,042 102,154 219,260 243,730 402,474 1,069,660
Other Income - - - - - -
Other Expenses - - - - - -
Total Non-Operating Activity (2,907,941) (2,833,198) (2,618,702) (2,502,081) (2,229,816) (13,091,738)
Revenues Over (Under) Expenses 1,876,915 1,748,387 2,345,600 3,100,074 3,877,143 12,948,119
Interest Income - CEF 100,000 40,000 5,000 - - 145,000
Change in Net Assets 1,976,915$ 1,788,387$ 2,350,600$ 3,100,074$ 3,877,143$ 13,093,119$
Fund Balances
Add:
Depreciation and Amortization 7,435,203 8,719,332 9,457,649 9,986,169 10,166,948 45,765,301
Capacity Fees 700,000 700,000 700,000 700,000 700,000 3,500,000
2009 COP Funds Receivable / Payable - - - - - -
2009 COP Transfers / Woodside 7,610,201 10,994,815 1,454,009 - - 20,059,025
Financing (Grants, SRF Loan, Other) 1,500,000 1,549,500 - - - 3,049,500
Deduct:
Capital Improvements & Equipment (19,606,550) (23,477,449) (11,535,718) (9,581,170) (10,666,379) (74,867,266)
Debt Principal (2,682,901) (2,800,256) (2,896,805) (2,978,697) (2,759,659) (14,118,318)
Financing (Grants, SRF Loan, Other) (7,610,201) (10,994,815) (1,454,009) - - (20,059,025)
Transfers between CEF and CRF - - - - - -
Cash Generated (Used) (10,677,333) (13,520,486) (1,924,274) 1,226,376 1,318,053 (23,577,665)
Beginning Fund Balance 59,202,639 48,525,306 35,004,820 33,080,546 34,306,922 59,202,639
Ending Fund Balance 48,525,306$ 35,004,820$ 33,080,546$ 34,306,922$ 35,624,974$ 35,624,974$
EXHIBIT A (revised) - Reso 2012-52

Padre Dam Municipal Water DistrictFive-Year Plan Budget
FY '13 - FY '17Retail Water Operations
FY 13 FY 14 FY 15 FY 16 FY 17
YEAR 1 YEAR 2 YEAR 3 YEAR 4 YEAR 5 TOTAL
Revenues:
Water Sales 23,090,570$ 24,713,613$ 25,799,512$ 26,935,627$ 28,125,623$ 128,664,945$
Infrastructure Access Charge ("IAC) 821,982 830,552 830,552 830,552 830,552 4,144,190
Energy Billings 1,575,392 1,669,915 1,770,110 1,876,317 1,988,896 8,880,630
CWA/Metro Water Purchase Credits - - - - - -
Padre Dam Sewer Processing Revenue - - - - - -
Sewer Revenues - - - - - -
System Charges 7,199,696 7,721,794 8,088,580 8,472,787 8,875,245 40,358,102
Park Fees - - - - - -
Property Tax Subvention 2,400,000 2,424,000 2,448,240 2,472,722 2,497,450 12,242,412
Other Revenues 792,602 767,340 906,202 913,768 915,929 4,295,841
Total Operating Revenues 35,880,242 38,127,214 39,843,196 41,501,773 43,233,695 198,586,120
Direct Costs:
Water Purchases 14,412,199 15,169,586 15,169,586 15,169,586 15,169,586 75,090,543
Infrastructure Access Charge ("IAC") 821,982 830,552 830,552 830,552 830,552 4,144,190
Energy Purchases 1,575,392 1,669,915 1,770,110 1,876,317 1,988,896 8,880,630
Sewer Metro Costs - - - - - -
Padre Dam Sewer Processing Fee - - - - - -
Fish Stocking - - - - - -
Park Purchases - - - - - -
Total Direct Costs 16,809,573 17,670,053 17,770,248 17,876,455 17,989,034 88,115,363
Revenues Available for Operating Expenses 19,070,669 20,457,161 22,072,948 23,625,318 25,244,661 110,470,757
Operating Expenses:
Salary & Wages 6,764,384 6,968,974 7,220,279 7,415,707 7,758,402 36,127,746
Employee Benefits 3,995,973 4,126,859 4,238,250 4,441,562 4,768,140 21,570,784
Professional Services 494,353 543,253 634,573 605,973 663,416 2,941,568
Materials, Supplies, Vehicle & Building 1,800,389 1,832,924 1,881,250 1,915,547 1,979,872 9,409,982
Administrative 497,397 496,757 522,153 539,118 548,317 2,603,742
Utilities 95,827 98,945 101,954 104,972 107,934 509,632
Additional Approved Park Expenses - - - - - -
Billing Credits (1,725,716) (1,777,487) (1,830,812) (1,847,864) (1,903,299) (9,085,178)
Operating Expenses before Depreciation 11,922,607 12,290,225 12,767,647 13,175,015 13,922,782 64,078,276
Depreciation and Amortization 4,955,243 5,893,746 6,439,970 6,677,552 6,645,918 30,612,429
Operating Income (Loss) 2,192,819 2,273,190 2,865,331 3,772,751 4,675,961 15,780,052
Non-Operating Activity:
Interest Expense (2,044,905) (2,009,340) (1,877,568) (1,809,963) (1,751,722) (9,493,498)
Interest Income 24,105 25,429 60,091 70,844 108,549 289,018
Other Income - - - - - -
Other Expenses - - - - - -
Total Non-Operating Activity (2,020,800) (1,983,911) (1,817,477) (1,739,119) (1,643,173) (9,204,480)
Revenues Over (Under) Expenses 172,019 289,279 1,047,854 2,033,632 3,032,788 6,575,572
Interest Income - CEF - - - - - -
Change in Net Assets 172,019$ 289,279$ 1,047,854$ 2,033,632$ 3,032,788$ 6,575,572$
Fund Balances
Add:
Depreciation and Amortization 4,955,243 5,893,746 6,439,970 6,677,552 6,645,918 30,612,429
Capacity Fees 379,534 379,534 379,534 379,534 379,534 1,897,670
2009 COP Funds Receivable / Payable 1,779,825 - - - - 1,779,825
2009 COP Transfers / Woodside 5,662,715 6,778,644 889,854 - - 13,331,213
Financing (Grants, SRF Loan, Other) - - - - - -
Deduct:
Capital Improvements & Equipment (9,617,849) (10,883,365) (5,733,815) (6,219,108) (8,779,402) (41,233,540)
Debt Principal (1,272,321) (1,332,791) (1,377,825) (1,410,930) (1,423,215) (6,817,082)
Financing (Grants, SRF Loan, Other) - - - - - -
Transfers between CEF and CRF (1,183,569) (1,625,003) (1,350,015) (625,526) (465,204) (5,249,317)
Cash Generated (Used) 875,596 (499,956) 295,557 835,153 (609,581) 896,770
Beginning Fund Balance 7,359,038 8,234,634 7,734,678 8,030,235 8,865,389 7,359,038
Ending Fund Balance 8,234,634$ 7,734,678$ 8,030,235$ 8,865,389$ 8,255,808$ 8,255,808$
EXHIBIT A (revised) - Reso 2012-52

Padre Dam Municipal Water DistrictFive-Year Plan Budget
FY '13 - FY '17Recycled Water Operations
FY 13 FY 14 FY 15 FY 16 FY 17
YEAR 1 YEAR 2 YEAR 3 YEAR 4 YEAR 5 TOTAL
Revenues:
Water Sales 1,129,608$ 1,183,287$ 1,239,488$ 1,298,295$ 1,359,892$ 6,210,570$
Infrastructure Access Charge ("IAC) - - - - - -
Energy Billings - - - - - -
CWA/Metro Water Purchase Credits 270,397 270,397 270,397 270,397 270,397 1,351,985
Padre Dam Sewer Processing Revenue 1,959,038 2,056,989 2,159,839 2,267,831 2,381,222 10,824,919
Sewer Revenues - - - - - -
System Charges 96,757 101,355 106,169 111,206 116,482 531,969
Park Fees - - - - - -
Property Tax Subvention - - - - - -
Other Revenues - - - - - -
Total Operating Revenues 3,455,800 3,612,028 3,775,893 3,947,729 4,127,993 18,919,443
Direct Costs:
Water Purchases - - - - - -
Infrastructure Access Charge ("IAC") - - - - - -
Energy Purchases - - - - - -
Sewer Metro Costs - - - - - -
Padre Dam Sewer Processing Fee - - - - - -
Fish Stocking - - - - - -
Park Purchases - - - - - -
Total Direct Costs - - - - - -
Revenues Available for Operating Expenses 3,455,800 3,612,028 3,775,893 3,947,729 4,127,993 18,919,443
Operating Expenses:
Salary & Wages 868,264 894,525 926,782 951,867 995,855 4,637,293
Employee Benefits 536,346 553,914 568,865 596,154 639,988 2,895,267
Professional Services 32,967 36,227 42,317 40,410 44,241 196,162
Materials, Supplies, Vehicle & Building 279,614 284,667 292,172 297,499 307,489 1,461,441
Administrative 73,639 73,543 77,303 79,814 81,176 385,475
Utilities 161,411 166,663 171,731 176,814 181,802 858,421
Additional Approved Park Expenses - - - - - -
Billing Credits (244,308) (251,638) (259,187) (261,601) (269,449) (1,286,183)
Operating Expenses before Depreciation 1,707,933 1,757,901 1,819,983 1,880,957 1,981,102 9,147,876
Depreciation and Amortization 633,735 758,718 843,428 897,822 969,603 4,103,306
Operating Income (Loss) 1,114,132 1,095,409 1,112,482 1,168,950 1,177,288 5,668,261
Non-Operating Activity:
Interest Expense (154,941) (132,243) (108,407) (83,029) (55,501) (534,121)
Interest Income 24,046 23,606 50,066 56,549 98,419 252,686
Other Income - - - - - -
Other Expenses - - - - - -
Total Non-Operating Activity (130,895) (108,637) (58,341) (26,480) 42,918 (281,435)
Revenues Over (Under) Expenses 983,237 986,772 1,054,141 1,142,470 1,220,206 5,386,826
Interest Income - CEF - - - - - -
Change in Net Assets 983,237$ 986,772$ 1,054,141$ 1,142,470$ 1,220,206$ 5,386,826$
Fund Balances
Add:
Depreciation and Amortization 633,735 758,718 843,428 897,822 969,603 4,103,306
Capacity Fees - - - - - -
2009 COP Funds Receivable / Payable - - - - - -
2009 COP Transfers / Woodside 65,610 103,855 - - - 169,465
Financing (Grants, SRF Loan, Other) - - - - - -
Deduct:
Capital Improvements & Equipment (1,157,056) (1,186,926) (581,827) (615,616) (456,168) (3,997,592)
Debt Principal (752,899) (778,674) (801,890) (825,664) (666,346) (3,825,473)
Financing (Grants, SRF Loan, Other) - - - - - -
Transfers between CEF and CRF (789,046) (1,083,335) (900,010) (417,017) (310,136) (3,499,545)
Cash Generated (Used) (1,016,420) (1,199,590) (386,158) 181,995 757,159 (1,663,013)
Beginning Fund Balance 5,753,993 4,737,573 3,537,983 3,151,826 3,333,821 5,753,993
Ending Fund Balance 4,737,573$ 3,537,983$ 3,151,826$ 3,333,821$ 4,090,980$ 4,090,980$
EXHIBIT A (revised) - Reso 2012-52

Padre Dam Municipal Water DistrictFive-Year Plan Budget
FY '13 - FY '17Sewer Operations
FY 13 FY 14 FY 15 FY 16 FY 17
YEAR 1 YEAR 2 YEAR 3 YEAR 4 YEAR 5 TOTAL
Revenues:
Water Sales -$ -$ -$ -$ -$ -$
Infrastructure Access Charge ("IAC) - - - - - -
Energy Billings - - - - - -
CWA/Metro Water Purchase Credits - - - - - -
Padre Dam Sewer Processing Revenue - - - - - -
Sewer Revenues 14,477,786 14,700,502 14,926,645 15,156,266 15,389,419 74,650,618
System Charges - - - - - -
Park Fees - - - - - -
Property Tax Subvention - - - - - -
Other Revenues 15,000 15,000 15,000 15,000 15,000 75,000
Total Operating Revenues 14,492,786 14,715,502 14,941,645 15,171,266 15,404,419 74,725,618
Direct Costs:
Water Purchases - - - - - -
Infrastructure Access Charge ("IAC") - - - - - -
Energy Purchases - - - - - -
Sewer Metro Costs 3,900,000 3,900,000 3,900,000 3,900,000 3,900,000 19,500,000
Padre Dam Sewer Processing Fee 1,959,038 2,056,989 2,159,839 2,267,831 2,381,222 10,824,919
Fish Stocking - - - - - -
Park Purchases - - - - - -
Total Direct Costs 5,859,038 5,956,989 6,059,839 6,167,831 6,281,222 30,324,919
Revenues Available for Operating Expenses 8,633,748 8,758,513 8,881,806 9,003,435 9,123,197 44,400,699
Operating Expenses:
Salary & Wages 2,994,821 3,085,400 3,196,661 3,283,183 3,434,906 15,994,971
Employee Benefits 1,960,975 2,025,206 2,079,869 2,179,642 2,339,906 10,585,598
Professional Services 197,219 216,728 253,160 241,750 264,667 1,173,524
Materials, Supplies, Vehicle & Building 1,446,023 1,472,154 1,510,969 1,538,515 1,590,180 7,557,841
Administrative 405,594 405,072 425,781 439,615 447,116 2,123,178
Utilities 395,982 408,866 421,300 433,770 446,008 2,105,926
Additional Approved Park Expenses - - - - - -
Billing Credits (910,971) (938,300) (966,449) (975,450) (1,004,713) (4,795,883)
Operating Expenses before Depreciation 6,489,643 6,675,126 6,921,291 7,141,025 7,518,070 34,745,155
Depreciation and Amortization 980,055 1,105,438 1,188,010 1,398,621 1,526,856 6,198,980
Operating Income (Loss) 1,164,050 977,949 772,505 463,789 78,271 3,456,564
Non-Operating Activity:
Interest Expense (46,608) (37,322) (27,758) (17,906) (7,287) (136,881)
Interest Income 49,153 48,449 97,518 102,550 170,023 467,693
Other Income - - - - - -
Other Expenses - - - - - -
Total Non-Operating Activity 2,545 11,127 69,760 84,644 162,736 330,812
Revenues Over (Under) Expenses 1,166,595 989,076 842,265 548,433 241,007 3,787,376
Interest Income - CEF - - - - - -
Change in Net Assets 1,166,595$ 989,076$ 842,265$ 548,433$ 241,007$ 3,787,376$
Fund Balances
Add:
Depreciation and Amortization 980,055 1,105,438 1,188,010 1,398,621 1,526,856 6,198,980
Capacity Fees 210,097 210,097 210,097 210,097 210,097 1,050,485
2009 COP Funds Receivable / Payable - - - - - -
2009 COP Transfers / Woodside 226,976 359,282 - - - 586,258
Financing (Grants, SRF Loan, Other) - - - - - -
Deduct:
Capital Improvements & Equipment (2,880,941) (2,962,277) (2,079,217) (1,609,716) (715,210) (10,247,361)
Debt Principal (309,606) (318,891) (328,455) (338,307) (252,242) (1,547,501)
Financing (Grants, SRF Loan, Other) - - - - - -
Transfers between CEF and CRF - - - - - -
Cash Generated (Used) (606,824) (617,275) (167,300) 209,128 1,010,508 (171,763)
Beginning Fund Balance 10,552,997 9,946,173 9,328,898 9,161,598 9,370,726 10,552,997
Ending Fund Balance 9,946,173$ 9,328,898$ 9,161,598$ 9,370,726$ 10,381,234$ 10,381,234$
EXHIBIT A (revised) - Reso 2012-52

Padre Dam Municipal Water DistrictFive-Year Plan Budget
FY '13 - FY '17Park Operations
FY 13 FY 14 FY 15 FY 16 FY 17
YEAR 1 YEAR 2 YEAR 3 YEAR 4 YEAR 5 TOTAL
Revenues:
Water Sales -$ -$ -$ -$ -$ -$
Infrastructure Access Charge ("IAC) - - - - - -
Energy Billings - - - - - -
CWA/Metro Water Purchase Credits - - - - - -
Padre Dam Sewer Processing Revenue - - - - - -
Sewer Revenues - - - - - -
System Charges - - - - - -
Park Fees 4,391,247 4,545,306 4,655,159 4,842,628 4,961,097 23,395,437
Property Tax Subvention - - - - - -
Other Revenues - - - - - -
Total Operating Revenues 4,391,247 4,545,306 4,655,159 4,842,628 4,961,097 23,395,437
Direct Costs:
Water Purchases - - - - - -
Infrastructure Access Charge ("IAC") - - - - - -
Energy Purchases - - - - - -
Sewer Metro Costs - - - - - -
Padre Dam Sewer Processing Fee - - - - - -
Fish Stocking 107,924 108,461 108,997 109,534 110,071 544,987
Park Purchases 144,836 144,836 144,836 144,836 144,836 724,180
Total Direct Costs 252,760 253,297 253,833 254,370 254,907 1,269,167
Revenues Available for Operating Expenses 4,138,487 4,292,009 4,401,326 4,588,258 4,706,190 22,126,270
Operating Expenses:
Salary & Wages 984,308 1,029,951 1,075,951 1,165,730 1,240,481 5,496,421
Employee Benefits 592,075 626,397 649,501 700,514 757,140 3,325,627
Professional Services 281,351 271,456 274,888 250,936 250,934 1,329,565
Materials, Supplies, Vehicle & Building 535,743 566,489 587,089 615,571 602,514 2,907,406
Administrative 167,291 171,832 170,475 174,318 162,605 846,521
Utilities 427,694 444,417 463,197 482,350 502,506 2,320,164
Additional Approved Park Expenses - - - - - -
Billing Credits (30,000) (15,000) (20,000) (10,000) (10,000) (85,000)
Operating Expenses before Depreciation 2,958,462 3,095,542 3,201,101 3,379,419 3,506,180 16,140,704
Depreciation and Amortization 862,950 958,168 982,458 1,008,222 1,020,619 4,832,417
Operating Income (Loss) 317,075 238,299 217,767 200,617 179,391 1,153,149
Non-Operating Activity:
Interest Expense (250,043) (236,809) (222,615) (207,568) (191,615) (1,108,650)
Interest Income 4,738 4,670 11,585 13,787 25,483 60,263
Other Income - - - - - -
Other Expenses - - - - - -
Total Non-Operating Activity (245,305) (232,139) (211,030) (193,781) (166,132) (1,048,387)
Revenues Over (Under) Expenses 71,770 6,160 6,737 6,836 13,259 104,762
Interest Income - CEF - - - - - -
Change in Net Assets 71,770$ 6,160$ 6,737$ 6,836$ 13,259$ 104,762$
Fund Balances
Add:
Depreciation and Amortization 862,950 958,168 982,458 1,008,222 1,020,619 4,832,417
Capacity Fees - - - - - -
2009 COP Funds Receivable / Payable - - - - - -
2009 COP Transfers / Woodside - - - - - -
Financing (Grants, SRF Loan, Other) - - - - - -
Deduct:
Capital Improvements & Equipment (904,400) (335,000) (447,500) (372,046) (258,887) (2,317,833)
Debt Principal (333,190) (346,700) (360,390) (374,291) (388,351) (1,802,922)
Financing (Grants, SRF Loan, Other) - - - - - -
Transfers between CEF and CRF - - - - - -
Cash Generated (Used) (302,870) 282,628 181,305 268,721 386,640 816,424
Beginning Fund Balance 1,050,643 747,773 1,030,401 1,211,706 1,480,427 1,050,643
Ending Fund Balance 747,773$ 1,030,401$ 1,211,706$ 1,480,427$ 1,867,067$ 1,867,067$
EXHIBIT A (revised) - Reso 2012-52

Padre Dam Municipal Water DistrictFive-Year Plan Budget
FY '13 - FY '17CEF and Restricted Funds
FY 13 FY 14 FY 15 FY 16 FY 17
YEAR 1 YEAR 2 YEAR 3 YEAR 4 YEAR 5 TOTAL
Revenues:
Water Sales -$ -$ -$ -$ -$ -$
Infrastructure Access Charge ("IAC) - - - - - -
Energy Billings - - - - - -
CWA/Metro Water Purchase Credits - - - - - -
Padre Dam Sewer Processing Revenue - - - - - -
Sewer Revenues - - - - - -
System Charges - - - - - -
Park Fees - - - - - -
Property Tax Subvention - - - - - -
Other Revenues - - - - - -
Total Operating Revenues - - - - - -
Direct Costs:
Water Purchases - - - - - -
Infrastructure Access Charge ("IAC") - - - - - -
Energy Purchases - - - - - -
Sewer Metro Costs - - - - - -
Padre Dam Sewer Processing Fee - - - - - -
Fish Stocking - - - - - -
Park Purchases - - - - - -
Total Direct Costs - - - - - -
Revenues Available for Operating Expenses - - - - - -
Operating Expenses:
Salary & Wages - - - - - -
Employee Benefits - - - - - -
Professional Services - - - - - -
Materials, Supplies, Vehicle & Building - - - - - -
Administrative - - - - - -
Utilities - - - - - -
Additional Approved Park Expenses - - - - - -
Billing Credits - - - - - -
Operating Expenses before Depreciation - - - - - -
Depreciation and Amortization 3,220 3,262 3,783 3,952 3,952 18,169
Operating Income (Loss) (3,220) (3,262) (3,783) (3,952) (3,952) (18,169)
Non-Operating Activity:
Interest Expense (513,486) (519,638) (601,614) (627,345) (626,165) (2,888,248)
Interest Income - - - - - -
Other Income - - - - - -
Other Expenses - - - - - -
Total Non-Operating Activity (513,486) (519,638) (601,614) (627,345) (626,165) (2,888,248)
Revenues Over (Under) Expenses (516,706) (522,900) (605,397) (631,297) (630,117) (2,906,417)
Interest Income - CEF 100,000 40,000 5,000 - - 145,000
Change in Net Assets (416,706)$ (482,900)$ (600,397)$ (631,297)$ (630,117)$ (2,761,417)$
Fund Balances
Add:
Depreciation and Amortization 3,220 3,262 3,783 3,952 3,952 18,169
Capacity Fees 110,369 110,369 110,369 110,369 110,369 551,845
2009 COP Funds Receivable / Payable (1,779,825) - - - - (1,779,825)
2009 COP Transfers / Woodside 1,654,900 3,753,034 564,155 - - 5,972,089
Financing (Grants, SRF Loan, Other) 1,500,000 1,549,500 - - - 3,049,500
Deduct:
Capital Improvements & Equipment (5,046,304) (8,109,881) (2,693,359) (764,684) (456,713) (17,070,941)
Debt Principal (14,885) (23,200) (28,245) (29,505) (29,505) (125,340)
Financing (Grants, SRF Loan, Other) (7,610,201) (10,994,815) (1,454,009) - - (20,059,025)
Transfers between CEF and CRF 1,972,616 2,708,338 2,250,025 1,042,544 775,340 8,748,862
Cash Generated (Used) (9,626,816) (11,486,293) (1,847,678) (268,621) (226,674) (23,456,083)
Beginning Fund Balance 34,485,968 24,859,152 13,372,859 11,525,180 11,256,559 34,485,968
Ending Fund Balance 24,859,152$ 13,372,859$ 11,525,180$ 11,256,559$ 11,029,885$ 11,029,885$
EXHIBIT A (revised) - Reso 2012-52

BUDGET BUDGET BUDGET BUDGET BUDGET 5-YEARADMINISTRATION YEAR 1 YEAR 2 YEAR 3 YEAR 4 YEAR 5 TOTALSSalary and Wages 515,333$ 543,425$ 565,514$ 588,417$ 612,299$ 2,824,989$ Employee Benefits 334,746 344,723 359,303 377,084 405,595 1,821,451 Professional Services 196,255 186,353 197,185 195,994 228,616 1,004,403 Materials and Supplies 65,733 75,672 64,312 64,009 68,349 338,075 Administrative Expenses 166,066 161,015 178,746 170,805 185,727 862,359 Utilities 130,188 136,392 142,923 149,800 157,040 716,343 Billing Credits - - - - - -
Total Expenditures 1,408,322$ 1,447,581$ 1,507,983$ 1,546,108$ 1,657,626$ 7,567,620$
FINANCE YEAR 1 YEAR 2 YEAR 3 YEAR 4 YEAR 5 TOTALSSalary and Wages 1,681,431$ 1,678,875$ 1,756,748$ 1,835,566$ 1,922,535$ 8,875,155$ Employee Benefits 960,512 963,259 994,700 1,052,470 1,128,145 5,099,087 Professional Services 200,836 147,486 184,365 153,248 182,648 868,582 Administrative Expenses 182,445 178,420 176,298 190,068 183,029 910,259 Utilities 17,032 17,263 17,501 17,747 17,989 87,533 Materials and Supplies 257,297 307,815 202,574 207,370 294,197 1,269,253 Billing Credits - - - - - -
Total Expenditures 3,299,554$ 3,293,117$ 3,332,188$ 3,456,469$ 3,728,542$ 17,109,869$
HUMAN RESOURCES YEAR 1 YEAR 2 YEAR 3 YEAR 4 YEAR 5 TOTALSSalary and Wages 348,135$ 344,733$ 345,362$ 360,545$ 377,022$ 1,775,798$ Employee Benefits 252,632 207,529 206,667 218,941 233,853 1,119,622 Professional Services 22,517 34,032 28,282 25,464 27,002 137,297 Materials and Supplies 35,307 42,375 34,833 35,549 35,057 183,121 Administrative Expenses 313,849 332,083 347,046 364,033 384,636 1,741,647 Utilities 1,032 1,682 1,812 1,812 1,812 8,150 Billing Credits - - - - - -
Total Expenditures 973,472$ 962,434$ 964,002$ 1,006,345$ 1,059,383$ 4,965,635$
ENGINEERING YEAR 1 YEAR 2 YEAR 3 YEAR 4 YEAR 5 TOTALSSalary and Wages 1,702,217$ 1,781,804$ 1,863,523$ 1,747,615$ 1,832,660$ 8,927,820$ Employee Benefits 871,870 924,117 949,711 915,514 984,066 4,645,277 Professional Services 73,396 74,312 77,052 77,992 81,464 384,216 Materials and Supplies 82,116 83,072 80,727 83,407 84,747 414,069 Administrative Expenses 49,685 45,286 55,417 56,618 58,136 265,142 Utilities 8,240 8,612 9,020 9,416 9,800 45,088 Billing Credits (1,275,000) (1,313,250) (1,352,648) (1,330,000) (1,369,900) (6,640,798)
Total Expenditures 1,512,524$ 1,603,953$ 1,682,802$ 1,560,562$ 1,680,973$ 8,040,814$
OPERATIONS YEAR 1 YEAR 2 YEAR 3 YEAR 4 YEAR 5 TOTALSSalary and Wages 6,442,680$ 6,664,921$ 6,879,516$ 7,188,618$ 7,517,837$ 34,693,572$ Employee Benefits 4,111,358 4,303,465 4,414,441 4,693,236 5,039,135 22,561,636 Professional Services 235,220 357,560 446,867 439,329 456,737 1,935,713 Materials and Supplies 3,087,664 3,083,947 3,304,115 3,363,048 3,397,301 16,236,076 Administrative Expenses 268,320 262,621 271,846 281,021 269,566 1,353,374 Utilities 503,238 517,386 530,926 544,324 557,009 2,652,882 Billing Credits (1,605,995) (1,654,175) (1,703,800) (1,754,914) (1,807,562) (8,526,446)
Total Expenditures 13,042,485$ 13,535,726$ 14,143,911$ 14,754,661$ 15,430,024$ 70,906,807$
PARK YEAR 1 YEAR 2 YEAR 3 YEAR 4 YEAR 5 TOTALSSalary and Wages 921,980$ 965,091$ 1,009,009$ 1,095,725$ 1,167,290$ 5,159,095$ Employee Benefits 554,251 589,282 611,663 660,626 714,380 3,130,202 Professional Services 277,666 267,922 271,187 247,042 246,791 1,310,608 Materials and Supplies 533,652 563,352 584,919 613,749 600,405 2,896,077 Administrative Expenses 163,556 167,780 166,360 170,320 158,120 826,136 Utilities 421,184 437,556 456,000 474,808 494,600 2,284,148 Billing Credits (30,000) (15,000) (20,000) (10,000) (10,000) (85,000)
Total Expenditures 2,842,289$ 2,975,983$ 3,079,138$ 3,252,270$ 3,371,586$ 15,521,266$
PADRE DAM MUNICIPAL WATER DISTRICTDEPARTMENTAL BUDGET SUMMARIES
FIVE YEAR PLAN
EXHIBIT A (revised) - Reso 2012-52

Salary & Employee Professional Materials & Admin. Billing Year 1
Department Wages Benefits Services Supplies Expenses Utilities Credits Total PercentAdministration 515,333$ 334,746$ 196,255$ 65,733$ 166,066$ 130,188$ -$ 1,408,322$ 6.1%Finance 1,681,431 960,512 200,836 257,297 182,445 17,032 - 3,299,554 14.3%Human Resources 348,135 252,632 22,517 35,307 313,849 1,032 - 973,472 4.2%Engineering 1,702,217 871,870 73,396 82,116 49,685 8,240 (1,275,000) 1,512,524 6.6%Operations 6,442,680 4,111,358 235,220 3,087,664 268,320 503,238 (1,605,995) 13,042,485 56.5%Park 921,980 554,251 277,666 533,652 163,556 421,184 (30,000) 2,842,289 12.3%Total 11,611,776$ 7,085,370$ 1,005,890$ 4,061,769$ 1,143,921$ 1,080,914$ (2,910,995)$ 23,078,645$ 100.0%
Salary & Employee Professional Materials & Admin. Billing Year 1
Division Wages Benefits Services Supplies Expenses Utilities Credits Total PercentRetail Water 6,764,384$ 3,995,973$ 494,353$ 1,800,389$ 497,397$ 95,827$ (1,725,716)$ 11,922,607$ 51.7%Water Recycling 868,264 536,346 32,967 279,614 73,638 161,411 (244,308) 1,707,931 7.4%Sewer 2,994,821 1,960,975 197,219 1,446,023 405,594 395,982 (910,971) 6,489,644 28.1%Park 984,308 592,075 281,351 535,743 167,291 427,694 (30,000) 2,958,462 12.8%Total 11,611,776$ 7,085,370$ 1,005,890$ 4,061,769$ 1,143,921$ 1,080,914$ (2,910,995)$ 23,078,645$ 100.0%
PADRE DAM MUNICIPAL WATER DISTRICTDEPARTMENTAL ALLOCATIONS TO DIVISION BUDGETS
FY 13
EXHIBIT A (revised) - Reso 2012-52

Salary & Employee Professional Materials & Admin. Billing Year 2
Department Wages Benefits Services Supplies Expenses Utilities Credits Total PercentAdministration 543,425$ 344,723$ 186,353$ 75,672$ 161,015$ 136,392$ -$ 1,447,581$ 6.1%Finance 1,678,875 963,259 147,486 307,815 178,420 17,263 - 3,293,117 13.8%Human Resources 344,733 207,529 34,032 42,375 332,083 1,682 - 962,434 4.0%Engineering 1,781,804 924,117 74,312 83,072 45,286 8,612 (1,313,250) 1,603,953 6.7%Operations 6,664,921 4,303,465 357,560 3,083,947 262,621 517,386 (1,654,175) 13,535,726 56.8%Park 965,091 589,282 267,922 563,352 167,780 437,556 (15,000) 2,975,983 12.5%Total 11,978,849$ 7,332,376$ 1,067,664$ 4,156,233$ 1,147,205$ 1,118,891$ (2,982,425)$ 23,818,794$ 100.0%
Salary & Employee Professional Materials & Admin. Billing Year 2
Division Wages Benefits Services Supplies Expenses Utilities Credits Total PercentRetail Water 6,968,974$ 4,126,859$ 543,253$ 1,832,924$ 496,757$ 98,945$ (1,777,487)$ 12,290,225$ 51.6%Water Recycling 894,525 553,914 36,227 284,667 73,543 166,663 (251,638) 1,757,901 7.4%Sewer 3,085,400 2,025,206 216,728 1,472,154 405,072 408,866 (938,300) 6,675,126 28.0%Park 1,029,951 626,397 271,456 566,489 171,832 444,417 (15,000) 3,095,541 13.0%Total 11,978,849$ 7,332,376$ 1,067,664$ 4,156,233$ 1,147,205$ 1,118,891$ (2,982,425)$ 23,818,794$ 100.0%
PADRE DAM MUNICIPAL WATER DISTRICTDEPARTMENTAL ALLOCATIONS TO DIVISION BUDGETS
FY 14
EXHIBIT A (revised) - Reso 2012-52

Salary & Employee Professional Materials & Admin. Billing Year 3
Department Wages Benefits Services Supplies Expenses Utilities Credits Total PercentAdministration 565,514$ 359,303$ 197,185$ 64,312$ 178,746$ 142,923$ -$ 1,507,983$ 6.1%Finance 1,756,748 994,700 184,365 202,574 176,298 17,501 - 3,332,188 13.5%Human Resources 345,362 206,667 28,282 34,833 347,046 1,812 - 964,002 3.9%Engineering 1,863,523 949,711 77,052 80,727 55,417 9,020 (1,352,648) 1,682,802 6.8%Operations 6,879,516 4,414,441 446,867 3,304,115 271,846 530,926 (1,703,800) 14,143,911 57.2%Park 1,009,009 611,663 271,187 584,919 166,360 456,000 (20,000) 3,079,138 12.5%Total 12,419,673$ 7,536,485$ 1,204,939$ 4,271,480$ 1,195,712$ 1,158,182$ (3,076,448)$ 24,710,023$ 100.0%
Salary & Employee Professional Materials & Admin. Billing Year 3
Division Wages Benefits Services Supplies Expenses Utilities Credits Total PercentRetail Water 7,220,279$ 4,238,250$ 634,573$ 1,881,250$ 522,153$ 101,954$ (1,830,812)$ 12,767,648$ 51.7%Water Recycling 926,782 568,865 42,317 292,172 77,303 171,731 (259,187) 1,819,984 7.4%Sewer 3,196,661 2,079,869 253,160 1,510,969 425,781 421,300 (966,449) 6,921,291 28.0%Park 1,075,951 649,501 274,888 587,089 170,475 463,197 (20,000) 3,201,101 13.0%Total 12,419,673$ 7,536,485$ 1,204,939$ 4,271,480$ 1,195,712$ 1,158,182$ (3,076,448)$ 24,710,023$ 100.0%
PADRE DAM MUNICIPAL WATER DISTRICTDEPARTMENTAL ALLOCATIONS TO DIVISION BUDGETS
FY 15
EXHIBIT A (revised) - Reso 2012-52

Salary & Employee Professional Materials & Admin. Billing Year 4
Department Wages Benefits Services Supplies Expenses Utilities Credits Total PercentAdministration 588,417$ 377,084$ 195,994$ 64,009$ 170,805$ 149,800$ -$ 1,546,108$ 6.0%Finance 1,835,566 1,052,470 153,248 207,370 190,068 17,747 - 3,456,469 13.5%Human Resources 360,545 218,941 25,464 35,549 364,033 1,812 - 1,006,345 3.9%Engineering 1,747,615 915,514 77,992 83,407 56,618 9,416 (1,330,000) 1,560,562 6.1%Operations 7,188,618 4,693,236 439,329 3,363,048 281,021 544,324 (1,754,914) 14,754,661 57.7%Park 1,095,725 660,626 247,042 613,749 170,320 474,808 (10,000) 3,252,270 12.7%Total 12,816,486$ 7,917,871$ 1,139,068$ 4,367,132$ 1,232,865$ 1,197,907$ (3,094,914)$ 25,576,416$ 100.0%
Salary & Employee Professional Materials & Admin. Billing Year 4
Division Wages Benefits Services Supplies Expenses Utilities Credits Total PercentRetail Water 7,415,707$ 4,441,562$ 605,973$ 1,915,547$ 539,118$ 104,972$ (1,847,864)$ 13,175,015$ 51.5%Water Recycling 951,867 596,154 40,410 297,499 79,814 176,814 (261,601) 1,880,957 7.4%Sewer 3,283,183 2,179,642 241,750 1,538,515 439,615 433,770 (975,450) 7,141,025 27.9%Park 1,165,730 700,514 250,936 615,571 174,318 482,350 (10,000) 3,379,419 13.2%Total 12,816,486$ 7,917,871$ 1,139,068$ 4,367,132$ 1,232,865$ 1,197,907$ (3,094,914)$ 25,576,416$ 100.0%
PADRE DAM MUNICIPAL WATER DISTRICTDEPARTMENTAL ALLOCATIONS TO DIVISION BUDGETS
FY 16
EXHIBIT A (revised) - Reso 2012-52

Salary & Employee Professional Materials & Admin. Billing Year 5
Department Wages Benefits Services Supplies Expenses Utilities Credits Total PercentAdministration 612,299$ 405,595$ 228,616$ 68,349$ 185,727$ 157,040$ -$ 1,657,626$ 6.2%Finance 1,922,535 1,128,145 182,648 294,197 183,029 17,989 - 3,728,542 13.8%Human Resources 377,022 233,853 27,002 35,057 384,636 1,812 - 1,059,383 3.9%Engineering 1,832,660 984,066 81,464 84,747 58,136 9,800 (1,369,900) 1,680,973 6.2%Operations 7,517,837 5,039,135 456,737 3,397,301 269,566 557,009 (1,807,562) 15,430,024 57.3%Park 1,167,290 714,380 246,791 600,405 158,120 494,600 (10,000) 3,371,586 12.5%Total 13,429,644$ 8,505,174$ 1,223,258$ 4,480,055$ 1,239,214$ 1,238,250$ (3,187,462)$ 26,928,133$ 100.0%
Salary & Employee Professional Materials & Admin. Billing Year 5
Division Wages Benefits Services Supplies Expenses Utilities Credits Total PercentRetail Water 7,758,402$ 4,768,140$ 663,416$ 1,979,872$ 548,317$ 107,934$ (1,903,299)$ 13,922,782$ 51.7%Water Recycling 995,855 639,988 44,241 307,489 81,176 181,802 (269,449) 1,981,102 7.4%Sewer 3,434,906 2,339,906 264,667 1,590,180 447,116 446,008 (1,004,713) 7,518,069 27.9%Park 1,240,481 757,140 250,934 602,514 162,605 502,506 (10,000) 3,506,180 13.0%Total 13,429,644$ 8,505,174$ 1,223,258$ 4,480,055$ 1,239,214$ 1,238,250$ (3,187,462)$ 26,928,133$ 100.0%
PADRE DAM MUNICIPAL WATER DISTRICTDEPARTMENTAL ALLOCATIONS TO DIVISION BUDGETS
FY 17
EXHIBIT A (revised) - Reso 2012-52

Salary & Employee Professional Materials & Admin. Billing 5 Year
Department Wages Benefits Services Supplies Expenses Utilities Credits Total PercentAdministration 2,824,989$ 1,821,451$ 1,004,403$ 338,075$ 862,359$ 716,343$ -$ 7,567,620$ 6.1%Finance 8,875,155 5,099,087 868,582 1,269,253 910,259 87,533 - 17,109,869 13.8%Human Resources 1,775,798 1,119,622 137,297 183,121 1,741,647 8,150 - 4,965,635 4.0%Engineering 8,927,820 4,645,277 384,216 414,069 265,142 45,088 (6,640,798) 8,040,814 6.5%Operations 34,693,572 22,561,636 1,935,713 16,236,076 1,353,374 2,652,882 (8,526,446) 70,906,807 57.1%Park 5,159,095 3,130,202 1,310,608 2,896,077 826,136 2,284,148 (85,000) 15,521,266 12.5%Total 62,256,429$ 38,377,275$ 5,640,819$ 21,336,671$ 5,958,917$ 5,794,144$ (15,252,244)$ 124,112,011$ 100.0%
Salary & Employee Professional Materials & Admin. Billing 5 Year
Division Wages Benefits Services Supplies Expenses Utilities Credits Total PercentRetail Water 36,127,745$ 21,570,784$ 2,941,568$ 9,409,983$ 2,603,744$ 509,633$ (9,085,179)$ 64,078,277$ 51.6%Water Recycling 4,637,293 2,895,266 196,162 1,461,441 385,475 858,421 (1,286,182) 9,147,875 7.4%Sewer 15,994,970 10,585,598 1,173,523 7,557,842 2,123,178 2,105,927 (4,795,882) 34,745,156 28.0%Total Park 5,496,421 3,325,627 1,329,566 2,907,406 846,521 2,320,163 (85,000) 16,140,703 13.0%Total 62,256,429$ 38,377,275$ 5,640,819$ 21,336,671$ 5,958,917$ 5,794,144$ (15,252,244)$ 124,112,011$ 100.0%
PADRE DAM MUNICIPAL WATER DISTRICTDEPARTMENTAL ALLOCATIONS TO DIVISION BUDGETS
5 YEAR TOTAL
EXHIBIT A (revised) - Reso 2012-52

Padre Dam Municipal Water DistrictFive Year Business Plan and Budget
Organizational Staffing by DepartmentFY '13 - '17 with History
Prior Five Actual Budget Budget Budget Budget Budget
TITLE Year Plan Mar '12 FY '13 FY '14 FY '15 FY '16 FY '17ADMINISTRATION
GENERAL MANAGER 1 1 1 1 1 1 1
ADMINISTRATIVE ASSISTANT (GM) (BOARD SECRETARY) 1 1.8 1.8 1.8 1.8 1.8 1.8
DIRECTOR OF COMMUNICATIONS 1 0 0 0 0 0 0
COMMUNICATIONS OFFICER/COORD (PUBLIC AFFAIRS ADMINISTRATOR) 1 1 1 1 1 1 1
TOTAL ADMINISTRATION 4 3.8 3.8 3.8 3.8 3.8 3.8
FINANCE DEPARTMENT
DIRECTOR OF FINANCE 1 1 1 1 1 1 1
ACCOUNTING MANAGER 1 1 1 1 1 1 1
ACCOUNTANT 1 1 1 1 1 1 1
ACCOUNTING SPECIALIST 3 3 3 3 3 3 3
INFO SYSTEMS TECH SPECIALIST (SYSTEM ADMINISTRATOR) 1 2 2 2 2 2 2
INFO SYSTEMS TECH SPECIALIST 2 2 2 1 1 1 1
INFO SYSTEMS MANAGER 1 1 1 1 1 1 1
INFO SYSTEM TECH SPECIALIST (NETWORK SPECIALIST) 1 0 0 0 0 0 0
CUSTOMER SERVICE SUPERVISOR 1 1 1 1 1 1 1
CUSTOMER SERVICE REP 7 7 7 7 7 7 7
TOTAL FINANCE 19 19 19 18 18 18 18
ENGINEERING DEPARTMENT
DIRECTOR OF ENGINEERING & PLANNING 1 1 1 1 1 1 1
ENGINEER MANAGER 2 2 2 2 2 1 1
ENGINEER STAFF ASSISTANT 1 1 1 1 1 1 1
ENGINEERING C/S TECH 1 0 0 0 0 0 0
ENGINEER 3 3 3 3 3 3 3
ENGINEER TECH 7 3 3 3 3 3 3
FIELD ENG SUPERVISOR 2 0 0 0 0 0 0
GIS/MAPPING ADMINISTRATOR 1 1 1 1 1 1 1
GIS/MAPPING SPECIALIST 3 1 1 1 1 1 1
RIGHT OF WAY AGENT-ENVIRONMENTAL 1 1 1 1 1 1 1
CATHODIC PROTECTION PROGRAM COORDINATOR 1 0 0 0 0 0 0
CONSTRUCTION INSPECTOR 1 2 2 2 2 2 2
ADMINISTRATIVE ASSISTANT 3 0 0 0 0 0 0
TOTAL ENGINEERING 27 15 15 15 15 14 14
OPERATIONS DEPARTMENT
DIRECTOR OF OPS & WATER QUALITY 1 1 1 1 1 1 1
ADMINISTRATIVE ASSISTANT 2 1.2 1.2 1.2 1.2 1.2 1.2
DISTRIBUTION MAINTENANCE SUPERVISOR 1 1 1 1 1 1 1
CONSTRUCTION & MAINT. SUPERVISOR 4 4 4 4 4 4 4
UTILITY WORKER 21 14 14 14 14 14 14
EQUIPMENT MECHANIC 2 2 2 2 2 2 2
ASSISTANT OPS MANAGER 1 2 2 2 2 2 2
OERATIONS MANAGER 1 1 1 1 1 1 1
SYSTEMS OPERATOR TECHNICIAN 11 8 8 8 8 8 8
ELECTRICAL/INSTR CONTROL TECH 3 2 2 2 2 2 2
ELECTRICAL/INSTR CONTROL SPVSR 1 1 1 1 1 1 1
PLANT MANAGER 1 1 1 1 1 1 1
LAB ANALYST-SENIOR 1 1 1 1 1 1 1
LAB ANALYST 2 2 2 2 2 2 2
RECYCLED WATER PLANT SUPV 1 1 1 1 1 1 1
RECYCLED WATER PLANT OPERATOR 5 4 4 4 4 4 4
RECYCLED WATER TECHNICIAN 1 1 1 1 1 1 1
WATER QUALITY / COMPLIANCE SPECIALIST 2 2 2 2 2 2 2
CONSTRUCTION EQUIPMENT OPERATOR 9 7 7 7 6 6 6
WASTEWATER COLLECTION SYSTEMS WORKER 0 5 5 6 6 6 6
SCADA TECH 0 2 2 2 2 2 2
INDUSTRIAL CODE COMPLIANCE SPECIALIST 0 1 1 0 0 0 0
CATHODIC PROTECTECTION PG COORD 0 1 1 1 1 1 1
FACILITIES MAINTENANCE CREW SUPERVISOR 1 1 1 1 1 1 1
FACILITIES MAINTENANCE WORKER 5 2 2 2 2 2 2
CUSTODIAN (Contracted out since 3/12, eliminate position in FY '14) 0 1 1 0 0 0 0
METER SHOP SUPERVISOR 1 1 1 1 1 1 1
METER TECH 7 4 4 4 4 4 4
ENGINEERING TECH (AMR) 0 1 1 1 1 1 1
WAREHOUSE SPECIALIST 1 1 1 1 1 1 1
WAREHOUSE WORKER 1 1 0 0 0 0 0
TOTAL OPERATIONS 86 77.2 76.2 75.2 74.2 74.2 74.2
FIVE YEAR PLAN

Padre Dam Municipal Water DistrictFive Year Business Plan and Budget
Organizational Staffing by DepartmentFY '13 - '17 with History
Prior Five Actual Budget Budget Budget Budget Budget
TITLE Year Plan Mar '12 FY '13 FY '14 FY '15 FY '16 FY '17
FIVE YEAR PLAN
HUMAN RESOURCES DEPARTMENT
DIRECTOR OF HUMAN RESOURCES 1 1 1 1 1 1 1
HUMAN RESOURCES SPECIALIST 1 1 1 1 1 1 1
SAFETY & RISK MANAGER 1 1 1 1 1 1 1
TOTAL HUMAN RESOURCES 3 3 3 3 3 3 3
PARK & CAMPGROUNDS
DIRECTOR OF PARK & RECREATION 1 1 1 1 1 1 1
PARK & RECREATION SUPERVISOR 2 2 2 2 2 2 2
PARK & RECREATION COORINATOR 8 8 8 8 8 8.75 9
TOTAL PARK & CAMPGROUNDS 11 11 11 11 11 11.75 12
TOTAL DISTRICT APPROVED REGULAR EMPLOYEES 150.0 129.0 128.0 126.0 125.0 124.75 125.0
TEMPORARY & PART-TIME POSITIONS
ENGINEERING TECH INTERN 1.0 0.0 0.0 0.0 0.0 0.0 0.0
OPERATIONS UTILITY WORKER - OPERATIONS 2.0 1.0 1.0 1.0 1.0 1.0 1.0
PARK REC AIDE 4.5 0.8 1.2 1.2 1.2 1.2 1.2
CUSTOMER SERVICE REP 0.0 1.0 1.0 1.0 1.0 1.0 1.0
PARK SUPPORT STAFF 0.4 2.9 3.4 3.4 3.4 3.4 3.4
COMMUNICATIONS STAFF SUPPORT 0.5 0.0 0.0 0.0 0.0 0.0 0.08.4 5.7 6.6 6.6 6.6 6.6 6.6
TOTAL STAFFING 158.4 134.7 134.6 132.6 131.6 131.4 131.6TOTAL STAFFING EXCLUDING PARK 142.5 120.0 119.0 117.0 116.0 115.0 115.0
REDUCTIONS (EXCLUDING PARK) 22.50 1.00 2.00 1.00 1.00 0.00CUMULATIVE REDUCTION (EXCLUDING PARK) 1.00 3.00 4.00 5.00 5.00
BOARD OF DIRECTORS 5 5 5 5 5 5 5
VOLUNTEER POSITIONS PARK 7.5 7.5 7.5 7.5 7.5 7.5 7.5
120
125
130
135
140
145
150
155
160
Staffing FY '13 - '17 with History

EXHIBIT B
CAPITAL EQUIPMENT BUDGET

FIVE YEAR BUSINESS PLAN CAPITAL EQUIPMENT BUDGET
FY '13 - FY '17
Capital Equipment Life in Budget Budget Budget Budget Budget BudgetDescription Years Department CC Year 1 Year 2 Year 3 Year 4 Year 5 TOTAL
CSC Color Copier/Printer 5 ADMIN 69 17,000 - 17,000$ Replacement LCD for Backlit Projector 5 ADMIN 69 5,000 5,000 Board room streaming audio/video 5 ADMIN 69 - 15,000 15,000 2003 Ford F350 Supercab Truck 5 ENGINEERING 47 65,657 65,657 2003 Ford Explorer 5 ENGINEERING 34 30,303 30,303 2003 Ford Explorer 5 ENGINEERING 37 30,303 30,303 Copier 5 FINANCE 11 - - - - 15,000 15,000 Imaging System (desktop scanners) 5 FINANCE 11 20,000 - - - - 20,000 Printers 5 FINANCE 11 20,000 - - - - 20,000 Data backup and recovery improvement 5 FINANCE 16 - - 40,000 - - 40,000 Storage Area Network (SAN) expansion ($15k-$50K) 5 FINANCE 16 50,000 - - - - 50,000 VMware Host replacements 5 FINANCE 16 - - - - 31,000 31,000 Phone system $400-$1000 per user 5 FINANCE 16 - 110,000 - - - 110,000 Backup Tape Library/loader 5 FINANCE 16 - 11,000 - 11,000 Computer equipment 5 FINANCE 16 40,000 42,500 42,500 42,500 42,500 210,000 HUMA alert software upgrades for CS 5 FINANCE 12 - 25,000 - - - 25,000 Repeater hydrant caps 10 OPS 13 20,000 20,000 Construct Meter Retro 10 OPS 13 10,000 10,000 Metal Lathe (new building) 5 OPS 47 9,500 - - - - 9,500 Ball Valve Replacement - P4-PS 3 10 OPS 47 14,000 - - - - 14,000 A/C Units 5 OPS 51 5,000 5,000 - 5,000 15,000 Pumps 5 OPS 51 30,500 27,000 35,000 27,000 143,000 262,500 Filter Sand 5 OPS 51 35,000 35,000 35,000 35,000 140,000 Meters and Analyzers 5 OPS 51 26,000 25,000 11,000 12,000 6,000 80,000 Valves & Equipment 5 OPS 51 10,000 5,000 10,000 5,000 30,000 Rag removal belt and motor 5 OPS 51 - 5,000 5,000 Chlorine Scrubber rehab 5 OPS 51 - 28,000 28,000 Mixers 5 OPS 51 5,000 10,000 5,000 5,000 13,500 38,500 SCADA System 5 OPS 51 44,500 8,400 8,400 51,500 24,500 137,300 Motors & Equipment 5 OPS 51 5,500 35,000 13,000 15,000 21,500 90,000 Plate settlers 5 OPS 51 25,000 25,000 Solar panel upgrade(flow to lake # 7) 5 OPS 51 8,500 8,500 Auto sampler 5 OPS 52 12,000 12,000 Casework-Lab Cabinet 5 OPS 52 25,000 25,000 Painting the Laboratory 5 OPS 52 25,000 25,000 Lab Flooring 5 OPS 52 25,000 25,000 Atomic Adsorption (metals) 5 OPS 52 60,000 60,000 UV/VIS Spectrophotometer 5 OPS 52 15,000 15,000 Auto Analyzer 5 OPS 52 50,000 50,000 Gas Chromatograph 5 OPS 52 150,000 150,000 Autoclave 5 OPS 52 12,000 12,000 JD Gator 5 OPS 61 - 18,000 18,000 Laptop Computers (add to duty trucks) 5 OPS 71 11,000 - - - 11,000 Backhoe John Deere 5 OPS 71 - 95,000 - - 95,000 Backhoe John Deere 5 OPS 73 95,000 - - - 95,000 Autosampler 5 OPS 73 11,000 - - - - 11,000 Light Tower 5 OPS 73 9,000 9,000 18,000 Arrow Board 5 OPS 73 5,000 5,000 10,000 Emission Control Systems 5 OPS 71/73 90,000 40,000 40,000 170,000 Tremac pnuematic breaker 5 OPS 15,000 15,000 2000 L7501 Vactor Sewer Cleaning Truck 5 OPS 71 400,000 400,000 2003 Ford Explorer 5 OPS 37 30,808 30,808 1999 Ford F-150 Pickup 5 OPS 73 30,000 30,000 2000 Ford Ranger XLT supercab 4x2 5 OPS 73 30,000 30,000 2006 Ford Explorer 5 OPS 45 30,303 30,303 2008 DODGE DAKOTA (Lease - not disposed) 5 OPS 61 25,253 25,253 2001 Ford F250 Truck 5 OPS 43 44,444 44,444 2002 Ford F250 Truck 5 OPS 51 35,354 35,354 2003 Ford F-250 Truck 5 OPS 61 37,374 37,374 2003 Ford F-350 Truck 5 OPS 73 44,444 44,444 2004 Ford F250 Super Cab 5 OPS 47 44,444 44,444 2004 Ford F-150 supercab 5 OPS 79 31,313 31,313 2008 Ford Explorer Sporttrack 5 OPS 41 31,313 31,313 2008 Ford F-350 Duty Truck 5 OPS 73 50,000 50,000 1999 Ford F-150 Pickup 5 OPS 43 32,828 32,828 2004 Ford F-150 supercab 5 OPS 13 33,333 33,333 2004 Ford Explorer 5 OPS 79 30,808 30,808 2004 Ford Explorer 5 OPS 79 30,808 30,808 2004 Ford F-150 supercab 5 OPS 79 31,313 31,313 2003 Vactor 2110 Jet Rodder 5 OPS 71 420,000 420,000 1999 Ford Windstar Van 5 OPS 69 30,303 30,303 2000 Ford Taurus LX 4-Door Sedan 5 OPS 69 20,202 20,202 2004 Ford F-350 Super Duty 5 OPS 45 50,000 50,000 2006 Ford F-150 5 OPS 49 31,818 31,818 2006 Ford F-350 5 OPS 45 37,374 37,374 2010 Ford F-350 Duty Truck 5 OPS 73 50,000 50,000 2007 DODGE DAKOTA 5 OPS 13 26,263 26,263 2007 DODGE DAKOTA 5 OPS 13 25,758 25,758 2007 Ford F-350 5 OPS 61 35,859 35,859 2010 Ford F-350 5 OPS 47 70,707 70,707 1999 Ford F-550 Dumptruck 5 OPS 73 50,505 50,505 2001 Ford F650 Utility Truck 5 OPS 73 126,263 126,263

FIVE YEAR BUSINESS PLAN CAPITAL EQUIPMENT BUDGET
FY '13 - FY '17
Capital Equipment Life in Budget Budget Budget Budget Budget BudgetDescription Years Department CC Year 1 Year 2 Year 3 Year 4 Year 5 TOTAL
Ingersoll- Rand Air Compressor 5 OPS 18,000 - 18,000 Ingersoll- Rand Air Compressor (B-9) 5 OPS 18,000 - 18,000 Ingersoll Rand Air Compressor 5 OPS 18,000 - 18,000 Cat Forklift 5 OPS 60,000 - 60,000 Pump Control Valves PS 1, 3, 4, 5 50 OPS 47 9,200 13,000 19,000 32,000 73,200 Computer Server 5 PARK 62 10,000 7,500 - 7,500 - 25,000 Gator Maintenance Vehicle 5 PARK 62 - - 10,000 - - 10,000 Maintenance Yard Car Port 15 PARK 62 - - - - 10,000 10,000 Peddle Boats 5 PARK 62 10,000 10,000 10,000 10,000 10,000 50,000 Pontoon Boat 5 PARK 62 - - 20,000 - - 20,000 Tractor (John Deer) 5 PARK 62 - - - 35,000 - 35,000 WiFi Systems 5 PARK 62 7,500 7,500 7,500 7,500 7,500 37,500 AC -Park Buildings 5 PARK 62 - 20,000 20,000 40,000 Dock Lake 1 15 PARK 62 20,000 - 15,000 35,000 Trash Receptacle Lids 5 PARK 62 - 10,000 - - - 10,000 Storage Unit\Container 15 PARK 62 10,000 10,000 10,000 30,000 Radio System Upgrade 5 PARK 62 6,500 6,500 Golf Cart Replacement 5 PARK 62 7,500 7,500 5,000 5,000 5,000 30,000 Copiers 5 PARK 62 10,000 10,000 20,000 Generator Installation 15 PARK 62 75,000 75,000 Cabins AC Units 5 PARK 67 7,500 7,500 5,000 5,000 5,000 30,000 2002 Ford F150 Truck 5 PARK 62 30,000 30,000 2003 Ford F-150 Truck 5 PARK 62 30,000 30,000 1992 Dodge Caravan 5 PARK 62 20,000 20,000 2003 Ford Explorer 5 PARK 62 30,000 30,000
TOTAL 1,451,220$ 1,109,193$ 760,991$ 1,132,697$ 731,853$ 5,185,953$
TOTAL BY DEPARTMENTOPERATIONS 1,019,564$ 765,087$ 560,991$ 995,197$ 575,853$ 3,916,691$ ENGINEERING 65,657 60,606 - - - 126,263 PARK 214,000 80,000 117,500 95,000 67,500 574,000 FINANCE 130,000 188,500 82,500 42,500 88,500 532,000 ADMIN 22,000 15,000 - - - 37,000 TOTAL 1,451,220$ 1,109,193$ 760,991$ 1,132,697$ 731,853$ 5,185,953$
TOTAL BY OPERATIONRETAIL WATER 312,466$ 463,447$ 156,700$ 188,716$ 241,150$ 1,362,478$ SEWER 539,996 107,944 160,120 448,589 43,992 1,300,641 WATER RECYCLING 384,757 457,802 326,671 400,392 379,211 1,948,834 PARK 214,000 80,000 117,500 95,000 67,500 574,000 TOTAL 1,451,220$ 1,109,193$ 760,991$ 1,132,697$ 731,853$ 5,185,953$

EXHIBIT C
CAPITAL IMPROVEMENT PROGRAM (CIP)
BUDGET

12/13 13/14 14/15 15/16 16/17 5 YEARS
EXPENDITURESProject CostsCapitalized Operations 1,363$ 1,094$ 1,103$ 1,167$ 1,308$ 6,036$ Mandated by External Agencies 910$ 1,498$ 1,051$ 948$ 808$ 5,215$ CIP General 4,970$ 4,805$ 3,766$ 5,928$ 7,482$ 26,951$ Debt/External Financing Req'd 10,098$ 14,237$ 4,349$ 150$ 155$ 28,990$ Developer Driven 128$ 479$ 176$ ‐$ ‐$ 783$
Subtotal Project Costs 17,469$ 22,113$ 10,445$ 8,193$ 9,755$ 67,975$
Debt Service 878$ 917$ 921$ 912$ 908$ 4,537$
TOTAL EXPENDITURES 18,347$ 23,031$ 11,366$ 9,106$ 10,663$ 72,512$
FUNDING SOURCESCapital Replacement FundWater 4,477$ 4,461$ 5,548$ 6,886$ 9,394$ 30,766$ Sewer 2,114$ 2,476$ 1,919$ 1,161$ 672$ 8,342$ Recycled 698$ 605$ 250$ 209$ 67$ 1,829$
Subtotal CRF 7,289$ 7,542$ 7,717$ 8,256$ 10,133$ 40,938$
Capital Expansion Fund Water 1,273$ 2,134$ 1,699$ 519$ 258$ 5,884$ Sewer 356$ 553$ 351$ 215$ 171$ 1,646$ Recycled 314$ 169$ 63$ 10$ 4$ 561$
Subtotal CEF 1,944$ 2,856$ 2,114$ 745$ 433$ 8,091$
Grants and External FinancingCOP 6,775$ 9,673$ 1,454$ ‐$ ‐$ 17,902$ Grants, Sale of Woodside, Misc 2,335$ 2,945$ 80$ 83$ 85$ 5,528$ Park Participation 4$ ‐$ ‐$ 22$ 11$ 38$ Other ‐$ 15$ ‐$ ‐$ ‐$ 15$
Subtotal Other Funding 9,115$ 12,633$ 1,534$ 105$ 97$ 23,483$
TOTAL FUNDING 18,347$ 23,030$ 11,366$ 9,106$ 10,663$ 72,511$
COP REMAININGAnticipated start 12/13 17,902$ Anticipated end of year 11,127$ 1,454$
Notes:1) Unless otherwise noted, costs include an inflation factor of 3.3% per year beginning FY 13/14.2) 12/13 Costs are present value based on January 2012 ENR LA CCI of 10,092.3) Amounts are rounded which may affect footing.
PROPOSED CIP BUDGET 12/13 ‐ 16/17SUMMARY OF EXPENDITURES AND FUNDING SOURCES (THOUSANDS)
page 1 of 1

PROPOSED CIP BUDGET 12/13 THRU 16/17 PROJECT EXPENDITURES (THOUSANDS)
NOTES: 1) Unless otherwise noted, costs include an inflation factor of 3.3% per year beginning FY 13/14.2) 12/13 Costs are present value based on January 2012 ENR LA CCI of 10,092.3) SRF Loan assumes 3% interest for 20 year term.4) Amounts are rounded which may affect footing.
Project Name Job No.Estimated
CompletionEst. Cost to Date
6/30/12 12/13 13/14 14/15 15/16 16/17 FutureTotal Cost
(Incl. Inflation)
Capitalized OperationsOps - Annual Raise Air Vacs (ESA) 202033 2016 325$ 25$ 26$ 27$ 28$ -$ -$ 430$ Ops - Annual Raise Air Vacs (WSA) 98048 Annual 5$ 19$ 20$ 20$ 21$ 22$ 250$ 357$ Ops - Annual Sewer Rehab Annual -$ 30$ 31$ 32$ 33$ 68$ 497$ 691$ Ops - Blowoff Installation 208015 Annual 273$ 50$ 52$ 53$ 83$ 85$ 207$ 803$ Ops - ESA Poly Service Replacement 202032 Annual 55$ 45$ 46$ 48$ 50$ 68$ 799$ 1,112$ Ops - SCADA Network/Comm Upgrades 208009 2013 110$ 165$ -$ -$ -$ -$ -$ 275$ Ops - SCADA Software Upgrades (Ops) 208003 2013 1,190$ 229$ -$ -$ -$ -$ -$ 1,419$ Ops - Security System Upgrades Ph 2 205002 2017 318$ 50$ 52$ 53$ 55$ 57$ 314$ 900$ Ops - Sewer Manhole Rehabilitation 201004 Annual 10$ 50$ 52$ 53$ 55$ 85$ 984$ 1,290$ Ops - Site Paving As Needed Annual -$ 50$ 52$ 53$ 55$ 85$ 571$ 867$ Ops - Valve Replacement Program (ESA) 202034 Annual 100$ 100$ 129$ 133$ 138$ 165$ 1,387$ 2,152$ Ops - Valve Replacement Program (WSA) 99017 Annual 432$ 400$ 413$ 427$ 441$ 455$ 4,754$ 7,322$ Ops - Vault Lid Replacement 211023 2013 25$ 25$ 26$ -$ -$ -$ -$ 76$ Ops - WSA Poly Service Replacement 202008 Annual 167$ 75$ 52$ 53$ 55$ 57$ 2,583$ 3,042$ WRF Treatment Equipment Repl Program 207006 Annual 59$ 50$ 145$ 149$ 154$ 159$ 808$ 1,524$
Subtotal 3,068$ 1,363$ 1,094$ 1,103$ 1,167$ 1,308$ 13,154$ 22,258$
Mandated by External AgenciesCity of Santee Atlas View Sidewalks Service Reloc. 2013 -$ 25$ -$ -$ -$ -$ -$ 25$ City of Santee Bridge Retrofits Util. Reloc. 2014 -$ 50$ 52$ -$ -$ -$ -$ 102$ City of Santee Buena Vista/Railroad Impr. 2013 -$ 25$ -$ -$ -$ -$ -$ 25$ City of Santee Carlton Oaks Bridge Retrofit 2014 -$ 75$ 77$ -$ -$ -$ -$ 152$ City of Santee Cottonwood Ave Util. Reloc 2014 -$ -$ 26$ -$ -$ -$ -$ 26$ City of Santee Cuyamaca/Miss Gorge Rt Turn Lanes Not budgeted -$ -$ -$ -$ -$ -$ -$ -$ City of Santee Magnolia Widening Util. Reloc. 2015 -$ -$ -$ 27$ -$ -$ -$ 27$ City of Santee Magnolia/Palm Glen Util. Reloc. Not budgeted -$ -$ -$ -$ -$ -$ -$ -$ City of Santee Mission Gorge Drainage Conflicts 2015 -$ -$ -$ 107$ -$ -$ -$ 107$ City of Santee Mission Gorge Median Util. Reloc. 2013 -$ 25$ -$ -$ -$ -$ -$ 25$ City of Santee Olive Lane Util. Reloc. 2014 -$ -$ 26$ -$ -$ -$ -$ 26$ City of Santee Pavement Repair Util. Reloc. 2015 -$ 50$ 52$ 53$ -$ -$ -$ 155$ City of Santee Prospect Ave East Util. Reloc. 211003 2014 -$ 250$ 258$ -$ -$ -$ -$ 508$ City of Santee Prospect Ave Sidewalks W. Util. Reloc. 2016 -$ -$ 103$ 107$ 55$ -$ -$ 265$ City of Santee Prospect Ave West Util. Reloc. 2015 -$ -$ 258$ 267$ -$ -$ -$ 525$ City of Santee Riverwalk/Park Center Dr 2012 25$ -$ -$ -$ -$ -$ -$ 25$ City of Santee Storm Drain Conflicts 2016 -$ 75$ 77$ 80$ 55$ -$ -$ 288$ City of Santee Woodside/Shadow Hill Util Reloc. Not budgeted -$ -$ -$ -$ -$ -$ -$ -$ County Alpine Blvd Service Relocations 2014 -$ -$ 207$ -$ -$ -$ -$ 207$
page 1 of 5

PROPOSED CIP BUDGET 12/13 THRU 16/17 PROJECT EXPENDITURES (THOUSANDS)
Project Name Job No.Estimated
CompletionEst. Cost to Date
6/30/12 12/13 13/14 14/15 15/16 16/17 FutureTotal Cost
(Incl. Inflation)
County Wing Avenue Sewer Relocation 2013 -$ 220$ -$ -$ -$ -$ -$ 220$ Forester Creek Utility Relocation Participation 200006 2012 1,179$ -$ -$ -$ -$ -$ -$ 1,179$ Lakeside Interceptor Replacement Participation 206007 Annual 1,242$ 15$ 207$ 213$ 220$ 228$ 1,495$ 3,620$ Stage 2 DBPR System Improvements 206028 2022 33$ -$ -$ -$ -$ -$ 74$ 107$ Undefined External Mandates Annual -$ -$ -$ -$ 551$ 569$ 3,141$ 4,262$ Urban Water Management Plan 2015 2016 -$ -$ -$ 53$ 55$ -$ -$ 108$ WDR Sewer System Management Plan Update 2014 -$ 25$ 77$ -$ -$ -$ -$ 102$ WRF NPDES Permit Annual Updates Annual -$ 10$ 10$ 11$ 11$ 11$ 63$ 116$ WRF NPDES Permit Renewal 2014 2015 -$ 65$ 67$ 133$ -$ -$ -$ 266$
Subtotal 2,479$ 910$ 1,498$ 1,051$ 948$ 808$ 4,773$ 12,467$
CIP General5 Res Retrofit Ph 4 - Blossom Valley 208027 2017 132$ -$ -$ -$ 3,307$ 5,693$ -$ 9,132$ 5 Res Retrofit Ph 4 - Blossom Valley Permitting 2015 -$ -$ -$ 80$ -$ -$ -$ 80$ Annual Post-Project Engineering Annual -$ 10$ 5$ 5$ 6$ 6$ 31$ 63$ Annual Sewer Assessment/Repl/Rehab Annual -$ 300$ 258$ 213$ 110$ 57$ 628$ 1,567$ Asset Management System/CMMS 2050000 2017 -$ -$ -$ -$ 551$ 285$ -$ 836$ Blossom Valley Res Drainage & Site Impr. 2016 -$ 60$ -$ -$ 165$ -$ -$ 225$ Braverman Sewer Cured in Place Repairs Ph 2 2013 -$ 250$ -$ -$ -$ -$ -$ 250$ Capacity Fee Update 2014 2016 -$ -$ -$ 110$ 114$ -$ -$ 223$ Carlton Hills Diversion Structure Upgrade 2120000 2015 -$ 75$ -$ 534$ -$ -$ -$ 609$ CSC Elec Reliability & Consolidation 209004 2013 39$ 110$ -$ -$ -$ -$ -$ 149$ CSC Ph 2 - Verizon Relocation 2013 -$ 30$ -$ -$ -$ -$ -$ 30$ Emerg Generators Startup, Testing, and Permitting 2013 -$ 50$ -$ -$ -$ -$ -$ 50$ Emergency Interconn Trailer Mounted Pumps 2016 -$ -$ 21$ 213$ 52$ -$ -$ 286$ Eng System Data Updates (Annual) 211015 Annual 5$ 5$ 5$ 5$ 6$ 6$ 31$ 63$ ESA Sec. Supply Conn Legal Costs 203032 2013 1,156$ 75$ -$ -$ -$ -$ -$ 1,231$ Facility Condition Assessment Sewer 2015 -$ 15$ 15$ 16$ -$ -$ -$ 47$ Facility Condition Assessment Water 2015 -$ 35$ 36$ 37$ -$ -$ -$ 109$ Financial Computer Syst Upgrade 2014 1,000$ 1,500$ 1,550$ -$ -$ -$ -$ 4,050$ GIS Projects 209016 425$ 150$ 77$ 53$ 55$ -$ -$ 761$ I-8 Crossing - Labrador Lane 2016 -$ -$ 129$ 373$ 66$ -$ -$ 569$ I-8 Crossing - Viewside Lane 8" Replacement 207024 2013 -$ 50$ -$ -$ -$ -$ -$ 50$ IFP & Program EIR 2014 -$ 100$ 413$ -$ -$ -$ -$ 513$ IFP Annual Updates 2013-2022 Annual -$ 45$ 62$ 48$ 66$ 51$ 331$ 603$ IPS Chopper Pumps 209013 2014 106$ 50$ 52$ -$ -$ -$ -$ 208$ JWA NCCP Subarea Plan (PD + Otay share) 98046 2013 809$ 50$ -$ -$ -$ -$ -$ 859$ JWA NCCP Subarea Plan (Ph 2) 2090000 2020 -$ -$ 72$ 75$ 77$ 63$ 197$ 484$ Magnolia Ave South Relief Sewer - Segment 1 204030 2016 39$ 75$ -$ 320$ 55$ -$ -$ 489$ METRO Sewer Billing 210008 2014 200$ 30$ 15$ -$ -$ -$ -$ 246$ Mission Gorge Rd 36" Valves 2100000 2017 -$ -$ -$ -$ -$ 399$ -$ 399$ Northcote Pump Station Upgrade 2130000 2019 -$ -$ -$ -$ -$ 38$ 224$ 262$ Pipe Evaluations - Bridge Crossings 2014 -$ 50$ 103$ -$ -$ -$ -$ 153$ Reservoir Refurbishing Ph 5 210017 2017 7$ -$ -$ 320$ 110$ 114$ 96$ 648$ Rios Canyon PS Suction Rplc 211014 2014 150$ 650$ 258$ -$ -$ -$ -$ 1,058$ Santee Basin Aquifer Study & Env. (PD Share) 210020 2015 207$ 200$ 52$ 53$ -$ -$ -$ 512$
page 2 of 5

PROPOSED CIP BUDGET 12/13 THRU 16/17 PROJECT EXPENDITURES (THOUSANDS)
Project Name Job No.Estimated
CompletionEst. Cost to Date
6/30/12 12/13 13/14 14/15 15/16 16/17 FutureTotal Cost
(Incl. Inflation)
Sewer Flow Studies 5 Year Updates 2015 -$ -$ -$ 107$ -$ -$ 126$ 232$ Sewer Rehab Fanita Parkway 2015 -$ -$ 103$ 107$ -$ -$ -$ 210$ Sewer Trans-River Interceptor (Siphon) Assessment 2014 -$ 30$ 103$ -$ -$ -$ -$ 133$ Solar Energy Feasibility Study (CSC & WRF) 2014 -$ -$ 15$ -$ -$ -$ -$ 15$ Solar Power - Res/Ops/WRF Sites 211012 2022 35$ -$ 15$ 16$ 17$ 17$ 94$ 195$ Steel Pipe Condition Assessment 2022 -$ 150$ 155$ 213$ 220$ 228$ 1,256$ 2,223$ Steel Pipe Replacement Future -$ -$ -$ 320$ 386$ 455$ 3,141$ 4,303$ Sunrise Reservoir Verizon Relocation 2013 -$ 50$ -$ -$ -$ -$ -$ 50$ Sycamore Creek Flood Wall 2015 -$ -$ 258$ 267$ -$ -$ -$ 525$ Sycamore Creek Hydrology Study 2013 5$ 125$ -$ -$ -$ -$ -$ 130$ Walmart Sewer Diversion Structure 211022 2014 100$ 150$ 517$ -$ -$ -$ -$ 767$ Water Pump Replacement Program (2011-2015) 2015 -$ -$ 146$ 150$ -$ -$ -$ 296$ Willowgrove Sewer, Phase 2 Assessment 209006 2016 40$ 30$ 31$ 32$ 165$ -$ -$ 299$ WRF & Pond Valve Replacements 2090000 2016 -$ -$ 57$ 86$ 331$ -$ -$ 473$ WRF Aeration Panels 2110000 2017 -$ -$ -$ -$ 69$ 72$ -$ 141$ WRF Chlorine Trolley (CIP portion) 211025 2014 -$ 350$ 77$ -$ -$ -$ -$ 427$ WRF Demo Project RFP 2013 -$ 45$ -$ -$ -$ -$ -$ 45$ WRF Fence Replacement 2014 -$ -$ 103$ -$ -$ -$ -$ 103$ WRF Paving & Entry Gate 212002 2013 150$ 60$ -$ -$ -$ -$ -$ 210$ WRF SO2-Wet Scrubber 2060000 2015 -$ 15$ 99$ 11$ -$ -$ -$ 125$
Subtotal 4,606$ 4,970$ 4,805$ 3,766$ 5,928$ 7,482$ 6,157$ 37,714$
Debt & External Financing Required5 Res Retrofit Ph 3 - West Victoria 208026 2013 4,540$ 1,100$ -$ -$ -$ -$ -$ 5,640$ CSC Ph 2 - OPS 205014 2014 914$ 1,773$ 2,963$ -$ -$ -$ -$ 5,650$ El Monte GW / WRF Expansion Feasibility Study 205051 2012 338$ -$ -$ -$ -$ -$ -$ 338$ Emergency Generator - Flinn Springs PS 209014 2013 248$ 800$ -$ -$ -$ -$ -$ 1,048$ Emergency Generator - Rios Canyon PS 209019 2013 229$ 500$ -$ -$ -$ -$ -$ 729$ ESA Sec. Supply Conn (incl Los Coches PS) 203032 2013 10,021$ 50$ -$ -$ -$ -$ -$ 10,071$ ESA Sec. Supply Conn Alt Site 2015 15$ 3,000$ 9,673$ 4,268$ -$ -$ -$ 16,956$ ESA Sec. Supply Conn Land Acquisition (2011) 211009 2013 152$ 625$ -$ -$ -$ -$ -$ 777$ ESA Sec. Supply Conn Mitigation & Monitoring 210001 2020 1$ 250$ 1$ 1$ 68$ 70$ 97$ 486$ Ops Security Gates (funded by Cell Phone Revenues) 2019 -$ -$ -$ 80$ 83$ 85$ 137$ 385$ Sunrise Reservoir Retaining Wall / Site Impr. 210026 2013 110$ 450$ -$ -$ -$ -$ -$ 560$ WRF Demo Project 2014 -$ 1,500$ 1,550$ -$ -$ -$ -$ 3,050$ WRF Studies 210014 2014 634$ 50$ 52$ -$ -$ -$ -$ 736$
Subtotal 17,203$ 10,098$ 14,237$ 4,349$ 150$ 155$ 234$ 46,427$
Developer DrivenAlpine High School D/P 209021 2013 14$ 93$ -$ -$ -$ -$ -$ 107$ Alpine Ranch Estates West D/P 210012 2014 2$ -$ 309$ -$ -$ -$ -$ 311$ El Cap Pipeline D/P (Rios Canyon, Pecan Park 24-in) 2070000 2015 -$ -$ 170$ 176$ -$ -$ -$ 346$ Grossmont College Privatization 205021 2013 67$ 35$ -$ -$ -$ -$ -$ 102$ Pebble Beach Relief Sewer (Castlerock) (12-in upsize) 203033 Future -$ -$ -$ -$ -$ -$ 818$ 818$
Subtotal 83$ 128$ 479$ 176$ -$ -$ 818$ 1,684$
page 3 of 5

PROPOSED CIP BUDGET 12/13 THRU 16/17 PROJECT EXPENDITURES (THOUSANDS)
Project Name Job No.Estimated
CompletionEst. Cost to Date
6/30/12 12/13 13/14 14/15 15/16 16/17 FutureTotal Cost
(Incl. Inflation)
COP Financing5 Res Retrofit Ph 3 - West Victoria 208026 2013 (4,474)$ (1,100)$ -$ -$ -$ -$ -$ (5,574)$ Emergency Generator - Flinn Springs PS 2013 -$ (800)$ -$ -$ -$ -$ -$ (800)$ Emergency Generator - Rios Canyon PS 2013 -$ (500)$ -$ -$ -$ -$ -$ (500)$ ESA Sec. Supply Conn (incl Los Coches) 203032 2013 (10,416)$ (50)$ -$ -$ -$ -$ -$ (10,466)$ ESA Sec. Supply Conn Alt Site 2015 (15)$ (3,000)$ (9,673)$ (1,454)$ -$ -$ -$ (14,142)$ ESA Sec. Supply Conn Land Acquisition (2011) 211009 2013 (120)$ (625)$ -$ -$ -$ -$ -$ (745)$ ESA Sec. Supply Conn Mitigation & Monitoring 2013 -$ (250)$ -$ -$ -$ -$ -$ (250)$ Sunrise Reservoir Retaining Wall / Site Impr. 2013 -$ (450)$ -$ -$ -$ -$ -$ (450)$
Subtotal (15,025)$ (6,775)$ (9,673)$ (1,454)$ -$ -$ -$ (32,927)$
Grants & Other FinancingCSC Ph 2 - OPS (Sale of Woodside Property) 205014 2014 (486)$ (835)$ (1,395)$ -$ -$ -$ -$ (2,717)$ El Monte GW / WRF Study - ARRA grant (25%) 205051 2012 (84)$ -$ -$ -$ -$ -$ -$ (84)$ Financial Computer Syst Upgrade, Ops Conting Fund 2012 (100)$ -$ -$ -$ -$ -$ -$ (100)$ Ops - Security Gates, Cell Phone Revenues 2019 -$ -$ -$ (80)$ (83)$ (85)$ (137)$ (385)$ WRF Demo Project - Grants 2014 -$ (1,500)$ (1,550)$ -$ -$ -$ -$ (3,050)$ WRF Studies, ARRA Grants 210014 (17)$ -$ -$ -$ -$ -$ -$ (17)$
Subtotal (687)$ (2,335)$ (2,945)$ (80)$ (83)$ (85)$ (137)$ (6,352)$
Debt ServiceAMR Debt Service 207029 2020 1,759$ 704$ 704$ 704$ 704$ 704$ 1,759$ 7,037$ COP Debt Service (CIP Share) 2040 256$ 174$ 214$ 217$ 208$ 204$ 33,853$ 35,127$
Subtotal 878$ 917$ 921$ 912$ 908$ 35,612$ 42,164$
TOTAL BUDGETED 11,727$ 9,237$ 10,413$ 9,832$ 9,023$ 10,577$ 60,611$ 123,435$
page 4 of 5

PROPOSED CIP BUDGET 12/13 THRU 16/17 PROJECT EXPENDITURES (THOUSANDS)
Project Name Job No.Estimated
CompletionEst. Cost to Date
6/30/12 12/13 13/14 14/15 15/16 16/17 FutureTotal Cost
(Incl. Inflation)
BELOW THE LINE - UNBUDGETED, EXTERNAL FINANCING REQUIREDCuyamaca/Carlton Oaks Interconn Upsize 2019 8$ -$ -$ -$ -$ 618$ 1,494$ 2,120$ Willowgrove Sewer, Phase 2 Constr 209006 2018 -$ -$ -$ -$ -$ -$ 959$ 959$ WRF Ph 1 Design (incl IPS) 210014 2016 -$ -$ -$ 2,134$ 2,205$ -$ -$ 4,339$ WRF Ph 1 Constr (WRF & AWT) 210014 2018 -$ -$ -$ -$ -$ 25,279$ 26,113$ 51,392$ WRF Ph 1 Recycled Water Dist System 2018 -$ -$ -$ -$ -$ 882$ 912$ 1,794$ WRF Ph 1 Recycled Water Retrofit 2018 -$ -$ -$ -$ -$ 294$ 303$ 597$
Subtotal 8$ -$ -$ 2,134$ 2,205$ 27,073$ 29,781$ 61,201$
SRF FinancingCuyamaca/Carlton Oaks Interconnect 2019 -$ -$ -$ -$ -$ (618)$ (1,494)$ (2,112)$ Willowgrove Sewer, Ph 2 Construction 209006 2018 -$ -$ -$ -$ -$ -$ (959)$ (959)$ WRF Ph 1 Design (incl IPS) 210014 2016 -$ -$ -$ (2,134)$ (2,205)$ -$ -$ (4,339)$ WRF Ph 1 Constr 210014 2018 -$ -$ -$ -$ -$ (25,279)$ (26,113)$ (51,392)$ WRF Ph 1 Recycled Water Dist System 2018 -$ -$ -$ -$ -$ (882)$ (912)$ (1,794)$ WRF Ph 1 Recycled Water Retrofit 2018 -$ -$ -$ -$ -$ (294)$ (303)$ (597)$
Subtotal -$ -$ -$ (2,134)$ (2,205)$ (27,073)$ (29,781)$ (61,193)$
Title 16 Grants WRF Ph 1 Design 2019 -$ -$ -$ -$ -$ -$ (1,000)$ (1,000)$ WRF Ph 1 Constr. 2021 -$ -$ -$ -$ -$ -$ (11,100)$ (11,100)$ WRF Ph 1 Recycled Water Dist Syst 2021 -$ -$ -$ -$ -$ -$ (129)$ (129)$ WRF Ph 1 Recycled Water Retrofit 2021 -$ -$ -$ -$ -$ -$ (387)$ (387)$
Subtotal -$ -$ -$ -$ -$ -$ (11,616)$ (11,616)$
Debt ServiceCuyamaca/Carlton Oaks Interconnect 2040 -$ -$ -$ -$ -$ -$ 2,770$ 2,770$ Willowgrove Sewer, Phase 2 209006 2040 -$ -$ -$ -$ -$ -$ 1,280$ 1,280$ WRF Ph 1 Design (incl IPS) 210014 2038 -$ -$ -$ -$ -$ -$ 5,740$ 5,740$ WRF Ph 1 Constr, 210014 2040 -$ -$ -$ -$ -$ -$ 67,960$ 67,960$ WRF Ph 1 Recycled Water Dist System 2040 -$ -$ -$ -$ -$ -$ 2,380$ 2,380$ WRF Ph 1 Recycled Water Retrofit 2040 -$ -$ -$ -$ -$ -$ 790$ 790$
Subtotal -$ -$ -$ -$ -$ -$ 80,920$ 80,920$
TOTAL BELOW THE LINE 8$ -$ -$ -$ -$ 0$ 69,304$ 69,312$
page 5 of 5

PROPOSED CIP BUDGET 12/13 THRU 16/17UNBUDGETED AND FUTURE PROJECTS (THOUSANDS)
Costs are present value based on January 2012 ENR LA CCI of 10,092.
Project Name Job No.Total Project
BudgetEstimated Cost to Date 6/30/12
Estimated Remaining 6/30/12
FUTURE / BEYOND 5 YEARS - MOVE UP AS BUDGET ALLOWSCrest Pipeline Upsizes TBD $944 $0 $944Crest Reservoir #11, #12 Replacement (2 MG) 203020 $5,522 $39 $5,483East Victoria Interconnect (12-inch) D/P 2120000 $459 $0 $459El Capitan Liner Replacement Project 2200000 $19,376 $0 $19,376El Capitan Pipeline Purchase $600 $0 $600Engineering Data Access $50 $0 $50Galloway Valley Res. Inlet/Outlet Upsize $201 $0 $201Graves Ave Relief Sewer (10-, 12-, 15-in) 2080000 $1,425 $0 $1,425Harbison Canyon Trans. Upgrade - Section 1 (14-in) 211001 $111 $18 $92I-8 Crossing - 30-in abandonment and replacement $2,347 $0 $2,347I-8 Crossing - Old Hwy 80/Blossom Valley Rd Parallel 8-in $786 $0 $786IPS Grinders $350 $0 $350Mountain View Pipeline Repl (12-in) 211002 $1,508 $34 $1,474Oak Creek Pump Station Upgrade (625 gpm) 2090000 $169 $0 $169Ops - SCADA Upgrades IPS $375 $0 $375Ops - SCADA Upgrades Operations 2017 $1,000 $0 $1,000Ops - SCADA Upgrades WRF Hardware & PLC $375 $0 $375Quick Connect for Mobile Pump 2120000 $11 $0 $11Reservoir Refurbishing - Future 2080000 $2,508 $0 $2,508Undefined Replacement - Retail Water Mains (2015-2019) 2100000 $719 $0 $719Undefined Replacement - Sewer Mains (2015-2019) 2110000 $4,000 $0 $4,000Undefined Replacement - Sewer Pump Stations (2010-2014) 2070000 $407 $0 $407Undefined Replacement - Sewer Pump Stations (2015-2019) 2110000 $1,033 $0 $1,033Undefined Replacement - Water Pump Stations (2016-2020) 2100000 $4,747 $0 $4,747Undefined Replacement - Water Pumps( 2016-2020) $309 $0 $309Urban Water Management Plan 2020 $100 $0 $100Vulnerability Assessment Implementation 2030000 $2,109 $0 $2,109Water Pump Station Replacement (2011-2015) - El Capitan Booster 2160000 $1,136 $0 $1,136Wholesale Res Seismic Actuator 210025 $269 $19 $250WRF NPDES Permit Renewal 2019 $255 $0 $255
Subtotal $53,200 $110 $53,090
FUTURE / BEYOND 10 YEARSADA - Alpine 2140000 $35 $0 $35ADA - Operations 2140000 $46 $0 $46ADA - WRF 2140000 $59 $0 $59Alpine/Viejas Trans Main Extension (16-in) 2160000 $612 $0 $612Bend St Sewer Relief 2150000 $312 $0 $312East Mast/Riverford Relief Sewer (12- and 15-in) 2200000 $3,195 $0 $3,195East Mission Gorge Interceptor Participation 204008 $7,085 $41 $7,044ESA Reliability - Alpine Heights Pump Station (1600 gpm) 2110000 $2,464 $0 $2,464ESA Reliability - Alpine South Pump Station (1500 gpm) $2,859 $0 $2,859ESA Reliability - Alpine West Pump Station (5100 gpm) 2110000 $5,229 $0 $5,229ESA Reliability - Alpine West Reservoir (2 MG) 2110000 $5,498 $0 $5,498ESA Reliability - Alpine West Trans. Main (12- and 16-in) $343 $0 $343ESA Reliability - Harbison Canyon Trans. Upgrade - Section 2 (16-in) $1,150 $0 $1,150ESA Reliability - Mountain Top Interconnect (12-in) 2090000 $2,719 $0 $2,719ESA Reliability - Rios Canyon Pump Station #2 Upgrade 2200000 $1,017 $0 $1,017Flinn Springs Pump Station #3 Upgrade 2200000 $1,967 $0 $1,967Magnolia Ave North Relief Sewer - Segment 2 2080000 $1,289 $0 $1,289Magnolia Ave South Relief Sewer - Segment 2 2080000 $2,071 $0 $2,071Mission Gorge Rd Relief Sewer (12-, 15-, 18-in) 2080000 $1,273 $0 $1,273
page 1 of 2

PROPOSED CIP BUDGET 12/13 THRU 16/17UNBUDGETED AND FUTURE PROJECTS (THOUSANDS)
Project Name Job No.Total Project
BudgetEstimated Cost to Date 6/30/12
Estimated Remaining 6/30/12
Oak Creek East Pump Station (1400 gpm) 2200000 $0 $0 $0Oak Creek East Reservoir D/P (0.75 MG) 2200000 $504 $0 $504Oak Creek East Reservoir Trans. Main D/P (12-in) 2200000 $315 $0 $315Spanish Bit Reservoir North Loop (10-in) 2120000 $331 $0 $331Sunrise Conversion to Recycled Water $329 $0 $329Undefined Repl - Recycled Water Pumps (2020-2024) $396 $0 $396Undefined Repl - Retail Water Mains (2020-2029) $1,432 $0 $1,432Undefined Repl - Sewer Mains (2020-2024) $11,188 $0 $11,188Undefined Repl - Water Pump Stations (2021-2025) $3,441 $0 $3,441Viejas Mtn South Res Expansion & Repl $2,135 $0 $2,135Woodrose/Woodpark Sewer Relief 2130000 $2,302 $0 $2,302
Subtotal $61,596 $41 $61,556
TOTAL FUTURE $114,797 $151 $114,645
page 2 of 2

EXHIBIT D
2013-2017 Five Year Business Plan
(See Chapters 1-12)

SALARY GRADE Min. Mid. Max.
SALARY GRADE Min. Mid. Max.
5 10.91$ 13.67$ 16.43$ 27 30.51$ 38.23$ 45.95$
6 11.79$ 14.77$ 17.75$ 28 30.85$ 38.65$ 46.45$
7 12.66$ 15.86$ 19.06$ 29 32.02$ 40.12$ 48.22$
8 13.53$ 16.96$ 20.38$ 30 33.13$ 41.51$ 49.89$
9 14.40$ 18.05$ 21.69$ 31 33.60$ 42.10$ 50.60$
10 15.15$ 18.99$ 22.82$ 32 34.47$ 43.20$ 51.92$
11 16.15$ 20.24$ 24.32$ 33 35.58$ 44.58$ 53.58$
12 17.17$ 21.51$ 25.85$ 34 36.22$ 45.39$ 54.55$
13 17.90$ 22.43$ 26.95$ 35 37.27$ 46.70$ 56.12$
14 18.86$ 23.63$ 28.40$ 36 38.23$ 47.90$ 57.57$
15 19.94$ 24.98$ 30.02$ 37 38.98$ 48.84$ 58.70$
16 20.60$ 25.81$ 31.02$ 38 39.71$ 49.76$ 59.80$
17 21.65$ 27.13$ 32.60$ 39 40.58$ 50.85$ 61.12$
18 22.61$ 28.33$ 34.05$ 40 41.14$ 51.55$ 61.95$
19 23.15$ 29.00$ 34.85$ 41 42.33$ 53.04$ 63.75$
20 24.41$ 30.58$ 36.75$ 42 43.20$ 54.13$ 65.06$
21 24.94$ 31.25$ 37.55$ 43 44.08$ 55.23$ 66.37$
22 25.42$ 31.85$ 38.28$ 44 44.95$ 56.32$ 67.69$
23 26.81$ 33.59$ 40.37$ 45 46.22$ 57.91$ 69.60$
24 27.43$ 34.37$ 41.30$ 46 46.30$ 58.02$ 69.73$
25 28.64$ 35.89$ 43.13$ 47 47.57$ 59.60$ 71.63$
26 29.26$ 36.66$ 44.06$ 48 48.12$ 60.30$ 72.47$
* This schedule is for Year 1 only. In accordance with the MOU each year will be based on the February San Diego CPI-W.
HOURLY WAGES BY GRADE*
PADRE DAM MUNICIPAL WATER DISTRICT
Job Classifications and Salary GradesFiscal Year Budget 2012-2013

PADRE DAM MUNICIPAL WATER DISTRICTFiscal Year Budget 2012-2013
Job Classification Schedule for All Employees
CLASSIFICATIONMin. Mid. Max. Min. Mid. Max. Min. Mid. Max.
Accountant 23 $26.81 - $33.59 - $40.37 $4,647 - $5,822 - $6,997 $55,765 - $69,867 - $83,970Accountant, Senior 29 $32.02 - $40.12 - $48.22 $5,550 - $6,954 - $8,358 $66,602 - $83,450 - $100,298Accounting Manager 38 $39.71 - $49.76 - $59.80 $6,883 - $8,625 - $10,365 $82,597 - $103,501 - $124,384Accounting Specialist 13 $17.90 - $22.43 - $26.95 $3,103 - $3,888 - $4,671 $37,232 - $46,654 - $56,056Accounting Specialist 15 $19.94 - $24.98 - $30.02 $3,456 - $4,330 - $5,203 $41,475 - $51,958 - $62,442Accounting Specialist 17 $21.65 - $27.13 - $32.60 $3,753 - $4,703 - $5,651 $45,032 - $56,430 - $67,808Administrative Assistant 11 $16.15 - $20.24 - $24.32 $2,799 - $3,508 - $4,215 $33,592 - $42,099 - $50,586Administrative Assistant 13 $17.90 - $22.43 - $26.95 $3,103 - $3,888 - $4,671 $37,232 - $46,654 - $56,056Administrative Assistant 15 $19.94 - $24.98 - $30.02 $3,456 - $4,330 - $5,203 $41,475 - $51,958 - $62,442Administrative Assistant 18 $22.61 - $28.33 - $34.05 $3,919 - $4,911 - $5,902 $47,029 - $58,926 - $70,824Assistant Operations Manager 40 $41.14 - $51.55 - $61.95 $7,131 - $8,935 - $10,738 $85,571 - $107,224 - $128,856Board Secretary 27 $30.51 - $38.23 - $45.95 $5,288 - $6,627 - $7,965 $63,461 - $79,518 - $95,576Cathodic Protection Program Coordinator 25 $28.64 - $35.89 - $43.13 $4,964 - $6,221 - $7,476 $59,571 - $74,651 - $89,710Cathodic Protection Program Coordinator 27 $30.51 - $38.23 - $45.95 $5,288 - $6,627 - $7,965 $63,461 - $79,518 - $95,576Cathodic Protection Program Coordinator 30 $33.13 - $41.51 - $49.89 $5,743 - $7,195 - $8,648 $68,910 - $86,341 - $103,771Communications Coordinator 25 $28.64 - $35.89 - $43.13 $4,964 - $6,221 - $7,476 $59,571 - $74,651 - $89,710Communications Manager 35 $37.27 - $46.70 - $56.12 $6,460 - $8,095 - $9,727 $77,522 - $97,136 - $116,730Communications Officer 30 $33.13 - $41.51 - $49.89 $5,743 - $7,195 - $8,648 $68,910 - $86,341 - $103,771Construction & Maintenance Supervisor 27 $30.51 - $38.23 - $45.95 $5,288 - $6,627 - $7,965 $63,461 - $79,518 - $95,576Construction Equipment Operator 18 $22.61 - $28.33 - $34.05 $3,919 - $4,911 - $5,902 $47,029 - $58,926 - $70,824Construction Equipment Operator 20 $24.41 - $30.58 - $36.75 $4,231 - $5,301 - $6,370 $50,773 - $63,606 - $76,440Construction Inspector 18 $22.61 - $28.33 - $34.05 $3,919 - $4,911 - $5,902 $47,029 - $58,926 - $70,824Construction Inspector 20 $24.41 - $30.58 - $36.75 $4,231 - $5,301 - $6,370 $50,773 - $63,606 - $76,440Construction Inspector 23 $26.81 - $33.59 - $40.37 $4,647 - $5,822 - $6,997 $55,765 - $69,867 - $83,970Construction Inspector 25 $28.64 - $35.89 - $43.13 $4,964 - $6,221 - $7,476 $59,571 - $74,651 - $89,710Custodian 10 $15.15 - $18.99 - $22.82 $2,626 - $3,292 - $3,955 $31,512 - $39,499 - $47,466Customer Service Manager 28 $30.85 - $38.65 - $46.45 $5,347 - $6,699 - $8,051 $64,168 - $80,392 - $96,616Customer Service Representative 11 $16.15 - $20.24 - $24.32 $2,799 - $3,508 - $4,215 $33,592 - $42,099 - $50,586Customer Service Representative 13 $17.90 - $22.43 - $26.95 $3,103 - $3,888 - $4,671 $37,232 - $46,654 - $56,056Customer Service Representative 15 $19.94 - $24.98 - $30.02 $3,456 - $4,330 - $5,203 $41,475 - $51,958 - $62,442Director of Engineering & Planning Uncl. $57.87 - $71.70 - $85.52 $10,031 - $12,428 - $14,823 $120,370 - $149,136 - $177,882Director of Finance/Chief Financial Officer Uncl. $57.87 - $71.70 - $85.52 $10,031 - $12,428 - $14,823 $120,370 - $149,136 - $177,882Director of Human Resources Uncl. $44.68 - $55.36 - $66.03 $7,745 - $9,596 - $11,445 $92,934 - $115,149 - $137,342Director of Operations & Water Quality Uncl. $57.87 - $71.70 - $85.52 $10,031 - $12,428 - $14,823 $120,370 - $149,136 - $177,882
MONTHLY PAY RANGE ANNUAL PAY RANGESalary Grade
HOURLY PAY RANGE*

PADRE DAM MUNICIPAL WATER DISTRICTFiscal Year Budget 2012-2013
Job Classification Schedule for All Employees
CLASSIFICATIONMin. Mid. Max. Min. Mid. Max. Min. Mid. Max.
MONTHLY PAY RANGE ANNUAL PAY RANGESalary Grade
HOURLY PAY RANGE*
Director of Park & Recreation Uncl. $45.99 - $57.63 - $69.27 $7,972 - $9,989 - $12,007 $95,659 - $119,870 - $144,082Distribution Maintenance Supervisor 27 $30.51 - $38.23 - $45.95 $5,288 - $6,627 - $7,965 $63,461 - $79,518 - $95,576Distribution Supervisor 30 $33.13 - $41.51 - $49.89 $5,743 - $7,195 - $8,648 $68,910 - $86,341 - $103,771Electrician/Instrumentation & Control Supervisor 30 $33.13 - $41.51 - $49.89 $5,743 - $7,195 - $8,648 $68,910 - $86,341 - $103,771Electrician/Instrumentation & Control Technician 18 $22.61 - $28.33 - $34.05 $3,919 - $4,911 - $5,902 $47,029 - $58,926 - $70,824Electrician/Instrumentation & Control Technician 22 $25.42 - $31.85 - $38.28 $4,406 - $5,521 - $6,635 $52,874 - $66,248 - $79,622Electrician/Instrumentation & Control Technician 26 $29.26 - $36.66 - $44.06 $5,072 - $6,354 - $7,637 $60,861 - $76,253 - $91,645Engineer 29 $32.02 - $40.12 - $48.22 $5,550 - $6,954 - $8,358 $66,602 - $83,450 - $100,298Engineer 33 $35.58 - $44.58 - $53.58 $6,167 - $7,727 - $9,287 $74,006 - $92,726 - $111,446Engineer 36 $38.23 - $47.90 - $57.57 $6,627 - $8,303 - $9,979 $79,518 - $99,632 - $119,746Engineer 41 $42.33 - $53.04 - $63.75 $7,337 - $9,194 - $11,050 $88,046 - $110,323 - $132,600Engineering Manager 44 $44.95 - $56.32 - $67.69 $7,791 - $9,762 - $11,733 $93,496 - $117,146 - $140,795Engineering Manager 48 $48.12 - $60.30 - $72.47 $8,341 - $10,452 - $12,561 $100,090 - $125,424 - $150,738Engineering Staff Assistant 18 $22.61 - $28.33 - $34.05 $3,919 - $4,911 - $5,902 $47,029 - $58,926 - $70,824Engineering Supervisor 29 $32.02 - $40.12 - $48.22 $5,550 - $6,954 - $8,358 $66,602 - $83,450 - $100,298Engineering Technician 18 $22.61 - $28.33 - $34.05 $3,919 - $4,911 - $5,902 $47,029 - $58,926 - $70,824Engineering Technician 20 $24.41 - $30.58 - $36.75 $4,231 - $5,301 - $6,370 $50,773 - $63,606 - $76,440Engineering Technician 23 $26.81 - $33.59 - $40.37 $4,647 - $5,822 - $6,997 $55,765 - $69,867 - $83,970Engineering Technician 25 $28.64 - $35.89 - $43.13 $4,964 - $6,221 - $7,476 $59,571 - $74,651 - $89,710Equipment Mechanic 20 $24.41 - $30.58 - $36.75 $4,231 - $5,301 - $6,370 $50,773 - $63,606 - $76,440Equipment Mechanic 25 $28.64 - $35.89 - $43.13 $4,964 - $6,221 - $7,476 $59,571 - $74,651 - $89,710Facilities Maintenance Worker 12 $17.17 - $21.51 - $25.85 $2,976 - $3,728 - $4,481 $35,714 - $44,741 - $53,768Facilities Maintenance Worker 14 $18.86 - $23.63 - $28.40 $3,269 - $4,096 - $4,923 $39,229 - $49,150 - $59,072Facilities Maintenance Worker 17 $21.65 - $27.13 - $32.60 $3,753 - $4,703 - $5,651 $45,032 - $56,430 - $67,808Facilities Maintenance Specialist 23 $26.81 - $33.59 - $40.37 $4,647 - $5,822 - $6,997 $55,765 - $69,867 - $83,970GIS/Mapping Administrator 33 $35.58 - $44.58 - $53.58 $6,167 - $7,727 - $9,287 $74,006 - $92,726 - $111,446GIS/Mapping Specialist 20 $24.41 - $30.58 - $36.75 $4,231 - $5,301 - $6,370 $50,773 - $63,606 - $76,440GIS/Mapping Specialist 22 $25.42 - $31.85 - $38.28 $4,406 - $5,521 - $6,635 $52,874 - $66,248 - $79,622GIS/Mapping Specialist 24 $27.43 - $34.37 - $41.30 $4,755 - $5,957 - $7,159 $57,054 - $71,490 - $85,904Human Resources Specialist 20 $24.41 - $30.58 - $36.75 $4,231 - $5,301 - $6,370 $50,773 - $63,606 - $76,440Human Resources Specialist 25 $28.64 - $35.89 - $43.13 $4,964 - $6,221 - $7,476 $59,571 - $74,651 - $89,710Industrial Code Compliance Specialist 20 $24.41 - $30.58 - $36.75 $4,231 - $5,301 - $6,370 $50,773 - $63,606 - $76,440Industrial Code Compliance Specialist 23 $26.81 - $33.59 - $40.37 $4,647 - $5,822 - $6,997 $55,765 - $69,867 - $83,970

PADRE DAM MUNICIPAL WATER DISTRICTFiscal Year Budget 2012-2013
Job Classification Schedule for All Employees
CLASSIFICATIONMin. Mid. Max. Min. Mid. Max. Min. Mid. Max.
MONTHLY PAY RANGE ANNUAL PAY RANGESalary Grade
HOURLY PAY RANGE*
Information Systems Manager 44 $44.95 - $56.32 - $67.69 $7,791 - $9,762 - $11,733 $93,496 - $117,146 - $140,795Information Systems Technicial Specialist 20 $24.41 - $30.58 - $36.75 $4,231 - $5,301 - $6,370 $50,773 - $63,606 - $76,440Information Systems Technicial Specialist 24 $27.43 - $34.37 - $41.30 $4,755 - $5,957 - $7,159 $57,054 - $71,490 - $85,904Information Systems Technicial Specialist 30 $33.13 - $41.51 - $49.89 $5,743 - $7,195 - $8,648 $68,910 - $86,341 - $103,771Laboratory Analyst 14 $18.86 - $23.63 - $28.40 $3,269 - $4,096 - $4,923 $39,229 - $49,150 - $59,072Laboratory Analyst 20 $24.41 - $30.58 - $36.75 $4,231 - $5,301 - $6,370 $50,773 - $63,606 - $76,440Laboratory Analyst 22 $25.42 - $31.85 - $38.28 $4,406 - $5,521 - $6,635 $52,874 - $66,248 - $79,622Laboratory Analyst, Senior 31 $33.60 - $42.10 - $50.60 $5,824 - $7,297 - $8,771 $69,888 - $87,568 - $105,248Meter Services Administrator 29 $32.02 - $40.12 - $48.22 $5,550 - $6,954 - $8,358 $66,602 - $83,450 - $100,298Meter Shop Supervisor 25 $28.64 - $35.89 - $43.13 $4,964 - $6,221 - $7,476 $59,571 - $74,651 - $89,710Meter Technician 14 $18.86 - $23.63 - $28.40 $3,269 - $4,096 - $4,923 $39,229 - $49,150 - $59,072Meter Technician 16 $20.60 - $25.81 - $31.02 $3,571 - $4,474 - $5,377 $42,848 - $53,685 - $64,522Meter Technician 18 $22.61 - $28.33 - $34.05 $3,919 - $4,911 - $5,902 $47,029 - $58,926 - $70,824Operations Manager 45 $46.22 $57.91 $69.60 $8,011 - $10,038 - $12,064 $96,138 - $120,453 - $144,768Park & Recreation Coordinator 10 $15.15 - $18.99 - $22.82 $2,626 - $3,292 - $3,955 $31,512 - $39,499 - $47,466Park & Recreation Coordinator 12 $17.17 - $21.51 - $25.85 $2,976 - $3,728 - $4,481 $35,714 - $44,741 - $53,768Park & Recreation Coordinator 14 $18.86 - $23.63 - $28.40 $3,269 - $4,096 - $4,923 $39,229 - $49,150 - $59,072Park & Recreation Manager 36 $38.23 - $47.90 - $57.57 $6,627 - $8,303 - $9,979 $79,518 - $99,632 - $119,746Park & Recreation Supervisor 19 $23.15 - $29.00 - $34.85 $4,013 - $5,027 - $6,041 $48,152 - $60,320 - $72,488Park & Recreation Aide 5 $10.91 - $13.67 - $16.43 $1,891 - $2,369 - $2,848 $22,693 - $28,434 - $34,174Plant Manager 35 $37.27 - $46.70 - $56.12 $6,460 - $8,095 - $9,727 $77,522 - $97,136 - $116,730Recycled Water Operations Supervisor 27 $30.51 - $38.23 - $45.95 $5,288 - $6,627 - $7,965 $63,461 - $79,518 - $95,576Recycled Water Operator 14 $18.86 - $23.63 - $28.40 $3,269 - $4,096 - $4,923 $39,229 - $49,150 - $59,072Recycled Water Operator 17 $21.65 - $27.13 - $32.60 $3,753 - $4,703 - $5,651 $45,032 - $56,430 - $67,808Recycled Water Operator 20 $24.41 - $30.58 - $36.75 $4,231 - $5,301 - $6,370 $50,773 - $63,606 - $76,440Recycled Water Operator 23 $26.81 - $33.59 - $40.37 $4,647 - $5,822 - $6,997 $55,765 - $69,867 - $83,970Recycled Water Operator/Instrumentation Technician 25 $28.64 - $35.89 - $43.13 $4,964 - $6,221 - $7,476 $59,571 - $74,651 - $89,710Recycled Water Technician 20 $24.41 - $30.58 - $36.75 $4,231 - $5,301 - $6,370 $50,773 - $63,606 - $76,440Right of Way Agent 25 $28.64 - $35.89 - $43.13 $4,964 - $6,221 - $7,476 $59,571 - $74,651 - $89,710Right of Way Agent 27 $30.51 - $38.23 - $45.95 $5,288 - $6,627 - $7,965 $63,461 - $79,518 - $95,576Right of Way Agent 30 $33.13 - $41.51 - $49.89 $5,743 - $7,195 - $8,648 $68,910 - $86,341 - $103,771Safety & Risk Manager 31 $33.60 - $42.10 - $50.60 $5,824 - $7,297 - $8,771 $69,888 - $87,568 - $105,248Safety & Risk Manager 40 $41.14 - $51.55 - $61.95 $7,131 - $8,935 - $10,738 $85,571 - $107,224 - $128,856

PADRE DAM MUNICIPAL WATER DISTRICTFiscal Year Budget 2012-2013
Job Classification Schedule for All Employees
CLASSIFICATIONMin. Mid. Max. Min. Mid. Max. Min. Mid. Max.
MONTHLY PAY RANGE ANNUAL PAY RANGESalary Grade
HOURLY PAY RANGE*
SCADA Technician 28 $30.85 - $38.65 - $46.45 $5,347 - $6,699 - $8,051 $64,168 - $80,392 - $96,616SCADA Technician 30 $33.13 - $41.51 - $49.89 $5,743 - $7,195 - $8,648 $68,910 - $86,341 - $103,771Staff Support (Minimum Wage) N/A $8.00 - * - * $1,387 - * - * $16,640 - * - *Systems Operator/Technician 18 $22.61 - $28.33 - $34.05 $3,919 - $4,911 - $5,902 $47,029 - $58,926 - $70,824Systems Operator/Technician 19 $23.15 - $29.00 - $34.85 $4,013 - $5,027 - $6,041 $48,152 - $60,320 - $72,488Systems Operator/Technician 21 $24.94 - $31.25 - $37.55 $4,323 - $5,417 - $6,509 $51,875 - $65,000 - $78,104Systems Operator/Technician 23 $26.81 - $33.59 - $40.37 $4,647 - $5,822 - $6,997 $55,765 - $69,867 - $83,970Utility Worker 14 $18.86 - $23.63 - $28.40 $3,269 - $4,096 - $4,923 $39,229 - $49,150 - $59,072Utility Worker 17 $21.65 - $27.13 - $32.60 $3,753 - $4,703 - $5,651 $45,032 - $56,430 - $67,808Warehouse Specialist 18 $22.61 - $28.33 - $34.05 $3,919 - $4,911 - $5,902 $47,029 - $58,926 - $70,824Warehouse Specialist 20 $24.41 - $30.58 - $36.75 $4,231 - $5,301 - $6,370 $50,773 - $63,606 - $76,440Warehouse Worker 16 $20.60 - $25.81 - $31.02 $3,571 - $4,474 - $5,377 $42,848 - $53,685 - $64,522Wastewater Collection Systems Worker 14 $18.86 - $23.63 - $28.40 $3,269 - $4,096 - $4,923 $39,229 - $49,150 - $59,072Wastewater Collection Systems Worker 17 $21.65 - $27.13 - $32.60 $3,753 - $4,703 - $5,651 $45,032 - $56,430 - $67,808Wastewater Collection Systems Worker 18 $22.61 - $28.33 - $34.05 $3,919 - $4,911 - $5,902 $47,029 - $58,926 - $70,824Wastewater Collection Systems Worker 20 $24.41 - $30.58 - $36.75 $4,231 - $5,301 - $6,370 $50,773 - $63,606 - $76,440Water Quality Compliance Specialist 23 $26.81 - $33.59 - $40.37 $4,647 - $5,822 - $6,997 $55,765 - $69,867 - $83,970Water Quality Specialist 23 $26.81 - $33.59 - $40.37 $4,647 - $5,822 - $6,997 $55,765 - $69,867 - $83,970
After Hours Duty Pay: $231.56
* This schedule is for Year 1 only. In accordance with the MOU each year will be based on the February San Diego CPI-W.
Rev. January 2013


Padre Dam Municipal Water DistrictFive Year Plan Budget, Year 2
FY '13 - FY '17Combined Operations
FY '13 FY '14 FY '15 FY '16 FY '17
Forecast Budget Budget Budget Budget
YEAR 1 YEAR 2 YEAR 3 YEAR 4 YEAR 5 TOTAL
Revenues:
Water Sales 25,127,175$ 26,294,230$ 27,970,864$ 29,212,315$ 30,498,436$ 139,103,020$
Infrastructure Access Charge ("IAC) 821,364 834,843 841,113 841,113 841,113 4,179,546
Energy Billings 1,502,853 1,532,910 1,563,568 1,594,840 1,626,736 7,820,907
CWA/Metro Water Purchase Credits 288,698 288,698 288,698 288,698 288,698 1,443,490
Padre Dam Sewer Processing Revenue 1,959,038 2,056,989 2,159,839 2,267,831 2,381,222 10,824,919
Sewer Revenues 15,065,976 15,141,306 15,217,012 15,293,097 15,369,563 76,086,954
System Charges 7,361,385 7,866,103 8,243,957 8,636,814 9,045,691 41,153,950
Park Fees 4,602,246 4,548,937 4,659,090 4,846,859 4,965,628 23,622,760
Property Tax Subvention 2,325,000 2,348,250 2,371,733 2,395,450 2,419,404 11,859,837
Other Revenues 1,043,877 829,572 868,044 883,383 899,643 4,524,519
Total Operating Revenues 60,097,612 61,741,838 64,183,918 66,260,400 68,336,134 320,619,902
Direct Costs:
Water Purchases 14,768,464 15,471,325 15,843,781 15,843,781 15,843,781 77,771,132
Infrastructure Access Charge ("IAC") 821,364 834,843 841,113 841,113 841,113 4,179,546
Energy Purchases 1,502,853 1,532,910 1,563,568 1,594,840 1,626,736 7,820,907
Sewer Metro Costs 3,977,520 3,731,659 3,731,659 3,731,659 3,731,659 18,904,156
Padre Dam Sewer Processing Fee 1,959,038 2,056,989 2,159,839 2,267,831 2,381,222 10,824,919
Fish Stocking 121,025 108,461 108,997 109,534 110,071 558,088
Park Purchases 149,411 144,836 144,836 144,836 144,836 728,755
Total Direct Costs 23,299,675 23,881,023 24,393,793 24,533,594 24,679,418 120,787,503
Revenues Available for Operating Expenses 36,797,937 37,860,815 39,790,125 41,726,806 43,656,716 199,832,399
Operating Expenses:
Salary & Wages 11,242,551 11,982,135 12,532,362 12,942,380 13,557,001 62,256,429
Employee Benefits 6,763,673 7,142,969 7,550,241 8,054,716 8,865,676 38,377,275
Professional Services 1,320,314 3,147,434 2,274,660 2,293,985 2,046,268 11,082,661
Materials, Supplies, Vehicle & Building 3,701,165 4,444,200 4,414,816 4,490,462 4,594,735 21,645,378
Utilities 1,182,862 1,143,596 1,183,290 1,232,855 1,280,375 6,022,978
Administrative Expenses 1,043,491 1,300,614 1,342,638 1,377,470 1,411,641 6,475,854
Billing Credits (2,903,162) (3,219,983) (2,714,172) (2,698,191) (2,930,178) (14,465,686)
Operating Expenses before Depreciation 22,350,894 25,940,965 26,583,835 27,693,677 28,825,518 131,394,889
Depreciation and Amortization 6,527,035 7,627,703 8,533,427 9,008,504 9,293,994 40,990,663
Operating Income (Loss) 7,920,008 4,292,147 4,672,863 5,024,625 5,537,204 27,446,847
Non-Operating Activity:
Interest Expense (3,009,983) (2,910,352) (2,812,962) (2,720,811) (2,607,290) (14,061,398)
Interest Income 202,042 142,154 224,260 243,730 402,474 1,214,660
Property Tax Debt - - - - - -
Gain (Loss) on Sale of Fixed Assets & Investments - - - - - -
Other Income - - - - - -
Other Expenses - - - - - -
Total Non-Operating Activity (2,807,941) (2,768,198) (2,588,702) (2,477,081) (2,204,816) (12,846,738)
Revenues Over (Under) Expenses 5,112,067 1,523,949 2,084,161 2,547,544 3,332,388 14,600,109
Interest Income - CEF - - - - - -
Change in Net Assets 5,112,067$ 1,523,949$ 2,084,161$ 2,547,544$ 3,332,388$ 14,600,109$
Fund Balances
Add:
Depreciation and Amortization 6,527,035 7,627,703 8,533,427 9,008,504 9,293,994 40,990,663
Change in Payables/Receivables/ST Assets & Lia - - - - - -
Capacity Fees 1,393,325 700,000 700,000 700,000 700,000 4,193,325
2009 COP - Restricted - - - - - -
2009 COP - Transfers to CRF - - - - - -
2009 COP Funds Receivable / (Payable) - - - - - -
2009 COP Transfers / Woodside 5,008,810 12,774,368 4,316,631 - - 22,099,809
Financing (Grants, SRF Loan, Other) 1,500,000 1,564,995 140,032 82,673 85,401 3,373,101
Contributed Capital - - - - - -
Deduct: -
Capital Improvements & Equipment (12,094,410) (24,082,535) (14,911,133) (8,468,346) (10,004,475) (69,560,899)
Debt Principal (2,682,901) (2,800,256) (2,896,805) (2,978,697) (2,759,659) (14,118,318)
Financing (Grants, SRF Loan, Woodside, Other) (5,008,810) (12,774,368) (4,316,631) - - (22,099,809)
Transfers between CRF and CEF - - - - - -
Capitalization of Contributed Capital - - - - - -
Cash Generated (Used) (244,884) (15,466,144) (6,350,318) 891,678 647,649 (20,522,019)
Beginning Fund Balance 59,202,639 58,957,755 43,491,611 37,141,293 38,032,971 59,202,639 Ending Fund Balance 58,957,755$ 43,491,611$ 37,141,293$ 38,032,971$ 38,680,620$ 38,680,620$
Exhibit A

Padre Dam Municipal Water DistrictFive Year Plan Budget, Year 2
FY '13 - FY '17Retail Water Operation
FY '13 FY '14 FY '15 FY '16 FY '17
Forecast Budget Budget Budget Budget
YEAR 1 YEAR 2 YEAR 3 YEAR 4 YEAR 5 TOTAL
Revenues:
Water Sales 23,523,424$ 24,770,590$ 26,374,851$ 27,540,491$ 28,747,200$ 130,956,556$
Infrastructure Access Charge ("IAC) 821,364 834,843 841,113 841,113 841,113 4,179,546
Energy Billings 1,502,853 1,532,910 1,563,568 1,594,840 1,626,736 7,820,907
CWA/Metro Water Purchase Credits - - - - - -
Padre Dam Sewer Processing Revenue - - - - - -
Sewer Revenues - - - - - -
System Charges 7,235,175 7,724,546 8,095,400 8,481,498 8,883,000 40,419,619
Park Fees - - - - - -
Property Tax Subvention 2,325,000 2,348,250 2,371,733 2,395,450 2,419,404 11,859,837
Other Revenues 1,028,877 814,572 853,044 868,383 884,643 4,449,519
Total Operating Revenues 36,436,693 38,025,711 40,099,709 41,721,775 43,402,096 199,685,984
Direct Costs:
Water Purchases 14,768,464 15,471,325 15,843,781 15,843,781 15,843,781 77,771,132
Infrastructure Access Charge ("IAC") 821,364 834,843 841,113 841,113 841,113 4,179,546
Energy Purchases 1,502,853 1,532,910 1,563,568 1,594,840 1,626,736 7,820,907
Sewer Metro Costs - - - - - -
Padre Dam Sewer Processing Fee - - - - - -
Fish Stocking - - - - - -
Park Purchases - - - - - -
Total Direct Costs 17,092,681 17,839,078 18,248,462 18,279,734 18,311,630 89,771,585
Revenues Available for Operating Expenses 19,344,012 20,186,633 21,851,247 23,442,041 25,090,466 109,914,399
Operating Expenses:
Salary & Wages 6,539,565 6,970,890 7,289,860 7,489,224 7,835,085 36,124,624
Employee Benefits 3,821,726 4,023,602 4,250,001 4,513,154 4,962,040 21,570,523
Professional Services 748,354 1,964,330 1,366,541 1,396,260 1,227,658 6,703,143
Materials, Supplies, Vehicle & Building 1,590,732 1,966,893 1,940,590 1,967,183 2,027,980 9,493,378
Utilities 101,035 100,179 103,493 107,198 110,863 522,768
Administrative Expenses 456,471 574,148 596,296 612,103 635,541 2,874,559
Billing Credits (1,739,610) (1,955,109) (1,610,814) (1,607,231) (1,746,192) (8,658,956)
Operating Expenses before Depreciation 11,518,273 13,644,933 13,935,967 14,477,891 15,052,975 68,630,039
Depreciation and Amortization 4,171,881 4,665,759 5,148,227 5,394,237 5,580,052 24,960,156
Operating Income (Loss) 3,653,858 1,875,941 2,767,053 3,569,913 4,457,439 16,324,204
Non-Operating Activity:
Interest Expense (2,044,905) (2,009,340) (1,877,568) (1,809,963) (1,751,722) (9,493,498)
Interest Income 24,105 25,429 60,091 70,844 108,549 289,018
Property Tax Debt - - - - - -
Gain (Loss) on Sale of Fixed Assets & Investments - - - - - -
Other Income - - - - - -
Other Expenses - - - - - -
Total Non-Operating Activity (2,020,800) (1,983,911) (1,817,477) (1,739,119) (1,643,173) (9,204,480)
Revenues Over (Under) Expenses 1,633,058 (107,970) 949,576 1,830,794 2,814,266 7,119,724
Interest Income - CEF - - - - - -
Change in Net Assets 1,633,058$ (107,970)$ 949,576$ 1,830,794$ 2,814,266$ 7,119,724$
Fund Balances
Add:
Depreciation and Amortization 4,171,881 4,665,759 5,148,227 5,394,237 5,580,052 24,960,156
Change in Payables/Receivables/ST Assets & Lia - - - - - -
Capacity Fees 595,930 379,534 379,534 379,534 379,534 2,114,066
2009 COP - Restricted - - - - - -
2009 COP - Transfers to CRF - - - - - -
2009 COP Funds Receivable / (Payable) 1,779,825 - - - - 1,779,825
2009 COP Transfers / Woodside 4,172,312 8,093,142 2,710,466 - - 14,975,920
Financing (Grants, SRF Loan, Other) - - - - - -
Contributed Capital - - - - - -
Deduct: -
Capital Improvements & Equipment (7,126,284) (11,799,745) (6,761,597) (5,751,309) (8,448,702) (39,887,637)
Debt Principal (1,272,321) (1,332,791) (1,377,825) (1,410,930) (1,423,215) (6,817,082)
Financing (Grants, SRF Loan, Woodside, Other) - - - - - -
Transfers between CRF and CEF (419,028) (1,314,590) (2,101,590) (664,503) (506,445) (5,006,156)
Capitalization of Contributed Capital - - - - - -
Cash Generated (Used) 3,535,373 (1,416,661) (1,053,209) (222,177) (1,604,510) (761,184)
Beginning Fund Balance 7,359,038 10,894,411 9,477,750 8,424,541 8,202,364 7,359,038 Ending Fund Balance 10,894,411$ 9,477,750$ 8,424,541$ 8,202,364$ 6,597,854$ 6,597,854$
Exhibit A

Padre Dam Municipal Water DistrictFive Year Plan Budget, Year 2
FY '13 - FY '17Recycled Water Operation
FY '13 FY '14 FY '15 FY '16 FY '17
Forecast Budget Budget Budget Budget
YEAR 1 YEAR 2 YEAR 3 YEAR 4 YEAR 5 TOTAL
Revenues:
Water Sales 1,603,751$ 1,523,640$ 1,596,013$ 1,671,824$ 1,751,236$ 8,146,464$
Infrastructure Access Charge ("IAC) - - - - - -
Energy Billings - - - - - -
CWA/Metro Water Purchase Credits 288,698 288,698 288,698 288,698 288,698 1,443,490
Padre Dam Sewer Processing Revenue 1,959,038 2,056,989 2,159,839 2,267,831 2,381,222 10,824,919
Sewer Revenues - - - - - -
System Charges 126,210 141,557 148,557 155,316 162,691 734,331
Park Fees - - - - - -
Property Tax Subvention - - - - - -
Other Revenues - - - - - -
Total Operating Revenues 3,977,697 4,010,884 4,193,107 4,383,669 4,583,847 21,149,204
Direct Costs:
Water Purchases - - - - - -
Infrastructure Access Charge ("IAC") - - - - - -
Energy Purchases - - - - - -
Sewer Metro Costs - - - - - -
Padre Dam Sewer Processing Fee - - - - - -
Fish Stocking - - - - - -
Park Purchases - - - - - -
Total Direct Costs - - - - - -
Revenues Available for Operating Expenses 3,977,697 4,010,884 4,193,107 4,383,669 4,583,847 21,149,204
Operating Expenses:
Salary & Wages 839,407 894,771 935,713 961,303 1,005,698 4,636,892
Employee Benefits 512,958 540,055 570,442 605,763 666,013 2,895,231
Professional Services 49,905 130,994 91,129 93,111 81,868 447,007
Materials, Supplies, Vehicle & Building 247,053 305,473 301,388 305,518 314,960 1,474,392
Utilities 170,183 168,741 174,322 180,564 186,736 880,546
Administrative Expenses 67,579 85,001 88,279 90,620 94,089 425,568
Billing Credits (246,275) (276,783) (228,042) (227,535) (247,207) (1,225,842)
Operating Expenses before Depreciation 1,640,810 1,848,252 1,933,231 2,009,344 2,102,157 9,533,794
Depreciation and Amortization 631,600 930,635 1,215,545 1,310,263 1,375,975 5,464,018
Operating Income (Loss) 1,705,287 1,231,997 1,044,331 1,064,062 1,105,715 6,151,392
Non-Operating Activity:
Interest Expense (154,941) (132,243) (108,407) (83,029) (55,501) (534,121)
Interest Income 24,046 23,606 50,066 56,549 98,419 252,686
Property Tax Debt - - - - - -
Gain (Loss) on Sale of Fixed Assets & Investments - - - - - -
Other Income - - - - - -
Other Expenses - - - - - -
Total Non-Operating Activity (130,895) (108,637) (58,341) (26,480) 42,918 (281,435)
Revenues Over (Under) Expenses 1,574,392 1,123,360 985,990 1,037,582 1,148,633 5,869,957
Interest Income - CEF - - - - - -
Change in Net Assets 1,574,392$ 1,123,360$ 985,990$ 1,037,582$ 1,148,633$ 5,869,957$
Fund Balances
Add:
Depreciation and Amortization 631,600 930,635 1,215,545 1,310,263 1,375,975 5,464,018
Change in Payables/Receivables/ST Assets & Lia - - - - - -
Capacity Fees - - - - - -
2009 COP - Restricted - - - - - -
2009 COP - Transfers to CRF - - - - - -
2009 COP Funds Receivable / (Payable) - - - - - -
2009 COP Transfers / Woodside 4,070 22,200 143,195 - - 169,465
Financing (Grants, SRF Loan, Other) - - - - - -
Contributed Capital - - - - - -
Deduct: -
Capital Improvements & Equipment (471,748) (1,453,355) (787,921) (624,784) (440,570) (3,778,378)
Debt Principal (752,899) (778,674) (801,890) (825,664) (666,346) (3,825,473)
Financing (Grants, SRF Loan, Woodside, Other) - - - - - -
Transfers between CRF and CEF (279,352) (876,393) (1,401,060) (443,002) (337,630) (3,337,437)
Capitalization of Contributed Capital - - - - - -
Cash Generated (Used) 706,063 (1,032,227) (646,141) 454,395 1,080,062 562,152
Beginning Fund Balance 5,753,993 6,460,056 5,427,829 4,781,688 5,236,083 5,753,993 Ending Fund Balance 6,460,056$ 5,427,829$ 4,781,688$ 5,236,083$ 6,316,145$ 6,316,145$
Exhibit A

Padre Dam Municipal Water DistrictFive Year Plan Budget, Year 2
FY '13 - FY '17Sewer Operation
FY '13 FY '14 FY '15 FY '16 FY '17
Forecast Budget Budget Budget Budget
YEAR 1 YEAR 2 YEAR 3 YEAR 4 YEAR 5 TOTAL
Revenues:
Water Sales -$ -$ -$ -$ -$ -$
Infrastructure Access Charge ("IAC) - - - - - -
Energy Billings - - - - - -
CWA/Metro Water Purchase Credits - - - - - -
Padre Dam Sewer Processing Revenue - - - - - -
Sewer Revenues 15,065,976 15,141,306 15,217,012 15,293,097 15,369,563 76,086,954
System Charges - - - - - -
Park Fees - - - - - -
Property Tax Subvention - - - - - -
Other Revenues 15,000 15,000 15,000 15,000 15,000 75,000
Total Operating Revenues 15,080,976 15,156,306 15,232,012 15,308,097 15,384,563 76,161,954
Direct Costs:
Water Purchases - - - - - -
Infrastructure Access Charge ("IAC") - - - - - -
Energy Purchases - - - - - -
Sewer Metro Costs 3,977,520 3,731,659 3,731,659 3,731,659 3,731,659 18,904,156
Padre Dam Sewer Processing Fee 1,959,038 2,056,989 2,159,839 2,267,831 2,381,222 10,824,919
Fish Stocking - - - - - -
Park Purchases - - - - - -
Total Direct Costs 5,936,558 5,788,648 5,891,498 5,999,490 6,112,881 29,729,075
Revenues Available for Operating Expenses 9,144,418 9,367,658 9,340,514 9,308,607 9,271,682 46,432,879
Operating Expenses:
Salary & Wages 2,895,286 3,086,248 3,227,467 3,315,732 3,468,856 15,993,589
Employee Benefits 1,875,465 1,974,534 2,085,636 2,214,775 2,435,060 10,585,470
Professional Services 298,552 783,659 545,174 557,031 489,768 2,674,184
Materials, Supplies, Vehicle & Building 1,277,633 1,579,755 1,558,629 1,579,988 1,628,818 7,624,823
Utilities 417,502 413,964 427,657 442,969 458,111 2,160,203
Administrative Expenses 372,222 468,179 486,239 499,129 518,241 2,344,010
Billing Credits (918,305) (1,032,063) (850,316) (848,425) (921,779) (4,570,888)
Operating Expenses before Depreciation 6,218,355 7,274,276 7,480,486 7,761,199 8,077,075 36,811,391
Depreciation and Amortization 984,097 1,150,327 1,237,951 1,336,950 1,348,642 6,057,967
Operating Income (Loss) 1,941,966 943,055 622,077 210,458 (154,035) 3,563,521
Non-Operating Activity:
Interest Expense (46,608) (37,322) (27,758) (17,906) (7,287) (136,881)
Interest Income 49,153 48,449 97,518 102,550 170,023 467,693
Property Tax Debt - - - - - -
Gain (Loss) on Sale of Fixed Assets & Investments - - - - - -
Other Income - - - - - -
Other Expenses - - - - - -
Total Non-Operating Activity 2,545 11,127 69,760 84,644 162,736 330,812
Revenues Over (Under) Expenses 1,944,511 954,182 691,837 295,102 8,701 3,894,333
Interest Income - CEF - - - - - -
Change in Net Assets 1,944,511$ 954,182$ 691,837$ 295,102$ 8,701$ 3,894,333$
Fund Balances
Add:
Depreciation and Amortization 984,097 1,150,327 1,237,951 1,336,950 1,348,642 6,057,967
Change in Payables/Receivables/ST Assets & Lia - - - - - -
Capacity Fees 312,664 210,097 210,097 210,097 210,097 1,153,052
2009 COP - Restricted - - - - - -
2009 COP - Transfers to CRF - - - - - -
2009 COP Funds Receivable / (Payable) - - - - - -
2009 COP Transfers / Woodside 14,080 76,800 495,378 - - 586,258
Financing (Grants, SRF Loan, Other) - - - - - -
Contributed Capital - - - - - -
Deduct: -
Capital Improvements & Equipment (1,140,959) (2,998,360) (2,365,363) (1,480,531) (648,681) (8,633,894)
Debt Principal (309,606) (318,891) (328,455) (338,307) (252,242) (1,547,501)
Financing (Grants, SRF Loan, Woodside, Other) - - - - - -
Transfers between CRF and CEF - - - - - -
Capitalization of Contributed Capital - - - - - -
Cash Generated (Used) 1,804,787 (925,845) (58,555) 23,311 666,517 1,510,215
Beginning Fund Balance 10,552,997 12,357,784 11,431,939 11,373,384 11,396,695 10,552,997 Ending Fund Balance 12,357,784$ 11,431,939$ 11,373,384$ 11,396,695$ 12,063,212$ 12,063,212$
Exhibit A

Padre Dam Municipal Water DistrictFive Year Plan Budget, Year 2
FY '13 - FY '17Park Operation
FY '13 FY '14 FY '15 FY '16 FY '17
Forecast Budget Budget Budget Budget
YEAR 1 YEAR 2 YEAR 3 YEAR 4 YEAR 5 TOTAL
Revenues:
Water Sales -$ -$ -$ -$ -$ -$
Infrastructure Access Charge ("IAC) - - - - - -
Energy Billings - - - - - -
CWA/Metro Water Purchase Credits - - - - - -
Padre Dam Sewer Processing Revenue - - - - - -
Sewer Revenues - - - - - -
System Charges - - - - - -
Park Fees 4,602,246 4,548,937 4,659,090 4,846,859 4,965,628 23,622,760
Property Tax Subvention - - - - - -
Other Revenues - - - - - -
Total Operating Revenues 4,602,246 4,548,937 4,659,090 4,846,859 4,965,628 23,622,760
Direct Costs:
Water Purchases - - - - - -
Infrastructure Access Charge ("IAC") - - - - - -
Energy Purchases - - - - - -
Sewer Metro Costs - - - - - -
Padre Dam Sewer Processing Fee - - - - - -
Fish Stocking 121,025 108,461 108,997 109,534 110,071 558,088
Park Purchases 149,411 144,836 144,836 144,836 144,836 728,755
Total Direct Costs 270,436 253,297 253,833 254,370 254,907 1,286,843
Revenues Available for Operating Expenses 4,331,810 4,295,640 4,405,257 4,592,489 4,710,721 22,335,917
Operating Expenses:
Salary & Wages 968,293 1,030,226 1,079,322 1,176,121 1,247,362 5,501,324
Employee Benefits 553,524 604,778 644,162 721,024 802,563 3,326,051
Professional Services 223,503 268,451 271,816 247,583 246,974 1,258,327
Materials, Supplies, Vehicle & Building 585,747 592,079 614,209 637,773 622,977 3,052,785
Utilities 494,142 460,712 477,818 502,124 524,665 2,459,461
Administrative Expenses 147,219 173,286 171,824 175,618 163,770 831,717
Billing Credits 1,028 43,972 (25,000) (15,000) (15,000) (10,000)
Operating Expenses before Depreciation 2,973,456 3,173,504 3,234,151 3,445,243 3,593,311 16,419,665
Depreciation and Amortization 736,237 877,720 927,921 963,102 985,373 4,490,353
Operating Income (Loss) 622,117 244,416 243,185 184,144 132,037 1,425,899
Non-Operating Activity:
Interest Expense (250,043) (211,809) (197,615) (182,568) (166,615) (1,008,650)
Interest Income 4,738 4,670 11,585 13,787 25,483 60,263
Property Tax Debt - - - - - -
Gain (Loss) on Sale of Fixed Assets & Investments - - - - - -
Other Income - - - - - -
Other Expenses - - - - - -
Total Non-Operating Activity (245,305) (207,139) (186,030) (168,781) (141,132) (948,387)
Revenues Over (Under) Expenses 376,812 37,277 57,155 15,363 (9,095) 477,512
Interest Income - CEF - - - - - -
Change in Net Assets 376,812$ 37,277$ 57,155$ 15,363$ (9,095)$ 477,512$
Fund Balances
Add:
Depreciation and Amortization 736,237 877,720 927,921 963,102 985,373 4,490,353
Change in Payables/Receivables/ST Assets & Lia - - - - - -
Capacity Fees - - - - - -
2009 COP - Restricted - - - - - -
2009 COP - Transfers to CRF - - - - - -
2009 COP Funds Receivable / (Payable) - - - - - -
2009 COP Transfers / Woodside - - - - - -
Financing (Grants, SRF Loan, Other) - - - - - -
Contributed Capital - - - - - -
Deduct: -
Capital Improvements & Equipment (495,725) (588,675) (407,500) (310,000) (207,500) (2,009,400)
Debt Principal (333,190) (346,700) (360,390) (374,291) (388,351) (1,802,922)
Financing (Grants, SRF Loan, Woodside, Other) - - - - - -
Transfers between CRF and CEF - - - - - -
Capitalization of Contributed Capital - - - - - -
Cash Generated (Used) 284,134 (20,378) 217,186 294,174 380,427 1,155,543
Beginning Fund Balance 1,050,643 1,334,777 1,314,399 1,531,585 1,825,759 1,050,643 Ending Fund Balance 1,334,777$ 1,314,399$ 1,531,585$ 1,825,759$ 2,206,186$ 2,206,186$
Exhibit A

Padre Dam Municipal Water DistrictFive Year Plan Budget, Year 2
FY '13 - FY '17CEF and Restricted Funds
FY '13 FY '14 FY '15 FY '16 FY '17
Forecast Budget Budget Budget Budget
YEAR 1 YEAR 2 YEAR 3 YEAR 4 YEAR 5 TOTAL
Revenues:
Water Sales -$ -$ -$ -$ -$ -$
Infrastructure Access Charge ("IAC) - - - - - -
Energy Billings - - - - - -
CWA/Metro Water Purchase Credits - - - - - -
Padre Dam Sewer Processing Revenue - - - - - -
Sewer Revenues - - - - - -
System Charges - - - - - -
Park Fees - - - - - -
Property Tax Subvention - - - - - -
Other Revenues - - - - - -
Total Operating Revenues - - - - - -
Direct Costs:
Water Purchases - - - - - -
Infrastructure Access Charge ("IAC") - - - - - -
Energy Purchases - - - - - -
Sewer Metro Costs - - - - - -
Padre Dam Sewer Processing Fee - - - - - -
Fish Stocking - - - - - -
Park Purchases - - - - - -
Total Direct Costs - - - - - -
Revenues Available for Operating Expenses - - - - - -
Operating Expenses:
Salary & Wages - - - - - -
Employee Benefits - - - - - -
Professional Services - - - - - -
Materials, Supplies, Vehicle & Building - - - - - -
Utilities - - - - - -
Administrative Expenses - - - - - -
Billing Credits - - - - - -
Operating Expenses before Depreciation - - - - - -
Depreciation and Amortization 3,220 3,262 3,783 3,952 3,952 18,169
Operating Income (Loss) (3,220) (3,262) (3,783) (3,952) (3,952) (18,169)
Non-Operating Activity:
Interest Expense (513,486) (519,638) (601,614) (627,345) (626,165) (2,888,248)
Interest Income 100,000 40,000 5,000 - - 145,000
Property Tax Debt - - - - - -
Gain (Loss) on Sale of Fixed Assets & Investments - - - - - -
Other Income - - - - - -
Other Expenses - - - - - -
Total Non-Operating Activity (413,486) (479,638) (596,614) (627,345) (626,165) (2,743,248)
Revenues Over (Under) Expenses (416,706) (482,900) (600,397) (631,297) (630,117) (2,761,417)
Interest Income - CEF - - - - - -
Change in Net Assets (416,706)$ (482,900)$ (600,397)$ (631,297)$ (630,117)$ (2,761,417)$
Fund Balances
Add:
Depreciation and Amortization 3,220 3,262 3,783 3,952 3,952 18,169
Change in Payables/Receivables/ST Assets & Lia - - - - - -
Capacity Fees 484,731 110,369 110,369 110,369 110,369 926,207
2009 COP - Restricted - - - - - -
2009 COP - Transfers to CRF - - - - - -
2009 COP Funds Receivable / (Payable) (1,779,825) - - - - (1,779,825)
2009 COP Transfers / Woodside 818,348 4,582,226 967,592 - - 6,368,166
Financing (Grants, SRF Loan, Other) 1,500,000 1,564,995 140,032 82,673 85,401 3,373,101
Contributed Capital - - - - - -
Deduct: -
Capital Improvements & Equipment (2,859,694) (7,242,400) (4,588,752) (301,722) (259,022) (15,251,590)
Debt Principal (14,885) (23,200) (28,245) (29,505) (29,505) (125,340)
Financing (Grants, SRF Loan, Woodside, Other) (5,008,810) (12,774,368) (4,316,631) - - (22,099,809)
Transfers between CRF and CEF 698,380 2,190,983 3,502,650 1,107,505 844,075 8,343,593
Capitalization of Contributed Capital - - - - - -
Cash Generated (Used) (6,575,241) (12,071,033) (4,809,599) 341,975 125,153 (22,988,745)
Beginning Fund Balance 34,485,968 27,910,727 15,839,694 11,030,095 11,372,070 34,485,968 Ending Fund Balance 27,910,727$ 15,839,694$ 11,030,095$ 11,372,070$ 11,497,223$ 11,497,223$
Exhibit A

FORECAST BUDGET BUDGET BUDGET BUDGET 5-YEARADMINISTRATION YEAR 1 YEAR 2 YEAR 3 YEAR 4 YEAR 5 TOTALSSalary and Wages 531,243$ 536,214$ 561,537$ 585,489$ 610,505$ 2,824,989$ Employee Benefits 335,490 330,890 356,233 379,541 419,297 1,821,451 Professional Services 113,772 205,686 209,186 213,267 246,012 987,922 Materials and Supplies 56,941 88,482 64,042 59,595 68,434 337,495 Administrative Expenses 145,405 171,004 186,775 173,890 190,036 867,110 Utilities 128,148 139,132 146,193 153,741 161,438 728,652 Billing Credits - - - - - -
Total Expenditures 1,310,999$ 1,471,409$ 1,523,966$ 1,565,522$ 1,695,723$ 7,567,619$
FINANCE YEAR 1 YEAR 2 YEAR 3 YEAR 4 YEAR 5 TOTALSSalary and Wages 1,643,511$ 1,805,407$ 1,841,764$ 1,921,771$ 2,010,156$ 9,222,609$ Employee Benefits 905,591 1,002,721 1,058,355 1,132,091 1,242,790 5,341,547 Professional Services 200,657 322,148 404,326 372,138 400,475 1,699,744 Materials and Supplies 171,172 371,076 205,852 210,746 297,675 1,256,522 Administrative Expenses 194,187 315,942 314,524 322,046 315,958 1,462,656 Utilities 37,014 17,263 17,501 17,747 17,989 107,515 Billing Credits (278,162) (1,112,647) - - - (1,390,809)
Total Expenditures 2,873,970$ 2,721,910$ 3,842,323$ 3,976,540$ 4,285,042$ 17,699,784$
HUMAN RESOURCES YEAR 1 YEAR 2 YEAR 3 YEAR 4 YEAR 5 TOTALSSalary and Wages 321,255$ 341,103$ 356,372$ 370,699$ 386,368$ 1,775,798$ Employee Benefits 383,433 200,870 162,909 176,660 195,750 1,119,622 Professional Services 21,225 35,232 29,482 26,452 27,299 139,690 Materials and Supplies 39,837 35,550 34,983 34,774 35,211 180,355 Administrative Expenses 282,640 325,240 345,943 369,463 417,730 1,741,015 Utilities 2,037 1,682 1,812 1,812 1,812 9,155 Billing Credits - - - - - -
Total Expenditures 1,050,427$ 939,677$ 931,502$ 979,860$ 1,064,169$ 4,965,635$
ENGINEERING YEAR 1 YEAR 2 YEAR 3 YEAR 4 YEAR 5 TOTALSSalary and Wages 1,703,392$ 1,774,341$ 1,863,348$ 1,749,701$ 1,837,038$ 8,927,820$ Employee Benefits 821,390 907,013 954,212 933,731 1,028,930 4,645,277 Professional Services 497,192 2,000,900 956,347 1,040,063 714,576 5,209,076 Materials and Supplies 150,927 96,556 81,227 83,407 84,747 496,864 Administrative Expenses 34,823 51,752 57,558 58,674 58,192 260,999 Utilities 8,030 10,824 9,020 9,416 9,800 47,090 Billing Credits (1,020,034) (497,134) (985,372) (928,277) (1,107,617) (4,538,433)
Total Expenditures 2,195,720$ 4,344,252$ 2,936,340$ 2,946,715$ 2,625,666$ 15,048,693$
OPERATIONS YEAR 1 YEAR 2 YEAR 3 YEAR 4 YEAR 5 TOTALSSalary and Wages 6,137,069$ 6,559,976$ 6,898,430$ 7,210,156$ 7,540,487$ 34,346,117$ Employee Benefits 3,809,054 4,132,765 4,409,635 4,749,500 5,218,222 22,319,175 Professional Services 266,896 318,542 407,054 398,218 414,885 1,805,595 Materials and Supplies 2,698,861 3,263,774 3,416,766 3,465,999 3,487,869 16,333,270 Administrative Expenses 242,036 267,547 270,128 281,730 270,249 1,331,691 Utilities 519,976 520,903 538,219 555,675 572,716 2,707,489 Billing Credits (1,605,995) (1,654,175) (1,703,800) (1,754,914) (1,807,562) (8,526,446)
Total Expenditures 12,067,898$ 13,409,333$ 14,236,431$ 14,906,364$ 15,696,866$ 70,316,891$
PARK YEAR 1 YEAR 2 YEAR 3 YEAR 4 YEAR 5 TOTALSSalary and Wages 906,078$ 965,095$ 1,010,912$ 1,104,564$ 1,172,447$ 5,159,096$ Employee Benefits 508,715 568,709 608,897 683,194 760,687 3,130,201 Professional Services 220,572 264,927 268,267 243,847 243,021 1,240,634 Materials and Supplies 583,426 588,762 611,945 635,941 620,799 3,040,873 Administrative Expenses 144,400 169,129 167,710 171,667 159,476 812,382 Utilities 487,658 453,792 470,544 494,464 516,620 2,423,078 Billing Credits 1,028 43,972 (25,000) (15,000) (15,000) (10,000)
Total Expenditures 2,851,879$ 3,054,386$ 3,113,274$ 3,318,677$ 3,458,049$ 15,796,265$
PADRE DAM MUNICIPAL WATER DISTRICTDEPARTMENTAL BUDGET SUMMARIES
FIVE YEAR PLAN, REFORECASTED YEAR 2
Exhibit A

Salary & Employee Professional Materials & Admin. Billing Year 1
Department Wages Benefits Services Supplies Expenses Utilities Credits Total Percent
Administration 531,243$ 335,490$ 113,772$ 56,941$ 145,405$ 128,148$ -$ 1,310,999$ 5.9%Finance 1,643,511 905,591 200,657 171,172 194,187 37,014 (278,162) 2,873,970 12.9%Human Resources 321,255 383,433 21,225 39,837 282,640 2,037 - 1,050,427 4.7%Engineering 1,703,392 821,390 497,192 150,927 34,823 8,030 (1,020,034) 2,195,720 9.8%Operations 6,137,069 3,809,054 266,896 2,698,861 242,036 519,976 (1,605,995) 12,067,898 54.0%Park 906,078 508,715 220,572 583,426 144,400 487,658 1,028 2,851,879 12.8%Total 11,242,550$ 6,763,674$ 1,320,314$ 3,701,165$ 1,043,491$ 1,182,862$ (2,903,163)$ 22,350,893$ 100.0%
Salary & Employee Professional Materials & Admin. Billing Year 1
Division Wages Benefits Services Supplies Expenses Utilities Credits Total Percent
Retail Water 6,539,565$ 3,821,726$ 748,354$ 1,590,732$ 456,471$ 101,035$ (1,739,610)$ 11,518,274$ 51.5%Water Recycling 839,407 512,958 49,905 247,053 67,579 170,183 (246,275) 1,640,809 7.3%Sewer 2,895,286 1,875,465 298,552 1,277,633 372,222 417,502 (918,305) 6,218,355 27.8%Park 968,293 553,524 223,503 585,747 147,219 494,142 1,028 2,973,456 13.3%Total 11,242,550$ 6,763,674$ 1,320,314$ 3,701,165$ 1,043,491$ 1,182,862$ (2,903,163)$ 22,350,893$ 100.0%
PADRE DAM MUNICIPAL WATER DISTRICTDEPARTMENTAL ALLOCATIONS TO DIVISION BUDGETS
FY 13, PROJECTED
Exhibit A

Salary & Employee Professional Materials & Admin. Billing Year 2
Department Wages Benefits Services Supplies Expenses Utilities Credits Total Percent
Administration 536,214$ 330,890$ 205,686$ 88,482$ 171,004$ 139,132$ -$ 1,471,409$ 5.7%Finance 1,805,407 1,002,721 322,148 371,076 315,942 17,263 (1,112,647) 2,721,910 10.5%Human Resources 341,103 200,870 35,232 35,550 325,240 1,682 - 939,677 3.6%Engineering 1,774,341 907,013 2,000,900 96,556 51,752 10,824 (497,134) 4,344,252 16.7%Operations 6,559,976 4,132,765 318,542 3,263,774 267,547 520,903 (1,654,175) 13,409,333 51.7%Park 965,095 568,709 264,927 588,762 169,129 453,792 43,972 3,054,386 11.8%Total 11,982,135$ 7,142,969$ 3,147,434$ 4,444,201$ 1,300,614$ 1,143,597$ (3,219,984)$ 25,940,966$ 100.0%
Salary & Employee Professional Materials & Admin. Billing Year 2
Division Wages Benefits Services Supplies Expenses Utilities Credits Total Percent
Retail Water 6,970,890$ 4,023,602$ 1,964,330$ 1,966,893$ 574,148$ 100,179$ (1,955,109)$ 13,644,934$ 52.6%Water Recycling 894,771 540,055 130,994 305,473 85,001 168,741 (276,783) 1,848,250 7.1%Sewer 3,086,248 1,974,534 783,659 1,579,755 468,179 413,964 (1,032,063) 7,274,277 28.0%Park 1,030,226 604,778 268,451 592,079 173,286 460,712 43,972 3,173,505 12.2%Total 11,982,135$ 7,142,969$ 3,147,434$ 4,444,201$ 1,300,614$ 1,143,597$ (3,219,984)$ 25,940,966$ 100.0%
PADRE DAM MUNICIPAL WATER DISTRICTDEPARTMENTAL ALLOCATIONS TO DIVISION BUDGETS
FY 14, REFORECAST
Exhibit A

Salary & Employee Professional Materials & Admin. Billing Year 3
Department Wages Benefits Services Supplies Expenses Utilities Credits Total Percent
Administration 561,537$ 356,233$ 209,186$ 64,042$ 186,775$ 146,193$ -$ 1,523,966$ 5.7%Finance 1,841,764 1,058,355 404,326 205,852 314,524 17,501 - 3,842,323 14.5%Human Resources 356,372 162,909 29,482 34,983 345,943 1,812 - 931,502 3.5%Engineering 1,863,348 954,212 956,347 81,227 57,558 9,020 (985,372) 2,936,340 11.0%Operations 6,898,430 4,409,635 407,054 3,416,766 270,128 538,219 (1,703,800) 14,236,431 53.6%Park 1,010,912 608,897 268,267 611,945 167,710 470,544 (25,000) 3,113,274 11.7%Total 12,532,363$ 7,550,241$ 2,274,662$ 4,414,815$ 1,342,638$ 1,183,290$ (2,714,172)$ 26,583,836$ 100.0%
Salary & Employee Professional Materials & Admin. Billing Year 3
Division Wages Benefits Services Supplies Expenses Utilities Credits Total Percent
Retail Water 7,289,860$ 4,250,001$ 1,366,541$ 1,940,590$ 596,296$ 103,493$ (1,610,814)$ 13,935,966$ 52.4%Water Recycling 935,713 570,442 91,129 301,388 88,279 174,322 (228,042) 1,933,233 7.3%Sewer 3,227,467 2,085,636 545,174 1,558,629 486,239 427,657 (850,316) 7,480,486 28.1%Park 1,079,322 644,162 271,816 614,209 171,824 477,818 (25,000) 3,234,151 12.2%Total 12,532,363$ 7,550,241$ 2,274,662$ 4,414,815$ 1,342,638$ 1,183,290$ (2,714,172)$ 26,583,836$ 100.0%
PADRE DAM MUNICIPAL WATER DISTRICTDEPARTMENTAL ALLOCATIONS TO DIVISION BUDGETS
FY 15, REFORECAST
Exhibit A

Salary & Employee Professional Materials & Admin. Billing Year 4
Department Wages Benefits Services Supplies Expenses Utilities Credits Total Percent
Administration 585,489$ 379,541$ 213,267$ 59,595$ 173,890$ 153,741$ -$ 1,565,522$ 5.7%Finance 1,921,771 1,132,091 372,138 210,746 322,046 17,747 - 3,976,540 14.4%Human Resources 370,699 176,660 26,452 34,774 369,463 1,812 - 979,860 3.5%Engineering 1,749,701 933,731 1,040,063 83,407 58,674 9,416 (928,277) 2,946,715 10.6%Operations 7,210,156 4,749,500 398,218 3,465,999 281,730 555,675 (1,754,914) 14,906,364 53.8%Park 1,104,564 683,194 243,847 635,941 171,667 494,464 (15,000) 3,318,677 12.0%Total 12,942,380$ 8,054,717$ 2,293,984$ 4,490,463$ 1,377,470$ 1,232,855$ (2,698,191)$ 27,693,678$ 100.0%
Salary & Employee Professional Materials & Admin. Billing Year 4
Division Wages Benefits Services Supplies Expenses Utilities Credits Total Percent
Retail Water 7,489,224$ 4,513,154$ 1,396,260$ 1,967,183$ 612,103$ 107,198$ (1,607,231)$ 14,477,891$ 52.3%Water Recycling 961,303 605,763 93,111 305,518 90,620 180,564 (227,535) 2,009,345 7.3%Sewer 3,315,732 2,214,775 557,031 1,579,988 499,129 442,969 (848,425) 7,761,199 28.0%Park 1,176,121 721,024 247,583 637,773 175,618 502,124 (15,000) 3,445,243 12.4%Total 12,942,380$ 8,054,717$ 2,293,984$ 4,490,463$ 1,377,470$ 1,232,855$ (2,698,191)$ 27,693,678$ 100.0%
PADRE DAM MUNICIPAL WATER DISTRICTDEPARTMENTAL ALLOCATIONS TO DIVISION BUDGETS
FY 16, REFORECAST
Exhibit A

Salary & Employee Professional Materials & Admin. Billing Year 5
Department Wages Benefits Services Supplies Expenses Utilities Credits Total Percent
Administration 610,505$ 419,297$ 246,012$ 68,434$ 190,036$ 161,438$ -$ 1,695,723$ 5.9%Finance 2,010,156 1,242,790 400,475 297,675 315,958 17,989 - 4,285,042 14.9%Human Resources 386,368 195,750 27,299 35,211 417,730 1,812 - 1,064,169 3.7%Engineering 1,837,038 1,028,930 714,576 84,747 58,192 9,800 (1,107,617) 2,625,666 9.1%Operations 7,540,487 5,218,222 414,885 3,487,869 270,249 572,716 (1,807,562) 15,696,866 54.5%Park 1,172,447 760,687 243,021 620,799 159,476 516,620 (15,000) 3,458,049 12.0%Total 13,557,001$ 8,865,675$ 2,046,267$ 4,594,735$ 1,411,640$ 1,280,375$ (2,930,179)$ 28,825,515$ 100.0%
Salary & Employee Professional Materials & Admin. Billing Year 5
Division Wages Benefits Services Supplies Expenses Utilities Credits Total Percent
Retail Water 7,835,085$ 4,962,040$ 1,227,658$ 2,027,980$ 635,541$ 110,863$ (1,746,192)$ 15,052,974$ 52.2%Water Recycling 1,005,698 666,013 81,868 314,960 94,089 186,736 (247,207) 2,102,157 7.3%Sewer 3,468,856 2,435,060 489,768 1,628,818 518,241 458,111 (921,779) 8,077,075 28.0%Park 1,247,362 802,563 246,974 622,977 163,770 524,665 (15,000) 3,593,309 12.5%Total 13,557,001$ 8,865,675$ 2,046,267$ 4,594,735$ 1,411,640$ 1,280,375$ (2,930,179)$ 28,825,515$ 100.0%
PADRE DAM MUNICIPAL WATER DISTRICTDEPARTMENTAL ALLOCATIONS TO DIVISION BUDGETS
FY 17, REFORECAST
Exhibit A

Salary & Employee Professional Materials & Admin. Billing 5 Year
Department Wages Benefits Services Supplies Expenses Utilities Credits Total Percent
Administration 2,824,989$ 1,821,451$ 987,922$ 337,495$ 867,110$ 728,652$ -$ 7,567,619$ 5.8%Finance 9,222,609 5,341,547 1,699,744 1,256,522 1,462,656 107,515 (1,390,809) 17,699,784 13.5%Human Resources 1,775,798 1,119,622 139,690 180,355 1,741,015 9,155 - 4,965,635 3.8%Engineering 8,927,820 4,645,277 5,209,076 496,864 260,999 47,090 (4,538,433) 15,048,693 11.5%Operations 34,346,117 22,319,175 1,805,595 16,333,270 1,331,691 2,707,489 (8,526,446) 70,316,891 53.5%Park 5,159,096 3,130,201 1,240,634 3,040,873 812,382 2,423,078 (10,000) 15,796,265 12.0%Total 62,256,429$ 38,377,275$ 11,082,662$ 21,645,378$ 6,475,854$ 6,022,978$ (14,465,688)$ 131,394,888$ 100.0%
Salary & Employee Professional Materials & Admin. Billing 5 Year
Division Wages Benefits Services Supplies Expenses Utilities Credits Total Percent
Retail Water 36,124,624$ 21,570,523$ 6,703,144$ 9,493,379$ 2,874,559$ 522,768$ (8,658,957)$ 68,630,040$ 52.2%Water Recycling 4,636,892 2,895,231 447,007 1,474,393 425,568 880,545 (1,225,842) 9,533,794 7.3%Sewer 15,993,588 10,585,470 2,674,184 7,624,823 2,344,010 2,160,204 (4,570,888) 36,811,391 28.0%Total Park 5,501,324 3,326,051 1,258,327 3,052,784 831,716 2,459,461 (10,000) 16,419,664 12.5%Total 62,256,429$ 38,377,275$ 11,082,662$ 21,645,378$ 6,475,854$ 6,022,978$ (14,465,688)$ 131,394,888$ 100.0%
PADRE DAM MUNICIPAL WATER DISTRICTDEPARTMENTAL ALLOCATIONS TO DIVISION BUDGETS
5 YEAR TOTAL, REFORECAST
Exhibit A

Capital Equipment Forecast Budget Budget Budget Budget TotalDescription Life in Years Department CC Year 1 Year 2 Year 3 Year 4 Year 5 Budget
Copier 5 FINANCE 11 - - - - 15,000 15,000 Imaging System (desktop scanners) 5 FINANCE 11 - 20,000 - - - 20,000 Printers 5 FINANCE 11 - 20,000 - - - 20,000 Data backup and recovery improvement 5 FINANCE 16 - 40,000 - - 40,000 Storage Area Network (SAN) expansion ($15k-$50K) 5 FINANCE 16 - 50,000 - - - 50,000 VMware Host replacements 5 FINANCE 16 - - - - 31,000 31,000 Phone system $400-$1000 per user 5 FINANCE 16 - - 110,000 - - 110,000 Backup Tape Library/loader 5 FINANCE 16 - 11,000 - - - 11,000 Computer equipment 5 FINANCE 16 - 52,500 52,500 52,500 52,500 210,000 HUMA alert software upgrades for CS 5 FINANCE 12 - 25,000 - - - 25,000 CSC Copier 5 ADMIN 69 - 17,000 - - - 17,000 New Backlit Projector for Board Room - requested quo5 ADMIN 69 - 5,000 - - - 5,000 Board room streaming audio/video 5 ADMIN 69 - 15,000 - - - 15,000 Repeater hydrant caps 10 OPS 13 20,000 20,000 Construct Meter Retro 10 OPS 13 10,000 10,000 Metal Lathe (new building) 5 OPS 47 9,500 - - 9,500 Ball Valve Replacement - P4-PS 3 10 OPS 47 14,000 - - - - 14,000 A/C Units 5 OPS 51 10,925 - 5,000 - 5,000 20,925 Pumps 5 OPS 51 - 37,000 37,000 37,000 143,000 254,000 Filter Sand 5 OPS 51 78,300 78,300 Meters and Analyzers 5 OPS 51 6,000 55,200 21,000 22,000 6,000 110,200 Valves & Equipment 5 OPS 51 - 22,885 18,000 5,000 45,885 Rag removal belt and motor 5 OPS 51 - 5,000 5,000 Chlorine Scrubber rehab 5 OPS 51 - 28,000 28,000 Mixers 5 OPS 51 - 10,000 10,000 5,000 13,500 38,500 SCADA System 5 OPS 51 6,632 27,400 19,400 51,500 24,500 129,432 Motors & Equipment 5 OPS 51 - 20,000 28,500 25,000 21,500 95,000 Plate settlers 5 OPS 51 25,000 25,000 Solar panel upgrade(flow to lake # 7) 5 OPS 51 8,500 8,500 Primary Tank Sed Cover 5 OPS 51 15,545 15,545 Asphalt Improvements 5 OPS 51 5,513 5,513 Auto sampler 5 OPS 52 12,000 12,000 Casework-Lab Cabinet 5 OPS 52 8,765 23,901 32,666 Painting the Laboratory 5 OPS 52 25,000 25,000 Lab Flooring 5 OPS 52 25,000 25,000 Atomic Adsorption (metals) 5 OPS 52 60,000 60,000 UV/VIS Spectrophotometer 5 OPS 52 7,334 7,334 Auto Analyzer 5 OPS 52 50,000 50,000 Gas Chromatograph 5 OPS 52 150,000 150,000 Autoclave 5 OPS 52 12,000 12,000 Bladder Tanks 5 OPS 47 16,600 - - - - 16,600 JD Gator 5 OPS 61 - 18,000 18,000 Laptop Computers (add to duty trucks) 5 OPS 71 11,000 - - - 11,000 Backhoe John Deere 5 OPS 71 - 95,000 - - 95,000 Backhoe John Deere 5 OPS 73 95,000 - - - 95,000 Autosampler 5 OPS 73 11,000 - - - - 11,000 Light Tower (two purchased 6/30/12) 5 OPS 73 - - 9,000 - - 9,000 Arrow Board 5 OPS 73 - 5,000 5,000 10,000 Emission Control Systems 5 OPS 71 78,455 51,545 40,000 14,000 184,000 Tremac pnuematic breaker 5 OPS 73 15,000 15,000 Computer Server 5 PARK 62 - 17,500 - 7,500 - 25,000 Gator Maintenance Vehicle 5 PARK 62 - - 10,000 - - 10,000 Maintenance Yard Car Port 15 PARK 62 - - - - 10,000 10,000 Peddle Boats 5 PARK 62 - 20,000 10,000 10,000 10,000 50,000 Pontoon Boat 5 PARK 62 - - 20,000 - - 20,000 Tractor (John Deer) 5 PARK 62 - - - 35,000 - 35,000 WiFi Systems 5 PARK 62 - 15,000 7,500 7,500 7,500 37,500 AC -Park Buildings 5 PARK 62 - 20,000 20,000 40,000 Dock Lake 1 15 PARK 62 - 20,000 15,000 35,000 Trash Receptacle Lids 5 PARK 62 - 10,000 - - - 10,000 Storage Unit\Container 15 PARK 62 - 10,000 10,000 10,000 30,000 Radio System Upgrade 5 PARK 62 - 6,500 6,500 Golf Cart Replacement 5 PARK 62 15,000 5,000 5,000 5,000 30,000 Copiers 5 PARK 62 10,000 10,000 20,000 Generator Installation 15 PARK 62 - 75,000 75,000 Oaks Hot Water Heater 5 PARK 67 5,325 5,325 Cabins AC Units 5 PARK 67 9,675 5,000 5,000 5,000 24,675 2000 L7501 Vactor Sewer Cleaning Truck 5 OPS 71 400,000 400,000 2002 Ford F150 Truck 5 PARK 62 30,000 30,000 2003 Ford F350 Supercab Truck 5 ENGINEERING 47 65,657 65,657 2003 Ford Explorer 5 OPS 37 30,808 30,808 1999 Ford F-150 Pickup 5 OPS 73 30,000 30,000 2000 Ford Ranger XLT supercab 4x2 5 OPS 73 30,000 30,000 2003 Ford F-150 Truck 5 PARK 62 30,000 30,000 2006 Ford Explorer 5 OPS 45 30,303 30,303 2008 DODGE DAKOTA (Lease - not disposed) 5 OPS 61 6,203 6,203 2001 Ford F250 Truck 5 OPS 43 44,444 44,444 2002 Ford F250 Truck 5 OPS 51 35,354 35,354 2003 Ford Explorer 5 ENGINEERING 34 30,303 30,303 2003 Ford Explorer 5 ENGINEERING 37 30,303 30,303 2003 Ford F-250 Truck 5 OPS 61 37,374 37,374
Exhibit B

Capital Equipment Forecast Budget Budget Budget Budget TotalDescription Life in Years Department CC Year 1 Year 2 Year 3 Year 4 Year 5 Budget
2003 Ford F-350 Truck 5 OPS 73 44,444 44,444 2004 Ford F250 Super Cab 5 OPS 47 44,444 44,444 2004 Ford F-150 supercab 5 OPS 79 31,313 31,313 2008 Ford Explorer Sporttrack 5 OPS 41 31,313 31,313 2008 Ford F-350 Duty Truck 5 OPS 73 50,000 50,000 1992 Dodge Caravan 5 PARK 62 20,000 20,000 1999 Ford F-150 Pickup 5 OPS 43 32,828 32,828 2003 Ford Explorer 5 PARK 62 30,000 30,000 2004 Ford F-150 supercab 5 OPS 13 33,333 33,333 2004 Ford Explorer 5 OPS 79 30,808 30,808 2004 Ford Explorer 5 OPS 79 30,808 30,808 2004 Ford F-150 supercab 5 OPS 79 31,313 31,313 2003 Vactor 2110 Jet Rodder 5 OPS 71 420,000 420,000 1999 Ford Windstar Van 5 OPS 69 30,303 30,303 2000 Ford Taurus LX 4-Door Sedan 5 OPS 69 20,202 20,202 2004 Ford F-350 Super Duty 5 OPS 45 50,000 50,000 2006 Ford F-150 5 OPS 49 31,818 31,818 2006 Ford F-350 5 OPS 45 37,374 37,374 2010 Ford F-350 Duty Truck 5 OPS 73 50,000 50,000 2007 DODGE DAKOTA 5 OPS 13 26,263 26,263 2007 DODGE DAKOTA 5 OPS 13 25,758 25,758 2007 Ford F-350 5 OPS 61 35,859 35,859 2010 Ford F-350 5 OPS 47 70,707 70,707 1999 Ford F-550 Dumptruck 5 OPS 73 50,505 50,505 2001 Ford F650 Utility Truck 5 OPS 73 126,263 126,263 Ingersoll- Rand Air Compressor 5 OPS 73 18,000 - 18,000 Ingersoll- Rand Air Compressor (B-9) 5 OPS 73 18,000 - 18,000 Ingersoll Rand Air Compressor 5 OPS 73 18,000 - 18,000 Cat Forklift 5 OPS 44 60,000 - 60,000 Pump Control Valves PS 1, 3, 4, 5 50 OPS 47 8,078 14,122 19,000 15,400 14,051 70,651 Diesel Generator (Board approved 10/2011) 10 OPS 61 97,062 97,062
- TOTAL 567,394 1,857,632 916,991 1,185,097 755,904 5,283,017 LESS DIESEL GENERATOR (97,062) ORIGINAL PLAN BUDGET 5,185,955
TOTAL BY DEPARTMENTOPERATIONS 466,412$ 1,322,851$ 596,991$ 1,037,597$ 589,904$ 4,013,754$ ENGINEERING 65,657 60,606 - - - 126,263 PARK 35,325 258,675 117,500 95,000 67,500 574,000 FINANCE - 178,500 202,500 52,500 98,500 532,000 ADMIN - 37,000 - - - 37,000
TOTAL 567,394$ 1,857,632$ 916,991$ 1,185,097$ 755,904$ 5,283,017$
TOTAL BY OPERATIONWATER 201,487$ 521,649$ 239,199$ 171,424$ 237,239$ 1,370,998$ SEWER 102,324 537,747 174,659 449,368 44,654 1,308,752 RECYCLED WATER 228,258 539,561 413,683 455,305 392,461 2,029,267 PARK 35,325 258,675 117,500 95,000 67,500 574,000
TOTAL 567,394$ 1,857,632$ 945,041$ 1,171,097$ 741,854$ 5,283,017$
Exhibit B

Expenditures and Funding Sources ($1,000s)EXHIBIT C
Anticipated 2013 2014 2015 2016 2017 5 YEARS
YEAR 1 REVISED BUDGETEXPENDITURESProject Costs 11,921$ 24,615$ 14,900$ 8,658$ 9,997$ 70,092$ Debt Service 878$ 917$ 921$ 912$ 908$ 4,537$
Total 12,799$ 25,533$ 15,821$ 9,570$ 10,905$ 74,628$
FUNDING SOURCESCOP 4,957$ 12,492$ 2,494$ -$ -$ 19,943$ Woodside 52$ 283$ 1,823$ -$ -$ 2,157$ Grants & Misc. 1,500$ 1,565$ 140$ 83$ 85$ 3,373$ Park Participation 4$ -$ -$ 22$ 11$ 38$ Capital Replacement Funds
Water 3,550$ 4,252$ 4,668$ 6,666$ 9,058$ 28,195$ Sewer 1,025$ 2,384$ 1,695$ 1,031$ 604$ 6,739$ Recycled 239$ 892$ 231$ 169$ 48$ 1,580$
Capital Expansion FundsWater 471$ 995$ 2,722$ 158$ 108$ 4,455$ Sewer 101$ 245$ 784$ 124$ 127$ 1,381$ Recycled 29$ 70$ 40$ 0$ 0$ 139$
ExpensedWater 296$ 1,190$ 787$ 1,064$ 743$ 4,081$ Sewer 333$ 763$ 319$ 206$ 98$ 1,719$ Recycled 241$ 402$ 118$ 47$ 21$ 829$
Total 12,799$ 25,533$ 15,821$ 9,570$ 10,905$ 74,628$
ORIGINAL 5 YEAR BUSINESS PLANEXPENDITURESProject Costs 17,469$ 22,114$ 10,445$ 8,193$ 9,755$ 67,976$ Debt Service 878$ 917$ 921$ 912$ 908$ 4,537$
Total 18,347$ 23,031$ 11,366$ 9,106$ 10,663$ 72,513$
FUNDING SOURCESCOP 6,775$ 9,673$ 1,454$ -$ -$ 17,902$ Woodside 835$ 1,396$ -$ -$ -$ 2,231$ Grants & Misc. 1,500$ 1,565$ 80$ 83$ 85$ 3,313$ Park Participation 4$ -$ -$ 22$ 11$ 38$ Capital Replacement Funds
Water 4,477$ 4,461$ 5,548$ 6,886$ 9,394$ 30,767$ Sewer 2,114$ 2,476$ 1,919$ 1,161$ 672$ 8,342$ Recycled 698$ 605$ 250$ 209$ 67$ 1,829$
Capital Expansion FundsWater 1,273$ 2,134$ 1,699$ 519$ 258$ 5,884$ Sewer 356$ 553$ 351$ 215$ 171$ 1,646$ Recycled 314$ 169$ 63$ 10$ 4$ 561$
ExpensedWater -$ -$ -$ -$ -$ -$ Sewer -$ -$ -$ -$ -$ -$ Recycled -$ -$ -$ -$ -$ -$
Total 18,347$ 23,031$ 11,366$ 9,106$ 10,663$ 72,513$
rev. 6/10/2013 page 1 of 2

Expenditures and Funding Sources ($1,000s)EXHIBIT C
Anticipated 2013 2014 2015 2016 2017 5 YEARS
VARIANCEEXPENDITURESProject Costs (5,548)$ 2,501$ 4,455$ 465$ 242$ 2,116$ Debt Service -$ -$ -$ -$ -$ -$
Total (5,548)$ 2,501$ 4,455$ 465$ 242$ 2,116$
FUNDING SOURCESCOP (1,818)$ 2,819$ 1,040$ -$ -$ 2,041$ Woodside (783)$ (1,113)$ 1,823$ -$ -$ (74)$ Grants & Misc. -$ -$ 60$ (0)$ (0)$ 60$ Park Participation -$ -$ -$ 0$ (0)$ (0)$ Capital Replacement Funds
Water (926)$ (209)$ (881)$ (220)$ (336)$ (2,571)$ Sewer (1,090)$ (92)$ (224)$ (130)$ (68)$ (1,603)$ Recycled (459)$ 287$ (19)$ (40)$ (19)$ (250)$
Capital Expansion FundsWater (802)$ (1,139)$ 1,022$ (361)$ (150)$ (1,430)$ Sewer (255)$ (308)$ 433$ (92)$ (44)$ (265)$ Recycled (286)$ (99)$ (23)$ (10)$ (4)$ (422)$
ExpensedWater 296$ 1,190$ 787$ 1,064$ 743$ 4,081$ Sewer 333$ 763$ 319$ 206$ 98$ 1,719$ Recycled 241$ 402$ 118$ 47$ 21$ 829$
Total (5,548)$ 2,501$ 4,455$ 465$ 242$ 2,116$
rev. 6/10/2013 page 2 of 2

YEAR 1 REVISED CIP BUDGET
PROJECT EXPENDITURES ($1,000s)
EXHIBIT C
NOTES: 1) Unless otherwise noted, costs include an inflation factor of 3.3% per year.
2) Amounts are rounded which may affect footing.
Project and Phase
Job No. or
Work Order
Estimated
Completion
Cost to
6/30/12
Anticipated
12/13 13/14 14/15 15/16 16/17 Future Total
Total 5 Years
12/13 - 16/17
Capitalized OperationsAnnual Raise Air Vacs (ESA) 202033 Annual 324$ 25$ 26$ 27$ 28$ -$ TBD 429$ 105$
Annual Raise Air Vacs (WSA) 98048 Annual -$ 19$ 20$ 20$ 21$ 22$ TBD 101$ 101$
Annual Sewer Manhole Rehab. 201004 Annual 49$ 50$ 52$ 53$ 55$ 85$ TBD 344$ 296$
Annual Sewer Rehab Annual -$ 30$ 31$ 32$ 33$ 68$ TBD 194$ 194$
Blowoff Installation 208015 Annual -$ 50$ 52$ 53$ 83$ 85$ TBD 323$ 323$
Poly Service Replacement (ESA) 202032 Annual -$ 80$ 46$ 48$ 50$ 68$ TBD 292$ 292$
Poly Service Replacement (WSA) 202008 Annual -$ 115$ 52$ 53$ 55$ 57$ TBD 332$ 332$
SCADA Network/Comm. Upgrades 208009 2013 110$ 165$ -$ -$ -$ -$ -$ 275$ 165$
SCADA Software Upgrades (Ops) 208003 2013 1,274$ 154$ -$ -$ -$ -$ -$ 1,428$ 154$
Security System Upgrades Ph 2 205002 2017 314$ 50$ 102$ 53$ 55$ 57$ TBD 631$ 317$
Site Paving As Needed Annual -$ 50$ 102$ 53$ 55$ 85$ TBD 346$ 346$
Valve Replacement Contractor 99017 Annual -$ -$ 250$ 250$ 250$ 250$ TBD 1,000$ 1,000$
Valve Replacement Program (ESA) 202034 Annual -$ 100$ 129$ 133$ 138$ 165$ TBD 665$ 665$
Valve Replacement Program (WSA) 99017 Annual -$ 400$ 513$ 482$ 496$ 510$ TBD 2,401$ 2,401$
Vault Lid Replacement 211023 2014 16$ 25$ 26$ -$ -$ -$ -$ 67$ 51$
WRF Treatment Equipment Repl. Program 207006 Annual 39$ -$ 70$ 149$ 154$ 159$ TBD 571$ 533$
Subtotal 2,124$ 1,313$ 1,469$ 1,408$ 1,472$ 1,613$ -$ 9,400$ 7,276$
Mandated by External AgenciesCity of El Cajon Meter Box & Sidewalk Rplc 2014 -$ 10$ 40$ -$ -$ -$ -$ 50$ 50$
City of Santee
Atlas View Sidewalks Service Reloc. 2013 -$ 25$ -$ -$ -$ -$ -$ 25$ 25$
Bridge Retrofits Util. Reloc. 2014 -$ 50$ 52$ -$ -$ -$ -$ 102$ 102$
Buena Vista/Railroad Impr. 2013 -$ 25$ -$ -$ -$ -$ -$ 25$ 25$
Carlton Oaks Bridge Retrofit 2014 -$ 75$ 77$ -$ -$ -$ -$ 152$ 152$
Cottonwood Ave Util. Reloc 2014 -$ -$ 26$ -$ -$ -$ -$ 26$ 26$
Cuyamaca/Mission Gorge Rt Turn Lanes Not budgeted -$ -$ -$ -$ -$ -$ -$ -$ -$
Magnolia Widening Util. Reloc. 2015 -$ -$ -$ 27$ -$ -$ -$ 27$ 27$
Magnolia/Palm Glen Median Util. Reloc. Not budgeted -$ -$ -$ -$ -$ -$ -$ -$ -$
Mission Gorge Drainage Conflicts 2015 -$ -$ -$ 107$ -$ -$ -$ 107$ 107$
Mission Gorge Median Install Util. Reloc. 2013 -$ 25$ -$ -$ -$ -$ -$ 25$ 25$
Olive Lane Util. Reloc. 2014 -$ -$ 26$ -$ -$ -$ -$ 26$ 26$
Pavement Repair Util. Reloc. 2015 -$ 50$ 52$ 53$ -$ -$ -$ 155$ 155$
Prospect Ave East Util. Reloc. 2015 0$ 15$ 258$ 235$ -$ -$ -$ 508$ 508$
Prospect Ave Sidewalks West Util. Reloc. 2016 -$ -$ 103$ 107$ 55$ -$ -$ 265$ 265$
Prospect Ave West Util. Reloc. 2015 -$ -$ 258$ 267$ -$ -$ -$ 525$ 525$
Riverwalk/Park Center Dr Not budgeted -$ -$ -$ -$ -$ -$ -$ -$ -$
Storm Drain Conflicts 2016 -$ 75$ 77$ 80$ 55$ -$ -$ 288$ 288$
Woodside/Shadow Hill Util Reloc. Not budgeted -$ -$ -$ -$ -$ -$ -$ -$ -$
County Alpine Blvd Service Relocations 2014 -$ -$ 207$ -$ -$ -$ -$ 207$ 207$
County Wing Avenue Sewer Relocation 212004 2014 0$ -$ 220$ -$ -$ -$ -$ 220$ 220$
Lakeside Interceptor Replacement Particip. 206007 Annual -$ 15$ 207$ 213$ 220$ 228$ -$ 883$ 883$
Salinity Nutrient Mgt Plan (PD share) 42876 2014 -$ 40$ 45$ -$ -$ -$ -$ 85$ 85$
Stage 2 DBPR System Improvements 206028 Not budgeted -$ -$ -$ -$ -$ -$ -$ -$ -$
Undefined External Mandates Annual -$ -$ -$ -$ 551$ 569$ TBD 1,120$ 1,120$
Urban Water Management Plan 2015 2016 -$ -$ -$ 53$ 55$ -$ -$ 108$ 108$
rev 6/10/2013 page 1 of 5

YEAR 1 REVISED CIP BUDGET
PROJECT EXPENDITURES ($1,000s)
EXHIBIT C
Project and Phase
Job No. or
Work Order
Estimated
Completion
Cost to
6/30/12
Anticipated
12/13 13/14 14/15 15/16 16/17 Future Total
Total 5 Years
12/13 - 16/17
WDR Sewer System Management Plan Update 2014 -$ 25$ 77$ -$ -$ -$ -$ 102$ 102$
WRF NPDES Permit Annual Updates Annual -$ 10$ 10$ 11$ 11$ 11$ TBD 53$ 53$
WRF NPDES Permit Renewal 2014 2015 -$ 65$ 67$ 133$ -$ -$ -$ 266$ 266$
Subtotal 1$ 505$ 1,803$ 1,286$ 948$ 808$ -$ 5,351$ 5,350$
CIP General5 Res Retrofit Ph 4 - Blossom Valley
Design 208027 Complete 124$ 1$ -$ -$ -$ -$ -$ 125$ 1$
Permitting 2015 -$ -$ -$ 80$ -$ -$ -$ 80$ 80$
Construction 208027 2017 -$ -$ -$ -$ 3,544$ 5,693$ -$ 9,237$ 9,237$
Annual Post-Project Engineering 212007 Annual -$ 12$ 5$ 5$ 6$ 6$ TBD 33$ 33$
Annual Sewer Assessment Annual -$ 30$ 26$ 21$ 11$ 6$ TBD 94$ 94$
Annual Sewer Replacment / Rehab Annual -$ 170$ 232$ 192$ 99$ 51$ TBD 745$ 745$
Asset Management System/CMMS -$ -$ -$ -$ 551$ 285$ -$ 836$ 836$
Blossom Valley Res Drainage & Site Impr.
Study 43027 2013 -$ 40$ -$ -$ -$ -$ -$ 40$ 40$
Construction 2016 -$ -$ -$ -$ 165$ -$ -$ 165$ 165$
Braverman Sewer Cured in Place Repairs Ph 2 212011 2013 -$ 250$ 100$ -$ -$ -$ -$ 350$ 350$
Capacity Fee Update 2014 2016 -$ -$ -$ 110$ 114$ -$ -$ 223$ 223$
Carlton Hills Diversion Structure Upgrade 2015 -$ -$ 75$ 534$ -$ -$ -$ 609$ 609$
Chocolate Summit Res Land Acq. 2014 -$ 15$ 135$ -$ -$ -$ -$ 150$ 150$
CSC Elec Reliability & Consolidation 209004 2013 29$ 110$ -$ -$ -$ -$ -$ 139$ 110$
CSC Ph 2 - Verizon Relocation 212014 2013 -$ 30$ -$ -$ -$ -$ -$ 30$ 30$
Emerg. Generators Startup, Testing, Permitting 2013 -$ 50$ -$ -$ -$ -$ -$ 50$ 50$
Emergency Interconn Trailer Mounted Pumps 2016 -$ -$ 21$ 213$ 52$ -$ -$ 286$ 286$
Eng System Data Updates (Annual) Annual -$ 5$ 5$ 5$ 6$ 6$ TBD 27$ 27$
Facility Condition Assessment Sewer 2015 -$ 15$ 15$ 16$ -$ -$ -$ 47$ 47$
Facility Condition Assessment Water 2015 -$ 35$ 36$ 37$ -$ -$ -$ 109$ 109$
Financial Computer Syst Upgrade
CIS Software 212012 2014 -$ 720$ 744$ -$ -$ -$ -$ 1,464$ 1,464$
EDMS Implementation 212008 2014 -$ 105$ 108$ -$ -$ -$ -$ 213$ 213$
Finance & HR Software 212013 2014 -$ 675$ 697$ -$ -$ -$ -$ 1,372$ 1,372$
GIS Projects 2016 -$ 150$ 77$ 53$ 55$ -$ -$ 336$ 336$
HWD/Camino Canada Emerg. Conn. 204021 2014 -$ -$ 80$ -$ -$ -$ -$ 80$ 80$
I-8 Crossing - Labrador Lane
Assessment 2014 -$ -$ 57$ -$ -$ -$ -$ 57$ 57$
Design & Construction 2016 -$ -$ 72$ 373$ 66$ -$ -$ 512$ 512$
I-8 Crossing - Viewside Lane 8" Assessment 2014 -$ 20$ 30$ -$ -$ -$ -$ 50$ 50$
IFP Annual Maint Annual -$ 0$ -$ 48$ 66$ 51$ TBD 166$ 166$
IPS Chopper Pumps (IPS Screening) 209013 2014 -$ 50$ 52$ -$ -$ -$ -$ 102$ 102$
JWA NCCP Subarea Plan (prev 98046) 2013 -$ 50$ -$ -$ -$ -$ -$ 50$ 50$
JWA NCCP Subarea Plan (Ph 2) 2014 -$ -$ 37$ 0$ 0$ 0$ -$ 37$ 37$
Magnolia Ave South Relief Sewer - Segment 1
Studies 204030 Complete 39$ -$ -$ -$ -$ -$ -$ 39$ -$
Planning & Prelim. Design 42930 2014 -$ 1$ 74$ -$ -$ -$ -$ 75$ 75$
Design & Construction 204030 2016 -$ -$ -$ 320$ 55$ -$ -$ 375$ 375$
Master Plan & Program EIR 42913 2014 -$ 15$ 755$ -$ -$ -$ -$ 770$ 770$
METRO Sewer Billing 43140 2014 -$ 30$ 15$ -$ -$ -$ -$ 45$ 45$
Mission Gorge Rd 36" Valves 2017 -$ -$ -$ -$ -$ 399$ -$ 399$ 399$
Northcote Pump Station Upgrade - Prelim Design 2017 -$ -$ -$ -$ -$ 38$ -$ 38$ 38$
Pipe Evaluations - Bridge Crossings 2014 -$ 50$ 103$ -$ -$ -$ -$ 153$ 153$
Reservoir Refurbishing Ph 5 210017 2017 -$ -$ -$ 320$ 110$ 114$ -$ 544$ 544$
rev 6/10/2013 page 2 of 5

YEAR 1 REVISED CIP BUDGET
PROJECT EXPENDITURES ($1,000s)
EXHIBIT C
Project and Phase
Job No. or
Work Order
Estimated
Completion
Cost to
6/30/12
Anticipated
12/13 13/14 14/15 15/16 16/17 Future Total
Total 5 Years
12/13 - 16/17
Rios Canyon PS Suction Rplc 211014 2014 110$ 300$ 33$ -$ -$ -$ -$ 443$ 333$
Santee Basin Aquifer Study & Env. (PD Share) 43043 2015 -$ 65$ 187$ 53$ -$ -$ -$ 305$ 305$
Sewer Flow Studies 5 Year Updates 2015 -$ -$ -$ 107$ -$ -$ -$ 107$ 107$
Sewer Rehab Fanita Parkway 2015 -$ -$ 103$ 107$ -$ -$ -$ 210$ 210$
Sewer Trans-River Interceptor (Siphon) Assess. 43035 2014 -$ 5$ 128$ -$ -$ -$ -$ 133$ 133$
Solar Energy Feasibility Study (CSC & WRF) 2014 -$ -$ 15$ -$ -$ -$ -$ 15$ 15$
Solar Power - Res/Ops/WRF Sites 211012 2017 -$ -$ 15$ 16$ 17$ 17$ -$ 65$ 65$
Steel Pipe Condition Assessment 2017 -$ -$ 155$ 213$ 220$ 228$ -$ 817$ 817$
Steel Pipe Repl. 2017 -$ -$ -$ 320$ 386$ 455$ -$ 1,161$ 1,161$
Sunrise Reservoir Verizon Relocation Complete -$ 50$ -$ -$ -$ -$ -$ 50$ 50$
Sycamore Creek Flood Wall 2015 -$ -$ 258$ 267$ -$ -$ -$ 525$ 525$
Sycamore Creek Hydrology Study 43051 2014 -$ 30$ 95$ -$ -$ -$ -$ 125$ 125$
Walmart Sewer Diversion Structure
Studies 211022 Complete 12$ -$ -$ -$ -$ -$ -$ 12$ -$
Prelim. Design 2013 -$ 110$ -$ -$ -$ -$ -$ 110$ 110$
Design & Construction 211022 2014 -$ -$ 557$ -$ -$ -$ -$ 557$ 557$
Water Pump Replacement Program 2015 -$ -$ 146$ 150$ -$ -$ -$ 296$ 296$
Willowgrove Sewer, Phase 2
Assessment 2015 -$ -$ 31$ 32$ -$ -$ -$ 63$ 63$
Construction 209006 2016 -$ -$ -$ -$ 165$ -$ -$ 165$ 165$
WRF & Pond Valve Replacements 2016 -$ -$ 57$ 86$ 331$ -$ -$ 473$ 473$
WRF Aeration Panels 2017 -$ -$ -$ -$ 69$ 72$ -$ 141$ 141$
WRF Chlorine Trolley 211025 2014 26$ 60$ 367$ -$ -$ -$ -$ 453$ 427$
WRF Fence Replacement 2014 -$ -$ 103$ -$ -$ -$ -$ 103$ 103$
WRF Imprvmts - General (prev SO2 Scrubber) 2015 -$ 15$ 99$ 11$ -$ -$ -$ 125$ 125$
WRF Mag Meter Install 213002 2014 -$ -$ 125$ -$ -$ -$ -$ 125$ 125$
WRF Paving Repair (paid by District) 212002 2015 70$ -$ -$ 60$ -$ -$ -$ 130$ 60$
WRF Studies 42631, 42930 2014 -$ 25$ 77$ -$ -$ -$ -$ 102$ 102$
Subtotal 410$ 3,289$ 6,106$ 3,751$ 6,087$ 7,420$ -$ 27,063$ 26,653$
Debt & External Financing Required5 Res Retrofit Ph 2 - Mt Top & East Victoria 208025 2013 8,792$ 25$ -$ -$ -$ -$ -$ 8,817$ 25$
5 Res Retrofit Ph 3 - West Victoria 2013 3,707$ 2,200$ 10$ -$ -$ -$ -$ 5,917$ 2,210$
CSC Ph 2 - Ops
RFP Review & Negotiations 42235 Complete -$ 9$ -$ -$ -$ -$ -$ 9$ 9$
Design & Construction 205014 2015 862$ 101$ 600$ 3,870$ -$ -$ -$ 5,433$ 4,572$
Emergency Generator - Alpine PS 209001 2013 689$ 68$ -$ -$ -$ -$ -$ 758$ 68$
Emergency Generator - Flinn Springs PS 209014 2014 193$ 800$ 50$ -$ -$ -$ -$ 1,043$ 850$
Emergency Generator - Rios Canyon PS 209019 2014 172$ 60$ 450$ -$ -$ -$ -$ 682$ 510$
ESA Sec. Supply Connection
Orig Site / Restoration (excl. sunk costs) 203032 2013 4,443$ 400$ -$ -$ -$ -$ -$ 4,843$ 400$
Legal Costs 2013 -$ 75$ -$ -$ -$ -$ -$ 75$ 75$
Mitigation & Monitoring 210001 2020 -$ 250$ 1$ 1$ 68$ 70$ 97$ 486$ 389$
Land Acq. 2011 & Vallone 211009, 212015 2013 24$ 711$ -$ -$ -$ -$ -$ 735$ 711$
Land Acq. El Dorado 2014 -$ 40$ 260$ -$ -$ -$ -$ 300$ 300$
Basis of Design 43473 2014 -$ 20$ 350$ -$ -$ -$ -$ 370$ 370$
Alt Site Design & Constr 2015 -$ -$ 11,197$ 4,268$ -$ -$ -$ 15,465$ 15,465$
Ops - Security Gates (from Cell Revenues) -$ -$ -$ 80$ 83$ 85$ -$ 248$ 248$
Sunrise Reservoir Retaining Wall / Site Impr. 210026 2014 99$ 450$ 175$ -$ -$ -$ -$ 724$ 625$
WRF Demo Project
RFP 42884 2013 -$ 45$ -$ -$ -$ -$ -$ 45$ 45$
rev 6/10/2013 page 3 of 5

YEAR 1 REVISED CIP BUDGET
PROJECT EXPENDITURES ($1,000s)
EXHIBIT C
Project and Phase
Job No. or
Work Order
Estimated
Completion
Cost to
6/30/12
Anticipated
12/13 13/14 14/15 15/16 16/17 Future Total
Total 5 Years
12/13 - 16/17
Demo Project 2014 -$ 1,500$ 1,550$ -$ -$ -$ -$ 3,050$ 3,050$
WRF Paving Repair (SDGE funded) 212002 2015 -$ -$ -$ 60$ -$ -$ -$ 60$ 60$
Subtotal 18,980$ 6,754$ 14,642$ 8,279$ 150$ 155$ 97$ 49,058$ 29,981$
Developer DrivenAlpine High School D/P 209021 2014 18$ 1$ 93$ -$ -$ -$ -$ 111$ 93$
Alpine Ranch Estates West D/P 210012 2014 2$ 24$ 24$ -$ -$ -$ -$ 50$ 48$
D/P General 2014 -$ -$ 309$ -$ -$ -$ -$ 309$ 309$
Grossmont College Privatization 205021 2013 -$ 35$ -$ -$ -$ -$ -$ 35$ 35$
Pebble Beach Relief Sewer (Castlerock) 203033 -$ -$ -$ -$ -$ -$ -$ -$ -$
El Cap Pipeline D/P (South Coast) 2015 -$ -$ 170$ 176$ -$ -$ -$ 346$ 346$
Subtotal 2015 20$ 60$ 596$ 176$ -$ -$ -$ 851$ 831$
COP Financing5 Res Retrofit Ph 2 - Mt Top & East Victoria 2013 (25)$ -$ -$ -$ -$ -$ (25)$
5 Res Retrofit Ph 3 - West Victoria 208026 2014 (2,200)$ (10)$ -$ -$ -$ -$ (2,210)$
5 Res Retrofit Ph 4 - Blossom Valley Design 208027 2013 (1)$ -$ -$ -$ -$ -$ (1)$
Emergency Generator - Flinn Springs PS 203032 2014 (800)$ (50)$ -$ -$ -$ -$ (850)$
Emergency Generator - Rios Canyon PS 209019 2014 (60)$ (450)$ -$ -$ -$ -$ (510)$
ESA Sec. Supply Conn
Orig Site 203032 2013 (400)$ -$ -$ -$ -$ -$ (400)$
Mitigation & Monitoring 210001 2013 (250)$ -$ -$ -$ -$ -$ (250)$
Land Acq 2011 & Vallone 211009 & 212015 2013 (711)$ -$ -$ -$ -$ -$ (711)$
Land Acq El Dorado 2014 (40)$ (260)$ -$ -$ -$ -$ (300)$
Alt Site Basis of Design 43473 2014 (20)$ (350)$ -$ -$ -$ -$ (370)$
Alt Site Design & Construction 2015 -$ (11,197)$ (2,494)$ -$ -$ -$ (13,691)$
Sunrise Reservoir Retaining Wall / Site Impr. 210026 2014 (450)$ (175)$ -$ -$ -$ -$ (625)$
Subtotal (25,057)$ (4,957)$ (12,492)$ (2,494)$ -$ -$ -$ (45,000)$ (19,943)$
Grants & Other FinancingCSC Ph 2 - OPS (Sale of Woodside Property) 205014 2015 (560)$ (52)$ (283)$ (1,823)$ -$ -$ -$ (2,717)$ (2,157)$
Ops - Security Gates, Cell Phone Revenues 2017 -$ -$ -$ (80)$ (83)$ (85)$ -$ (248)$ (248)$
Solar Energy Feasibility Study (CSC & WRF) 2014 -$ -$ (15)$ -$ -$ -$ -$ (15)$
WRF Demo Project - Grants 2014 -$ (1,500)$ (1,550)$ -$ -$ -$ -$ (3,050)$ (3,050)$
WRF Paving, SDG&E Contribution 2015 -$ -$ -$ (60)$ -$ -$ -$ (60)$ (60)$
Subtotal (560)$ (1,552)$ (1,848)$ (1,963)$ (83)$ (85)$ -$ (6,075)$ (5,530)$
Debt ServiceAMR Debt Service 207029 2020 1,759$ 704$ 704$ 704$ 704$ 704$ 1,759$ 7,037$ 3,519$
COP Debt Service (CIP Share) 2040 256$ 174$ 214$ 217$ 208$ 204$ 33,853$ 35,127$ 1,018$
Subtotal 2,015$ 878$ 917$ 921$ 912$ 908$ 35,612$ 42,164$ 4,537$
NET TOTAL 6,290$ 11,193$ 11,365$ 9,488$ 10,820$ 35,709$ 82,812$ 49,155$
TOTAL PROJECTS 11,921$ 24,615$ 14,900$ 8,658$ 9,997$ 97$ 91,723$ 70,092$
TOTAL FINANCING (6,509)$ (14,339)$ (4,457)$ (83)$ (85)$ -$ (51,075)$ (25,473)$
DEBT SERVICE 878$ 917$ 921$ 912$ 908$ 35,612$ 42,164$ 4,537$
NET 6,290$ 11,193$ 11,365$ 9,488$ 10,820$ 35,709$ 82,812$ 49,155$
rev 6/10/2013 page 4 of 5

YEAR 1 REVISED CIP BUDGET
PROJECT EXPENDITURES ($1,000s)
EXHIBIT C
Project and Phase
Job No. or
Work Order
Estimated
Completion
Cost to
6/30/12
Anticipated
12/13 13/14 14/15 15/16 16/17 Future Total
Total 5 Years
12/13 - 16/17
BELOW THE LINE - UNBUDGETED, EXTERNAL FINANCING REQUIREDCuyamaca/Carlton Oaks Interconn Upsize 2019 8$ -$ -$ -$ -$ 618$ 1,494$ 2,120$
Willowgrove Sewer, Phase 2 Constr 209006 2018 -$ -$ -$ -$ -$ -$ 959$ 959$ -$
WRF Ph 1 Design (incl IPS) 210014 2016 -$ -$ -$ 2,134$ 2,205$ -$ -$ 4,339$ 4,339$
WRF Ph 1 Constr (WRF & AWT) 210014 2018 -$ -$ -$ -$ -$ 25,279$ 26,113$ 51,392$ 25,279$
WRF Ph 1 Recycled Water Dist System 2018 -$ -$ -$ -$ -$ 882$ 912$ 1,794$ 882$
WRF Ph 1 Recycled Water Retrofit 2018 -$ -$ -$ -$ -$ 294$ 303$ 597$ 294$
Subtotal 8$ -$ -$ 2,134$ 2,205$ 27,073$ 29,781$ 61,201$ 31,412$
SRF FinancingCuyamaca/Carlton Oaks Interconnect 2019 -$ -$ -$ -$ -$ (618)$ (1,494)$ (2,112)$ (618)$
Willowgrove Sewer, Ph 2 Construction 209006 2018 -$ -$ -$ -$ -$ -$ (959)$ (959)$ -$
WRF Ph 1 Design (incl IPS) 210014 2016 -$ -$ -$ (2,134)$ (2,205)$ -$ -$ (4,339)$ (4,339)$
WRF Ph 1 Constr 210014 2018 -$ -$ -$ -$ -$ (25,279)$ (26,113)$ (51,392)$ (25,279)$
WRF Ph 1 Recycled Water Dist System 2018 -$ -$ -$ -$ -$ (882)$ (912)$ (1,794)$ (882)$
WRF Ph 1 Recycled Water Retrofit 2018 -$ -$ -$ -$ -$ (294)$ (303)$ (597)$ (294)$
Subtotal -$ -$ -$ (2,134)$ (2,205)$ (27,073)$ (29,781)$ (61,193)$ (31,412)$
Title 16 Grants WRF Ph 1 Design 2019 -$ -$ -$ -$ -$ -$ (1,000)$ (1,000)$ -$
WRF Ph 1 Constr. 2021 -$ -$ -$ -$ -$ -$ (11,100)$ (11,100)$ -$
WRF Ph 1 Recycled Water Dist Syst 2021 -$ -$ -$ -$ -$ -$ (129)$ (129)$ -$
WRF Ph 1 Recycled Water Retrofit 2021 -$ -$ -$ -$ -$ -$ (387)$ (387)$ -$
Subtotal -$ -$ -$ -$ -$ -$ (11,616)$ (11,616)$ -$
Debt ServiceCuyamaca/Carlton Oaks Interconnect 2040 -$ -$ -$ -$ -$ -$ 2,770$ 2,770$ -$
Willowgrove Sewer, Phase 2 209006 2040 -$ -$ -$ -$ -$ -$ 1,280$ 1,280$ -$
WRF Ph 1 Design (incl IPS) 210014 2038 -$ -$ -$ -$ -$ -$ 5,740$ 5,740$ -$
WRF Ph 1 Constr, 210014 2040 -$ -$ -$ -$ -$ -$ 67,960$ 67,960$ -$
WRF Ph 1 Recycled Water Dist System 2040 -$ -$ -$ -$ -$ -$ 2,380$ 2,380$ -$
WRF Ph 1 Recycled Water Retrofit 2040 -$ -$ -$ -$ -$ -$ 790$ 790$ -$
Subtotal -$ -$ -$ -$ -$ -$ 80,920$ 80,920$ -$
TOTAL BELOW THE LINE 8$ -$ -$ -$ -$ 0$ 69,304$ 69,312$ 0$
rev 6/10/2013 page 5 of 5

YEAR 1 REVISED CIP BUDGETFUTURE PROJECTS ($1,000s)
EXHIBIT C
Costs are present value based on April, 2013 ENR LA CCI of 10,289.18, an increase of 2% from the original 5 YBP.
ORIG. 5YBP
Project Name Job No.Total Project
BudgetCost to Date
6/30/13 Remaining 6/30/13 Remaining 6/30/12
FUTURE / BEYOND 5 YEARS - MOVE UP AS BUDGET ALLOWSCrest Pipeline Upsizes TBD $962 $0 $962 $944 $18Crest Reservoir #11, #12 Replacement (2 MG) 203020 $5,629 $39 $5,590 $5,483 $107East Victoria Interconnect (12-inch) D/P $468 $0 $468 $459 $9El Capitan Liner Replacement Project $19,754 $0 $19,754 $19,376 $379El Capitan Pipeline Purchase $612 $0 $612 $600 $12Engineering Data Access $51 $0 $51 $50 $1Galloway Valley Res. Inlet/Outlet Upsize $205 $0 $205 $201 $4Graves Ave Relief Sewer (10-, 12-, 15-in) $1,453 $0 $1,453 $1,425 $28Harbison Canyon Trans. Upgrade - Section 1 (14-in) 211001 $112 $18 $94 $92 $2I-8 Crossing - 30-in abandonment and replacement $2,393 $0 $2,393 $2,347 $46I-8 Crossing - Old Hwy 80/Blossom Valley Rd Parallel 8-in $801 $0 $801 $786 $15IPS Grinders $357 $0 $357 $350 $7Mountain View Pipeline Repl (12-in) 211002 $1,537 $34 $1,503 $1,474 $29Oak Creek Pump Station Upgrade (625 gpm) $172 $0 $172 $169 $3Ops - SCADA Upgrades IPS $382 $0 $382 $375 $7Ops - SCADA Upgrades Operations 2017 $1,020 $0 $1,020 $1,000 $20Ops - SCADA Upgrades WRF Hardware & PLC $382 $0 $382 $375 $7Quick Connect for Mobile Pump $12 $0 $12 $11 $0Reservoir Refurbishing - Future $2,557 $0 $2,557 $2,508 $49Undefined Replacement - Retail Water Mains (2015-2019) $733 $0 $733 $719 $14Undefined Replacement - Sewer Mains (2015-2019) $4,078 $0 $4,078 $4,000 $78Undefined Replacement - Sewer Pump Stations (2010-2014) $415 $0 $415 $407 $8Undefined Replacement - Sewer Pump Stations (2015-2019) $1,053 $0 $1,053 $1,033 $20Undefined Replacement - Water Pump Stations (2016-2020) $4,840 $0 $4,840 $4,747 $93Undefined Replacement - Water Pumps( 2016-2020) $315 $0 $315 $309 $6Urban Water Management Plan 2020 $102 $0 $102 $100 $2Vulnerability Assessment Implementation $2,150 $0 $2,150 $2,109 $41Water Pump Station Replacement (2011-2015) - El Capitan Booster PS $1,159 $0 $1,159 $1,136 $22Wholesale Res Seismic Actuator 210025 $274 $19 $255 $250 $5WRF NPDES Permit Renewal 2019 $260 $0 $260 $255 $5
Subtotal $54,238 $110 $54,127 $53,090 $1,037
FUTURE / BEYOND 10 YEARSADA - Alpine $35 $0 $35 $35 $1ADA - Operations $47 $0 $47 $46 $1ADA - WRF $60 $0 $60 $59 $1
YEAR 1 UPDATE
VARIANCE(inflation)
page 1 of 2

YEAR 1 REVISED CIP BUDGETFUTURE PROJECTS ($1,000s)
EXHIBIT C
ORIG. 5YBP
Project Name Job No.Total Project
BudgetCost to Date
6/30/13 Remaining 6/30/13 Remaining 6/30/12
YEAR 1 UPDATE
VARIANCE(inflation)
Alpine/Viejas Trans Main Extension (16-in) $624 $0 $624 $612 $12Bend St Sewer Relief $318 $0 $318 $312 $6East Mast/Riverford Relief Sewer (12- and 15-in) $3,257 $0 $3,257 $3,195 $62East Mission Gorge Interceptor Participation 204008 $7,223 $41 $7,182 $7,044 $138ESA Reliability - Alpine Heights Pump Station (1600 gpm) $2,512 $0 $2,512 $2,464 $48ESA Reliability - Alpine South Pump Station (1500 gpm) $2,915 $0 $2,915 $2,859 $56ESA Reliability - Alpine West Pump Station (5100 gpm) $5,331 $0 $5,331 $5,229 $102ESA Reliability - Alpine West Reservoir (2 MG) $5,605 $0 $5,605 $5,498 $107ESA Reliability - Alpine West Trans. Main (12- and 16-in) $349 $0 $349 $343 $7ESA Reliability - Harbison Canyon Trans. Upgrade - Section 2 (16-in) $1,172 $0 $1,172 $1,150 $22ESA Reliability - Mountain Top Interconnect (12-in) $2,773 $0 $2,773 $2,719 $53ESA Reliability - Rios Canyon Pump Station #2 Upgrade $1,037 $0 $1,037 $1,017 $20Flinn Springs Pump Station #3 Upgrade $2,006 $0 $2,006 $1,967 $38Magnolia Ave North Relief Sewer - Segment 2 $1,314 $0 $1,314 $1,289 $25Magnolia Ave South Relief Sewer - Segment 2 $2,111 $0 $2,111 $2,071 $40Mission Gorge Rd Relief Sewer (12-, 15-, 18-in) $1,298 $0 $1,298 $1,273 $25Oak Creek East Pump Station (1400 gpm) $0 $0 $0 $0 $0Oak Creek East Reservoir D/P (0.75 MG) $514 $0 $514 $504 $10Oak Creek East Reservoir Trans. Main D/P (12-in) $321 $0 $321 $315 $6Spanish Bit Reservoir North Loop (10-in) $337 $0 $337 $331 $6Sunrise Conversion to Recycled Water $336 $0 $336 $329 $6Undefined Repl - Recycled Water Pumps (2020-2024) $404 $0 $404 $396 $8Undefined Repl - Retail Water Mains (2020-2029) $1,460 $0 $1,460 $1,432 $28Undefined Repl - Sewer Mains (2020-2024) $11,407 $0 $11,407 $11,188 $219Undefined Repl - Water Pump Stations (2021-2025) $3,508 $0 $3,508 $3,441 $67Viejas Mtn South Res Expansion & Repl $2,177 $0 $2,177 $2,135 $42Woodrose/Woodpark Sewer Relief $2,347 $0 $2,347 $2,302 $45
Subtotal $62,799 $41 $62,758 $61,556 $1,203
TOTAL FUTURE $117,037 $151 $116,885 $114,645 $2,240
page 2 of 2


Padre Dam Municipal Water DistrictFive Year Plan Budget, Year 3
FY '13 - FY '17Combined Operations
Exhibit A
FY '13 FY '14 FY '15 FY '16 FY '17
Actual Forecast Budget Budget Budget
YEAR 1 YEAR 2 YEAR 3 YEAR 4 YEAR 5 TOTAL
Revenues:Water Sales 26,055,917$ 27,958,677$ 28,503,226$ 30,184,188$ 31,539,930$ 144,241,939$
Infrastructure Access Charge ("IAC) 819,467 835,350 849,576 862,776 862,776 4,229,945
Energy Billings 1,435,618 1,492,522 1,522,372 1,552,820 1,583,876 7,587,209
CWA/Metro Water Purchase Credits 337,441 331,455 331,455 331,455 331,455 1,663,262
Padre Dam Sewer Processing Revenue 1,959,038 2,056,989 2,159,839 2,267,831 2,381,222 10,824,919
Sewer Revenues 15,529,545 15,915,110 16,074,261 16,235,003 16,397,353 80,151,272
System Charges 7,515,126 7,866,103 8,243,678 8,636,815 9,045,691 41,307,413
Park Fees 4,692,526 4,776,169 4,800,000 4,846,859 4,965,628 24,081,182
Property Tax Subvention 2,612,562 2,663,246 2,689,879 2,716,778 2,743,945 13,426,410
Other Revenues 1,092,120 1,279,137 925,786 944,883 965,110 5,207,036
Total Operating Revenues 62,049,360 65,174,758 66,100,072 68,579,408 70,816,988 332,720,587
Direct Costs:Water Purchases 14,809,293 15,361,190 16,089,364 16,448,276 16,448,276 79,156,398
Infrastructure Access Charge ("IAC") 821,364 835,350 849,576 862,776 862,776 4,231,842
Energy Purchases 1,251,043 1,492,522 1,522,372 1,552,820 1,583,876 7,402,634
Sewer Metro Costs 3,964,591 3,782,940 3,540,940 3,540,940 3,540,940 18,370,351
Padre Dam Sewer Processing Fee 1,959,038 2,056,990 2,159,839 2,267,831 2,381,223 10,824,922
Fish Stocking 131,056 142,828 144,263 147,085 154,238 719,470
Park Purchases 163,053 144,836 144,836 144,836 144,836 742,397
Total Direct Costs 23,099,438 23,816,656 24,451,191 24,964,564 25,116,165 121,448,014
Revenues Available for Operating Expenses 38,949,922 41,358,102 41,648,881 43,614,844 45,700,823 211,272,573
Operating Expenses:Salary & Wages 11,128,337 11,238,747 11,692,242 12,224,356 12,674,782 58,958,464
Employee Benefits 6,673,559 6,613,171 7,135,915 7,804,209 8,769,859 36,996,713
Professional Services 1,141,340 2,444,436 3,367,608 2,960,177 2,779,329 12,692,890
Materials, Supplies, Vehicle & Building 3,760,782 4,089,194 5,457,837 5,435,914 5,576,154 24,319,881
Utilities 1,220,827 1,218,310 1,303,597 1,354,661 1,404,079 6,501,475
Administrative Expenses 1,034,503 1,110,292 1,654,808 1,653,297 1,666,670 7,119,571
Billing Credits (2,272,766) (3,056,770) (2,991,986) (2,991,282) (2,764,799) (14,077,604)
Operating Expenses before Depreciation 22,686,582 23,657,380 27,620,021 28,441,332 30,106,074 132,511,390
Depreciation and Amortization 6,653,192 6,929,300 7,973,264 8,432,431 8,735,659 38,723,846
Operating Income (Loss) 9,610,148 10,771,422 6,055,596 6,741,081 6,859,091 40,037,337
Non-Operating Activity:Interest Expense (2,980,215) (2,910,352) (2,812,962) (2,720,811) (2,607,290) (14,031,631)
Interest Income 129,189 145,470 150,339 142,411 147,897 715,307
Property Tax Debt - - - - - -
Gain (Loss) on Sale of Fixed Assets & Investmts (105,649) - - - - (105,649)
Other Income - - - - - -
Other Expenses - - - - - -
Total Non-Operating Activity (2,956,675) (2,764,882) (2,662,623) (2,578,400) (2,459,392) (13,421,973)
Revenues Over (Under) Expenses 6,653,474 8,006,539 3,392,973 4,162,680 4,399,698 26,615,364
Interest Income - CEF 145,241 128,464 117,734 92,292 65,253 548,983
Change in Net Assets 6,798,715$ 8,135,003$ 3,510,706$ 4,254,972$ 4,464,951$ 27,164,348$
Fund BalancesAdd:
Depreciation and Amortization 6,653,192 6,929,300 7,973,264 8,432,431 8,735,659 38,723,846
Change in Payables/Rec/ST Assets & Liab. (959,301) - - - - (959,301)
Capacity Fees 1,517,546 4,077,591 700,000 700,000 700,000 7,695,136
2009 COP Funds Receivable / (Payable) - - - - - -
2009 COP Transfers / Woodside 4,492,475 2,622,418 3,117,361 7,465,124 4,915,545 22,612,923
Financing (Grants, Woodside, Other) - 724,194 2,140,032 432,673 85,401 3,382,300
Contributed Capital 4,526,580 - - - - 4,526,580
Deduct: -
CIP (7,879,133) (9,669,677) (16,344,719) (17,077,753) (13,094,436) (64,065,717)
Capital Equipment (608,206) (1,363,092) (1,337,930) (1,206,494) (761,802) (5,277,525)
Debt Principal (2,608,648) (2,800,256) (2,896,806) (2,978,697) (2,759,659) (14,044,065)
Financing (Grants, Woodside, Other) (4,492,476) (2,622,418) (3,117,361) (7,465,124) (4,915,545) (22,612,924)
Transfers between CRF and CEF - - - - - -
Capitalization of Contributed Capital (3,640,865) - - - - (3,640,865)
Cash Generated (Used) 3,799,879 6,033,063 (6,255,452) (7,442,868) (2,629,886) (6,495,264)
Beginning Fund Balance 59,202,637 63,002,516 69,035,579 62,780,127 55,337,259 59,202,637 Ending Fund Balance 63,002,516$ 69,035,579$ 62,780,127$ 55,337,259$ 52,707,373$ 52,707,373$

Padre Dam Municipal Water DistrictFive Year Plan Budget, Year 3
FY '13 - FY '17Potable Water Operation
Exhibit A
FY '13 FY '14 FY '15 FY '16 FY '17
Actual Forecast Budget Budget Budget
YEAR 1 YEAR 2 YEAR 3 YEAR 4 YEAR 5 TOTAL
Revenues:Water Sales 24,320,190$ 26,113,383$ 26,545,971$ 28,114,883$ 29,380,289$ 134,474,717$
Infrastructure Access Charge ("IAC) 819,467 835,350 849,576 862,776 862,776 4,229,945
Energy Billings 1,435,618 1,492,522 1,522,372 1,552,820 1,583,876 7,587,209
CWA/Metro Water Purchase Credits - - - - - -
Padre Dam Sewer Processing Revenue - - - - - -
Sewer Revenues - - - - - -
System Charges 7,383,474 7,724,546 8,095,400 8,481,498 8,883,000 40,567,919
Park Fees - - - - - -
Property Tax Subvention 2,612,562 2,663,246 2,689,879 2,716,778 2,743,945 13,426,410
Other Revenues 1,077,126 1,264,137 910,786 929,883 950,110 5,132,042
Total Operating Revenues 37,648,437 40,093,185 40,613,985 42,658,638 44,403,997 205,418,242
Direct Costs:Water Purchases 14,809,293 15,361,190 16,089,364 16,448,276 16,448,276 79,156,398
Infrastructure Access Charge ("IAC") 821,364 835,350 849,576 862,776 862,776 4,231,842
Energy Purchases 1,251,043 1,492,522 1,522,372 1,552,820 1,583,876 7,402,634
Sewer Metro Costs - - - - - -
Padre Dam Sewer Processing Fee - - - - - -
Fish Stocking - - - - - -
Park Purchases - - - - - -
Total Direct Costs 16,881,700 17,689,062 18,461,312 18,863,871 18,894,928 90,790,874
Revenues Available for Operating Expenses 20,766,737 22,404,122 22,152,673 23,794,767 25,509,070 114,627,368
Operating Expenses:Salary & Wages 6,475,257 6,427,498 6,696,358 6,999,099 7,250,035 33,848,246
Employee Benefits 3,765,123 3,743,971 4,046,235 4,426,374 4,972,016 20,953,719
Professional Services 663,207 1,442,349 1,965,753 1,823,687 1,702,217 7,597,214
Materials, Supplies, Vehicle & Building 1,598,044 1,985,223 2,706,652 2,681,207 2,768,762 11,739,887
Utilities 95,603 90,404 100,117 103,750 107,399 497,272
Administrative Expenses 451,700 625,533 961,904 958,439 974,776 3,972,352
Billing Credits (1,352,239) (1,835,149) (1,796,693) (1,796,294) (1,660,124) (8,440,499)
Operating Expenses before Depreciation 11,696,694 12,479,830 14,680,326 15,196,260 16,115,081 70,168,192
Depreciation and Amortization 4,318,368 4,563,053 4,957,498 5,205,625 5,459,455 24,503,999
Operating Income (Loss) 4,751,674 5,361,239 2,514,848 3,392,881 3,934,534 19,955,177
Non-Operating Activity:Interest Expense (2,024,353) (2,009,340) (1,877,568) (1,809,963) (1,751,722) (9,472,945)
Interest Income 38,104 51,937 55,126 49,199 48,274 242,639
Property Tax Debt - - - - - -
Gain (Loss) on Sale of Fixed Assets & Investmts - - - - - -
Other Income - - - - - -
Other Expenses - - - - - -
Total Non-Operating Activity (1,986,249) (1,957,404) (1,822,442) (1,760,764) (1,703,448) (9,230,306)
Revenues Over (Under) Expenses 2,765,426 3,403,836 692,406 1,632,117 2,231,086 10,724,871
Interest Income - CEF - - - - - -
Change in Net Assets 2,765,426$ 3,403,836$ 692,406$ 1,632,117$ 2,231,086$ 10,724,871$
Fund BalancesAdd:
Depreciation and Amortization 4,318,368 4,563,053 4,957,498 5,205,625 5,459,455 24,503,999
Change in Payables/Rec/ST Assets & Liab. (754,169) - - - - (754,169)
Capacity Fees 666,500 1,849,418 379,534 379,534 379,534 3,654,520
2009 COP Funds Receivable / (Payable) - - - - - -
2009 COP Transfers / Woodside 3,860,413 2,275,945 1,604,800 4,568,656 3,008,314 15,318,127
Financing (Grants, Woodside, Other) - - - - - -
Contributed Capital 2,970,395 - - - - 2,970,395
Deduct: -
CIP (5,667,484) (5,348,761) (7,076,092) (9,739,685) (8,828,466) (36,660,488)
Capital Equipment (374,108) (296,071) (509,750) (176,539) (287,457) (1,643,925)
Debt Principal (1,364,701) (1,332,791) (1,377,825) (1,410,930) (1,423,215) (6,909,462)
Financing (Grants, Woodside, Other) - - - - - -
Transfers between CRF and CEF (948,807) (408,220) (1,334,768) (668,593) (859,651) (4,220,038)
Capitalization of Contributed Capital (2,450,900) - - - - (2,450,900)
Cash Generated (Used) 3,020,933 4,706,408 (2,664,197) (209,815) (320,399) 4,532,930
Beginning Fund Balance 7,359,064 10,379,997 15,086,405 12,422,208 12,212,393 7,359,064 Ending Fund Balance 10,379,997$ 15,086,405$ 12,422,208$ 12,212,393$ 11,891,994$ 11,891,994$

Padre Dam Municipal Water DistrictFive Year Plan Budget, Year 3
FY '13 - FY '17Recycled Water Operation
Exhibit A
FY '13 FY '14 FY '15 FY '16 FY '17
Actual Forecast Budget Budget Budget
YEAR 1 YEAR 2 YEAR 3 YEAR 4 YEAR 5 TOTAL
Revenues:Water Sales 1,735,727$ 1,845,294$ 1,957,255$ 2,069,305$ 2,159,641$ 9,767,221$
Infrastructure Access Charge ("IAC) - - - - - -
Energy Billings - - - - - -
CWA/Metro Water Purchase Credits 337,441 331,455 331,455 331,455 331,455 1,663,262
Padre Dam Sewer Processing Revenue 1,959,038 2,056,989 2,159,839 2,267,831 2,381,222 10,824,919
Sewer Revenues - - - - - -
System Charges 131,652 141,557 148,278 155,316 162,691 739,495
Park Fees - - - - - -
Property Tax Subvention - - - - - -
Other Revenues - - - - - -
Total Operating Revenues 4,163,858 4,375,295 4,596,827 4,823,908 5,035,009 22,994,897
Direct Costs:Water Purchases - - - - - -
Infrastructure Access Charge ("IAC") - - - - - -
Energy Purchases - - - - - -
Sewer Metro Costs - - - - - -
Padre Dam Sewer Processing Fee - - - - - -
Fish Stocking - - - - - -
Park Purchases - - - - - -
Total Direct Costs - - - - - -
Revenues Available for Operating Expenses 4,163,858 4,375,295 4,596,827 4,823,908 5,035,009 22,994,897
Operating Expenses:Salary & Wages 831,152 916,747 955,095 998,274 1,034,065 4,735,334
Employee Benefits 505,361 515,575 557,199 609,548 684,687 2,872,370
Professional Services 44,227 99,871 136,113 126,276 117,865 524,353
Materials, Supplies, Vehicle & Building 248,188 241,912 329,822 326,722 337,391 1,484,034
Utilities 161,033 162,888 180,387 186,933 193,508 884,748
Administrative Expenses 66,873 65,841 101,245 100,880 102,600 437,439
Billing Credits (191,435) (266,291) (260,694) (260,627) (240,847) (1,219,894)
Operating Expenses before Depreciation 1,665,398 1,736,543 1,999,168 2,088,006 2,229,269 9,718,383
Depreciation and Amortization 636,548 641,231 840,450 893,055 922,437 3,933,721
Operating Income (Loss) 1,861,912 1,997,521 1,757,209 1,842,847 1,883,304 9,342,793
Non-Operating Activity:Interest Expense (153,384) (132,243) (108,407) (83,029) (55,501) (532,563)
Interest Income 28,077 28,472 27,865 27,466 30,174 142,053
Property Tax Debt - - - - - -
Gain (Loss) on Sale of Fixed Assets & Investmts - - - - - -
Other Income - - - - - -
Other Expenses - - - - - -
Total Non-Operating Activity (125,307) (103,771) (80,542) (55,563) (25,327) (390,510)
Revenues Over (Under) Expenses 1,736,605 1,893,750 1,676,667 1,787,284 1,857,977 8,952,283
Interest Income - CEF - - - - - -
Change in Net Assets 1,736,605$ 1,893,750$ 1,676,667$ 1,787,284$ 1,857,977$ 8,952,283$
Fund BalancesAdd:
Depreciation and Amortization 636,548 641,231 840,450 893,055 922,437 3,933,721
Change in Payables/Rec/ST Assets & Liab. (12,852) - - - - (12,852)
Capacity Fees - - - - - -
2009 COP Funds Receivable / (Payable) - - - - - -
2009 COP Transfers / Woodside 12,553 18,915 226,751 - - 258,219
Financing (Grants, Woodside, Other) - 650,000 2,000,000 350,000 - 3,000,000
Contributed Capital 1,547 - - - - 1,547
Deduct: -
CIP (125,299) (733,191) (893,372) (594,017) (110,341) (2,456,219)
Capital Equipment (54,843) (355,774) (531,557) (447,213) (358,078) (1,747,466)
Debt Principal (807,565) (778,674) (801,890) (825,664) (666,346) (3,880,138)
Financing (Grants, Woodside, Other) - - - - - -
Transfers between CRF and CEF (407,080) (272,146) (889,845) (445,729) (573,100) (2,587,901)
Capitalization of Contributed Capital 4,441 - - - - 4,441
Cash Generated (Used) 984,055 1,064,112 1,627,204 717,716 1,072,548 5,465,635
Beginning Fund Balance 5,753,979 6,738,034 7,802,146 9,429,350 10,147,066 5,753,979 Ending Fund Balance 6,738,034$ 7,802,146$ 9,429,350$ 10,147,066$ 11,219,614$ 11,219,614$

Padre Dam Municipal Water DistrictFive Year Plan Budget, Year 3
FY '13 - FY '17Sewer Operation
Exhibit A
FY '13 FY '14 FY '15 FY '16 FY '17
Actual Forecast Budget Budget Budget
YEAR 1 YEAR 2 YEAR 3 YEAR 4 YEAR 5 TOTAL
Revenues:Water Sales -$ -$ -$ -$ -$ -$
Infrastructure Access Charge ("IAC) - - - - - -
Energy Billings - - - - - -
CWA/Metro Water Purchase Credits - - - - - -
Padre Dam Sewer Processing Revenue - - - - - -
Sewer Revenues 15,529,545 15,915,110 16,074,261 16,235,003 16,397,353 80,151,272
System Charges - - - - - -
Park Fees - - - - - -
Property Tax Subvention - - - - - -
Other Revenues 14,617 15,000 15,000 15,000 15,000 74,617
Total Operating Revenues 15,544,162 15,930,110 16,089,261 16,250,003 16,412,353 80,225,889
Direct Costs:Water Purchases - - - - - -
Infrastructure Access Charge ("IAC") - - - - - -
Energy Purchases - - - - - -
Sewer Metro Costs 3,964,591 3,782,940 3,540,940 3,540,940 3,540,940 18,370,351
Padre Dam Sewer Processing Fee 1,959,038 2,056,990 2,159,839 2,267,831 2,381,223 10,824,922
Fish Stocking - - - - - -
Park Purchases - - - - - -
Total Direct Costs 5,923,629 5,839,930 5,700,779 5,808,771 5,922,163 29,195,273
Revenues Available for Operating Expenses 9,620,533 10,090,180 10,388,481 10,441,232 10,490,190 51,030,616
Operating Expenses:Salary & Wages 2,866,814 2,921,683 3,043,896 3,181,510 3,295,576 15,309,480
Employee Benefits 1,847,688 1,792,410 1,937,118 2,119,108 2,380,332 10,076,656
Professional Services 264,583 600,943 819,015 759,824 709,215 3,153,581
Materials, Supplies, Vehicle & Building 1,283,505 1,289,024 1,757,454 1,740,932 1,797,783 7,868,698
Utilities 395,055 412,915 457,275 473,869 490,536 2,229,651
Administrative Expenses 368,331 272,713 419,360 417,849 424,972 1,903,225
Billing Credits (713,820) (949,556) (929,599) (929,361) (858,829) (4,381,165)
Operating Expenses before Depreciation 6,312,157 6,340,132 7,504,519 7,763,732 8,239,584 36,160,125
Depreciation and Amortization 963,001 975,364 1,348,135 1,494,381 1,510,270 6,291,150
Operating Income (Loss) 2,345,376 2,774,683 1,535,827 1,183,119 740,336 8,579,341
Non-Operating Activity:Interest Expense (46,140) (37,322) (27,758) (17,906) (7,287) (136,414)
Interest Income 56,255 57,868 59,611 57,068 60,195 290,997
Property Tax Debt - - - - - -
Gain (Loss) on Sale of Fixed Assets & Investmts - - - - - -
Other Income - - - - - -
Other Expenses - - - - - -
Total Non-Operating Activity 10,115 20,546 31,853 39,161 52,909 154,584
Revenues Over (Under) Expenses 2,355,491 2,795,229 1,567,680 1,222,281 793,244 8,733,925
Interest Income - CEF - - - - - -
Change in Net Assets 2,355,491$ 2,795,229$ 1,567,680$ 1,222,281$ 793,244$ 8,733,925$
Fund BalancesAdd:
Depreciation and Amortization 963,001 975,364 1,348,135 1,494,381 1,510,270 6,291,150
Change in Payables/Rec/ST Assets & Liab. (364,145) - - - - (364,145)
Capacity Fees 329,414 805,818 210,097 210,097 210,097 1,765,523
2009 COP Funds Receivable / (Payable) - - - - - -
2009 COP Transfers / Woodside 42,006 74,893 897,810 - - 1,014,709
Financing (Grants, Woodside, Other) - - - - - -
Contributed Capital 1,294,137 - - - - 1,294,137
Deduct: -
CIP (598,433) (1,916,353) (4,623,728) (2,200,991) (647,746) (9,987,250)
Capital Equipment (148,207) (482,572) (229,123) (487,742) (48,767) (1,396,411)
Debt Principal (332,086) (318,891) (328,455) (338,307) (252,242) (1,569,981)
Financing (Grants, Woodside, Other) - - - - - -
Transfers between CRF and CEF - - - - - -
Capitalization of Contributed Capital (1,196,004) - - - - (1,196,004)
Cash Generated (Used) 2,345,174 1,933,488 (1,157,584) (100,281) 1,564,856 4,585,653
Beginning Fund Balance 10,553,004 12,898,178 14,831,666 13,674,082 13,573,801 10,553,004 Ending Fund Balance 12,898,178$ 14,831,666$ 13,674,082$ 13,573,801$ 15,138,657$ 15,138,657$

Padre Dam Municipal Water DistrictFive Year Plan Budget, Year 3
FY '13 - FY '17Park Operations
Exhibit A
FY '13 FY '14 FY '15 FY '16 FY '17
Actual Forecast Budget Budget Budget
YEAR 1 YEAR 2 YEAR 3 YEAR 4 YEAR 5 TOTAL
Revenues:Water Sales -$ -$ -$ -$ -$ -$
Infrastructure Access Charge ("IAC) - - - - - -
Energy Billings - - - - - -
CWA/Metro Water Purchase Credits - - - - - -
Padre Dam Sewer Processing Revenue - - - - - -
Sewer Revenues - - - - - -
System Charges - - - - - -
Park Fees 4,692,526 4,776,169 4,800,000 4,846,859 4,965,628 24,081,182
Property Tax Subvention - - - - - -
Other Revenues 377 - - - - 377
Total Operating Revenues 4,692,903 4,776,169 4,800,000 4,846,859 4,965,628 24,081,559
Direct Costs:Water Purchases - - - - - -
Infrastructure Access Charge ("IAC") - - - - - -
Energy Purchases - - - - - -
Sewer Metro Costs - - - - - -
Padre Dam Sewer Processing Fee - - - - - -
Fish Stocking 131,056 142,828 144,263 147,085 154,238 719,470
Park Purchases 163,053 144,836 144,836 144,836 144,836 742,397
Total Direct Costs 294,109 287,664 289,099 291,921 299,074 1,461,867
Revenues Available for Operating Expenses 4,398,794 4,488,505 4,510,901 4,554,938 4,666,554 22,619,692
Operating Expenses:Salary & Wages 955,114 972,819 996,893 1,045,473 1,095,107 5,065,405
Employee Benefits 555,387 561,215 595,362 649,179 732,825 3,093,968
Professional Services 169,323 301,272 446,726 250,390 250,031 1,417,743
Materials, Supplies, Vehicle & Building 631,045 573,035 663,909 687,054 672,219 3,227,262
Utilities 569,136 552,103 565,819 590,109 612,637 2,889,803
Administrative Expenses 147,599 146,206 172,298 176,129 164,322 806,555
Billing Credits (15,272) (5,774) (5,000) (5,000) (5,000) (36,046)
Operating Expenses before Depreciation 3,012,333 3,100,875 3,436,008 3,393,335 3,522,140 16,464,690
Depreciation and Amortization 735,275 746,389 823,399 835,419 839,545 3,980,028
Operating Income (Loss) 651,186 641,241 251,494 326,185 304,869 2,174,974
Non-Operating Activity:Interest Expense (242,854) (211,809) (197,615) (182,568) (166,615) (1,001,460)
Interest Income 6,754 7,193 7,737 8,679 9,254 39,617
Property Tax Debt - - - - - -
Gain (Loss) on Sale of Fixed Assets & Investmts - - - - - -
Other Income - - - - - -
Other Expenses - - - - - -
Total Non-Operating Activity (236,100) (204,615) (189,878) (173,889) (157,361) (961,844)
Revenues Over (Under) Expenses 415,086 436,626 61,616 152,296 147,507 1,213,131
Interest Income - CEF - - - - - -
Change in Net Assets 415,086$ 436,626$ 61,616$ 152,296$ 147,507$ 1,213,131$
Fund BalancesAdd:
Depreciation and Amortization 735,275 746,389 823,399 835,419 839,545 3,980,028
Change in Payables/Rec/ST Assets & Liab. - - - - - -
Capacity Fees - - - - - -
2009 COP Funds Receivable / (Payable) - - - - - -
2009 COP Transfers / Woodside - - - - - -
Financing (Grants, Woodside, Other) - 58,699 - - - 58,699
Contributed Capital 260,501 - - - - 260,501
Deduct: -
CIP (425,869) (555,130) (292,483) (215,000) (541,118) (2,029,599)
Capital Equipment (31,048) (228,675) (67,500) (95,000) (67,500) (489,723)
Debt Principal (333,190) (346,700) (360,390) (374,291) (388,351) (1,802,921)
Financing (Grants, Woodside, Other) - - - - - -
Transfers between CRF and CEF - - - - - -
Capitalization of Contributed Capital 1,598 - - - - 1,598
Cash Generated (Used) 622,354 111,209 164,642 303,424 (9,916) 1,191,713
Beginning Fund Balance 1,050,630 1,672,984 1,784,193 1,948,835 2,252,259 1,050,630 Ending Fund Balance 1,672,984$ 1,784,193$ 1,948,835$ 2,252,259$ 2,242,343$ 2,242,343$

Padre Dam Municipal Water DistrictFive Year Plan Budget, Year 3
FY '13 - FY '17CEF and Other Restricted Funds
Exhibit A
FY '13 FY '14 FY '15 FY '16 FY '17
Actual Forecast Budget Budget Budget
YEAR 1 YEAR 2 YEAR 3 YEAR 4 YEAR 5 TOTAL
Revenues:Water Sales -$ -$ -$ -$ -$ -$
Infrastructure Access Charge ("IAC) - - - - - -
Energy Billings - - - - - -
CWA/Metro Water Purchase Credits - - - - - -
Padre Dam Sewer Processing Revenue - - - - - -
Sewer Revenues - - - - - -
System Charges - - - - - -
Park Fees - - - - - -
Property Tax Subvention - - - - - -
Other Revenues - - - - - -
Total Operating Revenues - - - - - -
Direct Costs:Water Purchases - - - - - -
Infrastructure Access Charge ("IAC") - - - - - -
Energy Purchases - - - - - -
Sewer Metro Costs - - - - - -
Padre Dam Sewer Processing Fee - - - - - -
Fish Stocking - - - - - -
Park Purchases - - - - - -
Total Direct Costs - - - - - -
Revenues Available for Operating Expenses - - - - - -
Operating Expenses:Salary & Wages - - - - - -
Employee Benefits - - - - - -
Professional Services - - - - - -
Materials, Supplies, Vehicle & Building - - - - - -
Utilities - - - - - -
Administrative Expenses - - - - - -
Billing Credits - - - - - -
Operating Expenses before Depreciation - - - - - -
Depreciation and Amortization - 3,262 3,783 3,952 3,952 14,948
Operating Income (Loss) - (3,262) (3,783) (3,952) (3,952) (14,948)
Non-Operating Activity:Interest Expense (513,485) (519,638) (601,614) (627,345) (626,165) (2,888,248)
Interest Income - - - - - -
Property Tax Debt - - - - - -
Gain (Loss) on Sale of Fixed Assets & Investmts (105,649) - - - - (105,649)
Other Income - - - - - -
Other Expenses - - - - - -
Total Non-Operating Activity (619,134) (519,638) (601,614) (627,345) (626,165) (2,993,897)
Revenues Over (Under) Expenses (619,134) (522,901) (605,397) (631,297) (630,117) (3,008,846)
Interest Income - CEF 145,241 128,464 117,734 92,292 65,253 548,983
Change in Net Assets (473,893)$ (394,437)$ (487,663)$ (539,005)$ (564,864)$ (2,459,862)$
Fund BalancesAdd:
Depreciation and Amortization - 3,262 3,783 3,952 3,952 14,948
Change in Payables/Rec/ST Assets & Liab. 171,865 - - - - 171,865
Capacity Fees 521,632 1,422,355 110,369 110,369 110,369 2,275,093
2009 COP Funds Receivable / (Payable) - - - - - -
2009 COP Transfers / Woodside 577,503 252,665 388,000 2,896,468 1,907,231 6,021,868
Financing (Grants, Woodside, Other) - 15,495 140,032 82,673 85,401 323,601
Contributed Capital - - - - - -
Deduct: -
CIP (1,062,048) (1,116,243) (3,459,045) (4,328,061) (2,966,765) (12,932,161)
Capital Equipment - - - - - -
Debt Principal 228,893 (23,200) (28,245) (29,505) (29,505) 118,438
Financing (Grants, Woodside, Other) (4,492,476) (2,622,418) (3,117,361) (7,465,124) (4,915,545) (22,612,924)
Transfers between CRF and CEF 1,355,887 680,366 2,224,613 1,114,322 1,432,751 6,807,939
Capitalization of Contributed Capital - - - - - -
Cash Generated (Used) (3,172,637) (1,782,155) (4,225,517) (8,153,911) (4,936,975) (22,271,195)
Beginning Fund Balance 34,485,960 31,313,323 29,531,169 25,305,651 17,151,740 34,485,960 Ending Fund Balance 31,313,323$ 29,531,169$ 25,305,651$ 17,151,740$ 12,214,765$ 12,214,765$

ACTUAL FORECAST BUDGET BUDGET BUDGET 5-YEARADMINISTRATION YEAR 1 YEAR 2 YEAR 3 YEAR 4 YEAR 5 TOTALSSalary and Wages 529,925$ 575,167$ 613,745$ 641,366$ 667,665$ 3,027,867$ Employee Benefits 312,245 308,564 368,712 399,772 453,827 1,843,118 Professional Services 95,773 142,711 303,776 254,714 283,959 1,080,934 Materials and Supplies 47,135 51,475 86,121 64,915 74,201 323,847 Administrative Expenses 139,190 152,134 199,265 184,825 201,486 876,900 Utilities 115,545 112,842 124,536 131,774 139,366 624,062 Billing Credits (15,333) (3,817) - - - (19,150)
Total Expenditures 1,224,480$ 1,339,076$ 1,696,155$ 1,677,365$ 1,820,503$ 7,757,578$
FINANCE YEAR 1 YEAR 2 YEAR 3 YEAR 4 YEAR 5 TOTALSSalary and Wages 1,607,796$ 1,675,076$ 1,692,499$ 1,776,662$ 1,861,228$ 8,613,261$ Employee Benefits 922,416 948,475 1,012,975 1,104,285 1,250,714 5,238,865 Professional Services 145,119 252,834 570,532 473,513 572,025 2,014,024 Materials and Supplies 180,015 316,722 586,727 549,366 620,585 2,253,415 Administrative Expenses 183,913 241,016 349,011 356,735 351,141 1,481,815 Utilities 22,366 30,713 24,024 24,311 24,614 126,028 Billing Credits (22,872) (538,752) (253,200) (206,400) (206,400) (1,227,624)
Total Expenditures 3,038,753$ 2,926,084$ 3,982,568$ 4,078,472$ 4,473,908$ 18,499,784$
HUMAN RESOURCES YEAR 1 YEAR 2 YEAR 3 YEAR 4 YEAR 5 TOTALSSalary and Wages 314,942$ 296,521$ 308,452$ 323,269$ 337,929$ 1,581,113$ Employee Benefits 270,337 181,776 188,304 205,101 232,182 1,077,699 Professional Services 27,565 67,906 63,238 59,484 66,441 284,635 Materials and Supplies 36,194 26,998 37,408 37,624 35,132 173,357 Administrative Expenses 295,280 304,933 352,448 339,494 365,317 1,657,472 Utilities 2,115 2,149 1,992 1,992 1,992 10,240 Billing Credits (1,066) (7,775) - - - (8,841)
Total Expenditures 945,367$ 872,510$ 951,843$ 966,964$ 1,038,993$ 4,775,676$
ENGINEERING YEAR 1 YEAR 2 YEAR 3 YEAR 4 YEAR 5 TOTALSSalary and Wages 1,688,364$ 1,756,107$ 1,732,076$ 1,836,562$ 1,809,867$ 8,822,976$ Employee Benefits 833,476 864,569 900,581 1,009,328 1,086,189 4,694,143 Professional Services 371,878 1,296,379 1,601,791 1,580,152 1,247,948 6,098,146 Materials and Supplies 153,750 137,155 116,849 107,278 107,712 622,744 Administrative Expenses 33,591 35,437 61,879 61,269 62,088 254,264 Utilities 5,765 7,112 9,596 10,016 10,436 42,925 Billing Credits (777,634) (850,677) (972,664) (967,585) (801,444) (4,370,004)
Total Expenditures 2,309,190$ 3,246,082$ 3,450,107$ 3,637,020$ 3,522,795$ 16,165,195$
OPERATIONS YEAR 1 YEAR 2 YEAR 3 YEAR 4 YEAR 5 TOTALSSalary and Wages 6,093,394$ 6,027,328$ 6,416,158$ 6,671,963$ 6,977,182$ 32,186,024$ Employee Benefits 3,817,981 3,782,302 4,106,094 4,475,882 5,058,833 21,241,093 Professional Services 334,546 387,823 390,005 348,468 365,935 1,826,776 Materials and Supplies 2,715,027 2,985,680 3,969,927 3,991,680 4,068,365 17,730,679 Administrative Expenses 238,625 234,012 524,346 539,160 527,013 2,063,157 Utilities 511,717 519,049 583,841 603,040 621,988 2,839,635 Billing Credits (1,440,609) (1,650,000) (1,760,320) (1,811,434) (1,751,002) (8,413,366)
Total Expenditures 12,270,681$ 12,286,194$ 14,230,051$ 14,818,758$ 15,868,313$ 69,473,998$
PARK YEAR 1 YEAR 2 YEAR 3 YEAR 4 YEAR 5 TOTALSSalary and Wages 893,921$ 908,547$ 929,312$ 974,535$ 1,020,912$ 4,727,227$ Employee Benefits 517,109 526,881 558,596 609,125 687,311 2,899,021 Professional Services 166,464 296,782 438,267 243,847 243,021 1,388,381 Materials and Supplies 628,662 571,164 660,805 685,051 670,159 3,215,840 Administrative Expenses 143,906 142,664 167,710 171,667 159,476 785,422 Utilities 563,322 546,444 559,608 583,528 605,684 2,858,586 Billing Credits (15,272) (5,047) (5,000) (5,000) (5,000) (35,319)
Total Expenditures 2,898,111$ 2,987,435$ 3,309,298$ 3,262,753$ 3,381,562$ 15,839,158$
PADRE DAM MUNICIPAL WATER DISTRICTDEPARTMENTAL BUDGET SUMMARIES
FIVE YEAR PLAN, REFORECASTED YEAR 3
Exhibit A

Salary & Employee Professional Materials & Admin. Billing Year 1
Department Wages Benefits Services Supplies Expenses Utilities Credits Total Percent
Administration 529,925$ 312,245$ 95,773$ 47,135$ 139,190$ 115,545$ (15,333)$ 1,224,480$ 5.4%Finance 1,607,796 922,416 145,119 180,015 183,913 22,366 (22,872) 3,038,753 13.4%Human Resources 314,942 270,337 27,565 36,194 295,280 2,115 (1,066) 945,367 4.2%Engineering 1,688,364 833,476 371,878 153,750 33,591 5,765 (777,634) 2,309,190 10.2%Operations 6,093,394 3,817,981 334,546 2,715,027 238,625 511,717 (1,440,609) 12,270,681 54.1%Park 893,921 517,109 166,464 628,662 143,906 563,322 (15,272) 2,898,111 12.8%Total 11,128,343$ 6,673,563$ 1,141,345$ 3,760,783$ 1,034,505$ 1,220,829$ (2,272,786)$ 22,686,582$ 100.0%
Salary & Employee Professional Materials & Admin. Billing Year 1
Division Wages Benefits Services Supplies Expenses Utilities Credits Total Percent
Retail Water 6,475,257$ 3,765,123$ 663,207$ 1,598,044$ 451,700$ 95,603$ (1,352,239)$ 11,696,694$ 51.6%Water Recycling 831,152 505,361 44,227 248,188 66,873 161,033 (191,435) 1,665,398 7.3%Sewer 2,866,814 1,847,688 264,583 1,283,505 368,331 395,055 (713,820) 6,312,157 27.8%Park 955,114 555,387 169,323 631,045 147,599 569,136 (15,271) 3,012,333 13.3%Total 555,387$ 6,673,559$ 1,141,340$ 3,760,782$ 1,034,503$ 1,220,827$ (2,272,765)$ 22,686,582$ 100.0%
PADRE DAM MUNICIPAL WATER DISTRICTDEPARTMENTAL ALLOCATIONS TO DIVISION BUDGETS
FY 13, ACTUAL
Exhibit A

Salary & Employee Professional Materials & Admin. Billing Year 2
Department Wages Benefits Services Supplies Expenses Utilities Credits Total Percent
Administration 575,167$ 308,564$ 142,711$ 51,475$ 152,134$ 112,842$ (3,817)$ 1,339,076$ 5.7%Finance 1,675,076 948,475 252,834 316,722 241,016 30,713 (538,752) 2,926,084 12.4%Human Resources 296,521 181,776 67,906 26,998 304,933 2,149 (7,775) 872,510 3.7%Engineering 1,756,107 864,569 1,296,379 137,155 35,437 7,112 (850,677) 3,246,082 13.7%Operations 6,027,328 3,782,302 387,823 2,985,680 234,012 519,049 (1,650,000) 12,286,194 51.9%Park 908,547 526,881 296,782 571,164 142,664 546,444 (5,047) 2,987,435 12.6%Total 11,238,747$ 6,612,566$ 2,444,436$ 4,089,194$ 1,110,196$ 1,218,310$ (3,056,068)$ 23,657,381$ 100.0%
0
Salary & Employee Professional Materials & Admin. Billing Year 2
Division Wages Benefits Services Supplies Expenses Utilities Credits Total Percent
Retail Water 6,427,498$ 3,743,971$ 1,442,349$ 1,985,223$ 625,533$ 90,404$ (1,835,149)$ 12,479,830$ 52.8%Water Recycling 916,747 515,575 99,871 241,912 65,841 162,888 (266,291) 1,736,543 7.3%Sewer 2,921,683 1,792,410 600,943 1,289,024 272,713 412,915 (949,556) 6,340,132 26.8%Park 972,819 561,215 301,272 573,035 146,206 552,103 (5,774) 3,100,875 13.1%Total 11,238,747$ 6,613,171$ 2,444,436$ 4,089,194$ 1,110,292$ 1,218,310$ (3,056,770)$ 23,657,380$ 100.0%
PADRE DAM MUNICIPAL WATER DISTRICTDEPARTMENTAL ALLOCATIONS TO DIVISION BUDGETS
FY 14, PROJECTED
Exhibit A

Salary & Employee Professional Materials & Admin. Billing Year 3
Department Wages Benefits Services Supplies Expenses Utilities Credits Total Percent
Administration 613,745$ 368,712$ 303,776$ 86,121$ 199,265$ 124,536$ -$ 1,696,155$ 6.1%Finance 1,692,499 1,012,975 570,532 586,727 349,011 24,024 (253,200) 3,982,568 14.4%Human Resources 308,452 188,304 63,238 37,408 352,448 1,992 - 951,843 3.4%Engineering 1,732,076 900,581 1,601,791 116,849 61,879 9,596 (972,664) 3,450,107 12.5%Operations 6,416,158 4,106,094 390,005 3,969,927 524,346 583,841 (1,760,320) 14,230,051 51.5%Park 929,312 558,596 438,267 660,805 167,710 559,608 (5,000) 3,309,298 12.0%Total 11,692,242$ 7,135,261$ 3,367,608$ 5,457,837$ 1,654,660$ 1,303,597$ (2,991,184)$ 27,620,021$ 100.0%
(0)
Salary & Employee Professional Materials & Admin. Billing Year 3
Division Wages Benefits Services Supplies Expenses Utilities Credits Total Percent
Retail Water 6,696,358$ 4,046,235$ 1,965,753$ 2,706,652$ 961,904$ 100,117$ (1,796,693)$ 14,680,326$ 53.2%Water Recycling 955,095 557,199 136,113 329,822 101,245 180,387 (260,694) 1,999,168 7.2%Sewer 3,043,896 1,937,118 819,015 1,757,454 419,360 457,275 (929,599) 7,504,519 27.2%Park 996,893 595,362 446,726 663,909 172,298 565,819 (5,000) 3,436,008 12.4%Total 11,692,242$ 7,135,915$ 3,367,608$ 5,457,837$ 1,654,808$ 1,303,597$ (2,991,986)$ 27,620,021$ 100.0%
PADRE DAM MUNICIPAL WATER DISTRICTDEPARTMENTAL ALLOCATIONS TO DIVISION BUDGETS
FY 15, REFORECAST
Exhibit A

Salary & Employee Professional Materials & Admin. Billing Year 4
Department Wages Benefits Services Supplies Expenses Utilities Credits Total Percent
Administration 641,366$ 399,772$ 254,714$ 64,915$ 184,825$ 131,774$ -$ 1,677,365$ 5.9%Finance 1,776,662 1,104,285 473,513 549,366 356,735 24,311 (206,400) 4,078,472 14.3%Human Resources 323,269 205,101 59,484 37,624 339,494 1,992 - 966,964 3.4%Engineering 1,836,562 1,009,328 1,580,152 107,278 61,269 10,016 (967,585) 3,637,020 12.8%Operations 6,671,963 4,475,882 348,468 3,991,680 539,160 603,040 (1,811,434) 14,818,758 52.1%Park 974,535 609,125 243,847 685,051 171,667 583,528 (5,000) 3,262,753 11.5%Total 12,224,356$ 7,803,494$ 2,960,177$ 5,435,914$ 1,653,150$ 1,354,661$ (2,990,419)$ 28,441,332$ 100.0%
(0)
Salary & Employee Professional Materials & Admin. Billing Year 4
Division Wages Benefits Services Supplies Expenses Utilities Credits Total Percent
Retail Water 6,999,099$ 4,426,374$ 1,823,687$ 2,681,207$ 958,439$ 103,750$ (1,796,294)$ 15,196,260$ 53.4%Water Recycling 998,274 609,548 126,276 326,722 100,880 186,933 (260,627) 2,088,006 7.3%Sewer 3,181,510 2,119,108 759,824 1,740,932 417,849 473,869 (929,361) 7,763,732 27.3%Park 1,045,473 649,179 250,390 687,054 176,129 590,109 (5,000) 3,393,335 11.9%Total 12,224,356$ 7,804,209$ 2,960,177$ 5,435,914$ 1,653,297$ 1,354,661$ (2,991,282)$ 28,441,332$ 100.0%
PADRE DAM MUNICIPAL WATER DISTRICTDEPARTMENTAL ALLOCATIONS TO DIVISION BUDGETS
FY 16, REFORECAST
Exhibit A

Salary & Employee Professional Materials & Admin. Billing Year 5
Department Wages Benefits Services Supplies Expenses Utilities Credits Total Percent
Administration 667,665$ 453,827$ 283,959$ 74,201$ 201,486$ 139,366$ -$ 1,820,503$ 6.0%Finance 1,861,228 1,250,714 572,025 620,585 351,141 24,614 (206,400) 4,473,908 14.9%Human Resources 337,929 232,182 66,441 35,132 365,317 1,992 - 1,038,993 3.5%Engineering 1,809,867 1,086,189 1,247,948 107,712 62,088 10,436 (801,444) 3,522,795 11.7%Operations 6,977,182 5,058,833 365,935 4,068,365 527,013 621,988 (1,751,002) 15,868,313 52.7%Park 1,020,912 687,311 243,021 670,159 159,476 605,684 (5,000) 3,381,562 11.2%Total 12,674,782$ 8,769,055$ 2,779,329$ 5,576,154$ 1,666,520$ 1,404,079$ (2,763,845)$ 30,106,074$ 100.0%
0
Salary & Employee Professional Materials & Admin. Billing Year 5
Division Wages Benefits Services Supplies Expenses Utilities Credits Total Percent
Retail Water 7,250,035$ 4,972,016$ 1,702,217$ 2,768,762$ 974,776$ 107,399$ (1,660,124)$ 16,115,081$ 53.5%Water Recycling 1,034,065 684,687 117,865 337,391 102,600 193,508 (240,847) 2,229,269 7.4%Sewer 3,295,576 2,380,332 709,215 1,797,783 424,972 490,536 (858,829) 8,239,584 27.4%Park 1,095,107 732,825 250,031 672,219 164,322 612,637 (5,000) 3,522,140 11.7%Total 12,674,782$ 8,769,859$ 2,779,329$ 5,576,154$ 1,666,670$ 1,404,079$ (2,764,799)$ 30,106,074$ 100.0%
PADRE DAM MUNICIPAL WATER DISTRICTDEPARTMENTAL ALLOCATIONS TO DIVISION BUDGETS
FY 17, REFORECAST
Exhibit A

Salary & Employee Professional Materials & Admin. Billing 5 Year
Department Wages Benefits Services Supplies Expenses Utilities Credits Total Percent
Administration 3,027,867$ 1,843,118$ 1,080,934$ 323,847$ 876,900$ 624,062$ (19,150)$ 7,757,578$ 5.9%Finance 8,613,261 5,238,865 2,014,024 2,253,415 1,481,815 126,028 (1,227,624) 18,499,784 14.0%Human Resources 1,581,113 1,077,699 284,635 173,357 1,657,472 10,240 (8,841) 4,775,676 3.6%Engineering 8,822,976 4,694,143 6,098,146 622,744 254,264 42,925 (4,370,004) 16,165,195 12.2%Operations 32,186,024 21,241,093 1,826,776 17,730,679 2,063,157 2,839,635 (8,413,366) 69,473,998 52.4%Park 4,727,227 2,899,021 1,388,381 3,215,840 785,422 2,858,586 (35,319) 15,839,158 12.0%Total 58,958,469$ 36,993,939$ 12,692,895$ 24,319,882$ 7,119,030$ 6,501,477$ (14,074,303)$ 132,511,390$ 100.0%
0
Salary & Employee Professional Materials & Admin. Billing 5 Year
Division Wages Benefits Services Supplies Expenses Utilities Credits Total Percent
Retail Water 33,848,246$ 20,953,719$ 7,597,214$ 11,739,887$ 3,972,352$ 497,272$ (8,440,499)$ 70,168,192$ 53.0%Water Recycling 4,735,334 2,872,370 524,353 1,484,034 437,439 884,748 (1,219,894) 9,718,383 7.3%Sewer 15,309,480 10,076,656 3,153,581 7,868,698 1,903,225 2,229,651 (4,381,165) 36,160,125 27.3%Total Park 5,065,405 3,093,968 1,417,743 3,227,262 806,555 2,889,803 (36,045) 16,464,690 12.4%Total 58,958,464$ 36,996,713$ 12,692,890$ 24,319,881$ 7,119,571$ 6,501,474$ (14,077,603)$ 132,511,390$ 100.0%
PADRE DAM MUNICIPAL WATER DISTRICTDEPARTMENTAL ALLOCATIONS TO DIVISION BUDGETS
5 YEAR TOTAL, REFORECAST
Exhibit A

EXHIBIT B
FY13-17 Capital Equipment Plan (All)
Capital Equipment Actual Forecast Budget Budget Budget Total
# Description Life in Years Department CC Year 1 Year 2 Year 3 Year 4 Year 5 Budget
1 Copier 5 FINANCE 11 - - - - 15,000 15,000 2 Imaging System (desktop scanners) 5 FINANCE 11 - - 20,000 - - 20,000 3 Printers 5 FINANCE 11 - - 20,000 - - 20,000 4 Data backup and recovery improvement 5 FINANCE 16 - 20,969 40,000 - - 60,969 5 Storage Area Network (SAN) expansion ($15k-$50 5 FINANCE 16 - 34,205 - - - 34,205 6 VMware Host replacements 5 FINANCE 16 - - - - 31,000 31,000 7 Phone system $400-$1000 per user 5 FINANCE 16 - - 110,000 - - 110,000 8 Backup Tape Library/loader 5 FINANCE 16 - - - - - - 9 Computer equipment (Yr 2 includes AC Equip) 5 FINANCE 16 6,182 62,977 48,889 48,889 48,889 215,826 9 HUMA alert software upgrades for CS 5 FINANCE 12 - - 25,000 - - 25,000
10 CSC Copier 5 ADMIN 69 - - 17,000 - - 17,000
11 New Backlit Projector for Board Room - reque5 ADMIN 69 - - - - 5,000 5,000
12 Board room streaming audio/video 5 ADMIN 69 - - 15,000 - - 15,000
13 Repeater hydrant caps 10 OPS 13 20,000 20,000 14 Construct Meter Retro 10 OPS 13 10,000 10,000 15 Metal Lathe (new building) 10 OPS 47 - - - - 16 Ball Valve Replacement - P4-PS 3 10 OPS 47 - 14,000 - - 14,000 17 A/C Units 10 OPS 51 10,925 5,840 5,000 - 5,000 26,765 18 Pumps 10 OPS 51 - 37,000 37,000 37,000 103,000 214,000 19 Filter Sand 5 OPS 51 78,300 78,300 20 Meters and Analyzers 10 OPS 51 - 14,743 21,000 22,000 6,000 63,743 21 Valves & Equipment 10 OPS 51 - 22,885 18,000 5,000 45,885 22 Rag removal belt and motor 5 OPS 51 - 5,000 5,000 23 Chlorine Scrubber rehab 10 OPS 51 - 28,514 28,514 24 Mixers 10 OPS 51 - 10,000 10,000 5,000 13,500 38,500 25 SCADA System 5 OPS 51 6,632 27,400 19,400 51,500 24,500 129,432 26 Motors & Equipment 5 OPS 51 - 13,691 28,500 25,000 21,500 88,691 27 Plate settlers 10 OPS 51 25,000 25,000 28 Solar panel upgrade(flow to lake # 7) 20 OPS 51 8,500 8,500 29 Primary Tank Sed Cover 25 OPS 51 15,545 15,545 30 Asphalt Improvements 5 OPS 51 5,513 5,513 31 Turbidity Unit/WRF Gate 10 OPS 51 19,901 19,901 32 Auto sampler 10 OPS 52 12,000 12,000 33 Casework-Lab Cabinet 25 OPS 52 8,765 23,901 32,666 34 Painting the Laboratory 25 OPS 52 25,000 25,000 35 Lab Flooring 25 OPS 52 25,000 25,000 36 Atomic Adsorption (metals) 10 OPS 52 60,000 60,000 37 UV/VIS Spectrophotometer 10 OPS 52 7,334 7,334 38 Auto Analyzer 10 OPS 52 50,000 50,000 39 Gas Chromatograph 10 OPS 52 150,000 150,000 40 Autoclave 10 OPS 52 12,000 12,000 41 Bladder Tanks 10 OPS 47 - 10,734 - - 10,734 42 JD Gator 10 OPS 61 - 18,000 18,000 43 Laptop Computers (add to duty trucks) 5 OPS 71 - 11,000 - - 11,000 44 Backhoe John Deere 15 OPS 71 - 95,000 - - 95,000 45 Backhoe John Deere 15 OPS 73 - - - 95,000 95,000 46 Autosampler 10 OPS 73 - - - - - 47 Light Tower (two purchased 6/30/12) 10 OPS 73 - - 9,000 - - 9,000 48 Arrow Board 10 OPS 73 - 5,000 5,000 10,000 49 Emission Control Systems 5 OPS 71 156,738 51,545 40,000 14,000 262,283 50 Tremac pnuematic breaker 10 OPS 73 15,000 15,000 51 Computer Server 5 PARK 62 - 17,500 - 7,500 - 25,000 52 Gator Maintenance Vehicle 10 PARK 62 - - 10,000 - - 10,000 53 Maintenance Yard Car Port 15 PARK 62 - - - - 10,000 10,000 54 Peddle Boats 10 PARK 62 - 20,000 10,000 10,000 10,000 50,000 55 Pontoon Boat 10 PARK 62 - - 20,000 - - 20,000 56 Tractor (John Deer) 20 PARK 62 - - - 35,000 - 35,000 57 WiFi Systems 5 PARK 62 - 15,000 7,500 7,500 7,500 37,500 58 AC -Park Buildings 10 PARK 62 - 20,000 20,000 40,000 59 Dock Lake 1 15 PARK 62 - 20,000 15,000 35,000 60 Trash Receptacle Lids 5 PARK 62 - 10,000 - - - 10,000 61 Storage Unit\Container 15 PARK 62 - 10,000 10,000 10,000 30,000 62 Radio System Upgrade 5 PARK 62 - 6,500 6,500 63 Golf Cart Replacement 10 PARK 62 15,000 5,000 5,000 5,000 30,000 64 Copiers 5 PARK 62 10,000 10,000 20,000 65 Generator Installation 15 PARK 62 - 75,000 75,000 66 Oaks Hot Water Heater 5 PARK 67 5,325 5,325 67 Cabins AC Units 5 PARK 67 9,675 5,000 5,000 5,000 24,675 68 2000 L7501 Vactor Sewer Cleaning Truck 5 OPS 71 400,000 400,000 69 2002 Ford F150 Truck 5 PARK 62 30,000 30,000 70 2003 Ford F350 Supercab Truck 5 OPS 47 65,657 65,657 71 2003 Ford Explorer 5 OPS 37 30,808 30,808 72 1999 Ford F-150 Pickup 5 OPS 73 26,009 26,009 73 2000 Ford Ranger XLT supercab 4x2 5 OPS 73 24,880 24,880 74 2003 Ford F-150 Truck 5 PARK 62 25,686 - 25,686

EXHIBIT B
Capital Equipment Actual Forecast Budget Budget Budget Total
# Description Life in Years Department CC Year 1 Year 2 Year 3 Year 4 Year 5 Budget
75 2006 Ford Explorer 5 OPS 45 30,303 30,303 76 2008 DODGE DAKOTA (Lease - not disposed) 5 OPS 13 6,203 6,203 77 2001 Ford F250 Truck 5 OPS 43 44,444 44,444 78 2002 Ford F250 Truck 5 OPS 51 35,354 35,354 79 2003 Ford Explorer 5 ENG 34 30,303 30,303 80 2003 Ford Explorer 5 ENG 37 30,303 30,303 81 2003 Ford F-250 Truck 5 OPS 61 37,374 37,374 82 2003 Ford F-350 Truck 5 OPS 73 44,444 44,444 83 2004 Ford F250 Super Cab 5 OPS 47 44,444 44,444 84 2004 Ford F-150 supercab 5 OPS 79 31,313 31,313 85 2008 Ford Explorer Sporttrack 5 OPS 41 31,313 31,313 86 2008 Ford F-350 Duty Truck 5 OPS 73 50,000 50,000 87 1992 Dodge Caravan 5 PARK 62 20,000 20,000 88 1999 Ford F-150 Pickup 5 OPS 43 32,828 32,828 89 2003 Ford Explorer 5 PARK 62 30,000 30,000 90 2004 Ford F-150 supercab 5 OPS 13 33,333 33,333 91 2004 Ford Explorer 5 OPS 79 30,808 30,808 92 2004 Ford Explorer 5 OPS 79 30,808 30,808 93 2004 Ford F-150 supercab 5 OPS 79 31,313 31,313 94 2003 Vactor 2110 Jet Rodder 5 OPS 71 445,000 445,000 95 1999 Ford Windstar Van 5 OPS 69 30,303 30,303 96 2000 Ford Taurus LX 4-Door Sedan 5 OPS 69 20,202 20,202 97 2004 Ford F-350 Super Duty 5 OPS 45 50,000 50,000 98 2006 Ford F-150 5 OPS 49 31,818 31,818 99 2006 Ford F-350 5 OPS 45 37,374 37,374
100 2010 Ford F-350 Duty Truck 5 OPS 73 50,000 50,000 101 2007 DODGE DAKOTA 5 OPS 13 26,263 26,263 102 2007 DODGE DAKOTA 5 OPS 13 25,758 25,758 103 2007 Ford F-350 5 OPS 61 35,859 35,859 104 2010 Ford F-350 5 OPS 47 70,707 70,707 105 1999 Ford F-550 Dumptruck 5 OPS 73 50,505 - 50,505 106 2001 Ford F650 Utility Truck 5 OPS 73 126,263 126,263 107 Ingersoll- Rand Air Compressor 5 OPS 73 16,863 16,863 108 Ingersoll- Rand Air Compressor (B-9) 5 OPS 73 16,863 16,863 109 Ingersoll Rand Air Compressor 5 OPS 73 18,000 18,000 110 Cat Forklift 20 OPS 44 60,000 60,000 111 Pump Control Valves PS 1, 3, 4, 5 20 OPS 47 13,371 14,122 19,000 15,400 14,051 75,944 112 Diesel Generator (Board approved 10/2011) 15 OPS 61 97,062 97,062
- TOTAL 613,754 1,363,083 1,337,906 1,206,486 761,788 5,283,017 LESS DIESEL GENERATOR (97,062) - - - - (97,062) ORIGINAL PLAN BUDGET 516,692 1,363,083 1,337,906 1,206,486 761,788 5,185,955
TOTAL BY DEPARTMENTOPERATIONS 576,561$ 986,257$ 863,911$ 1,062,597$ 594,399$ 4,083,725$ ENGINEERING -$ -$ 60,606$ -$ -$ 60,606$ PARK 31,011$ 258,675$ 117,500$ 95,000$ 67,500$ 569,686$ FINANCE 6,182$ 118,151$ 263,889$ 48,889$ 94,889$ 532,000$ ADMIN -$ -$ 32,000$ -$ 5,000$ 37,000$
TOTAL 613,754$ 1,363,083$ 1,337,906$ 1,206,486$ 761,788$ 5,283,017$
TOTAL BY OPERATIONWATER 229,601 296,062 509,750 176,530 287,443 1,499,386$ SEWER 171,979 482,572 229,123 487,742 48,767 1,420,182$ RECYCLED WATER 206,850 355,774 531,557 447,213 358,078 1,899,473$ PARK 5,325 228,675 67,500 95,000 67,500 464,000$
TOTAL 613,754 1,363,083 1,337,906 1,206,485 761,788 5,283,017$
TO RECONCILE TO CAPITAL EQUIPMENT ACTIVITY ON BUDGET
TOTAL CAPITAL EQUIPMENT PURCHASES 5,283,017$
DISPOSALS (77,152)
CHANGE IN ACCUMULATED DEPRECIATION 71,603 TOTAL CAPITAL EQUIPMENT ACTIVITY PER BUDGET 5,288,566$

Table 2Year 3 Reforecasted CIP
Project Expenditures ($1,000s)
Exhibit C
NOTES: 1) Unless otherwise noted, costs include an inflation factor of 3.3% per year.2) Amounts are rounded which may affect footing.
Project and Phase
Job No. or Work Order
Estimated Completion Cost to 6/30/12 Actual 12/13
Anticipated 13/14 14/15 15/16 16/17 Future Total
Total 5 Years 12/13 - 16/17
Capitalized OperationsAnnual Raise Air Vacs (ESA) 202033 Annual 324$ -$ 1$ 34$ 35$ 35$ 429$ 105$ Annual Raise Air Vacs (WSA) 98048 Annual -$ 3$ -$ 33$ 33$ 33$ 101$ 101$ Annual Sewer Manhole Rehabilitation 201004 Annual 49$ 55$ 52$ 53$ 55$ 85$ 349$ 301$ Annual Sewer Rehab Annual -$ -$ 10$ 49$ 50$ 85$ 194$ 194$ Blowoff Installation 208015 Annual -$ 47$ 108$ 53$ 83$ 85$ 376$ 376$ Poly Service Replacement (ESA) 202032 Annual -$ 87$ 66$ 48$ 50$ 68$ 319$ 319$ Poly Service Replacement (WSA) 202008 Annual -$ 138$ 214$ 53$ 55$ 57$ 518$ 518$ SCADA Network/Communication Upgrades 208009 Complete 110$ 0$ -$ -$ -$ -$ 110$ 0$ SCADA Software Upgrades (Ops) 208003 Complete 1,274$ 114$ 0$ -$ -$ -$ 1,388$ 114$ Security System Upgrades Ph 2 205002 2017 314$ 106$ 95$ 53$ 55$ 57$ 681$ 367$ Site Paving As Needed Annual -$ -$ 102$ 101$ 100$ 100$ 403$ 403$ Valve Replacement Contractor (offset in op. budget) 213007 Annual -$ -$ 293$ 229$ 229$ 250$ 1,000$ 1,000$ Valve Replacement Program (ESA) 202034 Annual 31$ 34$ 112$ 112$ 112$ 401$ 401$ Valve Replacement Program (WSA) 99017 Annual 493$ 361$ 516$ 516$ 516$ 2,401$ 2,401$ Vault Lid Replacement 211023 2014 16$ 24$ 27$ -$ -$ -$ 67$ 51$ WRF SCADA Hardware -$ -$ 98$ -$ -$ 98$ 98$ WRF Treatment Equipment Replacement Program 207006 Annual 39$ -$ 21$ 151$ 171$ 184$ 566$ 527$ Subtotal 2,124$ 1,099$ 1,384$ 1,583$ 1,542$ 1,667$ -$ 9,401$ 7,276$
Mandated by External AgenciesCity of El Cajon Meter Box & Sidewalk Rplc 2015 -$ -$ 50$ -$ -$ 50$ 50$ City of Santee -$ -$
Atlas View Sidewalks Service Reloc. 2015 -$ -$ 25$ -$ -$ 25$ 25$ Bridge Retrofits Util. Reloc. 2016 -$ -$ 50$ 52$ -$ 102$ 102$ Buena Vista/Railroad Impr. 44062 2015 -$ 94$ 206$ -$ -$ 300$ 300$ Carlton Oaks Bridge Retrofit 2015 -$ -$ 77$ -$ -$ 77$ 77$ Cottonwood Ave Util. Reloc Not needed -$ -$ -$ -$ -$ -$ -$ Cuyamaca/Mission Gorge Rt Turn Lanes Not budgeted -$ -$ -$ -$ -$ -$ -$ Magnolia Widening Util. Reloc. 2015 -$ -$ 27$ -$ -$ 27$ 27$ Magnolia/Palm Glen Median Util. Reloc. Not budgeted -$ -$ -$ -$ -$ -$ -$ Mission Gorge Drainage Conflicts 2015 -$ -$ 107$ -$ -$ 107$ 107$ Mission Gorge Median Install Util. Reloc. -$ -$ -$ -$ -$ -$ -$ Olive Lane Util. Reloc. 2014 -$ 26$ -$ -$ -$ 26$ 26$ Pavement Repair Util. Reloc. 2017 -$ -$ 50$ 52$ 53$ 155$ 155$ Prospect Ave Widening Util. Reloc. 211003 2016 0$ 12$ 695$ 608$ 55$ -$ 1,370$ 1,370$ Riverwalk/Park Center Dr Not budgeted -$ -$ -$ -$ -$ -$ -$ Storm Drain Conflicts 2016 -$ 75$ 77$ 80$ 55$ 288$ 288$ Woodside/Shadow Hill Util Reloc. Not budgeted -$ -$ -$ -$ -$ -$ -$
County Alpine Blvd Service Relocations 2014 -$ 207$ -$ -$ -$ 207$ 207$ County Wing Avenue Sewer Relocation 2014 0$ -$ 220$ -$ -$ -$ 220$ 220$ Lakeside Interceptor Replacement Participation Annual -$ 207$ 213$ 220$ 228$ 868$ 868$ Stage 2 DBPR System Improvements 206028 Not budgeted -$ -$ -$ -$ -$ -$ -$
rev 6/2/2014 page 1 of 6
EXHIBIT C
kjassoy
Text Box
ATTACHMENT 4
kjassoy
Text Box

Table 2Year 3 Reforecasted CIP
Project Expenditures ($1,000s)
Exhibit C
Project and Phase
Job No. or Work Order
Estimated Completion Cost to 6/30/12 Actual 12/13
Anticipated 13/14 14/15 15/16 16/17 Future Total
Total 5 Years 12/13 - 16/17
Undefined External Mandates Annual -$ -$ -$ 251$ 569$ 820$ 820$ Urban Water Management Plan 2015 2016 -$ -$ 53$ 55$ -$ 108$ 108$ WDR Sewer System Management Plan Update Complete 3$ 50$ -$ -$ -$ 53$ 53$ WRF NPDES Permit Annual Updates Annual -$ -$ 18$ 18$ 18$ 53$ 53$ WRF NPDES Permit Renewal 2014 Complete 0$ 35$ -$ -$ -$ 35$ 35$ Subtotal 1$ 15$ 1,608$ 1,562$ 783$ 923$ -$ 4,892$ 4,892$
CIP General5 Res Retrofit Ph 4 - Blossom Valley
5 Res Retrofit Ph 4 - Blossom Valley Design 208027 Complete 124$ 2$ 1$ -$ -$ -$ 126$ 2$ Permitting 2018 -$ -$ -$ -$ -$ -$ -$ Construction 208027 2019 -$ -$ -$ -$ -$ 9,237$ 9,237$ -$
Annexation Fee Study 211006 Complete 6$ -$ -$ -$ -$ 6$ 6$ Annual Post-Project Engineering 212007 Annual 16$ 17$ 5$ 6$ 6$ 50$ 50$ Annual Sewer Assessment 43772 Annual -$ 10$ 21$ 11$ 6$ 48$ 48$ Annual Sewer Assessmt Techite 43810 Complete -$ 15$ -$ -$ -$ 15$ 15$ Annual Sewer Repl/Rehab Annual -$ -$ 192$ 99$ 51$ 342$ 342$
Braverman Cured in Place Repair Ph 1 211019 Complete 56$ -$ -$ -$ -$ 56$ 56$ Braverman Sewer Cured in Place Repairs Ph 2 212011 Complete 30$ 322$ -$ -$ -$ 352$ 352$ Sewer Cured in Place Repairs 13/14 213008 2015 -$ 30$ 315$ -$ -$ 345$ 345$
Asset Management System/CMMS 2017 -$ -$ -$ 551$ 285$ 836$ 836$ Blossom Valley Res Drainage & Site Impr. Study 43027 Complete 34$ 2$ -$ -$ -$ 36$ 36$ Blossom Valley Res Drainage & Site Impr. 2016 -$ -$ -$ 100$ -$ 100$ 100$ Capacity Fee Update 2016 -$ -$ 110$ 114$ -$ 223$ 223$ Carlton Hills Diversion Structure Upgrade 2016 -$ -$ 75$ 534$ -$ 609$ 609$ Chocolate Summit Res Land Acq. 213010 2015 -$ 140$ 110$ -$ -$ 250$ 250$ CSC Elec Reliability & Consolidation 209004 2015 29$ 26$ 22$ 62$ -$ -$ 139$ 110$ CSC Ph 2 - Verizon Relocation 212014 2015 1$ 1$ 28$ -$ -$ 30$ 30$ El Monte Groundwater/WRF Exp. 205051 Complete 0$ -$ -$ -$ -$ 0$ 0$ Emergency Diesel Trailer Pump 213012 2016 -$ 21$ 213$ 52$ -$ 286$ 286$ Emergency Generator - Alpine PS 209001 Complete 689$ 68$ -$ -$ -$ -$ 758$ 68$ Emergency Generators Startup, Testing, and Permitt 42083 2014 4$ 2$ 44$ -$ -$ 50$ 50$ Eng System Data Updates (Annual) Annual -$ 5$ 5$ 6$ 6$ 22$ 22$ Facility Condition Assessment Sewer Incl. in Master Plan -$ -$ -$ -$ -$ -$ -$ Facility Condition Assessment Water Incl. in Master Plan -$ -$ -$ -$ -$ -$ -$ Financial Computer System Upgrade -$ -$
CIS Software 212012 2014 571$ 892$ -$ -$ -$ 1,464$ 1,464$ EDMS Implementation 212008 2014 198$ 80$ -$ -$ -$ 278$ 278$ Finance & HR Software 212013 2015 175$ 700$ 433$ -$ -$ 1,308$ 1,308$
GIS Projects 2016 3$ -$ 135$ 198$ -$ 336$ 336$ GIS Projects Ph 1 209016 JN Closed 13$ -$ -$ -$ -$ 13$ 13$ HWD/Camino Canada Emerg. Conn. 204021 2014 1$ 59$ -$ -$ -$ 60$ 60$ I-8 Crossings -$ -$
Viewside Lane 8" Rplc Assessment 43465 Complete 2$ 13$ -$ -$ -$ 15$ 15$ Prelim Design (Labrador, Dunbar, maybe 20") 43748 2014 -$ 57$ -$ -$ -$ 57$ 57$ Design & Constr tbd -$ -$ 479$ 67$ -$ 546$ 546$
IPS Chopper Pumps 214001 2014 -$ 52$ -$ -$ -$ 52$ 52$ IPS Grinder Rplc & Sluice Gate 214003 2014 -$ 233$ -$ -$ -$ 233$ 233$ JWA NCCP Subarea Plan 98046 Complete 9$ -$ -$ -$ -$ 9$ 9$
rev 6/2/2014 page 2 of 6
EXHIBIT C
kjassoy
Text Box
ATTACHMENT 4
kjassoy
Text Box

Table 2Year 3 Reforecasted CIP
Project Expenditures ($1,000s)
Exhibit C
Project and Phase
Job No. or Work Order
Estimated Completion Cost to 6/30/12 Actual 12/13
Anticipated 13/14 14/15 15/16 16/17 Future Total
Total 5 Years 12/13 - 16/17
JWA NCCP Subarea Plan (Ph 2) 2014 -$ 37$ -$ -$ -$ 37$ 37$ Lakeside WD Conn-Abandonment 212006 Complete 3$ 97$ -$ -$ -$ -$ 100$ 97$ Magnolia Ave South Relief Sewer Segment 1 -$ -$
Studies 204030 Complete 39$ 39$ -$ Planning & Prelim Design 42930 2015 0$ -$ 74$ -$ -$ 74$ 74$ Dsn & Constr 204030 2016 -$ -$ 320$ 55$ -$ 375$ 375$
Master Plan & Program EIR 42913 2015 13$ 250$ 507$ -$ -$ 770$ 770$ Master Plan Annual Maint 43107 Annual 1$ -$ 48$ 66$ 51$ 166$ 166$
202056 Complete 31$ -$ -$ -$ -$ 31$ 31$ METRO Sewer Billing 43140 2014 7$ 15$ -$ -$ -$ 22$ 22$
210008 Complete 16$ -$ -$ -$ -$ 16$ 16$ Mission Gorge Rd 36" Valves 2017 -$ -$ -$ -$ 399$ 399$ 399$ Northcote Pump Station Upgrade (Prelim Design) 2017 -$ -$ -$ -$ 38$ 38$ 38$ Other Water Projects (Undefined) tbd -$ -$ -$ 1,699$ 1,699$ 3,398$ 3,398$ Pipe Evaluations - Bridge Crossings 44134 2016 -$ 0$ 50$ 103$ -$ 153$ 153$ PS 1 Surge Tank Replacement -$ -$
Assessment / Prelim. Design 43959 Complete -$ 45$ -$ -$ -$ 45$ 45$ Design & Constr 214004 2015 -$ 50$ 312$ -$ -$ 362$ 362$
Reservoir Refurbishing -$ -$ -$ 110$ 114$ 224$ 224$ Reservoir Refurbishing - Surge Tanks 214002 2014 -$ 10$ 140$ -$ -$ 150$ 150$ Rios Canyon PS Suction Rplc 211014 Complete 110$ 288$ 22$ -$ -$ -$ 420$ 310$ Sewer Flow Studies 2011 211021 Complete 2$ -$ -$ -$ -$ 2$ 2$ Sewer Flow Studies 5 Year Updates -$ -$ 207$ -$ -$ 207$ 207$ Sewer Rehab Fanita Parkway 2015 -$ 103$ 107$ -$ -$ 210$ 210$ Sewer Trans-River Interceptor (Siphon) Assessment 43035 2015 3$ 60$ 70$ -$ -$ 133$ 133$ Solar Energy Feasibility Study (CSC & WRF) 2014 -$ 15$ -$ -$ -$ 15$ 15$ Solar Power - Res/Ops/WRF Sites 211012 Move to future -$ -$ -$ -$ -$ -$ -$ Steel Pipe Condition Assessment 43879 2017 -$ 2$ 50$ 220$ 228$ 500$ 500$ Steel Pipe Replacement (based on Condition Assessment) Annual -$ -$ 637$ 386$ 455$ 1,478$ 1,478$ Sycamore Creek Hydrology Study Complete 29$ 33$ -$ -$ -$ 62$ 62$ Sycamore Creek Security Wall Design & Constr Close out -$ -$ 167$ -$ -$ 167$ 167$ Sycamore Creek Security Wall Prelim. 44003 Complete -$ 25$ -$ -$ -$ 25$ 25$ Walmart Sewer Diversion Structure -$ -$
Studies 211022 Complete 12$ 12$ -$ Prelim. Design 42921 Complete 107$ 29$ -$ -$ -$ 136$ 136$ Design & Constr 211022 2015 8$ 12$ 510$ -$ -$ 530$ 530$
Water Pump Replacement Program (2011-2015) 2016 -$ -$ 146$ 150$ -$ 296$ 296$ Willowgrove Sewer, Phase 2 -$ -$
Assessment 2015 -$ 31$ 32$ -$ -$ 63$ 63$ Construction 209006 2016 -$ -$ -$ 165$ -$ 165$ 165$
WRF & Pond Valve Repl 213009 2016 -$ 102$ 86$ 285$ -$ 473$ 473$ WRF Aeration Panels 2015 -$ -$ 175$ -$ -$ 175$ 175$ WRF Chlorine Trolley 211025 2014 26$ 60$ 498$ -$ -$ -$ 584$ 558$ WRF Fence Replacement 2016 -$ -$ 103$ 122$ -$ 225$ 225$ WRF Improvements - General Annual -$ -$ 42$ 42$ 41$ 125$ 125$ WRF Mag Meter Install 213002 2016 2$ -$ -$ 123$ -$ 125$ 125$ WRF Paving Repair (District funded) 212002 2017 70$ 5$ -$ 60$ -$ 60$ 194$ 125$ WRF Sed Basin Cover Rplc 213001 Complete 24$ -$ -$ -$ -$ 24$ 24$ Subtotal 1,102$ 1,910$ 4,013$ 6,071$ 5,264$ 3,438$ 9,237$ 31,035$ 20,696$
rev 6/2/2014 page 3 of 6
EXHIBIT C
kjassoy
Text Box
ATTACHMENT 4
kjassoy
Text Box
kjassoy
Cross-Out

Table 2Year 3 Reforecasted CIP
Project Expenditures ($1,000s)
Exhibit C
Project and Phase
Job No. or Work Order
Estimated Completion Cost to 6/30/12 Actual 12/13
Anticipated 13/14 14/15 15/16 16/17 Future Total
Total 5 Years 12/13 - 16/17
COP Financing Required5 Res Retrofit Ph 2 - Mt Top & East Victoria 208025 Complete 8,792$ 28$ -$ -$ -$ -$ 8,820$ 28$ 5 Res Retrofit Ph 3 - West Victoria 208026 Complete 3,707$ 2,189$ 64$ -$ -$ -$ 5,959$ 2,253$ Emergency Generator - Flinn Springs PS 209014 Complete 193$ 417$ 568$ -$ -$ -$ 1,177$ 985$ Emergency Generator - Rios Canyon PS 209019 Complete 172$ 53$ 575$ -$ -$ -$ 800$ 628$ ESA Sec. Supply Conn. -$ -$
Orig Site Restoration (excl. sunk costs) 203032 2014 4,443$ 371$ 367$ -$ -$ -$ 5,181$ 737$ Mitigation & Monitoring 210001 2020 -$ 1$ 1$ 68$ 70$ 139$ 139$ Land Acq 2011 211009 Complete 24$ -$ -$ -$ -$ 24$ 24$ Land Acq. Vallone 212015 Complete 71$ 695$ (16)$ -$ -$ -$ 750$ 679$ Land Acq. El Dorado 213005 2014 0$ 280$ -$ -$ -$ 280$ 280$
43369 2014 12$ 15$ -$ -$ -$ 27$ 27$ Basis of Design 43473 2014 12$ 350$ -$ -$ -$ 362$ 362$ Alt Site Design & Constr 214007 2017 -$ -$ 1,000$ 7,465$ 7,000$ 15,465$ 15,465$
Sunrise Reservoir Retaining Wall (incl Verizon reloc 210026 Complete 99$ 315$ 242$ 656$ 557$ Subtotal 17,476$ 4,114$ 2,445$ 1,001$ 7,533$ 7,070$ -$ 39,639$ 22,163$
Grants & Other Financing RequiredOps - Security Gates (funded by Cell Phone Revenues) Annual -$ -$ 80$ 83$ 85$ 248$ 248$ Ops Yard Improvements (prev. CSC Ph 2 - Ops) -$ -$
RFP Review & Negotiations 42235 Complete 10$ 15$ -$ -$ -$ 25$ 25$ Design & Constr. 205014 2016 862$ 143$ 375$ 7,000$ 3,000$ -$ 11,380$ 10,518$
WRF Expansion Studies / IPR / East County Sewer -$ -$ 4.4 MGD Expansion Studies 210014 Complete 7$ -$ -$ -$ -$ 7$ 7$ Potable Reuse Study 42631 Complete 1$ 0$ -$ -$ -$ 1$ 1$ Santee Basin Aquifer Study & Env. (PD Share) 43043 2016 18$ 3$ 6$ -$ -$ 28$ 28$
210020 Complete 15$ -$ -$ -$ -$ 15$ 15$ Salinity Nutrient Mgt Plan (PD share) 42876 Complete 85$ 35$ -$ -$ -$ 120$ 120$ Santee Basin Test Wells 43887 2014 -$ 220$ -$ -$ -$ 220$ 220$ WRF Studies (incl. East County project) 42905 2014 13$ 89$ -$ -$ -$ 102$ 102$ WRF Demo Project 42884 2016 31$ 664$ 2,000$ 350$ -$ 3,045$ 3,045$ Groundwater Modeling Not budgeted -$ -$ Groundwater Management Plan Not budgeted -$ -$
WRF Paving Repair (SDGE Funded) 212002 -$ -$ 60$ -$ -$ 60$ 60$ Subtotal 862$ 323$ 1,400$ 9,146$ 3,433$ 85$ -$ 15,250$ 14,388$
Developer DrivenAlpine High School D/P (part of Spanish Bit Loop) 2015 -$ -$ 93$ -$ -$ 93$ 93$ Alpine Ranch Estates West D/P 210012 2015 2$ 24$ -$ 24$ -$ -$ 50$ 48$ D/P General 2014 -$ 309$ -$ -$ -$ 309$ 309$ El Cap Pipeline D/P (South Coast) Rios Canyon, Pecan Park 24") 2015 -$ 170$ 176$ -$ -$ 346$ 346$ Grossmont College Privatization 2015 -$ -$ 35$ -$ -$ 35$ 35$ Pebble Beach Relief Sewer (Castlerock) (12-in upsize) Not budgeted -$ -$ -$ -$ -$ -$ -$ Subtotal 2$ 24$ 479$ 328$ -$ -$ -$ 833$ 831$
COP Financing5 Res Retrofit Ph 2 - Mt Top & East Victoria 208025 (28)$ -$ -$ -$ -$ (28)$ (28)$ 5 Res Retrofit Ph 3 - West Victoria 208026 (2,189)$ (64)$ -$ -$ -$ (2,253)$ (2,253)$ 5 Res Retrofit Ph 4 - Blossom Valley Design 208027 (2)$ (1)$ -$ -$ -$ (2)$ (2)$
rev 6/2/2014 page 4 of 6
EXHIBIT C
kjassoy
Text Box
ATTACHMENT 4
kjassoy
Text Box

Table 2Year 3 Reforecasted CIP
Project Expenditures ($1,000s)
Exhibit C
Project and Phase
Job No. or Work Order
Estimated Completion Cost to 6/30/12 Actual 12/13
Anticipated 13/14 14/15 15/16 16/17 Future Total
Total 5 Years 12/13 - 16/17
Emergency Generator - Flinn Springs PS 209014 (417)$ (568)$ -$ -$ -$ (985)$ (985)$ Emergency Generator - Rios Canyon PS 209019 (53)$ (575)$ -$ -$ -$ (628)$ (628)$ ESA Secondary Supply Conn. -$ -$
Orig Site Restoration and Legal 203032 (371)$ (367)$ -$ -$ -$ (737)$ (737)$ Mitigation & Monitoring 210001 -$ (1)$ -$ -$ -$ (1)$ (1)$ Land Acq. 2011 & Vallone 212015 (695)$ 16$ -$ -$ -$ (679)$ (679)$
211009 (24)$ -$ -$ -$ -$ (24)$ (24)$ Land Acq. El Dorado 213005 (0)$ (280)$ -$ -$ -$ (280)$ (280)$
43369 (12)$ (15)$ -$ -$ -$ (27)$ (27)$ Alt Site Basis of Design 43473 (12)$ (350)$ -$ -$ -$ (362)$ (362)$ Alt Site Design & Constr 214007 -$ -$ (1,000)$ (7,465)$ (4,916)$ (13,381)$ (13,381)$
Sunrise Reservoir Retaining Wall / Site Impr. (incl V 210026 (315)$ (242)$ -$ -$ -$ (557)$ (557)$ Subtotal (25,057)$ (4,116)$ (2,446)$ (1,000)$ (7,465)$ (4,916)$ -$ (45,000)$ (19,943)$
Grants & Other FinancingOps Yard (Sale of Woodside Property) 205014 (560)$ (67)$ (177)$ (2,117)$ -$ -$ (2,921)$ (2,361)$ Ops - Security Gates, Cell Phone Revenues -$ -$ (80)$ (83)$ (85)$ (248)$ (248)$ Solar Energy Feasibility Study (CSC & WRF) -$ (15)$ -$ -$ -$ (15)$ (15)$ WRF Demo Project - Grants 42884 -$ (650)$ (2,000)$ (350)$ -$ (3,000)$ (3,000)$ WRF Paving, SDG&E Contribution -$ -$ (60)$ -$ -$ (60)$ (60)$ Subtotal (560)$ (67)$ (842)$ (4,257)$ (433)$ (85)$ -$ (6,245)$ (5,685)$
Debt ServiceAMR Debt Service 207029 2020 1,759$ 704$ 704$ 704$ 704$ 704$ 1,759$ 7,037$ 3,519$ COP Debt Service (CIP Share) 2040 256$ 174$ 214$ 217$ 208$ 204$ 33,853$ 35,127$ 1,018$ Subtotal 2,015$ 878$ 917$ 921$ 912$ 908$ 35,612$ 42,164$ 4,537$
$0 $0NET TOTAL 4,181$ 8,959$ 15,354$ 11,569$ 9,091$ 44,849$ 52,329$ 49,155$
TOTAL PROJECTS 7,486$ 11,330$ 19,691$ 18,555$ 13,184$ 9,237$ 79,483$ 70,246$ TOTAL FINANCING (4,183)$ (3,288)$ (5,257)$ (7,898)$ (5,001)$ -$ (25,627)$ (25,627)$ DEBT SERVICE 878$ 917$ 921$ 912$ 908$ 35,612$ 40,149$ 4,537$ NET 4,181$ 8,959$ 15,354$ 11,569$ 9,091$ 44,849$ 94,004$ 49,155$
rev 6/2/2014 page 5 of 6
EXHIBIT C
kjassoy
Text Box
ATTACHMENT 4
kjassoy
Text Box

Table 2Year 3 Reforecasted CIP
Project Expenditures ($1,000s)
Exhibit C
Project and Phase
Job No. or Work Order
Estimated Completion Cost to 6/30/12 Actual 12/13
Anticipated 13/14 14/15 15/16 16/17 Future Total
Total 5 Years 12/13 - 16/17
BELOW THE LINE - UNBUDGETED, EXTERNAL FINANCING REQUIREDCuyamaca/Carlton Oaks Interconn Upsize 2019 8$ -$ -$ -$ -$ 618$ 1,494$ 2,120$ Willowgrove Sewer, Phase 2 Constr 209006 2018 -$ -$ -$ -$ -$ -$ 959$ 959$ -$ WRF Ph 1 Design (incl IPS) 210014 2016 -$ -$ -$ 2,134$ 2,205$ -$ -$ 4,339$ 4,339$ WRF Ph 1 Constr (WRF & AWT) 210014 2018 -$ -$ -$ -$ -$ 25,279$ 26,113$ 51,392$ 25,279$ WRF Ph 1 Recycled Water Dist System 2018 -$ -$ -$ -$ -$ 882$ 912$ 1,794$ 882$ WRF Ph 1 Recycled Water Retrofit 2018 -$ -$ -$ -$ -$ 294$ 303$ 597$ 294$ Subtotal 8$ -$ -$ 2,134$ 2,205$ 27,073$ 29,781$ 61,201$ 31,412$
SRF FinancingCuyamaca/Carlton Oaks Interconnect 2019 -$ -$ -$ -$ -$ (618)$ (1,494)$ (2,112)$ (618)$ Willowgrove Sewer, Ph 2 Construction 209006 2018 -$ -$ -$ -$ -$ -$ (959)$ (959)$ -$ WRF Ph 1 Design (incl IPS) 210014 2016 -$ -$ -$ (2,134)$ (2,205)$ -$ -$ (4,339)$ (4,339)$ WRF Ph 1 Constr 210014 2018 -$ -$ -$ -$ -$ (25,279)$ (26,113)$ (51,392)$ (25,279)$ WRF Ph 1 Recycled Water Dist System 2018 -$ -$ -$ -$ -$ (882)$ (912)$ (1,794)$ (882)$ WRF Ph 1 Recycled Water Retrofit 2018 -$ -$ -$ -$ -$ (294)$ (303)$ (597)$ (294)$ Subtotal -$ -$ -$ (2,134)$ (2,205)$ (27,073)$ (29,781)$ (61,193)$ (31,412)$
Title 16 Grants WRF Ph 1 Design 2019 -$ -$ -$ -$ -$ -$ (1,000)$ (1,000)$ -$ WRF Ph 1 Constr. 2021 -$ -$ -$ -$ -$ -$ (11,100)$ (11,100)$ -$ WRF Ph 1 Recycled Water Dist Syst 2021 -$ -$ -$ -$ -$ -$ (129)$ (129)$ -$ WRF Ph 1 Recycled Water Retrofit 2021 -$ -$ -$ -$ -$ -$ (387)$ (387)$ -$ Subtotal -$ -$ -$ -$ -$ -$ (11,616)$ (11,616)$ -$
Debt ServiceCuyamaca/Carlton Oaks Interconnect 2040 -$ -$ -$ -$ -$ -$ 2,770$ 2,770$ -$ Willowgrove Sewer, Phase 2 209006 2040 -$ -$ -$ -$ -$ -$ 1,280$ 1,280$ -$ WRF Ph 1 Design (incl IPS) 210014 2038 -$ -$ -$ -$ -$ -$ 5,740$ 5,740$ -$ WRF Ph 1 Constr, 210014 2040 -$ -$ -$ -$ -$ -$ 67,960$ 67,960$ -$ WRF Ph 1 Recycled Water Dist System 2040 -$ -$ -$ -$ -$ -$ 2,380$ 2,380$ -$ WRF Ph 1 Recycled Water Retrofit 2040 -$ -$ -$ -$ -$ -$ 790$ 790$ -$ Subtotal -$ -$ -$ -$ -$ -$ 80,920$ 80,920$ -$
TOTAL BELOW THE LINE 8$ -$ -$ -$ -$ 0$ 69,304$ 69,312$ 0$
rev 6/2/2014 page 6 of 6
EXHIBIT C
kjassoy
Text Box
ATTACHMENT 4
kjassoy
Text Box

Year 3 Reforecasted BudgetPark Project Expenditures
EXHIBIT C
Project Name Project # FY '13 Actual FY '14 Projected FY '15 Budget FY '16 Budget FY '17 Budget Total 5 Years
Park Lake 5 (General Store) Shelter Replacement 208029 393,520$ 2,194$ -$ -$ -$ 395,714$
Park Campground Playground 211017 - 128,078 - - - 128,078
Park Club House Expansion 2070000 - - 150,000 - - 150,000
Park Day Use Landscape Improvements 207023 - - 75,000 - 75,000 150,000
Park Day Use Restroom Renovation 207004 - 50,000 - 50,000 100,000
ADA Renovations - - 15,000 15,000 15,000 45,000
Playground, Sycamore Restroom Repairs, Paving Lake 1 211011, 212016, 212018 31,304 423,985 - - 401,118 856,407
424,824$ 554,257$ 290,000$ 215,000$ 541,118$ 2,025,199$


CLASSIFICATIONMin. Mid. Max. Min. Mid. Max. Min. Mid. Max.
Accountant 23 $26.81 - $34.27 - $41.72 $4,647 - $5,940 - $7,231 $55,765 - $71,282 - $86,778Accountant, Senior 29 $32.02 - $40.93 - $49.83 $5,550 - $7,095 - $8,637 $66,602 - $85,134 - $103,646Accounting Manager 38 $39.71 - $50.76 - $61.80 $6,883 - $8,798 - $10,712 $82,597 - $105,581 - $128,544Accounting Specialist 13 $17.90 - $22.88 - $27.85 $3,103 - $3,966 - $4,827 $37,232 - $47,590 - $57,928Accounting Specialist 15 $19.94 - $25.48 - $31.02 $3,456 - $4,417 - $5,377 $41,475 - $52,998 - $64,522Accounting Specialist 17 $21.65 - $27.67 - $33.69 $3,753 - $4,796 - $5,840 $45,032 - $57,554 - $70,075Administrative Assistant 11 $16.15 - $20.65 - $25.14 $2,799 - $3,579 - $4,358 $33,592 - $42,952 - $52,291Administrative Assistant 13 $17.90 - $22.88 - $27.85 $3,103 - $3,966 - $4,827 $37,232 - $47,590 - $57,928Administrative Assistant 15 $19.94 - $25.48 - $31.02 $3,456 - $4,417 - $5,377 $41,475 - $52,998 - $64,522Administrative Assistant 18 $22.61 - $28.90 - $35.18 $3,919 - $5,009 - $6,098 $47,029 - $60,112 - $73,174Assistant Operations Manager 40 $41.14 - $52.58 - $64.01 $7,131 - $9,114 - $11,095 $85,571 - $109,366 - $133,141Board Secretary 27 $30.51 - $39.00 - $47.49 $5,288 - $6,760 - $8,232 $63,461 - $81,120 - $98,779Board Secretary 27L $32.04 - $40.96 - $49.87 $5,554 - $7,100 - $8,644 $66,643 - $85,197 - $103,730Cathodic Protection Program Coordinator 25 $28.64 - $36.61 - $44.57 $4,964 - $6,346 - $7,725 $59,571 - $76,149 - $92,706Cathodic Protection Program Coordinator 27 $30.51 - $39.00 - $47.49 $5,288 - $6,760 - $8,232 $63,461 - $81,120 - $98,779Cathodic Protection Program Coordinator 30 $33.13 - $42.35 - $51.56 $5,743 - $7,341 - $8,937 $68,910 - $88,088 - $107,245Communications Coordinator 25 $28.64 - $36.61 - $44.57 $4,964 - $6,346 - $7,725 $59,571 - $76,149 - $92,706Communications Manager 35 $37.27 - $47.63 - $57.99 $6,460 - $8,256 - $10,052 $77,522 - $99,070 - $120,619Communications Officer 30 $33.13 - $42.35 - $51.56 $5,743 - $7,341 - $8,937 $68,910 - $88,088 - $107,245Construction & Maintenance Supervisor 27 $30.51 - $39.00 - $47.49 $5,288 - $6,760 - $8,232 $63,461 - $81,120 - $98,779Construction Equipment Operator 18 $22.61 - $28.90 - $35.18 $3,919 - $5,009 - $6,098 $47,029 - $60,112 - $73,174Construction Equipment Operator 20 $24.41 - $31.20 - $37.98 $4,231 - $5,408 - $6,583 $50,773 - $64,896 - $78,998Construction Equipment Operator 20L $25.63 - $32.76 - $39.88 $4,443 - $5,678 - $6,913 $53,310 - $68,141 - $82,950Construction Inspector 18 $22.61 - $28.90 - $35.18 $3,919 - $5,009 - $6,098 $47,029 - $60,112 - $73,174Construction Inspector 20 $24.41 - $31.20 - $37.98 $4,231 - $5,408 - $6,583 $50,773 - $64,896 - $78,998Construction Inspector 23 $26.81 - $34.27 - $41.72 $4,647 - $5,940 - $7,231 $55,765 - $71,282 - $86,778Construction Inspector 25 $28.64 - $36.61 - $44.57 $4,964 - $6,346 - $7,725 $59,571 - $76,149 - $92,706Custodian 10 $15.15 - $19.37 - $23.59 $2,626 - $3,357 - $4,089 $31,512 - $40,290 - $49,067Customer Service Manager 28 $30.85 - $39.43 - $48.00 $5,347 - $6,835 - $8,320 $64,168 - $82,014 - $99,840Customer Service Representative 11 $16.15 - $20.65 - $25.14 $2,799 - $3,579 - $4,358 $33,592 - $42,952 - $52,291Customer Service Representative 13 $17.90 - $22.88 - $27.85 $3,103 - $3,966 - $4,827 $37,232 - $47,590 - $57,928Customer Service Representative 15 $19.94 - $25.48 - $31.02 $3,456 - $4,417 - $5,377 $41,475 - $52,998 - $64,522Director of Engineering & Planning Uncl. $57.87 - $73.12 - $88.37 $10,031 - $12,674 - $15,317 $120,370 - $152,090 - $183,810Director of Finance/Chief Financial Officer Uncl. $57.87 - $73.12 - $88.37 $10,031 - $12,674 - $15,317 $120,370 - $152,090 - $183,810Director of Human Resources Uncl. $44.68 - $56.46 - $68.23 $7,745 - $9,786 - $11,827 $92,934 - $117,426 - $141,918Director of Operations & Water Quality Uncl. $57.87 - $73.12 - $88.37 $10,031 - $12,674 - $15,317 $120,370 - $152,090 - $183,810
Salary Grade
HOURLY PAY RANGE* MONTHLY PAY RANGE ANNUAL PAY RANGE
PADRE DAM MUNICIPAL WATER DISTRICT Fiscal Year Budget 2014-2015
Job Classification Schedule for All EmployeesExhibit A
Resolution 2014-17

CLASSIFICATIONMin. Mid. Max. Min. Mid. Max. Min. Mid. Max.
Salary Grade
HOURLY PAY RANGE* MONTHLY PAY RANGE ANNUAL PAY RANGE
Director of Park & Recreation Uncl. $45.99 - $58.79 - $71.58 $7,972 - $10,189 - $12,407 $95,659 - $122,273 - $148,886Distribution Maintenance Manager 35 $37.27 - $47.63 - $57.99 $6,460 - $8,256 - $10,052 $77,522 - $99,070 - $120,619Distribution Maintenance Supervisor 27 $30.51 - $39.00 - $47.49 $5,288 - $6,760 - $8,232 $63,461 - $81,120 - $98,779Distribution Supervisor 30 $33.13 - $42.35 - $51.56 $5,743 - $7,341 - $8,937 $68,910 - $88,088 - $107,245Electrician/Instrumentation & Control Supervisor 30 $33.13 - $42.35 - $51.56 $5,743 - $7,341 - $8,937 $68,910 - $88,088 - $107,245Electrician/Instrumentation & Control Technician 18 $22.61 - $28.90 - $35.18 $3,919 - $5,009 - $6,098 $47,029 - $60,112 - $73,174Electrician/Instrumentation & Control Technician 22 $25.42 - $32.49 - $39.56 $4,406 - $5,632 - $6,857 $52,874 - $67,579 - $82,285Electrician/Instrumentation & Control Technician 26 $29.26 - $37.40 - $45.53 $5,072 - $6,483 - $7,892 $60,861 - $77,792 - $94,702Engineer 29 $32.02 - $40.93 - $49.83 $5,550 - $7,095 - $8,637 $66,602 - $85,134 - $103,646Engineer 33 $35.58 - $45.48 - $55.37 $6,167 - $7,883 - $9,597 $74,006 - $94,598 - $115,170Engineer 36 $38.23 - $48.86 - $59.49 $6,627 - $8,469 - $10,312 $79,518 - $101,629 - $123,739Engineer 41 $42.33 - $54.11 - $65.88 $7,337 - $9,379 - $11,419 $88,046 - $112,549 - $137,030Engineering Manager 44 $44.95 - $57.45 - $69.94 $7,791 - $9,958 - $12,123 $93,496 - $119,496 - $145,475Engineering Manager 48 $48.12 - $61.51 - $74.89 $8,341 - $10,662 - $12,981 $100,090 - $127,941 - $155,771Engineering Staff Assistant 18 $22.61 - $28.90 - $35.18 $3,919 - $5,009 - $6,098 $47,029 - $60,112 - $73,174Engineering Supervisor 29 $32.02 - $40.93 - $49.83 $5,550 - $7,095 - $8,637 $66,602 - $85,134 - $103,646Engineering Technician 18 $22.61 - $28.90 - $35.18 $3,919 - $5,009 - $6,098 $47,029 - $60,112 - $73,174Engineering Technician 20 $24.41 - $31.20 - $37.98 $4,231 - $5,408 - $6,583 $50,773 - $64,896 - $78,998Engineering Technician 23 $26.81 - $34.27 - $41.72 $4,647 - $5,940 - $7,231 $55,765 - $71,282 - $86,778Engineering Technician 25 $28.64 - $36.61 - $44.57 $4,964 - $6,346 - $7,725 $59,571 - $76,149 - $92,706Equipment Mechanic 20 $24.41 - $31.20 - $37.98 $4,231 - $5,408 - $6,583 $50,773 - $64,896 - $78,998Equipment Mechanic 25 $28.64 - $36.61 - $44.57 $4,964 - $6,346 - $7,725 $59,571 - $76,149 - $92,706Facilities Maintenance Worker 12 $17.17 - $21.94 - $26.71 $2,976 - $3,803 - $4,630 $35,714 - $45,635 - $55,557Facilities Maintenance Worker 14 $18.86 - $24.11 - $29.35 $3,269 - $4,179 - $5,087 $39,229 - $50,149 - $61,048Facilities Maintenance Worker 17 $21.65 - $27.67 - $33.69 $3,753 - $4,796 - $5,840 $45,032 - $57,554 - $70,075Facilities Maintenance Worker 17L $22.73 - $29.05 - $35.37 $3,940 - $5,035 - $6,131 $47,278 - $60,424 - $73,570Facilities Maintenance Specialist 23 $26.81 - $34.27 - $41.72 $4,647 - $5,940 - $7,231 $55,765 - $71,282 - $86,778General Manager/Chief Executive Officer (1) Uncl. * - * - $96.97 * - * - $16,808 * - * - $201,698GIS/Mapping Administrator 33 $35.58 - $45.48 - $55.37 $6,167 - $7,883 - $9,597 $74,006 - $94,598 - $115,170GIS/CAD Specialist 20 $24.41 - $31.20 - $37.98 $4,231 - $5,408 - $6,583 $50,773 - $64,896 - $78,998GIS/CAD Specialist 22 $25.42 - $32.49 - $39.56 $4,406 - $5,632 - $6,857 $52,874 - $67,579 - $82,285GIS/CAD Specialist 24 $27.43 - $35.06 - $42.68 $4,755 - $6,077 - $7,398 $57,054 - $72,925 - $88,774Human Resources Specialist 20 $24.41 - $31.20 - $37.98 $4,231 - $5,408 - $6,583 $50,773 - $64,896 - $78,998Human Resources Specialist 25 $28.64 - $36.61 - $44.57 $4,964 - $6,346 - $7,725 $59,571 - $76,149 - $92,706Industrial Code Compliance Specialist 20 $24.41 - $31.20 - $37.98 $4,231 - $5,408 - $6,583 $50,773 - $64,896 - $78,998Industrial Code Compliance Specialist 23 $26.81 - $34.27 - $41.72 $4,647 - $5,940 - $7,231 $55,765 - $71,282 - $86,778
PADRE DAM MUNICIPAL WATER DISTRICT Fiscal Year Budget 2014-2015
Job Classification Schedule for All EmployeesExhibit A
Resolution 2014-17

CLASSIFICATIONMin. Mid. Max. Min. Mid. Max. Min. Mid. Max.
Salary Grade
HOURLY PAY RANGE* MONTHLY PAY RANGE ANNUAL PAY RANGE
Information Systems Manager 44 $44.95 - $57.45 - $69.94 $7,791 - $9,958 - $12,123 $93,496 - $119,496 - $145,475Information Systems Technicial Specialist 20 $24.41 - $31.20 - $37.98 $4,231 - $5,408 - $6,583 $50,773 - $64,896 - $78,998Information Systems Technicial Specialist 24 $27.43 - $35.06 - $42.68 $4,755 - $6,077 - $7,398 $57,054 - $72,925 - $88,774Information Systems Technicial Specialist 30 $33.13 - $42.35 - $51.56 $5,743 - $7,341 - $8,937 $68,910 - $88,088 - $107,245Information Systems Technicial Specialist 30L $34.79 - $44.47 - $54.14 $6,030 - $7,708 - $9,384 $72,363 - $92,498 - $112,611Laboratory Analyst 14 $18.86 - $24.11 - $29.35 $3,269 - $4,179 - $5,087 $39,229 - $50,149 - $61,048Laboratory Analyst 20 $24.41 - $31.20 - $37.98 $4,231 - $5,408 - $6,583 $50,773 - $64,896 - $78,998Laboratory Analyst 22 $25.42 - $32.49 - $39.56 $4,406 - $5,632 - $6,857 $52,874 - $67,579 - $82,285Laboratory Analyst, Senior 31 $33.60 - $42.95 - $52.29 $5,824 - $7,445 - $9,064 $69,888 - $89,336 - $108,763Laboratory Analyst, Senior 31L $35.28 - $45.09 - $54.90 $6,115 - $7,816 - $9,516 $73,382 - $93,787 - $114,192Meter Services Administrator 29 $32.02 - $40.93 - $49.83 $5,550 - $7,095 - $8,637 $66,602 - $85,134 - $103,646Meter Shop Supervisor 25 $28.64 - $36.61 - $44.57 $4,964 - $6,346 - $7,725 $59,571 - $76,149 - $92,706Meter Technician 14 $18.86 - $24.11 - $29.35 $3,269 - $4,179 - $5,087 $39,229 - $50,149 - $61,048Meter Technician 16 $20.60 - $26.33 - $32.06 $3,571 - $4,564 - $5,557 $42,848 - $54,766 - $66,685Meter Technician 18 $22.61 - $28.90 - $35.18 $3,919 - $5,009 - $6,098 $47,029 - $60,112 - $73,174Operations Manager 45 $46.22 - $59.07 - $71.92 $8,011 - $10,239 - $12,466 $96,138 - $122,866 - $149,594Park & Recreation Coordinator 10 $15.15 - $19.37 - $23.59 $2,626 - $3,357 - $4,089 $31,512 - $40,290 - $49,067Park & Recreation Coordinator 12 $17.17 - $21.94 - $26.71 $2,976 - $3,803 - $4,630 $35,714 - $45,635 - $55,557Park & Recreation Coordinator 14 $18.86 - $24.11 - $29.35 $3,269 - $4,179 - $5,087 $39,229 - $50,149 - $61,048Park & Recreation Coordinator 14L $19.80 - $25.31 - $30.82 $3,432 - $4,387 - $5,342 $41,184 - $52,645 - $64,106Park & Recreation Manager 36 $38.23 - $48.86 - $59.49 $6,627 - $8,469 - $10,312 $79,518 - $101,629 - $123,739Park & Recreation Supervisor 19 $23.15 - $29.59 - $36.02 $4,013 - $5,129 - $6,243 $48,152 - $61,547 - $74,922Park & Recreation Aide 5 $10.91 - $13.95 - $16.98 $1,891 - $2,418 - $2,943 $22,693 - $29,016 - $35,318Plant Manager 35 $37.27 - $47.63 - $57.99 $6,460 - $8,256 - $10,052 $77,522 - $99,070 - $120,619Recycled Water Operations Supervisor 27 $30.51 - $39.00 - $47.49 $5,288 - $6,760 - $8,232 $63,461 - $81,120 - $98,779Recycled Water Operator 14 $18.86 - $24.11 - $29.35 $3,269 - $4,179 - $5,087 $39,229 - $50,149 - $61,048Recycled Water Operator 17 $21.65 - $27.67 - $33.69 $3,753 - $4,796 - $5,840 $45,032 - $57,554 - $70,075Recycled Water Operator 20 $24.41 - $31.20 - $37.98 $4,231 - $5,408 - $6,583 $50,773 - $64,896 - $78,998Recycled Water Operator 23 $26.81 - $34.27 - $41.72 $4,647 - $5,940 - $7,231 $55,765 - $71,282 - $86,778Recycled Water Operator/Instrumentation Technician 25 $28.64 - $36.61 - $44.57 $4,964 - $6,346 - $7,725 $59,571 - $76,149 - $92,706Recycled Water Technician 20 $24.41 - $31.20 - $37.98 $4,231 - $5,408 - $6,583 $50,773 - $64,896 - $78,998Right of Way Agent 25 $28.64 - $36.61 - $44.57 $4,964 - $6,346 - $7,725 $59,571 - $76,149 - $92,706Right of Way Agent 27 $30.51 - $39.00 - $47.49 $5,288 - $6,760 - $8,232 $63,461 - $81,120 - $98,779Right of Way Agent 30 $33.13 - $42.35 - $51.56 $5,743 - $7,341 - $8,937 $68,910 - $88,088 - $107,245Safety & Risk Manager 31 $33.60 - $42.95 - $52.29 $5,824 - $7,445 - $9,064 $69,888 - $89,336 - $108,763Safety & Risk Manager 40 $41.14 - $52.58 - $64.01 $7,131 - $9,114 - $11,095 $85,571 - $109,366 - $133,141
PADRE DAM MUNICIPAL WATER DISTRICT Fiscal Year Budget 2014-2015
Job Classification Schedule for All EmployeesExhibit A
Resolution 2014-17

CLASSIFICATIONMin. Mid. Max. Min. Mid. Max. Min. Mid. Max.
Salary Grade
HOURLY PAY RANGE* MONTHLY PAY RANGE ANNUAL PAY RANGE
SCADA Technician 28 $30.85 - $39.43 - $48.00 $5,347 - $6,835 - $8,320 $64,168 - $82,014 - $99,840SCADA Technician 30 $33.13 - $42.35 - $51.56 $5,743 - $7,341 - $8,937 $68,910 - $88,088 - $107,245Staff Support (Minimum Wage) N/A $8.00 - * - * $1,387 - * - * $16,640 - * - *Systems Operator/Technician 18 $22.61 - $28.90 - $35.18 $3,919 - $5,009 - $6,098 $47,029 - $60,112 - $73,174Systems Operator/Technician 19 $23.15 - $29.59 - $36.02 $4,013 - $5,129 - $6,243 $48,152 - $61,547 - $74,922Systems Operator/Technician 21 $24.94 - $31.87 - $38.80 $4,323 - $5,524 - $6,725 $51,875 - $66,290 - $80,704Systems Operator/Technician 23 $26.81 - $34.27 - $41.72 $4,647 - $5,940 - $7,231 $55,765 - $71,282 - $86,778Systems Operator/Technician 23L $28.15 - $35.98 - $43.81 $4,879 - $6,237 - $7,594 $58,552 - $74,838 - $91,125Utility Worker 14 $18.86 - $24.11 - $29.35 $3,269 - $4,179 - $5,087 $39,229 - $50,149 - $61,048Utility Worker 17 $21.65 - $27.67 - $33.69 $3,753 - $4,796 - $5,840 $45,032 - $57,554 - $70,075Warehouse Specialist 18 $22.61 - $28.90 - $35.18 $3,919 - $5,009 - $6,098 $47,029 - $60,112 - $73,174Warehouse Specialist 20 $24.41 - $31.20 - $37.98 $4,231 - $5,408 - $6,583 $50,773 - $64,896 - $78,998Warehouse Specialist 20L $25.63 - $32.76 - $39.88 $4,443 - $5,678 - $6,913 $53,310 - $68,141 - $82,950Warehouse Worker 16 $20.60 - $26.33 - $32.06 $3,571 - $4,564 - $5,557 $42,848 - $54,766 - $66,685Wastewater Collection Systems Worker 14 $18.86 - $24.11 - $29.35 $3,269 - $4,179 - $5,087 $39,229 - $50,149 - $61,048Wastewater Collection Systems Worker 17 $21.65 - $27.67 - $33.69 $3,753 - $4,796 - $5,840 $45,032 - $57,554 - $70,075Wastewater Collection Systems Worker 18 $22.61 - $28.90 - $35.18 $3,919 - $5,009 - $6,098 $47,029 - $60,112 - $73,174Wastewater Collection Systems Worker 20 $24.41 - $31.20 - $37.98 $4,231 - $5,408 - $6,583 $50,773 - $64,896 - $78,998Water Quality Compliance Specialist 23 $26.81 - $34.27 - $41.72 $4,647 - $5,940 - $7,231 $55,765 - $71,282 - $86,778Water Quality Compliance Specialist 23L $28.15 - $35.98 - $43.81 $4,879 - $6,237 - $7,594 $58,552 - $74,838 - $91,125Water Quality Specialist 23 $26.81 - $34.27 - $41.72 $4,647 - $5,940 - $7,231 $55,765 - $71,282 - $86,778
After Hours Duty Pay: $239.2700
(1) The General Manager's pay is not adjusted for COLA; it is approved by the Board as part of the GM’s employment contract reviewed annually.
* This schedule is for Year 3 only. In accordance with the MOU each year will be based on the February San Diego CPI-W.
PADRE DAM MUNICIPAL WATER DISTRICT Fiscal Year Budget 2014-2015
Job Classification Schedule for All EmployeesExhibit A
Resolution 2014-17

SALARY GRADE Min. Mid. Max.
SALARY GRADE Min. Mid. Max.
5 $10.91 13.9500$ 16.9800$ 26 29.2600$ 37.4000$ 45.5300$
6 $11.79 15.0700$ 18.3400$ 27 30.5100$ 39.0000$ 47.4900$
7 12.6600$ 16.1800$ 19.6900$ 27L 32.0400$ 40.9600$ 49.8700$
8 13.5300$ 17.3000$ 21.0700$ 28 30.8500$ 39.4300$ 48.0000$
9 14.4000$ 18.4100$ 22.4200$ 29 32.0200$ 40.9300$ 49.8300$
10 15.1500$ 19.3700$ 23.5900$ 30 33.1300$ 42.3500$ 51.5600$
11 16.1500$ 20.6500$ 25.1400$ 30L 34.7900$ 44.4700$ 54.1400$
12 17.1700$ 21.9400$ 26.7100$ 31 33.6000$ 42.9500$ 52.2900$
13 17.9000$ 22.8800$ 27.8500$ 31L 35.2800$ 45.0900$ 54.9000$
14 18.8600$ 24.1100$ 29.3500$ 32 34.4700$ 44.0600$ 53.6500$
14L 19.8000$ 25.3100$ 30.8200$ 33 35.5800$ 45.4800$ 55.3700$
15 19.9400$ 25.4800$ 31.0200$ 34 36.2200$ 46.3000$ 56.3700$
16 20.6000$ 26.3300$ 32.0600$ 35 37.2700$ 47.6300$ 57.9900$
17 21.6500$ 27.6700$ 33.6900$ 36 38.2300$ 48.8600$ 59.4900$
17L 22.7300$ 29.0500$ 35.3700$ 37 38.9800$ 49.8200$ 60.6600$
18 22.6100$ 28.9000$ 35.1800$ 38 39.7100$ 50.7600$ 61.8000$
19 23.1500$ 29.5900$ 36.0200$ 39 40.5800$ 51.8700$ 63.1600$
20 24.4100$ 31.2000$ 37.9800$ 40 41.1400$ 52.5800$ 64.0100$
20L 25.6300$ 32.7600$ 39.8800$ 41 42.3300$ 54.1100$ 65.8800$
21 24.9400$ 31.8700$ 38.8000$ 42 43.2000$ 55.2200$ 67.2300$
22 25.4200$ 32.4900$ 39.5600$ 43 44.0800$ 56.3300$ 68.5800$
23 26.8100$ 34.2700$ 41.7200$ 44 44.9500$ 57.4500$ 69.9400$
23L 28.1500$ 35.9800$ 43.8100$ 45 46.2200$ 59.0700$ 71.9200$
24 27.4300$ 35.0600$ 42.6800$ 46 46.3000$ 59.1800$ 72.0600$
25 28.6400$ 36.6100$ 44.5700$ 47 47.5700$ 60.8000$ 74.0200$
26 29.2600$ 37.4000$ 45.5300$ 48 48.1200$ 61.5100$ 74.8900$
* This schedule is for Year 3 only. In accordance with the MOU each year will be based on the February San Diego CPI-W.
HOURLY WAGES BY GRADE*
PADRE DAM MUNICIPAL WATER DISTRICT Fiscal Year Budget 2014-2015
Job Classification Schedule for All EmployeesExhibit A
Resolution 2014-17