Draft Budget Tables Fiscal Year 2016/17 - Ministry of Finance ...
Upload
khangminh22Category
view
6download
0
Think. Learn. Grow.
FISCAL YEAR 2021-2022
PRELIMINARY BUDGETAND
FINANCIAL STATEMENTS

FISCAL YEAR 2022 PRELIMINARY BUDGET & FINANCIAL STATEMENTS
March 26, 2021
BOARD OF DIRECTORS Dwana Bradley, Chair
Rob X. Barron, Vice Chair Teree Caldwell-Johnson
Kalyn Cody Kyrstin Delagardelle Kimberly Martorano
Kelli Soyer
Dr. Thomas M. Ahart, Superintendent
Report issued by Shashank Aurora, Chief Financial Officer
Office of Business and Finance (515) 242-7745
2100 Fleur Drive Des Moines, Iowa 50321

TABLE OF CONTENTS
PART 1: Executive Summary Organizational Summary ................................................................................................................................. 7 Financial Summary ..........................................................................................................................................19 Informational Summary .................................................................................................................................29
PART 2: Organizational Section Des Moines: A Vibrant & Diverse City ......................................................................................................36 Des Moines Public Schools: A Leader in Urban Education ...................................................................38 District Governance & Leadership .............................................................................................................43 Des Moines Public Schools: Vision for the Future ..................................................................................51 Financial Policies, Budgetary Assumptions & Constraints .....................................................................54 Budget Process ................................................................................................................................................68 Fund Structures & Descriptions ..................................................................................................................79
PART 3: Financial Section Summary All Funds .........................................................................................................................................86 Consolidated Fund Balances .........................................................................................................................96 Fund Balances ..................................................................................................................................................96 Revenues & Expenditures .......................................................................................................................... 133 Long-Range Financial Plans ........................................................................................................................ 160
PART 4: Informational Section Des Moines Public Schools: At a Glance ................................................................................................ 168 Property Taxes ............................................................................................................................................. 178 Capital Improvement & Bonding .............................................................................................................. 188 Personnel ....................................................................................................................................................... 272 Glossary ......................................................................................................................................................... 196 Acronyms ...................................................................................................................................................... 201 Proposed Filing for the Certified Budget ............................................................................................... 205
2021 - 2022 Preliminary Budget 3

P R E L I M I N A RY B U D G E T 2 0 2 1 - 2 0 2 2
EXECUTIVE SUMMARY

WELCOME MESSAGE
March 26, 2021
Members of the Board Dwana Bradley, Chair Rob X. Barron, Vice Chair Teree Caldwell-Johnson Kalyn Cody Kyrstin Delagardelle Kimberly Martorano Kelli Soyer
When Des Moines Public Schools was preparing its budget last Spring, the impact of the COVID-19 pandemic was just starting to be felt. In the span of a week, DMPS transitioned to a new modality of teaching and learning to best protect the tens of thousands of teachers, students, families, and community members who are impacted by the work of the district. Little did anyone know then that this global crisis would continue for more than a year. From the sickness and death caused by the virus, to the impact it has had on the economy, to changes in so many parts of daily life – including education – this past year has been unlike anything any of us have ever experienced.
Things are beginning to look hopeful, however. The number of COVID-19 cases are trending downward, and people are being vaccinated across the country. The district, through its community partnerships, was able to host multiple vaccination events for DMPS staff, bringing us one step closer to a life post-pandemic. At DMPS, nearly two-thirds of students are back in the classroom, and the rest have chosen to learn online. Slowly but surely, life is beginning to return to normal.
What normal will look like in the future remains to be seen. As a direct result of COVID-19, the district is down approximately 1,000 students. In addition, the Iowa Legislature put forth bills that could directly impact enrollment in Des Moines. Student enrollment affects the amount of state aid received by the district, which is the district’s largest single source of revenue. Given the dramatic decrease in enrollment experienced, the district will utilize a Budget Guarantee for FY 2022. A Budget Guarantee is the minimum amount of budget authority given to the district by the State, regardless of enrollment declines and changes to the State-calculated cost per pupil. The guarantee is a calculation based on the previous year’s budget wherein the new budget cannot be less than 101% of the previous year’s budget authority. The Budget Guarantee is funded locally through property taxes.
2021 - 2022 Preliminary Budget 5

In developing the budget for FY 2022 and beyond, it is unknown how many students who did not enroll in 2020-21 will return and how many students will choose to open enroll out of Des Moines, if all potential legislative acts come to fruition. After analyzing several scenarios, the district settled on a projected enrollment count that is reasonable, given the information available, and developed a balanced budget that meets the needs of students. One of our priorities is to maintain a fiscally-sound organization, while accelerating improvements to student outcomes. However, the past several years of the under-funding of public education in Iowa is taking a toll.
Most General Fund revenue, generated from both State and Local sources, is controlled by the State Foundation Formula. Supplemental State Aid is the annual percent of growth that is calculated into the State Foundation Formula. The state controls the maximum amount districts can spend annually through the Spending Authority function. One of the few ways Spending Authority can grow is through an increase in Supplemental State Aid. Supplemental State Aid is vital as costs paid for with General Fund dollars – such as health care, other compensation components, fuel costs, and the cost of goods and services – continue to rise. Supplemental State Aid has been abysmal over the past decade. The real fear is that 0-2% Supplemental State Aid is the “new normal” school districts are facing, and the years of regular 4% increases to Supplemental State Aid are a thing of the past. School districts have also experienced increased state categorical funding that can only be spent on certain programs, not for general education purposes.
FY 2022 is the third year of planned expenditure reductions. Based on General Fund forecasting models, the district resolved to implement aggressive expenditure reductions, spread over several years, to reach the Board target for Spending Authority. Each year, the district has evaluated the need for and amount of reductions to be made. While the district was on-track to meet the Board target for Spending Authority, as a direct result of COVID-19, the district is down approximately 1,000 students. This is the largest single decrease to enrollment in decades and will impact the district in FY 2022 and potentially for years beyond. Given all current financial conditions, the district will reduce $15 million in expenditures for FY 2022, with $14 million in reductions thereafter. This plan continues to move the district toward achieving the Board target for Spending Authority.
As in previous years, the district has worked tirelessly to identify areas where these reductions can be made with the least impact on students and staff. The preliminary budget takes these conditions into consideration and presents a plan that will maintain the financial health of the district, while continuing to support the Board’s priorities in our efforts to improve the education students receive and the opportunities available to them in Des Moines.
2021 - 2022 Preliminary Budget 6

ORGANIZATIONAL SUMMARY
DISTRICT MISSION & GOALS
DMPS developed its Student Expectations and Board Beliefs with public input through a series of community conversations. Student Expectations are deliverables that address educational goals and specific desired outcomes for students. Board Beliefs emphasize the governance of school operations and focus of the district’s work on behalf of Des Moines students.
Mission The Des Moines Public Schools exists so that graduates possess the knowledge, skills, and abilities to be successful at the next stage of their lives.
Vision To be the model for urban education in the United States.
Student Expectations 1. Students demonstrate proficiency and understanding of a rigorous core curriculum:
A. They demonstrate proficiency in reading, writing, speaking, and listening.B. They demonstrate proficiency in mathematics, including algebra and geometry.C. They demonstrate financial and economic literacy.D. They demonstrate an understanding of the value of fine and performing arts in society.E. They demonstrate proficiency in technological and information literacy.F. They demonstrate proficiency in science, including life, earth, and physical science.
2. Students possess the knowledge and skills to be self-directed and autonomous:A. They demonstrate critical thinking and problem solving skills.B. They exercise sound reasoning in making complex choices.C. They exhibit creative, innovative, and entrepreneurial thinking.D. They understand the attributes of physical and mental well-being.
3. Students have world awareness:A. They learn from and work with individuals representing diverse cultures and religions in a
spirit of mutual respect in school, work, and community.B. They understand the rights and obligations of citizenship at local, state, national, and global
levels.C. They are actively engaged in community life.D. They are exposed to languages and cultures of the world.
2021 - 2022 Preliminary Budget 7
Board Beliefs 1. We believe in every child and, no matter their circumstance, will support them in achieving at their highest level.
• DMPS will work to ensure our students are career and post-secondary education ready, that they possess the knowledge and skills to be self-directed and autonomous, and they have world awareness with exposure to languages and cultures of the world.
2. We believe all students will have the best staff working to provide and support their education. • DMPS will be a best place to work, committed to recruiting, developing, retaining, and
recognizing high quality staff in a climate and culture where people are able to do their best work.
3. We believe in the full engagement of our parents and community in the support of our students’ education. • DMPS will commit to the support, training, and tools needed to maximize engagement
opportunities with our parents and the entire community.
4. We believe, as a community, in providing the resources necessary to offer PK-12 education of the highest quality. • DMPS will work, proactively and creatively, with the community to assure the proper
investment in our commitment to our children.
5. We believe first-rate facilities are essential to quality education. • DMPS is committed to facilities, as centers of our community and neighborhoods, which
offer safe, healthy, well-run, and creative learning environments.
6. We believe in a school district that operates with transparency, accountability, and efficiency at every level. • DMPS is committed to operating in an atmosphere of full-disclosure to ensure transparency,
accountability, and efficiency.
Board SMART Goals In Des Moines Public Schools, every student is expected to succeed academically, socially, and emotionally. However, opportunity gaps, which often result in achievement gaps, persist for several student populations. While many factors contribute to these disproportionate outcomes, the district cannot regard these outcomes as outside of the district’s locus of control. To serve all students, the district must intentionally focus on student populations experiencing the biggest disparities in opportunity and outcomes.
During the 2018-19 school year, the Des Moines School Board facilitated a number of public sessions that engaged parents, community members/partners, district staff, and students to collect information around two critical questions:
• What is the impact you want our school system to make on our students? • What do you want students to know and be able to do?
Participants were then asked to list three student outcomes representative of their answers, which were collected, categorized, and prioritized.
2021 - 2022 Preliminary Budget 8

All the information gathered from those sessions, as well as a host of district data, was collaboratively reviewed and analyzed by the Board, the Superintendent, and district staff. In addition, data revealed black males have the lowest rates of achievement in the district. It does not mean that black males are low achievers, rather that the system’s performance in creating success for black males is critically low and it needs to be named and addressed. It recognizes the need for change within the system to evolve into one that does not continue to marginalize various student populations — doing things the same way and expecting different results has proven to be ineffective. As a result, the three priority areas that were determined will be analyzed through the focus lens of black male achievement.
As a result, the Board’s community engagement efforts produced specific, measurable, time-targeted goals around three priority areas.
EARLY LITERACY • Goal 1: The percent of all third grade students on track in reading will increase from 52% to
72% by June 2023, as measured by FAST.
• Goal 2: The percent of black male third grade students on track in reading will increase from 35% to 72% by June 2023, as measured by FAST.
ALGEBRA • Goal 3: The percent of black male students earning a ‘B’ or higher in Algebra 1 by the end
of 9th grade will increase from 17% to 35% by August 2023.
In addition, a fourth Board goal will be developed for social emotional learning. Much of the work of the district over the next few years will focus on meeting these goals, and DMPS staff will report to the Board on progress towards meeting each of these goals four times per year.
2021 - 2022 Preliminary Budget 9

BUDGETARY CONSIDERATIONS
Policy Governance: Management Limitations Management Limitation 2.6: Financial Planning/Budgeting Financial planning for any fiscal year or the remaining part of any fiscal year may not deviate materially from the Board’s Student Expectations Policy or risk financial jeopardy.
Accordingly, the Superintendent shall not present a budget that:
1. Falls below a 15% solvency ratio for the General Fund. 2. Falls below a 15% unspent spending ratio for the General Fund. 3. Creates a situation or condition described as unacceptable in the “Financial Conditions and
Activities.” 4. Omits credible projections of revenues and expenses and disclosure of planning
assumptions. 5. Plans the expenditure of more funds than are projected to be received in any fiscal year.
The Board revisits and revises management limitations annually.
Management Limitation 2.4: Financial Conditions & Activities With respect to actual ongoing conditions of the district’s financial resources, the Superintendent shall not cause or allow the development of fiscal jeopardy or a material deviation of actual expenditures from the Board’s Student Expectations Policy.
Accordingly, the Superintendent shall not:
1. Fail to provide quarterly summaries of the financial condition of the district. 2. Fail to settle district payroll obligations and payables in a timely manner. 3. Fail to implement prudent competitive quoting procedures for all facility improvement
projects in an amount that meets or exceeds the competitive quote threshold as established by Iowa law.
4. Fail to implement prudent competitive bidding procedures for all facility improvement projects in the amount of $100,000 or more.
5. Fail to implement prudent competitive procedures, including but not limited to RFPs, for purchasing and securing contractual and professional services.
6. Obligate the district to contracts or expenditures greater than $100,000. 7. Acquire, lease, or dispose of real property. 8. Invest funds in securities contrary to state law. 9. Allow tax payments to other governmental ordered payments or filing to be overdue or
inaccurately filed.
The Board revisits and revises management limitations annually.
2021 - 2022 Preliminary Budget 10

Critical Financial Assumptions This budget document, like prior years, incorporates financial assumptions. The assumptions, as required by Board adopted Management Limitation 2.6(4), were used to develop the budget and these assumptions are used to ensure that revenues and expenditure projections are credible.
This budget document presents analysis that follows sound budgeting principles including: • Presentation of a balanced budget. • Limited use of one-time funding to cover one-time costs as authorized by the board. • Use of ongoing funding to cover ongoing costs. • Determination of revenues and expenditures. • Alignment of expenditures incurred and related revenues earned in the same fiscal year. • Incorporation of board management limitations. • Integration of reasonable financial assumptions.
As a direct result of COVID-19, the district is down approximately 1,000 students. In addition, the Iowa Legislature put forth bills that could directly impact enrollment in Des Moines. Student enrollment impacts the amount of state aid received, which is the largest single source of revenue the district receives.
Given the dramatic decrease in enrollment experienced, the district will utilize a budget guarantee for FY 2022. A Budget Guarantee is minimum amount of budget authority given to the district by the State, regardless of enrollment declines and changes to the State-calculated cost per pupil. The guarantee is a calculation based on the previous year’s budget wherein the new budget cannot be less than 101% of the previous year’s budget authority. The Budget Guarantee is funded locally through property taxes.
In developing the budget for FY 2022 and beyond, it is unknown how many students who did not enroll in 2020-21 will return and how many students will choose to open enroll out of Des Moines. After analyzing several scenarios, the district settled on a projected enrollment count that is reasonable, given the information available, and developed a balanced budget. After the Aid & Levy is finalized in June, the district may amend the budget, if needed.
The district monitors key finical indicators, forecasts, and issues that have a major impact on district finances, including the district’s spending authority and solvency ratios, Supplemental State Aid, the property tax rate, property valuations, and the General Fund forecast. In addition, the district is facing some significant financial issues that must be addressed to maintain the long-term financial health of the district, while continuing to take steps to improve student outcomes. One of the priorities of the school district is to maintain a vital, fiscally sound organization so that students continue receive education in a robust, supportive environment that is conducive to teaching and learning. The district strives to make student-centered decisions in all areas of operation.
2021 - 2022 Preliminary Budget 11

To maintain long-term financial health, current expenditures cannot exceed current revenues. Consequently, the district must make strategic decisions to align expenditures with revenues in the most effective and efficient way possible. There are two, associated dynamics spurring these efforts: the district’s spending authority and the amount of Supplemental State Aid received from the state.
Supplemental State Aid The General Fund is the largest fund in the district and accounts for 78.5% of all revenues received by the district. The sources General Fund of revenue are state funds, local funds (including property tax), federal funds, and intermediary sources. Collectively, 90.5% of General Fund revenue comes from state or local sources. Most those dollars are driven by the State Foundation Formula, growth of which is controlled by Supplemental State Aid. Supplemental State Aid is the annual percent of growth that is calculated into the foundation formula.
State Foundation Aid regulated funding paid by the state to school districts to provide equal funding on a per pupil basis. It is a significant component of the District Combined Cost, the first major element of a district’s Spending Authority. The State Foundation Aid formula also funds other special programs — also known as weighted funded programs — based on enrollment adjusted by a weighting factor, then multiplied by the cost per student. These programs include Special Education, Shared Programs, English Language Learners, Gifted and Talented, At-Risk programming, and Home School Instruction.
The annual amount of State Foundation Aid is driven by Supplemental State Aid. Supplemental State Aid is the annual percent of growth that is calculated into the foundation formula. From 1973 – 1994, the average annual growth in school funding was 6.42%. From 1995 – 2010, when allowable growth was no longer set by a formula but became a legislatively passed item, the rate of annual growth decreased to 3.22% From 2011 – 2020, the average annual growth in State Aid has been 1.86%. The real fear is that 0-2% Supplemental State Aid is the “new normal” school districts are facing, and the years of regular 4% increases to Supplemental State Aid are a thing of the past. School districts have also experienced increased state categorical funding (such as TLC funding) that can only be spent on certain programs, not for general education purposes.
0%2%4%6%8%
10%12%14%16%
ANNUAL SUPPLEMENTAL STATE AID1973 – 1994 Average Annual Growth: 6.22% 1995 – 2010 Average Growth: 3.29% 2011 – 2021 Average: 1.86%
2021 - 2022 Preliminary Budget 12

The district is budgeting for a 2.4% annual growth to Supplemental State Aid in FY 2022. While this is an improvement from last year, it is woefully inadequate. Supplemental State Aid is vital as costs paid for with funding from the General Fund — such as health care, other compensation components, fuel costs, and cost of goods and services — continue to rise.
Spending Authority Iowa uses a school finance formula that sets the maximum amount a district is authorized to spend and certify on a budget for a fiscal year. A district’s spending authority is the sum of the district’s combined cost and miscellaneous income for the budget year plus the unspent balance from the previous year. Under the spending authority control, it is illegal for a school district to exceed its maximum authorized budget. It is important to understand that the limit on spending is the amount of spending authority a district has, not the amount of cash or fund balance a district has.
The unspent spending authority ratio is a measure of the district’s unbudgeted authorized spending capacity (not cash reserves) and is defined as the district’s unspent spending authority divided by the district’s maximum budget authority. The IASB recommends this ratio be in the target range of 10-20%. The Board adopted guidelines in FY 2012 setting the target for the district’s unspent spending authority ratio at 10%; in 2015 the Board raised this target to 15%.
Spending authority is directly tied to student enrollment, and there are only three general means by which the district’s spending authority can grow: (1) increased State Supplemental Aid, (2) increased enrollment, or (3) increased miscellaneous income. In situations where spending authority is not growing, if no adjustments are made to expenses, the unspent budget is tapped into to cover expenses. The significant predicament this creates is the decrease in the district’s maximum authorized budget, as it is illegal for a school district to exceed its maximum authorized budget.
In FY 2017, the district’s forecasting model indicated that if Supplemental State Aid continued to grow by 1%, as had been the trend, by 2019, expenses would exceed Spending Authority by more than $5 million (and rising) each year, if changes were not made. Consequently, the district cut expenditures for three years to stay within compliance of the spending authority function.
To develop the budget for FY 2020 and beyond, the district modeled out numerous scenarios that outlined the impact Supplemental State Aid, inflation, compensation, and expenditure reductions have on district’s unspent authorized budget. Thereafter, the district settled on one set of likely variables and modeled out multiple scenarios with the focus on returning the district to a Spending Authority Ratio that meets the Board’s target of 15%. Based on those models, the district resolved to implement aggressive expenditure reductions spread over a number of years to reach the Board target.
FY 2022 is the third year of the planned expenditure reductions. Each year, the district has evaluated the need for and amount of reductions to be made. The original strategy was to cut $24M for three consecutive fiscal years. The district revised its strategy in FY 2021 to be a $24M reduction in year
2021 - 2022 Preliminary Budget 13

one, followed by $14M in reductions for the next three years. After making the aggressive expenditure reductions in FY 2020 and FY 2021, the district was on track to reach the Board Target.
Going into budget planning for FY 2022, the district again reviewed conditions to determine if things had improved, deteriorated, or remained unchanged to determine adjustments to targets and goals for the district’s budget and Spending Authority. While the district was on-track to meet the Board target for Spending Authority, the COVID-19 pandemic began, impacting all areas of district operation, including student enrollment. As a direct result of COVID-19, the district is down approximately 1,000 students. This is the largest single decrease in decades and will impact the district in FY 2022 and potentially for years beyond. What is unknown is how many of the approximate 1,000 students will enroll in DMPS in fall 2021. In addition to the enrollment impact due to the global pandemic, the Iowa Legislature has also put forth bills that could directly impact enrollment in Des Moines. DMPS currently operates under a voluntary diversity plan. The proposed legislation would eliminate that diversity plan, thereby potentially increasing the number of students who choose to open enroll out of Des Moines. It is unknown how many students would choose to open enroll out of Des Moines if the voluntary diversity plan is eliminated. Another proposed piece of legislation would introduce a “Student First Scholarship Program” that would allow students to utilize a voucher to pay tuition to a private school. It is unknown how many students would choose to utilize a voucher to enroll in a private school.
While the final impact of these three enrollment variables are unknown, the district modeled various scenarios on the potential impact. The most likely scenario is built into the district’s long-term forecast, and the district continued to evaluate conditions and adjust accordingly while planning for FY 2022. Given all currently financial conditions, the district will reduce $15 million in expenditures for FY 2022, with $14 million in reductions thereafter. This plan continues to move the district toward achieving the Board target for Spending Authority. The district is projected to end FY 2021 with an unspent Spending Authority Ratio of 7.4% and is forecasting the FY 2022 unspent Spending Authority Ratio to be 11.5%
0.0%
5.0%
10.0%
15.0%
20.0%
$-
$20,000,000
$40,000,000
$60,000,000
$80,000,000
FY 2013 FY 2014 FY 2015 FY 2016 FY 2017 FY 2018 FY 2019 FY 2020 FY 2021(est.)
FY 2022(forecast)
SPENDING AUTHORITY
Unspent Authorized Budget Unspent Spending Authority School Board Target
2021 - 2022 Preliminary Budget 14

Solvency Ratio The district’s solvency ratio is a moment-in-time (June 30) measurement of the district’s General Fund financial health. The solvency ratio is measure of the district’s fund equity position and is defined as the unreserved, undesignated fund balance (commonly referred to as the cash reserves) divided by the district’s total General Fund revenues, less AEA flow-through.
The Iowa Association of School Boards (IASB) considers a solvency ratio of 5-10% within “Target” or “Good” and therefore “can handle the unexpected.” GFOA guidelines are 10-17%. During the 2012-13 school year, the School Board approved a minimum target of 15.0% for the district’s solvency ratio. Board guidelines state that the solvency ratio should not go below 3%, without prior knowledge of the Board. The solvency ratio for the district increased at year end 2020 to 21.0%, up from 15.1% the prior year. The solvency ratio for FY 2021 is projected to end at 25.4%, and the solvency ratio is forecasted to be at 27.5% for FY 2022.
0%
10%
20%
30%
40%
FY 2013 FY 2014 FY 2015 FY 2016 FY 2017 FY 2018 FY 2019 FY 2020 FY 2021(est.)
FY 2022(forecast)
SOLVENCY RATIO
Solvency Ratio Target Solvency Ratio
2021 - 2022 Preliminary Budget 15

CERTIFIED BUDGET
The Superintendent submits an annual budget for consideration, deliberation, and approval by the Board of Directors no later than the first meeting in April. Iowa law requires the proposed budget (i.e., the certified budget) to be filed with the Polk County Auditor by April 15 of each year. The “proposed/certified budget” provides data that is the basis of the school property tax levy to begin on July 1 and run through June 30 of the following calendar year. In addition, the certified budget establishes the legal expenditure limit in each of the district’s various expenditure categories. The Superintendent and/or designated representative is authorized to administer specific expenditures only after the official adoption of the certified budget by the Board. The proposed budget for certification is included in the Appendix.
Legal Requirements for Budget Publication, Review, and Certification A public hearing is held prior to the required budget certification each year to receive public comment on the budget document. On or before April 15 of each year, Iowa Code Sections 24.9 and 24.17 require the district to accomplish the following:
1. The school district must publish a notice with the location, date, and time for the public hearing at least ten (10) days but no later than twenty (20) days prior to the public hearing.
2. The school district must hold a public hearing. 3. Upon receiving the required certification by the Board, the certified budget must be filed
with the county auditor no later than April 15.
In meeting the filing requirement of April 15, it is necessary to re-estimate miscellaneous incomes and expenditures for the current fiscal year as well as initially estimate miscellaneous incomes and expenditures for the next fiscal year. Because the process requires making estimates as many as fifteen months in advance, it may be necessary to amend the budget to change the legal expenditures limit in some of the various categories.
In the event the budget is amended, the legal expenditures limit can only be increased to use un-anticipated miscellaneous incomes or prior year unused funds. The current fiscal year school property tax levy is final and cannot be increased. The district is proposing the maximum tax levy. This levy can be amended to be lower amount, but it cannot be increased.
2021 - 2022 Preliminary Budget 16

Summary of Proposed Budget for Certification
The full proposed budget summary for certification is located on the final page of this document.
Summary of Publication
Revenue Total Revenue (line 21) $ 563,831,886
Beginning Balance (line 22) $ 248,267,574 Total Resources (line 23) $ 812,099,460
Expenditures Instruction (line 24) $ 283,553,293
Total Support Services (line 32A) $ 168,392,566 Non Instructional Programs (line 33) $ 25,471,638
Total Other Expenditures (line 36A) $ 76,759,532 Transfers Out (line 38) $ 24,093,997
Total Expenditures, Transfers, & Other (line 40) $ 578,271,026
Ending Fund Balance (line 41) $ 233,828,434 Total Requirements (line 42) $ 812,099,460
Proposed Tax Rate: 16.08128
2021 - 2022 Preliminary Budget 17

BUDGET CALENDAR
Building the district budget is a year-round process, beginning in the fall of the current fiscal year, and ending in October of the following fiscal year when the district and school budgets are revised per certified enrollment figures. All activities are influenced by variables including the state budget process, changes in employee compensation, and budget constraints. The following calendar of events more fully explains the budget development and approval process.
FY 2022 Budget Calendar (Actual and Projected) 2021
September – October Five year budget forecast revised with known factors
October 1 Board report: Financial Planning & Budgeting October 20 School Board work session: Budget Overview November 21 Public Forum: Community Legislative Action Team meeting
2022 January 11 Iowa Legislature convened January 12 Governor’s budget recommendations released February 16 School Board work session: Budget Development March 2 School Board work session: Budget Development
March 26 Preliminary Budget & Financial Statements published online and proposed budget published in The Des Moines Register (Note: By law, the budget must be published 10 to 20 days before the Public Hearing)
March 26 Virtual Budget Public Forum April 6 School Board meeting: Public Hearing; Board Adoption & Certification April 7-14 If necessary, Special School Board meeting: Hearing; Board Adoption & Certification April 15 Statutory deadline to submit budget to the Polk County Auditor for certification April 30 110th day of the Legislative Session June 30 Adopted Budget & Financial Statements published online July 1 Fiscal Year 2022 begins August 25 First day of the 2021-2022 school year September – October Five year forecast revised
October Student enrollment certified FY 2022 district and school budgets revised based on actual enrollment
2022 June 1 Last day of the 2021-2022 school year June 30 Fiscal Year 2022 ends
2021 - 2022 Preliminary Budget 18

FINANCIAL SUMMARY
FY 2022 BUDGET OVERVIEW
Summary All Funds, by Function
FY 2018 FY 2019 FY 2020 FY 2021Actual Actual Actual Re-estimated
RevenuesProperty Taxes 135,449,189$ 145,710,033$ 149,109,926$ 162,910,678$ State Foundation Aid 204,551,888 203,948,433 206,654,943 207,439,304AEA Flow Through 14,751,903 14,914,998 15,108,730 15,424,026Teacher Quality Act 22,343,408 22,607,625 22,860,024 23,227,383Universal 4 Year Old Preschool 5,161,268 5,206,928 5,311,360 5,670,200Teacher Leadership Supplement 10,661,186 10,793,241 10,926,212 11,115,298Early Intervention Supplement 2,987,256 3,017,810 3,041,489 3,079,377Other State Sources 2,837,965 3,246,336 2,153,616 4,525,464Title 1 Grants 14,844,628 12,809,582 12,723,002 15,213,824Other Federal Sources 41,879,538 42,106,101 45,179,877 42,686,578Tuition/Transportation Fees 8,737,225 9,035,336 8,699,706 8,349,825Earnings on Investments: 2,493,460 6,159,393 4,298,403 1,709,174Student Activities 2,591,759 2,372,198 1,627,855 837,400Nutrition Program Sales 1,809,971 1,514,191 915,037 220,000Sales and Use Tax 30,706,896 33,896,019 33,985,178 32,559,592Other Revenue from Local Sources 19,801,319 19,530,709 21,960,379 16,454,443Revenue from Intermediary Sources 816,427 839,737 749,892 617,000Other Financing Sources 83,130 115,795 208,267 50,000General Long-Term Debt Proceeds 60,711,168 - - - Proceeds from Fixed Asset Disposition 243,182 1,245,595 109,531 - Transfers In 19,392,445 24,216,939 24,268,720 24,096,380
Total Revenues 602,855,210 563,286,998 569,892,148 576,185,946
Expenditures by FunctionInstruction 282,867,223 284,842,115 273,957,307 277,154,087Student Support Services 29,100,096 31,555,455 29,438,219 29,803,514Instructional Staff Support 26,701,706 26,961,329 21,983,491 22,310,237General Administration 9,204,771 9,548,869 9,917,277 9,211,959Building Administration 23,469,984 22,842,478 25,922,892 26,283,156Business and Central Administration 16,520,578 18,161,192 16,364,036 18,787,302Plant Operation & Maintenance 40,991,785 42,097,389 42,389,314 42,556,161Student Transportation 14,173,748 13,407,431 12,893,527 12,055,150Non-Instructional Expenditures 30,311,850 29,371,991 28,714,984 24,180,158Facilities Acquisition and Construction 24,437,699 25,223,502 31,202,014 32,091,853Debt Service 18,249,571 23,095,026 22,995,050 22,996,380Other Financing Uses 469,511 3,500 - - AEA Support 14,751,903 14,914,998 15,108,730 15,424,026Transfers Out 18,269,571 23,095,026 23,689,723 24,096,380
Total Expenditures 549,519,996 565,120,300 554,576,565 556,950,365
Excess of Revenues over Expenditures 53,335,215 (1,833,302) 15,315,581 19,235,581Beginning Fund Balance 162,214,500 215,549,715 213,716,413 229,031,994
Ending Fund Balance 215,549,715$ 213,716,413$ 229,031,994$ 248,267,575$
DES MOINES PUBLIC SCHOOLS2021 - 2022 BUDGET
SUMMARY ALL FUNDS — HISTORICAL SUMMARY
2021 - 2022 Preliminary Budget 19

FY 2022 FY 2023 FY 2024 FY 2025Budget Projected Projected Projected
RevenuesProperty Taxes 146,028,000$ 145,908,000$ 147,197,000$ 148,499,000$ State Foundation Aid 207,782,000 208,043,000 208,307,000 208,574,000 AEA Flow Through 16,413,000 16,577,000 16,743,000 16,911,000 Teacher Quality Act 23,037,000 23,268,000 23,500,000 23,735,000 Universal 4 Year Old Preschool 4,402,000 4,446,000 4,491,000 4,536,000 Teacher Leadership Supplement 11,038,000 11,148,000 11,260,000 11,373,000 Early Intervention Supplement 3,043,000 3,073,000 3,104,000 3,135,000 Other State Sources 3,674,000 3,710,000 3,748,000 3,785,000 Title 1 Grants 15,366,000 15,520,000 15,675,000 15,832,000 Other Federal Sources 45,510,000 45,913,000 41,522,000 42,138,000 Tuition/Transportation Fees 8,435,000 8,520,000 8,606,000 8,692,000 Earnings on Investments: 570,000 527,000 513,000 502,000 Student Activities 2,051,000 2,072,000 2,093,000 2,115,000 Nutrition Program Sales 1,300,000 1,313,000 1,326,000 1,339,000 Sales and Use Tax 32,564,000 33,205,000 33,772,000 34,179,000 Other Revenue from Local Sources 17,788,000 18,013,000 18,215,000 18,421,000 Revenue from Intermediary Sources 622,000 629,000 636,000 643,000 Other Financing Sources 115,000 116,000 117,000 118,000 General Long-Term Debt Proceeds - - - - Proceeds from Fixed Asset Disposition - - - - Transfers In 24,094,000 24,093,000 24,093,000 24,097,000
Total Revenues 563,832,000 566,095,000 564,918,000 568,622,000
Expenditures by FunctionInstruction 283,611,000 288,830,000 301,279,000 309,204,000 Student Support Services 33,339,000 34,937,000 35,552,000 33,127,000 Instructional Staff Support 22,748,000 23,203,000 23,667,000 24,140,000 General Administration 9,990,000 10,103,000 10,269,000 9,073,000 Building Administration 26,794,000 27,327,000 27,874,000 28,419,000 Business and Central Administration 19,165,000 19,524,000 19,890,000 20,263,000 Plant Operation & Maintenance 43,792,000 44,596,000 45,416,000 46,251,000 Student Transportation 12,565,000 12,777,000 12,993,000 13,212,000 Non-Instructional Expenditures 25,472,000 25,386,000 25,651,000 25,920,000 Facilities Acquisition and Construction 37,352,000 23,341,000 20,787,000 20,441,000 Debt Service 22,994,000 22,993,000 22,993,000 22,997,000 Other Financing Uses - - - - AEA Support 16,356,000 16,519,000 16,684,000 16,851,000 Transfers Out 24,094,000 24,093,000 24,093,000 24,097,000
Total Expenditures 578,271,000 573,629,000 587,147,000 593,995,000
Excess of Revenues over Expenditures (14,439,000) (7,533,000) (22,229,000) (25,373,000) Beginning Fund Balance 248,268,000 233,828,000 226,295,000 204,066,000
Ending Fund Balance 233,828,000$ 226,295,000$ 204,066,000$ 178,693,000$
SUMMARY ALL FUNDS — BUDGET AND PROJECTIONS
DES MOINES PUBLIC SCHOOLS2021 - 2022 BUDGET
2021 - 2022 Preliminary Budget 20

The graphs below outline all district revenues by fund type and fund account.
2021 - 2022 Preliminary Budget 21

The graphs below outline all district expenditures by fund type and fund account.
2021 - 2022 Preliminary Budget 22

General Fund
FY 2018 FY 2019 FY 2020 FY 2021Actual Actual Actual Re-estimated
Property Taxes 109,838,923$ 116,740,281$ 118,163,515$ 117,226,990$ Utility Replacement Tax 3,053,514 2,896,621 2,856,031 2,751,981Mobile Home Tax 93,411 97,033 92,233 103,767Military Credit 27,334 25,519 24,290 24,500Commercial & Industrial Replacement 4,210,659 4,325,577 4,307,639 4,496,286State Foundation Aid 204,551,888 203,948,433 206,654,943 207,439,304AEA Flow Through 14,751,903 14,914,998 15,108,730 15,424,026Teacher Quality Act:
Teacher Salary Supplement 19,867,000 20,103,858 20,332,335 20,663,518Teacher Quality Professional Development 2,476,408 2,503,767 2,527,689 2,563,865Early Intervention Supplement 2,987,256 3,017,810 3,041,489 3,079,377
Universal 4 Year Old Preschool 5,161,268 5,206,928 5,311,360 5,670,200TLC Grant 10,661,186 10,793,241 10,926,212 11,115,298Other State Sources 2,657,111 3,071,593 1,979,558 4,525,464Title 1 Grants 14,844,628 12,809,582 12,723,002 15,213,824Other Federal Sources 22,730,437 23,045,241 25,892,411 24,067,296Tuition/Transportation/Textbook Fees 8,737,225 9,035,336 8,699,706 8,349,825Earnings on Investments 1,771,399 3,498,790 3,670,173 1,300,000Student Activities 86,375 59,280 21,663 50,000Other Revenue from Local Sources 13,472,926 13,514,092 17,244,565 13,065,000Revenue from Intermediary Sources 816,427 839,737 749,892 617,000Proceeds from Fixed Asset Disposition 229,930 1,243,095 109,531 - Transfers In 1,142,874 1,121,913 1,273,670 1,100,000
Total Revenues 444,170,081 452,812,724 461,710,638 458,847,521
Instruction 276,584,727 272,972,771 268,288,503 272,497,869Student Support Services 28,562,340 28,219,276 29,271,585 29,703,534Instructional Staff Support 26,687,034 26,958,599 21,970,960 22,295,176General Administration 8,158,183 8,744,413 7,863,867 7,979,913Building Administration 23,293,583 22,615,700 25,869,190 26,250,935Business and Central Administration 15,620,578 17,496,098 16,139,740 16,377,910Plant Operation & Maintenance 36,033,765 36,308,544 37,161,833 37,710,219Student Transportation 11,546,060 10,574,959 9,820,005 9,963,862Non-Instructional Expenditures 1,098,492 1,338,901 1,247,165 1,261,000AEA Support 14,751,903 14,914,998 15,108,730 15,424,026Transfers Out 20,000 - 694,673 975,243
Total Expenditures 442,356,665 440,144,259 433,436,251 440,439,687
Excess of Revenues over Expenditures 1,813,416 12,668,465 28,274,387 18,407,834Beginning Fund Balance 82,303,759 84,117,175 96,785,640 125,060,027
Ending Fund Balance 84,117,175$ 96,785,640$ 125,060,027$ 143,467,861$
Expenditures by Function
Revenues
DES MOINES PUBLIC SCHOOLS2021 - 2022 BUDGET
GENERAL FUND SUMMARY — HISTORICAL SUMMARY
2021 - 2022 Preliminary Budget 23

FY 2022 FY 2023 FY 2024 FY 2025Budget Projected Projected Projected
Property Taxes 100,447,000$ 101,451,000$ 102,466,000$ 103,490,000$ Utility Replacement Tax 2,154,000 2,175,000 2,197,000 2,219,000 Mobile Home Tax 90,000 91,000 92,000 93,000 Military Credit 25,000 25,000 25,000 25,000 Commercial & Industrial Replacement 4,673,000 4,720,000 4,767,000 4,815,000 State Foundation Aid 207,782,000 208,043,000 208,307,000 208,574,000 AEA Flow Through 16,413,000 16,577,000 16,743,000 16,911,000 Teacher Quality Act:
Teacher Salary Supplement 20,499,000 20,704,000 20,911,000 21,120,000 Teacher Quality Professional Development 2,539,000 2,564,000 2,590,000 2,615,000 Early Intervention Supplement 3,043,000 3,073,000 3,104,000 3,135,000
Universal 4 Year Old Preschool 4,402,000 4,446,000 4,491,000 4,536,000 TLC Grant 11,038,000 11,148,000 11,260,000 11,373,000 Other State Sources 3,494,000 3,529,000 3,564,000 3,600,000 Title 1 Grants 15,366,000 15,520,000 15,675,000 15,832,000 Other Federal Sources 26,110,000 26,119,000 21,330,000 21,544,000 Tuition/Transportation/Textbook Fees 8,435,000 8,520,000 8,606,000 8,692,000 Earnings on Investments 250,000 253,000 256,000 259,000 Student Activities 51,000 52,000 53,000 54,000 Other Revenue from Local Sources 14,153,000 14,294,000 14,436,000 14,579,000 Revenue from Intermediary Sources 622,000 629,000 636,000 643,000 Proceeds from Fixed Asset Disposition - - - - Transfers In 1,100,000 1,100,000 1,100,000 1,100,000
Total Revenues 442,685,000 445,034,000 442,609,000 445,207,000
Instruction 266,686,000 272,275,000 284,734,000 298,181,000 Student Support Services 30,298,000 30,904,000 31,522,000 32,152,000 Instructional Staff Support 22,741,000 23,196,000 23,660,000 24,133,000 General Administration 8,140,000 8,303,000 8,469,000 8,638,000 Building Administration 26,776,000 27,312,000 27,858,000 28,415,000 Business and Central Administration 16,705,000 17,039,000 17,380,000 17,728,000 Plant Operation & Maintenance 38,464,000 39,233,000 40,018,000 40,818,000 Student Transportation 10,163,000 10,366,000 10,573,000 10,784,000 Non-Instructional Expenditures 1,274,000 1,287,000 1,300,000 1,313,000 AEA Support 16,356,000 16,519,000 16,684,000 16,851,000 Transfers Out 260,000 - - -
Total Expenditures 437,863,000 446,434,000 462,198,000 479,013,000
Excess of Revenues over Expenditures 4,822,000 (1,400,000) (19,589,000) (33,806,000) Beginning Fund Balance 143,468,000 148,290,000 146,890,000 127,301,000
Ending Fund Balance 148,290,000$ 146,890,000$ 127,301,000$ 93,495,000$
Expenditures by Function
Revenues
DES MOINES PUBLIC SCHOOLS2021 - 2022 BUDGET
GENERAL FUND SUMMARY — BUDGET AND PROJECTIONS
2021 - 2022 Preliminary Budget 24

FY 2022 GENERAL FUND REVENUE SOURCES
State, 61.0% Local Funds, 29.5% Federal, 9.4% Intermediary, 0.1%
FY 2022 GENERAL FUND EXPENDITURESInstruction, 60.9% Student Support, 22.4% Plant Operations, 8.8%
Central Administration, 3.8% AEA Flowthrough, 3.7% Non-Instruction, 0.3%
Transfers Out, 0.1%
2021 - 2022 Preliminary Budget 25

LONG-RANGE FINANCIAL PLANS
Multi-year financial planning can potentially avoid the budgetary cycle of simply putting out the next fire by providing a longer term perspective on what problems are coming and thus preventing or minimizing them. The district has identified several key issues that can affect the budget:
Spending Authority Iowa uses a school finance formula which sets the maximum amount a district is authorized to spend and certify on a budget for a fiscal year. A district’s spending authority is the sum of the district’s combined cost and miscellaneous income for the budget year plus unspent balance from the previous year. It is illegal for a district to exceed its maximum authorized budget.
Supplemental State Aid Supplemental State Aid has been abysmal over the past decade. Given the political climate in the state, the real fear is that 0-2% Supplemental State Aid is the “new normal” school district are facing, and the years of regular 4% increases to Supplemental State Aid are a thing of the past. Supplemental State Aid is vital as costs paid for with General Fund dollars — such as health care, other compensation components, fuel costs, and cost of goods and services — continue to rise.
Compensation Compensation — salaries and benefits — is the largest of all budgeted expenditures in the General Fund. The issue of compensation has several key components including cost of living for employees, rising health care costs, sustainability of the workforce, and maintaining effective programing. To address this key issue, the district has a multi-faceted approach. For example, the district conducts comprehensive negotiations with employees, conducts extensive training for staff, and is implementing a district-wide wellness program.
Cost of Goods and Services The district is focused on finding ways to do more with less and directing funds toward costs that impact students. The district has pursued multiple ways to address rising costs of goods and services including paper reduction strategies, system integration, data analysis, and energy savings.
Long-term forecasting helps the district budget for areas of operation to implement achieve Student Expectations, while staying within the Management Limitations set by the Board of Directors. The Business & Finance department reviews financial data on daily, monthly, quarterly, and annual basis. If an analysis determines that an initiative is not effective, corrective steps are taken. The Business & Finance department also completes and presents quarterly monitoring reports to the Board to demonstrate the district’s fiscal condition.
2021 - 2022 Preliminary Budget 26

General Fund Forecast
The forecast makes the following assumptions for revenues: (1) Enrollment decreases occur each year. (2) The percent of growth for Supplemental State Aid is 2.4% for FY 2022 and 1.00% for FY
2023-2025. (3) The amount of federal revenue received will decrease post-COVID.
The forecast also makes the following assumptions for expenditures: (A) Historical increases for compensation (state average) will continue. (B) Modest 1% increases for goods and services (inflation). (C) Expenditure reduction $15 million in FY 2022 and $14 million annually thereafter.
2021 - 2022 Preliminary Budget 27

Re-estimated Budget Projected Projected ProjectedFY 2018 FY 2019 FY 2020 FY 2021 FY 2022 FY 2023 FY 2024 FY 2025
Revenues with assumptions with assumptions with assumptions with assumptions Total Revenues 444,170,081 452,812,724 461,710,638 458,847,521 442,685,000 445,034,000 442,609,000 445,207,000
ExpendituresTotal Expenditures & Other Uses 442,356,665 440,144,259 433,436,251 440,439,687 437,863,000 446,434,000 462,198,000 479,013,000
Excess Revenues Over Expenditures 1,813,416 12,668,465 28,274,387 18,407,834 4,822,000 (1,400,000) (19,589,000) (33,806,000) Beginning Fund Balance 82,303,759 84,117,175 96,785,640 125,060,027 143,468,000 148,290,000 146,890,000 127,301,000
Ending Fund Balance 84,117,175 96,785,640 125,060,027 143,467,861 148,290,000 146,890,000 127,301,000 93,495,000
Solvency Ratio 12.7% 15.1% 21.0% 25.3% 27.5% 27.0% 22.5% 14.5%Unspent Spending Authority Ratio 3.0% 2.3% 5.2% 7.4% 11.5% 14.0% 14.0% 12.6%
Unspent Authorized Budget 13,687,231 10,391,630 23,811,426 35,214,678 56,689,000 72,451,000 75,178,000 69,006,000
AssumptionsSupplemental State Aid 2.40% 1.00% 1.00% 1.00%
Enrollment 31621 31933 31683 31433Inflation Increase 1.00% 1.00% 1.00% 1.00%
Compensation Increase Negotiated Negotiated Negotiated Negotiated
Expenditure Reduction $15M reductionReview; up to $14M
reduction
Review; up to $14M
reduction
Review; up to $14M
reduction
DES MOINES PUBLIC SCHOOLS2021 - 2022 BUDGET
GENERAL FUND FORECAST
2021 - 2022 Preliminary Budget 28

INFORMATIONAL SUMMARY
ENROLLMENT
For more 100 years, DMPS, accredited by the North Central Association of Secondary Schools and Colleges and the Iowa Department of Education, has educated hundreds of thousands of children in Iowa’s capital city. Peak enrollment in recent history occurred in 2001-02, followed by seven years of declining enrollment, and then a decade of stable of growing enrollment. The last three school years the district has again experienced declining enrollment.
The impact the COVID-19 pandemic had on the community was great and affected all areas of operation for the district. As a direct result of COVID-19, the district is down approximately 1,000 students. This is the largest single decrease in decades and will impact the district in FY 2022 and potentially for years beyond. In addition, the Iowa Legislature put forth bills in 2021 that could directly impact enrollment in Des Moines.
The breakdown of students by level in the 2020-21 school year is 45.4% elementary school, 23.3% middle school, and 31.3% high school.
In addition to serving students in grades K-12, the district also has a robust Early Childhood program. DMPS Early Childhood programs provide quality learning experiences to help promote the growth of young children and their families. This is done by offering free, quality preschool with several options to best meet the needs of families, including a variety of locations, class times, and half- or full-day plans. All DMPS preschool programs adhere to state and national program standards to facilitate the district goal of improving Kindergarten readiness. More than 1,500 students were enrolled in preschool programs through a variety of funding sources in 2021-22.
29,000
30,000
31,000
32,000
33,000
34,000
DMPS ENROLLMENT
2021 - 2022 Preliminary Budget 29

PROPERTY TAXES
The district is proposing a tax rate of $16.08, which is $2.53 lower than the FY 2021 rate.
District Property Overall Recommended Tax Rate FY 2021 FY 2022 Change GENERAL Regular Instructional Support Dropout Prevention Cash Reserve Levy
8.87 1.57 1.36 2.47
9.03 1.56 1.32 0.00
0.16
(0.01) (0.04) (2.47)
MANAGEMENT 3.24 2.36 (0.88) PPEL Regular Voted
0.33 0.63
0.33 1.34
0.00 0.71
PERL 0.135 0.135 0.00 DEBT SERVICE 0.00000 0.00000 0.00 TOTAL 18.61 16.08 (2.53)
$0
$5
$10
$15
$20
$25
$30
FY 2013 FY 2014 FY 2015 FY 2016 FY 2017 FY 2018 FY 2019 FY 2020 FY 2021 FY 2022(budget)
ANNUAL PROPERTY TAX RATE
2021 - 2022 Preliminary Budget 30

PERSONNEL: PAST YEAR, CURRENT YEAR, & BUDGET YEAR
DMPS Employee Schedule FY 2020 FY 2021 FY 2022 (est.)
Administrators
Central Office 41.0 40.0 40.0 Elementary Schools 38.0 38.0 38.0 Middle Schools 10.0 10.0 10.0 High Schools 13.0 14.0 14.0 Special Schools 5.0 3.0 2.0 Administrators 107.0 105.0 104.0
Instructional Staff (Certified) Classroom teachers 1,532.4 1,505.2 1,466.2 ELL 118.4 117.9 118.4 Head Start 14.0 13.0 13.0 Home Instruction 8.0 9.0 9.0 Preschool 35.0 35.0 31.0 Special Ed teachers 487.0 479.0 473.0 Title I, Rdg, Math, Instruct Coaches 251.4 280.7 282.4 Float 3.0 21.0 21.0 Instructional Staff (Certified) 2,449.2 2,460.8 2,414.0 Continued on next page
Instructional Staff(Certified)
Support Staff(Certified) Associates
Specialists,Clerical,
Paraprofessionals
Food Service,Operations,
Transportation,Childcare
Administrators Total
FY 2020 2,449 384 560 569 815 107 4,884
FY 2021 2,461 411 581 582 820 105 4,960
FY 2022 (est.) 2,414 402 570 600 815 104 4,906
0
1,000
2,000
3,000
4,000
5,000
ALL DMPS EMPLOYEES
2021 - 2022 Preliminary Budget 31

Continued from previous page Support Staff (Certified)
Counselors 85.0 96.0 95.5 Facilitator - - 10.0 Gifted and Talented 21.0 23.0 23.0 Library/Media specialists 1.0 1.0 0.2 Non-classroom teachers 53.5 62.7 62.2 Nurses 61.0 61.0 61.0 Special Ed consultants 30.0 30.0 30.0 Special Ed support 132.4 137.5 120.5 Support Staff (Certified) 383.9 411.2 402.4
Associates
Central Office 46.0 51.5 51.5 Elementary Schools 239.0 244.0 231.0 Middle Schools 57.5 60.0 66.5 High Schools 61.0 66.5 68.5 Special Schools 156.0 158.5 152.5 Associates 559.5 580.7 570.2
Specialists, Clerical, Paraprofessionals
Central Office 256.9 257.3 253.3 Elementary Schools 111.0 112.9 117.9 Middle Schools 71.5 72.9 71.4 High Schools 113.5 118.4 137.4 Special Schools 16.0 19.9 19.9 Specialists, Clerical, Paraprofessionals 568.9 581.6 600.1
Food Service, Operations, Transportation, Childcare
Central Office 294.7 295.3 293.3 Elementary Schools 283.9 285.0 285.0 Middle Schools 105.3 106.3 106.3 High Schools 112.2 113.3 110.3 Special Schools 19.3 20.4 20.4 Food Service, Operations, Transportation, Childcare 815.4 820.4 815.4
Total 4,883.9 4,959.7 4,906.0
2021 - 2022 Preliminary Budget 32

CAPITAL IMPROVEMENT & BONDING
Thanks to community support, Des Moines Public Schools has completed more than $500 million in improvements to district facilities since the turn of the 21st century, from the renovation of historic structures to the construction of brand new facilities. There has been a concentrated effort to improve and replace existing building equipment, improve energy efficiency, and provide a safe, comfortable environment for students.
In 1999, voters in Polk County approve a local one-cent sales tax for school infrastructure improvements. By 2008, voters in all 99 Iowa counties had voted for the local sales tax increase. In 2008, the Iowa legislature enacted a statewide one-cent sales tax — now called SAVE — to benefit school districts across Iowa to replace the local option sales taxes, and the governor signed it into law that same year. SAVE is a dedicated source of revenue to support improvements to public schools. A Revenue Purpose Statement indicating how SAVE funding could be used by the district was approved by voters on September 9, 2009. In most cases, a district incurs long-term debt for capital projects, and the amounts are often sizable. One of the priorities of the Revenue Purpose Statement was to introduce money-saving strategies, and one strategy enacted by the district has been the sale of revenue bonds to minimize the impact of inflation on renovation and construction budgets. The district has issued the following revenue bonds:
Revenue Bond Series Amount Due 2010 $70.0 million Refinanced in 2016 2013 $8.8 million 2029 2014 $61.9 million 2029 2016 $53.7 million 2028 2018 $56.2 million 2019
This strategy saves money by getting ahead of the cost of inflation, accelerating the projects schedule, and supporting jobs in the construction trades. Issuing revenue bonds has allowed the district DMPS to complete more school projects, while saving tax dollars, and providing additional opportunities to students. Issuing revenue bonds — paid for by the revenue from the statewide sales tax, not property taxes — has allowed DMPS to:
• Minimize inflationary increases on a portion of the construction program. • Add flexibility to the construction schedule. • Develop the most optimal construction plan. • Lock up a portion of the revenue stream for debt service (and/or projects). • Move up projects to benefit students earlier. • Lock in projects at a borrowing cost lower than the average inflationary factor. • Continue the plan created by the Superintendent’s Facilities Advisory Committee. • Continue to provide operational efficiencies that will have a direct impact on the district’s
General Fund in the form of reduced energy costs.
2021 - 2022 Preliminary Budget 33

Principal Interest Total Principal Interest Total Principal Interest Total201120122013 3,125,000$ 3,059,744$ 6,184,744$ 2014 3,330,000 2,751,000 6,081,000 485,000$ 131,116$ 616,116$ 2015 3,430,000 2,617,800 6,047,800 425,000 298,045 723,045 3,105,000$ 2,850,385$ 5,955,385$ 2016 3,530,000 2,480,600 6,010,600 440,000 285,295 725,295 3,400,000 2,506,925 5,906,9252017 3,650,000 2,339,400 5,989,400 455,000 272,095 727,095 3,490,000 2,336,925 5,826,9252018 3,755,000 2,193,400 5,948,400 470,000 253,895 723,895 3,600,000 2,162,425 5,762,4252019 3,870,000 2,043,200 5,913,200 490,000 235,095 725,095 3,720,000 1,982,425 5,702,4252020 3,990,000 1,888,400 5,878,400 505,000 220,395 725,395 3,850,000 1,796,425 5,646,4252021 4,125,000 1,728,800 5,853,800 530,000 195,145 725,145 3,875,000 1,603,925 5,478,9252022 4,280,000 1,563,800 5,843,800 555,000 168,645 723,645 4,000,000 1,410,175 5,410,1752023 4,435,000 1,392,600 5,827,600 575,000 151,995 726,995 4,145,000 1,210,175 5,355,1752024 4,595,000 1,215,200 5,810,200 590,000 134,745 724,745 4,310,000 1,002,925 5,312,9252025 4,770,000 1,031,400 5,801,400 610,000 116,455 726,455 4,480,000 873,625 5,353,6252026 4,955,000 840,600 5,795,600 630,000 96,630 726,630 4,670,000 739,225 5,409,2252027 5,145,000 642,400 5,787,400 650,000 75,525 725,525 4,870,000 587,450 5,457,4502028 5,350,000 436,600 5,786,600 675,000 52,775 727,775 5,090,000 417,000 5,507,0002029 5,565,000 222,600 5,787,600 695,000 27,800 722,800 5,335,000 213,400 5,548,400
71,900,000$ 28,447,544$ 100,347,544$ 8,780,000$ 2,715,651$ 11,495,651$ 61,940,000$ 21,693,410$ 83,633,410$
Principal Interest Total Principal Interest Total Principal Interest Total2011 1,640,000$ 4,313,500$ 5,953,500$ 2012 2,590,000 3,418,000 6,008,0002013 5,810,000 6,348,244 12,158,2442014 6,595,000 6,036,366 12,631,3662015 9,845,000 8,781,480 18,626,4802016 *Replaced Series 2010 Bonds 10,355,000 8,143,820 18,498,8202017 4,900,000$ 930,288$ 5,830,288$ 12,495,000 5,878,708 18,373,7082018 4,830,000 984,851 5,814,851 12,655,000 5,594,571 18,249,571
2019 4,025,000 887,285 4,912,285 3,300,000 2,542,021 5,842,021 15,405,000 7,690,026 23,095,0262020 4,100,000 805,980 4,905,980 3,570,000 2,268,850 5,838,850 16,015,000 6,980,050 22,995,0502021 4,165,000 723,160 4,888,160 3,960,000 2,090,350 6,050,350 16,655,000 6,341,380 22,996,3802022 4,240,000 639,027 4,879,027 4,245,000 1,892,350 6,137,350 17,320,000 5,673,997 22,993,9972023 4,325,000 553,379 4,878,379 4,525,000 1,680,100 6,205,100 18,005,000 4,988,249 22,993,2492024 4,415,000 466,014 4,881,014 4,810,000 1,453,850 6,263,850 18,720,000 4,272,734 22,992,7342025 4,510,000 376,831 4,886,831 5,015,000 1,213,350 6,228,350 19,385,000 3,611,661 22,996,6612026 4,610,000 285,729 4,895,729 5,205,000 962,600 6,167,600 20,070,000 2,924,784 22,994,7842027 4,710,000 192,607 4,902,607 5,420,000 702,350 6,122,350 20,795,000 2,200,332 22,995,3322028 4,825,000 97,465 4,922,465 5,565,000 485,550 6,050,550 21,505,000 1,489,390 22,994,3902029 - - - 10,620,000 318,600 10,938,600 22,215,000 782,400 22,997,400
53,655,000$ 6,942,616$ 60,597,616$ 56,235,000$ 15,609,971$ 71,844,971$ 268,075,000$ 95,469,693$ 363,544,693$
2012 SAVE Revenue Bonds 2013 SAVE Revenue Bonds 2014 SAVE Revenue Bonds
DES MOINES PUBLIC SCHOOLS2021 - 2022 BUDGET
DEBT SERVICE FUND SUMMARY
2016 SAVE Revenue Bonds 2018 SAVE Revenue Bonds DEBT SERVICE RECAP
On May 8, 2012, the District issued revenue bonds in the amount of $71,900,000 to be paid out of SAVE revenues. On December 30, 2013, the District issued revenue bonds in the amount of $8,780,000 to be paid out of SAVE revenues. On May 1, 2014, the District issued revenue bonds in the amount of $61,940,000 to be paid out of SAVE revenues.On July 22, 2016, the District refunded the Series 2010 revenue bonds with the Series 2016 Bonds in the amount of $53,655,000 to be paid out of SAVE revenues. On May 15, 2018, the District issued revenue bonds in the amount of $56,235,000 to be paid out of SAVE revenues.
2021 - 2022 Preliminary Budget 34

P R E L I M I N A RY B U D G E T 2 0 2 1 - 2 0 2 2
ORGANIZATION

DES MOINES: A VIBRANT & DIVERSE CITY
As Iowa’s capital city, Des Moines is a hub of government action, business activity, and cultural affairs. The Des Moines Independent Community School District, also known as Des Moines Public Schools (DMPS) serves more than 214,000 people who live in Polk and Warren Counties, approximately 24% of whom are under the age of 18. The median household income (2019) in Des Moines is $53,525, and approximately 16.1% of persons live below the poverty line.
Covering nearly 86 square miles, the school district developed in the heart of the Des Moines city center, east into Pleasant Hill, west into Windsor Heights, and south into Warren County. The district benefits from having strong and diverse neighborhoods and a citizenry deeply involved in its public education. Des Moines is the industrial, technological, commercial, financial, trade, transportation, and governmental center of Iowa. The insurance industry in Des Moines is the third largest in the world, after London and Hartford, with more than 200 insurance offices/headquarters located the city. Insurance activities are part of a strong local economy that is also based in agriculture, manufacturing, technology, education, health care, and other services.
Des Moines offers amenities usually found only in major cities: unique shopping in the East Village; dining at world-class restaurants; countless entertainment opportunities at Wells Fargo Arena and the Civic Center; educational opportunities at the Science Center of Iowa, Downtown Library, and Pappajohn Sculpture Park; and professional sporting events. The city boasts unique housing options at several lofts and townhome developments, has one of the nation’s largest
farmers’ markets, and is home to the top-ranked art festival. The community also has a vibrant outdoor scene. One can listen to summer concerts along the banks of the Des Moines River or on the steps of the state capitol building, take a leisurely stroll along the Principal Riverwalk, and the entire central Iowa region is connected by more than 500 miles of trails (including 60 within Des Moines). While there is big city bustle, the community is extremely proud of its small-town atmosphere. Throughout Des Moines are dozens of neighborhoods, each with its own personality and style. The community offers superb schools, quality public services, and friendly neighborhoods.
2021 - 2022 Preliminary Budget 36

Here’s what others have to say about Des Moines being a great place to live and work:
• Des Moines ranks #7 Best Place to Live in the U.S. – U.S. News & World Report, 2020 • Des Moines ranks #3 Best Affordable Place to Live in the U.S. – U.S. News & World
Report, 2020 • Des Moines is #6 on Yahoo Finance’s “Best American Cities to Work in Tech” – Yahoo
Finance, 2019 • Des Moines ranks #3 on “Best Affordable Places to Live in the US” – MSN Money, 2019 • Des Moines is the #4 Best Place to Live – U.S. News & World Report, 2019 • Des Moines is the #4 Best Place to Live – U.S. News & World Report, 2018 • Des Moines is the #1 Most Popular City for Millennial Homebuyers – Lending Tree, 2018 • Des Moines is the #8 Best Job Market for 2018 – ZipRecruiter, 2018 • Des Moines is one of the “5 Up-and-Coming Tech Hotspots” – Livability, 2018 • Des Moines is the #8 Best City to Find Small Business Jobs – ZipRecruiter, 2018 • Des Moines is the #7 Place Where Jobs Will Be In 2018 – Forbes, 2017 • Des Moines ranks #9 on the “Top 10 Paces to Lives in the U.S.” – U.S. News & World
Report, 2017. • Des Moines ranks #11 on the “Best State Capitals to Live In” list – WalletHub, 2017. • Des Moines is the #4 Best City for Young Families – ValuePenguin, 2016. • Des Moines is the #1 Best City for the Middle Class – Business Insider, 2016. • Des Moines ranks #4 on Best Mid-Sized Cities for Making a Living – MoneyGeek, 2016. • Des Moines is the #6 Best City to Find a Job – WalletHub, 2016. • Des Moines is the #1 Metro with the Most Community Pride – Gallup, 2015. • Des Moines is the #2 Best City for Jobs in 2015 – Forbes, 2015. • Des Moines is the #2 Best City to Find a Job – WalletHub, 2015. • Des Moines ranks #4 on “America’s Most Business Friendly Cities” – MarketWatch, 2015. • Des Moines is a Top 5 Emerging Start Up City – Investopedia, 2015. • Des Moines is the #3 Top City for New College Graduates – SmartAsset, 2015. • Des Moines is the #6 Midsize Metro Where College Grads Move for Jobs – AIER, 2015. • Des Moines is the #1 City with an Up and Coming Downtown – Fortune, 2014. • Des Moines is the #1 Best City for Young Professionals – Forbes, 2014. • Des Moines is the #2 Best City for Business – Forbes, 2014. • Des Moines is the #4 Best City for Business and Careers – Forbes, 2014. • Des Moines is the #6 City for Raising a Family – Forbes, 2014. • Des Moines is the #1 Wealthiest City in America – Today show, 2014. • Des Moines ranks #1 on “Best Places for Business and Careers” – Forbes, 2013. • Des Moines ranks #1 on “Best Cities for Families” – Kiplinger, 2012. • Des Moines ranks #4 on “Best Places for Business and Careers” – Forbes, 2012.
2021 - 2022 Preliminary Budget 37

DES MOINES PUBLIC SCHOOLS: A LEADER IN URBAN EDUCATION
LARGEST SCHOOL DISTRICT IN IOWA
Des Moines Public Schools is home to 70 schools and support facilities, including 38 elementary schools, 10 middle schools, 5 comprehensive high schools, and 11 other sites that provide specialized programming. The district covers nearly six million square feet and serves more than 31,600 students from preschool through high school in every neighborhood in the city. District Map
See also: http://www.dmschools.org/maps/
2021 - 2022 Preliminary Budget 38

EXCEPTIONAL EDUCATIONAL OPPORTUNITIES
With more than 31,600 students, Des Moines Public Schools is by far the largest school district in Iowa. While the district may be the largest provider of public education in the state, DMPS takes anything but a one-size-fits-all approach to educating students. In fact, families in Des Moines can find more educational options than anyplace in the state, including:
• Advanced Placement. Central Academy — attended by students from 39 central Iowa middle and high schools — is Iowa’s top AP program, dedicated to providing a challenging curriculum. The Belin-Blank Center for Gifted Education and Talent Development placed Central Academy “in a class by itself” as a college preparatory school. In addition, DMPS is in the midst of a significant expansion of AP course offerings throughout all five comprehensive high schools. All five comprehensive high schools are on the Belin-Blank Center’s Iowa AP Top 25 Index.
• International Baccalaureate. DMPS provides opportunities for students to participate in a comprehensive IB program at four elementary schools (Hubbell, Park Avenue, Stowe, and Walnut Street), four middle schools (Brody, Goodrell, Meredith, and Merrill), and one high school (Hoover).
• Montessori. Cowles Montessori School is the only public Montessori program in Iowa, serving students in grades K-8. Students learn in multi-age classrooms, and children’s natural curiosities are exploited to the fullest as they advance at their own pace.
• Career & Technical Institute. Located at Central Campus, CTI offers students learning opportunities in several high-skill areas, including graphic design, broadcasting & film, culinary arts, fashion, and automotive technology. In addition, DMPS is home to one of only three high school aviation programs certified by the FAA and has the largest marine biology program of any non-coastal high school. In 2017, the district launched the Skilled Trades Academy at Central Campus. The partnership with construction industry leaders and labor organizations created the Skilled Trades Alliance, with the goal of creating a model program of work-based learning with hands-on applications for students. Students enrolled in a High Quality Pre-Apprenticeship program are immersed in job-embedded practices and internships while learning from industry mentors.
• Higher Education Partnerships. Des Moines Public Schools’ proximity to Drake University, Iowa State University, Des Moines Area Community College, and other Institutes of Higher Education have created numerous partnerships and collaborative efforts that support students, teachers, and administrators.
2021 - 2022 Preliminary Budget 39
OUTSTANDING WORKFORCE
Des Moines Public Schools is proud to be home to thousands of educators and other professionals who work hard each and every day to help the students of Des Moines succeed. The good work performed by DMPS teachers and staff has earned awards, honors, and recognition at the state and national level. Highlights of some recent honors include:
Twelve National Award Winners Presidential Award for Excellence in Mathematics and Science Teaching
2017, 2016 Digital Innovator
2016 AP Teacher of the Year College Board
2016 DMR Coach of the Year The Des Moines Register
2016 ISPRA Communicator of the Year Iowa Schools Public Relations Association
Award of Excellence (multiple years) National School Public Relations Association
Distinguished Budget Presentation Award Recipient (multiple years) Certificate of Achievement Recipient (multiple years) Government Finance Officers Association
Meritorious Budget Award Recipient (multiple years) Certificate of Excellence Award Recipient (multiple years) Association of School Business Officials International
2015 Iowa Teacher of the Year Iowa Department of Education
Five-time ENERGY STAR Partner of the Year U.S. Environmental Protection Agency
2014 Elementary School Counselor of the Year Iowa School Counselor Association
2014 School Social Worker of the Year Iowa School Social Workers Association
2021 - 2022 Preliminary Budget 40
The Association of School Business Officials (ASBO) International awarded a Certificate of Excellence in Financial Reporting to the district for the fiscal year ending June 30, 2019. DMPS has been recognized by ASBO for this honor since 2007. This award represents the highest recognition for school district operations offered by ASBO International. We believe our current Comprehensive Annual Financial Report continues to meet ASBO’s Certificate of Excellence requirements and have submitted it to ASBO to determine eligibility for another certificate.
The Government Finance Officers Association (GFOA) of the United States and Canada awarded a Certificate of Achievement for Excellence in Financial Reporting to the district for its Comprehensive Annual Financial Report for the fiscal year ended June 30, 2019. DMPS has been recognized by GFOA for this honor since 2007. To be awarded a Certificate of Achievement, a district must publish an easily readable and efficiently organized Comprehensive Annual Financial Report. This report must satisfy both accepted accounting principles and applicable legal requirements. We believe our current Comprehensive Annual Financial Report continues to meet the GFOA’s Certificate of Achievement requirements and have submitted it to the GFOA to determine eligibility for another certificate.
Other honors earned by Des Moines Public Schools and its employees include:
• 2018, 2017, 2016, 2015, 2014, 2013, 2012, 2011, 2010, 2009, 2008, 2007 Certificate of Excellence in Financial Reporting and 2018, 2017, 2016 Meritorious Budget Award — Association of School Business Officials Association for the school district’s comprehensive annual financial report and annual budget, respectively
• 2018, 2017, 2016, 2015, 2014, 2013, 2012, 2011, 2010, 2009, 2008, 2007 Certificate of Achievement and 2016, 2015, 2014, 2013 Distinguished Budget Presentation Award — Government Finance Officers Association for the school district’s comprehensive annual financial report and annual budget, respectively
• 2018, 2015, 2012, 2010, 2009, 2006, 1995, 1997, 1997, 1995, 1995, 1983 Presidential Award for Excellence in Mathematics and Science Teaching recipients
• 2018 Capital City Pride Ally of the Year • 2018 Iowa Juneteenth Mary McCleod Bethune Award • 2018, 2017, 2016, 2015, 2014, 2013, 2012 ENERGY STAR Partner of the Year —
Environmental Protection Agency • 2017 Hoover High School— Governor’s STEM Best Partner • 2016, 2015, 2014, 2013, 2012, 2010 state finalists for Presidential Award for Excellence in
Mathematics and Science Teaching • 2016 Arts Learning Leadership — Governor’s Arts Award • 2016 AP Teacher of the Year — College Board • 2016 DMR Coach of the Year — The Des Moines Register • 2016 ISPRA Communicator of the Year — Iowa Schools Public Relations Association • 2016, 2015, 2014, 2013, 2012 honors — National School Public Relations Association
2021 - 2022 Preliminary Budget 41

• 2016, 2015, 2014 ENERGY STAR Partner of the Year for Climate Communications — Environmental Protection Agency
• 2015 Iowa Teacher of the Year — Iowa Department of Education • 2015 Educator of the Year — Iowa Association of Alternative Education • 2015 Certified Public Finance Officer — Government Finance Officers Association • 2015 Magna Award — National School Boards Association • 2014 Prostart Educator of Excellence Award — Iowa Restaurant Association • 2014 Iowa School Social Worker of the Year — Iowa School Social Workers Association • 2014 Four Rotary Educators of the Year • 2014 Rising Star — Journalism Education Association • 2014, 2013, 2012 finalists for Iowa Teacher of the Year • 2013 Trailblazing Teacher — The Center for Green Schools • 2013 Steve France Honor Award — Iowa Association for Health, Physical Education,
Recreation, and Dance • 2013 Rod Vahl Teacher of the Year award — Iowa High School Press Association • 2013 Outstanding Middle School Art Educator — Art Educators of Iowa • 2013 Outstanding Elementary Art Educator — Art Educators of Iowa • 2013 Green Ribbon School Award for Des Moines Public Schools — U.S. Department of
Education • 2013 Excellence in Education Award — Iowa State Education Association • 2013 Dr. Robert E. and Phyllis M. Yager Exemplary Teaching Recognition Award — University of
Northern Iowa • 2013, 2012 Governor’s Iowa Environmental Excellence Award • 2012 Phyllis Yager Memorial Commitment to Diversity Award — University of Iowa • 2012 honoree as a Champion of Change in education — White House • 2012 Green Ribbon School Award for Central Campus — U.S. Department of Education • 2012 Gary Hendrichs Memorial Award — Iowa School Counselor Association • 2012 finalist for America History Teacher of the Year — Iowa Preserve • 2012 Education Support Personnel of the Year for the State of Iowa • 2011 Outstanding Secondary Art Educator — Art Educators of Iowa • 2011 Outstanding Iowa Biology Teacher of the Year — National Association of Biology Teachers • 2011 Educator of the Year — Printing Industry of the Midwest • 2011 and 2009 James Madison Fellowships for the state of Iowa • 2010 James Bryant Conant Award in High School Teaching • 2010 Iowa School Social Worker of the Year — Iowa School Social Workers Association • 2010 Iowa Financial Literacy Educator of the Year • 2010 honoree for the Teacher Program — Toyota International
2021 - 2022 Preliminary Budget 42
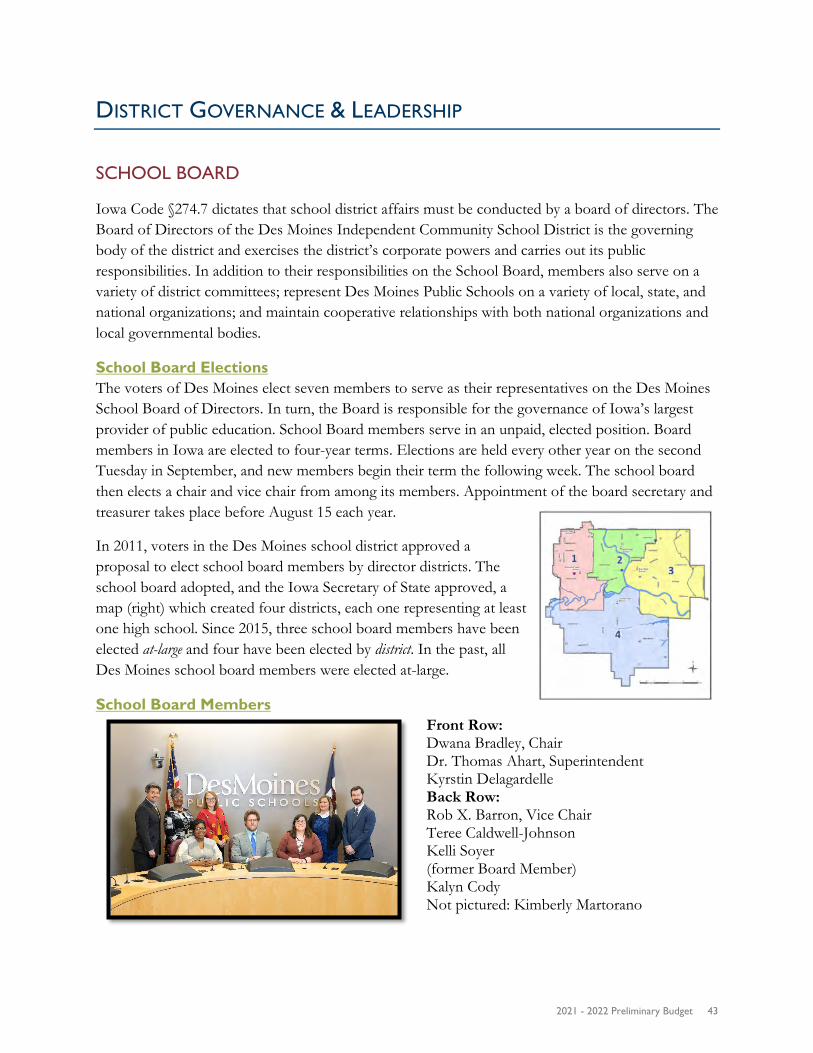
DISTRICT GOVERNANCE & LEADERSHIP
SCHOOL BOARD
Iowa Code §274.7 dictates that school district affairs must be conducted by a board of directors. The Board of Directors of the Des Moines Independent Community School District is the governing body of the district and exercises the district’s corporate powers and carries out its public responsibilities. In addition to their responsibilities on the School Board, members also serve on a variety of district committees; represent Des Moines Public Schools on a variety of local, state, and national organizations; and maintain cooperative relationships with both national organizations and local governmental bodies.
School Board Elections The voters of Des Moines elect seven members to serve as their representatives on the Des Moines School Board of Directors. In turn, the Board is responsible for the governance of Iowa’s largest provider of public education. School Board members serve in an unpaid, elected position. Board members in Iowa are elected to four-year terms. Elections are held every other year on the second Tuesday in September, and new members begin their term the following week. The school board then elects a chair and vice chair from among its members. Appointment of the board secretary and treasurer takes place before August 15 each year.
In 2011, voters in the Des Moines school district approved a proposal to elect school board members by director districts. The school board adopted, and the Iowa Secretary of State approved, a map (right) which created four districts, each one representing at least one high school. Since 2015, three school board members have been elected at-large and four have been elected by district. In the past, all Des Moines school board members were elected at-large.
School Board Members
Front Row: Dwana Bradley, Chair Dr. Thomas Ahart, Superintendent Kyrstin Delagardelle Back Row: Rob X. Barron, Vice Chair Teree Caldwell-Johnson Kelli Soyer (former Board Member) Kalyn Cody Not pictured: Kimberly Martorano
2021 - 2022 Preliminary Budget 43

Dwana Bradley, Chair Seat: District Three Member Since: 2019 | Term Expires: 2023
3012 E. 32nd Court, Des Moines, IA 50317 | (515) 829-0927 [email protected]
Dwana Bradley was selected to fill the District 3 vacancy in December 2018 and sworn into office on January 8, 2019. She was elected to a full-term in November 2019. Dwana holds a bachelor’s degree in child and family services from Iowa
State University, a master’s degree in Elementary Education and Literacy from Drake University, and a specialist’s degree in administration. She spent nearly seven years as a reading interventionist with Des Moines Public Schools. She is currently executive director of Iowa Juneteenth, a teacher in the after-school program at Homes of Oakridge, as well as owner of Iowa Urban Media, a community-focused publishing company. Bradley is active in the community, for example volunteering on the DMPS attendance committee, serving as choir director at True Bible Baptist Church, and graduating from the Greater Des Moines Leadership Institute. She has two children.
Rob X. Barron, Vice Chair Seat: At-large Member Since: 2013 | Term Expires: 2021
4220 Holland Drive, Des Moines, IA 50310 | (515) 778-2961 [email protected]
Rob X. Barron is the co-founder of the Latino Political Network, a non-partisan organization which serves to educate and empower Latinos to serve at all levels of elected office throughout Iowa. Additionally, he is the Special Assistant to Grand View University President Kent Henning for Government and Community Relations. In that role, he represents Grand
View before elected officials and bureaucrats and works to build relationships with the community on behalf of Grand View students, faculty, and staff. He previously worked for NextGen Climate Action and U.S. Senator Tom Harkin. For the last six years of his work for Senator Harkin, he served as Senator Harkin’s State Staff Director. Prior to starting that position, he worked for four years as Senator Harkin’s education policy advisor in Washington, D.C., where he was responsible for work on education legislation at all levels, from early childhood education to higher education. During the school year, Rob volunteers weekly at Cattell Elementary School for the Everybody Wins program. Everybody Wins pairs volunteers with elementary students in a mentoring program to increase reading fluency, comprehension, and academic confidence. Rob is also a member of the 2014 class of the Greater Des Moines Leadership Institute. Rob is a Des Moines native. He and his wife Angela Matsuoka, an elementary art educator employed by the Iowa Department of Education, live in the Beaverdale neighborhood with their son, Javy, and a daughter, Mirabel. Rob is a graduate of Des Moines Roosevelt High School and Grinnell College. He also attended Hanawalt Elementary School, Merrill Middle School, Central Academy, and Lincoln High School. Rob received his B.A. in Political Science from Grinnell College.
2021 - 2022 Preliminary Budget 44

Teree Caldwell-Johnson Seat: District Four Member Since: 2006 | Term Expires: 2021
3907 SW 29th Street, Des Moines, IA 50321 | (515) 287-3123 [email protected]
Teree Caldwell-Johnson serves as the CEO of Oakridge Neighborhood and Oakridge Neighborhood Services, a housing and humans services non-profit agency in Des Moines. Prior to assuming her position at Oakridge, Teree held progressively responsible positions in local government across the county, most recently serving as Polk County Manager from 1996-2003.
Active in the community, Teree serves on several non-profit boards, including University of Kansas College of Liberal Arts and Sciences Advisory Board, Mid-Iowa Health Foundation, Greater Des Moines Community Foundation, Planned Parenthood of the Heartland, Spelman College Museum Board, and The Directors Council. In addition, Teree is a member of Alpha Kappa Alpha Sorority Incorporated, Jack and Jill of America, and The Links, Incorporated.
Teree holds a B.A. in English from Spelman College in Atlanta, GA and an MPA from the University of Kansas in Lawrence, KS. She has also completed post-graduate studies at Bucknell University in Lewisburg, PA. Teree and her husband Vernon, a retired non-profit executive, are the parents of two DMPS graduates, Baley (LHS Class of 2008) and Baxtyr (LHS Class of 2011).
Kalyn Cody Seat: District Two Member Since: 2019 | Term Expires: 2023
2006 Chautauqua Parkway, Des Moines, IA 50314 | (623) 243-3725 [email protected]
Kalyn Cody is a career educator. His teaching career spanned a variety of public schools; first in a small desert town in California, followed by a stint in Phoenix, Arizona, before settling in Des Moines, Iowa. After more than a decade as a classroom educator, Kalyn moved to Iowa State University Extension & Outreach where he works as a Family Finance Specialist, going
out into the community to help his neighbors acquire the skills they need to reach their goals. Kalyn received his Master of Arts in Curriculum and Instruction (Education of the Gifted) from the University of Northern Iowa and a Bachelor of Arts in Elementary Education from Luther College in Decorah, Iowa. He holds an Iowa Master Educator License with endorsements including K-6 elementary classroom, 5-8 middle school generalist, and PK-12 Talented and Gifted. Kalyn lives in Des Moines with his wife, Tess, and their daughter, Etta. In his free time, Kalyn likes to kayak, read, and play sports and games (particularly soccer). His body often tells him that it is time for a few less strenuous hobbies, but he owns plenty of ice packs.
2021 - 2022 Preliminary Budget 45

Kyrstin Delagardelle Seat: At-large Member Since: 2017 | Term Expires: 2021
1048 37th Street Apt. 1, Des Moines, IA 50311 | (515) 210-9330 [email protected]
Kyrstin Delagardelle grew up in Elwood, near Maquoketa, Iowa, and graduated from Grand View University (2013) with a Bachelor of Arts in English and Secondary Education. She was honored as a 10 Under 10 Alumni Award recipient in 2017, which is awarded to recent alumni who are making a significant impact in their professional work and community.
She also holds a Master of Arts in Library and Information Science from University of Iowa (2017) and completed her capstone researching the effects of diverse literature and the importance of diversity embedded within pre-service teacher education.
A teacher librarian at Northview Middle School in Ankeny, Kyrstin serves on various committees within Ankeny Community Schools including the Equity Committee and her building’s Instructional Leadership Team.
Kyrstin is a past fellow for the New Leaders Council Des Moines, a nonprofit dedicated to recruiting, training, and promoting the next generation of progressive leaders and is a founding board member of Iowa Women for Progressive Change. She was a co-organizer for the Women’s March in Des Moines. She enjoys exploring the cultural opportunities Des Moines has to offer including its many festivals and restaurants.
Kimberly Martorano Seat: District One Member Since: 2020 | Term Expires: 2023
3913 Maquoketa Drive, Des Moines, IA 50311 | (847) 858-8603 [email protected]
Kimberly Martorano was selected by the Board to fill Heather Anderson’s seat. Anderson announced her resignation effective July 31, 2020. Martorano was sworn in during the Board of Directors meeting on August 17, 2020 and will serve until the November 2021 election. At that time, voters will elect a director to serve until 2023 and complete the remaining two years of Anderson’s term.
Kimberly Martorano is an Information System Specialist with the Johnston Community School District. She holds a bachelor’s degree in industrial technology education from Illinois State University. She was previously a data analyst with Des Moines Public Schools and an education training specialist with Computer Information Concepts.
Martorano served on the executive board of Lake County Federation of Teachers Local 504 and volunteers with Big Brothers Big Sisters.
2021 - 2022 Preliminary Budget 46

Kelli Soyer Seat: At-large Member Since: 2019 | Term Expires: 2023
3700 37th Street, Des Moines, IA 50312 | (515) 971-9230 [email protected]
Kelli Soyer is the Associate Director for the Coalition for Family and Children’s Services in Iowa. Kelli works tirelessly advocating for children’s issues in Iowa and federally. Since its inception, Kelli has been involved with the Des Moines School Board’s Community Legislative Action Team, sharing the parent voice on behalf of issues impacting the district.
As a social worker, Kelli has spent her career in the non-profit industry. She has been active in grassroots and community organizing. Her advocacy efforts earned her recognition earning the 2016 Children’s Champion Award by the Iowa Association for the Education of Young Children and the 2010 Friend of Children Award by the Iowa School Social Workers’ Association.
Kelli is a native Iowan. She graduated from Johnston High School and received her Bachelor of Arts in Psychology and Masters in Social Work from the University of Iowa. She is a Licensed Masters Social Worker (LMSW) in Iowa.
Kelli and her husband, Paul, live in Des Moines with their daughter, Sayde, a student at Callanan Middle School.
Community Legislative Action Team The district receives the majority of its annual revenue from sources that are directly impacted by the actions of the Iowa Legislature. While the district has maintained lobby representatives and advocated for students and staff, the School Board recognized the district had not tapped into a powerful resource for advocacy on a formal basis: parents and other community members.
By capitalizing on the potential of parents and other community members who recognize the need for more awareness of how specific legislative actions affect schools, the Board could help citizens advocate for policies that increase student success. To that end, the Board created the DMPS Community Legislative Action Team (DMPS-CLAT) to facilitate advocacy on behalf of the students of Des Moines. During the legislative session, DMPS-CLAT holds regular coffees with members of the Des Moines legislative delegation the second Saturday of each month. In addition, CLAT usually schedules a “Day on the Hill” for DMPS representatives to talk with legislators at the State Capitol about issues important to the school district. Members of DMPS-CLAT regularly reach out to legislators to share ideas and get input on topics critical to public schools in Des Moines.
2021 - 2022 Preliminary Budget 47

The DMPS-CLAT focused on four issues for the 2021 legislative session:
EXPAND SUPPORT FOR DISADVANTAGED STUDENTS: Change state per pupil funding allocation based on need. Recognize at-risk student challenges by providing additional weighting in the foundation formula for students qualifying for free/reduced lunch. Study after study shows students who do not have resources at home are not prepared for learning at school. Schools with large numbers of students who live with poverty both in urban and rural areas are required to provide more services than their more affluent counterparts to achieve the same result.
EXPAND PRESCHOOL FUNDING FOR CHILDREN IN NEED: Increase funding for four-year-old preschool students in need. Reduce the cliff effect by providing half-day preschool and half-day daycare for four-year-old children in families at or below the 200% poverty rate.
EXPAND SUPPORT FOR ENGLISH LANGUAGE LEARNERS: Increase weighted English Language Learner (ELL) funding to .39, in accordance with evidence-based practice and as recommended by the 2013 task force report on ELL education in Iowa.
INCREASE SUPPORT STATEWIDE FOR SCHOOLS IMPACTED BY COVID-19: Address the statewide enrollment loss due to COVID-19 and its impact beyond what is provided by the budget guarantee, and consider using 2019 preschool certified enrollment for pre-K funding as those students are not protected by the budget guarantee.
2021 - 2022 Preliminary Budget 48

LEGAL AUTONOMY & FISCAL INDEPENDENCE
In May 2017, the Iowa Legislature created limited Home Rule for Iowa school districts. The change provides more flexibility to school districts in their exercise of powers where the law or administrative rule does not already prescribe or prohibit the action. All Iowa school districts remain under the control of a local board of directors and have fiscal independence from other governmental entities.
As provided in Iowa Code §274.1, each school district in Iowa district continues a body politic as a school corporation, unless changed as provided by law, and as such may sue and be sued, hold property, and exercise all the powers granted by law and has exclusive jurisdiction in all school matters over the territory therein contained.
The Des Moines Independent Community School District is a political subdivision of the State of Iowa that exists as a separate legal entity; as a territorial unit, the district is responsibility for the provision of public education within its borders, operating public schools and supporting programs for children in preschool through grade twelve. The district only has authority over the land within the school district and, politically, can only wield powers conferred by the state.
The school district is legally and politically independent of other general purpose local governments, (i.e., counties and municipalities; e.g., Polk and Warren Counties, City of Des Moines, City of Windsor Heights, etc.). The district also has financial independence from other local governments. As outlined in Iowa Code Chapter 257, the district has the power to levy and collect taxes. The school district is also a public body and has some of the privileges of a government, such as the ability to issue tax-exempt bonds.
FIRST-LEVEL DISTRICT ADMINISTRATION
Dr. Thomas Ahart, Superintendent Shashank Aurora, Chief Financial Officer Bill Good, Chief Operations Officer Matt Smith, Associate Superintendent Susie Tallman, Chief Human Resources Officer
2021 - 2022 Preliminary Budget 49

ORGANIZATION CHART
2021 - 2022 Preliminary Budget 50

DES MOINES PUBLIC SCHOOLS: VISION FOR THE FUTURE
DISTRICT MISSION & GOALS
DMPS developed its Student Expectations and Board Beliefs with public input through a series of community conversations. Student Expectations are deliverables that address educational goals and specific desired outcomes for students. Board Beliefs emphasize the governance of school operations and focus of the district’s work on behalf of Des Moines students.
Mission The Des Moines Public Schools exists so that graduates possess the knowledge, skills, and abilities to be successful at the next stage of their lives.
Vision To be the model for urban education in the United States.
Student Expectations 1. Students demonstrate proficiency and understanding of a rigorous core curriculum:
A. They demonstrate proficiency in reading, writing, speaking, and listening. B. They demonstrate proficiency in mathematics, including algebra and geometry. C. They demonstrate financial and economic literacy. D. They demonstrate an understanding of the value of fine and performing arts in society. E. They demonstrate proficiency in technological and information literacy. F. They demonstrate proficiency in science, including life, earth, and physical science.
2. Students possess the knowledge and skills to be self-directed and autonomous: A. They demonstrate critical thinking and problem solving skills. B. They exercise sound reasoning in making complex choices. C. They exhibit creative, innovative, and entrepreneurial thinking. D. They understand the attributes of physical and mental well-being.
3. Students have world awareness: A. They learn from and work with individuals representing diverse cultures and religions in a
spirit of mutual respect in school, work, and community. B. They understand the rights and obligations of citizenship at local, state, national, and global
levels. C. They are actively engaged in community life. D. They are exposed to languages and cultures of the world.
2021 - 2022 Preliminary Budget 51

Board Beliefs 1. We believe in every child and, no matter their circumstance, will support them in achieving at their highest level.
• DMPS will work to ensure our students are career and post-secondary education ready, that they possess the knowledge and skills to be self-directed and autonomous, and they have world awareness with exposure to languages and cultures of the world.
2. We believe all students will have the best staff working to provide and support their education. • DMPS will be a best place to work, committed to recruiting, developing, retaining, and
recognizing high quality staff in a climate and culture where people are able to do their best work.
3. We believe in the full engagement of our parents and community in the support of our students’ education. • DMPS will commit to the support, training, and tools needed to maximize engagement
opportunities with our parents and the entire community.
4. We believe, as a community, in providing the resources necessary to offer PK-12 education of the highest quality. • DMPS will work, proactively and creatively, with the community to assure the proper
investment in our commitment to our children.
5. We believe first-rate facilities are essential to quality education. • DMPS is committed to facilities, as centers of our community and neighborhoods, which
offer safe, healthy, well-run, and creative learning environments.
6. We believe in a school district that operates with transparency, accountability, and efficiency at every level. • DMPS is committed to operating in an atmosphere of full-disclosure to ensure transparency,
accountability, and efficiency.
Board SMART Goals In Des Moines Public Schools, every student is expected to succeed academically, socially, and emotionally. However, opportunity gaps, which often result in achievement gaps, persist for several student populations. While many factors contribute to these disproportionate outcomes, the district cannot regard these outcomes as outside of the district’s locus of control. To serve all students, the district must intentionally focus on student populations experiencing the biggest disparities in opportunity and outcomes.
During the 2018-19 school year, the Des Moines School Board facilitated a number of public sessions that engaged parents, community members/partners, district staff, and students to collect information around two critical questions:
• What is the impact you want our school system to make on our students? • What do you want students to know and be able to do?
Participants were then asked to list three student outcomes representative of their answers, which were collected, categorized, and prioritized.
2021 - 2022 Preliminary Budget 52

All the information gathered from those sessions, as well as a host of district data, was collaboratively reviewed and analyzed by the Board, the Superintendent, and district staff. In addition, data revealed black males have the lowest rates of achievement in the district. It does not mean that black males are low achievers, rather that the system’s performance in creating success for black males is critically low and it needs to be named and addressed. It recognizes the need for change within the system to evolve into one that does not continue to marginalize various student populations — doing things the same way and expecting different results has proven to be ineffective. As a result, the three priority areas that were determined will be analyzed through the focus lens of black male achievement.
As a result, the Board’s community engagement efforts produced specific, measurable, time-targeted goals around three priority areas.
EARLY LITERACY • Goal 1: The percent of all third grade students on track in reading will increase from 52% to
72% by June 2023, as measured by FAST.
• Goal 2: The percent of black male third grade students on track in reading will increase from 35% to 72% by June 2023, as measured by FAST.
ALGEBRA • Goal 3: The percent of black male students earning a ‘B’ or higher in Algebra 1 by the end
of 9th grade will increase from 17% to 35% by August 2023.
In addition, a fourth Board goal will be developed for social emotional learning. Much of the work of the district over the next few years will focus on meeting these goals, and DMPS staff will report to the Board on progress towards meeting each of these goals four times per year.
2021 - 2022 Preliminary Budget 53

FINANCIAL POLICIES, BUDGETARY ASSUMPTIONS & CONSTRAINTS
GUIDING LIMITATIONS, POLICIES, & PARAMETERS
The district utilizes the Policy Governance and Management Limitations to develop the budget. Using guidance from GFOA, ASBO, Iowa Association of School Boards, and Iowa School Finance Information Services, among others, each year the Board sets targets for financial indicators, including the district’s solvency ratio and unspent spending ratio. The targets set for both the solvency ratio and unspent spending ratio place the district into the “healthy range” identified for each of these financial indicators. The following Management Limitations were used in the development of the budget.
Policy Governance: Management Limitations Management Limitation 2.6: Financial Planning/Budgeting Financial planning for any fiscal year or the remaining part of any fiscal year may not deviate materially from the Board’s Student Expectations Policy or risk financial jeopardy.
Accordingly, the Superintendent shall not present a budget that:
1. Falls below a 15% solvency ratio for the General Fund. 2. Falls below a 15% unspent spending ratio for the General Fund. 3. Creates a situation or condition described as unacceptable in the “Financial Conditions and
Activities.” 4. Omits credible projections of revenues and expenses and disclosure of planning
assumptions. 5. Plans the expenditure of more funds than are projected to be received in any fiscal year.
The Board revisits and revises management limitations annually.
Management Limitation 2.4: Financial Conditions & Activities With respect to actual ongoing conditions of the district’s financial resources, the Superintendent shall not cause or allow the development of fiscal jeopardy or a material deviation of actual expenditures from the Board’s Student Expectations Policy.
Accordingly, the Superintendent shall not:
1. Fail to provide quarterly summaries of the financial condition of the district. 2. Fail to settle district payroll obligations and payables in a timely manner. 3. Fail to implement prudent competitive quoting procedures for all facility improvement
projects in an amount that meets or exceeds the competitive quote threshold as established by Iowa law.
4. Fail to implement prudent competitive bidding procedures for all facility improvement projects in the amount of $100,000 or more.
2021 - 2022 Preliminary Budget 54

5. Fail to implement prudent competitive procedures, including but not limited to RFPs, for purchasing and securing contractual and professional services.
6. Obligate the district to contracts or expenditures greater than $100,000. 7. Acquire, lease, or dispose of real property. 8. Invest funds in securities contrary to state law. 9. Allow tax payments to other governmental ordered payments or filing to be overdue or
inaccurately filed.
The Board revisits and revises management limitations annually.
Board and Administrative Policies: Business & Operations Administrative Policy 700: Guiding Principles The primary responsibility of the board is to provide the citizens of Des Moines an education program consistent with the mission of the district and the Student Expectations. Business and operational functions relative to this mission shall be managed and implemented in an efficient, effective, and equitable manner.
Administrative Policy 702: Budget Planning Planning of the budget is a continuous process involving study and deliberation by the Board, the administrative staff, the faculty, other staff members, and the citizens of the community.
The Superintendent of Schools shall submit an annual budget for consideration, deliberation, and approval by the Board of Directors. After adoption of the budget by the official action of the board, the superintendent and/or designated representatives will be authorized to administer specific expenditures.
The budget document shall include revenue sources and expenditures for all areas of operation to implement the Student Expectations and Budget Parameters set by the board of directors.
Administrative Policy 703: Preparation of Budget Document The Superintendent shall be responsible for preparing and submitting to the board, not later than the first meeting in April, a tentative detailed budget for the ensuing fiscal year. A formalized budget for the same year will be submitted to the board as soon as is practical.
Administrative Policy 704: Budget Publication, Review and Certification A public hearing shall be held prior to the required budget certification each year to receive public comment on the budget document. The school district shall, at least ten (10) days but no later than twenty (20) days prior to the public hearing, publish the estimated budget and public hearing date, time, and place in accordance with the Code of Iowa. At least one board meeting providing an opportunity for board discussion of the budget, including the opportunity for public input, will be held at a meeting prior to the date of the public hearing and certification of the budget. Upon receiving the required certification by the board, the budget will be filed with the county auditor no later than April 15.
2021 - 2022 Preliminary Budget 55

Board Policy 770: Cash Flow and Investments The Board directs the Superintendent to invest district funds in excess of current needs in compliance applicable law and public fund investment standards.
Administrative Policy 770: Cash Flow and Investments District funds in excess of current needs shall be invested in compliance with this policy. The goals of the district’s investment portfolio in order of priority are:
• To provide safety of the principal. • To maintain the necessary liquidity to match expected liabilities. • To obtain a reasonable rate of return.
In making investments, the district shall exercise the care, skill, prudence, and diligence under the circumstances then prevailing that a prudent person acting in a like capacity and familiar with such matters would use to meet the goals of the investment program.
District funds are monies of the district, including operating funds. Operating funds of the district are funds, which are reasonably expected to be used during a current budget year or within fifteen months of receipt. When investing operating funds, the investments must mature within three hundred and ninety-seven days or less. When investing funds other than operating funds, the investments must mature according to the need for the funds.
The board authorizes the Chief Financial Officer (CFO) to invest funds in excess of current needs in the following investments:
• Interest bearing savings, money market, and checking accounts at the district’s authorized depositories.
• Obligations of the United States government, its agencies, and instrumentalities. • Certificates of deposit and other evidences of deposit at federally insured Iowa depository
institutions. • Repurchase agreements in which underlying collateral consists of investments in government
securities. The district must take delivery of the collateral either directly or through an authorized custodian. Repurchase agreements do not include reverse repurchase agreements.
• Prime banker acceptances that mature within two hundred seventy days and are eligible for purchase by a federal reserve bank. At the time of purchase, no more than ten percent of the investment portfolio can be in these investments and no more than five percent of the investment portfolio can be invested in the securities of a single issuer.
• Commercial paper or other short-term corporate debt that matures within two hundred seventy days and is rated within the two highest classifications, as established by at least one of the standard rating services, with no more than five percent at the time of purchase placed in the second highest classification. At the time of purchase no more than ten percent of the
2021 - 2022 Preliminary Budget 56

investment portfolio can be in these investments and no more than five percent of the investment portfolio can be invested in the securities of a single issuer.
• An open-end management investment company registered with the federal Securities and Exchange Commission and commonly referred to as a money market mutual fund. The money market mutual fund shall use only the investments individually authorized by law for school districts.
It shall be the responsibility of the CFO to oversee the investment portfolio in compliance with this policy and the law.
The CFO shall have the discretion to contract with an outside person to invest school district funds, to advise on investments, to direct investments, to act in a fiduciary capacity, or to perform other services to the Board for review and approval consistent with Management Limitations 2.3. The CFO shall also provide the Board with information about and verification of the outside person’s fiduciary bond. Contracts with outside persons shall include a clause requiring them to notify the district within thirty days of any material weakness in internal structure or regulatory orders or sanctions against information necessary to ensure that the investments and the outside person doing business with the district meet the requirements outlined in this policy. It shall be the responsibility of the CFO to deliver a copy of this policy to the district’s depositories, auditor, and outside persons doing business with the district.
It shall also be the responsibility of the Superintendent, in conjunction with the CFO, to develop a system of investment practices and internal controls over the investment practices. The investment practices shall be designed to prevent losses, document the officers and employees responsibility for elements of the investment process, and ensure the capability of management.
Other Financial Information Internal Control District management is responsible for establishing and maintaining an internal control system designed to ensure that district assets are protected from loss, theft, or misuse and to ensure that adequate accounting data are compiled to allow for the preparation of the basic financial statements in accordance with accounting principles generally accepted in the United States of America. Internal control is designed to provide reasonable, but not absolute, assurances that these objectives are met. The concept of reasonable assurance recognizes that the cost of a control should not exceed the benefits likely to be derived and the valuation of costs and benefits requires estimates and judgments by management.
Single Audit As a recipient of federal, state, and county financial assistance, the district is also responsible for ensuring that an adequate internal control is in place to ensure compliance with applicable laws and regulations related to those programs. This internal control is subject to periodic evaluation by management and external auditors. As a part of the district’s single audit, tests are made to determine the adequacy of the internal control over financial reporting and its compliance with
2021 - 2022 Preliminary Budget 57

applicable laws and regulations, including those related to major federal award programs. The results of the district’s single audit for the fiscal year ended June 30, 2015 revealed no instances of material weakness in the internal control or violations of applicable laws.
Budgetary Controls The district maintains strong budgetary controls. The objective of these budgetary controls is to ensure compliance with legal provisions embodied in the annual appropriated budget approved by the Board of Directors. Activities of the General Fund, Special Revenue Funds, Capital Projects Funds, Debt Service Fund, Enterprise Funds, and Private Purpose Trust Funds are included in the annual appropriated budget by program. Project-length financial plans are adopted for the Capital Projects Funds and budgeted accordingly on an annual basis.
ASSUMPTIONS FOR A BALANCED BUDGET
This budget document, like prior years, incorporates financial assumptions. The assumptions, as required by Board adopted Management Limitation 2.6(4), were used to develop the budget and these assumptions are used to ensure that revenues and expenditure projections are credible.
This budget document presents analysis that follows sound budgeting principles including: • Presentation of a balanced budget. • Limited use of one-time funding to cover one-time costs as authorized by the board. • Use of ongoing funding to cover ongoing costs. • Determination of revenues and expenditures. • Alignment of expenditures incurred and related revenues earned in the same fiscal year. • Incorporation of board management limitations. • Integration of reasonable financial assumptions.
The year 2020 was unlike any year in modern history. In the span of a week, DMPS transitioned to a new modality of teaching and learning to best protect the tens of thousands of teachers, students, families, and community members who are impacted by the work of the district. The impact the COVID-19 pandemic had on the community was great and affected all areas of operation for the district. As a direct result of COVID-19, the district is down approximately 1,000 students. In addition, the Iowa Legislature put forth bills that could directly impact enrollment in Des Moines. Student enrollment affects the amount of state aid received by the district, which is the district’s largest single source of revenue.
Given the dramatic decrease in enrollment experienced, the district will utilize a budget guarantee for FY 2022. A Budget Guarantee is the minimum amount of budget authority given to the district by the State, regardless of enrollment declines and changes to the State-calculated cost per pupil. The guarantee is a calculation based on the previous year’s budget wherein the new budget cannot be less than 101% of the previous year’s budget authority. The Budget Guarantee is funded locally
2021 - 2022 Preliminary Budget 58

through property taxes. The impact for FY 2022 will be $0.46717 to the regular levy, which will generate approximately $4 million.
In developing the budget for FY 2022 and beyond, it is unknown how many students who did not enroll in 2020-21 will return and how many students will choose to open enroll out of Des Moines, if all potential legislative acts come to fruition. After analyzing several scenarios, the district settled on a projected enrollment count that is reasonable, given the information available, and developed a balanced budget that meets the needs of students. After the Aid & Levy is finalized in June, the district may amend the budget, if needed.
The district monitors key finical indicators, forecasts, and issues that have a major impact on district finances, including the district’s spending authority and solvency ratios, Supplemental State Aid, the property tax rate, property valuations, and the General Fund forecast. In addition, the district is facing some significant financial issues that must be addressed to maintain the long-term financial health of the district, while continuing to take steps to improve student outcomes. One of the priorities of the school district is to maintain a vital, fiscally sound organization so that students continue receive education in a robust, supportive environment that is conducive to teaching and learning. The district strives to make student-centered decisions in all areas of operation.
To maintain long-term financial health, current expenditures cannot exceed current revenues. Consequently, the district must make strategic decisions to align expenditures with revenues in the most effective and efficient way possible. There are two, associated dynamics spurring these efforts: the district’s spending authority and the amount of Supplemental State Aid received from the state.
Supplemental State Aid The General Fund is the largest fund in the district and accounts for 78.5% of all revenues received by the district. The sources General Fund of revenue are state funds, local funds (including property tax), federal funds, and intermediary sources. Collectively, 90.5% of General Fund revenue comes from state or local sources (61.0% and 29.5%, respectively). Most General Fund revenue is determined by the State Foundation Formula, growth of which is controlled by Supplemental State Aid. Supplemental State Aid is the annual percent of growth that is calculated into the foundation formula.
State Foundation Aid regulated funding paid by the state to school districts to provide equal funding on a per pupil basis. It is a significant component of the District Combined Cost, the first major element of a district’s Spending Authority. The State Foundation Aid formula also funds other special programs — also known as weighted funded programs — based on enrollment adjusted by a weighting factor, then multiplied by the cost per student. These programs include Special Education, Shared Programs, English Language Learners, Gifted and Talented, At-Risk programming, and Home School Instruction.
2021 - 2022 Preliminary Budget 59

The annual amount of State Foundation Aid is driven by Supplemental State Aid. Supplemental State Aid is the annual percent of growth that is calculated into the foundation formula. From 1973 – 1994, the average annual growth in school funding was 6.42%. From 1995 – 2010, when allowable growth was no longer set by a formula but became a legislatively passed item, the rate of annual growth decreased to 3.22% From 2011 – 2020, the average annual growth in State Aid has been 1.86%.
The district is budgeting for a 2.4% annual growth to Supplemental State Aid in FY 2022. While this is an improvement from last year, it is woefully inadequate. Supplemental State Aid is vital as costs paid for with funding from the General Fund — such as health care, other compensation components, fuel costs, and cost of goods and services — continue to rise. Supplemental State Aid has been abysmal over the past several years. The real fear is that 0-2% Supplemental State Aid is the “new normal” school districts are facing, and the years of regular 4% increases to Supplemental State Aid are a thing of the past. School districts have also experienced increased state categorical funding (such as TLC funding) that can only be spent on certain programs, not for general education purposes.
Final State Foundation Aid will not be determined until the Iowa Department of Education releases the final Aid & Levy in June. When State Aid is finalized, the district may amend the budget.
0%
2%
4%
6%
8%
10%
12%
14%
16%
ANNUAL SUPPLEMENTAL STATE AID1973 – 1994 Average Annual Growth: 6.22% 1995 – 2010 Average Growth: 3.29% 2011 – 2021 Average: 1.86%
2021 - 2022 Preliminary Budget 60

In recent years, the amount of Supplemental State Aid allocated by the state has not covered the compensation settlements with employee groups. This gap has caused the district to use unspent spending dollars to cover the costs of operations. NOTE: DMEA is the largest employee group in the district and is used for illustrative purposes.
Spending Authority Iowa uses a school finance formula that sets the maximum amount a district is authorized to spend and certify on a budget for a fiscal year. A district’s spending authority is the sum of the district’s combined cost and miscellaneous income for the budget year plus the unspent balance from the previous year. Under the spending authority control, it is illegal for a school district to exceed its maximum authorized budget. It is important to understand that the limit on spending is the amount of spending authority a district has, not the amount of cash or fund balance a district has.
The unspent spending authority ratio is a measure of the district’s unbudgeted authorized spending capacity (not cash reserves) and is defined as the district’s unspent spending authority divided by the district’s maximum budget authority. The IASB recommends this ratio be in the target range of 10-20%. The Board adopted guidelines in FY 2012 setting the target for the district’s unspent spending authority ratio at 10%; in 2015 the Board raised this target to 15%.
Spending authority is directly tied to student enrollment, and there are only three general means by which the district’s spending authority can grow: (1) increased State Supplemental Aid, (2) increased enrollment, or (3) increased miscellaneous income. In situations where spending authority is not growing, if no adjustments are made to expenses, the unspent budget is tapped into to cover expenses. The significant predicament this creates is the decrease in the district’s maximum authorized budget, as it is illegal for a school district to exceed its maximum authorized budget.
In FY 2017, the district’s forecasting model indicated that if Supplemental State Aid continued to grow by 1%, as had been the trend, by 2019, expenses would exceed Spending Authority by more than $5 million (and rising) each year, if changes were not made. Consequently, the district cut expenditures for three years to stay within compliance of the spending authority function.
3.11%3.95% 3.98% 4.09%
3.33%2.92%
3.35% 3.28%2.66% 2.62%
2.19%
0.00%
2.00%2.00%
4.00%
1.25%
2.25%
1.10% 1.00%
2.06% 2.30%
2.40%
0%
1%
2%
3%
4%
5%
FY 2012 FY 2013 FY 2014 FY 2015 FY 2016 FY 2017 FY 2018 FY 2019 FY 2020 FY 2021 FY 2022
SUPPLEMENTAL STATE AID VS. COMPENSATION SETTLEMENTS
DMEA Settlement State Allowable Growth
2021 - 2022 Preliminary Budget 61

To develop the budget for FY 2020 and beyond, the district modeled out numerous scenarios that outlined the impact Supplemental State Aid, inflation, compensation, and expenditure reductions have on district’s unspent authorized budget. Thereafter, the district settled on one set of likely variables and modeled out multiple scenarios with the focus on returning the district to a Spending Authority Ratio that meets the Board’s target of 15%. Based on those models, the district resolved to implement aggressive expenditure reductions spread over a number of years to reach the Board target.
FY 2022 is the third year of the planned expenditure reductions. Each year, the district has evaluated the need for and amount of reductions to be made. The original strategy was to cut $24M for three consecutive fiscal years. The district revised its strategy in FY 2021 to be a $24M reduction in year one, followed by $14M in reductions for the next three years. After making the aggressive expenditure reductions in FY 2020 and FY 2021, the district was on track to reach the Board Target.
Going into budget planning for FY 2022, the district again reviewed conditions to determine if things had improved, deteriorated, or remained unchanged to determine adjustments to targets and goals for the district’s budget and Spending Authority. While the district was on-track to meet the Board target for Spending Authority, the COVID-19 pandemic began, impacting all areas of district operation, including student enrollment. As a direct result of COVID-19, the district is down approximately 1,000 students. This is the largest single decrease in decades and will impact the district in FY 2022 and potentially for years beyond. What is unknown is how many of the approximate 1,000 students will enroll in DMPS in fall 2021. In addition to the enrollment impact due to the global pandemic, the Iowa Legislature has also put forth bills that could directly impact enrollment in Des Moines. DMPS currently operates under a voluntary diversity plan. The proposed legislation would eliminate that diversity plan, thereby potentially increasing the number of students who choose to open enroll out of Des Moines. It is unknown how many students would choose to open enroll out of Des Moines if the voluntary diversity plan is eliminated. Another proposed piece of legislation would introduce a “Student First Scholarship Program” that would allow students to utilize a voucher to pay tuition to a private school. It is unknown how many students would choose to utilize a voucher to enroll in a private school.
While the final impact of these three enrollment variables are unknown, the district modeled various scenarios on the potential impact. The most likely scenario is built into the district’s long-term forecast, and the district continued to evaluate conditions and adjust accordingly while planning for FY 2022. Given all currently financial conditions, the district will reduce $15 million in expenditures for FY 2022, with $14 million in reductions thereafter. This plan continues to move the district toward achieving the Board target for Spending Authority.
2021 - 2022 Preliminary Budget 62

The district is projected to end FY 2021 with an unspent Spending Authority Ratio of 7.4% and is forecasting the FY 2022 unspent Spending Authority Ratio to be 11.5%
Solvency Ratio The district’s solvency ratio is a moment-in-time (June 30) measurement of the district’s General Fund financial health. The solvency ratio is measure of the district’s fund equity position and is defined as the unreserved, undesignated fund balance (commonly referred to as the cash reserves) divided by the district’s total General Fund revenues, less AEA flow-through.
The Iowa Association of School Boards (IASB) considers a solvency ratio of 5-10% within “Target” or “Good” and therefore “can handle the unexpected.” GFOA guidelines are 10-17%. During the 2012-13 school year, the School Board approved a minimum target of 15.0% for the district’s solvency ratio. Board guidelines state that the solvency ratio should not go below 3%, without prior knowledge of the Board. The solvency ratio for the district increased at year end 2020 to 21.0%, up from 15.1% the prior year. The solvency ratio for FY 2021 is projected to end at 25.4%, and the solvency ratio is forecasted to be at 27.5% for FY 2022.
0.0%
5.0%
10.0%
15.0%
20.0%
$-
$20,000,000
$40,000,000
$60,000,000
$80,000,000
FY 2013 FY 2014 FY 2015 FY 2016 FY 2017 FY 2018 FY 2019 FY 2020 FY 2021(est.)
FY 2022(forecast)
SPENDING AUTHORITY
Unspent Authorized Budget Unspent Spending Authority School Board Target
0%
10%
20%
30%
40%
FY 2013 FY 2014 FY 2015 FY 2016 FY 2017 FY 2018 FY 2019 FY 2020 FY 2021(est.)
FY 2022(forecast)
SOLVENCY RATIO
Solvency Ratio Target Solvency Ratio
2021 - 2022 Preliminary Budget 63

General Fund Forecast
Multi-year financial planning can potentially avoid the budgetary cycle of simply putting out the next fire by providing a longer term perspective on what problems are coming and thus preventing or minimizing them. Maintaining the financial health of the district is accomplished through a variety of factors including:
(1) Maintaining a spending authority ratio within the recommended guidelines. (2) Maintaining a solvency ratio within the recommended guidelines. (3) Following GFOA recommendations of 60 days of cash reserves on hand. (4) Managing the district’s investment portfolio and debt. (5) Conducting trend/forecast analysis including the various impacts tax rates can have on the
district.
Long-term forecasting helps the district budget for areas of operation to achieve Student Expectations, while staying within the annual Budget Parameters set by the Board of Directors. The Business & Finance department reviews financial data on daily, monthly, quarterly, and annual basis. If an analysis determines that an initiative is not effective, corrective steps are taken. The Business & Finance department also completes and presents quarterly monitoring reports to the Board to demonstrate the district’s fiscal condition.
The forecast makes the following assumptions for revenues: (1) Enrollment decreases occur each year. (2) The percent of growth for Supplemental State Aid is 2.4% for FY 2022 and 1.00% for FY
2023-2025. (3) The amount of federal revenue received will decrease post-COVID.
The forecast also makes the following assumptions for expenditures: (A) Historical increases for compensation (state average) will continue. (B) Modest 1% increases for goods and services (inflation). (C) Expenditure reduction $15 million in FY 2022 and $14 million annually thereafter.
2021 - 2022 Preliminary Budget 64

Re-estimated Budget Projected Projected ProjectedFY 2018 FY 2019 FY 2020 FY 2021 FY 2022 FY 2023 FY 2024 FY 2025
Revenues with assumptions with assumptions with assumptions with assumptions Total Revenues 444,170,081 452,812,724 461,710,638 458,847,521 442,685,000 445,034,000 442,609,000 445,207,000
ExpendituresTotal Expenditures & Other Uses 442,356,665 440,144,259 433,436,251 440,439,687 437,863,000 446,434,000 462,198,000 479,013,000
Excess Revenues Over Expenditures 1,813,416 12,668,465 28,274,387 18,407,834 4,822,000 (1,400,000) (19,589,000) (33,806,000) Beginning Fund Balance 82,303,759 84,117,175 96,785,640 125,060,027 143,468,000 148,290,000 146,890,000 127,301,000
Ending Fund Balance 84,117,175 96,785,640 125,060,027 143,467,861 148,290,000 146,890,000 127,301,000 93,495,000
Solvency Ratio 12.7% 15.1% 21.0% 25.3% 27.5% 27.0% 22.5% 14.5%Unspent Spending Authority Ratio 3.0% 2.3% 5.2% 7.4% 11.5% 14.0% 14.0% 12.6%
Unspent Authorized Budget 13,687,231 10,391,630 23,811,426 35,214,678 56,689,000 72,451,000 75,178,000 69,006,000
AssumptionsSupplemental State Aid 2.40% 1.00% 1.00% 1.00%
Enrollment 31621 31933 31683 31433Inflation Increase 1.00% 1.00% 1.00% 1.00%
Compensation Increase Negotiated Negotiated Negotiated Negotiated
Expenditure Reduction $15M reductionReview; up to $14M
reduction
Review; up to $14M
reduction
Review; up to $14M
reduction
DES MOINES PUBLIC SCHOOLS2021 - 2022 BUDGET
GENERAL FUND FORECAST
2021 - 2022 Preliminary Budget 65

Property Tax Rate and Valuations The district will utilize the Budget Guarantee for FY 2022, which will provide a financial buffer to the enrollment decreases experienced in 2020-21. The Budget Guarantee will be funded by an increase to the regular General Fund levy. However, per the Preliminary Aid & Levy, the total school district property tax rate is projected to decrease.
District Property Overall Recommended Tax Rate FY 2021 FY 2022 Change GENERAL Regular Instructional Support Dropout Prevention Cash Reserve Levy
8.87 1.57 1.36 2.47
9.03 1.56 1.32 0.00
0.16
(0.01) (0.04) (2.47)
MANAGEMENT 3.24 2.36 (0.88) PPEL Regular Voted
0.33 0.63
0.33 1.34
0.00 0.71
PERL 0.135 0.135 0.00 DEBT SERVICE 0.00000 0.00000 0.00 TOTAL 18.61 16.08 (2.53)
As outlined on the following page, the Polk County Assessor is anticipating overall property assessments used to determine tax collections for FY 2022 will increase slightly by 2.0%. Total property valuations multiplied by the tax rate equals the total taxes assessed.
$0
$5
$10
$15
$20
$25
$30
FY 2013 FY 2014 FY 2015 FY 2016 FY 2017 FY 2018 FY 2019 FY 2020 FY 2021 FY 2022(budget)
ANNUAL PROPERTY TAX RATE
2021 - 2022 Preliminary Budget 66

Polk County Warren County Total Polk Warren Total Polk Warren Total
Residential 5,367,177,741$ 66,732,362$ 5,433,910,103$ 5,479,334,573$ 69,286,080$ 5,548,620,653$ 2.1% 3.8% 2.1%Commercial 2,422,048,834 2,344,950 2,424,393,784 2,488,199,304 2,492,245 2,490,691,549 2.7% 6.3% 2.7%Industrial 203,210,911 - 203,210,911 222,588,246 - 222,588,246 9.5% NA 9.5%Agricultural 2,374,242 1,545,814 3,920,056 2,540,832 1,467,372 4,008,204 7.0% (5.1%) 2.2%Utilities (WO Gas & Electric) 24,056,056 717,137 24,773,193 18,483,410 659,241 19,142,651 (23.2%) (8.1%) (22.7%)Railroads 21,432,185 - 21,432,185 22,618,481 - 22,618,481 5.5% NA 5.5%
Total Valuation 8,040,299,969 71,340,263 8,111,640,232 8,233,764,846 73,904,938 8,307,669,784 2.4% 3.6% 2.4%Less: Military 10,681,410 248,168 10,929,578 9,990,445 244,191 10,234,636 (6.5%) (1.6%) (6.4%)Plus: Gas & Electric 188,420,325 4,340,739 192,761,064 176,605,624 4,098,807 180,704,431 (6.3%) (5.6%) (6.3%)
Total General Taxable Valuation 8,218,038,884 75,432,834 8,293,471,718 8,400,380,025 77,759,554 8,478,139,579 2.2% 3.1% 2.2%TIF Value 1,002,372,633 - 1,002,372,633 1,000,524,071 - 1,000,524,071 (0.2%) NA (0.2%)
Total Debt & PPEL Taxable Valuation 9,220,411,517$ 75,432,834$ 9,295,844,351$ 9,400,904,096$ 77,759,554$ 9,478,663,650$ 2.0% 3.1% 2.0%
DES MOINES PUBLIC SCHOOLS2021 - 2022 BUDGET
LOCAL FUNDS: PROPERTY VALUATIONS — PREVIOUS YEAR AND BUDGET YEAR
1/1/2020FY 2022 One Year ChangeFY 2021
1/1/2019
2021 - 2022 Preliminary Budget 67

BUDGET PROCESS
BUDGETING PRINCIPALS
This budget document presents analysis that continues to follow sound budgeting principles including presentation of a balanced budget, limited use of one-time funding to cover one-time costs as authorized by the board, use of ongoing funding to cover ongoing costs, determination of revenues and expenditures, alignment of expenditures incurred and related revenues earned in the same fiscal year, incorporation of Board Management Limitations and Board budgetary parameters, and the integration of reasonable financial assumptions.
School districts in Iowa must operate within their means. There are eight ways a budget can be balanced:
The district’s General Fund is balanced using methods #1 (Revenues ≥ Expenditures) and #2 (Revenues + Fund Balances ≥ Expenditures). The district’s combined budget is balanced using method #8 (Revenues + Fund Balances + Transfers + Loans ≥ Expenditures).
1. Revenues ≥ Expenditures 2. Revenues + Fund Balances ≥ Expenditures 3. Revenues + Transfers ≥ Expenditures 4. Revenues + Loans ≥ Expenditures 5. Revenues + Fund Balances + Transfers ≥ Expenditures 6. Revenues + Fund Balances + Loans ≥ Expenditures 7. Revenues + Transfers + Loans ≥ Expenditures 8. Revenues + Fund Balances + Transfers + Loans ≥ Expenditures
2021 - 2022 Preliminary Budget 68

BASIS OF BUDGETING
In governmental accounting, the budgetary basis of accounting differs slightly from Generally Accepted Accounting Principles (GAAP) that is the basis used in preparation of the Comprehensive Annual Financial Report.
The basis of budgeting (or “budgetary basis”) refers to the basis of accounting used to estimate financing sources in the budget. There are three general types of budgetary bases:
• Cash Basis indicates transactions are recognized only when cash is increased or decreased. • Accrual Basis indicates revenues are recorded when they are earned (whether or not cash is
received at the time) and expenditures are recorded when goods and services are received (whether or not cash disbursements are made at the time).
• Modified Accrual Basis is the method under which revenues and other financial resource increments are recognized when they become susceptible to accrual; that is, when they become both “measurable” and “available to finance expenditures of the current period.” Available means collectible in the current period or soon enough thereafter to be used to pay the liabilities of the current period.
The district uses modified accrual as the basis of budgeting.
Conversely, district management prepares a Comprehensive Annual Financial Report that utilizes the following principles:
Government-
Wide Statements
Fund Financial Statements
Governmental Funds
Proprietary Funds Fiduciary Funds
Scope Entire district (except Fiduciary Funds)
Activities that are not Proprietary or Fiduciary, such as instruction, administration, and building maintenance
Activities the district operated similar to private businesses, such as school nutrition
Activities the district administers on behalf of someone else, such as scholarships
Required Financial Statements
• Statement of Net Assets
• Statement of Activities
• Balance Sheet • Statement of
Revenues, Expenditures, and Changes in Fund Balances
• Statement of Net Assets
• Statement of Revenues, Expenditures, and Changes in Fund Balances
• Statement of Cash Flows
• Statement of Fiduciary Net Assets
• Statement of Changes in Fiduciary Net Assets
2021 - 2022 Preliminary Budget 69

Accounting Basis
Accrual Accounting
Modified Accrual Accounting
Accrual Accounting
Accrual Accounting
Measurement Focus
Economic Resources
Current Financial Economic Resources
Economic Resources
Type of Asset / Liability Information
All assets and liabilities, both financial and capital and short-term and long-term
Generally, assets expected to be used up and liabilities that come due during the year or soon thereafter; no capital assets or long-term liabilities included
All assets and liabilities, both financial and capital, and short-term and long-term
All assets and liabilities, both short-term and long-term
Type of Inflow / Outflow Information
All revenues and expenses during year, regardless of when cash is received or paid
Revenues for which cash is received during or within specified periods after year-end of the year; expenditures when goods or services are received and liability is due and payable
All revenues and expense during the year, regardless of when cash is received or paid
All additions and deductions during the year, regardless of when cash is received or paid
The most recent Comprehensive Annual Financial Report can be found at: http://www.dmschools.org/departments/business-finance/financial-reports/.
The budgetary basis of accounting is not subject to the same provisions as GAAP. The differences between the two may be summarized by four important distinctions:
1) Basis: Generally Accepted Accounting Principles (GAAP) uses the accrual basis of accounting as the primary method for recording and calculating information. Accrual accounting is the idea that financial transactions are noted and recorded at essentially the same time that they take place. A budgetary basis of accounting uses either a modified accrual basis or the cash plus encumbrances method. Modified accrual accounting, which the district uses as the basis of budgeting, combines accrual accounting and cash basis accounting. This means that expenditures and liabilities are often recorded when they occur, but can also take place when physical cash is used as the basis for the transaction.
2) Timing: Timing is part of the difference between the various accrual methods. In GAAP accounting, transactions based on accrual methods are concurrent with the recording of those transactions. However, with budgetary basis accounting, this is not required. Instead, there can be a lapse between the budgetary period and the accounting period. In other words, the actual recording of the financial transactions and the reconciliation can take place at a later date.
2021 - 2022 Preliminary Budget 70

3) Reporting: The reporting perspective of budgetary basis accounting can also differ somewhat from the reporting perspective of GAAP accounting. In budgetary basis accounting, certain items can be reported as part of the General Fund, whereas in GAAP accounting, these same items must be reported separately. This is simply a matter of the basis structuring of accounting methods.
4) Entities: The final major difference between GAAP and the budgetary accounting basis is in the reporting of entities for which funds are typically allocated. In GAAP accounting, each entity is noted and recorded. However, in budgetary basis accounting, not every entity for which funds have been appropriated will necessarily show up in the budget and in the general account. Whenever this occurs, it is referred to as an entity difference.
In Des Moines Public Schools, differences between the basis of accounting and the basis of budgeting methods include:
• The timing of revenue and expenditures. For example, in GAAP accounting, revenues are recognized in Governmental Funds as soon as they are both “measurable” and “available,” whereas revenues recognition under the budgetary basis of accounting may be deferred until amounts are actually received in cash.
• Encumbered amounts are commonly treated as expenditures under the basis of budgeting, while encumbrances are never classified as expenditures under the GAAP basis of accounting.
• Budgetary revenues and expenditures may include items classified as “other financing sources” and “other financing uses” under the GAPP basis of accounting.
• Under the GAAP basis of accounting, changes in the fair value of investments are generally treated as adjustments to revenues, which is not commonly the case under the basis of budgeting.
• Under the GAAP basis of accounting, an expenditure is recognized for the net present value of minimum lease payments at the time the district enters into a capital lease involving a governmental fund. Typically, no such expenditure is recognized under the basis of budgeting.
• There may be differences between the fiscal year used for financial reporting and the budget period (e.g., grants from the U.S. Department of Education may operate on an October 1 – September 30 fiscal calendar).
• The fund structure used in GAAP financial statements may differ from the fund structure used for budgetary purposes.
• Under the GAAP basis of accounting used in proprietary funds, the receipt of long-term debt proceeds, capital outlays, and debt services principal payments are not reported in operations, but all allocations for depreciation and amortization expense are recorded. The opposite is true under the budgetary basis.
2021 - 2022 Preliminary Budget 71

BUDGET PLANNING
Budget planning is a continuous process involving study and deliberation by the Board, administrative staff, faculty, other staff members, and citizens of the community. It is important to note there are two distinctive budget documents with uniquely different purposes and timelines the Certified Budget and the Adopted Budget and Financial Statements.
Certified Budget The Superintendent submits an annual budget for consideration, deliberation, and approval by the Board of Directors no later than the first meeting in April. Iowa law requires the proposed budget (i.e., the certified budget) to be filed with the Polk County Auditor by April 15 of each year. The “proposed/certified budget” provides data that is the basis of the school property tax levy to begin on July 1 and run through June 30 of the following calendar year. In addition, the certified budget establishes the legal expenditure limit in each of the district’s various expenditure categories. The Superintendent and/or designated representative is authorized to administer specific expenditures only after the official adoption of the certified budget by the Board. The proposed budget for certification is included in the Appendix.
Legal Requirements for Budget Publication, Review, and Certification A public hearing is held prior to the required budget certification each year to receive public comment on the budget document. On or before April 15 of each year, Iowa Code Sections 24.9 and 24.17 require the district to accomplish the following:
1. The school district must publish a notice with the location, date, and time for the public hearing at least ten (10) days but no later than twenty (20) days prior to the public hearing.
2. The school district must hold a public hearing. 3. Upon receiving the required certification by the Board, the certified budget must be filed
with the county auditor no later than April 15.
In meeting the filing requirement of April 15, it is necessary to re-estimate miscellaneous incomes and expenditures for the current fiscal year as well as initially estimate miscellaneous incomes and expenditures for the next fiscal year. Because the process requires making estimates as many as fifteen months in advance, it may be necessary to amend the budget to change the legal expenditures limit in some of the various categories.
In the event the budget is amended, the legal expenditures limit can only be increased to use un-anticipated miscellaneous incomes or prior year unused funds. The current fiscal year school property tax levy is final and cannot be increased. The district is proposing the maximum tax levy. This levy can be amended to be lower amount, but it cannot be increased.
2021 - 2022 Preliminary Budget 72

Summary of Proposed Budget for Certification
The full proposed budget summary for certification is located on the final page of this document.
Summary of Publication
Revenue Total Revenue (line 21) $ 563,831,886
Beginning Balance (line 22) $ 248,267,574 Total Resources (line 23) $ 812,099,460
Expenditures Instruction (line 24) $ 283,553,293
Total Support Services (line 32A) $ 168,392,566 Non Instructional Programs (line 33) $ 25,471,638
Total Other Expenditures (line 36A) $ 76,759,532 Transfers Out (line 38) $ 24,093,997
Total Expenditures, Transfers, & Other (line 40) $ 578,271,026
Ending Fund Balance (line 41) $ 233,828,434 Total Requirements (line 42) $ 812,099,460
Proposed Tax Rate: 16.08128
Adopted Budget and Financial Statements In addition to the certified budget that is filed with the County Auditor by April 15, a detailed document, the Adopted Budget and Financial Statements, is developed for the same year and is released as soon as is practical. This document is the culmination of a multi-month budget development process (described below) and is completed prior to the July 1st start of the fiscal year. The budget document is designed to serve as a management tool. It is a detailed analysis of all revenue sources and expenditures for all areas of operation to implement the Student Expectations/Board Beliefs set by the Board of Directors, achieve progress toward the Board SMART Goals, and ensure success of students. The information contained in the main body of this document is reflective of the budgeted plan to fund the district’s instructional programs and services and is more complete than the certified budget.
The purpose of the certified budget and the detailed Adopted Budget and Financial Statements is to provide timely information with which to make strategic decisions that ultimately affect the quality of education provided to students.
2021 - 2022 Preliminary Budget 73

BUDGET DEVELOPMENT
District Budget Development The district-wide budget development process is a collaborative process involving many stakeholders including school personnel, Business & Finance, the CFO, the Superintendent, and the Board. The budget reflects the labor, materials, and resources required to fulfill the goals and objectives outlined by the Board. The budget serves as an operational plan, stated in financial terms, for carrying out the goals of the school system. The budget preparation process begins each year in the fall, continues through April 15 with the adoption of the certified budget by the Board, and culminates with revisions based on actual enrollment in October.
In previous years, a high-level overview of the collaborative process was as outlined below:
The district modified this process slightly to push the collaboration on the front-end, as outlined in the following high-level overview:
CFO charges Chiefs to work with their teams to develop recommendations
Chiefs provide recommendations to CFO
Chiefs discuss all recommendations
Superintendent / CFO present budget plan to Board
Engage Cabinet members in Budget Advisory Team
Budget Advisory Team develops recommendations
Recommendations presented to Chiefs
Chiefs discuss all recommendations
Superintendent / CFO present budget plan to Board
2021 - 2022 Preliminary Budget 74

To achieve this modified process, the CFO convened a working Advisory Team comprised of Cabinet members from every Chief’s office. The team met to develop recommendations that were presented to the Chiefs of how to reach the target. The goal of the team was to provide recommendations with minimal impact to students and employees. The approach to reach budget targets was to consider both cost reductions and revenue generating ideas, while keeping the financial targets for Spending Authority and Solvency ratios in mind. In addition to reductions, the district has planned new expenses related to achieving the Board’s SMART goals that had not been previously identified. The CFO presented this to Chiefs; that group made final decision.
Idea Cost Savings Retirement incentive $2.0 M
Discontinuation of activities $1.5 M Health benefits / payroll $4.0 M
Staffing in all areas / departments $4.1 M Moving Costs from General Fund to SAVE or PPEL $0.2 M
SSA in addition to 1% $3.2 M
TOTAL EXPENDITURE REDUCTION RECOMMENDATION $15.0 M
New SMART Goal Expenditures $0.7 M
The employee positions identified will be addressed through the allocation process (13 FTE at the elementary level, 5 FTE at the middle school level, and 2 FTE at the high school level), in specific programs (2.4 FTE in the IB program and 3 FTE in the Turnaround Arts program), and in Central Office (1 FTE in HR, 4 FTE in Custodial, 1 FTE in Security, and 7 FTE in Student & Family Services). Activities that will be impacted in FY 2022 include reducing expenses for the IB program, Climate Summit, and certain athletic and instructional stipends. Changes to employee benefits include changes to dental and medical benefits.
Moving forward, the district will continue with the implementation phase on ideas developed by the Advisory Team. New working groups will be formed to work on the execution of these ideas. Major areas for evaluation include: conducting a new demographic study, evaluating athletic committee proposals, and executing an ongoing Student ROI evaluation, evaluating academic and student program that provide the lease value to students at the highest post.
School Budget Development The development of a school budget is a critical component of the district-wide process. A school’s budget is often driven by allocation formula, contractual obligations, district-wide policies and procedures, and school-based initiatives.
The process starts with each school’s enrollment projections and programmatic requirements. Business & Finance staff sends each school a budget workbook showing its resources and allocations. The workbook contains various components such as staffing, prior year expenditures, and enrollment counts. School administrators review the budget and work with their administrative team to make decisions regarding staffing and resource allocation for the following year.
2021 - 2022 Preliminary Budget 75

Adjustments are made in October, once actual enrollments are certified. Decentralized funds are allocated to schools based on enrollment.
Timeline Building the district budget is a year-round process, beginning in the fall of the current fiscal year, and ending in October of the following fiscal year when the district and school budgets are revised per certified enrollment figures. All activities are influenced by variables including the state budget process, changes in employee compensation, and budget constraints. The following calendar of events more fully explains the budget development and approval process.
Budget Timeline Ongoing Performance monitored
Fall Revisions to current fiscal year; departments and schools submit requests for new fiscal year
Winter Input from the community and staff solicited for new fiscal year
Spring Proposed budget for new fiscal year released; public hearings held; budget for new fiscal year approved
Summer Close out of current fiscal year; startup of new fiscal year; projections for next fiscal year
Ongoing • The School Board monitors school system performance to ensure reasonable progress is
made toward meeting student achievement goals and to ensure operational expectations are being met. Board Monitoring Reports are presented throughout the year.
September – November • CFO develops budget calendar. • Business & Finance reviews current fiscal year budget, begins updating five-year forecast,
and refines estimates and recommendations for the next fiscal year. • CFO reviews financial outlook with Cabinet. • Business & Finance certifies enrollment for the current fiscal year and current fiscal year
budgets are revised accordingly. • Business & Finance completes enrollment projections for the next fiscal year. • Business & Finance completes revenue projections and develops cost and program
guidelines for budget areas. • Business & Finance completes staffing salary and benefit cost projections for the next
fiscal year.
December – February • Superintendent and CFO solicit input on budget priorities. • Cabinet prioritizes recommended initiatives and changes to programs and services. • Superintendent and CFO (with Cabinet) make preliminary program and staffing
additions/reductions decisions. • Board holds work sessions.
2021 - 2022 Preliminary Budget 76

• Business & Finance prepares proposed budget for certification.
March – April • Board holds work sessions. • Proposed budget is released for public review and presented to the Board. • CFO meets with community to discuss the proposed budget. • Board holds a public hearing. • Board adopts and certifies the budget. • Business & Finance files budget with the Polk County Auditor.
May – August • Business & Finance updates revenue estimates as new information becomes available
from the tax assessor, state legislature, State Department of Education, and federal government agencies.
• Business & Finance finalizes budget based on the most current information and the formal budget book is developed.
• Business & Finance closes out accounts for current fiscal year, enters appropriations for the new fiscal year into books of accounts, and opens new accounts for the next fiscal year.
• Business & Finance completes startup for new fiscal year through the distribution of approved line item budget amounts for building principals and department heads.
• Business & Finance develops a financial forecast for the following fiscal year, framing the underlying assumptions on expected costs, revenue, position turnover, inflations, and other issues that drive budget development.
2021 - 2022 Preliminary Budget 77

FY 2022 Budget Calendar (Actual and Projected) 2021
September – October Five year budget forecast revised with known factors
October 1 Board report: Financial Planning & Budgeting October 20 School Board work session: Budget Overview November 21 Public Forum: Community Legislative Action Team meeting
2022 January 11 Iowa Legislature convened January 12 Governor’s budget recommendations released February 16 School Board work session: Budget Development March 2 School Board work session: Budget Development
March 26 Preliminary Budget & Financial Statements published online and proposed budget published in The Des Moines Register (Note: By law, the budget must be published 10 to 20 days before the Public Hearing)
March 26 Virtual Budget Public Forum April 6 School Board meeting: Public Hearing; Board Adoption & Certification April 7-14 If necessary, Special School Board meeting: Hearing; Board Adoption & Certification April 15 Statutory deadline to submit budget to the Polk County Auditor for certification April 30 110th day of the Legislative Session June 30 Adopted Budget & Financial Statements published online July 1 Fiscal Year 2022 begins August 25 First day of the 2021-2022 school year September – October Five year forecast revised
October Student enrollment certified FY 2022 district and school budgets revised based on actual enrollment
2022 June 1 Last day of the 2021-2022 school year June 30 Fiscal Year 2022 ends
2021 - 2022 Preliminary Budget 78

FUND STRUCTURES & DESCRIPTIONS
Fiscal operations of the district are organized on the basis of “funds” and “accounts.” A fund is a grouping of related accounts that is used to maintain control over resources that have been segregated for specific activities or objectives, and each fund is a separate accounting entity with a self-balancing set of accounts. District resources are allocated to and accounted in various funds according to the purpose for which they are spent and how they are controlled. Some funds are required by state law or bond covenants, others are established to control and manage money for particular purposes.
All of the district’s funds are divided into one of three categories: I) Governmental, II) Proprietary, and III) Fiduciary.
DMPS All Funds
Governmental Funds
Operating Fund
General Fund
Special Revenue Funds
Management
PPEL
PERL
Student Activity
Governmental Trust
Capital Projects Funds
SAVE
Debt Service Fund
Debt Service
Proprietary Funds
Enterprise Funds
Food & Nutrition
Child Care
Home Building
Student Auto Body
Internal Service Funds
Self-Insurance
Risk Management
Print Shop
Fiduciary Funds
Trust Funds
Private Purpose
Pension
Agency
2021 - 2022 Preliminary Budget 79

I) GOVERNMENTAL FUNDS Governmental Funds account for activities typically associated with government operations. Property taxes and intergovernmental revenues, such as State Aid and federal funding, primarily support Governmental Funds. Expenditures are classified by function such as instruction, support services, operation and maintenance of plant, student transportation, operation of non-instructional services, and capital construction. The four fund types in the Governmental Fund category are:
A) The Operating Fund (i.e., General Fund) accounts for day-to-day operations of schools and is the general operating fund of the district. It is funded primarily by state funds, federal funds, and local revenues, including property taxes.
B) Special Revenue Funds account for and report the proceeds of specific revenue sources (other than Capital Projects or Debt Service) that are legally restricted or committed to expenditures for specified purposes.
C) Capital Projects Funds account for all revenues and expenditures generated through the collection of local option sales taxes and expenditures attributed to the Schools First or Students First renovation programs.
D) The Debt Service Fund accounts for all aspects of the incurrence and repayment of general long-term debt.
II) PROPRIETARY FUNDS Proprietary Funds account for activities similar to those found in the private sector where the intent of the governing body is to finance the full cost of providing services primarily through user charges. As described below, there are two fund types in the Proprietary Fund category:
A) Enterprise Funds account for operations that are financed and operated in a manner similar to private business enterprises or where the intent of the district is to finance or recover, primarily through user fees, the costs of goods or services on a continuing basis or where the district has determined that the revenue earned, cost incurred, and/or net income is necessary for management accountability.
B) Internal Service Funds account for business-like activities where related goods or services are provided by one district department to other departments on a cost reimbursement basis.
III) FIDUCIARY FUNDS Fiduciary Funds account for assets held by the district in a trustee capacity or as an agent for individuals, private organizations, other governments, or other funds. They provide information about the financial relationships in which the district acts solely as a trustee or agent for the benefit of others.
A) Trust or Agent Funds held by the district (e.g. Private-Purpose Trust, Pension Trust, and Agency Funds), while included in the budget book, are appropriated and, therefore, are not part of the total budget.
2021 - 2022 Preliminary Budget 80

Within the three fund categories and the various fund types, the district maintains the following fund accounts:
I) GOVERNMENTAL FUNDS A) Operating Fund:
1. The General Fund is the largest fund in the district. It is used to account for and report all financial resources not accounted for and reported in another fund.
B) Special Revenue Funds: 1. The Management Fund is authorized by Iowa Code Section 298.4. The Management Fund receives monies from a tax levy approved by the Board for the purpose of covering the costs of property and liability insurance, equipment breakdown insurance, unemployment, early retirement incentives, workers’ compensation claims, and judgments. Given the district’s re-evaluation of the early retirement program, the district intends to lower the tax rate in the Management fund to reflect this cost reduction.
2. Physical, Plant, and Equipment Levy Fund (PPEL) is authorized by Iowa Code 298.2. Revenue is primarily generated from voter- and Board-approved property tax levies. The FY 21 PPEL levy will continue at the same rate as in past years. The voter portion of the PPEL levy was raised to the max of $1.34 for ten years in September 2019 and will go into effect with the FY 22 budget. The PPEL Fund accounts for transactions related to the improvement of facilities and grounds, construction of schools, certain equipment expenditures, and other authorized expenditures.
3. Public Education and Recreation Levy Fund (PERL) is authorized by Iowa Code 300.2. Revenue is primarily generated through a voter-approved property tax levy and community education fees. The PERL levy will continue at the same rate as in past years. The PERL Fund accounts for transactions related to school playgrounds and recreational activities within the district. These funds also pay for a portion of district activity directors’ compensation, certain middle school intramural athletic programs, and City of Des Moines summer recreation programs.
4. The Student Activity Fund accounts for transactions that occur due to school-sponsored, student-related co-curricular and extra-curricular activities. For example, money received from admission fees for events such as athletic events, drama productions, yearbook purchases, student fundraising, and other student-related activities are accounted for in this fund. Expenditures from this fund must directly benefit students.
5. Governmental Trust Funds can be used for general district purposes, unless otherwise stipulated by the trust. Within these funds, Expendable Trust Funds account for transactions that are received in trust in which both the principal and interest earned can be used to support the district, while Permanent Trust Funds account for transactions that are received in trust in which only the interest earned, and not the principal itself, can be used to support the district.
2021 - 2022 Preliminary Budget 81

C) Capital Projects Funds: 1. Secure an Advanced Vision for Education (SAVE) accounts for monies received from a statewide sales tax for school infrastructure. In 2009, voters approved a Revenue Purpose Statement to enable the district to use its portion of a statewide one cent sales tax for school renovation. As outlined in the Revenue Purpose Statement, SAVE projects focus on:
• Safety and security • Replacement of obsolete, inefficient, or worn-out equipment or systems • Money saving strategies • Improvements to buildings which were not targeted with Schools First revenues • Technology infrastructure upgrades • Air conditioning classrooms • Improvements to enhance research-based student achievement • Changing program needs
D) Debt Service Fund: 1. The Debt Service Fund accounts for and reports financial resources that are restricted, committed, or assigned to the expenditure of principal and interest. As required by law, funds are transferred from PPEL and SAVE funds to the Debt Service Fund to make principal and interest payments on the district’s notes and bonds as they come due.
II) PROPRIETARY FUNDS A) Enterprise Funds:
1. The Food and Nutrition Fund accounts for transactions related to the school lunch, breakfast, and summer food programs authorized by Iowa Code 283A. Funding for these programs is provided by student sales and state and federal reimbursement through the operation of the National School Lunch Program. These funds are used to pay for personnel, food, supplies, and equipment purchase and repair.
2. The Child Care Fund accounts for transactions for before-school, after-school, and summer child care programs authorized by Iowa Code 298A.12 and 279.49. The district provides before-school, after-school, and summer child care at various sites throughout the district through the Metro Kids program. Revenue is generated from fees, and the funds are primarily used to pay for staff.
3. The Home Building Fund accounts for transactions for home building activities performed by students as part of an instructional Career and Technical Education (CTE) program. Students in the Home Building program receive hands-on training in the construction of residential homes. This fund also accounts for the sale of homes constructed in the program. Proceeds from the sale of completed houses finance the program.
4. The Student Auto Body Fund accounts for transactions related to the service and repair of automobiles performed by students as part of an instructional program. Students in the Auto Body program receive hands-on training in the repair and maintenance of automobiles.
2021 - 2022 Preliminary Budget 82

District employees and other community members allow students to work on damaged vehicles and perform regular service work on cars and trucks for a fee. These fees support and sustain the program.
B) Internal Service Funds: 1. The Self-Insurance Fund accounts for the district’s self-insured medical plans including regular health, vision, and dental. This fund is supported by premiums charged to other funds based on employee payroll assignments. Medical, vision, and dental claims are paid in full from this fund.
2. The Risk Management Fund accounts for the district’s premium-based insurance plans including life and long-term disability insurance. The fund is supported by premiums charged to other funds based on employee payroll assignments. Premiums are then paid from the fund to the life and long-term disability insurance carriers.
3. The Print Shop Fund accounts for activities related to centralized printing operations of the district. Schools and departments use the Print Shop for large and complex print jobs and are charged a competitive rate for printing services. Fees are charged based on the services performed. Expenses include staffing, equipment, and costs of inventory items.
III) FIDUCIARY FUNDS A) Trust or Agent Funds:
1. Private-Purpose Trust Funds account for transactions that are received in trust and are expended based on the donors’ wishes and designations. Most of the funds are designated for student scholarships.
2. The Pension Trust Fund (i.e., Des Moines Teachers Retirement System, DMTRS) accounts for the district’s defined contribution retirement plan for teachers. The fund provides pension benefits to eligible district teachers and administrators. While this fund is accounted for in the district’s Comprehensive Annual Financial Report, it is not a budget fund and not included.
3. Agency Funds account for assets held in a custodial capacity by the district for individuals, private organizations, or other governments. PTOs are generally accounted for in these funds. While these funds are accounted for in the district’s Comprehensive Annual Financial Report, it is not a budget fund and not included.
2021 - 2022 Preliminary Budget 83

DEPARTMENT/FUND RELATIONSHIP
Fund Category Fund Type
Description DMPS Fund Account(s)
Governmental Funds account for operating and special revenue activities.
Operating (Major)
The primary operating fund which accounts for all financial resources except those that are accounted for in another fund. Expenditures are classified by function such as instruction, support services, and plant operations.
• General Fund
Special Revenue (Non-major)
Accounts for proceeds of specific revenue sources, other than major capital or debt projects, in which expenditures are restricted for a specific purpose.
• Management • PPEL • PERL • Student Activity • Governmental Trusts
Capital Projects (Non-major)
Tracks financial transactions used for the acquisition, construction, or renovation of school sites, buildings, and other major capital improvements.
• SAVE
Debt Service (Non-major)
Accounts for and reports financial resources that are restricted, committed, or assigned to expenditure for principal and interest.
• Debt Service
Proprietary Funds account for business-type activities.
Enterprise (Non-major)
Operations financed and operated in a manner similar to private business or where the district has decided that the determination of revenues earned, costs incurred, and/or net income is necessary for management accountability.
• Food & Nutrition • Childcare • Home Building • Student Auto Body
Internal Service (Non-major)
Used to account for goods or services provided by one department to other departments of the district on a cost reimbursement basis.
• Self-Insurance • Risk Management • Print Shop
Fiduciary Funds account for resources held for others by DMPS as an agent or trustee.
Trust (Non-major)
Fiduciary funds provide information about the financial relationships in which the district acts solely as a trustee or agent for the benefit of others.
• Private Purpose Trust Funds
• Pension Trust • Agency Funds
2021 - 2022 Preliminary Budget 84

P R E L I M I N A RY B U D G E T 2 0 2 1 - 2 0 2 2
FINANCIAL SUMMARIES

SUMMARY ALL FUNDS
FY 2018 FY 2019 FY 2020 FY 2021Actual Actual Actual Re-estimated
RevenuesProperty Taxes 135,449,189$ 145,710,033$ 149,109,926$ 162,910,678$ State Foundation Aid 204,551,888 203,948,433 206,654,943 207,439,304AEA Flow Through 14,751,903 14,914,998 15,108,730 15,424,026Teacher Quality Act 22,343,408 22,607,625 22,860,024 23,227,383Universal 4 Year Old Preschool 5,161,268 5,206,928 5,311,360 5,670,200Teacher Leadership Supplement 10,661,186 10,793,241 10,926,212 11,115,298Early Intervention Supplement 2,987,256 3,017,810 3,041,489 3,079,377Other State Sources 2,837,965 3,246,336 2,153,616 4,525,464Title 1 Grants 14,844,628 12,809,582 12,723,002 15,213,824Other Federal Sources 41,879,538 42,106,101 45,179,877 42,686,578Tuition/Transportation Fees 8,737,225 9,035,336 8,699,706 8,349,825Earnings on Investments: 2,493,460 6,159,393 4,298,403 1,709,174Student Activities 2,591,759 2,372,198 1,627,855 837,400Nutrition Program Sales 1,809,971 1,514,191 915,037 220,000Sales and Use Tax 30,706,896 33,896,019 33,985,178 32,559,592Other Revenue from Local Sources 19,801,319 19,530,709 21,960,379 16,454,443Revenue from Intermediary Sources 816,427 839,737 749,892 617,000Other Financing Sources 83,130 115,795 208,267 50,000General Long-Term Debt Proceeds 60,711,168 - - - Proceeds from Fixed Asset Disposition 243,182 1,245,595 109,531 - Transfers In 19,392,445 24,216,939 24,268,720 24,096,380
Total Revenues 602,855,210 563,286,998 569,892,148 576,185,946
Expenditures by FunctionInstruction 282,867,223 284,842,115 273,957,307 277,154,087Student Support Services 29,100,096 31,555,455 29,438,219 29,803,514Instructional Staff Support 26,701,706 26,961,329 21,983,491 22,310,237General Administration 9,204,771 9,548,869 9,917,277 9,211,959Building Administration 23,469,984 22,842,478 25,922,892 26,283,156Business and Central Administration 16,520,578 18,161,192 16,364,036 18,787,302Plant Operation & Maintenance 40,991,785 42,097,389 42,389,314 42,556,161Student Transportation 14,173,748 13,407,431 12,893,527 12,055,150Non-Instructional Expenditures 30,311,850 29,371,991 28,714,984 24,180,158Facilities Acquisition and Construction 24,437,699 25,223,502 31,202,014 32,091,853Debt Service 18,249,571 23,095,026 22,995,050 22,996,380Other Financing Uses 469,511 3,500 - - AEA Support 14,751,903 14,914,998 15,108,730 15,424,026Transfers Out 18,269,571 23,095,026 23,689,723 24,096,380
Total Expenditures 549,519,996 565,120,300 554,576,565 556,950,365
Excess of Revenues over Expenditures 53,335,215 (1,833,302) 15,315,581 19,235,581Beginning Fund Balance 162,214,500 215,549,715 213,716,413 229,031,994
Ending Fund Balance 215,549,715$ 213,716,413$ 229,031,994$ 248,267,575$
DES MOINES PUBLIC SCHOOLS2021 - 2022 BUDGET
SUMMARY ALL FUNDS — HISTORICAL SUMMARY
2021 - 2022 Preliminary Budget 86

FY 2022 FY 2023 FY 2024 FY 2025Budget Projected Projected Projected
RevenuesProperty Taxes 146,028,000$ 145,908,000$ 147,197,000$ 148,499,000$ State Foundation Aid 207,782,000 208,043,000 208,307,000 208,574,000 AEA Flow Through 16,413,000 16,577,000 16,743,000 16,911,000 Teacher Quality Act 23,037,000 23,268,000 23,500,000 23,735,000 Universal 4 Year Old Preschool 4,402,000 4,446,000 4,491,000 4,536,000 Teacher Leadership Supplement 11,038,000 11,148,000 11,260,000 11,373,000 Early Intervention Supplement 3,043,000 3,073,000 3,104,000 3,135,000 Other State Sources 3,674,000 3,710,000 3,748,000 3,785,000 Title 1 Grants 15,366,000 15,520,000 15,675,000 15,832,000 Other Federal Sources 45,510,000 45,913,000 41,522,000 42,138,000 Tuition/Transportation Fees 8,435,000 8,520,000 8,606,000 8,692,000 Earnings on Investments: 570,000 527,000 513,000 502,000 Student Activities 2,051,000 2,072,000 2,093,000 2,115,000 Nutrition Program Sales 1,300,000 1,313,000 1,326,000 1,339,000 Sales and Use Tax 32,564,000 33,205,000 33,772,000 34,179,000 Other Revenue from Local Sources 17,788,000 18,013,000 18,215,000 18,421,000 Revenue from Intermediary Sources 622,000 629,000 636,000 643,000 Other Financing Sources 115,000 116,000 117,000 118,000 General Long-Term Debt Proceeds - - - - Proceeds from Fixed Asset Disposition - - - - Transfers In 24,094,000 24,093,000 24,093,000 24,097,000
Total Revenues 563,832,000 566,095,000 564,918,000 568,622,000
Expenditures by FunctionInstruction 283,611,000 288,830,000 301,279,000 309,204,000 Student Support Services 33,339,000 34,937,000 35,552,000 33,127,000 Instructional Staff Support 22,748,000 23,203,000 23,667,000 24,140,000 General Administration 9,990,000 10,103,000 10,269,000 9,073,000 Building Administration 26,794,000 27,327,000 27,874,000 28,419,000 Business and Central Administration 19,165,000 19,524,000 19,890,000 20,263,000 Plant Operation & Maintenance 43,792,000 44,596,000 45,416,000 46,251,000 Student Transportation 12,565,000 12,777,000 12,993,000 13,212,000 Non-Instructional Expenditures 25,472,000 25,386,000 25,651,000 25,920,000 Facilities Acquisition and Construction 37,352,000 23,341,000 20,787,000 20,441,000 Debt Service 22,994,000 22,993,000 22,993,000 22,997,000 Other Financing Uses - - - - AEA Support 16,356,000 16,519,000 16,684,000 16,851,000 Transfers Out 24,094,000 24,093,000 24,093,000 24,097,000
Total Expenditures 578,271,000 573,629,000 587,147,000 593,995,000
Excess of Revenues over Expenditures (14,439,000) (7,533,000) (22,229,000) (25,373,000) Beginning Fund Balance 248,268,000 233,828,000 226,295,000 204,066,000
Ending Fund Balance 233,828,000$ 226,295,000$ 204,066,000$ 178,693,000$
SUMMARY ALL FUNDS — BUDGET AND PROJECTIONS
DES MOINES PUBLIC SCHOOLS2021 - 2022 BUDGET
2021 - 2022 Preliminary Budget 87

CAPITAL PROJECTSSTUDENT STATEWIDE DEBT FOOD & CHILD
GENERAL MANAGEMENT PPEL PERL ACTIVITY TRUST PENNY SERVICE NUTRITION CARE OTHER TOTALRevenues
Property Taxes 100,447,000$ 19,574,000$ 15,528,000$ 1,120,000$ -$ -$ -$ -$ -$ -$ -$ 136,669,000$ Utility Replacement Tax 2,154,000 426,000 302,000 24,000 - - - - - - - 2,906,000 Mobile Home Tax 90,000 12,000 12,000 1,000 - - - - - - - 115,000 Military Credit 25,000 3,000 2,000 - - - - - - - - 30,000 Commercial & Industrial Replacement 4,673,000 925,000 658,000 53,000 - - - - - - - 6,308,000 State Foundation Aid 207,782,000 - - - - - - - - - - 207,782,000 AEA Flow Through 16,413,000 - - - - - - - - - - 16,413,000 Teacher Quality Act 23,037,000 - - - - - - - - - - 23,037,000 Universal 4 Year Old Preschool 4,402,000 - - - - - - - - - - 4,402,000 Teacher Leadership Supplement 11,038,000 - - - - - - - - - - 11,038,000 Early Intervention Supplement 3,043,000 - - - - - - - - - - 3,043,000 Other State Sources 3,494,000 - - - - - - - 180,000 - - 3,674,000 Title 1 Grants 15,366,000 - - - - - - - - - - 15,366,000 Other Federal Sources 26,110,000 - - - - - - - 19,400,000 - - 45,510,000 Tuition/Transportation Fees 8,435,000 - - - - - - - - - - 8,435,000 Earnings on Investments 250,000 - 25,000 - - 118,000 177,000 - - - - 570,000 Student Activities 51,000 - - - 2,000,000 - - - - - - 2,051,000 Nutrition Program Sales - - - - - - - - 1,300,000 - - 1,300,000 Sales and Use Tax - - - - - - 32,564,000 - - - - 32,564,000 Other Revenue from Local Sources 14,153,000 - 10,000 200,000 - - - - - 3,390,000 35,000 17,788,000 Revenue from Intermediary Sources 622,000 - - - - - - - - - - 622,000 Other Financing Sources - - - - - 115,000 - - - - - 115,000 General Long-Term Debt Proceeds - - - - - - - - - - - - Proceeds from Fixed Asset Disposition - - - - - - - - - - - - Transfers In 1,100,000 - - - - - - 22,994,000 - - - 24,094,000
Total Revenues 442,685,000 20,940,000 16,536,000 1,399,000 2,000,000 233,000 32,741,000 22,994,000 20,880,000 3,390,000 35,000 563,832,000
Expenditures by FunctionInstruction 266,686,000 7,883,000 6,100,000 856,000 2,000,000 85,000 - - - - - 283,611,000 Student Support Services 30,298,000 3,041,000 - - - - - - - - - 33,339,000 Instructional Staff Support 22,741,000 - - - - 7,000 - - - - - 22,748,000 General Administration 8,140,000 1,850,000 - - - - - - - - - 9,990,000 Building Administration 26,776,000 18,000 - - - - - - - - - 26,794,000 Business and Central Administration 16,705,000 - 2,460,000 - - - - - - - - 19,165,000 Plant Operation & Maintenance 38,464,000 1,855,000 3,178,000 - - 295,000 - - - - - 43,792,000 Student Transportation 10,163,000 1,552,000 850,000 - - - - - - - - 12,565,000 Non-Instructional Expenditures 1,274,000 514,000 2,000 285,000 - - - - 20,040,000 3,315,000 41,000 25,472,000 Facilities Acquisition and Construction - - 3,330,000 600,000 - - 33,422,000 - - - - 37,352,000 Debt Service - - - - - - - 22,994,000 - - - 22,994,000 Other Financing Uses - - - - - - - - - - - - AEA Support 16,356,000 - - - - - - - - - - 16,356,000 Transfers Out 260,000 - - - - - 22,994,000 - 840,000 - - 24,094,000
Total Expenditures 437,863,000 16,713,000 15,920,000 1,741,000 2,000,000 387,000 56,416,000 22,994,000 20,880,000 3,315,000 41,000 578,271,000
Excess of Revenues over Expenditures 4,822,000 4,226,000 616,000 (342,000) - (154,000) (23,676,000) - - 75,000 (6,000) (14,439,000)Beginning Fund Balance 143,468,000 27,747,000 2,384,000 645,000 874,000 2,086,000 73,859,000 - (1,185,000) (2,002,000) 391,000 248,268,000
Ending Fund Balance 148,290,000$ 31,974,000$ 2,999,000$ 303,000$ 874,000$ 1,932,000$ 50,183,000$ -$ (1,185,000)$ (1,927,000)$ 385,000$ 233,828,000$
DES MOINES PUBLIC SCHOOLS2021 - 2022 BUDGET
SUMMARY ALL FUNDS
FISCAL YEAR 2022 BUDGET
SPECIAL REVENUE ENTERPRISE
2021 - 2022 Preliminary Budget 88

CAPITAL PROJECTSSTUDENT STATEWIDE DEBT FOOD & CHILD
GENERAL MANAGEMENT PPEL PERL ACTIVITY TRUST PENNY SERVICE NUTRITION CARE OTHER TOTALRevenues
Property Taxes 117,226,990$ 26,248,571$ 8,738,959$ 1,093,596$ -$ -$ -$ -$ -$ -$ -$ 153,308,116$ Utility Replacement Tax 2,751,981 624,600 185,052 26,023 - - - - - - - 3,587,656 Mobile Home Tax 103,767 12,000 7,000 1,000 - - - - - - - 123,767 Military Credit 24,500 3,000 1,700 300 - - - - - - - 29,500 Commercial & Industrial Replacement 4,496,286 1,020,494 302,342 42,517 - - - - - - - 5,861,639 State Foundation Aid 207,439,304 - - - - - - - - - - 207,439,304 AEA Flow Through 15,424,026 - - - - - - - - - - 15,424,026 Teacher Quality Act 23,227,383 - - - - - - - - - - 23,227,383 Universal 4 Year Old Preschool 5,670,200 - - - - - - - - - - 5,670,200 Teacher Leadership Supplement 11,115,298 - - - - - - - - - - 11,115,298 Early Intervention Supplement 3,079,377 - - - - - - - - - - 3,079,377 Other State Sources 4,525,464 - - - - - - - - - - 4,525,464 Title 1 Grants 15,213,824 - - - - - - - - - - 15,213,824 Other Federal Sources 24,067,296 - - - - - - - 18,619,282 - - 42,686,578 Tuition/Transportation Fees 8,349,825 - - - - - - - - - - 8,349,825 Earnings on Investments 1,300,000 - 35,000 - - 118,000 256,174 - - - - 1,709,174 Student Activities 50,000 - - - 787,400 - - - - - - 837,400 Nutrition Program Sales - - - - - - - - 220,000 - - 220,000 Sales and Use Tax - - - - - - 32,559,592 - - - - 32,559,592 Other Revenue from Local Sources 13,065,000 - 78,300 32,000 - - - - - 3,275,243 3,900 16,454,443 Revenue from Intermediary Sources 617,000 - - - - - - - - - - 617,000 Other Financing Sources - - - - - 50,000 - - - - - 50,000 General Long-Term Debt Proceeds - - - - - - - - - - - - Proceeds from Fixed Asset Disposition - - - - - - - - - - - - Transfers In 1,100,000 - - - - - - 22,996,380 - - - 24,096,380
Total Revenues 458,847,521 27,908,665 9,348,353 1,195,436 787,400 168,000 32,815,766 22,996,380 18,839,282 3,275,243 3,900 576,185,946
Expenditures by FunctionInstruction 272,497,869 1,002,918 1,500,000 956,000 1,142,300 55,000 - - - - - 277,154,087 Student Support Services 29,703,534 99,980 - - - - - - - - - 29,803,514 Instructional Staff Support 22,295,176 6,061 - - - 9,000 - - - - - 22,310,237 General Administration 7,979,913 1,232,046 - - - - - - - - - 9,211,959 Building Administration 26,250,935 32,221 - - - - - - - - - 26,283,156 Business and Central Administration 16,377,910 9,392 2,400,000 - - - - - - - - 18,787,302 Plant Operation & Maintenance 37,710,219 1,483,942 3,178,000 - - 184,000 - - - - - 42,556,161 Student Transportation 9,963,862 1,241,288 850,000 - - - - - - - - 12,055,150 Non-Instructional Expenditures 1,261,000 411,470 2,000 285,000 - - - - 19,105,277 3,110,811 4,600 24,180,158 Facilities Acquisition and Construction - - 4,000,000 600,000 - - 27,491,854 - - - - 32,091,854 Debt Service - - - - - - - 22,996,380 - - - 22,996,380 Other Financing Uses - - - - - - - - - - - - AEA Support 15,424,026 - - - - - - - - - - 15,424,026 Transfers Out 975,243 - - - - - 22,996,380 - 124,757 - - 24,096,380
Total Expenditures 440,439,687 5,519,320 11,930,000 1,841,000 1,142,300 248,000 50,488,234 22,996,380 19,230,034 3,110,811 4,600 556,950,365
Excess of Revenues over Expenditures 18,407,834 22,389,345 (2,581,647) (645,564) (354,900) (80,000) (17,672,468) - (390,752) 164,432 (700) 19,235,581Beginning Fund Balance 125,060,027 5,358,082 4,965,234 1,290,828 1,229,142 2,166,497 91,530,983 - (793,842) (2,166,455) 391,498 229,031,994
Ending Fund Balance 143,467,861$ 27,747,427$ 2,383,587$ 645,264$ 874,242$ 2,086,497$ 73,858,515$ -$ (1,184,594)$ (2,002,023)$ 390,798$ 248,267,575$
SPECIAL REVENUE ENTERPRISE
DES MOINES PUBLIC SCHOOLS2021 - 2022 BUDGET
SUMMARY ALL FUNDS
FISCAL YEAR 2021 RE-ESTIMATED
2021 - 2022 Preliminary Budget 89

CAPITAL PROJECTSSTUDENT STATEWIDE DEBT FOOD & CHILD
GENERAL MANAGEMENT PPEL PERL ACTIVITY TRUST PENNY SERVICE NUTRITION CARE OTHER TOTALRevenues
Property Taxes 118,163,515$ 13,279,507$ 7,907,310$ 981,783$ -$ -$ -$ -$ -$ -$ -$ 140,332,114$ Utility Replacement Tax 2,856,031 365,163 194,754 27,387 - - - - - - - 3,443,335 Mobile Home Tax 92,233 11,811 6,335 906 - - - - - - - 111,285 Military Credit 24,290 3,106 1,656 233 - - - - - - - 29,285 Commercial & Industrial Replacement 4,307,639 550,761 294,199 41,307 - - - - - - - 5,193,906 State Foundation Aid 206,654,943 - - - - - - - - - - 206,654,943 AEA Flow Through 15,108,730 - - - - - - - - - - 15,108,730 Teacher Quality Act 22,860,024 - - - - - - - - - - 22,860,024 Universal 4 Year Old Preschool 5,311,360 - - - - - - - - - - 5,311,360 Teacher Leadership Supplement 10,926,212 - - - - - - - - - - 10,926,212 Early Intervention Supplement 3,041,489 - - - - - - - - - - 3,041,489 Other State Sources 1,979,558 - - - - - - - 174,058 - - 2,153,616 Title 1 Grants 12,723,002 - - - - - - - - - - 12,723,002 Other Federal Sources 25,892,411 - - - - - - - 19,287,466 - - 45,179,877 Tuition/Transportation Fees 8,699,706 - - - - - - - - - - 8,699,706 Earnings on Investments 3,670,173 - 61,796 - - (450,755) 1,017,189 - - - - 4,298,403 Student Activities 21,663 - - - 1,606,192 - - - - - - 1,627,855 Nutrition Program Sales - - - - - - - - 915,037 - - 915,037 Sales and Use Tax - - - - - - 33,985,178 - - - - 33,985,178 Other Revenue from Local Sources 17,244,565 - 575,974 10,986 - - - - - 3,204,779 229,402 21,265,706 Revenue from Intermediary Sources 749,892 - - - - - - - - - - 749,892 Other Financing Sources - - - - - 208,267 - - - - - 208,267 General Long-Term Debt Proceeds - - - - - - - - - - - - Proceeds from Fixed Asset Disposition 109,531 - - - - - - - - - - 109,531 Transfers In 1,273,670 - - - - - - 22,995,050 - 694,673 - 24,963,393
Total Revenues 461,710,638 14,210,348 9,042,024 1,062,602 1,606,192 (242,488) 35,002,367 22,995,050 20,376,561 3,899,452 229,402 569,892,148
Expenditures by FunctionInstruction 268,288,503 1,671,530 1,928,897 123,402 1,903,171 41,804 - - - - - 273,957,307 Student Support Services 29,271,585 166,634 - - - - - - - - - 29,438,219 Instructional Staff Support 21,970,960 10,101 - - - 2,430 - - - - - 21,983,491 General Administration 7,863,867 2,053,410 - - - - - - - - - 9,917,277 Building Administration 25,869,190 53,702 - - - - - - - - - 25,922,892 Business and Central Administration 16,139,740 15,654 208,643 - - - - - - - - 16,364,036 Plant Operation & Maintenance 37,161,833 1,866,594 3,360,887 - - - - - - - - 42,389,314 Student Transportation 9,820,005 1,561,368 1,512,154 - - - - - - - - 12,893,527 Non-Instructional Expenditures 1,247,165 521,969 - 231,167 - - - - 20,630,266 4,774,139 36,608 27,441,314 Facilities Acquisition and Construction - - 5,120,690 310,470 - 18,150 25,752,704 - - - - 31,202,014 Debt Service - - - - - - - 22,995,050 - - - 22,995,050 Other Financing Uses - - - - - - - - - - - - AEA Support 15,108,730 - - - - - - - - - - 15,108,730 Transfers Out 694,673 - - - - - 22,995,050 - 1,273,670 - - 24,963,393
Total Expenditures 433,436,251 7,920,963 12,131,271 665,039 1,903,171 62,384 48,747,754 22,995,050 21,903,936 4,774,139 36,608 554,576,565
Excess of Revenues over Expenditures 28,274,387 6,289,384 (3,089,246) 397,563 (296,979) (304,872) (13,745,387) - (1,527,375) (874,687) 192,794 15,315,582Beginning Fund Balance 96,785,640 (931,303) 8,054,481 893,265 1,526,121 2,471,369 105,276,370 - 733,533 (1,291,768) 198,704 213,716,412
Ending Fund Balance 125,060,027$ 5,358,082$ 4,965,234$ 1,290,828$ 1,229,142$ 2,166,497$ 91,530,983$ -$ (793,842)$ (2,166,455)$ 391,498$ 229,031,994$
DES MOINES PUBLIC SCHOOLS2021 - 2022 BUDGET
SUMMARY ALL FUNDS
FISCAL YEAR 2020 ACTUAL
SPECIAL REVENUE ENTERPRISE
2021 - 2022 Preliminary Budget 90

CAPITAL PROJECTSSTUDENT STATEWIDE DEBT FOOD & CHILD
GENERAL MANAGEMENT PPEL PERL ACTIVITY TRUST PENNY SERVICE NUTRITION CARE OTHER TOTALRevenues
Property Taxes 116,740,281$ 11,508,824$ 7,754,279$ 971,052$ -$ -$ -$ -$ -$ -$ -$ 136,974,436$ Utility Replacement Tax 2,896,621 325,418 195,251 27,457 - - - - - - - 3,444,747 Mobile Home Tax 97,033 10,915 6,589 942 - - - - - - - 115,479 Military Credit 25,519 2,867 1,720 242 - - - - - - - 30,348 Commercial & Industrial Replacement 4,325,577 486,073 292,369 41,003 - - - - - - - 5,145,022 State Foundation Aid 203,948,433 - - - - - - - - - - 203,948,433 AEA Flow Through 14,914,998 - - - - - - - - - - 14,914,998 Teacher Quality Act 22,607,625 - - - - - - - - - - 22,607,625 Universal 4 Year Old Preschool 5,206,928 - - - - - - - - - - 5,206,928 Teacher Leadership Supplement 10,793,241 - - - - - - - - - - 10,793,241 Early Intervention Supplement 3,017,810 - - - - - - - - - - 3,017,810 Other State Sources 3,071,593 - - - - - - - 174,743 - - 3,246,336 Title 1 Grants 12,809,582 - - - - - - - - - - 12,809,582 Other Federal Sources 23,045,241 - - - - - - - 19,060,860 - - 42,106,101 Tuition/Transportation Fees 9,035,336 - - - - - - - - - - 9,035,336 Earnings on Investments 3,498,790 - 141,079 - - 262,563 2,256,961 - - - - 6,159,393 Student Activities 59,280 - - - 2,312,918 - - - - - - 2,372,198 Nutrition Program Sales - - - - - - - - 1,514,191 - - 1,514,191 Sales and Use Tax - - - - - - 33,896,019 - - - - 33,896,019 Other Revenue from Local Sources 13,514,092 - 304,056 225,172 - - - - - 5,448,485 38,904 19,530,709 Revenue from Intermediary Sources 839,737 - - - - - - - - - - 839,737 Other Financing Sources - - - - - 115,795 - - - - - 115,795 General Long-Term Debt Proceeds - - - - - - - - - - - - Proceeds from Fixed Asset Disposition 1,243,095 - 2,500 - - - - - - - - 1,245,595 Transfers In 1,121,913 - - - - - - 23,095,026 - - - 24,216,939
Total Revenues 452,812,724 12,334,097 8,697,843 1,265,868 2,312,918 378,358 36,152,980 23,095,026 20,749,794 5,448,485 38,904 563,286,998
Expenditures by FunctionInstruction 272,972,771 7,669,882 1,550,335 136,957 2,322,877 189,293 - - - - - 284,842,115 Student Support Services 28,219,276 3,336,179 - - - - - - - - - 31,555,455 Instructional Staff Support 26,958,599 - - - - 2,730 - - - - - 26,961,329 General Administration 8,744,413 804,456 - - - - - - - - - 9,548,869 Building Administration 22,615,700 226,778 - - - - - - - - - 22,842,478 Business and Central Administration 17,496,098 607,878 57,216 - - - - - - - - 18,161,192 Plant Operation & Maintenance 36,308,544 1,941,088 3,847,757 - - - - - - - - 42,097,389 Student Transportation 10,574,959 1,750,337 1,082,135 - - - - - - - - 13,407,431 Non-Instructional Expenditures 1,338,901 608,054 - 577,790 - - - - 21,210,691 5,589,520 47,036 29,371,991 Facilities Acquisition and Construction - - 3,822,125 187,546 - 898,783 20,315,047 - - - - 25,223,502 Debt Service - - - - - - - 23,095,026 - - - 23,095,026 Other Financing Uses - - - - - - 3,500 - - - - 3,500 AEA Support 14,914,998 - - - - - - - - - - 14,914,998 Transfers Out - - - - - - 23,095,026 - - - - 23,095,026
Total Expenditures 440,144,259 16,944,652 10,359,568 902,292 2,322,877 1,090,806 43,413,573 23,095,026 21,210,691 5,589,520 47,036 565,120,301
Excess of Revenues over Expenditures 12,668,465 (4,610,554) (1,661,725) 363,576 (9,960) (712,448) (7,260,593) - (460,897) (141,035) (8,132) (1,833,303) Beginning Fund Balance 84,117,175 3,679,252 9,716,206 529,690 1,536,081 3,183,817 112,536,963 - 1,194,430 (1,150,734) 206,836 215,549,715
Ending Fund Balance 96,785,640$ (931,303)$ 8,054,481$ 893,265$ 1,526,121$ 2,471,369$ 105,276,370$ -$ 733,533$ (1,291,768)$ 198,704$ 213,716,412$
SPECIAL REVENUE ENTERPRISE
DES MOINES PUBLIC SCHOOLS2021 - 2022 BUDGET
SUMMARY ALL FUNDS
FISCAL YEAR 2019 ACTUAL
2021 - 2022 Preliminary Budget 91

CAPITAL PROJECTSSTUDENT STATEWIDE DEBT FOOD & CHILD
GENERAL MANAGEMENT PPEL PERL ACTIVITY TRUST PENNY SERVICE NUTRITION CARE OTHER TOTALRevenues
Property Taxes 109,838,923$ 8,664,336$ 7,429,710$ 903,085$ -$ -$ -$ -$ -$ -$ -$ 126,836,054$ Utility Replacement Tax 3,053,514 275,520 203,559 28,634 - - - - - - - 3,561,227 Mobile Home Tax 93,411 8,499 6,427 984 - - - - - - - 109,320 Military Credit 27,334 2,466 1,821 256 - - - - - - - 31,877 Commercial & Industrial Replacement 4,210,659 379,892 280,690 39,470 - - - - - - - 4,910,711 State Foundation Aid 204,551,888 - - - - - - - - - - 204,551,888 AEA Flow Through 14,751,903 - - - - - - - - - - 14,751,903 Teacher Quality Act 22,343,408 - - - - - - - - - - 22,343,408 Universal 4 Year Old Preschool 5,161,268 - - - - - - - - - - 5,161,268 Teacher Leadership Supplement 10,661,186 - - - - - - - - - - 10,661,186 Early Intervention Supplement 2,987,256 - - - - - - - - - - 2,987,256 Other State Sources 2,657,111 - - - - - - - 180,854 - - 2,837,965 Title 1 Grants 14,844,628 - - - - - - - - - - 14,844,628 Other Federal Sources 22,730,437 - - - - - - - 19,149,101 - - 41,879,538 Tuition/Transportation Fees 8,737,225 - - - - - - - - - - 8,737,225 Earnings on Investments 1,771,399 - 79,635 - - - 642,426 - - - - 2,493,460 Student Activities 86,375 - - - 2,541,466 (36,082) - - - - - 2,591,759 Nutrition Program Sales - - - - - - - - 1,809,971 - - 1,809,971 Sales and Use Tax - - - - - - 30,706,896 - - - - 30,706,896 Other Revenue from Local Sources 13,472,926 - 205,204 357,241 - 19,145 9,351 - - 5,699,859 37,593 19,801,319 Revenue from Intermediary Sources 816,427 - - - - - - - - - - 816,427 Other Financing Sources - - - - - 83,130 - - - - - 83,130 General Long-Term Debt Proceeds - - - - - - 60,711,168 - - - - 60,711,168 Proceeds from Fixed Asset Disposition 229,930 - 10,000 - - - - - 3,252 - - 243,182 Transfers In 1,142,874 - - - - - - 18,249,571 - - - 19,392,445
Total Revenues 444,170,081 9,330,713 8,217,045 1,329,670 2,541,466 66,193 92,069,841 18,249,571 21,143,179 5,699,859 37,593 602,855,210
Expenditures by FunctionInstruction 276,584,727 3,437,177 92,634 128,251 2,569,759 54,675 - - - - - 282,867,223 Student Support Services 28,562,340 537,756 - - - - - - - - - 29,100,096 Instructional Staff Support 26,687,034 - - - - 14,672 - - - - - 26,701,706 General Administration 8,158,183 1,046,588 - - - - - - - - - 9,204,771 Building Administration 23,293,583 176,401 - - - - - - - - - 23,469,984 Business and Central Administration 15,620,578 - 900,000 - - - - - - - - 16,520,578 Plant Operation & Maintenance 36,033,765 1,989,055 2,968,965 - - - - - - - - 40,991,785 Student Transportation 11,546,060 1,840,003 787,685 - - - - - - - - 14,173,748 Non-Instructional Expenditures 1,098,492 906,780 2,175 684,623 - - - - 21,737,208 5,843,522 39,050 30,311,850 Facilities Acquisition and Construction - - 3,048,130 419,342 - 82,519 20,887,708 - - - - 24,437,699 Debt Service - - - - - - - 18,249,571 - - - 18,249,571 Other Financing Uses - - - - - - 469,511 - - - - 469,511 AEA Support 14,751,903 - - - - - - - - - - 14,751,903 Transfers Out 20,000 - - - - - 18,249,571 - - - - 18,269,571
Total Expenditures 442,356,665 9,933,760 7,799,588 1,232,217 2,569,759 151,866 39,606,790 18,249,571 21,737,208 5,843,522 39,050 549,519,996
Excess of Revenues over Expenditures 1,813,416 (603,047) 417,457 97,454 (28,294) (85,673) 52,463,051 - (594,029) (143,662) (1,457) 53,335,215 Beginning Fund Balance 82,303,759 4,282,299 9,298,748 432,236 1,564,375 3,269,490 60,073,912 - 1,788,459 (1,007,071) 208,293 162,214,500
Ending Fund Balance 84,117,175$ 3,679,252$ 9,716,206$ 529,690$ 1,536,081$ 3,183,817$ 112,536,963$ -$ 1,194,430$ (1,150,734)$ 206,836$ 215,549,715$
SPECIAL REVENUE ENTERPRISE
DES MOINES PUBLIC SCHOOLS2021 - 2022 BUDGET
SUMMARY ALL FUNDS
FISCAL YEAR 2018 ACTUAL
2021 - 2022 Preliminary Budget 92

CONSOLIDATED FUND BALANCES
General Capital Projects Nonmajor
Special Revenue Total
Governmental Nonmajor
Enterprise Funds Internal Service
Funds Private Purpose
Trust Nonspendable 2,545,106$ -$ 95,216$ 2,640,322$ -$ -$ -$ Restricted 16,977,566 112,536,963 18,549,829 148,064,358 - - 716,477 Committed 11,500,000 - - 11,500,000 - - - Invested in capital assets - - - - 2,370,341 12,249 - Assigned 2,722,083 - - 2,722,083 - - - Unassigned 50,372,420 - - 50,372,420 (2,127,941) 8,776,292 -
Total fund balances 84,117,175$ 112,536,963$ 18,645,045$ 215,299,183$ 242,400$ 8,788,541$ 716,477$
General Capital Projects Nonmajor
Special Revenue Total
Governmental Nonmajor
Enterprise Funds Internal Service
Funds Private Purpose
Trust Nonspendable 3,968,453$ -$ 84,370$ 4,052,823$ -$ -$ -$ Restricted 15,816,459 105,276,370 11,929,564 133,022,393 - - 1,116,440Committed 11,500,000 - - 11,500,000 - - - Invested in capital assets - - - - 2,445,207 18,252 - Assigned 2,887,205 - - 2,887,205 - - - Unassigned 62,613,524 - - 62,613,524 (2,804,739) 9,156,927 -
Total fund balances 96,785,641$ 105,276,370$ 12,013,934$ 214,075,945$ (359,532)$ 9,175,179$ 1,116,440$
General Capital Projects Nonmajor
Special Revenue Total
Governmental Nonmajor
Enterprise Funds Internal Service
Funds Private Purpose
Trust Nonspendable 2,187,264$ -$ 1,185,434$ 3,372,698$ -$ -$ -$ Restricted 17,588,320 91,530,983 13,824,600 122,943,903 - - 2,375,861 Committed 11,500,000 - - 11,500,000 - - - Invested in capital assets - - - - 2,183,983 29,900 - Assigned 2,374,122 - - 2,374,122 - - - Unassigned 91,410,321 - - 91,410,321 (4,752,782) 11,116,540 -
Total fund balances 125,060,027$ 91,530,983$ 15,010,034$ 231,601,044$ (2,568,799)$ 11,146,440$ 2,375,861$
General Capital Projects Nonmajor
Special Revenue Total
Governmental Nonmajor
Enterprise Funds Internal Service
Funds Private Purpose
Trust Nonspendable -$ -$ 1,185,000$ 1,185,000$ -$ -$ -$ Restricted - 73,859,000 32,552,000 106,411,000 - - 2,412,000 Committed - - - - - - - Invested in capital assets - - - - 2,100,000 30,000 - Assigned 2,374,000 - - 2,374,000 - - - Unassigned 110,082,842 - - 109,818,155 (4,896,000) 9,877,000 -
Total fund balances 143,733,000$ 73,859,000$ 33,737,000$ 219,788,155$ (2,796,000)$ 9,907,000$ 2,412,000$
General Capital Projects Nonmajor
Special Revenue Total
Governmental Nonmajor
Enterprise Funds Internal Service
Funds Private Purpose
Trust Nonspendable -$ -$ 20,000$ 20,000$ -$ -$ -$ Restricted - - (20,000) (20,000) - - 2,453,000 Committed - - - - - - - Invested in capital assets - - - - 2,100,000 30,000 - Assigned 2,374,000 - - 2,374,000 - - - Unassigned 113,240,212 - - 113,240,212 (2,100,000) (30,000) -
Total fund balances 146,890,000$ -$ -$ 115,614,212$ -$ -$ 2,453,000$
Notes:Nonspendable includes assets held in inventories and prepaid items.Restricted includes Federal, State, bonding for construction, and other funds received for specific purposes.Private Purpose Trust Funds are held in trust for scholarships.Unassigned includes the yearly addition of revenues in excess of expenditures.
Fund Balances Fiscal Year ended June 30, 2021, Re-estimated
Governmental Funds
Fund Balances Fiscal Year ended June 30, 2022, Budgeted
FY 2018 - 2022DES MOINES PUBLIC SCHOOLS
FUND BALANCES
Fund Balances Fiscal Year ended June 30, 2020
Governmental Funds
Governmental Funds
Governmental Funds
Fund Balances Fiscal Year ended June 30, 2018
Fund Balances Fiscal Year ended June 30, 2019
Governmental Funds
2021 - 2022 Preliminary Budget 93

FUND BALANCES
A fund balance is equal to the excess of a fund’s assets over its liabilities and reserves. A fund balance may be either negative or positive, depending on the current activities of the fund. The funds listed below are actively managed by the district:
Fund Category Fund Type DMPS Fund Account(s)
Governmental Funds
Operating • General Fund
Special Revenue
• Management • PPEL • PERL • Student Activity • Governmental Trusts
Capital Projects • SAVE
Debt Service • Debt Service
Proprietary Funds
Enterprise
• Food & Nutrition • Childcare • Home Building • Student Auto Body
Internal Service • Self-Insurance • Risk Management • Print Shop
Fiduciary Funds Trust • Private Purpose Trust Funds
2021 - 2022 Preliminary Budget 94

GOVERNMENTAL FUNDS
DMPS All Funds
Governmental Funds
Operating Fund
General Fund
Special Revenue Funds
Management
PPEL
PERL
Student Activity
Governmental Trust
Capital Projects Fund
SAVE
Debt Service Fund
Debt Service
2021 - 2022 Preliminary Budget 95

Governmental Funds - Operating Fund (i.e. the General Fund)
FY 2018 FY 2019 FY 2020 FY 2021Actual Actual Actual Re-estimated
Property Taxes 109,838,923$ 116,740,281$ 118,163,515$ 117,226,990$ Utility Replacement Tax 3,053,514 2,896,621 2,856,031 2,751,981Mobile Home Tax 93,411 97,033 92,233 103,767Military Credit 27,334 25,519 24,290 24,500Commercial & Industrial Replacement 4,210,659 4,325,577 4,307,639 4,496,286State Foundation Aid 204,551,888 203,948,433 206,654,943 207,439,304AEA Flow Through 14,751,903 14,914,998 15,108,730 15,424,026Teacher Quality Act:
Teacher Salary Supplement 19,867,000 20,103,858 20,332,335 20,663,518Teacher Quality Professional Development 2,476,408 2,503,767 2,527,689 2,563,865Early Intervention Supplement 2,987,256 3,017,810 3,041,489 3,079,377
Universal 4 Year Old Preschool 5,161,268 5,206,928 5,311,360 5,670,200TLC Grant 10,661,186 10,793,241 10,926,212 11,115,298Other State Sources 2,657,111 3,071,593 1,979,558 4,525,464Title 1 Grants 14,844,628 12,809,582 12,723,002 15,213,824Other Federal Sources 22,730,437 23,045,241 25,892,411 24,067,296Tuition/Transportation/Textbook Fees 8,737,225 9,035,336 8,699,706 8,349,825Earnings on Investments 1,771,399 3,498,790 3,670,173 1,300,000Student Activities 86,375 59,280 21,663 50,000Other Revenue from Local Sources 13,472,926 13,514,092 17,244,565 13,065,000Revenue from Intermediary Sources 816,427 839,737 749,892 617,000Proceeds from Fixed Asset Disposition 229,930 1,243,095 109,531 - Transfers In 1,142,874 1,121,913 1,273,670 1,100,000
Total Revenues 444,170,081 452,812,724 461,710,638 458,847,521
Instruction 276,584,727 272,972,771 268,288,503 272,497,869Student Support Services 28,562,340 28,219,276 29,271,585 29,703,534Instructional Staff Support 26,687,034 26,958,599 21,970,960 22,295,176General Administration 8,158,183 8,744,413 7,863,867 7,979,913Building Administration 23,293,583 22,615,700 25,869,190 26,250,935Business and Central Administration 15,620,578 17,496,098 16,139,740 16,377,910Plant Operation & Maintenance 36,033,765 36,308,544 37,161,833 37,710,219Student Transportation 11,546,060 10,574,959 9,820,005 9,963,862Non-Instructional Expenditures 1,098,492 1,338,901 1,247,165 1,261,000AEA Support 14,751,903 14,914,998 15,108,730 15,424,026Transfers Out 20,000 - 694,673 975,243
Total Expenditures 442,356,665 440,144,259 433,436,251 440,439,687
Excess of Revenues over Expenditures 1,813,416 12,668,465 28,274,387 18,407,834Beginning Fund Balance 82,303,759 84,117,175 96,785,640 125,060,027
Ending Fund Balance 84,117,175$ 96,785,640$ 125,060,027$ 143,467,861$
Revenues
Expenditures by Function
DES MOINES PUBLIC SCHOOLS2021 - 2022 BUDGET
GENERAL FUND SUMMARY — HISTORICAL SUMMARY
2021 - 2022 Preliminary Budget 96

FY 2022 FY 2023 FY 2024 FY 2025Budget Projected Projected Projected
Property Taxes 100,447,000$ 101,451,000$ 102,466,000$ 103,490,000$ Utility Replacement Tax 2,154,000 2,175,000 2,197,000 2,219,000 Mobile Home Tax 90,000 91,000 92,000 93,000 Military Credit 25,000 25,000 25,000 25,000 Commercial & Industrial Replacement 4,673,000 4,720,000 4,767,000 4,815,000 State Foundation Aid 207,782,000 208,043,000 208,307,000 208,574,000 AEA Flow Through 16,413,000 16,577,000 16,743,000 16,911,000 Teacher Quality Act:
Teacher Salary Supplement 20,499,000 20,704,000 20,911,000 21,120,000 Teacher Quality Professional Development 2,539,000 2,564,000 2,590,000 2,615,000 Early Intervention Supplement 3,043,000 3,073,000 3,104,000 3,135,000
Universal 4 Year Old Preschool 4,402,000 4,446,000 4,491,000 4,536,000 TLC Grant 11,038,000 11,148,000 11,260,000 11,373,000 Other State Sources 3,494,000 3,529,000 3,564,000 3,600,000 Title 1 Grants 15,366,000 15,520,000 15,675,000 15,832,000 Other Federal Sources 26,110,000 26,119,000 21,330,000 21,544,000 Tuition/Transportation/Textbook Fees 8,435,000 8,520,000 8,606,000 8,692,000 Earnings on Investments 250,000 253,000 256,000 259,000 Student Activities 51,000 52,000 53,000 54,000 Other Revenue from Local Sources 14,153,000 14,294,000 14,436,000 14,579,000 Revenue from Intermediary Sources 622,000 629,000 636,000 643,000 Proceeds from Fixed Asset Disposition - - - - Transfers In 1,100,000 1,100,000 1,100,000 1,100,000
Total Revenues 442,685,000 445,034,000 442,609,000 445,207,000
Instruction 266,686,000 272,275,000 284,734,000 298,181,000 Student Support Services 30,298,000 30,904,000 31,522,000 32,152,000 Instructional Staff Support 22,741,000 23,196,000 23,660,000 24,133,000 General Administration 8,140,000 8,303,000 8,469,000 8,638,000 Building Administration 26,776,000 27,312,000 27,858,000 28,415,000 Business and Central Administration 16,705,000 17,039,000 17,380,000 17,728,000 Plant Operation & Maintenance 38,464,000 39,233,000 40,018,000 40,818,000 Student Transportation 10,163,000 10,366,000 10,573,000 10,784,000 Non-Instructional Expenditures 1,274,000 1,287,000 1,300,000 1,313,000 AEA Support 16,356,000 16,519,000 16,684,000 16,851,000 Transfers Out 260,000 - - -
Total Expenditures 437,863,000 446,434,000 462,198,000 479,013,000
Excess of Revenues over Expenditures 4,822,000 (1,400,000) (19,589,000) (33,806,000) Beginning Fund Balance 143,468,000 148,290,000 146,890,000 127,301,000
Ending Fund Balance 148,290,000$ 146,890,000$ 127,301,000$ 93,495,000$
Revenues
Expenditures by Function
DES MOINES PUBLIC SCHOOLS2021 - 2022 BUDGET
GENERAL FUND SUMMARY — BUDGET AND PROJECTIONS
2021 - 2022 Preliminary Budget 97

Governmental Funds - Special Revenue Funds
FY 2018 FY 2019 FY 2020 FY 2021Actual Actual Actual Re-estimated
RevenuesProperty Taxes 8,664,336$ 11,508,824$ 13,279,507$ 26,248,571$ Utility Replacement Tax 275,520 325,418 365,163 624,600Mobile Home Tax 8,499 10,915 11,811 12,000Military Credit 2,466 2,867 3,106 3,000Commercial & Industrial Replacement 379,892 486,073 550,761 1,020,494
Total Revenues 9,330,713 12,334,097 14,210,348 27,908,665
Expenditures by FunctionInstruction 3,437,177 7,669,882 1,671,530 1,002,918Student Support Services 537,756 3,336,179 166,634 99,980Instructional Staff Support - - 10,101 6,061General Administration 1,046,588 804,456 2,053,410 1,232,046Building Administration 176,401 226,778 53,702 32,221Business and Central Administration - 607,878 15,654 9,392Plant Operation & Maintenance 1,989,055 1,941,088 1,866,594 1,483,942Student Transportation 1,840,003 1,750,337 1,561,368 1,241,288Non-Instructional Expenditures 906,780 608,054 521,969 411,470
Total Expenditures 9,933,760 16,944,652 7,920,963 5,519,320
Excess of Revenues over Expenditures (603,047) (4,610,554) 6,289,384 22,389,345Beginning Fund Balance 4,282,299 3,679,252 (931,303) 5,358,082
Ending Fund Balance 3,679,252$ (931,303)$ 5,358,082$ 27,747,427$
DES MOINES PUBLIC SCHOOLS2021 - 2022 BUDGET
MANAGEMENT FUND SUMMARY — HISTORICAL SUMMARY
2021 - 2022 Preliminary Budget 98

FY 2022 FY 2023 FY 2024 FY 2025Budget Projected Projected Projected
RevenuesProperty Taxes 19,574,000$ 17,906,000$ 17,906,000$ 17,906,000$ Utility Replacement Tax 426,000 697,000 697,000 697,000Mobile Home Tax 12,000 12,000 12,000 12,000Military Credit 3,000 3,000 3,000 3,000Commercial & Industrial Replacement 925,000 943,000 962,000 981,000
Total Revenues 20,940,000 19,562,000 19,581,000 19,600,000
Expenditures by FunctionInstruction 7,883,000 7,423,000 7,395,000 1,789,000 Student Support Services 3,041,000 4,033,000 4,030,000 975,000 Instructional Staff Support - - - - General Administration 1,850,000 1,800,000 1,800,000 435,000 Building Administration 18,000 15,000 16,000 4,000 Business and Central Administration - - - - Plant Operation & Maintenance 1,855,000 1,855,000 1,855,000 1,855,000 Student Transportation 1,552,000 1,552,000 1,552,000 1,552,000 Non-Instructional Expenditures 514,000 514,000 514,000 514,000
Total Expenditures 16,713,000 17,192,000 17,162,000 7,124,000
Excess of Revenues over Expenditures 4,226,000 2,370,000 2,419,000 12,476,000 Beginning Fund Balance 27,747,000 31,974,000 34,344,000 36,762,000
Ending Fund Balance 31,974,000$ 34,344,000$ 36,762,000$ 49,238,000$
DES MOINES PUBLIC SCHOOLS2021 - 2022 BUDGET
MANAGEMENT FUND SUMMARY — BUDGET AND PROJECTIONS
2021 - 2022 Preliminary Budget 99

FY 2018 FY 2019 FY 2020 FY 2021Actual Actual Actual Re-estimated
RevenuesProperty Taxes 7,429,710$ 7,754,279$ 7,907,310$ 8,738,959$ Utility Replacement Tax 203,559 195,251 194,754 185,052Mobile Home Tax 6,427 6,589 6,335 7,000Military Credit 1,821 1,720 1,656 1,700Commercial & Industrial Replacement 280,690 292,369 294,199 302,342Earnings on Investments: 79,635 141,079 61,796 35,000Other Revenue from Local Sources 205,204 304,056 575,974 78,300Proceeds from Fixed Asset Disposition 10,000 2,500 - -
Total Revenues 8,217,045 8,697,843 9,042,024 9,348,353
Expenditures by FunctionInstruction 92,634 1,550,335 1,928,897 1,500,000Business and Central Administration, Technology 900,000 57,216 208,643 2,400,000Plant Operation & Maintenance 2,968,965 3,847,757 3,360,887 3,178,000Student Transportation 787,685 1,082,135 1,512,154 850,000Non-Instructional Expenditures 2,175 - - 2,000Facilities Acquisition and Construction 3,048,130 3,822,125 5,120,690 4,000,000
Total Expenditures 7,799,588 10,359,568 12,131,271 11,930,000
Excess of Revenues over Expenditures 417,457 (1,661,725) (3,089,246) (2,581,647)Beginning Fund Balance 9,298,748 9,716,206 8,054,481 4,965,234
Ending Fund Balance 9,716,206$ 8,054,481$ 4,965,234$ 2,383,587$
DES MOINES PUBLIC SCHOOLS2021 - 2022 BUDGET
PPEL FUND SUMMARY — HISTORICAL SUMMARY
2021 - 2022 Preliminary Budget 100

FY 2022 FY 2023 FY 2024 FY 2025Budget Projected Projected Projected
RevenuesProperty Taxes 15,528,000$ 15,683,000$ 15,840,000$ 15,998,000$ Utility Replacement Tax 302,000 305,000 308,000 311,000 Mobile Home Tax 12,000 12,000 12,000 12,000 Military Credit 2,000 2,000 2,000 2,000 Commercial & Industrial Replacement 658,000 671,000 684,000 698,000 Earnings on Investments: 25,000 26,000 27,000 28,000 Other Revenue from Local Sources 10,000 10,000 10,000 10,000 Proceeds from Fixed Asset Disposition - - - -
Total Revenues 16,536,000 16,709,000 16,883,000 17,059,000
Expenditures by FunctionInstruction 6,100,000 6,161,000 6,223,000 6,285,000 Business and Central Administration, Technology 2,460,000 2,485,000 2,510,000 2,535,000 Plant Operation & Maintenance 3,178,000 3,210,000 3,242,000 3,274,000 Student Transportation 850,000 859,000 868,000 877,000 Non-Instructional Expenditures 2,000 2,000 2,000 2,000 Facilities Acquisition and Construction 3,330,000 3,363,000 3,397,000 3,431,000
Total Expenditures 15,920,000 16,080,000 16,242,000 16,404,000
Excess of Revenues over Expenditures 616,000 629,000 641,000 655,000 Beginning Fund Balance 2,384,000 2,999,000 3,628,000 4,269,000
Ending Fund Balance 2,999,000$ 3,628,000$ 4,269,000$ 4,924,000$
DES MOINES PUBLIC SCHOOLS2021 - 2022 BUDGET
PPEL FUND SUMMARY — BUDGET AND PROJECTIONS
2021 - 2022 Preliminary Budget 101

FY 2018 FY 2019 FY 2020 FY 2021Actual Actual Actual Re-estimated
RevenuesProperty Taxes 903,085$ 971,052$ 981,783$ 1,093,596$ Utility Replacement Tax 28,634 27,457 27,387 26,023Mobile Home Tax 984 942 906 1,000Military Credit 256 242 233 300Commercial & Industrial Replacement 39,470 41,003 41,307 42,517Other Revenue from Local Sources 357,241 225,172 10,986 32,000
Total Revenues 1,329,670 1,265,868 1,062,602 1,195,436
Expenditures by FunctionInstruction 128,251 136,957 123,402 956,000Non-Instructional Expenditures 684,623 577,790 231,167 285,000Facilities Acquisition and Construction 419,342 187,546 310,470 600,000
Total Expenditures 1,232,217 902,292 665,039 1,841,000
Excess of Revenues over Expenditures 97,454 363,576 397,563 (645,564)Beginning Fund Balance 432,236 529,690 893,265 1,290,828
Ending Fund Balance 529,690$ 893,265$ 1,290,828$ 645,264$
DES MOINES PUBLIC SCHOOLS2021 - 2022 BUDGET
PERL FUND SUMMARY — HISTORICAL SUMMARY
2021 - 2022 Preliminary Budget 102

FY 2022 FY 2023 FY 2024 FY 2025Budget Projected Projected Projected
RevenuesProperty Taxes 1,120,000$ 1,131,000$ 1,142,000$ 1,153,000$ Utility Replacement Tax 24,000 25,000 25,000 25,000Mobile Home Tax 1,000 1,000 1,000 1,000Military Credit - - - - Commercial & Industrial Replacement 53,000 54,000 55,000 56,000Other Revenue from Local Sources 200,000 250,000 275,000 303,000
Total Revenues 1,399,000 1,461,000 1,498,000 1,538,000
Expenditures by FunctionInstruction 856,000 865,000 800,000 800,000Non-Instructional Expenditures 285,000 200,000 204,000 208,000Facilities Acquisition and Construction 600,000 500,000 500,000 600,000
Total Expenditures 1,741,000 1,565,000 1,504,000 1,608,000
Excess of Revenues over Expenditures (342,000) (104,000) (6,000) (70,000)Beginning Fund Balance 645,000 303,000 199,000 194,000
Ending Fund Balance 303,000$ 199,000$ 194,000$ 124,000$
DES MOINES PUBLIC SCHOOLS2021 - 2022 BUDGET
PERL FUND SUMMARY — BUDGET AND PROJECTIONS
2021 - 2022 Preliminary Budget 103

FY 2018 FY 2019 FY 2020 FY 2021Actual Actual Actual Re-estimated
RevenuesStudent Activities 2,541,466$ 2,312,918$ 1,606,192$ 787,400$
Total Revenues 2,541,466 2,312,918 1,606,192 787,400
Expenditures by FunctionInstruction 2,569,759 2,322,877 1,903,171 1,142,300
Total Expenditures 2,569,759 2,322,877 1,903,171 1,142,300
Excess of Revenues over Expenditures (28,294) (9,960) (296,979) (354,900)Beginning Fund Balance 1,564,375 1,536,081 1,526,121 1,229,142
Ending Fund Balance 1,536,081$ 1,526,121$ 1,229,142$ 874,242$
DES MOINES PUBLIC SCHOOLS2021 - 2022 BUDGET
STUDENT ACTIVITY FUND SUMMARY — HISTORICAL SUMMARY
2021 - 2022 Preliminary Budget 104

FY 2022 FY 2023 FY 2024 FY 2025Budget Projected Projected Projected
RevenuesStudent Activities 2,000,000$ 2,020,000$ 2,040,000$ 2,061,000$
Total Revenues 2,000,000 2,020,000 2,040,000 2,061,000
Expenditures by FunctionInstruction 2,000,000 2,020,000 2,040,000 2,061,000
Total Expenditures 2,000,000 2,020,000 2,040,000 2,061,000
Excess of Revenues over Expenditures - - - - Beginning Fund Balance 874,000 874,000 874,000 874,000
Ending Fund Balance 874,000$ 874,000$ 874,000$ 874,000$
DES MOINES PUBLIC SCHOOLS2021 - 2022 BUDGET
STUDENT ACTIVITY FUND SUMMARY — BUDGET AND PROJECTIONS
2021 - 2022 Preliminary Budget 105

FY 2018 FY 2019 FY 2020 FY 2021Actual Actual Actual Re-estimated
Other Financing Sources 83,130 115,795 208,267 50,000Investment Earnings (Loss) (36,082) 262,563 (450,755) 118,000Student Activities 19,145 - - -
Total Revenues 66,193 378,358 (242,488) 168,000
Instruction 54,675 189,293 41,804 55,000Facilities Acquisition and Construction 14,672 2,730 2,430 9,000Transfers Out 82,519 898,783 18,150 184,000
Total Expenditures 151,866 1,090,806 62,384 248,000
Excess of Revenues over Expenditures (85,673) (712,448) (304,872) (80,000)Beginning Fund Balance 3,269,490 3,183,817 2,471,369 2,166,497
Ending Fund Balance 3,183,817$ 2,471,369$ 2,166,497$ 2,086,497$
DES MOINES PUBLIC SCHOOLS2021 - 2022 BUDGET
GOVERNMENTAL TRUST: EXPENDABLE TRUST FUND SUMMARY (FUND 27) — HISTORICAL SUMMARY
Revenues
Expenditures by Function
2021 - 2022 Preliminary Budget 106

FY 2022 FY 2023 FY 2024 FY 2025Budget Projected Projected Projected
Other Financing Sources 115,000 116,000 117,000 118,000Investment Earnings (Loss) 118,000 119,000 120,000 121,000Student Activities - - - -
Total Revenues 233,000 235,000 237,000 239,000
Instruction 85,000 86,000 87,000 88,000 Facilities Acquisition and Construction 7,000 7,000 7,000 7,000 Transfers Out 295,000 298,000 301,000 304,000
Total Expenditures 387,000 391,000 395,000 399,000
Excess of Revenues over Expenditures (154,000) (156,000) (158,000) (160,000)Beginning Fund Balance 2,086,000 1,932,000 1,776,000 1,618,000
Ending Fund Balance 1,932,000$ 1,776,000$ 1,618,000$ 1,458,000$
Revenues
Expenditures by Function
DES MOINES PUBLIC SCHOOLS2021 - 2022 BUDGET
GOVERNMENTAL TRUST: EXPENDABLE TRUST FUND SUMMARY (FUND 27) — BUDGET AND PROJECTIONS
2021 - 2022 Preliminary Budget 107

Governmental Funds - Capital Projects Funds
FY 2018 FY 2019 FY 2020 FY 2021Actual Actual Actual Re-estimated
RevenuesEarnings on Investments 642,426$ 2,256,961$ 1,017,189$ 256,174$ Sales and Use Tax 30,706,896 33,896,019 33,985,178 32,559,592Other Revenue from Local Sources 9,351 - - - General Long-Term Debt Proceeds 60,711,168 - - -
Total Revenues 92,069,841 36,152,980 35,002,367 32,815,766
Expenditures by FunctionFacilities Acquisition and Construction 20,887,708 20,315,047 25,752,704 27,491,854Other Financing Uses 469,511 3,500 - - Transfers Out 18,249,571 23,095,026 22,995,050 22,996,380
Total Expenditures 39,606,790 43,413,573 48,747,754 50,488,234
Excess of Revenues over Expenditures 52,463,051 (7,260,593) (13,745,387) (17,672,468)Beginning Fund Balance 60,073,912 112,536,963 105,276,370 91,530,983
Ending Fund Balance 112,536,963$ 105,276,370$ 91,530,983$ 73,858,515$
DES MOINES PUBLIC SCHOOLS2021 - 2022 BUDGET
SECURE AN ADVANCED VISION FOR EDUCATION (SAVE) FUND SUMMARY — HISTORICAL SUMMARY
2021 - 2022 Preliminary Budget 108

FY 2022 FY 2023 FY 2024 FY 2025Budget Projected Projected Projected
RevenuesEarnings on Investments 177,000$ 129,000$ 110,000$ 94,000$ Sales and Use Tax 32,564,000 33,205,000 33,772,000 34,179,000Other Revenue from Local Sources - - - - General Long-Term Debt Proceeds - - - -
Total Revenues 32,741,000 33,333,000 33,882,000 34,273,000
Expenditures by FunctionFacilities Acquisition and Construction 33,422,000 19,478,000 16,890,000 16,410,000Other Financing Uses - - - - Transfers Out 22,994,000 22,993,000 22,993,000 22,997,000
Total Expenditures 56,416,000 42,471,000 39,882,000 39,406,000
Excess of Revenues over Expenditures (23,676,000) (9,138,000) (6,001,000) (5,134,000)Beginning Fund Balance 73,859,000 50,183,000 41,045,000 35,045,000
Ending Fund Balance 50,183,000$ 41,045,000$ 35,045,000$ 29,911,000$
DES MOINES PUBLIC SCHOOLS2021 - 2022 BUDGET
SECURE AN ADVANCED VISION FOR EDUCATION (SAVE) FUND SUMMARY — BUDGET AND PROJECTIONS
2021 - 2022 Preliminary Budget 109

FY 2018 FY 2019 FY 2020 FY 2021Actual Actual Actual Re-estimated
RevenuesTransfers In 18,249,571$ 23,095,026$ 22,995,050$ 22,996,380$
Total Revenues 18,249,571 23,095,026 22,995,050 22,996,380
Expenditures by FunctionDebt Service 18,249,571 23,095,026 22,995,050 22,996,380
Total Expenditures 18,249,571 23,095,026 22,995,050 22,996,380
Excess of Revenues over Expenditures - - - - Beginning Fund Balance - - - -
Ending Fund Balance -$ -$ -$ -$
DES MOINES PUBLIC SCHOOLS2021 - 2022 BUDGET
DEBT SERVICE FUND SUMMARY — HISTORICAL SUMMARY
2021 - 2022 Preliminary Budget 110

FY 2022 FY 2023 FY 2024 FY 2025Budget Projected Projected Projected
RevenuesTransfers In 22,994,000$ 22,993,000$ 22,993,000$ 22,997,000$
Total Revenues 22,994,000 22,993,000 22,993,000 22,997,000
Expenditures by FunctionDebt Service 22,994,000 22,993,000 22,993,000 22,997,000
Total Expenditures 22,994,000 22,993,000 22,993,000 22,997,000
Excess of Revenues over Expenditures - - - - Beginning Fund Balance - - - -
Ending Fund Balance -$ -$ -$ -$
DES MOINES PUBLIC SCHOOLS2021 - 2022 BUDGET
DEBT SERVICE FUND SUMMARY — BUDGET AND PROJECTIONS
2021 - 2022 Preliminary Budget 111

Principal Interest Total Principal Interest Total Principal Interest Total201120122013 3,125,000$ 3,059,744$ 6,184,744$ 2014 3,330,000 2,751,000 6,081,000 485,000$ 131,116$ 616,116$ 2015 3,430,000 2,617,800 6,047,800 425,000 298,045 723,045 3,105,000$ 2,850,385$ 5,955,385$ 2016 3,530,000 2,480,600 6,010,600 440,000 285,295 725,295 3,400,000 2,506,925 5,906,9252017 3,650,000 2,339,400 5,989,400 455,000 272,095 727,095 3,490,000 2,336,925 5,826,9252018 3,755,000 2,193,400 5,948,400 470,000 253,895 723,895 3,600,000 2,162,425 5,762,4252019 3,870,000 2,043,200 5,913,200 490,000 235,095 725,095 3,720,000 1,982,425 5,702,4252020 3,990,000 1,888,400 5,878,400 505,000 220,395 725,395 3,850,000 1,796,425 5,646,4252021 4,125,000 1,728,800 5,853,800 530,000 195,145 725,145 3,875,000 1,603,925 5,478,9252022 4,280,000 1,563,800 5,843,800 555,000 168,645 723,645 4,000,000 1,410,175 5,410,1752023 4,435,000 1,392,600 5,827,600 575,000 151,995 726,995 4,145,000 1,210,175 5,355,1752024 4,595,000 1,215,200 5,810,200 590,000 134,745 724,745 4,310,000 1,002,925 5,312,9252025 4,770,000 1,031,400 5,801,400 610,000 116,455 726,455 4,480,000 873,625 5,353,6252026 4,955,000 840,600 5,795,600 630,000 96,630 726,630 4,670,000 739,225 5,409,2252027 5,145,000 642,400 5,787,400 650,000 75,525 725,525 4,870,000 587,450 5,457,4502028 5,350,000 436,600 5,786,600 675,000 52,775 727,775 5,090,000 417,000 5,507,0002029 5,565,000 222,600 5,787,600 695,000 27,800 722,800 5,335,000 213,400 5,548,400
71,900,000$ 28,447,544$ 100,347,544$ 8,780,000$ 2,715,651$ 11,495,651$ 61,940,000$ 21,693,410$ 83,633,410$
Principal Interest Total Principal Interest Total Principal Interest Total2011 1,640,000$ 4,313,500$ 5,953,500$ 2012 2,590,000 3,418,000 6,008,0002013 5,810,000 6,348,244 12,158,2442014 6,595,000 6,036,366 12,631,3662015 9,845,000 8,781,480 18,626,4802016 *Replaced Series 2010 Bonds 10,355,000 8,143,820 18,498,8202017 4,900,000$ 930,288$ 5,830,288$ 12,495,000 5,878,708 18,373,7082018 4,830,000 984,851 5,814,851 12,655,000 5,594,571 18,249,571
2019 4,025,000 887,285 4,912,285 3,300,000 2,542,021 5,842,021 15,405,000 7,690,026 23,095,0262020 4,100,000 805,980 4,905,980 3,570,000 2,268,850 5,838,850 16,015,000 6,980,050 22,995,0502021 4,165,000 723,160 4,888,160 3,960,000 2,090,350 6,050,350 16,655,000 6,341,380 22,996,3802022 4,240,000 639,027 4,879,027 4,245,000 1,892,350 6,137,350 17,320,000 5,673,997 22,993,9972023 4,325,000 553,379 4,878,379 4,525,000 1,680,100 6,205,100 18,005,000 4,988,249 22,993,2492024 4,415,000 466,014 4,881,014 4,810,000 1,453,850 6,263,850 18,720,000 4,272,734 22,992,7342025 4,510,000 376,831 4,886,831 5,015,000 1,213,350 6,228,350 19,385,000 3,611,661 22,996,6612026 4,610,000 285,729 4,895,729 5,205,000 962,600 6,167,600 20,070,000 2,924,784 22,994,7842027 4,710,000 192,607 4,902,607 5,420,000 702,350 6,122,350 20,795,000 2,200,332 22,995,3322028 4,825,000 97,465 4,922,465 5,565,000 485,550 6,050,550 21,505,000 1,489,390 22,994,3902029 - - - 10,620,000 318,600 10,938,600 22,215,000 782,400 22,997,400
53,655,000$ 6,942,616$ 60,597,616$ 56,235,000$ 15,609,971$ 71,844,971$ 268,075,000$ 95,469,693$ 363,544,693$
2012 SAVE Revenue Bonds 2013 SAVE Revenue Bonds 2014 SAVE Revenue Bonds
DES MOINES PUBLIC SCHOOLS2021 - 2022 BUDGET
DEBT SERVICE FUND SUMMARY
2016 SAVE Revenue Bonds 2018 SAVE Revenue Bonds DEBT SERVICE RECAP
On May 8, 2012, the District issued revenue bonds in the amount of $71,900,000 to be paid out of SAVE revenues. On December 30, 2013, the District issued revenue bonds in the amount of $8,780,000 to be paid out of SAVE revenues. On May 1, 2014, the District issued revenue bonds in the amount of $61,940,000 to be paid out of SAVE revenues.On July 22, 2016, the District refunded the Series 2010 revenue bonds with the Series 2016 Bonds in the amount of $53,655,000 to be paid out of SAVE revenues. On May 15, 2018, the District issued revenue bonds in the amount of $56,235,000 to be paid out of SAVE revenues.
2021 - 2022 Preliminary Budget 112

PROPRIETARY FUNDS
DMPS All Funds
Proprietary Funds
Enterprise Funds
Food & Nutrition
Child Care
Home Building
Student Auto Body
Internal Service Funds
Self-Insurance
Risk Management
Print Shop
2021 - 2022 Preliminary Budget 113

Proprietary Funds - Enterprise Funds
FY 2018 FY 2019 FY 2020 FY 2021Actual Actual Actual Re-estimated
RevenuesState Sources 180,854$ 174,743$ 174,058$ -$ Federal Sources 19,149,101 19,060,860 19,287,466 18,619,282Nutrition Program Sales 1,809,971 1,514,191 915,037 220,000Capital Contributions 3,252 - - -
Total Revenues 21,143,179 20,749,794 20,376,561 18,839,282
Expenditures by FunctionNon-Instructional Expenditures 20,594,344 20,098,310 20,630,266 19,105,277Transfers Out 1,142,874 1,112,380 1,273,670 124,757
Total Expenditures 21,737,208 21,210,691 21,903,936 19,230,034
Excess of Revenues over Expenditures (594,029) (460,897) (1,527,375) (390,752)Beginning Fund Balance 1,788,459 1,194,430 733,533 (793,842)
Ending Fund Balance 1,194,430$ 733,533$ (793,842)$ (1,184,594)$
DES MOINES PUBLIC SCHOOLS2021 - 2022 BUDGET
FOOD & NUTRITION FUND SUMMARY — HISTORICAL SUMMARY
2021 - 2022 Preliminary Budget 114

FY 2022 FY 2023 FY 2024 FY 2025Budget Projected Projected Projected
RevenuesState Sources 180,000$ 181,800$ 184,000$ 185,000$ Federal Sources 19,400,000 19,794,000 20,192,000 20,594,000Nutrition Program Sales 1,300,000 1,313,000 1,326,000 1,339,000Capital Contributions - - - -
Total Revenues 20,880,000 21,288,800 21,702,000 22,119,000
Expenditures by FunctionNon-Instructional Expenditures 20,040,000 19,993,000 20,208,000 20,426,000Transfers Out 840,000 1,100,000 1,100,000 1,100,000
Total Expenditures 20,880,000 21,093,000 21,308,000 21,526,000
Excess of Revenues over Expenditures - 196,000 393,000 593,000Beginning Fund Balance (1,185,000) (1,185,000) (989,000) (595,000)
Ending Fund Balance (1,185,000)$ (989,000)$ (595,000)$ (2,000)$
DES MOINES PUBLIC SCHOOLS2021 - 2022 BUDGET
FOOD & NUTRITION FUND SUMMARY — BUDGET AND PROJECTIONS
2021 - 2022 Preliminary Budget 115

FY 2018 FY 2019 FY 2020 FY 2021Actual Actual Actual Re-estimated
RevenuesRevenue from Local Sources 5,699,859$ 5,448,485$ 3,899,452$ 3,275,243$
Total Revenues 5,699,859 5,448,485 3,899,452 3,275,243
Expenditures by FunctionNon-Instructional Expenditures 5,843,522 5,589,520 4,774,139 3,110,811
Total Expenditures 5,843,522 5,589,520 4,774,139 3,110,811
Excess of Revenues over Expenditures (143,662) (141,035) (874,687) 164,432Beginning Fund Balance (1,007,071) (1,150,734) (1,291,768) (2,166,455)
Ending Fund Balance (1,150,734)$ (1,291,768)$ (2,166,455)$ (2,002,023)$
DES MOINES PUBLIC SCHOOLS2021 - 2022 BUDGET
CHILDCARE FUND SUMMARY — HISTORICAL SUMMARY
2021 - 2022 Preliminary Budget 116

FY 2022 FY 2023 FY 2024 FY 2025Budget Projected Projected Projected
RevenuesRevenue from Local Sources 3,390,000$ 3,424,000$ 3,458,000$ 3,493,000$
Total Revenues 3,390,000 3,424,000 3,458,000 3,493,000
Expenditures by FunctionNon-Instructional Expenditures 3,315,000 3,348,000 3,381,000 3,415,000
Total Expenditures 3,315,000 3,348,000 3,381,000 3,415,000
Excess of Revenues over Expenditures 75,000 76,000 77,000 78,000Beginning Fund Balance (2,002,000) (1,927,000) (1,851,000) (1,774,000)
Ending Fund Balance (1,927,000)$ (1,851,000)$ (1,774,000)$ (1,696,000)$
DES MOINES PUBLIC SCHOOLS2021 - 2022 BUDGET
CHILDCARE FUND SUMMARY — BUDGET AND PROJECTIONS
2021 - 2022 Preliminary Budget 117

FY 2018 FY 2019 FY 2020 FY 2021Actual Actual Actual Re-estimated
RevenuesRevenue from Local Sources 9,500$ 100$ 207,310$ -$
Total Revenues 9,500 100 207,310 -
Expenditures by FunctionNon-Instructional Expenditures 1,112 2,229 3,761 600
Total Expenditures 1,112 2,229 3,761 600
Excess of Revenues over Expenditures 8,388 (2,129) 203,549 (600)Beginning Fund Balance 113,897 122,285 120,156 323,705
Ending Fund Balance 122,285$ 120,156$ 323,705$ 323,105$
FY 2018 Value includes CIP of $98,173FY 2019 Value includes CIP of $122,379FY 2020 Value inclues CIP of $143,279FY 2021 Value inclues estimated CIP of $154,846
DES MOINES PUBLIC SCHOOLS2021 - 2022 BUDGET
HOME BUILDING FUND SUMMARY — HISTORICAL SUMMARY
2021 - 2022 Preliminary Budget 118

FY 2022 FY 2023 FY 2024 FY 2025Budget Projected Projected Projected
RevenuesRevenue from Local Sources -$ -$ -$ -$
Total Revenues - - - -
Expenditures by FunctionNon-Instructional Expenditures - - - -
Total Expenditures - - - -
Excess of Revenues over Expenditures - - - - Beginning Fund Balance 323,000 323,000 323,000 323,000
Ending Fund Balance 323,000$ 323,000$ 323,000$ 323,000$
DES MOINES PUBLIC SCHOOLS2021 - 2022 BUDGET
HOME BUILDING FUND SUMMARY — BUDGET AND PROJECTIONS
2021 - 2022 Preliminary Budget 119

FY 2018 FY 2019 FY 2020 FY 2021Actual Actual Actual Re-estimated
RevenuesRevenue from Local Sources 28,093$ 38,804$ 22,092$ 3,900$
Total Revenues 28,093 38,804 22,092 3,900
Expenditures by FunctionNon-Instructional Expenditures 37,938 44,807 32,847 4,000
Total Expenditures 37,938 44,807 32,847 4,000
Excess of Revenues over Expenditures (9,845) (6,003) (10,755) (100)Beginning Fund Balance 94,397 84,551 78,548 67,793
Ending Fund Balance 84,551$ 78,548$ 67,793$ 67,693$
DES MOINES PUBLIC SCHOOLS2021 - 2022 BUDGET
STUDENT AUTO BODY — HISTORICAL SUMMARY
2021 - 2022 Preliminary Budget 120

FY 2022 FY 2023 FY 2024 FY 2025Budget Projected Projected Projected
RevenuesRevenue from Local Sources 35,000$ 35,000$ 36,000$ 36,000$
Total Revenues 35,000 35,000 36,000 36,000
Expenditures by FunctionNon-Instructional Expenditures 41,000 41,000 42,000 42,000
Total Expenditures 41,000 41,000 42,000 42,000
Excess of Revenues over Expenditures (6,000) (6,000) (6,000) (6,000)Beginning Fund Balance 68,000 62,000 56,000 50,000
Ending Fund Balance 62,000$ 56,000$ 50,000$ 43,000$
DES MOINES PUBLIC SCHOOLS2021 - 2022 BUDGET
STUDENT AUTO BODY — BUDGET AND PROJECTIONS
2021 - 2022 Preliminary Budget 121

Proprietary Funds - Internal Service
FY 2018 FY 2019 FY 2020 FY 2021Actual Actual Actual Re-estimated
RevenuesEmployee Benefits Deductions 67,698,188$ 68,542,835$ 65,618,526$ 69,036,000$
Total Revenues 67,698,188 68,542,835 65,618,526 69,036,000
Expenditures by FunctionClaims and Related Costs 69,996,514 68,146,608 63,663,364 70,221,000
Total Expenditures 69,996,514 68,146,608 63,663,364 70,221,000
Excess of Revenues over Expenditures (2,298,326) 396,227 1,955,162 (1,185,000)Beginning Fund Balance 10,808,072 8,509,746 8,905,973 10,861,135
Ending Fund Balance 8,509,746$ 8,905,973$ 10,861,135$ 9,676,135$
DES MOINES PUBLIC SCHOOLS2021 - 2022 BUDGET
SELF INSURANCE FUND SUMMARY — HISTORICAL SUMMARY
2021 - 2022 Preliminary Budget 122

FY 2022 FY 2023 FY 2024 FY 2025Budget Projected Projected Projected
RevenuesEmployee Benefits Deductions 70,000,000$ 70,700,000$ 71,407,000$ 72,121,000$
Total Revenues 70,000,000 70,700,000 71,407,000 72,121,000
Expenditures by FunctionClaims and Related Costs 71,000,000 71,710,000 72,427,000 73,151,000
Total Expenditures 71,000,000 71,710,000 72,427,000 73,151,000
Excess of Revenues over Expenditures (1,000,000) (1,010,000) (1,020,000) (1,030,000)Beginning Fund Balance 9,676,000 8,676,000 7,666,000 6,646,000
Ending Fund Balance 8,676,000$ 7,666,000$ 6,646,000$ 5,616,000$
DES MOINES PUBLIC SCHOOLS2021 - 2022 BUDGET
SELF INSURANCE FUND SUMMARY — BUDGET AND PROJECTIONS
2021 - 2022 Preliminary Budget 123

FY 2018 FY 2019 FY 2020 FY 2021Actual Actual Actual Re-estimated
RevenuesRevenue from local sources 954,550$ 936,443$ 943,347$ 955,000$
Total Revenues 954,550 936,443 943,347 955,000
Expenditures by FunctionOperations 948,870 933,015 935,987 950,000
Total Expenditures 948,870 933,015 935,987 950,000
Excess of Revenues over Expenditures 5,680 3,428 7,360 5,000Beginning Fund Balance 190,162 195,842 199,270 206,630
Ending Fund Balance 195,842$ 199,270$ 206,630$ 211,630$
DES MOINES PUBLIC SCHOOLS2021 - 2022 BUDGET
RISK MANAGEMENT FUND SUMMARY — HISTORICAL SUMMARY
2021 - 2022 Preliminary Budget 124

FY 2022 FY 2023 FY 2024 FY 2025Budget Projected Projected Projected
RevenuesRevenue from local sources 965,000$ 975,000$ 985,000$ 995,000$
Total Revenues 965,000 975,000 985,000 995,000
Expenditures by FunctionOperations 960,000 970,000 980,000 990,000
Total Expenditures 960,000 970,000 980,000 990,000
Excess of Revenues over Expenditures 5,000 5,000 5,000 5,000Beginning Fund Balance 212,000 217,000 222,000 227,000
Ending Fund Balance 217,000$ 222,000$ 227,000$ 232,000$
DES MOINES PUBLIC SCHOOLS2021 - 2022 BUDGET
RISK MANAGEMENT FUND SUMMARY — BUDGET AND PROJECTIONS
2021 - 2022 Preliminary Budget 125

FY 2018 FY 2019 FY 2020 FY 2021Actual Actual Actual Re-estimated
RevenuesRevenue from Local Sources 1,413,600$ 1,395,963$ 1,318,186$ 1,474,000$
Total Revenues 1,413,600 1,395,963 1,318,186 1,474,000
Expenditures by FunctionOperations 1,397,112 1,408,979 1,309,448 1,533,000
Total Expenditures 1,397,112 1,408,979 1,309,448 1,533,000
Excess of Revenues over Expenditures 16,488 (13,016) 8,738 (59,000)Beginning Fund Balance 66,465 82,953 69,937 78,675
Ending Fund Balance 82,953$ 69,937$ 78,675$ 19,675$
DES MOINES PUBLIC SCHOOLS2021 - 2022 BUDGET
PRINT SHOP FUND SUMMARY — HISTORICAL SUMMARY
2021 - 2022 Preliminary Budget 126

FY 2022 FY 2023 FY 2024 FY 2025Budget Projected Projected Projected
RevenuesRevenue from Local Sources 1,560,000$ 1,591,000$ 1,592,000$ 1,608,000$
Total Revenues 1,560,000 1,591,000 1,592,000 1,608,000
Expenditures by FunctionOperations 1,555,000 1,586,000 1,587,000 1,603,000
Total Expenditures 1,555,000 1,586,000 1,587,000 1,603,000
Excess of Revenues over Expenditures 5,000 5,000 5,000 5,000Beginning Fund Balance 20,000 25,000 30,000 35,000
Ending Fund Balance 25,000$ 30,000$ 35,000$ 40,000$
DES MOINES PUBLIC SCHOOLS2021 - 2022 BUDGET
PRINT SHOP FUND SUMMARY — BUDGET AND PROJECTIONS
2021 - 2022 Preliminary Budget 127

FIDUCIARY FUNDS
DMPS All Funds
Fiduciary Funds
Trust Funds
Private Purpose
Pension
Agency
2021 - 2022 Preliminary Budget 128

Fiduciary Funds - Trust Funds
FY 2018 FY 2019 FY 2020 FY 2021Actual Actual Actual Re-estimated
Donations 32,159$ 359,529$ 1,403,139$ 200,000$ Investment Income 5,710 113,894 17,089 1,000
Total Revenues 37,869 473,423 1,420,228 201,000
Scholarships 43,969 73,462 160,805 165,000
Total Expenditures 43,969 73,462 160,805 165,000
Excess of Revenues over Expenditures (6,100) 399,961 1,259,423 36,000Beginning Fund Balance 722,577 716,477 1,116,438 2,375,861
Ending Fund Balance 716,477$ 1,116,438$ 2,375,861$ 2,411,861$
Expenditures by Function
DES MOINES PUBLIC SCHOOLS2021 - 2022 BUDGET
FIDUCIARY TRUST: PRIVATE PURPOSE TRUST FUND SUMMARY (FUND 81) — HISTORICAL SUMMARY
Revenues
2021 - 2022 Preliminary Budget 129

FY 2022 FY 2023 FY 2024 FY 2025Budget Projected Projected Projected
Donations 200,000$ 202,000$ 204,000$ 206,000$ Investment Income 8,000 8,000 8,000 8,000
Total Revenues 208,000 210,000 212,000 214,000
Scholarships 167,000 169,000 171,000 173,000
Total Expenditures 167,000 169,000 171,000 173,000
Excess of Revenues over Expenditures 41,000 41,000 41,000 41,000Beginning Fund Balance 2,412,000 2,453,000 2,494,000 2,535,000
Ending Fund Balance 2,453,000$ 2,494,000$ 2,535,000$ 2,576,000$
Expenditures by Function
Revenues
DES MOINES PUBLIC SCHOOLS2021 - 2022 BUDGET
FIDUCIARY TRUST: PRIVATE PURPOSE TRUST FUND SUMMARY (FUND 81) — BUDGET AND PROJECTIONS
2021 - 2022 Preliminary Budget 130

FY 2018 FY 2019 FY 2020 FY 2021Actual Actual Actual Re-estimated
Student Activities 22,006$ 38,695$ 29,190$ 29,000$ Revenue from Local Sources 72,383 84,374 70,685 71,000
Total Revenues 94,389 123,069 99,875 100,000
Support Services 122,761 115,483 79,952 80,000
Total Expenditures 122,761 115,483 79,952 80,000
Excess of Revenues over Expenditures (28,372) 7,586 19,923 20,000Beginning Fund Balance 131,306 102,934 110,520 130,443
Ending Fund Balance 102,934$ 110,520$ 130,443$ 150,443$
Revenues
Expenditures by Function
DES MOINES PUBLIC SCHOOLS2021 - 2022 BUDGET
AGENCY FUND SUMMARY (FUND 91) — HISTORICAL SUMMARY
2021 - 2022 Preliminary Budget 131

FY 2022 FY 2023 FY 2024 FY 2025Budget Projected Projected Projected
Student Activities 29,000$ 29,000$ 29,000$ 29,000$ Revenue from Local Sources 72,000 73,000 74,000 75,000
Total Revenues 101,000 102,000 103,000 104,000
Support Services 88,000 97,000 107,000 118,000
Total Expenditures 88,000 97,000 107,000 118,000
Excess of Revenues over Expenditures 13,000 5,000 (4,000) (14,000)Beginning Fund Balance 150,000 163,000 168,000 164,000
Ending Fund Balance 163,000$ 168,000$ 164,000$ 150,000$
Revenues
Expenditures by Function
DES MOINES PUBLIC SCHOOLS2021 - 2022 BUDGET
AGENCY FUND SUMMARY (FUND 91) — BUDGET AND PROJECTIONS
2021 - 2022 Preliminary Budget 132

REVENUES & EXPENDITURES
ALL FUNDS
District revenues and expenditures are accounted for in five fund types (Operating, Special Revenue, Capital Projects, Debt Service, and Enterprise). Within these five fund types, the district maintains multiple fund accounts to account for revenues from a variety of sources and expenditures.
Fund Category Fund Type: DMPS Fund Account(s)
Governmental Funds account for operating and special revenue activities. Operating: General Fund Special Revenue: Management, PPEL, PERL, Student Activity, and Governmental Trusts Capital Projects: SAVE Debt Service: Debt Service
Proprietary Funds account for business-type activities. Enterprise: Food & Nutrition, Childcare, Home Building, and Student Auto Body Internal Service: Self-Insurance, Risk Management, and Print Shop
Fiduciary Funds account for resources held for others by DMPS as an agent or trustee. Trust: Private Purpose Trust, Pension, and Agency
Revenue Sources State Funds received from state sources, including State Foundational Aid, Teacher
Quality, Preschool, Vocational Aid, aid for non-public schools and the AEA, and state-funded grants.
Local Funds received from local sources, including property taxes, tuition, usage fees, income from investments and student activities, and local contributions and donations.
Federal Funds received from federal sources, including federal title programs and other federal acts, special education, Medicaid, and federally-funded grants.
Intermediary Funds received from funds or grants from the county, city, or AEA or an institute of higher education.
Other Sources Funds that do not fit into one other the other categories.
2021 - 2022 Preliminary Budget 133

Expenditures by Function Instruction Activities dealing directly with the interaction between teachers and students.
Teaching may be provided for students in a school classroom, in another location such as a home or hospital, and in other learning situations such as those involving cocurricular activities. It may also be provided through some other approved medium (such as television, radio, computer, Internet, multimedia telephone, and correspondence) that is delivered inside or outside the classroom or in other teacher-student settings. Included in this function are the activities of aides or classroom assistants of any type who assist in the instructional process.
Student Support Services
Activities designed to assess and improve the well-being of students and to supplement the teaching process.
Plant Operations & Maintenance
Activities concerned with keeping the physical plant open, comfortable, and safe for use and with keeping the grounds, buildings, and equipment in effective working condition and state of repair. These include the activities of maintaining safety in buildings, on the grounds, and in the vicinity of schools.
Central Administration
Activities concerned with establishing and administering policy for operating the school district.
Non-Instruction Activities concerned with providing non-instructional services to students, staff, or the community.
Facilities Activities concerned with acquiring land and buildings, remodeling buildings, constructing buildings and additions to buildings, initially installing or extending service systems and other built-in equipment, and improving sites.
Debt Service Activities related to servicing the long-term debt of the school district, including payments of both principal and interest.
AEA Support The portion of the state foundation aid which the district is required by Iowa Code section 273.9(1) to include in its local certified budget but which is paid directly to the AEA from the state.
Transfers Out Transactions which withdraw money from one fund and place it in another without recourse.
2021 - 2022 Preliminary Budget 134

The graphs below outline all district revenues by fund type and fund account.
2021 - 2022 Preliminary Budget 135

The graphs below outline all district expenditures by fund type and fund account.
2021 - 2022 Preliminary Budget 136

GENERAL FUND
The General Fund is the largest fund in the district. All funds that are not required to be accounted for in a different fund are accounted for in the General Fund. The sources of General Fund revenue are state funds, local funds (including property tax), federal funds, and intermediary sources. These revenue sources are explained in greater detail on the following pages.
Budgeted Revenue & Expenditures
The General Fund accounts for 78.5% of all FY 2022 budgeted revenues and 75.7% of all FY 2022 budgeted expenses.
78.5% of Total Revenues
75.7% of Total Expenditures
The budgeted General Fund expenditures (by function) for FY 2022 encompasses:
GENERAL FUND EXPENDITURES, BY FUNCTION
Instruction, 60.9%
Student Support, 22.4%
Plant Operations, 8.8%
Central Administration, 3.8%
AEA Flowthrough, 3.7%
Non-Instruction, 0.3%
Transfers Out, 0.1%
2021 - 2022 Preliminary Budget 137

General Fund Revenue Sources
General Fund Revenue Sources, 10 Year Comparison
FY 2022 GENERAL FUND REVENUE SOURCES
State, 61.0% Local Funds, 29.5% Federal, 9.4% Intermediary, 0.1%
FY2013
FY2014
FY2015
FY2016
FY2017
FY2018
FY2019
FY2020
FY2021
FY2022
Intermediary 0.1% 0.2% 0.2% 0.2% 0.2% 0.2% 0.2% 0.2% 0.1% 0.1% Federal 10.2% 7.8% 8.3% 7.5% 7.8% 8.1% 8.0% 8.4% 8.6% 9.4% Local Funds 32.0% 32.3% 30.5% 31.1% 31.3% 31.1% 32.4% 32.2% 32.2% 29.5% State 57.7% 59.7% 61.0% 61.2% 60.7% 60.6% 59.5% 59.2% 59.1% 61.0%
0%
20%
40%
60%
80%
100%
SOURCES OF GENERAL FUND REVENUES, BY PERCENT
2021 - 2022 Preliminary Budget 138

General Fund Revenues: State Funds State revenues include State Foundation Aid, Teacher Salary Supplement, and Universal Preschool. State Aid is the single largest source of revenue for the General Fund. State Foundation Aid budgets are based on the initial “Aid & Levy” documents released by the Iowa Department of Education each year in early February. The Aid & Levy projects Foundation Aid based on a per student funding formula which has been in place for years and is administered by the Iowa Department of Education. Property tax rates and subsequent revenues are part of the Aid & Levy and can be adjusted with School Board approval, within limits defined by the State. The district developed a balanced budget, using all known factors. After the Aid & Levy is finalized in June, the district may amend the budget, if needed. Details of the initial Aid & Levy are included in the State and Local Funds: Aid & Levy worksheet.
Other sources of state revenues include grants from the Iowa Department of Education. State grants are usually determined in advance, and projections are based on grant documents.
State funds account for 61.0% of General Fund revenues.
Details on state revenues in the General Funds are included in the General Fund Revenues by Source: State schedule.
State, 61.0%
FY 2022 GENERAL FUND REVENUE SOURCES: STATE
2021 - 2022 Preliminary Budget 139

FY 2018 FY 2019 FY 2020 FY 2021Revenue Source Actual Actual Actual Re-estimated
Aid and Levy:State Foundation Aid 204,551,888$ 203,948,433$ 206,654,943$ 207,439,304$ Teacher Quality Act:
Teacher Salary Supplement 19,867,000 20,103,858 20,332,335 20,663,518Teacher Quality Professional Development 2,476,408 2,503,767 2,527,689 2,563,865Early Intervention Supplement 2,987,256 3,017,810 3,041,489 3,079,377
Universal 4 Year Old Preschool 5,161,268 5,206,928 5,311,360 5,670,200AEA Flow Through 14,751,903 14,914,998 15,108,730 15,424,026
Teacher Leadership Supplement 10,661,186 10,793,241 10,926,212 11,115,298Shelter Care Foster Care Aid 164,320 200,579 65,182 200,000Shelter Care Juvenile Home Aid 119,106 105,571 213,145 105,000Vocational Aid - 183,481 52,466 150,000Non-public Textbook Aid 39,776 42,931 40,593 43,000Non-public School Transportation Aid 413,753 420,561 408,892 425,000At Risk Early Elementary K-3 1,207,732 1,285,856 448,024 2,868,964Child Development - Age 3-5 302,472 296,819 296,366 296,000IA Arts Council 1,000 - - - Successful Progression Early Readers 271,219 277,828 275,027 272,259 Early Access SPED 93,238 88,919 95,687 98,241Miscellaneous 44,495 169,048 84,176 67,000
Total State Revenues 263,114,020$ 263,560,628$ 265,882,316$ 270,481,052$
DES MOINES PUBLIC SCHOOLS2021 - 2022 BUDGET
GENERAL FUND REVENUES BY SOURCE
STATE — HISTORICAL SUMMARY
2021 - 2022 Preliminary Budget 140

FY 2022 FY 2023 FY 2024 FY 2025Revenue Source Budget Projected Projected Projected
Aid and Levy:State Foundation Aid 207,782,000$ 208,043,000$ 208,307,000$ 208,574,000$ Teacher Quality Act:
Teacher Salary Supplement 20,499,000 20,704,000 20,911,000 21,120,000Teacher Quality Professional Development 2,539,000 2,564,000 2,590,000 2,615,000Early Intervention Supplement 3,043,000 3,073,000 3,104,000 3,135,000
Universal 4 Year Old Preschool 4,402,000 4,446,000 4,491,000 4,536,000AEA Flow Through 16,413,000 16,577,000 16,743,000 16,911,000
Teacher Leadership Supplement 11,038,000 11,148,000 11,260,000 11,373,000Shelter Care Foster Care Aid 202,000 204,000 206,000 208,000Shelter Care Juvenile Home Aid 106,000 107,000 108,000 109,000Vocational Aid 152,000 154,000 155,000 157,000Non-public Textbook Aid 43,000 43,000 44,000 44,000Non-public School Transportation Aid 429,000 433,000 438,000 442,000At Risk Early Elementary K-3 2,098,000 2,119,000 2,140,000 2,162,000Child Development - Age 3-5 299,000 302,000 305,000 308,000IA Arts Council - - - - Successful Progression Early Readers - - - - Early Access SPED 98,000 99,000 100,000 101,000Miscellaneous 67,000 68,000 68,000 69,000
Total State Revenues 269,209,000$ 270,085,000$ 270,970,000$ 271,863,000$
GENERAL FUND REVENUES BY SOURCE
STATE — BUDGET AND PROJECTIONS
DES MOINES PUBLIC SCHOOLS2021 - 2022 BUDGET
2021 - 2022 Preliminary Budget 141

FY 2021 FY 2022 New Dollars
District Dollars SummaryTotal Combined District Dollars 349,276,379$ 351,136,402$ 1,860,023$ Less: AEA Flow-through 15,424,026 16,413,243 989,217
Sub-Total District Dollars 333,852,353 334,723,159 870,806Instructional Support 14,616,094 16,137,134 1,521,040
Total District Dollars 348,468,447 350,860,293 2,391,846
Special Weighted ProgramsSpecial Education 42,742,614 41,657,147 (1,085,467)Instructional Support 14,616,094 14,820,678 204,584Dropout Prevention 11,311,264 11,219,308 (91,956)Supplemental Weighting 10,912,945 10,733,732 (179,213)
Special Program Subtotal 79,582,917 78,430,865 (1,152,052)
Gifted and Talented 2,797,977 2,865,128 67,151Regular Program Dollars 228,579,166 230,825,786 2,246,620
Regular Program Subtotal 231,377,143 233,690,914 2,313,771
Categorical Fund Roll-InTeacher Quality Compensation 20,663,518 20,498,637 (164,881)Educational Excellence Phase II (included in Teacher Quality Compensation)
Teacher Quality Professional Development 2,563,865 2,538,574 (25,291)Iowa Core Curriculum Professional Development (included in Teacher Quality Professional Development)
Class Size/Early Intervention Block Grant 3,079,377 3,042,937 (36,440)
Audit Enrollment Adjustment - - -
Total District Dollars 337,266,820$ 338,201,927$ 935,107$
Reserved For:Special Education (1,085,467)$
Instructional Support 204,584Dropout Prevention (91,956)
Supplemental Weighting (179,213)Teacher Quality Compensation (164,881)
Teacher Quality Professional Development (25,291)Class Size/Early Intervention Block Grant (36,440)
Total Reserved for Specific Purpose (1,378,664)
Dollars Remaining After Reservations 2,313,771
Less:Local Match - Talented/Gifted & DOP 87,581
Dollars Remaining 2,226,190$
DES MOINES PUBLIC SCHOOLS2021 - 2022 BUDGET
STATE AND LOCAL FUNDS: AID & LEVY WORKSHEET
2021 - 2022 Preliminary Budget 142

General Fund Revenues: Local Funds, Including Property Taxes The second largest source of General Funds is from local revenues, which comprises 29.5% of all General Fund revenues.
Details on local revenues in the General Funds are included in the General Fund Revenues by Source: Local schedule.
The primary local revenue source is property taxes, and in FY 2022 property taxes are projected to account for 23.3% of all General Fund revenues. The School Board must vote on and approve the district’s tax rate.
Local Funds, 29.5%
FY 2022 GENERAL FUND REVENUE SOURCES: LOCAL
0%
25%
50%
75%
100%
FY 2012 FY 2013 FY 2014 FY 2015 FY 2016 FY 2017 FY 2018 FY 2019 FY 2020 FY 2021 FY 2022
GENERAL FUND DOLLARS GENERATED FROM PROPERTY TAXES
All Other General Fund Sources Property Taxes
2021 - 2022 Preliminary Budget 143

Per the Aid & Levy report, the district property tax rates for FY 2018 – FY 2021 and the projected FY 2022 (per the preliminary Aid & Levy) are:
District Property Tax Rates FY 2018
FY 2019
FY 2020
FY 2021
FY 2022
Total Tax Rate 18.56349 18.60074 18.60686 18.61192 16.08128
Details on the components of the tax rate are included on the Local Funds: Property Tax Rates schedule.
To ensure a budget that meets the district’s needs and provides adequate programming for students, the district is proposing a tax rate of $16.08128, which is $2.53064 lower than the FY 2021 rate.
District Property Overall Recommended Tax Rate Authority FY 2021 FY 2022 Max. Expires GENERAL Regular Instructional Support Dropout Prevention Cash Reserve Levy
Code Citizen Vote OR Board Action Board Action Board Action
8.86861 1.57233 1.36388 2.47182
9.08252 1.56358 1.27117 0.00000
NA 10% of cost 5% of cost 20%
NA 2021 Annual Annual
MANAGEMENT Board Action 3.24028 2.25901 NA Annual PPEL Regular Voted
Board Action Citizen Vote
0.33000 0.63000
0.33000 1.34000
0.330 1.340
Annual 2021
PERL Citizen Vote 0.13500 0.13500 0.135 NA DEBT SERVICE Citizen Vote 0.00000 0.00000 4.050 NA TOTAL 18.61192 16.08128
Change From Prior Year ($2.53064)
Per the Aid and Levy, the tax rate is based on a per $1,000 of assessed valuation in most instances, as determined by the State of Iowa.
$0
$5
$10
$15
$20
$25
$30
FY 2013 FY 2014 FY 2015 FY 2016 FY 2017 FY 2018 FY 2019 FY 2020 FY 2021 FY 2022(budget)
ANNUAL PROPERTY TAX RATE
2021 - 2022 Preliminary Budget 144

Using a $100,000 home as an example, the average taxpayer would have the following annual obligation:
Calculation: FY 2018 FY 2019 FY 2020 FY 2021 FY 2022 $100,000 home value
$1,000 = 100 x Annual Tax Rate $ 1,856.35 $ 1,860.07 $ 1,860.69 $ 1,861.19 $ 1,608.13
Details on the components of the property valuations within the district are included on the Local Funds: Property Valuations schedule.
The value of property is established by a County Assessor (or the Iowa Department of Revenue) estimating the value of each property, which is called the assessed value. Residential, commercial, and industrial real estate is assessed at 100% of market value, and the Assessor must determine the fair market value of the property. To do this, the Assessor generally uses three approaches:
• Market Approach: Analyze sales of similar properties that were recently sold and determine the most probable sales price of the property being appraised.
• Cost Approach: Estimate how much money at current labor and material prices it would take to replace the property with one similar to it. This is useful when no sales of comparable properties exist.
• Income Approach: If the property produces income, such as an apartment or office building, estimate its ability to produce income.
Agricultural real estate is assessed at 100% of productivity and net earning capacity value. The Assessor considers the productivity and net earning capacity of the property. Agricultural income as reflected by production, prices, expenses, and various local conditions is taken into account. The utilities/railroad class of property is assessed at the state level.
The Assessor totals the assessed value in each classification (residential, commercial, industrial, agricultural, or utilities/railroad) and reports it to the County Auditor. Each Assessor sends the reports — called abstracts — to the Iowa Department of Revenue. The abstract shows the total taxable values of all real property in each jurisdiction by classification of property, not by individual property. The state then examines total assessed values and equalizes them. The equalization process is applied every two years to ensure that property values are comparable among jurisdictions and according to law. The state compares the Assessors’ abstracts to a sales assessment ratio study it has completed independently of the Assessors. If the assessment (by property class) is 5% or more above or below the sales ratio study, the state increases or decreases the assessment. There is no sales ratio study for agricultural and industrial property. Equalization occurs on an entire class of property, not on an individual property. Also, equalization occurs on an assessing jurisdiction basis, not on a statewide basis. Equalization is important as it helps maintain equitable assessments among classes of property and among assessing jurisdictions. This contributes to a fairer distribution of state aid, such as aid to schools. It also helps to equally distribute the total tax burden within an area. In addition, an assessment limitation is applied every year. This process is commonly called rollback and is used to adjust for inflation.
2021 - 2022 Preliminary Budget 145

FY 2018 FY 2019 FY 2020 FY 2021Revenue Source Actual Actual Actual Re-estimated
Property Taxes: 95,934,466$ 102,442,060$ 103,862,348$ 102,926,865$ Instructional Support Property Tax 13,904,457 14,298,221 14,301,166 14,300,125 Utility Replacement Tax 3,053,514 2,896,621 2,856,031 2,751,981 Mobile Home Tax 93,411 97,033 92,233 103,767 Military Credit 27,334 25,519 24,290 24,500 Commercial & Industrial Replacement 4,210,659 4,325,577 4,307,639 4,496,286
Tuition:Regular Program & Preschool 809,537 827,336 699,138 850,000Special Education 2,245,528 2,457,892 2,433,231 1,789,825Open Enrollment 4,293,529 4,438,196 4,342,172 4,560,000Sharing Arrangements 257,967 219,338 147,455 220,000
Transportation 828,351 768,993 768,993 650,000Investment Income 1,771,399 3,498,790 3,670,173 1,300,000Textbook Fees 302,312 323,580 308,717 280,000Rental Fees 225,066 219,021 172,315 50,000Student Activities 86,375 59,280 21,663 50,000Contributions and Donations 1,426,494 1,165,263 1,447,377 1,100,000United Way of Central Iowa 955,048 953,473 953,473 912,000Prairie Meadows 480,585 513,408 518,475 - Area Education Agency 9,492,748 9,508,029 9,712,614 9,848,000Refund of Prior Year Expenditures 20,451 1,584 20,383 5,000Miscellaneous 872,534 1,153,304 4,419,929 1,150,000
Total Local Revenues 141,291,765$ 150,192,518$ 155,079,815$ 147,368,349$
LOCAL — HISTORICAL SUMMARY
DES MOINES PUBLIC SCHOOLS2021 - 2022 BUDGET
GENERAL FUND REVENUES BY SOURCE
2021 - 2022 Preliminary Budget 146

FY 2022 FY 2023 FY 2024 FY 2025Revenue Source Budget Projected Projected Projected
Property Taxes: 85,909,000$ 86,768,000$ 87,636,000$ 88,512,000$ Instructional Support Property Tax 14,538,000 14,683,000 14,830,000 14,978,000 Utility Replacement Tax 2,154,000 2,175,000 2,197,000 2,219,000 Mobile Home Tax 90,000 91,000 92,000 93,000 Military Credit 25,000 25,000 25,000 25,000 Commercial & Industrial Replacement 4,673,000 4,720,000 4,767,000 4,815,000
Tuition:Regular Program & Preschool 859,000 868,000 877,000 886,000Special Education 1,808,000 1,826,000 1,844,000 1,862,000Open Enrollment 4,606,000 4,652,000 4,699,000 4,746,000Sharing Arrangements 222,000 224,000 226,000 228,000
Transportation 657,000 664,000 671,000 678,000 Investment Income 250,000 253,000 256,000 259,000Textbook Fees 283,000 286,000 289,000 292,000Rental Fees 170,000 172,000 174,000 176,000Student Activities 51,000 52,000 53,000 54,000Contributions and Donations 1,111,000 1,122,000 1,133,000 1,144,000United Way of Central Iowa 921,000 930,000 939,000 948,000Prairie Meadows 500,000 505,000 510,000 515,000Area Education Agency 9,946,000 10,045,000 10,145,000 10,246,000Refund of Prior Year Expenditures 5,000 5,000 5,000 5,000Miscellaneous 1,500,000 1,515,000 1,530,000 1,545,000
Total Local Revenues 130,278,000$ 131,581,000$ 132,898,000$ 134,226,000$
DES MOINES PUBLIC SCHOOLS2021 - 2022 BUDGET
GENERAL FUND REVENUES BY SOURCE
LOCAL — BUDGET AND PROJECTIONS
2021 - 2022 Preliminary Budget 147

Regular Valuation (with Utilities) 6,896,129,735$ 1.76% 7,410,150,207$ 7.45% 7,715,762,964$ 4.12% 8,293,471,718$ 7.49%TIF Valuation 765,374,658 7.79% 897,768,845 17.30% 873,554,703 (2.70%) 1,002,372,633 14.75%Regular and TIF Valuation 7,661,504,393$ 2.33% 8,307,919,052$ 8.44% 8,589,317,667$ 3.39% 9,295,844,351$ 8.23%
Dollars Generated Tax Rate Dollars Generated Tax Rate Dollars Generated Tax Rate Dollars Generated Tax RateGeneral:
Regular Program 64,651,494$ 9.37504 68,556,542$ 9.25171 70,250,411$ 8.94697 73,551,572$ 8.86861 Instructional Support 13,463,025 1.75723 13,822,550 1.66378 14,031,509 1.63360 14,616,135 1.57233 Dropout Prevention 10,980,425 1.59226 11,127,121 1.50161 8,849,106 1.14689 11,311,264 1.36388 Cash Reserve 23,750,000 3.44396 25,851,400 3.48865 29,525,000 3.98440 20,500,000 2.47182
Total General 112,844,944 16.16849 119,357,613 15.90574 122,656,026 15.71186 119,978,971 14.27664
Management 8,965,000 1.30000 11,856,275 1.60000 13,888,373 1.80000 26,873,171 3.24028
PPEL:Regular 2,528,296 0.33000 2,741,613 0.33000 2,834,475 0.33000 3,067,629 0.33000 Voted 4,826,748 0.63000 5,233,989 0.63000 5,411,270 0.63000 5,856,382 0.63000
Total PPEL 7,355,044 0.96000 7,975,602 0.96000 8,245,745 0.96000 8,924,011 0.96000
PERL 930,978 0.13500 1,000,370 0.13500 1,041,628 0.13500 1,119,619 0.13500
Debt Service - - - - - - - -
Total 130,095,966$ 18.56349 140,189,860$ 18.60074 145,831,772$ 18.60686 156,895,772$ 18.61192
Increase 0.05763$ Increase 0.03725$ Increase 0.00612$ Increase 0.00506$
Regular Valuation (with Utilities) 8,478,139,579$ 2.23% 8,562,921,000$ 1.00% 8,648,550,000$ 1.00% 8,735,036,000$ 1.00%TIF Valuation 1,000,524,071 (0.18%) 990,519,000 (1.00%) 980,614,000 (1.00%) 970,808,000 (1.00%)Regular and TIF Valuation 9,478,663,650$ 1.97% 9,553,440,000$ 0.79% 9,629,164,000$ 0.79% 9,705,844,000$ 0.80%
Dollars Generated Tax Rate Dollars Generated Tax Rate Dollars Generated Tax Rate Dollars Generated Tax RateGeneral:
Regular Program 76,843,331$ 9.08252 77,773,000$ 9.08252 78,551,000$ 9.08252 79,336,000$ 9.08252 Instructional Support 14,538,103 1.56358 14,938,000 1.56358 15,056,000 1.56358 15,176,000 1.56358 Dropout Prevention 11,219,308 1.27117 11,244,000 1.27117 11,340,000 1.27117 11,438,000 1.27117 Cash Reserve - - - - - - - -
Total General 102,600,742 11.91727 103,955,000 11.91727 104,947,000 11.91727 105,950,000 11.91727
Management 20,000,000 2.35901 20,000,000 2.35901 20,000,000 2.35901 20,000,000 2.35901
PPEL:Regular 3,127,959 0.33000 3,153,000 0.33000 3,178,000 0.33000 3,203,000 0.33000 Voted 12,701,409 1.34000 12,802,000 1.34000 12,903,000 1.34000 13,006,000 1.34000
Total PPEL 15,829,368 1.67000 15,955,000 1.67000 16,081,000 1.67000 16,209,000 1.67000
PERL 1,144,549 0.13500 1,290,000 0.13500 1,300,000 0.13500 1,310,000 0.13500
Debt Service - - - - - - - -
Total 139,574,659$ 16.08128 141,200,000$ 16.08128 142,328,000$ 16.08128 143,469,000$ 16.08128
Decrease (2.53064)$ Flat -$ Flat -$ Flat -$
Preliminary Aid and Levy
FY 2018 FY 2021FY 2020Per Final Aid and LevyPer Final Aid and LevyPer Final Aid and Levy Per Final Aid and Levy
FY 2019
Estimated EstimatedFY 2025
EstimatedFY 2022 FY 2023 FY 2024
DES MOINES PUBLIC SCHOOLS2021 - 2022 BUDGET
LOCAL FUNDS: PROPERTY TAX RATES — HISTORICAL SUMMARY, BUDGET, AND PROJECTIONS
2021 - 2022 Preliminary Budget 148

Polk County Warren County Total Polk Warren Total Polk Warren Total
Residential 5,367,177,741$ 66,732,362$ 5,433,910,103$ 5,479,334,573$ 69,286,080$ 5,548,620,653$ 2.1% 3.8% 2.1%Commercial 2,422,048,834 2,344,950 2,424,393,784 2,488,199,304 2,492,245 2,490,691,549 2.7% 6.3% 2.7%Industrial 203,210,911 - 203,210,911 222,588,246 - 222,588,246 9.5% NA 9.5%Agricultural 2,374,242 1,545,814 3,920,056 2,540,832 1,467,372 4,008,204 7.0% (5.1%) 2.2%Utilities (WO Gas & Electric) 24,056,056 717,137 24,773,193 18,483,410 659,241 19,142,651 (23.2%) (8.1%) (22.7%)Railroads 21,432,185 - 21,432,185 22,618,481 - 22,618,481 5.5% NA 5.5%
Total Valuation 8,040,299,969 71,340,263 8,111,640,232 8,233,764,846 73,904,938 8,307,669,784 2.4% 3.6% 2.4%Less: Military 10,681,410 248,168 10,929,578 9,990,445 244,191 10,234,636 (6.5%) (1.6%) (6.4%)Plus: Gas & Electric 188,420,325 4,340,739 192,761,064 176,605,624 4,098,807 180,704,431 (6.3%) (5.6%) (6.3%)
Total General Taxable Valuation 8,218,038,884 75,432,834 8,293,471,718 8,400,380,025 77,759,554 8,478,139,579 2.2% 3.1% 2.2%TIF Value 1,002,372,633 - 1,002,372,633 1,000,524,071 - 1,000,524,071 (0.2%) NA (0.2%)
Total Debt & PPEL Taxable Valuation 9,220,411,517$ 75,432,834$ 9,295,844,351$ 9,400,904,096$ 77,759,554$ 9,478,663,650$ 2.0% 3.1% 2.0%
DES MOINES PUBLIC SCHOOLS2021 - 2022 BUDGET
LOCAL FUNDS: PROPERTY VALUATIONS — PREVIOUS YEAR AND BUDGET YEAR
1/1/2020FY 2022 One Year ChangeFY 2021
1/1/2019
2021 - 2022 Preliminary Budget 149

General Fund Revenues: Federal Funds Federal funds are the third largest source of General Fund revenues.
Federal funds include title funds, special education funds, and various grants. In many cases, federal funds and grants cover multiple years and levels of funding, as defined in program and grant documents. Revenue projections are based on documentation and expected additions or discontinuance of specific programs and grants.
In FY 2022, federal funds are projected to comprise 9.4% of General Fund revenues. This is an increase over previous years, due primarily to federal funds received in response to the COVID-19 pandemic (e.g., ESSER, GEER, and FEMA)
Details on federal revenues in the General Funds are included in the General Fund Revenues by Source: Federal schedule.
Federal, 9.4%
FY 2022 GENERAL FUND REVENUE SOURCES: FEDERAL
2021 - 2022 Preliminary Budget 150

FY 2018 FY 2019 FY 2020 FY 2021Revenue Source Actual Actual Actual Re-estimated
Title I 14,844,628$ 12,809,582$ 12,723,002$ 15,213,824$ Title I Migrant - - 3,323 66,640 Title II 2,182,811 1,594,355 1,151,584 1,769,000 Title III - ELL/LEP 931,366 907,681 465,343 1,416,000 Title I School Improvement Funds 2,087,759 2,261,218 305,728 1,186,000 Title IV - 580,842 352,183 858,000 Title IV Foster Care Transportation - 49,679 - - FEMA - - - 250,000 ESSER1 cares act - - 8,875,060 840,000 GEER1 cares act - - - 1,233,572 ESSER2 crrsa act - - - 1,000,000 Special Education IDEA/Part B 8,124,116 8,271,428 8,454,226 8,650,000 Special Education - Preschool 165,239 152,780 140,744 154,274 Special Education - Infants/Disabilities 167,598 167,599 174,953 174,953 21st Century Community 1,269,364 1,123,088 1,017,580 1,297,000 AmeriCorp 279,861 277,002 132,746 - Basics Grant 188,856 175,960 170,137 190,290 Carl D. Perkins 519,898 472,933 232,294 520,645 Education for Homeless 40,000 40,000 36,943 36,943 Full Service Community Grant - 223,557 420,300 499,404 Gear Up Iowa 321,469 295,374 227,623 40,671 Head Start 1,891,253 2,140,515 1,482,413 2,093,000 High Cost Fund 101,689 - - - Immigrant Education 70,140 - - - Medicaid Direct Billing 3,555,045 3,160,089 1,875,824 1,500,000 Project Search 79,999 77,254 83,044 77,000 Refugee Grant 43,515 136,485 266 - ROTC 100,173 128,439 170,536 150,000 School Climate 533,873 593,141 100,914 - School Wellness 16,452 2,291 748 - Miscellaneous 59,961 213,531 17,900 63,904
Total Federal Revenues 37,575,065$ 35,854,823$ 38,615,413$ 39,281,120$
DES MOINES PUBLIC SCHOOLS2021 - 2022 BUDGET
GENERAL FUND REVENUES BY SOURCE
FEDERAL — HISTORICAL SUMMARY
2021 - 2022 Preliminary Budget 151

FY 2022 FY 2023 FY 2024 FY 2025Revenue Source Budget Projected Projected Projected
Title I 15,366,000$ 15,520,000$ 15,675,000$ 15,832,000$ Title I Migrant 67,000 68,000 69,000 69,000 Title II 1,787,000 1,805,000 1,823,000 1,841,000 Title III - ELL/LEP 1,430,000 1,444,000 1,459,000 1,473,000 Title I School Improvement Funds 1,198,000 1,210,000 1,222,000 1,234,000 Title IV 867,000 875,000 884,000 893,000 Title IV Foster Care Transportation - - - - FEMA - - - - ESSER1 cares act 200,000 - - - GEER1 cares act - - - - ESSER2 crrsa act 5,000,000 5,000,000 - - Special Education IDEA/Part B 8,737,000 8,824,000 8,912,000 9,001,000 Special Education - Preschool 156,000 157,000 159,000 161,000 Special Education - Infants/Disabilities 177,000 178,000 180,000 182,000 21st Century Community 1,310,000 1,323,000 1,336,000 1,350,000 AmeriCorp - - - - Basics Grant 192,000 194,000 196,000 198,000 Carl D. Perkins 526,000 531,000 536,000 542,000 Education for Homeless 37,000 38,000 38,000 38,000 Full Service Community Grant 504,000 509,000 515,000 520,000 Gear Up Iowa - - - - Head Start 2,114,000 2,135,000 2,156,000 2,178,000 High Cost Fund - - - - Immigrant Education - - - - Medicaid Direct Billing 1,515,000 1,530,000 1,545,000 1,561,000 Project Search 78,000 79,000 79,000 80,000 Refugee Grant - - - - ROTC 152,000 153,000 155,000 156,000 School Climate - - - - School Wellness - - - - Miscellaneous 65,000 65,000 66,000 66,000
Total Federal Revenues 41,476,000$ 41,639,000$ 37,005,000$ 37,375,000$
DES MOINES PUBLIC SCHOOLS2021 - 2022 BUDGET
GENERAL FUND REVENUES BY SOURCE
FEDERAL — BUDGET AND PROJECTIONS
2021 - 2022 Preliminary Budget 152

General Fund Revenues: Intermediary Funds The final, and smallest, source of General Fund revenues comes from intermediary sources. Intermediary sources of revenue are generally received from other local government agencies with fundraising and revenue generation potential that operate between the state and local government levels.
Intermediary sources comprise 0.1% of the district’s budgeted General Fund revenues for FY 2022.
Details on intermediary revenues in the General Funds are included in the General Fund Revenues by Source: Intermediary Sources schedule.
Intermediary, 0.1%
FY 2022 GENERAL FUND REVENUE SOURCES: INTERMEDIARY
2021 - 2022 Preliminary Budget 153

FY 2018 FY 2019 FY 2020 FY 2021Revenue Source Actual Actual Actual Re-estimated
Community Betterment 12,560$ 17,202$ 4,800$ -$ Early Childhood Iowa 548,700 570,097 485,195 450,000Grants Through Area Education Agency 255,167 252,438 259,897 167,000
Total Intermediary Revenues 816,427$ 839,737$ 749,892$ 617,000$
DES MOINES PUBLIC SCHOOLS2021 - 2022 BUDGET
GENERAL FUND REVENUES BY SOURCE
INTERMEDIARY — HISTORICAL SUMMARY
2021 - 2022 Preliminary Budget 154

FY 2022 FY 2023 FY 2024 FY 2025Revenue Source Budget Projected Projected Projected
Community Betterment -$ -$ -$ -$ Early Childhood Iowa 455,000 460,000 465,000 470,000Grants Through Area Education Agency 167,000 169,000 171,000 173,000
Total Intermediary Revenues 622,000$ 629,000$ 636,000$ 643,000$
DES MOINES PUBLIC SCHOOLS2021 - 2022 BUDGET
GENERAL FUND REVENUES BY SOURCE
INTERMEDIARY — BUDGET AND PROJECTIONS
2021 - 2022 Preliminary Budget 155

SPECIAL REVENUE FUND
The Special Revenue Fund is used to account for the proceeds of specific revenue sources (other than certain trusts or SAVE capital projects) that are legally restricted to expenditures for specified purposes. Revenue derived for the Management, PPEL, and PERL funds is based upon the property tax rates per the Aid & Levy. Student Activity Fund revenue is derived from fees and transactions that occur on account of student-related activities from groups and organizations such as athletic events, fundraising, and other extracurricular or co-curricular activities. Governmental Trust revenue is derived from the principal and/or interest earned by trusts established to support the district.
Budgeted Revenue & Expenses
The Special Revenue Fund accounts for 7.3% of all FY 2022 budgeted revenues and 6.4% of all FY 2022 budgeted expenses.
7.3% of Total Revenues
6.4% of Total Expenditures
The budgeted Special Revenue Fund expenditures (by function) for FY 2022 encompasses:
SPECIAL REVENUE EXPENDITURES, BY FUNCTION
Instruction, 46.0%
Student Support, 19.9%
Plant Operations, 14.5%
Facilities Acquisition/Construction, 10.7%
Central Administration, 6.7%
Non-Instruction, 2.2%
2021 - 2022 Preliminary Budget 156

CAPITAL PROJECTS FUND
The Capital Projects Fund is funded primarily by a statewide penny sales tax; all funds are used for projects in accordance with the district’s revenue purpose statement. Additionally, revenues for the Capital Projects Fund come from earnings on investments, other revenue from local sources, and general long-term debt proceeds.
Budgeted Revenue & Expenses
The Capital Projects Fund accounts for 5.8% of all FY 2022 budgeted revenues and 9.8% of all FY 2022 budgeted expenses.
5.8% of Total Revenues
9.8% of Total Expenditures
The budgeted Capital Projects Fund expenditures (by function) for FY 2022 encompasses:
CAPITAL PROJECTS EXPENDITURES, BY FUNCTION
Facilities Acquisition and Construction, 59.2%Transfers Out, 40.8%
2021 - 2022 Preliminary Budget 157

DEBT SERVICE FUND
Proceeds are transferred into the Debt Service Fund from the SAVE Fund pertaining to revenue bonds issued for the SAVE projects. The Debt Service Fund accounts for and reports financial resources that are restricted, committed, or assigned to expenditure for principal and interest.
Budgeted Revenue & Expenses
The Debt Service Fund accounts for 4.1% of all FY 2022 budgeted revenues and 4.0% of all FY 2022 budgeted expenses.
4.1% of Total Revenues
4.0% of Total Expenditures
The budgeted Debt Service Fund expenditures (by function) for FY 2022 encompasses:
DEBT SERVICES EXPENDITURES, BY FUNCTION
Debt Service, 100%
2021 - 2022 Preliminary Budget 158

ENTERPRISE FUND
Enterprise Funds rely on fees, donations, and federal grants for funding. Revenue projections in the Enterprise Fund are based on participation levels and proposed fee increases.
Budgeted Revenue & Expenses
The Enterprise Fund accounts for 4.3% of all FY 2022 budgeted revenues and 4.2% of all FY 2022 budgeted expenses.
4.3% of Total Revenues
4.2% of Total Expenditures
The budgeted Enterprise Fund expenditures (by function) for FY 2022 encompasses:
ENTERPRISE EXPENDITURES, BY FUNCTION
Non-Instruction, 100%
2021 - 2022 Preliminary Budget 159

LONG-RANGE FINANCIAL PLANS
PURPOSE
There is a two-part purpose for long-range financial planning. First, it provides a forward looking view of the General Fund operating budget, which is the fund that accounts for 78.5% of all revenues received by the district and has the least expenditure restrictions. It is from this account that the majority of salaries are funded. With a forward-thinking view, the Board and the district are able to evaluate the long-term sustainability of the annual operating budget. Second, long-range planning provides a reference point for future budgetary decisions budget by weighting potential spending needs and projected revenue.
The long-range forecast, which projects General Fund revenues and expenses for the budget year plus an additional three years based on a series of assumptions, is a key tool used for financial planning. Multi-year financial planning can potentially avoid the budgetary cycle of simply putting out the next fire by providing a longer term perspective on what problems are coming and thus preventing or minimizing them. Multi-year budgeting can also end the “us vs. them” dynamic that can plague the budget process. Multi-year planning helps build understanding and consensus for change in the district. Long-term forecasting helps the district budget for areas of operation to implement achieve Student Expectations, while staying within budget parameters set by the Board of Directors. The Business & Finance department reviews financial data on daily, monthly, quarterly, and annual basis. If an analysis determines that an initiative is not effective, corrective steps are taken. The Business & Finance department also completes and presents quarterly monitoring reports to the Board to demonstrate the district’s fiscal condition.
Approach The following guidelines from the GFOA steered the development of the district’s long-range financial plans:
1. Baseline Assessment — What is the current fiscal/financial condition, and, after careful analysis of revenue and expenditure trends and related budget drivers, what is the fiscal/financial condition likely to be in the future if no policy changes or corrective actions are made? • The baselines assessment helps to:
o Communicate a clear picture of the district’s financial strengths, weaknesses, and potential future with no corrective action.
o Quantify the impact of key budget drivers. o Identify hidden and emerging problems. o Provide a framework for addressing intermediate and longer-range considerations in
budget discussions.
2021 - 2022 Preliminary Budget 160

2. Initiatives Development — Given this baseline assessment, what initiatives (on both the expenditure and revenue side of the budget) should be pursued, and what are the fiscal implications of those initiatives? • The multi-year planning process includes development of a menu of options, generally
quantified, that represent the best available approach to achieving and maintaining balance. Approaches would typically involve some (or all) of the following: o Workforce strategy. o Management and productivity initiatives (e.g., transportation, facilities, technology). o Program prioritization. o State legislative agenda. o Tax rates and cost recovery. o Debt management.
3. Implementation — What institutional/organizational measures will ensure that initiatives are put in place? What performance measures are appropriate to monitor the success of these initiatives, and are the necessary data collections/systems in place? Revisit and revise based on results. • Once a plan has been adopted and implementation of initiatives has begun, it is
important to find practical ways to do the following: o Measure: “That which gets measured gets done.” What are the performance
measures that track the progress made toward implementing an initiative? How do you measure whether the initiative had the desired impact(s)?
o Monitor: What are the most effective way to communicate with staff in charge of implementing changes to discuss challenges, successes and failures? How will those lessons and the progress achieved be communicated?
o Manage: It is okay to change strategies mid-course as the nature of the problem, available resource levels, etc. change. Measurement and monitoring will indicate when those changes are appropriate.
2021 - 2022 Preliminary Budget 161

KEY ISSUES
The district is facing significant financial issues that must be addressed to maintain the long-term financial health of the district, while continuing to take steps to improve student outcomes. One of the priorities of the school district is to maintain a vital, fiscally sound organization so that students continue receive education in a robust, supportive environment that is conducive to teaching and learning. The district strives to make student-centered decisions in all areas of operation.
Maintaining the financial health of the district is accomplished through a variety of factors including: (1) Maintaining a spending authority ratio within the recommended guidelines. (2) Maintaining a solvency ratio within the recommended guidelines. (3) Following GFOA recommendations of 60 days of cash reserves on hand. (4) Managing the district’s investment portfolio and debt. (5) Conducting trend/forecast analysis including the various impacts tax rates can have on the district.
To maintain long-term financial health, current expenditures should not exceed current revenues. Consequently, the district must make strategic decisions to align expenditures with revenues in the most effective and efficient way possible. There are two, associated dynamics spurring these efforts: the district’s Spending Authority and the amount of Supplemental State Aid received from the state.
Spending Authority Iowa uses a school finance formula that sets the maximum amount a district is authorized to spend and certify on a budget for a fiscal year. A district’s spending authority is the sum of the district’s combined cost and miscellaneous income for the budget year plus the unspent balance from the previous year. Under the spending authority control, it is illegal for a school district to exceed its maximum authorized budget. It is important to understand that the limit on spending is the amount of spending authority a district has, not the amount of cash or fund balance a district has.
The unspent spending authority ratio is a measure of the district’s unbudgeted authorized spending capacity (not cash reserves) and is defined as the district’s unspent spending authority divided by the district’s maximum budget authority. The IASB recommends this ratio be in the target range of 10-20%. The Board adopted guidelines in FY 2012 setting the target for the district’s unspent spending authority ratio at 10%; in 2015 the Board raised this target to 15%.
Spending authority is directly tied to student enrollment, and there are only three general means by which the district’s spending authority can grow:
(1) increased State Supplemental Aid (2) increased enrollment (3) increased miscellaneous income.
2021 - 2022 Preliminary Budget 162

Supplemental State Aid The General Fund is the largest fund in the district and accounts for 78.5% of all revenues received by the district. The sources General Fund of revenue are state funds, local funds (including property tax), federal funds, and intermediary sources. Collectively, 90.5% of General Fund revenue comes from state or local sources (61.0% and 29.5%, respectively). The majority of those dollars are driven by the State Foundation Formula, growth of which is controlled by Supplemental State Aid. Supplemental State Aid is the annual percent of growth that is calculated into the foundation formula.
Supplemental State Aid has been abysmal over the past decade. Given the political climate in the state, the real fear is that 0-2% Supplemental State Aid is the “new normal” school district are facing, and the years of regular 4% increases to Supplemental State Aid are a thing of the past. School districts have also experienced an increase in categorical funding from the state (such as TLC funding) that can only be spent on certain programs, not for general education purposes. Supplemental State Aid is vital as costs paid for with General Fund dollars — such as health care, other compensation components, fuel costs, and cost of goods and services — continue to rise.
Compensation — salaries and benefits — is the largest of all budgeted expenditures in the General Fund. The issue of compensation has several key components including cost of living for employees, rising health care costs, sustainability of the workforce, and maintaining effective programing. To address this key issue, the district has a multi-faceted approach. For example, the district conducts comprehensive negotiations with employees, conducts extensive training for staff, and is implementing a district-wide wellness program.
The district is focused on finding ways to do more with less and directing funds toward costs that impact students. The district has pursued multiple ways to address rising costs of goods and services including paper reduction strategies, system integration, data analysis, and energy savings.
Solvency Ratio The district’s solvency ratio is a moment-in-time (June 30) measurement of the district’s General Fund financial health. The solvency ratio is measure of the district’s fund equity position and is defined as the unreserved, undesignated fund balance (commonly referred to as the cash reserves) divided by the district’s total General Fund revenues, less AEA flow-through.
The Iowa Association of School Boards (IASB) considers a solvency ratio of 5-10% within “Target” or “Good” and therefore “can handle the unexpected.” GFOA guidelines are 10-17%. During the 2012-13 school year, the School Board approved a minimum target of 15.0% for the district’s solvency ratio. Board guidelines state that the solvency ratio should not go below 3%, without prior knowledge of the Board. The solvency ratio for the district increased at year end 2020 to 21.0%, up from 15.1% the prior year. The solvency ratio for FY 2021 is projected to end at 25.4%, and the solvency ratio is forecasted to be at 27.5% for FY 2022.
2021 - 2022 Preliminary Budget 163

GENERAL FUND FISCAL OUTLOOK THROUGH FY 2025
In FY 2017, the district’s forecasting model indicated that if Supplemental State Aid continued to grow by 1%, as had been the trend, by 2019, expenses would exceed Spending Authority by more than $5 million (and rising) each year, if changes were not made. Consequently, the district cut expenditures for three years to stay within compliance of the spending authority function.
To develop the budget for FY 2020 and beyond, the district modeled out numerous scenarios that outlined the impact Supplemental State Aid, inflation, compensation, and expenditure reductions have on district’s unspent authorized budget. Thereafter, the district settled on one set of likely variables and modeled out multiple scenarios with the focus on returning the district to a Spending Authority Ratio that meets the Board’s target of 15%. Based on those models, the district resolved to implement aggressive expenditure reductions spread over a number of years to reach the Board target.
FY 2022 is the third year of the planned expenditure reductions. Each year, the district has evaluated the need for and the amount of reductions to be made. The original strategy was to cut $24 million for three consecutive fiscal years. The district revised its strategy in FY 2021 to be a $24 million reduction in year one, followed by $14 million in reductions for the next three years. After making the aggressive expenditure reductions in FY 2020 and FY 2021, the district was on track to reach the Board Target.
Going into budget planning for FY 2022, the district again reviewed conditions to determine if things had improved, deteriorated, or remained unchanged to determine adjustments to targets and goals for the district’s budget and Spending Authority. While the district was on-track to meet the Board target for Spending Authority, the COVID-19 pandemic began, impacting all areas of district operation, including student enrollment. As a direct result of COVID-19, the district is down approximately 1,000 students; in addition, the Iowa Legislature put forth bills that could directly impact enrollment in Des Moines. The enrollment decline in 2020-21 was the largest single decrease in decades and will impact the district in FY 2022 and potentially for years beyond. While final enrollment for FY 2021-22 and beyond is unknown, the district modeled various scenarios on the potential impact. The most likely scenario is built into the district’s long-term forecast, and the district continued to evaluate conditions and adjust accordingly while planning for FY 2022. Given all currently financial conditions, the district will reduce $15 million in expenditures for FY 2022, with $14 million in reductions thereafter.
The CFO convened a working group that met to develop recommendations that were presented to the Chiefs of how to reach the target. The goal of the Advisory Team was to provide recommendations with minimal impact to students and employees. The approach to reach budget targets was to consider both cost reductions and revenue generating ideas, while keeping the financial targets in mind. In addition to reductions, the district has planned new expenses that had not been previously identified related to achieving the Board’s SMART goals. The CFO presented this to Chiefs; that group made final decision.
2021 - 2022 Preliminary Budget 164

Idea Cost Savings Retirement incentive $2.0 M
Discontinuation of activities $1.5 M Health benefits / payroll $4.0 M
Staffing in all areas / departments $4.1 M Moving Costs from General Fund to SAVE or PPEL $0.2 M
SSA in addition to 1% $3.2 M
TOTAL EXPENDITURE REDUCTIONS IDENTIFIED $15.0 M
Additional SMART Goal General Fund Expenses $0.7 M
The employee positions identified will be addressed through the allocation process (13 FTE at the elementary level, 5 FTE at the middle school level, and 2 FTE at the high school level), in specific programs (2.4 FTE in the IB program and 3 FTE in the Turnaround Arts program), and in Central Office (1 FTE in HR, 4 FTE in Custodial, 1 FTE in Security, and 7 FTE in Student & Family Services). Activities that will be impacted in FY 2022 include reducing expenses for the IB program, Climate Summit, and certain athletic and instructional stipends. Changes to employee benefits include changes to dental and medical benefits.
Moving forward, the district will continue with the implementation phase on ideas developed by the Advisory Team. New working groups will be formed to work on the execution of these ideas. Major areas for evaluation include conducting a demographic study, evaluating athletic committee proposals, and executing an ongoing Student ROI evaluation to assess academic and student programs that provide the least value to students at the highest cost. In conjunction, the district is continuing to implement efforts to improve efficiencies across the district. Efficiencies can be gained in areas such as business processes, and the district employs a continuous improvement environment using Lean methodologies across multiple areas of the organization. Finally, the district is closely monitoring the Iowa Revenue Estimating Conference, mandates from the Governor, Legislative actions, and federal programs for fiscal impacts.
The forecast makes the following assumptions for revenues: (1) Enrollment decreases occur each year. (2) The percent of growth for Supplemental State Aid is 2.4% for FY 2022 and 1.00% for FY
2023-2025. (3) The amount of federal revenue received will decrease post-COVID.
The forecast also makes the following assumptions for expenditures: (A) Historical increases for compensation (state average) will continue. (B) Modest 1% increases for goods and services (inflation). (C) Expenditure reduction $15 million in FY 2022 and $14 million annually thereafter.
2021 - 2022 Preliminary Budget 165

Re-estimated Budget Projected Projected ProjectedFY 2018 FY 2019 FY 2020 FY 2021 FY 2022 FY 2023 FY 2024 FY 2025
Revenues with assumptions with assumptions with assumptions with assumptions Total Revenues 444,170,081 452,812,724 461,710,638 458,847,521 442,685,000 445,034,000 442,609,000 445,207,000
ExpendituresTotal Expenditures & Other Uses 442,356,665 440,144,259 433,436,251 440,439,687 437,863,000 446,434,000 462,198,000 479,013,000
Excess Revenues Over Expenditures 1,813,416 12,668,465 28,274,387 18,407,834 4,822,000 (1,400,000) (19,589,000) (33,806,000) Beginning Fund Balance 82,303,759 84,117,175 96,785,640 125,060,027 143,468,000 148,290,000 146,890,000 127,301,000
Ending Fund Balance 84,117,175 96,785,640 125,060,027 143,467,861 148,290,000 146,890,000 127,301,000 93,495,000
Solvency Ratio 12.7% 15.1% 21.0% 25.3% 27.5% 27.0% 22.5% 14.5%Unspent Spending Authority Ratio 3.0% 2.3% 5.2% 7.4% 11.5% 14.0% 14.0% 12.6%
Unspent Authorized Budget 13,687,231 10,391,630 23,811,426 35,214,678 56,689,000 72,451,000 75,178,000 69,006,000
AssumptionsSupplemental State Aid 2.40% 1.00% 1.00% 1.00%
Enrollment 31621 31933 31683 31433Inflation Increase 1.00% 1.00% 1.00% 1.00%
Compensation Increase Negotiated Negotiated Negotiated Negotiated
Expenditure Reduction $15M reductionReview; up to $14M
reduction
Review; up to $14M
reduction
Review; up to $14M
reduction
DES MOINES PUBLIC SCHOOLS2021 - 2022 BUDGET
GENERAL FUND FORECAST
2021 - 2022 Preliminary Budget 166

P R E L I M I N A RY B U D G E T 2 0 2 1 - 2 0 2 2
INFORMATION

DES MOINES PUBLIC SCHOOLS: AT A GLANCE
ENROLLMENT
For more 100 years, DMPS, accredited by the North Central Association of Secondary Schools and Colleges and the Iowa Department of Education, has educated hundreds of thousands of children in Iowa’s capital city. Peak enrollment in recent history occurred in 2001-02, followed by seven years of declining enrollment, and then a decade of stable of growing enrollment. The last three school years the district has again experienced declining enrollment.
The impact the COVID-19 pandemic had on the community was great and affected all areas of operation for the district. As a direct result of COVID-19, the district is down approximately 1,000 students. This is the largest single decrease in decades and will impact the district in FY 2022 and potentially for years beyond. In addition, the Iowa Legislature put forth bills in 2021 that could directly impact enrollment in Des Moines.
29,000
30,000
31,000
32,000
33,000
34,000
DMPS ENROLLMENT
2021 - 2022 Preliminary Budget 168

Using a simple regression analysis, the Iowa Department of Education projects district enrollment for four years beyond the current school year. The district is forecasting future enrolment based on an analysis of live births of Des Moines residents. The analysis indicated that during the Great Recession citizens of Des Moines has fewer babies; the lower birth rate is impacting enrollment now at the elementary level. The lower birth rate coupled with decreased enrollment from refugees and immigrants has led the district to budget under the assumption that there will be 250 students enrolled each year for the next four years. In addition, the Iowa Department of Education enrollment forecast has approximately 400 more students returning to the district next year than the district has built into future estimates.
The breakdown of students by level in the 2020-21 school year is 45.4% elementary school, 23.3% middle school, and 31.3% high school.
31,933 31,683 31,433 30,000 31,000 32,000 33,000 34,000 35,000 36,000
DMPS ENROLLMENT PROJECTION
Actual Enrollment DE Projection DMPS Assumption
-
5,000
10,000
15,000
20,000
25,000
30,000
35,000
2011-12 2012-13 2013-14 2014-15 2015-16 2016-17 2017-18 2018-19 2019-20 2020-21
ENROLLMENT BY SCHOOL LEVEL
Elementary Middle High
2021 - 2022 Preliminary Budget 169

In addition to serving students in grades K-12, the district also has a robust Early Childhood program. DMPS Early Childhood programs provide quality learning experiences to help promote the growth of young children and their families. This is done by offering free, quality preschool with several options to best meet the needs of families, including a variety of locations, class times, and half- or full-day plans. All DMPS preschool programs adhere to state and national program standards to facilitate the district goal of improving Kindergarten readiness.
There are a number of preschool options for families in Des Moines: Universal Preschool — A state-funded program designed to provide voluntary, universal access to high-quality preschool education programs for the state’s four-year-olds. This is the largest DMPS preschool program. Classrooms are located throughout Des Moines in neighborhood elementary schools, DMPS Education Centers, and partner locations.
Head Start — A federally-funded comprehensive child development program that serves income-eligible children ages three to five and their families. The Des Moines Head Start program is a delegate of the Drake University Head Start program.
Shared Visions — The district is the recipient of three grants from the Iowa Department of Education to implement the Shared Visions program at preschool programs located in three Des Moines elementary schools: McKinley, Capitol View, and Moulton. The Shared Visions preschool program provides comprehensive quality preschool program experiences for at-risk children who are ages three to five years.
Early Childhood Special Education (ECSE) — Services are available for eligible children three to five years of age. ECSE staff assist in the identification, assessment, and development of an Individualized Educational Plan for eligible children. A continuum of services is available, tailored to meet the individual needs of each student, including integrated classroom settings with Head Start, Universal Preschool, and self-contained programming. ECSE classrooms are located throughout Des Moines in neighborhood elementary schools and in DMPS Education Centers.
More than 1,500 students were enrolled in preschool programs through a variety of funding sources in 2021-22. This was a sharp decline compared to previous years, due to COVID-19. Students in Des Moines participate in early childhood education programs in district buildings or in partnering religious, childcare, and other organizations.
- 500 1,000 1,500
PRESCHOOL ENROLLMENT BY FUNDING SOURCE
Universal Preschool, 59%
Head Start, 22%
Early Childhood Special Education, 11%
Early Childhood Iowa, 5%
Shared Visions 3%
2021 - 2022 Preliminary Budget 170

DISTRICT DEMOGRAPHICS
Low-Income Students DMPS is an urban school district that serves an increasingly diverse student population. Seventy-eight percent of the students in the district are low-income, based on eligibility for the Free or Reduced-Price Lunch (FRPL) program. The percentage of DMPS students enrolled in the FRPL program is substantially higher than the state average, and Des Moines Public Schools has the highest poverty rate in Polk County (based on FRPL enrollment).
DMPS Ankeny West DesMoines Johnston Southeast
Polk Urbandale Bondurant-Farrar
NorthPolk Saydel
% FRPL 78% 13% 41% 20% 32% 10% 19% 11% 62%
FRPL Students 23,523 1,505 3,603 1,429 2,197 388 441 206 783
Non-FRPL Students 6,714 10,359 5,193 5,673 4,639 3,479 1,939 1,685 471
-
5,000
10,000
15,000
20,000
25,000
30,000
2020-21 FRPL ENROLLMENT: POLK COUNTY DISTRICTS
20%
30%
40%
50%
60%
70%
80%
90%
2011-12 2012-13 2013-14 2014-15 2015-16 2016-17 2017-18 2018-19 2019-20 2020-21
FRPL RATES: DMPS VS. STATE OF IOWA
DMPS State of Iowa
2021 - 2022 Preliminary Budget 171

Minority Students DMPS is a “majority-minority” school district, and minority enrollment has steadily increased to 64% of all students. Latino families are the fastest growing demographic segment of both the city and the schools.
ENROLLMENT BY RACE/ETHNICITY
White, 36.0% Latino, 28.1% African American, 20.5%
Asian, 8.1% Multiple Races, 6.7% Native American, 0.5%
Pacific Islander, 0.2%
0% 20% 40% 60% 80% 100%
2011-12
2012-13
2013-14
2014-15
2015-16
2016-17
2017-18
2018-19
2019-20
2020-21
ENROLLMENT BY RACE/ETHNICITY
White Latino African American Asian Multi-Racial Other
2021 - 2022 Preliminary Budget 172
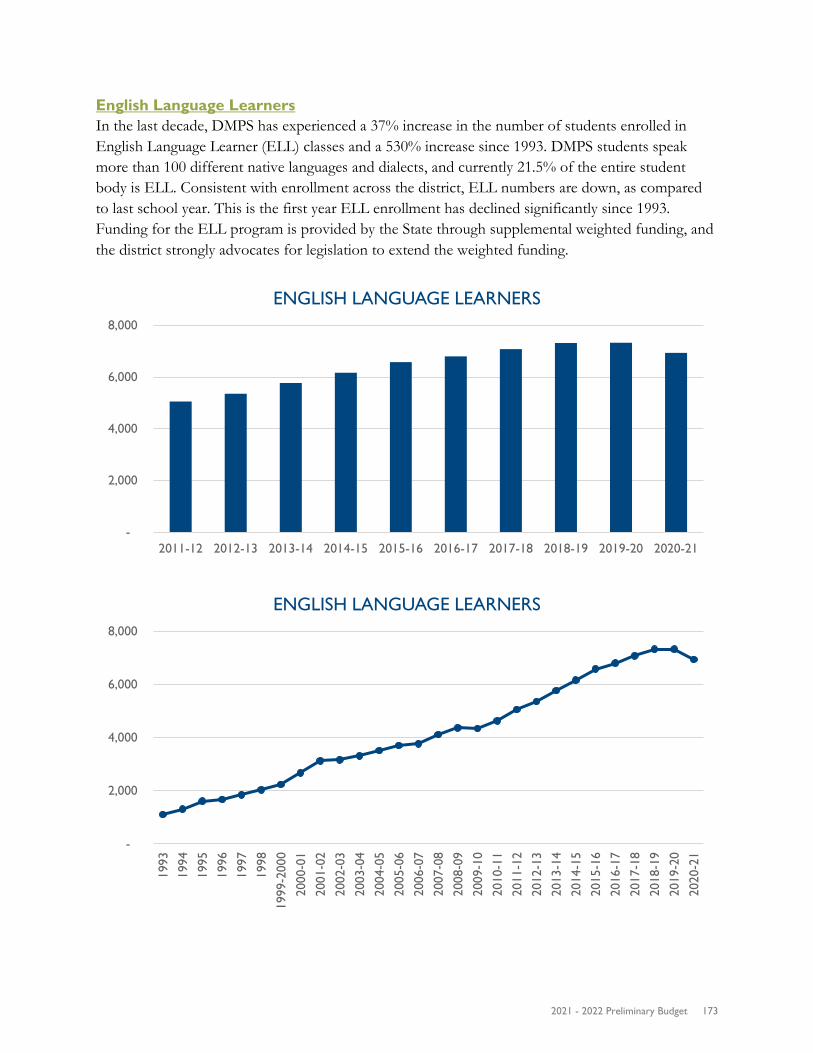
English Language Learners In the last decade, DMPS has experienced a 37% increase in the number of students enrolled in English Language Learner (ELL) classes and a 530% increase since 1993. DMPS students speak more than 100 different native languages and dialects, and currently 21.5% of the entire student body is ELL. Consistent with enrollment across the district, ELL numbers are down, as compared to last school year. This is the first year ELL enrollment has declined significantly since 1993. Funding for the ELL program is provided by the State through supplemental weighted funding, and the district strongly advocates for legislation to extend the weighted funding.
-
2,000
4,000
6,000
8,000
2011-12 2012-13 2013-14 2014-15 2015-16 2016-17 2017-18 2018-19 2019-20 2020-21
ENGLISH LANGUAGE LEARNERS
-
2,000
4,000
6,000
8,000
1993
1994
1995
1996
1997
1998
1999
-200
020
00-0
120
01-0
220
02-0
320
03-0
420
04-0
520
05-0
620
06-0
720
07-0
820
08-0
920
09-1
020
10-1
120
11-1
220
12-1
320
13-1
420
14-1
520
15-1
620
16-1
720
17-1
820
18-1
920
19-2
020
20-2
1
ENGLISH LANGUAGE LEARNERS
2021 - 2022 Preliminary Budget 173

Special Education Approximately 15% of DMPS students receive Special Education (SPED) services for disabilities ranging from mild behavioral or learning disorders to severe and profound disabilities. Consistent with enrollment across the district, SPED numbers are down, as compared to last school year. The district will continue to provide quality services that families and students with disabilities have come to expect from the district and as required by law. Funding for the SPED program is provided by the State through supplemental weighted funding and through State and Federal grants.
-
1,000
2,000
3,000
4,000
5,000
6,000
7,000
8,000
2011-12 2012-13 2013-14 2014-15 2015-16 2016-17 2017-18 2018-19 2019-20 2020-21
SPECIAL EDUCATION ENROLLMENT
2021 - 2022 Preliminary Budget 174

STUDENT PERFORMANCE MEASURES
Graduation and Dropout Rates Beginning with the graduating class of 2009, graduation rates in Iowa have been calculated with a new formula established by the U.S. Department of Education. Unique student identification numbers are assigned to ninth-grade students, allowing school districts to carefully account for students as they move through high school. At the state level, the method helps determine when a student graduates, even if the student has moved to a different district in Iowa during high school.
The 4-year graduation rate for Des Moines has increased eight percentages points since Iowa began using its current graduation rate formula in 2009. The DMPS Class of 2020 had a graduation rate of 77%. While this is a decline from the previous year, it is four percentage points higher than the Class of 2009. The five year graduation rate for the Class of 2019 was 86%, which is the highest it has been since the Class of 2009.
Des Moines Public Schools again saw a decrease in the dropout rate, which was 3.4% for the 2019-20 school year compared to 3.8% for the 2018-19 school year. The dropout rate was the lowest it has been since 2008-09.
Classof
2009
Classof
2010
Classof
2011
Classof
2012
Classof
2013
Classof
2014
Classof
2015
Classof
2016
Classof
2017
Classof
2018
Classof
2019
Classof
2020Four-Year Rate 73% 78% 76% 79% 79% 82% 78% 81% 82% 81% 83% 77%Five-Year Rate 77% 83% 81% 83% 84% 82% 84% 85% 86% 85% 86%
0%
20%
40%
60%
80%
100%
FOUR & FIVE YEAR GRADUATION RATES
3.0%
4.0%
5.0%
6.0%
2008-09 2009-10 2010-11 2011-12 2012-13 2013-14 2014-15 2015-16 2016-17 2017-18 2018-19 2019-20
GRADE 7-12 DROPOUT RATE
2021 - 2022 Preliminary Budget 175

Student Proficiency Reading and mathematics assessments are administered to students in grades 3-11 in the spring each year. In 2012, the Iowa Assessments replaced the ITBS and ITED tests students previously took. The Iowa Statewide Assessment of Student Progress (ISASP) replaced the former Iowa Assessments, with students taking the new tests for the first time in spring 2019. English Language Arts and Math tests were given to students in grades 3 through 11. ISASP better reflects what’s being taught in Iowa classrooms and how students are progressing toward the grade-level expectations outlined in Iowa’s academic standards. Because the new state test is more aligned to Iowa’s academic standards, it is more challenging. These results will re-set the baseline for future progress on the new state test. They should not be compared to results from previous years’ Iowa Assessments because the new state test measures Iowa’s academic standards aligned to the appropriate grade level.
The state of Iowa has adopted three performance levels for the ISASP: Advanced, Proficient, and Not-Yet-Proficient. These performance levels were recommended by a committee of Iowa educators and define the range of standard scores for each of the three categories. The standard score is a number that describes a student’s location on the achievement continuum.
Performance Level Descriptor
Advanced
Students performing at the Advanced level demonstrate thorough competency over the knowledge, skills, and abilities that meet the requirements for their grade level associated with academic readiness for college and careers in the subject.
Proficient
Students performing at the Proficient level demonstrate adequate competency over the knowledge, skills, and abilities that meet the requirements for their grade level associated with academic readiness for college and careers in the subject area.
Not-Yet- Proficient Students performing at the not-yet-proficient level have not yet demonstrated the knowledge and skills to the classified as Proficient.
Due to the COVID-19 pandemic, the statewide assessment was not administered in 2020. The 2019 data is provided as a reference.
2021 - 2022 Preliminary Budget 176

45.9% 48.1%51.0%
0%
20%
40%
60%
Grades 3-5 Grades 6-8 Grades 9-11
READING: PROFICIENCY ON THE IOWA STATEWIDE ASSESSMENT OF STUDENT PROGRESS
(PROFICIENT & ADVANCED)
2019
49.8% 51.1%46.7%
0%
20%
40%
60%
Grades 3-5 Grades 6-8 Grades 9-11
MATHEMATICS: PROFICIENCY ON THE IOWA STATEWIDE ASSESSMENT OF STUDENT PROGRESS
(PROFICIENT & ADVANCED)
2019
2021 - 2022 Preliminary Budget 177

PROPERTY TAXES
Per the Aid & Levy report, the district property tax rates for FY 2018 – FY 2021 and the projected FY 2022 (per the preliminary Aid & Levy) are:
District Property Tax Rates FY 2018 FY 2019 FY 2020 FY 2021 FY 2022
Total Tax Rate 18.56349 18.60074 18.60685 18.61192 16.08128
Details on the components of the tax rate are included on the Local Funds: Property Tax Rates schedule. The total school district property tax rate is projected to decrease for FY 2022, as compared to FY 2021.
District Property Overall Recommended Tax Rate FY 2021 FY 2022 Change GENERAL Regular Instructional Support Dropout Prevention Cash Reserve Levy
8.87 1.57 1.36 2.47
9.03 1.56 1.32 0.00
0.16
(0.01) (0.04) (2.47)
MANAGEMENT 3.24 2.36 (0.88) PPEL Regular Voted
0.33 0.63
0.33 1.34
0.00 0.71
PERL 0.135 0.135 0.00 DEBT SERVICE 0.00000 0.00000 0.00 TOTAL 18.61 16.08 (2.53)
$0
$5
$10
$15
$20
$25
$30
FY 2013 FY 2014 FY 2015 FY 2016 FY 2017 FY 2018 FY 2019 FY 2020 FY 2021 FY 2022(budget)
ANNUAL PROPERTY TAX RATE
2021 - 2022 Preliminary Budget 178

Regular Valuation (with Utilities) 6,896,129,735$ 1.76% 7,410,150,207$ 7.45% 7,715,762,964$ 4.12% 8,293,471,718$ 7.49%TIF Valuation 765,374,658 7.79% 897,768,845 17.30% 873,554,703 (2.70%) 1,002,372,633 14.75%Regular and TIF Valuation 7,661,504,393$ 2.33% 8,307,919,052$ 8.44% 8,589,317,667$ 3.39% 9,295,844,351$ 8.23%
Dollars Generated Tax Rate Dollars Generated Tax Rate Dollars Generated Tax Rate Dollars Generated Tax RateGeneral:
Regular Program 64,651,494$ 9.37504 68,556,542$ 9.25171 70,250,411$ 8.94697 73,551,572$ 8.86861 Instructional Support 13,463,025 1.75723 13,822,550 1.66378 14,031,509 1.63360 14,616,135 1.57233 Dropout Prevention 10,980,425 1.59226 11,127,121 1.50161 8,849,106 1.14689 11,311,264 1.36388 Cash Reserve 23,750,000 3.44396 25,851,400 3.48865 29,525,000 3.98440 20,500,000 2.47182
Total General 112,844,944 16.16849 119,357,613 15.90574 122,656,026 15.71186 119,978,971 14.27664
Management 8,965,000 1.30000 11,856,275 1.60000 13,888,373 1.80000 26,873,171 3.24028
PPEL:Regular 2,528,296 0.33000 2,741,613 0.33000 2,834,475 0.33000 3,067,629 0.33000 Voted 4,826,748 0.63000 5,233,989 0.63000 5,411,270 0.63000 5,856,382 0.63000
Total PPEL 7,355,044 0.96000 7,975,602 0.96000 8,245,745 0.96000 8,924,011 0.96000
PERL 930,978 0.13500 1,000,370 0.13500 1,041,628 0.13500 1,119,619 0.13500
Debt Service - - - - - - - -
Total 130,095,966$ 18.56349 140,189,860$ 18.60074 145,831,772$ 18.60686 156,895,772$ 18.61192
Increase 0.05763$ Increase 0.03725$ Increase 0.00612$ Increase 0.00506$
Regular Valuation (with Utilities) 8,478,139,579$ 2.23% 8,562,921,000$ 1.00% 8,648,550,000$ 1.00% 8,735,036,000$ 1.00%TIF Valuation 1,000,524,071 (0.18%) 990,519,000 (1.00%) 980,614,000 (1.00%) 970,808,000 (1.00%)Regular and TIF Valuation 9,478,663,650$ 1.97% 9,553,440,000$ 0.79% 9,629,164,000$ 0.79% 9,705,844,000$ 0.80%
Dollars Generated Tax Rate Dollars Generated Tax Rate Dollars Generated Tax Rate Dollars Generated Tax RateGeneral:
Regular Program 76,843,331$ 9.08252 77,773,000$ 9.08252 78,551,000$ 9.08252 79,336,000$ 9.08252 Instructional Support 14,538,103 1.56358 14,938,000 1.56358 15,056,000 1.56358 15,176,000 1.56358 Dropout Prevention 11,219,308 1.27117 11,244,000 1.27117 11,340,000 1.27117 11,438,000 1.27117 Cash Reserve - - - - - - - -
Total General 102,600,742 11.91727 103,955,000 11.91727 104,947,000 11.91727 105,950,000 11.91727
Management 20,000,000 2.35901 20,000,000 2.35901 20,000,000 2.35901 20,000,000 2.35901
PPEL:Regular 3,127,959 0.33000 3,153,000 0.33000 3,178,000 0.33000 3,203,000 0.33000 Voted 12,701,409 1.34000 12,802,000 1.34000 12,903,000 1.34000 13,006,000 1.34000
Total PPEL 15,829,368 1.67000 15,955,000 1.67000 16,081,000 1.67000 16,209,000 1.67000
PERL 1,144,549 0.13500 1,290,000 0.13500 1,300,000 0.13500 1,310,000 0.13500
Debt Service - - - - - - - -
Total 139,574,659$ 16.08128 141,200,000$ 16.08128 142,328,000$ 16.08128 143,469,000$ 16.08128
Decrease (2.53064)$ Flat -$ Flat -$ Flat -$
Preliminary Aid and Levy
FY 2018 FY 2021FY 2020Per Final Aid and LevyPer Final Aid and LevyPer Final Aid and Levy Per Final Aid and Levy
FY 2019
Estimated EstimatedFY 2025
EstimatedFY 2022 FY 2023 FY 2024
DES MOINES PUBLIC SCHOOLS2021 - 2022 BUDGET
LOCAL FUNDS: PROPERTY TAX RATES — HISTORICAL SUMMARY, BUDGET, AND PROJECTIONS
2021 - 2022 Preliminary Budget 179

IMPACT ON TAXPAYER
The tax rate is based on a per $1,000 of assessed valuation, in most instances, per the Aid and Levy, as determined by the State of Iowa. Using a $100,000 home as an example, a taxpayer would have the following annual obligation:
Calculation: $100,000 home value
$1,000 = 100 x Annual Tax Rate
FY 2016 FY 2017 FY 2018 FY 2019 FY 2020 FY 2021 FY 2022 $ 1,842.81 $ 1,850.59 $ 1,856.35 $ 1,860.07 $ 1,861.69 $ 1,861.19 $ 1,608.13
Property Valuations Generally, property tax rates will only change slightly from year-to-year; therefore, fluctuations in revenue from year-to-year are mainly caused by changes in property valuations. The value of property is established by a County Assessor (or the Iowa Department of Revenue) estimating the value of each property, which is called the “assessed value.”
Residential, commercial, and industrial real estate is assessed at 100% of market value, and the Assessor must determine the fair market value of the property. To do this, the Assessor generally uses three approaches:
• Market Approach: Analyze sales of similar properties that were recently sold, and determine the most probable sales price of the property being appraised.
• Cost Approach: Estimate how much money at current labor and material prices it would take to replace the property with one similar to it. This is useful when no sales of comparable properties exist.
• Income Approach: If the property produces income, such as an apartment or office building, estimate its ability to produce income.
Assessments are conducted in Iowa in odd-numbered years. The 2019 Polk County residential property valuations increased 10%, multi-residential increased 20%, and commercial & industrial increased 6.8%. Residential and commercial values were higher in 2019 because of a strong real estate market and continued growth. Market data is key to providing accurate assessments for most types of property. And when it comes to COVID-19 and commercial properties, this means some difficult challenges on the horizon as assessors attempt to determine 2021 revaluations. The difference in the market before and after the start of COVID-19 is the main reason for the challenge. Sales volume of commercial properties dropped 25% in the second quarter of 2020, as the impact of COVID-19 took hold. This made the sales data from first quarter largely outdated. Basing assessments on existing data, with so many fewer sales since March, could lead to higher assessments for these types of commercial properties — even though the data no longer aligns with the current market. Some commercial properties still appear to be performing well; however, they also have fewer sales since March, which makes it difficult to ascertain their current market value.
2021 - 2022 Preliminary Budget 180

Multi-residential properties continued to sell well, and assessments are expected to increase more than 10 percent. However, in some cases, income for these property owners may be lower due to evictions resulting from job losses — creating yet another assessment challenge. The residential market has continued on a similar path in spite of COVID-19. Properties continue to sell well, especially those priced at less than $300,000. This was largely due to near record-low interest rates and a shortage of homes for sale (a record low in July in Polk County).
Agricultural real estate is assessed at 100% of productivity and net earning capacity value. The Assessor considers the productivity and net earning capacity of the property. Agricultural income as reflected by production, prices, expenses, and various local conditions is taken into account.
The utilities/railroad class of property is assessed at the state level.
Source: City of Des Moines, Community Development Department
2021 - 2022 Preliminary Budget 181

The Assessor totals the assessed value in each classification (residential, commercial, industrial, agricultural, or utilities/railroad) and reports it to the County Auditor. Each Assessor sends the reports — called abstracts — to the Iowa Department of Revenue. The abstract shows the total taxable values of all real property in each jurisdiction by classification of property, not by individual property. The state then examines total assessed values and equalizes them. The equalization process is applied every two years to ensure that property values are comparable among jurisdictions and according to law. The state compares the Assessors’ abstracts to a sales assessment ratio study it has completed independently of the Assessors. If the assessment (by property class) is 5% or more above or below the sales ratio study, the state increases or decreases the assessment. There is no sales ratio study for agricultural and industrial property. Equalization occurs on an entire class of property, not on an individual property. Also, equalization occurs on an assessing jurisdiction basis, not on a statewide basis. Equalization is important as it helps maintain equitable assessments among classes of property and among assessing jurisdictions. This contributes to a fairer distribution of state aid, such as aid to schools. It also helps to equally distribute the total tax burden within an area. In addition, an assessment limitation is applied every year. This process is commonly called rollback and is used to adjust for inflation.
Details on the components of the property valuations within the district for the past three years, the current year, and the budget year are included on the Local Funds: Property Valuations schedule on the following page.
2021 - 2022 Preliminary Budget 182

Polk County Warren County Total Polk Warren Total Polk Warren Total
Residential 5,367,177,741$ 66,732,362$ 5,433,910,103$ 5,479,334,573$ 69,286,080$ 5,548,620,653$ 2.1% 3.8% 2.1%Commercial 2,422,048,834 2,344,950 2,424,393,784 2,488,199,304 2,492,245 2,490,691,549 2.7% 6.3% 2.7%Industrial 203,210,911 - 203,210,911 222,588,246 - 222,588,246 9.5% NA 9.5%Agricultural 2,374,242 1,545,814 3,920,056 2,540,832 1,467,372 4,008,204 7.0% (5.1%) 2.2%Utilities (WO Gas & Electric) 24,056,056 717,137 24,773,193 18,483,410 659,241 19,142,651 (23.2%) (8.1%) (22.7%)Railroads 21,432,185 - 21,432,185 22,618,481 - 22,618,481 5.5% NA 5.5%
Total Valuation 8,040,299,969 71,340,263 8,111,640,232 8,233,764,846 73,904,938 8,307,669,784 2.4% 3.6% 2.4%Less: Military 10,681,410 248,168 10,929,578 9,990,445 244,191 10,234,636 (6.5%) (1.6%) (6.4%)Plus: Gas & Electric 188,420,325 4,340,739 192,761,064 176,605,624 4,098,807 180,704,431 (6.3%) (5.6%) (6.3%)
Total General Taxable Valuation 8,218,038,884 75,432,834 8,293,471,718 8,400,380,025 77,759,554 8,478,139,579 2.2% 3.1% 2.2%TIF Value 1,002,372,633 - 1,002,372,633 1,000,524,071 - 1,000,524,071 (0.2%) NA (0.2%)
Total Debt & PPEL Taxable Valuation 9,220,411,517$ 75,432,834$ 9,295,844,351$ 9,400,904,096$ 77,759,554$ 9,478,663,650$ 2.0% 3.1% 2.0%
DES MOINES PUBLIC SCHOOLS2021 - 2022 BUDGET
LOCAL FUNDS: PROPERTY VALUATIONS — PREVIOUS YEAR AND BUDGET YEAR
1/1/2020FY 2022 One Year ChangeFY 2021
1/1/2019
2021 - 2022 Preliminary Budget 183

As a taxing authority, the district has a limited amount of property from which it can draw taxes. More than 38% of land within the city is for “public use” for city, county, and state government offices; parks; churches; universities, etc. The property, with an equivalent value of $1.3 billion, is tax exempt.
Source: City of Des Moines, Community Development Department
2021 - 2022 Preliminary Budget 184

CAPITAL IMPROVEMENT & BONDING
Thanks to community support, Des Moines Public Schools has completed more than $500 million in improvements to district facilities since the turn of the 21st century, from the renovation of historic structures to the construction of brand new facilities. There has been a concentrated effort to improve and replace existing building equipment, improve energy efficiency, and provide a safe, comfortable environment for students.
In 1999, voters in Polk County approve a local one-cent sales tax for school infrastructure improvements. By 2008, voters in all 99 Iowa counties had voted for the local sales tax increase. In 2008, the Iowa legislature enacted a statewide one-cent sales tax — now called SAVE — to benefit school districts across Iowa to replace the local option sales taxes, and the governor signed it into law that same year. SAVE is a dedicated source of revenue to support improvements to public schools. A Revenue Purpose Statement indicating how SAVE funding could be used by the district was approved by voters on September 9, 2009. In most cases, a district incurs long-term debt for capital projects, and the amounts are often sizable. One of the priorities of the Revenue Purpose Statement was to introduce money-saving strategies, and one strategy enacted by the district has been the sale of revenue bonds to minimize the impact of inflation on renovation and construction budgets. The district has issued the following revenue bonds:
Revenue Bond Series Amount Due 2010 $70.0 million Refinanced in 2016 2013 $8.8 million 2029 2014 $61.9 million 2029 2016 $53.7 million 2028 2018 $56.2 million 2019
This strategy saves money by getting ahead of the cost of inflation, accelerating the projects schedule, and supporting jobs in the construction trades. Issuing revenue bonds has allowed the district DMPS to complete more school projects, while saving tax dollars, and providing additional opportunities to students. Issuing revenue bonds — paid for by the revenue from the statewide sales tax, not property taxes — has allowed DMPS to:
• Minimize inflationary increases on a portion of the construction program. • Add flexibility to the construction schedule. • Develop the most optimal construction plan. • Lock up a portion of the revenue stream for debt service (and/or projects). • Move up projects to benefit students earlier. • Lock in projects at a borrowing cost lower than the average inflationary factor. • Continue the plan created by the Superintendent’s Facilities Advisory Committee. • Continue to provide operational efficiencies that will have a direct impact on the district’s
General Fund in the form of reduced energy costs.
2021 - 2022 Preliminary Budget 185

FY 2022 FY 2023 FY 2024 FY 2025Budget Projected Projected Projected
RevenuesTransfers In 22,994,000$ 22,993,000$ 22,993,000$ 22,997,000$
Total Revenues 22,994,000 22,993,000 22,993,000 22,997,000
Expenditures by FunctionDebt Service 22,994,000 22,993,000 22,993,000 22,997,000
Total Expenditures 22,994,000 22,993,000 22,993,000 22,997,000
Excess of Revenues over Expenditures - - - - Beginning Fund Balance - - - -
Ending Fund Balance -$ -$ -$ -$
DES MOINES PUBLIC SCHOOLS2021 - 2022 BUDGET
DEBT SERVICE FUND SUMMARY — BUDGET AND PROJECTIONS
2021 - 2022 Preliminary Budget 186

Principal Interest Total Principal Interest Total Principal Interest Total201120122013 3,125,000$ 3,059,744$ 6,184,744$ 2014 3,330,000 2,751,000 6,081,000 485,000$ 131,116$ 616,116$ 2015 3,430,000 2,617,800 6,047,800 425,000 298,045 723,045 3,105,000$ 2,850,385$ 5,955,385$ 2016 3,530,000 2,480,600 6,010,600 440,000 285,295 725,295 3,400,000 2,506,925 5,906,9252017 3,650,000 2,339,400 5,989,400 455,000 272,095 727,095 3,490,000 2,336,925 5,826,9252018 3,755,000 2,193,400 5,948,400 470,000 253,895 723,895 3,600,000 2,162,425 5,762,4252019 3,870,000 2,043,200 5,913,200 490,000 235,095 725,095 3,720,000 1,982,425 5,702,4252020 3,990,000 1,888,400 5,878,400 505,000 220,395 725,395 3,850,000 1,796,425 5,646,4252021 4,125,000 1,728,800 5,853,800 530,000 195,145 725,145 3,875,000 1,603,925 5,478,9252022 4,280,000 1,563,800 5,843,800 555,000 168,645 723,645 4,000,000 1,410,175 5,410,1752023 4,435,000 1,392,600 5,827,600 575,000 151,995 726,995 4,145,000 1,210,175 5,355,1752024 4,595,000 1,215,200 5,810,200 590,000 134,745 724,745 4,310,000 1,002,925 5,312,9252025 4,770,000 1,031,400 5,801,400 610,000 116,455 726,455 4,480,000 873,625 5,353,6252026 4,955,000 840,600 5,795,600 630,000 96,630 726,630 4,670,000 739,225 5,409,2252027 5,145,000 642,400 5,787,400 650,000 75,525 725,525 4,870,000 587,450 5,457,4502028 5,350,000 436,600 5,786,600 675,000 52,775 727,775 5,090,000 417,000 5,507,0002029 5,565,000 222,600 5,787,600 695,000 27,800 722,800 5,335,000 213,400 5,548,400
71,900,000$ 28,447,544$ 100,347,544$ 8,780,000$ 2,715,651$ 11,495,651$ 61,940,000$ 21,693,410$ 83,633,410$
Principal Interest Total Principal Interest Total Principal Interest Total2011 1,640,000$ 4,313,500$ 5,953,500$ 2012 2,590,000 3,418,000 6,008,0002013 5,810,000 6,348,244 12,158,2442014 6,595,000 6,036,366 12,631,3662015 9,845,000 8,781,480 18,626,4802016 *Replaced Series 2010 Bonds 10,355,000 8,143,820 18,498,8202017 4,900,000$ 930,288$ 5,830,288$ 12,495,000 5,878,708 18,373,7082018 4,830,000 984,851 5,814,851 12,655,000 5,594,571 18,249,571
2019 4,025,000 887,285 4,912,285 3,300,000 2,542,021 5,842,021 15,405,000 7,690,026 23,095,0262020 4,100,000 805,980 4,905,980 3,570,000 2,268,850 5,838,850 16,015,000 6,980,050 22,995,0502021 4,165,000 723,160 4,888,160 3,960,000 2,090,350 6,050,350 16,655,000 6,341,380 22,996,3802022 4,240,000 639,027 4,879,027 4,245,000 1,892,350 6,137,350 17,320,000 5,673,997 22,993,9972023 4,325,000 553,379 4,878,379 4,525,000 1,680,100 6,205,100 18,005,000 4,988,249 22,993,2492024 4,415,000 466,014 4,881,014 4,810,000 1,453,850 6,263,850 18,720,000 4,272,734 22,992,7342025 4,510,000 376,831 4,886,831 5,015,000 1,213,350 6,228,350 19,385,000 3,611,661 22,996,6612026 4,610,000 285,729 4,895,729 5,205,000 962,600 6,167,600 20,070,000 2,924,784 22,994,7842027 4,710,000 192,607 4,902,607 5,420,000 702,350 6,122,350 20,795,000 2,200,332 22,995,3322028 4,825,000 97,465 4,922,465 5,565,000 485,550 6,050,550 21,505,000 1,489,390 22,994,3902029 - - - 10,620,000 318,600 10,938,600 22,215,000 782,400 22,997,400
53,655,000$ 6,942,616$ 60,597,616$ 56,235,000$ 15,609,971$ 71,844,971$ 268,075,000$ 95,469,693$ 363,544,693$
2012 SAVE Revenue Bonds 2013 SAVE Revenue Bonds 2014 SAVE Revenue Bonds
DES MOINES PUBLIC SCHOOLS2021 - 2022 BUDGET
DEBT SERVICE FUND SUMMARY
2016 SAVE Revenue Bonds 2018 SAVE Revenue Bonds DEBT SERVICE RECAP
On May 8, 2012, the District issued revenue bonds in the amount of $71,900,000 to be paid out of SAVE revenues. On December 30, 2013, the District issued revenue bonds in the amount of $8,780,000 to be paid out of SAVE revenues. On May 1, 2014, the District issued revenue bonds in the amount of $61,940,000 to be paid out of SAVE revenues.On July 22, 2016, the District refunded the Series 2010 revenue bonds with the Series 2016 Bonds in the amount of $53,655,000 to be paid out of SAVE revenues. On May 15, 2018, the District issued revenue bonds in the amount of $56,235,000 to be paid out of SAVE revenues.
2021 - 2022 Preliminary Budget 187

PERSONNEL
MAJOR DES MOINES METRO EMPLOYERS
Key industries in the greater Des Moines region include financial services, insurance, government, retail, manufacturing, and healthcare.
Des Moines Public Schools is central Iowa’s sixth largest employer with more than 4,900 FTE teachers and other employees and is the largest local governmental employer (excluding State employees).
Largest Des Moines Area Employers Rank Employer Product or Service Employees
1 Wells Fargo & Co Financial services, home mortgage 13,500
2 Unity Point Health – Des Moines Healthcare 8,026 3 Principal Financial Group Financial services 6,500
4 Hy-Vee Food Stores, Inc. Retail grocery and drugstore chain 6,400
5 Des Moines Public Schools Public Education 4,906 FTE 6 Nationwide Insurance 4,525 7 MercyOne Healthcare 4,276
8 John Deere Agricultural machinery, GPS/ag equipment software, consumer financial services
3,500
9 Corteva Agriscience Crop inputs for worldwide agribusiness 2,500
10 Kum & Go Convenience store chain 2,000 Sources: Greater Des Moines Partnership Major Employers, 2019; DMPS Employee Schedule, FY 2022.
Largest Des Moines Area Local Governmental Employers Rank Employer Service Employees
1 Des Moines Public Schools Public Education 4,906 FTE 2 City of Des Moines City Government 1,590 3 Polk County County Government 1,318
Sources: City of Des Moines 2020 CAFR; and Polk County 2020 CAFR; DMPS Employee Schedule, 2022.
2021 - 2022 Preliminary Budget 188

TEN YEAR EMPLOYMENT TRENDS
Compared to ten years ago, the district workforce is projected to be 251 FTE higher in FY 2022. The majority of the increase (74%) is in classroom staff. Classroom staff is projected to be 184 FTE higher in FY 2022 than it was in 2013.
FY2013
FY2014
FY2015
FY2016
FY2017
FY2018
FY2019
FY2020
FY2021
FY2022(est.)
Instructional Staff (Certified) 2,329 2,403 2,418 2,526 2,494 2,497 2,477 2,449 2,461 2,414Support Staff (Certified) 359 370 385 404 401 412 403 384 411 402Associates 519 521 518 515 510 510 535 560 581 570Specialists, Clerical,Paraprofessionals 509 542 552 564 546 559 553 569 582 600
Food Service, Operations,Transportation, Childcare 817 804 811 828 836 856 829 815 820 815
Administrators 123 124 123 126 122 127 123 107 105 104
0
500
1,000
1,500
2,000
2,500
3,000
TEN YEAR TREND: ALL DMPS EMPLOYEES
2329
2403
2418
2526
2494
2497
2477
2449
2461
2414
359 370 385 404 401 412 403 384 411 402
620 624 619 619 613 614 627 636 657 676
0%
20%
40%
60%
80%
100%
FY 2013 FY 2014 FY 2015 FY 2016 FY 2017 FY 2018 FY 2019 FY 2020 FY 2021 FY 2022(est.)
TEN YEAR TREND: CLASSROOM STAFF
Instructional Staff (Certified) Support Staff (Certified) Other Classroom Associates & Paras
2021 - 2022 Preliminary Budget 189

PERSONNEL: PAST YEAR, CURRENT YEAR, & BUDGET YEAR
Instructional Staff(Certified)
Support Staff(Certified) Associates
Specialists,Clerical,
Paraprofessionals
Food Service,Operations,
Transportation,Childcare
Administrators Total
FY 2020 2,449 384 560 569 815 107 4,884
FY 2021 2,461 411 581 582 820 105 4,960
FY 2022 (est.) 2,414 402 570 600 815 104 4,906
0
1,000
2,000
3,000
4,000
5,000
ALL DMPS EMPLOYEES
2021 - 2022 Preliminary Budget 190

The largest employee groups in the district in FY 2021 were certified instructional (i.e., teachers) and operations (i.e., food service, custodial, transportation, and childcare) at 50% and 18% of the workforce, respectively. Staffing ratios for FY 2022 are projected to remain virtually unchanged.
FY 2021 DMPS STAFF
Instructional Staff (Certified),50%
Support Staff (Certified), 8%
Associates, 12%
Specialists, Clerical,Paraprofessionals, 12%
Food Service, Operations,Transportation, Childcare, 16%
Administrators, 2%
FY 2022 DMPS STAFF (ESTIMATED)
Instructional Staff (Certified),49%
Support Staff (Certified), 8%
Associates, 12%
Specialists, Clerical,Paraprofessionals, 12%
Food Service, Operations,Transportation, Childcare, 17%
Administrators, 2%
2021 - 2022 Preliminary Budget 191

Classroom staff (which encompasses certified instructional, certified support, and other classroom associates and paraprofessionals) comprised 71% of all DMPS employees in FY 2021 and is projected to be virtually unchanged in FY 2022.
FY 2021 DMPS STAFF
Classroom Staff, 71% All Other Staff, 29%
FY 2022 DMPS STAFF (ESTIMATED)
Classroom Staff, 71% All Other Staff, 29%
2021 - 2022 Preliminary Budget 192

The student to instructional or student to classroom staff ratios are projected to remain steady in FY 2021.
DMPS Employee Schedule FY 2020 FY 2021 FY 2022 (est.)
Administrators
Central Office 41.0 40.0 40.0 Elementary Schools 38.0 38.0 38.0 Middle Schools 10.0 10.0 10.0 High Schools 13.0 14.0 14.0 Special Schools 5.0 3.0 2.0 Administrators 107.0 105.0 104.0
Instructional Staff (Certified) Classroom teachers 1,532.4 1,505.2 1,466.2 ELL 118.4 117.9 118.4 Head Start 14.0 13.0 13.0 Home Instruction 8.0 9.0 9.0 Preschool 35.0 35.0 31.0 Special Ed teachers 487.0 479.0 473.0 Title I, Rdg, Math, Instruct Coaches 251.4 280.7 282.4 Float 3.0 21.0 21.0 Instructional Staff (Certified) 2,449.2 2,460.8 2,414.0 Continued on next page
0.0 5.0 10.0 15.0
2012-13
2013-14
2014-15
2015-16
2016-17
2017-18
2018-19
2019-20
2020-21
2021-22 (est.)
STUDENTS TO INSTRUCTIONAL STAFF
0.0 5.0 10.0
2012-13
2013-14
2014-15
2015-16
2016-17
2017-18
2018-19
2019-20
2020-21
2021-22 (est.)
STUDENTS TO ALL CLASSROOM STAFF
2021 - 2022 Preliminary Budget 193

Continued from previous page Support Staff (Certified)
Counselors 85.0 96.0 95.5 Facilitator - - 10.0 Gifted and Talented 21.0 23.0 23.0 Library/Media specialists 1.0 1.0 0.2 Non-classroom teachers 53.5 62.7 62.2 Nurses 61.0 61.0 61.0 Special Ed consultants 30.0 30.0 30.0 Special Ed support 132.4 137.5 120.5 Support Staff (Certified) 383.9 411.2 402.4
Associates
Central Office 46.0 51.5 51.5 Elementary Schools 239.0 244.0 231.0 Middle Schools 57.5 60.0 66.5 High Schools 61.0 66.5 68.5 Special Schools 156.0 158.5 152.5 Associates 559.5 580.7 570.2
Specialists, Clerical, Paraprofessionals
Central Office 256.9 257.3 253.3 Elementary Schools 111.0 112.9 117.9 Middle Schools 71.5 72.9 71.4 High Schools 113.5 118.4 137.4 Special Schools 16.0 19.9 19.9 Specialists, Clerical, Paraprofessionals 568.9 581.6 600.1
Food Service, Operations, Transportation, Childcare
Central Office 294.7 295.3 293.3 Elementary Schools 283.9 285.0 285.0 Middle Schools 105.3 106.3 106.3 High Schools 112.2 113.3 110.3 Special Schools 19.3 20.4 20.4 Food Service, Operations, Transportation, Childcare 815.4 820.4 815.4
Total 4,883.9 4,959.7 4,906.0
2021 - 2022 Preliminary Budget 194

Employee Compensation The district will continue to hire and retain highly qualified staff and fully fund total compensation agreements. Components of compensation include salary (including base pay, steps, and longevity), teacher salary supplements, health insurance, payroll taxes, retirement (IPERS or DMTRS), dental and vision insurance, and long-term disability. To the extent as allowed by law, the district conducts comprehensive negotiations with employee groups. DMEA is the district’s largest employee group and is used for illustrative purposes.
Compensation Package: Teachers (DMEA) State Average % District Package % FY 2008 4.67% 4.77% FY 2009 4.50% 5.00% FY 2010 3.26% 3.65% FY 2011 2.84% 1.98% FY 2012 3.33% 3.11% FY 2013 3.71% 3.95% FY 2014 3.70% 3.98% FY 2015 3.65% 4.09% FY 2016 2.96% 3.33% FY 2017 3.33% 2.92% FY 2018 2.16% 3.35% FY 2019 1.93% 3.28% FY 2020 2.52% 2.66% FY 2021 2.69% 2.30% FY 2022 TBD 2.40%
While adequate compensation is always the minimum standard, it is difficult to sustain when state funding is insufficient and grows at historically low rates. In recent years, negotiated increases in compensation packages have been more than the increases in State Foundation Aid, measured by the rate of Supplemental State Aid, thus creating a growing budget gap from one year to the next.
3.11%
3.95% 3.98% 4.09%
3.33%2.92%
3.35% 3.28%2.66% 2.62%
2.19%
0.00%
2.00%
2.00%
4.00%
1.25%
2.25%
1.10%1.00%
2.06% 2.30%
2.40%
0%
1%
2%
3%
4%
5%
FY 2012 FY 2013 FY 2014 FY 2015 FY 2016 FY 2017 FY 2018 FY 2019 FY 2020 FY 2021 FY 2022
SUPPLEMENTAL STATE AID VS. COMPENSATION SETTLEMENTS
DMEA Settlement State Allowable Growth
2021 - 2022 Preliminary Budget 195

SUPPLEMENTAL INFORMATION
GLOSSARY
ALLOWABLE GROWTH – The amount by which state cost per pupil and district cost per pupil will increase from one budget year to the next, as of FY 2015 it is known as Supplemental State Aid.
AREA EDUCATION AGENCY (AEA) – A service bureau that provides a variety of programs, services, and other resources including special education to local education agencies located in a certain geographical area.
AREA EDUCATION AGENCY (AEA) SUPPORT – State funding for AEAs that passes through local a school district’s budget.
AT-RISK FUNDING – Funding generated by the supplementary weighting plan for at-risk students used to develop or maintain at-risk programs.
AT-RISK STUDENT – Any identified student who needs additional support and who is not meeting or not expected to meet the established goals of the educational program (academic, personal/social, career/vocational). At-risk students include but are not limited to students in the following groups: homeless children and youth, dropouts, returning dropouts, and potential dropouts.
BOARD BELIEFS – Board-defined goals regarding the governance of school operations that focus the district’s work on behalf of the education of students in Des Moines. Together, Board Beliefs and Student Expectations serve as the overarching goals for the district. The Board Beliefs and Student Expectations were developed in part as the result of public input at a series of Community Conversations.
BOARD OF DIRECTORS (BOARD, SCHOOL BOARD) – The elected or appointed body that has been created according to state law and is vested with responsibilities for the educational mission of the district. In Iowa, the Board is elected by voters.
BOND – A written promise to pay a specific sum of money — called the face value — at a fixed time in the future — called the maturity date — and carrying interest at a fixed rate, usually payable periodically.
BUDGET – A plan of financial operation embodying an estimate of proposed expenditures for a given period or purpose and the proposed means of financing them.
BUDGET GUARANTEE – The minimum amount of budget authority given to the district by the State, regardless of enrollment declines and changes to the State-calculated cost per pupil. The guarantee is a calculation based on the previous year’s budget wherein the new budget cannot be less than 101% of the previous year’s budget authority.
2021 - 2022 Preliminary Budget 196

BUILDING ADMINISTRATION – Activities concerned with overall administrative responsibility for a school.
BUSINESS AND CENTRAL ADMINISTRATION – Activities concerned with paying, transporting, exchanging, and maintaining goods and services for the district. Included are fiscal, human resources, and internal services necessary for operating the district. Also included are activities, other than general administration, which support each of the other instructional and supporting services programs. These activities include planning, research, development, evaluation, information, staff, and data processing services.
CABINET – Superintendent and senior district administrators.
COMMUNITY EDUCATION – Activities that develop knowledge and skills that meet the immediate and long-range educational objectives of adults who, having completed or interrupted formal schooling, have accepted adult roles and responsibilities. Programs include activities to foster the development of fundamental tools of learning, prepare students for a post-secondary career, prepare students for post-secondary education programs, upgrade occupational competence, prepare students for a new or different career, develop skills and appreciation for special interests, or to enrich the aesthetic qualities of life.
DEBT – An obligation resulting from the borrowing of money or from the purchase of goods and services. Debts of local education agencies include bonds, warrants, and notes.
DEBT SERVICE FUND – A fund established to account for the accumulation of resources used to pay long-term debt, including principal and interest.
DISTRICT COST PER PUPIL – A calculated amount of dollars set by the State Foundation Aid Formula that represents the maximum amount of expenditures per student available to the district.
DROPOUT PREVENTION – Dropout Prevention interventions are school- and community-based initiatives that aim to keep students in school and encourage them to complete their high school education. Interventions and services, such as counseling, monitoring, school restructuring, curriculum redesign, financial incentives, and community services are provided to eliminate barriers so students may be successful academically, personally and in a career or vocation. Resources are focused on outcomes in the following three domains: 1) Staying in school, 2) Progressing in school, and 3) completing school.
EARLY INDICATOR SYSTEM (EIS) – A system used to identify students who may be at risk of dropping out of school or who may need social or emotional interventions to improve academic performance.
ENGLISH LANGUAGE LEARNER (ELL) – A student who is in the process of acquiring English proficiency and has a first language other than English or in addition to English.
2021 - 2022 Preliminary Budget 197

EXPENDITURES – Obligations incurred for services rendered and/or goods received that result in decreases in net financial resources.
FIDUCIARY FUNDS – Funds held in a custodial capacity such as Trust Funds.
FISCAL YEAR – An accounting period equal to twelve months. For the district, the fiscal year begins July 1 and ends June 30.
FULL-TIME EQUIVALENT POSITION (FTE) – A measuring unit equal to one full-time position; not necessarily one person (e.g. two 0.5 FTE positions equal 1.0 FTE).
FUND – A self-balancing set of accounts. The accounts of a fund constitute a complete entity, and all of the financial transactions for the particular fund are recorded in them.
FUND BALANCE – A balance that is equal to the excess of a fund’s assets over its liabilities and reserves. A fund balance may be either negative or positive depending on the current activities of the fund.
GENERAL ADMINISTRATION – Activities concerned with establishing and administering policy for operating the district.
GENERAL FUND – The chief operating fund of the district, which accounts for all financial resources of the district except for those required to be accounted for in a different fund.
INSTRUCTION – Teaching activities dealing with direct interaction between teachers and students provided for in or outside of the classroom or any other approved medium, such as a computer.
INSTRUCTIONAL STAFF SUPPORT – Activities associated with assisting instructional staff with the content and process of providing learning experiences for students and staff.
INSTRUCTIONAL SUPPORT LEVY – A levy placed on property values that provides additional funding for district instructional programs including elementary counseling; class-size reduction; and reading, writing, and math recovery.
INTERNAL SERVICE FUNDS – Funds that account for the financing of goods or services provided by one department to other departments on a cost reimbursement basis.
INVESTMENT INCOME – Revenue earned on the investment of idle school district funds. Investments are statutorily limited to money markets and government backed securities.
LEVY – (Verb) To impose taxes or special assessments. (Noun) The total of taxes or special assessments imposed by a governmental unit.
MISSION STATEMENT – The Des Moines Public Schools Exist So That Graduates Possess the Knowledge, Skills and Abilities to Be Successful at the Next Stage of Their Lives.
2021 - 2022 Preliminary Budget 198

NON-INSTRUCTIONAL EXPENDITURES – Activities concerned with providing non- instructional services — such as food services — to students, staff, or the community.
OPERATIONS – Activities concerned with keeping the physical plant clean and ready for daily use. Activities include operating heating, cooling, lighting, and ventilating systems; repairing and replacing facilities and equipment; and the costs of building rental and property insurance.
OTHER FINANCING SOURCES – Other financing sources encompassing all other revenues received from the local level such as refund of prior year expenditures, transfers, etc.
PLANT OPERATION AND MAINTENANCE – Activities concerned with keeping the physical plant open, comfortable, and safe for use; keeping the grounds, buildings, and equipment in effective working condition and state of repair; and maintaining safety in buildings, on the grounds, and in the vicinity of schools.
POLICY GOVERNANCE – A system for organizational governance that defines the role of a board, emphasizing values, vision, and empowerment of both board and staff.
PROPERTY RICH/POOR – A term used to describe the property tax base of a school district based on taxable valuation per student in that district. The higher the valuation per student the more “property rich” the district is, as it can generate more tax dollars than a “property poor” district given the same tax rate.
PROPERTY TAXES – The second largest source of revenue for the district. Property taxes are based on the taxable valuation of all taxable property within the school district. They are certified (independently) by the district, levied by the County Board of Supervisors, and collected and remitted by the County Treasurer.
QUALIFIED ZONE ACADEMY BONDS (QZAB) – A U.S. government debt instrument that allows qualified schools to borrow at nominal interest rates (as low as zero percent) for costs incurred in connection with the establishment of special programs in partnership with the private sector.
REGULAR PROGRAM BUDGET– The district cost per pupil times the certified enrollment.
SOLVENCY RATIO – Calculated ratio equal to the Unreserved/Undesignated fund balance divided by total revenues.
SPECIAL EDUCATION – Education primarily for students with special needs. The programs include pre-kindergarten, kindergarten, elementary, and secondary services for the mentally challenged, physically challenged, emotionally disturbed, and students with learning disabilities.
SPECIAL PROGRAMS – Activities primarily for students with special needs. Special Programs include pre-kindergarten, kindergarten, elementary, and secondary services for talented and gifted,
2021 - 2022 Preliminary Budget 199

the mentally and physically handicapped, emotionally disturbed, at-risk, students with learning disabilities, limited English speaking students, and special programs for other types of students.
SPENDING AUTHORITY – The maximum amount of spending allowed under law based on the combination of district cost per pupil, miscellaneous income, and unspent authority from the previous fiscal year.
STATE (FOUNDATION) AID – Funding provided by the State as part of the state foundation aid formula.
STUDENT EXPECTATIONS – Board-defined deliverables that address educational goals and specific desired outcomes for students. Together, Student Expectations and Board Beliefs serve as the overarching goals for the district. The Student Expectations and Board Beliefs were developed in part as the result of public input at a series of Community Conversations.
STUDENT SUPPORT SERVICES – Activities designed to assess and improve the well- being of students and to supplement the teaching process.
STUDENT TRANSPORTATION – Activities concerned with conveying students to and from school, as provided by State and Federal law. This includes trips between home and school and trips to school activities.
SUPPLEMENTAL STATE AID – Formerly known as Allowable Growth, Supplemental State Aid is the amount by which state cost per pupil and district cost per pupil will increase from one budget year to the next.
SUPPLEMENTAL WEIGHTING – This additional weighting is designed to encourage a particular type of activity by school districts. Supplemental weighting is currently available for activities such as concurrent enrollment, special education, gifted learners, at-risk students, and for non-English speaking students.
TAXES – Compulsory charges levied by a governmental unit for the purpose of financing services performed for the common benefit, such as schools.
TITLE PROGRAMS – Provides federal funding to schools that have high poverty levels. The funding is meant to help students who are at risk of falling behind academically. The funding provides supplemental instruction for students who economically disadvantaged or at risk for failing to meet state standards
UNSPENT SPENDING AUTHORITY – The remaining amount of spending authority at the end of a fiscal year that is carried over into the following fiscal year to determine that year’s maximum amount of spending authority.
2021 - 2022 Preliminary Budget 200

ACRONYMS
The following is a list of the commonly used acronyms used in Des Moines Public Schools.
~A~ ACT American College Testing ADA Americans with Disabilities Act ADA Average Daily Attendance ADM Average Daily Membership AEA Area Education Agency AFSCME American Federation of State, County and Municipal Employees AP Advanced Placement ARRA American Recovery and Reinvestment Act ASBO Association of School Business Officials AVID Advanced Via Individual Determination AYP Adequate Yearly Progress ~B~ BEDS Basic Educational Data Survey BF Business & Finance BRI Basic Reading Inventory ~C~ CFA Common Formative Assessment CFO Chief Financial Officer CGI Cognitively Guided Instruction CHRO Chief Human Resources Officer CIA Curriculum, Instruction & Assessment COO Chief Operating Officer CSIP Comprehensive School Improvement Plan CTE Career & Technology Education ~D~ DE Department of Education DHS Department of Human Services DINA District in Need of Assistance DM Des Moines DMACC Des Moines Area Community College DMEA Des Moines Education Association DMICSD Des Moines Independent Community School District DMPS Des Moines Public Schools DMTRS Des Moines Teacher Retirement System DSM Des Moines
2021 - 2022 Preliminary Budget 201

~E~ EC Education Center ECE Early Childhood Education ECSE Early Childhood Special Education ED Executive Director EEO Equal Employment Opportunity ELA English Language Arts ELDA English Language Development Assessment ELL English Language Learner ES Elementary School ESEA Elementary & Secondary Education Act ~F~ FAA Federal Aviation Administration FAY Full Academic Year FERPA Family Educational Rights and Privacy Act FMLA Family & Medical Leave Act FRPL Free & Reduced Price Lunch FTE Full-Time Equivalency FY Fiscal Year ~G~ GAAP Generally Accepted Accounting Principals GFOA Governmental Finance Officers Association GPA Grade Point Average GT Gifted & Talented ~H~ HBAC Health Benefits Advisory Committee HF House File HR Human Resources HS High School HVAC Heating, Ventilation & Air Conditioning ~I~ IASBO Iowa Association of School Business Officials IB International Baccalaureate IC Infinite Campus IDE Iowa Department of Education IDEA Individuals with Disabilities Education Act IDHS Iowa Department of Human Services IDPH Iowa Department of Public Health IELC Intensive English Language Center IEP Individualized Education Plan / Program IHE Institute of Higher Education IPDM Iowa Professional Development Model IPERS Iowa Public Employees Retirement System ISD Independent Community School District
2021 - 2022 Preliminary Budget 202

ISASP Iowa Statewide Assessment of Student Progress ISEA Iowa Science Education Association ISU Iowa State University ~K~ K Kindergarten ~L~ LEA Local Education Agency LEP Limited English Proficiency LOST Local Option Sales Tax LRE Least Restrictive Environment ~M~ ML Management Limitation MTSS Multi-Tiered System of Supports ~N~ NCES National Center for Education Statistics NCLB No Child Left Behind NPR National Percentile Rank NSS National Standard Score ~P~ PBIS Positive Behavior Intervention & Support PD Professional Development PERL Public Education & Recreation Levy PK Pre-Kindergarten, Preschool PLAS Persistently Low Achieving School PLC Professional Learning Community PLTW Project Lead the Way PMIC Psychiatric Medical Institute for Children PPEL Physical, Plant & Equipment Levy PTA Parent Teacher Association PTO Parent Teacher Organization ~Q~ QZAB Qualified Zone Academy Bond ~R~ RFP Request for Proposal RTI Response to Intervention ~S~ SAT Scholastic Aptitude Test SE Special Education SEA State Education Association SINA School in Need of Assistance
2021 - 2022 Preliminary Budget 203

SIP School Improvement Plan SIS Student Information System SLC Smaller Learning Communities SPED Special Education SRI Scholastic Reading Inventory SRG Standards Referenced Grading SSA Supplemental State Aid STEM Science, Technology, Engineering & Mathematics SWP Statewide Penny SAVE Secure an Advanced Vision for Education ~T~ TLC Teacher Leadership & Compensation ~U~ UEN Urban Education Network USDA U.S. Department of Agriculture ~Y~ YTD Year to Date
2021 - 2022 Preliminary Budget 204

PROPOSED FILING FOR THE FY 2022 CERTIFIED BUDGET
2021 - 2022 Preliminary Budget 205

Think. Learn. Grow.
www.dmschools.org | facebook.com/dmschools | twitter.com/dmschools
Copyright © 2022 FDOKUMEN