Fiscal Year 2018-19 Adopted Budget - City of Pinole
224
Fiscal Year 2018-19 Adopted Budget CITY OF PINOLE, CALIFORNIA
-
Upload
khangminh22 -
Category
Documents
-
view
0 -
download
0
Transcript of Fiscal Year 2018-19 Adopted Budget - City of Pinole

Fiscal Year 2018-19 Adopted Budget
CITY OF PINOLE, CALIFORNIA

i
CITY OF PINOLE
ADOPTED FY 2018-19 BUDGET
TABLE OF CONTENTS Page
INTRODUCTION Transmittal Letter ............................................................................................................ iv
Citywide Officials .......................................................................................................... A-1
Citywide Organizational Chart ...................................................................................... A-3
Budget Overview .......................................................................................................... A-5
Jurisdictional Comparison ......................................................................................... A-6
Budget Process ......................................................................................................... A-7
Budget Calendar ....................................................................................................... A-8
Financial Policies ...................................................................................................... A-9
Accounting Basis .................................................................................................... A-11
Fund Structure ........................................................................................................ A-11
Major General Fund Revenue Sources ................................................................... A-16
Financial Analysis ................................................................................................... A-18
Budget Award ............................................................................................................. A-27
BUDGET SUMMARIES
Summary of Revenue and Expenditures by Department ............................................. B-1
Five-Year Funding Plan (General Fund) .................................................................... B-10
Five-Year Funding Plan (Measure S 2014 Fund) ....................................................... B-11
Summary of Debt Obligations .................................................................................... B-14
Schedule of Transfers ................................................................................................ B-16

ii
GENERAL GOVERNMENT
City Council .............................................................................................................. C-1
City Manager ............................................................................................................ C-4
City Clerk ................................................................................................................. C-8
City Treasurer ........................................................................................................ C-12
City Attorney .......................................................................................................... C-14
Finance .................................................................................................................. C-16
Human Resources ................................................................................................. C-19
General Government.............................................................................................. C-22
Information Systems .............................................................................................. C-26
Cable Access TV ................................................................................................... C-32
POLICE
Police Operations ..................................................................................................... D-1
Police Support Services ........................................................................................... D-9
Police Dispatch (WBCC) ........................................................................................ D-13
Police Grants ......................................................................................................... D-16
FIRE
Fire Operations ......................................................................................................... E-1
PUBLIC WORKS
Administration & Engineering .................................................................................... F-1
Road Maintenance .................................................................................................... F-5
Facility Maintenance ................................................................................................. F-8
NPDES Storm Water............................................................................................... F-12
Park Maintenance ................................................................................................... F-15
Waste Reduction………………………………………………………………………….F-19
Water Pollution Control Plant .................................................................................. F-24

iii
COMMUNITY DEVELOPMENT
Planning .................................................................................................................... G1
Building Inspection ................................................................................................... G-4
Successor Agency Administration ............................................................................ G-7
Housing Administration ............................................................................................ G-9
Code Enforcement ................................................................................................. G-11
RECREATION
Recreation Administration ........................................................................................ H-1
Senior Center ........................................................................................................... H-4
Tiny Tots Child Care ................................................................................................ H-8
Youth Center .......................................................................................................... H-11
Performing Arts ...................................................................................................... H-16
Swim Center .......................................................................................................... H-18
Tennis .................................................................................................................... H-22
CAPITAL PROJECTS
Capital Improvement Program Summary ................................................................... I-1
Capital Project Revenue and Expense Summary ...................................................... I-2
Capital Project Description Sheets ............................................................................. I-5
APPENDIX
Glossary of Terms ..................................................................................................... J-1
Glossary of Acronyms ............................................................................................... J-5
Personnel Position Listing ......................................................................................... J-7
Labor Cost Allocations .............................................................................................. J-9
Resolution Adopting FY 2018-19 Budget ................................................................ J-11
Resolution Adopting FY 2018-19 Appropriation (GANN) Limit ................................ J-13
Resolution Adopting FY 2018-19 Capital Budget .................................................... J-14

This page is intentionally left blank


This page is intentionally left blank
ix

CITY OF PINOLE
ELECTED OFFICIALS AND ADMINISTRATIVE PERSONNEL
JUNE 30, 2018
ELECTED OFFICIALS
Mayor
Mayor Pro Tem
Council Member
Council Member
Council Member
City Treasurer
Tim Banuelos
Peter Murray
Roy Swearingen
Debbie Long
Maureen Toms
Dina Rosales
ADMINISTRATIVE PERSONNEL
City Manager
Assistant City Manager
City Attorney (Contract)
Development Services Director
Finance Director
Police Chief
Fire Chief
City Clerk
Michelle Fitzer
Hector De La Rosa
Eric Casher
Tamara Miller
Andrea Miller
Neil Gang
Scott Kouns
Rosa Acosta
A-1

This page is intentionally left blank
A-2

CITY OF PINOLE – ORGANIZATIONAL CHART
Citizens of Pinole
Police Fire FinanceHuman
Resources
Development
Services
Community Development
Public Works
Information Systems
Pinole Cable TV
Recreation
Mayor & Council
City Treasurer
City Attorney City Clerk
City Manager
Asst. City Manager
A-3

This page is intentionally left blank
A-4

BUDGET OVERVIEW
City Overview
The City of Pinole is a general law city which was incorporated on June 25, 1903. The City is primarily a residential community located in the San Francisco Bay Area on the shores of San Pablo Bay in West Contra Costa County. Interstate-80, which traverses Pinole, connects the San Francisco/Oakland metropolitan area with Sacramento and points east. Pinole is linked to central Contra Costa County which includes the cities of Martinez, Concord, and Pleasant Hill by State Route 4 which begins just north of Pinole and connects with Interstate-680. There are approximately four square miles of land included in Pinole’s boundary. The City’s population at January 1, 2018 was 19,236, according to the California Department of Finance.
Municipal Government
The City operates under a Council-Manager form of government, whereby policies of the City Council are administered by a City Manager who is appointed by the City Council. All municipal departments operate under the supervision of the City Manager. The Council consists of five members who are elected at large for 4-year overlapping terms. The Council elects one of the Council members to serve as Mayor each year.
The City provides the following services: public safety (police and fire), public works, parks and recreation, community development, and general administration services.
A-5

BUDGET OVERVIEW
Jurisdictional Comparison
City of Pinole City of
Hercules City of
San Pablo City of
El Cerrito
Form of Government Council-Manager
General Law Council-Manager
General Law Council-Manager
General Law Council-Manager
General Law
Year Incorporated 1903 1900 1948 1917
Budget Comparison
General Fund Revenue 12,222,628 16,104,294 30,666,427 33,907,573
General Fund Expenditures
11,637,525 15,207,087 31,230,524 33,670,211
Total Full Time Equivalents (FTE)
109.76 80.20 178.4 177.7
Sworn Personnel FTE 27 21 54 46
Demographics
Population 18,946 24,791 30,829 24,378
Annual Percent Change .4 .9 1.1 1.0
Median Age 42.8 37.8 32 44.4
Population per FTE 167 309 173 137
Population per Sworn FTE
681 1,181 571 530
Housing Units 7,161 8,585 9,526 10,789
Average Household Size
2.76 3.03 3.35 2.37
Labor Force 10,000 13,900 14,200 13,800
Unemployment Rate 4.0% 3.1% 7.3% 4.2%
Median Household Income
$74,379 $100,267 $42,746 $88,380
Per Capita Income $34,219 $37,978 $16,874 $45,190
Sources: City of Hercules, City of San Pablo, City of El Cerrito, California Employment Development Department, California Department of Finance, United States Census Bureau
A-6

BUDGET OVERVIEW
The Budget Process
The preparation and submission of the Annual Proposed City Budget is the statutory responsibility of the City Manager. Each department is responsible for preparing the program and capital projects for their area of responsibility. The Finance Department provides the departments with projected salary and benefit costs and performs the first level of review of each budget. Finance personnel also prepare the revenue forecasts and anticipated fund balances.
In April, department managers attend meetings with the City Manager, Assistant City Manager and Finance Director in which analysis of current and projected expenditures takes place and requests are discussed with the City Manager for approval.
The Finance Subcommittee meets in May at which time the departments’ proposed operating budgets are presented to the City Council for further review and preparation for the Budget Workshop.
A budget Public Hearing is held in June where the budget for the upcoming fiscal year is considered by the City Council. Additional meetings may be held during June to discuss the budget if necessary. Active public participation is encouraged following the presentation of the Proposed Budget. Appropriate recommended changes are incorporated into the Adopted Budget document by the Finance Department after follow up discussions. The budget is presented for adoption by the City Council on or before June 30th of each fiscal year.
Monitoring the Budget
Once adopted, the operating budget becomes the main internal control document used to monitor and manage the City’s financial position. The City’s budget level of control is executed at the fund level set by the City’s governing body. Necessary changes to the budget are recommended by department managers and approved by the City Manager before it is presented to the City Council for enactment. Budget amendments deemed necessary are presented to the City Council and are enacted by resolution. Managers are allowed to transfer funds within their respective departments with the approval of the City Manager. Financial reports that highlight variances and proposed adjustments to the budget are presented to City Council for consideration and adoption on a quarterly basis.
A-7

BUDGET OVERVIEW
Budget Calendar
March 23, 2018
•Department FY 2018‐19 Budget requests are due to Finance
April 13, 2018
•Preliminary FY 2018‐19 budget submitted to City manager
April 23, 2018
•Preliminary FY 2018‐19 budget distributed to Department Managers
April 23 ‐May 3, 2018
•Budget Hearings
•City Manager, Asst. City Manager, and Finance Director meet with Department Managers
May 23, 2018
• Finance Subcommittee Meeting
• FY 2018‐19 Proposed Budget
•Review Fiscal Policies
May 29, 2018
• Special City Council Meeting
•Workshop on Proposed FY 2018‐19 Budget
June 19, 2018
•Adoption of FY 2018‐19 Budget and Appropriations Limit
A-8

BUDGET OVERVIEW
Financial Policies
The following Financial Policies are established to ensure that the City’s finances are managed in a sound and prudent manner which will (1) continue to provide for the delivery of quality services, (2) maintain and enhance service delivery as the community grows in accordance with the General Plan, (3) strive for a balanced budget annually, assuring that the City is living within our means, and (4) establish reserves necessary to meet known and unknown future obligations. To achieve these goals the following Financial Policies have been established:
1. Structurally Balanced Budget Policy i. The annual budget will be structurally balanced whereby the
operating budget will be prepared with current year expenditures funded with current year revenue. If a structural imbalance occurs, a plan will be developed and implemented to bring the budget back into structural balance.
2. Reserves Policy
i. The City will establish, dedicate and maintain reserves annually to meet known and estimated future obligations. The City will establish specific reserve accounts which include but are not limited to:
a. General Fund Reserves for Economic Uncertainties equivalent to a minimum 10 percent or 180 days cash on hand of General Fund recurring expenditures;
b. Reserves for depreciation and replacement of vehicles and major equipment;
c. Reserves for maintenance, replacement, and renovations of facilities, parks, landscape maintenance and infrastructure.
If these reserves are used, a plan will be developed and implemented to replenish the funds used.
3. Revenue Policy – One Time Resources
i. The City will strive to maintain a diversified and stable revenue base that is not overly dependent on any land use, major taxpayer, revenue type, restricted revenue, inelastic revenue, or external revenue. The General Fund Budget will be structurally in balance without relying on one-time resources such as proceeds from asset sales, debt refinancing, one-time grants, revenue spikes, budget savings and similar non-recurring revenue. Appropriate uses of one-time resources include establishing and rebuilding the General Fund Reserve, other City established reserves, or early retirement of debt, capital expenditures, reducing unfunded pension liabilities (PERS and OPEB), and other non-recurring expenditures.
A-9

BUDGET OVERVIEW
4. Revenue Policy – User Fees and Charges i. The City of Pinole is empowered to recapture, through fees, up to
the full cost of providing specific services. Regular and consistent review of all fees is necessary to ensure that the costs associated with delivery of individual services have been appropriately identified, and that the City is fully recovering those costs. It is the City’s policy to set user fees at full cost recovery levels, except where a greater community benefit is demonstrated to the satisfaction of the City Council, or when it is not cost effective to do so. The City will recover the costs of new facilities and infrastructure necessitated by the development consistent with state law.
5. Expenditure and Budget Policy
i. The City will deliver service in the most efficient and cost-effective manner. This includes utilizing the services of volunteers in areas where economically viable. The budget will state the objectives of the operating programs, and identify the resources being provided to accomplish the specified objectives.
6. Debt Policy
i. The City will limit the use of debt so as not to place a burden on the fiscal resources of the City and its taxpayers. Long-term borrowing will be limited to capital improvements or projects that cannot be financed from current revenues. When capital projects are financed, the City will amortize the debt within a period not to exceed the expected useful life of the project. The City will limit the total debt ratio (debt guaranteed by the General Fund) to 10% or as required by bond coverage ratios. The debt ratio is calculated by the relationship between the debt and the General Fund revenue.
7. Investment Policy
i. The purpose of this Policy is to define the parameters within which funds are to be managed. In methods, procedures, and practices, the policy formalizes the framework for the City of Pinole’s investment activities that must be exercised to ensure effective and judicious fiscal and investment management of the City’s funds.
A-10

BUDGET OVERVIEW
Accounting and Budget Basis
The City maintains its accounting records in accordance with Generally Accepted Accounting Principles (GAAP) and standards established by the Governmental Accounting Standards Board (GASB). Governmental fund financial statements are reported using the current financial resources measurement focus and the modified accrual basis of accounting. Revenue is recognized when both measurable and available. Expenditures are recognized when the liability is incurred. Debt service obligations are appropriated when due.
Proprietary fund financial statements are reported using the economic resources measurement focus and the accrual basis of accounting. Revenue is recognized when earned and expenses when the liability is incurred regardless of timing of related cash flows.
The basis of budgeting is consistent with the basis of accounting discussed above. Appropriations that are budgeted and not expensed at the end of the year lapse and revert to fund balance.
Fund Structure
The City uses funds to report its current financial position and the results of its operations. Fund accounting is designed to demonstrate legal compliance and to aid in financial management by segregating transactions related to certain governmental functions of activities. A fund is a grouping of related accounts that is used to maintain control over resources that have been segregated for specific activities or objectives. All of the funds of the City can be divided into three categories: governmental funds, proprietary funds and fiduciary funds.
A-11

BUDGET OVERVIEW
GOVERNMENTAL FUNDS
General Fund - 100
The General Fund is used to account for all the general revenues of the City not specifically levied or collected for other City funds and the related expenditures. The major revenue sources for this fund are property taxes, sales taxes, utility users’ tax, franchise fees, business licenses, unrestricted revenues from the State, fines and forfeitures and interest income. Expenditures are made for general administration, public safety, public works, and parks. In accordance with GASB Statement No. 34, the General Fund is classified as a major fund.
Measure S 2006 Fund – 105 and Measure S 2014 Fund – 106
Measure S funds account for the 2006 and 2014 voter-approved half-cent Local Use Tax which levies 0.5% each on all merchandise. These funds are received directly from the State on a monthly basis. Although not legally restricted, the 2006 Local Use Taxes have been pledged by the City Council to fund Public Safety Programs as their highest funding priority and the 2014 Local Use Taxes have been pledged by the City Council to fund Infrastructure Projects as their highest funding priority.
City of Pinole
Governmental Funds
General Fund
Special Revenue
Funds
Debt Service Funds
Capital Projects Funds
Proprietary Funds
Enterprise Funds
Internal Service Funds
Fiduciary Funds
Trust and Agency Funds
A-12

BUDGET OVERVIEW
Special revenue funds account for proceeds that are legally restricted for specific purposes.
Gas Tax Fund – 200
The Gas Tax Fund accounts for the Highway Users Tax Account (HUTA) State imposed excise taxes on gasoline and diesel fuel sales within the City Limits. These taxes are distributed primarily on the basis of population pursuant to formulas specified in Streets and Highways Code Sections 2105, 2106, 2107, 2107.5, and Section 2103. As a result of the Road Repair and Accountability Act of 2017 (SB1 Beall), funds received as part of the Road Maintenance and Rehabilitation Account (RMRA) Section 2106 are also accounted for in this fund. Gas Tax funds are restricted for use in the construction, improvement and maintenance of public streets. These funds support both annual operating and capital projects.
Restricted Real Estate Maintenance Fund - 201
This fund accounts for revenues resulting from the sale or rental of property owned by the former Redevelopment Agency. These resources are used to maintain properties owned by the Successor Agency within the boundaries of the former Redevelopment Agency.
Public Safety Augmentation Fund - 203
The Public Safety Augmentation Fund (PSAF) accounts for monies allocated by the County Auditor-Controller under Prop 172 from the statewide one-half cent sales tax based on a share of statewide taxable sales. These funds are used exclusively for public safety. The receipt of these funds is conditioned on maintenance of effort using base year 1992-93.
Traffic Safety Fund - 205
The Traffic Safety Fund accounts for fines and forfeitures received by the City under Section 1463 of the Penal Code. These funds are used exclusively for official traffic control devices, the maintenance thereof, equipment and supplies for traffic law enforcement and traffic accident prevention, and for the maintenance, improvement, or construction of public streets, bridges, and culverts within the City. Funds shall not be used to pay the compensation of traffic or other police officers. The fund may be used to pay the compensation of school crossing guards who are not regular full-time members of the police department of the City.
Supplemental Law Enforcement Services Fund - 206
Accounts for funds received from the County under AB 3229 which enacted the Citizens Option for Public Safety (COPS) Program through which funds could be annually
A-13

BUDGET OVERVIEW
provided in the State budget for local law enforcement jurisdictions. The minimum allocation for public agencies is $100,000, which is the amount which has been historically allocated to Pinole.
Storm Water Fund - 207
Accounts for assessments collected by the County via property tax bills pursuant to the National Pollution Discharge Elimination System (NPDES) Regulations, a federally mandated program. Assessments are levied at $35 per Equivalent Runoff Unit (ERU). Revenue estimates are based on the number of ERU's multiplied by the adopted rate.
Recreation Fund - 209
The Recreation Fund accounts for program fees, fundraising efforts and donations from Recreation programs. Resources are used towards staffing and maintenance costs to operate the programs on a full-cost recovery basis.
Building and Planning Fund - 212
The Building and Planning Fund accounts for fees collected for building permits and plan check fees. Fees collected are used to cover the cost involved in inspections and plan checks performed.
Refuse Management Fund - 213
Accounts for resources received via Richmond Sanitary Service for fees imposed under AB 939 of $0.83 per can per month on all residential customers in Pinole. These revenues are restricted to programs and activities that encourage and promote recycling of solid waste products and generate source reduction for sanitary landfills used for refuse disposal.
Measure J Fund - 215
Accounts for special override sales tax revenues collected by the Contra Costa Transportation Authority (CCTA) and reapportioned to the cities for local street projects. The City must submit a checklist each year to confirm compliance with a Growth Management Program. Estimates of annual funding are provided by the CCTA, and jurisdiction allocations are based on a formula split (50/50) between population and road mileage.
Housing Fund - 285
This fund receives tax increment funds through Redevelopment activity representing 20% set-aside for housing activities. Funds are expended for approved housing activities.
A-14

BUDGET OVERVIEW
Capital projects funds are used to account for the acquisition or construction of facilities and other capital assets.
Debt service funds are used to account for accumulations of resources that are restricted, committed, or assigned to expenditures for principal and interest of general long-term debt.
PROPRIETARY FUNDS
Enterprise funds are used to account for goods or services from such activities a fee is
charged to external users.
Sewer Enterprise Fund - 500
Accounts for annual fees charged to residents and businesses for sewer utilities. Sewer user fees are charged in the amount specified by City Council Resolution (Section 13.04.040 PMC). Fees are used to operate the Pinole Wastewater Treatment Plant which services the Pinole and Hercules areas. The cost of operations is shared between the two cities using a cost sharing formula based on sewage inflows by each city. The City’s Sewer Enterprise Fund meets the criteria to be classified as a major fund.
Cable Access TV Fund - 505
Accounts for revenue received from cable franchise fees, video production charges, and PEG access fees. PEG access fees are designated for equipment purchases.
Internal service funds are used to account for activities that provide goods or services
to other funds, departments, or agencies of the primary government and its component
units, or to other governments on a cost-reimbursement basis. The City uses internal
service funds to account for the costs of information services and equipment reserves.
FIDUCIARY FUNDS
Agency funds are used to maintain records of assets and financial activities on behalf of a third party.
Redevelopment Obligation Retirement Fund – 750
The Redevelopment Obligation Retirement Fund (RORF) was created to account for the close-out activities of the Successor Agency to the Pinole Redevelopment Agency.
Pledged property tax revenues will continue to be provided to the City for timely payment of outstanding redevelopment bond debt obligations, to reimburse the City for
A-15

BUDGET OVERVIEW
Administrative staff time up to $250,000 per year, and other enforceable obligations in accordance with the Recognized Obligations Payment Schedule (ROPS).
Major General Fund Revenue Sources
Property Tax is an ad valorem tax imposed on real property (land and permanently attached improvements such as buildings) and tangible personal property (movable property) located within the state. The fixed statutory rate is 1% of assessed valuation. Assessed value is based on the 1975 property values with subsequent increases limited to 2% or CPI growth, whichever is less. However, when there is a change in property ownership, property renovation or new construction, property is reappraised at its full current market value. Proposition 8 allows the County Assessor to decrease these assessed values when property values decline and recapture these valuations back to the original amounts in the following years if and when property values increase.
The General Fund receives on average 20% of the total ad valorem property taxes levied (excluding voter approved tax overrides pledged for the retirement of bonded debt) on property located within its boundaries (exclusive of the Redevelopment Project Areas). In 2018-19 local secured and unsecured property taxes are forecast to be $2,410,794 which comprises 17% of the General Fund revenues. Property Tax settlements are received in December, April and June.
It is anticipated that the City’s Redevelopment Successor Agency will also receive approximately $1.2 million in property taxes “pledged” from assessments falling within the boundaries of the former Redevelopment Project Areas, as may be required to liquidate all remaining Enforceable Obligations of the now dissolved Pinole Redevelopment Agency. The remainder of the “pledged” revenues will be allocated by the County Auditor-Controller to all local taxing entities, pursuant to the provisions of the Redevelopment Dissolution Legislation (ABx1-26 and AB-1484).
This tax is imposed and collected by the County. Contra Costa County is on a Teeter Plan which dictates payment of 100% of all taxes levied; the County absorbs the delinquencies under this plan, which are offset by delinquency penalties (flat 10%) and late payment interest charges (1.5% compounded monthly).
Supplemental Property Tax includes property taxes apportioned to the City by the County from the 1% Tax Rate of the Supplemental Roll Allocation in accordance with Revenue and Taxation Code 75.50.
A-16

BUDGET OVERVIEW
Property Transfer Tax is levied at $0.55 for each $1,000 value of real property transferred in the City; the County Recorder imposes these fees and remits them to the City. Estimates are based on historical experience.
Sales Tax is the General Fund’s single largest revenue source. The City’s 9.25% Sales Tax is levied on all merchandise and includes the 1% Bradley Burns Sales Tax, .5% Measure S 2006 Sales and Use Tax, and .5% Measure S 2014 Sales and Use Tax. These funds are received directly from the State on a monthly basis. Sales taxes represent approximately 26% of the General Fund revenues at $3.6 million.
The City uses HdL to estimate sales taxes which are based on economic indicators, historical data and projections for gross sales from newly opened stores and restaurants. The Proposed Budget is based on a conservative 95% of the HdL projection. The 2018-19 estimates are 2% greater than the estimate of projected collections for 2017-18.
Utility User Taxes (UUT) are levied in accordance with Chapter 3.26 of the Municipal Code, amended in 2012, which levies an 8% tax on the value public utilities services consumed within the City limits for electricity, natural gas, and telecommunications. Low income households are eligible for exemption from payment. Historically, the tax has been authorized for fixed time intervals of eight years in length and is subject to voter ratification for extension beyond December of 2020. The Electorate ratified renewal of the taxing authority for another eight years at the last General Election (November 2012). UUT is estimated to be $1.9 million, 14%, of the General Fund revenues in fiscal year 2018-19.
Franchise Tax is levied at 5% on public utilities and other corporations who furnish gas, electric, water, Cable TV, refuse or similar services to citizens living within city boundaries. The various fees are delineated in franchise agreements and are paid directly to the city by these franchisees. Estimates are based on historical experience considering contract amendments which impact future years. Franchise Taxes are estimated to be approximately $744 thousand, 6% of the General Fund revenue.
Business License Tax is assessed on all businesses doing business within City limits in accordance with Municipal Code Title 5. The City charges business license tax in accordance with the provisions of Government Code 37101. Pinole’s tax is computed based on a flat tax of $138 per year combined with a variable tax component based on number of employees engaged in each business. Business License taxes are estimated to be approximately $325 thousand, 3% of the General Fund revenues.
Transient Occupancy Tax (Motel or Bed Tax) is a 10% tax levied by the City for the privilege of occupying quarters on a transient basis (Chapter 3.24 of Municipal Code).
A-17

BUDGET OVERVIEW
This tax is imposed upon persons staying 30 days or less in a motel or lodging facility. The tax rate is set at the discretion of the City Council, subject to ratification by the City’s electorate. Transient Occupancy taxes are estimated to be approximately $465 thousand, 4% of the General Fund revenues.
Motor Vehicle In-lieu is the City’s share of motor vehicle license fees levied, collected and apportioned by the State. The Vehicle License Fee (VLF), also called the “motor vehicle in-lieu tax” is a tax on the ownership of registered motor vehicles which takes the place of taxation of this personal property. The VLF is paid annually at the time vehicle licenses are renewed based on current value adjusted for depreciation. Estimated FY 2018-19 revenue is $1.7 million, 12% of General Fund revenues.
Homeowner's Property Tax Rebates (HOPTR) The City is reimbursed for property taxes lost due to the homeowner's property tax exemption. Estimates are based on historical experience and county estimates. Payments are routed through the county from the State to the City and are usually received in April and July. No increase over the amount projected for 2017-18 is expected in 2018-19.
Dispatch Services are provided to the cities of Hercules and San Pablo under an Intergovernmental Service Sharing agreement. A portion of the costs of this activity are reimbursed by the City of Hercules and City of San Pablo. The current reimbursement commitment of $1,086,656 covers approximately 68% of the activity’s budget.
Rent is received on leased property owned by the City. The principal City facility rental is a long-term (15-year) lease of the Pinole Post Office building with the United States Postal Service, which includes cost escalators at five year intervals. The third and final renewal/extension period began on September 1, 2010. Current annual lease payments are $81,450.
Financial Analysis
The City finances its Operating Activities to the public with revenue derived from a variety of sources. City staff uses information obtained from historical data, actual costs, long and short term trends, estimates from professional consultants and County and State agencies to update the projected revenues for the current fiscal year and for the proposed fiscal year.
Revenues are estimated conservatively based upon staff’s best judgment. Estimates are not increased without solid evidence that the individual revenues are likely to be received.
A-18

BUDGET OVERVIEW
Revenue Overall, the City’s finances have continued to show signs of recovery. The Proposed FY 2018-19 Budget continues to follow a conservative approach to the City’s finances with modest improvements in order to begin to rebuild our community services. Revenues including our property tax and sales tax receipts continue to improve. Revenue estimates for sales and property taxes are currently projected at 95% of the total revenue projected by our property and sales tax consultant, HdL. Assuming revenue is realized at or above our consultants estimate, it is possible that by fiscal year end they will be adjusted upward. Property Tax is the second largest General Fund revenue stream. The true number for FY 2018-19 property taxes will not be apparent until the tax roll is established. HdL has carefully analyzed the three most important factors involved in projecting property taxes:
1) the Consumer Price Index on parcels, which did not decrease in value (due to the application of Proposition 8) during the recession;
2) the valuation increase due to change of ownership, and the most volatile factor;
3) the recapture of valuation (per Proposition 8) due to increases in the market
value of properties. The County Assessor determines which properties have increased in valuation and which properties under Proposition 8 should be restored to the pre-recession valuation. Thus, it is possible that property taxes could turn out to be anywhere from a few thousand to as much as $200,000 more than projected. Sales Taxes are the City’s largest source of revenues in the General Fund and here too a conservative approach has been taken in estimating the projected revenues. According to HdL, sales tax revenues have steadily increased over the past couple of years. The increase can be attributed to not only a spike in the personal spending but also the infill of businesses at our shopping centers including the new Gateway Plaza Shopping Center. General Fund In FY 2018-19, the City’s primary operating fund, the General Fund, is projected to generate a surplus of $305,909. While this is good news, there are some obligations which have yet to be addressed and the potential impact is still being determined. One of the largest potential impacts is the change in PERS discount rates estimated by California Public Employees’ Retirement System (CalPERS) to change from its current rate of 7.50% down to 7.00% by FY 2020-21. Staff has included five-year projections
A-19

BUDGET OVERVIEW
for the General Fund and Measure S 2006 and 2014 funds that take the projected change in PERS rates into consideration. General Fund revenue is projected at $707,670 more than current year revenue estimates. This is largely due to an increase in projected dispatch revenue stemming from extending dispatch services the City of San Pablo. Department expenditure budgets are mostly status quo with increases built in to reflect MOU increases for contracts that extend through FY 2018-19 and increases in employee benefit costs. Measure S 2006 Measure S 2006 FY 2018-19 revenue estimates are $26,600 higher than current year revenue estimates. Expenditures are projected at $161,520 less than current year projections primarily the result of reducing overtime and allocating 50% of Battalion Chief salary and benefits to the General Fund. The operating budget is otherwise status quo with a projected $499,666 use of fund balance due to a $50,000 carry forward from FY 2017-18 and the allocation of $400,000 towards the purchase of a reserve fire engine at the City Council’s direction during the May 29th Budget Workshop. Measure S 2006 funds are used primarily to fund personnel and overtime in the Police and Fire departments. Measure S 2014 Measure S 2014 revenue estimates are projected at $26,600 higher than current year revenue projections. Expenditures are projected at $189,063 less than current year estimates. Revenue is projected to exceed expenditures by $94,937. Measure S 2014 funds are used to fund major arterial and residential street work, purchase new equipment, vehicles and computers, address some of the deferred maintenance on City facilities, add staff, other community oriented projects, and to build General Fund reserves. The decrease in expenditure appropriations is primarily attributed to funding allocations for infrastructure and projects funded and/or completed in the current fiscal year, and benefits for a position budgeted in FY 2017-18 with full benefits filled with an employee with less benefit costs. Fund Balance
Fund balance is defined as the net position of a governmental fund (difference between assets, liabilities, deferred outflows of resources, and deferred inflows of resources). As a practical matter, the City prepares its budget using working capital, resources (cash) available to fund day-to-day operations (calculated as current assets minus current liabilities).
A-20

BUDGET OVERVIEW
Deficit Funds
Some of the City’s operating funds have long standing deficits as the result of expenditures exceeding budgeted revenues during the early years of the recession. Staff continues to analyze funds cost recovery ability and provides quarterly updates to the City Council. In addition, a nexus fee study is planned in the current fiscal year to review all City fees. With the unwinding of the Successor Agency, it can be anticipated that current salary costs funded by the Successor Agency in the amount of $250,000 will terminate with the General Fund absorbing the costs. Use of Fund Balance The operating budget includes using fund balance and carryover funds accumulated from prior years in the following funds, in order to offset anticipated deficit spending and/or to appropriate fund balances for one time expenditures in FY 2018-19:
Measure S 2006 -499,666 NPDES Storm Water -2,405 Building and Planning -271,803 Refuse Management -56,448 Housing Fund -84,383 Lighting and Landscape District -8,072 Sewer Enterprise -11,511
The deficits in some of these funds are not “structural” in nature. For example, the fee revenues received by the Building and Planning Fund can only be used to cover the costs for the services performed. Often inspection fees are collected in the fiscal year before the inspections are actually performed. Major Non-General Fund Revenue Sources Gas Tax Fund Revenues are projected at $804,375, $367,774 above current year revenue estimates. This is the result of the recently adopted Governors budget which provides $21,571 for loan repayments over a three year period to repay funds the State borrowed from the General Fund, and $315,100 for Road Maintenance and Rehabilitation Account (RMRA) to provide additional funding for local streets and roads . Expenditures are projected at $436,601 for FY 2018-19, a decrease of $26,190 compared to the current fiscal year. The capital budget which allocates funding for streets and road repair is under development and will be presented to Council on July 17, 2018.
A-21

BUDGET OVERVIEW
Police Grant Funds The Police Department receives a variety of grants and funding from federal and state governments. Funding is received from the Supplemental Law Enforcement Services Fund (SLESF) in the amount of $100,000 per year to provide funding for a portion of a Police Officer and a Canine Officer’s salary. Funding is also received from the West Contra Costa County School District in the amount of $320,000 to fund two School Resource Officers (SROs). Fines and forfeitures received under Section 1463 of the Penal Code go into the Traffic Safety Fund to fund School Crossing Guards. Lastly, funding is received from the Public Safety Augmentation Fund under Proposition 172 to fund public safety services. These funds are being used to offset the costs of one SRO previously funded from WCCUSD. Recreation Funds For all Recreation Services, the fiscal policy direction of the City Council is that the goal of Recreation Programs are to be fully funded through their own user fees and community donations generated through on-going fundraising efforts. This continues to be a struggle each year. A nexus fee study is planned for this fiscal year to determine if program fees are equitable. FY 2018-19 revenue is projected to be $12,001 less than the current year revenue. This is largely as a result of decreased participation in Youth Center and Day Camp programs as a result of reduced staffing and the need to maintain student-to-teacher ratios; discontinued breakfast at the Senior Center; Pinole Area Senior Foundation contribution is no longer available; and, a shift in requiring online enrollment for programs versus walk-ins. Expenditures are projected to be $132,451 higher than current year expenditure appropriations. This is largely due to an increase benefits and cost-of-living increases, Senior Center flooring and chair replacement costs included in FY 2018-19, and an increase in maintenance and structure improvement contracts. Expenditures are projected to exceed revenue by $370,902; as a result, staff is proposing an operating contribution from the General Fund. Building and Planning Fund FY 2018-19 revenues of $768,050 are projected to be $271,803 less than proposed expenditures of $1,039,853. As noted earlier this does not necessarily mean that the fund is not balanced. Often fees are received for development services in the fiscal year prior to when they are rendered; this results in a mismatch of revenues to expenditures since accounting for governmental funds is on a modified accrual basis. Also, development fees are conservatively estimated and may very well increase by the end of the fiscal year. The need for Development Services fluctuates from year to year and it is expected that in some years the fund balance will be used to cover some of the costs from fees received in prior years. Fees are set for the services with the expectation that over the
A-22

BUDGET OVERVIEW
period of several years the total fees collected will not exceed the cost of services plus enough working capital to cover operations. User fees for Development Services will be included as part of the nexus fee study planned for this fiscal year. Cable Television Fund It is the direction of the City Council that the Pinole Community Television (PCTV) activity becomes self-sustaining through the development of a full cost recovery fiscal plan. This means that the Cable Services will have to generate enough revenues from contracts, user fees, sponsorships and donations to cover all operating, maintenance and capital equipment costs. FY 2018-19 revenue is projected to be $245,810, $178,736 less than expenditures of $424,546. Accordingly, a continued $55,000 operating contribution funded by Measure S 2014 is proposed to cover program revenue deficiencies. In addition, staff is recommending an operating contribution of $123,736 allocation from General Fund to cover the balance of the projected deficit. Efforts are underway to fully analyze all the services provided by PCTV and the costs associated to provide the services. Fees for PCTV will be reviewed as part of the nexus fee study planned this fiscal year. Once that analysis has been completed, Staff will present the finding to the City Council outlining those services, which are profitable, and those which are not. Wastewater Fund
REVENUE
The Wastewater Fund remains the City’s most stable operation in the City’s budget and is consistent with the City’s Rate Analysis model which projects a positive fund balance of $11.4 million, at fiscal year ending June 30, 2018. For FY 2018-19, “Pinole Only” operating revenues are projected at $5,217,654. These annual revenues will continue to fund operations, which are shared on a percentage basis of flow with the City of Hercules. It should be noted, that the current rate structure was designed to achieve a large fund balance until 2017-18 at which point the Fund Balance would be reduced by $600,000 annually to pay a portion of the debt service attributed to the State loan of $26.6 million. The City of Pinole is financing the entire portion of our share ($26.6 million) of the Water Pollution Control Plant Upgrade Project through a low interest loan from the State Revolving Fund (SRF) Loan. Construction of the upgrade project began in May of 2016 with an estimated completion date of Spring 2019. EXPENDITURES
Expenditures for the Wastewater Fund include three components; plant operations, the collection system and capital improvements at the treatment plant. Operational costs at
A-23

BUDGET OVERVIEW
the plant are shared with the City of Hercules based on wastewater inflows for treatment. The budget also included funding for the rehabilitation or replacement of the Pinole collection system, which is funded 100% by Pinole ratepayers. For capital improvements at the plant, the cities of Pinole and Hercules share costs equally on a 50/50 basis. Operational Costs
The total operational budget for FY 2018-19 is $3,697,317. Of this amount and based on the flow formula, the City of Pinole’s share of the “treatment activities” varies monthly from 47% to 51% (51% is $1,885,632). The City of Pinole bills the City of Hercules on a monthly basis for their share of the costs. Equipment Replacement Fund Established Through the rate structure, the City is now including for the six year in a row, a budget to establish reserves for replacement of its assets at the plant. This has always been a goal and now that a revenue source is available, we are able to initiate this financially prudent practice. The equipment replacement reserve account will provide for a “pay-as-you-go” method for the long-term replacement of physical capital equipment, infrastructure and buildings, which are obsolete, or at the end of their useful life. The depreciation schedule is based on the total value of the current assets and the long-term economic life of those assets. In FY 2013-14, based on the then depreciated amount of existing assets, a total of $580,000 was necessary to establish replacement funds for anticipated outdated equipment. With the agreement in place with the City of Hercules, which states they will pay for 50% of equipment at the Plant, their share of the depreciation was $290,000. Staff is proposing to increase the equipment replacement allocation to $340,000. Collection System
The FY 2018-19 proposed budget for the Collection System is $2,385,251. In FY 2013-14, City crews began an inflow and infiltration detection program utilizing smoke testing and flow monitoring. This is in an effort to reduce the amount of extraneous flow entering into the City’s sewer collection system. These activities are mandated by the recently issued Regional Water Quality Control Board operating permit for the plant. Included in the amount listed above, is an appropriation of $395,000 funding sewer main-line collection system renovations, and $1.2 million funding upgrades to the the Hazel Street Pump Station. Capital Improvement Projects
The City Council adopted a Five-Year Capital Improvement Plan on August 15, 2017. Staff anticipates returning to City Council on July 17, 2018 with a Proposed FY 2018-23 Five-Year Capital Improvement Plan with adoption on August 21, 2018.
A-24

BUDGET OVERVIEW
Staff will continue progress on the Water Pollution Control Plant Upgrade Project in FY 2018-19 with estimated project completion in Spring of 2019. Compensation and Benefits
Salaries and benefits make up the largest component of General Fund expenditures and represent all personnel-related costs. Current salary and benefit schedules are available online at: www.ci.pinole.ca.us/personnel/salary.html. There are currently four union-represented groups in the City: Pinole Police Employees Association, International Association of Firefighters Local 1230, Public Employees Union – Local 1, and AFSCME Local 512.
Pension Plans
The City contributes to the California Public Employees’ Retirement System (“PERS”), a cost-sharing, multiple-employer, public employee, defined benefit, pension plan. PERS provides retirement and disability benefits, annual cost-of-living adjustments, and death benefits to plan members and beneficiaries. PERS acts as a common investment and administrative agent for participating public entities within the State of California. Benefit provisions and all other requirements are established by state statute and City ordinance. Copies of PERS’ annual financial report may be obtained from their executive office: 400 P Street, Sacramento, CA 95814. Funding Policy: Miscellaneous Plan participants are required to contribute 8% of their annual covered salary, while Safety Plan participants are required to contribute 9% of their annual covered salary. The City as employer is required to contribute for the period July 1, 2018 to June 30, 2019 at an actuarially determined rate of 38.103% and 47.318% of annual covered payroll for miscellaneous and safety employees respectively. The City entered into cost-sharing agreements with its union-represented and unrepresented employees whereby the City pays the employer contribution up to a cap of 8.509% and 16.000% for its miscellaneous and safety employees respectively. Employer contributions in excess of the 8.509% and 16.000% cap are shared (50% each) between the City and the employees. Other Post-Employment Benefits
In addition to the retirement pension benefits described above, the City sponsors and administers a single-employer healthcare plan for its employees. The plan includes healthcare coverage to long-service retirees. At retirement, employees can elect Blue Shield, Kaiser, PERS Care, or PERS Choice medical coverage through the City at the City’s expense.
Employees hired before July 1, 2010 receive a City contribution toward their health premium equal that provided to current active employees. Employees hired after July 1, 2010 receive a City contribution toward their retiree health premium in an amount
A-25

BUDGET OVERVIEW
described by Government Code Section 22893 (the PERS vesting schedule) as shown below:
Credited Years of Service Percentage of Employer Contribution 10 50% 11 55% 12 60% 13 65% 14 70% 15 75% 16 80% 17 85% 18 90% 19 95%
20 or more 100%
Funding Policy: The City’s contribution for each retiree is capped at the Kaiser BayArea/Sacramento family premium. The premium as of July 1, 2018 is $2,027.64 per month. The City is currently funding the benefits on a pay-as-you-go basis. Risk Management
The City manages risk of loss related to torts, theft of, damage to, and destruction of assets, errors and omissions, injuries to employees, and natural disasters by participating in a public entity risk pool established under the Joint Exercise of Powers Act of the State of California. The City is a member of the Municipal Pooling Authority (MPA) of Northern California.
MPA provides coverage against the following types of risk of loss under the terms of the joint-powers agreement:
Type of Coverage (Deductible) Coverage Limits Liability ($25,000) including errors and omissions for public officials $29,000,000All Risk Fire and Property ($5,000) $1,000,000,000Workers’ Compensation (no deductible) $50,000,000Vehicle Physical Damage ($3,000 for Police, $2,000 all others) $250,000
A-26

BUDGET OVERVIEW
For the fourth consecutive year, the City of Pinole has received the Operating Budget Excellence Award from the California Society of Municipal Finance Officers (CSMFO) for its annual Operating Budget. The City previously received the Meritorious Award for its fiscal years 2006 through 2011 Operating Budgets.
The award represents a significant achievement by the City. It reflects the commitment of the City Council and the City staff in meeting the highest principles of government budgeting. To receive this award, the City had to satisfy nationally recognized guidelines for effective budget presentation.
A-27

This page is intentionally left blank

Notes
2,037,205 2,201,877 1,210,567 1,344,448 1,251,195 1,945,456 3,833,795 3,606,395 2,627,758 1,876,318 2,066,623 1,459,321 687,737 717,013 699,362 763,252 812,417 685,689
1,553,895 1,647,297 855,964 209,203 ‐ ‐ 105,929 23,435 17,971 47,385 60,467 ‐ 47,705 61,096 55,612 27,084 35,125 16,491 56,895 26,159 6,241 3,377 4,242 576
38,162 38,876 31,172 364,079 529,686 968,609 77,060 (18,559) (2,813)82,215 81,510 76,664 79,036 4,171 34,433 84,739 17,355 50,138 1,909 16,099 11,931
13,321,427 13,182,479 10,751,141 49,398 200,000 ‐ [1,2]
13,370,825 13,382,479 10,751,141
64,538 81,942 63,177 133,617 112,444 92,009 229,431 123,878 143,016
3,699 5,722 8,036 312,911 200,331 113,782 383,415 403,152 305,320 309,598 275,138 226,822
1,223,439 1,101,421 1,212,203 2,660,649 2,304,028 2,164,365
2,502,583 2,566,750 2,172,937 1,017,905 942,507 542,483 1,038,836 1,116,412 1,135,952 2,600,212 3,266,865 1,593,559 7,159,537 7,892,534 5,444,931
229,699 105,332 79,293 31,851 31,926 28,614
538,801 428,408 373,762 159,086 199,490 135,839 959,437 765,157 617,508
2,548 7,749 6,004 2,237 210 ‐ ‐ ‐ ‐
4,785 7,959 6,004
‐ 5,837 ‐ ‐ 5,837 ‐
554,467 326,081 505,000 [3]11,338,874 11,301,596 8,737,808
5,000 30,000 ‐ [2]11,343,874 11,331,596 8,737,808
1,977,553 1,850,883 2,013,333
3,232,117 5,209,670
5,209,670 7,060,553
[1] General Reserve allocation. Not for operations.[2] Refer to Schedule of Transfers on page B‐16 for details.[3] Refer to Debt Obligations on B‐14 and B‐15 for details.
CITY OF PINOLEBUDGET SUMMARIES
313 ‐ Utility Users Tax 1,912,350 1,930,000 314 ‐ Franchise Taxes 712,350 744,128
Fund: 100 ‐ General FundRevenue:
311 ‐ Property Taxes 2,560,503 2,587,392
312 ‐ Sales and Use Taxes 3,638,966 3,685,921
2015‐2016
Actual
2016‐2017
Actual
2017‐2018
Revised
Budget
2017‐2018
Actual Thru Mar‐
18
2018‐2019
Proposed
324 ‐ Other Grants 49,437 49,437
322 ‐ Federal Grants 6,545 ‐ 323 ‐ State Grants 66,600 35,000
315 ‐ Other Taxes 780,000 790,000 321 ‐ Intergovernmental Taxes 1,539,950 1,736,706
351 ‐ Fines and Forfeiture 54,050 59,050 361 ‐ Public Safety Charges 1,344,283 1,123,939
342 ‐ Other Fees 3,000 60,500 343 ‐ Abatement Fees 2,000 4,000
332 ‐ Permits 53,500 76,700 341 ‐ Review Fees 57,905 30,000
384 ‐ Other Revenue 46,752 14,000 392 ‐ Proceeds from Sale of Property 11,750 11,000
381 ‐ Rental Income 81,450 81,450 383 ‐ Reimbursements 14,748 4,276
370 ‐ Interest and Investment Income 55,000 55,000
Department: 11 ‐ City Manager Total: 110,668 141,871 Department: 12 ‐ City Clerk Total: 236,016 226,183
Sources Total: 13,770,829 14,478,499
Expenditures:Department: 10 ‐ City Council Total: 113,248 130,636
Revenue Total: 13,570,829 14,278,499 399 ‐ Transfers In 200,000 200,000
Division: 117 ‐ General Government Total: 1,430,137 1,451,337 Administrative Total: 2,826,709 2,902,646
Department: 15 ‐ Finance Department Total: 401,812 455,345 Department: 16 ‐ Human Resources Total: 310,609 389,020
Department: 13 ‐ City Treasurer Total: 8,444 11,434 Department: 14 ‐ City Attorney Total: 215,775 96,820
Public Safety Total: 8,191,762 8,885,009
Division: 341 ‐ Administration/Engineering Total: 127,091 137,078
Division: 223 ‐ Dispatch WBCC Total: 1,463,189 1,598,024 Division: 231 ‐ Fire Total: 2,575,750 2,978,161
Division: 221 ‐ Police Operations Total: 3,060,890 3,228,746 Division: 222 ‐ Police Support Services Total: 1,091,933 1,080,079
Division: 461 ‐ Planning Total: 8,345 9,893 Division: 462 ‐ Building Inspection Total: 59,122 ‐
Division: 345 ‐ Park Maintenance Total: 248,473 236,311 Public Works Total: 864,201 819,410
Division: 342 ‐ Road Maintenance Total: 51,823 55,914 Division: 343 ‐ Facility Maintenance Total: 436,814 390,107
481 ‐ Debt Service 768,300 783,300 Sub‐Total: 12,718,439 13,472,952
Division: 554 ‐ Youth Center Total: ‐ ‐ Department: 55 ‐ Recreation Total: ‐ ‐
Division: 465 ‐ Code Enforcement Total: ‐ 72,694 Community Development Total: 67,467 82,587
Fund: 100 ‐ General Fund Net Results 718,824 305,909
499 ‐ Transfers Out 133,566 499,638 Expenditure Total: 12,852,005 13,972,590
FUND BALANCE, JULY 1
FUND BALANCE, JUNE 30
7,060,553
7,779,377
7,779,377
8,085,286
RPTTF and Passthrough Payments 579,690 1,200,000
B-1

Notes
CITY OF PINOLEBUDGET SUMMARIES
2015‐2016
Actual
2016‐2017
Actual
2017‐2018
Revised
Budget
2017‐2018
Actual Thru Mar‐
18
2018‐2019
Proposed
1,959,773 1,909,172 1,454,639 5,853 443 6,362 ‐ ‐ 18,680
1,965,626 1,909,615 1,479,681
1,124,953 1,055,123 821,355 ‐ 58,993 206,301
555,295 655,666 561,656 [1]1,680,249 1,769,782 1,589,313
285,377 139,834 (109,632)
2,252,628 2,538,005
2,538,005 2,677,838
2,065,627 1,896,338 1,243,683 2,398 262 6,519
2,068,025 1,896,600 1,250,202
‐ 48,786 40,417 ‐ 2,500 ‐ ‐ 120,000 ‐
103,618 135,848 81,334 30,616 ‐ ‐
134,234 307,134 121,751
38,157 44,162 32,384 ‐ ‐ ‐
18,683 11,589 34,637 56,840 55,752 67,021
53,101 15,697 34,194 202,807 3,229 29,472
‐ ‐ ‐ 59,054 5,882 6,475
314,962 24,809 70,141
2,964 6,946 1,961 38,964 6,946 1,961
441,000 841,364 ‐ [2]
986,000 1,236,004 260,873
1,082,025 660,596 989,329
406,885 1,488,910
1,488,910 2,149,506
[1] Carry over $50,000 for reserve fire engine purchase; $400,000 towards the purchase of a new engine. Use of fund balance .[2] Refer to Schedule of Transfers on B‐16 for details.
FUND BALANCE, JULY 1 2,677,838 2,048,252
FUND BALANCE, JUNE 30 2,048,252 1,598,586
FUND BALANCE, JULY 1 2,149,506 2,030,480
FUND BALANCE, JUNE 30 2,030,480 2,125,417
Division: 115 ‐ Finance Department Total: 5,000 4,865 Division: 117 ‐ General Government Total: 125,000 145,000
Revenue Total: 1,921,700 1,946,600
Expenditures:Division: 114 ‐ City Attorney Total: 45,000
Fund: 106 ‐ MEASURE S‐2014
370 ‐ Interest and Investment Income 2,700 1,000 383 ‐ Reimbursements 6,500 ‐
Fund: 105 ‐ Measure S ‐2006Revenue
312 ‐ Sales and Use Taxes 1,919,000 1,945,600
Expenditure Total: 2,557,786 2,396,266
Fund: 105 ‐ Measure S ‐2006 Net Results (629,586) (449,666)
Division: 223 ‐ Dispatch WBCC Total: 25,000 ‐ Division: 231 ‐ Fire Total: 854,949 951,046
Revenue Total: 1,928,200 1,946,600
Expenditures:Division: 221 ‐ Police Operations Total: 1,677,837 1,445,220
Revenue312 ‐ Sales and Use Taxes 1,919,000 1,945,600 370 ‐ Interest and Investment Income 2,700 1,000
Division: 223 ‐ Dispatch WBCC Total: 25,000 ‐ Division: 231 ‐ Fire Total: 359,760 314,663
Administrative Total: 325,000 274,865
Division: 221 ‐ Police Operations Total: 104,554 106,306
Division: 118 ‐ Information Systems Total: 150,000 125,000 Division: 119 ‐ Cable Access TV Total: ‐ ‐
‐
Division: 345 ‐ Park Maintenance Total: 55,000 15,000 Public Works Total: 444,412 448,829
Division: 343 ‐ Facility Maintenance Total: 184,966 227,592 Division: 344 ‐ NPDES Storm Drain Total: 150,000 150,000
Public Safety Total: 489,314 420,969
Division: 341 ‐ Administration/Engineering Total: 54,446 56,237
Fund: 106 ‐ MEASURE S‐2014 Net Results (119,026) 94,937
499 ‐ Transfers Out 775,000 707,000
Expense Total: 2,040,726 1,851,663
Division: 551 ‐ Recreation Administration Total: 7,000 ‐ Recreation Total: 7,000 ‐
B-2

Notes
CITY OF PINOLEBUDGET SUMMARIES
2015‐2016
Actual
2016‐2017
Actual
2017‐2018
Revised
Budget
2017‐2018
Actual Thru Mar‐
18
2018‐2019
Proposed
‐ 120,000 ‐ ‐ 120,000 ‐
49,398 ‐ ‐ 49,398 ‐ ‐
49,398 ‐ ‐
(49,398) 120,000 ‐
75,586 26,188
26,188 146,188
417,474 365,347 354,727 928 317 916
418,401 365,664 355,643
270,790 391,415 221,049 ‐ ‐ ‐ ‐ 747 53
270,790 392,162 221,102
270,790 392,162 221,102
147,611 (26,498) 134,541
155,357 302,968
302,968 276,470
2,700 2,725 1,825 34,000 36,211 5,342
‐ 5,274 ‐ 36,700 44,211 7,167
48,762 23,142 21,424 48,762 23,142 21,424
48,762 23,142 21,424
(12,062) 21,069 (14,257)
143,851 131,789
131,789 152,858
164,902 184,740 115,740 357 (4) 706
165,259 184,736 116,446
‐ 144,472 108,722 ‐ 144,472 108,722
‐ 144,472 108,722
165,259 40,264 7,724
56,776 222,036
222,036 262,300
FUND BALANCE, JULY 1 146,188 271,188
FUND BALANCE, JUNE 30 271,188 396,188
Fund: 160 ‐ EQUIPMENT RESERVERevenue
385 ‐ Indirect Cost Allocations 125,000 125,000
Fund: 160 ‐ EQUIPMENT RESERVE Net Results 125,000 125,000
Fund: 200 ‐ Gas Tax FundRevenue
321 ‐ Intergovernmental Taxes 528,732 804,375
Department: 22 ‐ Police Department Total: ‐ ‐
Expense Total: ‐ ‐
Revenue Total: 125,000 125,000
ExpenseDivision: 222 ‐ Police Support Services Total: ‐ ‐
Division: 343 ‐ Facility Maintenance Total: ‐ ‐ Department: 34 ‐ Public Works Total: 462,791 436,601
ExpenseDivision: 341 ‐ Administration/Engineering Total: 462,791 ‐ Division: 342 ‐ Road Maintenance Total: ‐ 436,601
370 ‐ Interest and Investment Income 500 ‐ Revenue Total: 529,232 804,375
384 ‐ Other Revenue ‐ ‐ Revenue Total: 37,175 37,175
Fund: 201 ‐ Restricted Real Estate Maintenance FundRevenue
342 ‐ Other Fees 3,175 3,175 381 ‐ Rental Income 34,000 34,000
Expense Total: 462,791 436,601
Fund: 200 ‐ Gas Tax Fund Net Results 66,441 367,774
FUND BALANCE, JULY 1 276,470 342,911
FUND BALANCE, JUNE 30 342,911 710,685
Fund: 203 ‐ Public Safety Augmentation FundRevenue
321 ‐ Intergovernmental Taxes 155,000 174,069 370 ‐ Interest and Investment Income 500 500
Expense Total: 47,500 37,175
Fund: 201 ‐ Restricted RE Maint. Fund Net Results (10,325) ‐
ExpenseDivision: 343 ‐ Facility Maintenance Total: 47,500 37,175
Department: 34 ‐ Public Works Total: 47,500 37,175
FUND BALANCE, JULY 1 152,858 142,533
FUND BALANCE, JUNE 30 142,533 142,533
Fund: 203 ‐ Public Safety Augmentation Net Results 4,643 23,163
Department: 22 ‐ Police Department Total: 150,857 151,406
Expense Total: 150,857 151,406
Revenue Total: 155,500 174,569
ExpenseDivision: 221 ‐ Police Operations Total: 150,857 151,406
FUND BALANCE, JULY 1 262,300 266,943
FUND BALANCE, JUNE 30 266,943 290,106
B-3

Notes
CITY OF PINOLEBUDGET SUMMARIES
2015‐2016
Actual
2016‐2017
Actual
2017‐2018
Revised
Budget
2017‐2018
Actual Thru Mar‐
18
2018‐2019
Proposed
75,512 13,118 ‐ 480,000 320,000 164,000 555,512 333,118 164,000
569,842 346,787 277,957 569,842 346,787 277,957
569,842 346,787 277,957
(14,330) (13,669) (113,957)
72,012 57,682
57,682 44,013
50,994 43,889 13,350 188 40 330
51,182 43,929 13,679
10,849 14,256 7,089 2,809 ‐ ‐
13,659 14,256 7,089
37,523 29,672 6,591
43,796 81,319
81,319 110,992
143,942 139,416 100,000 85 35 245
144,027 139,452 100,245
91,915 100,137 65,761 91,915 100,137 65,761
52,111 39,315 34,484
19,661 71,772
71,772 111,088
263,990 239,503 170,363 902 ‐ ‐ 103 (78) 94 ‐ ‐ 378
264,995 239,425 170,836
161,106 255,169 177,522 161,106 255,169 177,522
103,889 (15,744) (6,686)
(10,168) 93,720
93,720 77,976
44,013 72,072
FUND BALANCE, JUNE 30 72,072 118,069
FUND BALANCE, JULY 1 110,992 142,708
FUND BALANCE, JUNE 30 142,708 182,000
FUND BALANCE, JULY 1 111,088 114,606
FUND BALANCE, JUNE 30 114,606 114,606
Division: 341 ‐ Administration/Engineering Total: ‐ ‐ Expense Total: 26,284 18,458
Revenue Total: 58,000 57,750
ExpenseDivision: 227 ‐ Police Grants Total: 26,284
Fund: 205 ‐ Traffic Safety Fund
FUND BALANCE, JULY 1
Fund: 204 ‐ Police GrantsRevenue
323 ‐ State Grants ‐ ‐
Expense Total: 291,941 274,003
Fund: 204 ‐ Police Grants Net Results 28,059 45,997
ExpenseDivision: 227 ‐ Police Grants Total: 291,941 274,003
Department: 22 ‐ Police Department Total: 291,941 274,003
324 ‐ Other Grants 320,000 320,000 Revenue Total: 320,000 320,000
Revenue351 ‐ Fines and Forfeiture 57,750 57,750 370 ‐ Interest and Investment Income 250 ‐
ExpenseDivision: 227 ‐ Police Grants Total: 96,657 100,000
Expense Total: 96,657 100,000
370 ‐ Interest and Investment Income 175 ‐ Revenue Total: 100,175 100,000
Fund: 205 ‐ Traffic Safety Fund Net Results 31,716 39,292
Fund: 206 ‐ Supplemental Law Enforcement Svc FundRevenue
323 ‐ State Grants 100,000 100,000
18,458
384 ‐ Other Revenue ‐ ‐ Revenue Total: 315,943 315,768
332 ‐ Permits ‐ ‐ 370 ‐ Interest and Investment Income 175 ‐
Fund: 206 ‐ Suppl. Law Enf. Svc Fund Net Results 3,518 ‐
Fund: 207 ‐ NPDES Storm Water FundRevenue
321 ‐ Intergovernmental Taxes 315,768 315,768
Fund: 207 ‐ NPDES Storm Water Fund Net Results 10,523 (2,405)
ExpenseDivision: 344 ‐ NPDES Storm Drain Total: 305,420 318,173
Expense Total: 305,420 318,173
FUND BALANCE, JULY 1 77,976 88,499
FUND BALANCE, JUNE 30 88,499 86,094
B-4

Notes
CITY OF PINOLEBUDGET SUMMARIES
2015‐2016
Actual
2016‐2017
Actual
2017‐2018
Revised
Budget
2017‐2018
Actual Thru Mar‐
18
2018‐2019
Proposed
39,105 34,136 19,844 373,125 461,156 267,387 187,548 192,118 139,444 230,297 132,005 45,681
2,000 69,008 31,486 49,464 (2,702) 47,344
654 53,659 28,020 ‐ 10,470 1,250 440 714 290
882,634 950,565 580,747 182,839 91,000 ‐ [1]
1,065,473 1,041,565 580,747
158,955 185,100 79,035 530,149 516,228 296,610 104,016 102,151 80,699 141,759 159,388 106,763 40,415 28,530 3,487 34,785 36,980 27,118 34,248 51,151 39,841 4,177 4,820 2,631 2,220 2,726 2,417
1,050,723 1,087,073 638,600
1,050,723 1,087,073 638,600
14,750 (45,508) (57,853)
242,495 257,245
257,245 211,736
1,308 1,561 155 796,675 497,828 568,599 189,970 130,071 146,082 66,578 46,559 52,701
250 5,035 ‐ 2,161 43 2,529 29,802 19,850 16,920
1,086,744 700,946 786,986
197,118 223,545 207,238 528,777 558,324 458,489 725,895 781,870 665,727
725,895 781,870 665,727
360,848 (80,923) 121,259
373,727 734,575
734,575 653,652
[1] Refer to Schedule of Transfers on page B‐16 for details. Only enough to balance will be transferred.
Division: 552 ‐ Senior Center Total: 361,700 321,500 Division: 553 ‐ Tiny Tots Total: 191,557 195,589
Fund: 209 ‐ Recreation FundRevenue
Division: 551 ‐ Recreation Administration Total: 27,500 14,000
Division: 558 ‐ Memorial Hall Total: 5,600 5,600 Division: 559 ‐ Tennis Total: 200 500
Division: 556 ‐ Performing Arts Total: 45,270 48,280 Division: 557 ‐ Swim Center Total: 7,500 38,920
Division: 554 ‐ Youth Center Total: 51,297 76,375 Division: 555 ‐ Day Camp Total: 54,141 32,000
Division: 552 ‐ Senior Center Total: 429,591 470,458 Division: 553 ‐ Tiny Tots Total: 114,304 119,030
Sources Total: 789,765 1,155,666
ExpenseDivision: 551 ‐ Recreation Administration Total: 188,626 192,844
Revenue Total: 744,765 732,764 399 ‐ Transfers In 45,000 422,902
Division: 558 ‐ Memorial Hall Total: 4,838 4,838 Division: 559 ‐ Tennis Total: 3,495 3,250
Division: 556 ‐ Performing Arts Total: 40,007 43,950 Division: 557 ‐ Swim Center Total: 38,691 80,811
Division: 554 ‐ Youth Center Total: 165,235 202,913 Division: 555 ‐ Day Camp Total: 38,428 37,572
332 ‐ Permits 913,000 530,750 341 ‐ Review Fees 105,000 160,000
Fund: 209 ‐ Recreation Fund Net Results (233,450) 0
Fund: 212 ‐ Building & PlanningRevenue
315 ‐ Other Taxes 1,800 1,800
Department: 55 ‐ Recreation Total: 1,023,215 1,155,666
Expense Total: 1,023,215 1,155,666
FUND BALANCE, JULY 1 211,736 (21,714)
FUND BALANCE, JUNE 30 (21,714) (21,713)
Revenue Total: 1,088,350 768,050
ExpenseDivision: 461 ‐ Planning Total: 441,719 355,014
370 ‐ Interest and Investment Income 1,500 ‐ 384 ‐ Other Revenue 12,500 31,000
342 ‐ Other Fees 54,050 44,500 343 ‐ Abatement Fees 500 ‐
Expense Total: 1,432,067 1,039,853
Fund: 212 ‐ Building & Planning Net Results (343,717) (271,803)
Division: 462 ‐ Building Inspection Total: 990,348 684,839 Department: 46 ‐ Community Development Total: 1,432,067 1,039,853
FUND BALANCE, JULY 1 653,652 309,935
FUND BALANCE, JUNE 30 309,935 38,132
B-5

Notes
CITY OF PINOLEBUDGET SUMMARIES
2015‐2016
Actual
2016‐2017
Actual
2017‐2018
Revised
Budget
2017‐2018
Actual Thru Mar‐
18
2018‐2019
Proposed
491,875 70,850 45,973 1,339 38 2,113
493,214 70,888 48,086
‐ ‐ 38,009 49,437 94,478 64,992 49,437 94,478 103,001
49,437 94,478 103,001
443,777 (23,590) (54,916)
293,179 736,956
736,956 713,366
338,773 356,789 ‐ 1,886 (357) 2,340
340,659 356,431 2,340
36,675 ‐ ‐
57,185 110,103 104,423 599,760 6,326 6,947 656,945 116,429 111,369
693,620 116,429 111,369
(352,962) 240,002 (109,029)
1,129,872 776,911
776,911 1,016,913
‐ ‐ 4,700 93,496 33,332 (1,368)64,182 72,253 54,190
‐ 35,000 5,500 85,849 145,456 8,209 243,527 286,041 71,231
55,172 145,703 136,652 55,172 145,703 136,652
188,355 140,338 (65,421)
1,011,498 1,199,853
1,199,853 1,340,191
FUND BALANCE, JULY 1 713,366 660,904
FUND BALANCE, JUNE 30 660,904 604,456
FUND BALANCE, JULY 1 1,016,913 1,132,978
FUND BALANCE, JUNE 30 1,132,978 1,235,987
FUND BALANCE, JULY 1 1,340,191 1,379,448
FUND BALANCE, JUNE 30 1,379,448 1,295,065
Fund: 213 ‐ Refuse Management FundRevenue
323 ‐ State Grants 60,060 60,060 370 ‐ Interest and Investment Income 1,000 ‐
Expense Total: 113,522 116,508
Fund: 213 ‐ Refuse Mgmt Fund Net Results (52,462) (56,448)
Division: 346 ‐ Waste Reduction Total: 113,522 116,508 Department: 34 ‐ Public Works Total: 113,522 116,508
Revenue Total: 61,060 60,060
ExpenseDivision: 344 ‐ NPDES Storm Drain Total: ‐ ‐
ExpenseDivision: 117 ‐ General Government Total: 42,772 47,049
Division: 341 ‐ Administration/Engineering Total: 100,033 107,812
370 ‐ Interest and Investment Income 1,000 ‐ Revenue Total: 304,590 303,590
Fund: 215 ‐ Measure C and J FundRevenue
324 ‐ Other Grants 303,590 303,590
Fund: 285 ‐ Housing FundRevenue
342 ‐ Other Fees ‐ ‐ 370 ‐ Interest and Investment Income 75,000 35,000
Expense Total: 188,525 200,581
Fund: 215 ‐ Measure C and J Fund Net Results 116,065 103,009
Division: 343 ‐ Facility Maintenance Total: 45,720 45,720 Department: 34 ‐ Public Works Total: 145,753 153,532
ExpenseDivision: 464 ‐ Housing Administration Total: 223,996 202,136
Expense Total: 223,996 202,136
393 ‐ Loan/Bond Proceeds 81,000 10,500 Revenue Total: 263,253 117,753
381 ‐ Rental Income 72,253 72,253 384 ‐ Other Revenue 35,000 ‐
Fund: 285 ‐ Housing Fund Net Results 39,257 (84,383)
B-6

Notes
CITY OF PINOLEBUDGET SUMMARIES
2015‐2016
Actual
2016‐2017
Actual
2017‐2018
Revised
Budget
2017‐2018
Actual Thru Mar‐
18
2018‐2019
Proposed
34,711 34,222 21,923 ‐ ‐ ‐
5,000 5,000 ‐ [1]39,711 39,222 21,923
14,599 21,462 10,775.60 13,701 26,642 8,457.68 28,300 48,104 19,233.28
28,300 48,104 19,233.28
11,411 (8,882) 2,689.23
12,499 23,910
23,910 15,028
15,000 15,000 11,250 15,000 15,000 11,250
15,094 15,154 11,334 15,094 15,154 11,334
(94) (154) (84)
433 339
339 185
‐ ‐ 1,000 250,000 250,000 ‐ 250,000 250,000 1,000
21,712 20,233 43,990 21,712 20,233 43,990
228,288 229,767 (42,990)
287,211 515,499
515,499 745,266
‐ 70,364 ‐ 382,636 ‐ ‐ 100,000 250,000 ‐ 482,636 320,364 ‐
218,206 22,340 ‐ 218,206 22,340 ‐
264,430 298,024 ‐
(397,000) (132,570)
(132,570) 165,454
[1] Refer to Schedule of Transfers on B‐16 for details.
Revenue Total: 38,870 48,565
ExpenseDivision: 347 ‐ Landscape & Lighting PVR North 26,726 30,976
362 ‐ Public Works Charges ‐ 43,565 399 ‐ Transfers In 5,000 5,000
Fund: 310 ‐ Lighting & Landscape DistrictsRevenue
321 ‐ Intergovernmental Taxes 33,870 ‐
Expense Total: 46,637 56,637
Fund: 310 ‐ Lighting & Landscape Districts Net Results (7,767) (8,072)
Division: 348 ‐ Landscape & Lighting PVR South 19,911 25,661 Department: 34 ‐ Public Works Total: 46,637 56,637
FUND BALANCE, JULY 1 15,028 7,261
FUND BALANCE, JUNE 30 7,261 (811)
Fund: 317 ‐ Pinole Valley Caretaker FundRevenue
381 ‐ Rental Income 15,000 15,000 Revenue Total: 15,000 15,000
Fund: 317 ‐ Pinole Vly Caretaker Fund Net Results 251 223
ExpenseDivision: 345 ‐ Park Maintenance Total: 14,749 14,777
Expense Total: 14,749 14,777
FUND BALANCE, JULY 1 185 436
FUND BALANCE, JUNE 30 436 659
Fund: 325 ‐ City Street ImprovementsRevenue
351 ‐ Fines and Forfeiture ‐ ‐ 399 ‐ Transfers In 225,000 200,000
Expense Total: 225,000 200,000
Fund: 325 ‐ City Street Improvements Net Results ‐ ‐
Revenue Total: 225,000 200,000
ExpenseDivision: 343 ‐ Facility Maintenance Total: 225,000 200,000
FUND BALANCE, JULY 1 745,266 745,266
FUND BALANCE, JUNE 30 745,266 745,266
ExpenseDivision: 343 ‐ Facility Maintenance Total: 250,000 200,000
Expense Total: 250,000 200,000
399 ‐ Transfers In 250,000 200,000 Revenue Total: 250,000 200,000
Fund: 377 ‐ Arterial Streets Rehabilitation FundRevenue
322 ‐ Federal Grants ‐ ‐ 323 ‐ State Grants ‐ ‐
Fund: 377 ‐ Arterial Streets Rehab. Fund Net Results ‐ ‐
FUND BALANCE, JULY 1 165,454 165,454
FUND BALANCE, JUNE 30 165,454 165,454
B-7

Notes
CITY OF PINOLEBUDGET SUMMARIES
2015‐2016
Actual
2016‐2017
Actual
2017‐2018
Revised
Budget
2017‐2018
Actual Thru Mar‐
18
2018‐2019
Proposed
‐ 200 ‐ 6,117,245 6,282,893 4,217,682
20,137 808 20,449 ‐ 681 ‐ 212 ‐ ‐
10,000 ‐ ‐ 6,147,593 6,284,582 4,238,131
3,803,755 3,714,255 2,126,670 604,968 657,209 449,844 910,225 413,216 517,770
5,318,947 4,784,679 3,094,283
5,318,947 4,784,679 3,094,283
828,646 1,499,902 1,143,848
8,353,055 9,181,701
9,181,701 10,681,603
‐ 2,762 2,541 1,414,569 31,790 3,263,607 1,414,569 34,552 3,266,148
7,846 ‐ ‐ ‐ (475) 1,597,682
32,395 134 ‐ 40,241 (341) 1,597,682
40,241 (341) 1,597,682
1,374,329 34,893 1,668,466
1,648,548 3,022,876
3,022,876 3,057,769
44,070 45,713 18,988 108,251 87,337 32,455 [1]46,213 57,874 54,190 [2]17,899 4,550 630 55,000 96,364 ‐ [3]271,432 291,838 106,264
285,865 298,898 236,544 285,865 298,898 236,544
(14,432) (7,061) (130,281)
(16,524) (30,956)
(30,956) (38,016)
[1] Inclusive of $45,360 for City Council and $19,440 for Planning Commission meetings.[2] PEG Access Fees is only available for capital equipment.[3] Refer to Schedule of Transfers on B‐16 for details. Only enough to balance will be transferred.
383 ‐ Reimbursements ‐ ‐ 392 ‐ Proceeds from Sale of Property ‐ ‐
363 ‐ Sewer Enterprise Charges 6,242,610 6,937,332 370 ‐ Interest and Investment Income 10,250 ‐
Fund: 500 ‐ Sewer Enterprise FundRevenue
342 ‐ Other Fees ‐ ‐
Division: 644 ‐ WPCP Equipment/Debt Service 526,948 526,275 Department: 64 ‐ Sewer Total: 5,545,948 6,948,843
ExpenseDivision: 641 ‐ Sewer Treatment Plant/Shared 3,896,162 4,037,317 Division: 642 ‐ Sewer Collections 1,122,838 2,385,251
393 ‐ Loan/Bond Proceeds ‐ ‐ Revenue Total: 6,252,860 6,937,332
Revenue Total: 18,277,900 6,371,178
ExpenseDivision: 642 ‐ Sewer Collections ‐ ‐
Fund: 503 ‐ Plant Expansion FundRevenue
370 ‐ Interest and Investment Income ‐ 3,500 383 ‐ Reimbursements 18,277,900 6,367,678
Expense Total: 5,545,948 6,948,843
Fund: 500 ‐ Sewer Enterprise Fund Net Results 706,912 (11,511)
FUND BALANCE, JULY 1 10,681,603 11,388,515
FUND BALANCE, JUNE 30 11,388,515 11,377,005
Department: 64 ‐ Sewer Total: 18,277,900 6,371,178
Expense Total: 18,277,900 6,371,178
Division: 643 ‐ Sewer Projects/Shared 18,265,300 6,367,678 Division: 644 ‐ WPCP Equipment/Debt Service 12,600 3,500
FUND BALANCE, JULY 1 3,057,769 3,057,769
FUND BALANCE, JUNE 30 3,057,769 3,057,769
384 ‐ Other Revenue 2,100 ‐ 399 ‐ Transfers In 183,566 178,736
36501 ‐ Video Production 119,585 147,810 36502 ‐ PEG Fees 59,000 58,000
Fund: 503 ‐ Plant Expansion Fund Net Results ‐ ‐
Fund: 505 ‐ Cable Access TVRevenue
314 ‐ Franchise Taxes 36,788 40,000
Expense Total: 399,091 424,546
Fund: 505 ‐ Cable Access TV Net Results 1,948 ‐
FUND BALANCE, JULY 1 (38,016) (36,068)
FUND BALANCE, JUNE 30 (36,068) (36,068)
Revenue Total: 401,039 424,546
ExpenseDivision: 119 ‐ Cable Access TV Total: 399,091 424,546
B-8

Notes
CITY OF PINOLEBUDGET SUMMARIES
2015‐2016
Actual
2016‐2017
Actual
2017‐2018
Revised
Budget
2017‐2018
Actual Thru Mar‐
18
2018‐2019
Proposed
657,982 666,102 342,050 (664,289) (566,532) ‐
(6,307) 99,570 342,050
(6,307) 99,570 342,050
(282,837) (289,144)
(289,144) (189,574)
250,000 250,000 253,500 13,446 6,380 8,151 18,617 ‐ ‐
114,451 97,357 14,638 396,514 353,737 276,289
240,658 231,493 184,777 240,658 231,493 184,777
155,856 122,244 91,512
23,953,160 23,359,189
FUND BALANCE, JULY 1 (189,574) (189,574)
FUND BALANCE, JUNE 30 (189,574) (189,574)
TOTAL APPROPRIATIONS ALL FUNDS 46,826,117 36,737,059
‐ ‐
Fund: 750 ‐ Recognized Obligation Retirement FundRevenue
311 ‐ Property Taxes 253,500 250,000 370 ‐ Interest and Investment Income ‐ ‐
Expense Total: ‐ ‐
Fund: 525 ‐ Information Systems Total: ‐ ‐
Fund: 525 ‐ Information SystemsExpense
Division: 118 ‐ Information Systems Total: 736,239 729,824 461 ‐ Indirect cost allocations (736,239) (729,824)
Expense Total: 253,500 250,000
Fund: 750 ‐ RORF Net Results ‐ ‐
Division: 463 ‐ Successor Agency to RDA Total: 253,500 250,000
Revenue Total: 253,500 250,000
Expense
381 ‐ Rental Income ‐ ‐ 393 ‐ Loan/Bond Proceeds
B-9

General Fund ‐ 100 FY 2017‐18 2018‐19 2019‐20 2020‐21 2021‐22 2022‐23
Adopted Budget Proposed Projected Projected Projected Projected
REVENUE:
PROPERTY TAX 3,140,193 3,787,392 3,825,266 3,863,519 3,902,154 3,941,175
SALES TAX 3,638,966 3,685,921 3,759,639 3,834,832 3,911,529 3,989,759
UTILITY USERS TAX 1,912,350 1,930,000 1,968,600 2,007,972 2,048,131 2,089,094
FRANCHISE TAX 712,350 744,128 759,011 774,191 789,675 805,468
OTHER TAXES 780,000 790,000 805,800 821,916 838,354 855,121
OTHER REVENUE 3,386,970 3,341,058 3,407,879 3,476,037 3,545,557 3,616,469
Total Revenue 13,570,829 14,278,499 14,526,195 14,778,466 15,035,400 15,297,087
TRANSFERS IN 200,000 200,000 200,000 200,000 200,000 200,000
Total Sources 13,770,829 14,478,499 14,726,195 14,978,466 15,235,400 15,497,087
EXPENDITURES:
SALARIES 6,750,194 6,989,511 7,199,196 7,415,172 7,637,627 7,866,756
BENEFITS & INSURANCE 3,258,827 4,204,050 5,088,321 5,464,762 5,814,800 6,140,692
OTHER OPERATING EXPENSES 1,941,118 1,496,091 1,537,982 1,581,045 1,625,314 1,670,823
DEBT SERVICE 768,300 783,300 798,300 818,300 838,300 858,300
TRANSFERS OUT 133,566 499,638 300,000 300,000 300,000 300,000
Total Expenditures 12,852,005 13,972,590 14,923,798 15,579,279 16,216,042 16,836,572
Net Results 718,824 305,909 ‐397,603 ‐800,813 ‐1,180,641 ‐1,539,485
Fund Balance, July 1 7,060,553 7,779,377 8,085,286 7,687,683 6,886,870 5,706,229
Fund Balance, June 30 7,779,377 8,085,286 7,687,683 6,886,870 5,706,229 4,166,744
Measure S ‐2006 Fund ‐ 105 FY 2017‐18 2018‐19 2019‐20 2020‐21 2021‐22 2022‐23
Adopted Budget Proposed Projected Projected Projected Projected
REVENUE:
SALES TAX 1,919,000 1,945,600 1,984,512 2,024,202 2,064,686 2,105,980
OTHER REVENUE 9,200 1,000 1,000 1,000 1,000 1,000
Total Revenue 1,928,200 1,946,600 1,985,512 2,025,202 2,065,686 2,106,980
EXPENDITURES:
SALARIES 1,592,223 1,417,301 1,459,820 1,503,615 1,548,723 1,595,185
BENEFITS & INSURANCE 443,241 535,811 806,864 886,705 960,118 1,027,213
OTHER OPERATING EXPENSES 451,889 443,154 455,563 468,318 481,431 494,911
DEBT SERVICE 70,433 ‐ ‐ ‐ ‐ ‐
Total Expenses 2,557,786 2,396,266 2,722,247 2,858,638 2,990,272 3,117,309
Net Results ‐629,586 ‐449,666 ‐736,735 ‐833,435 ‐924,586 ‐1,010,329
Fund Balance, July 1 2,677,838 2,048,252 1,598,586 861,851 28,416 ‐896,170
Fund Balance, June 30 2,048,252 1,598,586 861,851 28,416 ‐896,170 ‐1,906,499
CITY OF PINOLE
FIVE‐YEAR PROJECTIONS
B-10

CITY OF PINOLE
FIVE‐YEAR PROJECTIONS
MEASURE S‐2014 ‐ 106 FY 2017‐18 2018‐19 2019‐20 2020‐21 2021‐22 2022‐23
Adopted Budget Proposed Projected Projected Projected Projected
REVENUE:
SALES TAX 1,919,000 1,945,600 1,984,512 2,024,202 2,064,686 2,105,980
OTHER REVENUE 2,700 1,000 1,000 1,000 1,000 1,000
Total Revenue 1,921,700 1,946,600 1,985,512 2,025,202 2,065,686 2,106,980
EXPENDITURES:
SALARIES 264,064 243,363 250,664 258,184 265,929 273,907
BENEFITS & INSURANCE 88,837 44,774 111,730 124,236 135,548 145,673
OTHER OPERATING EXPENSES 552,825 500,526 514,541 528,948 543,758 558,984
CAPITAL PROJECTS 360,000 356,000 365,968 376,215 386,749 397,578
TRANSFERS OUT 775,000 707,000 650,000 650,000 650,000 650,000
Total Expenses 2,040,726 1,851,663 1,892,903 1,937,583 1,981,985 2,026,142
Net Results ‐119,026 94,937 92,609 87,619 83,701 80,838
Fund Balance, July 1 2,149,506 2,030,480 2,125,417 2,218,026 2,305,645 2,389,346
Fund Balance, June 30 2,030,480 2,125,417 2,218,026 2,305,645 2,389,346 2,470,185
ASSUMPTIONS:
[1] 3% Salary increases included each year
[2] 2.8% operating expenses applied based on four year average.
[3] PERS classic rate increases applied to all employees including PEPRA which currently accounts for approximately 25% of staffing.
[4] PERS rate increases are reflected at 13.009% cap on misc. and 16.000% cap on safety employee/employer 50% share formula.
[5] All other benefits increased 5% each year.
B-11

CITY OF PINOLEMEASURE S 2014 FIVE-YEAR FUNDING PLAN
PROPOSED JUNE 19, 2018
Functional Area Notes FY 2015-16 FY 2016-17 FY 2017-18 FY 2018-19 FY 2019-20
Transfer to General Fund Reserve $ - $200,000 $200,000 $200,000 $200,000Total $ - $200,000 $200,000 $200,000 $200,000
Cable TelevisionOperating Subsidy 55,000$ 96,364$ 55,000$ 55,000$ 55,000$ Equipment-Replace Mixer and Convert to Digital Projection [1] 31,000$ -$ -$ -$ -$
Total 86,000$ 96,364$ 55,000$ 55,000$ 55,000$
City FacilitiesPaint Tiny Tots Building -$ 8,000$ $ - $ - $ - Replace Carpet at Senior Center with Tile 5,000$ -$ $ - $ - $ - Replace Roof at Senior Center 254,000$ -$ -$ -$ -$ Roof Repairs/Replace Roof Flashing - All City Facilities 25,000$ -$ -$ 164,000$ 108,000$
Replace HVAC at Senior Center 60,000$ -$ $ - $ - $ - Engineering Building Slab Displacement @ Tiny Tots $ - 5,000$ $ - $ - $ - Replace Carpeting with Tile in the Council Break Room $ - 5,000$ -$ $ - $ -
Paint City Hall (Inside and Outside) -$ -$ 35,000$ 35,000$ -$ Total 344,000$ 18,000$ 35,000$ 199,000$ 108,000$
City HallTablets (3) City Manager, Development Services Director and City Clerk
4,500$ -$ -$ -$ -$
Replace SIRE Records System Software (Laser Fiche) -$ 25,000$ 25,000$ -$ -$
Replace Financial System (Finance and Personnel) [2] 50 000$ 150 000$ $ $ $
APROVED MAY 5, 2015 - AMENDED JUNE 21, 2016 & JUNE 20, 2017
Replace Financial System (Finance and Personnel) [2] 50,000$ 150,000$ -$ ‐$ -$ Annual Measure S 2014 Audit 2,500$ 2,500$ 2,500$ 2,365$ 2,365$ Sales Tax Analysis 2,500$ 2,500$ 2,500$
Total 57,000$ 177,500$ 30,000$ 4,865$ 4,865$
RecreationOperating Subsidy - Swim Center 36,000$ 45,000$ 45,000$ 45,000$ 45,000$ Summer Sounds in the Park- Twice a Summer 2,500$ 2,500$ 2,500$ 2,500$ 2,500$ Cinema in the Park-3 Times a Summer 1,500$ 1,500$ 1,500$ 1,500$ 1,500$ Community Service Commission 2,000$ 2,000$ 2,000$ 2,000$ 2,000$ Annual Tree Lighting 1,000$ 1,000$ 1,000$ 1,000$ 1,000$ Replace CLASS Registration [3] -$ 50,000$ 45,000$ -$ -$
Total 43,000$ 102,000$ 97,000$ 52,000$ 52,000$
Development ServicesProject Manager (Full Time 50% Measure S and 50% from Other Funding Sources)
63,701$ 70,067$ 54,446$ 56,237$ 59,049$
Supplemental Funding - Skate Park Project 51,175$ $ - -$ -$ -$ Initiate Internal Services Fund-Depreciation to Replace 2 Vehicles/Year Excludes Heavy Equipment
5,000$ 5,000$ 5,000$ 5,000$ 5,000$
Total 119,876$ 75,067$ 59,446$ 61,237$ 64,049$
NOTES:[1] Funding for capital equipment and maintenace is provided through PEG Access Fees.[2] Carry forward $50,000 from FY 2015-16 to FY 2016-17.[3] Carry forward $45,000 from FY 2016-17 to FY 2017-18.
B-12

CITY OF PINOLEMEASURE S 2014 FIVE-YEAR FUNDING PLAN
PROPOSED JUNE 19, 2018
Functional Area Notes FY 2015-16 FY 2016-17 FY 2017-18 FY 2018-19 FY 2019-20
APROVED MAY 5, 2015 - AMENDED JUNE 21, 2016 & JUNE 20, 2017
ParksReplace Chips with Rubber Matting at Tiny Tots, Meadow, Fernandez and Louis Francis Parks
-$ 50,000$ $ - $ - $ -
Resurface Parking Lot at Senior Center -$ 30,000$ $ - $ - $ - Replace Lighting at Louis Francis Park [4] $ - $ - $ 40,000 -$ $ - Annual re sod @ two Soccer Fields 15,000$ 50,000$ 10,000$ 10,000$ 10,000$ New Restrooms at Fernandez Park $ - 170,000$ -$ $ - $ - Replacement of Park Benches 15,000$ -$ 5,000$ 5,000$ $ -
Total $ 30,000 $ 300,000 $ 55,000 $ 15,000 $ 10,000
Public Works1 Maintenance Worker ( Full Time) $ - 92,454$ 89,966$ 97,592$ 102,472$ Initiate Internal Services Fund-Depreciation to Replace 2 Vehicles/Year Excludes Heavy Equipment
20,000$ $ 20,000 20,000$ 30,000$ 30,000$
Initiate Internal Services Fund-Depreciation for Heavy Equipment
50,000$ 50,000$ 50,000$ 50,000$ 50,000$
Residential/Arterial Street Maintenance Program 350,000$ 500,000$ 475,000$ 400,000$ 500,000$ Storm Drainage Master Plan -$ 75,000$ -$ -$ -$ Storm Drainage Annual Rehabilitation -$ -$ 150,000$ 150,000$ 150,000$ Replacement of Traffic Signs -$ 20,000$ 20,000$ 20,000$ 20,000$ Public Tree Maintenance 20,000$ 20,000$ 20,000$ 20,000$ 20,000$ Sidewalk Maintenance -$ 20,000$ 20,000$ 20,000$ 20,000$
Total $ 440,000 $ 797,454 844,966$ 787,592$ 892,472$
PoliceCommunity Safety Officers (2 Part Time) 54,046$ 53,837$ 54,554$ 56,306$ 59,121$ Replace Mobile Digital Terminals With Tablets for Vehicles, Motorcycle, Chief (17)
85,000$ -$ 20,000$ $ - $ -
Lap Tops 2 @ $1 500 each-Evidence and Squad Room 5 000$ 5 000$ 5 000$ 5 000$ -$Lap Tops 2 @ $1,500 each-Evidence and Squad Room, Also for 3 Detectives and Tablets for Admin 3 @ $1,500 each Total of 10
5,000$ 5,000$ 5,000$ 5,000$ -$
Initiate Internal Services Fund-Depreciation to Replace 1 Police Vehicle per year
45,000$ 45,000$ 50,000$ 50,000$ 50,000$
Dispatch overtime 25,000$ -$ -$ Emergency Preparedness [5] -$ -$ 50,000$ 50,000$ -$
Total 189,046$ 103,837$ 204,554$ 161,306$ 109,121$
FireFull Time Fire Chief (effective FY 2017-18) 146,661$ 228,962$ 262,259$ 239,663$ 251,646$ Rehab Station 73 - Drapes, Painting, Appliances, Carpeting 15,000$ -$ -$ -$ -$ 2 New Computers - Training Officer and Training Room 3,000$ -$ -$ -$ -$ 1 Tablet for Fire Chief & Battalion Chiefs 5,000$ -$ -$ -$ -$ Fire Training Academy -$ -$ -$ 20,000$ -$ Computer monitors [5] -$ -$ 15,000$ 10,000$ -$ Compressor [5] -$ -$ 45,000$ 45,000$ -$
Total 169,661$ 228,962$ 322,259$ 314,663$ 251,646$
City AttorneyMunicipal Code Update -$ 25,000$ 45,000$ -$ -$
-$ -$ -$ -$ -$ Total -$ 25,000$ 45,000$ -$ -$
Grand Total 1,478,583$ 2,124,184$ 1,948,225$ 1,850,663$ 1,747,153$
NOTES:[4] Project completed in FY 2017-18.[5] Carry forward funding from FY 2017-18 to FY 2018-19.
B-13

DEBT OBLIGATIONS
Pension Obligation Bonds
On June 1, 2006, the City Council authorized the issuance of $16,800,000 of Taxable Pension Obligation Bonds, 2006 Series A-2 (Capital Appreciation Bonds). The bonds in the aggregate principal of $6,214,630 were issued to finance the City’s unfunded accrued actuarial liability with CalPERS. The bonds bear compounded interest which is due semi-annually on June 1 and December 1 through 2036. Principal payments are due annually on June 1 through 2036. In accordance with Section 4.01 (a) of the Trust Agreement, the City is required to deposit with the Trustee on or before August 1 of each year the annual amount for the upcoming fiscal year ending June 30. The bonds are secured with an insurance policy.
Bonds payable debt service requirements for governmental activities are shown below:
For the Year Ending, June 30 Principal Interest 2018 $ 250,440 $ 254,560 2019 241,322 278,678 2020 233,014 301,986 2021 227,389 327,611 2022 221,565 353,435
2023-2027 1,013,511 2,151,490 2028-2032 879,365 2,840,635 2033-2036 620,009 2,819,990
$ 3,686,615 $ 9,328,385 Capitalized Lease Obligations The City leases equipment under an agreement which provides for title to pass upon expiration of the lease period. Future annual payments on capitalized lease obligations are as follows:
For the Year Ending, June 30 Principal Interest
2018 $ 111,234 $ 8,981 2019 114,795 5,420 2020 68,695 1,738
$ 294,724 $ 16,139
B-14

DEBT OBLIGATIONS
2016 Wastewater Revenue Refunding Bonds
On June 30, 2016, the City of Pinole issued an $8,251,000 Wastewater Revenue Refunding Bond (Bank Qualified) to redeem its 2006 Wastewater Revenue Bonds which were issued to finance certain capital improvements to the City’s wastewater system. The bonds bear annual intertest at 2.95% which is payable semi-annually on March 1 and September 1 of each year through 2036. Principal payments are due annually beginning on September 1, 2016 through 2036. The bond is secured with pledged net wastewater revenues.
Bonds payable debt service requirements for business-type activities are shown below:
For the Year Ending, June 30 Principal Interest
2018 $ 290,000 $ 227,770 2019 298,000 219,097 2020 310,000 210,129 2021 318,000 200,866 2022 329,000 191,323
2023-2027 1,803,000 802,474 2028-2032 2,089,000 516,029 2033-2037 2,429,000 183,566
$ 7,866,000 $ 2,551,254 Advance from Private Purpose Fund
On May 6, 2008, the City Council and former Pinole Redevelopment Agency approved a resolution for the former Pinole Redevelopment Agency to advance the City $2,500,000 to provide sufficient working capital to address the structural deficit in the City’s General Fund. The terms of the advance, as amended on April 5, 2011, provide for the payment of interest at the rate of 3.8% over 15 years and additional one-year deferral of payments to fiscal year 2014. The agreement terms allow for a capitalized interest payment deferral period of three years followed by amortization of the principal and interest in equal annual payments of $263,300 for the succeeding 12 years.
B-15

FY 2018‐19 Schedule of Tran
sfers TR
AN
SF
ER
-OU
TT
RA
NS
FE
R-I
N
FU
ND
#D
ES
CR
IPT
ION
AC
CO
UN
T #
AM
OU
NT
FU
ND
#D
ES
CR
IPT
ION
AC
CO
UN
T #
PU
RP
OS
E
100Gen
eral Fund
100‐49901‐117
2,500
310Lighting & Landscape Fund
310‐39901‐347
Fund Zone A Business Assistance Program
100Gen
eral Fund
100‐49901‐117
2,500
310Lighting & Landscape Fund
310‐39901‐347
Fund Zone B Business Assistance Program
100Gen
eral Fund
100‐49901‐117
123,736
505Cable Television Fund
505‐39901‐119
Cable Televison contribution [1]
100Gen
eral Fund
100‐49901‐117
370,902
209Recreation Fund
209‐39901‐551
Recration operating contribution [1]
Subtotal Transfers from
the Gen
eral Fun
d 49
9,638
106Measure S 2014 Fund
106‐49901‐117
200,000
150Gen
eral Reserve Fund
150‐39901‐117
Gen
eral Fund reserve
106Measure S 2014 Fund
106‐49901‐117
45,000
209Recreation Fund
209‐39901‐557
Swim
Cen
ter contribution [1]
106Measure S 2014 Fund
106‐49901‐117
200,000
325City Street Fund
325‐39901‐341
Funding for Future Street Projects
106Measure S 2014 Fund
106‐49901‐117
200,000
377Arterial Streets Reh
abilitation Fund
377‐39901‐ 341
Fund Portion of Arterial Streets Reh
abilitation
106Measure S 2014 Fund
106‐49901‐117
55,000
505Cable Television Fund
505‐39901‐119
Cable Televison contribution [1]
106Measure S 2014 Fund
106‐49901‐117
7,000
209Recreation Fund
209‐39901‐551
Recreation: C
inem
a, Community Service, Summer
Sounds, Tree Lighting.
Subtotal Transfers from
Mea
sure S 201
4 707,000
NOTES:
Grand
total Transfers
1,206,638
[1] Only enough
to balance will be transferred.
B-16

CITY COUNCIL - 110
City of Pinole FY 2018‐19
Mission
The City Council's responsibility is to establish comprehensive goals and objectives for the City; provide leadership in establishing policies for the conduct of municipal affairs; formulate priorities for allocation of City resources; support special legislative bodies; represent the City at local, regional, and State organizations; and hold regularly scheduled meetings, hearings, and study sessions to receive citizen's input and conduct the City's business in a public forum. The five-member City Council is elected at large and serves four-year overlapping terms. The City of Pinole operates under the Council/Manager form of Government.
Program Description
Annually, the City Council chooses one of its members to serve as the Mayor and the Mayor Pro Tempore. The City Council serves as the City's policy-making body, enacting ordinances, approving resolutions and taking action on municipal affairs. The City Council also serves as the governing body of the Pinole (Redevelopment) Successor Agency, and appoints members of the community to serve on various boards and commissions.
Key Objectives
Efficient service delivery Long-term sustainable financing for City's General Fund Capital Improvement Program priority setting Redevelopment Successor Agency activities Establishing priorities for staff assignments and projects Creating a business friendly environment promoting growth in retail sales and
employment Attracting and sustaining a diverse and growing commercial/retail mix Maintaining a strong relationship with the business community and community groups
Success Indicators
Sponsorship and participation in community events Continued progress on the Water Pollution Control Plant Upgrade Project Approved the design for a dialysis medical building at Gateway East Entered into a Purchase and Sale Agreement for the land at the Pinole Assisted Living
Center Authorized several new software programs citywide to streamline services and improve
efficiencies Approved new collective bargaining agreements with Police and Fire units Establishment of a General Fund reserve, with a goal of $5.5 million dollars
C-1

GENERAL FUND - 100CITY COUNCIL - 110
EXPENDITURE SUMMARY
FY 2015-16 FY 2016-17 FY 2017-18 FY 2017-18 FY 2018-19 $ Chg % ChgActual Actual Actual Budget Proposed
Personnel Thru Mar-18
Salaries & Wages -401 36,371 49,994 42,915 58,950 60,638 1,688 3%Overtime - 402 - - - - - - 0%Employee Benefits - 410 35,595 29,358 25,464 33,337 35,182 1,845 5%
Total Salary & Benefits 71,966 79,352 68,379 92,287 95,820 3,533 4%
Services and SuppliesProfessional & Administrative Services - 42 5,376 14,976 9,827 42,290 56,860 14,570 26%Other Operating Expenses -43 960 1,016 552 1,010 1,030 20 2%
Total Services and Supplies 6,336 15,992 10,379 43,300 57,890 14,590 25%
Capital OutlayAsset Acquisition/Improvement - 47 - - - - - - 0%
Total Capital Outlay - - - - - - 0%
Indirect Cost AllocationsAdministrative Credits - 46121 (13,763) (13,866) (16,647) (23,316) (24,249) (933) 4%General Liability Insurance - 46201 464 1,066 977 1,175 198 17%
Total Indirect Cost Allocations (13,763) (13,401) (15,581) (22,339) (23,074) (735) 3%
Total 64,539 81,942 63,177 113,248 130,636 17,388 13%
C-2

MAJOR NON-PERSONNEL EXPENSE DETAILS
FY 2017-18 FY 2018-19
42107 Equipment Maintenance 500$ -$
42201 Office Expense 200$ 500$
4230X Travel and Training 6,270$ 6,000$ ABAG (delegate) $250Allocated Appropriation (5 @ 500) 2,500CCC Mayor's Conference monthly dinners 1,200East Bay Division meetings 600Funding for council members on league committees 500Mayor's travel expenses 600Other identified City sponsored events 250Mayors Conference-add'l Council attendees 100
42401 Memberships 2,020$ 2,000$ Contra Costa Mayor's Conference $1,400 League of California Cities East Bay Division 400 Other Memberships 200
42514 Special Department Expense 33,300$ 48,360$ City Council meetings recorded by PCTV $45,360 Mayoral Celebration expense 400 Misc. supplies and food for meetings 1,000 Other special department expenses 1,000
West County Mayor's Breakfast meetings 600
Total Professional/Administrative Services 56,860$
4310X Utilities 1,010$ 1,030$ Gas/Electric 980$ Water 50
C-3

CITY MANAGER - 111
City of Pinole FY 2018-19
Mission
The mission of the City Manager is to support the City Council's goals and objectives and to efficiently and effectively carry out the City Council's directives in the provision of services to the community.
Program Description
The City Manager is the Chief Administrative Officer of the City and is responsible for providing daily direction and leadership to City operations and the organization to implement City Council policy directives. The City Manager provides the Council with information and recommendations on all policy issues being considered. In carrying out the direction and vision of the City Council, the City Manager coordinates and integrates City services to ensure effective, efficient and responsive service delivery. The City Manager is also designated the "Appointing Authority" for all City employees.
Key Objectives
Maintain long-term fiscal health and viability of the City to continue providing public services responsive to community needs and interests.
Support the City Council and implement adopted policies and directives. Build and develop a strong Executive Management team to support the organization. Recommend fiscally responsible annual Operating and Capital Improvement Program
budgets. Represent Pinole’s interests when working with local, regional, and State agencies.
Success Indicators
Approved a balanced budget for FY 2017-18 and contained expenses to within or under budget.
Completed Purchase & Sale Agreement for Faria House. Working with the Pinole Historical Society on a Lease Agreement and architectural plans.
Continued work on the WWTP Upgrade Project to finalize SRF loan agreement and Wells Fargo escrow accounts. Accounts now established and payment processing/ reimbursement running smoothly.
Initiated discussions on addressing PERS unfunded liability issue and retained Bartel & Associates for complete analysis.
Completed transition to new Tri-City Services for Dispatch through Pinole PD and Police Records through San Pablo PD.
Worked with the Pinole Seals on an agreement to operate Pinole Swim Center for 2018 season.
C-4

CITY MANAGER - 111
City of Pinole FY 2018-19
Negotiated a Purchase and Sale Agreement for PALC. New Fire Chief hired October 2017. New Battalion Chief hired March 2018.
Position Summary
Position 2014-15 2015-16 2016-17 2017-18 2018-19
City Manager 1.00 1.00 1.00 1.00 1.00
Total 1.00 1.00 1.00 1.00 1.00
C-5

GENERAL FUND - 100CITY MANAGER - 111
EXPENDITURE SUMMARY
FY 2015-16 FY 2016-17 FY 2017-18 FY 2017-18 FY 2018-19 $ Chg % ChgActual Actual Actual Budget Proposed
Personnel Thru Mar-18
Salaries & Wages - 401 230,151 206,971 153,853 212,705 240,380 27,675 12%Employee Benefits - 410 64,170 66,437 58,563 75,220 98,564 23,344 24%
Total Salary & Benefits 294,321 273,408 212,416 287,925 338,944 51,019 15%
Services and SuppliesProfessional & Administrative Services - 42 6,913 4,457 4,774 6,475 6,475 - 0%Other operating Expenses - 43 1,319 1,384 761 1,380 1,425 45 3%
Total Services and Supplies 8,232 5,841 5,535 7,855 7,900 45 1%
Capital OutlayAsset Acquisition/Improvement - 47 - - - - - - 0%
Total Capital Outlay - - - - - - 0%
Indirect Cost AllocationsAdmin Credits - 46121 (175,233) (172,993) (132,664) (191,269) (212,946) (21,677) 10%General Liability Insurance - 46201 6,298 6,187 6,721 6,157 7,973 1,816 23%
Total Internal Cost Allocations (168,935) (166,806) (125,943) (185,112) (204,973) (19,861) 10%
Total 133,618 112,444 92,008 110,668 141,871 31,203 22%
C-6

MAJOR NON-PERSONNEL EXPENSE DETAILS
FY 2017-18 FY 2018-19
42201 Office Expense 800$ 800$ Miscellaneous Office Expenses $300 Other Office Expenses 500
4230X Travel and Training 4,900$ 4,900$ League of Cities or Other Trainings $4,000Mayor's Conference monthly dinners 600Miscellaneous Meetings 300
42401 Memberships 600$ 600$ CCC Public Managers Association (CM & ACM) $600
42506 Bonds 175$ 175$ Bond $175
Total Professional/Administrative Services 6,475$
4310X Utilities 1,380$ 1,425$ 43103 Gas/Electric 1,300$ 43102 Water 125
C-7

CITY CLERK - 112
City of Pinole FY 2018-19
Mission
The City Clerk's office serves as the conduit between the residents of the City of Pinole and the City Council. The City Clerk is an appointed officer by the City Council and is responsible for, scheduling City Council meetings and preparing agenda packets, producing the official records of Council decisions, maximizing public access to municipal government ensuring transparency to the public and is the official custodian of the records of the City. The City Clerk serves as the Elections Official of the City and conducts all City elections; acts as a Compliance Officer for federal, state and local statues including the Political Reform Act, the Brown Act, and the Public Records Act.
The City Clerk's mission is to fulfill the role as elections official, legislative administrator and records manager for the City in an efficient, professional and friendly manner, to provide outstanding support to the Council throughout the legislative process, and to serve the citizens of Pinole as an accessible and responsive representative of transparent and open government.
Program Description
The primary duties of the City Clerk's office is to perform all legislative duties pursuant to state and local government requirements, including managing projected agenda items; noticing public hearings; coordinating, preparing and publishing meeting agendas; preparing, finalizing and retaining resolutions and ordinances; preparing minutes for presentation to the City Council; maintaining the codification of the Municipal Code, attesting to official signatures and attending all meetings of the Governing Body. Serve as the custodian of official records and records manager for the City and its Successor Agency. Serve as the Elections Official of the City and conduct all City elections; act as a Compliance Officer for federal, state and local statues including the Political Reform Act, the Brown Act, and the Public Records Act.
Key Objectives
Provide accurate and timely minutes for all legislative bodies City Council and Finance Sub-Committee Agenda Packet Management Serve as Elections Official and conduct all City Elections in compliance with the CA
Elections Code Coordinate Citywide Records Management Program and conduct semi-annual audit Streamline the paperless filing and electronic submission of Form 700 for FPPC filers Manage implementation of new Records and Agenda Management System program Administration of the City’s Public Records Act Program Codification of Pinole Municipal code Provide Excellent Customer Service to members of the community & staff
Success Indicators
Timely and Accurate Delivery of 29 Council, Successor Agency, Oversight Board and Finance Committee Transcriptions
Prepared 29 Meeting Packets Prepared 104 Legislative Actions & 12 Proclamations
C-8

CITY CLERK - 112
City of Pinole FY 2018-19
Scanned / Imported 1000 Files in the Electronic Records System Municipal Code Updated On-Line with Each Ordinance Adoption Processed and Responded to 41 Formal Public Records Requests by Mid-Year
Position Summary
Position 2014-15 2015-16 2016-17 2017-18 2018-19
City Clerk 1.00 1.00 1.00 1.00 1.00
Admin Secretary part-time 0.00 0.48 0.48 0.48 0.48
Total 1.00 1.48 1.48 1.48 1.48
C-9

GENERAL FUND - 100CITY CLERK - 112
EXPENDITURE SUMMARY
FY 2015-16 FY 2016-17 FY 2017-18 FY 2017-18 FY 2018-19 $ Chg % ChgActual Actual Actual Budget Proposed
Personnel Thru Mar-18
Salaries & Wages - 401 199,062 91,804 102,611 156,784 153,053 (3,731) -2%Overtime - 402 - - - - - - 0%Employee Benefits- 410 52,818 32,906 46,413 61,161 72,014 10,853 15%
Total Salary & Benefits 251,880 124,710 149,024 217,945 225,067 7,122 3%
Services and SuppliesProfessional &Administrative Services - 42 2,589 12,818 14,453 50,875 35,425 (15,450) -44%Other Operating Expenses - 43 1,428 1,503 823 1,200 1,600 400 25%
Total Services and Supplies 4,017 14,321 15,276 52,075 37,025 (15,050) -41%
Capital OutlayAsset Acquisition/Improvement - 47 - - 2,714 - - - 0%
Total Capital Outlay - - 2,714 - - - 0%
Indirect Cost AllocationsAdmin Credits - 46121 (32,481) (20,289) (28,952) (41,542) (40,957) 585 -1%Legal Charges - 46126 760 182 - 3,000 - (3,000) -100%General Liability Insurance - 46201 5,255 4,955 4,954 4,538 5,048 510 10%
Total Internal Cost Allocations (26,466) (15,152) (23,998) (34,004) (35,909) (1,905) 5%
Total 229,431 123,878 143,016 236,016 226,183 (9,833) -4%
C-10

MAJOR NON-PERSONNEL EXPENSE DETAILS
FY 2017-18 FY 2018-19
42101 Professional Services 8,950$ 4,000$ Filming and imaging of permanent records 2,000$ Pinole Municipal Code codification and update 2,000
42201 Office Expense 1,600$ 1,600$ Misc. office expenses & proclamations and certificates $1,600
4230X Travel and Training 4,000$ 4,000$ City Clerk's New Law/Election Seminar/misc 3,400$ Travel expense / Mileage 600
42401 Memberships 650$ 650$ CCAC Dues 130$ IIMC Member Dues 135 Other Dues, Notary 385
42506 Bonds 175$ 175$
42514 Special Department Expense 35,500$ 25,000$ CCC Elections 22,500$ Public Notices 2,500
Total Professional/Administrative Services 35,425$
4310X Utilities 1,200$ 1,600$ Gas/Electric 1,500$ Water 100
C-11

CITY TREASURER - 113
City of Pinole FY 2018-19
Mission
The elected City Treasurer is responsible for ensuring all funds of the City are received, disbursed, deposited and invested in accordance with the City’s Investment Policy and Generally Accepted Accounting Principles (GAAP). The primary mission of the City Treasurer is the safekeeping of City funds. Safety, liquidity and yield are always considered, in that order, when investing idle funds.
Program Description
The City Treasurer ensures quarterly investment reports which include reconciled bank balances, the type and amount of investments and deposits, the institution in which these deposits are made, market values, maturity dates, and rates of interest for all outstanding investments are provided to the City Council. In addition, the City Treasurer reviews the weekly check run and signs all checks $5,000 or greater.
Key Objectives
Ensure sufficient liquidity within the City’s investment portfolio to meet 100% of both the City’s operating and capital improvement program cash flow requirements
Maintain investment of 99% of all available funds at all times
Success Indicators
Reinvested $1.3 million of idle funds with a 1.456% effective yield Updated Investment Policy
C-12

GENERAL FUND - 100CITY TREASURER - 113
EXPENDITURE SUMMARY
FY 2015-16 FY 2016-17 FY 2017-18 FY 2017-18 FY 2018-19 $ Chg % ChgActual Actual Actual Budget Proposed
Personnel Thru Mar-18
Salaries & Wages - 401 2,563 2,088 2,134 3,000 3,000 - 0%Overtime - 402 - - - - - - 0%Employee Benefits - 410 1,465 4,570 7,954 10,633 11,215 582 5%
Total Salary & Benefits 4,028 6,658 10,088 13,633 14,215 582 4%
Services and SuppliesProfessional & Administrative Services - 42 203 209 275 740 760 20 3%Other Operating Expenses - 43 - - - - - - 0%
Total Services and Supplies 203 209 275 740 760 20 3%
Capital OutlayAsset Acquisition/Improvement - 47 - - - - - - 0%
Total Capital Outlay - - - - - - 0%
Indirect Cost AllocationsAdmin Credits - 46121 (532) (1,239) (2,422) (6,016) (3,641) 2,375 -65%General Liability Insurance - 46201 - 93 95 87 100 13 13%
Total Indirect Cost Allocations (532) (1,146) (2,327) (5,929) (3,541) 2,388 -67%
Total 3,699 5,722 8,036 8,444 11,434 2,990 26%
MAJOR NON-PERSONNEL EXPENSE DETAILS
FY 2017-18 FY 2018-19
42401 Memberships 65$ 110$ CSMFO Dues 110$
42301 Travel and Training 500$ 400$ Misc. training 400$
42506 Bonds 175$ 250$ Bonds 250$
Total Professional/Administrative Services 760$
C-13

CITY ATTORNEY - 114
City of Pinole FY 2018-19
Mission
The City Attorney is the Chief Legal Officer for the City of Pinole. The City Attorney provides legal advice to the City Council, City officials and staff. At the direction of the City Council, and by Resolution, the City Attorney prepares and reviews all ordinances, resolutions and contracts for City Council consideration, represents the City in legal actions and serves as general counsel for the Pinole Successor Agency and Housing Successor. The City Attorney also serves as the Risk Manager for the City of Pinole. The City Attorney prepares opinions at the request of the City Council and staff as needed.
Key Objectives for FY 2018- 19
Pinole Municipal Code Update Project (Measure S 2014) o Rental Inspection Ordinance Update o Zoning Code Update o General Updates to Municipal Code
Risk Management o Defend Police Department in Pitchess Motions o Provide legal assistance in labor, employment and HR issues o Minimize risks to City by advising on liability avoidance management practices o Defending lawsuits and claims not covered by Municipal Pooling Authority
Development Services (Building Fund and Cost Reimbursed by Developers) o Provide legal advice and representation to City on development project
Training and other Best Management Practices o Provide AB 1234 Training to the City Council and Commissioners o Provide Sexual Harassment Prevention Training to Council and Staff
Code Enforcement Provide Legal Services for Upgrade Project (Wastewater Revenue Fund)
Success Indicators
Adopted Ordinance banning polystyrene (Styrofoam) in the City of Pinole. Adopted Ordinance requiring balcony inspections in the City of Pinole. Introduced sidewalk ordinance. Conducted code enforcement training for City staff.
Position Summary
No personnel are directly assigned to this division. Legal services are a contract service.
C-14

GENERAL FUND - 100CITY ATTORNEY - 114
EXPENDITURE SUMMARY
FY 2015-16 FY 2016-17 FY 2017-18 FY 2017-18 FY 2018-19 $ Chg % Chg
Actual Actual Actual Budget Proposed
Legal Services Thru Mar-18
Attorney Services - 42102 312,911 333,669 270,906 541,775 402,820 (138,955) -34%Total Legal Services 312,911 333,669 270,906 541,775 402,820 (138,955) -34%
Indirect Cost AllocationsAdministrative Credits - 46121 - (133,338) (157,123) (326,000) (306,000) 20,000 -7%
Total Indirect Cost Allocations - (133,338) (157,123) (326,000) (306,000) 20,000 -7%
Total 312,911 200,331 113,782 215,775 96,820 (118,955) -123%
MEASURE S - 2014 FUND - 106Attorney Services - 42102 - 48,786 40,417 45,000 - (45,000) -100%
Total Measure S - 48,786 40,417 45,000 - (45,000) -100%
MAJOR NON-PERSONNEL EXPENSE DETAILS
FY 2017-18 FY 2018-19
42102 Attorney Services - General Fund 541,775$ 402,820$ General legal services for FY 2017-18 $452,820HR contract attorney services in HR budget ($50,000)
42102 Attorney Services - Measure S 2014 45,000$ -$
C-15

FINANCE DEPARTMENT - 115
City of Pinole FY 2018‐19
Mission
The mission of the Finance Department is to provide the City Council and City Management with financial information necessary to ensure sound and prudent financial management and protection of assets. This is accomplished through timely and effective preparation of the Comprehensive Annual Financial Report (CAFR), the annual Operating Budget, and quarterly financial and investment reports.
Program Description
The Finance Department is responsible for accounting, payroll, accounts payable, treasury management, business licenses, budget preparation, debt and bond administration and long range financial planning. In addition, the Finance Department prepares the Recognized Obligation Payment Schedule (ROPS) for the Successor Agency to the Pinole Redevelopment Agency, submitting the ROPS to the County Oversight Board for approval, and to the State Department of Finance and the County.
Key Objectives
Annual Operating Budget adopted by June 30th Comprehensive Annual Financial Report (CAFR) completed by December 31st Prepare the Successor Agency Annual ROPS for approval by the County Oversight
Board and submission to the State Department of Finance by February 1st Ensure Financial Policy and Procedures are current and align with best practices
Success Indicators
Received California Society of Municipal Finance Officers Budget Excellence Award Received Government Finance Officers Association Excellence in Financial Reporting
Award Managed investment portfolio that averaged $33.1 million reinvesting idle funds with an
average 1.456% effective yield Ensured accurate WPCP Upgrade Project accounting and timely reimbursements from
project financing Developed Grants Policy, Capital Assets Policy and Unclaimed Funds Policy
Position Summary
Position 2014-15 2015-16 2016-17 2017-18 2018-19
Finance Director 1.00 1.00 1.00 1.00 1.00
Accounting Specialist 2.00 2.00 2.00 2.00 2.00
Accounting Technician, PT 0.00 0.00 0.00 0.00 0.48
Accounting Intern, PT/Temp 0.40 0.48 0.48 0.48 0.00
Total 3.40 3.48 3.48 3.48 3.48
C-16

GENERAL FUND - 100FINANCE - 115
EXPENDITURE SUMMARY
FY 2015-16 FY 2016-17 FY 2017-18 FY 2017-18 FY 2018-19 $ Chg % ChgActual Actual Actual Budget Proposed
Personnel Thru Mar-18
Salaries & Wages - 401 317,174 336,424 246,917 341,564 378,165 36,601 10%Overtime - 402 3,354 1,576 1,678 2,500 2,806 306 0%Employee Benefits - 410 64,448 105,688 93,806 105,905 131,801 25,896 20%
Total Salary & Benefits 384,976 443,688 342,401 449,969 512,772 62,803 12%
Services and SuppliesProfessional & Administrative Services - 42 49,579 76,483 47,133 78,320 75,475 (2,845) -4%Other Operating Expenses - 43 3,610 3,789 2,083 3,025 3,300 275 8%Materials & Supplies - 44 - - - - - - 0%
Total Services and Supplies 53,189 80,272 49,217 81,345 78,775 (2,570) -3%
Capital OutlayAsset Acquisition/Improvement - 47 - - - - - - 0%
Total Capital Outlay - - - - - - 0%
Indirect Cost AllocationsAdmin Credits - 46121 (90,939) (131,089) (97,637) (139,024) (149,170) (10,146) 7%Benefits & Insurance - 46123 25,602 - 0%Legal Charges - 46126 734 945 750 750 100%Insurance General Liability - 46201 10,588 9,548 10,394 9,522 12,218 2,696 22%
Total Indirect Cost Allocations (54,750) (120,807) (86,298) (129,502) (136,202) (6,700) 5%
Total 383,415 403,153 305,320 401,812 455,345 53,533 12%
MEASURE S - 2014 FUND - 106Professional & Administrative Services - 42 - 2,500 - 5,000 4,865 (135) -3%
C-17

MAJOR NON-PERSONNEL EXPENSE DETAILSFY 2017-18 FY 2018-19
42101 Professional Services 66,485$ 63,670$ Auditing Services 44,935$ Preparation of State Controllers Report 5,610 GASB 68 PERS Report(5 reports @$850) 4,250
CA Municipal Statistics (CAFR schedule) 475 HdL Sales Tax Analysis 5,600 Armored car treasury services 2,800
42201 Office Expense 5,700$ 5,700$ Miscellaneous Office Expenses 3,000$ Year End Tax Forms 700
Check stock 1,500 Printing Services 500
4230x Travel and Training 1,800$ 1,800$ CSMFO annual conference 1,100$ Airfare 700
42401 Memberships 430$ 400$ CSMFO dues 110$ GFOA dues 190 AGA Dues 100
42506 Admin Exp/Bonds 250$ 250$ Bonds 250$
42510 Software Subscription 3,000$ 3,000$ Cost Tree Cost Allocation Software subscription 3,000
42514 Special Department Expense 655$ 655$ GFOA CAFR review and certification 505$
CSMFO budget review and award 150
Total Professional/Administrative Services 75,475$
4310X Utilities 3,025$ 3,300$ Water - 43102 300$ Electricity & Power - 43103 3,000
MEASURE S - 2014 FUND - 106
42101 Professional Services 5,000$ 4,865$ Measure S Audit (106) 2,365$
Sales Tax Analysis 2,500
C-18

HUMAN RESOURCES - 116
City of Pinole FY 2018-19
Mission
The mission of the Human Resources Department is to ensure accurate, fair and equitable management of the City's personnel functions which include recruitment and selection, employee and labor relations, classification and compensation administration, performance evaluation, employee training, and the City's workers' compensation and safety programs.
Program Description
The Human Resources Department provides service and advice to the City departments in the areas of personnel management, recruitment, employee records, distribution and coordination of training programs, employee benefit administration and labor relations.
Key Objectives
Review and Update the City’s Rules, Policies, and Procedures Manual for clarity and consistency.
Finalize the Illness and Injury Prevention Policy Provide subject matter training on use of NEO Gov – Online recruitment software. Continue recruitment efforts for vacant positions throughout the organization.
Success Indicators
Completed 32 recruitment processes commencing from advertising to hiring. Received and evaluated over 1,000 applications for sworn and non-sworn positions Served as the Lead and coordinated with the Departments on the Implementation of the
new Website. Finalized successful negotiations with the four (4) bargaining Units
Position Summary
The Human Resources Department consists of two regular full-time positions. This staffing level represents a lean staffing model that requires continual review to prioritize tasks to accomplish based on changes within the organization. Position 2014-15 2015-16 2016-17 2017-18 2018-19
Assistant City Manager 1.00 1.00 1.00 1.00 1.00 Human Resources Specialist 1.00 1.00 1.00 1.00 1.00
Total 2.00 2.00 2.00 2.00 2.00
C-19

GENERAL FUND - 100HUMAN RESOURCES - 116
EXPENDITURE SUMMARY
FY 2015-16 FY 2016-17 FY 2017-18 FY 2017-18 FY 2018-19 $ Chg % ChgActual Actual Actual Budget Proposed
Personnel Thru Mar-18
Salaries & Wages - 401 248,866 260,287 196,222 262,727 300,750 38,023 13%Overtime - 402 (128) 317 8 3,000 - (3,000) -100%Employee Benefits - 410 70,898 73,815 68,446 69,960 95,002 25,042 26%
Total Salary & Benefits 319,636 334,419 264,676 335,687 395,752 60,065 15%
Services and SuppliesProfessional & Administrative Services - 42 77,789 38,168 35,160 78,760 105,905 27,145 26%Other Operating Expenses - 43 1,069 1,119 618 1,188 1,195 7 1%
Total Services and Supplies 78,858 39,287 35,778 79,948 107,100 27,152 25%
Capital OutlayAsset Acquisition/Improvement - 47 - - 718 - 300 300 100%
Total Capital Outlay - - 718 - 300 300 100%
Indirect Cost AllocationsAdministrative Credits - 46121 (88,897) (106,031) (82,291) (112,487) (124,053) (11,566) 9%Legal Charges - 46126 - - - 185 185 - 0%General Liability Insurance - 46201 - 7,462 7,941 7,276 9,736 2,460 25%
Total Indirect Cost Allocations (88,897) (98,568) (74,350) (105,026) (114,132) (9,106) 8%
Total 309,597 275,138 226,822 310,609 389,020 78,411 20%
C-20

MAJOR NON-PERSONNEL EXPENSE DETAILS
FY 2017-18 FY 2018-19
42101 Professional Services 59,506$ 31,201$ Basic Pacific Admin $625CPS tests 1,500 IEDA 25,476 Misc 1,500 Pre-employment exams-Concentra 2,100
42102 Attorney Services -$ 50,000$ Jackson Lewis contract 50,000$
4110 Fingerprinting -$ 320$
42201 Office Expense 1,000$ 500$ Miscellaneous Office Supplies $500
4230X Travel and Training 9,135$ 9,294$ Covers the cost of minimal training workshops covering employee relations issues, workers compensation, ADA and family leave
Leadership Academy 1,200$ Other Travel and Training/Conferences 8,094
42401 Memberships -$ 1,615$ ICMA 1,400$ SHRM 215$
42506 Bond 175$ 175$ Bond 175$
42510 Software Purchases -$ 4,200$ NeoGov Annual License/Maintenance 4,200$
42514 Special Department Expense 8,944$ 8,600$ Employee BBQ $1,200Employee Recognition 2,500 Legal Posting 400 Recruitment Advertising 4,000 Recruitment Expense 500
Total Professional/Administrative Services 105,905$
4310X Utilities 1,188$ 1,195$ 43103 Gas/Electric 1,080$ 43102 Water 115
C-21

GENERAL GOVERNMENT - 117
City of Pinole FY 2018-19
Mission
To provide various services to the citizens of Pinole through the combined efforts of multiple agencies, and to appropriate funds for general City administrative overhead costs.
Position Summary
Position 2014-15 2015-16 2016-17 2017-18 2018-19 Management Analyst 0.00 0.48 0.48 1.00 1.00 Admin Secretary, part-time 0.46 0.00 0.00 0.00 0.00
Total 0.46 0.48 0.48 1.00 1.00
C-22

GENERAL FUND - 100GENERAL GOVERNMENT - 117
EXPENDITURE SUMMARY
FY 2015-16 FY 2016-17 FY 2017-18 FY 2017-18 FY 2018-19 $ Chg % ChgActual Actual Actual Budget Proposed
Personnel Thru Mar-18
Salaries & Wages - 401 (179) 315 20,007 69,278 78,670 9,392 12%Overtime - 402 - - - - - - 0%Employee Benefits - 410 1,203,849 6,234 356,196 4,546,853 53,885 (4,492,968) -8338%Med Insurance/Retirement - 411 963,040 801,065 696,103 901,000 901,000 - 0%Benefits & Insurance - 38502 (1,328,884) - - (4,810,284) - 4,810,284 -100%
Total Salary & Benefits 837,827 807,614 1,072,306 706,847 1,033,555 326,708 32%
Services and SuppliesProfessional & Administrative Services - 42 190,213 161,641 130,789 249,045 241,912 (7,133) -3%Other Operating Expenses - 43 11,616 12,596 6,920 12,089 12,400 311 3%
Total Services and Supplies 201,829 174,237 137,709 261,134 254,312 (6,822) -3%
Capital OutlayAsset Acquisition/Improvement - 47 - - - - - - 0%
Total Capital Outlay - - - - - - 0%
Debt ServiceDebt Principal - 48101 264,718 (0) 250,440 513,740 504,622 (9,118) -2%Debt Interest - 48102 289,749 324,939 254,560 254,560 278,678 24,118 9%Cost of Issuance - 48103 - 1,142 - - - - 0%
Total Debt Service 554,467 326,081 505,000 768,300 783,300 15,000 2%
Indirect Cost AllocationsAdministrative Credits - 46121 - - - - - - 0%Administrative Debits - 46122 91,348 2,846 - - - - 0%IS Charges - 46124 90,655 94,845 - 163,500 160,861 (2,639) -2%General Liability Insurance - 46201 1,780 21,878 2,189 298,656 2,609 (296,047) -11347%
Total Indirect Cost Allocations 183,783 119,568 2,189 462,156 163,470 (298,686) -183%
Operating Transfers Out - 49901 5,000 30,000 - 133,566 115,566 (18,000) -16%
Total 1,782,906 1,457,501 1,717,204 2,332,003 2,350,203 18,200 1%
MEASURE S - 2014 FUND - 106Professional & Administrative Services - 42 - - - - 40,000 40,000 100%Equipment Replacement Charges - 46 - 120,000 - 125,000 105,000 (20,000) -19%Transfers Out - 49 - 841,364 - 775,000 707,000 (68,000) -10%Total Measure S - 961,364 - 900,000 852,000 (48,000) -6%
MEASURE J FUND - 215Professional & Administrative Services - 42 36,675 - - 42,772 47,049 4,277 9%Total Measure J 36,675 - - 42,772 47,049 4,277 9%
C-23

MAJOR NON-PERSONNEL EXPENSE DETAILSFY 2017-18 FY 2018-19
42101 Professional Services 191,410$ 180,037$ Architectural Drawings (Faria House) 50,000$ Animal Control Services 115,937 Mural maintenance 10,100 WCCUSD Summer Intern 4,000
42107 Equipment Maintenance 100$ 100$
42201 Office Expense 19,200$ 19,200$ Postage Supplies 6,200$ Office Supplies 5,000 Copier Supplies 1,000 Other Office Expenses 7,000
4230X Travel & Training -$ 1,500$
42401 Memberships 18,210$ 18,075$ ABAG Dues 4,650$ Bay Area News Group subscription 550 CAER dues 550
LAFCO dues 5,525 League of CA Cities 6,800
42501 Bank Fees 8,600$ 14,000$ Mechanics Bank and Bank of the West fees $14,000
42506 Bonds 1,125$ -$
42511 Equipment Rent 2,400$ 3,500$ Restroom Services (Farmers market & PVP) $3,500
42513 Rent 2,700$ 2,700$ Tennent Ave Parking lot. 401-142-012 (AT&T) 2,700$
42514 Special Department Expense 5,300$ 2,800$ Flowers for funerals and special occasions 300$ Miscellaneous 2,000 Notary fees and supplies 100 UPS/FedEx/Misc. shipping 400
Total Professional/Administrative Services 241,912
4310X Utilities 12,089$ 12,400$ 43103 Gas/Electric 11,000$ 43102 Water 900
4310X Comcast 500
C-24

48101 Debt Principal 413,740$ 504,622$ Pension Obligation Bond principal 241,322$ Successor Agency Collateralized Investment Agreement payment 263,300
48102 Debt Interest 254,560$ 278,678$ Pension Obligation Bond interest 278,678$
MEASURE S - 2014 FUND - 106
42101 Professional Services -$ 40,000$ Architectural Drawings (Faria House) reimbursable 40,000$
46125 Equipment Replacement Charges 125,000$ 105,000$ Initiate ISF- Depreciation for Heavy Equipment 50,000$
Initiate ISF- Depreciation to Replace 1 PD Vehicle per year 50,000 Initiate ISF- Depreciation to Replace 2 Dev Svcs Vehicles per year 5,000
49901 Transfers Out 775,000$ 707,000$ Arterial Street Rehabilitation Projects 200,000$
Cable TV Contribution 55,000 General Reserve 200,000 Recreation-Cinema in the Park 1,500 Recreation-Community Service Commission 2,000 Recreation-Summer Sounds in the Park 2,500 Recreation-Swim Center Contribution 45,000 Recreation-Tree Lighting 1,000 Street Projects Funding 200,000
MEASURE J - FUND 215MEASURE J FUND 215
42401 Memberships 42,772$ 47,049$ WCCTAC dues 47,049$
C-25

INFORMATION SYSTEMS - 118
City of Pinole FY 2018-19
Mission
To manage, evaluate, and implement technologies across the organization that will increase employee productivity. To provide project management services on technology projects. To provide technology support services to operating departments and agencies of the City of Pinole.
Program Description
The Information Systems Division, through a contract service agreement, maintains organization-wide software and computer automation projects to increase the efficiency and effectiveness of the City workforce. Through cooperative efforts with other departments, it provides hardware and software solutions along with business process re-engineering to meet City Business needs. It provides integral input into the selection of technologies, along with the project management services to implement those technologies.
This Division maintains over 150 workstations, and 7 network fileservers used throughout the City. Remote site locations, such as the recreational activity centers and public works maintenance facilities are all connected to the primary City Hall building through dedicated wide-area network (WAN) communication links. The Police and Fire departments are served on separate servers.
Key Objectives
• Replace 20 outdated XP computers and upgrade 46 computers operating system to Windows 10
• Install a new Disaster Recovery System for the Police Department • Upgrade email and computers software with most current Office 365 • Replace existing electronic database storage system • Continued maintenance and evaluation of the City’s IT system.
Success Indicators
Implemented eTrakIt Enhancement to enable permits to be submitted through the website.
Rollout the Police Department body camera program Rollout NeoGov (on-line job recruitment) program for Human Resources Implemented replacement of ERP system for Finance and HR. Replaced Recreation Registration and Management program. Commenced a multi-year project of replacing outdated computers (15 replaced in FY
2017-18)
C-26

INFORMATION SYSTEMS - 118
City of Pinole FY 2018-19
Position Summary
Position 2014-15 2015-16 2016-17 2017-18 2018-19
Information Systems Administrator 1.00 1.00 0.00 0.00 0.00
Total 1.00 1.00 0.00 0.00 0.00
C-27

INFORMATION SYSTEMS FUND - 525INFORMATION SYSTEMS - 118
EXPENDITURE SUMMARY
FY 2015-16 FY 2016-17 FY 2017-18 FY 2017-18 FY 2018-19 $ Chg %
ChgActual Actual Actual Budget Proposed
Personnel Thru Mar-18
Salaries & Wages - 401 91,099 - - - - - 0%Overtime - 402 275 - - - - - 0%Employee Benefits - 410 21,570 1,885 - - - - 0%
Total Salary & Benefits 112,944 1,885 - - - - 0%
Services and SuppliesProfessional & Administrative Services - 42 414,939 527,393 251,348 538,979 505,164 (33,815) -7%Other Operating Expenses - 43 103,777 105,533 83,292 136,160 145,160 9,000 6%
Total Services and Supplies 518,716 632,926 334,640 675,139 650,324 (24,815) -4%
Capital OutlayAsset Acquisition/Improvement - 47 26,599 30,012 7,410 61,100 79,500 18,400 23%
Total Capital Outlay 26,599 30,012 7,410 61,100 79,500 18,400 23%
Indirect Cost AllocationsAdministrative Credits - 46121 (101,498) (3,163) - - - - 0%IS Charges - 46124 (565,961) (563,369) - (736,239) (729,824) 6,415 -1%General Liability Insurance - 46201 2,893 1,279 - - - - 0%
Total Indirect Cost Allocations (664,566) (565,252) - (736,239) (729,824) 6,415 -1%
Total (6,307) 99,571 342,050 - - - 0%
MEASURE S - 2014 FUND - 106Computer Equipment - 47102 - - - - 6,000 6,000 100%Software Purchases - 42510 103,618 135,848 81,334 150,000 119,000 (31,000) -26%Total Measure S 103,618 135,848 81,334 150,000 125,000 (25,000) -20%
C-28

MAJOR NON-PERSONNEL EXPENSE DETAILS
FY 2017-18 FY 2018-19
42101 Professional Services 188,000$ 210,800$ Deploy Disaster Recovery Solution 5,000$
Managed IT Support (Precision IT) 150,000$ Replace 20 Windows XP workstations 6,400 Upgrade 45 workstations to Windows 10 14,400 Upgrade antivirus for all servers and workstations 5,000 Upgrade City Hall and Public Safety servers 5,000 Upgrade City Hall firewall 5,000 Upgrades 20,000
42105 Network Maintenance 103,560$ 47,060$ Network servers and hardware maintenance, including professional callouts.
Firewall maintenance & content filters 3,500$ Hardware warranty for police car tablets 8,500 LiveScan maintenance 10,000 Printer repair 1,000 Spam/Spyware hardware 1,400 Web hosting (ABAG/post-ABAG) 6,160 Website auto notification subscription 6,500 Website updates/maintenance 3,000 Web streaming 6,000 Wi-Fi service 1,000
42106 Software Maintenance 133,000$ 134,714$ Fire RMS support- Station 73 3,500$ AMAG alarm software maintenance 500 CrimeView desktop support 3,000 Critical Reach maintenance 300 ESRI- Ainfo, Aedito, Aview maintenance 20,000 Forenics Maintenance 1,200 FileOnQ Support & maintenance 3,000 Fire RMS support- Station 73 2,000 Geo Trust SSL certificate for OWA 500 RecDesk software 4,400 Sire software support 4,000 TRACKIT support maintenance 16,400 Tyler Incode license fee & maintenance 62,914 Upgrade to Sophos exploit protection 8,000 Versatile Express & retention support 5,000
42107 Equipment Maintenance 56,624$ 49,700$ Copier Lease and Maintenance (Xerox) 47,700$ Mailing System Meter Lease (Pitney Bowes) 2,000
42201 Office Expense 1,500$ 1,500$ Miscellaneous computer supplies 1,300$ Miscellaneous office supplies 200
C-29

FY 2017-18 FY 2018-19
42401 Memberships 160$ -$ Municipal Information System Membership 160$
42510 Software Purchase & Subscriptions 56,135$ 61,390$ Copware Site License 140$ Office 365 E3 License (160 Licenses) 40,000 PD background checks (TLO, Transunion) 750 Pinole Municode 500 Public Safety data backup and DR solution 10,000 Realquest maintenance 10,000
Total Professional/Administrative Services 505,164$
43101 Communications 136,160$ 145,160$ AT&T voice service 97,200$ DSL - 911 1,300 Fire Department pagers 360 Public Safety satellite phones 700 Tiny Tots solar 600 Verizon cell service 45,000
47102 Computer Equipment 61,100$ 79,500$ Body Cameras (5) 5,000$ Computers- Admin (3) 3,000 Computers- Admin replace (13) Windows 7 13,000 Computers -Comm. Dev (1) 1,000 Computers - Fire (1) 1,000 Computers - PCTV (4) 4,000 Computers - Police (2) 2,000 Computers - Police replace (14) Windows 7 14,000 Computers - Public Works (6) 6,000 Computers - Recreation (2) 2,000 Dual monitors- all divisions 15,000 Laptop for new Lieutenant 2,000 Printer replacement 1,500 Tablets and docking stations - Police (2) 10,000
MEASURE S - 2014 FUND - 106
42510 Software Purchase & Subscriptions 150,000$ 125,000$ Replace SIRE Records System Software (25K Carryover) 80,000$ Ancillary equipment related to RecDesk upgrade 39,000
Computers - Recreation (5)[a] 6,000 [a] Funded with Measure S 2014 Carryover
C-30

INFORMATION SYSTEMS CHARGES FOR COMMUNICATION & TECHNOLOGY
FY 2017-18 FY 2018-19
46124 IS Charges for Communication & Technology (736,239)$ (729,824)$ General Government [117] (160,861)$ Police Services [222] (226,747) Police Dispatch [223] (35,052) Fire Services [231] (60,524) Public Works [341] (66,557) Building Inspection [462] (48,185) Recreation [551] (58,223) CATV [118] (24,459) Sewer WPCP [641] (32,709) Sewer Collection (CY) [642] (16,508)
C-31

CABLE ACCESS TV – 119
City of Pinole FY 2018-19
Mission
To provide quality broadcasting and ancillary video and audio services to the City of Pinole, other organizations and the community informing the public of the City’s operations and events while at the same time achieving cost recovery.
Program Description
Pinole Cable TV (PCTV) manages a non-commercial, (except as allowed through the DIVCA state franchise,) community access television station. PCTV is a PEG station with programming and information that is Public, Educational, and Governmental. Resources are utilized for staffing, operational and equipment supplies, utilities and facility maintenance. Revenue is generated from service charges, donations, sponsorships, DVD sales and franchise fees. The majority of revenue is from contracts with other municipalities, nonprofits and for profits with whom PCTV provides broadcasting and other services. Key Objectives
To maintain operations, live broadcasts of Pinole City Council Meetings and other Pinole government meetings, program and schedule all replays, and manage and maintain the related video website files.
To maintain Local Origination or Pinole content for broadcasting and to, when financially possible, provide for local Public Access operations for Pinole citizens.
To strive to maintain client operations at the current levels of service within financial budgets.
To effectuate restorative steps to correct deferred maintenance, and replace obsolete equipment.
To maintain operations without awareness of the public of station difficulties. To successfully maintain and restore the operational skill sets through training of staff.
Success Indicators
PCTV staff continues to maintain operations. Commenced migration and integration of equipment from analog to digital format
through in-house staff. Launched updated bulletin board (PCTV Scroll) systems with modern digital formats and
features. Re-tooled the Live Truck with a rotation of surplus gear.
Position Summary
Position 2014-15 2015-16 2016-17 2017-18 2018-19
Cable Access Coordinator 0.90 1.00 1.00 1.00 1.00
Cable Access Technician 0.90 1.00 1.00 1.00 1.00
Cable Equipment Operators, PT/Temp 0.44 0.75 0.75 0.75 0.75
Total 2.24 2.75 2.75 2.75 2.75
C-32

CABLE ACCESS TV FUND - 505CABLE ACCESS TV - 119
EXPENDITURE SUMMARY
FY 2015-16 FY 2016-17 FY 2017-18 FY 2017-18 FY 2018-19 $ Chg %
ChgActual Actual Actual Budget Proposed
Personnel Thru Mar-18
Salaries & Wages -401 168,042 175,674 131,867 187,255 195,704 8,449 4%Overtime - 402 - 121 - 2,000 2,000 - 0%Employee Benefits - 410 72,111 72,283 62,098 82,399 96,276 13,877 14%
Total Salary & Benefits 240,153 248,077 193,966 271,654 293,980 22,326 8%
Services and SuppliesProfessional & Administrative Services - 42 20,718 21,324 5,107 31,418 33,150 1,732 5%Other Operating Expenses - 43 6,989 8,575 1,116 9,000 8,000 (1,000) -13%Materials & Supplies - 44 208 294 277 - 400 400 100%
Total Services and Supplies 27,915 30,193 6,500 40,418 41,550 1,132 3%
Capital OutlayAsset Acquisition/Improvement - 47 - - 30,098 56,900 58,000 1,100 2%
Total Capital Outlay - - 30,098 56,900 58,000 1,100 2%
Indirect Cost AllocationsIS Charges - 46124 11,888 15,000 - 24,641 24,459 (182) -1%General Liability Insurance -46201 5,907 5,628 5,980 5,478 6,557 1,079 16%
Total Indirect Cost Allocations 17,795 20,628 5,980 30,119 31,016 897 0%
Total 285,863 298,898 236,544 399,091 424,546 25,455 6%
[1] PEG funded
C-33

MAJOR NON-PERSONNEL EXPENSE DETAILS
FY 2017-18 FY 2018-19
42101 Professional Services 19,000$ 19,000$ Remote programming and support for Leightronix, Scala 9,000$
and General A/V Contractors (90% funded through production fees )Nexus Fee Study 10,000
42106 Software Maintenance -$ 900$ Scala Annual License 900$
42107 Equipment Maintenance 4,000$ 3,600$ Equipment repair 300$ Equipment repair parts 1,900 Loaner equipment 170 Other equipment maintenance 1,230
42108 Maintenance Structure/Imp 3,800$ 3,800$ Cleaning supplies 500$ Elevator maintenance 1,080 HVAC maintenance 1,580 Other maintenance 442 Pest control 198
42201 Office Expense 250$ 250$
4230X Travel and Training 1,500$ 2,500$ NAB Convention for two employees 2,400$ Other Travel and Training 100$
42510 Software Purchase -$ 600$ Adobe Editing Software 600$
42514 Special Department Expense 2,868$ 2,500$ Equipment Rental 100$ Misc specialized supplies 1300Other Special Dept Expenses 700Recording media 400
Total Professional/Administrative Services 33,150$
43102 Utilities 9,000$ 8,000$ Gas and Electric 7,000$ Water 500 Taxes 500
44301 Fuel -$ 400$
C-34

47101 Equipment $56,900 58,000$ DSLR Digital Camera- Hand Held $2,200 Master Control automation update 28,800 Osprey Talon G1H Video Encoder 2,000 Panasonic AV-HS410 Multi-format HD/SD 12,000 Panasonic matching camera for ture A-B roll 11,000 Teranex converters by Blackmagicdesign 2,000
C-35

POLICE OPERATIONS - 221
City of Pinole FY 2018-19
Mission
The Pinole Police Department is committed to ensuring a safe community by providing exemplary law enforcement service while engaging our citizens with: Honor, Integrity, Professionalism, and Respect.
Program Description
Police Operations is responsible for the day to day operation of the department. It includes funding Officers and their uniforms, gear, weapons, vehicles, and other supplies. It includes the P.O.S.T. mandated training and other training for departmental personnel. Other programs that are covered under Police Operations are: Canine, Ride Along, School Liaison, Special Olympics participation, and community special events. Police Operations also involves the personnel issues within the department. It interfaces with other law enforcement and community entities.
Key Objectives
Provide exemplary customer service and law enforcement services to the community. Seek new technology to enhance the delivery of services to the community. Provide the community with an effective Criminal Investigations Division. Provide an effective K-9 Program to enhance the safety of the officers and citizens. Provide the community an SRO program that incorporates Restorative Justice Practices. Liaison program with Municipal Pooling Authority for RMTAC (Police Risk Management
Training Advisory Committee). School liaison Program to all elementary schools in the community. Responsible for the following: Pitchess Motions, lawsuits, claims, personnel,
investigations, special investigations. Mutual Aid Program Management and Investigation. Mobile Field Force Program Liaison, Management, and Scheduling. P.O.S.T. Training. Special Olympics - Tip a Cop, Torch Run, and Bike the Bridges. Police Explorer Program (Community Funded). Security for Community Special Events. Community Service Officer Unit.
Success Indicators
New Lieutenants hired and in place. SmartGuardian Technology to enhance efficiency in delivering services to community. Top 20 Law Enforcement agency in fundraising for Special Olympics Northern California. Up to date on all P.O.S.T. mandated training for Officers. Hired and Trained new officers and CSO postions. Instituted a Police Officer Trainee position.
D-1

POLICE OPERATIONS - 221
City of Pinole FY 2018-19
Position Summary
Position 2014-15 2015-16 2016-17 2017-18 2018-19
Chief of Police 1.00 1.00 1.00 1.00 1.00
Commander 1.00 1.00 1.00 0.00 0.00
Lieutenant 0.00 0.00 0.00 2.00 2.00
Sergeant 6.00 6.00 6.00 6.00 6.00
Police Officer 16.00 16.00 17.00 17.00 17.00
Community Service Officers 0.00 0.96 0.96 0.96 0.96
Police Officer (SRO) 0.00 0.00 0.00 0.00 0.00
Total 24.00 24.96 25.96 26.96 26.96
D-2

GENERAL FUND - 100POLICE OPERATIONS - 221
EXPENDITURE SUMMARY
FY 2015-16 FY 2016-17 FY 2017-18 FY 2017-18 FY 2018-19 $ Chg % Chg
Actual Actual Actual Budget Proposed
Personnel Thru Mar-18
Salaries & Wages - 401 1,768,032 1,830,270 1,410,680 2,152,282 2,252,519 100,237 4%Overtime - 402 - 2,864 4,600 - - - 0%Employee Benefits - 410 747,899 744,895 679,726 900,592 960,611 60,019 6%
Total Salary & Benefits 2,515,931 2,578,029 2,095,005 3,052,874 3,213,130 160,256 5%
Services and SuppliesProfessional & Administrative Services - 42 147,114 136,211 172,273 184,279 156,712 (27,567) -18%Materials & Supplies - 44301 42,217 55,384 43,819 3,500 85,500 82,000 96%
Total Services and Supplies 189,331 191,595 216,092 187,779 242,212 54,433 22%
Capital OutlayAsset Acquisition/Improvement - 47 875 - 3,202 3,240 3,240 - 0%
Total Capital Outlay 875 - 3,202 3,240 3,240 - 0%
Indirect Cost AllocationsAdministrative Credits - 46121 (295,918) (308,325) (222,338) (311,358) (323,357) (11,999) 4%Administrative Debits - 46122 - - - - - - 0%Legal Charges - 46126 13,771 18,458 7,627 67,100 20,000 (47,100) -236%General Liability Insurance - 46201 78,593 86,992 73,350 61,255 73,521 12,266 17%
Total Indirect Cost Allocations (203,553) (202,874) (141,361) (183,003) (229,836) (46,833) 20%
Total 2,502,583 2,566,750 2,172,937 3,060,890 3,228,746 167,856 5%
D-3

MAJOR NON-PERSONNEL EXPENSE DETAILS
FY 2017-18 FY 2018-19
42101 Professional Services 16,000$ 51,712$ Applicant Processing/Recruiting 16,000$ EBRCSA Contract - Radios 35,712$
42107 Equipment Maintenance 103,379$ 30,000$ Radio Repairs 1,500$ Vehicle Maintenance 9,000Vehicle Repairs 18,000Vehicle Washing 1,500
42401 Memberships 1,805$ 2,000$ CA Crime Prevention Officers Assn 120$ CA Peace Officers Assn. 320 CA Police Chief's Assn. 400 County Police Chiefs' Assn. 775 International Assn. of Police Chiefs 150 National Assn. of Town Watch 35 Police Executive Research Forum 200
42511 Equipment Rental 5,000$ 5,000$ Firearms Range Rental 5,000$
42514 Special Department Expense 33,095$ 38,000$ Ammunition and firearm repair 5,500$ Body cameras, tablets, and docking stations 4,900 Canine expenses 12,100 Crime Scene Processing/Field Testing Supplies 7,300 Miscellaneous Supplies 8,200
42301 Travel and Training 25,000$ 30,000$ State of CA -- P.O.S.T. 30,000$
Total Professional/Administrative Services 156,712$
44301 Fuel -$ 73,000$
44410 Safety Clothing 3,500$ 12,500$ Part-time employees uniforms 3,500$ Protective Vests 9,000
47101 Equipment 3,240$ 3,240$ Ballistic Shield 1,400$ MP5 1,840
D-4

MEASURE S-2006 FUND - 105POLICE OPERATIONS - 221
EXPENDITURE SUMMARY
FY 2015-16 FY 2016-17 FY 2017-18 FY 2017-18 FY 2018-19 $ Chg % Chg
Actual Actual Actual Budget Proposed
Personnel Thru Mar-18
Salaries & Wages - 401 351,318 354,941 137,869 627,446 631,002 3,556 1%Overtime - 402 398,769 353,913 353,221 320,500 337,438 16,938 5%Employee Benefits - 410 189,297 191,268 132,092 345,138 427,860 82,722 19%
Total Salary & Benefits 939,385 900,123 623,183 1,293,084 1,396,300 103,216 7%
Services and SuppliesProfessional & Administrative Services - 42 2,362 1,169 268 19,790 7,300 (12,490) -171%Other Operating Expenses - 43 - - - - - - 0%Materials & Supplies - 44 6,270 - - - 12,500 12,500 100%
Total Services and Supplies 8,632 1,169 268 19,790 19,800 10 0%
Capital OutlayAsset Acquisition/Improvement - 47 - 126,534 168,190 337,525 - (337,525) -100%
Total Capital Outlay - 126,534 168,190 337,525 - (337,525) -100%
Indirect Cost AllocationsAdministrative Debits - 46122 154,977 - - - - - 0%General Liability Insurance - 46201 21,960 27,298 29,714 27,438 32,120 4,682 15%
Total Indirect Cost Allocations 176,937 27,298 29,714 27,438 32,120 4,682 15%
Total 1,124,953 1,055,123 821,355 1,677,837 1,448,220 (229,617) -16%
D-5

MAJOR NON-PERSONNEL EXPENSE DETAILS
FY 2017-18 FY 2018-19
42107 Equipment Maintenance 16,540$ 4,050$ MDC Repairs 1,650$ Vehicle Maintenance 1,350Vehicle Repairs 1,050
42514 Special Department Expense 3,250$ 3,250$ Gunshot trauma kits 700$ Miscellaneous Supplies 2,550
Total Professional/Administrative Services 7,300$
44301 Fuel -$ 12,500$
D-6

MEASURE S-2014 FUND - 106POLICE OPERATIONS - 221
EXPENDITURE SUMMARY
FY 2015-16 FY 2016-17 FY 2017-18 FY 2017-18 FY 2018-19 $ Chg %
ChgActual Actual Actual Budget Proposed
Personnel Thru Mar-18
Salaries & Wages - 401 - 22,288 26,425 46,965 48,374 1,409 3%Overtime - 402 - - - - - - 0%Employee Benefits - 410 2,712 3,783 4,474 6,230 6,328 98 2%
Total Salary & Benefits 2,712 26,071 30,900 53,195 54,702 1,507 3%
Services and SuppliesProfessional & Administrative Services - 42 3,640 1 - 50,000 50,000 - 0%Other Operating Expenses - 43 - - - - - - 0%Material & Supplies - 44 - - - - - - 0%
Total Services and Supplies 3,640 1 - 50,000 50,000 - 0%
Indirect Cost AllocationsAdministrative Credits - 46121 - - - - - - 0%Equipment Repl Charge - 46125 30,232 16,679 - - - - 0%General Liability Insurance - 46201 1,572 1,411 1,484 1,359 1,604 245 15%
Total Indirect Cost Allocations 31,804 18,090 1,484 1,359 1,604 245 15%
Total 38,156 44,162 32,384 104,554 106,306 1,752 2%
MAJOR NON-PERSONNEL EXPENSE DETAILS
FY 2017-18 FY 2018-19
42514 Special Department Expense 50,000$ 50,000$ EOC Safety Plan/Emergency Prep ($50,000 carryover) 50,000$
D-7

PUBLIC SAFETY AUGMENTATION FUND - 203POLICE OPERATIONS - 221
EXPENDITURE SUMMARY
FY 2015-16 FY 2016-17 FY 2017-18 FY 2017-18 FY 2018-19 $ Chg % Chg
Actual Actual Actual Budget Proposed
Personnel Thru Mar-18
Salaries & Wages - 401 - - - - - - 0%Overtime - 402 - - - - - - 0%Employee Benefits - 410 - - - - - - 0%
Total Salary & Benefits - - - - - - 0%
Services and SuppliesProfessional & Administrative Services - 42 - - - - - - 0%Other Operating Expenses - 43 - - - - - - 0%Material & Supplies - 44 - - - - - - 0%
Total Services and Supplies - - - - - - 0%
Capital OutlayAsset Acquisition/Improvement - 47 - - - - - - 0%
Total Capital Outlay - - - - - - 0%
Indirect Cost AllocationsAdministrative Credits - 46121 - - - - - - 0%Administrative Debits - 46122 - 144,472 108,722 150,857 151,406 549 0%
Total Indirect Cost Allocations - 144,472 108,722 150,857 151,406 549 0%
Total - 144,472 108,722 150,857 151,406 549 0%
D-8

POLICE SUPPORT SERVICES - 222
City of Pinole FY 2018-19
Mission
To supplement and assist Patrol Operations and to enhance the quality of life of our community and the citizens of Pinole.
Program Description
Police Support Services provides support and assistance to Patrol Operations and the community. It includes front office staff who work with the public daily. It includes the Crime Prevention Officers who provide outreach into the community. It includes the collection and processing of evidence. It also includes the maintenance and repair of vehicles and equipment used by all Police staff.
Key Objectives
Manage all Community Outreach Programs Find ways to implement innovative crime prevention techniques C.P.T.E.D. (Crime Prevention Through Environmental Design) Criminal Records Monitoring of Massage Establishments Property and Evidence Room Operations Crime Scene Documentation/ Investigation Remodel of Property and Evidence center
Success Indicators:
New Police Property Specialist hired and trained. New Records Specialist hired and trained. New Community Outreach programs Initiated. Chaplain program and Peer Support Program continued. New volunteers and interns working at the Department.
Position Summary
Position 2014-15 2015-16 2016-17 2017-18 2018-19
Police Property Specialist 1.00 1.00 1.00 1.00 1.00
Administrative Assistant 1.00 1.00 1.00 1.00 1.00
Records Specialist 2.00 2.00 2.00 2.00 2.00
Community Safety Specialist (CPU) 0.92 0.96 0.96 0.96 0.96
Total 4.92 4.96 4.96 4.96 4.96
D-9

GENERAL FUND - 100POLICE SUPPORT SERVICES - 222
EXPENDITURE SUMMARY
FY 2015-16 FY 2016-17 FY 2017-18 FY 2017-18 FY 2018-19 $ Chg % ChgActual Actual Actual Budget Proposed
Personnel Thru Mar-18
Salaries & Wages - 401 290,455 247,211 190,706 288,701 287,698 (1,003) 0%Overtime - 402 753 0 15,742 - - - 0%Employee Benefits - 410 121,275 111,169 101,916 134,385 153,237 18,852 12%
Total Salary & Benefits 412,484 358,380 308,364 423,086 440,935 17,849 4%
Services and SuppliesProfessional & Administrative Services - 242,227 196,889 100,540 331,429 295,473 (35,956) -12%Other Operating Expenses - 43 48,822 55,514 36,929 45,775 51,800 6,025 12%Materials & Supplies - 44 2,013 868 7,078 - 5,400 5,400 100%
Total Services and Supplies 293,062 253,271 144,547 377,204 352,673 (24,531) -7%
Capital OutlayAsset Acquisition/Improvement - 47 49,782 49,782 79,990 79,990 400 (79,590) -19898%Debt Principal & Interest - 48 - - - - 49,782 49,782 100%
Total Capital Outlay 49,782 49,782 79,990 79,990 50,182 (29,808) -59%
Indirect Cost AllocationsAdministrative Debits - 46122 55,000 66,303 - - - - 0%IS Charges - 46124 198,179 205,916 - 203,297 226,747 23,450 10%Legal Charges -46126 - - 459 - - - 0%General Liability Insurance - 46201 9,399 8,854 9,122 8,356 9,542 1,186 12%
Total Indirect Cost Allocations 262,578 281,073 9,581 211,653 236,289 24,636 10%
Total 1,017,905 942,507 542,483 1,091,933 1,080,079 (11,854) -1%
D-10

MAJOR NON-PERSONNEL EXPENSE DETAILS
FY 2017-18 FY 2018-19
42101 Professional Services 156,088$ 167,153$ Axon body cameras licensing and storage 5,973 Children's interview center 1,300 Contra Costa County Jail fees 49,600 County Crime Lab Services 58,000EBCRSA Contract - radios 2,880Family Justice Center 450Miscellaneous Professional Services 4,050SART Exams 5,000Smart Guardian 9,900Video Surveillance System 30,000
42105 Network Maintenance 28,000$ 28,000$ CAD/RMS (previously in IT budget) 28,000
42106 Software Maintenance 38,000$ 28,000$ Police Dispatch and Records Mgmt Software (Tyler) 28,000
42107 Equipment Maintenance 10,445$ 6,050$ Radio Repairs 250 Vehicle Maintenance 4,000 Vehicle Repairs 1,500 Vehicle Washing 300
42108 Maintenance Structure/Imp 53,057$ 23,065$ Bldg Maintenance 1,075 Elevator Service (NEC) 650 HVAC Maintenance (City Mechanical) 1,850 Janitorial Service (UBS) 17,365 Janitorial Supplies (UBS) 1,700 Pest control (Western Exterminator) 425
42201 Office Expense 21,855$ 19,355$ Copier Supplies 500 Office Supplies 12,720 Postage & Equipment (Pitney) 3,000 Printing Services (Concord) 635 Printing Services (Eagle) 2,500
42301 Travel and Training 5,500$ 5,500$ Conferences (CALNENA) $1,000Meetings 500Non POST training 1,000POST training 3,000
D-11

42401 Memberships 350$ 350$ California Criminal Justice 75$ CLEARS 50C.A.P.E. 45 IAPE 50 Nat'l Emergency Number Assn 130
42501 Bank Fees -$ 1,000$
42514 Special Department Expense 18,134$ 17,000$ Photographic supplies 500$ Lab supplies, mandated processing material 375 Crime scene supplies 5,700GSR processing 5,335Fire extinguisher replacement 380Misc. special department expenses 4,710
Total Professional/Administrative Fees 295,473$
43102 Utilities 45,775$ 51,800$ Electricity & Gas (PG&E) $ 48,000 Water (EBMUD) 3,800
44301 Fuel -$ 4,400$
44410 Safety Clothing -$ 1,000$ Aramark Uniform Service
47101 Equipment 49,798$ 400$ Fax Machine 400
47104 Vehicles 30,192$ -$
D-12

POLICE WEST BAY COMMUNICATIONS CENTER - 223
City of Pinole FY 2018-19
Mission
Provide for the West Bay Communication Center (WBCC) operations, serving the Hercules, San Pablo and Pinole Police Departments. The WBCC is staffed 24 hours/day, seven days/week, serving a total population of approximately 75,000. The WBCC handles all police emergency radio/telephone traffic for City Departments during disasters and serves as an "after hours" resource for the Public Works Department.
Program Description
The WBCC now operates under a “Tri-City” model with the cities of Hercules and San Pablo. The Cities of Hercules and San Pablo are billed for Dispatch Services based on a cost-sharing formula that incorporates various usage measurements.
Key Objectives
Provide Exemplary Dispatch Services for the Tri-Cities East Bay Regional Communications System Upgrade Community Warning System Program Camera System Monitoring Program Re-institute the Dispatch Lead position
Success Indicators:
New 911 system in place WBCC is fully staffed “Tri-City” model is in operation
Position Summary
Position 2014-15 2015-16 2016-17 2017-18 2018-19
Support Services Manager 1.00 1.00 1.00 0.00 0.00
Dispatcher 7.00 7.00 7.00 11.00 11.00
Total 8.00 8.00 8.00 11.00 11.00
D-13

GENERAL FUND - 100POLICE WEST BAY COMMUNICATIONS CENTER - 223
EXPENDITURE SUMMARY
FY 2015-16 FY 2016-17 FY 2017-18 FY 2017-18 FY 2018-19 $ Chg % ChgActual Actual Actual Budget Proposed
Personnel Thru Mar-18
Salaries & Wages - 401 605,127 729,441 562,527 813,004 851,090 38,086 4%Overtime - 402 79,884 70,443 200,362 74,695 110,691 35,996 33%Employee Benefits - 410 251,362 217,702 268,911 376,165 401,684 25,519 6%
Total Salary & Benefits 936,372 1,017,586 1,031,800 1,263,864 1,363,465 99,601 7%
Services and SuppliesProfessional & Administrative Services - 42 16,950 15,604 21,914 53,535 58,795 5,260 9%Other Operating Expenses - 43 9,558 10,653 7,505 8,900 10,400 1,500 14%
Total Services and Supplies 26,508 26,258 29,419 62,435 69,195 6,760 10%
Capital OutlayAsset Acquisition/Improvement - 47 843 - - - 27,000 27,000 100%
Total Capital Outlay 843 - - - 27,000 27,000 100%
Indirect Cost AllocationsAdministrative Credits - 46121 (55,000) (66,303) - - - - 0%Administrative Debits - 46122 49,025 63,716 47,855 63,845 71,997 8,152 11%IS Charges - 46124 57,687 47,862 - 48,184 35,052 (13,132) -37%Legal Charges - 46126 - 6,499 - - - - 0%General Liability Insurance - 46126 23,401 20,794 26,878 24,861 31,315 6,454 21%
Total Indirect Cost Allocations 75,113 72,568 74,733 136,890 138,364 1,474 1%
Total 1,038,836 1,116,412 1,135,952 1,463,189 1,598,024 134,835 8%
MEASURE S - 2006 FUND - 105Overtime - 40201 - 25,000 - 25,000 - (25,000) -100%Professional & Administrative Services - 42 - - 3,248 - - - 0%Asset Acquisition/Improvement -47 - - 203,054 - - - 0%Total - 25,000 206,301 25,000 - (25,000) -100%
MEASURE S - 2014 FUND - 106Overtime - 40201 - - - 25,000 - (25,000) -100%Total - - - 25,000 - (25,000) -100%
D-14

MAJOR NON-PERSONNEL EXPENSE DETAILS
FY 2017-18 FY 2018-19
42101 Professional Services 6,765$ 9,645$ 800 MHz radio system maintenance 4,265$ EBCRSA Contract - 5 radios 2,880$ Language Interpretation Services 2,500
42105 Network Maintenance 12,000$ 12,000$ Cad/RMS (previously in IT budget) 12,000$
42106 Software Maintenance 12,000$ 12,000$ Police Dispatch and Records Mgmt Software (Tyler_ 12,000$
42107 Equipment Maintenance 5,500$ 5,500$ Dispatch headset/cord replacement 1,265$ Stancil maintenance 3,000 General equipment non-contract maintenance 1,235
42108 Maintenance Structure/Imp 3,470$ 6,500$ Elevator Service 127$ HVAC Maintenance 241 Janitorial Services 5,318 Janitorial Supplies 757 Pest Control Service 56
42201 Office Expense 2,000$ 2,000$ General Office Supplies 2,000$
4230X Travel and Training 10,650$ 10,000$ Non-POST training $1,500Meetings associated with dispatch function 500Conference attendance for APCO, PSAP, CLEWOA 1,000POST training 3,000Dispatcher Training 4,000
42401 Memberships 150$ 150$ WBCC portion of costs for APCO and CLEWOA participation. 150$
42514 Special Department Expense 1,000$ 1,000$ DOJ fingerprints and background investigations on applicants. 1,000$
Total Professional/Administrative Services 58,795$
4310X Utilities 8,900$ 10,400$ 43103 Electricity & Gas (PG&E) $ 9,500 43102 Water (EBMUD) 800
43105 Cable 100
47102 Computer Equipment -$ 27,000$ New workstations and UPS $ 10,000 Universal Powe Supply 17,000
D-15

POLICE GRANTS - 227
City of Pinole FY 2018-19
Mission
The Police Department receives a variety of grants and special revenue from Federal, State, County, and special district governments to support public safety programs and will continue to seek new grant opportunities.
Program Description
Traffic Safety
Fines and forfeitures received by the City under Section 1463 of the Penal Code are deposited into a special revenue Traffic Safety Fund - 205. These funds are used exclusively for official traffic control devices, the maintenance thereof, equipment and supplies for traffic law enforcement and traffic accident prevention, and for the maintenance, improvement, or construction of public streets, bridges, and culverts within the City. Funds shall not be used to pay the compensation of traffic or other police officers. The fund may be used to pay the compensation of school crossing guards who are not regular full-time members of the police department of the City.
Supplemental Law Enforcement Services
Supplemental Law Enforcement Services Funds (SLESF) - 206 is provided by the State annually. The County applies for the funds and it is received based on population. The City is currently using the funds for basic patrol services.
Supplemental Law Enforcement Services
The Public Safety Augmentation Fund (PSAF) accounts for monies allocated by the County Auditor-Controller under Prop 172 from the statewide one-half cent sales tax based on a share of statewide taxable sales. These funds are used exclusively for public safety. One School Resource Officer (SRO) is funded from PSAF.
Police Grants
The City has an active grant with the West Contra Costa Unified School District (WCCUSD) for reimbursement of two (2) School Resource Officers (SRO's). One SRO is assigned to Pinole Valley High and one is assigned to Pinole Middle School. The two SRO's are funded by the WCCUSD at $160,000 per SRO per year.
Key Objectives
Continue to provide the community with an School Resource Officer Program Grant Program Management and Reporting Seek to enhance our Community Oriented Policing Programs Crossing Guard Program Enhance our current Explorer Program
D-16

POLICE GRANTS - 227
City of Pinole FY 2018-19
Success Indicators
One School Resource Officer at Pinole Valley High School and one at Pinole Middle School are effective in bridging the gap with the youth of our community.
Community Outreach programs include: Coffee with a Cop, Police/ Clergy meetings, School Liaison program, National Night Out, Citizen and Youth Academies, “Making it Better” Police/Youth Literacy program.
Position Summary
Position 2014-15 2015-16 2016-17 2017-18 2018-19
Crossing Guards, PT Temp 0.50 0.50 0.50 0.50 0.50
Police Officer (SRO) 3.00 3.00 2.00 2.00 2.00
Total 3.50 3.50 2.50 2.50 2.50
D-17

POLICE GRANT FUND - 204POLICE GRANTS PROGRAM - 227
EXPENDITURE SUMMARY
FY 2015-16 FY 2016-17 FY 2017-18 FY 2017-18 FY 2018-19 $ Chg % Chg
Actual Actual Actual Budget Proposed
Personnel Thru Mar-18
Salaries & Wages - 401 266,358 192,513 165,888 188,473 209,791 21,318 10%Overtime - 402 47,939 40,322 9,285 9,710 9,000 (710) -8%Employee Benefits- 410 148,646 102,073 92,737 79,775 43,433 (36,342) -84%
Total Salary & Benefits 462,942 334,908 267,909 277,958 262,224 (15,734) -6%
Services and SuppliesProfessional & Administrative Services - 19,010 5,623 4,092 8,455 5,000 (3,455) -69%Materials & Supplies - 44 3,138 - - - - - 0%
Total Services and Supplies 22,148 5,623 4,092 8,455 5,000 (3,455) -69%
Capital OutlayAsset Acquisition/Improvement - 47 74,706 - - - - - 0%
Total Capital Outlay 74,706 - - - - - 0%
Indirect Cost AllocationsAdministrative Credits - 38501 - - - - - 0%General Liability Insurance- 46201 10,047 6,256 5,955 5,528 6,779 1,251 18%
Total Indirect Cost Allocations 10,047 6,256 5,955 5,528 6,779 1,251 18%
Total 569,842 346,787 277,957 291,941 274,003 (17,938) -7%
D-18

MAJOR NON-PERSONNEL EXPENSE DETAILS
FY 2017-18 FY 2018-19
42107 Equipment Maintenance 500$ -$ Crime prevention vehicle maintenance. 500$
42201 Office Expense 2,955$ -$ Office supplies for crime prevention program -$
42514 Special Department Expense 5,000$ 5,000$ Crime prevention and Neighborhood Watch 5,000$ promotional items
D-19

TRAFFIC SAFETY FUND - 205POLICE GRANTS PROGRAM - 227
EXPENDITURE SUMMARY
FY 2015-16 FY 2016-17 FY 2017-18 FY 2017-18 FY 2018-19 $ Chg % Chg
Actual Actual Actual Budget Proposed
Personnel Thru Mar-18
Salaries & Wages - 401 8,745 5,488 4,144 11,471 5,720 (5,751) -101%Overtime - 402 - - - - - - 0%Employee Benefits - 410 1,246 943 916 1,521 750 (771) -103%
Total Salary & Benefits 9,991 6,430 5,060 12,992 6,470 (6,522) -101%
Services and SuppliesProfessional & Administrative Services - 42 479 7,471 1,666 5,460 4,300 (1,160) -27%Other Operating Expenses - 43 - - - - - - 0%
Total Services and Supplies 479 7,471 1,666 5,460 4,300 (1,160) -27%
Capital OutlayAsset Acquisition/Improvement - 47 - - - 7,500 7,500 - 0%
Total Capital Outlay - - - 7,500 7,500 - 0%
Indirect Cost AllocationsAdministrative Debits - 46122 - - - - - - 0%General Liability Insurance -46201 381 355 362 332 191 (141) -74%
Total Indirect Cost Allocations 381 355 362 332 191 (141) -74%
Transfers Out - 49901 - - - - - - 0%
Total 10,850 14,256 7,089 26,284 18,461 (7,823) -42%
MAJOR NON-PERSONNEL EXPENSE DETAILS
FY 2017-18 FY 2018-19
42107 Equipment Maintenance 3,160$ 2,000$ Lidar repair & Supplies 2,000$
42514 Special Department Expense 2,300$ 2,300$ Citation printing 2,300$
Total Professional/Administrative Services 4,300$
47101 Equipment 7,500$ 7,500$ Repair/Replace Traffic Cameras 7,500$
D-20

SUPPLEMENTAL LAW ENFORCEMENT SERVICES FUND - 206POLICE GRANTS PROGRAM - 227
EXPENDITURE SUMMARY
FY 2015-16 FY 2016-17 FY 2017-18 FY 2017-18 FY 2018-19 $ Chg % Chg
Actual Actual Actual Budget Proposed
Personnel Thru Mar-18
Salaries & Wages - 401 - - - - - - 0%Overtime - 402 - - - - - - 0%Employee Benefits - 410 - - - - - - 0%
Total Salary & Benefits - - - - - - 0%
Services and SuppliesProfessional & Administrative
- - - - - - 0%
Other Operating Expenses - 43 - - - - - - 0%Total Services and Supplies - - - - - - 0%
Capital OutlayAsset Acquisition/Improvement - 47 - - - - - - 0%
Total Capital Outlay - - - - - - 0%
Indirect Cost AllocationsAdministrative Credits - 38501 - - - - - - 0%Administrative Debits - 46122 91,915 100,137 65,761 96,657 100,000 3,343 3%
Total Indirect Cost Allocations 91,915 100,137 65,761 96,657 100,000 3,343 3%
Total 91,915 100,137 65,761 96,657 100,000 3,343 3%
D-21

FIRE OPERATIONS - 231
City of Pinole FY 2018-19
Mission
The members of the Pinole Fire Department dedicate their efforts and available resources to provide safety and welfare to the public through preservation of life, property, and the environment.
Key Objectives
Complete our top 40 most critical Fire Prevention inspections Hire (2)Firefighters to get full strength Acquire a reserve Fire Engine Complete the Fire Station repairs: Station alert package & dorm privacy Order a new Fire Engine
Success Indicators
Hired two new Firefighters and placed into an academy Hired a new Battalion Chief Promoted a Captain and (2) Fire Engineers Acquired 16 new SCBA packs and 20 bottles from a regional grant Integrated a hardware and software program: Tablet Command Responded to over 2,400 calls for service
Position Summary
Position 2014-15 2015-16 2016-17 2017-18 2018-19
Fire Chief 1.00 1.00 1.00 1.00 1.00
Administrative Battalion Chief 0.00 1.00 1.00 0.00 0.00
Battalion Chief 1.00 1.00 1.00 1.00 1.00
Captain 3.00 3.00 3.00 3.00 3.00
Fire Engineer 1.00 1.00 1.00 1.00 1.00
Engineer/Paramedic 3.00 2.00 2.00 2.00 2.00
Firefighter/Paramedic 5.00 3.00 3.00 3.00 6.00
Firefighter 6.00 3.00 3.00 3.00 0.00
Administrative Secretary 0.48 0.48 0.48 0.48 0.48
Total 20.48 15.48 15.48 14.48 14.48
E-1

GENERAL FUND - 100FIRE OPERATIONS - 231
EXPENDITURE SUMMARY
FY 2015-16 FY 2016-17 FY 2017-18 FY 2017-18 FY 2018-19 $ Chg % Chg
Actual Actual Actual Budget Proposed
Personnel Thru Mar-18
Salaries & Wages - 401 1,336,157 1,090,343 829,498 1,228,301 1,256,283 27,982 2%Overtime - 402 - 5,108 21,099 - - - 0%Employee Benefits - 410 633,739 500,665 416,292 644,154 747,924 103,770 14%
Total Salary & Benefits 1,969,896 1,596,116 1,266,890 1,872,455 2,004,207 131,752 7%
Services and SuppliesProfessional & Administrative Services - 42 437,066 1,470,431 213,666 465,795 627,414 161,619 26%Other Operating Expenses -43 74,473 59,884 41,053 66,194 53,600 (12,594) 0%Materials & Supplies - 44 37,294 41,778 31,645 24,800 43,400 18,600 43%
Total Services and Supplies 548,833 1,572,093 286,363 556,789 724,414 167,625 23%
Capital OutlayAsset Acquisition/Improvement - 47 - - - 23,000 - (23,000) -100%
Total Capital Outlay - - - 23,000 - (23,000) -100%
Indirect Cost AllocationsAdmin Debits - 46122 - - - - 145,506 145,506 100%IS Charges - 46124 35,101 51,186 - 63,270 60,524 (2,746) -5%Legal Services - 46126 - 4,712 2,254 25,100 2,500 (22,600) -904%General Liability Insurance - 46201 46,382 42,759 38,052 35,136 41,010 5,874 14%
Total Indirect Cost Allocations 81,483 98,656 40,306 123,506 249,540 126,034 51%
Total 2,600,212 3,266,865 1,593,559 2,575,750 2,978,161 402,411 14%
E-2

MAJOR NON-PERSONNEL EXPENSE DETAILS
FY 2017-18 FY 2018-19
42101 Professional Services 282,860$ 428,104$ Admin Consultant 141000
Annual Physicals 15,200$ CCC Cupa 500 CCC Fire Protection District- Dispatch 165,000Crisis Resolution 5,000EBRCSA Radio contract -29 radios 16,704Fire Prevention - CSG Consultants 50,000Greg Kennedy - Medic IQ Services 24,000Maximum Security -Station 74 1,200Physio Control Annual Premium 2,500Recruitment 7,000
42104 Paramedic Supplies 17,470$ 20,585$
Medical Supplies 10,000$ Medic CD ($1,000 x 9) 9,000 EMT Recerts ($37 x 5) 185 Paramedic Recerts ($100 x 9) 900 EMS Reference Books 500
42105 Network Maintenance 2,000$ 2,000$ Fire RMS Support (previously in IT budget) 2,000$
42106 Software Maintenance 7,000$ -$
42107 Equipment Maintenance 85,000$ 65,100$ Apparatus Maintenance 40,000$ Flow/Hydro testing 10,100Miscellaneous tools/parts 10,000SCBA Maintenance 5,000
42108 Maintenance Structure/Imp 14,370$ 39,000$ D&H Landscape Contract 4,320$ Dorm room privacy/separation 24,630 Elevator Contract 800 Heating and air contract 3,850 Janitorial Supplies 4,950 Pest Control Contract 450
42201 Office Expense 3,000$ 4,000$ New Office furniture 4,000$
4230X Travel and Training 13,540$ 15,000$ Annual Training 15,000$
E-3

42401 Memberships 855$ 625$
42512 Weed Abatement 30,000$ 45,000$ Increased abatement for brush removal 45,000$
42514 Special Department Expense 9,700$ 8,000$ Miscellaneous Special Department Expenses 8,000
Total Professional/Administrative Services 627,414$
4310X Utilities 66,194$ 50,600$ 43103 PG&E 40,000$ 43102 EBMUD 10,000 43101 Comcast 500
43101 Telephone 100
43201 Property Tax -$ 3,000$
44301 Fuel -$ 12,400$
44410 Safety Clothing 24,800$ 31,000$ Safety Clothing 5,000$ Replacement Turn-out Gear (6-sets) 21,000 Foul Weather Gear 5,000
E-4

MEASURE S-2006 FUND - 105FIRE OPERATIONS - 231
EXPENDITURE SUMMARY
FY 2015-16 FY 2016-17 FY 2017-18 FY 2017-18 FY 2018-19 $ Chg % ChgActual Actual Actual Budget Proposed
Personnel Thru Mar-18
Salaries & Wages - 401 171,068 240,098 120,660 185,648 201,794 16,146 8%Overtime - 402 201,069 239,641 304,261 433,629 247,067 (186,562) -76%Employee Benefits - 410 91,520 89,491 53,079 98,103 107,951 9,848 9%
Total Salary & Benefits 463,657 569,231 478,000 717,380 556,812 (160,568) -29%
Services and SuppliesProfessional & Administrative Services - 42 5,222 10 - 55,000 55,000 - 0%Materials & Supplies - 44 900 - - - - - 0%
Total Services and Supplies 6,122 10 - 55,000 55,000 - 0%
Capital OutlayAsset Acquisition/Improvement - 47 - 7,197 - - 400,000 400,000 100%Debt Principal - 48101 62,162 63,734 65,347 65,347 67,000 1,653 2%Debt Interest - 48102 8,335 6,699 5,086 5,086 3,433 (1,653) -48%
Total Capital Outlay 70,497 77,630 70,433 70,433 470,433 400,000 85%
Indirect Cost AllocationsAdministrative Credits - 46121 - (5,149) - - (145,506) (145,506) -100%Administrative Debits - 46122 - - - - - - 0%General Liability Insurance - 46201 15,020 13,943 13,223 12,136 14,307 2,171 15%
Total Indirect Cost Allocations 15,020 8,795 13,223 12,136 (131,199) (143,335) 0%
Total 555,295 655,666 561,656 854,949 951,046 96,097 10%
MAJOR NON-PERSONNEL EXPENSE DETAILS
FY 2017-18 FY 2018-19
42107 Equipment Maintenance 55,000$ 55,000$ Vehicle Maintenance 5,000$ Reserve apparatus engine purchase 50,000$
Total Professional/Administrative Services 55,000$
47101 Equipment -$ 400,000$ Fire Engine 400,000$
48101 Debt Principal 65,347$ 67,000$ Type-1 Vehicle Apparatus (Commercial Lease - Principal) 67,000$
48102 Debt Interest 5,086$ 3,433$ Type-1 Vehicle Apparatus (Commercial Lease - Interest) 3,433$
E-5

MEASURE S-2014 FUND - 106FIRE OPERATIONS - 231
EXPENDITURE SUMMARY
FY 2015-16 FY 2016-17 FY 2017-18 FY 2017-18 FY 2018-19 $ Chg % ChgActual Actual Actual Budget Proposed
Personnel Thru Mar-18
Salaries & Wages - 401 - - - 174,599 194,989 20,390 10%Overtime - 402 - - - 17,500 - (17,500) -100%Employee Benefits - 410 5,365 6,902 9,120 82,607 38,446 (44,161) -115%
Total Salary & Benefits 5,365 6,902 9,120 274,706 233,435 (41,271) -18%
Services and SuppliesProfessional & Administrative Services - 42 - - 20,000 20,000 20,000 - 0%Materials & Supplies - 44 1,000 - - - - - 0%
Total Services and Supplies 1,000 - 20,000 20,000 20,000 - 0%
Capital OutlayAsset Acquisition/Improvement - 47 9,208 - - 60,000 55,000 (5,000) -9%
Total Capital Outlay 9,208 - - 60,000 55,000 (5,000) -9%
Indirect Cost AllocationsAdministrative Credits - 46121 - - - - - - 0%Administrative Debits - 46122 - - - - - - 0%General Liability Insurance - 46201 3,110 4,687 5,517 5,054 6,228 1,174 19%
Total Indirect Cost Allocations 3,110 4,687 5,517 5,054 6,228 1,174 19%
Total 18,683 11,589 34,637 359,760 314,663 (45,097) -14%
MAJOR NON-PERSONNEL EXPENSE DETAILS
FY 2017-18 FY 2018-19
4230X Travel & Training 20,000$ 20,000$ Fire Training Academy 20,000$
Total Professional/Administrative Services 20,000$
47101 Equipment 45,000$ 45,000$ Compressor (carryover from FY 2017/18 ) 45,000$
47102 Computer Equipment 15,000$ 10,000$ Computer monitors ($10,000 carryover from FY 2017/18 ) 10,000$
E-6

PUBLIC WORKS ADMINISTRATION & ENGINEERING - 341
City of Pinole FY 2018‐19
Mission
The mission of the Public Works Administration and Engineering Division is to administer, plan, engineer and manage projects and programs that benefit of the City.
Program Description
Design, administer, and supervise capital improvement projects for:
Street Projects funded from the General Fund, Gas Tax and Measure J Parks and recreation funded from Measure WW Pinole Hercules Water Pollution Control Plant and sewer collection system funded by the
Sewer Enterprise Storm drainage system funded by Storm Water Benefit Assessment
Key Objectives
Daily management of the Public Works department including: parks, maintenance, code enforcement, planning, waste reduction, and clean water
Compliance reporting regarding all engineering and public works matters, including and not limited to the General Plan; environmental compliance; labor compliance, etc.
Environmental program management including solid waste and stormwater Represent Pinole in regional transportation, development, environmental, and planning
processes Evaluate opportunities to increase collaborate with private developers on projects,
including the sale of City owned lots for development Periodic updates to the Capital Improvement Plan Pursue grant-funding opportunities Provide support to Traffic and Pedestrian Safety Committee
Success Indicators
Efficient, successful project execution and program management to benefit Pinole residents.
Position Summary
Position 2014-15 2015-16 2016-17 2017-18 2018-19 Development Services Director/City Engineer 1.00 1.00 1.00 1.00 1.00
Management Analyst, PT/Temp 0.48 0.00 0.00 0.00 0.00
Senior Project Manager 0.00 1.00 1.00 1.00 1.00
Public Works Specialist 1.00 1.00 1.00 1.00 1.00
Administrative Secretary 1.00 1.00 1.00 1.00 1.00
Total 3.48 4.00 4.00 4.00 4.00
F-1

GENERAL FUND - 100PUBLIC WORKS - ADMINISTRATION & ENGINEERING - 341
EXPENDITURE SUMMARY
FY 2015-16 FY 2016-17 FY 2017-18 FY 2017-18 FY 2018-19 $ Chg % ChgActual Actual Actual Budget Proposed
Personnel Thru Mar-18
Salary & Wages - 401 271,358 336,677 283,311 388,691 432,056 43,365 10%Overtime - 402 1,254 192 10 - - - 0%Employee Benefits - 410 92,932 127,374 126,411 159,662 185,118 25,456 14%
Total Salary & Benefits 365,544 464,242 409,732 548,353 617,174 68,821 11%
Services and SuppliesProfessional & Administrative Services - 42 109,347 1,932 2,572 9,525 12,575 3,050 24%Materials and Supplies - 44 200 - - - - - 0%
Total Services and Supplies 109,547 1,932 2,572 9,525 12,575 3,050 24%
Capital OutlayAsset Acquisition/Improvement - 47 - - 6,288 - - - 0%
Total Capital Outlay - - 6,288 - - - 0%
Indirect Cost AllocationsAdministrative Credits - 46121 (263,761) (423,355) (353,853) (514,347) (581,319) (66,972) 12%IS Charges - 46124 5,259 39,487 - 72,524 66,557 (5,967) -9%Legal Charges - 46126 - - 108 - 8,000 8,000 100%General Liability Insurance - 46201 13,112 23,026 14,445 11,036 14,091 3,055 22%
Total Indirect Cost Allocations (245,391) (360,842) (339,300) (430,787) (492,671) (61,884) 13%
Total 229,699 105,332 79,293 127,091 137,078 9,987 7%
MEASURE S - 2014 FUND - 106Administrative Debits - 46122 - 15,697 34,194 54,446 56,237 1,791 3%Equipment Repl Charges - 46125 53,101 - - - - - 0%
Total Measure S - 2014 53,101 15,697 34,194 54,446 56,237 1,791 3%
F-2

MAJOR NON-PERSONNEL EXPENSE DETAILS
FY 2017-18 FY 2018-19
42101 Professional Services 2,100$ 10,000$ General engineering services 10,000$
42107 Equipment Maintenance 500$ 500$ Maintenance of office equipment. 500$
42201 Office Expense 5,750$ 500$ General office supplies 500$
4230X Travel and Training 1,000$ 1,400$ 1,400$
42506 Bonds 175$ 175$ 175$
Total Professional/Administrative Services 12,575$
F-3

MEASURE J FUND - 215PUBLIC WORKS - ADMINISTRATION & ENGINEERING - 341
EXPENDITURE SUMMARY
FY 2015-16 FY 2016-17 FY 2017-18 FY 2017-18 FY 2018-19 $ Chg % ChgActual Actual Actual Budget Proposed
Personnel Thru Mar-18
Salaries & Wages - 401 - - - - - - 0%Overtime - 402 - - - - - - 0%Employee Benefits - 410 - - - - - - 0%
Total Salary & Benefits - - - - - - 0%
Services and SuppliesProfessional & Administrative Services - 42 - 39,675 42,772 - - - 0%Other Operating Expenses - 43 - 440 3,542 4,000 4,400 400 9%Materials & Supplies - 44 - - - - - - 0%
Total Services and Supplies - 40,115 46,314 4,000 4,400 400 9%
Capital OutlayAsset Acquisition/Improvement - 47 599,760 6,326 6,947 45,720 45,720 - 0%
Total Capital Outlay 599,760 6,326 6,947 45,720 45,720 - 0%
Indirect Cost AllocationsAdministrative Debits - 46122 25,451 15,754 58,109 96,033 103,412 7,379 7%IS Charges - 46124 31,734 54,233 - - - - 0%
Total Indirect Cost Allocations 57,185 69,987 58,109 96,033 103,412 7,379 7%
Total 656,945 116,429 111,369 145,753 153,532 7,779 5%
MAJOR NON-PERSONNEL EXPENSE DETAILS
FY 2017-18 FY 2018-19
4310X Utilities 4,000$ 4,400$ 43101 Telephone 4,000$ 43103 Electricity & Power 400
F-4

PUBLIC WORKS ROAD MAINTENANCE - 342
City of Pinole FY 2018‐19
Mission
The mission of the Road Maintenance Division is to maintain the City’s infrastructure. The City’s infrastructure includes buildings, roads, pavement, pavement markings, curb, sidewalk, medians, traffic signs, traffic signals, and streetlights.
Program Description
This division maintains the entire city road infrastructure which includes pavement, medians, traffic signs, pavement markings, traffic signals, streetlights, curbs and sidewalks.
Key Objectives
Timely response to maintenance needs Preservation of assets Safe roadways Water wise and energy efficient infrastructure
Success Indicators
Pavement Condition Index maintained at current level: 70.
Position Summary
No personnel are directly assigned to this division.
F-5

GAS TAX FUND - 200ROAD MAINTENANCE - 342
EXPENDITURE SUMMARY
FY 2015-16 FY 2016-17 FY 2017-18 FY 2017-18 FY 2018-19 $ Chg % ChgActual Actual Actual Budget Proposed
Personnel Thru Mar-18
Salaries & Wages - 401 (13,386) - - - - 0%Overtime - 402 - - - - - - 0%Employee Benefits - 410 - 48 - - - - 0%
Total Salary & Benefits (13,386) 48 - - - - 0%
Services and SuppliesProfessional & Administrative Services - 19,293 20,360 7,317 42,200 112,522 70,322 62%Other Operating Expenses - 43 201,376 240,829 128,407 290,000 181,000 (109,000) -60%Materials & Supplies - 44 163 - - - - - 0%
Total Services and Supplies 220,832 261,189 135,725 332,200 293,522 (38,678) -13%
Capital OutlayAsset Acquisition/Improvement - 47 - 250 - - - - 0%
Total Capital Outlay - 250 - - - - 0%
Indirect Cost AllocationsAdministrative Credits - 46121 - - - - - - 0%Administrative Debits - 46122 53,887 112,733 80,240 121,191 135,079 13,888 10%IS Charges - 46124 1,279 - - - - - 0%Legal Charges - 46126 8,178 17,195 5,085 9,400 8,000 (1,400) -18%
Total Indirect Cost Allocations 63,344 129,928 85,325 130,591 143,079 12,488 9%
Total 270,790 391,415 221,049 462,791 436,601 (26,190) -6%
GENERAL FUND - 100Professional & Administrative Services - 20,461 9,917 - 30,000 32,000 2,000 6%Materials & Supplies - 44 2,548 2,911 16,304 - - - 0%Administrative Debits - 46122 8,842 19,098 12,310 21,823 23,914 2,091 9%
31,851 31,926 28,614 51,823 55,914 4,091 7%
F-6

MAJOR NON-PERSONNEL EXPENSE DETAILS
FY 2017-18 FY 2018-19
42101 Professional Services 31,000$ 101,000$ Audit Services 1,000$ General engineering survey contract 10,000Professional engineering support 20,000Traffic and signal maintenance 70,000
42108 Maintenance Structure/Imp 7,500$ 7,500$ Hardware supplies and median maintenance 7,500$
42514 Special Department Expense 3,700$ 4,022$ CCTA congestion management plan administration 4,022$ Pinole's share of CTA Congestion Management Plan administrative costs.
Total Professional/Administrative Services 112,522$
4310X Utilities 290,000$ 181,000$ Electricity costs for street lights, traffic lights and controls Electricity & Gas (PG&E) 180,000$ EBMUD median irrigation 1,000$
GENERAL FUND - 100
42101 Professional Services 30,000$ -$
42514 Special Department Expense -$ 32,000$ Maintenance materials and supplies 29,000$ Street sign replacement program 3,000
F-7

PUBLIC WORKS FACILITY MAINTENANCE - 343
City of Pinole FY 2018‐19
Mission
The mission of the Facility Maintenance Division is to maintain the City’s various facilities.
Program Description
This division maintains all buildings and properties owned by the City. Building maintenance includes and is not limited to landscape maintenance, janitorial service, maintenance of heating and ventilation systems, maintenance of all mechanical aspects of the buildings, general building maintenance, and making improvements as needed.
Key Objectives
Timely response to maintenance needs. Preservation of facility assets. Safe, comfortable, and energy efficient buildings.
Success Indicators
Facilities are maintained in a safe, clean, and aesthetically pleasing manner.
Position Summary
Position 2014-15 2015-16 2016-17 2017-18 2018-19
Public Works Manager 1.00 1.00 1.00 1.00 1.00
Public Works Maintenance Supervisor 1.00 1.00 1.00 1.00 1.00
Maintenance Workers 4.00 4.00 5.00 5.00 5.00
Total 6.00 6.00 7.00 7.00 7.00
F-8

GENERAL FUND - 100PUBLIC WORKS - FACILITY MAINTENANCE - 343
EXPENDITURE SUMMARY
FY 2015-16 FY 2016-17 FY 2017-18 FY 2017-18 FY 2018-19 $ Chg % ChgActual Actual Actual Budget Proposed
Personnel Thru Mar-18
Salaries & Wages - 401 380,936 424,112 313,777 507,496 508,369 873 0%Overtime - 402 4,402 2,249 1,411 - 362 362 100%Employee Benefits - 410 195,701 211,531 158,798 236,600 304,825 68,225 22%
Total Salary & Benefits 581,039 637,891 473,986 744,096 813,556 69,460 9%
Services and SuppliesProfessional & Administrative Services - 42 156,951 150,812 120,150 195,615 104,977 (90,638) -86%Other Operating Expenses - 43 39,872 37,493 23,047 38,000 41,000 3,000 7%Materials & Supplies - 44 5,436 8,773 7,158 5,600 28,200 22,600 80%
Total Services and Supplies 202,258 197,078 150,355 239,215 174,177 (65,038) -37%
Capital OutlayAsset Acquisition/Improvement - 47 - - - - - - 0%
Total Capital Outlay - - - - - - 0%
Indirect Cost AllocationsAdministrative Credits - 46121 (258,250) (422,712) (287,256) (560,770) (614,260) (53,490) 9%IS Charges - 46124 - - - - - - 0%General Liability Insurance - 46201 13,754 16,152 36,678 14,273 16,634 2,361 14%
Total Indirect Cost Allocations (244,496) (406,561) (250,579) (546,497) (597,626) (51,129) 9%
Total 538,801 428,408 373,762 436,814 390,107 (46,707) -12%
MEASURE S - 2014 FUND - 106Administrative Debits - 46122 - - - 89,966 97,592 7,626 8%Asset Acquisition/Improvement - 47 202,807 3,229 29,472 95,000 130,000 35,000 27%
202,807 3,229 29,472 184,966 227,592 42,626 19%
F-9

MAJOR NON-PERSONNEL EXPENSE DETAILS
FY 2017-18 FY 2018-19
42101 Professional Services 83,600$ 3,456$ EBRCSA contract - 6 radios 3,456$
42107 Equipment Maintenance 22,000$ 43,456$ EBRCSA maintenance for 6 radios 3,456$ Vehicle maintenance and repair 40,000$
42108 Maintenance/Structure Imp 56,000$ 56,000$ Elevator maintenance 800Heating and air repair 16,000$ Janitorial service and supplies 13,000 Landscape maintenance 3,000 Lighting supplies 500 Misc. hardware and maintenance 1,000 Pest control and weed control 10,700 Pacific facilities deferred maintenance 11,000
4230X Travel and Training 1,500$ 1,550$ Technical training 1,550$
42401 Memberships 315$ 315$ M.S.A. (Maintenance Superintendents Association) 315$ T.C.S.A. (Traffic Control Supervisory Association)Technical publications
42511 Equipment Rental 200$ 200$ This is used to rent infrequently used equipment. 200$
42514 Special Department Expense 32,000$ -$ Maintenance materials, street warning signs, -$ street marking paint, small hand tools and vandalism repairStreet sign replacement program
Total Professional/Administrative Services 104,977$
4310X Utilities 38,000$ 37,000$ Gas/Electricity 24,000$ Water 13,000
43201 Property Tax -$ 4,000$
44301 Fuel -$ 8,200$
44410 Safety Clothing 5,600$ 20,000$ The worker classifications in this division are supplied: 20,000$ Uniforms, coveralls, and foul weather gear
F-10

RESTRICTED REAL ESTATE MAINTENANCE FUND - 201PUBLIC WORKS - FACILITY MAINTENANCE - 343
EXPENDITURE SUMMARY
FY 2015-16 FY 2016-17 FY 2017-18 FY 2017-18 FY 2018-19 $ Chg % ChgActual Actual Actual Budget Proposed
Personnel Thru Mar-18
Salaries & Wages - 401 - - - - - - 0%Overtime - 402 - - - - - - 0%Employee Benefits - 410 - - - - - - 0%
Total Salary & Benefits - - - - - - 0%
Services and SuppliesProfessional & Administrative Services - 42 30,762 11,017 13,083 27,500 21,175 (6,325) -30%Other Operating Expenses - 43 18,000 9,661 8,341 15,000 11,000 (4,000) -36%
Total Services and Supplies 48,762 20,678 21,424 42,500 32,175 (10,325) -32%
Capital OutlayAsset Acquisition/Improvement - 47 - - - - - - 0%
Total Capital Outlay - - - - - - 0%
Indirect Cost AllocationsAdministrative Debits - 46122 - - - - - - 0%IS Charges - 46124 - - - - - - 0%Legal Charges - 46126 - 2,464 - 5,000 5,000 - 0%
Total Indirect Cost Allocations - 2,464 - 5,000 5,000 - 0%
Total 48,762 23,142 21,424 47,500 37,175 (10,325) -28%
MAJOR NON-PERSONNEL EXPENSE DETAILS
FY 2017-18 FY 2018-19
42101 Professional Services 5,000$ -$ Appraisals of R/E Properties for Marketing/Sale -$
42108 Maintenance/Structure Imp 22,500$ 21,175$ Material to maintain facilities owned by the 21,175$
former Redevelopment Agency.
4310X Utilities 15,000$ 11,000$ Gas/Electricity 5,000$ Water 6,000
F-11

PUBLIC WORKS NPDES STORM WATER - 344
City of Pinole FY 2018‐19
Mission
The mission of the Public Works National Pollution Discharge Elimination System (NPDES) Storm Water Program is to provide programs, projects and services that aid the City of Pinole in maintaining compliance with its NPDES obligations under the Clean Water Act, thereby maintaining and improving the water quality of Pinole Creek and the San Pablo Bay.
Program Description
The Regional Water Quality Control Board regulates storm water discharges from municipal storm drains under the NPDES program and has issued a NPDES permit in November 2016 to the region. The City of Pinole participates with the regional permit; administrative oversight for the permit is performed by the Contra Costa Clean Water Program (CCCWP). The new permit has become more stringent on litter removal, PCB and Mercury levels, and has required increased use of green infrastructure. It will be necessary to expand programs in 2016-17 to strive toward permit compliance.
This program is funded by a storm water benefit assessment area. The Equivalent Runoff Unit cost associated with the implementation of NPDES Program for 2016-17 remains at $35. Assessment fees are collected as a part of the annual property tax collection disbursed using the same schedule that is used for payment of property taxes to each participating city. The programs that the City of Pinole implements under its Storm Water Pollution Control Plan are primarily street sweeping, storm drain cleaning and maintenance.
Key Objectives
Maintain the City’s Storm Drain System Install additional litter collection devices in the City's Storm Drain System Maintain new and existing litter collection devices in the City's Storm Drain System Collect litter from city roadways Public Outreach and Education Perform storm water inspections at all construction sites and identifies development sites
for green infrastructure Prepare an Annual Report of City Activities with respect to NPDES Participate in the administration of the CCCWP as required by the permit
Success Indicators
Timely CCCWP reporting
Functional litter collection devices Street sweeping as scheduled Permit compliance
Position Summary
No personnel are directly assigned to this division.
F-12

STORM WATER FUND - 207PUBLIC WORKS - NPDES STORM WATER - 344 NATIONAL POLLUTION DISCHARGE ELIMINATION SYSTEM (NPDES)
EXPENDITURE SUMMARY
FY 2015-16 FY 2016-17 FY 2017-18 FY 2017-18 FY 2018-19 $ Chg % ChgActual Actual Actual Budget Proposed
Personnel Thru Mar-18
Salaries & Wages - 401 - - - - - 0%Overtime - 402 - - - - - - 0%Employee Benefits - 410 14,438 - - - - - 0%
Total Salary & Benefits 14,438 - - - - - 0%
Services and SuppliesProfessional & Administrative Services - 48,538 50,855 31,714 113,083 88,181 (24,902) -28%Other Operating Expenses - 43 - - - - - - 0%Materials & Supplies - 44 4,420 11,184 14,146 500 9,600 9,100 95%
Total Services and Supplies 52,958 62,039 45,861 113,583 97,781 (15,802) -16%
Capital OutlayAsset Acquisition/Improvement - 47 - - - - - - 0%
Total Capital Outlay - - - - - - 0%
Indirect Cost AllocationsAdministrative Credits - 46121 - - - - - - 0%Administrative Debits - 46122 93,710 179,043 126,387 191,837 214,392 22,555 11%IS Charges - 46124 - - - - - - 0%Legal Charges - 46126 - - 5,274 - 6,000 6,000 100%
Total Indirect Cost Allocations 93,710 179,043 131,661 191,837 220,392 28,555 13%
Total 161,106 241,082 177,522 305,420 318,173 12,753 4%
F-13

MAJOR NON-PERSONNEL EXPENSE DETAILS
FY 2017-18 FY 2018-19
42101 Professional Services 23,000$ 23,000$ Contract support for Clean Water and NPDES 23,000$
42107 Equipment Maintenance 18,000$ 10,000$ Storm drain, trash capture, street sweeper 10,000$
42108 Building Structure Maintenance 5,000$ 5,000$ Trash capture devices 5,000$
4220X Office Expenses -$ 400$ Miscellaneous office expenses 200$ Printing and Binding 200
42514 Special Departamental Expense 67,083$ 49,781$ CCC Assessment District admin 802$ CCC Tax collection service 5,570$ CCCWP group costs 33,630$ Lumber and supply costs for Clean Water program 9,779$
Total Professional/Administrative Services 88,181$
44301 Fuel -$ 8,000$
44410 Safety Clothing 500$ 1,600$
F-14
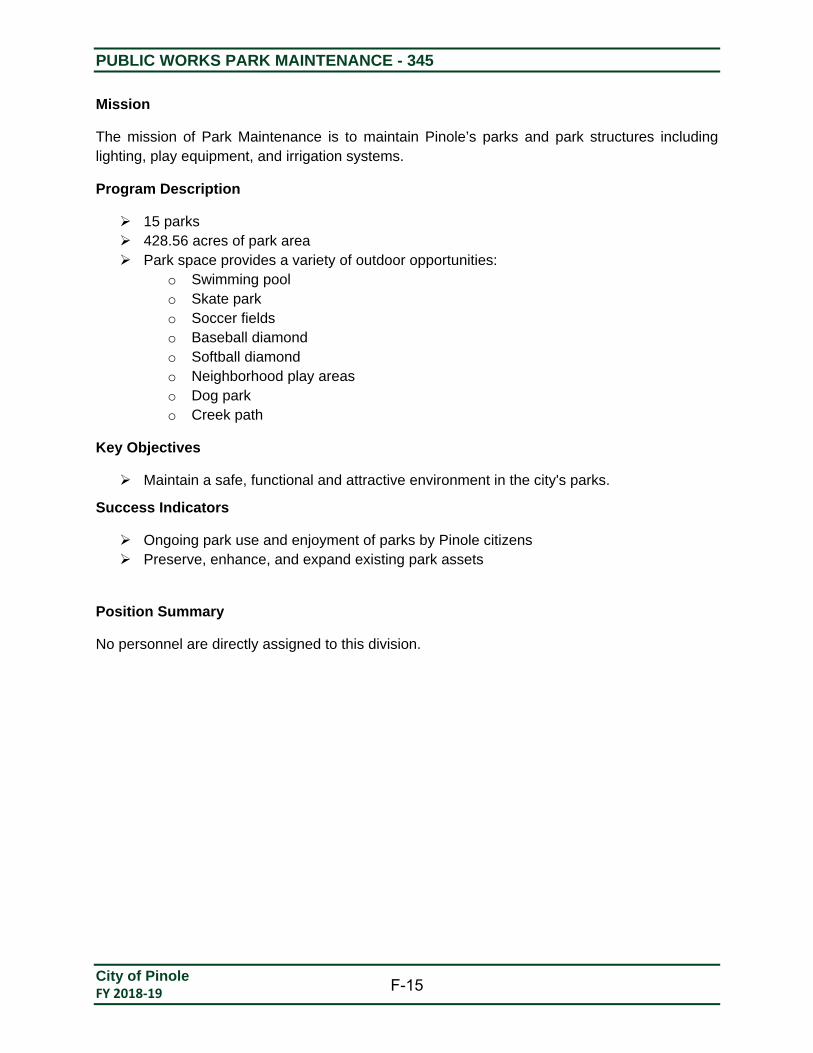
PUBLIC WORKS PARK MAINTENANCE - 345
City of Pinole FY 2018‐19
Mission
The mission of Park Maintenance is to maintain Pinole’s parks and park structures including lighting, play equipment, and irrigation systems.
Program Description
15 parks 428.56 acres of park area Park space provides a variety of outdoor opportunities:
o Swimming pool o Skate park o Soccer fields o Baseball diamond o Softball diamond o Neighborhood play areas o Dog park o Creek path
Key Objectives
Maintain a safe, functional and attractive environment in the city's parks.
Success Indicators
Ongoing park use and enjoyment of parks by Pinole citizens Preserve, enhance, and expand existing park assets
Position Summary
No personnel are directly assigned to this division.
F-15

GENERAL FUND - 100PUBLIC WORKS - PARK MAINTENANCE - 345
EXPENDITURE SUMMARY
FY 2015-16 FY 2016-17 FY 2017-18 FY 2017-18 FY 2018-19 $ Chg % ChgActual Actual Actual Budget Proposed
Personnel Thru Mar-18
Salaries & Wages - 401 - - - - - - 0%Overtime - 402 - - - - - - 0%Employee Benefits - 410 - - - - - - 0%
Total Salary & Benefits - - - - - - 0%
Services and SuppliesProfessional & Administrative Services - 42 79,083 104,776 64,966 119,827 119,827 - 0%Other Operating Expenses - 43 35,443 55,845 45,642 85,000 68,156 (16,844) -20%Materials & Supplies - 44 351 672 610 - 500 500 100%
Total Services and Supplies 114,877 161,293 111,218 204,827 188,483 (16,344) -8%
Capital OutlayAsset Acquisition/Improvement - 47 - - - - - - 0%
Total Capital Outlay - - - - - - 0%
Indirect Cost AllocationsAdministrative Debits - 46122 44,209 38,197 24,621 43,646 47,828 4,182 9%IS Charges - 46124 - - - - - - 0%
Total Indirect Cost Allocations 44,209 38,197 24,621 43,646 47,828 4,182 10%
Total 159,086 199,490 135,839 248,473 236,311 (12,162) -5%
F-16

MAJOR NON-PERSONNEL EXPENSE DETAILS
FY 2017-18 FY 2018-19
42101 Professional Services 5,000$ 5,000$ Professional maintenance contract 5,000$
42107 Equipment Maintenance 4,500$ 4,500$ Off road equipment maintenance 4,500$
42108 Maintenance/Structure Imp 110,000$ 110,000$ Landscape maintenance contract (HDL) 100,000$ Materials for parks, restrooms and play area 10,000
42401 Memberships 127$ 127$ CAPCA (California Agricultural Production 100$ Consultants Association)P.A.P.A. (Pest Applicators Association) 27$
42511 Equipment Rental 200$ 200$ Cost to rent infrequently used equipment. 200$
Total Professional/Administrative Services 119,827$
4310X Utilities 85,000$ 68,000$ Gas/Electricity 10,000$ Water 58,000
43201 Property Tax -$ 156$
44301 Fuel -$ 500$
F-17

PV PARK CARETAKER FUND - 317PUBLIC WORKS - PARK MAINTENANCE - 345(FORMERLY PARKS/RECREATION FACILITIES - 7351)
EXPENDITURE SUMMARY
FY 2015-16 FY 2016-17 FY 2017-18 FY 2017-18 FY 2018-19 $ Chg % ChgActual Actual Actual Budget Proposed
Personnel Thru Mar-18
Salaries & Wages - 401 13,440 11,776 8,740 11,960 11,960 - 0%Overtime - 402 - - - - - - 0%Employee Benefits - 410 966 1,446 1,293 1,587 1,564 (23) -1%
Total Salary & Benefits 14,406 13,222 10,033 13,547 13,524 (23) 0%
Services and SuppliesProfessional & Administrative Services - 42 - 806 263 - - - 0%Other Operating Expenses -43 688 756 660 856 856 - 0%
Total Services and Supplies 688 1,562 923 856 856 - 0%
Capital OutlayEquipment - 42107 - - - - - - 0%
Total Capital Outlay - - - - - - 0%
Internal Cost AllocationsAdministrative Debits - 46122 - - - - - - 0%General Liability Insurance - 46201 - 370 378 346 397 51 0%
Total Internal Cost Allocations - 370 378 346 397 51 0%
Total 15,094 15,154 11,334 14,749 14,777 28 0%
MAJOR NON-PERSONNEL EXPENSE DETAILS
FY 2017-18 FY 2018-19
43201 Property Tax 856$ 856$
F-18

PUBLIC WORKS WASTE REDUCTION - 346
City of Pinole FY 2018‐19
Mission
The mission of the Waste Reduction Program is to encourage both source reduction and recycling of solid waste in accordance with the mandates of the California Integrated Waste Management Act of 1989 (Assembly Bill 939).
Program Description
The Waste Reduction Program encourages and promotes recycling, source reduction, and reuse with the overall goal of decreasing reliance on sanitary landfills used for refuse disposal. The City of Pinole utilizes strategic partnerships with West Contra Costa Integrated Waste Management Authority, known as “RecycleMore”, and the franchise waste hauler, Republic Services, to meet its obligations regarding the Waste Reduction Program.
Key Objectives
Provide the waste management services identified in the Regional Plan and the City of Pinole’s collection franchise agreement
Implement source reduction, recycling, and composting activities Coordination with the Authority & franchise vendor regarding residential solid waste
collection and reduction; household hazardous waste collection and public outreach and education activities to encourage waste reduction in the City of Pinole
Install and maintain solid waste collection and recycling containers in public areas Meet annual reporting requirements
Success Indicators
Compliance with the California Integrated Waste Management Act of 1989 Meeting the waste reduction goals set forth in the West Contra Costa Integrated Waste
Management Authority Regional Plans
Position Summary
No personnel are directly assigned to this division.
F-19

AB 939 REFUSE MANAGEMENT FUND - 213WASTE REDUCTION - 346
EXPENDITURE SUMMARY
FY 2015-16 FY 2016-17 FY 2017-18 FY 2017-18 FY 2018-19 $ Chg % ChgActual Actual Actual Budget Proposed
Personnel Thru Mar-18
Salaries & Wages - 401 - - - - - - 0%Overtime - 402 - - - - - - 0%Employee Benefits - 410 - - - - - - 0%
Total Salary & Benefits - - - - - - 0%
Services and SuppliesProfessional & Administrative Services - 12,700 13,994 8,463 32,500 22,500 (10,000) -44%Other Operating Expenses -43 - - - - - - 0%
Total Services and Supplies 12,700 13,994 8,463 32,500 22,500 (10,000) -44%
Capital OutlayAsset Acquisition/Improvement - 47 - - - - - - 0%
Total Capital Outlay - - - - - - 0%
Indirect Cost AllocationsAdministrative Debits - 46122 33,653 76,115 54,827 81,022 91,508 10,486 11%IS Charges - 46124 - - - - - - 0%Legal Services - 46126 3,085 4,369 1,703 - 2,500 2,500 100%
Total Indirect Cost Allocations 36,737 80,484 56,530 81,022 94,008 12,986 14%
Transfers Out - 49901 - - - - - - 0%
Total 49,437 94,478 64,992 113,522 116,508 2,986 3%
MAJOR NON-PERSONNEL EXPENSE DETAILS
FY 2016-17 FY 2017-18
42101 Professional Services 20,000$ 10,000$ Consulting Services 10,000$
42514 Special Department Expense 12,500$ 12,500$ Litter pick up services 12,500$
F-20

PUBLIC WORKS LIGHTING & LANDSCAPE DISTRICTS – 347 & 348
City of Pinole FY 2018‐19
Mission
The mission of the Lighting and Landscape Assessment District is to maintain median lighting and landscape funded by assessments to property owners within the respective district.
Program Description
The City currently maintains two Lighting and Landscape Districts:
Zone A, Pinole Valley Road North Zone B, Pinole Valley Road South
Key Objectives
Integrate new development within the district into the assessment. Prepare annual engineer’s report for assessment.
Success Indicators
Maintain a safe, cost effective, functional and attractive Landscape and Lighting District.
Position Summary
No personnel are directly assigned to this division.
F-21

LIGHTING & LANDSCAPE DISTRICTS FUND - 310PUBLIC WORKS - ZONE A, PINOLE VALLEY ROAD NORTH - 347PUBLIC WORKS - ZONE B, PINOLE VALLEY ROAD SOUTH - 348
EXPENDITURE SUMMARY
FY 2015-16 FY 2016-17 FY 2017-18 FY 2017-18 FY 2018-19 $ Chg % ChgActual Actual Actual Budget Proposed
Personnel Thru Mar-18
Salaries & Wages - 401 - - - - - - 0%Overtime - 402 - - - - - - 0%Employee Benefits - 410 - - - - - - 0%
Total Salary & Benefits - - - - - - 0%
Services and SuppliesProfessional & Administrative Services - 42 15,429 34,354 11,427 28,350 30,850 2,500 8%Other Operating Expenses - 43 1,637 3,129 7,084 2,500 10,000 7,500 75%
Total Services and Supplies 17,066 37,482 18,511 30,850 40,850 10,000 24%
Capital OutlayAsset Acquisition/Improvement - 47 11,235 10,622 633 15,787 15,787 - 0%
Total Capital Outlay 11,235 10,622 633 15,787 15,787 - 0%
Indirect Cost AllocationsAdministrative Debits - 46122 - - - - - - 0%Legal Charges - 46126 - - 90 - - - 0%
Total Indirect Cost Allocations - - 90 - - - 0%
Total 28,301 48,104 19,233 46,637 56,637 10,000 18%
F-22

MAJOR NON-PERSONNEL EXPENSE DETAILS
FY 2017-18 FY 2018-19
42108 Maintenance Structures/Imp 1,850$ 1,850$ D & H Landscaping maintenance - Zone A 900$ D & H Landscaping maintenance - Zone B 950
42101 Professional Services 26,500$ 29,000$ Contra Costa County traffic signal maintenance - Zone A 19,000$ Special District Services - Zone AContra Costa County traffic signal maintenance - Zone B 10,000 Special District Services - Zone BPreparation of Engineer's Report for annual assessment(50/50) -
Total Professional/Administrative Services 30,850$
4310X Utilities 2,500$ 10,000$ Water (EBMUD) - Zone A 1,000$ Electricity & Power - Zone A 4,000 Water (EBMUD) - Zone B 1,000 Electricity & Power - Zone B 4,000
47202 Kaiser Medians 15,787$ 15,787$ PG&E Traffic control service/lighting- Zone A 6,076$ PG&E Street and highway lighting - Zone B 9,711$
F-23

PUBLIC WORKS WATER POLLUTION CONTROL PLANT - 641
City of Pinole FY 2018‐19
Mission
The mission of the Water Pollution Control Plant (WPCP) is to treat the wastewater for the City of Pinole and the City of Hercules.
Program Description
Produce an effluent that meets or exceeds State and Federal standards, minimize the emission of unpleasant odors, and meet the Air Quality Control Board requirements, while processing solids in a safe manner.
Key Objectives
Operate the facility in compliance with standards set by the Regional Water Quality Control Board
Support the construction activities of the WPCP Upgrade Support the ongoing training needs of the WPCP Staff
Success Indicators
Permit Compliance Certified Staff Preventive Maintenance of Assets
Position Summary
Position 2014-15 2015-16 2016-17 2017-18 2018-19
Treatment Plant Manager 1.00 1.00 1.00 1.00 1.00
Administrative Secretary 0.50 0.00 0.00 0.00 0.00Water Pollution Control Plant Supervisor 1.00 1.00 1.00 0.00 0.00Water Pollution Control Plant Operation Supervisor 0.00 0.00 0.00 1.00 1.00
Environmental Analyst 1.00 1.00 1.00 1.00 1.00
Environmental Assistant 1.00 1.00 1.00 1.00 1.00
Operator 5.00 5.00 5.00 5.00 5.00
Maintenance Mechanic 1.00 1.00 1.00 1.00 1.00
Water Pollution Control Plant Intern 0.46 0.46 0.46 0.46 0.46
Total 10.96 10.46 10.46 10.46 10.46
F-24

SEWER ENTERPRISE FUND - 500SEWER TREATMENT PLANT - 641
EXPENDITURE SUMMARY
FY 2015-16 FY 2016-17 FY 2017-18 FY 2017-18 FY 2018-19 $ Chg % ChgActual Actual Actual Budget Proposed
Personnel Thru Mar-18
Salaries & Wages - 401 694,208 802,694 485,195 820,521 833,765 13,244 2%Overtime - 402 18,787 32,744 22,569 37,385 36,500 (885) -2%Employee Benefits - 410 522,611 565,259 275,377 387,036 491,063 104,027 21%Medical Retirees - 411 - 30,387 27,068 - - - 0%
Total Salary & Benefits 1,235,606 1,431,084 810,209 1,244,942 1,361,328 116,386 9%
Services and Supplies
Professional & Administrative Services - 42 258,745 195,149 100,146 446,580 401,130 (45,450) -11%Other Operating Expenses - 43 528,443 569,450 417,576 600,000 600,000 - 0%Materials & Supplies - 44 796,281 811,868 574,151 942,628 952,588 9,960 1%
Total Services and Supplies 1,583,469 1,576,467 1,091,873 1,989,208 1,953,718 (35,490) -2%
Capital Outlay
Asset Acquisition/Improvement - 47 - - - 340,000 340,000 100%Total Capital Outlay - - - - 340,000 340,000 0%
Indirect Cost Allocations
Administrative Debits - 46122 159,674 2,153 183,311 258,816 305,877 47,061 15%IS Charges - 46124 15,084 25,009 - 38,533 32,709 (5,824) -18%Legal Charges - 46126 767 50 000 15 000 (35 000) 233%Legal Charges - 46126 - - 767 50,000 15,000 (35,000) -233%General Liability Insurance - 46201 26,167 26,393 26,860 24,663 28,685 4,022 14%
Total Indirect Cost Allocations 200,925 53,554 210,937 372,012 382,271 10,259 3%
Depreciation
Depreciation Expense - 47401 783,754 632,447 - 290,000 - (290,000) -100%Total Depreciation 783,754 632,447 - 290,000 - (290,000) -100%
Total 3,803,755 3,693,553 2,113,020 3,896,162 4,037,317 141,155 3%
F-25

MAJOR NON-PERSONNEL EXPENSE DETAILS
FY 2017-18 FY 2018-19
42101 Professional Services 92,500$ 53,500$ Assessment of headlosses in pipe to outfall (carry forward) 40,000$ Engineering contract services 10,000 PCTV quarterly subcommittee meeting 3,500
42107 Equipment Maintenance 269,080$ 263,080$ Equipment parts and supplies 131,580$ Equipment service 131,500$
42108 Maintenance Structure/Imp 42,000$ 42,000$ Cathodic inspection for Rodeo Sanitary District outfall - Pinole Share 12,000$
Janitorial services 10,000$ Various structure refurbishment 20,000
42109 Compliance Inspections 25,000$ 25,000$ Laboratory supplies and safety equipment 10,000$ Public outreach materials 5,000 Sampling analysis 10,000
42201 Office Expense 5,000$ 5,000$ Miscellaneous office supplies 5,000$
4230X Travel and Training 7,000$ 7,000$ 42301 State Certified operators training 6 000$42301 State Certified operators training 6,000$ 42302 Mileage, Air 1,000
42401 Memberships 5,000$ 4,550$ Joint CWEA/WEF membership 2,550$ Technical publications 2,000$
42511 Equipment Rental 1,000$ 1,000$ 1,000$
Total Professional/Administrative Services 401,130$
4310X Utilities 600,000$ 600,000$ PG&E 590,000$ EBMUD 10,000
Total Other Operating Expenses 600,000$
F-26

44301 Fuel -$ 10,000$
44302 WPCP Sludge Removal 90,000$ 90,000$ Sludge hauling to EBMUD and Landfill. 90,000$
44303 WPCP Chemicals 688,000$ 688,000$ Chemicals for Plant Operations 688,000$
44304 WPCP Permit Fees 64,588$ 64,588$ NPDES permit fee renewal 64,588$
44305 WPCP Laboratory Operations 85,000$ 85,000$ Laboratory supplies 70,000$ Accelerated Chronic Toxinicy Testing 15,000
44410 Safety Clothing 15,040$ 15,000$ Laundry service for uniforms, safety shoes/boots, gloves, etc. 15,000$
Total Materials and Supplies 952,588$
47101 Equipment -$ 340,000$ Equipment replacement 340,000$
F-27

PUBLIC WORKS SEWER COLLECTION - 642
City of Pinole FY 2018‐19
Mission
The mission of the Sewer Collection Program is to maintain unobstructed flow in the public collection system to the wastewater treatment plant.
Program Description
The Public Works’ Sewer Collection Program provides preventive maintenance services including cleaning (hydro flushing and mechanical cleaning), inspecting for root intrusion, pipe integrity, and removal of foreign objects. The program also maintains 2 sewer pump stations, and offers 24 hour on-call service for overflows and other emergencies. The program maintains a network of 565 manholes; 225,727 linear feet of pipe; 5,340 laterals; and 2 lift stations.
Key Objectives
Maintain collection system and pump stations network Preservation of assets Reduce inflow and infiltration Continue to manage the sewer lateral ordinance Establish a sewer manhole lining program
Success Indicators
No sanitary sewer overflows Permit Compliance Development of a program to systematically address I/I within areas identified as “high
contributors” Sewer lateral rehabilitations
Position Summary
Position 2014-15 2015-16 2016-17 2017-18 2018-19
Public Works Maintenance Supervisor 1.00 1.00 1.00 1.00 1.00
Senior Maintenance Worker 1.00 1.00 1.00 1.00 1.00
Maintenance Worker 1.00 1.00 1.00 1.00 1.00
Total 3.00 3.00 3.00 3.00 3.00
F-28

SEWER ENTERPRISE FUND - 500SEWER COLLECTION - 642
EXPENDITURE SUMMARY
FY 2015-16 FY 2016-17 FY 2017-18 FY 2017-18 FY 2018-19 $ Chg % Chg
Actual Actual Actual Budget Proposed
Personnel Thru Mar-18
Salaries & Wages - 401 212,106 217,718 158,001 221,454 229,816 8,362 4%Overtime - 402 4,090 1,459 1,305 - 2,200 2,200 100%Benefits & Insurance - 410 85,037 65,785 52,837 68,775 84,381 15,606 18%
Total Salary & Benefits 301,233 284,962 212,144 290,229 316,397 26,168 8%
Services and SuppliesProfessional & Administrative Services - 42 30,481 29,921 27,510 92,650 92,150 (500) -1%Other Operating Expenses - 43 10,214 10,028 6,609 13,500 13,500 - 0%Materials & Supplies - 44 5,490 9,328 7,212 3,700 10,200 6,500 64%
Total Services and Supplies 46,184 49,278 41,332 109,850 115,850 6,000 5%
Capital OutlayAsset Acquisition/Improvement - 47 30,547 30,163 - 395,000 1,595,000 1,200,000 75%
Total Capital Outlay 30,547 30,163 - 395,000 1,595,000 1,200,000 75%
Indirect Cost AllocationsAdministrative Credits - 46121 - (71,965) (51,179) (71,270) (77,570) (6,300) 8%Administrative Debits - 46122 205,507 334,954 239,006 361,361 396,729 35,368 9%IS Charges - 46124 14,480 13,106 - 15,043 16,508 1,465 9%Legal Charges - 46126 - 402 1,819 16,450 15,000 (1,450) -10%General Liability Insurance - 46201 7,017 6,416 6,722 6,175 7,337 1,162 16%
Total Indirect Cost Allocations 227,004 282,913 196,369 327,759 358,004 30,245 8%
DepreciationDepreciation Expense - 47401 - 9,893 - - - - 0%
Total Depreciation - 9,893 - - - - 0%
Total 604,968 657,209 449,844 1,122,838 2,385,251 1,262,413 53%
F-29

MAJOR NON-PERSONNEL EXPENSE DETAILS
FY 2017-18 FY 2018-19
42101 Professional Services 55,000$ 55,000$ Contractors for isolated emergency repairs 10,000$ Hydraulic analysis of isolated trouble spots 10,000$ Sewer flow modeling 35,000
42107 Equipment Maintenance 20,000$ 20,000$ Vehicle maintenance and repair 20,000$
42201 Office Expense 150$ 150$ Office supplies, includes reprinting of map books. 150$
42401 Memberships 1,000$ 1,000$ Joint CWEA/WEF membership 765$ Technical publications 235$
42301 Travel and Training 1,000$ 1,000$ Technical training programs for sewer maintenance, 1,000$
confined space entry and street safety procedures.
42511 Equipment Rental 500$ -$ Rental of infrequently used equipment. -$
42514 Special Department Expense 15,000$ 15,000$ Maintenance materials (asphalt, concrete, pipe, hardware, etc.) 15,000$
Total Professional/Administrative Services 92,150$
4310X Utilities 13,500$ 13,500$ PG&E 9,000$ EBMUD 4,500
44301 Fuel -$ 6,500$
44410 Safety Clothing 3,700$ 3,700$ Uniforms, coveralls, foul weather gear, gloves 3,700$
47201 Improvements 395,000$ 1,595,000$ Deferred collection repairs 395,000$ Hazel Street Pump Station 1,200,000$
F-30

PUBLIC WORKS WPCP PROJECTS (SHARED) - 643
City of Pinole FY 2018‐19
Mission
The mission of the WPCP Projects (Shared) is to maintain and replace outdated or worn equipment, and to make periodic upgrades to the shared components of the WPCP and sewer system to ensure safe and efficient processing, while complying with all state and federal standards.
Program Description
The City of Hercules shares the cost of WPCP expenditures 50/50 with the City of Pinole.
Presently the Shared Projects program is overseeing the Pinole-Hercules WPCP Upgrade. The project has completed the environmental, planning, design, and financing phases. Construction began on the Project in May 2016.
Key Objectives
Manage construction phase of the Pinole- Hercules WPCP Upgrade project.
Success Indicators
Project progresses on budget Project schedule meets expectations Transparent project management
Position Summary
No personnel are directly assigned to this division.
F-31

SEWER ENTERPRISE PLANT EXPANSION FUND - 503SEWER PROJECTS - SHARED - 643
EXPENDITURE SUMMARY
FY 2015-16FY 2016-17 FY 2017-18 FY 2017-18 FY 2018-19 $ Chg % Chg
Actual Actual Actual Budget Proposed
Services and Supplies Thru Mar-18
Professional & Administrative Services - 42 - (440) 21,818 1,596,500 251,884 (1,344,616) -534%Total Services and Supplies - (440) 21,818 1,596,500 251,884 (1,344,616) -534%
Capital OutlayAsset Acquisition /Improvement - 47 0 -560 1,575,755 16,668,800 6,115,794 (10,553,006) -173%
Total Capital Outlay - (560) 1,575,755 16,668,800 6,115,794 (10,553,006) -173%
Indirect Cost AllocationsLegal Charges - 46126 - 525 110 - - - 0%
Total Indirect Cost Allocations - 525 110 - - - 0%
Total - (475) 1,597,682 18,265,300 6,367,678 (11,897,622) -706%
MAJOR NON-PERSONNEL EXPENSE DETAILS
FY 2017-18 FY 2018-19
42101 Professional Services 1,596,500$ 251,884$ Construction Management of Plant Upgrades 503,768$ Hercules-Construction management of plan (251,884)
47101 Equipment 50,000$ -$ Equipment Replacement: -$
General Equipment Replacement
47201 Building 16,618,800$ 6,115,794$ WPCP upgrades- Contingency 1,350,000$ WPCP upgrades- HDR 331,381$ WPCP upgrades- Hercules Share (6,115,794)$ WPCP upgrades- Kiewit 10,550,207
F-32

PUBLIC WORKS WPCP EQUIPMENT & DEBT SERVICE - 644
City of Pinole FY 2018‐19
Mission
The purpose of the Water Pollution Control Plant (WPCP) Equipment and Debt Service account is to manage debt service expenses issued to maintain and replace outdated or damaged equipment, and to facility upgrades.
Program Description
Expenses associated with this program apply to City of Pinole only.
Success Indicators
Processed 2016 Wastewater Revenue Refunding Bonds annual debt service payments in accordance with the debt schedule
Position Summary
No personnel are directly assigned to this division.
F-33

SEWER ENTERPRISE FUND - 500WPCP / EQUIPMENT AND DEBT SERVICE (PINOLE ONLY) - 644
EXPENDITURE SUMMARY
FY 2015-16 FY 2016-17 FY 2017-18 FY 2017-18 FY 2018-19 $ Chg % ChgActual Actual Actual Budget Proposed
Services and Supplies Thru Mar-18
Professional & Administrative Services - 42 13,279 2,000 - 9,178 9,178 - 0%Total Services and Supplies 13,279 2,000 - 9,178 9,178 - 0%
Debt ServiceDebt Principal - 48101 - - - - - - 0%Debt Interest - 48102 739,196 233,566 290,000 290,000 298,000 8,000 3%Cost of Issuance - 48103 157,750 161,238 227,770 227,770 219,097 (8,674) -4%Total Debt Service 896,946 394,803 517,770 517,770 517,097 (674) 0%
Indirect Cost AllocationsLegal Charges - 46126 - 16,412 - - - - 0%
Total Indirect Cost Allocations - 16,412 - - - - 0%
Total 910,225 413,216 517,770 526,948 526,275 (674) (0)
SEWER ENTERPRISE PLANT EXPANSION FUND - 503
Professional & Administrative Services - 42 3,500 - - - 3,500 3,500 100%Legal Charges - 46126 28,895 134 - 12,600 (12,600) -100%
32,395 134 - 12,600 3,500 (9,100) -260%
MAJOR NON-PERSONNEL EXPENSE DETAILS
FY 2017-18 FY 2018-19
42101 Professional Services 9,178$ 9,178$ Auditing Services 5,678$
Trustee Fees 3,500
4810X Wastewater Revenue Bonds, Series 2006 627,310$ 517,097$ 48101 - Principal 298,000$ 48102 - Interest 219,097
SEWER ENTERPRISE PLANT EXPANSION FUND - 503
42501 Bank Fees -$ 3,500$ Wells Fargo Bank Fees 3,500$
F-34

DEVELOPMENT SERVICES - PLANNING - 461
City of Pinole FY 2018-19
Mission
Provide orderly growth and development in Pinole, consistent with the General Plan and priorities of the City Council, maximizing the benefits to the residents of Pinole. The Planning Division protects and enhances the desirability of the community for residents, businesses, and visitors.
Program Description
The Planning Division administers and implements the General Plan for the City, and provides Zoning Code administration and development application processing. Land use and development applications include use permits; design review requests; and subdivisions. The Planning Division seeks to deliver on its mission with the highest regard for time, accuracy, completion, customer satisfaction, and overall well-being of the City consistent with local, State, and Federal laws.
Planning staff assist in the coordination of city-wide development activities that enhance the community services available and contribute to the general safety and welfare of the community. These activities include providing project environmental review, development permit software and communications support and participation in multi-modal transportation and circulation planning.
Key Objectives
Monitor Implementation of the General Plan Process development requests Maintain positive relationships with regional agencies and neighboring jurisdictions Inspection coordination and verification of compliance with Conditions of Approval Environmental review and monitoring for projects affecting the City of Pinole
Success Indicators
Protect and enhance residential areas Nurture an inviting climate for doing business in Pinole Encouraging multimodal transportation Protect Pinole’s natural and historic resources
Position Summary
Position 2014-15 2015-16 2016-17 2017-18 2018-19
Planning Manager 1.00 1.00 1.00 1.00 1.00
Total 1.00 1.00 1.00 1.00 1.00
G-1

BUILDING & PLANNING FUND - 212DEVELOPMENT SERVICES - PLANNING - 461
EXPENDITURE SUMMARY
FY 2015-16 FY 2016-17 FY 2017-18 FY 2017-18 FY 2018-19 $ Chg % ChgActual Actual Actual Budget Proposed
Personnel Thru Mar-18
Salaries & Wages - 401 122,926 125,873 96,956 128,973 145,850 16,877 12%Employee Benefits - 410 29,584 30,416 27,804 34,411 47,407 12,996 27%
Total Salary & Benefits 152,510 156,289 124,760 163,384 193,257 29,873 15%
Services and SuppliesProfessional & Administrative Services - 42 47,552 55,123 55,913 264,700 147,040 (117,660) -80%Other Operating Expenses - 43 1,544 1,634 889 1,800 1,550 (250) -16%Materials & Supplies - 44 449 1,092 522 - 500 500 100%
Total Services and Supplies 49,545 57,849 57,324 266,500 149,090 (117,410) -79%
Capital OutlayAsset Acquisition/Improvement - 47 - - 1,804 - 2,000 2,000 100%
Total Capital Outlay - - 1,804 - 2,000 2,000 100%
Indirect Cost AllocationsAdministrative Credits - 46121 (13,210) (15,499) (12,007) (16,690) (18,932) (2,242) 12%Administrative Debits - 46122 4,368 - - - - - 0%Legal Charges - 46126 - 18,695 31,509 25,000 25,000 - 0%General Liability Insurance - 46201 3,906 3,643 3,848 3,525 4,599 1,074 23%
Total Indirect Cost Allocations (4,936) 6,839 23,349 11,835 10,667 (1,168) -11%
Total 197,119 220,978 207,238 441,719 355,014 (86,705) -24%
GENERAL FUND - 100Administrative Debits - 46122 2,237 7,749 6,004 8,345 9,893 1,548 16%
MAJOR NON-PERSONNEL EXPENSE DETAILS
FY 2017-18 FY 2018-19
42101 Professional Services 225,000$ 105,000$ Nexus Fee Study (carry forward) 20,000$ Parking Study (carry forward) 25,000Contract Planner 60,000
42107 Equipment Maintenance 1,600$ 1,600$ Maintenance costs for two vehicles 1,600$
42201 Office Expense 6,000$ 1,000$ Miscellaneous office supplies 1,000$
G-2

42301 Travel and Training 9,000$ 9,000$ Training and seminars for staff 2,000$ Planning Commissioner training 7,000
42401 Memberships 1,000$ 1,000$ American Institute of Certified Planners (AICP) 300$ American Planning Assoc (APA) 350Assoc of Environmental Planners (AEP) 350
42514 Special Department Expense 22,100$ 29,440$ Publishing Legal Notices 2,000$ PCTV Planning Commission Meetings 19,440 Meeting Minute Preparation 8,000
Total Professional/Administrative Services 147,040$
4310X Utilities 1,800$ 1,550$ PG&E 1,400$ EBMUD 150
44301 Fuel -$ 500$
G-3

DEVELOPMENT SERVICES - BUILDING DIVISION- 462
City of Pinole FY 2018-19
Mission
The mission of the Development Services - Building Division is to improve public health and safety within the City of Pinole through the application and enforcement of construction and property maintenance codes.
Program Description
This function is fiscally self supporting through the assessment and collection of user fees. Building Division issues construction permits and provides building, electrical, mechanical, plumbing, Title-24 and accessibility inspections for new construction, additions, and alterations of commercial, residential, and public projects upon request of the Development Services Director / City Engineer to insure a safe environment for the residents, businesses, and employees in the City. The division investigates citizens' complaints relating to construction code compliance and/or health and safety issues in a prompt and courteous manner.
Key Objectives
Coordinate required construction inspection functions to more effectively respond to the needs of the private development community
Compliance with the Construction Codes Provide thorough Plan Checks for private development Issue required private construction permits Conduct Building and Rental Inspection and document results Provide Code Enforcement
Success Indicators
Perform Inspections within one business day Maintenance of housing stock Provide online access to inspection services Plan check times matched to complexity of project
o Same day Reroof, Water Heater, Furnace Replacement
o 48 hours Solar
Code compliant private construction
Position Summary
Position 2014-15 2015-16 2016-17 2017-18 2018-19
Building Inspector/Code Enforcement 0.00 0.00 0.00 1.00 0.00
Senior Building Inspector 0.00 0.00 0.00 1.00 1.00
Building Inspector 1.00 1.00 1.00 0.00 0.00
Permit Technician, (1 FT/1PT) 0.90 0.95 1.48 1.48 1.48
Total 1.90 1.95 2.48 3.48 2.48
G-4

BUILDING & PLANNING FUND - 212DEVELOPMENT SERVICES - BUILDING DIVISION - 462
EXPENDITURE SUMMARY
FY 2015-16 FY 2016-17 FY 2017-18 FY 2017-18 FY 2018-19 $ Chg % ChgActual Actual Actual Budget Proposed
Personnel Thru Mar-18
Salaries & Wages - 401 112,933 84,811 47,592 230,305 172,982 (57,323) -33%Overtime - 402 1,943 296 59 - 77 77 100%Employee Benefits - 410 56,916 53,482 40,441 137,190 89,229 (47,961) -54%
Total Salary & Benefits 171,792 138,589 88,091 367,495 262,288 (105,207) -40%
Services and SuppliesProfessional & Administrative Services - 42 209,763 307,988 307,648 482,200 220,250 (261,950) -119%Other Operating Expenses - 43 3,901 4,108 2,247 4,630 4,500 (130) -3%Materials & Supplies - 44 200 - - 650 300 (350) -117%
Total Services and Supplies 213,865 312,096 309,894 487,480 225,050 (262,430) -117%
Capital OutlayAsset Acquisition/Improvement - 47 - - - 63,000 - (63,000) -100%
Total Capital Outlay - - - 63,000 - (63,000) -100%
Indirect Cost AllocationsAdministrative Credits - 46121 - - - (59,122) - 59,122 100%Administrative Debits - 46122 70,442 61,570 42,106 60,272 133,576 73,304 55%IS Charges - 46124 63,203 28,929 - 54,557 48,185 (6,372) -13%Legal Charges - 46126 5,485 11,997 11,121 10,000 10,000 - 0%General Liability Insurance - 46201 3,992 5,143 7,277 6,666 5,740 (926) -16%
Total Indirect Cost Allocations 143,121 107,639 60,504 72,373 197,501 125,128 63%
Total 528,778 558,324 458,489 990,348 684,839 (305,509) -45%
GENERAL FUND - 100Administrative Debits - 46122 2,237 210 - 59,122 - (59,122) -100%
G-5

MAJOR NON-PERSONNEL EXPENSE DETAILS
FY 2017-18 FY 2018-19
42101 Professional Services 450,000$ 190,000$ Contract Inspection Services 100,000$ Contract Plan Check Services 90,000
42107 Equipment Maintenance 1,100$ 1,100$ Equipment and vehicle maintenance 1,000$ Digital microfilm machine maintenance 100$
42108 Building-Structure Maintenance -$ 500$
42201 Office Expense 4,450$ 2,000$ Miscellaneous Office Expenses 2000
4230X Travel and Training 10,000$ 6,000$ Training required for building code updates 6,000$
42401 Memberships 1,650$ 1,650$ International Conference of Building Officials (ICBO) 1,200$ California Building Officials (CALBO) 300Int'l Association of Mechanical and Plumbing Officials (IAMPO) 150
42501 Bank Fees -$ 10,000$
42512 Abatement 6,000$ -$ Code Enforcement Activity - Repair and demolition -$ Section 1401.3, Item 3 of the Uniform Housing Code.
42514 Special Department Expense 9,000$ 9,000$ Land development file maintenance, requiring the purchase
of change of ownership of parcels information. Bi-annual updates of the assessor parcel information as required. 1,500$
Blueprints and permits to be scanned. 7,500
Total Professional/Administrative Services 220,250$
4310X Utilities 4,630$ 4,500$ PG&E 4,000$ EBMUD 500
44410 Safety Clothing 650$ 300$ Safety clothing (safety boots, hard hat, protective eye ware, 300$
protective handwear, etc.) for the two Inspector's who perform inspections at job site locations.
G-6

SUCCESSOR AGENCY - 463
City of Pinole FY 2018-19
Mission
The mission of the Successor Agency is to effectively administer the "close-out" of business affairs of the former Pinole Redevelopment Agency.
Success Indicators
Processed debt service payments in accordance with debt service schedules.
Maintained Long Range Property Management Plan which was approved by the Oversight Board in November of 2015.
Prepared annual Recognized Obligation Payment Schedules (ROPS) covering the period, July 1, 2018 – June 30, 2019
Position Summary
No personnel are directly assigned to the division.
G-7

RECOGNIZED OBLIGATION RETIREMENT FUND - 750SUCCESSOR AGENCY TO THE PINOLE REDEVELOPMENT AGENCY - 463
EXPENDITURE SUMMARY
FY 2015-16 FY 2016-17 FY 2017-18 FY 2017-18 FY 2018-19 $ Chg % Chg
Actual Actual Actual Budget Proposed
Personnel Thru Mar-18
Salaries & Wages - 401 - - - - - - 0%Overtime - 402 - - - - - - 0%Other Pay - 403 - - - - - - 0%Employee Benefits - 410 - - - - - - 0%
Total Salary & Benefits - - - - - - 0%
Services and SuppliesProfessional & Administrative Services - 42 3,500 3,500 3,500 3,500 3,450 (50) -1%Other Operating Expenses - 43 - - - - - - 0%Materials & Supplies - 44 - - - - - - 0%
Total Services and Supplies 3,500 3,500 3,500 3,500 3,450 (50) -1%
Indirect Cost AllocationsAdministrative Debits - 46122 187,703 202,969 149,291 233,000 233,000 - 0%Legal Charges - 46126 17,675 5,747 3,159 17,000 13,550 (3,450) -25%
Total Indirect Cost Allocations 205,378 208,715 152,450 250,000 246,550 (3,450) -1%
Total 208,878 212,215 155,950 253,500 250,000 (3,500) -1%
MAJOR NON-PERSONNEL EXPENSE DETAILS
FY 2017-18 FY 2018-19
42101 Professional Services 3,500$ 3,450$ Auditing services 3,450$
46122 Administrative Debits 233,000$ 233,000$ Payroll cost allocations for administrative staff support 233,000$ of the Pinole Successor Agency:
City Manager - 25%Assistant City Manager - 25%Finance Director - 26%City Clerk - 25%
46126 Legal Charges 17,000$ 13,550$ Estimated legal costs 13,550$
G-8

HOUSING ADMINISTRATION - 464
City of Pinole FY 2018-19
Mission
To effectively manage and develop housing programs that meet or exceed the needs of our customers, and to maintain effective relationships with our residents and customers with which we interact. Staff assigned to Housing Administration carries out the Implementation Plan as it relates to the use of Housing Set Aside Funds and the provision of affordable housing within the community.
Program Description
Human Resources staff manages the City’s Housing functions, including overseeing annual affordable housing audits, verifying compliance with Regulatory Agreements, training landlords on how to pre-certify/certify tenants and other related tasks.
Success Indicators
Assured that the annual audits on the Affordable Housing Covenants are completed timely.
Hired and obtained proposals from Architects for construction improvement to the Faria House.
Issued a request for proposal (RFP) for several properties. Working on an RFP to sell and develop 811 San Pablo Avenue as a Housing project.
Position Summary
No personnel are directly assigned to this division.
G-9

HOUSING - LAND HELD FOR RESSALE FUND - 285 HOUSING ADMINISTRATION - 464
EXPENDITURE SUMMARY
FY 2015-16 FY 2016-17 FY 2017-18 FY 2017-18 FY 2018-19 $ Chg % ChgActual Actual Actual Budget Proposed
Personnel Thru Mar-18
Salaries & Wages - 401 - - - - - - 0%Employee Benefits - 410 - - - - - - 0%
Total Salary & Benefits - - - - - - 0%
Services and SuppliesProfessional & Administrative Services - 42 24,154 78,724 17,089 59,920 118,920 59,000 50%Other Operating Expenses - 43 2,499 1,352 738 2,500 2,100 (400) -19%
Total Services and Supplies 26,653 80,076 17,827 62,420 121,020 58,600 48%
Capital OutlayAsset Acquisition/Improvement - 47 - - - - - - 0%
Total Capital Outlay - - - - - - 0%
Indirect Cost AllocationsAdministrative Debits - 46122 28,519 43,767 36,451 51,576 61,116 9,540 16%Legal Charges - 41427 - 21,860 82,375 110,000 20,000 (90,000) -450%
Total Indirect Cost Allocations 28,519 65,626 118,825 161,576 81,116 (80,460) -99%
Total 55,172 145,703 136,652 223,996 202,136 (21,860) -11%
MAJOR NON-PERSONNEL EXPENSE DETAILS
FY 2017-18 FY 2018-19
42101 Professional Services 59,920$ 118,920$ AmeriNat loan servicing 3,000$ Affordable housing monitoring 14,000Annual housing certification report 5,000Fiscal and land acquisition activities 3,920Tree Grove Maintenance 34,000811 San Pablo Ave RFP 59,000
4310X Utilities 2,500$ 2,100$ PG&E 2,000$ EBMUD 100
G-10

DEVELOPMENT SERVICES – CODE ENFORCEMENT DIVISION- 465
City of Pinole FY 2018-19
Mission
The mission of the Development Services Code Enforcement Division is to promote health and safety within the City of Pinole through the application and enforcement of various City and State codes.
Program Description
The Code Enforcement division investigates citizens' complaints of health and safety issues. These issues include blight abatement, graffiti abatement, abandoned vehicles, and illegal dumping. At this time the Division is complaint driven, with a goal to achieve a more proactive approach as time and resources are available.
Key Objectives
Hire the assigned Building Inspector/Code Enforcement Officer in this fiscal year. Respond to Code Enforcement complaints within no more than 96 hours, depending on
the severity of the health/safety aspect of the issue. Work with other City departments as needed to ensure code compliance is achieved. Increase proactive enforcements, as time and resources permit.
Success Indicators
Blight eliminated in a reasonable period of time, within the legal framework of the Municipal Code and State statutes.
Position Summary
Position 2014-15 2015-16 2016-17 2017-18 2018-19
Building Inspector/Code Enforcement 0.00 0.00 0.00 0.00 1.00
Total 0.00 0.00 0.00 0.00 1.00
G-11G-11

GENERAL FUND - 100CODE ENFORCEMENT - 465
EXPENDITURE SUMMARY
FY 2015-16 FY 2016-17 FY 2017-18 FY 2017-18 FY 2018-19 $ Chg % ChgActual Actual Actual Budget Proposed
Personnel Thru Mar-18
Salaries & Wages - 401 - - - - 72,981 72,981 100%Employee Benefits - 410 - - - - 51,988 51,988 100%
Total Salary & Benefits - - - - 124,969 124,969 100%
Services and SuppliesProfessional & Administrative Services - 42 - - - - 9,000 9,000 100%Other Operating Expenses - 43 - - - - - - 0%
Total Services and Supplies - - - - 9,000 9,000 100%
Capital OutlayAsset Acquisition/Improvement - 47 - - - - - - 0%
Total Capital Outlay - - - - - - 0%
Indirect Cost AllocationsAdministrative Credits - 46121 - - - - (63,696) (63,696) -100%General Liability Insurance - 46201 - - - - 2,421 2,421 100%
Total Indirect Cost Allocations - - - - (61,275) (61,275) 0%
Total - - - - 72,694 72,694 100%
MAJOR NON-PERSONNEL EXPENSE DETAILS
FY 2017-18 FY 2018-19
42201 Office Expense -$ 1,000$ Citation books and misc. expenses 1,000$
4230X Travel & Training -$ 2,000$ Conference registration 2,000$
42512 Abatement -$ 6,000$ -$
G-12G-12

RECREATION ADMINISTRATION - 551
City of Pinole FY 2018-19
Mission
The mission of the Recreation Department is to create community through people, parks and programs. The Department aims to provide safe, high-quality parks and recreation facilities that meet the needs of the diverse Pinole community. The City has 14 parks totaling 358 acres with recreational facilities including the Senior Center, Swim Center, Tennis Courts, Youth Center and Community Playhouse.
Key Objectives
Staff the Community Services Commission Fundraising Activities for Full Cost Recovery for all Recreation programs Strive to achieve 100% Cost Recovery for Park and Facility Rentals () Design and Publish Community Activity Guide (2 times/year) Continue to facilitate the implementation of community events, including the Tree
Lighting Festival through fundraising efforts
Success Indicators
Supported the implementation of site specific fundraising efforts Supported and Developed Coordinating Staff Movies in the Park (3),Sounds in the Park(2) Tree Lighting Received $6,000 in donations from community businesses
Position Summary
Position 2014-15 2015-16 2016-17 2017-18 2018-19
Recreation Manager 1.00 1.00 1.00 1.00 1.00
Gym Rental Attendant, PT/Regular 0.45 0.45 0.00 0.00 0.00
Total 1.45 1.45 1.00 1.00 1.00
H-1

RECREATION FUND - 209RECREATION ADMINISTRATION - 551
EXPENDITURE SUMMARY
FY 2015-16 FY 2016-17 FY 2017-18 FY 2017-18 FY 2018-19 $ Chg % ChgActual Actual Actual Budget Proposed
Personnel Thru Mar-18
Salaries & Wages - 401 70,282 80,068 32,396 78,659 72,207 (6,452) -9%Overtime - 402 - - - - - - 0%Employee Benefits - 410 29,564 34,473 26,434 31,836 38,504 6,668 17%
Total Salary & Benefits 99,846 114,541 58,830 110,495 110,711 216 0%
Services and SuppliesProfessional & Administrative Services - 15,120 13,530 9,229 20,765 21,515 750 3%Other Operating Expenses - 43 - - - - - - 0%
Total Services and Supplies 15,120 13,530 9,229 20,765 21,515 750 3%
Capital OutlayAsset Acquisition/Improvement - 47 - - - - - - 0%
Total Capital Outlay - - - - - - 0%
Indirect Cost AllocationsIS Charges - 46124 41,411 42,030 - 52,689 58,223 5,534 10%Legal Charges - 46126 - 924 1,231 2,400 - (2,400) -100%General Liability Insurance - 46201 2,578 2,223 2,485 2,277 2,395 118 5%
Total Indirect Cost Allocations 43,989 45,177 3,716 57,366 60,618 3,252 5%
Total 158,954 173,249 71,775 188,626 192,844 4,218 2%
MEASURE S - 2014 FUND - 106Professional & Administrative Services - 2,964 6,833 1,961 7,000 - (7,000) -100%Total 161,918 180,081 73,736 195,626 192,844 (2,782) -1%
H-2

MAJOR NON-PERSONNEL EXPENSE DETAILS
FY 2017-18 FY 2018-19
42101 Professional Services 12,365$ 10,865$ CPRS Membership 165 Broadcast Music/ASCAP Services 700 Nexus Fee Study 10,000
42107 Equipment Maintenance 2,200$ -$ Copier and other equipment maintenance -$
42501 Bank Fees -$ 200$
42514 Special Department Expense 6,200$ 6,200$ Postage Machine 100$ Office Supplies 500 Recreation Activity Guide & Postage 5,600
42515 Special Events -$ 4,250$ Expenses for Movies and Sounds in the Park 4,250$
MEASURE S - 2014 FUND - 106
42514 Special Department Expense 7,000$ -$
*GF subsidize the difference.
H-3

SENIOR CENTER - 552
City of Pinole FY 2018-19
Mission
The Pinole Senior Center provides adults, age 50 and over, with a full service active Senior Center. It is a regional center that serves Pinole and other local cities. The Center serves over 1,500 regular participants. The Center provides social activities, classes, fitness, health and wellness, daily hot lunches, homebound services, salon services, local, domestic and international trips and special services including insurance counseling, and support services. The Pinole Senior Center has an outstanding established reputation as the best Senior Center in the County. Under the guidance and leadership of an 11-member Board of Directors (elected by the membership), over 150 volunteers provide hands-on assistance with all aspects of the Center's programs and fundraising.
Program Description
The Center currently provides social, educational, recreational, health, and consumer services and activities to our more than 1,500 yearly participants. Revenue for programs and operations is generated by fundraising, donations, program fees, lunch program, travel income, salon service income, gift shop, other social program income, and facility rentals.
Key Objectives
To serve as many local senior citizens as possible by offering a wide variety of programs and activities that meet the diverse interests of the senior population.
Increase promotion and outreach efforts to make local senior citizens aware of the programs and services offered at the Pinole Senior Center facility.
Provide programs that are both affordable for senior citizens, and cost-effective for the Center.
Success Indicators
Growth of the membership roster both by the number of seniors enrolled, and the number of cities in which members reside.
Increased participation from the community in marketing programs including but not limited to newsletter mailings, e-mail blasts, social media accounts, and flyer distribution.
Silver and Fit Program.
Position Summary
Position 2014-15 2015-16 2016-17 2017-18 2018-19
Recreation Coordinator 0.90 0.90 0.90 0.90 0.90
Senior Recreation Leader 0.48 0.48 0.48 0.48 0.48
Recreation Leader 0.50 0.50 0.50 0.50 0.50
Cook, PT/Regular 0.75 0.75 0.75 0.75 0.75 Rental Facility Custodian, PT/Temp (3,120 Hours) 1.65 1.65 1.65 1.65 1.65
Total 4.28 4.28 4.28 4.28 4.28
H-4

RECREATION FUND - 209SENIOR CENTER - 552
EXPENDITURE SUMMARY
FY 2015-16FY 2016-17 FY 2017-18 FY 2017-18 FY 2018-19 $ Chg %
ChgActual Actual Actual Budget Proposed
Personnel Thru Mar-18
Salaries & Wages - 401 108,373 97,661 81,533 128,672 152,354 23,682 16%Overtime - 402 - - 68 - - - 0%Employee Benefits - 410 44,392 31,822 40,988 63,749 43,136 (20,613) -48%
Total Salary & Benefits 152,764 129,482 122,590 192,421 195,490 3,069 2%
Services and SuppliesProfessional & Administrative Services - 42 20,490 25,707 13,394 27,097 28,510 1,413 5%Other Operating Expenses - 43 46,570 64,087 151,360 204,230 241,405 37,175 15%Materials & Supplies - 44 485 1,849 1,682 1,540 0 (1,540) -100
Total Services and Supplies 67,545 91,643 166,437 232,867 269,915 37,048 14%
Capital OutlayAsset Acquisition/Improvement - 47 - - 2,528 - - - 0%
Total Capital Outlay - - 2,528 - - - 0%
Indirect Cost AllocationsLegal Charges - 46126 826 357 - - - 0%General Liability Insurance - 46201 4,657 4,452 4,698 4,303 5,053 750 15%
Total Indirect Cost Allocations 4,657 5,278 5,055 4,303 5,053 750 15%
Transfers Out - 49901 - - - - - - 0%
Total 224,966 226,403 296,610 429,591 470,458 40,867 9%
SENIOR CENTER PROGRAMS FUND - 211 Professional & Administrative Services - 42 136 (540) - - - - 0%Other Operating Expenses - 43 158,208 244,365 - - - - 0%Transfers Out - 49901 146,839 46,000 - - - - 0%Total 305,183 289,825 - - - - 0%
MAJOR NON-PERSONNEL EXPENSE DETAILS
FY 2017-18 FY 2018-19
42101 Professional Services 285$ 785$ CPRS Membership 165$ Costco Membership 120Staff Training 500
42107 Equipment Maintenance 3,850$ 1,875$ Fire Extinguisher Maintenance 650 Fridge/Freezer Maintainence 500 Other Maintenance 725
H-5

42108 Maintenance Structure/Imp 18,000$ 20,000$ Sanitary/Cleaning Supplies 1,800$ Landscape Maintenance 6,500 Pest Control Services 300 Electrical Supplies 400 Plumbing Supplies 400 Key Pad/Alarm Service 500 HVAC Service 5,100 Janitorial 5,000
42201 Office Expense 600$ 1,500$ Office supplies, paper flyers, and tickets 1,500$
42501 Bank Fee 2,412$ 2,400$
42514 Special Department Expense 1,950$ 1,950$ Healthh Permit 1,950$
Total Professional/Administrative Services 28,510$
4310X Utilities 51,000$ 52,100$ Gas and Electric 43,500$ Water 8,600
43802 Class Fees 31,000$ 34,000$
43803 Personal Service 2,500$ 2,500$ WestCat tickets (reimbursed when sold) 2500
43804 Food Program 55,000$ 63,000$
43805 Travel 34,000$ 35,000$
43806 Dance Program 7,750$ 7,800$ Band 5000 Bar Supplies 600 CW Line Dance 2200
43807 Fundraising 8,000$ 10,000$
43808 Gift Shop Sales 3,000$ 2,200$
43809 Newsletter 4,980$ 5,000$ Monthly Newsletter 5000
43810 Center Maintenance -$ 22,805$ Replace Chairs 5805 Resand Flooring 17000
H-6

43811 Supplies 7,000$ 7,000$ Misc. Program Supplies (cleaning, paper) 7000
Total Other Operating Expenses 241,405$
44301 Fuel 1,540$ -$
H-7

TINY TOTS - 553
City of Pinole FY 2018-19
Mission
Pinole Tiny Tots provides an affordable, high quality learning environment for preschool children ages 3 1/2 to 5 years of age. These programs are designed to offer children a recreational, social and educational experience with activities including age-appropriate academics, crafts, cutting with scissors, using glue and paste, painting, circle time, show-and-tell, music, science and story time. Resources are utilized for staffing, facility maintenance, utilities, program, and office supplies.
Key Objectives
To provide recreational activities for the children within the Pinole Community. Conduct fundraising activities that generate $500 annually. Maintain a trained staff to provide enrichment services to youth participants.
Success Indicators
Maintained quarterly enrollment of average 80 in the Tiny Tots Recreation Program during the program year.
Mon, Wed, Fri AM Mon, Wed, Fri PM Tue & Thurs School Year 30 30 20 Mon, Wed, Fri Tues & Thurs Summer (60) 30 30
Hosted annual community events which support program promotion, including: o Spring Open House o Fall Preview
This event is open to the public and should provide services to a minimum of 25 patrons.
Annual T-shirt fundraiser
Position Summary
Position 2014-15 2015-16 2016-17 2017-18 2018-19 Tiny Tots Program Coordinator, PT/Regular 0.90 0.90 0.80 0.80 0.80 Tiny Tots Recreation Leader, PT/Regular (3 – 15 hrs) 1.38 1.10 1.125 1.125 1.125
Total 2.28 2.00 1.925 1.925 1.925
H-8

RECREATION FUND - 209TINY TOTS - 553
EXPENDITURE SUMMARY
FY 2015-16 FY 2016-17 FY 2017-18 FY 2017-18 FY 2018-19 $ Chg % Chg
Actual Actual Actual Budget Proposed
Personnel Thru Mar-18
Salaries & Wages - 401 58,428 66,584 53,197 79,190 74,805 (4,385) -6%Overtime - 402 - - 1,037 - - - 0%Employee Benefits - 410 29,437 14,624 13,063 14,868 18,012 3,144 17%
Total Salary & Benefits 87,865 81,208 67,298 94,058 92,817 (1,241) -1%
Services and SuppliesProfessional & Administrative Services - 42 10,370 16,164 8,761 14,723 20,524 5,801 28%Other Operating Expenses - 43 3,018 2,892 2,518 3,579 3,394 (185) -5%
Total Services and Supplies 13,388 19,056 11,278 18,302 23,918 5,616 23%
Capital OutlayAsset Acquisition/Improvement - 47 - - - - - - 0%
Total Capital Outlay - - - - - - 0%
Indirect Cost AllocationsAdministrative Credits - 46121 - - - - - - 0%General Liability Insurance - 46201 2,764 1,887 2,122 1,944 2,295 351 15%
Total Indirect Cost Allocations 2,764 1,887 2,122 1,944 2,295 351 15%
Transfers Out - 49901 - - - - - - 0%
Total 104,016 102,151 80,699 114,304 119,030 4,726 4%
H-9

MAJOR NON-PERSONNEL EXPENSE DETAILS
FY 2017-18 FY 2018-19
42107 Equipment Maintenance 300$ 300$ Copier and other equipment maintenance 300$
42108 Maintenance Structure/Imp 9,661$ 9,662$ Alarm Monitoring 792 Building Maintenance 500 HVAC Maintenance 300 Janitorial (2 times weekly) 5,000 Landscape Maintenance 2,472 Pest Control 348 Sanitary Supplies 250
42201 Office Expense 1,500$ 1,500$ Toner, ink, other office supplies 1,500$
42302 Travel & Training -$ 300$ CPR staff training 300$
42501 Bank Fees -$ 5,000$
42514 Special Department Expense 3,262$ 3,762$ Advertising banners 330$ Holiday paper and craft supplies 450 Paper and craft supplies 732 Toy replacement 1,750
T-Shirt fundraiser 500
Total Professional/Administrative Services 20,524$
4310X Utilities 3,579$ 1,075$ Gas and Electric 875$ Water 200
43201 Property Tax -$ 2,319$
H-10

YOUTH CENTER - 554
City of Pinole FY 2018-19
Mission
The mission of the Pinole Youth Center is to provide a safe environment for children, provide programs that extend the learning opportunities outside of school time that help children develop interests, passions and new talents. The Pinole Youth Center provides a variety of enrichment programs, drop-in sessions along with Summer, Winter, Spring and President week camps for youth ages 6-18. Services are offered at the Youth Center at 635 Tennent Avenue.
Program Description
Programming at PYC includes a variety of enrichment programs from Art, Karate, Cooking, Sports, Lego, drop in sessions “Smarties”-homework help, “Discovery Zone-create and explore, “Recess Hour” - structured playtime and group games, intergenerational activities, youth leadership, and health and wellness activities.
The Day Camp program provides constructive and structured programming for youth ages 6-18 in Pinole during the summer, winter, spring and president breaks.
Key Objectives
To provide recreational activities for the children within the Pinole Community.
Provide a variety of enrichment programs and day camps for the youth of Pinole and surrounding communities.
Conduct fundraising activities that generate $800 annually.
Maintain a trained staff to provide enrichment services to youth participants
Success Indicators
Provided programming that features each of the following focus areas during the calendar year for the children attending the After School and Camp Programs. Recreation Youth Development Education Community Awareness
Hosted annual community events which support program promotion, including: o Spring Egg Hunt o Summer Camp Info Booth o Recreation Expo
These events are open to the public and should provide services to a minimum of 200 patrons.
Developed new programming for the fall-enrichment sessions
H-11

YOUTH CENTER - 554
City of Pinole FY 2018-19
Position Summary
Position 2014-15 2015-16 2016-17 2017-18 2018-19
Recreation Coordinator 0.90 0.90 0.90 0.90 0.90 Senior Recreation Leader (2 – 19 hr), PT 1.00 1.00 0.95 0.95 0.95 Recreation Leader (3 – 15 hr), PT/Regular 1.13 1.13 1.125 1.125 1.125 Recreation Leader (5 – 10 hr), PT/Seasonal 2.25 2.25 1.25 1.25 1.25
Total 5.28 5.28 4.225 4.225 4.225
H-12

RECREATION FUND - 209YOUTH CENTER - 554
EXPENDITURE SUMMARY
FY 2015-16 FY 2016-17 FY 2017-18 FY 2017-18 FY 2018-19 $ Chg % Chg
Actual Actual Actual Budget Proposed
Personnel Thru Mar-18
Salaries & Wages - 401 89,492 83,847 58,583 136,412 145,491 9,079 6%Overtime - 402 - 744 221 - - - 0%Employee Benefits - 410 27,936 29,005 28,419 28,340 47,685 19,345 41%
Total Salary & Benefits 117,428 113,596 87,224 164,752 193,176 28,424 15%
Services and SuppliesProfessional & Administrative Services - 32,743 42,729 14,204 17,943 23,949 6,006 25%Other Operating Expenses - 43 5,080 6,171 984 2,230 6,155 3,925 64%Materials & Supplies - 44 713 1,663 41 - 500 500 100%
Total Services and Supplies 38,536 50,563 15,229 20,173 30,604 10,431 34%
Capital OutlayAsset Acquisition/Improvement - 47 - - - - - - 0%
Total Capital Outlay - - - - - - 0%
Indirect Cost AllocationsAdministrative Credits - 46121 (19,244) (9,248) - (24,893) (25,692) (799) 3%Legal Charges - 46126 - - - 1,255 - (1,255) -100%General Liability Insurance - 46201 5,039 4,477 4,310 3,948 4,825 877 18%
Total Indirect Cost Allocations (14,205) (4,771) 4,310 (19,690) (20,867) (1,177) 6%
Transfers Out - 49901 - - - - - - 0%
Total 141,759 159,388 106,763 165,235 202,913 37,678 19%
H-13

MAJOR NON-PERSONNEL EXPENSE DETAILS
FY 2017-18 FY 2018-19
42101 Professional Services 3,444$ -$
42107 Equipment Maintenance 4,000$ 1,000$ Vehicle Maintenance 1,000$
42108 Maintenance Structure/Imp 10,743$ 19,164$ Building Maintenance 2,100$ Elevator Maintenance 1,080 Fire Extinguisher Maintenance 68 Janitorial Service 5,388 JanPro floor cleaning 1,172 Misc. other supplies 9,158 Pest Control 198
42201 Office Expense (1,244)$ 450$ Miscellaneous Office Supplies 450$
42301 Travel and Training 750$ 750$ Costs of seminars, conferences, staff training, first aid/CPR training 750$
42401 Memberships 250$ 250$ CPRS Membership 250$
42501 Bank Fees -$ 2,000$
42504 Recruitment Costs -$ 335$
Total Professional/Administrative Services 23,949$
4310X Utilities 737$ 3,350$ Gas and Electric 3,000$ Water 350
42301 Property Taxes -$ 665$
43812 Youth Center 1,493$ 2,140$ Break Week 1,040$ Program Costs 900 Program Supplies 200
Total Other Operating Expenses 6,155$
44301 Fuel -$ 500$
H-14

RECREATION FUND - 209DAYCAMP PROGRAM - 555
EXPENDITURE SUMMARY
FY 2015-16 FY 2016-17 FY 2017-18 FY 2017-18 FY 2018-19 $ Chg %
ChgActual Actual Actual Budget Proposed
Personnel Thru Mar-18
Salaries & Wages - 401 - - - - - - 0%Overtime - 402 - - - - - - 0%Employee Benefits - 410 - - - - - - 0%
Total Salary & Benefits - - - - - - 0%
Services and SuppliesProfessional & Administrative Services - 20,517 19,282 3,487 13,535 11,880 (1,655) -14%Other Operating Expenses - 43 654 - - - - - 0%Materials & Supplies - 44 - - - - - - 0%
Total Services and Supplies 21,171 19,282 3,487 13,535 11,880 (1,655) -14%
Capital OutlayAsset Acquisition/Improvement - 47 - - - - - - 0%
Total Capital Outlay - - - - - - 0%
Indirect Cost AllocationsAdministrative Credits - 46121 - - - - - - 0%Administrative Debits - 46122 19,244 9,248 - 24,893 25,692 799 3%
Total Indirect Cost Allocations 19,244 9,248 - 24,893 25,692 799 3%
Total 40,415 28,530 3,487 38,428 37,572 (856) -2%
MAJOR NON-PERSONNEL EXPENSE DETAILS
FY 2017-18 FY 2018-1942501 Recreation Bank Fee Day Camp 850$ 880$
Credit Card Charges 880$ -
42514 Special Department Expense 12,685$ 11,000$ Bus Tickets 700$ Camp Shirts 700 Fieldtrips 5,000 Misc. Supplies 1,800 Project Supplies 1,800 Snack Bar 1,000
H-15

PERFORMING ARTS - 556
City of Pinole FY 2018-19
Mission
The mission of the Performing Arts Theatre Program and the Pinole Community Playhouse is to create a positive recreation experience through participation in musicals and theatre activities for youth and young adults ages 8-25.
Program Description
The Performing Arts Theatre Program offers a variety of theater workshops for the community of Pinole and surrounding cities. Spring and Fall theater workshops are offered for youth ages 8-14 and a summer theater workshop is offered for youth and adults ages 18-24 at the Pinole Community Playhouse (Memorial Hall). The youth and adult workshop participants perform Broadway musicals at the end of their workshops. There are over 150 participants annually and hundreds of audience members. The Pinole Community Playhouse is also utilized by a local nonprofit organization, the Pinole Community Players. The Pinole Community Players offer a variety of plays and musicals throughout the year.
Pinole Community Playhouse (Memorial Hall) - 558
The Pinole Community Playhouse (Memorial Hall) is maintained as a community theatre for performing arts programs for youth and adults. There are six or more performances annually. It is utilized by the Pinole Recreation Department's School of Performing Arts and a local nonprofit organization, the Pinole Community Players. This program is funded from ticket sales, advertisements, registration fees, donations, grants, and rental fees.
H-16

RECREATION FUND - 209PERFORMING ARTS - 556
EXPENDITURE SUMMARY
FY 2015-16 FY 2016-17 FY 2017-18 FY 2017-18 FY 2018-19 $ Chg % ChgActual Actual Actual Budget Proposed
Personnel Thru Mar-18
Salaries & Wages - 401 - - - - - - 0%Overtime - 402 - - - - - - 0%Employee Benefits - 410 - - - - - - 0%
Total Salary & Benefits - - - - - - 0%
Services and SuppliesProfessional & Administrative Services - 42 34,785 36,979.88 27,118 40,007 43,950 3,943 9%Other Operating Expenses - 43 - - - - - - 0%Materials & Supplies - 44 - - - - - - 0%
Total Services and Supplies 34,785 36,980 27,118 40,007 43,950 3,943 9%
Indirect Cost AllocationsAdministrative Credits - 46121 - - - - - - 0%IS Charges - 46124 - - - - - - 0%
Total Indirect Cost Allocations - - - - - - 0%
Total 34,785 36,980 27,118 40,007 43,950 3,943 9%
MAJOR NON-PERSONNEL EXPENSE DETAILS
FY 2017-18 FY 2018-19
42101 Professional Services 27,450$ 28,800$ Director 9,000$ Instructors, designers, etc. 19,800$
42108 Maintenance Imp 3,350$ 3,350$ Mis. Maintenance 850$ Supplies & Materials 2,500$
42201 Office Expense 1,500$ 1,500$ Supplies and materials 1,500$
42501 Bank Fees 800$ 1,000$ Bank Fees for CC usage 800$
42514 Special Department Expense 6,907$ 9,300$ Prop/Costume Rentals 2,500 Misc Supplies 2,300 Royalties 4,500
H-17

SWIM CENTER - 557
City of Pinole FY 2018-19
Mission
The Pinole Swim Center provides high-quality recreational swimming opportunities for the Pinole community as well as instructional opportunities for children, competitive swimming through the Pinole Seals and adult exercise. The pool is managed and operated cooperatively by the City and the Pinole Seals Swim Club/Team.
H-18

RECREATION FUND - 209SWIM CENTER - 557
EXPENDITURE SUMMARY
FY 2015-16 FY 2016-17 FY 2017-18 FY 2017-18 FY 2018-19 $ Chg %
ChgActual Actual Actual Budget Proposed
Personnel Thru Mar-18
Salaries & Wages - 401 - - - - - - 0%Overtime - 402 - - - - - - 0%Employee Benefits - 410 - - - - - - 0%
Total Salary & Benefits - - - - - - 0%
Services and SuppliesProfessional & Administrative Services - 23,753 36,952 31,620 25,503 67,406 41,903 62%Other Operating Expenses - 43 10,495 10,653 8,221 13,188 13,405 217 2%
Total Services and Supplies 34,248 47,604 39,841 38,691 80,811 42,120 52%
Capital OutlayAsset Acquisition/Improvement - 47 - - - - - - 0%
Total Capital Outlay - - - - - - 0%
Indirect Cost AllocationsAdministrative Credits - 46121 - - - - - - 0%Legal Charges - 46126 - 3,547 - - - - 0%
Total Indirect Cost Allocations - 3,547 - - - - 0%
Total 34,248 51,151 39,841 38,691 80,811 42,120 52%
H-19

MAJOR NON-PERSONNEL EXPENSE DETAILS
FY 2017-18 FY 2018-19
42101 Professional Services -$ 41,873$ Swim Center Operations Contract 41,873$
42108 Maintenance Structure/Imp 24,003$ 24,033$
Pool Maintenance 12,158$ Pool Supplies 3,780 Landscape Maintenance 2,595 Janitorial 4,000 Building Maintenance 1,500
42514 Special Department Expense 1,500$ 1,500$ County Hazardous Material Fee, Annual 1,500$
Total Professional/Administrative Services 67,406$
4310X Utilities 11,300$ 11,300$ 43103 Gas and Electric 4,700$ 43102 Water 6,600
43201 Property Taxes 1,888$ 2,105$
H-20

RECREATION FUND - 209MEMORIAL HALL - 558
EXPENDITURE SUMMARY
FY 2015-16 FY 2016-17 FY 2017-18 FY 2017-18 FY 2018-19 $ Chg %
ChgActual Actual Actual Budget Proposed
Personnel Thru Mar-18
Salaries & Wages - 401 - - - - - - 0%Overtime - 402 - - - - - - 0%Employee Benefits - 410 - - - - - - 0%
Total Salary & Benefits - - - - - - 0%
Services and SuppliesProfessional & Administrative Services - 42 2,198 2,659 905 2,475 2,375 (100) -4%Other Operating Expenses - 43 1,979 2,161 1,725 2,363 2,463 100 4%
Total Services and Supplies 4,177 4,820 2,631 4,838 4,838 - 0%
Indirect Cost AllocationsAdministrative Credits - 46121 - - - - - - 0%Administrative Debits - 46122 - - - - - - 0%
Total Indirect Cost Allocations - - - - - - 0%
Total 4,177 4,820 2,631 4,838 4,838 - 0%
MAJOR NON-PERSONNEL EXPENSE DETAILS
FY 2017-18 FY 2018-19
42107 Equipment Maintenance 100$ -$ -$
42108 Maintenance Structure/Imp 2,375$ 2,375$ Building Maintenance 1,185$ Fire Alarm Service 280 Misc. Maintenance 320 Pest Control 325 Plumbing Supplies 90 Sanitary Supplies 175
Total Professional/Administrative Services 2,375$
4310X Utilities 2,363$ 2,463$ Gas and Electric 1,963$ Water 500
H-21

TENNIS PROGRAM - 559
City of Pinole FY 2018-19
Mission
The mission of the Tennis Program is to provide high-quality recreational use of tennis courts with the goal of managing clean, well-lit tennis courts for community public use. Funding is generated by tennis court reservation fees.
FY 2014-15 Actual
FY 2015-16 Actual
FY 2016-17 Budget
FY 2017-18 Proposed
FY 2018-19 Proposed
Services and Supplies Maintenance Structure/Imp - 42108 87 500 500 500 500
Utilities – 4310X 1,504 2,000 2,000 2,995 2,750
Total Services and Supplies 1,591 2,500 2,500 3,495 3,250
Total 1,591 2,500 2,500 3,495 3,250
H-22

RECREATION FUND - 209TENNIS - 559
EXPENDITURE SUMMARY
FY 2015-16 FY 2016-17 FY 2017-18 FY 2017-18 FY 2018-19 $ Chg % ChgActual Actual Actual Budget Proposed
Services and Supplies Thru Mar-18Professional & Administrative Services - - - - 500 500 - 0%Other Operating Expenses - 43 2,220 2,726 2,417 2,995 2,750 (245) -9%
Total Services and Supplies 2,220 2,726 2,417 3,495 3,250 (245) -8%
Total 2,220 2,726 2,417 3,495 3,250 (245) -8%
MAJOR NON-PERSONNEL EXPENSE DETAILS
FY 2017-18 FY 2018-19
42108 Maintenance Structure/Imp 500$ 500$ Building Maintenance 500$
4310X Utilities 2,995$ 2,750$ Gas and Electric -$ Water 2,750
H-23

CAPTIAL IMPROVEMENT PLAN
City of Pinole FY 2018‐19
Mission
The Capital Improvement Plan (CIP) sets the schedule within which public improvements are proposed to be undertaken. The five-year schedule represents estimated future capital needs that may be funded given projected revenue estimates. The CIP is reviewed and revised annually. Capital expenditures that are expected to have matching revenue are included in the Annual Operating Budget that is presented to the City Council as part of the annual budget process in June.
Program Description
A Capital Improvement Plan is a major public infrastructure and planning tool for municipalities. The CIP is a statement of the City’s policies and financial abilities to manage the physical development of the community. The development of a five-year CIP provides a systematic plan for providing infrastructure improvements within a prioritized framework.
Capital Projects completed:
Tiny Tots Building: Slab Displacement Painting and Maintenance of the Caretaker’s House Storage Building and Improvements at 651 Pinole Shores Drive – Phase 2 Installed Trash Capture Devices – Original Area Roadway Striping in Old Town – to the maximum budget
Key Objectives
Facility Maintenance: Citywide Roof Repairs and Replacement
Funding: Measure S 2014
Parks: Replace Restrooms in Fernandez Park
Funding: Measure S 2014
Sewer Collection: Inflow and Infiltration Monitoring Program
Funding: Sewer Enterprise fund
Sewer Treatment: Upgrades to Wastewater Treatment Plant
Funding: Sewer Plant Expansion fund
Streets and Roadways: Pavement Maintenance and Rehabilitation Program
Funding: City Street Improvements and Arterial Street Rehabilitation funds
I-1

Cit
y o
f P
ino
leP
rop
sed
FY
201
8-19
th
rou
gh
202
2-23
Fiv
e-Y
ear
Cap
ital
Imp
rove
men
t P
lan
SO
UR
CE
S B
Y F
UN
DF
Y 2
018-
19F
Y 2
019-
20F
Y 2
020-
21F
Y 2
021-
22F
Y 2
022-
235-
Yea
r T
ota
l
Mea
sure
S 2
014
- 10
699
6,61
8
36
8,00
0
36
0,00
0
220,
000
22
0,00
0
2,16
4,61
8$
Gas
Tax
- 2
0048
1,72
7
47
0,10
0
37
0,10
0
370,
100
37
0,10
0
2,06
2,12
7$
AB
939
Ref
use
Man
agem
ent
- 21
312
,000
-
-
-
-
12,0
00$
Mea
sure
J -
215
132,
650
139,
000
616,
000
30
,000
30,0
00
94
7,65
0$
Par
klan
d D
edic
atio
n -
275
15,5
09
-
-
-
-
15
,509
$
Pu
blic
Fac
iliti
es -
324
115,
000
60,0
00
60
,000
60,0
00
60
,000
355,
000
$
Cit
y S
tree
t Im
pro
vem
ents
- 3
251,
778,
889
25
0,00
0
32
6,00
0
250,
000
25
0,00
0
2,85
4,88
9$
Par
k G
ran
ts -
327
24,4
91
-
-
-
-
24
,491
$
2014
Art
eria
l Str
eet
Reh
ab -
377
796,
019
250,
000
250,
000
25
0,00
0
250,
000
1,
796,
019
$
Sew
er E
nte
rpri
se -
500
1,71
3,85
1
700,
000
350,
000
35
0,00
0
350,
000
3,
463,
851
$
Sew
er P
lan
t E
xpan
sio
n -
503
7,54
2,16
7
-
-
-
-
7,54
2,16
7$
So
urc
es T
ota
l13
,608
,921
2,23
7,10
0
2,33
2,10
0
1,
530,
100
1,53
0,10
0
21
,238
,321
$
Un
fun
ded
To
tal
810,
000
90,0
00
-
-
-
90
0,00
0$
T
ota
l So
urc
es R
equ
ired
14,4
18,9
21$
2,32
7,10
0$
2,
332,
100
$ 1,
530,
100
$ 1,
530,
100
$ 22
,138
,321
$
5-Y
ear
To
tal
PR
J #
US
ES
BY
PR
OJE
CT
FY
201
8-19
FY
201
9-20
FY
202
0-21
FY
202
1-22
FY
202
2-23
Bu
dg
et U
nit
Acc
ou
nt
#F
un
din
g S
ou
rce
Can
did
ate
for
Sto
rmw
ater
Gre
en
Infr
astr
uct
ure
FA
1701
Bui
ldin
g R
ehab
ilita
tion/
Maj
or R
epai
r P
roje
cts
$60,
000
$60,
000
$60,
000
$60,
000
$60,
000
Fac
ilitie
s 32
4-34
3-47
201
Fac
ilitie
s F
und
N
o
FA
1702
City
wid
e R
oof r
epai
rs a
nd r
epla
cem
ent
$164
,000
$108
,000
$140
,000
Fac
ilitie
s 10
6-34
3-47
201
Mea
sure
S 2
014
No
FA
1703
Pai
nt C
ity H
all (
Insi
de a
nd O
utsi
de)
$35,
000
$35,
000
F
acili
ties
106-
343-
4720
1 M
easu
re S
201
4 N
o
FA
1706
Rep
lace
HV
AC
at S
enio
r C
ente
r$6
0,00
0
F
acili
ties
106-
343-
4720
1 M
easu
re S
201
4 N
o
FA
1707
Rep
lace
Roo
f at S
enio
r C
ente
r$5
0,00
0
F
acili
ties
106-
343-
4720
1 M
easu
re S
201
4 N
o
FA
1712
2548
Cha
rles
Ave
. Rep
urpo
sing
(F
owle
r H
ouse
)$4
5,00
0F
acili
ties
324-
343-
4720
1 F
acili
ties
Fun
d
No
FA
1801
Rep
lace
HV
AC
at C
ity H
all
$60,
000
Fac
ilitie
s U
nfun
ded
No
PA
1701
Soc
cer
Fie
ld M
aint
enan
ce$1
0,00
0$1
0,00
0$1
0,00
0$1
0,00
0$1
0,00
0P
arks
106-
345-
4720
3 M
easu
re S
201
4 Y
es
PA
1703
Par
k F
undi
ng fo
r B
ench
es a
nd P
icni
c ta
bles
$5,0
00$5
,000
P
arks
106-
345-
4720
3 M
easu
re S
201
4 N
o
PA
1704
Pre
pare
a P
ark
Mas
ter
Pla
n$5
5,00
0P
arks
Unf
unde
d Y
es
PA
1705
Reh
abili
tatio
n of
Pla
y F
ield
s at
Fer
nand
ez P
ark
$40,
000
P
arks
275-
345-
4720
3 $1
5,50
9 32
7-34
5-47
203
$24,
491
Par
k Im
pact
/Gra
nts
Yes
PA
1706
Rep
lace
Chi
ps w
ith R
ubbe
r M
attin
g at
sel
ect p
ark
loca
tions
$50,
000
P
arks
106-
345-
4720
3 M
easu
re S
201
4 Y
es
I-2

Cit
y o
f P
ino
leP
rop
sed
FY
201
8-19
th
rou
gh
202
2-23
Fiv
e-Y
ear
Cap
ital
Imp
rove
men
t P
lan
PR
J #
US
ES
BY
PR
OJE
CT
FY
201
8-19
FY
201
9-20
FY
202
0-21
FY
202
1-22
FY
202
2-23
Bu
dg
et U
nit
Acc
ou
nt
#F
un
din
g S
ou
rce
Can
did
ate
for
Sto
rmw
ater
Gre
en
Infr
astr
uct
ure
PA
1707
Rep
lace
Lig
htin
g at
Lou
is F
ranc
is P
ark
$15,
000
P
arks
106-
345-
4720
3 M
easu
re S
201
4 N
o
PA
1708
Res
troo
ms
in F
erna
ndez
Par
k$2
82,6
18
P
arks
106-
345-
4720
3 M
easu
re S
201
4 Y
es
PA
1709
Sen
ior
Cen
ter
Par
king
Lot
Pav
emen
t Mai
nten
ance
$42,
000
P
arks
106-
345-
4720
3 M
easu
re S
201
4 N
o
PA
1710
Uni
form
Par
k S
igna
ge
$35,
000
Par
ks U
nfun
ded
No
PA
1801
Car
etak
er's
Hou
se D
rain
age
Rep
air
$10,
000
P
arks
324-
345-
4720
1 F
acili
ties
Fun
d
No
SS
1702
Haz
el S
tree
t Sew
er P
ump
Sta
tion
Reh
abili
tatio
n$1
,200
,000
Sew
er C
olle
ctio
n50
0-64
2-47
201
Sew
er E
nter
pris
eN
o
SS
1703
Inflo
w a
nd In
filtr
atio
n M
onito
ring
Pro
gram
$60,
000
Sew
er C
olle
ctio
n50
0-64
2-42
101
Sew
er E
nter
pris
eN
o
SS
1704
Inflo
w a
nd In
filtr
atio
n R
ehab
ilita
tion
Pro
gram
; Bas
in
3.1
$350
,000
Sew
er C
olle
ctio
n50
0-64
2-47
201
Sew
er E
nter
pris
eN
o
SS
1705
Inflo
w a
nd In
filtr
atio
n R
ehab
ilita
tion
Pro
gram
; Bas
in
5.2
and
6.5
$350
,000
Sew
er C
olle
ctio
n50
0-64
2-47
201
Sew
er E
nter
pris
eN
o
SS
1707
Upg
rade
s to
Was
tew
ater
Tre
atm
ent P
lant
$7,5
42,1
67S
ewer
Tre
atm
ent
503-
643-
4720
1S
ewer
Exp
ansi
onN
o
SS
1801
Inflo
w a
nd In
filtr
atio
n R
ehab
ilita
tion
Pro
ject
$350
,000
$350
,000
$350
,000
$350
,000
Sew
er C
olle
ctio
n50
0-64
2-47
201
Sew
er E
nter
pris
eN
o
SS
1802
Rod
eo O
utfa
ll P
roje
ct$1
03,8
51S
ewer
Tre
atm
ent
500-
641-
4720
1S
ewer
Ent
erpr
ise
No
SW
1701
Inst
all T
rash
Cap
ture
Dev
ices
$12,
000
Sto
rmw
ater
213-
344-
4710
1 R
efus
e M
anag
emen
t Y
es
SW
1702
Sto
rm D
rain
age
Ann
ual R
ehab
ilita
tion
$150
,000
$150
,000
$150
,000
$150
,000
$150
,000
Sto
rmw
ater
106-
344-
4720
6 M
easu
re S
201
4 Y
es
SW
1703
Sto
rm D
rain
age
Mas
ter
Pla
n$7
5,00
0S
torm
wat
er10
6-34
4-42
101
Mea
sure
S 2
014
Yes
RO
1701
Mis
cella
neou
s R
oadw
ay R
epai
r$1
5,00
0$1
5,00
0$1
5,00
0$1
5,00
0$1
5,00
0R
oads
215-
343-
4720
5 M
easu
re J
N
o
RO
1702
Pot
hole
Rep
air
Pro
gram
$40,
000
$40,
000
$40,
000
$40,
000
$40,
000
Roa
ds20
0-34
3-47
205
Gas
Tax
N
o
RO
1703
Roa
dway
Str
ipin
g P
rogr
am$1
5,00
0$1
5,00
0$1
5,00
0$1
5,00
0$1
5,00
0R
oads
200-
343-
4720
5 G
as T
ax
No
RO
1704
Sid
ewal
k M
aint
enan
ce P
rogr
am$3
5,00
0$3
5,00
0$3
5,00
0$3
5,00
0$3
5,00
0R
oads
106-
343-
4720
4 $
20,0
00
215-
343-
4720
4 $1
5,00
0 M
easu
re S
201
4 &
M
easu
re J
N
o
RO
1705
Sig
n R
epla
cem
ent P
rogr
am$2
0,00
0$2
0,00
0$2
0,00
0$2
0,00
0$2
0,00
0R
oads
106-
343-
4720
2 $1
8,00
0 21
5-34
3-47
202
$2,0
00 M
easu
re S
201
4 &
M
easu
re J
N
o
RO
1706
Tre
e T
rimm
ing
Pro
gram
$20,
000
$20,
000
$20,
000
$20,
000
$20,
000
Roa
ds10
6-34
3-47
202
Mea
sure
S 2
014
No
RO
1707
Pav
emen
t Mai
nten
ance
and
Reh
abili
tatio
n P
rogr
am$2
,116
,782
$815
,100
$815
,100
$815
,100
$815
,100
Roa
ds32
5-34
3-47
205
$900
k
377-
343-
4720
5 $7
96k,
20
0-34
3-47
205
$420
,977
City
Str
eet I
mpr
ov/A
rt
Reh
ab/G
as T
ax-
RM
RA
N
o
RO
1708
Pin
ole
Val
ley
Roa
d Im
prov
emen
ts$1
00,0
00R
oads
200-
343-
4720
5 G
as T
ax
No
I-3
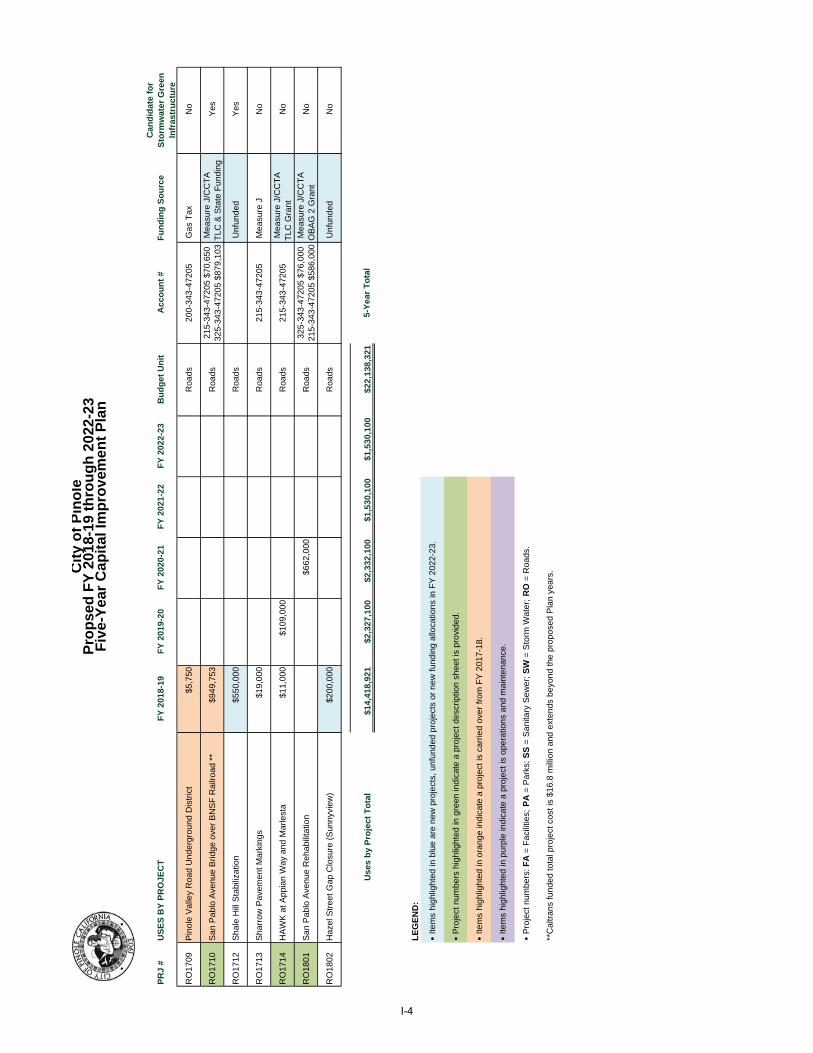
Cit
y o
f P
ino
leP
rop
sed
FY
201
8-19
th
rou
gh
202
2-23
Fiv
e-Y
ear
Cap
ital
Imp
rove
men
t P
lan
PR
J #
US
ES
BY
PR
OJE
CT
FY
201
8-19
FY
201
9-20
FY
202
0-21
FY
202
1-22
FY
202
2-23
Bu
dg
et U
nit
Acc
ou
nt
#F
un
din
g S
ou
rce
Can
did
ate
for
Sto
rmw
ater
Gre
en
Infr
astr
uct
ure
RO
1709
Pin
ole
Val
ley
Roa
d U
nder
grou
nd D
istr
ict
$5,7
50R
oads
200-
343-
4720
5 G
as T
ax
No
RO
1710
San
Pab
lo A
venu
e B
ridge
ove
r B
NS
F R
ailro
ad *
*$9
49,7
53R
oads
215-
343-
4720
5 $7
0,65
0 32
5-34
3-47
205
$879
,103
Mea
sure
J/C
CT
A
TLC
& S
tate
Fun
ding
Y
es
RO
1712
Sha
le H
ill S
tabi
lizat
ion
$550
,000
Roa
ds U
nfun
ded
Yes
RO
1713
Sha
rrow
Pav
emen
t Mar
king
s $1
9,00
0R
oads
215-
343-
4720
5 M
easu
re J
N
o
RO
1714
HA
WK
at A
ppia
n W
ay a
nd M
arle
sta
$11,
000
$109
,000
Roa
ds21
5-34
3-47
205
Mea
sure
J/C
CT
A
TLC
Gra
nt
No
RO
1801
San
Pab
lo A
venu
e R
ehab
ilita
tion
$662
,000
Roa
ds32
5-34
3-47
205
$76,
000
215-
343-
4720
5 $5
86,0
00 M
easu
re J
/CC
TA
O
BA
G 2
Gra
nt
No
RO
1802
Haz
el S
tree
t Gap
Clo
sure
(S
unny
view
)$2
00,0
00R
oads
Unf
unde
d N
o
Use
s b
y P
roje
ct T
ota
l$1
4,41
8,92
1$2
,327
,100
$2,3
32,1
00$1
,530
,100
$1,5
30,1
00$2
2,13
8,32
15-
Yea
r T
ota
l
LE
GE
ND
:
• Ite
ms
high
light
ed in
blu
e ar
e ne
w p
roje
cts,
unf
unde
d pr
ojec
ts o
r ne
w fu
ndin
g al
loca
tions
in F
Y 2
022-
23.
• P
roje
ct n
umbe
rs h
ighl
ight
ed in
gre
en in
dica
te a
pro
ject
des
crip
tion
shee
t is
prov
ided
.
• Ite
ms
high
light
ed in
ora
nge
indi
cate
a p
roje
ct is
car
ried
over
from
FY
201
7-18
.
• Ite
ms
high
light
ed in
pur
ple
indi
cate
a p
roje
ct is
ope
ratio
ns a
nd m
aint
enan
ce.
• P
roje
ct n
umbe
rs: F
A =
Fac
ilitie
s; P
A =
Par
ks;
SS
= S
anita
ry S
ewer
; S
W =
Sto
rm W
ater
; R
O =
Roa
ds.
**C
altr
ans
fund
ed to
tal p
roje
ct c
ost i
s $1
6.8
mill
ion
and
exte
nds
beyo
nd th
e pr
opos
ed P
lan
year
s.
I-4

Pro
ject
: C
ityw
ide
Roo
f R
epai
rs a
nd R
epla
cem
ent
Des
crip
tio
n:
Just
ific
atio
n:
Pro
ject
Nu
mb
er:
FA
17
02
Pro
ject
ed T
imin
g:
Est
imat
ed S
tart
Dat
e:2
01
8E
stim
ated
En
d D
ate:
2
02
1
Cit
y o
f P
ino
leC
apit
al Im
pro
vem
ent
Pla
nF
isca
l Yea
rs 2
018-
19 t
hro
ug
h 2
022-
23
Roo
f Rep
air
and
Rep
lace
men
t on
Bui
ldin
g id
entif
ied
by
insp
ectio
n.
The
City
hire
s co
ntra
ct s
ervi
ces
to r
epai
ran
d/or
rep
lace
ro
ofs
on C
ity F
acili
ties.
A c
ompr
ehen
sive
insp
ectio
n w
as
perf
orm
ed o
n al
l fac
ilitie
s in
ear
ly 2
015.
The
insp
ectio
n id
entif
ied
seve
ral o
f the
roo
fs n
eede
d to
be
repl
aced
by
the
end
of F
Y 2
020-
21.
To
tal E
stim
ated
Co
st:
Pla
nn
ing
an
d D
es
ign
:
En
gin
ee
rin
g a
nd
Ad
min
istr
ati
ve:
Co
nst
ruct
ion
:$
41
2,0
00
Eq
uip
me
nt:
Co
nti
ng
en
cy:
To
tal:
41
2,0
00
$
Fu
nd
ing
So
urc
e:P
rio
rF
Y 2
01
8-1
9F
Y 2
01
9-2
0F
Y 2
02
0-2
1F
Y 2
02
1-2
2F
Y 2
02
2-2
3A
ctu
al
Pro
po
se
dP
rop
os
ed
Pro
po
sed
Pro
po
sed
Pro
po
sed
Me
as
ure
S 2
01
4 -
10
6-
$1
64
,00
0$
10
8,0
00
$1
40
,00
0-
-
-
-
-
-
-
-
T
ota
l-
16
4,00
0
$108
,000
$140
,000
-
-
I-5

Pro
ject
: 25
48 C
harle
s A
venu
e R
epur
posi
ng (
Fow
ler
Hou
se)
Des
crip
tio
n:
Just
ific
atio
n:
Pro
ject
Nu
mb
er:
FA
1712
Pro
ject
ed T
imin
g:
Est
imat
ed S
tart
Dat
e:20
17
Est
imat
ed E
nd
Dat
e:
2020
Tt
lEti
td
Ct
Cit
y o
f P
ino
leC
apit
al Im
pro
vem
ent
Pla
nF
isca
l Yea
rs 2
018-
19 t
hro
ug
h 2
022-
23
The
City
in
tend
s to
dem
olis
h th
e F
owle
rH
ouse
and
will
se
ek a
noth
er u
se fo
r th
e pr
oper
ty.
Eff
ectiv
ely,
pha
se 1
of
wor
k is
for
the
dem
oliti
on o
nly.
T
he fu
ture
use
of t
his
site
is
stil
l to
be d
eter
min
ed a
nd w
ill b
e co
mpl
eted
in a
se
cond
pha
se.
Rem
ove
City
Ow
ned
Res
iden
tial U
nit a
nd R
epla
ce w
ith
New
Fac
ility
/Am
enity
.
To
tal E
stim
ated
Co
st:
Pla
nn
ing
an
d D
esig
n:
TD
B
En
gin
eeri
ng
an
d A
dm
inis
trat
ive:
TD
B
Dem
olit
ion
:$4
5,00
0
Co
nst
ruct
ion
:T
DB
Co
nti
ng
ency
:T
DB
To
tal (
Ph
ase
1 o
nly
):45
,000
$
Fu
nd
ing
So
urc
e:P
rio
rF
Y 2
018-
19F
Y 2
019-
20F
Y 2
020-
21F
Y 2
021-
22F
Y 2
022-
23
Act
ual
Pro
po
sed
Pro
po
sed
Pro
po
sed
Pro
po
sed
Pro
po
sed
Pu
blic
Fac
iliti
es F
un
d -
324
-
45
,000
F
un
din
g S
ou
rce
to b
e d
eter
min
ed-
-
-
-
-
-
To
tal
-
45
,000
-
-
-
-
I-6

Pro
ject
: P
rep
are
Pa
rk M
ast
er
Pla
n
Des
crip
tio
n:
Just
ific
atio
n:
Pro
ject
Nu
mb
er:
PA
1704
Pro
ject
ed T
imin
g:
Est
imat
ed S
tart
Dat
e:20
19E
stim
ated
En
d D
ate:
20
20
Cit
y o
f P
ino
leC
apit
al I
mp
rove
men
t P
lan
Fis
ca
l Y
ea
rs 2
01
8-1
9 t
hro
ug
h 2
02
2-2
3
A m
aste
r pl
an f
or p
arks
will
aid
the
City
in d
evel
opin
g a
stra
tegi
c ap
proa
ch t
o pa
rk m
aint
enan
ce a
nd o
pera
tion.
Mas
ter
plan
ning
allo
ws
the
City
to
quan
tify
and
qual
ify t
he
exis
ting
park
sys
tem
, id
entif
y de
ficie
ncie
s, d
evel
op f
inan
cial
an
alys
is o
f th
e co
st to
mai
ntai
n, o
pera
te,
and
if op
port
unity
ar
ises
, exp
and
the
park
sys
tem
. Mas
ter
plan
ning
ser
ves
can
supp
ort
the
City
in p
rovi
ding
a p
latf
orm
for
resp
ondi
ng
stra
tegi
cally
to
gran
ts a
nd o
ther
opp
ortu
nitie
s.
To
tal
Est
imat
ed C
ost
:P
lan
nin
g a
nd
Des
ign
:55
,000
$
E
ng
inee
rin
g a
nd
Ad
min
istr
ativ
e:C
on
stru
ctio
n:
Eq
uip
men
t:C
on
tin
gen
cy:
To
tal:
55,0
00$
Fu
nd
ing
So
urc
e:P
rio
rF
Y 2
018-
19F
Y 2
019-
20F
Y 2
020-
21F
Y 2
021-
22F
Y 2
022-
23A
ctu
alP
rop
ose
dP
rop
ose
dP
rop
ose
dP
rop
ose
dP
rop
ose
d
Un
fun
ded
-
-
$55,
000
-
-
-
To
tal
-
-
$55,
000
-
-
-
I-7

Pro
ject
: R
est
roo
ms
in F
ern
an
de
z P
ark
Des
crip
tio
n:
Just
ific
atio
n:
Pro
ject
Nu
mb
er:
PA
1708
Pro
ject
ed T
imin
g:
Est
imat
ed S
tart
Dat
e:20
17E
stim
ated
En
d D
ate:
20
18
Cit
y o
f P
ino
leC
apit
al I
mp
rove
men
t P
lan
Fis
ca
l Y
ea
rs 2
01
8-1
9 t
hro
ug
h 2
02
2-2
3
Rep
lace
Res
troo
ms
in F
erna
ndez
Par
k
The
exi
stin
g re
stro
omis
bey
ond
its u
sefu
l life
. It
ha
s be
en r
ehab
ilita
ted
seve
ral t
imes
. Cur
rent
ly,
the
conc
rete
flo
orin
g an
d bl
ock
wal
ls c
an n
o lo
nger
be
kept
cle
an a
nd o
dor
free
. N
ew r
estr
oom
fac
ilitie
s w
ill p
rovi
de b
ette
r ac
cess
ibili
ty f
or a
ll pa
rk u
sers
.
To
tal
Est
imat
ed C
ost
:P
lan
nin
g a
nd
Des
ign
:-
$
En
gin
eeri
ng
an
d A
dm
inis
trat
ive:
10,0
00$
Co
nst
ruct
ion
:28
4,00
0$
E
qu
ipm
ent:
-$
C
on
tin
gen
cy:
6,00
0$
T
ota
l:30
0,00
0$
Fu
nd
ing
So
urc
e:P
rio
rF
Y 2
018-
19F
Y 2
019-
20F
Y 2
020-
21F
Y 2
021-
22F
Y 2
022-
23A
ctu
alP
rop
ose
dP
rop
ose
dP
rop
ose
dP
rop
ose
dP
rop
ose
d
Mea
sure
S 2
014
- 10
617
,382
$282
,618
-
-
-
-
To
tal
17,3
82
$2
82,6
18-
-
-
-
I-8

Pro
ject
: U
nifo
rm P
ark
Sig
na
ge
Des
crip
tio
n:
Just
ific
atio
n:
Pro
ject
Nu
mb
er:
PA
1710
Pro
ject
ed T
imin
g:
Est
imat
ed S
tart
Dat
e:20
17E
stim
ated
En
d D
ate:
20
18
Cit
y o
f P
ino
leC
apit
al I
mp
rove
men
t P
lan
Fis
ca
l Y
ea
rs 2
01
8-1
9 t
hro
ug
h 2
02
2-2
3
Sig
nage
thro
ugho
ut t
he p
ark
syst
em h
as e
volv
ed o
ver
time
to a
pat
chw
ork
of e
ffec
tive
by p
lain
and
som
etim
es a
ging
si
gnag
e. R
ecen
t ac
tiviti
es in
the
are
a of
P
inol
e C
reek
has
illus
trat
ed t
hat
sign
age
is a
des
irabl
e co
mpo
nent
of t
he
park
sys
tem
. Frie
nds
of P
inol
e C
reek
has
exp
ress
ed a
de
sire
for
ver
y ar
tistic
sig
nage
. A
uni
fied
appr
oach
is a
lso
Dev
elop
a un
iform
sig
nage
app
roac
h to
all
park
s in
clud
ing
linea
r pa
rks.
Upg
rade
sig
ns t
hrou
ghou
t pa
rk
To
tal
Est
imat
ed C
ost
:P
lan
nin
g a
nd
Des
ign
:E
ng
inee
rin
g a
nd
Ad
min
istr
ativ
e:C
on
stru
ctio
n:
35,0
00$
Eq
uip
men
t:C
on
tin
gen
cy:
To
tal:
35,0
00$
Fu
nd
ing
So
urc
e:P
rio
rF
Y 2
018-
19F
Y 2
019-
20F
Y 2
020-
21F
Y 2
021-
22F
Y 2
022-
23A
ctu
alP
rop
ose
dP
rop
ose
dP
rop
ose
dP
rop
ose
dP
rop
ose
d
Un
fun
ded
-
-
$35,
000
-
-
-
To
tal
-
-
35,0
00
-
-
-
I-9

Pro
ject
:
Des
crip
tio
n:
Just
ific
atio
n:
Pro
ject
Nu
mb
er:
SS
1702
Pro
ject
ed T
imin
g:
Est
imat
ed S
tart
Dat
e:
Oct
ober
201
8E
stim
ated
En
d D
ate:
June
201
9
Cit
y o
f P
ino
leC
apit
al I
mp
rove
men
t P
lan
Fis
ca
l Y
ea
rs 2
01
8-1
9 t
hro
ug
h 2
02
2-2
3
Ha
zel S
tre
et
Pu
mp
Sta
tion
Re
ha
bili
tatio
n
The
exi
stin
g pu
mp
stat
ion
is o
pera
tiona
lly
defic
ient
, an
d s
ome
com
pone
nts
have
rea
ched
th
e en
d of
the
ir us
eful
life
. Add
ition
ally
the
for
ce
mai
n fr
om th
e lif
t sta
tion
need
s to
be
repl
aced
.
Haz
el S
tree
t S
ewer
Lift
Sta
tion
pum
ps w
aste
wat
er
gene
rate
d in
an
area
of
Pin
ole
near
Sun
nyvi
ew
Driv
e be
caus
eth
e gr
avity
rou
ting
is c
ost p
rohi
bitiv
e.
To
tal
Est
imat
ed C
ost
:P
lan
nin
g a
nd
Des
ign
:22
,500
$
E
ng
inee
rin
g/A
dm
inis
trat
ive:
150,
000
$
Co
nst
ruct
ion
:88
4,00
0$
E
qu
ipm
ent:
-$
C
on
tin
gen
cy:
143,
500
$
To
tal:
1,20
0,00
0$
Fu
nd
ing
So
urc
e:P
rio
rF
Y 2
018-
19F
Y 2
019-
20F
Y 2
020-
21F
Y 2
021-
22F
Y 2
022-
23A
ctu
alP
rop
ose
dP
rop
ose
dP
rop
ose
dP
rop
ose
dP
rop
ose
d
Sew
er E
nte
rpri
se F
un
d-
500
-
$1
,200
,000
-
-
-
-
-
To
tal
-
$1
,200
,000
-
-
-
-
I-10

Pro
ject
: In
flow
an
d I
nfil
tra
tion
Mo
nito
rin
g P
rog
ram
Des
crip
tio
n:
Just
ific
atio
n:
Pro
ject
Nu
mb
er:
SS
1703
Pro
ject
ed T
imin
g:
Est
imat
ed S
tart
Dat
e:
Est
imat
ed E
nd
Dat
e:
Cit
y o
f P
ino
leC
apit
al I
mp
rove
men
t P
lan
Fis
ca
l Y
ea
rs 2
01
8-1
9 t
hro
ug
h 2
02
2-2
3
Add
ition
al f
ocus
edm
onito
ring
and
test
ing
of
the
sew
er c
olle
ctio
n sy
stem
to r
efin
e w
ork
effo
rts.
The
Aug
ust
2015
I/I
Stu
dyre
com
men
ded
that
m
onito
ring
durin
g st
orm
eve
nts
be c
ondu
cted
to
pinp
oint
pro
ject
s fo
r fo
cuse
d im
prov
emen
t to
m
itiga
te s
torm
wat
er in
flow
.
To
tal
Est
imat
ed C
ost
:P
lan
nin
g a
nd
Des
ign
:60
,000
.00
$
E
ng
inee
rin
g a
nd
Ad
min
istr
ativ
e:-
$
Co
nst
ruct
ion
:-
$
Eq
uip
men
t:-
$
Co
nti
ng
ency
:-
$
To
tal:
60,0
00.0
0$
Fu
nd
ing
So
urc
e:P
rio
rF
Y 2
018-
19F
Y 2
019-
20F
Y 2
020-
21F
Y 2
021-
22F
Y 2
022-
23A
ctu
alP
rop
ose
dP
rop
ose
dP
rop
ose
dP
rop
ose
dP
rop
ose
d
Sew
er E
nte
rpri
se F
un
d-
500
-
$60,
000
-
-
-
-
To
tal
-
$60,
000
-
-
-
-
I-11

Pro
jec
t:
De
sc
rip
tio
n:
Ju
sti
fic
ati
on
:
Pro
jec
t N
um
be
r:S
S17
04
Pro
jec
ted
Tim
ing
:E
stim
ated
Sta
rt D
ate:
Est
imat
edE
nd
Dat
e:
Cit
y o
f P
ino
leC
ap
ita
l Im
pro
vem
en
t P
lan
Fis
ca
l Ye
ars
20
18
-19
th
rou
gh
20
22
-23
Inflo
w a
nd In
filtr
atio
n R
ehab
ilita
tion
Pro
gram
; Bas
in 3
.1
Impr
ovem
ents
to t
he c
olle
ctio
n sy
stem
, T
arge
t lo
catio
n B
asin
3.1
, to
red
uce
inflo
w a
nd in
filtr
atio
n (I
/I).
Pin
ole
has
fairl
y hi
gh I
/I ra
tes
with
in t
he s
ewer
col
lect
ion
syst
em r
esul
ting
from
sto
rm w
ater
inflo
w a
nd in
filtr
atio
n.
Tar
gete
dim
prov
emen
ts to
the
was
tew
ater
col
lect
ion
syst
emca
n re
duce
tre
atm
ent
cost
and
fre
e ca
paci
ty f
or
expa
nded
use
s. S
tudi
es h
ave
alre
ady
targ
eted
sev
eral
ar
eas
of th
e co
llect
ion
syst
em t
hat
war
rant
im
prov
emen
ts.
Est
imat
ed E
nd
Dat
e:
To
tal E
sti
ma
ted
Co
st:
Pla
nn
ing
an
d D
esig
n:
-$
E
ng
inee
rin
g a
nd
Ad
min
istr
ativ
e:30
,000
$
Co
nst
ruct
ion
:30
0,00
0$
Eq
uip
men
t:-
$
Co
nti
ng
ency
:20
,000
$
To
tal:
350,
000
$
Fu
nd
ing
So
urc
e:
Pri
or
FY
201
8-19
FY
201
9-20
FY
202
0-21
FY
202
1-22
FY
202
2-23
Act
ual
Pro
po
sed
Pro
po
sed
Pro
po
sed
Pro
po
sed
Pro
po
sed
Sew
er E
nte
rpri
se F
un
d-
500
-
$350
,000
-
-
-
-
To
tal
-
$350
,000
-
-
-
-
I-12

Pro
jec
t:
De
sc
rip
tio
n:
Ju
sti
fic
ati
on
:
Pro
jec
t N
um
be
r:S
S17
05
Pro
jec
ted
Tim
ing
:E
stim
ated
Sta
rt D
ate:
July
201
9E
stim
ated
En
dD
ate:
June
2020
Cit
y o
f P
ino
leC
ap
ita
l Im
pro
vem
en
t P
lan
Fis
ca
l Ye
ars
20
18
-19
th
rou
gh
20
22
-23
Inflo
w a
nd In
filtr
atio
n R
ehab
ilita
tion
Pro
gram
; Ba
sin
5.2
an
d 6
.5
Impr
ovem
ents
to t
he c
olle
ctio
n sy
stem
, B
asin
5.2
and
6.5
to r
educ
e st
orm
wat
er in
flow
.
Pin
ole
has
fairl
y hi
gh in
flow
rat
es w
ithin
the
sew
er
colle
ctio
n sy
stem
res
ultin
gfr
om s
torm
wat
er in
flow
.
Tar
gete
dim
prov
emen
ts to
the
was
tew
ater
col
lect
ion
syst
emca
n re
duce
tre
atm
ent
cost
and
fre
e ca
paci
ty
for
expa
nded
use
s. S
tudi
es h
ave
alre
ady
targ
eted
se
vera
l are
as o
f th
e co
llect
ion
syst
em t
hat
war
rant
im
prov
emen
ts.
Est
imat
ed E
nd
Dat
e:
June
202
0
To
tal E
sti
ma
ted
Co
st:
Pla
nn
ing
an
d D
esig
n:
-$
E
ng
inee
rin
g a
nd
Ad
min
istr
ativ
e:30
,000
$
Co
nst
ruct
ion
:30
0,00
0$
Eq
uip
men
t:-
$
Co
nti
ng
ency
:20
,000
$
To
tal:
350,
000
$
Fu
nd
ing
So
urc
e:
Pri
or
FY
201
8-19
FY
201
9-20
FY
202
0-21
FY
202
1-22
FY
202
2-23
Act
ual
Pro
po
sed
Pro
po
sed
Pro
po
sed
Pro
po
sed
Pro
po
sed
Sew
er E
nte
rpri
se F
un
d-
500
-
-
$350
,000
-
-
-
To
tal
-
-
350,
000
-
-
-
I-13

Pro
ject
: P
ino
le-H
erc
ule
s W
ate
r P
ollu
tion
Co
ntr
ol P
lan
t U
pg
rad
e
Des
crip
tio
n:
Just
ific
atio
n:
Pro
ject
Nu
mb
er:
SS
1707
Pro
ject
ed T
imin
g:
Est
imat
ed S
tart
Dat
e:
May
201
6E
stim
ated
En
d D
ate:
Ju
ne 2
019
To
tal
Est
imat
ed C
ost
: *
Cit
y o
f P
ino
leC
apit
al I
mp
rove
men
t P
lan
Fis
ca
l Y
ea
rs 2
01
8-1
9 t
hro
ug
h 2
02
2-2
3
Com
plet
eup
grad
e to
the
Pin
ole
Her
cule
s W
ater
P
ollu
tion
Con
trol
Pla
nt.
The
upg
rade
is n
eces
sary
for
ope
ratio
nal
impr
ovem
ents
and
per
mit
com
plia
nce.
Pla
nn
ing
an
d D
esig
n:
2,85
1,78
9$
En
gr/
Ad
min
:4,
434,
535
$
C
on
stru
ctio
n:
43,1
43,0
00$
E
qu
ipm
ent:
-$
C
on
tin
gen
cy:
3,02
0,01
0$
To
tal:
53,4
49,3
34$
* 1
00 %
of
Pro
ject
Co
st s
ho
wn
, sp
lit e
qu
ally
wit
h t
he
Cit
y o
f H
ercu
les
Fu
nd
ing
So
urc
e:P
rio
rF
Y 2
018-
19F
Y 2
019-
20F
Y 2
020-
21F
Y 2
021-
22F
Y 2
022-
23A
ctu
alP
rop
ose
dP
rop
ose
dP
rop
ose
dP
rop
ose
dP
rop
ose
d
Sew
er P
lan
t E
xpan
sio
n -
503
$19,
182,
500
$7,5
42,1
67-
-
-
-
*
50
% P
ino
le p
ort
ion
on
ly
To
tal
$19,
182,
500
$7,5
42,1
67-
-
-
-
I-14
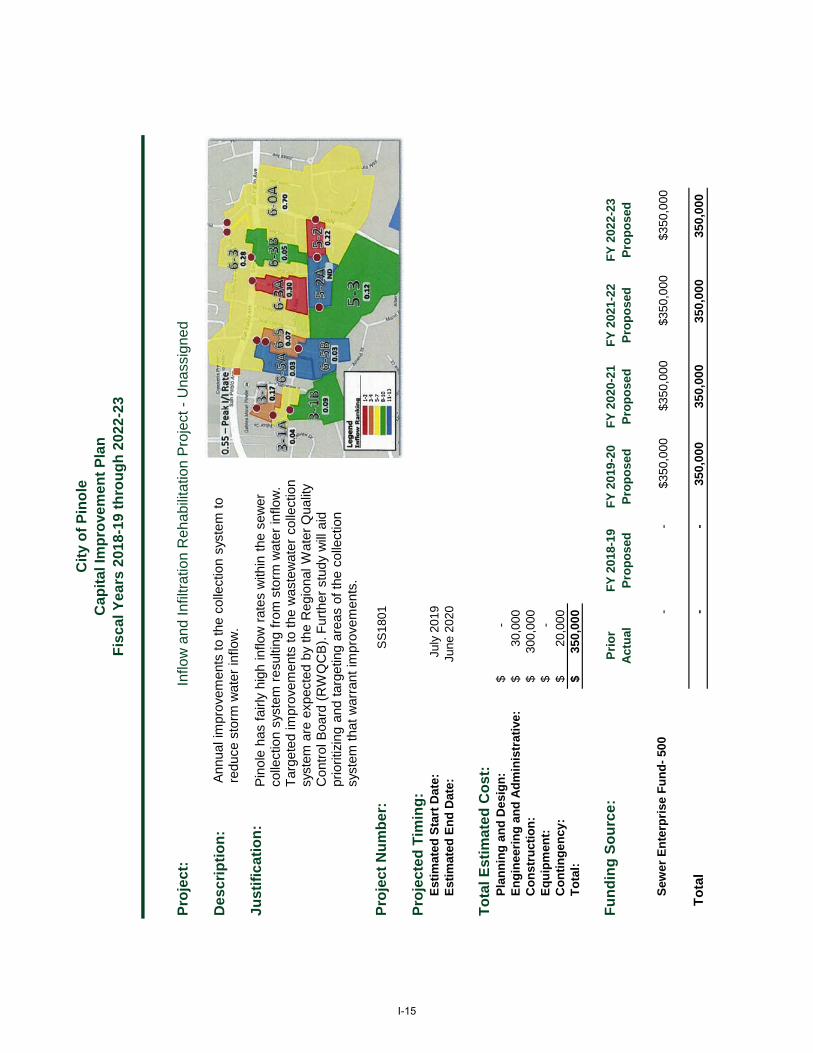
Pro
jec
t:
De
sc
rip
tio
n:
Ju
sti
fic
ati
on
:
Pro
jec
t N
um
be
r:S
S18
01
Pro
jec
ted
Tim
ing
:E
stim
ated
Sta
rt D
ate:
July
201
9E
stim
ated
En
dD
ate:
June
2020
Cit
y o
f P
ino
leC
ap
ita
l Im
pro
vem
en
t P
lan
Fis
ca
l Ye
ars
20
18
-19
th
rou
gh
20
22
-23
Inflo
w a
nd In
filtr
atio
n R
ehab
ilita
tion
Pro
ject
- U
nass
igne
d
Ann
ual i
mpr
ovem
ents
to t
he c
olle
ctio
n sy
stem
to
redu
ce s
torm
wat
er in
flow
.
Pin
ole
has
fairl
y hi
gh in
flow
rat
es w
ithin
the
sew
er
colle
ctio
n sy
stem
res
ultin
gfr
om s
torm
wat
er in
flow
.
Tar
gete
dim
prov
emen
ts to
the
was
tew
ater
col
lect
ion
syst
emar
e ex
pect
ed b
y th
e R
egio
nal W
ater
Qua
lity
Con
trol
Boa
rd (
RW
QC
B).
Fur
ther
stu
dy w
ill a
id
prio
ritiz
ing
and
targ
etin
g ar
eas
of th
e co
llect
ion
syst
em th
at w
arra
nt im
prov
emen
ts.
Est
imat
ed E
nd
Dat
e:
June
202
0
To
tal E
sti
ma
ted
Co
st:
Pla
nn
ing
an
d D
esig
n:
-$
E
ng
inee
rin
g a
nd
Ad
min
istr
ativ
e:30
,000
$
Co
nst
ruct
ion
:30
0,00
0$
Eq
uip
men
t:-
$
Co
nti
ng
ency
:20
,000
$
To
tal:
350,
000
$
Fu
nd
ing
So
urc
e:
Pri
or
FY
201
8-19
FY
201
9-20
FY
202
0-21
FY
202
1-22
FY
202
2-23
Act
ual
Pro
po
sed
Pro
po
sed
Pro
po
sed
Pro
po
sed
Pro
po
sed
Sew
er E
nte
rpri
se F
un
d-
500
-
-
$350
,000
$350
,000
$350
,000
$350
,000
To
tal
-
-
350,
000
35
0,00
0
350,
000
35
0,00
0
I-15

Pro
ject
:R
od
eo
Ou
tfa
ll P
roje
ct
Des
crip
tio
n:
Just
ific
atio
n:
Pro
ject
Nu
mb
er:
SS
1802
Pro
ject
ed T
imin
g:
Est
imat
ed S
tart
Dat
e:
July
201
8E
stim
ated
En
d D
ate:
June
201
9
Cit
y o
f P
ino
leC
apit
al I
mp
rove
men
t P
lan
Fis
ca
l Y
ea
rs 2
01
8-1
9 t
hro
ug
h 2
02
2-2
3
Rod
eo S
anita
tion
oper
ates
and
mai
ntai
ns a
dee
p w
ater
out
fall
whi
ch is
use
d by
Pin
ole-
Her
cule
s W
PC
P. T
he o
utfa
ll w
as r
ecen
tly in
spec
ted
as
requ
ired
by t
he f
acili
ty p
erm
it. T
he in
spec
tion
repo
rt s
tate
s th
is w
ork
is n
eede
d. T
here
is a
pre
-es
tabl
ishe
d co
st s
harin
g ag
reem
ent.
Rod
eoS
anita
tion
Dis
tric
t nee
ds t
o re
plac
e th
e ou
tfal
l val
ue,
clea
n th
e ou
tfal
l diff
user
s, a
nd r
esto
re
the
cath
odic
pro
tect
ion
syst
em.
To
tal
Est
imat
ed C
ost
:P
lan
nin
g a
nd
Des
ign
:10
,385
$
E
ng
inee
rin
g/A
dm
inis
trat
ive:
-$
Co
nst
ruct
ion
:83
,081
$
E
qu
ipm
ent:
-$
Co
nti
ng
ency
:10
,385
$
T
ota
l*:
103,
851
$
Fu
nd
ing
So
urc
e:P
rio
rF
Y 2
018-
19F
Y 2
019-
20F
Y 2
020-
21F
Y 2
021-
22F
Y 2
022-
23A
ctu
alP
rop
ose
dP
rop
ose
dP
rop
ose
dP
rop
ose
dP
rop
ose
d
Sew
er E
nte
rpri
se F
un
d-
500
-
$1
03,8
51-
-
-
-
-
-
-
-
-
-
To
tal
-
$1
03,8
51-
-
-
-
* T
ota
l co
st is
exp
ecte
d t
o b
e $2
40,0
00:
Sp
lit a
s fo
llow
s P
ino
le/H
ercu
les/
Ro
deo
- $
103,
851/
$79,
048/
$57,
101
I-16

Pro
jec
t:
De
sc
rip
tio
n:
Ju
sti
fic
ati
on
:
Pro
jec
t N
um
be
r:S
W17
02
Pro
jec
ted
Tim
ing
:E
stim
ated
Sta
rt D
ate:
2017
Est
imat
ed E
nd
Dat
e:
2020
Cit
y o
f P
ino
leC
ap
ita
l Im
pro
vem
en
t P
lan
Fis
ca
l Ye
ars
20
18
-19
th
rou
gh
20
22
-23
Sto
rm D
rain
age
Ann
ual R
ehab
ilita
tion
Reh
abili
tate
exis
ting
stor
mw
ater
col
lect
ion
syst
em
com
pone
nts
to p
erfo
rm to
cur
rent
sta
ndar
ds.
The
exi
stin
g sy
stem
does
not
con
tain
all
stor
mw
ater
ru
noff
. Los
ses
with
in t
he s
yste
m c
an le
ad t
o ot
her
mai
nten
ance
issu
es s
uch
as e
rodi
ng e
mba
nkm
ents
, an
d w
eake
ned
road
wa
ys.
Add
ition
ally
, as
per
the
new
m
unic
ipal
sto
rmw
ater
per
mit,
con
veya
nce
of li
tter
and
tras
h w
ithin
the
col
lect
ion
syst
em n
eeds
to
be r
educ
ed
subs
tant
ially
for
com
plia
nce.
To
tal E
sti
ma
ted
Co
st:
Pla
nn
ing
an
d D
esig
n:
En
gin
eeri
ng
an
d A
dm
inis
trat
ive:
75,0
00$
C
on
stru
ctio
n:
600,
000
$
E
qu
ipm
ent:
Co
nti
ng
ency
:75
,000
$
To
tal:
750,
000
$
Fu
nd
ing
So
urc
e:
Pri
or
FY
201
8-19
FY
201
9-20
FY
202
0-21
FY
202
1-22
FY
202
2-23
Act
ual
Pro
po
sed
Pro
po
sed
Pro
po
sed
Pro
po
sed
Pro
po
sed
Mea
sure
S 2
014
- 10
6$1
50,0
00$1
50,0
00$1
50,0
00$1
50,0
00$1
50,0
00
To
tal
-
$150
,000
$150
,000
$150
,000
$150
,000
$150
,000
I-17

Pro
ject
:
Des
crip
tio
n:
Just
ific
atio
n:
Pro
ject
Nu
mb
er:
SW
1703
Pro
ject
ed T
imin
g:
Est
imat
ed S
tart
Dat
e:20
16E
stim
ated
En
d D
ate:
20
17
Cit
y o
f P
ino
leC
apit
al I
mp
rove
men
t P
lan
Fis
ca
l Y
ea
rs 2
01
8-1
9 t
hro
ug
h 2
02
2-2
3
Sto
rm D
rain
ag
e M
ast
er
Pla
n
Pre
pare
a s
torm
dra
inag
em
aste
r pl
an
Pre
para
tion
of a
sto
rm d
rain
mas
ter
plan
will
pro
vide
an
anal
ysis
of
the
exis
ting
colle
ctio
n sy
stem
. The
pla
n w
ill
inde
ntify
sys
tem
def
icie
ncie
s re
late
d to
cap
acity
, fu
nctio
nalit
y, a
nd p
erm
it co
mpl
ianc
e. T
he p
lan
can
serv
e to
gui
de f
utur
e bu
dget
allo
catio
ns f
or
impr
ovem
ents
to t
he s
yste
m.
To
tal
Est
imat
ed C
ost
:P
lan
nin
g a
nd
Des
ign
:75
,000
$
E
ng
inee
rin
g a
nd
Ad
min
istr
ativ
e:-
$
Co
nst
ruct
ion
:-
$
Eq
uip
men
t:-
$
Co
nti
ng
ency
:-
$
To
tal:
75,0
00$
Fu
nd
ing
So
urc
e:P
rio
rF
Y 2
018-
19F
Y 2
019-
20F
Y 2
020-
2021
FY
202
1-20
22F
Y 2
022-
2023
Act
ual
Pro
po
sed
Pro
po
sed
Pro
po
sed
Pro
po
sed
Pro
po
sed
Mea
sure
S 2
014
- 10
6$7
5,00
0
To
tal
-
$7
5,00
0-
-
-
-
I-18

Pro
ject
:
Des
crip
tio
n:
Just
ific
atio
n:
Pro
ject
Nu
mb
er:
RO
1707
Pro
ject
ed T
imin
g:
Est
imat
ed S
tart
Dat
e:A
nnua
llyE
stim
ated
En
d D
ate:
A
nnua
lly
Tt
lE
tit
dC
t
Cit
y o
f P
ino
leC
apit
al I
mp
rove
men
t P
lan
Fis
cal
Yea
rs 2
018-
19 t
hro
ug
h 2
022-
23
Pav
emen
t M
aint
enan
ce a
nd R
ehab
ilita
tion
Pro
gram
Rou
tine
Roa
d M
aint
enan
celim
ited
to f
unds
ava
ilabl
e.
The
Pav
emen
t M
anag
emen
t R
epor
t co
mpl
eted
Jan
uary
201
6 pr
ovid
es a
Pav
emen
t C
ondi
tion
Inde
x (P
CI)
for
mos
t roa
ds w
ithin
P
inol
e of
70.
The
Rep
ort
help
s id
entif
y ro
ads,
tha
t be
caus
e of
th
eir
PC
I, s
houl
d re
ceiv
e pa
vem
ent
mai
nten
ance
or
reha
bilit
atio
n w
ith th
e in
tent
of
exte
ndin
g th
e us
eful
life
of t
he r
oad.
F
undi
ng
avai
labi
lity
is li
mite
d an
d in
suff
icie
nt t
o ad
equa
tely
mai
ntai
n th
e P
CI o
f the
ent
ire e
xist
ing
road
sys
tem
.
To
tal
Est
imat
ed C
ost
:P
lan
nin
g a
nd
Des
ign
:-
$
E
ng
inee
rin
g a
nd
Ad
min
istr
ativ
e:36
8,10
6$
C
on
stru
ctio
n:
4,04
9,17
0$
E
qu
ipm
ent:
-$
Co
nti
ng
ency
:18
4,05
3$
T
ota
l:4,
601,
329
$
Fu
nd
ing
So
urc
e:P
rio
rF
Y 2
018-
19F
Y 2
019-
20F
Y 2
020-
21F
Y 2
021-
22F
Y 2
022-
23A
ctu
alP
rop
ose
dP
rop
ose
dP
rop
ose
dP
rop
ose
dP
rop
ose
d
Cit
y S
tree
t Im
pro
vem
ents
- 3
25 *
$4,9
81$8
99,7
86$2
50,0
00$2
50,0
00$2
50,0
00$2
50,0
00
Art
eria
l S
tree
t R
ehab
- 3
77 *
$0$7
96,0
19$2
50,0
00$2
50,0
00$2
50,0
00$2
50,0
00
Gas
Tax
(R
MR
A/S
B1
Fu
nd
s) -
200
**
$0$4
20,9
77$3
15,1
00$3
15,1
00$3
15,1
00$3
15,1
00
To
tal
$4,9
81$2
,116
,782
$815
,100
$815
,100
$815
,100
$815
,100
** R
MR
A/S
B1
fund
ing
is e
stim
ated
pen
ding
con
firm
atio
n of
act
ual s
ourc
es a
vaila
ble.
P
roje
ct s
ize
will
be
adju
sted
to
mat
ch f
undi
ng a
vaila
ble.
* O
rigi
nal f
undi
ng s
ourc
e is
Mea
sure
S 2
014
I-19

Pro
jec
t:
De
sc
rip
tio
n:
Ju
sti
fic
ati
on
:
Pro
jec
t N
um
be
r:R
O17
08
Pro
jec
ted
Tim
ing
:E
stim
ated
Sta
rt D
ate:
2019
Est
imat
ed E
nd
Dat
e:
2020
Cit
y o
f P
ino
leC
ap
ita
l Im
pro
vem
en
t P
lan
Fis
ca
l Ye
ars
20
18
-19
th
rou
gh
20
22
-23
Pin
ole
Va
lley
Ro
ad
Imp
rove
me
nts
Impr
ovem
ents
onP
inol
e V
alle
y R
oad
at c
ompl
etio
n of
Pin
ole
Val
ley
Hig
h S
choo
l con
stru
ctio
n.
As
part
of
the
high
sch
ool c
onst
ruct
ion
proj
ect
WC
CU
SD
will
pro
vide
roa
d im
prov
emen
ts a
long
the
sc
hool
fro
ntag
e. I
mpr
ovem
ents
to P
inol
e V
alle
y R
oad
-fr
om S
hea
to G
rana
da -
will
ext
end
the
usef
ul
life
of th
e pa
vem
ent.
The
exi
stin
g pa
vem
ent
scor
e is
hi
gh in
thi
s ar
ea,
so a
slu
rry
seal
wou
ld b
e th
e re
com
men
ded
trea
tmen
t.
To
tal E
sti
ma
ted
Co
st:
Pla
nn
ing
an
d D
esig
n:
-$
E
ng
inee
rin
g a
nd
Ad
min
istr
ativ
e:5,
000
$
Co
nst
ruct
ion
:87
,000
$
Eq
uip
men
t:-
$
Co
nti
ng
ency
:8,
000
$
To
tal:
100,
000
$
Fu
nd
ing
So
urc
e:
Pri
or
FY
201
8-19
FY
201
9-20
FY
202
0-21
FY
202
1-22
FY
202
2-23
Act
ual
Pro
po
sed
Pro
po
sed
Pro
po
sed
Pro
po
sed
Pro
po
sed
Gas
Tax
- 2
00-
-
$1
00,0
00-
-
-
To
tal
-
-
$100
,000
-
-
-
I-20

Pro
ject
:
Des
crip
tio
n:
Just
ific
atio
n:
Pro
ject
Nu
mb
er:
RO
1710
Pro
ject
ed T
imin
g:
Est
imat
ed S
tart
Dat
e:20
17E
stim
ated
En
dD
ate:
Bey
ond
5ye
arte
rm
Cit
y o
f P
ino
leC
apit
al I
mp
rove
men
t P
lan
Fis
cal
Yea
rs
2018
-19
thro
ug
h 2
022-
23
San
Pab
lo A
venu
e B
ridge
ove
r B
NS
F R
ailro
ad
Rep
lace
San
Pab
lo A
venu
e B
ridge
( B
ridge
# 28
C00
62)
The
S
an P
ablo
Ave
nue
Brid
ge is
an
inte
gral
par
t of
the
ar
ea's
tran
spor
tatio
n sy
stem
. T
he a
ge o
f th
e br
idge
and
the
co
nditi
on a
sses
smen
t su
ppor
t re
plac
emen
t. F
urth
er, t
he
exis
ting
brid
ge d
oes
not
mee
t th
e cu
rren
t st
anda
rds
for
pede
stria
n ac
cess
. C
altr
ans
has
rece
ntly
pla
ced
the
Brid
ge in
the
ir fu
ndin
g pl
an a
nd w
ill p
rovi
de f
undi
ng f
or
88.5
% o
f the
rep
lace
men
t co
st. T
he t
otal
pro
ject
cos
t is
$1
6,76
6,80
0: S
tate
con
trib
utio
n w
ill b
e $1
4,84
3,64
8. T
his
proj
ect
is p
artia
lly f
unde
d by
the
CC
TA
TLC
Pro
gram
.
Est
imat
ed E
nd
Dat
e:
Bey
ond
5 ye
ar t
erm
To
tal
Est
imat
ed C
ost
:P
lan
nin
g a
nd
Des
ign
:45
,000
$
En
gin
eeri
ng
an
d A
dm
inis
trat
ive:
948,
000
$
Co
nst
ruct
ion
:15
,773
,800
$
E
qu
ipm
ent:
-$
Co
nti
ng
ency
:T
ota
l:16
,766
,800
$
Fu
nd
ing
So
urc
e:P
rio
rF
Y 2
018-
19F
Y 2
019-
20F
Y 2
020-
2021
FY
202
1-22
FY
202
2-23
Bey
on
dA
ctu
alP
rop
ose
dP
rop
ose
dP
rop
ose
dP
rop
ose
dP
rop
ose
dP
rop
ose
dC
ity
Str
eet
Imp
rove
men
ts -
325
*43
,247
-
-
-
-
-
$1,4
92,9
05
Sta
te C
on
trib
uti
on
-
87
9,10
3
-
-
-
-
$13,
964,
545
Mea
sure
J (
TL
C)
- 21
5 *
-
70
,650
-
-
-
-
$316
,350
To
tal
43,2
47
$949
,753
-
-
-
-
$1
5,77
3,80
0
* F
undi
ng in
the
am
ount
of
$267
,000
is e
xpec
ted
from
the
CC
TA
TLC
Pro
gram
.
I-21

Pro
jec
t:
De
sc
rip
tio
n:
Ju
sti
fic
ati
on
:
Pro
jec
t N
um
be
r:R
O17
14
Pro
jec
ted
Tim
ing
:E
stim
ated
Sta
rt D
ate:
2017
Est
imat
ed E
nd
Dat
e:
June
202
0
Tt
lEti
td
Ct
Cit
y o
f P
ino
leC
ap
ita
l Im
pro
vem
en
t P
lan
Fis
ca
l Ye
ars
20
18
-19
th
rou
gh
20
22
-23
HA
WK
at A
pp
ian
an
d M
arle
sta
Inst
all a
Hig
h-In
tens
ity A
ctiv
ate
d C
ross
Wal
k (H
AW
K)
Bea
con
The
inte
rsec
tion
of A
ppia
n an
d M
arle
sta
expe
rienc
es
high
tra
ffic
vol
umes
tha
t ca
n be
haz
ardo
usfo
r pe
dest
rians
. A
s a
resu
lt, a
HA
WK
, or
Hig
h In
tens
ity
Act
ivat
ed C
ross
Wal
k B
eaco
n , w
ill in
crea
se
pede
stria
n vi
sibi
lity
and
safe
ty.
Thi
s pr
ojec
t is
part
ially
fu
nded
by
the
CC
TA
TLC
Pro
gram
.
To
tal E
sti
ma
ted
Co
st:
Pla
nn
ing
an
d D
esig
n:
-$
En
gin
eeri
ng
an
d A
dm
inis
trat
ive:
15,6
00$
Co
nst
ruct
ion
:10
9,00
0$
E
qu
ipm
ent:
-$
Co
nti
ng
ency
:T
ota
l:12
4,60
0$
Fu
nd
ing
So
urc
e:
Pri
or
FY
201
8-19
FY
201
9-20
FY
202
0-20
21F
Y 2
021-
22F
Y 2
022-
23A
ctu
alP
rop
ose
dP
rop
ose
dP
rop
ose
dP
rop
ose
dP
rop
ose
d
Cit
y S
tree
t Im
pro
vem
ents
- 3
25 *
4,60
0
-
-
-
-
-
M
easu
re J
(T
LC
) -
215
*-
11,0
00
109,
000
-
-
-
To
tal
4,60
0
11,0
00
10
9,00
0
-
-
-
*
Fun
ded
$120
,000
by
the
CC
TA
TLC
Pro
gram
.
I-22

Pro
jec
t:
De
sc
rip
tio
n:
Ju
sti
fic
ati
on
:
Pro
jec
t N
um
be
r:R
O18
01
Pro
jec
ted
Tim
ing
:E
stim
ated
Sta
rt D
ate:
2020
Est
imat
ed E
nd
Dat
e:
2021
Cit
y o
f P
ino
leC
ap
ita
l Im
pro
ve
me
nt
Pla
nF
isc
al
Ye
ars
20
18
-19
th
rou
gh
20
22
-23
San
Pab
lo A
venu
e R
ehab
ilita
tion
Co
ld m
ill 2
1/2
inch
es
of
asph
alt c
oncr
etee
t pav
emen
t an
d re
plac
e w
ith n
ew H
MA
, rec
onst
ruct
~12
cur
b ra
mps
, rep
lace
d da
mag
ed s
idew
alk,
and
clo
se s
idw
alk
gap.
The
Pav
emen
t Man
agem
ent R
epor
t com
plet
ed J
anua
ry 2
016
prov
ides
a P
avem
ent C
ondi
tion
Inde
x (P
CI)
for
mos
t roa
ds
with
in P
inol
e of
70.
The
Rep
ort h
elps
art
eria
ls to
be
reha
bilit
ated
usi
ng th
e "F
ix it
Firs
t" a
ppro
ach.
Due
to t
he
impo
rtan
ce o
f San
Pab
lo A
venu
e as
an
arte
rial,
it is
des
irabl
e to
mai
ntai
n th
e P
CI a
t a m
inum
um o
f 70
.
To
tal
Est
imat
ed
Co
st:
Pla
nn
ing
an
d D
esig
n:
-$
En
gin
eeri
ng
an
d A
dm
inis
trat
ive:
-$
Co
nst
ruct
ion
:66
2,00
0$
E
qu
ipm
ent:
-$
Co
nti
ng
ency
:-
$
T
ota
l:66
2,00
0$
Fu
nd
ing
So
urc
e:
Pri
or
FY
201
8-19
FY
201
9-20
FY
202
0-21
FY
202
1-22
FY
202
2-23
Act
ual
Pro
po
sed
Pro
po
sed
Pro
po
sed
Pro
po
sed
Pro
po
sed
Cit
y S
tree
t Im
pro
vem
ents
- 3
25
-
-
-
$7
6,00
0-
-
M
easu
re J
(O
BA
G 2
) -
215
*-
-
-
$586
,000
-
-
To
tal
-
-
-
$6
62,0
00-
-
* F
unde
d $5
86,0
00 b
y th
e C
CT
A O
BA
G 2
Pro
gram
.
I-23

GLOSSARY OF BUDGET TERMS & ACRONYMS
Appropriation - An authorization by the City Council to make expenditures/expenses and to incur obligations for a specific purpose within a specific time frame. Assessed Valuation - A dollar value placed on real estate or other property by the County as a basis for levying property taxes. Assessments- Levies that pay for improvements directly benefiting their property. Audit - A view of the City's accounts by an independent auditing firm to substantiate fiscal year-end fund, salaries, reserves, and cash on hand. Beginning/Ending (Unappropriated) Fund Balance - Unencumbered resources available in a fund from the prior/current fiscal year after payment of the prior/current fiscal year's expenditures/expenses. This is not necessarily cash on hand. Bond - A City may raise capital by issuing a written promise to pay a specific sum of money, called the face value or principal amount, at a specific date or dates in the future, together with periodic interest at a special rate. There are two types of bonds: General Obligation and Revenue. Budget - A fiscal plan of financial operation listing an estimate of proposed applications or expenditures/expenses and the proposed means of financing them for a particular time period. The budget is proposed until it has been approved by the City Council. Capital Improvement - A permanent addition to the City's assets, including the design, construction, or purchase of land, buildings, or facilities, or major renovations of same. Capital Improvement Program - A financial plan of proposed capital improvement projects with single-and multiple-year capital expenditures/expenses. Capital Outlay - A budget appropriation category which budgets all equipment having an estimated useful life of over one year. City Manager's Transmittal Letter - A general discussion of the budget. The letter contains an explanation of principal budget items and summaries. CPI - Consumer Price Index; measure of inflation in an area of consumer products. Debt Service - Payment of the principal and interest on an obligation resulting from the issuance bonds, notes, or Certificates of Participation (COP's). Debt Service Requirements - The amount of money required to pay interest on outstanding debt and required contributions to accumulate monies for future retirement of term bonds.
J-1

GLOSSARY OF BUDGET TERMS & ACRONYMS
Deficit - An excess of expenditures or expenses over revenues (resources). Department - An organizational unit comprised of divisions. It is the basic unit of service responsibility encompassing a broad mandate of related activities. Depreciation- The cost allocation of tangible assets over the useful/economic life of the asset. Division - A sub-section (or activity) within a department, which furthers the objectives of the City by providing specific services or a product. Encumbrances - A legal obligation to pay funds, the expenditure/expense of which has not yet occurred. They cease to be encumbrances when the obligations are paid or otherwise terminated. Enterprise Fund - A type of fund established for the total costs of those governmental facilities and services which are operated in a manner similar to private enterprise. These programs are entirely or predominately self-supporting. Expenditure - The actual spending of Governmental Funds set aside by appropriation. Expense - The actual spending of Proprietary Funds (Enterprise and Internal Service Fund types) set aside by an appropriation. Fiscal Year - A twelve-month period of time to which a budget, forecast or reporting period applies. The City of Pinole fiscal year is July 1 through June 30. Fund - An independent fiscal and accounting entity used to record all financial transactions related to the specific purpose for which the fund was created. Fund Balance - The amount of financial resources available for use. Generally, this represents the detail of all the annual operating surpluses and deficits since the fund's inception. General Fund - The primary fund of the City used to account for all revenues and expenditures of the City not legally restricted as to use. This fund is used to offset the cost of the City's general operations. Examples of departments financed by the General Fund include the City Council, Police and others. General Obligation Bond - Bonds used for various purposes and repaid by the regular (usually via the General Fund) revenue raising powers of the City. Grant - Contributions, gifts of cash, or other assets from another governmental entity to be used or expended for a specific purpose, activity, or facility.
J-2

GLOSSARY OF BUDGET TERMS & ACRONYMS
Interfund Transfers - Monies transferred from one fund to another. Such money is transferred to finance the operations of another fund or to reimburse the fund for certain expenditures/expenses. Internal Service Fund - An Internal Service Fund provides services to other City departments and bills the various other funds for services rendered, just as would private business. ISF's are self-supporting and only the expense by an ISF is counted in budget totals. Major Fund – Governmental fund or enterprise fund reported as a separate column in the basic financial statements and subject to a separate opinion in the independent auditor’s report. Materials, Supplies, and Services - Expenditures/expenses for materials, supplies, and services which are ordinarily consumed within a fiscal year and which are not included in departmental inventories. Municipal Code - A book that contains the City Council approved ordinances currently in effect. The Code defines City policy with respect to areas such as planning, etc. Objectives - The expected results or achievements of a budget activity. Operating Budget - Annual appropriation of funds for on-going program costs, including salaries and benefits, services and supplies, debt service, capital outlay and capital improvements. Ordinance - A formal legislative enactment by the City Council. It has the full force and effect of law within City boundaries unless preempted by a higher form of law. An Ordinance has a higher legal standing than a Resolution. Projects – Long-term investments in public facilities and infrastructure; also known as capital improvements. The amount spent may overlap from year to year until the project is completed. Proprietary Funds- These include the enterprise (wastewater treatment and collection) and internal services (information technology and equipment reserve) funds. They are accounted for in a manner similar to businesses, measuring cost for services and including total assets and liabilities. Redevelopment Agency- A separate legal entity created to alleviate conditions of blight, build infrastructure and promote economic development. The Agency receives property tax revenue on assessed value growth within these areas called “tax increments” to repay Agency indebtedness. Redevelopment Successor Agency - Trust agency formed for the purpose of reporting close-out financial activities of the former Redevelopment Agency.
J-3

GLOSSARY OF BUDGET TERMS & ACRONYMS
Reimbursement - Payment of amount remitted on behalf of another party, department, or fund. Reserve - An account used to record a portion of the fund balance as legally segregated for a specific use. Resolution - A special order of the City Council which has a lower legal standing than an Ordinance. Return to Source Funds - Residual moneys from former Redevelopment Agency’s tax levy’s that are redistributed to the Cities after the Agency’s debt obligations have been paid off. These funds are non-restricted and are distributed by the State in January and July of every year. Revenues - Amount received for taxes, fees, permits, licenses, interest, intergovernmental sources, and other sources during the fiscal year. Revenue Bonds - A type of bonds usually issued to construct facilities. The bonds are repaid from the revenue produced by the operation of these facilities. Salaries and Benefits - A budget category which generally accounts for full-time and temporary employees, overtime expenses, and all employee benefits, such as medical, dental, and retirement. Special Revenue Funds - This fund type collects revenues that are restricted by the City, State, or Federal Government as to how the City might spend them. Unfunded Liability - Amount of future obligations not covered by assets currently set aside for that purpose, such as accrued vacation leave payable at termination or actuarial-determined future insurance claims. User Fees - Charges of a voluntary nature paid by persons receiving a service in exchange for the fee (such as recreation activities or wastewater service fees).
J-4

GLOSSARY OF BUDGET TERMS & ACRONYMS
ACRONYMS
ABAG Association of Bay Area Government CIP Capital Improvement Program CPI Consumer Price Index CSMFO California Society of Municipal Finance Officers EAP Employee Assistance Program FTE Full Time Equivalent GASB Governmental Accounting Standards Board GFOA Government Finance Officers Association HOPTR Homeowner’s Property Tax Rebates LAIF Local Agency Investment Fund LTD Long Term Disability NPDES National Pollution Discharge Elimination System PALC Pinole Assisted Living Community PERS Public Employees’ Retirement System PEPRA Public Employees’ Pension Reform Act [of 2013] PPEA Pinole Police Employees Association PRA Pinole Redevelopment Agency RDA Redevelopment Agency SAFER Staffing for Adequate Fire and Emergency Response SDI State Disability Insurance SRO School Resource Officer
J-5
GLOSSARY OF BUDGET TERMS & ACRONYMS
UBC Uniform Building Code VLF Vehicle License Fee WBCC West Bay Communications Center WCCTAC West Contra Costa Transportation Advisory Committee WCCUSD West Contra Costa Unified School District WPCP Wastewater Pollution Control Plant
J-6

CITY OF PINOLE
MULTI-YEAR POSITION LISTING
Department FY 2014-15 FY 2015-16 FY 2016-17 FY 2017-18 FY 2018-19CITY MANAGERCity Manager 1.00 1.00 1.00 1.00 1.00Total Full-Time Equivalents (FTEs) 1.00 1.00 1.00 1.00 1.00CITY CLERKCity Clerk 1.00 1.00 1.00 1.00 1.00Administrative Secretary, part-tme 0.00 0.46 0.46 0.46 0.46Total Full-Time Equivalents (FTEs) 1.00 1.46 1.46 1.46 1.46FINANCE DEPARTMENTFinance Director 1.00 1.00 1.00 1.00 1.00Accounting Specialist 2.00 2.00 2.00 2.00 2.00Accounting Technician, part-time 0.00 0.00 0.00 0.00 0.48Accounting Intern, part-time/temporary 0.40 0.48 0.48 0.48 0.00Total Full-Time Equivalents (FTEs) 3.40 3.48 3.48 3.48 3.48HUMAN RESOURCESAssistant City Manager 1.00 1.00 1.00 1.00 1.00Human Resources Specialist 1.00 1.00 1.00 1.00 1.00Total Full-Time Equivalents (FTEs) 2.00 2.00 2.00 2.00 2.00GENERAL GOVERNMENTManagement Analyst 0.00 0.48 0.48 1.00 1.00Administrative Secretary, part-tme 0.46 0.00 0.00 0.00 0.00Total Full-Time Equivalents (FTEs) 0.46 0.48 0.48 1.00 1.00INFORMATION SYSTEMSInformation Systems Administrator 1.00 1.00 1.00 0.00 0.00Total Full-Time Equivalents (FTEs) 1.00 1.00 1.00 0.00 0.00CABLE ACCESS TVCable Access Coordinator 0.90 1.00 1.00 1.00 1.00Cable Access Technician 0.90 1.00 1.00 1.00 1.00Cable Equipment Operators 0.44 0.75 0.75 0.75 0.75Total Full-Time Equivalents (FTEs) 2.24 2.75 2.75 2.75 2.75POLICE DEPARTMENTSWORNPolice Chief 1.00 1.00 1.00 1.00 1.00Police Commander 1.00 1.00 1.00 0.00 0.00Police Lieutenant 0.00 0.00 0.00 2.00 2.00Police Sergeant 6.00 6.00 6.00 6.00 6.00Police Officer 19.00 19.00 19.00 19.00 19.00Sub-total Sworn 27.00 27.00 27.00 28.00 28.00
NON-SWORNAdministrative Secretary 1.00 1.00 1.00 1.00 1.00Community Safety Specialist 0.92 0.96 0.96 0.96 0.96Community Service Officer 0.00 0.96 0.96 0.96 0.96Crossing Guards, part-time/temporary 0.50 0.50 0.50 0.50 0.50Dispatcher 7.00 7.00 7.00 11.00 11.00Police Property Specialist 1.00 1.00 1.00 1.00 1.00Records & Property Specialist 2.00 2.00 2.00 2.00 2.00Supprt Services Manager 1.00 1.00 1.00 0.00 0.00Sub-total Non-Sworn 13.42 14.42 14.42 17.42 17.42Total Full-Time Equivalents (FTEs) 40.42 41.42 41.42 45.42 45.42
J-7

CITY OF PINOLE
MULTI-YEAR POSITION LISTING
Department FY 2014-15 FY 2015-16 FY 2016-17 FY 2017-18 FY 2018-19FIRE DEPARTMENTSWORNFire Chief 1.00 1.00 1.00 1.00 1.00Administrative Battalion Chief 0.00 1.00 1.00 0.00 0.00Battalion Chief 1.00 1.00 1.00 1.00 1.00Fire Captain 3.00 3.00 3.00 3.00 3.00Fire Engineer 1.00 1.00 1.00 1.00 1.00Fire Engineer/Paramedic 3.00 2.00 2.00 2.00 2.00Fire Fighter/Paramedic 5.00 3.00 3.00 3.00 3.00Fire Fighter 6.00 3.00 3.00 3.00 3.00Sub-total Sworn 20.00 15.00 15.00 14.00 14.00
NON-SWORNAdministrative Secretary 0.48 0.48 0.48 0.48 0.48Sub-total Non-Sworn 0.48 0.48 0.48 0.48 0.48Total Full-Time Equivalents (FTEs) 20.48 15.48 15.48 14.48 14.48PUBLIC WORKSDevelopment Services Director/City Engineer 1.00 1.00 1.00 1.00 1.00Management Analyst, part-time/temporary 0.48 0.00 0.00 0.00 0.00Project Manager 0.00 1.00 1.00 1.00 1.00Public Works Specialist 1.00 1.00 1.00 1.00 1.00Administrative Secretary 1.50 1.00 1.00 1.00 1.00Public Works Manager 1.00 1.00 1.00 1.00 1.00Public Works Maintenance Supervisor 2.00 2.00 2.00 2.00 2.00Maintenance Workers 5.00 5.00 6.00 6.00 6.00Senior Maintenance Worker 1.00 1.00 1.00 1.00 1.00Treatment Plant Manager 1.00 1.00 1.00 1.00 1.00Water Pollution Control Plant Supervisor 1.00 1.00 1.00 0.00 0.00Water Pollution Control Plant Operation Supervisor 0.00 0.00 0.00 1.00 1.00Environmental Analyst 1.00 1.00 1.00 1.00 1.00Environmental Assistant 1.00 1.00 1.00 1.00 1.00Operator 6.00 6.00 5.00 5.00 5.00Maintenance Mechanic 0.00 0.00 1.00 1.00 1.00Water Pollution Control Plant Intern 0.46 0.46 0.46 0.46 0.46Park Caretaker 0.25 0.25 0.25 0.25 0.25Total Full-Time Equivalents (FTEs) 23.69 23.71 24.71 24.71 24.71COMMUNITY DEVELOPMENTPlanning Manager 1.00 1.00 1.00 1.00 1.00Senior Building Inspector 0.00 0.00 0.00 1.00 1.00Building Inspector/Code Enforcement 0.00 0.00 0.00 1.00 1.00Building Inspector 1.00 1.00 1.00 0.00 0.00Permit Technician 0.90 0.95 1.48 1.48 1.48Total Full-Time Equivalents (FTEs) 2.90 2.95 3.48 4.48 4.48RECREATION DEPARTMENTRecreation Manager 1.00 1.00 1.00 1.00 1.00Gym Rental Attendant, part-time/regular 0.45 0.45 0.00 0.00 0.00Recreation Coordinator 2.70 2.70 2.60 2.60 2.60Senior Recreation Leader 1.50 1.50 1.50 1.50 1.50Recreation Leader 3.88 3.88 2.88 2.88 2.88Tiny Tots Recreation Leader 1.38 1.10 1.13 1.13 1.13Cook, part-time/regular 0.75 0.75 0.75 0.75 0.75Rental Facility Custodian, part-time/temporary 1.65 1.65 1.65 1.65 1.65Total Full-Time Equivalents (FTEs) 13.31 13.03 11.51 11.50 11.50
GRAND TOTAL ALL DEPARTMENTS 111.90 108.76 108.77 112.28 112.28
J-8

ADOPTED BUDGETFY 2018-19
LABOR COST ALLOCATIONS
J-9
Position Title Total Wages and Benefits General Fund
Sewer Enterprise (WWTP)
Sewer Enterprise (Corp Yard)
Successor Agency
Housing Admin
Gas Tax Fund
Building Fund
Measure "S-2006"
Measure "S-2014" PSAF SLESF
Storm Water
Refuse Mgmt
Measure "J" Total
Council Members (5) 96,995 72,746 - 24,249 - - - - - - - - - - 96,995 City Manager 349,092 136,146 17,455 87,273 73,309 17,455 - 17,455 - - - - - - 349,092 City Clerk 195,034 154,077 - - 40,957 - - - - - - - - - 195,034 Treasurer 14,563 10,922 - 3,641 - - - - - - - - - - 14,563 Finance Director 270,707 159,717 40,606 - 56,848 13,535 - - - - - - - - 270,707 Accounting Specialist (2) 227,710 193,554 34,157 - - - - - - - - - - - 227,710 Accounting Technician 26,820 22,797 4,023 - - - - - - - - - - - 26,820 Assistant City Manager 301,676 193,073 30,168 - 63,352 15,084 - - - - - - - - 301,676 HR Specialist 102,998 87,548 10,300 - - 5,150 - - - - - - - - 102,998 Police Officer (Canine) 151,477 136,679 - - - - - - - - 14,798 - - - 151,477 Police Officer 157,782 72,580 - - - - - - - - 85,202 - - - 157,782 Police Officer 159,326 7,966 - 151,360 - 159,326 PW Director/City Eng 279,892 13,995 139,946 13,995 - - 27,989 27,989 - - - 27,989 27,989 - 279,892 PW Specialist 122,180 24,436 - 30,545 - - 18,327 24,436 - - - 12,218 12,218 - 122,180 Admin Secretary 116,894 11,689 29,224 58,447 - - 17,534 - - - - - - - 116,894 Public Works Manager 171,365 85,683 - 34,273 - - 8,568 - - - - 34,273 8,568 - 171,365 PW Maint. Supervisor 145,904 65,657 - 36,476 - - 7,295 - - - - 29,181 7,295 - 145,904 Maintenance Workers (4) 398,567 119,570 - 79,713 - - 39,857 - - - - 79,713 19,928 59,785 398,567 Maintenance Worker (1) 97,592 - - - - - - - - 97,592 - - - - 97,592 PW Maint. Supervisor 122,837 - - 92,128 - - 6,142 - - - - 12,284 6,142 6,142 122,837 Maintenance Workers (2) 187,342 - - 140,507 - - 9,367 - - - - 18,734 9,367 9,367 187,342 Planning Manager 197,856 9,893 - - - 9,893 - 178,070 - - - - - - 197,856 Building Inspector/Code Enf office 127,391 63,696 - - - - - 63,696 - - - - - - - 127,391 Project Manager 112,473 - - 28,118 - - - - - 56,237 - - - 28,118 112,473 Battalion Chief 264,557 145,506 - - - - - - 119,051 - - - - - 264,557
- 4,399,030$ 1,787,929$ 305,877$ 629,364$ 234,467$ 61,116$ 135,079$ 311,646$ 119,051$ 153,829$ 151,360$ 100,000$ 214,392$ 91,508$ 103,412$ 4,399,030$
PERCENTAGE OF TOTAL 41% 7% 14% 5% 1% 3% 7% 3% 3% 3% 2% 5% 2% 2% 100%
General Fund Special
Revenue Sewer
Enterprise Successor
Agency Measure S 1,787,929 1,017,154$ 935,241$ 234,467$ 153,829$
100-221 100-222 100-223 100-342 100-343 100-345 209-554 209-555 Total Police Chief 250,525 27,836 278,361 Lieutenant 176,645 44,161 220,806 Recreation Leaders (Seasonal) 11,543 25,692 37,235 Maintenance Workers (4) 23,914 47,828 47,828 119,570

ADOPTED BUDGETFY 2018-19
LABOR COST ALLOCATION PERCENTAGES
J-10
Position Title Total Wages and Benefits
General Fund*
Sewer Enterprise (WWTP)
Sewer Enterprise
(Corp Yard) Successor
Agency Housing Admin
Gas Tax Fund
Building Fund
Measure "S-2006"
Measure "S-2014" PSAF SLESF
Storm Water
Refuse Mgmt
Measure "J" Total
Council Members (5) 96,995 75% 25% 100%City Manager 349,092 39% 5% 25% 21% 5% 5% 100%City Clerk 195,034 79% 21% 100%Treasurer 14,563 75% 25% 100%Finance Director 270,707 59% 15% 21% 5% 100%Accounting Specialist (2) 227,710 85% 15% 100%Accounting Technician 26,820 85% 15% 100%Assistant City Manager 301,676 64% 10% 21% 5% 100%HR Specialist 102,998 85% 10% 5% 100%Police Officer (Canine) 151,477 90% 10% 100%Police Officer 157,782 46% 54% 100%Police Officer 159,326 5% 95% 100%PW Director/City Eng 279,892 5% 50% 5% 10% 10% 10% 10% 100%PW Specialist 122,180 20% 25% 15% 20% 10% 10% 100%Admin Secretary 116,894 10% 25% 50% 15% 100%Public Works Manager 171,365 50% 20% 5% 20% 5% 100%PW Maint. Supervisor 145,904 45% 25% 5% 20% 5% 100%Maintenance Workers (4) 398,567 30% 20% 10% 20% 5% 15% 100%Maintenance Worker (1) 97,592 0% 100% 100%PW Maint. Supervisor 122,837 0% 75% 5% 10% 5% 5% 100%Maintenance Workers (2) 187,342 0% 75% 5% 10% 5% 5% 100%Planning Manager 197,856 5% 5% 90% 100%Building Inspector/Code Enf Offic 127,391 50% 50% 100%Project Manager 112,473 0% 25% 50% 25% 100%Battalion Chief 264,557 55% 45% 100%
- 4,399,030$ 41% 7% 14% 5% 1% 3% 7% 3% 3% 3% 2% 5% 2% 2% 100%
100-0221 100-0222 100-0223 100-0342 100-0343 100-0351 209-0595 209-0592 Total Police Chief 90% 10% 100%Lieutenant 80% 20% 100%Recreation Leaders (Seasonal) 31% 69% 100%Maintenance Workers (4) 6% 12% 12% 30%

J-11

J-12

J-13

J-14

J-15