ANNUAL BUDGET - For the Fiscal Year July 1, 2016
441
-
Upload
khangminh22 -
Category
Documents
-
view
0 -
download
0
Transcript of ANNUAL BUDGET - For the Fiscal Year July 1, 2016


HOLLAND CITY COUNCIL
Prepared in accordance with Chapter 9, Section 9.4 through 9.5 of the Charter of the City of Holland
and State of Michigan Public Act 2 of 1968, as amended through Public Act 493 of 2000
CITY OF HOLLAND, MICHIGAN
ANNUAL BUDGET
For the Fiscal Year
July 1, 2016 - June 30, 2017
Nancy De BoerWayne KlomparensQuincy ByrdMyron TretheweyJay PetersBrian BurchBrian LynnTodd WhitemanDavid Hoekstra
MayorCouncil Member, At LargeCouncil Member, At LargeCouncil Member, First WardCouncil Member, Second WardCouncil Member, Third WardCouncil Member, Fourth WardCouncil Member, Fifth WardCouncil Member, Sixth Ward

TABLE OF CONTENTS
CITY OF HOLLAND ANNUAL BUDGET
FISCAL YEAR 2017
MANAGEMENT INTRODUCTION & FINANCIAL OVERVIEW Organization Vision and Mission / Work and Action Plan Process 2
City Manager's Budget Message 6
Attachments A through E of Budget Message 19
Organizational Chart 31
Community Profile 32
Population Trends and Demographics 34
History of the City 37
Trends of Significant Revenues 41
Financial Policies and Guidelines 47
Annual Budget Resolution 50
PROPERTY TAXES Average Property Tax Distribution 53
2016 (FY2017) Property Taxable Valuation Roll Delineated by Property Classification 54
2016 (FY2017) Property Taxable Valuation Roll by School District and County 55
2016 (FY2017) Property Taxable Valuation Roll Delineated by Property Type 56
Brownfield Redevelopment Authority Tax Increment Financing Plans 61
Property Tax Rate and Levy 64
Property Assessment Rolls Expressed as Taxable Valuations 65
1% Property Tax Administration Fee 66
Downtown Development Authority (DDA) Property Assessment Roll, Tax Rate & Tax Levy 67
Assessments by Percentage and Class 68
Millage Rate History - City of Holland 70
Supplemental Information - Ten Largest Taxpayers 72
FUND SUMMARIES Budget Fund Structure 74
Department/Fund Relationship 75
Fund Descriptions 76
Funds by Type with Adopted Appropriations 85
Revenue and Expenditure Summaries - Governmental Funds 86
Fund Equity Estimates - Governmental Funds 88
Revenue, Expenditure and Fund Equity Estimates - Component Units 89
Revenue and Expense Summaries - Proprietary Funds 90
Fund Equity Estimates - Proprietary Funds 92
Working Capital Estimates - Proprietary Funds 94
Reserve Estimates - Proprietary Funds 95
Summary of Sources and Applications Across All Fund Types 96
Financing Sources, Uses & Fund Equity Across All Funds 100
3-Year Financial Summary - Governmental and Component Unit Funds 102
3-Year Financial Summary - Enterprise Funds 105
3-Year Financial Summary - Internal Service Funds 106
GENERAL FUND SUMMARY Fund Summary 108
Funding Sources 110
Funding Uses 114

TABLE OF CONTENTS
CITY OF HOLLAND ANNUAL BUDGET
FISCAL YEAR 2017
GROUPS Summary of All Groups 120
MANAGEMENT & ADMINISTRATION Introduction 123
Group Summary 125
City Council 126
City Manager 129
Elections/Voter Registration 135
City Attorney 138
City Clerk 140
Human Resources 143
Volunteer Services 146
Human Relations Commission 149
Contingencies 159
Cable TV Public Access Fund 161
FISCAL SERVICES Introduction 163
Group Summary 165
Finance 166
Independent Audit 169
Assessing 171
Treasurer 173
Insurance - Unallocated 174
Transfers to Other Funds 176
Budget Stabilization 177
Revolving Cash Assistance Fund 178
Specified Donations Fund 179
City Hall Employees Benefit Fund 180
PUBLIC SAFETY Introduction 181
Group Summary 183
Public Safety 184
Police Criminal Justice Training Fund 190
Police Employees Benefit Fund 191
Fire Vehicle and Equipment Pool Fund 192

TABLE OF CONTENTS
CITY OF HOLLAND ANNUAL BUDGET
FISCAL YEAR 2017
TRANSPORTATION Introduction 193
Group Summary 195
Streets Division 197
Management/Engineering 199
MVH Major Streets Fund 201
MVH Local Streets Fund 202
Allegan County Road Tax Fund 203
Ottawa County Road Tax Fund 204
Street Improvements Reserve Fund 205
Downtown Snowmelt Operating Fund 207
Depot Operations Fund 209
Municipal Airport Facilities & Management Fund 210
Public Transit Facilities & Management Fund 212
Transportation Employees Benefit Fund 213
Centralized Vehicle/Equipment Fund 214
COMMUNITY & NEIGHBORHOOD SERVICES Introduction 217
Group Summary 219
City Hall & Grounds 220
Planning & Zoning 223
Environmental Health & Inspections 226
Construction Inspections 229
Social Services 232
Housing & Neighborhoods 233
Economic Development Assistance 236
8th Street Market 239
Downtown Parking System Fund 241
Downtown Development Authority Fund (Component Unit) 244
Downtown Principal Shopping District Fund 247
Dangerous Structures Fund 250
Solid Waste Recycling Fund 253
Brownfield Redevelopment Authority Fund (Component Unit) 256
PARKS & RECREATION Introduction 259
Group Summary 261
Cemeteries 265
Parks & Recreation Administration 267
Recreation 268
Parks 270
DeGraaf Nature Center 272
Cultural Activities Assistance 275
Civic Center 276
Cemetery Perpetual Care Fund 278
Herrick District Library Taxation Fund 279
Windmill Island Gardens Fund 280

TABLE OF CONTENTS
CITY OF HOLLAND ANNUAL BUDGET
FISCAL YEAR 2017
PARKS & RECREATION cont. Park & Cemetery Employees Benefit Fund 284
Holland Historical Trust Fund (Component Unit) 285
UTILITY FUNDS Board of Public Works:
Introduction 288
Group Summary 290
Electric Fund 291
Wastewater Fund 295
Water Fund 299
INTERNAL SERVICES FUNDS Introduction 303
Group Summary 305
Technology Services Fund 306
Fuel Dispensing Fund 310
Postage Services Fund 312
Communications Services Fund 315
Compensated Absences Fund 316
Risk Management Summary 318
Employee Workers Compensation Insurance Fund 321
Employee Disability Insurance Fund 322
Employee Health and Dental Insurance Fund 323
Vehicle Insurance Fund 324
Property Insurance Fund 325
Liability Insurance Fund 326
CAPITAL PROJECTS Introduction 327
Group Summary 330
Municipal Capital Improvements Fund 331
Street Capital Projects Fund 340
Sidewalk Improvements Capital Projects Fund 347
Utilities 5-Year Capital Improvement Program 348

TABLE OF CONTENTS
CITY OF HOLLAND ANNUAL BUDGET
FISCAL YEAR 2017
APPENDICES
Appendix A - Personnel
Full-Time Employee Trends 357
Part-Time Employee Trends 360
Fulll-Time Summary by Department 361
Full-Time Summary by Service Group and Fund 362
Part-Time Summary by Department 364
Part-Time Summary by Service Group and Fund 365
Detail of Approved Positions by Group 367
Appendix B - Capital Outlay
Capital Outlay by Group:
Management & Administration 395
Public Safety 396
Transportation 397
Parks & Recreation 398
Board of Public Works Utilities 399
Internal Services 402
Capital Outlay - Controlled Type Items 403
Appendix C - Debt Service
Legal Debt Limitation and Margin 408
Debt Service Funds - Across All LTGO Bond Issues 410
Debt Service - Taxation & Cash Control 411
Debt Service - Building Authority Construction Bonds 412
Debt Service - Special Assessment Bonds (Summary of Outstanding Issues) 413
Debt Service - Energy Performance Bonds 417
Detail of Remaining Debt Requirements 418
Appendix D - Glossary of Terms 429

> ORGANIZATION MISSION / WORK PLAN PROCESS
> CITY MANAGER'S BUDGET MESSAGE
> ORGANIZATIONAL CHART
> COMMUNITY PROFILE
> POPULATION TRENDS
> DEMOGRAPHICS
> HISTORY
> TRENDS OF SIGNIFICANT REVENUES
> GUIDE TO THE BUDGET PROCESS AND FINANCIAL POLICIES
> ANNUAL BUDGET RESOLUTION
BUDGET OVERVIEW
INTRODUCTORY
-1-

Organizational Vision and Mission Statements In 2006, the City Council developed a vision statement.
Vision Statement A vibrant, world class community in a beautiful lakefront environment where people work together celebrate community and realize dreams.
Mission Statement Maximize Livability.
Belief Statement As employees of the City of Holland, we will . . .
Maintain respect for each other and the public. Foster a progressive environment where employees are strongly encouraged to
reach their full potential. Perform each responsibility with pride and integrity. Continually improve channels of communications both internally and externally. Encourage participation by all in the development and improvement of services. Strive for excellence and satisfaction in public services. Recognize our strengths and weakness and how we can learn from them. Build upon our diversity and experiences as we prepare for the future.
-2-

OVERALL COUNCIL STRATEGIES, GOALS AND ACTION PLANS
To implement the City’s Vision and Mission, the City Council developed seven (7) strategies and related goals as follows. Budget Action Plans were subsequently developed in the body of this document that follows to be specific, measurable, attainable, realistic and timely (SMART) and related to the Council overall Strategies and the FY 17 priorities. These Strategies are supplemented with the highest priority goals set by the City Council on February 17, 2016 below. See the underlined words for new goals.
STRATEGY I: ECONOMIC DEVELOPMENT AND TRANSPORTATION: A. Provide the infrastructure necessary to support the City’s economic development mission,
including an emphasis on safety, cost-effectiveness and complete streets multi-modal transportation.
B. Quality streets and sidewalks are a pre-condition for quality neighborhoods. Quality neighborhoods are a pre-condition for a world-class community. Quality infrastructure is a pre-condition for industrial development. Industrial development is a pre-condition for community financial stability.
C. Foster an environment that supports the retention and growth of industrial businesses. Foster an environment that supports the retention and growth of commercial businesses, including on an attractive waterfront.
D. Utilize the incentives available to the City to retain and attract business. E. Work with area organizations on providing a quality workforce for area employers. F. Reduce the tax burden.
STRATEGY II: AREA COOPERATION: A. Collaborate with other area organizations in order to provide a region that is strong and
dynamic. B. Look for opportunities to create efficiency and economies of scale through collaboration
and regionalization.
STRATEGY III: NEIGHBORHOODS: A. Develop mixed income neighborhoods that are a synergistic for people, activities, facilities,
and investment. B. Target no more than 30% of the housing stock to be rentals on any given block. C. Encourage green space and leisure opportunities within or near all neighborhoods. D. Ensure all housing and all greenspace in all neighborhoods is attractive and well-maintained. E. Ensure all neighborhoods are well served by police, fire and medical emergency responders.
-3-

STRATEGY IV: COMMUNITY AND FAMILY: A. Develop/support social and cultural institutions, programs, and activities that provide a safe,
healthy, and productive environment. B. Focus on issues that are important to senior citizens. C. Support the achievement of a strong and diverse community-wide public and private
educational system that establishes Holland as the “community of choice” with excellence and academic options at all levels.
D. Promote personal and community health.
STRATEGY V: PUBLIC UTILITIES: A. Provide the right stuff, in right place, for the right value (electric, water, sewer, fiber optic,
electric heat, energy optimization and conservation.)
B. Foster regional cooperation on the provision of utility services to ensure efficient and
adequate resources.
C. Maintain local control and a Holland citizen-focus in the administration of the utility
operation.
D. Provide public utilities in an aesthetically sensitive manner, striving for a perceived invisibility of services.
E. Evaluate the benefits of renewable energy sources to sustaining long-term energy
alternatives.
STRATEGY VI: PUBLIC SPACES: A. Ensure that all public spaces and facilities are inviting, cost-efficient, up-to-date, and well-
maintained. B. Emphasize environmental stewardship in the construction, maintenance and efficient
operation of all public spaces. C. Support efforts to preserve natural areas, protect natural wildlife and their habitats and
introduce further landscaping.
STRATEGY VII: ORGANIZATION: A. Support a culture of continuous innovation. B. Support the team.
-4-

ANNUAL ACTION PLAN PROCESS
Annually the City Council holds a “Coffee with City Council” open to the entire community so citizens can express their issues, programs, and needs for the community. The City Council also holds an annual retreat with the City Manager and all department directors at which time the management staff presents to the City Council their top issues and programs facing the City. The updated City Council Strategies and Goals are then used by the City Manager and the Departmental Leadership Team to develop individual Action Plans for the relevant fiscal year.
-5-

-6-

Executive Summary 1. Bottom Lines for FY 17
The recommended FY 17 budget is balanced with a General Fund contribution to surplus of ($8,408) while maintaining a modest fund balance – assuming no use of the General Fund for snowmelt on 9th Street. The year will end with $3.4 million in fund balance, which is the equivalent to 16% of annual expenditures. The annual inflationary rate established by the State of Michigan through Proposal A for all property was only 0.3% this year. In other words, if there were no change in ownership or major improvements made, residential property owners would only see a 0.3% increase in their City taxes. The City’s overall growth well-exceeded this average. The City’s property tax revenues attributed to real property grew at a rate that exceeded inflation, due to new development and redevelopment. Real property taxable value growth is estimated to be approximately 3.8%.
Personal Property experienced a large decrease this year, due to changes in State Law regarding how personal property is reported and valued. When including the personal property, the overall taxable value decreased 7.47% for 2016-17. This budget assumes full replacement revenue as provided by state statute for loss of the personal property taxable value. (This replacement will be via an Essential Services Assessment. MCL 211.1051 thru MCL 211.1061. This calculation enables a $978,804 addition to General Fund revenues.) Total General Fund revenues are down 2.5%, nevertheless given the vagaries of accounting needed to properly reflect the new unfunded pension obligation payments coming from the one-time borrow last year. These total revenues include state statutory revenue sharing, the $5.85 million of ownership dividends from Holland Board of Public Works (HBPW), and the new growth in taxable value mentioned above. The one-time unfunded pension liability action in FY 16 enabled the City’s overall operating costs to decrease as well (down by 2.8%) due to the closed group pension payments now being made from the one-time borrowed funding. I recommend that this same approach be taken for addressing the unfunded liability of the public safety defined benefit plans in the next few years also. Replacement Positions and Operating Improvements The recommended budget includes three (3) replacement positions and one vacancy for a net of 2.0 new full-time equivalents. Given the cutbacks of the last decade and consistent with the 2016 Retreat discussions, there is a need to strategically fund replacement positions. The General Fund budget includes $157,728 of new recommended funding for the increase in full time equivalents (FTE). (Note: The vacancy is the former Personal Property Appraiser position.)
1. A Lead Streets Supervisor (replacement for a retirement four (4) years ago); 2. A Geographic Information System position (replacement for a transfer ten (10) years ago); 3. A Recreation Programmer (replacement for a reduction in force five (5) years ago); and 4. Leave the Personal Property Appraiser position vacant due to new leadership and changes in
personal property tax assessments.
Management of our buildings and facilities will also be centralized under the Parks and Recreation Director in FY 17 given the successful pilot project of transferring the former City Hall custodian and the use of the Parks and Recreation team to assist in facility oversight last year. Succession planning in several departments to be discussed throughout the budget review is an emerging goal in the context of a Staffing Study. The City Council’s goal of a $60,000 Staffing Study was approved with new revenue expected from a potential land sale (still pending). Major Capital Projects It is important for the City to reinvest in its basic infrastructure again. Major projects recommended are street projects on 6.8 miles of roadway, including the 9th Street Reconstruction; the Greenhouse Replacement project ($250,000 in FY 17); the Civic Center Place Renovations and Construction
-7-

($11 million in FY 17); Windmill Island Gardens Path and Bridge Connection ($787,000 in FY 17); and Windmill Island Gardens replacement water line ($410,000). (The extent of the 9th Street snowmelt capital investments will be reviewed further once unit bid prices are known at the time of our budget review sessions.)
2. FY 17 Budget Sources and Uses for the Future The total budget sources and uses are $210,907,182. This is a balanced budget, yet $21,372,452 of various fund balances are recommended. These funds will primarily support numerous capital improvement projects, yet several will balance operating budgets. The General City operations account for $60,709,076 in sources, excluding use of fund balances, and $68,683,416 in uses. The City’s HBPW utility funds account for $128,825,654 in sources excluding use of fund balances, and $142,223,766 in uses. The City continues to pay down $21 million in infrastructure debt spanning the last decade for road and building projects. A significant reduction of 0.55 mills was paid off in FY 14 from accumulated reserves. The entire remaining amount of approximately 2.2198 mills could come off by FY 23. This millage is proposed to be re-directed to capital reinvestments as it is paid off as per the Reinvestment Task Force discussed at the February 2014 Retreat. The City Council increased the millage by 0.1585 in 2012 to preserve two Firefighter positions while long-term alternative, fire safety cost measures were researched. Given the completion of the Public Safety Service Delivery Study of 2013, a minimum level of 18 firefighters was accepted by the City Council on March 20, 2013. This FY 17 Budget continues to re-direct these funds to replacement fire station (s) instead (later increased by 0.1 mills for a total of 0.2585 mills). After the above funding priorities are addressed, any remaining debt service funds could be considered for a regional Recreation Center (3-Gym) at Smallenburg Park to be organized between now and then without increasing the tax rate. See Attachment C for a “What If” scenario at that time. A. FY 17 Tax Rate The operating millage dropped to 8.3494 mills due to payback of the closed group pension unfunded liability with the sale of bonds. The debt service levy increased a corresponding amount. The new distribution of the tax rate is indicated below:
A review of City tax rates in comparable communities in West Michigan is shown in Attachment D. Holland is ranked 15th highest out of 52, i.e. in the bottom one–third of Michigan mid-size communities. This is slightly higher over last year when we were 10th out of 43 due to three new communities being listed. Out of seven
PROPERTY TAX LEVY MILLAGE RATES CITY OF HOLLAND FY 12 FY 13 FY 14 FY 15 FY16 FY 17 Percent
Change Operating Levies: General 9.5089 9.6585 9.6585 9.5000 9.5000 8.3494 -12.11% Total Operating 9.5089 9.6585 9.6585 9.5000 9.5000 8.3494 -12.11% Capital Levies: Property Acquisition 0.0000 0.0000 0.0000 0.0000 0.000 0.0000 0.000 Street Improvement Projects 1.0000 1.0000 1.0000 1.3669 1.4268 1.4268 0.000 Sidewalk Improve. Projects 0.0500 0.0500 0.0500 .0500 0.0500 .0500 0.000 Municipal Capital Projects 0.2004 0.1343 0.2360 .2459 0.318 .057 - 81.777 Fire Station Funds (MCIF) 0.2585 0.2585 .2585 0.000 Total Capital 1.2504 1.1843 1.2860 1.9213 2.0533 1.7923 -12.71 Debt Service Levies: Fire Station Reinvestment Fund General Obligation Debt 2.1277 2.8936 2.8069 2.3400 2.2198 3.629 63.48 Total City of Holland 12.8870 13.7364 13.7514 13.7613 13.7731 13.7707 0.00 HERRICK DISTRICT LIBRARY Operation Levy 1.1000 1.1000 1.1000 1.1000 1.1000 1.1000 0.000 Debt Service Levy * 0.1630 0.1721 0.1571 0.1472 0.1362 .1386 0.017 Total Herrick District Library 1.2634 1.2721 1.2571 1.2472 1.2362 1.2386 0.018 Airport Authority * 0.1000 0.1000 0.1000 0.1000 0.0992 0.0992 0.000 TOTAL MILLAGE RATES 14.2500 15.1085 15.1085 15.1085 15.1085 15.1085 0.000 * May be adjusted before final approval of budget.
-8-

communities that are lower in West Michigan, three (3) have a local option income tax (Muskegon, Grand Rapids and Walker).
3. Council Goals for FY 17 This year’s budget is based on a refreshed list of City Council Strategies, Goals and Action Plans. The City Council created the following goal priorities at your Retreat on January 30, 2016 and was subsequently approved for further action/policy steps at your February 17, 2016 meeting. Action Plans were created to address each priority as reported later in this Budget Message. The full set of strategies with these new Action Plans is shown in Attachment A to this message:
SPECIFIC, MEASURABLE, ATTAINABLE, REALISTIC AND TIMELY (SMART) February 2017
Rank 2016 City Council Priorities Votes 1 Create a path to begin to achieve fiber internet access to neighborhoods (after HBPW Pilot program and after review of the
Business Case and by the creation of priorities, perhaps down Pine or in the Smart Zone) 11
2 Eliminate barriers to new development and re-development by reviewing ways to reduce requirements (review Historic District Commission Guidelines), streamline reviews (reduce the number of steps or boards), provide a clear path to success (one-stop shopping and form-based code approaches), provide incentives (like Neighborhood Enterprise Zone tax reductions), and/or streamlining this permitting (for Partners for Renewal, for example)
9
3 Create the budget to be within the annual taxable value increases and reduce the tax burden over time by eliminating the 0.7 capital debt and 0.15 fire station millage increases from 2012/2013
8
4 Add a water feature for Downtown public areas, parks and/or at Civic Center Place (splash pads) 5
5 Add restaurant and indoor/outdoor concert venue at Windmill Island Gardens as part of the Interpretive and Landscape Plan steps in the Business Plan
5
6 Work with MDOT to make the US 31 Corridor From 8th to 32nd more pedestrian friendly and more aesthetically pleasing and budget the City's share
5
7 Add language to City ordinances and policies to protect LGBT community against discrimination in housing, employment and accommodation
5
8 Create and plan for a beautiful, world -class waterfront with public access by water 4
9 Create a Dog Park at Window on the Waterfront or at Van Raalte Farm 4
10 Consider zoning revisions for "Air BNB" (short-term vacation rentals) in the (R-TRN) zones (Downtown neighborhoods) 4
11 Increase community knowledge of City activities by billboards, message boards, Facebook networks, churches, links, mobile apps, photo survey of visual preferences and by otherwise leveraging technology
3
12 Create a Downtown ice rink in relation to Civic Center Place, potentially an ice skating pathway 3
This budget therefore includes the following Action Plans (in the same order as above):
1. A report from the Holland Board of Public Works on Broadband Fiber on March 30, 2016 recommends a long-term plan to provide 1 gigabyte service capability to every residence. A $25,000 contribution to assist in potential planning is included in this budget. The City Council agreed on a cost share with the Holland Board of Public Works for initial engineering. The parties concur to try to install fiber in Downtown in the next 12 months.
2. A plan to conduct lean engineering on development projects to eliminate barriers via an interdisciplinary staff development team is included in the Community and Neighborhood Services Action Plan (No budgetary impact);
3. No operating tax changes. Capital costs include deferred maintenance projects (like the Civic Center,
the replacement Greenhouse at $250,000 in FY 17, and Baseline Fix It first projects for Parks. Other projects are either supported by grant funding (Windmill Island Garden path/bridge) or are former Council priorities (signage, dog parks, street ends on Lake Macatawa, etc.);
4. A small water feature is included for the Civic Center Place project (part of the site plan improvements in the $11 million plan);
-9-

5. Funding for an Interpretative Plan at Windmill Island Gardens that could eventually lead to landscaping and business planning for a concert venue and restaurant at Windmill Island Gardens is included for $15,000;
6. US-31 pedestrian improvements. No extra action proposed at this time other than the recent changes
at 16th Street and proposed changes at 8th Street;
7. LGBT rights. No extra action proposed at this time, other than continued general education on discrimination;
8. Waterfront public access. Initiatives to realize joint ownership are pending and will be supported by $25,000 when realized in the Municipal Capital Improvement Fund;
9. Dog Park. A Van Raalte Dog Park area is being worked on by the Parks and Recreation Board and is
supported by $25,000 in the Municipal Capital Improvement Fund;
10. Short-Term Rentals. Zoning changes are being studied and developed. No budgetary impact;
11. Increase community messaging in various forms is supported by re-filling the Public Information Coordinator’s position and $90,000 of signage that would include an electronic message board at the Civic Center Place in a way that captures passing traffic on 7th and Pine; and
12. A downtown ice rink. This is listed as an optional item in fund raising for the Civic Center Place Project
($590,000).
4. Financial Summaries for FY 17
A. City Overview
In addition to the above summarized statements on the Council Goals and key statements below, the Departmental Action Plans appear in the individual departmental sections that are explained later in this budget. The largest operating changes in FY 17 address staffing improvements. The most important changes that increase or decrease costs are listed below:
a. Strategically replace positions in FY 17 ($236,460 impact; $157,728 in the General Fund); b. Provide for a potential 8% increase in health insurance; c. Plan on 75% of the expected utility savings from the City building deep energy retrofits ($64,000
savings); d. Reduce street light costs due to converting the existing 250 watt street lights to lower energy use
107 watt LED’s ($45,000 savings); e. Add $25,000 to resolve retirement issues in public safety via arbitration services; f. Increase the Holland Historic Trust Funding by $11,000 from $89,000 to $100,000; g. Maintain funding for Project Clarity contract with a flat financial contribution of $30,000, as well as
in-kind tree planting efforts and other efforts worth $30,000, for a total value to Project Clarity of $60,000;
h. Use the Municipal Capital Improvement fund balance to pay for a long-needed water line replacement to Windmill Island Gardens at the same time as the pathway installation along the causeway ($410,000 water line and $787,000 pathway/bridge); and
i. Use the new state street funds to re-establish the 20-year cycle for addressing street resurfacing and reconstruction. (The Central Park area will be resurfaced in FY 17 as well as State Street from Michigan to 32nd Street, and 9th Street reconstruction for a total of 6.8 miles. South Shore is planned for FY 18).
Note: 39,093 additional square foot of new snowmelt distribution on 9th Street and College Avenue is included.
-10-

B. City General Fund for FY 17 The operating millage is reduced consistent with the closed group pension payoff (8.3494 mills). The reserves remain in good shape ($3,442,930) – no use of reserves for snowmelt is recommended until the unit prices on the bids are known. The total General Fund Revenue is recommended at $21,212,062; this is a 2.5% reduction from the budget in FY 16 of $21,763,424. General Fund expenditures declined to $21,203,654 or 2.8% from FY 16 budget of $21,805,283 given the closed group unfunded pension reduction last year. A surplus of $8,408 is projected as of June 30, 2016. An estimated fund balance of $3,442,930 represents 16.2% of FY 17 recommended expenditures (15% is the auditor’s recommended minimum). In addition, the Budget Stabilization Fund for the General Fund is estimated to end the year at $916,213 compared to its former high point of $1,016,820 in FY 10. This fund traditionally addresses unforeseen losses created by appeals to the Michigan Tax Tribunal. The purpose of the Budget Stabilization Fund is to assist in weathering these types of financial situations as per Sec. 2-110 (c) of the City Ordinance regulating this fund. The Budget Stabilization ordinance states: to prevent a reduction in the level of public services or in the number of employees when; in preparing the budget for the next fiscal year, the City’s estimated revenue does not appear sufficient to cover estimated expenses. An operating transfer of $115,000 from the Cable Television (CATV) Fund will be made to the General Fund in FY 17. This compares to $115,000 in FY 16, $126,900 in FY 15; and $100,000 in FY 14. Another key variable is the dividend from the Holland Board of Public Works each year. $5,850,000 for FY 17. Again this year, 0.25% or $255,000 is reserved to be transferred to the Holland Energy Fund to address the Community Energy Plan’s continued implementation.
C. City Outside Agencies The Holland Historic Trust requested increased funding from $89,000 last year to $100,000. Some of the Community Development Block Grant (CDBG) funding was shifted from funding Neighborhood Connectors to low income assistance. A comparable change to enable less General Fund contributions to the Neighborhood Improvement program was done instead.
FY 12 Request
Agencies Funding Category FY 12 FY 13 FY 14 FY 15 FY 16 FY 17
$160,750 17 Social Services $97,000 $0 $0 $0 $0 $40,000*
$124,080 15 Cultural Activities (4th of July Fireworks)
$73,600 $8,045 $8,045 $8,200 $8200 $8,200
$235,239 1 Holland Historical Trust $235,239 $117,600 $89,000 $250,000 $89,000 $100,000
$47,000 1 Economic Dev. – Lakeshore Advantage
$47,000 $47,000 $50,000 $50,000 $75,000 $50,000
$85,940 9 CDBG – Outside Agencies
$56,250 $48,500 $50,000 $52,200 $30,000* $0
$653,009 43 Total $509,089 $221,145 $197,045 $360,400 $202,200 $198,200
*Both of these changes are related to funding Neighborhood Connectors, yet the accounting has been changed from CBDG funding to using HBPW dividend funds.
FUND
HBPW FY 11 5.5%
HBPW FY 12 5.5%
HBPW FY 13 5.5%
HBPW FY 14 5.5%
HBPW FY 15 5.5%
HBPW FY 15 (5.5%)
HBPW FY 16
(ADOPTED: 5.75%)
HBPW FY 17
(ADOPTED: 5.75%
GEN FUND $3,195,400 $3,950,000 $4,351,200 $4,590,804 $4,694,000 $4,904,000 $4,952,000 $5,195,000 MCIF* $603,800 $357,040 $300,000 $400,000 $400,000 $440,000 $400,000 $400,000 HEF** 0 0 0 0 0 0 $183,000 $255,000 TOTAL $3,799,200 $4,307,040 $4,651,200 $4,990,800 $5,094,000 $5,344,000 $5,535,000 $5,850,000 *Municipal Capital Improvement Fund ** Holland Energy Fund
-11-

D. Summary of Overall City Fiscal Health for FY 17
The table below summarizes the long-term financial goal for major reserves and capital funds, as well as indicating progress being made, given the improved revenues and expenditure controls. All Funds are operating as intended in a financially sustainable manner and will end the year as planned. These numbers demonstrate fiscal stability.
E. Holland Board of Public Works Budgets for FY 17 (Adapted from presentation by David Koster, General Manager, to the Holland Board of Public Works on March 14, 2016.)
In accordance with the Holland City Charter, and in accordance with best business practices, the Holland Board of Public works (HBPW) develops and submits an annual budget for inclusion with the General City Budget each fiscal year. The Holland Board of Public Works Board approved a $5.85 million dividend distribution to the City, on March 14, 2015 of which 0.25% ($255,000) is due to be slated by the City Council to be placed into the Holland Energy Fund. The electric, water and wastewater budgets include proposed rate adjustments (between 2.2 % and 4.3% increases). (Note: The proposed rate adjustments do not have a separate rate increase component for the pension bond obligations. Previously, the pension obligation was included in operating expenses. Those amounts are now being used to reduce the bond obligation since the fall of 2015.) The broadband/fiber optics rates remain the same. Sixty-one (61%) of the annual operating expenses are related to the cost of fuel and purchased power for the electric utility. Future generation needs are planned to be met with the new gas-fired combined cycle facility planned to be online February 2017. The planning for this unit has positioned the utility to handle the capital cost and the debt requirement with minimal impact on ratepayers. Currently the plan is a 2.2% increase in FY 17. The four-year projection estimates modest annual increases for FY 2018 - FY 2021 of between 1.8% and 2.4%. For the water utility, the capital investment in replacing aging distribution infrastructure remains a large cash demand. The capital budget for water mains replacement for FY 17 is approximately $2.3 million. The water unit growth is expected to be flat. Although cash position is improving, meeting all capital and debt obligations requires
Fund Transfer Highest Point &
Year
Actual Balances at 6/30/11
Actual Balances at 6/30/12
Actual Balances at 6/30/13
Actual Balances At 6/30/14
Actual Balance
at 6/30/15
Estimated Balance
At 6/30/16
Estimated Balance
at 6/30/17
Dashboard
Budget Stabilization Fund
$1,872,659 in 2003
$ -0-
$720,877
$917,936
$983,286
$981,213
$966,213
$916,213
↔
MCIF*
$1,400,000 in 2004
$657,796
$352,386
$1,644,036 $657,004 $1,123,914 $4,860,497 $2,097,786 ↓
Extra Streets Fund Transfers from General Revenues
$ -0- $ -0- $ -0- $100,000 $100,000 * $169,000 $ -0- $0 ↔
Legacy Funds
NA NA NA NA $1,327,926 $1,099,175 $1,259,942 $857,942 ↓
General Fund
$4,042,039 $3,129,046 $3,684,340 $4,239,773 $3,704,073 $3,988,315 $3,414,522 $3,442,930 ↔
*Municipal Capital Improvement Fund
-12-

planned rate increases. Currently the plan is a 2.5% increase in FY 17 with similar rate increases in the next four years. The wastewater utility continues to implement the well planned and much needed lift station improvements as well as addressing sewer main reliability with continued relining projects. The biosolids handling and the oxygen optimization projects are continuing during FY 17. The majority of these two large capital projects were funded through a $19 million bond issue. Estimated completion is October 2017. The rate requirements to meet the ongoing capital needs and the debt obligations are 4.3% increase for FY 17, then average rate increases of 3.0% for the next four years. The following are other highlights of the proposed budget:
1. The electric utility reflects operating revenues of $107,740,361 with a projected net income of $20,983,562.
2. The water utility reflects operating revenues of $9,272,234 with a projected net income of $2,738,676. 3. The wastewater utility reflects operating revenues of $10,862,683 with a projected net income of
$978,390. 4. Fuel and purchased power is anticipated to be $47,422,205 which is approximately 61% of total electric
operating expenses and represents 45.5% of combined total expenses for all utilities. 5. The contribution to the City is proposed to be $5,850,000, 5.75% of calendar year 2015 actual sales
revenue from the electric utility. 6. Wages and benefits represent 16.2% of combined total expense budget which is slightly higher than the
previous year. 7. The capital budget cash outlay for FY 17 is projected to be $51,265,219 with a related multiple year total
project cost of $282,780,166. See attachment for details including large projects and improvements for each utility with $228,884,766 representing anticipated capital budget for the gas fired combined cycle generating unit and $4,000,000 for the snowmelt lines and upgrades.
Various electric production related repairs $647,500 Distribution upgrades and replacements $7,910,000 Broadband improvements and extensions $506,000 Water Treatment Plant capital improvements $664,630 Water distribution improvements $3,090,000 Wastewater Treatment Plant capital improvements $2,043,900 Wastewater collection improvements $2,585,000 Administrative Capital for all utilities combined $527,400
Summary: FY 17 Proposed
Revenues Expenses Net Income
Electric Utility $108,255,365 $87,271,803 $20,983,562
Water $9,412,363 $6,673,687 $2,738,676
Wastewater $11,157,926 $10,179,537 $978,389
Total
$128,825,654
$104,125,027
$24,700,627
Revenues include all operating revenues (sales) as well as fees, grant revenue, assessments and interest income. Expenses include all operating expenses, transfers and non-capitalized interest on debt. See http://www.hollandbpw.com/images/Board_Packets/20150312Packet2.pdf for additional highlights of the proposed budget.
-13-

5. Capital Action Plan Summaries for FY 17
A. Municipal Capital Improvement Program: (The three major categories for capital projects
are due to Council Goals, Infrastructure/Deferred Maintenance or Strategic Planning.)
The primary new Council Goals are to include funding for broadband fiber planning, a water feature at Civic Center Place, planning funds for an indoor/outdoor venue at Windmill Island Gardens, waterfront planning, a dog park and ice skate rink planning. Former funding priorities for wayfinding signage are included as well. The primary Infrastructure/deferred maintenance items budgeted include the Civic Center Place (up to $16.5; $8.5 million tax payers); Greenhouse replacement with a Grow House ($250,000 for two fiscal years); Windmill Island Gardens water line ($410,000); Van Raalte barn structural improvements for $120,000; Centennial Park and Kollen Park rail painting ($60,000); City Hall carpet/chairs/blinds/security ($50,000) and Downtown Broadcast System ($50,000). The primary Strategic plan capital goals include an overlap with the above deferred maintenance items and include street end improvements ($25,000), Parks and Recreation ($75,000 for a fix-it first approach), and tree planting ($50,000), for example. The Fix-it First approach pertains to miscellaneous deferred patching, ball field repairs, playground equipment, vandalism, signage, etc. The intent is to fix large capital maintenance problems in our Parks and Recreation facilities as soon as recognized rather than waiting for a new budget cycle.
B. Capital Equipment
The Central Equipment FY 17 budget includes $808,100 for equipment and vehicle replacement. Revenue budgeted from sale of old vehicles and equipment is $96,500 for a net of $711,600.The equipment reserve balance by June 2017 is estimated at $300,000. It is important this balance be maintained to assure there are adequate funds available in the future to replace equipment and vehicles on schedule. The above includes a purchase of a junior wing plow at a net cost change of $80,000. These wing plows will enable an eventual staff reduction of two employees through attrition as per the proposed Strategic Plan. A 15-passenger van is also budgeted for $35,000 for use by DeGraaf and to loan out to other departments. Other major expenditures continue to include the annual fire truck replacement contribution of $100,000.
6. Highlights of Departmental and Non-General Fund Action Plans
1. Management and Administration: Funding for the Michigan Municipal League conference on
Mackinac Island is planned ($6,000); Holland Youth Connections and EPIC interns in the City Manager’s Office ($4,600); third year of funding for the Sustainability Institute ($15,000 or $2,500 more); a $5,000 increase in the contingency for a possible true-up of the Holland City Manager’s compensation in relation to Holland-area communities; funding for the International Institute Municipal Clerks and the National Clerk Conference so as to obtain Certified and Masters Certification ($4,200); upgrade the required election equipment ($5,250); implementation of an Ad Hoc committee to increase voter participation and turnout for all elections; implementation of a Safety Program Contract with the Holland Board of Public Works ($15,000); activation of a Crisis Response Team, an increase in Human Relations/International Relations to assist in more community-wide training, as well as to send four International Relations Commissioners to Queretaro to reinvigorate this international exchange ($8,080). A $63,800 utility savings is planned from the Energy Performance Contract implementation planned to be completed in FY 17. Further savings are expected in FY 18. These savings are guaranteed by Schneider Electric given the Energy Service Company (ESCO) approach.
2. Fiscal Services: Assessing services will be provided with one less full-time person via use of two
summer interns and management efficiencies (net $61,100 savings). Civic Center Place financing will need to be secured for approximately $11 million, implementation of the Holland Energy Fund processes,
-14-

and an upgrade of security at City Hall will be accomplished.
3. Public Safety: The budget includes no material change yet maintains a $100,000 fire truck fund contribution, a four-officer WEMET service in the face of declining grant funding, a four-officer Community Policing services, and a three-strong K-9 officer program. $5,000 is included to implement the enhanced VHF county-wide radio system and $4,000 for replacement safety vests is budgeted. A $25,000 line item is included in the Human Resources line item for up to two arbitration settlements of the labor contracts.
4. Transportation: Replacement of a four-year vacancy in the former Lead Streets Supervisor is included (approximately $60,000) to provide more oversight to permitted right-of-way work, more supervision of street crews and more flexibility to distribute supervisory work load (snow and ice removal supervision). Design for the reconstruction of South Shore Drive for construction in summer of 2017 is expected as well as funds to reconfigure fire suppression system in airport tunnel ($20,000).
5. Community and Neighborhood Services: Neighborhood Connections funding is removed from the CDBG funding stream and placed into the General Fund ($40,000); the Assistant Director’s position is eliminated in return for funding four (4) new Coordinator position promotions, a full-time building inspector, a part-time Home Energy Retrofit Administrator and transfer of the City Hall maintenance staff to Parks and Recreation as part of a new Facility team for a total budget reduction of $9,875. (The City Council supported funding and completing a Staffing Study before fully executing these plans.)
6. Although the Principal Shopping District (PSD), the Downtown Development Authority, and Parking Fund are under control of the Downtown Director, they appear in Community and Neighborhood Services category since this description is more representative of their functional contributions to Holland. The PSD budget is balanced due to conservative measures on new revenue, cost cutting, and a vacancy of the former Downtown Director’s position, while still investing in new parking technology ($25,000) and innovation training ($2,000). The actual training cost is $12,000 and assumes a scholarship of $10,000 or so. Major maintenance is needed downtown within the next ten years. A Tax Increment Financing District is recommended to accrue the funding needed to refresh the streetscape. More parking management is needed as soon as possible. A parking study is underway and may recommend a computerized tracking system from fund balance, as well as increased enforcement, to manage reduced employee parking in prime parking spaces. The details will be recommended to the City Council in FY 17. (A vacancy in the Downtown Director’s position will lead to mid-year budget adjustments and a potential Administrative Plan amendment.)
7. Parks and Recreation: Replacement of a former Recreation Program Assistant by upgrading a part-time position to full-time is recommended (net $27,000); Project Clarity contributions of $60,000 are continued as adjusted downward by $30,000 of tree plantings for a total of $30,000—same as last year; a new 15-passenger van will increase lease rates by $4,000. Increased sponsorship opportunities for the Holland Recreation programs and events will be secured ($15,000); a park development plan for Lakeview School Park will be developed with joint funding from Laketown Township officials ($5,000).
8. Technology Services: A Storage Area Network will be created to improve computing speed, efficiency and reliability across all applications. Storage will be converted from local disk on servers to a distributed environment. This is the last major investment in our information technology infrastructure following the IP scheme, Network, Wireless, Phone and Server Virtualization efforts of the last several years. These efforts will allow the city to make smaller yearly incremental investments to maintain our infrastructure into the future. ($90,000) Total transfers from the Cable Access Television Fund are budgeted at $235,000, or $59,500 less when compared to $294,500 last year (the new phone system was included last year). The Cable Access Television fund will gain $40,193 in Fund Balance.
-15-

7. Snowmelt Fund A 35% increase in revenue is needed for FY 17 as well as $840,000 of new funding if the complete 9th Street build-out is to happen. This extra assessment and funding is primarily needed to cover the extra cost for the new transmission line and distribution beyond Central Avenue. (The assessment would go from 0.39 per square foot to 0.50 per square foot for a 28% direct change. Overall revenue should climb by 35%, however, given the new users on the system). The cost to extend transmission beyond Central Avenue to serve snowmelt in the new area to be developed west of Central to the Civic Center is estimated at $840,000 (assumes no distribution costs initially). Some of the overall transmission costs ($500,000) could logically be recovered from a tax increment financing assessment on the new growth west of River and some of this could come from assessments over time through a higher than 28% increase next calendar year. If extra funding of $840,000 came from the General Fund, it would reduce the General Fund balance to approximately $2.6 million, or 12% of the City’s annual operating revenues. This would create potential weakness in the City’s financial position according to auditing norms (a minimum of 15% of reserves is recommended). The City Council concluded to use year-end fund balance surpluses expected and/or reduce the interest exposure by conversation with BPW and by potential use of Qualified Environmental Conservation Bonds. Better alternatives are listed below:
1. Use the existing fund balances in other City funds via an internal borrow and pay back over time -- as long as the General Fund maintains a 15% minimum and work with HBPW on long-term funding scenarios. (This was the option chosen by the City Council);
2. Extend the term for the transmission cost borrowing with the Holland Board of Public Works to thirty years at 4% and pass on the difference in cost to the users. (The special assessment might go from 0.39 per square foot to 0.60 per square foot, for example. This would amount to a 54% increase per square foot;
3. Do not build any transmission from Central west. This would save $840,000 and then wait for actual unit pricing from the bids and provide for any differences from a budget adjustment transfer from the General Fund (expected to be known by mid-April).
A second problem is the need to give good information to the snowmelt users ahead of the formal snowmelt process in September. The Downtown staff is planning a series of snowmelt information sessions to ensure there are no surprises regarding the 28% increase in rates and what other changes will be seen on snowmelt (flushing, valve replacement, etc.) via Downtown coffees, special open houses, special postings, etc. See Attachment E to better understand the snowmelt transmission and distribution costs. Assuming the 35% overall revenue increase (28% rate increase) in revenue is approved after the public information sessions and formal special assessment process in September of 2016, the FY 17 annual operating snowmelt budget is recommended to be $242,667, with revenues of $323,824 and $81,157 of fund balance after the above costs are taken into account. The fund balance by June 2017 is estimated at $84,576.
8. Holland Energy Fund
The City and the Holland Board of Public Works is in the fourth year of a four-decade long Community Energy Plan to increase generation, business and residential user efficiencies in ways that have the potential to reduce per capita carbon consumption to 10 metric tons per person as compared to the average of 24 metric tons if no coordinated actions were made.
To this end, the City and Holland Board of Public Works are working to implement the plan via creation of a Holland Energy Fund in FY 16. Projects for FY 17 are listed below:
-16-

1. On-bill financing legislation was achieved for use in residential energy retrofits and may involve statewide coordination with the Governor’s Michigan Saves initiative. Launch is planned for October with $80,000 expended in the current fiscal year and an amount to be determined in FY 17. A potential loan of $3,000,000 from the HBPW to the Holland Energy Fund is being discussed.
2. Home Energy Retrofit Program: This program is recommended to be incentivized while working in concert with on-bill financing for up to $200,000 in $3,000 apiece grant amounts to each eligible and participating homeowner to overcome barriers to deep energy retrofits via likely assistance with asbestos removal, wiring upgrades, lead paint abatement, etc.
3. District heat: As the budget goes to press, it appears that the Civic Center could be the first pilot project for District Energy (inclusive of a heat pump to provide both heat and cooling transfer) subject to the funding discussions for snowmelt transmission under 9th Street. Newer buildings on the snowmelt transmission system are more likely to get connected than existing buildings from a payback point of view. Up to $11,000,000 of Qualified Energy Conservation Bonding for the Civic Center Place project is being requested so as to reduce interest costs by $3 million over twenty years. The amount of savings from using District Energy is estimated to be 37% in the new Civic Center building compared to traditional heating. (No district heat will be pursued should Council decide to not fund snowmelt westward expansion on 9th Street at Central or River Avenues. This cost/benefit policy judgement will be up to Council once bid prices are known regarding snowmelt.)
9. Community Development Block Grant (CDBG) Program A change this year is to not use Community Development Block Grant funding for the Neighborhood Connectors ($30,000). Instead, $40,000 will be paid from the General Fund for this program and a corresponding less transfer into the Municipal Capital Improvement funds share of the Neighborhood Improvement Program will be made. The use of these funds is made possible from the Holland Board of Public Works annual dividend inclusion in the revenues. A trial program to assist low income homeowners and renters to lower their bills is recommended with some of these Community Development Block Grant funds ($146,000).
10. Solid Waste Program and Rates
The City’s Solid Waste program started in 1993 and is administered by the City, yet the pick-up and disposal is contracted through a private solid waste company through a competitive bidding process. Rates are established to cover the costs of service with a focus on keeping the costs for residents as low as possible. The Action Plans for solid waste program include:
Promote the yard waste pick up program by providing education on what kitchen scraps can be added to the yard waste container at no additional charge. Determine if compostable materials can be added to yard waste, or if a second container is required. Promote and provide education for onsite and backyard composting.
Implement a 3% fee increase to cover the 3% cost increase in the contract. (Approved in December for July 2016)
Type of Service 2008 RATES 2009
RATES 2010–2013
RATES 2014
RATES (3%) 2015
RATES (3%) 2016
RATES (3%)
1 bag/month $5.27 $5.53 $5.70 $5.90 $6.15 $6.33
2 bags/months 6.84 7.18 7.40 7.65 7.95 8.19
32 gallons 10.00 10.50 10.82 11.15 11.55 11.90
65 gallons 12.62 13.25 13.65 14.15 14.60 15.04
90 gallons 14.72 15.46 15.92 16.40 16.95 17.46
Additional bags 3.00 3.15 3.25 3.25 3.25 3.25
The rate increases over the years were primarily due to increased cost of fuel and general increases in labor and landfill costs. A seven (7) year contract was bid in 2010, Chef Container was the low bidder and recommended by the City’s Sustainability Committee, and enhanced the Recycling program. The contract had
-17-

-18-

Attachment A: Overall Council Strategies, Goals and Action Plans
To implement the City’s Vision and Mission, the City Council developed seven (7) strategies and related goals as follows. Budget Action Plans were subsequently developed in the body of this document that follows to be specific, measurable, attainable, realistic and timely (SMART) and related to the Council overall Strategies and the FY 17 priorities. These Strategies are supplemented with the highest priority goals set by the City Council on February 17, 2016 below. See the underlined words for new goals.
SPECIFIC, MEASURABLE, ATTAINABLE, REALISTIC AND TIMELY (SMART) February 2017
Rank 2016 City Council Priorities Votes
1 Create a path to begin to achieve fiber internet access to neighborhoods (after HBPW Pilot program and after review of the Business Case and by the creation of priorities, perhaps down Pine or in the Smart Zone)
11
2 Eliminate barriers to new development and re-development by reviewing ways to reduce requirements (review Historic District Commission Guidelines), streamline reviews (reduce the number of steps or boards), provide a clear path to success (one-stop shopping and form-based code approaches), provide incentives (like Neighborhood Enterprise Zone tax reductions), and/or streamlining this permitting (for Partners for Renewal, for example)
9
3 Create the budget to be within the annual taxable value increases and reduce the tax burden over time by eliminating the 0.7 capital debt and 0.15 fire station millage increases from 2012/2013
8
4 Add a water feature for Downtown public areas, parks and/or at Civic Center Place (splash pads)
5
5 Add restaurant and indoor/outdoor concert venue at Windmill Island Gardens as part of the Interpretive and Landscape Plan steps in the Business Plan
5
6 Work with MDOT to make the US 31 Corridor From 8th to 32nd more pedestrian friendly and more aesthetically pleasing and budget the City's share
5
7 Add language to City ordinances and policies to protect LGBT community against discrimination in housing, employment and accommodation
5
8 Create and plan for a beautiful, world -class waterfront with public access by water 4
9 Create a Dog Park at Window on the Waterfront or at Van Raalte Farm 4
10 Consider zoning revisions for "Air BNB" (short-term vacation rentals) in the (R-TRN) zones (Downtown neighborhoods)
4
11 Increase community knowledge of City activities by billboards, message boards, Facebook networks, churches, links, mobile apps, photo survey of visual preferences and by otherwise leveraging technology
3
12 Create a Downtown ice rink in relation to Civic Center Place, potentially an ice skating pathway
3
STRATEGY I: ECONOMIC DEVELOPMENT AND TRANSPORTATION (NOTE: Underlined words are based on new Council Goals for FY 17):
Goals
A. Provide the infrastructure necessary to support the City’s economic development mission,
including an emphasis on safety, cost-effectiveness and complete streets multi-modal transportation.
B. Quality streets and sidewalks are a pre-condition for quality neighborhoods. Quality neighborhoods are a pre-condition for a world-class community. Quality infrastructure is a pre-condition for industrial development. Industrial development is a pre-condition for community financial stability.
-19-

C. Foster an environment that supports the retention and growth of industrial businesses. Foster an environment that supports the retention and growth of commercial businesses, including on an attractive waterfront.
D. Utilize the incentives available to the City to retain and attract business. E. Work with area organizations on providing a quality workforce for area employers. F. Reduce the tax burden.
FY 17 Action Plans
A1. Snowmelt Extensions Action Plan: Extend snowmelt whenever possible as desired by City Council (and as per the Snowmelt/District Heat Potential Master Plan from December 2015). See the Downtown section of the Municipal Capital Improvement Fund budget regarding new $500,000 for major maintenance (to initially be paid for by the Holland Board of Public Works and then spread across the users).
A2. Improve non-motorized access to Kollen Park Action Plan: Monitor the parking and lane narrowing at 10th and 11th and Van Raalte.
A3. US-31 Corridor Improvements: Work with MDOT to make the US 31 Corridor from 8th Street to 32nd Street to be more pedestrian friendly and more aesthetically pleasing and budget the City’s share.
B1. Streets Action Plan: The City is touching every street on a 35-year cycle now (extended out from the former 20-year cycle). The Reinvestment Staff Task Force of 2014 recommended use of the declining debt payments to increased street resurfacing and reconstructions from three lane miles per year to seven lane miles ($500,000 more per year eventually as well as one major reconstruction per year for a cost of roughly $1.75 million more each per year by FY 22). Re-direction of mills from debt paid off in prior years to the Street Reinvestment Fund started this program in FY 15 with .4268 mills (approximately $425,000) in FY 17 budget, in addition to 2 mills from City and counties, plus new state road funding, will facilitate 6.8 miles of street reconstructions and resurfacing (9th Street, Central Park area, and State Street).
B2. Sidewalks Action Plan: Sidewalks will continue to be addressed in FY 17 by re-surfacing the path along Lugers.
B3. Mark Alternative Transportation Routes Action Plan: Bicycle Highways will be mapped and marked via routes on-street and off as part of the Master Plan Update due end of 2016. ($5,000)
C1. Waterfront Redevelopment Action Plan: The Ad Hoc Task Force on Lake Macatawa Waterfront is working with the private sector on transitional planning. Waterfront Conceptual Redevelopment funds are included in the Municipal Capital Improvement Fund for FY 17 ($25,000). The intent is to facilitate land use ownership changes, organize a Tax Increment Financing District, and develop a form-based code to ensure the necessary public access and economic investment so as to create a plan for a beautiful, world-class waterfront with public access by water.
C2. Holland Energy Fund and the Community Energy Plan Action Plan: Implementation of community energy planning has been a priority since 2012. The long-term payoff from these strategies is increased energy competency to the City, reinforcement of the City’s reputation as being a choice place to live, and increased taxable values.
i. The Community Energy Plan Steering Committee members will work on additional
initiatives in 1) home energy retrofits and building energy labeling via funding in the Holland Energy Trust and implementation of on-bill financing -- $25,000; 2) commercial/institutional energy retrofit projects; 3) continued partial funding for a new grant-supported creation of Sustainability Institute ($15,000 from the City Manager’s budget and $15,000 from the Holland Board of Public Works’ Energy Optimization budget); 4) re-building the Civic Center to use District Energy via
-20-

snowmelt and; 5) creating new public policies to win the Georgetown University Energy Prize.
ii. Implement deep energy savings in City buildings via completion of the Energy Performance Contract.
C3. Strategic Broadband Fiber Optic Utility/Network Action Plan: Create a path to achieve fiber internet access to neighborhoods (after HBPW Pilot program and after review of the Business Case and by creation of priorities, perhaps down Pine Avenue, or in the Smart Zone.
C4. Eliminate Barriers to New Development and Redevelopment: Review ways to reduce requirements (review Historic District Commission Guidelines), streamline reviews (reduce the number of steps or boards), provide a clear path to success (one-stop shopping and form-based code approaches), provide incentives (like Neighborhood Enterprise zone tax reductions), and streamline permitting (Partners for Renewal, for example).
D1. Neighborhood Commercial Action Plan: Work to incentivize and otherwise enable Service Businesses growth for Neighborhood commercial areas. The most active commercial areas currently have city staff assigned to each to act as shepherds until the City can potentially organize mini-principal shopping districts to proactively address their needs. Signage needs to be improved at a minimum. Wayfinding signage funds are included in the Municipal Capital Improvement Fund for FY 17 to fund gateway, wayfinding and community message board signs ($90,000).
D2. US-31 Corridor Redevelopment Action Plan: A major initiative needed is the US-31 Corridor and improved land uses (24th to 16th Street, especially on the east side). A multi-phased approach to land use review, marketing studies, Brownfield tools and a commercial corridor district is needed to encourage redevelopment along this corridor. Developers will need to be incentivized as a result starting with a realistic land use plan and marketing study from a firm specializing in these matters. Redevelopment ready planning funds are included in the Municipal Capital Improvement Fund for FY 17 ($25,000).
E1. Holland Youth Connections for At-Risk Youth Growth Action Plan: Gang prevention is a key staff goal. Eradication of gangs will enhance economic development. The Holland Youth Connections program will be maintained at 135 youth if contributions and employment opportunities can be retained. Public funds for this summer youth employment (under 18) remain included in the FY 17 budget for Fire, Streets and Parks projects ($30,000 total).
F1. Create budgets to reduce the tax burden: (New in February 2016). Need more discussion in the FY 17 Budget Study Sessions on whether to reduce operating programs or capital projects.
STRATEGY II: AREA COOPERATION:
Goals
A. Collaborate with other area organizations in order to provide a region that is strong and dynamic.
B. Look for opportunities to create efficiency and economies of scale through collaboration and
regionalization.
-21-

FY 17 Action Plans
A1. Regionalization Action Plan. Work with the Macatawa Area Coordinating Council to address ways to work together as part of a bigger whole. No extra cost.
A2. Collaboration Action Plan: Actively support incremental moves to collaborate with Holland Charter Township as per Fire Services’ experimentation with Auto Aid Agreement completed in FY 14 and expanding to include Graafschap Fire Department in FY 16.
A3. Regional Recreation Action Plan: Plan and create ways to separate recreation from the Civic Center and look for regional recreational efficiencies. A three-gym solution to competitive sport recreation is proposed for Smallenburg Park when other debt is paid off. This project will be done with special collaboration of the school districts and municipalities on the south side of Lake Macatawa that may, or may not, include regional funding.
A4. Shared Positions Action Plan: Actively merge administrative services where possible with other units of government: Embrace the planning created by a Succession Plan being created with the Macatawa Area Coordinating Council’s Service Delivery Team.
B2. Regionalize Windmill Island Gardens Action Plan: Windmill Island Gardens' will gain non-motorized access grants/cost sharing with Holland Charter Township in FY 17. ($600,000 is being cost shared in FY 17, along with use of $1.9 million in grants and donations).
STRATEGY III: NEIGHBORHOODS:
Goals
A. Develop mixed income neighborhoods that are synergistic for people, activities, facilities, and
investment. B. Target no more than 30% of the housing stock to be rentals on any given block. C. Encourage green space and leisure opportunities within or near all neighborhoods. D. Ensure all housing and all green space in all neighborhoods is attractive and well-maintained. E. Ensure all neighborhoods are well served by police, fire and medical emergency responders.
FY 17 Action Plans
A1. Owner-occupied Housing Encouragement Action Plan: Although rental housing may be the only option for some City households, work for all neighborhoods to attract a mix of incomes. Neighborhoods should be characterized by an inclusiveness of all economic, social, and racial factors. An Annual Neighborhood Report is planned for January 2017 at no extra expense.
A2. Washington School Block Redevelopment Action Plan: Washington School Block Redevelopment for high density housing is supported.
A3. Consider zoning revisions for “AirBNB” (short-term vacation rentals) in the R-TRN zones (Downtown neighborhoods).
B1. Neighborhood Residential Improvement Action Plan: Residential Neighborhood redevelopment and renewal is paramount. Private and public sector efforts to encourage owner-occupied home ownership are supported in this budget. Part of the proposed $35,000 in the Downtown Neighborhoods Enhancement Program is intended to assist in
-22-

funding new garages for redeveloped parcels and conversions from rental to owner-occupied on a 50% grant basis up to $4,000 per project.
B2. Rental Property Improvements Action Plan: The City’s rental inspection fees go toward this 100% annual inspection goal. Significant progress to 95% from 49% two years ago is expected.
C1. Plant Trees and Return the Tree Canopy Action Plan: Replacement trees remain included for $50,000 per year given a new $100,000 grant being implemented. Meanwhile, the program to pay for half of trees placed inside yards and front yards visible from the street will be better marketed. A 35% tree canopy is planned.
C2. Create a Dog Park Action Plan: Create a Dog Park at Window on the Waterfront or Van Raalte Farm ($25,000 is recommended in the Municipal Capital Improvement Fund).
STRATEGY IV: COMMUNITY AND FAMILY:
Goals
A. Develop/support social and cultural institutions, programs, and activities that provide a safe,
healthy, and productive environment. B. Focus on issues that are important to senior citizens. C. Support the achievement of a strong and diverse community-wide public and private educational
system that establishes Holland as the “community of choice” with excellence and academic options at all levels.
D. Promote personal and community health.
FY 17 Action Plans
A1. Human Relations Action Plan: Support the Human Relations Commission as they create goals to support inclusion and community team building in core areas as a goal for all residents to feel safe and affirmed by others and be a diverse, inclusive, and tolerant community.
D1. Holland Youth Connections for At-Risk Youth: Gang prevention is a key goal. Greater efforts to recruit a diverse seasonal, part-time and full-time work force was successful recently (34%). Funds for this summer youth employment (under 18) are included in the FY 17 budget for Fire, Streets and Parks ($30,000 total).
D2. Non-Discrimination: Add language to City ordinances and policies to protect LGBT
community against discrimination in housing, employment, and accommodation.
STRATEGY V: PUBLIC UTILITIES:
Goals
A. Provide the right stuff, in the right place, for the right value (electric, water, sewer, fiber optic,
electric heat, energy optimization and conservation.) B. Foster regional cooperation on the provision of utility services to ensure efficient and adequate
resources. C. Maintain local control and a Holland citizen-focus in the administration of the utility operation. D. Provide public utilities in an aesthetically sensitive manner, striving for a perceived invisibility
of services. E. Evaluate the benefits of renewable energy sources to sustaining long-term energy alternatives.
-23-

FY 17 Action Plans
A1. Replace DeYoung Coal Burning Plant Action Plan: Implement construction of a gas-powered generation plant. See the Holland Board of Public Works budget.
A2. Community Energy Plan Implementation: See Strategy I Action Plans regarding the Community Energy Plan.
A3. Fiber Optic Extension Action Plan: Create a path to achieve fiber internet access to neighborhoods (after HBPW Pilot program and after review of the Business Case and by creation of priorities, perhaps down Pine Avenue, or in the Smart Zone.
STRATEGY VI: PUBLIC SPACES:
Goals
A. Ensure that all public spaces and facilities are inviting, cost-efficient, up-to-date, and well-
maintained. B. Emphasize environmental stewardship in the construction, maintenance and efficient operation
of all public spaces. C. Support efforts to preserve natural areas, protect natural wildlife and their habitats and introduce
further landscaping.
FY 17 Action Plans
A1. Implement the Five Year Recreation Action Plan: This Plan outlines major park maintenance and upgrades needed. A total of $2,029,800 of priorities is recommended in the Municipal Capital Improvement Fund (one-third funded from grants). Use of Legacy Funds and the Municipal Capital Improvement funds are recommended.
A2. Civic Center Renewal Action Plan: Implement the Civic Center Place Steering Committee’s vision of an $11 million facility with air conditioning, new restrooms and an expanded connection to the Farmers’ Market for year-round use. Add a water feature for Downtown public area, parks and/or at Civic Center Place (splash pads).
A3. Bouws Pool Improvements Action Plan: Restoration of Bouws Pool (including a destination Splash Pad) will be part of the three-gym recreation center project when existing debt is paid off. The amount needed for the destination splash pad(s) is $500,000 to $1,000,000. No expenses except planning funds are included in the FY17 Budget ($15,000).
A4. Combine/Enhance Public Enjoyment of Windmill Island Gardens via Implementation of the Strategic Plan and Business Action Plans. Add a restaurant and indoor/outdoor concert venue at Windmill Island Gardens as part of the interpretive and Landscape Plan steps in the Windmill Island Gardens’ Business Plan.
A5. Fire Station Replacement/Renovation Action Plan: Planning for land acquisition and/or renovation options will continue in FY 17 with use of existing funding streams (planning started in FY 15 with re-directed millage of $270,000 per year). These funds will be saved up for construction/renovation on or before FY 19 ($6.0 million expected by then).
-24-

B1. Greenhouse Replacement Action Plan: Construct a grow house in FY 17 & 18 once the existing greenhouse on State Street is transferred to Evergreen Commons. $250,000 for each of two years is budgeted.
C1. Trees and Tree Canopy Action Plan: Keep & plant more trees to recover from ash borer and achieve a multi-year goal of 35% tree canopy (up from 24% now). See Strategy III on Neighborhoods.
C2. DeGraaf Nature Center Action Plan: The long-term plan is for DeGraaf Nature Center to be self-sustaining with programming expansion and/or collaboration with other like-entities. Meanwhile, this function draws a decreasing amount from the General Fund revenues.
C3. Review the public art policy and develop incentives for public sculptures/art at City entrances.
STRATEGY VII: ORGANIZATION:
Goals
A. Support a culture of continuous innovation. B. Support the team.
FY 17 Action Plans
A1. Implement the Public Safety Service Delivery Study of 2013 Goals: This study will continue to be implemented pertaining to non-sworn staff reductions, part-paid support/recruitment, as well as voluntary cross-training, part-paid staff station duty, joint training, as well as continued Holland Charter Township collaboration via auto aid, and coordinated training/recruitment of part-paid firefighters.
A2. Conserve on economic and environmental resources Action Plan: Reduce, reuse, recycle, and repurpose whenever possible – both for cost savings and for environmental purposes. An on-bill financing mechanism to provide deep energy retrofits for City buildings, parks and other facilities will be implemented in July 2016.
A3. Increase community knowledge of City activities by billboards, message boards, Facebook networks, churches, links, mobile apps, and by otherwise leveraging technology.
B1. Pension Solution Action Plan: Reduce unfunded liability in the public safety pension system (about 60% funded now) by securing a closed group in negotiations. Borrow and pay off the remaining unfunded liability when economic conditions are right.
-25-

Attachment B: Five-Year Financial Plan Summary FY 2022 Long-Term Financial Plan and Assumptions: A long-term Financial Plan is provided by the Finance Department to accurately forecast revenues and expenditures. The intent is to increase the City’s fiscal vision to ensure thoughtful approaches to maintaining fiscal integrity. Unexpected depletion of the General Fund balance can be avoided thereby. A 15% fund balance minimum needs to be maintained to withstand unforeseen economic or catastrophic events.
FY-13 Final Actual
FY-14 Final Actual
FY-15 Final Budget
FY-16 Estimated
FY-17 Manager Projected
FY-18 Projected
FY-19 Projected
FY-20 Projected
FY-21 Projected
FY-22
Projected
Total Funding Sources
$19,819,734 $20,580,886 $20,935,044 $21,676,382 $21,212,062 $21,783,068 $22,360,072 $22,951,170 $23,506,768 $24,077,287
Total Funding
Uses
$19,273,977 $20,905,935 $20,650,083 $22,263,090 $21,203,654 $21,714,921 $22,311,586 $22,938,648 $23,588,478 $24,268,665
Net Increase
(Decrease) from
Operations
$545,757 ($325,049) $284,241 ($586,708) $8,408 $68,147 $48,486 $12,522 ($81,710) ($191,378)
Fund Equity
$4,042,038 $3,716,989 $4,001,230 $3,414,522 $3,422,930 $3,491,077 $3,539,563 $3,552,085 $3,470,375 $3,278,997
-26-

Attachment C: Long-Term Debt Service with New Potential Capital Projects (“What If” Scenario)
(Note: Does not include new short-term pension pay off debt or the energy performance contract debt for
City buildings)
-27-

Attachment D: 2015 Municipal Tax Rate Survey
2015 MUNICIPAL TAX RATE SURVEY (OF SELECTED MICHIGAN CITIES)1
September 23, 2015 Responding City Parcel Count
2015 (Estimated) Population
2014 Census
Income Tax
City2
Total City Millage
Rate 2015
Rate Rank City
Millage
Property Taxes 2015 (City
Only)3
Oak Park 11,913 29,834 No 37.6060 52 $ 2,861.74
Taylor 25,764 61,594 No 29.2327 51 $ 2,224.55
Warren 61,385 135,099 No 27.7637 50 $ 2,112.76
Dearborn 37,412 95,535 No 26.4500 49 $ 2,012.79
Southfield 30,360 73,002 No 26.2712 48 $ 1,999.19
Allen Park 13,707 27,566 No 25.5524 47 $ 1,944.49
Madison Heights 13,177 30,267 No 23.9616 46 $ 1,823.43
Lincoln Park 15,358 37,231 No 23.0386 45 $ 1,753.19
Southgate 11,666 29,416 No 22.8766 44 $ 1,740.86
Roseville 20,468 47,598 No 22.8494 43 $ 1,738.79
Wyandotte 11,421 25,151 No 22.75 42 $ 1,731.23
East Lansing 9,197 48,648 No 22.7011 41 $ 1,727.51
Garden City 12,645 27,052 No 22.5217 40 $ 1,713.86
Kalamazoo 26,752 75,922 No 21.4205 39 $ 1,630.06
Bay City 15,400 34,149 No 21.3365 38 $ 1,623.66
St. Clair Shores 28,833 60,036 No 21.2633 37 $ 1,618.09
*Lansing 48,101 114,620 Yes 19.7 35 $ 1,499.13
*Flint 58,577 99,002 Yes 19.1 34 $ 1,453.47
Westland 30,563 82,314 No 17.8923 33 $ 1,361.57
Dearborn Heights 26,000 56,415 No 17.836 32 $ 1,357.28
Royal Oak 27,791 59,069 No 17.6796 31 $ 1,345.38
Inkster 11,948 24,786 No 17.2349 30 $ 1,311.54
Monroe 9,325 20,198 No 16.7484 29 $ 1,274.52
Ann Arbor 36,650 117,770 No 16.4406 28 $ 1,251.10
Mount Pleasant 6,434 25,971 No 16.25 27 $ 1,236.59
*Port Huron 12,942 29,168 Yes 16.0869 26 $ 1,224.18
*Jackson 15,973 33,200 Yes 16.0329 25 $ 1,220.07
Marquette 7,772 21,441 No 15.2725 24 $ 1,162.21
Sterling Heights 48,255 131,741 No 15.1858 23 $ 1,155.61
Midland 18,602 41,957 No 15 22 $ 1,141.47
*Saginaw 27,719 49,844 Yes 14.8830 21 $ 1,132.57
*Battle Creek 23,987 51,833 Yes 14.7360 20 $ 1,121.38
Farmington Hills 30,500 81,435 No 14.3908 19 $ 1,095.11
Ferndale 11,192 20,256 No 14.3528 18 $ 1,092.22
Burton 13,749 28,974 No 14.1946 17 $ 1,080.18
Livonia 44,773 94,958 No 14.0380 15 $ 1,068.26
Holland 13,565 33,644 No 13.7731 14 $ 1,048.11*Muskegon 16,619 38,393 Yes 13.0875 13 $ 995.93
Eastpointe n/a 32,654 No 12.1754 12 $ 926.52
-28-

Wyoming 25,652 74,826 No 11.9073 11 $ 906.12
Romulus 11,253 23,496 No 11.5165 10 $ 876.38
Birmingham 11,281 20,757 No 11.4943 9 $ 874.69
Norton Shores 12,232 24,081 No 10.95 8 $ 833.27
Portage 19,372 47,837 No 10.9256 7 $ 831.42
Auburn Hills 8,366 21,845 No 10.5602 6 $ 803.61
Rochester Hills 27,460 73,125 No 10.3605 5 $ 788.41
Novi 21,022 58,416 No 10.2000 4 $ 776.20
Kentwood 18,122 50,764 No 9.6066 3 $ 731.04
*Grand Rapids 66,455 193,792 Yes 9.1515 2 $ 696.41
*Walker 9,573 24,468 Yes 1.3360 1 $ 101.67 1This report was prepared by the City of Portage Office of the City Assessor using (survey) information received from selected Michigan cities. The primary selection criterion was a population of at least 20,000 people. Estimated population provided by 2014 US Census Bureau. 2With the exception of Detroit, Grand Rapids, Highland Park, and Saginaw, cities with an income tax levy 1% on residents and .5% on non-residents. Detroit levies 2.4% on residents and 1.2% on non-residents. Highland Park levies 2% on residents and 1% on non-residents. Grand Rapids and Saginaw levy 1.5% on residents and .75% on non-residents. Tax rates provided by the Michigan Department of Treasury 3These taxes are based on a taxable value of $76,098, which is the average taxable value of a single-family residence in the City of Portage for 2015.
*Communities which also levy an income tax.
-29-
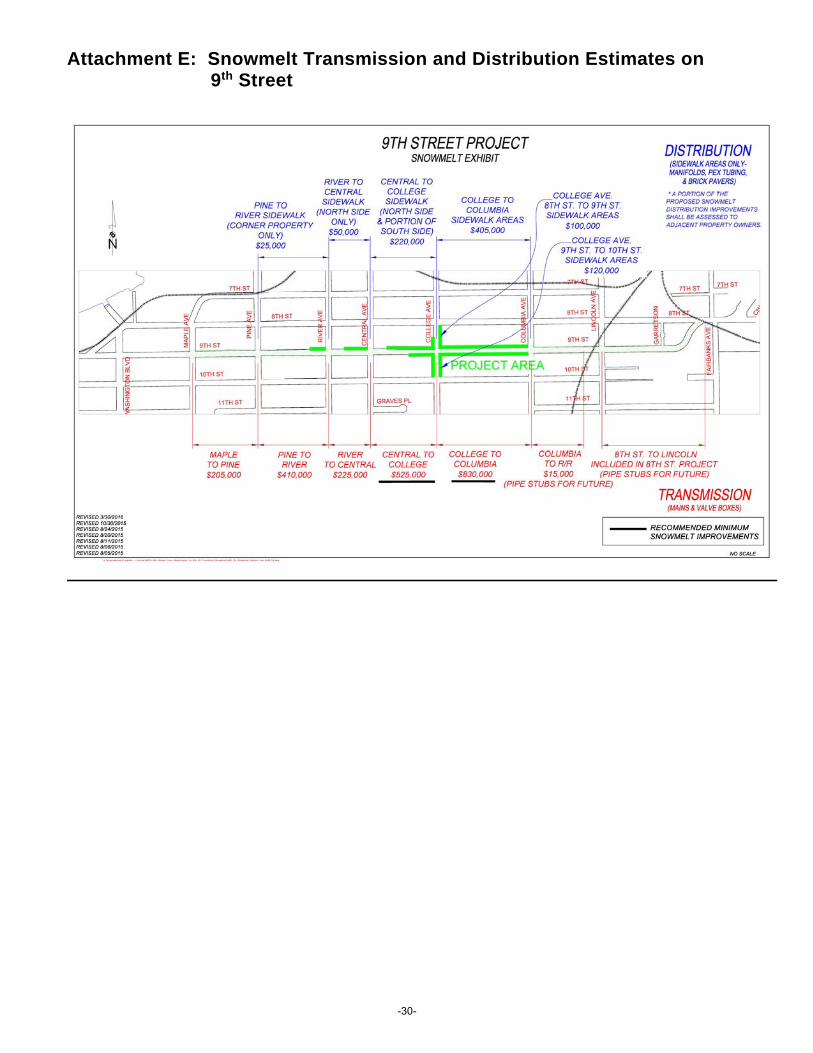
Attachment E: Snowmelt Transmission and Distribution Estimates on 9th Street
-30-

Human RelationsInternational Relations
* Human Relations Commission* International Relations Commission* Equal Employment Opportunity (EEO) * Americans with Disabilities Act (ADA)
Management
City Clerk* Elections* Council Meetings/Records* Licenses* Passports* City Records/Documents
Transportation
City Manager Advisory Boards & Commissions* Board of Canvassers* Board of Review* Brownfield Authority* Building Board of Appeals* CATV Advisory Commission* Community Dev. Advisory Committee * Compensation Commission* Downtown Design Review Board* Downtown Development Authority* Downtown Parking Board* Economic Development Corporation * Historic District Commission* Housing Board of Appeals* Human Relations Commission* Intern. Relations Commission* Parks and Recreation Commission * Neighborhood Improvement Committee* Panel Space Heating Examiners * Planning Commission * Police Community Relations Commission* Principal Shopping District (PSD)* Sustainability Committee* Youth Advisory Council* Zoning Board of Appeals
Ass't to the City Manager* Public Information * Special Projects
Human Resources* Employment* Labor Negotiations* Employee Relations* Employee Training* Employee Safety* Employee Wellness
Technology Services* Computers* Communications* GIS
Community & Neighborhood Services
* Planning * Plumbing Insp.* DDA/PSD * Mechanical Insp.* Electric Insp. * Neig. Liaison* Sanitation * Housing/CDBG * Outside Agencies * Solid Waste* Zoning * City Hall Maintenance* Building Inspection
Parks & Recreation* Parks * Nature Center* Recreation * Pool* Civic center * Van Raalte Farm* Market * Windmill Island* Cemeteries Gardens* Nature Center
Finance * Investments* Insurance* Budget Preparation* Payroll* Independent Audit* Treasurer* Property Assessing* Tax Abatement* Purchasing
Holland Board of Public Works Board
MayorCity Council
Citizens of Holland
City Attorney
Administration
Public Safety
City of Holland
Organizational Chart
Fiscal Services
Community & Neighborhood
Utility Services
Herrick District Library
Holland Community Aquatic Center Authority
Holland Historical Trust
MAX Transit Authority
Ottawa County Central Dispatch Authority
West Michigan Airport Authority
*
* The City Council makes appointments to these Districts and Authorities
Rev April 2016
Holland Board of Public Works
General Manager
* Electric * Water* Waste Water * Fiber Optic* Energy Optimization
Public Safety Police Division Fire Division
* Community Services * Fire Prevention* Traffic Services * Safety Education* Community Policing * Fire Suppression* Detective Bureau * Emergency Medical Serv.* Patrol Division * Emergency Management* Administrative Services
Transportation* Engineering* Streets* Sidewalks* Depot* Airport* Vehicle/Equipment Maintenance
Parks & Recreation
-31-

Community Profile: Holland, Michigan
The City of Holland is located along the coast of West Michigan in the lower left corner of Ottawa County
and the upper left corner of Allegan County. Nicknamed the “Tulip City” for its annual festival, the city spans
an area reaching just more than 17 square miles. According to the census, which took place in 2010, the
current population was 33,051 people. This makes Holland the 53rd largest municipality in Michigan, by
population.
Holland relies on the cycle of tourism, specifically in the months not included in winter, to drive local
business and create internal growth. Specifically, the Tulip Time Festival and the proximity to Lake Michigan
are the two ways in which Holland brings in tourists. The festival relates to the long history of Dutch heritage
that is still present and strong within the community. Through the main downtown area in Holland, you will
find comfortable dining and shopping experiences as well as various entertainment avenues. While
downtown offers a refreshing getaway from busy days, a well-respected list of companies call Holland
home. Among those companies are Haworth, Herman Miller, Johnson Controls, Tiara Yachts and H.J.
Heinz. The city also offers accommodations for banking, insurance, realtors, advertising agencies,
employment services and consulting firms to ensure that the needs of visitors and residents alike are met
year-round.
While the economic standing of Holland is impressive, it also boasts a highly diverse list of cultural
attractions, within the city and surrounding townships. Among these attractions are museums explaining
both Michigan and Dutch history, a recognized Michigan State Park, and historical landmark attractions
such as Dutch Windmills and Harbor Lighthouses. In 2013, the Holland area was named as most secure
mid-sized city in the United States by Farmers Insurance. In recent years, it has also been praised as the
second healthiest/happiest town in the United States by the Well-being Index as well as being named one
of the top-5 places to retire by CNN Money.
Housing
Holland offers a wide variety of housing options depending on how near to the heart of the city one finds
his/herself. On the outskirts of the town, you will find subdivisions filled with single-family homes as well as
duplexes. As you approach the city, you will continue to see this standard housing, but also will find
apartments for multiple families and condominiums. Many of the rental houses in the Hope College area
are reserved for students. Holland has been a place of demand for housing in recent memory due to the
strong school districts, the variety of school choices and the safety of the community at large.
Economy and Population Statistics
Per 2010 Census
Holland, MI United States
Unemployment Rate 6.6% 6.3%
Income Taxes 4.25% 4.72%
Median Household Income $42,138 $53,046
Recent Job Growth 4.51% 1.18%
The Holland economy relies heavily on the tourists that visit the city each year. As far as career
opportunities, many people are drawn in permanently based on the long list of established companies in
the area, some of which are highlighted in the section overview above. Holland also enjoys a diversified
industrial sector that includes manufacturing in areas such as office systems and furniture, auto and truck
parts, boats, aluminum extrusion, food manufacturing, wind energy components and lithium-ion batteries.
-32-

Community Profile: Holland, Michigan
Higher Education
There are a variety of higher education institutions in the Holland, Michigan area. Most notably, Hope
College. Other schools include the Western Theological Seminary, as well as satellite campuses for Grand
Valley State University, Davenport University and Grand Rapids Community College. With this wide array
of higher educational opportunities, Holland provides an exceptional opportunity for young adults and
professionals alike to continue their education for further opportunities.
Medical Facilities
Holland is fortunate to have a large and noteworthy hospital to handle the medical needs of its community.
Holland Hospital was established in 1917. It is also one of the major employers of residents in the area as
well as around the surrounding cities and serves the needs of more than 250,000 people on a yearly basis.
Some of the major awards accredited to Holland Hospital include Healthgrades 50 Best Hospitals, National
Best and Brightest (companies to work for) and the H100 award for being in the top 100 healthiest
workplaces in the United States.
Utilities and Government Programs
The Holland Board of Publics Works (BPW) is responsible for supplying utilities to residents in the City of
Holland and surrounding areas. Established in 1893, the purpose of the BPW is to provide reliable and
economical electric, water and wastewater treatment services while also maintaining environmental
responsibility. According to a recent survey done by the entity, BPW provides services to over 75,000
members of communities.
Holland is progressive with its operation “Snowmelt”. In this instance, the city runs warm water through
tubes under the streets of the city to melt snow and ice away and keep roads safer in the wintertime. The
entire system is over 400,000 square feet and is designed to melt up to 1 inch of snow per hour when
running at peak capacity. Downtown Holland has the largest municipally-owned snowmelt system in the
United States. This shows yet another reason why Holland has a high resident satisfaction percentage and
continues to be a great place to live.
Transportation.
Macatawa Area Transportation Authority (MAX) provides public bus transportation for citizens living in the
city and surrounding townships. With the relatively close proximity of places to go in the city and outside,
MAX offers people with a safe and reliable form of public transportation.
In terms of accessibility, Holland is an intricate network of smaller roads that make up a large system of
moving to and from places. Sitting just off an exit from US 31, Holland is easily accessible by tourist and
visitors traveling north or south along Michigan’s Lake Michigan coast. Interstate 196, also known as the
“Gerald R Ford Freeway”, cups the city from below and also offers an opportunity to reach Detroit and
Chicago respectively from the city.
Conclusion
All in all, the City of Holland has plenty to offer from an economic, residential and municipal standpoint. A
robust downtown district mixed with the presence of all age groups allows for many opportunities for all
interested parties. With a rich heritage, strong cultural presence and friendly atmosphere, it will continue to
draw a large number of tourists and be a destination for all people in the heart of West Michigan.
-33-

PERCENTAGE
OFFICIAL INCREASE
DECADE POPULATION * ( DECREASE )
1867 Incorporated as a City - - - - - - -
1870 2,324 - - - - - - -
1880 2,620 12.74
1890 3,956 50.99
1900 7,790 96.92
1910 10,490 34.66
1920 12,166 15.98
1930 14,346 17.92
1940 14,616 1.88
1950 15,858 8.50
1960 24,916 57.12
1970 26,337 5.70
1980 26,281 ( 0.21 )
1990 30,745 16.99
2000 35,048 14.00
2010 33,051 (5.70)
Source for Information:
* Michigan Manuals, Michigan Department of Management and Budget and U.S. Census Bureau.
CITY OF HOLLAND - HISTORY OF TRENDS IN POPULATION
-
5,000
10,000
15,000
20,000
25,000
30,000
35,000
40,000
1870 1880 1890 1900 1910 1920 1930 1940 1950 1960 1970 1980 1990 2000 2010
-34-

DEMOGRAPHICS
8%
25%
35%
19%
13%
2013 Estimate Age Distribution
Under 5 Years Old
5‐19 Years Old
20‐44 Years Old
45‐64 Years Old
65 Years or Older
80%
20%
Race: 2010 CensusPopulation 33,051
White, Non‐Hispanic
All Other
‐
5,000
10,000
15,000
Under 5 YearsOld
5‐19 Years Old 20‐44 Years Old 45‐64 Years Old 65 Years orOlder
Age Distributionof Residents
2010 Cencus
2013 Estimate
4,357
2,612 3,250
631
3,746
439
‐ 1,000 2,000 3,000 4,000 5,000
Management,Professional
Service Sales, Office Farming, Fishing,Forestry
Production,Transportation, Material
Moving
Construction,Maintenance
Employed Civilian Population ‐ 15,035 (16 Years and over)
7%
22%
36%
21%
14%
2000 Census Age Distribution
Under 5 Years Old
5‐19 Years Old
20‐44 Years Old
45‐64 Years Old
65 Years or Older
‐ 1,000 2,000 3,000 4,000
Black/AfricanAmerican
AmericanIndian/Alaska
Native
Asian Other Two or MoreRaces
Race: City of Holland Non‐White Population 2010 & 2013
2010 Census
2013 Estimate
81%
19%
Race: 2013 EstimatePopulation 33,281
White, Non‐Hispanic
All Other
81%
19%
Race: 2015 EstimatePopulation 33,742
White, Non‐Hispanic
All Other
note: Percentages based off the2013 estimate which is most current .
-35-

Fire Stations 3
Police Patrol Units 19
Parks 23
Cemeteries (City Owned) 2
Sports Complexes 2
Community Centers 1
Nature Center 1
Community Pools 2
Public Libraries 1
Higher Education Institutions 4
DEMOGRAPHICS
Miscellaneous Statistics
Source: Information on Higher Education Enrollment was found through websites of local colleges and universities and US News rankings and the
miscellaneous statistics is based on actual count of City assets. All other information is from www.census.gov.
52%
4%
11%
27%
6%
2010 Population composition by Household
Husband‐Wife Family
Single Male Family
Single Female Family
One Person Living Alone
Unrelated People
7,460
1,091 1,125 732
421 343
1,408
288 -
2,000
4,000
6,000
8,000
SingleFamily,
Detached
SingleFamily,
Attached
Duplex 3 or 4 Units 5 to 9 Units 10 to 19Units
20 or MoreUnits
Mobile Home
Total Housing Units per 2010 Census12,868
Housing Characteristics
12,021 91%
1,191 9%
Filled Housing vs. Vacant Housing per 2010 Census
Filled HousingUnits
Vacant HousingUnits
10.8%8.9% 8.8%
7.4%
4.5%
0.0%
5.0%
10.0%
15.0%
2011 Labor Force 17,494 2012 Labor Force 16,632 2013 Labor Force 16,937 2014 Labor Force 17,252 2015 Labor Force 17,860
Unemployment Rate 5 Year History
71%2%
19%
8%
2016 Higher Education Enrollment Total of 4,807 Degree Seeking
Hope College
Grand Valley State University (Meijer Campus)
Grand Rapids Community College ("Lakeshore" area)
Davenport University
-36-

1805 Michigan Territory. 1866 Hope College incorporates.
1813 Kingdom of the Netherlands established. 1867 Holland incorporates. Isaac Cappon
first mayor.
1821 Ottawa Indians relinquish West Michigan
land in Treaty of Chicago. 1870 First railroad links Holland, Allegan
and Muskegon.
1830's Ottawa Indian settlement on south side
of Black Lake (the "Landing"). 1871 Holland fire destroys 80% of town.
Holland Pump Manufactory, Phoenix Planing
1834 Separatist Movement leaves Reformed Church Mill, Cappon & Bertsch Tannery rebuilds.
1836 Separatists persecuted by Dutch
government and society. 1876 Centennial Park developed from market
square. Van Raalte dies in Holland.
1837 Michigan gains statehood and Ottawa
County organized. 1879 Anton Seif Brewery.
1841 Catholic Mission Church established at 1880 Van Putten Butter Tub Factory.
the Landing.
1881 Holland Manufacturing Company
1846 Rev. Van Raalte requests assistance from (windmills).
American Reformed Dutch Church for
separatists. 1883 Telephone service. Holland City Hall /
Fire Station (8th Street).
1847 Rev. Albertus Van Raalte and first group
of Dutch settlers arrive in the Black Lake 1885 City Water Service. Western Theological
region and first log church built, Holland platted. Seminary.
1850 Area population 1,828. Channel to Lake Michigan 1889 Holland State Bank, Lake Side
begun. Furniture Company, West Michigan
Furniture Company.
1852 Holland boasts seven stores, two hotels,
bakery, brass, copper & iron smithies, 1890 First private electric power plant.
tailor shop, clock shop & wagon makers.
1891 Building boom. Ottawa Furniture Company.
1856 Van Raalte's First Reformed Church completed.
1892 Electric street lights.
1857 Van Vleck Hall built at Holland Academy
(now Hope College). Cappon & Bertsch tannery. 1893 City of Holland steamer.
1858 Holland channel improved for large lake 1894 Municipal Electric Power Plant.
vessels. Steamboat line begins between Holland Furniture Company.
Chicago and Holland. Van Tongeren Cigar Factory.
1859 Holland City Foundry. 1895 "Bonus Plan" encourages companies
to locate in Holland.
1860 Area population 3,457 1896 Holland Daily Sentinel newspaper.
1861 Civil War begins. 1897 H.J. Heinz. Free mail delivery.
1864 Last presidential election with Democratic 1898 Western Machine Tool Works.
win in Holland. Holland-St. Louis Sugar Company.
HISTORY OF THE CITY OF HOLLAND
-37-

1899 Electric Interurban to Saugatuck. 1933 Baker Furniture Company moves from
Allegan. Seven-Up Bottling Company
1901 First automobile owned by Holland resident. of Western Michigan (Beverage America).
Holland Shoe Company. Electric Interurban
line from Grand Rapids to Holland. Graham & 1935 Black Lake renamed Lake Macatawa.
Morton Steamship Company line to Chicago.
1940 James DeYoung Electric Power Plant
1902 Holland Municipal Sewer System. constructed with PWA funds (BPW).
Netherlands Museum opens under of
1903 St. Francis Roman Catholic Church. Willard Wichers.
Brick street paving. Holland Gas Works.
1946 Tulip Time celebrated after wartime
1905 Louis Padnos scrap metal business. hiatus. Hope College enrollment increases
Star Furniture (later Herman Miller). due to GI Bill. Lithibar moves from
Kalamazoo.
1906 Holland Furnace Company. De Pree
Chemical Company. 1948 Modern Products (Haworth Corporation).
Hansen Machine Company.
1908 Holland Board of Trade established
(Chamber of Commerce). 1951 Bernice Bishop first woman elected to
City Council.
1911 Holland City Hall (River Avenue).
1953 General Electric.
1914 Mrs. George Kollen first woman elected
to Board of Education. 1954 Civic Center.
1919 Holland Hospital (12th & Central). 1955 Slikcraft (S-2 Yachts).
1920 Holland Hitch Company. 1958 Township land annexed to City.
1924 Federal Manufacturing Company (Hart 1960 Herrick Public Library. Michigan slips
& Cooley Inc.). to second place behind California in
number of Dutch immigrants.
1925 Warm Friend Tavern (hotel).
1962 Holland Economic Development Corporation
1927 Lida Rogers suggests "Tulip Day". (HEDCOR).
1928 First tulip bulbs planted along city streets. 1965 "De Zwaan" windmill dedicated by Prince
Sewage treatment plant. Holland State Bernhard of the Netherlands. Windmill
Park. Holland Hospital (Michigan Ave.). Island dedicated. Prince Corporation.
1930 First Tulip Time festival organized 1969 Lifesavers Company first plant in HEDCOR
under Mrs. J. Telling of the festival industrial park.
committee.
1978 Downtown Development Authority.
1932 Depression-bank closings. Sligh Furniture Metal Flow Corporation.
Company moves from Grand Rapids.
HISTORY OF THE CITY OF HOLLAND (continued)
-38-

1980 BLD Products Ltd. moves from Flint, Mich. 1999 Holland Area Community Swimming Pool
Cappon House Museum purchased. Authority Aquatic Center expansion
completed. 1,100 acres annexed from
1983 City purchases Van Raalte Farm. Fillmore Township.
1984 2000 Herrick District Library facility
expansion completed.
1985 Evergreen Commons (Senior Center).
2002 Planters Lifesavers plant closes and
1988 Westshore Mall (in Holland township). relocates to Canada. Herman Miller
Snowmelt system installed downtown. vacates Holland City manufacturing plant.
1990 Area population over 70,000 including 2003 City Transportation Facility constructed.
surrounding townships. Holland declared
Urban Center. 2004 City Police Facility Expansion completed.
Western Gateway & 8th Street Market
1991 Freedom Village (retirement living). area construction completed. Challenge
Padnos Transportation Center (train Manufacturing moves into former
and bus depot, Tulip Time Festival office). Herman Miller plant. Baker Furniture
vacates Holland City manufacturing plant.
1992 Holland Museum (in renovated former
U.S. Post Office). 2005 Hope College's DeVos Fieldhouse built
and Eastern Gateway (to downtown)
1993 Weed & Seed program. development continues. Baker Lofts
begins condo renovation of former
1995 Holland Area Community Swimming Pool Baker Furniture building.
Authority formation. Strategic Plan
for downtown adopted. 2006 Voters approve Macatawa Area Express
Transportation Authority .4 millage for
1996 Queretaro, Mexico, Sister City. expanded area-wide transit system across
Holland named All-America City. Holland City and Holland Township.
Settlers House Museum purchased.
2007 Plastech takes over management of
1997 Herrick District Library formation Holland Southview Johnson Controls
(Holland City, Holland Township, Park Interiors (JCI) plant.
Township, Laketown Township).
Holland celebrates its Sesquicentennial. 2008 Construction of Heinz boardwalk on Lake
Downtown receives Great American Main Macatawa and major reconstruction of
Street Award. Kollen Park boat ramp & roadway entrance.
1998 City Hall renovation completed. 2008 Voters approve West Michigan Airport
Johnson Controls Interiors (JCI) Authority 0.10 millage area-wide across
assumes ownership of Prince Corporation. Holland City, Park Township and City of
Zeeland. Even though Holland Township
voters failed to approve the tax levy, the
area wide Authority will proceed.
HISTORY OF THE CITY OF HOLLAND (continued)
Mainstreet designation for downtown Holland
-39-

2009 Downtown 7th Street Parking Deck constructed. 2012 In April the City and Hope College approve
a Joint Development and Funding
2009 National recession impacts Holland Agreement to install synthetic turf at the
severely. Holland unemployment rates Municipal Stadium. Transfer of ownership
soar as high as 16.4% as compared to of the stadium from the City to Hope College
State of Michigan rates of 14.1%. was finalized in January 2013.
2009 Hundred year June 19 rainstorm event 2013 April 19 the City experienced the 8th largest
causes major flooding and damage to storm in the last 100 years. The storm
City infrastructure and private residents' produced over 3.7 inches of rain. The
homes. City expends over $1.5 million BPW's new headworks at the Waste Water
over the next fiscal year for repairs. Treatment plant resulted in zero overflows
and the Lincoln Ave. storm water work in
2010 Johnson Controls (JCI) partners with 2012 resulted in no stream bank overflows
French manufacturer SAFT to retool the or road washouts.
existing JCI Meadowbrook facility in
Holland to produce lithium-ion cells 2013 The City climbed out of a multi-year financial
under a Renaissance Zone. slump with an increase in taxable value of
1.47% (adjusted) and completion of a 50
2010 Compact Power Inc., a subsidiary of Korea person downsizing and a Public Safety
based LG Chem Ltd starts construction of Service Report focusing on increased
a 650,000 square foot $304 million plant efficiencies and collaboration (18 person
in Holland to manufacture lithium-ion cells firefighter/EMT crew and 57 sworn police
for automobile battery packs under a officers).
Renaissance Zone.
2013 City Council approved a Community
2011 The City and Hope College transact a Energy Plan and several committees were
property exchange which took 5 years to formed to create implementation strategies.
fully complete. Hope College received
Lincoln Park and Columbia Park from the 2013 In June Holland Youth Connection Program
City. The City received property abutting started for area at-risk youth. Funding for
Smallenburg Park. the program achieved through donations
and sponsorship fees from employers.
2011 Several electric charging stations for
electric vehicles installed around the City. 2015 In April the Board of Public Works breaks
ground on the new Holland Energy Park.
2011 July 11 major storm and wind event
fells hundreds of trees throughout the
City. Many major power utility poles
snapped in half bringing the City to a
temporary standstill and requiring
emergency procedures to be implemented.
Source: Events 1997 and prior are segments from the Holland Museum Sesquicentennial Timeline compiled by
Joel LeFever, Curator. Later events compiled by City Finance Office.
HISTORY OF THE CITY OF HOLLAND (concluded)
-40-

Primary revenue sources, across all funds, are grouped into the classifications listed below. The other
sources include special assessments, fines & forfeitures, interest, rent and other miscellaneous revenues,
but excludes bond proceeds.
2014 Actual 2015 Actual 2016 Estimate 2017 Budget
Property Taxes 16,592,896 16,833,866 17,800,204 17,429,061
Intergovernmental 7,449,573 7,588,921 8,042,015 11,144,728
Charges for Services 122,913,760 126,061,708 130,101,273 134,596,296
Licenses & Permits 666,982 760,024 699,100 705,300
All Other Sources 13,884,289 13,973,457 14,011,642 18,659,345
Total Revenues 161,507,500$ 165,217,976$ 170,654,234$ 182,534,730$
Revenue Classification
Property Taxes9.5%
Intergovernmental6.1%
Charges for Services73.7%
Licenses & Permits0.4%
All Other Sources10.2%
2017 Budgeted Revenues
-41-

Property Taxes (Millions of Dollars)
- General Operations: 8.3494 mills
- Capital Projects: 1.7923 mills
- Debt Service: 3.6290 mills
MAJOR REVENUE SOURCE ANALYSIS
Property Taxes represent the primary revenue source for General Municipal Operations, Capital
Projects for Municipal and Street Projects and General Obligation Debt Service.
The City of Holland's taxable valuation base decreased 7.47% in Fiscal Year 2017 and is projected
to increase 2.0% in Fiscal Year 2018. The original millage rate authorized by City Charter is 17.5;
has been reduced for Fiscal Year 2017 to 15.9046 by the Headlee Rollback. As a general
guideline City Council prefers to levy a tax rate not to exceed 14.00 mills. The property tax millage
rates for Fiscal Year 2017 include:
-
2.0
4.0
6.0
8.0
10.0
12.0
14.0
General Operations Capital Projects Debt Service
$
-42-

Intergovernmental - Revenue Sharing and Grants (Millions of Dollars)
State Shared Revenue
Street Maintenance
- State revenue sharing from the gas & weight tax, projected 5.5% increase for Fiscal Year 2018.
- Annual maintenance fee payment as provided by Public Act 48 of 2002; Metro Authority
- Allegan & Ottawa County revenue sharing from the Road & Bridge Tax. This is a voted
county tax requiring period voter re-approval; projected to increase 2.0% in Fiscal Year 2018.
Federal and State Grants for Capital Projects
Other
MAJOR REVENUE SOURCE ANALYSIS
State shared revenue from sales tax is authorized by the state constitution and/or state statutes,
providing funding for local units of government. This revenue source is subject to volatility and
unpredictability, especially during economic swings. During the recent downturn in the ecomony
the City of Holland experienced a 15% decrease in revenue, from Fiscal Year 2008 to 2010. Since
2011 revenue has increased 12%, with another 2.0% increase projected for Fiscal Year 2018.
Included in this category is the replacement revenue for the personal property tax loss, via an
Essential Services Agreement.
Funding for street maintenance comes from:
The revenue shown from federal and state grants is for municipal and infrastructure projects;
these grants are one-time non-recurring in nature.The projected amount for Fiscal Year 2018 is
based on an estimate included in the five (5) year plan.
Funding for State of Michigan for Criminal Justice and the Fair Food Network for the 8th Street
Market are included in this category.
-
2.0
4.0
6.0
8.0
10.0
12.0
14.0
General Fund State Shared Revenue Street Maintenance Capital Projects Other
$
-43-

Charges for Services - Utilities (Millions of Dollars)
Charges for Services - Other than Utilities (Millions of Dollars)
MAJOR REVENUE SOURCE ANALYSIS
Charges for Services is the City's largest single revenue source. Customer charges for the municipal utilities
(Electric, Water and Wastewater) comprise more than 60% of all revenue sources. Anticpated increases in
utility rates for Fiscal Year 2018 include1.8% for electric, 2.5% for water and 3% for wastewater. Fiscal Year
2018 revenue is not projected to increase for Community Services (including inspections), Parks &
Recreation and All Other groups.
-
20.0
40.0
60.0
80.0
100.0
120.0
140.0
Electric Water Wastewater
$
-
1.0
2.0
3.0
4.0
5.0
6.0
7.0
8.0
Parks & Recreation Community Services All Other
$
-44-

Licenses & Permits (Thousands of Dollars)
MAJOR REVENUE SOURCE ANALYSIS
Licenses & Permits do not represent a material source of revenue, but it is significant enough to
reflect an illustration of trends over time.
The projection for Fiscal Year 2017 anticipates a 2% increase in revenue for Business Licenses
and no increase in revenue for Construction Permits and Right of Way Permits.
-
100.0
200.0
300.0
400.0
500.0
600.0
700.0
Business Licenses Construction Permits Right of Way Permits
$
-45-

BUDGET CALENDAR Fiscal Year 2016-17
Leadership Team Retreat Jan 8, 2016
Coffee with City Council & HBPW Board Jan 16, 2016
Budget packets distributed to Leadership Team Jan 22, 2016
City Council meets with Leadership Team to discuss priorities Jan 29, 2016
City Council Annual Retreat Jan 30, 2016
City Council approves Budget Calendar with extension Feb 3, 2016
Computer equipment requests submitted to Tech Services Feb 5, 2016
Personnel reclassification requests submitted to HR Director Feb 5, 2016
City Manager and HR Director make recommendations regarding wages, reclassifications and union negotiations Feb 12, 2016
Leadership Team submit budgets and narratives to Finance Office Feb 12, 2016
Finance Office assembles budgets Feb 15 – Mar 1, 2015
City Manager reviews budgets with Leadership Team members Feb 18 – Mar 10, 2016
City Manager & Budget Team make final decisions Mar 11 - 18, 2016
Finance Office prepares proposed budget document Mar 11 - Apr 1, 2016
Proposed budget formally submitted to City Council and date of public hearing is set Apr 13, 2016
City Council budget study sessions Apr 13, 14, 18 (optional), 2016
Public hearing held on Proposed Budget; and formal adoption of FY-2017 Budget Resolution May 4, 2016
-46-

FINANCIAL INFORMATION
ADJUSTMENTS TO THE BUDGET
During a fiscal year, circumstances may result in changes to department spending priorities. At the
beginning of each year, appropriations are made at the fund and department level, as adopted by City
Council in May. Budget amendments are made throughout the fiscal year based on specific council
action; individual amendments are approved at virtually every meeting. The City Manager has been
authorized by City Council to approve amendments within each department of the General Fund, up to a
maximum of $10,000.
ACCOUNTING BASIS OF THE BUDGET
The basis of budgeting mirrors the basis of accounting. Governmental fund types are budgeted
using the modified-accrual basis; these include the General Fund, Special Revenue Funds, General
Debt Service Funds and Capital Project Funds.
Proprietary fund types are budgeted using the full accrual basis; these include Enterprise and
Internal Service Funds. The following exception is followed:
The budget basis includes expenditures for capital outlay, which are not considered expenses on
the accrual basis of accounting.
BASIS OF ACCOUNTING
All governmental type funds and trust funds use modified-accrual basis of accounting. Revenues that
are measurable and available for funding current appropriations are recognized when earned. All
other revenues are recognized when cash is received, except revenues of a material amount that
have not been received at the normal time of receipt are accrued, and revenues received in advance
are deferred. Expenditures are recorded when a liability is incurred; except general obligation debt
principal & interest maturities that are recorded at the time of payment.
Proprietary type funds use the full accrual basis of accounting under which revenues are recognized
when earned and expenses are recognized and recorded as a liability when incurred.
BUDGETARY AND FINANCIAL POLICIES
BALANCED BUDGET
The General Fund budget will be balanced each fiscal year. The City considers the budget balanced
when total revenues are equal to or exceeds total expenditures. For FY-2016 the City’s General Fund
budget is balanced, with revenues equal to expenditures.
MULTI-YEAR FINANCIAL PROJECTIONS
To support the City’s budgetary planning and decision making process, its financial situation and key
factors impacting recurring revenues and expenditures will be analyzed. The annual budget will
include a 5 year General Fund projection, with major assumptions identified.
-47-

BUDGET PROCESS BASED ON AN ANNUAL CYCLE
As required by the City Charter, an annual budget will be adopted by council in the month of May.
Budgeting on an annual basis provides time to review revenue sources, develop solutions to
identified problems and discuss priorities. An annual budget process also allows management to
effectively plan and implement changes.
CASH AND INVESTMENTS
Cash and investments will be maintained in accordance with the City Charter and the adopted
investment policy will ensure proper controls and safeguards are maintained. City funds will be
managed in a prudent and diligent manner with an emphasis on safety of principal, liquidity and
financial return on principal.
REVENUE POLICIES
Diversification – The City shall attempt to achieve diversified, reliable and stable sources of
revenue to support the general operating budget. Management will vigilantly seek new sources, to
include grants made available by local, state and federal government agencies.
User Fees – The fees and charges are associated with recovering the cost of providing a service.
Each is reviewed annually and modified to reflect the changing costs of providing the service; City
Council approves the rates for the ensuing calendar year in the month of December.
Collections – The City will follow an aggressive approach toward collection of past due taxes
receivable and all other types of receivables.
Non-recurring revenue – This type of revenue is received only one time or for a very limited time.
This type of revenue is not considered stable and will not be used to fund ongoing operations.
Instead, it will be used for one-time uses, including capital and other one-time expenditures,
increasing reserves or paying down unfunded liabilities.
CAPITAL PROJECTS
Capital Improvement Plan Development - The City shall annually update a five year projection plan
of capital projects (including major renovations to infrastructure assets), to be used as a guideline for
short-term and long-term capital budgeting.
Proposed projects will be reviewed and prioritized for accuracy of cost and consistency with the
City’s goals and objectives. Staff will be diligent in searching for possible outside funding sources
that may provide financial assistance for its capital projects; and at the same time reduce the need
for issuance of new and additional debt.
Future operating and maintenance costs associated with new projects will be forecasted and
included in the appropriate operating budget.
DEBT MANAGEMENT
Bond Rating - The City will make every attempt to maintain a high bond rating, for the purpose of
minimizing borrowing costs and preserve access to credit.
Debt Capacity – An analysis showing the new issue combined with current debt impacts the City’s
debt capacity will accompany every future bond issue proposal.
General Obligation Debt – General Obligation Debt, which is supported by property tax revenues
that grow in proportion to the City’s assessed valuation and/or property tax increases, will be utilized
-48-

to make the principal and interest payments on the bonds. Other types of debt may be issued when it
is supported by a dedicated revenue source (i.e. revenue bonds paid by utility rates).
Defeasance of Bonds - The City shall review potential cost savings that may be achieved through
refunding of existing debt at lower interest rates.
Inter-fund Loans – The City will consider loans from one fund to another as an alternative to
installment loans and/or bond issuance. When evaluating inter-fund borrowing the financial health of
the lending fund will be closely reviewed, as well as the future cash flow projections for the fund
borrowing the money.
FUND BALANCE
General Fund - A minimum fund balance of 15.0% of the General Fund adopted budget
expenditures shall be maintained in the General and Budget Stabilization Fund. The minimum
balance represents about two months of expenditures; projected fund balance at the end of Fiscal
Years 2015 and 2016 is 22%.
All Other Funds – Each fund of the City represents a stand-alone financial operation and has its
own operating characteristics, financial capabilities and constraints. The level of reserves needed for
each fund is based on the financial and operating characteristics.
Reserves - As a part of the budgeting process, the City Council has made the decision to maintain
designated cash reserve balances in certain Internal Service Funds for the future purchases of
capital outlay.
FINANCIAL REPORTING POLICIES Accounting and Reporting Methods – The City’s accounting and financial reporting systems will be
maintained in conformance with all state and federal laws, generally accepted accounting principles
(GAAP) and standards of the Governmental Accounting Standards Board (GASB) and the
Government Finance Officers Association (GFOA).
Comprehensive Annual Financial Report (CAFR) – The City’s CAFR will be submitted to the
GFOA Certification of Achievement for Excellence in Financial Reporting Program. The financial
report should be conformity with GAAP, demonstrate compliance with finance related legal and
contractual provisions minimize ambiguities and potentials for misleading inference. The audit
opinion will be included with the City’s CAFR.
Distinguished Budget Awards Program – The City’s Fiscal Year 2016 Budget will be submitted to
the GFOA Distinguished Budget Presentation Program. The City received the GFOA Distinguished
Budget Award for its Fiscal Year 2015 submission, its twelfth consecutive award.
Internal Controls – Financial systems will maintain internal controls to monitor revenues,
expenditures and program performance on an ongoing basis.
Fiscal Monitoring – Financial reports present actual expenditures to the budget on a monthly and
cumulative basis. Major revenue sources are monitored quarterly, noting the status of each revenue
source as compared to the budget.
Monthly reports are presented to the City Manager and City Council indicating the status of actual
revenues and expenditures as compared to the budget on a monthly and cumulative basis. Notice
will be given if action is necessary to maintain the City’s financial position.
-49-

CITY OF HOLLAND
ANNUAL BUDGET RESOLUTION
FOR THE FISCAL YEAR JULY 1, 2016 - JUNE 30, 2017
May 4, 2016
HEREAS, notification of a public hearing on the annual budget for fiscal year 2016-17 as proposed by the City Council, has been duly published in accordance with Section 9.4 of the City Charter; and
WHEREAS, the proposed budget document has been placed on file for public inspection at Herrick District Library, Office of the City Clerk and the City of Holland website; and
WHEREAS, a public hearing on the proposed budget was held, as scheduled, at 7:00 P.M. on May 4, 2016 in the Council Chambers of City Hall, located at 270 River Avenue, Holland, to give interested citizens an opportunity to be heard;
THEREFORE, BE IT RESOLVED, that the City Council does hereby adopt the Annual Budget, of Estimated Revenues and Appropriations, by organizational unit, for all funds as therein presented, to include any modifications approved at the time of the public hearing, in accordance with requirements as set forth in Section 9.5 of the Holland City Charter and State of Michigan Act 621 of 1978, as amended, for the fiscal year July 1, 2016 through June 30, 2017; and
BE IT FURTHER RESOLVED, that the authorized employment positions and classifications are adopted as summarized in the personnel schedules of each fund and/or organizational unit, and any additional changes shall be the result of separate action of the City Council; and
BE IT FURTHER RESOLVED, that the compensation plans for all officials and employees shall be adopted as a separate action of the City Council; and
BE IT FURTHER RESOLVED, that any changes to fee and rate structures for various types of sales, services, uses or privileges, excluding utility rates, shall be adopted as a separate action of the City Council; and
BE IT FURTHER RESOLVED, that the City Manager is hereby authorized to make appropriation transfer adjustments from the Contingencies account of their respectively administered funds, and appropriation transfer adjustments within organization units of the same fund, and that individual appropriation transfer adjustments from a Contingencies account or within organizational units which exceed $10,000 may be authorized only by action of the City Council; and
BE IT FURTHER RESOLVED, that the City Manager is hereby authorized to administer appropriation adjustments to budgets of the fiscal year 2015-16, to the extent that such adjustments do not exceed the 2015-16 Revised Estimates, as outlined in the fiscal year 2016-17 annual budget; and
W
-50-

ANNUAL BUDGET RESOLUTION - Continued
BE IT FURTHER RESOLVED, that all open encumbrances in Governmental-Type Funds at June 30, 2016 will be liquidated and re-established as of July 1, 2016. The City Finance Office is hereby authorized to increase overall fund appropriations in the fiscal year 2016-17, directly from Fund Balance–Undesignated, equal to re-established encumbrances.
BE IT FURTHER RESOLVED, that the City of Holland's property tax millage levy against all classes of assessable property, at taxable valuations as approved by the Boards of Commissioners for Ottawa and Allegan counties, the State Tax Commission, and anticipated adjustments of the Michigan Tax Tribunal, for the fiscal year July 1, 2016 - June 30, 2017 is adopted as follows:
P r o p e r t y T a x M i l l a g e D e s i g n a t e d P u r p o s e Rate Amount
CITY OF HOLLAND Operating:
– General Government Operations 8.3494 $ 8,414,048 Capital Projects and Acquisitions:
– Sidewalk Development & Improvement 0.0500 50,387 – Street Development & Improvement 1.4268 1,437,848 – Municipal Capital Projects 0.3155 317,943
Debt Service Obligations: – General Obligation Debt 3.6290 3,766,932
Total Property Tax Millage Levy 13.7707 13,987,158
HERRICK DISTRICT LIBRARY – Library Operating 1.1000 1,108,517 – Library Debt Service Obligation 0.1386 143,868
Total Property Tax Millage Levy 1.2386 1,252,385
WEST MICHIGAN AIRPORT AUTHORITY 0.0992 99,968
GRAND TOTAL - TAX MILLAGE LEVY 15.1085 $ 15,339,511
DOWNTOWN DEVELOPMENT AUTHORITY 1.6034 $ 200,823
BE IT FURTHER RESOLVED, that the Herrick District Library and West Michigan Airport Authority (WMAA) millage rates are still subject to revision due to county equalization and Library or WMAA board action. If the Herrick District Library or WMAA rates are revised by County Equalization or board action prior to July 1,2015, then the City of Holland – Municipal Capital Projects rate will also be revised an equal amount; the total millage rate will remain at 15.1085 mills.
-51-

-52-

Schools,18%
State Education
Tax,15%
Intermediate School District,
13%
County, 12%
Other,8%
City of Holland, 34%
City of HollandAverage Property Tax Distribution
Principal Resident Properties
Property taxes account for 43% of General Fund revenues. Only $0.34of every tax dollar paid stays with the City of Holland, to fund the services provided to citizens. The above graph shows the distribution of the City's property tax dollars.
"Other" includes distribution to: Macatawa Area Express Transportation Authority, West Michigan Regional Airport Authority, Herrick District Library and the Holland Area Community Swimming Pool Authority.
Education, County & Other (66%) City of Holland (34%)
-53-

2015 2016 $ %
Residential Real Property + NEZ ($2,811,911) 544,175,806$ 566,196,788$ 22,020,982$ 4.05%
Business Real Property:
- Industrial 114,155,758$ 114,671,435$ 515,677$ 0.45%
- Commercial 244,689,377 257,083,309 12,393,932 5.07%
- Agricultural 1,437,358 1,496,290 58,932 4.10%
- Developmental 720,681 559,428 (161,253) -22.38%
- Total Business Real Property 361,003,174$ 373,810,462$ 12,807,288$ 3.55%
Personal Property:
- Industrial 218,838,700$ 92,244,100$ (126,594,600)$ -57.85%
- Commercial 33,822,000 38,226,300 4,404,300 13.02%
- Utilities 6,729,500 7,120,700 391,200 5.81%
- Total Business Personal Property 259,390,200$ 137,591,100$ (121,799,100)$ -46.96%
Total Business Property 620,393,374$ 511,401,562$ (108,991,812)$ -17.57%
Total Regular Assessment Roll 1,164,569,180$ 1,077,598,350$ (86,970,830)$ -7.47%
INDUSTRIAL FACILITIES TAX (IFT) ABATEMENT ASSESSMENT ROLL
@ Regular Valuations Real Property:
- New 17,471,515$ 17,771,760$ 300,245$ 1.72%
- Rehabilitated 578,040 578,040 - 0.00%
- Total Real Property 18,049,555$ 18,349,800$ 300,245$ 1.66%
Personal Property:
- New 39,197,000$ 18,747,900$ (20,449,100)$ -52.17%
- Rehabilitated - 0 - - 0 - - 0 - 0.00%
- Total Personal Property 39,197,000$ 18,747,900$ (20,449,100)$ -52.17%
Total Real and Personal Property 57,246,555$ 37,097,700$ (20,148,855)$ -35.20%
@ Taxable Valuation Equivalency 28,912,298$ 18,837,870$ (10,074,428)$ -34.84%
COMBINED SUMMARY OF CITY-WIDE PROPERTY ASSESSMENT ROLL
Regular Assessment Roll + NEZ 1,164,569,180$ 1,077,598,350$ (86,970,830)$ -7.47%
Tax Abatement Assessment Roll (IFT) 28,912,298 18,837,870 (10,074,428)$ -34.84%
Grand Total 1,193,481,478$ 1,096,436,220$ (97,045,258)$ -8.13%
For tax year 2016 (fiscal year 2017), the City of Holland administers ten individual Brownfield RedevelopmentPlans. Each plan includes a 'Tax Increment Financing' arrangement that 'Captures' accumulative taxable valuationincreases of all properties within the defined area of each plan. Most tax millages levied against the 'CapturedValuations' result in 'Captured Taxes' that accrue to the specific Brownfield Redevelopment Plan rather than tothe taxing unit. Total 'Captured Taxable Valuations' for tax year 2016 (fiscal year 2017) amount to $30,265,336.
For tax year 2016 (fiscal year 2017), P.A. 376 Tool & Die abatements amount to $4,726,781.For tax year 2016 (fiscal year 2017), P.A. 376 Michigan Strategic Fund abatements amount to $53,674,805.
TAXABLE VALUATIONS ABATED FOR RENAISSANCE RECOVERY ZONE
TAXABLE VALUATIONS - 'CAPTURED' TO BROWNFIELD REDEVELOPMENT PLANS
Increase ( Decrease )
COMPARISON OF PROPERTY TAXABLE VALUATION ROLL FOR 2015 AND 2016
Tax Year
- - BY PROPERTY CLASSIFICATION - -
REGULAR ASSESSMENT ROLL EXPRESSED AT TAXABLE VALUATION
-54-

BY SCHOOL DISTRICT JURISDICTIONS WITHIN THE CITY OF HOLLAND
Holland Public Hamilton Public Zeeland PublicSchools Schools Schools Combined
REGULAR ASSESSMENT ROLL:
Real Property + NEZ ($2,811,911) 851,332,607$ 88,674,643$ - 0 -$ 940,007,250$
Personal Property 71,655,100 65,927,400 8,600 137,591,100
Total 922,987,707$ 154,602,043$ 8,600$ 1,077,598,350$
IFT ABATEMENT ASSESSMENT ROLL:
New Property 19,617,531$ 16,902,129$ - 0 -$ 36,519,660$
Rehabilitated Property 578,040 - 0 - - 0 - 578,040
Total 20,195,571$ 16,902,129$ - 0 -$ 37,097,700$
Valuation for Budgeting Purposes 10,386,806$ 8,451,065$ - 0 -$ 18,837,870$
TOTAL TAXABLE VALUATION 933,374,513$ 163,053,108$ 8,600$ 1,096,436,220$
BY COUNTY GOVERNMENT JURISDICTIONS WITHIN THE CITY OF HOLLAND
Ottawa Allegan Combined
REGULAR ASSESSMENT ROLL:
Real Property + NEZ ($2,811,911) 654,661,069$ 285,346,181$ 940,007,250$
Personal Property 45,181,300 92,409,800 137,591,100
Total 699,842,369$ 377,755,981$ 1,077,598,350$
IFT ABATEMENT ASSESSMENT ROLL:
New Property 7,124,613$ 29,395,047$ 36,519,660$
Rehabilitated Property 244,900 333,140 578,040
Total 7,369,513$ 29,728,187$ 37,097,700$
Valuation for Budgeting Purposes 3,807,207$ 15,030,664$ 18,837,870$
TOTAL TAXABLE VALUATION 703,649,576$ 392,786,645$ 1,096,436,220$
TAXABLE VALUATIONS 'CAPTURED' TO BROWNFIELD REDEVELOPMENT PLANS
For tax year 2016 (fiscal year 2017), the City of Holland administers ten individual Brownfield Redevelopment
Plans. Each plan includes a 'Tax Increment Financing' arrangement that 'Captures' accumulative taxable valuation
increases of all properties within the defined area of each plan. Most tax millages levied against the 'Captured
Valuations' result in 'Captured Taxes' that accrue to the specific Brownfield Redevelopment Plan rather than to
the taxing unit. Total 'Captured Taxable Valuations' for tax year 2016 (fiscal year 2017) amount to $30,265,336.
TAXABLE VALUATIONS ABATED FOR RENAISSANCE RECOVERY ZONE
For tax year 2016 (fiscal year 2017), P.A. 376 Tool & Die abatements amount to $4,726,781.
For tax year 2016 (fiscal year 2017), P.A. 376 Michigan Strategic Fund abatements amount to $53,674,805.
County Of
SUMMARY OF PROPERTY TAXABLE VALUATION ROLL FOR TAX YEAR 2016
-55-

% Of Total % Of Total
Taxable Taxable Taxable Taxable
Property Type Valuation Valuation Valuation Valuation
Residential Property
Regular Assessment Roll:
- Real Property + NEZ ($2,811,911) 544,175,806$ 566,196,788$
Total - All Residential Property 544,175,806$ 45.60% 566,196,788$ 51.64%
Business Property
Regular Assessment Roll:
- Real Property 361,003,174$ 373,810,462$
- Personal Property 259,390,200 137,591,100
- Total 620,393,374$ 511,401,562$
IFT Abatement Assessment Roll:
- Real Property 9,313,798$ 9,463,920$
- Personal Property 19,598,500 9,373,950
- Total 28,912,298$ 18,837,870$
Total - All Business Property 649,305,672$ 54.40% 530,239,432$ 48.36%
Grand Total - All Property 1,193,481,478$ 100.00% 1,096,436,220$ 100.00%
Total - All Real Property 914,492,778$ 76.62% 949,471,170$ 86.60%
Total - All Personal Property 278,988,700 23.38% 146,965,050 13.40%
Grand Total - All Property 1,193,481,478$ 100.00% 1,096,436,220$ 100.00%
For tax year 2016 (fiscal year 2017), the City of Holland administers ten individual Brownfield Redevelopment
Plans. Each plan includes a 'Tax Increment Financing' arrangement that 'Captures' accumulative taxable valuation
increases of all properties within the defined area of each plan. Most tax millages levied against the 'Captured
Valuations' result in 'Captured Taxes' that accrue to the specific Brownfield Redevelopment Plan rather than to
the taxing unit. Total 'Captured Taxable Valuations' for tax year 2016 (fiscal year 2017) amount to $30,265,336.
For tax year 2016 (fiscal year 2017), P.A. 376 Tool & Die abatements amount to $4,726,781.
For tax year 2016 (fiscal year 2017), P.A. 376 Michigan Strategic Fund abatements amount to $53,674,805.
COMPARISON OF PROPERTY TAXABLE VALUATION ROLL FOR 2015 AND 2016
- - BY PROPERTY TYPE - -
TAXABLE VALUATIONS - RESIDENTIAL PROPERTY AND BUSINESS PROPERTY
TAXABLE VALUATIONS - REAL PROPERTY AND PERSONAL PROPERTY
TAXABLE VALUATIONS ABATED FOR TOOL & DIE RENAISSANCE RECOVERY ZONE
TAXABLE VALUATIONS - 'CAPTURED' TO BROWNFIELD REDEVELOPMENT PLANS
TAX YEAR 2015 TAX YEAR 2016
-56-

Assessed TaxableProperty Type Valuation Valuation Difference
Residential Property
Regular Assessment Roll + NEZ: 687,208,900$ 566,196,788$ 121,012,112$
Land Bank Assessment Roll:
- Total 32,500$ 25,271$ 7,229$
- Total (Taxable Equivalency) 16,250$ 12,636$ 3,615$
Total - All Residential Property (Taxable Equivalency) 687,225,150$ 566,209,424$ 121,015,727$
Business Property
Regular Assessment Roll: 560,074,700$ 511,401,562$ 48,673,138$
Land Bank Assessment Roll:
- Total 31,600$ 27,615$ 3,985$
- Total (Taxable Equivalency) 15,800$ 13,808$ 1,993$
IFT Abatement Assessment Roll:
- Real Property 22,047,500$ 17,799,375$ 4,248,125$
- Real Rehab Property 578,100$ 578,040$ 60$
- Personal Property 18,747,900 39,197,000 (20,449,100)$
- Total 41,373,500$ 57,574,415$ (16,200,915)$
- Total (Taxable Equivalency) 20,975,800$ 29,076,228$ (8,100,428)$
Total - All Business Property (Taxable Equivalency) 581,066,300$ 540,491,597$ 40,574,703$
Grand Total - All Property 1,268,291,450$ 1,106,701,021$ 161,590,430$
Reduction Percentage
12.74%
For tax year 2016 (fiscal year 2017), the City of Holland administers ten individual Brownfield Redevelopment
Plans. Each plan includes a 'Tax Increment Financing' arrangement that 'Captures' accumulative taxable valuation
increases of all properties within the defined area of each plan. Most tax millages levied against the 'Captured
Valuations' result in 'Captured Taxes' that accrue to the specific Brownfield Redevelopment Plan rather than to
the taxing unit. Total 'Captured Taxable Valuations' for tax year 2016 (fiscal year 2017) amount to $30,265,336.
For tax year 2016 (fiscal year 2017), P.A. 376 Tool & Die abatements amount to $4,726,781.
For tax year 2016 (fiscal year 2017), P.A. 376 Michigan Strategic Fund abatements amount to $53,674,805.
TAXABLE VALUATIONS ABATED FOR TOOL & DIE RENAISSANCE RECOVERY ZONE
TAXABLE VALUATIONS - 'CAPTURED' TO BROWNFIELD REDEVELOPMENT PLANS
COMPARISON OF PROPERTY TAXABLE VALUATION COMPARED TO ASSESSED VALUATION ROLL 2016
- - BY PROPERTY TYPE - -
VALUATIONS - RESIDENTIAL PROPERTY AND BUSINESS PROPERTY
-57-

2007 2008 2009 2010 2011 2012 2013 2014 2015 2016
Assessed Value 1.2% -1.0% -0.7% -10.6% -5.5% -6.5% 2.7% 5.7% 7.2% 2.5%
Taxable Value 3.5% -0.2% 1.8% -8.3% -4.1% -5.9% 1.7% 1.2% 5.0% -2.5%
-12.0%
-7.0%
-2.0%
3.0%
8.0%
Perc
enta
ge C
hange
PERCENTAGE CHANGE IN SEV & TAXABLE VALUETAX YEAR 2007-2016
(ad-valorem parcels not including LG Ren Zone)
-58-

-
100
200
300
400
500
600
700
800
900
1,000
1,100
1,200
1,300
FY-08 FY-09 FY-10 FY-11 FY-12 FY-13 FY-14 FY-15 FY-16 FY-17
M
I
L
L
I
O
N
S
O
F
D
O
L
L
A
R
S
CITY OF HOLLAND REGULAR/IFT ASSESSMENT COMPOSITION
REAL PERSONAL REAL PERSONAL
NOTE: The tax base of each fiscal year is established on December 31 preceding the beginning of the fiscal year.
IFT Tax Abatement RollRegular Tax Roll
-59-

28.1 25.9
18.4 15.2
12.8 10.3 9.2 9.2 9.3 9.5
30.0
27.9
24.3
21.7
19.9
17.817.4 18.7 19.6
9.4
0.0
10.0
20.0
30.0
40.0
50.0
60.0
70.0
80.0
FY-08 FY-09 FY-10 FY-11 FY-12 FY-13 FY-14 FY-15 FY-16 FY-17
M
I
L
L
I
O
N
S
O
F
D
O
L
L
A
R
S
CITY OF HOLLANDIFT ABATED PROPERTY ASSESSMENTS
TAX ABATEMENT REAL PROPERTY TAX ABATEMENT PERSONAL PROPERTY
-60-

Taxing Jurisdiction
BROWNFIELD REDEVELOPMENT TAX INCREMENT FINANCING PLANS
TAX YEAR 2016 T.I.F. CAPTURED TAXABLE VALUATIONS BY SPECIFIC MILLAGE LEVY ITEMS OF EACH TAXING UNIT WITH IFTS EXPRESSED AT EQUIVALENCY
(16th St Development) (E 48th St Properties)
29 E.6th St.
(5th St Partners,LLC)
570 E.16th St.
BROWNFIELD REDEVELOPMENT AUTHORITY - LOCAL DISTRICT FINANCING AUTHORITY
665 E.48th St.Crescent Shores
(561 Crescent Dr)
ture
ture
ture
dable
ation
ture
ture
ture
dable
ation
ture
dable
ation
ture
dable
ation
CITY OF HOLLAND
-Debt Service Levies:
Gen.Obligation Debt N - 0 - N - 0 - N - 0 - N - 0 -
-Operating Levies:
General Y 2,828,994 Y 2,691,725 Y 1,830,264 Y 104,556
-Capital Levies:
Property Acquisition Y 2,828,994 Y 2,691,725 Y 1,830,264 Y 104,556
Street Improv. Y 2,828,994 Y 2,691,725 Y 1,830,264 Y 104,556
Sidewalk Improv. Y 2,828,994 Y 2,691,725 Y 1,830,264 Y 104,556
Municipal Cap.Improv. Y 2,828,994 Y 2,691,725 Y 1,830,264 Y 104,556
-All Other:
Special Assessments N - 0 - N - 0 - N - 0 - N - 0 -
Misc. Assm'ts & Fees N - 0 - N - 0 - N - 0 - N - 0 -
D.D.A. Operating N - 0 - N - 0 - N - 0 - N - 0 -
1% Tax Admin Fee N - 0 - N - 0 - N - 0 - N - 0 -
MACATAWA TRANS. AUTH.
Operating Y 2,828,994 Y 2,691,725 Y 1,830,264 Y 104,556
WEST MI AIRPOR AUTH.
Operating Y 2,828,994 Y 2,691,725 Y 1,830,264 Y 104,556
DISTRICT LIBRARY
Debt Service N - 0 - N - 0 - N - 0 - N - 0 -
Operating Y 2,828,994 Y 2,691,725 Y 1,830,264 Y 104,556
COMMUNITY POOL
Debt N - 0 - N - 0 - N - 0 - N - 0 -
Operating Y 2,828,994 Y 2,691,725 Y 1,830,264 Y 104,556
COUNTY OF ALLEGAN
Operating - - - - - - - - - - - - - - - - - - - - - - - - Y 104,556
Road Improvements - - - - - - - - - - - - - - - - - - - - - - - - Y 104,556
Emergency 911 - - - - - - - - - - - - - - - - - - - - - - - - Y 104,556
COUNTY OF OTTAWA
Operating Y 2,828,994 Y 2,691,725 Y 1,830,264 - - - - - - - -
Parks Y 2,828,994 Y 2,691,725 Y 1,830,264 - - - - - - - -
Emergency 911 Y 2,828,994 Y 2,691,725 Y 1,830,264 - - - - - - - -
INTERMEDIATE SCHOOL
General Education Y 2,828,994 Y 2,691,725 Y 1,830,264 Y 104,556
Special Education Y 2,828,994 Y 2,691,725 Y 1,830,264 Y 104,556
Vocational Education Y 2,828,994 Y 2,691,725 Y 1,830,264 Y 104,556
HOLLAND SCHOOL
Debt N - 0 - N - 0 - N - 0 - N - 0 -
Operating Y - 0 - N - 0 - Y 1,511,297 Y 19,800
Bldg & Site Sinking Fd N - 0 - N - 0 - N - 0 - N - 0 -
STATE OF MICHIGAN
State Education Tax Y - 0 - N - 0 - Y 1,830,264 Y 36,700
Captu
Captu
Captu
Taxa
Valu
a
Captu
Captu
Captu
Taxa
Valu
a
Captu
Taxa
Valu
a
Captu
Taxa
Valu
a
-61-

Taxing Jurisdiction
BROWNFIELD REDEVELOPMENT TAX INCREMENT FINANCING PLANS
TAX YEAR 2016 T.I.F. CAPTURED TAXABLE VALUATIONS BY SPECIFIC MILLAGE LEVY ITEMS OF EACH TAXING UNIT WITH IFTS EXPRESSED AT EQUIVALENCY
479 Columbia Ave.
(Plaza East)(Baker-Lofts)
99 E 8th St.
(Lincolnshire)
BROWNFIELD REDEVELOPMENT AUTHORITY - LOCAL DISTRICT FINANCING AUTHORITY
573 Columbia Ave. 1110 Lincoln Ave.
(Purple House Prod.)
ture
d
able
ation
ture
ture
ture
ture
d
able
ation
ture
d
able
ation
ture
ture
d
able
ation
CITY OF HOLLAND
-Debt Service Levies:
Gen.Obligation Debt N - 0 - N - 0 - N - 0 - N - 0 -
-Operating Levies:
General Y 7,987,418 Y 191,428 Y 3,241,226 Y - 0 -
-Capital Levies:
Property Acquisition Y 7,987,418 Y 191,428 Y 3,241,226 Y - 0 -
Street Improv. Y 7,987,418 Y 191,428 Y 3,241,226 Y - 0 -
Sidewalk Improv. Y 7,987,418 Y 191,428 Y 3,241,226 Y - 0 -
Municipal Cap.Improv. Y 7,987,418 Y 191,428 Y 3,241,226 Y - 0 -
-All Other:
Special Assessments N - 0 - N - 0 - N - 0 - N - 0 -
Misc. Assm'ts & Fees N - 0 - N - 0 - N - 0 - N - 0 -
D.D.A. Operating N - 0 - N - 0 - N - 0 - N - 0 -
1% Tax Admin Fee N - 0 - N - 0 - N - 0 - N - 0 -
MACATAWA TRANS. AUTH.
Operating Y 7,987,418 Y 191,428 Y 3,241,226 Y - 0 -
WEST MI AIRPOR AUTH.
Operating Y 7,987,418 Y 191,428 Y 3,241,226 Y - 0 -
DISTRICT LIBRARY
Debt Service N - 0 - N - 0 - N - 0 - N - 0 -
Operating Y 7,987,418 Y 191,428 Y 3,241,226 Y - 0 -
COMMUNITY POOL
Debt N - 0 - N - 0 - N - 0 - N - 0 -
Operating Y 7,987,418 Y 191,428 Y 3,241,226 Y - 0 -
COUNTY OF ALLEGAN
Operating - - - - - - - - Y 191,428 - - - - - - - - - - - - - - - -
Road Improvements - - - - - - - - Y 191,428 - - - - - - - - - - - - - - - -
Emergency 911 - - - - - - - - Y 191,428 - - - - - - - - - - - - - - - -
COUNTY OF OTTAWA
Operating Y 7,987,418 - - - - - - - - Y 3,241,226 Y - 0 -
Parks Y 7,987,418 - - - - - - - - Y 3,241,226 Y - 0 -
Emergency 911 Y 7,987,418 - - - - - - - - Y 3,241,226 Y - 0 -
INTERMEDIATE SCHOOL
General Education Y 7,987,418 Y 191,428 Y 3,241,226 Y - 0 -
Special Education Y 7,987,418 Y 191,428 Y 3,241,226 Y - 0 -
Vocational Education Y 7,987,418 Y 191,428 Y 3,241,226 Y - 0 -
HOLLAND SCHOOL
Debt N - 0 - N - 0 - N - 0 - N - 0 -
Operating Y 6,061,890 N - 0 - Y 3,241,226 N - 0 -
Bldg & Site Sinking Fd N - 0 - N - 0 - N - 0 - N - 0 -
STATE OF MICHIGAN
State Education Tax Y 7,987,418 N - 0 - Y 3,241,226 N - 0 -
Captu
Taxa
Valu
a
Captu
Captu
Captu
Captu
Taxa
Valu
a
Captu
Taxa
Valu
a
Captu
Captu
Taxa
Valu
a
-62-

Grand
Taxing Jurisdiction Totals
BROWNFIELD REDEVELOPMENT TAX INCREMENT FINANCING PLANS
TAX YEAR 2016 T.I.F. CAPTURED TAXABLE VALUATIONS BY SPECIFIC MILLAGE LEVY ITEMS OF EACH TAXING UNIT WITH IFTS EXPRESSED AT EQUIVALENCY
146 River Ave. 7th Street
(Scrap Yard Lofts) (City Parking Deck)
BROWNFIELD REDEVELOPMENT AUTHORITY - LOCAL DISTRICT FINANCING AUTHORITY
ture
ture
d
able
ation
ture
ture
d
able
ation
ture
d
able
ation
CITY OF HOLLAND
-Debt Service Levies:
Gen.Obligation Debt N - 0 - N - 0 - - 0 -
-Operating Levies:
General Y 1,271,276 Y 9,951,463 30,098,350
-Capital Levies:
Property Acquisition Y 1,271,276 Y 9,951,463 30,098,350
Street Improv. Y 1,271,276 Y 9,951,463 30,098,350
Sidewalk Improv. Y 1,271,276 Y 9,951,463 30,098,350
Municipal Cap.Improv. Y 1,271,276 Y 9,951,463 30,098,350
-All Other:
Special Assessments N - 0 - N - 0 - - 0 -
Misc. Assm'ts & Fees N - 0 - N - 0 - - 0 -
D.D.A. Operating N - 0 - N - 0 - - 0 -
1% Tax Admin Fee N - 0 - N - 0 - - 0 -
MACATAWA TRANS. AUTH.
Operating Y 1,271,276 Y 9,951,463 30,098,350
WEST MI AIRPOR AUTH.
Operating Y 1,271,276 Y 9,951,463 30,098,350
DISTRICT LIBRARY
Debt Service N - 0 - N - 0 - - 0 -
Operating Y 1,271,276 Y 9,951,463 30,098,350
COMMUNITY POOL
Debt N - 0 - N - 0 - - 0 -
Operating Y 1,271,276 Y 9,951,463 30,098,350
COUNTY OF ALLEGAN
Operating - - - - - - - - - - - - - - - - 295,984
Road Improvements - - - - - - - - - - - - - - - - 295,984
Emergency 911 - - - - - - - - - - - - - - - - 295,984
COUNTY OF OTTAWA
Operating Y 1,271,276 Y 9,951,463 29,802,366
Parks Y 1,271,276 Y 9,951,463 29,802,366
Emergency 911 Y 1,271,276 Y 9,951,463 29,802,366
INTERMEDIATE SCHOOL
General Education Y 1,271,276 Y 9,951,463 30,098,350
Special Education Y 1,271,276 Y 9,951,463 30,098,350
Vocational Education Y 1,271,276 Y 9,951,463 30,098,350
HOLLAND SCHOOL
Debt N - 0 - N - 0 - - 0 -
Operating Y 1,271,276 Y 9,951,463 22,056,952
Bldg & Site Sinking Fd N - 0 - N - 0 - - 0 -
STATE OF MICHIGAN
State Education Tax Y 1,271,276 Y 9,951,463 24,318,347
Captu
Captu
Taxa
Valu
a
Captu
Captu
Taxa
Valu
a
Captu
Taxa
Valu
a
-63-

Tax Year 2015 Tax Year 2016
FY 2015-16 FY 2016-17 Amount Percent
C i t y o f H o l l a n d - Operating Levies:
General 9.5000 8.3494 (1.1506) - 12.11%
Total Operating 9.5000 8.3494 (1.1506) - 12.11%
- Capital Levies:
Property Acquisition 0.0000 0.0000 0.0000 0.00%
Street Improvement Projects 1.4268 1.4268 0.0000 0.00%
Sidewalk Improvement Projects 0.0500 0.0500 0.0000 0.00%
Municipal Capital Projects 0.5765 (1) 0.3155 (1) (0.2610) - 45.27%
Total Capital 2.0533 1.7923 (0.2610) - 12.71%
- Debt Service Levies:
General Obligation Debt 2.2198 3.6290 1.4092 63.48%
- Total City of Holland 13.7731 13.7707 (0.0024) - 0.02%
H e r r i c k D i s t r i c t L i b r a r y - Operating 1.1000 1.1000 0.0000 0.00%
- Debt Service 0.1362 (1) 0.1386 (1) 0.0024 1.76%
- Total Herrick District Library 1.2362 1.2386 0.0024 0.19%
A i r p o r t A u t h o r i t y 0.0992 0.0992 0.0000 0.00%
T o t a l M i l l a g e L e v y R a t e 15.1085 15.1085 (0.0000) - 0.00%
C i t y o f H o l l a n d
- Operating Levies:
General 9,975,857 8,414,048 (1,561,809) - 15.66%
Total Operating 9,975,857$ 8,414,048$ (1,561,809)$ - 15.66%
- Capital Levies:
Property Acquisition - 0 - - 0 - - 0 - 0.00%
Street Improvement Projects 1,498,269 1,437,848 (60,421) - 4.03%
Sidewalk Improvement Projects 52,505 50,387 (2,118) - 4.03%
Municipal Capital Projects 605,377 317,943 (287,434) - 47.48%
Total Capital 2,156,151$ 1,806,178$ (349,973)$ - 16.23%
- Debt Service Levies:
General Obligation Debt * 2,383,458 3,766,932 1,383,474 58.04%
- Total City of Holland 14,515,466$ 13,987,158$ (528,308)$ - 3.64%
H e r r i c k D i s t r i c t L i b r a r y
- Operating 1,155,099 1,108,517 (46,582) - 4.03%
- Debt Service * 146,242 143,868 (2,374) - 1.62%
- Total Herrick District Library 1,301,341$ 1,252,385$ (48,956)$ - 3.76%
A i r p o r t A u t h o r i t y 104,169 99,968 (4,201) - 4.03%
T o t a l M i l l a g e L e v y A m o u n t 15,920,976$ 15,339,511$ (581,465)$ - 3.65%
* Brownfield Captures Are Not Excluded From Debt Service Levies
(1) Final Adjusted Millage Rate Per County Equalization
PROPERTY TAX MILLAGE AMOUNTS
PROPERTY TAX LEVY
PROPOSED MILLAGE RATES AND AMOUNTS FOR THE FISCAL YEAR 2016-17
Increase ( Decrease )
PROPERTY TAX MILLAGE RATES
-64-

Tax Year 2015 Tax Year 2016
FY 2015-16 FY 2016-17 Change
Regular Roll (Includes Frozen NEZ) 1,162,577,825$ 1,077,598,350$ (84,979,475)$ - 7.31%
- Less Renaissance Zones
- LS Mold Tool & Die (636,583) (187,051) 449,532
- STM Manufacturing Tool & Die (702,859) (426,940) 275,919
- Buhler Prince (1,901,596) (2,099,904) (198,308)
- LG Chem/Compact Power (68,787,456) (53,674,805) 15,112,651
- Johnson Controls - Saft APS (43,020,272) - 0 - 43,020,272
Subtotal Renaissance Zones (115,048,766) (56,388,700) 58,660,066
- Less Brownfields:
- 29 East 6th Street (5th St Partners) (2,801,630) (2,828,994) (27,364)
- 665 East 48th Street (Lifesavers) (125,703) (104,556) 21,147
- 570 East 16th Street (GE) (3,033,625) (2,691,725) 341,900
- 573 Columbia Ave (Baker-Lofts) (7,652,890) (7,987,428) (334,538)
- 99 East 8th Street (Plaza East) (3,054,972) (3,421,226) (366,254)
- 146 River Ave (Scrap Yard Lofts) (587,327) (1,271,276) (683,949)
- 7th Street Project (Parking Deck) (6,133,729) (9,951,463) (3,817,734)
- 1110 Lincoln Ave (Lincolnshire) (159,284) (191,428) (32,144)
- 561 Crescent Drive (Crescent Shores) (86,909) (1,817,240) (1,730,331)
Subtotal Brownfields (23,636,069) (30,265,336) (6,629,267)
- Less Landbank (26,365) (26,443) (79)
Subtotal Regular Roll 1,023,866,626 990,917,871 (32,948,755)$ - 3.22%
Tax Abatement Roll (Expressed at Equivalency) 28,596,913 18,837,870 (9,759,043) - 34.13%
- Less Renaissance Zones - 0 -
- Buhler Prince (1,672,368) (1,499,550) 172,818
- STM Manufacturing Tool & Die (700,996) (513,336) 187,660
Subtotal Renaissance Zones (2,373,364) (2,012,886) 360,478
Subtotal Abatement Roll 26,223,549 16,824,984 (9,398,565)$ - 35.84%
Total - All Rolls Adjusted 1,050,090,175$ 1,007,742,855$ (42,347,320)$ - 4.03%
Valuation to Add Back to Debt Levies 23,636,069 30,265,336 6,629,267 28.05%
Valuation of Brownfields/Renaissance Zones 141,058,199 88,666,922 (52,391,277) - 37.14%
FY16 Note - the adjustments in the formulas of the Debt Services levies (City and Library) of $23,636,069 relate to
the Brownfield capture portion which is not applicable to be deducted from the debt service levies.
The total FY16 Taxable Valuation used for Debt Service computation is $1,074,015,264.
FY17 Note - the adjustments in the formulas of the Debt Services levies (City and Library) of $30,265,336 relate to
the Brownfield capture portion which is not applicable to be deducted from the debt service levies.
The total FY17 Taxable Valuation used for Debt Service computation is $1,038,008,191.
CITY OF HOLLAND
PROPERTY ASSESSMENT ROLLS EXPRESSED AS TAXABLE VALUATIONS
-65-

CITY OF HOLLAND
1% PROPERTY TAX ADMINISTRATION FEE
SUMMARY OF PROJECTED REVENUES TO BE GENERATED
FOR FISCAL YEAR 2016-17
Projected
2016 Taxable Value 1%
Within 2016-17 Millage Administration
Taxing Jurisdiction City of Holland Rates Amounts Fee
City of Holland 1,038,808,189$ 13.7707 14,305,116$ 143,051$
- Unfrozen NEZ Property 2,688,811 12.7270 34,221 342
Special Assessments/Operating Assessments 700,000 7,000
Downtown Development Authority 125,248,189 1.6034 200,823 2,008
Herrick District Library 1,041,497,000 1.2386 1,289,998 12,900
West Michigan Airport Authority 1,041,497,000 0.0992 103,317 1,033
State of Michigan 948,905,550 6.0000 5,693,433 56,934
- Commercial Personal Property 38,309,750 6.0000 229,859 2,299
- Industrial Personal Property 54,281,700 - 0 - - 0 - 0
Holland Public School District:
- Principal Residence Exempt Properties (a) 476,997,544 7.3622 3,511,751 35,118
- Non-Principal Residence Properties 382,854,609 25.3622 9,710,035 97,100
- Commercial Personal Property 33,555,150 13.3622 448,371 4,484
- Industrial Personal Property 34,894,650 7.3622 256,901 2,569
- Renaissance Zones - Debt Only 5,099,003 6.6200 33,755 338
Hamilton Community School District:
- Principal Residence Exempt Properties (a) 19,848,203 4.5000 89,317 893
- Non-Principal Residence Properties 69,196,594 22.5000 1,556,923 15,569
- Commercial Personal Property 4,754,600 10.5000 49,923 499
- Industrial Personal Property 19,387,050 4.5000 87,242 872
- Renaissance Zones - Debt Only 55,876,621 4.5000 251,445 2,514
Zeeland Public School District:
- Principal Residence Exempt Properties (a) - 0 - 8.3500 - 0 - - 0 -
- Non-Principal Residence Properties 8,600 26.3500 227 2
Ottawa Intermediate School District 1,041,497,000 5.5234 5,752,605 57,526
Holland Area Community Pool Authority 928,301,953 1.6675 1,547,944 15,479
MAX Authority 1,041,497,000 0.3989 415,453 4,155
County of Allegan 331,811,021 6.0937 2,021,957 20,220
County of Ottawa 639,985,141 4.8565 3,108,088 31,081
- Unfrozen NEZ Property 2,688,811 4.4065 11,848 118
Total 51,398,702$ 513,987$
Additional Notes
(a) The taxable valuation of "Principal Residence Properties" for each of the school districts within the
City of Holland are estimated using the most current information available in the database files.
However, estimates are subject to adjustments prior to tax levy in July and December 2016.
Any adjustments will affect the amounts to be received for the 1% Property Tax Administration Fee.
Valuations are adjusted downward by the LG Chem Renaissance Zone - school debt shown separately.
-66-

DOWNTOWN DEVELOPMENT AUTHORITY
SUMMARY OF PROPERTY ASSESSMENT ROLL, TAX RATE AND TAX LEVY
FISCAL YEAR 2015-16 AND FISCAL YEAR 2016-17
Tax Year 2015 Tax Year 2016FY 2015-16 FY 2016-17 Amount Percent
PROPERTY TAXABLE VALUATION ROLL
Regular Roll:
- Real Property 107,379,167$ 113,528,341$ 6,149,174$ 5.73%
- Personal Property 9,862,200 9,921,900 59,700 0.61%
- Total 117,241,367$ 123,450,241$ 6,208,874$ 5.30%
Tax Abatement Roll
- Real Property (includes NEZ) 151,075$ 912,948$ 761,873$ 504.30%
- Personal Property 2,350,200 1,770,000 (580,200) -24.69%
- Total: 2,501,275$ 2,682,948$ 181,673$ 7.26%
- Total (Taxing Equivalency): 1,326,175$ 1,797,948$ 471,773 35.57%
Total Assessment Rolls 118,567,542$ 125,248,189$ 6,680,647$ 5.63%
PROPERTY TAX MILLAGE RATE LEVY
Operating Rate
- For Operations & Maintenance 1.6034 1.6034 - 0 - 0.00%
PROPERTY TAX MILLAGE AMOUNT LEVY
Operating Levy
- For Operations & Maintenance 190,111$ 200,823$ 10,712$ 5.63%
Increase ( Decrease )
-67-

TY2007 TY2008 TY2009 TY2010 TY2011 TY2012 TY2013 TY2014 TY2015 TY2016
FY-08 FY-09 FY-10 FY-11 FY-12 FY-13 FY-14 FY-15 FY-16 FY-17
Agricultural 0.2% 0.2% 0.2% 0.1% 0.1% 0.2% 0.1% 0.1% 0.1% 0.1%
Commercial 23.7% 24.7% 24.7% 26.0% 25.3% 24.0% 23.0% 22.0% 23.4% 27.0%
Industrial 25.7% 24.7% 25.2% 24.7% 24.8% 28.6% 30.5% 31.5% 30.3% 20.5%
Residential 50.0% 50.0% 49.5% 48.6% 49.1% 46.4% 45.7% 45.7% 45.5% 51.6%
Utility 0.4% 0.4% 0.4% 0.5% 0.6% 0.6% 0.6% 0.6% 0.6% 0.7%
Developmental 0.0% 0.0% 0.0% 0.1% 0.1% 0.2% 0.1% 0.1% 0.1% 0.1%
Total 100.0% 100.0% 100.0% 100.0% 100.0% 100.0% 100.0% 100.0% 100.0% 100.0%
MULTI-YEAR COMPARATIVE OVERVIEW
PROPERTY CLASSIFICATIONS EXPRESSED AS A PERCENTAGE
OF ANNUAL PROPERTY VALUATION OF TOTAL CITY
(Includes Real & Personal Properties of Regular Tax Roll,
plus Tax Abatement Properties at Taxable Equivalency Values)
-68-

0%
10%
20%
30%
40%
50%
60%
70%
80%
90%
100%
'08 '09 '10 '11 '12 '13 '14 '15 '16 '17
CITY OF HOLLANDPROPERTY CLASSIFICATION
Residential Commercial / Industrial / Other
FISCAL YEAR
NOTE: Above property assessment chart presentation includes both ad valorem properties and IFT abatement properties.
-69-

% Change
West Increase
LTGO MAX Michigan Herrick (Decr.)
Fiscal Debt General Property Street Municipal Public Airport District In Total
Year Service Operating Acquis. Improv. Sidewalk Projects Transit Authority Library Total Rate
1998 1.1216 8.9900 0.2500 0.2500 0.0000 1.1078 0.2750 0.0000 1.4886 * 13.4831 0.00%
1999 1.2840 8.8790 0.2500 1.0000 0.2500 1.0470 0.1500 0.0000 1.3673 14.2273 5.52%
2000 1.2500 8.8000 0.2500 1.0000 0.2500 1.1000 0.1500 0.0000 1.3827 14.1827 -0.31%
2001 1.1000 8.9389 0.2500 1.0000 0.2500 1.1000 0.1500 0.0000 1.3938 14.1827 0.00%
2002 1.1108 8.8389 0.2500 1.0000 0.2500 1.1000 0.2500 0.0000 1.3830 14.1827 0.00%
2003 1.3620 9.0000 0.1000 0.9500 0.1000 0.8876 0.2234 0.0000 1.3770 14.0000 -1.29%
2004 1.5000 9.2421 0.1000 1.0000 0.1000 0.5000 0.2000 0.0000 1.3579 14.0000 0.00%
2005 2.0000 9.4590 0.0500 1.0000 0.0500 0.0000 0.1000 0.0000 1.3410 14.0000 0.00%
2006 2.0910 9.4337 0.0000 1.0000 0.0500 0.0000 0.1000 0.0000 1.3253 14.0000 0.00%
2007 1.9586 9.5188 0.0000 1.0000 0.0500 0.0142 0.1473 0.0000 1.3111 14.0000 0.00%
2008 1.8551 9.3361 0.0000 1.0000 0.0500 0.2977 0.0000 0.0000 1.3111 13.8500 -1.07%
2009 1.9504 9.3361 0.0000 1.0000 0.0500 0.2049 0.0000 0.1000 * 1.3086 13.9500 0.72%
2010 1.6379 9.5000 0.0000 1.0000 0.0500 0.4079 0.0000 0.1000 1.2542 13.9500 0.00%
2011 2.1277 9.5089 0.0000 1.0000 0.0500 0.2000 0.0000 0.1000 1.2634 14.2500 2.15%
2012 2.1946 9.5000 0.0000 1.0000 0.0500 0.1371 0.0000 0.1000 1.2683 14.2500 0.00%
2013 2.8936 9.6585 0.0000 1.0000 0.0500 0.1343 0.0000 0.1000 1.2721 15.1085 6.02%
2014 2.8069 9.6585 0.0000 1.0000 0.0500 0.2351 0.0000 0.1000 1.2580 15.1085 0.00%
2015 2.3400 9.5000 0.0000 1.3669 0.0500 0.4945 0.0000 0.1000 1.2571 15.1085 0.00%
2016 2.2198 9.5000 0.0000 1.4268 0.0500 0.5765 0.0000 0.0992 1.2362 15.1085 0.00%
2017 3.6290 8.3494 0.0000 1.4268 0.0500 0.3155 0.0000 0.0992 1.2386 15.1085 0.00%
NOTES AND COMMENTS TO ABOVE MILLAGE RATES:
* Herrick Public Library (City of Holland owned library) became Herrick District Library (district-wide library) effective
with calendar year 1997. The Municipal Airport became West Michigan Airport Authority (area-wide airport) effective
with calendar year 2008. The City of Holland continues to levy the millages for both the library and airport, and
submits payment of taxes to the library and airport as collected (per terms of agreements).
Capital Projects
MULTI-YEAR COMPARATIVE OVERVIEW
M i l l a g e R a t e L e v i e s
CITY OF HOLLAND MILLAGE RATE LEVIES
-70-

0
1
2
3
4
5
6
7
8
9
10
11
12
13
14
15
16
FY-08 FY-09 FY-10 FY-11 FY-12 FY-13 FY-14 FY-15 FY-16 FY-17
M
I
L
L
A
G
E
R
A
T
E
CITY OF HOLLAND PROPERTY TAX MILLAGE RATES
Debt Airport Operating & Capital Library
13.9500 13.950014.2500
13.8500
14.2500
15.1085 15.1085 15.1085 15.1085 15.1085
-71-

PERCENTAGE
OF TOTAL
TAXABLE TAXABLE
TAXPAYER TYPE OF BUSINESS VALUATION VALUATION
1. ARC Holland Real Eastate Holdings Retirement Village 33,148,364$ 3.29%
2. Haworth Inc Office Furniture Manufacturing 17,572,987$ 1.74%
3. Lumir LLC Real Estate Holdings 14,488,159$ 1.44%
4. Johnson Controls Interiors Automotive Parts Manufacturing 13,483,433$ 1.34%
5. YenFang Global Automotive Parts Manufacturing 11,583,100$ 1.15%
6. Challenge Mfg Co Automotive Parts Manufacturing 7,949,418$ 0.79%
7. Kraft Heinz Food Co Misc Food Manufacturing 6,598,029$ 0.65%
8. Semco Energy Utility 6,522,600$ 0.65%
9. JCIM US LLC Automotive Parts Manufacturing 5,815,129$ 0.58%
10. Hotel Holdings Holland DTW LLC Hotel 5,687,346$ 0.56%
Totals 122,848,565$ 12.19%
2016 Total Taxable Value is $1,032,648,686 which includes IFT's at equivalency valuation.
The abatements are taxed at approximately one‐half the tax rate.
Taxable valuations of Renaissance Zones are excluded.
CITY OF HOLLAND, MICHIGAN
PRINCIPAL TAXPAYERS
TAX YEAR 2016 (FY 2017)CITY WIDE
Concentration of Taxpayers
12.19%
87.81%
Top Ten Taxpayers All Other Taxpayers
-72-

> SUMMARY OF BUDGETED FINANCIAL DATA:
- FUNDS BY TYPE
- GOVERNMENTAL-TYPE FUNDS
- COMPONENT UNITS
- PROPRIETARY-TYPE FUNDS
> SUMMARY BY TYPE OF SOURCE AND USE
- SOURCES & APPLICATIONS ACROSS ALL FUNDS
- SUMMARY ACROSS ALL FUNDS
- GOVERNMENTAL FUNDS & COMPONENT UNITS
- ENTERPRISE FUNDS
- INTERNAL SERVICE FUNDS
FUND SUMMARIES
-73-

-incl. Budget Stabilization -MVH Major Street Fund -General Obligation Fund -Bridge Fund
-MVH Local Street Fund -Building Authority Fund -Drain Fund
-Allegan Co. Road Tax Fund -Special Assessment Fund -Street Fund
-Ottawa Co. Road Tax Fund -Energy Performance Fund -Sidewalk Fund
-Street Improvement Reserve Fund -Municipal Capital
-Parking System Fund Improvement Fund
-Downtown Snowmelt Fund
-Principal Shopping District Fund
-Cemetery Perpetual Care Fund -CATV Public Access TV Fund
-Herrick District Library Taxation Fund
-C/J Police Training Fund
-Revolving Cash Assistance Fund
-Specified Donations Fund
-Dangerous Structures Fund
-Solid Waste Fund -Technology Services Fund -Downtown Development Authority Fund
-Windmill Island Gardens Fund -Fuel Dispensing Fund -Brownfield Redevelopment Authority Funds
-Depot Operations Fund -Postage Services Fund -Holland Historical Trust Fund
-Airport Facilities & Mgmt. Fund -Communication Services Fund
-Transit Facilities & Mgmt. Fund -Centralized Vehicle/Equip Fund
-Police Employees Benefit Fund -Fire Emergency Vehicle Pool Fund
-City Hall Employees Benefit Fund -Compensated Absences Fund
-Transportation Employees Benefit Fund -Workers Compensation Insurance Fund
-Park/Cemetery Employees Benefit Fund -Income Protection Insurance Fund
-Electric Utility Fund* -Health/Dental Insurance Fund
-Water Utility Fund* -Vehicle Insurance Fund
-Wastewater Utility Fund* -Property Insurance Fund
-Liability Insurance Fund
Note: The Basis of Budgeting, which mimics the Basis of Accounting, is indicated for each fund type. Fund Type definitions can be found in the glossary.
* Considered a major fund for financial reporting purposes.
BUDGET FUND STRUCTURE
CITY OF HOLLAND
Governmental Funds
Proprietary Funds
Component Units(Modified Accrual)
General Fund*(Modified Accrual)
Special Revenue Funds(Modified Accrual)
Debt ServiceFunds
(Modified Accrual)
Capital ProjectFunds
(Modified Accrual)
Enterprise Funds(Full Accrual)
Internal Service Funds(Full Accrual)
Permanent Funds(Modified Accrual)
-74-

General
Fund
Capital
Projects
Other
Govt.
Utility
Funds
Other
Enterprise
Internal
Service
City Council x
City Manager x x
Elections x
Finance x x
Assessor x
Clerk x
Human Resources x x x
Treasurer x
City Hall & Grounds x
Cemetery x
Volunteer Services x
Planning & Zoning x
Public Safety - Police x x x
Public Safety - Fire x x
Environmental Health x
Construction Inspections x x
Streets Division x x x
Engineering Management x x x
Housing & Neighborhoods x
Human Relations x
International Relations x
Youth Services x
Recreation x
Parks x x
DeGraaf Nature Center x
8th St Market x
Civic Center x
Downtown Holland x
Solid Waste & Recycling x
Windmill Island x
Water x
Electric x
Wastewater x
Technology Services x x
Vehicle & Equipment Mntc x
The table shows which funds each Department is a part of.
Governmental Proprietary
Department
DEPARTMENT / FUND RELATIONSHIP
-75-

F U N D T Y P E : G E N E R A L F U N D
GENERAL FUND
The General Fund is a governmental fund, and represents the basic and primary operating fund of general government
operations. This fund records financial resources used for day-to-day general government service activities, such as City
Administration, Public Safety, Community & Neighborhood Services, Leisure & Cultural Services, Cemeteries, etc.
Certain activities, programs and projects are financed and recorded in other funds, in accordance with legal restrictions
and by Governmental Accounting Standards Board (GASB) requirements.
The General Fund receives the majority of its financing from four primary sources, to include property taxes, state shared
revenues, fees & charges for services and an annual transfer from the City's Electric Utility Fund as authorized by City
Charter provisions.
The informal policy is to maintain the fund balance within a 7.5% to 15% range of the ensuing year's adopted budget
appropriation for this fund. This is in addition to the balance in the Budget Stabilization Fund.
BUDGET STABILIZATION (RAINY DAY) FUND
Pursuant to Michigan P.A. 30 of 1978, the City Council adopted Ordinance No. 757 that became effective June 25, 1980,
authorizing the establishment of a Budget Stabilization Fund.
By City Ordinance and State of Michigan statutes, the balance maintained in this fund may be used to meet General Fund
deficits, to alleviate the reduction of levels of essential services (if so desired by City Council), or offset costs incurred as
the result of natural disasters. In recent years this fund has been used to directly fund prior years’ portions of Michigan
Tax Tribunal stipulated taxpayer refunds and make transfers to the General Fund to offset state revenue sharing
reductions.
Investment income generated in this fund is credited to the General Fund.
As a part of the annual budgeting process, the balance of this fund is examined and, to the extent possible, maintained at
ten percent of the General Fund operating appropriations for the ensuing fiscal year. Each year the balance in the Budget
Stabilization Fund may be adjusted by way of a transfer from or to the General Fund.
F U N D T Y P E : P E R M A N E N T F U N D S Permanent Funds are governmental funds reporting upon legally restricted resources to the extent that only earnings, and
not principal, may be used for purposes supporting the government’s programs and benefit the citizenry.
CEMETERY PERPETUAL CARE FUND
This fund provides financial accountability for fifty percent of revenues from the sale of cemetery lots (which includes
perpetual care service). Revenues accumulate in the fund, with the cash balance being continuously invested. The
principal within this fund (represented by accumulated revenues of cemetery lot sales) is designated as non-expendable.
Legally appropriated amounts of the expendable fund balance may be transferred to capital projects that are specific to
enhancements and/or development of municipal cemetery facilities.
-76-

F U N D T Y P E : S P E C I A L R E V E N U E F U N D S
Special Revenue Funds are governmental funds that account for proceeds of specific revenue sources (other than those
for major capital projects), which are legally restricted to expenditures for specified purposes.
MOTOR VEHICLE HIGHWAY MAJOR STREET FUND
The Major Street Fund is established pursuant to State of Michigan P.A. 51 of 1951, as amended. Its purpose is to receive
formula distributions from the Michigan Transportation Fund. Funding is also received from the State's Local Road
Program (a.k.a., Build Michigan) and State P.A. 48 Metro Act Maintenance Fee payments.
These revenues are required to be expended for maintenance and/or construction of designated major streets and
bridges. The local government is allowed to transfer a portion of these revenues to the Local Street Fund for use on
designated local streets & bridges (ref: Michigan Public Act 51 of 1951, as amended).
MOTOR VEHICLE HIGHWAY LOCAL STREET FUND
The Local Street Fund is established pursuant to State of Michigan P.A. 51 of 1951, as amended. Its purpose is to
receive formula distributions from the Michigan Transportation Fund. Funding is also received from the State's Local Road
Program (a.k.a., Build Michigan).
Revenues are required to be expended for maintenance and/or construction of designated local streets and bridges. All
outlays for construction of local streets must be matched dollar-for-dollar with locally derived sources (ref: Michigan Public
Act 51 of 1951, as amended).
ALLEGA N & OTT AWA C O UNTY R O AD TAX FUND
The purpose of these funds is to receive a portion of a county-wide, voted property tax millage; distribution is based on the
taxable value of the City located in the County, compared to the taxable value of the entire County. Outlays from this fund
are used for street, bridges, and right-of-way projects located within the corresponding county.
STREET IMPROVE MENT S RESERV E FUND
Primary funding is attained from a property tax levy. Funding can also be provided in the form of bond proceeds when
debt is issued for a street construction project. Outlays are in the form of interfund transfers to designated capital projects
for streets, bridges, and right-of-ways.
PUBLIC SYSTE M FUND
The downtown area includes several municipally-owned public parking lots and one two-story parking structure. Various
privately-owned parking lots, some of which are leased to the City of Holland for use as public parking facilities, are also
available downtown.
The primary revenue source is an annual operating assessment levied against property owners within a designated
downtown district that receive direct or indirect benefit from the parking lots. Expenditures include routine maintenance
and upkeep of public parking lots and a parking deck, lease payments on privately-owned lots and minor capital projects.
DOWNT O WN SN OWMELT F UND
Revenues are received from an annual operating special assessment levied against property owners within a designated
downtown district that benefits from the snowmelt system. Public space assessments for the City Police and Ottawa
County Court Complex parking lot and parking deck, the 8th Street Market Area and the 7th Street Parking Deck are also
received. Additionally, transfers-in are received from the Motor Vehicle Highway Major Streets Fund and the Downtown
Parking System Fund. Expenditures include operating and maintaining the snowmelt system.
-77-

F U N D T Y P E : S P E C I A L R E V E N U E F U N D S ( c o n t i n u e d )
PR INCI P AL SH OP PING D IS TRICT F UND
This fund was created for the purpose of promoting the downtown shopping district via a coordinated effort of marketing
and special events. Revenues are received from an annual operating assessment levied against property owners within a
designated downtown district that benefit from the PSD and from special event fees. Expenditures include advertising &
marketing, consultants and special events designed to benefit the downtown.
CATV P U BLIC ACCESS TV FUND
In accordance with terms of a licensing agreement with the cable television firms, Comcast, Inc. and AT&T, Inc. and
Michigan Public Act 480 of 2006 entitled the Uniform Video Services Local Franchise Act, the City of Holland receives an
annual franchise fee equal to five percent of gross subscriber revenues. Expenditures include operating costs associated
with providing local cable television programming services and enhancements to communications technology to meet the
informational needs of the City.
DISTRICT LIBRARY TAXATION FUND
Herrick Public Library (municipally-owned by City of Holland) became Herrick District Library (a separate area-wide library
entity) in 1997. Rather than the library entity imposing its own tax levy, the intergovernmental contractual arrangement
provides that the City and the three adjacent townships that make up the library district levy an identical tax millage rate
and each taxing unit will pay the collected taxes to the library district.
POLICE CRIMINAL JUSTICE TRAINING FUND
State of Michigan Act 302 of 1982 requires district courts to impose an added assessment on civil infractions under the
Michigan Vehicle Code, with a few exceptions. The assessments are in addition to the fines and court costs ordered to be
paid, and are forwarded to the State of Michigan. The State distributes 60% of assessments to local governments based
upon the number of full-time police officers currently employed. The funding is required to supplement training
appropriations in the Public Safety Police Division. The funding is not in the form of a grant.
REV OLVI NG C ASH ASSIST ANCE F U ND
This fund provides upfront working capital assistance for construction projects for which special assessment bonds are
issued. This fund receives significant reimbursement revenue from long term special assessment installment payments.
SPECIF I ED DONATIONS F UND
This fund accounts for contributions from donors that stipulate how the money is to be used. It provides financial
accountability for receipt of donations and disbursements made in accordance with the intended purpose.
DAN GER OUS ST R UCTU RE S FUND
Various sections and sub-sections within Chapters 6, 14, 15 and 19 of the City Ordinance Code establish local
government authority for actions to be taken regarding housing and business properties that are considered to be
‘dangerous structures’. Legal actions the city government may impose include the right to secure, fix or demolish such
properties if the property owner of record does not take appropriate action in a timely manner. In such instances, the City
submits an invoice to the property owner for reimbursement of costs incurred.
This fund provides accountability of costs associated with housing and business properties considered “dangerous
structures’ and property owners are invoiced for costs incurred.
-78-

F U N D T Y P E : D E B T S E R V I C E F U N D S
Debt Service Funds are governmental funds that account for financial resources accumulated to provide payment of
principal, interest, and fees on general obligation, limited tax general obligation, building authority, and special
assessment long-term debt.
GENERAL OBLIGATION AND BUILDING AUTHORITY DEBT FUND
The fund accounts for revenues from property taxes, internal fund transfers-in, and investment used for payment of
principal and interest of the general obligations bonds sold.
SPECIAL ASSESSMENT DEBT FUND
This fund accounts for revenue paid by property owners in designated districts that are used to pay the principal and
interest on special assessment debt.
ENERGY PERFORMANCE DEBT FUND
This fund accounts for revenue from property taxes and is used to pay the installment payments due on the loan.
F U N D T Y P E : C A P I T A L P R O J E C T S F U N D S
Capital Project Funds are governmental funds that account for financial resources designated for the acquisition or
construction of major capital facilities (other than those projects that are financed by proprietary funds).
CAPITAL PROJECT FUNDS
Capital Project Funds are established for new construction or major improvements to municipal facilities, equipment and
infrastructure. Projects are frequently multi-year with reserves established to assure project financing requirements are
met.
Financing for capital projects is derived from various sources, to include property taxes and special assessments, grants
from other government and non-government agencies, inter-fund transfers and contributions from the private sector.
Larger projects frequently will require financing through the issuance of long-term debt instruments, such as bond issues,
allowable borrowing arrangements with financial institutions, and land contracts.
-79-

F U N D T Y P E : E N T E R P R I S E F U N D S
Enterprise Funds are proprietary funds that account for operations (a) financed and operated in a manner similar to
private-sector business entities - where the intent of the governing body is that the costs (expenses, including
depreciation) of providing goods or services to the general public on a continuing basis be financed primarily through
user charges; or, (b) where the governing body has decided that periodic determination of revenues earned, expenses
incurred, and/or net income is appropriate for capital maintenance, public policy, management control, accountability,
or other purposes.
SOLID WASTE FUND
This fund accounts for the revenue and expenses associated with a mandatory refuse and recycling pickup program
for all single family residences, as well as multi-family residential units.
WINDMILL ISLAND FUND
This fund accounts for the revenue and expenses associated with operating a public attraction, referred to as Windmill
Island, that features an imported authentic operating windmill from the Netherlands. The revenue base consists of
admission fees, concession fees, and other miscellaneous revenues; along with an annual General Fund transfer to
subsidize operating deficits, if needed.
DEPOT OPERATIONS FUND
The City of Holland owns and leases out a renovated railroad depot located on the main street of the downtown area.
Per agreement, the MAX Transportation Authority operates and maintains the building and grounds and also receives
related rental income from the other tenants
AIRPORT FACILITIES AND MANAGEMENT FUND
On January 18, 2007 the City of Holland adopted a resolution to form the West Michigan Airport Authority along with
Holland Charter Township, Park Township and the City of Zeeland. The tax levy up to 0.1 mill was approved by voters
in all jurisdictions, except Holland Charter Township, in May 2008. Rather than the airport entity imposing its own tax
levy, the intergovernmental contractual arrangement provides that the City and two adjacent jurisdictions (composing
the airport authority) each levy an identical tax millage rate for the airport, and each taxing unit will pay the collected
taxes to the Authority. The City’s portion of this tax levy is accounted for by this fund.
Capital assets formerly acquired by the City of Holland, prior to the formation of the Authority, remain under the City’s
ownership and continue to be accounted for in this City fund. These City owned assets are leased to the Authority for
their use, operation and maintenance. The Authority contracts with the City for managerial staff, fiscal agent services
and some minor administrative costs which continue to be accounted for in this fund.
PUBLIC TRANSIT FACILITY AND MANAGEMENT FUND
Effective July 1, 2007 the City of Holland adopted a resolution to form the Macatawa Area Express Transportation
Authority, along with Holland Charter Township. The cost of property insurance on the Depot, which the Authority
leases, is charged to this fund. They are then invoiced so all cost
EMPL OY EES BE N EFIT FUNDS
Various departmental facilities provide a coffee shop / lunch room for staff members and commissions. This fund
provides financial accountability. Revenues are from merchandise sales to employees and payroll deductions.
Expenses include the purchase of lunch room inventory items and miscellaneous costs associated with special events,
such as decorated cakes, flowers, cards, and gifts.
-80-

F U N D T Y P E : E N T E R P R I S E F U N D S ( c o n t i n u e d )
ELECTRIC UTILITY FUND
Mandated by chapter 12 of the City Charter, the Electric Utility Fund provides financial accountability for a municipally-
owned electric generating facility and distribution system that supplies electrical power to residential, commercial,
industrial, and other users. Fiber Optics (broadband) is also supplied to a limited customer base. The City has entered
into agreements with several of the surrounding governmental jurisdictions to supply electrical power to various
residential, commercial, and industrial areas outside of the City.
WASTEWATER UTILITY FUND
The Wastewater Utility Fund provides financial accountability for a municipally-owned sewage treatment facility and
collection system that services residential, commercial, industrial, and other users within the City of Holland.
In 1979, a joint agreement was established between the City of Holland and surrounding townships to expand the
sewage treatment plant, and provide sewage collection services to an expanded area. In 1994 and 1995 these same
governing units took action to construct another large expansion of the treatment plant capacity to service the ever-
increasing volumes of sewage treatment requirements.
WATER UTILITY FUND
Mandated by chapter 12 of the Holland City Charter, the Water Utility Fund provides financial accountability for a
municipally-owned water treatment facility and distribution system that supplies water too residential, commercial,
industrial and other users within the City of Holland. The City of Holland has entered into joint agreements with several
of the surrounding governmental jurisdictions for the sale and distribution of water to various areas outside of the City.
-81-

F U N D T Y P E : I N T E R N A L S E R V I C E F U N D S
Internal Service Funds are used to account for the financing of services provided by one department or activity to other
departments or activities of the City, and/or to other governmental units on a cost-reimbursement basis. These types of
funds are established, managed, and operated as a proprietary type operation, providing financial accountability for
revenues, expenses, and balance sheet items.
TECHNOLOGY SERVICES FUND
The Technology Services Dept provides computer-processing capabilities to all departments; and to a small extent, to
other local area governmental units. To recover the cost of operations, user fees are charged to departments for
computer usage plus a surcharge for the purpose of accumulating reserves for future purchases.
POSTAGE SERVICES FUND
This fund accounts for the fees charged to departments for postage used and the cost of postage meter.
COMMUNICATION SERVICES FUND
This fund accounts for the cost of communication using the telephone system. Also captured are operating costs
across all departments for usage of cellular phones, pager units, broadband fiber as well as modems for computers
and credit card validation machines. Departments are charged user fees to recover costs plus a surcharge for the
purpose of accumulating a reserve for future purchases.
FUEL DISPENSING FUND
The City of Holland and Holland Public School District share the operating, maintenance, and capital costs for
underground storage tanks and automated fuel dispensing systems. This fund accounts for the purchase of fuel used
by their vehicles and equipment. User fees are charged to cover costs.
CENTRALIZED VEHICLE/EQUIPMENT FUND
This fund accounts for the costs associated with maintaining the City’s vehicles and equipment. Departments using the
vehicles and equipment on a daily basis pay an annual lease. Certain vehicles are available for use as needed;
department users are charged a per mile fee to recover costs.
FIRE VEHICLES & EQUIPMENT FUND
This fund accounts for cash reserves to be used for purchase of additional or replacement emergency vehicles, and for
major renovations to emergency vehicles. Primary financing for this fund is an annual operating transfer from the
General Fund.
COMPENSATED ABSENCES FUND
This fund is used to account for the liabilities related to accumulated vacation, paid time off, unused sick pay, time off
in lieu of holiday (fire union), comp time and related mandatory fringes across the General Fund and Special Revenue
Funds. Revenues and expenses relate to the annual adjustment of these liabilities.
-82-

F U N D T Y P E : I N T E R N A L S E R V I C E F U N D S ( c o n t i n u e d )
WORKERS COMPENSATION FUND
This fund accounts for the premiums paid by departments, according to the wages paid employees and the rates
provided by Accident Fund. Expenses of the fund include commercial insurance premiums on the current policy. A
small number of medical claims are also charged to this fund (retroactive to a time when the City's workers’
compensation coverage was partially self-insured). However, all such claims have reached the stop-loss limits of self-
insured coverage so reimbursement from the commercial insurance carrier is received.
EMPLOYEE DISABILITY INCOME PROTECTION FUND
The City of Holland provides a short-term disability income protection coverage through a fully self-funded plan, with
the City acting as the administrator. Revenues to this fund are generated from a combination of internally-developed
premium charges (short-term) and commercial carrier rates (long-term) to various departments and funds. Expenses
include disability income claims, as well as commercial insurance premiums for long-term income protection.
EMPLOYEE & RETIREE HEALTH / DENTAL FUND
Medical/dental insurance is provided for full-time employees and dependents, as well as for retirees, through a partially
self-funded plan. Revenues to this fund are generated primarily from internal premium charges to departments and
funds, employees and retirees. Expenses include payments for claims, administrative claim-handling fees and
commercial insurance premiums for stop-loss coverages.
VEHICLE INSURANCE FUND
The City of Holland partially self-insures for the cost of repairs or replacement to its damaged vehicles, other than fire
emergency vehicles. Revenues to this fund are generated primarily from internally-developed premium charges to
various departments and funds. Expenses are primarily for self-retention vehicle damage claims, as well as
commercial insurance premiums for stop-loss coverage.
PROPERTY INSURANCE FUND
The City of Holland partially self-insures coverage for the cost of repairs or replacement to its damaged property (other
than vehicles). Revenues to this fund are generated primarily from internally-developed premium charges to various
departments and funds. Expenses are primarily for self-retention property damage claims, as well as commercial
insurance premiums for stop-loss coverage.
GENERAL & PROFESSIONAL LIABILITY FUND
The City of Holland partially self-insures coverage for the cost of General Liability claims against the City. Revenues to
this fund are generated primarily from internally-developed premium charges to various departments and funds.
Expenses are primarily for payment of liability claims of the general public related to injuries and/or damaged property
resulting from administrative errors & omissions, faulty design, negligence, carelessness, etc. Expenses also include
commercial insurance premiums for stop-loss coverage.
-83-

F U N D T Y P E : C O M P O N E N T U N I T F U N D S
A component unit is a legally separate entity that satisfies at least one of the following criteria:
The primary government (City of Holland) is financially accountable for the legally separate entity.
The nature and significance of the relationship between the primary government and the legally separate
entity is such that to exclude the entity from the financial reporting entity would render the financial statements
misleading or incomplete.
BROWNFIELD REDEVELOPMENT AUTHORITY FUNDS
The Brownfield Redevelopment Authority Financing Act, State of Michigan P.A. 381 of 1996, as amended, establishes
a method for municipalities to facilitate and promote revitalization of environmentally contaminated and/or blighted and
functionally obsolete sites. A separate fund is established for each approved project site, to record revenues from Tax
Increment Financing 'captured property taxes'; and to record reimbursement payments to project developers for
authorized redevelopment expenditure outlays.
DOWNTOWN DEVELOPMENT AUTHORITY FUND
The Downtown Development Authority (DDA) Fund was established in May 1984 with adoption of City Ordinance
Number 757, under authority granted by State of Michigan, Public Act 197 of 1975, as amended. The Main Street
Program, is the mechanism used for administering operations and programs, under direction of a board of directors.
At the current time funding is accomplished with a district wide tax levy. Expenses are related to programs for low interest
loans to improve both exteriors and interiors of downtown buildings; recruitment of new businesses; improved ambiance
for shoppers such as assistance with window displays, a sidewalk hanging banners program, improved shopping
atmosphere through new and expanded decorations and music, underground electrical expansion programs; and
presentations to area groups and news media promoting the downtown area.
HOLLAND HISTORICAL TRUST FUND
Holland Historical Trust is a Michigan non-profit corporation with its own board of directors that is not appointed by the
Holland City Council. Primary revenue sources include an annual contribution from the City of Holland - General Fund
and bequests from the private sector. The portion of this fund that represents accumulated bequests – with limitations
placed upon use of the contributed principal – is established as non-expendable. This fund provides financial
accountability for the administration, operations and general maintenance of four local area historical buildings: Holland
Museum, Holland Armory (currently offices), Cappon House and the Settlers House. The buildings, with the exception
of the Armory, are owned by the City of Holland.
-84-

FY2017 ADOPTED APPROPRIATIONS
FUNDS BY TYPE
Including Basis of Budgeting & Accounting
General Fund Solid Waste Recycling 1,526,097
-Including Budget Stabilzation 21,253,654 Windmill Island Gardens 1,903,905
Employees Benefit 8,350
Municipal Airport Facilities & Mgmt 133,101
Public Transit Facilities & Mgmt 275
Electric Utility 125,343,349
Cemetery Perpetual Care 31,000 Water Utility 10,066,905
Wastewater Utility 12,663,512
151,645,494
Street Funds 7,298,813
Downtown Funds 793,026
CATV-Public Access TV 457,307 Technology Services 829,911
Herrick District Library Taxation 1,253,100 Fuel Dispensing 779,960
C/J Police Training 9,600 Postage Services 20,800
Specified Donations 145,000 Communications Services 121,800
Dangerous Structures 12,800 Centralized Vehicle/Equip 2,680,446
9,969,646 Compensated Absences 35,000
Risk Management 6,424,150
10,892,067
General Obligation LTGO 5,946,694
Building Authority 2,185,432
Special Assessment 12,530 Downtown Development Auth. 283,835
Energy Performance 353,201 Brownfield Redevel. Auth. 1,244,602
8,497,857 Holland Historical Trust 659,986
2,188,423
Municipal Improvements 16,425,400
Street, Bridge, Signalization 4,536,594
Sidewalk Improvements 71,000
21,032,994 Fund Type definitions can be found in the glossary.
Appropriations Include: Internal Transfers To Other Funds, Capital Outlay, and Debt Service Principal but Excludes Depreciation.
COMPONENT UNITS
( Modified Accrual )
CAPITAL PROJECTS
( Modified Accrual )
Note: The Basis of Budgeting, which mimics the Basis of
Accounting, is indicated for each fund type.
( Modified Accrual )
GENERAL OPERATING ENTERPRISE
( Modified Accrual ) ( Full Accrual )
PERMANENT
( Modified Accrual )
SPECIAL REVENUE
( Modified Accrual )
INTERNAL SERVICE FUNDS
( Full Accrual )
DEBT SERVICE
-85-

GOVERNMENTAL TYPE FUNDS
SUMMARY OF REVENUES
Revised Adopted
Actual Actual Estimate Budget
Fund FY-2014 FY-2015 FY-2016 FY-2017
GENERAL FUND 20,649,890 20,935,050 46,676,382 21,212,062
SPECIAL REVENUE FUNDS
MVH Major Streets 2,420,548 2,498,981 2,715,083 2,866,600
MVH Local Streets 1,376,938 1,263,983 1,363,728 1,468,980
Allegan County Road Tax 430,290 452,801 454,000 454,000
Ottawa County Road Tax - - 330,500 331,000
Street Improvements Reserve 1,103,862 1,556,517 5,393,793 2,346,892
Downtown Parking System 211,119 213,511 215,160 246,650
Downtown Snowmelt O&M 160,321 234,684 216,573 323,824
Principal Shopping District 327,338 300,261 264,664 341,000
CATV - Public Access TV 447,872 491,097 499,500 497,500
Herrick Dist. Library Taxation 1,247,366 1,251,454 1,305,974 1,253,100
Criminal Justice - Police Training 10,531 10,834 9,800 10,000
Revolving Cash Assistance 213,356 156,177 199,472 124,448
Specified Donations 1,041,921 508,524 25,000 70,000
Dangerous Structures 1,707 4,260 68,300 12,800
DEBT SERVICE FUNDS
General Obligation 4,049,559 2,654,679 2,703,951 5,961,879
Building Authority 3,542,153 2,137,281 2,165,922 2,185,532
Special Assessments 165,913 55,866 39,621 9,559
Energy Performance - - - 353,201
PERMANENT FUNDS
Cemetery Perpetual Care 40,917 37,285 42,600 42,600
TOTAL 37,441,601 34,763,245 64,690,023 40,111,627
Less Interfund Transfers (6,912,540) (6,149,310) (9,874,875) (6,949,465)
NET REVENUES 30,529,061 28,613,935 54,815,148 33,162,162
-86-

GOVERNMENTAL TYPE FUNDS
SUMMARY OF EXPENDITURES
Revised Adopted
Actual Actual Estimate Budget
Fund FY-2014 FY-2015 FY-2016 FY-2017
GENERAL FUND 20,909,592 20,652,881 47,278,090 21,253,654
SPECIAL REVENUE FUNDS
MVH Major Streets 2,412,416 2,727,954 5,200,571 2,879,089
MVH Local Streets 1,376,938 1,263,983 1,363,728 1,468,980
Allegan County Road Tax 165,002 504,609 867,074 375,000
Ottawa County Road Tax - - 330,000 330,000
Street Improvements Reserve 779,577 2,270,544 6,180,939 2,245,744
Downtown Parking System 193,975 166,308 300,113 236,489
Downtown Snowmelt O&M 238,716 260,905 213,191 242,674
Principal Shopping District 340,776 374,204 365,273 313,863
CATV - Public Access TV 401,103 422,513 554,746 457,307
Herrick Dist. Library Taxation 1,247,634 1,251,468 1,300,471 1,253,100
Criminal Justice - Police Training 10,575 9,475 9,525 9,600
Revolving Cash Assistance - - - -
Specified Donations 746,578 469,245 415,000 145,000
Dangerous Structures 1,707 4,260 68,300 12,800
DEBT SERVICE FUNDS
General Obligation 4,002,930 2,649,428 2,647,034 5,946,694
Building Authority 3,541,995 2,137,120 2,165,832 2,185,432
Special Assessments 265,473 36,233 37,143 12,530
Energy Performance - - - 353,201
PERMANENT FUNDS
Cemetery Perpetual Care 21,072 11,485 11,000 31,000
TOTAL 36,656,059 35,212,615 69,308,030 39,752,157
Less Interfund Transfers (4,606,215) (5,330,394) (13,563,120) (5,008,799)
NET EXPENDITURES 32,049,844 29,882,221 55,744,910 34,743,358
-87-

GOVERNMENTAL TYPE FUNDS
SUMMARY OF FUND EQUITY ESTIMATES
Estimated Revenue Expenditure Change Estimated
Balance Estimate Estimate in Fund Balance
Fund 7/1/2016 FY-2017 FY-2017 Balance 6/30/2017
GENERAL FUND 4,380,735 21,212,062 21,253,654 (41,592) 4,339,143
SPECIAL REVENUE FUNDS
MVH Major Streets 13,499 2,866,600 2,879,089 (12,489) 1,010
MVH Local Streets 2,000 1,468,980 1,468,980 - 2,000
Allegan County Road Tax 69,962 454,000 375,000 79,000 148,962
Ottawa County Road Tax 500 331,000 330,000 1,000 1,500
Street Improvements Reserve 10,769 2,346,892 2,245,744 101,148 111,917
Downtown Parking System 165,199 246,650 236,489 10,161 175,360
Downtown Snowmelt O&M 3,420 323,824 242,674 81,150 84,570
Principal Shopping District 16,325 341,000 313,863 27,137 43,462
CATV - Public Access TV 388,433 497,500 457,307 40,193 428,626
Herrick Dist. Library Taxation 5,557 1,253,100 1,253,100 - 5,557
Criminal Justice - Police Training 2,207 10,000 9,600 400 2,607
Revolving Cash Assistance 203,903 124,448 - 124,448 328,351
Specified Donations 117,889 70,000 145,000 (75,000) 42,889
Dangerous Structures - 12,800 12,800 - -
DEBT SERVICE FUNDS
General Obligation 231,478 5,961,879 5,946,694 15,185 246,663
Building Authority 12,996 2,185,532 2,185,432 100 13,096
Special Assessments 39,864 9,559 12,530 (2,971) 36,893
Energy Performance - 353,201 353,201 - -
PERMANENT FUNDS
Cemetery Perpetual Care 1,652,730 42,600 31,000 11,600 1,664,330
TOTAL ESTIMATED EQUITY 7,317,466 40,111,627 39,752,157 359,470 7,676,936
-88-

Revised Adopted
Actual Actual Estimate Budget
REVENUES FY-14 FY-15 FY-16 FY-17
Downtown Development Authority 186,536 188,861 199,157 197,000
Brownfield Redevel. Authority 853,718 939,911 1,058,324 1,368,706
Holland Historical Trust 597,606 778,933 565,930 670,950
1,637,860 1,907,705 1,823,411 2,236,656
Removal Of Interfund Transfers (155,734) (318,123) (162,940) (182,259)
NET REVENUES 1,482,126 1,589,582 1,660,471 2,054,397
EXPENDITURES
Downtown Development Authority 146,217 175,068 247,485 283,835
Brownfield Redevel. Authority 805,785 89,431 939,748 1,244,602
Holland Historical Trust 787,831 785,768 555,700 659,986
1,739,833 1,050,267 1,742,933 2,188,423
Removal Of Interfund Transfers (318,759) (344,834) (343,814) (423,097)
NET EXPENDITURES 1,421,074 705,433 1,399,119 1,765,326
Estimated Revenue Expenditure Adjust Change Estimated
Balance Estimate Estimate Non-Cash in Fund Balance
FUND EQUITY 7/1/2016 FY-2017 FY-2017 Assets Balance 6/30/2017
Downtown Development Authority 137,813 197,000 283,835 (86,835) 50,978
Brownfield Redevel. Authority 255,491 1,368,706 1,244,602 124,104 379,595
Holland Historical Trust 2,190,615 670,950 659,986 (109,285) (98,321) 2,092,294
FUND EQUITY 2,583,919 2,236,656 2,188,423 (109,285) (61,052) 2,522,867
COMPONENT UNIT FUNDS
SUMMARY OF REVENUES, EXPENDITURES & FUND EQUITY ESTIMATES
-89-

Revised Adopted
Actual Actual Estimate Budget
Fund FY-2014 FY-2015 FY-2016 FY-2017
GENERAL CITY
Enterprise Funds
- Solid Waste & Recycling 1,565,059 1,566,624 1,750,600 1,622,300
- Windmill Island Gardens 1,283,653 924,793 728,670 1,909,750
- Railroad Depot Operations 1 1 1 1
- Municipal Airport Facilities 98,858 118,293 220,076 133,123
- Public Transit Facilities & Mgmt 554 339 290 290
- Police Employees Benefit 5,650 5,779 3,160 3,110
- City Hall Employees Benefit 3,431 3,397 3,460 3,750
- Transportation Employees Ben. 1,354 1,325 1,420 1,420
- Park/Cemetery Employees Ben. 4 103 380 355
2,958,564 2,620,654 2,708,057 3,674,099
Internal Services Funds
- Technology Services 617,076 610,296 723,830 851,290
- Fuel Dispensing 1,090,682 773,796 505,400 808,100
- Postage Services 16,535 18,688 20,020 21,520
- Communications Services 116,102 128,029 210,283 119,100
- Centralized Vehicle/Equipment 2,463,118 2,344,001 2,335,318 2,267,551
- Fire Emergency Vehicles Pool 91,432 88,476 100,600 101,000
- Compensated Absences 131,865 29,712 20,000 35,000
- Risk Management:
Workers Comp Insurance 313,498 336,433 351,250 358,600
Employee Disability Ins. 106,776 104,347 109,200 108,600
Health/Dental Insurance 5,375,148 5,157,156 5,210,805 5,692,000
Vehicle Insurance 120,536 124,122 108,805 111,000
Property Insurance 31,593 47,057 26,095 27,300
Liability Insurance 1,290,803 135,218 112,285 114,700
11,765,164 9,897,331 9,833,891 10,615,761
Removal Of Interfund Transfers 0 (409,373) (550,901) (1,527,000)
General City Revenues 14,723,728 12,108,612 11,991,047 12,762,860
HOLLAND BOARD OF PUBLIC WORKS - UTILITIES:
- Electric 98,211,707 266,795,320 104,753,141 108,255,365
- Water 8,503,960 8,670,713 9,348,649 9,412,363
- Wastewater 10,306,970 21,967,869 20,825,222 11,157,926
Removal Of Interfund Transfers 0 0 0 0
BPW Utility Revenues 117,022,637 297,433,902 134,927,012 128,825,654
NET REVENUES 131,746,365 309,542,514 146,918,059 141,588,514
PROPRIETARY TYPE FUNDS
SUMMARY OF REVENUES
-90-

Revised Adopted
Actual Actual Estimate Budget
Fund FY-2014 FY-2015 FY-2016 FY-2017
GENERAL CITY
Enterprise Funds
- Solid Waste & Recycling 1,429,548 1,658,052 1,499,235 1,526,097
- Windmill Island Gardens 1,392,345 775,886 777,987 1,903,905
- Depot Operations 0 0 0 0
- Municipal Airport Facilities 99,003 116,877 128,076 133,101
- Public Transit Facilities & Mgmt 541 328 275 275
- Police Employees Benefit 5,192 5,723 2,800 2,800
- City Hall Employees Benefit 2,750 3,401 3,200 3,700
- Transportation Employees Ben. 892 1,695 1,900 1,700
- Park/Cemetery Employees Ben. 182 0 150 150
2,930,453 2,561,962 2,413,623 3,571,728
Internal Services Funds
- Technology Services 642,076 661,743 736,633 829,911
- Fuel Dispensing 1,051,639 843,385 484,860 779,960
- Postage Services 16,623 18,622 19,800 20,800
- Communications Services 113,164 119,323 207,800 121,800
- Centralized Vehicle/Equipment 2,659,309 2,410,403 3,060,908 2,680,446
- Fire Emergency Vehicles Pool 300,331 275,104 0 0
- Compensated Absences 131,865 29,712 20,000 35,000
- Risk Management:
Workers Comp Insurance 314,456 312,711 374,850 386,000
Employee Disability Ins. 89,068 55,114 108,380 85,000
Health/Dental Insurance 4,615,182 4,950,748 5,843,968 5,688,150
Vehicle Insurance 110,202 121,803 96,455 101,000
Property Insurance 31,012 49,234 25,120 29,000
Liability Insurance 1,303,959 146,050 132,610 135,000
11,378,886 9,993,952 11,111,384 10,892,067
Removal Of Interfund Transfers 0 (35,200) 0 0
Total General City 14,309,339 12,520,714 13,525,007 14,463,795
HOLLAND BOARD OF PUBLIC WORKS - UTILITIES:
- Electric 109,594,117 79,729,279 211,207,386 125,343,349
- Water 8,203,215 8,110,451 10,614,512 10,066,905
- Wastewater 11,696,478 13,372,505 26,722,041 12,663,512
Removal Of Interfund Transfers 0 (5,344,000) (5,535,000) (5,850,000)
Total BPW Utility 129,493,810 95,868,235 243,008,939 142,223,766
NET EXPENSES 143,803,149 108,388,949 256,533,946 156,687,561
Expenses include Capital Outlays & Debt Service Principal, but exclude Depreciation, and are reconciled to Fund Equity on the next page.
PROPRIETARY TYPE FUNDS
SUMMARY OF EXPENSES
-91-

Estimated Revenue Expense Capital & Non-Cash Estimated
Balance Estimate Estimate Debt Principal Items Balance
FUND 7/1/2016 FY-2017 FY-2017 FY-2017 FY-2017 6/30/2017
GENERAL CITY:
Enterprise Funds
- Solid Waste & Recycling 701,314 1,622,300 1,526,097 797,517
- Windmill Island Gardens 2,029,142 1,909,750 1,903,905 1,202,000 (130,000) 3,106,987
- Railroad Depot Operations 772,970 1 0 (24,550) 748,421
- Municipal Airport Facilities 9,859,327 133,123 133,101 (461,000) 9,398,349
- Public Transit Facilities & Mgmt 232,942 290 275 (11,750) 221,207
- Police Employees Benefit 1,781 3,110 2,800 2,091
- City Hall Employees Benefit 7,498 3,750 3,700 7,548
- Transportation Employees Ben. 2,404 1,420 1,700 2,124
- Park/Cemetery Employees Ben. 629 355 150 834
13,608,007 3,674,099 3,571,728 1,202,000 (627,300) 14,285,078
Internal Services Funds
- Technology Services 464,320 851,290 829,911 117,000 (80,000) 522,699
- Fuel Dispensing 265,977 808,100 779,960 (1,150) 292,967
- Postage Services 6,973 21,520 20,800 7,693
- Communications Services 109,938 119,100 121,800 (7,000) 100,238
- Centralized Vehicle/Equipment 4,552,419 2,267,551 2,680,446 808,100 (500,000) 4,447,624
- Fire Emergency Vehicles Pool 1,424,181 101,000 0 (110,000) 1,415,181
- Compensated Absences 0 35,000 35,000 0
- Risk Management:
Workers Comp Insurance 539,662 358,600 386,000 512,262
Employee Disability Insurance 151,690 108,600 85,000 175,290
Health/Dental Insurance 1,515,410 5,692,000 5,688,150 1,519,260
Vehicle Insurance 268,654 111,000 101,000 278,654
Property Insurance 384,858 27,300 29,000 383,158
Liability Insurance 232,430 114,700 135,000 212,130
9,916,512 10,615,761 10,892,067 925,100 (698,150) 9,867,156
Total General City 23,524,519 14,289,860 14,463,795 2,127,100 (1,325,450) 24,152,234
HOLLAND BOARD OF PUBLIC WORKS - UTILITIES:
- Electric 233,080,816 108,255,365 125,343,349 48,273,481 (10,201,935) 254,064,378
- Water 37,736,283 9,412,363 10,066,905 5,184,266 (1,791,048) 40,474,959
- Wastewater 56,288,626 11,157,926 12,663,512 5,362,798 (2,878,823) 57,267,015
Total Holland BPW Utility 327,105,725 128,825,654 148,073,766 58,820,545 (14,871,806) 351,806,352
TOTAL ESTIMATED EQUITY - 350,630,244 143,115,514 162,537,561 60,947,645 (16,197,256) 375,958,586
PROPRIETARY TYPE FUNDS
SUMMARY OF FUND EQUITY ESTIMATES
-92-

PROPRIETARY TYPE FUNDS
SUMMARY OF FUND EQUITY ESTIMATES
Estimated Estimated Change
Balance Balance in Fund
FUND 7/1/2016 6/30/2017 Equity
GENERAL CITY:
Enterprise Funds
- Solid Waste & Recycling 701,314 797,517 96,203
- Windmill Island Gardens 2,029,142 3,106,987 1,077,845
- Railroad Depot Operations 772,970 748,421 (24,549)
- Municipal Airport Facilities 9,859,327 9,398,349 (460,978)
- Public Transit Facilities & Mgmt 232,942 221,207 (11,735)
- Police Employees Benefit 1,781 2,091 310
- City Hall Employees Benefit 7,498 7,548 50
- Transportation Employees Benefit 2,404 2,124 (280)
- Park/Cemetery Employees Benefit 629 834 205
13,608,007 14,285,078 677,071
Internal Services Funds
- Technology Services 464,320 522,699 58,379
- Fuel Dispensing 265,977 292,967 26,990
- Postage Services 6,973 7,693 720
- Communications Services 109,938 100,238 (9,700)
- Centralized Vehicle/Equipment 4,552,419 4,447,624 (104,795)
- Fire Emergency Vehicles Pool 1,424,181 1,415,181 (9,000)
- Compensated Absences 0 0 0
- Risk Management:
Workers Comp Insurance 539,662 512,262 (27,400)
Employee Disability Insurance 151,690 175,290 23,600
Health/Dental Insurance 1,515,410 1,519,260 3,850
Vehicle Insurance 268,654 278,654 10,000
Property Insurance 384,858 383,158 (1,700)
Liability Insurance 232,430 212,130 (20,300)
9,916,512 9,867,156 (49,356)
Total General City 23,524,519 24,152,234 627,715
HOLLAND BOARD OF PUBLIC WORKS - UTILITIES:
- Electric 233,080,816 254,064,378 20,983,562
- Water 37,736,283 40,474,959 2,738,676
- Wastewater 56,288,626 57,267,015 978,389
Total Holland BPW Utility 327,105,725 351,806,352 24,700,627
TOTAL ESTIMATED EQUITY - 350,630,244 375,958,586 25,328,342
-93-

Revised Adopted
Actual Actual Estimate Budget
FUND FY-2014 FY-2015 FY-2016 FY-2017
GENERAL CITY:
Enterprise Funds
- Solid Waste & Recycling 541,377 449,949 701,314 797,517
- Windmill Island Gardens 0 151,388 102,071 110,907
- Railroad Depot Operations 6 7 8 9
- Municipal Airport Facilities 0 1,416 1,416 1,438
- Public Transit Facilities & Mgmt 1,637 1,648 1,663 1,678
- Police Employees Benefit 1,365 1,421 1,781 2,091
- City Hall Employees Benefit 7,242 7,238 7,498 7,548
- Transportation Employees Ben. 3,254 2,884 2,404 2,124
- Park/Cemetery Employees Ben. 296 399 629 834
Total Enterprise 555,177 616,350 818,784 924,146
Internal Services Funds
- Technology Services 4,969 5,079 20,576 41,955
- Fuel Dispensing 37,656 9,281 10,431 11,581
- Postage Services 6,687 6,753 6,973 7,693
- Communications Services 15,254 23,960 26,443 23,743
- Centralized Vehicle/Equipment 322,058 352,627 57,037 244,142
- Fire Emergency Vehicles Pool 259,796 76,056 176,656 277,656
- Compensated Absences 0 0 0 0
- Risk Management:
Workers Comp Insurance 524,540 563,262 539,662 512,262
Employee Disability Ins. 101,637 150,870 151,690 175,290
Health/Dental Insurance 1,942,165 2,148,573 1,515,410 1,519,260
Vehicle Insurance 253,985 256,304 268,654 278,654
Property Insurance 386,060 383,883 384,858 383,158
Liability Insurance 248,587 237,755 217,430 197,130
Total Internal Service 4,103,394 4,214,403 3,375,820 3,672,524
Total General City 4,658,571 4,830,753 4,194,604 4,596,670
HOLLAND BOARD OF PUBLIC WORKS - UTILITIES:
- Electric 105,809,863 95,866,933 46,266,880 30,476,552
- Water 5,055,938 4,547,659 3,281,796 2,469,887
- Wastewater 11,007,790 13,111,737 8,941,303 8,845,757
Total Holland BPW Utility 121,873,591 113,526,329 58,489,979 41,792,196
NET WORKING CAPITAL 126,532,162 118,357,082 62,684,583 46,388,866
PROPRIETARY TYPE FUNDS
SUMMARY OF ENDING WORKING CAPITAL
-94-

Revised Adopted
Actual Actual Estimate Budget
FUND FY-2014 FY-2015 FY-2016 FY-2017
GENERAL CITY:
Enterprise Funds
- Solid Waste & Recycling 0 0 0 0
- Windmill Island Gardens 0 0 0 0
- Railroad Depot Operations 0 0 0 0
- Municipal Airport Facilities 0 0 0 0
- Public Transit Facilities & Mgmt 0 0 0 0
- Police Employees Benefit 0 0 0 0
- City Hall Employees Benefit 0 0 0 0
- Transportation Employees Ben. 0 0 0 0
- Park/Cemetery Employees Ben. 0 0 0 0
Total Enterprise 0 0 0 0
Internal Services Funds
- Technology Services 168,800 128,300 100,000 100,000
- Fuel Dispensing 212,801 171,587 190,977 217,967
- Postage Services 0 0 0 0
- Communications Services 0 0 0 0
- Centralized Vehicle/Equipment 1,345,000 1,330,000 900,000 300,000
- Fire Emergency Vehicles Pool 168,364 168,364 0 0
- Compensated Absences 0 0 0 0
- Risk Management:
Workers Comp Insurance 15,000 0 0 0
Employee Disability Ins. 0 0 0 0
Health/Dental Insurance 0 0 0 0
Vehicle Insurance 0 0 0 0
Property Insurance 0 0 0 0
Liability Insurance 15,000 15,000 15,000 15,000
Total Internal Service 1,924,965 1,813,251 1,205,977 632,967
Total General City 1,924,965 1,813,251 1,205,977 632,967
HOLLAND BOARD OF PUBLIC WORKS - UTILITIES:
- Electric 16,668,000 109,373,361 52,519,169 51,221,513
- Water 3,166,865 4,235,406 4,284,617 4,441,984
- Wastewater 6,273,822 12,765,239 11,038,854 9,628,814
Total Holland BPW Utility 26,108,687 126,374,006 67,842,640 65,292,311
NET RESERVES 28,033,652 128,187,257 69,048,617 65,925,278
PROPRIETARY TYPE FUNDS
SUMMARY OF ENDING RESERVES
-95-

FINANCIAL SOURCES & USES
ACROSS ALL FUND TYPES
Fiscal Year July 1, 2016 - June 30, 2017
Percent
Adopted of
S O U R C E S Budget Total Budget
Property Taxes & Special Assessments 18,922,251 9.0%
Licenses & Permits 705,300 0.3%
Intergovernmental 11,144,728 5.3%
Charges for Services 134,596,296 63.8%
Fines & Forfeits 131,700 0.1%
Interest & Rents 3,327,876 1.6%
Other Revenues 13,706,579 6.5%
Bond Proceeds 7,000,000 3.3%
Use of Fund Equity 21,372,452 10.1%
Total Sources 210,907,182$ 100.0%
U S E S
Management & Administration 2,237,604 1.1%
Fiscal Services (Including Budget Stabilization) 1,321,770 0.6%
Public Safety 10,811,432 5.1%
Transportation 7,285,454 3.5%
Community & Neighborhood Services 5,040,918 2.4%
Parks & Recreation 7,565,824 3.6%
Utility Services 142,223,766 67.4%
Internal Servics 8,211,621 3.9%
Capital Projects (1)
19,800,994 9.4%
Debt Service 6,407,799 3.0%
Total Applications 210,907,182$ 100.0%
Note: "USES" excludes Depreciation, a non-cash expense. Transfers between funds are also excluded from this
presentation, while capital projects and debt service of principal and interest for all fund types are included.
(1) Smaller capital outlay purchases, such as vehicles, equipment & furniture, which are not considered as "Capital
Projects" are not included here, but rather within the related service groups. This explains the variance with the
Service Groups presentation.
-96-

Charges for Services63.8%
Other Revenue6.5%
Intergovernmental5.3%
Licenses & Permits0.3%
Interest & Rents1.6%
Property Taxes9.0% Use of Fund Equity
10.1%
Bond Proceeds3.3%
Fines &Forfeits0.1%
FISCAL YEAR 2017 SOURCES ACROSS ALL FUND TYPES
NOTE: ALL INTERFUND TRANSFERS ARE EXCLUDED. DOLLAR AMOUNTS FOR EACH SOURCECLASSIFICATION CAN BE REFERENCED ON THE PRECEDING ANALYSIS PAGE.
TOTAL $210,907,182
-97-

Utilities67.4%
Public Safety5.1%
Parks & Recreation3.6%
Transportation3.5%
Community & Neighborhood
Services2.4%
Management & Administration
1.1%
Capital Projects
9.4%
Fiscal Services0.6%
Debt Services3.0%
Internal Services3.9%
FISCAL YEAR 2017USES ACROSS ALL FUND TYPES
NOTE: USES INCLUDE ALL OPERATING EXPENSES, CAPITAL OUTLAYS, AND PRINCIPAL MATURITIES OF LONG TERM DEBT. DEPRECIATION EXPENSE IS NOT INCLUDED BECAUSE IT IS NOT A CASH USE. ALL INTERFUND TRANSFERS ARE EXCLUDED. DOLLAR AMOUNTS FOR EACH USE CAN BE REFERENCED ON THE PRECEDING ANALYSIS PAGE.
TOTAL $210,907,182
-98-

Salaries & Wages -Working11.3%
Utility Production24.1%
Supplies / Maintenance
4.0%
Debt Service8.3%
Mandatory Employer Costs0.9%
Other8.0%
Benefits - Includes Nonworking Wages
4.7%
Contractual3.6%
Capital Outlay34.8%
Contingencies0.3%
FISCAL YEAR 2017USES ACROSS ALL FUND TYPES
TOTAL $210,907,182
NOTE: USES INCLUDE ALL OPERATING EXPENSES, CAPITAL OUTLAYS, AND PRINCIPAL MATURITIES OF LONG-TERM DEBT. DEPRECIATION EXPENSE IS NOT INCLUDED BECAUSE IT IS NOT A CASH USE. ALL INTERFUND TRANSFERS ARE EXCLUDED. DOLLAR AMOUNTS FOR EACH CASH USE CAN BE REFERENCED ON THE PRECEDING ANALYSIS PAGE.
-99-

FINANCING SOURCES, USES & FUND EQUITY
SPECIAL DEBT CAPITAL COMPONENT
GENERAL PERMANENT REVENUE SERVICE PROJECT UNIT
FUND FUNDS FUNDS FUNDS FUNDS FUNDS
FUND EQUITY - PROJECTED BEGINNING BALANCE
As of July 1, 2016 4,380,735$ 1,652,730$ 999,663$ 284,338$ 5,963,786$ 2,583,919$
F I N A N C I N G S O U R C E S
Taxes 9,030,988 - 2,916,945 4,060,214 370,911 1,464,758
Special Assessments - - 585,231 7,704 380,850 -
Intergovernmental 4,061,654 - 4,643,647 - 2,350,677 88,750
Licenses and Permits 637,600 - 65,000 - - 2,700
Charges for Services 1,656,300 31,600 632,150 - - 168,630
Fines and Forfeits 131,700 - - - - -
Interest & Rents 336,300 11,000 33,267 453,530 21,203 44,203
Other 34,300 - 123,500 1,619,475 4,696,073 285,356
Total Financing Sources 15,888,842 42,600 8,999,740 6,140,923 7,819,714 2,054,397
F I N A N C I N G U S E S
Group:
Management & Administration 2,015,297 - 222,307 - - -
Fiscal Services 1,318,070 - - - - -
Public Safety 10,799,032 - 9,600 - - -
Transportation 1,215,243 - 3,254,689 - - -
Community & Neighborhood 1,746,329 - 1,816,252 - - 1,105,340
Parks & Recreation 3,848,683 - - - - 769,271
General Debt Service - - - 6,407,799 - -
Internal Services - - - - - -
Capital Projects - - - - 19,800,994 -
Utilities - - - - - -
Total Financing Uses 20,942,654 - 5,302,848 6,407,799 19,800,994 1,874,611
Sources Over (Under) Uses (5,053,812) 42,600 3,696,892 (266,876) (11,981,280) 179,786
OTHER FINANCING SOURCES (USES)
Bond Proceeds - - - - 7,000,000 -
Transfers In 5,323,220 - 1,347,054 279,191 3,855,172 182,259
Transfers Out (311,000) (31,000) (4,666,798) (1) (1,232,000) (423,097)
Net Change in Fund Equity (41,592) 11,600 377,148 12,314 (2,358,108) (61,052)
FUND EQUITY - PROJECTED ENDING BALANCE
As of June 30, 2017 4,339,143$ 1,664,330$ 1,376,811$ 296,652$ 3,605,678$ 2,522,867$
GOVERNMENTAL-TYPE FUNDS
FUND SUMMARY
-100-

FUND SUMMARY
FINANCING SOURCES, USES & FUND EQUITY FINANCING SOURCES, USES & FUND EQUITY
INTERNAL
ENTERPRISE SERVICE
FUNDS FUNDS TOTAL
FUND EQUITY - PROJECTED BEGINNING BALANCE
340,713,732$ 9,916,512$ 366,495,415$ As of July 1, 2016
F I N A N C I N G S O U R C E S
104,650 - 17,948,466 Taxes
- - 973,785 Special Assessments
- - 11,144,728 Intergovernmental
- - 705,300 Licenses and Permits
130,046,626 2,060,990 134,596,296 Charges for Services
- - 131,700 Fines and Forfeits
579,202 1,849,171 3,327,876 Interest & Rents
462,275 6,485,600 13,706,579 Other
131,192,753 10,395,761 182,534,730 Total Financing Sources
F I N A N C I N G U S E S
Group:
- - 2,237,604 Management & Administration
3,700 - 1,321,770 Fiscal Services
2,800 - 10,811,432 Public Safety
632,376 - 5,102,308 Transportation
1,526,097 - 6,194,018 Community & Neighborhood
832,055 - 5,450,009 Parks & Recreation
- - 6,407,799 General Debt Service
- 10,665,117 10,665,117 Internal Services
- - 19,800,994 Capital Projects
98,275,027 - 98,275,027 Utilities
101,272,055 10,665,117 166,266,078 Total Financing Uses
29,920,698 (269,356) 16,268,652 Sources Over (Under) Uses
OTHER FINANCING SOURCES (USES)
- - 7,000,000 Bond Proceeds
1,307,000 220,000 12,513,896 Transfers In
(5,850,000) - (12,513,896) Transfers Out
25,377,698 (49,356) 23,268,652 Net Change in Fund Equity
FUND EQUITY - PROJECTED ENDING BALANCE
366,091,430$ 9,867,156$ 389,764,067$ As of June 30, 2017
(Concluded)
PROPRIETARY-TYPE FUNDS
-101-

GOVERNMENTAL FUNDS
SUMMARY OF FINANCIAL SOURCES, USES AND FUND EQUITY
FY-2015 FY-2016 FY-2017 FY-2015 FY-2016 FY-2017
Final Final Revised Adopted Final Final Revised Adopted
Actual Estimate Budget Actual Estimate Budget
Fund Equity - Beginning Balance 4,700,274$ 4,982,443$ 4,380,735$ 1,595,330$ 1,621,130$ 1,652,730$
FINANCING SOURCES
Taxes 10,131,445 10,681,295 9,030,988 - - -
Special Assessments - - - - - -
Intergovernmental 2,981,647 3,171,893 4,061,654 - - -
Licenses and Permits 694,822 636,700 637,600 - - -
Charges for Services 1,559,390 1,602,142 1,656,300 26,200 31,600 31,600
Fines and Forfeits 156,384 132,200 131,700 - - -
Interest & Rents 341,499 344,700 336,300 11,085 11,000 11,000
Other 27,878 29,348 34,300 - - -
Total Financing Sources 15,893,065 16,598,278 15,888,842 37,285 42,600 42,600
FINANCING USES
Management & Administration 1,338,924 1,431,701 2,015,297 - - -
Fiscal Services 1,241,366 26,564,467 1,318,070 - - -
Public Safety 10,533,713 10,831,858 10,799,032 - - -
Transportation 1,310,365 1,273,509 1,215,243 - - -
Community & Neighborhood Services 1,605,987 1,779,933 1,746,329 - - -
Parks & Recreation 3,745,487 3,765,469 3,848,683 400 - -
Debt Service - - - - - -
Capital Projects - - - - - -
Total Financing Uses 19,775,842 45,646,937 20,942,654 400 - -
Sources Over (Under) Uses (3,882,777) (29,048,659) (5,053,812) 36,885 42,600 42,600
Bond Proceeds - 25,000,000 - - - -
Transfers In 5,041,985 5,078,104 5,323,220 - - -
Transfers Out (877,039) (1,631,153) (311,000) (11,085) (11,000) (31,000)
Net Change in Fund Equity 282,169 (601,708) (41,592) 25,800 31,600 11,600
Fund Equity - Ending Balance 4,982,443$ 4,380,735$ 4,339,143$ 1,621,130$ 1,652,730$ 1,664,330$
OTHER FINANCING SOURCES (USES)
G E N E R A L F U N D P E R M A N E N T F U N D S
-102-

GOVERNMENTAL FUNDS
SUMMARY OF FINANCIAL SOURCES, USES AND FUND EQUITY
FY-2015 FY-2016 FY-2017 FY-2015 FY-2016 FY-2017 FY-2015 FY-2016 FY-2017
Final Final Revised Adopted Final Final Revised Adopted Final Final Revised Adopted
Actual Estimate Budget Actual Estimate Budget Actual Estimate Budget
5,889,430$ 5,107,049$ 999,663$ 199,807$ 224,853$ 284,338$ 2,112,719$ 2,561,303$ 5,963,786$
2,811,847 3,004,062 2,916,945 2,390,584 2,432,854 4,060,214 554,309 658,042 370,911
482,691 537,785 585,231 49,665 35,985 7,704 - 478,811 380,850
3,550,749 4,186,498 4,643,647 - - - 1,020,726 580,125 2,350,677
64,513 60,000 65,000 - - - - - -
618,462 642,484 632,150 - - - - - -
- - - - - - - - -
64,722 45,395 33,267 514,380 489,213 453,530 22,489 31,117 21,203
504,340 56,650 123,500 - - 1,619,475 14,053 1,695,805 4,696,073
8,097,324 8,532,874 8,999,740 2,954,629 2,958,052 6,140,923 1,611,577 3,443,900 7,819,714
195,613 260,246 222,307 - - - - - -
390,464 - - - - - - - -
9,475 9,525 9,600 - - - - - -
2,932,439 2,977,364 3,254,689 - - - - - -
1,787,340 2,024,812 1,816,252 - - - - - -
- - - - - - - - -
- - - 3,169,013 3,142,684 6,407,799 - - -
- - - - - - 5,081,146 11,451,461 19,800,994
5,315,331 5,271,947 5,302,848 3,169,013 3,142,684 6,407,799 5,081,146 11,451,461 19,800,994
2,781,993 3,260,927 3,696,892 (214,384) (184,632) (266,876) (3,469,569) (8,007,561) (11,981,280)
- - - - - - - 3,000,000 7,000,000
845,760 4,528,673 1,347,054 261,566 268,098 279,191 3,960,734 8,660,921 3,855,172
(4,410,134) (11,896,986) (4,666,798) (22,136) (23,981) (1) (42,581) (250,877) (1,232,000)
(782,381) (4,107,386) 377,148 25,046 59,485 12,314 448,584 3,402,483 (2,358,108)
5,107,049$ 999,663$ 1,376,811$ 224,853$ 284,338$ 296,652$ 2,561,303$ 5,963,786$ 3,605,678$
D E B T S E R V I C E F U N D S C A P I T A L P R O J E C T F U N D SS P E C I A L R E V E N U E F U N D S
-103-

GOVERNMENTAL FUNDS
SUMMARY OF FINANCIAL SOURCES, USES AND FUND EQUITY
FY-2015 FY-2016 FY-2017 FY-2015 FY-2016 FY-2017
Final Final Revised Adopted Final Final Revised Adopted
Actual Estimate Budget Actual Estimate Budget
Fund Equity - Beginning Balance 14,497,560$ 14,496,778$ 13,281,252$ 2,701,592$ 2,616,714$ 2,583,919$
FINANCING SOURCES
Taxes 15,888,185 16,776,253 16,379,058 1,051,475 1,161,128 1,464,758
Special Assessments 532,356 1,052,581 973,785 - - -
Intergovernmental 7,553,122 7,938,516 11,055,978 100,000 60,966 88,750
Licenses and Permits 759,335 696,700 702,600 - 2,400 2,700
Charges for Services 2,204,052 2,276,226 2,320,050 100,137 92,700 168,630
Fines and Forfeits 156,384 132,200 131,700 - - -
Interest & Rents 954,175 921,425 855,300 28,657 16,555 44,203
Other 546,271 1,781,803 6,473,348 309,313 326,722 285,356
Total Financing Sources 28,593,880 31,575,704 38,891,819 1,589,582 1,660,471 2,054,397
FINANCING USES
Management & Administration 1,534,537 1,691,947 2,237,604 - - -
Fiscal Services 1,631,830 26,564,467 1,318,070 - - -
Public Safety 10,543,188 10,841,383 10,808,632 - - -
Transportation 4,242,804 4,250,873 4,469,932 - - -
Community & Neighborhood Services 3,393,327 3,804,745 3,562,581 729,665 843,419 1,105,340
Parks & Recreation 3,745,887 3,765,469 3,848,683 918,084 668,973 769,271
Debt Service 3,169,013 3,142,684 6,407,799 - - -
Capital Projects 5,081,146 11,451,461 19,800,994 - - -
Total Financing Uses 33,341,732 65,513,029 52,454,295 1,647,749 1,512,392 1,874,611
Sources Over (Under) Uses (4,747,852) (33,937,325) (13,562,476) (58,167) 148,079 179,786
Bond Proceeds - 28,000,000 7,000,000 - - -
Transfers In 10,110,045 18,535,796 10,804,637 318,123 162,940 182,259
Transfers Out (5,362,975) (13,813,997) (6,240,799) (344,834) (343,814) (423,097)
Net Change in Fund Equity (782) (1,215,526) (1,998,638) (84,878) (32,795) (61,052)
Fund Equity - Ending Balance 14,496,778$ 13,281,252$ 11,282,614$ 2,616,714$ 2,583,919$ 2,522,867$
T O T A L G O V E R N M E N T A L F U N D S C O M P O N E N T U N I T F U N D S
OTHER FINANCING SOURCES (USES)
-104-

ENTERPRISE FUNDS
SUMMARY OF FINANCIAL SOURCES, USES AND FUND EQUITY
FY-2015 FY-2016 FY-2017
Final Final Revised Adopted
Actual Estimate Budget
Fund Equity - Beginning Balance 292,748,218$ 314,279,951$ 340,713,732$
FINANCING SOURCES
Taxes 99,984 104,441 104,650
Special Assessments - - -
Intergovernmental - - -
Licenses and Permits - - -
Charges for Services 122,036,326 125,973,503 130,046,626
Fines and Forfeits - - -
Interest & Rents 1,163,879 915,600 579,202
Other 2,068,129 908,459 462,275
Total Financing Sources 125,368,318 127,902,003 131,192,753
FINANCING USES
Management & Administration - - -
Fiscal Services 3,401 3,200 3,700
Public Safety 5,723 2,800 2,800
Transportation 616,189 627,551 632,376
Community & Neighborhood Services 1,658,052 1,499,235 1,526,097
Parks & Recreation 809,512 833,137 832,055
Utilities 95,577,946 93,200,365 98,275,027
Total Financing Uses 98,670,823 96,166,288 101,272,055
Sources Over (Under) Uses 26,697,495 31,735,715 29,920,698
OTHER FINANCING SOURCES (USES)
Transfers In 178,238 233,066 1,307,000
Transfers Out (5,344,000) (5,535,000) (5,850,000)
Net Change in Fund Equity 21,531,733 26,433,781 25,377,698
Fund Equity - Ending Balance 314,279,951$ 340,713,732$ 366,091,430$
-105-

INTERNAL SERVICE FUNDS
SUMMARY OF FINANCIAL SOURCES, USES AND FUND EQUITY
FY-2015 FY-2016 FY-2017
Final Final Revised Adopted
Actual Estimate Budget
Fund Equity - Beginning Balance 10,293,459$ 10,537,391$ 9,916,512$
FINANCING SOURCES
Taxes - - -
Special Assessments - - -
Intergovernmental - - -
Licenses and Permits - - -
Charges for Services 1,813,564 1,624,763 2,060,990
Fines and Forfeits - - -
Interest & Rents 1,931,732 1,863,683 1,849,171
Other 5,920,900 6,027,610 6,485,600
Total Financing Sources 9,666,196 9,516,056 10,395,761
FINANCING USES
Type of Internal Service:
Technology 630,787 696,733 792,911
Fuel Dispensing 740,010 486,010 781,110
Postage 18,622 19,800 20,800
Communications 120,285 131,800 128,800
Centralized Vehicle & Equipment 2,372,201 2,409,044 2,372,346
Fire Emergency Vehicle Replacement 89,922 110,000 110,000
Compensated Absences 29,712 20,000 35,000
Risk Management - All Coverages 5,616,660 6,581,383 6,424,150
Total Financing Uses 9,618,199 10,454,770 10,665,117
Sources Over (Under) Uses 47,997 (938,714) (269,356)
OTHER FINANCING SOURCES (USES)
Transfers In 231,135 317,835 220,000
Transfers Out (35,200) - -
Net Change in Fund Equity 243,932 (620,879) (49,356)
Fund Equity - Ending Balance 10,537,391$ 9,916,512$ 9,867,156$
-106-

> FUND SUMMARY - GENERAL FUND, INCLUDING
BUDGET STABILIZATION
> FUND SUMMARY - GENERAL FUND ONLY
> FUNDING SOURCES
> FUNDING USES
The General Fund is the basic and primary operating fund of general
government operations. Departments and activities of the General
Fund are included throughout the Group tabs of the budget document.
GENERAL FUND SUMMARY
-107-

FY-2014 FY-2015 FY-2016 FY-2017
Final Final Final Revised Adopted
Description Actual Actual Estimate Budget
Funding Sources:
General Fund 20,580,890$ 20,935,050$ 46,676,382$ 21,212,062$
Budget Stabilization 69,000 - 0 - - 0 - - 0 -
TOTAL FUNDING SOURCES 20,649,890 20,935,050 46,676,382 21,212,062
Funding Uses:
General Fund 20,905,942 20,650,808 47,263,090 21,203,654
Budget Stabilization 3,650 2,073 15,000 50,000
TOTAL FUNDING USES 20,909,592 20,652,881 47,278,090 21,253,654
Net Increase (Decrease)
From Operations (259,702) 282,169 (601,708) (41,592)
FUND EQUITY - June 30:
Reserved:
- NIP/MSHDA Devel. Fees 12,915$ 12,915$ - 0 -$ - 0 -$
- Budget Stabilization 983,286 981,213 966,213 916,213
Unreserved:
- Designated-Market Adj. - 0 - - 0 - - 0 - - 0 -
- Undesignated 3,704,073 3,988,315 3,414,522 3,422,930
Total Ending Fund Equity 4,700,274$ 4,982,443$ 4,380,735$ 4,339,143$
Change from Prior Fiscal Year 17.6% 6.0% -12.1% -0.9%
Fund Equity Expressed as A
A Percentage of Expenditures 22.5% 24.1% 9.3% 20.4%
TOTAL GENERAL FUNDGENERAL FUND AND BUDGET STABILIZATION
-108-

FY-2014 FY-2015 FY-2016 FY-2017
Final Final Final Revised Adopted
Description Actual Actual Estimate Budget
TOTAL FUNDING SOURCES 20,580,890 20,935,050 46,676,382 21,212,062
TOTAL FUNDING USES 20,905,942 20,650,808 47,263,090 21,203,654
Net Increase (Decrease)
From Operations (325,052) 284,242 (586,708) 8,408
FUND EQUITY - June 30:
Reserved:
- NIP/MSHDA Devel. Fees 12,915 12,915 - 0 - - 0 -
Unreserved:
- Designated - 0 - - 0 - - 0 - - 0 -
- Undesignated 3,704,073 3,988,315 3,414,522 3,422,930
Total Ending Fund Equity 3,716,988$ 4,001,230$ 3,414,522$ 3,422,930$
Change from Prior Fiscal Year 9.4% 7.6% -14.7% 0.2%
Fund Equity Expressed as A
A Percentage of Expenditures 17.8% 19.4% 7.2% 16.1%
This fund presentation is a summary of all General fund and department activities that can be found in the Groups:
Management & Administration, Fiscal Services, Public Safety, Transportation, Community & Neighborhood Services,
and Parks and Recreation.
GENERAL FUNDFUND SUMMARY
- 0 -
1,000,000
2,000,000
3,000,000
4,000,000
5,000,000
FY03 FY04 FY05 FY06 FY07 FY08 FY09 FY10 FY11 FY12 FY13 FY14 FY15 FY16Est
FY17Est
Fund Equity
-109-

FY-2014 FY-2015 FY-2016 FY-2017 FY-16
Final Final Final Revised Adopted Revised Est
Description Actual Actual Estimate Budget to FY-17
Taxes 10,179,160$ 10,131,445$ 10,681,295$ 9,030,988$ -15.5%
Licenses & Permits 627,716 694,822 636,700 637,600 0.1%
Federal Grants 39,533 32,311 36,900 34,100 -7.6%
State Revenue Sharing 2,844,147 2,895,971 3,084,993 3,977,554 28.9%
Local Unit Contributions 42,717 53,365 50,000 50,000 0.0%
Charges for Services 1,554,820 1,559,390 1,602,142 1,656,300 3.4%
Fines & Forfeits 192,433 156,384 132,200 131,700 -0.4%
Interests & Rents 354,830 341,499 344,700 336,300 -2.4%
Other Revenue 33,513 27,878 29,348 34,300 16.9%
Bond Proceeds - 0 - - 0 - 25,000,000 - 0 - -100.0%
Transfers from Other Funds 4,712,021 5,041,985 5,078,104 5,323,220 4.8%
Total Funding Sources 20,580,890$ 20,935,050$ 46,676,382$ 21,212,062$ -54.6%
GENERAL FUND
FUNDING SOURCES
- 0 -
2,000,000
4,000,000
6,000,000
8,000,000
10,000,000
12,000,000
14,000,000
FY03 FY04 FY05 FY06 FY07 FY08 FY09 FY10 FY11 FY12 FY13 FY14 FY15 FY16Est
FY17Est
Property Taxes State Revenue Sharing BPW Dividend Interest & Rents
-110-

Interest & Rents1.6%
Licenses & Permits3.0%
Charges for Services
7.8%
Fines & Forfeits0.6%
Intergov't Revenues
18.9%
Local Unit Contributions
0.2%
Operating Transfers In25.1%
Other Revenues0.2%
Property Taxes42.6%
General Fund FY-2017 Revenues by Source
TOTAL $21,212,062
-111-

Revenue Classification 2006-07 Actual 2011-12 Actual 2016-17 Adopted
Taxes $11,687,614 56.80% $10,468,953 52.93% $9,030,988 42.57%
Licenses & Permits 543,700 2.64% 497,102 2.51% 637,600 3.01%
Intergovernmental 3,252,100 15.80% 2,718,670 13.75% 4,011,654 18.91%
Local Unit Contributions 37,000 0.18% 44,310 0.22% 50,000 0.24%
Charges for Services 1,093,020 5.31% 1,424,747 7.20% 1,656,300 7.81%
Fines & Forfeits 255,000 1.24% 205,665 1.04% 131,700 0.62%
Interest & Rents 617,031 3.00% 348,156 1.76% 336,300 1.59%
Other Revenue 6,300 0.03% 88,000 0.44% 34,300 0.16%
Operating Transfers In 2,902,669 14.11% 3,983,553 20.14% 5,323,220 25.10%
Use of Fund Balance 182,719 0.89% 0 0.00% 0 0.00%
TOTAL REVENUES $20,577,153 100.00% $19,779,156 99.99% $21,212,062 100.01%
GENERAL FUND
Comparison by Classification of Revenues & Other Financing Sources
-112-

0.0
2.0
4.0
6.0
8.0
10.0
12.0
14.0
16.0
18.0
20.0
22.0
FY-08 FY-09 FY-10 FY-11 FY-12 FY-13 FY-14 FY-15 FY-16 FY-17
M
I
L
L
I
O
N
S
O
F
D
O
L
L
A
R
S
CITY OF HOLLANDGENERAL FUND REVENUES BY SOURCE
Taxes Licenses & Permits Intergovernmental
Charges for Service Interest & Rents Other
Transfer from Other Funds Use of Fund Balance
-113-

FY-2014 FY-2015 FY-2016 FY-2017 FY-16
Final Final Final Revised Adopted Revised Est
Description Actual Actual Estimate Budget to FY-17
Management & Administration
City Council 163,909 163,188 171,930 183,113 6.5%
City Manager 325,688 332,988 323,870 340,625 5.2%
Elections / Voter Registration 31,231 72,613 74,367 79,067 6.3%
City Attorney 215,346 199,784 202,600 202,600 0.0%
City Clerk 186,765 216,273 266,732 302,382 13.4%
Human Resources 252,306 240,869 225,116 247,100 9.8%
Volunteer Services 7,272 7,303 5,904 7,521 27.4%
Human Relations Commission 92,036 105,906 141,182 159,089 12.7%
Contingencies Appropriation 0 0 20,000 493,800 2369.0%
Total 1,274,553 1,338,924 1,431,701 2,015,297 40.8%
Fiscal Services
Finance Office 502,164 449,000 517,091 501,225 -3.1%
Independent Audit 48,292 51,529 46,080 42,850 -7.0%
Property Assessing Office 443,489 405,009 401,767 421,592 4.9%
Treasurer's Office 172,055 240,946 212,787 222,403 4.5%
Unallocated Insurance 77,581 92,809 80,000 80,000 0.0%
Pension Bonds 0 0 25,291,742 0 -100.0%
Transfers to Other Funds 1,787,518 537,039 1,442,153 111,000 -92.3%
Total 3,031,099 1,776,332 27,991,620 1,379,070 -95.1%
Public Safety
Management 933,579 982,398 887,426 780,882 -12.0%
Police Division 6,326,446 6,455,072 6,808,811 6,854,586 0.7%
Fire Division 2,624,852 2,788,560 2,861,128 2,895,108 1.2%
Facilities 398,589 397,683 374,493 368,456 -1.6%
Total 10,283,466 10,623,713 10,931,858 10,899,032 -0.3%
Transportation
Street Division 1,039,139 1,126,700 1,100,071 1,000,843 -9.0%
Transportation Mgmt/Engineering 174,596 183,665 173,438 214,400 23.6%
Total 1,213,735 1,310,365 1,273,509 1,215,243 -4.6%
GENERAL FUNDFUNDING USES BY FUNCTION
-114-

FY-2014 FY-2015 FY-2016 FY-2017 FY-16
Final Final Final Revised Adopted Revised Est
Description Actual Actual Estimate Budget to FY-17
Community & Neighborhood Services
City Hall 229,646 233,214 189,071 167,968 -11.2%
Planning & Zoning 251,218 226,349 182,427 169,295 -7.2%
Environmental Health & Inspections 376,626 463,339 447,125 403,823 -9.7%
Construction Inspections 457,802 502,786 589,754 619,055 5.0%
Social Assistance 0 0 0 40,000 100.0%
Housing & Neighborhoods 200,032 197,706 214,940 207,136 -3.6%
Economic Devel. Assistance 198,295 101,960 90,026 73,750 -18.1%
8th Street Market 122,969 130,633 155,590 165,302 6.2%
Total 1,836,588 1,855,987 1,868,933 1,846,329 -1.2%
Parks & Recreation
Cemeteries 465,672 448,750 466,223 492,132 5.6%
Parks & Recreation Administration 59,901 52,366 58,093 59,174 1.9%
Recreation 830,374 887,623 937,577 973,110 3.8%
Parks 1,321,050 1,574,316 1,653,716 1,686,264 2.0%
DeGraaf Nature Center 246,849 268,965 315,481 353,682 12.1%
Cultural Activities Assistance 97,589 258,685 98,093 109,200 11.3%
Civic Center 245,066 254,782 236,286 175,121 -25.9%
Total 3,266,501 3,745,487 3,765,469 3,848,683 2.2%
Total Funding Uses 20,905,942 20,650,808 47,263,090 21,203,654 -55.1%
GENERAL FUNDFUNDING USES BY FUNCTION
-115-

TOTAL $21,203,654
Management & Administration 9.5%
Fiscal Services6.5%
Public Safety 51.4%
Transportation 5.7%
Community & Neighborhood Services 8.7%
Parks & Recreation18.2%
FY-2017 Expenditures by Function
Working Wages44.3%
Fringe Benefits22.1%
Mandatory Employer Costs3.2%
Supplies/Maintenance5.0%
Contractual5.4%
Capital Outlay0.1%
Other15.9%
Transfers Out1.5%
Contingency2.5%
FY-2017 Expenditures by Type
-116-

Service Group 2006-07 Actual 2011-12 Actual 2016-17 Adopted
Management & Administration $1,722,830 8.37% $1,086,208 5.58% $2,015,297 9.51%
Fiscal Services 1,903,976 9.25% 1,828,273 9.39% 1,379,070 6.50%
Public Safety 9,657,254 46.93% 9,837,572 50.50% 10,899,032 51.40%
Transportation 1,239,989 6.03% 1,283,936 6.59% 1,215,243 5.73%
Community & Neighborhood Svcs 2,074,453 10.08% 1,915,324 9.83% 1,846,329 8.71%
Parks & Recreation 3,978,921 19.34% 3,527,398 18.11% 3,848,683 18.15%
Total Appropriations $20,577,423 100.00% $19,478,711 100.00% $21,203,654 100.00%
GENERAL FUND
Comparison of Appropriations by Function
-117-

0.0
2.0
4.0
6.0
8.0
10.0
12.0
14.0
16.0
18.0
20.0
22.0
FY-08 FY-09 FY-10 FY-11 FY-12 FY-13 FY-14 FY-15 FY-16 FY-17
M
I
L
L
I
O
N
S
O
F
D
O
L
L
A
R
S
CITY OF HOLLANDGENERAL FUND EXPENDITURES BY FUNCTION
Management & Administration Fiscal Services
Public Safety Transportation
Community & Neighborhood Services Parks & Recreation
-118-

ALL SERVICE GROUPS
General Fund8.9%
Permanent Fund0.0%
Special Revenue Funds4.1%
Debt Service Funds2.7%
Capital Project Funds8.8%
Enterprise Funds69.7%
Internal Service Funds4.8%
Component Units1.0%
Total Uses by Fund Type $239,730,619 (Incl. Transfers)
Taxes & S/A10.0%
Licenses & Permits0.4%
Interest & Rents1.7%
Federal / State5.9%
Charges for Services71.0%
Other10.9%
Fines & Forfeits0.1%
Sources: $189,534,730 Excluding Transfers
Working Wages11.3%
Benefits & Non-Working Wages4.7%Other
8.0%
Mandatory Employer Costs1.0%
Utility Production24.1%
Contingencies0.3% Capital Outlay
34.7%
Contractual3.6%
Supplies/Maintenance4.0%
Debt Service8.3%
Uses: $210,907,182 Excluding Transfers & Depreciation
-119-

ALL SERVICE GROUPS
SUMMARY OF DEPTS, FUNCTIONS & RELATED FUNDS
FY-2017
Adopted
Description Budget
FUND TYPES -
General 21,253,654$
Permanent 31,000
Special Revenue 9,969,646
Debt Service 6,407,800
Capital Projects 21,032,994
Enterprise 167,144,600
Internal Service 11,590,217
Component Unit 2,300,708
FUND TYPE - TOTALS 239,730,619$
FUNDING SOURCES -
Taxes & Special Assessments 18,922,251
Licenses & Permits 705,300
Intergovernmental 11,144,728
Charges for Services 134,596,296
Fines & Forfeits 131,700
Interest & Rents 3,327,876
Other 20,706,579
Transfers In 12,513,896
TOTAL SOURCES 202,048,626$
FUNDING USES -
Personnel Services -
* Salaries & Wages - Working 23,860,304$
* Benefits - Includes NonWorking Wages 9,827,585
* Mandatory Employer Costs 2,012,394
Other Current Expenditures -
* Supplies / Maintenance 8,541,663
* Contractual 7,513,940
* Utility Production 50,891,214
* Other 16,871,029
Capital Outlay 73,369,483
Debt Service Payments
* Principal Maturities 12,556,025
* Interest & Fee Payments 4,929,745
Transfers Out 12,513,896
Depreciation & Amortization Expense 16,309,541
Contingencies 533,800
TOTAL USES 239,730,619$
Personnel Services Total Amount 35,700,283$
* Full-Time Positions 357.00
* Part-Paid Fire Positions (Not @ F.T.E.) 30.00
* Part-Time Positons @ F.T.E. 60.78
- - G R O U P S T A F F I N G T O T A L S - -
- - G R O U P F U N D I N G U S E S A C R O S S F U N D S - -
- - G R O U P F U N D I N G S O U R C E S & U S E S T O T A L S - -
-120-

ALL SERVICE GROUPS
SUMMARY OF DEPTS, FUNCTIONS & RELATED FUNDS
General Fund Debt Service Total Not Included in From Nine
Unallocated Sources Funds Service Groups Service Groups Grand Total
FUND TYPES -
General - 0 - - 0 - 21,253,654 21,253,654
Permanent - 0 - - 0 - 31,000 31,000
Special Revenue - 0 - - 0 - 9,969,646 9,969,646
Debt Service 6,407,800 6,407,800 - 0 - 6,407,800
Capital Projects - 0 - - 0 - 21,032,994 21,032,994
Enterprise - 0 - - 0 - 167,144,600 167,144,600
Internal Service - 0 - - 0 - 11,590,217 11,590,217
Component Unit - 0 - - 0 - 2,300,708 2,300,708
FUND TYPE - TOTALS - 0 -$ 6,407,800$ 6,407,800$ 233,322,819$ 239,730,619$
FUNDING SOURCES -
Taxes & Special Assessments 9,030,988 4,067,918 13,098,906 5,823,345 18,922,251
Licenses & Permits 1,500 - 0 - 1,500 703,800 705,300
Intergovernmental 3,977,554 - 0 - 3,977,554 7,167,174 11,144,728
Charges for Services 56,645 - 0 - 56,645 134,539,651 134,596,296
Fines & Forfeits - 0 - - 0 - - 0 - 131,700 131,700
Interest & Rents 101,500 453,530 555,030 2,772,846 3,327,876
Other 1,300 1,619,475 1,620,775 19,085,804 20,706,579
Transfers In 5,312,220 279,191 5,591,411 6,922,485 12,513,896
TOTAL SOURCES 18,481,707$ 6,420,114$ 24,901,821$ 177,146,805$ 202,048,626$
FUNDING USES -
Personnel Services -
* Salaries & Wages - Working - 0 - - 0 - 23,860,304 23,860,304
* Benefits - Includes NonWorking Wages - 0 - - 0 - 9,827,585 9,827,585
* Mandatory Employer Costs - 0 - - 0 - 2,012,394 2,012,394
Other Current Expenditures -
* Supplies / Maintenance - 0 - - 0 - 8,541,663 8,541,663
* Contractual - 0 - - 0 - 7,513,940 7,513,940
* Utility Production - 0 - - 0 - 50,891,214 50,891,214
* Other 1,001 1,001 16,870,028 16,871,029
Capital Outlay - 0 - 73,369,483 73,369,483
Debt Service Payments
* Principal Maturities 5,126,459 5,126,459 7,429,566 12,556,025
* Interest & Fee Payments 1,280,339 1,280,339 3,649,406 4,929,745
Transfers Out 1 1 12,513,895 12,513,896
Depreciation & Amortization Expense 16,309,541 16,309,541
Contingencies - 0 - - 0 - 533,800 533,800
TOTAL USES - 0 -$ 6,407,800$ 6,407,800$ 233,322,819$ 239,730,619$
Note - The summary excludes Building Authority and Notes Payable Rental Reciepts & Rental Payments of $2,090,057 for two
related bond issues as those Sources & Uses are already included in Taxes (Sources) and Principal/Interest Maturities (Uses).
-121-

ALL SERVICE GROUPS
SUMMARY OF DEPTS, FUNCTIONS & RELATED FUNDS
FY-2017
General BPW Utility All Other Adopted
Description Fund Funds Funds Budget
FUNDING SOURCES -
Taxes & Special Assessments 9,030,988$ -$ 9,891,263$ 18,922,251$
Licenses & Permits 637,600 - 67,700 705,300
Intergovernmental 4,061,654 - 7,083,074 11,144,728
Charges for Services 1,656,300 127,875,278 5,064,718 134,596,296
Fines & Forfeits 131,700 - - 131,700
Interest & Rents 336,300 488,101 2,503,475 3,327,876
Other 34,300 462,275 20,210,004 20,706,579
Transfers In 5,323,220 - 7,190,676 12,513,896
TOTAL SOURCES 21,212,062$ 128,825,654$ 52,010,910$ 202,048,626$
FUNDING USES -
Personnel Services -
* Salaries & Wages - Working 9,407,556$ 11,880,451$ 2,572,297$ 23,860,304$
* Benefits - Includes NonWorking Wages 4,677,840 4,097,294 1,052,451 9,827,585
* Mandatory Employer Costs 672,944 1,088,851 250,599 2,012,394
Other Current Expenditures -
* Supplies / Maintenance 1,068,813 4,706,785 2,766,065 8,541,663
* Contractual 1,140,000 4,484,740 1,889,200 7,513,940
* Utility Production - 50,891,214 - 50,891,214
* Other 3,363,291 2,604,480 10,903,258 16,871,029
Capital Outlay 28,410 51,390,979 21,950,094 73,369,483
Debt Service Payments
* Principal Maturities - 7,429,566 5,126,459 12,556,025
* Interest & Fee Payments - 3,649,406 1,280,339 4,929,745
Transfers Out 311,000 5,850,000 6,352,896 12,513,896
Depreciation & Amortization Expense - 14,871,806 1,437,735 16,309,541
Contingencies 533,800 - - 533,800
TOTAL USES 21,203,654$ 162,945,572$ 55,581,393$ 239,730,619$
Personnel Services Total Amount 14,758,340$ 17,066,596$ 3,875,347$ 35,700,283$
* Full-Time Positions 357.00
* Part-Paid Fire Positions (Not @ F.T.E.) 30.00
* Part-Time Positons @ F.T.E. 60.78
- - G R O U P S T A F F I N G T O T A L S - -
- - G R O U P F U N D I N G S O U R C E S & U S E S T O T A L S - -
-122-

MANAGEMENT & ADMINISTRATION INTRODUCTION
GROUP MISSION STATEMENT The Management and Administration provide oversight and management of general government activity. This includes the implementation of legislative responsibilities through adoption of ordinances and establishment of policies; and the overall management and administration of the City and its various departments and operations, as well as the allocation of financial, manpower, and material resources to implement quality services and programs to meet the City’s Mission Statement.
GROUP ORGANIZATIONAL STRUCTURE
-123-

MANAGEMENT & ADMINISTRATION
$-
$100,000
$200,000
$300,000
$400,000
$500,000
Use
s D
oll
ars
Total Uses by Department $2,472,604
Licenses & Permits1.0%
Charges for Services21.5%
Interest & Rents0.1%
General Revenues77.4%
Funding Sources
Working Wages30.5%
Benefits & NonWorking Wages10.1%
Mandatory Employer Costs2.6%
Other12.5%
Contractual12.3%
Capital Outlay0.8%
Transfers Out9.5%
Contingencies20.0%
Suppl/Maint.1.7%
Funding Uses
-124-

FY-2014 FY-2015 FY-2016 FY-2017
Final Final Final Adopted
Description Actual Actual Revised Est. Budget
FUND TYPES -
General 1,274,553$ 1,338,940$ 1,431,701$ 2,015,297$
Special Revenue 401,104 422,513 554,746 457,307
TOTAL FUND TYPE 1,675,657$ 1,761,453$ 1,986,447$ 2,472,604$
FUNDING SOURCES -
Taxes & Special Assessments - 0 - - 0 - - 0 - - 0 -
Intergovernmental 610 - 0 - 2,550 - 0 -
Licenses & Permits 25,809 28,229 25,000 26,000
Charges for Services 446,698 510,328 549,400 540,200
Interest & Rents 3,337 2,855 3,000 3,000
Other 3,307 - 0 - 5,700 5,700
Transfers In - 0 - - 0 - - 0 - - 0 -
TOTAL SOURCES 479,761$ 541,412$ 585,650$ 574,900$
FUNDING USES -
Personal Services -
* Salaries & Wages - Working 572,314$ 680,552$ 723,522$ 755,132$
* Benefits - Incl. NonWorking Wages 195,885 267,917 231,688 248,996
* Mandatory Employer Costs 48,342 54,411 59,895 63,945
Other Current Expenditures -
* Supplies / Maintenance 26,750 34,344 48,046 42,026
* Contractual Expenditures 349,929 257,840 295,316 304,050
* Other 199,169 202,974 251,480 310,655
Capital Outlay 83,268 36,515 62,000 19,000
Transfers Out 200,000 226,900 294,500 235,000
Contingencies - 0 - - 0 - 20,000 493,800
TOTAL USES 1,675,657$ 1,761,453$ 1,986,447$ 2,472,604$
Personnel Services Total Amount 816,541$ 1,002,880$ 1,015,105$ 1,068,073$
* Full-Time Positions 6.15 9.15 9.07 9.07
* Part-Time Positions @ F.T.E. 4.05 4.75 4.95 5.60
* Elected Officials (Not @ F.T.E.) 9.00 9.00 9.00 9.00
MANAGEMENT & ADMINISTRATION
SUMMARY OF DEPTS, FUNCTIONS & RELATED FUNDS
- - G R O U P F U N D N G U S E S A C R O S S F U N D S - -
- - GROUP FUNDING SOURCES & USES TOTALS - -
- - G R O U P S T A F F I N G T O T A L S - -
-125-

MANAGEMENT & ADMINISTRATION CITY COUNCIL
ACTION PLAN
The City Council serves as the legislative branch of the Holland City government by establishing the final policy decisions affecting City government developed through a cooperative effort with the Holland Board of Public Works, and all other citizen advisory commissions, special task forces, and neighborhood organizations; by developing a climate which will continue to provide a strong residential, commercial and industrial base which will enhance and sustain the social, economic and cultural quality of life for its citizens; and by participating in the Macatawa Area Coordinating Council to continue to strengthen the area cooperation of the Holland/ Zeeland area governmental units.
In order to identify priorities to give direction to staff, Council members vote on their highest goals each year at an annual retreat. The City Council held its 2016 Retreat on Saturday, January 30, 2016. The goals that received support via a modified dotocracy process were:
Rank 2016 City Council Priorities Votes
1 Create a path to begin to achieve fiber internet access to neighborhoods (after HBPW Pilot program and after review of the Business Case and by the creation of priorities, perhaps down Pine or in the Smart Zone)
11
2 Eliminate barriers to new development and re-development by reviewing ways to reduce requirements (review Historic District Commission Guidelines), streamline reviews (reduce the number of steps or boards), provide a clear path to success (one-stop shopping and form-based code approaches), provide incentives (like Neighborhood Enterprise Zone tax reductions), and/or streamlining this permitting (for Partners for Renewal, for example)
9
3 Create the budget to be within the annual taxable value increases and reduce the tax burden over time by eliminating the 0.7 capital debt and 0.15 fire station millage increases from 2012/2013
8
4 Add a water feature for Downtown public areas, parks and/or at Civic Center Place (splash pads) 5
Add restaurant and indoor/outdoor concert venue at Windmill Island Gardens as part of the Interpretive and Landscape Plan steps in the Business Plan
5
6 Work with MDOT to make the US 31 Corridor From 8th to 32nd more pedestrian friendly and more aesthetically pleasing and budget the City's share
5
7 Add language to City ordinances and policies to protect LGBT community against discrimination in housing, employment and accommodation
5
8 Create and plan for a beautiful, world -class waterfront with public access by water 4
9 Create a Dog Park at Window on the Waterfront or at VanRaalte Farm 4
10 Consider zoning revisions for "Air BNB" (short-term vacation rentals) in the (R-TRN) zones (Downtown neighborhoods)
4
11 Increase community knowledge of City activities by billboards, message boards, Facebook networks, churches, links, mobile apps, photo survey of visual preferences and by otherwise leveraging technology
3
12 Create a Downtown ice rink in relation to Civic Center Place, potentially an ice skating pathway 3
-126-

MANAGEMENT & ADMINISTRATION
CITY COUNCIL
FY-14 FY-15 FY-16 FY-17
Actual Actual Projected Projected
Number of Regular Scheduled Legislative Sessions 24 24 24 24
Number of Special Called Legislative Sessions 15 9 10 10
Number of Study Sessions 16 19 20 20
Number of Council Actions (Calendar Year) 695 732 711 720
Number of Ordinances Adopted 20 20 20 15
Facebook Posts on Legislative-Policy-Related 0 0 17 30
Post Reach (Post is Viewed in Users Newsfeed) Unk Unk 98,700 250,000
PERFORMANCE MEASURES
Work
load
-127-

FY-2014 FY-2015 FY-2016 FY-2017
Final Final Final Adopted
Description Actual Actual Revised Est. Budget
FUNDING SOURCES -
No Funding Sources - 0 -$ - 0 -$ - 0 -$ - 0 -$
General Fund Operating Revenues 163,908 163,205 171,930 183,113
TOTAL SOURCES 163,908$ 163,205$ 171,930$ 183,113$
FUNDING USES -
Personnel Services -
* Salaries & Wages - Working 62,533$ 62,852$ 65,870$ 67,449$
* Benefits - Incl. NonWorking Wages 3,651 2,811 3,625 5,362
* Mandatory Employer Costs 4,856 4,937 5,196 5,302
Other Current Expenditures -
* Supplies / Maintenance 1,194 1,180 3,000 1,800
* Contractual 5,398 8,249 8,300 6,200
* Other 86,276 83,176 85,939 97,000
Capital Outlay - 0 - - 0 - - 0 - - 0 -
TOTAL USES 163,908$ 163,205$ 171,930$ 183,113$
Personnel Services Total Amount 71,040$ 70,600$ 74,691$ 78,113$
* Full-Time Positions 0.25 0.20 0.20 0.20
* Elected Officials (Not @ F.T.E.) 9.00 9.00 9.00 9.00
MANAGEMENT & ADMINISTRATION
GENERAL FUND - CITY COUNCIL
- - F U N D I N G S O U R C E S & U S E S - -
- - S T A F F I N G - -
-128-

MANAGEMENT & ADMINISTRATION CITY MANAGER
DEPARTMENT MISSION STATEMENT
To improve the service and program capabilities of the City organizations through the effective and efficient forecasting and planning of financial, manpower and material needs of the City; to assist the City Council in developing the City's needs in services and programs; and to implement such services and programs established by the City Council through continual evaluation of the organization and structure of the City.
ACTION PLAN
Celebrate team success: Summer and Christmas events.
Work to implement the City Council goals from January, 2016:
a. Create a path to begin to achieve fiber internet access to neighborhoods (after HBPW Pilot program and after review of the Business Case and by the creation of priorities, perhaps down Pine or in the Smart Zone). Create a “Fiber to Neighborhoods” Strategic Plan. Work to fund in FY 18.
b. Eliminate barriers to new development and re-development by reviewing ways to reduce requirements (review Historic District Commission Guidelines), streamline reviews (reduce the number of steps or boards), provide a clear path to success (one-stop shopping and form-based code approaches), provide incentives (like Neighborhood Enterprise Zone tax reductions), and streamline permitting (Partners for Renewal, for example). The Holland Historic District guidelines could be written to enable flexibility when warranted (glass blocks, materials that appear original yet are more easily purchased and installed, larger footprints for garages when reviewed, etc.). (Planning funds TBD).
c. Create the budget to be within the annual taxable value increases so as to recommend a FY 17 budget that has no operating tax increase and reduce the tax burden over time by rolling back the 0.7 for capital debt and 0.15 millage for Fire Station renovations.
d. Add a water feature for Downtown public areas, parks and/or at Civic Center Place
(splash pads). (Cost TBD by GO Construction)
e. Work with MDOT to make the US 31 Corridor from 8th to 32nd more pedestrian friendly
and more aesthetically pleasing and budget the City's share. (Experiment in FY16 to be evaluated this spring).
f. Create an “interpretive plan” for Windmill Island Gardens that includes a restaurant and an indoor/outdoor concert venue feasibility study via an Interpretative Plan and an eventual Landscape Plan ($15,000).
g. Seek a city-wide charrette approach to the question of protecting the LGBT community against housing and job discrimination ($TBD for speakers, outreach, facilitators,
-129-

MANAGEMENT & ADMINISTRATION CITY MANAGER
neighborhood coffees, Council open houses, etc. and $TBD for professional facilitation help). Legislation may, or may not, occur. Knowledge and education would be the goal.
h. Create and plan for a beautiful, world -class waterfront with public access by water.
Creation of common ownership will be the goal for FY17 (no public funds). Work with experts to complete the Waterfront Visioning ($25,000) and begin implementation of a multi-year redevelopment outcome determined by the City Council. ($25,000) in the Municipal Capital Improvement Fund.
i. Create a Dog Park at Window on the Waterfront or at VanRaalte Farm Dog Park by working with the Parks and Recreation Board and donors ($15,000).
j. Create a Downtown ice rink in relation to Civic Center Place, potentially an ice skating pathway ($TBD by GO Construction).
k. Work with the Neighborhood Improvement Committee, the Planning Commission and the City Council to consider “AirBnB” Short Term Vacation Rental Policy changes, at least in the R-TRN and commercial districts. (No extra cost).
l. Increase community knowledge of City activities by billboards, message boards,
Facebook networks, churches, links, mobile apps and by otherwise leveraging links, mobile apps, visual preference surveys, etc. (No extra cost).
Work to complete the FY 17 City Manager’s Budget Theme to focus on Infrastructure and Service Reinvestment by: o Complete the Civic Center Design and proceed to construction groundbreaking. A total of
approximately $200,000 will be needed for final design costs FY17 and $500,000 in bidding and initial construction management services. A fund raising goal of $2 million more will be discussed. Total construction in FY17 is estimated to be $5 million.
o Create a Five Year Plan for reinvesting in Fire Station(s) via use of the established sinking fund for debt service from re-directed millage. (No extra cost).
o Backfilling and/or new positions as needed will be funded and filled as determined to be
fiscally responsible in the new normal mode (Deputy Street Superintendent, Recreation programmer, part-time Home Energy Retrofit Manager, etc. for approximately $150,000 more yet net of $X to General Fund)
o Overall team professional growth and support by facilitating coaching, professional trainings,
an orientation ambassador program, and retreats via about $5,000.
o Complete the Energy Service Company Performance contract and secure $177,000 or more in annual savings (no extra cost above the debt service financed in FY16).
Create action on the Waterfront Redevelopment Plan(s) by creating a cruise ship and
daytime dock plan at South Shore waterfront with tax increment funds and facilitating common ownership at the end of 8th Street. ($TBD)
-130-

MANAGEMENT & ADMINISTRATION CITY MANAGER
Partner with the Holland Board of Public Works staff on creation of a James DeYoung City-owned land repurposing project. Ramp up to fund a design and development team in FY 18 involving public charrette’s after remediation (FY17 via HBPW funds).
Implement the Parks and Recreation and the Transportation Department’s Strategic Plans
by streamlining administrative procedures, back filling where recommended, investing in new technology and equipment, investing in experienced part-time staff for enhanced flexibility and reinvesting in infrastructure. ($TBD)
If the Five Year Recreation Plan is amended, conduct a joint Recreation Center facility development planning and design process: $15,000 for design; $10,000 for educational materials and $15,000 for Bouws pool/splash pad design in the Municipal Capital Improvements Fund.
Initiate a comprehensive Home Energy Retrofit and On-Bill Financing program via the
Holland Energy Fund, inclusive of Building Energy labeling rental conversions tackled by Jubilee Ministries and Homecor ($3 million of Holland Board of Public Works investments for creation of a revolving loan fund, $225,000 of the extra 0.25 HPBW rate ($250,000) and $25,000 and part of $75,000 of Neighborhood Improvement Funds in Community and Neighborhood Services in the Municipal Capital Improvement fund budget for removal of ancillary homeowner barriers (lead, asbestos, etc.)
Make the third year payment for Sustainability Institute Director housed at Hope College
($15,000 in the City Manager’s Budget) and complete annual reports to funders. Next year will be undetermined until such time as an endowment is created.
Increase social networking from the City Manager’s Office. (up to 26 posts on Facebook)
Complete the second year of new Program Measurements associated with new results being measured, strategic goals being accomplished and the Annual Calendar Report tracked in real time with assistance of the Executive Assistant III.
Revise and recommend and Amended Communications Plan with the help of the
Technology Services Director and Assistant to the City Manager plus the Public Information Coordinator.
Budget for the Phase Two of the New Wayfinding Signage Construction: Message Board
and Neighborhood commercial, institutional destinations, etc. ($TBD in the Municipal Capital Improvement fund)
Find a way to motivate/incentivize redevelopment along US-31. Complete a Land Use
Study and Marketing Study for Commercial Corridor on US-31. ($25,000 in the Municipal Capital Improvement fund to become a Redevelopment Ready Community and establish a plan as well as $10,000 in the Economic Development budget)
Sustain the Holland Youth Connections Program and work to integrate at-risk youth into
the fabric of the community and eliminate recruitment opportunities for gangs ($10,000 each for Fire, Streets and in the Parks Divisions) plus 25 plus community employers. Decrease the percentage of annual donated funding to less than 50%.
-131-

MANAGEMENT & ADMINISTRATION CITY MANAGER
Complete Snowmelt Expansion installations/cost share execution on 9th Street ($TBD from
the General Fund balance initially until special assessment payments reimburse over twenty years).
Move toward the target in the Public Safety Service Delivery Report 2013 of Public Safety
representing 48-49% of the General Fund (Stated in the Report as “To reach a target of 48-49% of the General Fund Budget for Public Safety will require reductions of $250,000 to $450,000 from the original FY 13 Budget,” page 8). Work to increase community policing and decrease routine patrol so as to be even more preventative… perhaps over the night hours more via unusual recreational engagement (midnight drop in basketball, Bouws Pool, for example).
Ramp-up Downtown neighborhood investments via getting to 100% in rental inspections
per year.
Secure full implementation for the Windmill Island Gardens Strategic Plan implementation with a $2.9 million pathway and bridge construction kick-off in 2017 with assistance from Legacy Funds (City of Holland and Holland Charter Township sharing $TBD in local contributions)
To lead and bring new, non-tax resources into the community via grants, foundations, fund raisers, interns, volunteers, collaboration and cooperation prior to FY 17 Budget.
Complete the efforts to win the Georgetown Energy Prize $5 Million (use the remaining
Holland Energy Fund budget approved in FY 16 and ensure media, links, reports and other prize completion activities are done to the best of our ability).
Continue to look for continuous improvements in costs, while not cutting services.
Assist Mayor DeBoer in new initiatives (Ad Hoc Welcoming Committee, American Wind
Symphony, etc.)
Assist in traffic flow re-education associated with reducing use of 9th Street for vehicles and trucks.
Additional budgetary changes:
o EPIC Administrative Intern $ (down $3,520 due to less hours) o Holland Youth Connections Intern (new $1,080) o Sustainability Director $15,000 ($2,500 more than last year) o Lakeshore Advantage down $25,000 after prior year request for assistance in SmartZone
setup. Also in-kind fiscal services to be provided for SmartZone.
-132-

MANAGEMENT & ADMINISTRATIONCITY MANAGER
FY-14 FY-15 FY-16 FY-17
Actual Actual Projected Projected
Number of Management and Administrative / Council Action Plans 46 36 39 44
Number of City Manager Action Plans 20 32 28 34
Reinvestments in Existing Municipal Capital Improvements $511,000 $633,500 $2,260,000 $8,250,000
New Capital Improvements $398,000 $0 $642,000 $3,100,000
Number of Discrimination Investigations 6 1 2 2
Number of Grants Applied for 5 5 5 4
Amount of Grants Applied for: $1,300,000 $304,000 $360,000 $280,000
Parks & Recreation $4,000 $320,000 $100,000
Community & Neighborhood Services (1) $150,000 $0 $50,000
Public Safety Services $150,000 $140,000 $130,000
Energy Costs ($) $1,169,784 $958,580 $910,650 $733,650
Reduction (4%) (12%) (5%) (19%)
Facebook Posts 2 4 3 6
Percentage of Council Actions Plans Achieved 35% (16) 36% (13) 59% (23) 50% (22)
Percentage of City Manager Action Plans Achieved 65% (13) 56% (18) 60% (23) 50% (20)
Management Efficiency Savings ($43,000) ($34,000) ($530,000) ($50,000)
New Earned Income Donations $1,500,000 Unk $1,250,000 $1,700,000
Holland Budget Financial Snap Shot Improvements 3 for 5 3 for 5 3 for 5 2 for 5
Energy Savings Achieved (CO2) - Metric Tons of CO
2 71,570 63,633 63,000 61,900
Reduction Unk (11%) (1%) (2%)
PERFORMANCE MEASURES
Work
load
Effectiveness
-133-

FY-2014 FY-2015 FY-2016 FY-2017
Final Final Final Adopted
Description Actual Actual Revised Est. Budget
FUNDING SOURCES -
No Funding Sources - 0 -$ - 0 -$ - 0 -$ - 0 -$
General Fund Operating Revenues 325,687 332,986 323,870 340,625
TOTAL SOURCES 325,687$ 332,986$ 323,870$ 340,625$
FUNDING USES -
Personnel Services -
* Salaries & Wages - Working 188,284$ 187,374$ 186,770$ 189,875$
* Benefits - Incl. NonWorking Wages 98,339 97,438 77,295 81,283
* Mandatory Employer Costs 16,401 16,379 16,255 17,267
Other Current Expenditures -
* Supplies / Maintenance 2,417 3,232 5,900 4,400
* Contractual 656 2,720 3,200 3,200
* Other 19,590 25,843 34,450 44,600
Capital Outlay - 0 - - 0 - - 0 - - 0 -
TOTAL USES 325,687$ 332,986$ 323,870$ 340,625$
Personnel Services Total Amount 303,024$ 301,191$ 280,320$ 288,425$
* Full-Time Positions 2.35 2.05 1.97 1.97
*Part-Time Positions @ F.T.E. 0.10 1.05 1.00 1.15
MANAGEMENT & ADMINISTRATION
GENERAL FUND - CITY MANAGER
- - F U N D I N G S O U R C E S & U S E S - -
- - S T A F F I N G - -
-134-

MANAGEMENT & ADMINISTRATION ELECTIONS AND VOTER REGISTRATION
DEPARTMENT MISSION STATEMENT To conduct scheduled and special elections as mandated by state law and City Charter at the lowest possible cost and as effectively and accurately as possible; to process and maintain voter registrations in cooperation with the State of Michigan Qualified Voter File; to work with and in cooperation with the Ottawa and Allegan County Clerks during conduction of elections; to ensure that City of Holland City Clerk staff and City of Holland Election Inspectors receive election training. ACTION PLAN
To provide supplies, materials, voting machines and trained staff for polling places for Local Elections in August 2017 Primary and November 2015, and the possibility of a Special Election May 2018, as well as process voters and tabulate results. (From $175 to $350 per machine for a total new cost. ($5,250)
To obtain inspectors from both political parties and train them in the use of the E-Poll book for all elections and polling locations.
To purchase various election equipment to replace privacy screens and signage for all polling locations. ($1,676)
To work with the League of Women Voters to help inform voters of all elections and procedures.
To send office staff to the Michigan Bureau of Elections for a one day training on the
Qualified Voter File system. ($100)
To implement an Ad Hoc committee to increase voter participation and turnout for all elections.
To participate in the review of new election equipment to be purchased by State or County for use in FY 2017.
To collaborate with other jurisdictions to purchase E-Poll Books (laptops) to replace existing laptops for FY 2018
-135-

MANAGEMENT & ADMINISTRATION
ELECTIONS AND VOTER REGISTRATION
FY-14 FY-15 FY-16 FY-17
Actual Actual Projected Projected
Number of Registered Voters for November Election 23,552 23,753 23,652 23,702
August Election 20,562 23,658 23,110 23,500
May Election 23,737 23,602 23,669 23,635
Number of Elections (Total) 2 3 3 3
Regular 2 3 3 3
Special 0 0 0 0
Average Number of Election Workers per Precinct 5 5 5 6
Voting Station Election Officials:
Chairperson 16 16 16 16
Election Worker 65 65 65 85
Voter Turnout:
August N/A 3,368 N/A 3,500
November 4,334 8,702 4,360 14,050
February N/A N/A 4,160 N/A
May 1,780 4,435 2,850 3,000
Absentee Voters:
August N/A 1,046 N/A 1,200
November 1,232 1,961 1,245 1,500
February N/A N/A 1,297 N/A
May 940 1,230 1,070 1,100
% Turnout per Election:
August N/A 14.24% N/A 6.71%
November 18.40% 36.64% 18.39% 59.93%
February N/A N/A 18.42% N/A
May 7.62% 18.79% 12.00% 7.87%
PERFORMANCE MEASURES
Effic
iency
Work
load
-136-

FY-2014 FY-2015 FY-2016 FY-2017
Final Final Final Adopted
Description Actual Actual Revised Est. Budget
FUNDING SOURCES -
Intergovernmental 610$ - 0 -$ 2,550$ - 0 -$
Charges for Services 1,190 20,494 34,000 25,000
General Fund Operating Revenues 29,432 52,119 37,817 54,067
TOTAL SOURCES 31,232$ 72,613$ 74,367$ 79,067$
FUNDING USES -
Personnel Services -
* Salaries & Wages - Working 12,142$ 57,962$ 45,977$ 49,347$
* Benefits - Incl. NonWorking Wages - 0 - 80 75 50
* Mandatory Employer Costs 371 1,265 485 394
Other Current Expenditures -
* Supplies / Maintenance 9,982 3,494 11,330 6,776
* Contractual 4,264 3,120 10,150 16,650
* Other 4,473 6,692 6,350 5,850
Capital Outlay - 0 - - 0 - - 0 - - 0 -
TOTAL USES 31,232$ 72,613$ 74,367$ 79,067$
Personnel Services Total Amount 12,513$ 59,307$ 46,537$ 49,791$
* Full-Time Positions - 0 - - 0 - - 0 - - 0 -
*Part-Time Positions @ F.T.E. 0.75 1.50 1.50 1.25
MANAGEMENT & ADMINISTRATION
GENERAL FUND - ELECTIONS / VOTER REGISTRATION
- - F U N D I N G S O U R C E S & U S E S - -
- - S T A F F I N G - -
-137-

MANAGEMENT & ADMINISTRATION CITY ATTORNEY
ACTIVITY MISSION STATEMENT
To provide legal services to the City Council, City staff, boards and advisory commissions, and help ensure that functions of the City are performed on a legal basis in accordance with the City Charter and Code, state statutes, and federal laws and regulations; prosecute for City Ordinance violations; and defend the City in litigations.
ACTION PLAN
To provide legal advice and assistance to the risk management program, especially in regard to the Michigan Municipal League’s approach to liability defense and the risk retention exposures of self-funding for insurance coverages.
To wrap up various contested commercial property tax assessments, heard before the
Michigan Tax Tribunal and / or the State Court of Appeals. To provide the City Council with an annual review and status report on all pending
litigations. (December 2016)
To provide only the level of legal services desired by the client:
o Provide templates to enable greater customer service with less delay for re-occurring agreements.
o Approve re-occurring contracts as to form if minimal changes are made year-to-year.
o Reduce overall legal expenses associated with the above efficiency improvements.
-138-

FY-2014 FY-2015 FY-2016 FY-2017
Final Final Final Adopted
Description Actual Actual Revised Est. Budget
FUNDING SOURCES -
No Funding Sources - 0 -$ - 0 -$ - 0 -$ - 0 -$
General Fund Operating Revenues 215,346 199,783 202,600 202,600
TOTAL SOURCES 215,346$ 199,783$ 202,600$ 202,600$
FUNDING USES -
Other Current Expenditures -
* Contractual 215,346$ 199,783$ 202,600$ 202,600$
* Other - 0 - - 0 - - 0 - - 0 -
TOTAL USES 215,346$ 199,783$ 202,600$ 202,600$
MANAGEMENT & ADMINISTRATION
GENERAL FUND - CITY ATTORNEY
- - F U N D I N G S O U R C E S & U S E S - -
- - S T A F F I N G - -
Positions: Services For This Activity Are Contracted With a Private Attorney Firm.
-139-

MANAGEMENT & ADMINISTRATION CITY CLERK
DEPARTMENT MISSION STATEMENT
To provide administrative services as mandated by City Charter, local ordinances, state statute, City Council and the City Manager for the public and departments, boards, commissions of the City; and to maintain and protect all public documents of the City.
ACTION PLAN
To assist all departments with records management for paper documents; to establish an accurate inventory of stored documents; to work with the Holland Historical Trust to allow for storage of and access to permanently retained City documents and artifacts.
To re-codify city ordinances in phases with General Code (42 years) and maintain every 15
years.
To send Deputy City Clerk and Administrative Aide to conferences for continuing education to obtain Certified and Masters Certification with the International Institute Municipal Clerks and to attend National Clerk Conference. ($4,200)
To send staff annually to Customer Service seminars. ($440)
To send staff to Records Retention Workshops. ($500)
To provide Customer Service personnel during all regular business hours with ½ of positions be paid from Community and Neighborhood Services.
To implement and collaborate with the Mayor AD-HOC and HYAC committees, a new program to welcome new residents that move into the City of Holland through schools, churches, apartment complexes, senior housing etc. ($TBD)
-140-

MANAGEMENT & ADMINISTRATION
CITY CLERK
FY-14 FY-15 FY-16 FY-17
Actual Actual Projected Projected
Licenses & Applications
Business Licenses and Permits Issued 264 378 390 385
Passports 23 475 525
Zoning Board of Appeals Applications Processed 17 19 40 25
Ordinances
Ordinance Adopted 24 20 20 15
Council - Regular, Special, Closed Meetings (Total) 55 55 52 50
Board of Review Meetings 9 9 9 0
Compensation Commission Meetings 0 1 0 1
Passports effective June 2015
ZBA is being attended by CNS Staff approved by resolution
BOR is being attended by Assessor staff approved by resolution
PERFORMANCE MEASURES
Wo
rklo
ad
-141-

FY-2014 FY-2015 FY-2016 FY-2017
Final Final Final Adopted
Description Actual Actual Revised Est. Budget
FUNDING SOURCES -
Licenses & Permits 25,809$ 28,229$ 25,000$ 26,000$
Charges for Services 1,002 1,592 19,400 21,200
General Fund Operating Revenues 159,953 186,452 222,332 255,182
TOTAL SOURCES 186,764$ 216,273$ 266,732$ 302,382$
FUNDING USES -
Personnel Services -
* Salaries & Wages - Working 106,733$ 126,676$ 151,975$ 176,177$
* Benefits - Incl. NonWorking Wages 46,907 53,889 52,150 59,070
* Mandatory Employer Costs 8,805 10,202 12,950 14,965
Other Current Expenditures -
* Supplies / Maintenance 2,627 4,280 9,795 8,700
* Contractual 5,027 3,790 9,500 11,250
* Other 16,665 17,436 30,362 32,220
Capital Outlay - 0 - - 0 - - 0 - - 0 -
TOTAL USES 186,764$ 216,273$ 266,732$ 302,382$
Personnel Services Total Amount 162,445$ 190,767$ 217,075$ 250,212$
* Full-Time Positions 2.00 2.00 2.00 2.00
* Part-Time Positions @ F.T.E. 0.70 1.50 1.75 2.50
MANAGEMENT & ADMINISTRATION
GENERAL FUND - CITY CLERK
- - F U N D I N G S O U R C E S & U S E S - -
- - S T A F F I N G - -
-142-

MANAGEMENT & ADMINISTRATION HUMAN RESOURCES
DEPARTMENT MISSION STATEMENT
To provide professional leadership in all areas of Human Resources management for the City of Holland. To work with the management team and all employees to promote favorable employee relations through clear and fair policies, facilitating excellent communication, and maintaining a high quality of performance in employment, labor relations, safety, employee training, benefit management, employee appraisals, workers’ compensation administration, position evaluation, and numerous related activities.
ACTION PLAN
Work to coordinate placing recruitment tools on the City of Holland Human Resources web-page. (December 2016). Further research is needed to identify what our New World system can accommodate.
Ensure all full, part-time and seasonal new employees see the orientation video and are
paired up with a mentor on a regular basis. (August 2016) ($1,000 in expenses)
Ensure a quarterly employee newsletter at the end of each quarter, hard copy for those who need it and electronic starting in June 2016.
Create an employee wide event or series of events to be different from, yet like, the cook out
events of the last two years.
Create a Short Term Disability summary plan document by November 2016.
Train employees on the revised OSHA Globally Harmonized System (GHS) by June 2016. ($3000)
Prepare and adopt a formal written safety policy by August 2016. ($250)
Implement the Safety Contract with the Holland Board of Public Works ($15,000) and create an employee safety committee by August 2016.
Increase the multi-cultural representation of the City’s workforce via use of best practice recruiting and interviewing means to overcome unconscious bias.
-143-

MANAGEMENT & ADMINISTRATION
HUMAN RESOURCES
FY-14 FY-15 FY-16 FY-17
Actual Actual Projected Projected
Number of Employees (Full-Time and Part-Time A) 171 174 173 176
Number of New Hires (Full-time and Part-Time A) 4 2 13 5
Number of Labor Contract Settlements 2 0 12 1
Number of Recordable Work Compensation Claims (Calendar Year) 12 13 10 10
Number of Lost Time Accidents (Calendar Year) 7 5 4 2
Number of Lost Days (Calendar Year) 190 325 100 20
PERFORMANCE MEASURES
Wo
rklo
ad
-144-

FY-2014 FY-2015 FY-2016 FY-2017
Final Final Final Adopted
Description Actual Actual Revised Est. Budget
FUNDING SOURCES -
Charges for Services - 0 -$ - 0 -$ - 0 -$ - 0 -$
General Fund Operating Revenues 252,307 240,870 225,116 247,100
TOTAL SOURCES 252,307$ 240,870$ 225,116$ 247,100$
FUNDING USES -
Personnel Services -
* Salaries & Wages - Working 68,096$ 84,911$ 87,030$ 85,202$
* Benefits - Incl. NonWorking Wages 32,353 80,038 42,225 45,858
* Mandatory Employer Costs 6,776 8,357 8,875 8,995
Other Current Expenditures -
* Supplies / Maintenance 1,715 3,724 2,100 2,650
* Contractual 116,216 32,093 47,500 48,350
* Other 27,151 31,747 37,386 56,045
Capital Outlay - 0 - - 0 - - 0 - - 0 -
TOTAL USES 252,307$ 240,870$ 225,116$ 247,100$
Personnel Services Total Amount 107,225$ 173,306$ 138,130$ 140,055$
* Full-Time Positions 1.25 1.60 1.60 1.60
*Part-Time Positions @ F.T.E. - 0 - - 0 - - 0 - - 0 -
MANAGEMENT & ADMINISTRATION
GENERAL FUND - HUMAN RESOURCES
- - F U N D I N G S O U R C E S & U S E S - -
- - S T A F F I N G - -
-145-
MANAGEMENT & ADMINISTRATION VOLUNTEER SERVICES
DEPARTMENT MISSION STATEMENT
To develop and sustain meaningful volunteer opportunities on City Boards, Committees and Commissions that promote civic pride, provide citizen input, and strengthens the diversity of partnerships between the City and the community.
ACTION PLAN
To make increased efforts to ensure that all positions on City boards, committees and commissions are filled. (July 2016)
To collaborate with the Human Relations Coordinator and Commission to increase minority representation on City boards and commissions. The goal for FY 2017 is 12% minority representation. (December 2016)
To increase continuous awareness of volunteers opportunities by posting specific vacancies in the City by using social media, the City’s website, public TV, local English and Spanish language periodicals, local radio stations, e-newsletter, etc. (January 2016)
-146-

MANAGEMENT & ADMINISTRATION
VOLUNTEER SERVICES
FY-14 FY-15 FY-16 FY-17
Actual Actual Projected Projected
CVS Boards/Project/Program Volunteers
Boards and Commissions Volunteers 200 210 220 220
Females 70 80 80 80
Minorities 21 21 25 25
DeGraaf Nature Center Volunteers 150 175 200 200
Teen Court Coordinator, Jurors and Assistants 70 70 70 70
Victims Services Unit 18 18 18 18
Recreation Dept. Volunteers 246 255 260 260
Youth Council Volunteers 44 52 55 55
Miscellaneous Volunteers (Downtown Events, Interns, Etc.) 2,175 2,100 2,200 2,200
Total 2,903 2,880 3,023 3,023
CVS/Boards/Project/Program Hours
Boards and Commissions 5,085 4,925 4,950 4,950
DeGraaf Nature Center Volunteers 900 1,004 1,110 1,110
Teen Court Coordinator, Jurors and Assistants 150 150 150 150
Victims Services Unit Volunteers 396 560 560 560
Recreation Dept. Volunteers 3,460 3,326 3,350 3,350
Youth Council Volunteers 928 910 920 920
Miscellaneous Volunteers (Downtown Events, Interns, Etc.) 7,394 7,298 7,300 7,300
Total 18,313 18,173 18,340 18,340
Work
load
PERFORMANCE MEASURES
-147-

FY-2014 FY-2015 FY-2016 FY-2017
Final Final Final Adopted
Description Actual Actual Revised Est. Budget
FUNDING SOURCES -
Charges for Services - 0 -$ - 0 -$ - 0 -$ - 0 -$
General Fund Operating Revenues 7,272 7,304 5,904 7,521
TOTAL SOURCES 7,272$ 7,304$ 5,904$ 7,521$
FUNDING USES -
Personnel Services -
* Salaries & Wages - Working 4,248$ 3,869$ 4,175$ 3,657$
* Benefits - Incl. NonWorking Wages 1,461 1,497 1,313 2,248
* Mandatory Employer Costs 335 338 344 316
Other Current Expenditures -
* Supplies / Maintenance 5 1 - 0 - 400
* Contractual - 0 - 321 - 0 - 700
* Other 1,223 1,278 72 200
TOTAL USES 7,272$ 7,304$ 5,904$ 7,521$
Personnel Services Total Amount 6,044$ 5,704$ 5,832$ 6,221$
* Full-Time Positions 0.10 0.10 0.10 0.10
* Part-Time Positions @ F.T.E. - 0 - - 0 - - 0 - - 0 -
MANAGEMENT & ADMINISTRATION
GENERAL FUND - VOLUNTEER SERVICES
- - F U N D I N G S O U R C E S & U S E S - -
- - S T A F F I N G - -
-148-

MANAGEMENT & ADMINISTRATION HUMAN RELATIONS COMMISSION, YOUTH SERVICES &
INTERNATIONAL RELATIONS COMMISSION
DEPARTMENT MISSION STATEMENT
The Human Relations Department serves to protect the equal rights and equal opportunities of all citizens by preventing discrimination in housing, education, employment, and public services by conducting activities that promote social justice and cultural understanding and improve relationships among all the citizens of the City of Holland.
ACTION PLAN
This year’s action plan focuses on long-term initiatives from prior year. We will focus on increasing community presence and inclusion of citizens in the overall Human Relations Directives. We strive to have a greater presence in the community through collaborations. To maximize the greatest impact to community, we will focus on benchmarking other communities that have Human Relation Commissions as a continuous improvement process for the greatest outcome to citizens. Other activities include:
Develop and benchmark Diversity and Inclusion programs. Staff person will attend Competencies to Advance Diversity and Inclusion Strategies held in New York.
Activate a Crisis Response Team. The Commission will initiate dialogue by community sector: education, healthcare, local cultural organizations, neighborhood and faith community.
Serve as a resource to citizens and City Council.
Conduct educational forums and engage positive community dialogue that promote social justice, cultural understanding, and improves relationships among all citizens of the City of Holland. Educational forums to include: Refugee Awareness, Affordable Housing within our City limits (focus on City limits), and topics related to race. The City’s responsibility for the Forum on Does Race Matter was completed in March.
EMPLOYMENT
Conduct Staff training. Develop and maintain diversity training logs for all City staff.
Completed February 2016.
Examine City’s posting, recruitment, retention, and recruitment process and outcomes in 2017.
Monitor Title VI and Title VII federal mandate compliance at City Hall.
EDUCATION
Identify Social Justice Award recipient pool for all categories. Completed January 2016.
Educate community on those issues that impact community vibrancy. This year the commission has targeted Refugee series occurring in July and November to cross
-149-

MANAGEMENT & ADMINISTRATION HUMAN RELATIONS COMMISSION, YOUTH SERVICES &
INTERNATIONAL RELATIONS COMMISSION
promote The Big Read.
Facilitate Community Network for Education (CNE) and encourage collaboration and partnerships community wide that celebrate our diverse community. The CNE completed the first National Hispanic Heritage month event at City Hall in October 2015. In May, we are organizing the Japan Foundation photography exhibit and have invited the Consul of Japan to speak as part of Asia American Heritage Month to be completed in May 2016.
HOUSING
Explore and investigate affordable housing in the City of Holland (What is it? Do we have it? Benchmark other communities). Research within city limits.
GOVERNMENT/COMMUNITY RELATIONS
Extend annual invitation to IRC for collaborative Work Session. June 2016.
Promote citizen engagement and participation in City Government. The commission will be developing an educational pamphlet to share with citizens that explains how to engage in city government. (How do I run for City Council? How can I be a commissioner? etc.) The commission will be hosting commission meetings at neighborhood locations. The first to occur in April 2016.
YOUTH SERVICES MISSION STATEMENT The Holland Youth Advisory Council (HYAC), in partnership with other community leaders, will develop the leadership skills of ourselves and others; provide advice regarding youth issues; serve our community; and promote youth participation and civic involvement.”
ACTION PLAN
To hold social events for both current and past HYAC members, including a HYAC reunion by January 2016. The reunion is scheduled to take place on Saturday, June 18, from 4-7 pm at Kollen Park.
To collaborate with local organizations and Windmill Island personnel in the planning and
production of the Run of the Mill by April 2016. The Run of the Mill has been taken over by personnel at Windmill Island, with the new hire of their Events Coordinator. This event will be completed by April 2016.
To sponsor City-wide events that create awareness and support for area Sustainability
programs by May 2016. The Special Events Committee organized and implemented the Energy Wars, a friendly competition between the area schools as to which school could save the most energy in gas and electric between January, 2016 and March 2016. The final Energy Wars event will take place on Wednesday, April 20, 2016 at Maas Auditorium on Hope College’s campus from 7-9pm.
-150-

MANAGEMENT & ADMINISTRATION HUMAN RELATIONS COMMISSION, YOUTH SERVICES &
INTERNATIONAL RELATIONS COMMISSION
To promote the Human Relations Commission Social Justice Awards and provide youth nominations by November 2015. Completed - HYAC Core Council nominated and presented the Youth Social Justice Award to Kyler Beal at the awards ceremony on Wednesday, January 20, 2016. This event is an annual event.
To support and host the Lakeshore Youth Leadership Board’s activities and events in
November 2015 and February 2016 (namely the Leadership as a Lifestyle training and the Mayor’s Roundtable). Leadership as a Lifestyle was hosted on Saturday, November 14, 2015 by HYAC, at the Herrick District Library. Mayor’s Roundtable took take place in February 2017.
To partner with the International Relations Commission in the planning and implementation of their annual Multicultural Festival. Completed. This is an annual initiative.
INTERNATIONAL RELATIONS COMMISSION MISSION STATEMENT The International Relations Commission (IRC) promotes international and cross-cultural knowledge, awareness, understanding, and sensitivity through interactions within the community and across borders.
IRC Vision The City of Holland connected to and growing with the wider world.
IRC Mission
We build and maintain meaningful relations ships between the people of Holland and the wider world through cultural, educational and professional contact.
IRC Values
Respect: We commit to the highest levels of courtesy and fairness for those who serve on this commission and those whom this commission serves. Reliability: We fulfill our commitments to ourselves, Holland residents, its government, and our local and global partners. Collaboration: We seek great ideas and resources in our community and beyond our borders. Hospitality: We strive to make Holland a welcoming community for everyone.
-151-

MANAGEMENT & ADMINISTRATION HUMAN RELATIONS COMMISSION, YOUTH SERVICES &
INTERNATIONAL RELATIONS COMMISSION
ACTION PLAN
Oversee, maintain and grow existing relationships while exploring new relationships in other cities. The International Relations Commission will be sending at least 4 commissioners to Queretaro, Mexico. This will be used to forge new educational, economic and cultural relationships for future community exchange.
Provide the community and government of Holland with opportunities for education, support and advice on multiculturalism and international values. The International Relation Commission has invited the Mayor of Queretaro to come to Holland during Tulip Time. Host the Mayor of Queretaro for Goodwill visit. The Commission would like to send Commissioner and student to the Annual Sister City Conference.
Become a valued member of the economic development community in Holland. The
Human Relations Commission is working to meet with Michigan Economic Development Corporation to develop economic ties with our sister city.
-152-

MANAGEMENT & ADMINISTRATION
INTERNATIONAL RELATIONS COMMISSION
FY-14 FY-15 FY-16 FY-17
Actual Actual Projected Projected
Meetings with Wayfinding Task Force for Sister City
Signs N/A N/A 2 2
Reg. Meetings w/ Regional Econ. Development
Organizations N/A 1 3 6
Attain Coverage of IRC Programming in Traditional Media* 0 8 10 12
Increase Social Media Presence w/ Reg. Updates on
Facebook* 0 6 15 30
Develop & Update Website for Multicultural Festival* 0 1 1 1
Participate in Tulip Time Parade (IRC Members Only) 0 0 0 0
IRC Members Attend Governor's Luncheon 0 3 3 3
Participate in World Affairs Council Programming 0 1 3 5
Attend Mexican Consulate Activities (IRC members &
Coord.) 0 1 2 2
Host Queretaro Delegation 0 0 0 0
Visit Queretaro with Delegation 0 0 0 0
Promote IRC Membership 2 5 0 0
Coordinate Multicultural Festival Fundraising 28 30 35 35
Multicultural Festival Event Planning** 1 1 1 1
Coordinate Efforts to Permanently Fix Queretaro
Fountain 0 0 In process In process
* City Website, Facebook, Updates 4 6 20 25
Work
load
PERFORMANCE MEASURES
-153-

FY-2014 FY-2015 FY-2016 FY-2017
Final Final Final Adopted
Description Actual Actual Revised Est. Budget
FUNDING SOURCES -
No Funding Sources -0-$ -0-$ -0-$ -0-$
General Fund Operating Revenues 20,457 29,484 32,390 43,857
TOTAL SOURCES 20,457$ 29,484$ 32,390$ 43,857$
FUNDING USES -
Personnel Services -
* Salaries & Wages - Working 13,146$ 17,732$ 16,100$ 16,125$
* Benefits - Incl. NonWorking Wages - 0 - 3,811 4,890 5,700
* Mandatory Employer Costs 1,080 1,390 1,320 1,427
Other Current Expenditures -
* Supplies / Maintenance 312 540 800 1,300
* Contractual 281 206 300 500
* Other 5,638 5,805 8,980 18,805
Capital Outlay - 0 - - 0 - - 0 - - 0 -
TOTAL USES 20,457$ 29,484$ 32,390$ 43,857$
Personnel Services Total Amount 14,226$ 22,933$ 22,310$ 23,252$
* Full-Time Positions - 0 - 0.30 0.30 0.30
* Part-Time Positions @ F.T.E. 0.30 - 0 - - 0 - - 0 -
MANAGEMENT & ADMINISTRATION
GENERAL FUND - INTERNATIONAL RELATIONS
- - F U N D I N G S O U R C E S & U S E S - -
- - S T A F F I N G - -
-154-

MANAGEMENT & ADMINISTRATION
YOUTH SERVICES
FY-14 FY-15 FY-16 FY-17
Actual Actual Projected Projected
Holland Youth Advisory Council (HYAC) members (Total) 50 48 57 55
Females 32 28 36 30
Minorities 13 13 13 15
Special Events Committee 11 12 12 12
Recreation Committee 8 10 12 12
Social Services Committee 9 8 12 12
Youth on Adult Boards 20 18 21 20
Planned Events by HYAC
Raise Your Voice:
Total High School students involved 30 * * *
Total 6th Grade students impacted 840 * * *
Teen Court - # of cases 8 13+ 12 12
* No longer a city event
PERFORMANCE MEASURES
Work
load
-155-

FY-2014 FY-2015 FY-2016 FY-2017
Final Final Final Adopted
Description Actual Actual Revised Est. Budget
FUNDING SOURCES -
Charges for Services - 0 -$ - 0 -$ - 0 -$ - 0 -$
General Fund Operating Revenues 39,899 53,472 73,262 77,947
TOTAL SOURCES 39,899$ 53,472$ 73,262$ 77,947$
FUNDING USES -
Personnel Services -
* Salaries & Wages - Working 24,226$ 31,882$ 37,525$ 37,625$
* Benefits - Incl. NonWorking Wages 5,400 9,211 16,565 13,306
* Mandatory Employer Costs 1,995 2,446 3,045 3,331
Other Current Expenditures -
* Supplies / Maintenance 648 1,003 1,300 2,200
* Contractual 276 217 636 1,200
* Other 7,354 8,713 14,191 20,285
Capital Outlay - 0 - - 0 - - 0 - - 0 -
TOTAL USES 39,899$ 53,472$ 73,262$ 77,947$
Personnel Services Total Amount 31,621$ 43,539$ 57,135$ 54,262$
* Full-Time Positions - 0 - 0.70 0.70 0.70
* Part-Time Positions @ F.T.E. 0.30 - 0 - - 0 - - 0 -
MANAGEMENT & ADMINISTRATION
GENERAL FUND - HUMAN RELATIONS COMMISSION
- - F U N D I N G S O U R C E S & U S E S - -
- - S T A F F I N G - -
-156-

MANAGEMENT & ADMINISTRATIVE SERVICES
YOUTH SERVICES
FY-14 FY-15 FY-16 FY-17
Actual Actual Projected Projected
Holland Youth Advisory Council (HYAC) members (Total) 50 48 57 55
Females 32 28 36 30
Minorities 13 13 13 15
Special Events Committee 11 12 12 12
Recreation Committee 8 10 12 12
Social Services Committee 9 8 12 12
Youth on Adult Boards 20 18 21 20
Planned Events by HYAC
Raise Your Voice:
Total High School students involved 30 * * *
Total 6th Grade students impacted 840 * * *
Teen Court - # of cases 8 13+ 12 12
* No longer a city event
PERFORMANCE MEASURES
Work
load
-157-

FY-2014 FY-2015 FY-2016 FY-2017
Final Final Final Adopted
Description Actual Actual Revised Est. Budget
FUNDING SOURCES -
Other 3,277$ - 0 -$ 5,200$ 5,200$
General Fund Operating Revenues 28,404 22,950 30,330 32,085
TOTAL SOURCES 31,681$ 22,950$ 35,530$ 37,285$
FUNDING USES -
Personnel Services -
* Salaries & Wages - Working 18,721$ 15,035$ 18,400$ 19,125$
* Benefits - Incl. NonWorking Wages - 0 - - 0 - - 0 - - 0 -
* Mandatory Employer Costs 1,527 1,178 1,450 1,510
Other Current Expenditures -
* Supplies / Maintenance 368 469 700 700
* Contractual 191 - 0 - 1,330 900
* Other 10,874 6,268 13,650 15,050
Capital Outlay - 0 - - 0 - - 0 - - 0 -
TOTAL USES 31,681$ 22,950$ 35,530$ 37,285$
Personnel Services Total Amount 20,248$ 16,213$ 19,850$ 20,635$
* Full-Time Positions - 0 - - 0 - - 0 - - 0 -
* Part-Time Positions @ F.T.E. 0.50 0.50 0.50 0.50
MANAGEMENT & ADMINISTRATION
GENERAL FUND - YOUTH SERVICES
- - F U N D I N G S O U R C E S & U S E S - -
- - S T A F F I N G - -
-158-

MANAGEMENT & ADMINISTRATION CONTINGENCIES
ACTIVITY MISSION STATEMENT The purpose of the Contingencies activity is to establish an appropriation for the purpose of:
- Providing the City Council with limited additional appropriation funding for various unforeseen expenditures and costs that are incurred throughout the fiscal year.
- Adjusting individual departmental budgets for annual employee compensation adjustments.
- Adjusting liability accounts for compensated absences at fiscal year-end.
ACTION PLAN
No expenditures are charged directly to the Contingencies Appropriation. Rather a specified appropriation is transferred to the department or activity that incurs the expenditure. The City Manager may approve amounts up to $10,000, and any amount above that must be approved by the City Council.
Employee compensation adjustments are planned again in FY 2017.
-159-

FY-2014 FY-2015 FY-2016 FY-2017
Final Final Final Adopted
Description Actual Actual Revised Est. Budget
FUNDING SOURCES -
No Funding Sources - 0 -$ - 0 -$ - 0 -$ - 0 -$
General Fund Operating Revenues - 0 - - 0 - 20,000 493,800
TOTAL SOURCES - 0 -$ - 0 -$ 20,000$ 493,800$
FUNDING USES -
Contingencies - 0 -$ - 0 -$ 20,000$ 493,800$
TOTAL USES - 0 -$ - 0 -$ 20,000$ 493,800$
Positions: Not Applicable
MANAGEMENT & ADMINISTRATION
GENERAL FUND - CONTINGENCIES
- - F U N D I N G S O U R C E S & U S E S - -
- - S T A F F I N G - -
-160-

MANAGEMENT & ADMINISTRATION
CABLE TELEVISION - PUBLIC ACCESS FUND
FY-14 FY-15 FY-16 FY-17
Actual Actual Projected Projected
Televised Programs:
Government Meetings 72 72 72 72
Staff Produced 133 145 252 260
Producer Shows 880 890 850 850
Online Video Hits:
YouTube 6,000 91,955 140,000 150,000
Vimeo 5,489 20,293 14,000 14,000
Facebook (30 Seconds or More) N/A 20,206 130,000 140,000
Facebook (3 Seconds +) N/A 71,149 550,000 600,000
PERFORMANCE MEASURES
Work
load
-161-

FY-2014 FY-2015 FY-2016 FY-2017
Final Final Final Adopted
Description Actual Actual Revised Est. Budget
FUNDING SOURCES -
Charges for Services 444,506$ 488,242$ 496,000$ 494,000$
Interest & Rents 3,337 2,855 3,000 3,000
Other 30 - 0 - 500 500
TOTAL SOURCES 447,873$ 491,097$ 499,500$ 497,500$
FUNDING USES -
Personnel Services -
* Salaries & Wages - Working 74,185$ 92,259$ 109,700$ 110,550$
* Benefits - Incl. NonWorking Wages 7,774 19,142 33,550 36,119
* Mandatory Employer Costs 6,196 7,919 9,975 10,438
Other Current Expenditures -
* Supplies / Maintenance 7,482 16,421 13,121 13,100
* Contractual 2,274 7,341 11,800 12,500
* Other 19,925 16,016 20,100 20,600
Capital Outlay 83,268 36,515 62,000 19,000
Transfers Out 200,000 226,900 294,500 235,000
TOTAL USES 401,104$ 422,513$ 554,746$ 457,307$
INCREASE (DECREASE) 46,769$ 68,584$ (55,246)$ 40,193$
ENDING BALANCE -
Designated / Reserved - 0 - - 0 - - 0 - - 0 -
Undesignated / Unreserved 375,095 443,679 388,433 428,626
TOTAL FUND EQUITY 375,095$ 443,679$ 388,433$ 428,626$
Personnel Services Total Amount 88,155$ 119,320$ 153,225$ 157,107$
* Full-Time Positions 0.20 2.20 2.20 2.20
* Part-Time Positions @ F.T.E. 1.40 0.20 0.20 0.20
MANAGEMENT & ADMINISTRATION
CABLE TV PUBLIC ACCESS FUND
- - F U N D I N G S O U R C E S & U S E S - -
- - S T A F F I N G - -
- - F U N D E Q U I T Y - -
-162-

FISCAL SERVICES INTRODUCTION
PROPERTY ASSESSING
Boards & Commissions
Board of ReviewTax Abatement Board
Contested AssessmentsLitigation
Cash & InvestmentManagement
Property Taxation Administration
Special Assessments Administration
Ticket Sales/Issuance(Various Activities)
TREASURY
Independent AuditAnnual Financial
ReportReview/Opinion/
Comments
FINANCE
Risk ManagementAdministration
PROCUREMENT
Current Bid Lists
Purchase Orders& Contracts
Auction OfSurplus Property
Current Bid & RFPOfferings
FISCAL SERVICES
Capital Projects & Debt Issuance/
Adminsitration
Payroll/Benefits &Accounts Payable
Purchasing Guidelines and Procedures
Real & Personal Property Assessments
Special Assessments Development
Collections, Receipting & Depositing
Budget Development & Monitoring
Accounting & Financial Reporting
GROUP MISSION STATEMENT In a prudent and responsible manner, to assist management with financial planning and budgeting; record, monitor, and routinely report upon the City’s financial activities; collect and efficiently deposit all amounts owing the City; meet all current and long-term liability requirements in a timely manner; provide due diligence in the administration of cash and investment management; equitably allocate the property tax burden and special assessments in accordance with city charter and state statutes; and maintain a procurement system that provides a cost-effective method for obtaining quality goods and services for the City.
GROUP ORGANIZATIONAL STRUCTURE
-163-

FISCAL SERVICES
$- $100,000 $200,000 $300,000 $400,000 $500,000 $600,000 $700,000 $800,000
Use
s D
oll
ars
Total Uses by Department $1,577,770
Charges for Services8.4%
Special Assmts7.1%
Interest & Rents1.1%
General Revenues83.4%
Funding Sources
Working Wages40.2%
Benefits & NonWorking Wages
16.3%
Mandatory Employer Costs3.8%
Other15.3%
Transfers to Other Funds16.2%
Contractual6.0%
Suppl/Maint.2.2%
Funding Uses
-164-

FY-2014 FY-2015 FY-2016 FY-2017
Final Final Final Adopted
Description Actual Actual Revised Est. Budget
FUND TYPES-
General Fund 3,034,749$ 1,778,402$ 28,006,620$ 1,429,070$
Special Revenue Funds 746,578 469,245 415,000 145,000
Enterprise Funds 2,750 3,401 3,200 3,700
TOTAL- ALL FUND TYPES 3,784,077$ 2,251,048$ 28,424,820$ 1,577,770$
FUNDING SOURCES -
Taxes & Special Assessments 187,306$ 137,359$ 184,552$ 107,481$
Intergovernmental 375,000 - 0 - - 0 - - 0 -
Charges for Services 142,583 141,645 131,495 127,105
Interest & Rents 26,110 18,867 14,980 17,017
Other 648,461 465,613 25,000 70,000
Bond Proceeds - 0 - - 0 - 25,000,000 - 0 -
Transfers In 74,000.0 30,000.0 - 0 - - 0 -
TOTAL SOURCES 1,453,460$ 793,484$ 25,356,027$ 321,603$
FUNDING USES -
Personnel Services -
* Salaries & Wages - Working 586,027$ 605,167$ 582,681$ 632,519$
* Benefits - Incl. NonWorking Wages 321,652 300,977 302,108 257,719
* Mandatory Employer Costs 54,574 54,741 53,920 59,568
Other Current Expenditures -
* Supplies / Maintenance 49,008 79,538 36,375 34,800
* Contractual 170,631 216,882 109,100 95,150
* Other 193,947 268,181 25,317,733 242,014
Capital Outlay 4,072 109,741 165,750 - 0 -
Transfers Out 2,404,166 615,821 1,857,153 256,000
Contingencies - 0 - - 0 - - 0 - - 0 -
TOTAL USES 3,784,077$ 2,251,048$ 28,424,820$ 1,577,770$
Personnel Services Total Amount 962,253$ 960,885$ 938,709$ 949,806$
* Full-Time Positions 12.95 11.95 11.90 11.90
* Part-Time Positions @ F.T.E. 0.60 1.15 0.60 1.10
FISCAL SERVICES
SUMMARY OF DEPTS, FUNCTIONS & RELATED FUNDS
- - G R O U P F U N D I N G U S E S A C R O S S F U N D S - -
- - G R O U P S T A F F I N G T O T A L S - -
- - G R O U P F U N D I N G S O U R C E S & U S E S T O T A L S - -
-165-

FISCAL SERVICES FISCAL SERVICES GROUP
ACTIVITY MISSION STATEMENT Provide accurate and equitable systems to account and budget for financial transactions, assess property, audit financial information, collect taxes and fees, evaluate risk and insure appropriately, invest surplus funds, oversee issuance of debt, pay invoices and compensation, and purchase equipment and services. Provide financial and other information to elected officials and staff to assist decision making, while delivering excellent service to both internal and external customers.
ACTION PLAN
Develop Civic Center Funding Strategy.
Expand number of property reviews/assessing site inspections by employing two (2) summer part-time staff ($13,250).
Streamline budget process and document.
Streamline Purchasing Process with possible ordinance change.
Implement Holland Energy Fund processes.
Upgrade Security at City Hall.
-166-

FISCAL SERVICES
FINANCE & TREASURER
FY-14 FY-15 FY-16 FY-17
Actual Actual Projected Projected
Financial Activities of Individual Funds 68 68 70 70
Number of Grants Monitored 21 21 21 21
Payroll Cks Issued & Direct Deposits Made - City 13,483 13,390 13,939 13,950
Payroll Cks Issued & Direct Deposits Made- As Fiscal Agent 4,001 4,352 4,340 4,360
Accounts Payable Checks Issued - City 6,497 6,669 6,800 6,900
Accounts Payable Checks Issued - As Fiscal Agent 2,006 2,180 2,300 2,400
1099's Issued by City 121 151 165 175
1099's Issued as Fiscal Agent 35 43 55 65
W-2's Issued by City 700 734 750 750
W-2's Issued as Fiscal Agent 175 186 190 200
Purchase Orders Issued 1,078 1,186 1,200 1,300
Bid Requests Issued 17 37 35 35
Utility Billings Processed 4,072 3,690 3,680 3,670
Property Tax Billings Processed * 17,097 16,349 15,725 15,800
Dog Licenses Issued 102 77 80 80
Special Assessment (Full Payment) Receipts 69 68 70 75
Other Licenses, Permits, & Misc. Invoices Processed 10,314 12,333 12,500 12,750
Pursuit of Delinquent Personal Property Taxes 138 60 90 100
Avg. Days to Compile Monthly Financial Statements 18 20 20 20
Active Employees Receiving Compensation/Benefits 201 204 208 210
Years Received G.F.O.A. Budget Award 12 13 14 15
Bond Rating - Standard and Poor's AA AA AA AA
Bond Rating - Dun & Bradstreet Aa3 Aa3 Aa3 Aa3
* FY14 & 15 - Tax Year 2013 & 2014 - Winter millages in Ottawa Co. were billed on the summer tax statement if
winter tax was under $100.00.
* FY15 - Tax Year 2015 - First year with revised personal property tax law.
* FY16 - Tax Year 2015 - Winter millages in both Allegan & Ottawa Co. were billed on summer tax statements if
winter tax was under $100.00.
Work
load
Effic
iency
PERFORMANCE MEASURES
-167-

FY-2014 FY-2015 FY-2016 FY-2017
Final Final Final Adopted
Description Actual Actual Revised Est. Budget
FUNDING SOURCES -
Charges for Services 95,260$ 94,890$ 83,250$ 81,350$
General Fund Operating Revenues 406,904 354,109 433,841 419,875
TOTAL SOURCES 502,164$ 448,999$ 517,091$ 501,225$
FUNDING USES -
Personnel Services -
* Salaries & Wages - Working 262,073$ 244,624$ 293,739$ 296,424$
* Benefits - Incl. NonWorking Wages 170,847 134,150 137,632 116,731
* Mandatory Employer Costs 24,186 21,879 26,840 28,060
Other Current Expenditures -
* Supplies / Maintenance 7,860 8,613 12,020 9,900
* Contractual 7,319 8,550 11,200 10,950
* Other 29,879 31,183 35,660 39,160
Capital Outlay - 0 - - 0 - - 0 - - 0 -
TOTAL USES 502,164$ 448,999$ 517,091$ 501,225$
Personnel Services Total Amount 457,106$ 400,653$ 458,211$ 441,215$
* Full-Time Positions 6.00 4.50 5.00 5.00
* Part-Time Positions @ F.T.E. - 0 - 0.45 0.60 0.60
FISCAL SERVICES
GENERAL FUND - FINANCE
- - F U N D I N G S O U R C E S & U S E S - -
- - S T A F F I N G - -
-168-

FISCAL SERVICES
INDEPENDENT AUDIT
FY-14 FY-15 FY-16 FY-17
Actual Actual Projected Projected
AUDITS COORDINATED:
General City 1 1 1 1
As Fiscal Agent:
Herrick District Library 1 1 1 1
Holland Energy Fund N/A N/A 1 1
Macatawa Area Transportation Authority 1 1 1 1
West Michigan Airport Authority 1 1 1 1
Audit Committee Meetings Held 3 2 2 2
Years Received G.F.O.A. CAFR Award 24 25 26 27
PERFORMANCE MEASURES
Effic
iency
Wo
rklo
ad
-169-

FY-2014 FY-2015 FY-2016 FY-2017
Final Final Final Adopted
Description Actual Actual Revised Est. Budget
FUNDING SOURCES -
Charges for Services - 0 -$ - 0 -$ - 0 -$ - 0 -$
General Fund Operating Revenues 48,292 51,529 46,080 42,850
TOTAL SOURCES 48,292$ 51,529$ 46,080$ 42,850$
FUNDING USES -
Other Current Expenditures -
* Supplies / Maintenance 9$ 12$ 65$ 100$
* Contractual 47,185 50,387 44,800 41,500
* Other 1,098 1,130 1,215 1,250
TOTAL USES 48,292$ 51,529$ 46,080$ 42,850$
Positions: Not Applicable
FISCAL SERVICES
GENERAL FUND - INDEPENDENT AUDIT
- - F U N D I N G S O U R C E S & U S E S - -
- - S T A F F I N G - -
-170-

FISCAL SERVICES
ASSESSING
FY-14 FY-15 FY-16 FY-17
Actual Actual Projected Projected
Total Properties 13,533 13,561 13,513 13,525
Special Assessment Projects (New/Ongoing) 3 1/3 1/3 1/3
Board of Review Appeals
Board of Review Meeting Minutes - - 1 9
Appointments * 50 0 0 50
Letters * 6 0 0 5
Recommendations * 48 0 0 100
Total Parcels Appealed 126 323 203 220
MTT Assessment Appeal Properties
Full Tribunal 5 9 6 5
Small Claims Division 3 3 2 3
*May reflect more than one parcel being appealed.
PERFORMANCE MEASURES
Work
load
-171-

FY-2014 FY-2015 FY-2016 FY-2017
Final Final Final Adopted
Description Actual Actual Revised Est. Budget
FUNDING SOURCES -
Charges for Services 3,504$ 3,828$ 2,920$ 3,020$
General Fund Operating Revenues 439,984 401,180 398,847 418,572
TOTAL SOURCES 443,488$ 405,008$ 401,767$ 421,592$
FUNDING USES -
Personnel Services -
* Salaries & Wages - Working 223,841$ 214,189$ 197,995$ 236,975$
* Benefits - Incl. NonWorking Wages 112,809 114,196 112,235 91,562
* Mandatory Employer Costs 20,611 19,323 18,325 21,756
Other Current Expenditures -
* Supplies / Maintenance 8,584 12,785 9,390 9,500
* Contractual 46,911 19,225 35,300 23,600
* Other 30,732 25,290 28,522 38,199
Capital Outlay - 0 - - 0 - - 0 - - 0 -
TOTAL USES 443,488$ 405,008$ 401,767$ 421,592$
Personnel Services Total Amount 357,261$ 347,708$ 328,555$ 350,293$
* Full-Time Positions 5.10 5.10 4.10 4.10
* Part-Time Positions @ F.T.E. - 0 - - 0 - - 0 - 0.50
FISCAL SERVICES
GENERAL FUND - ASSESSING
- - F U N D I N G S O U R C E S & U S E S - -
- - S T A F F I N G - -
-172-

FY-2014 FY-2015 FY-2016 FY-2017
Final Final Final Adopted
Description Actual Actual Revised Est. Budget
FUNDING SOURCES -
Charges for Services 26,988$ 26,668$ 41,925$ 39,035$
Taxes & Special Assessments - 0 - - 0 - - 0 - - 0 -
General Fund Operating Revenues 145,068 214,276 170,862 183,368
TOTAL SOURCES 172,056$ 240,944$ 212,787$ 222,403$
FUNDING USES -
Personnel Services -
* Salaries & Wages - Working 82,645$ 108,651$ 90,947$ 99,120$
* Benefits - Incl. NonWorking Wages 37,996 52,631 52,241 49,426
* Mandatory Employer Costs 8,107 9,859 8,755 9,752
Other Current Expenditures -
* Supplies / Maintenance 8,489 9,102 13,100 13,100
* Contractual 31,923 36,118 17,800 19,100
* Other 2,896 24,583 29,944 31,905
Capital Outlay - 0 - - 0 - - 0 - - 0 -
TOTAL USES 172,056$ 240,944$ 212,787$ 222,403$
Personnel Services Total Amount 128,748$ 171,141$ 151,943$ 158,298$
* Full-Time Positions 1.85 2.35 2.80 2.80
* Part-Time Positions @ F.T.E. 0.60 0.70 - 0 - - 0 -
FISCAL SERVICES
GENERAL FUND - TREASURER
- - F U N D I N G S O U R C E S & U S E S - -
- - S T A F F I N G - -
-173-

FY-2014 FY-2015 FY-2016 FY-2017
Final Final Final Adopted
Description Actual Actual Revised Est. Budget
FUNDING SOURCES -
No Funding Sources - 0 -$ - 0 -$ - 0 -$ - 0 -$
General Fund Operating Revenues 77,581 92,809 80,000 80,000
TOTAL SOURCES 77,581$ 92,809$ 80,000$ 80,000$
FUNDING USES -
Other Current Expenditures -
* Other 77,581 92,809 80,000 80,000
TOTAL USES 77,581$ 92,809$ 80,000$ 80,000$
Positions: Not Applicable
FISCAL SERVICES
GENERAL FUND - UNALLOCATED INSURANCE PREMIUMS
- - F U N D I N G S O U R C E S & U S E S - -
- - S T A F F I N G - -
-174-

FY-2014 FY-2015 FY-2016 FY-2017
Final Final Final Adopted
Description Actual Actual Revised Est. Budget
FUNDING SOURCES -
Bond Proceeds - 0 -$ - 0 -$ 25,000,000$ - 0 -$
General Fund Operating Revenues - 0 - - 0 - 291,742 - 0 -
TOTAL SOURCES - 0 -$ - 0 -$ 25,291,742$ - 0 -$
FUNDING USES -
Other Current Expenditures -
* Other - 0 - - 0 - 25,125,992 - 0 -
Capital Outlay - 0 - - 0 - 165,750 - 0 -
TOTAL USES - 0 -$ - 0 -$ 25,291,742$ - 0 -$
Positions: Not Applicable
FISCAL SERVICES
GENERAL FUND - PENSION BONDS
- - F U N D I N G S O U R C E S & U S E S - -
- - S T A F F I N G - -
-175-

FY-2014 FY-2015 FY-2016 FY-2017
Final Final Final Adopted
Description Actual Actual Revised Est. Budget
FUNDING SOURCES -
No Funding Sources - 0 -$ - 0 -$ - 0 -$ - 0 -$
General Fund Operating Revenues 1,787,518 537,040 1,442,153 111,000
TOTAL SOURCES 1,787,518$ 537,040$ 1,442,153$ 111,000$
FUNDING USES -
Transfers Out 1,787,518$ 537,040$ 1,442,153$ 111,000$
TOTAL USES 1,787,518$ 537,040$ 1,442,153$ 111,000$
Positions: Not Applicable
FISCAL SERVICES
GENERAL FUND - TRANSFERS TO OTHER FUNDS
- - F U N D I N G S O U R C E S & U S E S - -
- - S T A F F I N G - -
-176-

FY-2014 FY-2015 FY-2016 FY-2017
Final Final Final Adopted
Description Actual Actual Revised Est. Budget
FUNDING SOURCES -
Transfers In 69,000$ - 0 -$ - 0 -$ - 0 -$
TOTAL SOURCES 69,000$ - 0 -$ - 0 -$ - 0 -$
FUNDING USES -
Other 3,650$ 2,073$ 15,000$ 50,000$
Transfers Out - 0 -$ - 0 -$ - 0 -$ - 0 -$
TOTAL USES 3,650$ 2,073$ 15,000$ 50,000$
INCREASE (DECREASE) 65,350$ (2,073)$ (15,000)$ (50,000)$
ENDING BALANCE -
Designated / Reserved - 0 - - 0 - - 0 - - 0 -
Undesignated / Unreserved 983,286 981,213 966,213 916,213
TOTAL FUND EQUITY 983,286$ 981,213$ 966,213$ 916,213$
Positions: Not Applicable
10% Target of General Fund Total Funding Uses 2,120,365$
Budget Stabilization Ending Fund Balance Excess (Shortfall) Compared to 10% Target 1,204,152$
Combined Ending FY2017 Fund Balance General Fund and Budget Stabilization Fund 4,359,143$
Percentage of FY2017 General Fund Expenditures 20.56%
‐ ‐ C O M P A R I S O N T O T A R G E T B A L A N C E ‐ ‐
FISCAL SERVICES
GENERAL FUND - BUDGET STABILIZATION
- - F U N D I N G S O U R C E S & U S E S - -
- - S T A F F I N G - -
- - F U N D E Q U I T Y - -
-177-
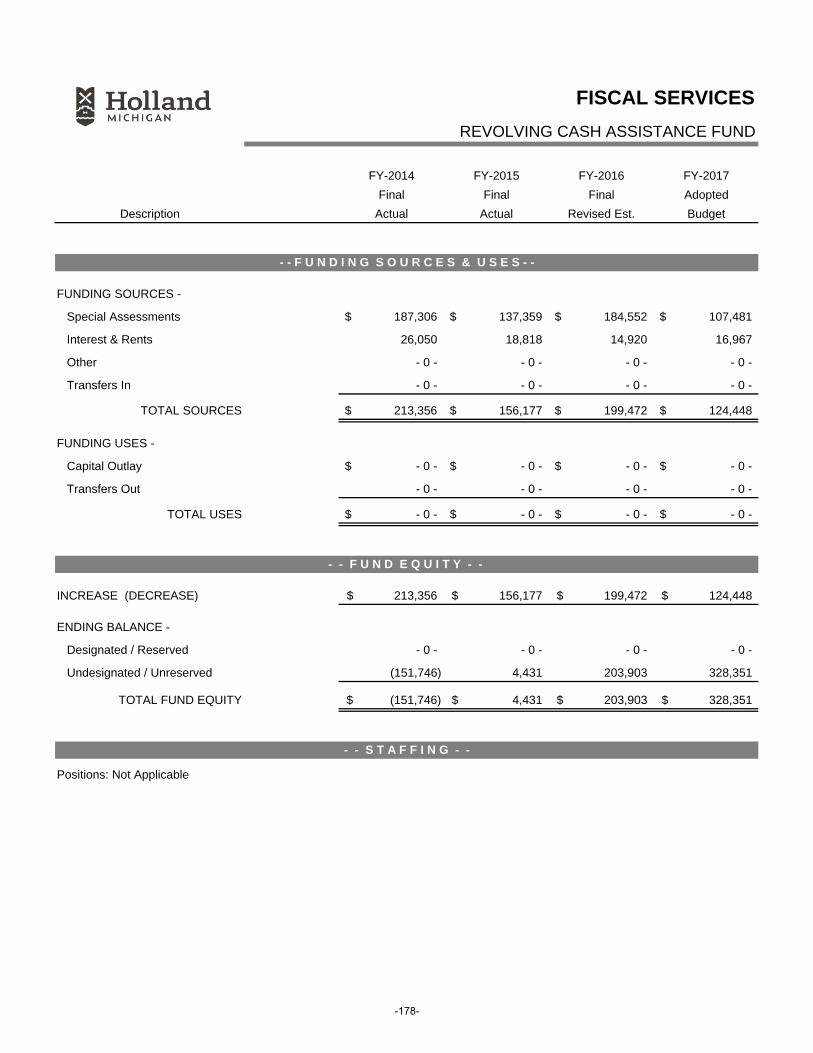
FY-2014 FY-2015 FY-2016 FY-2017
Final Final Final Adopted
Description Actual Actual Revised Est. Budget
FUNDING SOURCES -
Special Assessments 187,306$ 137,359$ 184,552$ 107,481$
Interest & Rents 26,050 18,818 14,920 16,967
Other - 0 - - 0 - - 0 - - 0 -
Transfers In - 0 - - 0 - - 0 - - 0 -
TOTAL SOURCES 213,356$ 156,177$ 199,472$ 124,448$
FUNDING USES -
Capital Outlay - 0 -$ - 0 -$ - 0 -$ - 0 -$
Transfers Out - 0 - - 0 - - 0 - - 0 -
TOTAL USES - 0 -$ - 0 -$ - 0 -$ - 0 -$
INCREASE (DECREASE) 213,356$ 156,177$ 199,472$ 124,448$
ENDING BALANCE -
Designated / Reserved - 0 - - 0 - - 0 - - 0 -
Undesignated / Unreserved (151,746) 4,431 203,903 328,351
TOTAL FUND EQUITY (151,746)$ 4,431$ 203,903$ 328,351$
Positions: Not Applicable
FISCAL SERVICES
REVOLVING CASH ASSISTANCE FUND
- - F U N D I N G S O U R C E S & U S E S - -
- - F U N D E Q U I T Y - -
- - S T A F F I N G - -
-178-

FY-2014 FY-2015 FY-2016 FY-2017
Final Final Final Adopted
Description Actual Actual Revised Est. Budget
FUNDING SOURCES -
Intergovernmental 375,000$ - 0 -$ - 0 -$ - 0 -$
Charges for Services 13,460 12,911 - 0 - - 0 -
Other 648,461 465,613 25,000 70,000
Interest & Rents - 0 - - 0 - - 0 - - 0 -
Transfers In 5,000 30,000 - 0 - - 0 -
TOTAL SOURCES 1,041,921$ 508,524$ 25,000$ 70,000$
FUNDING USES -
Personnel Services -
* Salaries & Wages - Working 17,468$ 37,703$ - 0 -$ - 0 -$
* Mandatory Employer Costs 1,670 3,680 - 0 - - 0 -
Other Current Expenditures -
* Supplies / Maintenance 22,376 47,282 - 0 - - 0 -
* Contractual 37,293 102,602 - 0 - - 0 -
* Other 47,051 89,456 - 0 - - 0 -
Capital Outlay 4,072 109,741 - 0 - - 0 -
Transfers Out 616,648 78,781 415,000 145,000
TOTAL USES 746,578$ 469,245$ 415,000$ 145,000$
INCREASE (DECREASE) 295,343$ 39,279$ (390,000)$ (75,000)$
ENDING BALANCE -
Designated / Reserved 3,606 3,606 3,606 3,606
Undesignated / Unreserved 465,004 504,283 114,283 39,283
TOTAL FUND EQUITY 468,610$ 507,889$ 117,889$ 42,889$
Positions: Not Applicable
ADDITIONAL NOTE -
With the Exception of Transfers Out and Related Revenue, No Attempt Is Made To Budget Specified Donations. Appropriations
Are Established upon City Council Acceptance of Donations. Virtually All Donors/Benefactors Include a Specific Purpose.
At the close of FY-2010 this fund received the $8,473 balance of the Bicentennial Celebration Fund in conformance with GASB
No. 54. This balance will be maintained separately until 2047 and earn interest annually. In FY-2011 $5,000 of the Balance
was used towards the Alburtus Van Raalte Bicentennial Celebration.
FISCAL SERVICES
SPECIFIED DONATIONS FUND
- - F U N D I N G S O U R C E S & U S E S - -
- - F U N D E Q U I T Y - -
- - S T A F F I N G - -
-179-

FY-2014 FY-2015 FY-2016 FY-2017
Final Final Final Adopted
Description Actual Actual Revised Est. Budget
FUNDING SOURCES -
Charges for Services 3,371$ 3,348$ 3,400$ 3,700$
Interest & Rents 60 49 60 50
Other - 0 - - 0 - - 0 - - 0 -
TOTAL SOURCES 3,431$ 3,397$ 3,460$ 3,750$
FUNDING USES -
Other Current Expenses -
* Supplies / Maintenance 1,690$ 1,744$ 1,800$ 2,200$
* Other 1,060 1,657 1,400 1,500
TOTAL USES 2,750$ 3,401$ 3,200$ 3,700$
INCREASE (DECREASE) 681$ (4)$ 260$ 50$
ENDING BALANCE -
Designated / Reserved - 0 - - 0 - - 0 - - 0 -
Undesignated / Unreserved 7,242 7,238 7,498 7,548
TOTAL FUND EQUITY 7,242$ 7,238$ 7,498$ 7,548$
INCREASE (DECREASE) 681$ (4)$ 260$ 50$
ENDING BALANCE 7,242$ 7,238$ 7,498$ 7,548$
Positions: Not Applicable
FISCAL SERVICES
CITY HALL EMPLOYEES BENEFIT FUND
- - F U N D I N G S O U R C E S & U S E S - -
- - F U N D E Q U I T Y - -
- - S T A F F I N G - -
- - W O R K I N G C A P I T A L - -
-180-

PUBLIC SAFETY INTRODUCTION
GROUP MISSION STATEMENT Public Safety is directed toward the coordination and integration of all of the operating functions of the Police and Fire Services. The Police Division’s overall objective is to provide citizens and visitors to the community with a professional level of police service in all areas of law enforcement responsibility, through the enforcement of statues and City ordinances, response to emergencies, crime prevention, awareness and educational programs. The Fire Division’s overall objective is to provide protection of life and property in the City through enforcement of fire protection codes, prevention and protection, education to the public, efficient extinguishing of fires, provision of emergency medical services and hazardous materials response services.
GROUP ORGANIZATIONAL STRUCTURE
-181-

PUBLIC SAFETY
$-
$2,000,000
$4,000,000
$6,000,000
$8,000,000
Use
s D
oll
ars
Total Uses by Department $11,021,432
Federal/State/Intergovt0.5%
Charges for Services1.6%
Fines & Forfeits1.2%
Interest & Rents0.0%
Transfers from Other Funds
0.9%
General Revenues95.8%
Funding Sources
Working Wages50.0%
Benefits & NonWorking Wages30.4%
Mandatory Employer Costs2.5%
Other10.7%
Transf. to Other Funds0.9%
Contractual0.2%
Suppl/Maint.4.1%
Capital Outlay0.2% Depreciation
1.0%
Funding Uses
-182-

FY-2014 FY-2015 FY-2016 FY-2017
Final Final Final Adopted
Description Actual Actual Revised Est. Budget
FUND TYPES-
General 10,283,467$ 10,623,706$ 10,931,858$ 10,899,032$
Special Revenue 10,575 9,475 9,525 9,600
Enterprise 5,192 5,723 2,800 2,800
Internal Service 388,458 365,026 110,000 110,000
TOTAL- ALL FUND TYPES 10,687,692$ 11,003,930$ 11,054,183$ 11,021,432$
FUNDING SOURCES -
Intergovernmental 53,773$ 64,565$ 60,050$ 60,000$
Charges for Services 180,869 172,013 148,590 173,300
Fines & Forfeits 191,808 155,204 130,500 130,000
Interest & Rents 3,904 1,375 610 1,010
Other 3,020 525 500 500
Transfers In 86,890 90,000 100,000 100,000
TOTAL SOURCES 520,264$ 483,682$ 440,250$ 464,810$
FUNDING USES -
Personnel Services -
* Salaries & Wages - Working 4,992,326$ 5,092,580$ 5,414,850$ 5,505,293$
* Benefits - Incl. NonWorking Wages 3,411,664 3,589,680 3,557,684 3,345,318
* Mandatory Employer Costs 230,546 244,733 261,925 280,430
Other Current Expenditures -
* Supplies / Maintenance 401,823 439,178 431,678 455,767
* Contractual Expenditures 22,994 21,604 15,600 25,600
* Other 1,080,179 1,106,489 1,125,885 1,176,114
Capital Outlay 373,143 329,744 36,561 22,910
Transfers Out 86,890 90,000 100,000 100,000
Depreciation Expense 88,127 89,922 110,000 110,000
TOTAL USES 10,687,692$ 11,003,930$ 11,054,183$ 11,021,432$
Personnel Services Total Amount 8,634,536$ 8,926,993$ 9,234,459$ 9,131,041$
* Full-Time Positions 83.00 83.00 83.00 83.00
* Part-Time Positions @ F.T.E. 8.85 9.90 9.55 9.55
* Part-Paid Fire Positions (Not @ F.T.E.) 30.00 30.00 30.00 30.00
PUBLIC SAFETY
SUMMARY OF DEPTS, FUNCTIONS & RELATED FUNDS
- - G R O U P F U N D I N G U S E S A C R O S S F U N D S - -
- - G R O U P S T A F F I N G T O T A L S - -
- - G R O U P F U N D I N G S O U R C E S & U S E S T O T A L S - -
-183-

PUBLIC SAFETY
FUND MISSION STATEMENT
To provide leadership and direction by maintaining an environment of continuous learning along with promoting teamwork, honesty, and integrity as we strive to deliver effective and efficient public safety to the citizens of Holland.
ACTION PLAN OPERATIONAL OBJECTIVES
Use innovation techniques from New North to establish an action plan to preserve and enhance trust between police and the community via one more potential command staff. (Throughout 2016-17)
Assist City Manager’s Office and Human Relations Coordinator with creating community relations opportunities to discuss the impact that gang activity and investigations have on the Holland community. (Throughout 2015-16)
Complete the installation and training for the new Computer Automated Dispatch (CAD) System and Records Management System (RMS). This may include electronic dailies, new evidence tracking systems, gang database, fire incident management and other increases in technology. These systems are being provided and funded by Ottawa County Central Dispatch Authority. (July - August 2016)
Implementation and associated training of police and fire staff on the new 800 MHZ / enhanced VHF county-wide radio system. This new radio system in conjunction with the new CAD system will create a challenge for the next two years. (Funded by Ottawa County Central Dispatch, except for cruiser/Console brackets and holders for radios of $5,000.)
To create employment opportunities for the Holland Youth Connections program by hiring youth to paint fire hydrants. (Summer 2016) (Fire budget $10,000. Same as prior years.)
To organize, promote and participate in at least two (2) charity events to raise money for
Holland area organizations or families in need. (Throughout 2016-17)
Update the Fire Operations vehicle replacement schedule and make necessary budget recommendations to support it with contributions to the fire vehicle/ boat replacement fund. (July 2016) (Fire Budget $100,000. Same as prior years.)
Become more proactive by increasing our recruiting methods for full-time staff, part-paid
firefighters, and reserve police officers. Staff must also look closely at what measures can be implemented to retain our current employees. (Throughout fiscal year) ($5,000)
Enhance fire ground and medical response training for fire staff. Consistent training
across the department continues to be a challenge. A small training committee has been created to coordinate and manage training; however, this is over and above other responsibilities that are placed upon them. Their efforts help to maintain essential skills, but there is little opportunity to add more advanced skills and keep up with new skills and
-184-

PUBLIC SAFETY
techniques that would benefit the community. Currently there is adequate training for our paid on call personnel. The larger concern is in the area of improving the ongoing and consistent training for full paid personnel. (Increase in staffing or contracting out as needed eventually.)
Create a steady funding source for the purchase of vests for officers. Ballistic vests can
only be worn for five years as directed by the manufacture guidelines. For the past several years the department has received a federal grant that funds 50% of the purchase price and the remaining 50% was funded by a local private donation. Staff believes that the federal grant will remain in place, but we have lost our local donor for half the cost of the vests. We must either establish an annual budgeted amount or generate a new donation source to purchase vests in the future. ($4,000 annually. Included in budget.)
Replace service handguns, holsters, and magazine carriers for law enforcement personnel. (July – August 2016. Police Budget $16,250)
-185-

PUBLIC SAFETY
POLICE DIVISION
FY-14 FY-15 FY-16 FY-17
Actual Actual Projected Projected
Police Calls:
Total Police Calls 19,975 19,867 19,900 19,900
Part I Criminal Offenses 2,929 2,692 2,700 2,700
Part II Criminal Offenses 3,074 2,542 2,600 2,600
Service Calls 12,480 13,196 13,200 13,200
Accidents Reported:
Total Crashes Investigated 1,492 1,437 1,450 1,450
Injury 220 171 180 180
Property Damage 1,270 1,265 1,270 1,270
Fatalities 2 1 4 4
Bookings/Arrests
Total Bookings 2,694 2,095 2,100 2,100
Adult Arrests 1,901 1,421 1,500 1,500
Juvenile Arrests 412 293 290 290
Court Commitments / Transfers 836 674 675 675
Police Vehicle Report:
Total Miles Driven 416,843 419,065 418,000 418,000
Preventable Cruiser Accidents 7 2 4 4
Non-Preventable Accidents 0 0 0 0
Training:
Total Hours-FTO, Reserve, & Regular Officers 8,917 8,990 8,990 8,990
Complaints Investigated
Domestic Animals 152 154 150 150
Yard Parking 156 100 100 100
Court Citations Issued 4,373 3,209 3,500 3,500
Parking Enforcement
Overnight Violations 2,903 3,196 3,200 3,200
Handicapped Violations 34 42 50 50
Ordinance Violations 690 672 680 680
Parking Fines Collected $45,450 $39,545 $40,000 $40,000
Park Patrol - Total Incidents 8 8 8 8
Abandoned Vehicles - Total Processed 12 19 19 19
Found/Recovered Bicycles - Total Processed 123 292 250 250
Call Response Time % on Total Police Calls
10 Minutes & Under 86.1% 86.3% 86.0% 86.0%
5 Minutes & Under 64.0% 63.1% 63.5% 63.5%
Work
load
Effic
iency
PERFORMANCE MEASURES
-186-

PUBLIC SAFETY
FIRE DIVISION
FY-14 FY-15 FY-16 FY-17
Actual Actual Projected Projected
Total Fire Incidents 103 101 110 104
Structure Fires 44 52 40 42
Outside of Structure Fires 4 1 6 4
Vehicle Fires 25 19 20 20
Vegetation Fires 4 2 6 4
Refuse Fires 9 13 15 15
Explosion with no After-Fire 10 10 5 8
Fire or Explosion not Otherwise Classified 7 4 2 4
Medical Emergencies 2,079 2,160 2,200 2,200
Flammable Liquid/Gas Emergencies & Hazardous Conditions 154 112 160 150
Service Calls 202 255 250 250
Good Intent Calls 254 295 290 290
False Alarms/Alarm Malfunctions 308 343 330 330
Other/Miscellaneous Calls 1 2 2 2
TOTAL INCIDENTS 3,101 3,369 3,436 3,423
Change from Previous Year 5.33% 8.64% 1.99% -0.38%
Value of Property Exposed to Fire $63,413,563 $119,519,601 $50,000,000 $50,000,000
Combined Real and Personal Property Lost $754,890 $855,565 $700,000 $700,000
Percent of Exposed Property Saved 98.81% 99.28% 98.60% 98.60%
TRAINING AND SAFETY ACTIVITIES
Total Personnel-Hours Spent in Training 4,038 4,962 2,510 3,000
Civilian Fire-Related Injuries 1 5 1 1
Firefighter Duty-Related Injuries 4 2 1 1
FIRE PREVENTION ACTIVITIES
Fire Code Inspections Performed 202 214 220 220
Fire Investigations Conducted 13 12 20 20
Outside Fire Prevention Programs Presented 18 95 100 100
Child Passenger Safety Seat Installations & Inspections 122 119 95 80
Insurance Service Office Rating 4 4 4 4
Number of Fire Stations 3 3 3 3
Fire Hydrant Maintenance & Flowing 1,739 1,739 1,739 1,739
EMERGENCY MANAGEMENT
Conduct Emergency Warning Systems Tests 9 9 9 9
Maintain and Update City Emergency Plan 1 1 1 1
Department Head Semi-Annual Tabletop Exercises 0 1 1 1
Plan and Implement City Emergency Plan Test Exercise 0 1 1 1
Wo
rklo
ad
PERFORMANCE MEASURES
-187-

PUBLIC SAFETY
FIRE DIVISION
FY-14 FY-15 FY-16 FY-17
Actual Actual Projected Projected
Total Fire Incidents 103 101 110 104
Structure Fires 44 52 40 42
Outside of Structure Fires 4 1 6 4
Vehicle Fires 25 19 20 20
Vegetation Fires 4 2 6 4
Refuse Fires 9 13 15 15
Explosion with no After-Fire 10 10 5 8
Fire or Explosion not Otherwise Classified 7 4 2 4
Medical Emergencies 2,079 2,160 2,200 2,200
Flammable Liquid/Gas Emergencies & Hazardous Conditions 154 112 160 150
Service Calls 202 255 250 250
Good Intent Calls 254 295 290 290
False Alarms/Alarm Malfunctions 308 343 330 330
Other/Miscellaneous Calls 1 2 2 2
TOTAL INCIDENTS 3,101 3,369 3,436 3,423
Change from Previous Year 5.33% 8.64% 1.99% -0.38%
Value of Property Exposed to Fire $63,413,563 $119,519,601 $50,000,000 $50,000,000
Combined Real and Personal Property Lost $754,890 $855,565 $700,000 $700,000
Percent of Exposed Property Saved 98.81% 99.28% 98.60% 98.60%
TRAINING AND SAFETY ACTIVITIES
Total Personnel-Hours Spent in Training 4,038 4,962 2,510 3,000
Civilian Fire-Related Injuries 1 5 1 1
Firefighter Duty-Related Injuries 4 2 1 1
FIRE PREVENTION ACTIVITIES
Fire Code Inspections Performed 202 214 220 220
Fire Investigations Conducted 13 12 20 20
Outside Fire Prevention Programs Presented 18 95 100 100
Child Passenger Safety Seat Installations & Inspections 122 119 95 80
Insurance Service Office Rating 4 4 4 4
Number of Fire Stations 3 3 3 3
Fire Hydrant Maintenance & Flowing 1,739 1,739 1,739 1,739
EMERGENCY MANAGEMENT
Conduct Emergency Warning Systems Tests 9 9 9 9
Maintain and Update City Emergency Plan 1 1 1 1
Department Head Semi-Annual Tabletop Exercises 0 1 1 1
Plan and Implement City Emergency Plan Test Exercise 0 1 1 1
Wo
rklo
ad
PERFORMANCE MEASURES
-188-

FY-2014 FY-2015 FY-2016 FY-2017
Final Final Final Adopted
Description Actual Actual Revised Est. Budget
FUNDING SOURCES -
Intergovernmental 43,242$ 53,731$ 50,250$ 50,000$
Charges for Services 177,602 168,958 145,440 170,200
Fines & Forfeits 191,808 155,204 130,500 130,000
Interest & Rents - 0 - - 0 - - 0 - - 0 -
Transfers In - 0 - - 0 - - 0 - - 0 -
Other - 0 - 700 500 500
General Fund Operating Revenues 9,870,815 10,245,113 10,605,168 10,548,332
TOTAL SOURCES 10,283,467$ 10,623,706$ 10,931,858$ 10,899,032$
FUNDING USES -
Personnel Services -
* Salaries & Wages - Working 4,992,326$ 5,092,580$ 5,414,850$ 5,505,293$
* Benefits - Incl. NonWorking Wages 3,411,664 3,589,680 3,557,684 3,345,318
* Mandatory Employer Costs 230,546 244,733 261,925 280,430
Other Current Expenditures -
* Supplies / Maintenance 399,337 436,743 429,178 453,267
* Contractual 22,994 21,604 15,600 25,600
* Other 1,066,898 1,093,726 1,116,060 1,166,214
Capital Outlay 72,812 54,640 36,561 22,910
Transfers Out 86,890 90,000 100,000 100,000
TOTAL USES 10,283,467$ 10,623,706$ 10,931,858$ 10,899,032$
Personnel Services Total Amount 8,634,536$ 8,926,993$ 9,234,459$ 9,131,041$
* Full-Time Positions 83.00 83.00 83.00 83.00
* Part-Paid Positions (Not @ F.T.E.) 30.00 30.00 30.00 30.00
* Part-Time Positions @ F.T.E. 8.85 9.90 9.55 9.55
PUBLIC SAFETY
GENERAL FUND - POLICE & FIRE DIVISIONS
- - F U N D I N G S O U R C E S & U S E S - -
- - S T A F F I N G - -
-189-

FY-2014 FY-2015 FY-2016 FY-2017
Final Final Final Adopted
Description Actual Actual Revised Est. Budget
FUNDING SOURCES -
Intergovernmental 10,531$ 10,834$ 9,800$ 10,000$
TOTAL SOURCES 10,531$ 10,834$ 9,800$ 10,000$
FUNDING USES -
Other Current Expenditures -
* Other 10,575 9,475 9,525 9,600
Capital Outlay - 0 - - 0 - - 0 - - 0 -
TOTAL USES 10,575$ 9,475$ 9,525$ 9,600$
INCREASE (DECREASE) (44)$ 1,359$ 275$ 400$
ENDING BALANCE -
Designated / Reserved - Vehicles - 0 - - 0 - - 0 - - 0 -
Undesignated / Unreserved 573 1,932 2,207 2,607
TOTAL FUND EQUITY 573$ 1,932$ 2,207$ 2,607$
Positions: Not Applicable
‐ ‐ S T A F F I N G ‐ ‐
PUBLIC SAFETY
POLICE CRIMINAL JUSTICE TRAINING FUND
- - F U N D I N G S O U R C E S & U S E S - -
- - F U N D E Q U I T Y - -
-190-

FY-2014 FY-2015 FY-2016 FY-2017
Final Final Final Adopted
Description Actual Actual Revised Est. Budget
FUNDING SOURCES -
Charges for Services 3,267$ 3,055$ 3,150$ 3,100$
Interest & Rents 12 11 10 10
Other 2,370 2,713 - 0 - - 0 -
TOTAL SOURCES 5,649$ 5,779$ 3,160$ 3,110$
FUNDING USES -
Other Current Expenditures -
* Supplies / Maintenance 2,486$ 2,435$ 2,500$ 2,500$
* Other 2,706 3,288 300 300
TOTAL USES 5,192$ 5,723$ 2,800$ 2,800$
INCREASE (DECREASE) 457$ 56$ 360$ 310$
ENDING BALANCE -
Designated / Reserved - Vehicles - 0 - - 0 - - 0 - - 0 -
Undesignated / Unreserved 1,365 1,421 1,781 2,091
TOTAL FUND EQUITY 1,365$ 1,421$ 1,781$ 2,091$
INCREASE (DECREASE) 458$ 56$ 360$ 310$
ENDING BALANCE 1,365$ 1,421$ 1,781$ 2,091$
Positions: Not Applicable
‐ ‐ S T A F F I N G ‐ ‐
PUBLIC SAFETY
POLICE EMPLOYEES BENEFIT FUND
- - F U N D I N G S O U R C E S & U S E S - -
- - F U N D E Q U I T Y - -
- - W O R K I N G C A P I T A L - -
-191-

FY-2014 FY-2015 FY-2016 FY-2017
Final Final Final Adopted
Description Actual Actual Revised Est. Budget
FUNDING SOURCES -
Interest & Rents 3,892$ 1,364$ 600$ 1,000$
Other 650 (2,888) - 0 - - 0 -
Transfers In 86,890 90,000 100,000 100,000
TOTAL SOURCES 91,432$ 88,476$ 100,600$ 101,000$
FUNDING USES -
Other Current Expenditures -
* Supplies / Maintenance - 0 -$ - 0 -$ - 0 -$ - 0 -$
Capital Outlay 300,331 275,104 - 0 - - 0 -
Transfers Out - 0 - - 0 - - 0 - - 0 -
Depreciation Expense 88,127 89,922 110,000 110,000
TOTAL USES 388,458$ 365,026$ 110,000$ 110,000$
INCREASE (DECREASE) 3,305$ (1,446)$ (9,400)$ (9,000)$
ENDING BALANCE -
Designated / Reserved - Vehicles 168,364 168,364 - 0 - - 0 -
Undesignated / Unreserved 1,266,663 1,265,217 1,424,181 1,415,181
TOTAL FUND EQUITY 1,435,027$ 1,433,581$ 1,424,181$ 1,415,181$
INCREASE (DECREASE) (208,899)$ (186,628)$ 100,600$ 101,000$
ENDING BALANCE 259,796$ 76,056$ 176,656$ 277,656$
Positions: Not Applicable
- - S T A F F I N G - -
PUBLIC SAFETY
FIRE VEHICLE AND EQUIPMENT FUND
- - F U N D I N G S O U R C E S & U S E S - -
- - F U N D E Q U I T Y - -
- - W O R K I N G C A P I T A L - -
-192-

TRANSPORTATION INTRODUCTION
GROUP MISSION STATEMENT The Transportation Group has responsibility for all activities related to the provision, maintenance and upgrade of transportation related systems, facilities, and operations within the community. The overall objective is to provide a quality, efficient and diversified transportation network that includes the maintenance and enhancement of the City’s streets, alleys, sidewalks, storm drain systems, air, rail, and bus services.
GROUP ORGANIZATIONAL STRUCTURE
-193-

TRANSPORTATION
$- $1,000,000 $2,000,000 $3,000,000 $4,000,000 $5,000,000 $6,000,000 $7,000,000 $8,000,000
Use
s D
oll
ars
Total Uses by Department $12,569,552
Taxes16.3%
Licenses & Permits0.6%
Intergovernmental41.0%
Interest & Rents17.8%
Transfers fr. Other Funds11.9%
Charges for Services3.4%
Gen Revenues9.0% Funding Sources
Working Wages12.0%
Benefits & NonWorking Wages5.8%
Mandatory Employer Costs1.4%
Other18.5%
Contractual2.9%
Suppl/Maint.10.9%
Capital Outlay6.4%
Depreciation7.9%
Transfers to Other Funds34.2%
Funding Uses
-194-

FY-2014 FY-2015 FY-2016 FY-2017
Final Final Final Adopted
Description Actual Actual Revised Est. Budget
FUND TYPES-
General Fund 1,215,559$ 1,310,363$ 1,273,509$ 1,215,243$
Special Revenue Funds 4,972,650 7,027,992 14,155,505 7,541,487
Enterprise Funds 597,748 616,189 719,551 632,376
Internal Service 3,147,087 2,883,169 3,560,908 3,180,446
TOTAL- ALL FUND TYPES 9,933,044$ 11,837,713$ 19,709,473$ 12,569,552$
FUNDING SOURCES -
Taxes & Special Assessments 1,196,836$ 1,632,870$ 1,777,672$ 1,840,245$
Licenses & Permits 39,766 65,038 60,600 65,500
Intergovernmental 3,383,080 3,539,915 4,176,698 4,633,647
Charges for Services 324,583 370,108 359,460 386,548
Fines & Forfeits 50 50 100 100
Interest & Rents 2,283,050 2,114,521 2,040,224 2,017,387
Other 68,106 72,937 239,620 102,500
Transfers In 930,507 852,635 4,566,608 1,346,054
TOTAL SOURCES 8,225,978$ 8,648,074$ 13,220,982$ 10,391,981$
FUNDING USES -
Personnel Services -
* Salaries & Wages - Working 1,346,482$ 1,273,896$ 1,322,233$ 1,511,765$
* Benefits - Incl. NonWorking Wages 847,253 856,967 837,017 729,915
* Mandatory Employer Costs 137,725 133,666 142,567 171,033
Other Current Expenditures -
* Supplies / Maintenance 1,428,897 1,371,769 1,334,116 1,376,165
* Contractual 214,551 308,047 343,236 370,150
* Other 2,496,439 2,316,792 2,310,999 2,318,326
Capital Outlay 663,957 494,768 1,243,864 808,100
Debt Service Payments -
* Principal Maturities - 0 - - 0 - - 0 - - 0 -
* Interest & Fee Payments - 0 - - 0 - - 0 - - 0 -
Transfers Out 1,812,650 4,111,753 11,178,141 4,286,798
Depreciation Expense 985,090 970,055 997,300 997,300
Contingencies - 0 - - 0 - - 0 - - 0 -
TOTAL USES 9,933,044$ 11,837,713$ 19,709,473$ 12,569,552$
Personnel Services Total Amount 2,331,460$ 2,264,529$ 2,301,817$ 2,412,713$
* Full-Time Positions 25.00 25.20 26.16 27.16
* Part-Time Positions @ F.T.E. 2.65 3.45 3.50 3.65
TRANSPORTATION
SUMMARY OF DEPTS, FUNCTIONS & RELATED FUNDS
- - G R O U P F U N D I N G U S E S A C R O S S F U N D S - -
- - G R O U P S T A F F I N G T O T A L S - -
- - G R O U P F U N D I N G S O U R C E S & U S E S T O T A L S - -
-195-

TRANSPORTATION
DEPARTMENT MISSION STATEMENT
To maintain and enhance the City’s street system, alleys, sidewalks, and storm drain systems by providing street maintenance equipment and human resources, and provide design and construction administration services for City capital projects so as to provide a transportation network essential to maintain the commercial, industrial and residential base of the City. Represent the City’s interest in road, sidewalk, drainage, and transportation matters as may be directed in metropolitan and regional planning forums, in the negotiation and administration of transportation contracts between the City and the Michigan Department of Transportation (MDOT), and in the administration of funding provided under county, state, and federal programs. Provide recordkeeping for the transit related facilities and capital assets owned by the City of Holland. Provide and maintain vehicles and equipment for use by various General City Departments and maintain a financing mechanism for the planned replacement of said vehicles and equipment.
ACTION PLAN
Utilize new project engineer staff member to administer construction projects, review site
developments, stay up to date with new MS4 permit reporting requirements expected in the coming years, among other work activities. Implementation of Parks & Recreation and Transportation Strategic Plan.
Plan to hire assistant street superintendent to provide more oversight to permitted right-
of-way work, more supervision of street crews and more flexibility to distribute supervisory work load (snow and ice removal supervision). Implementation of Parks & Recreation and Transportation Strategic Plan. Target $60,000 expense implement prior to winter 2016/2017.
Continue to place high importance on non-motorized improvements within the City.
Resume annual concrete sidewalk restoration program and resurface HMA pathways.
Complete the design for the reconstruction of South Shore Drive and advance the project to the bidding phase for construction in summer for 2017. Ready to bid, winter 2016/2017.
Procure asset management software to track complaints and work completed by street crews. Exploring development of module within existing software, Roadsoft. Target $20,000 deduct (avoid purchasing separate software). 2 year time frame to develop.
Continue to improve our use of electronic means for providing updates to citizens
regarding construction projects. Target $1,000 deduct over the year.
Replace a part-time mechanic position that was vacated in fiscal year 2016. Increase pay rate to attract more qualified replacement and retain both part time mechanic positions. Target $13,900 expense to be implemented as soon as possible.
Reconfigure fire suppression system in airport tunnel to simply and avoid more costly maintenance in the future. Target $20,000 expense over the year.
Provide additional funding for traffic signal maintenance to allow the BPW to start
upgrading old traffic signal installations. Target $15,000 expense over the year.
-196-

TRANSPORTATION
STREETS DIVISION
FY-14 FY-15 FY-16 FY-17
Actual Actual Projected Projected
Total Mileage of Street System Maintained
(Does Not Include State Trunkline Miles) 149.08 148.97 149.38 149.38
Mileage per MDOT Act 51 Approved Map
Major Streets 56.88 56.88 56.88 56.88
Local Streets 92.20 92.09 92.50 92.50
Street Cut Permits Issued For Utility Repair or New Construction 315 266 300 325
Amount of Asphalt Used for Street Patching and Repairing 997 1,270 1,300 1,300
(in Tons - Reflects Feb. to Feb.)
Amount of Salt Used for Winter Road Maintenance (in Tons) 3,955 2,045 2,200 2,200
Calendar Year 2015
Amount Liquid Deicing Used for Winter Road Maintenance (in Gallons) 24,805 16,680 15,000 15,000
Calendar Year 2015
Number of Street Sweeper Hours Operated 1,570.0 1,540.0 1,500.0 1,500.0
(Reflects Feb. to Feb.)
CY2014 CY2015 CY2016 CY2017
Actual Actual Projected Projected
Fall Leaf Pickup:
Streets Division Costs (Personnel and Equipment) $112,829 $135,422 $120,000 $125,000
Removal Costs $16,215 $29,137 $32,000 $35,000
Number of Hours Worked by Streets Division Personnel 1,884 2,200 2,000 2,000
Spring Cleanup:
Streets Division Costs (Personnel and Equipment) $72,597 $59,010 $60,000 $62,000
Removal Costs $11,962 $10,197 $12,000 $13,000
Number of Hours Worked by Streets Division Personnel 1,224 956 1,100 1,100
PERFORMANCE MEASURES
Work
load
-197-

FY-2014 FY-2015 FY-2016 FY-2017
Final Final Final Adopted
Description Actual Actual Revised Est. Budget
FUNDING SOURCES -
Charges for Services 4,584$ 6,574$ 8,500$ 8,500$
Licenses & Permits 500 525 600 500
Fines & Forfeits 50 50 100 100
Interest & Rents 165,000 170,000 180,000 187,200
General Fund Operating Revenues 870,829 949,550 910,871 804,543
TOTAL SOURCES 1,040,963$ 1,126,699$ 1,100,071$ 1,000,843$
FUNDING USES -
Personnel Services -
* Salaries & Wages - Working 157,222$ 165,144$ 167,273$ 184,400$
* Benefits - Incl. NonWorking Wages 22,900 127,677 96,312 10,566
* Mandatory Employer Costs 27,401 30,559 31,997 35,680
Other Current Expenditures -
* Supplies / Maintenance 42,089 30,438 36,188 43,240
* Contractual 65,541 74,692 95,613 102,550
* Other 725,810 698,189 672,688 624,407
Capital Outlay - 0 - - 0 - - 0 - - 0 -
TOTAL USES 1,040,963$ 1,126,699$ 1,100,071$ 1,000,843$
Personnel Services Total Amount 207,523$ 323,380$ 295,582$ 230,646$
* Full-Time Positions 15.65 15.65 15.65 16.65
* Part-Time Positions @ F.T.E. 1.20 1.10 1.10 1.10
NOTE: The majority of time for these positions is charged directly to the two Motor Vehicle Highway Funds.
TRANSPORTATION
GENERAL FUND - STREETS DIVISION
- - F U N D I N G S O U R C E S & U S E S - -
- - S T A F F I N G - -
-198-

TRANSPORTATION
MANAGEMENT & ENGINEERING
CY-14 CY-15 CY-16 CY-17
Actual Actual Projected Projected
Construction Projects in Process (Calendar) 12 11 10 10
Total Miles of Streets Reconstructed (Calendar) 0.00 2.44 1.35 2.49
Total Miles of Streets Resurfaced (Calendar) 3.790 0.880 5.530 6.880
Total Miles of Path Construction or Resurfacing (Calendar) 1.970 1.000 0.500 0.500
Sidewalk Repair Activities in Square Feet (Calendar) 500 107,078 100,000 100,000
Work
load
PERFORMANCE MEASURES
-199-

FY-2014 FY-2015 FY-2016 FY-2017
Final Final Final Adopted
Description Actual Actual Revised Est. Budget
FUNDING SOURCES -
Charges for Services - 0 -$ - 0 -$ 1,000$ 2,000$
General Fund Operating Revenues 174,596 183,664 172,438 212,400
TOTAL SOURCES 174,596$ 183,664$ 173,438$ 214,400$
FUNDING USES -
Personnel Services -
* Salaries & Wages - Working 90,501$ 81,498$ 88,775$ 130,800$
* Benefits - Incl. NonWorking Wages 38,250 46,737 37,875 34,436
* Mandatory Employer Costs 9,156 8,562 9,725 13,550
Other Current Expenditures -
* Supplies / Maintenance 2,324 1,872 2,400 2,250
* Contractual 2,110 13,615 2,000 2,000
* Other 32,255 31,380 32,663 31,364
Capital Outlay - 0 - - 0 - - 0 - - 0 -
TOTAL USES 174,596$ 183,664$ 173,438$ 214,400$
Personnel Services Total Amount 137,907$ 136,797$ 136,375$ 178,786$
Full-Time Positions 2.35 2.35 3.35 3.35
Part-Time Positions @ F.T.E. 0.30 0.30 0.30 0.35
TRANSPORTATION
GENERAL FUND - MANAGEMENT & ENGINEERING
- - F U N D I N G S O U R C E S & U S E S - -
- - S T A F F I N G - -
-200-

FY-2014 FY-2015 FY-2016 FY-2017
Final Final Final Adopted
Description Actual Actual Revised Est. Budget
FUNDING SOURCES -
Intergovernmental 2,381,647$ 2,460,808$ 2,675,083$ 2,836,600$
Licenses & Permits 16,451 20,456 20,000 25,000
Interest & Rents 22,450 17,717 20,000 5,000
Other - 0 - - 0 - - 0 - - 0 -
Transfers In - 0 - - 0 - - 0 - - 0 -
TOTAL SOURCES 2,420,548$ 2,498,981$ 2,715,083$ 2,866,600$
FUNDING USES -
Personnel Services -
* Salaries & Wages - Working 378,757$ 316,644$ 302,600$ 362,725$
* Benefits - Incl. NonWorking Wages 284,462 215,639 221,400 234,250
* Mandatory Employer Costs 32,265 27,009 27,240 35,610
Other Current Expenditures -
* Supplies / Maintenance 248,710 248,700 233,000 258,500
* Contractual 96,280 139,934 184,173 201,200
* Other 570,276 459,628 448,230 450,750
Transfers Out 801,666 1,320,400 3,783,928 1,336,054
Contingencies - 0 - - 0 - - 0 - - 0 -
TOTAL USES 2,412,416$ 2,727,954$ 5,200,571$ 2,879,089$
INCREASE (DECREASE) 8,132$ (228,973)$ (2,485,488)$ (12,489)$
ENDING BALANCE -
Designated / Reserved - 0 - - 0 - - 0 - - 0 -
Undesignated / Unreserved 2,727,960 2,498,987 13,499 1,010
TOTAL FUND EQUITY 2,727,960$ 2,498,987$ 13,499$ 1,010$
NOTE: The time of several positions listed under General Fund - Street O&M Dept "Staffing" is charged to this fund.
TRANSPORTATION
MOTOR VEHICLE HIGHWAY MAJOR STREETS
- - F U N D I N G S O U R C E S & U S E S - -
- - S T A F F I N G - -
- - F U N D E Q U I T Y - -
-201-

FY-2014 FY-2015 FY-2016 FY-2017
Final Final Final Adopted
Description Actual Actual Revised Est. Budget
FUNDING SOURCES -
Intergovernmental 573,609$ 629,883$ 695,400$ 728,000$
Licenses & Permits 22,815 44,057 40,000 40,000
Interest & Rents (452) 1,143 975 1,000
Other - 0 - - 0 - - 0 - - 0 -
Transfers In 780,966 588,900 627,353 699,980
TOTAL SOURCES 1,376,938$ 1,263,983$ 1,363,728$ 1,468,980$
FUNDING USES -
Personnel Services -
* Salaries & Wages - Working 347,104$ 320,350$ 342,113$ 394,400$
* Benefits - Incl. NonWorking Wages 254,488 215,547 240,175 256,575
* Mandatory Employer Costs 30,441 27,582 28,342 37,805
Other Current Expenditures -
* Supplies / Maintenance 228,891 225,039 214,500 237,500
* Contractual 14,095 52,195 51,600 55,600
* Other 501,919 423,268 487,000 487,100
Transfers Out - 0 - - 0 - - 0 - - 0 -
Contingencies - 0 - - 0 - - 0 - - 0 -
TOTAL USES 1,376,938$ 1,263,981$ 1,363,730$ 1,468,980$
INCREASE (DECREASE) - 0 -$ 2$ (2)$ - 0 -$
ENDING BALANCE -
Designated / Reserved - 0 - - 0 - - 0 - - 0 -
Undesignated / Unreserved 2,000 2,002 2,000 2,000
TOTAL FUND EQUITY 2,000 2,002 2,000 2,000
NOTE: The time of several positions listed under General Fund - Street O&M Dept "Staffing" is charged to this fund.
- - S T A F F I N G - -
TRANSPORTATION
MOTOR VEHICLE HIGHWAY LOCAL STREETS
- - F U N D I N G S O U R C E S & U S E S - -
- - F U N D E Q U I T Y - -
-202-

FY-2014 FY-2015 FY-2016 FY-2017
Final Final Final Adopted
Description Actual Actual Revised Est. Budget
FUNDING SOURCES -
Intergovernmental 427,824$ 449,224$ 450,000$ 450,000$
Interest & Rents 2,465 3,577 4,000 4,000
Transfers In - 0 - - 0 - - 0 - - 0 -
TOTAL SOURCES 430,289$ 452,801$ 454,000$ 454,000$
FUNDING USES -
Transfers Out 165,002$ 504,609$ 867,074$ 375,000$
Contingencies - 0 - - 0 - - 0 - - 0 -
TOTAL USES 165,002$ 504,609$ 867,074$ 375,000$
INCREASE (DECREASE) 265,287$ (51,808)$ (413,074)$ 79,000$
ENDING BALANCE -
Designated / Reserved - 0 - - 0 - - 0 - - 0 -
Undesignated / Unreserved 534,844 483,036 69,962 148,962
TOTAL FUND EQUITY 534,844$ 483,036$ 69,962$ 148,962$
Positions: Not Applicable
- - S T A F F I N G - -
TRANSPORTATION
ALLEGAN COUNTY ROAD TAX FUND
- - F U N D I N G S O U R C E S & U S E S - -
- - F U N D E Q U I T Y - -
-203-

FY-2014 FY-2015 FY-2016 FY-2017
Final Final Final Adopted
Description Actual Actual Revised Est. Budget
FUNDING SOURCES -
Intergovernmental - 0 -$ - 0 -$ 330,000$ 330,000$
Interest & Rents - 0 - - 0 - 500 1,000
Transfers In - 0 - - 0 - - 0 - - 0 -
TOTAL SOURCES - 0 -$ - 0 -$ 330,500$ 331,000$
FUNDING USES -
Transfers Out - 0 -$ - 0 -$ 330,000$ 330,000$
Contingencies - 0 - - 0 - - 0 - - 0 -
TOTAL USES - 0 -$ - 0 -$ 330,000$ 330,000$
INCREASE (DECREASE) - 0 -$ - 0 -$ 500$ 1,000$
ENDING BALANCE -
Designated / Reserved - 0 - - 0 - - 0 - - 0 -
Undesignated / Unreserved - 0 - - 0 - 500 1,500
TOTAL FUND EQUITY - 0 -$ - 0 -$ 500$ 1,500$
Positions: Not Applicable
- - S T A F F I N G - -
TRANSPORTATION
OTTAWA COUNTRY ROAD TAX FUND
- - F U N D I N G S O U R C E S & U S E S - -
- - F U N D E Q U I T Y - -
-204-

TRANSPORTATION STREET IMPROVEMENTS RESERVE FUND
FUND MISSION STATEMENT This fund is established to provide a reserve account, built up by an annual appropriation augmented by investment income, to be used to help fund major street and bridge infrastructure improvement projects that might not otherwise be possible out of annual operating and state gas tax revenues. Allocations from this fund are made by Council, and may be used in conjunction with other funding sources in the undertaking of any street and infrastructure project.
ACTION PLAN
Provide funding to assist with the implementation of the Five-Year Street Improvement plan outlined in the Capital Improvements section of the budget.
To direct revenues from this fund toward capital improvements outlined in the Engineering
and Street sections of the General Fund.
With the unusually high amount of road reconstruction projects being programmed in 2015/2016, primarily due to the necessity to back-feed the snowmelt system from the new power plant, fund balances across all City road funds will finish FY16 at extremely low levels (historically low levels). In addition, the 2015 Resurfacing program is also being severely trimmed in order to afford the reconstruction projects and capitalize on rare snowmelt expansion opportunities. Future road projects are expected to have to be moved out further into the future in order to rebuild fund balances and the overall PASER rating for our road network is expected to continue on its current downward trend. Michigan voters will have an opportunity in May of 2015 to approve new funding for road work in the form of a sales tax increase. The vote will have a major impact on the City’s road funds with additional revenues expected to approach $1.7 million phased in over a three year period. In the event this measure would pass, the transportation department would be able to make several positive adjustments to our five year street improvement program and maintain or even increase upon the usual amount of yearly road projects the City completes and reverse the downward trend of our PASER rating.
-205-

FY-2014 FY-2015 FY-2016 FY-2017
Final Final Final Adopted
Description Actual Actual Revised Est. Budget
FUNDING SOURCES -
Taxes & Special Assessments 988,452$ 1,366,547$ 1,498,578$ 1,437,845$
Intergovernmental - 0 - - 0 - 26,215 289,047
Interest & Rents 15,411 13,970 - 0 - - 0 -
Other - 0 - - 0 - - 0 - - 0 -
Transfers In 100,000 176,000 3,869,000 620,000
TOTAL SOURCES 1,103,863$ 1,556,517$ 5,393,793$ 2,346,892$
FUNDING USES -
Other Current Expenditures -
* Contractual - 0 -$ - 0 -$ - 0 -$ - 0 -$
Transfers Out 779,577 2,270,544 6,180,939 2,245,744
Contingencies - 0 - - 0 - - 0 - - 0 -
TOTAL USES 779,577$ 2,270,544$ 6,180,939$ 2,245,744$
INCREASE (DECREASE) 324,286$ (714,027)$ (787,146)$ 101,148$
ENDING BALANCE -
Designated / Reserved - 0 - - 0 - - 0 - - 0 -
Undesignated / Unreserved 1,511,942 797,915 10,769 111,917
TOTAL FUND EQUITY 1,511,942 797,915 10,769 111,917
Positions: Not Applicable
TRANSPORTATION
STREET IMPROVEMENTS RESERVE FUND
- - F U N D I N G S O U R C E S & U S E S - -
- - F U N D E Q U I T Y - -
- - S T A F F I N G - -
-206-

TRANSPORTATION DOWNTOWN SNOWMELT SYSTEM OPERATING FUND
FUND MISSION STATEMENT To provide the downtown and downtown neighborhoods with a cost and operationally efficient Snowmelt system that enables a snow-free environment during the winter months to promote all uses of the downtown, both public and private.
ACTION PLAN
Complete transmission and distribution improvements along Central Avenue with minimum level of transmission improvement necessary to back-feed existing snowmelt system. Will be completed in the spring/summer of 2016. Remaining portion South of 19th Street.
Complete transmission and distribution improvements along 8th Street with minimum level
of transmission improvement necessary to back-feed existing snowmelt system. Completed fall of 2015.
Complete design of 9th Street project that will include final piece of transmission piping to back-feed existing snowmelt system. This task will be completed spring of 2016.
Develop long-term snowmelt planning and financing strategy utilizing the downtown snowmelt vision map developed by the planning, downtown and transportation staff. Will be completed summer/fall of 2016.
Complete plan for maintenance overhaul of snowmelt system prior to conversion to new power plant. Actual maintenance overhaul scheduled for fall of 2016. Coordinating with BPW to ensure that this work progresses and is planned appropriately. (Estimated $500,000)
-207-

FY-2014 FY-2015 FY-2016 FY-2017
Final Final Final Adopted
Description Actual Actual Revised Est. Budget
FUNDING SOURCES -
Taxes & Special Assessments 109,526$ 166,339$ 174,653$ 297,750$
Interest & Rents 1,014 357 - 0 - - 0 -
Other 20,531 21,388 10,000 - 0 -
Transfers In 29,250 46,600 31,920 26,074
TOTAL SOURCES 160,321$ 234,684$ 216,573$ 323,824$
FUNDING USES -
Other Current Expenditures -
* Contractual - 0 -$ - 0 -$ - 0 -$ - 0 -$
* Other 238,717 260,904 196,991 242,674
Capital Outlay - 0 - - 0 - - 0 - - 0 -
Debt Service Payments -
* Principal - 0 - - 0 - - 0 - - 0 -
* Interest & Fee Payments - 0 - - 0 - - 0 - - 0 -
Transfers Out - 0 - - 0 - 16,200 - 0 -
Contingencies - 0 - - 0 - - 0 - - 0 -
TOTAL USES 238,717$ 260,904$ 213,191$ 242,674$
INCREASE (DECREASE) (78,396)$ (26,220)$ 3,382$ 81,150$
ENDING BALANCE -
Designated / Reserved - 0 - - 0 - - 0 - - 0 -
Undesignated / Unreserved 26,258 38 3,420 84,570
TOTAL FUND EQUITY 26,258$ 38$ 3,420$ 84,570$
Positions: Not Applicable
TRANSPORTATION
DOWNTOWN SNOWMELT SYSTEM OPERATING FUND
- - F U N D I N G S O U R C E S & U S E S - -
- - S T A F F I N G - -
- - F U N D E Q U I T Y - -
-208-

FY-2014 FY-2015 FY-2016 FY-2017
Final Final Final Adopted
Description Actual Actual Revised Est. Budget
FUNDING SOURCES -
Intergovernmental - 0 -$ - 0 -$ - 0 -$ - 0 -$
Interest & Rents 1 1 1 1
Other - 0 - - 0 - - 0 - - 0 -
Transfers In - 0 - - 0 - - 0 - - 0 -
TOTAL SOURCES 1$ 1$ 1$ 1$
FUNDING USES -
Personnel Services -
* Salaries & Wages - Working - 0 -$ - 0 -$ - 0 -$ - 0 -$
* Mandatory Employer Costs - 0 - - 0 - - 0 - - 0 -
Other Current Expenditures
* Supplies / Maintenance - 0 - - 0 - - 0 - - 0 -
* Contractual - 0 - - 0 - - 0 - - 0 -
* Other - 0 - - 0 - - 0 - - 0 -
Capital Outlay - 0 - - 0 - - 0 - - 0 -
Depreciation Expense 24,540 24,539 24,550 24,550
TOTAL USES 24,540$ 24,539$ 24,550$ 24,550$
INCREASE (DECREASE) (24,539)$ (24,538)$ (24,549)$ (24,549)$
ENDING BALANCE -
Undesignated / Unreserved 822,057 797,519 772,970 748,421
TOTAL FUND EQUITY 822,057$ 797,519$ 772,970$ 748,421$
INCREASE (DECREASE) - - - - - - - - - 1$ 1$ 1$
ENDING BALANCE 6 7$ 8$ 9$
Positions: Not Applicable
- - S T A F F I N G - -
TRANSPORTATION
DEPOT OPERATIONS FUND
- - F U N D I N G S O U R C E S & U S E S - -
- - F U N D E Q U I T Y - -
- - W O R K I N G C A P I T A L - -
-209-

TRANSPORTATION MUNICIPAL AIRPORT FACILITIES AND MANAGEMENT FUND
FUND MISSION STATEMENT
To provide recordkeeping for the airport related property tax levy and capital assets. The West Michigan Airport Authority (WMAA) receives a contributory payment for property taxes collected.
ACTION PLAN
To account for property tax collections that the City levies on behalf of the West Michigan Airport Authority and pay those collections over to the Authority.
To account for City owned capital assets which are leased to the West Michigan Airport Authority.
-210-

FY-2014 FY-2015 FY-2016 FY-2017
Final Final Final Adopted
Description Actual Actual Revised Est. Budget
FUNDING SOURCES -
Taxes & Special Assessments 98,858$ 99,984$ 104,441$ 104,650$
Charges for Services - 0 - 18,309 23,635 28,473
Other - 0 - - 0 - 92,000 - 0 -
TOTAL SOURCES 98,858$ 118,293$ 220,076$ 133,123$
FUNDING USES -
Personnel Services -
* Salaries & Wages - Working - 0 -$ 14,958$ 18,400$ 21,725$
* Benefits - To Include NonWorking Wages - 0 - 2,156 3,645 4,826
* Mandatory Employer Costs - 0 - 1,190 1,590 1,900
Other Current Expenditures -
* Other 99,003 98,573 104,441 104,650
Capital Outlay - 0 - - 0 - 92,000 - 0 -
Depreciation Expense 461,005 461,005 461,000 461,000
TOTAL USES 560,008$ 577,882$ 681,076$ 594,101$
INCREASE (DECREASE) (461,150)$ (459,589)$ (369,000)$ (460,978)$
ENDING BALANCE -
Designated / Reserved - 0 - - 0 - - 0 - - 0 -
Undesignated / Unreserved 10,687,916 10,228,327 9,859,327 9,398,349
TOTAL FUND EQUITY 10,687,916$ 10,228,327$ 9,859,327$ 9,398,349$
INCREASE (DECREASE) -$ 1,416$ -$ 22$
ENDING BALANCE - 0 -$ 1,416$ 1,416$ 1,438$
Personnel Services Total Amount - 0 -$ 18,304$ 23,635$ 28,451$
Full-Time Positions - 0 - 0.20 0.16 0.16
Part-Time Positions @ F.T.E. - 0 - 0.35 0.35 0.35
- - S T A F F I N G - -
TRANSPORTATION
MUNICIPAL AIRPORT FACILITIES MANAGEMENT FUND
- - F U N D I N G S O U R C E S & U S E S - -
- - F U N D E Q U I T Y - -
- - W O R K I N G C A P I T A L - -
-211-

FY-2014 FY-2015 FY-2016 FY-2017
Final Final Final Adopted
Description Actual Actual Revised Est. Budget
FUNDING SOURCES -
Charges for Services 541$ 328$ 275$ 275$
Intergovernmental - 0 - - 0 - - 0 - - 0 -
Interest & Rents 13 11 15 15
Other - 0 - - 0 - - 0 - - 0 -
Transfers In - 0 - - 0 - - 0 - - 0 -
TOTAL SOURCES 554$ 339$ 290$ 290$
FUNDING USES -
Personnel Services -
* Salaries & Wages - Working - 0 -$ - 0 -$ - 0 -$ - 0 -$
* Mandatory Employer Costs - 0 - - 0 - - 0 - - 0 -
Other Current Expenditures
* Supplies / Maintenance 1 - 0 - - 0 - - 0 -
* Contractual - 0 - - 0 - - 0 - - 0 -
* Other 540 328 275 275
Depreciation Expense 11,767 11,745 11,750 11,750
TOTAL USES 12,308$ 12,073$ 12,025$ 12,025$
INCREASE (DECREASE) (11,754)$ (11,734)$ (11,735)$ (11,735)$
ENDING BALANCE -
Designated / Reserved - 0 - - 0 - - 0 - - 0 -
Undesignated / Unreserved 256,411 244,677 232,942 221,207
TOTAL FUND EQUITY 256,411$ 244,677$ 232,942$ 221,207$
INCREASE (DECREASE) 13$ 11$ 15$ 15$
ENDING BALANCE 1,637$ 1,648$ 1,663$ 1,678$
Positions: Not Applicable
- - S T A F F I N G - -
TRANSPORTATION
PUBLIC TRANSIT FACILITIES & MGMT SYSTEM FUND
- - F U N D I N G S O U R C E S & U S E S - -
- - F U N D E Q U I T Y - -
- - W O R K I N G C A P I T A L - -
-212-

FY-2014 FY-2015 FY-2016 FY-2017
Final Final Final Adopted
Description Actual Actual Revised Est. Budget
FUNDING SOURCES -
Charges for Services 1,328$ 1,305$ 1,400$ 1,400$
Interest & Rents 26 20 20 20
Other - 0 - - 0 - - 0 - - 0 -
TOTAL SOURCES 1,354$ 1,325$ 1,420$ 1,420$
FUNDING USES -
Other Current Expenses -
* Supplies / Maintenance 385$ 481$ 500$ 500$
* Other 507 1,214 1,400 1,200
TOTAL USES 892$ 1,695$ 1,900$ 1,700$
INCREASE (DECREASE) 462$ (370)$ (480)$ (280)$
ENDING BALANCE -
Designated / Reserved - 0 - - 0 - - 0 - - 0 -
Undesignated / Unreserved 3,254 2,884 2,404 2,124
TOTAL FUND EQUITY 3,254$ 2,884$ 2,404$ 2,124$
INCREASE (DECREASE) 462$ (370)$ (480)$ (280)$
ENDING BALANCE 3,254$ 2,884$ 2,404$ 2,124$
Positions: Not Applicable
TRANSPORTATION
TRANSPORTATION EMPLOYEES BENEFIT FUND
- - F U N D I N G S O U R C E S & U S E S - -
- - F U N D E Q U I T Y - -
- - S T A F F I N G - -
- - W O R K I N G C A P I T A L - -
-213-

TRANSPORTATION
CENTRALIZED VEHICLE/EQUIPMENT
FY-14 FY-15 FY-16 FY-17
Actual Actual Projected Projected
General Motor Pool:
Vehicles 52 62 62 62
Equipment 59 59 59 59
Two Way Radios 34 34 34 34
Street:
Vehicles 30 29 29 29
Equipment 70 78 79 80
Two Way Radios 47 47 47 47
Police:
Vehicles 33 23 23 23
Macatawa Area Express:
Vehicles (Maintenance Only, not Purchased in this Fund) 27 29 29 29
(Note: Surplus Vehicles Waiting to be Disposed of)
Fire:
Vehicles (Maintenance Only, not Purchased in this Fund) 8 8 8 8
Total:
Vehicles (not Including MAX or Fire) 115 114 114 114
Equipment 129 137 138 139
Two Way Radios 81 81 81 81
PERFORMANCE MEASURES
Wo
rklo
ad
-214-

FY-2014 FY-2015 FY-2016 FY-2017
Final Final Final Adopted
Description Actual Actual Revised Est. Budget
FUNDING SOURCES -
Charges for Services 318,130$ 343,592$ 324,650$ 345,900$
Interest & Rents 2,077,122 1,907,725 1,834,713 1,819,151
Other 47,575 51,549 137,620 102,500
Transfers In 20,291 41,135 38,335 - 0 -
TOTAL SOURCES 2,463,118$ 2,344,001$ 2,335,318$ 2,267,551$
FUNDING USES -
Personal Services -
* Salaries & Wages - Working 372,898$ 375,302$ 403,072$ 417,715$
* Benefits - Includes NonWorking Wages 247,153 249,211 237,610 189,262
* Mandatory Employer Costs 38,462 38,764 43,673 46,488
Other Current Expenses -
* Supplies / Maintenance 906,497 865,239 847,528 834,175
* Contractual 36,525 27,611 9,850 8,800
* Other 327,412 343,308 367,311 375,906
Capital Outlay 663,957 494,768 1,151,864 808,100
Transfers Out 66,405 16,200 - 0 - - 0 -
Contingencies - 0 - - 0 - - 0 - - 0 -
Decpreciation Expense 487,778 472,766 500,000 500,000
TOTAL USES 3,147,087$ 2,883,169$ 3,560,908$ 3,180,446$
TRANSPORTATION
CENTRALIZED VEHICLE / EQUIPMENT FUND
- - F U N D I N G S O U R C E S & U S E S - -
T h I s F u n d C o n t I n u e s O n N e x t P a g e
-215-

FY-2014 FY-2015 FY-2016 FY-2017
Final Final Final Adopted
Description Actual Actual Revised Est. Budget
INCREASE (DECREASE) (20,012)$ (44,400)$ (73,726)$ (104,795)$
ENDING BALANCE -
Reserved for Asset Replacement 1,345,000 1,330,000 900,000 300,000
Undesignated / Unreserved 3,325,545 3,296,145 3,652,419 4,147,624
TOTAL FUND EQUITY 4,670,545$ 4,626,145$ 4,552,419$ 4,447,624$
INCREASE (DECREASE) 320,506$ 30,569$ (295,590)$ 187,105$
ENDING BALANCE 322,058$ 352,627$ 57,037$ 244,142$
Personnel Services Total Amount 658,513$ 663,277$ 684,355$ 653,465$
Full-Time Positions 7.00 7.00 7.00 7.00
Part-Time Positions @ F.T.E. 1.15 1.70 1.75 1.85
T h i s F u n d C o n t i n u e s F r o m P r e v i o u s P a g e
- - F U N D E Q U I T Y - -
- - W O R K I N G C A P I T A L - -
- - S T A F F I N G - -
TRANSPORTATION
CENTRALIZED VEHICLE / EQUIPMENT FUND
-216-

COMMUNITY & NEIGHBORHOOD SERVICES INTRODUCTION
GROUP MISSION STATEMENT
The Community and Neighborhood Services Group encompass all those activities related to community improvement, growth and development. The overall objective is to provide a coordinated and comprehensive approach to community planning by focusing on the physical, social and economic needs of the community, with an emphasis on residential neighborhood improvements and maintenance of a diversified and viable downtown, commercial and industrial areas.
GROUP ORGANIZATIONAL STRUCTURE
-217-

COMMUNITY & NEIGHBORHOOD SERVICES
$- $200,000 $400,000 $600,000 $800,000
$1,000,000 $1,200,000 $1,400,000 $1,600,000
Use
s D
oll
ars
Total Uses by Department $5,464,015
Taxes & S/A33.2%
Licenses & Permits10.9%
Intergovernmental0.8%
Transfers from Other Funds1.5%
Charges for Services/Fines
39.4%
Other1.2%
General Revenues
12.6%
Interest & Rents0.4%Funding Sources
Working Wages21.1%
Suppl/Maint.5.1% Benefits & NonWorking
Wages8.0%
Mandatory Employer Costs2.0%
Transfers to Other Funds7.7%
Other27.2%
Contingencies0.7%
Contractual28.2%
Funding Uses
-218-

FY-2014 FY-2015 FY-2016 FY-2017
Final Final Final Adopted
Description Actual Actual Revised Est. Budget
FUND TYPES-
General Fund 1,836,586$ 1,855,985$ 1,868,933$ 1,846,329$
Special Revenue Funds 536,459 544,772 733,686 563,152
Enterprise Funds 1,429,548 1,658,052 1,499,235 1,526,097
Component Unit 952,003 1,074,499 1,187,233 1,528,437
TOTAL- ALL FUND TYPES 4,754,596$ 5,133,308$ 5,289,087$ 5,464,015$
FUNDING SOURCES -
Taxes & Special Assessments 1,333,756$ 1,424,314$ 1,539,218$ 1,870,758$
Licenses & Permits 599,603 664,608 612,000 612,300
Intergovernmental 37,025 31,945 45,066 42,850
Charges for Services 2,234,749 2,154,194 2,360,387 2,227,150
Fines & Forfeits 575 1,130 1,600 1,600
Interest & Rents 31,444 28,648 22,325 23,539
Other 36,266 35,014 27,570 66,000
Transfers In 78,562 72,877 74,340 83,259
TOTAL SOURCES 4,351,980$ 4,412,730$ 4,682,506$ 4,927,456$
FUNDING USES -
Personnel Services -
* Salaries & Wages - Working 1,090,376$ 1,032,436$ 1,108,044$ 1,154,038$
* Benefits - Incl. NonWorking Wages 614,076 645,979 543,455 437,409
* Mandatory Employer Costs 98,456 92,877 101,235 107,027
Other Current Expenditures -
* Supplies / Maintenance 200,419 229,246 269,509 276,450
* Contractual 1,382,338 1,635,045 1,510,963 1,538,400
* Other 1,041,573 1,143,991 1,402,722 1,487,594
Capital Outlay 49 - 0 - - 0 - - 0 -
Transfers Out 327,309 353,734 353,159 423,097
Contingencies - 0 - - 0 - - 0 - 40,000
TOTAL USES 4,754,596$ 5,133,308$ 5,289,087$ 5,464,015$
Personnel Services Total Amount 1,802,908$ 1,771,292$ 1,752,734$ 1,698,474$
* Full-Time Positions 16.00 17.00 17.97 17.97
* Part-Time Positions @ F.T.E. 6.95 6.45 5.65 6.10
COMMUNITY & NEIGHBORHOOD SERVICES
SUMMARY OF DEPTS, FUNCTIONS & RELATED FUNDS
- - G R O U P F U N D I N G U S E S A C R O S S F U N D S - -
- - G R O U P S T A F F I N G T O T A L S - -
- - G R O U P F U N D I N G S O U R C E S & U S E S T O T A L S - -
-219-

COMMUNITY & NEIGHBORHOOD SERVICES CITY HALL & GROUNDS
ACTIVITY MISSION STATEMENT To maintain the structure which serves as a focal point for City government and the citizens of the community in a manner which represents the quality of the community, and provide the most economical and efficient space for the needs of municipal government, including its citizen boards, commissions, and committees. ACTION PLAN
Oversee the ESCO projects being installed in City Hall that were approved by City Council, including new windows, climate control and lighting.
Put together a coordinated plan to replace worn out and inoperable office furniture and carpeting throughout City Hall, where needed.
Investigate and repair the water leaking issue at the River Avenue Exterior Doors causing damage to the south side interior pillar.
Replace the failing pervious concrete around the westernmost catch basin in the parking lot with solid concrete.
-220-

COMMUNITY & NEIGHBORHOOD SERVICES
CITY HALL & GROUNDS
FY-14 FY-15 FY-16 FY-17
Actual Actual Projected Projected
Total Electrical Usage (Kilowatts) 666,900 645,300 660,000 594,000
Total Water Usage (CCF) 1,507 1,171 1,100 1,000
Total Gas Usage (CCF) 25,933 19,428 19,000 18,000
PERFORMANCE MEASURES
Work
load
-221-

FY-2014 FY-2015 FY-2016 FY-2017
Final Final Final Adopted
Description Actual Actual Revised Est. Budget
FUNDING SOURCES -
No Funding Sources - 0 -$ - 0 -$ - 0 -$ - 0 -$
General Fund Operating Revenues 229,646 233,217 189,071 167,968
TOTAL SOURCES 229,646$ 233,217$ 189,071$ 167,968$
FUNDING USES -
Personnel Services -
* Salaries & Wages - Working 39,868$ 37,186$ 24,900$ 25,086$
* Benefits - Incl. NonWorking Wages 26,360 32,004 22,062 11,486
* Mandatory Employer Costs 4,218 4,354 2,775 2,896
Other Current Expenditures -
* Supplies / Maintenance 23,408 26,198 16,200 20,200
* Contractual 43,246 45,113 47,700 47,700
* Other 92,546 88,362 75,434 60,600
Capital Outlay - 0 - - 0 - - 0 - - 0 -
TOTAL USES 229,646$ 233,217$ 189,071$ 167,968$
Personnel Services Total Amount 70,446$ 73,544$ 49,737$ 39,468$
Full-Time Positions 1.00 1.00 0.60 0.60
Part-Time Positions @ F.T.E. - 0 - - 0 - - 0 - - 0 -
COMMUNITY & NEIGHBORHOOD SERVICES
GENERAL FUND - CITY HALL & GROUNDS
- - F U N D I N G S O U R C E S & U S E S - -
- - S T A F F I N G - -
-222-

COMMUNITY & NEIGHBORHOOD SERVICES PLANNING & ZONING
ACTIVITY MISSION STATEMENT PLANNING: Provide a coordinated, comprehensive approach to community planning and design. Focus on the needs and aspirations of the community to provide the best conditions for living, working, learning, and recreating for the citizens of Holland. Assist in preparing and implementing policies, plans, and ordinances in pursuit of this mission, striving for “neighborhoods of choice,” high quality development, and sustainability.
ACTION PLAN
Complete a Re-Write of the City’s Subdivision and Zoning Ordinances in light of the new City Master Plan which will be approved in the spring of 2016.
Assemble a plan and process for the redevelopment of fatigued shopping centers and
corridor commercial centers, including the Waverly/Chicago Drive/8th Street Corridors, 40th Street and Washington Avenue and 16th Street to 24th Street along US 31.
Prepare for application to the Michigan Economic Development Corporation for certification
as a Redevelopment Ready Community.
-223-

COMMUNITY & NEIGHBORHOOD SERVICES
PLANNING & ZONING
FY-14 FY-15 FY-16 FY-17
Actual Actual Projected Projected
Planning Commission
Site Plan Reviews:
Approvals 10 13 10 10
Extensions 0 1 0 0
Amendments 0 1 1 1
Approved Non-Res Sq. Ft. 0 168,992 40,000 40,000
New Construction 0 13 0 10
Additions 0 2 0 3
Approved Residential Units 96 65 65 65
Infill Review (Commission) 2 0 0 0
Infill Review (by Staff) 1 5 10 5
Recommendations to City Council
Rezonings 3 3 3 3
Text Amendments 0 7 6 5
Street Vacations 1 1 0 0
Master Plan Amendments 0 0 0 0
Other 0 0 0 0
Review of Zoning Board of Appeals Referrals 0 0 1 1
Study Session Items 28 23 30 30
Historic District Commission
Community Education Sessions 0 1 2 1
Certificates of Appropriateness Reviewed 40 34 35 35
Certificates of Appropriateness Approved 40 33 34 35
Work
load
PERFORMANCE MEASURES
-224-

FY-2014 FY-2015 FY-2016 FY-2017
Final Final Final Adopted
Description Actual Actual Revised Est. Budget
FUNDING SOURCES -
Intergovernmental - 0 -$ - 0 -$ - 0 -$ - 0 -$
Charges for Services 16,555 7,150 4,200 7,200
General Fund Operating Revenues 234,662 219,200 178,227 162,095
TOTAL SOURCES 251,217$ 226,350$ 182,427$ 169,295$
FUNDING USES -
Personnel Services -
* Salaries & Wages - Working 133,811$ 105,135$ 91,950$ 91,547$
* Benefits - Incl. NonWorking Wages 79,191 89,278 55,992 41,174
* Mandatory Employer Costs 11,804 10,243 8,125 8,354
Other Current Expenditures -
* Supplies / Maintenance 2,370 3,022 3,000 3,000
* Contractual 5,840 5,465 6,900 6,900
* Other 18,201 13,207 16,460 18,320
Capital Outlay - 0 - - 0 - - 0 - - 0 -
TOTAL USES 251,217$ 226,350$ 182,427$ 169,295$
Personnel Services Total Amount 224,806$ 204,656$ 156,067$ 141,075$
Full-Time Positions 1.90 2.10 1.60 1.60
Part-Time Positions @ F.T.E. 0.30 0.30 0.30 0.30
COMMUNITY & NEIGHBORHOOD SERVICES
GENERAL FUND - PLANNING & ZONING
- - F U N D I N G S O U R C E S & U S E S - -
- - S T A F F I N G - -
-225-

COMMUNITY & NEIGHBORHOOD SERVICES ENVIRONMENTAL HEALTH & INSPECTIONS
DEPARTMENT MISSION STATEMENT To protect and improve the environment and well-being of Holland’s citizens by regulating, inspecting and investigating new and existing structures and property uses, electrical, mechanical and plumbing systems, and all other factors and activities within the jurisdiction of this department, affecting the health, safety and welfare of the community.
ACTION PLAN ZONING
To identify obstacles to investment that may exist in the zoning ordinance.
Participate in the Master Plan process to prepare for a zoning ordinance re-vamp.
NEIGHBORHOOD HOUSING AND CODE ENFORCEMENT
Use staff to address expired rental housing certificates, and be in line with the requirements of the ordinance, completing one inspection every three years. (Two year goal to have no expired permits)
Shift clerical duties currently done by inspectors to clerical staff.
A plan to conduct Lean Engineering on development projects to eliminate barriers via
an interdisciplinary staff development team is included in the Community and Neighborhood Services Action Plan. (No budgetary impact)
Note: Assumes public lodging shifted to Public Safety except for the most egregious situations.
-226-

COMMUNITY & NEIGHBORHOOD SERVICES
ENVIRONMENTAL HEALTH & INSPECTIONS
FY-14 FY-15 FY-16 FY-17
Actual Actual Projected Projected
Rental Housing - Inspections (Properties) 378 554 550 550
Vacant Recheck (Rental and Other than Vacant and Abandoned) 62 0 0 *
Rental Housing - Inspections (Units) Unk 1,315 1,300 1,300
Public Lodging Facility (Includes Complaints) 20 7 10 10
Land Use Permits 229 274 290 300
Inoperable Vehicles - Violations Corrected 163 170 180 180
Garbage and Rubbish - Investigations 560 404 500 500
Weeds - Investigations 426 732 700 700
Point of Sale Smoke Detectors 584 624 650 650
Home Business Inspections 1 1 1 1
Home Business Type I Renewals 4 4 4 4
NEZ Inspections 3 6 5 5
Vacant and Abandoned Registration 55 32 25 20
Monthly Inspections (Fire) Vacant and Abandoned 461 398 350 300
Pre-Sale Inspections 58 37 30 25
Vacant Occupancy Inspections 66 41 35 30
Vacant Other Inspections 252 172 120 100
*Eliminated
PERFORMANCE MEASURES
Work
load
-227-

FY-2014 FY-2015 FY-2016 FY-2017
Final Final Final Adopted
Description Actual Actual Revised Est. Budget
FUNDING SOURCES -
Licenses & Permits 17,785$ 23,537$ 19,600$ 19,600$
Charges for Services 312,758 314,236 313,000 313,000
Fines & Forfeits 450 250 800 800
General Fund Operating Revenues 45,632 125,314 113,725 70,423
TOTAL SOURCES 376,625$ 463,337$ 447,125$ 403,823$
FUNDING USES -
Personnel Services -
* Salaries & Wages - Working 165,660$ 218,093$ 222,925$ 215,553$
* Benefits - Incl. NonWorking Wages 148,915 170,668 145,500 103,816
* Mandatory Employer Costs 16,410 19,911 21,425 21,083
Other Current Expenditures -
* Supplies / Maintenance 5,187 6,144 6,600 6,600
* Contractual 10,706 18,797 18,100 18,100
* Other 29,747 29,724 32,575 38,671
Capital Outlay - 0 - - 0 - - 0 - - 0 -
TOTAL USES 376,625$ 463,337$ 447,125$ 403,823$
Personnel Services Total Amount 330,985$ 408,672$ 389,850$ 340,452$
Full-Time Positions 3.31 4.51 4.51 4.51
Part-Time Postions @ F.T.E. 0.30 0.10 - 0 - - 0 -
COMMUNITY & NEIGHBORHOOD SERVICES
GENERAL FUND - ENVIRONMENTAL HEALTH & INSPECTIONS
- - F U N D I N G S O U R C E S & U S E S - -
- - S T A F F I N G - -
-228-

COMMUNITY & NEIGHBORHOOD SERVICES CONSTRUCTION INSPECTIONS
ACTIVITY MISSION STATEMENT To protect and improve the environment and well-being of Holland’s citizens by regulating, inspecting and investigating new and existing structures, electrical, mechanical, and plumbing systems and all other factors and activities within the jurisdiction of the State Construction Code, affecting the health, safety and welfare of the community.
ACTION PLAN
Evaluate opportunities for expanded collaborations and joint inspection efforts with area governments on construction code processes as staffing transitions occur.
Evaluate our ability to continue to provide quality mechanical inspection services for Holland Township.
Manage increase in permits and inspection requests by shifting clerical duties currently
done by the inspector to clerical staff.
Provide additional attention to neglected data to maintain efficiencies.
Create a new administrative plan given the current leadership retirement.
-229-

COMMUNITY & NEIGHBORHOOD SERVICES
CONSTRUCTION INSPECTIONS
FY-14 FY-15 FY-16 FY-17
Actual Actual Projected Projected
Plumbing - Permits 485 438 500 500
Mechanical - Permits 652 708 800 800
Electrical - Permits 737 737 800 800
Building - Permits 638 661 680 680
Building - Construction Valuation $76,833,554 $74,490,179 $75,000,000 $75,000,000
Holland Township Mechanical Inspections Contract 841 1000 1000 1000
Zeeland City Mechanical Inspections Contract 174 180 180 180
Work
load
PERFORMANCE MEASURES
-230-

FY-2014 FY-2015 FY-2016 FY-2017
Final Final Final Adopted
Description Actual Actual Revised Est. Budget
FUNDING SOURCES -
Licenses & Permits 581,818$ 641,071$ 590,000$ 590,000$
Charges for Services 48,915 61,957 62,000 62,000
Fines & Forfeits 125 880 800 800
General Fund Operating Revenues (173,056) (201,123) (63,046) (33,745)
TOTAL SOURCES 457,802$ 502,785$ 589,754$ 619,055$
FUNDING USES -
Personnel Services -
* Salaries & Wages - Working 216,556$ 223,072$ 275,325$ 322,975$
* Benefits - Incl. NonWorking Wages 146,063 157,897 159,810 139,792
* Mandatory Employer Costs 19,383 19,682 24,975 29,700
Other Current Expenditures -
* Supplies / Maintenance 34,215 33,741 34,100 34,100
* Contractual 10,144 30,139 57,200 47,200
* Other 31,441 38,254 38,344 45,288
Capital Outlay - 0 - - 0 - - 0 - - 0 -
TOTAL USES 457,802$ 502,785$ 589,754$ 619,055$
Personnel Service Total Amount 382,002$ 400,651$ 460,110$ 492,467$
Full-Time Positions 3.42 3.42 5.47 5.47
Part-Time Positions @ F.T.E. 0.75 0.75 1.00 1.25
- - S T A F F I N G - -
COMMUNITY & NEIGHBORHOOD SERVICES
GENERAL FUND - CONSTRUCTION INSPECTIONS
- - F U N D I N G S O U R C E S & U S E S - -
-231-

FY-2014 FY-2015 FY-2016 FY-2017
Final Final Final Adopted
Description Actual Actual Revised Est. Budget
FUNDING SOURCES -
General Fund Operating Revenues - 0 -$ - 0 -$ - 0 -$ 40,000$
TOTAL SOURCES - 0 -$ - 0 -$ - 0 -$ 40,000$
FUNDING USES -
Personnel Services -
* Salaries & Wages - Working - 0 -$ - 0 -$ - 0 -$ - 0 -$
* Benefits - Incl. NonWorking Wages - 0 - - 0 - - 0 - - 0 -
* Mandatory Employer Costs - 0 - - 0 - - 0 - - 0 -
Other Current Expenditures -
* Supplies / Maintenance - 0 - - 0 - - 0 - - 0 -
* Contractual - 0 - - 0 - - 0 - - 0 -
* Other - 0 - - 0 - - 0 - - 0 -
Contingencies - 0 - - 0 - - 0 - 40,000
TOTAL USES - 0 -$ - 0 -$ - 0 -$ 40,000$
Positions: Not Applicable
- - S T A F F I N G - -
COMMUNITY & NEIGHBORHOOD SERVICES
GENERAL FUND - SOCIAL SERVICES ASSISTANCE
- - F U N D I N G S O U R C E S & U S E S - -
-232-

COMMUNITY & NEIGHBORHOOD SERVICES HOUSING & NEIGHBORHOODS
DEPARTMENT MISSION STATEMENT The Housing and Neighborhood Division of Community and Neighborhood Services provide administration to improve the physical and social structures in Holland’s Neighborhoods. This Division will facilitate communication and collaboration among neighborhood based groups and promotes neighborhood improvement initiatives including, but not limited to, improvements to the physical environment (such as private homes and public spaces).
ACTION PLAN
Transfer funding for the Neighborhood Connections Program from the Community Development Block Grant Fund to the General Fund and increase the City’s contribution to each neighborhood group to $10,000 and require that this funding only be distributed on a one to one match for each site. (Total budget impact $40,000).
Redesign the Neighborhood Leadership Academy to focus more on City of Holland relationships with its residents as a way to educate residents on the best way to interact with City Departments and grow participants to volunteer and take leadership roles on the City’s various advisory committees and boards. (No budget impact).
-233-

COMMUNITY & NEIGHBORHOOD SERVICES
HOUSING & NEIGHBORHOODS
FY-14 FY-15 FY-16 FY-17
Actual Actual Projected Projected
Social/Human Relations Activities
Coordinate Fair Housing Activities
Fair Housing Workshop Breakfast 1 1 1 1
Complaint Based or Survey Tests 5 5 5 5
3 Hr class for Industry Personnel 1 1 1 1
3 Hr Class for Protected Classes or Social Service Agencies 1 1 1 1
Coordinate with and Promote Visibility of Good Samaritan Ministries Neighborhood Connections
Hold Monthly Meetings with Good Sam & City Staff 12 10 10 10
City Staff Landlord/Tenant LiaisonHold 1 Tenant Workshop with Ottawa Area Housing Coalition 1 1 1 1
Hold 1 Landlord Workshop w/ Ottawa Area Housing Coalition 0 1 1 1
Distribute the Landlord and Tenant Rights and Responsibilities Handbook 50 60 60 60
Provide Neighborhood Mini Grants Neighbor Led Initiative
Neighborhood Celebrations (Including NNO)
Annual National Night Out Celebration 3 1 1 1
Hold a Neighborhood Leadership AcademyRecruit Residents to Participate 19 0 12 12
Serve as a Liaison for the Neighborhood Commercial DistrictsHost Quarterly Business Meetings
8
Marketing Efforts Promote the Benefits of Living in the CityDistribute Welcome Neighbor Gift Bags 2 12 n/a n/a
Create a Realtor Education Program - Hold Trainings 1 1
Graffiti Complaints165 129
3
8
50
PERFORMANCE MEASURES
Work
load
50
8 8
3 32
-234-

FY-2014 FY-2015 FY-2016 FY-2017
Final Final Final Adopted
Description Actual Actual Revised Est. Budget
FUNDING SOURCES -
Other 35$ - 0 -$ - 0 -$ - 0 -$
Transfers In 7,635 - 0 - - 0 - - 0 -
General Fund Operating Revenues 192,362 197,706 214,940 207,136
TOTAL SOURCES 200,032$ 197,706$ 214,940$ 207,136$
FUNDING USES -
Personnel Services -
* Salaries & Wages - Working 102,869$ 93,622$ 100,250$ 101,070$
* Benefits - Incl. NonWorking Wages 70,137 72,756 68,075 55,434
* Mandatory Employer Costs 9,410 8,732 9,350 9,682
Other Current Expenditures -
* Supplies / Maintenance 944 1,022 750 1,900
* Contractual 1,222 8,337 7,000 12,000
* Other 15,450 13,237 29,515 27,050
Capital Outlay - 0 - - 0 - - 0 - - 0 -
Contingencies - 0 - - 0 - - 0 - - 0 -
TOTAL USES 200,032$ 197,706$ 214,940$ 207,136$
Personnel Services Total Amount 182,416$ 175,110$ 177,675$ 166,186$
Full-Time Positions 1.50 1.90 1.87 1.87
Part-Time Positions @ F.T.E. 0.65 0.65 0.05 0.10
- - S T A F F I N G - -
COMMUNITY & NEIGHBORHOOD SERVICES
GENERAL FUND - HOUSING & NEIGHBORHOODS
- - F U N D I N G S O U R C E S & U S E S - -
-235-

COMMUNITY & NEIGHBORHOOD SERVICES ECONOMIC DEVELOPMENT ASSISTANCE
ACTIVITY MISSION STATEMENT
To foster an environment wherein businesses desire to locate, expand, and remain. To provide a quality of life in the City that is attractive to existing and potential employees of
area businesses. To collaborate with other area organizations in order to provide a region that is strong and
dynamic from an economic perspective. To utilize the financial tools available to the City to retain and attract businesses. To provide a diverse economic base that is responsive to the inevitable changes in the
marketplace. To provide the infrastructure necessary to support the City’s economic development mission. To work with area organizations on providing a quality workforce for area employers.
ACTION PLAN
To continue collaboration and support of Lakeshore Advantage to enhance economic opportunity in the City and area. ($50,000 down from $75,000 last year).
Provide in kind fiscal services to Lakeshore Advantage and the LDFA/SmartZone including accounting, coordination of the audit, funds management and coordination of insurance coverage. (No out of pocket costs are anticipated)
To work with the Community & Neighborhood Services Department and the City
Manager’s Office to become a Redevelopment Ready Community (RRC) including updates to the Master Land Use Plan and Zoning Ordinance.
-236-

COMMUNITY & NEIGHBORHOOD SERVICES
ECONOMIC DEVELOPMENT
FY-14 FY-15 FY-16 FY-17
Actual Actual Projected Projected
Brownfield Projects Adopted / Amended 0 1 0 2
Brownfield Projects Actively Capturing Tax Dollars 9 10 9 9
Tax Abatement Projects 6 5 5 6
Neighborhood Enterprise Zones Created 0 0 1 1
Work
load
PERFORMANCE MEASURES
0
0.02
0.04
0.06
0.08
0.1
0.12
0.14
0.16
0.18
2004 2005 2006 2007 2008 2009 2010 2011 2012 2013 2014 2015
Comparison of Unemployment Rates (Annual Average)
USA Michigan Ottawa County City of Holland
-237-

FY-2014 FY-2015 FY-2016 FY-2017
Final Final Final Adopted
Description Actual Actual Revised Est. Budget
FUNDING SOURCES -
Charges for Services 74,019$ 7,800$ 3,750$ 3,600$
Transfers In 2,486 494 - 0 - - 0 -
General Fund Operating Revenues 121,789 93,664 86,276 70,150
TOTAL SOURCES 198,294$ 101,958$ 90,026$ 73,750$
FUNDING USES -
Personnel Services -
* Salaries & Wages - Working 79,997$ 4,995$ 4,700$ 4,755$
* Benefits - Incl. NonWorking Wages 47,856 31,052 5,771 2,904
* Mandatory Employer Costs 7,721 403 405 441
Other Current Expenditures -
* Supplies / Maintenance - 0 - 241 200 300
* Contractual 6,218 5,240 1,300 12,300
* Other 56,502 60,027 77,650 53,050
Transfers Out - 0 - - 0 - - 0 - - 0 -
TOTAL USES 198,294$ 101,958$ 90,026$ 73,750$
Personnel Services Total Amount 135,574$ 36,450$ 10,876$ 8,100$
Full-Time Positions 1.10 0.10 0.10 0.10
Part-Time Positions @ F.T.E. 0.40 - 0 - - 0 - - 0 -
COMMUNITY & NEIGHBORHOOD SERVICES
GENERAL FUND - ECONOMIC DEVELOPMENT ASSISTANCE
- - F U N D I N G S O U R C E S & U S E S - -
- - S T A F F I N G - -
-238-

COMMUNITY & NEIGHBORHOOD SERVICES
8TH STREET MARKET
FY-14 FY-15 FY-16 FY-17
Actual Actual Projected Projected
Farmers Market
Wednesday Market (Markets Held Each Season) 29 29 29 29
Saturday Market (Markets Held Each Season) 31 37 39 39
Total Daily Stalls Rented (Calendar Year) 1,420 1,500 1,500 1,500
Total Number of Seasonal Stalls Rented 78 80 80 80
Project Fresh Coupon Program 6,560 3,644 4,000 4,000
EBT Program 25,940 22,316 25,000 25,000
Double Up Bucks 18,998 22,316 25,000 25,000
External Events Held in Tandem with Market 1 1 1 1
Saturday Market Demos 17 18 18 18
Wednesday Children's Activities 12 13 13 13
Seasonal Special Event Days 2 2 2 2
Other Activities
Events Held at 8th Street Market 29 32 32 32
PERFORMANCE MEASURES
Work
load
-239-

FY-2014 FY-2015 FY-2016 FY-2017
Final Final Final Adopted
Description Actual Actual Revised Est. Budget
FUNDING SOURCES -
Intergovernmental 37,025$ 31,945$ 34,100$ 34,100$
Interest & Rents 16,565 16,890 14,000 15,000
Charges for Services 84,592 76,107 79,353 79,900
Other 5,740 16,985 4,698 13,000
General Fund Operating Revenues (20,952) (11,295) 23,439 23,302
TOTAL SOURCES 122,970$ 130,632$ 155,590$ 165,302$
FUNDING USES -
Personnel Services
* Salaries & Wages - Working 29,278$ 27,485$ 43,750$ 48,741$
* Benefits - Incl. NonWorking Wages 2593 2536 5130 5971
* Mandatory Employer Costs 2517 2354 3705 4140
Other Current Expenditures -
* Supplies / Maintenance 1,942 2,008 5,664 5,700
* Contractual 5,006 5,983 6,300 6,300
* Other 81,634 90,266 91,041 94,450
Capital Outlay - 0 - - 0 - - 0 - - 0 -
TOTAL USES 122,970$ 130,632$ 155,590$ 165,302$
Personnel Services Total Amount 34,388$ 32,375$ 52,585$ 58,852$
Full-Time Positions 0.10 0.15 0.40 0.40
Part-Time Positions @ F.T.E. 1.00 1.05 0.75 0.90
COMMUNITY & NEIGHBORHOOD SERVICES
GENERAL FUND - 8TH STREET MARKET
- - F U N D I N G S O U R C E S & U S E S - -
- - S T A F F I N G - -
-240-

COMMUNITY & NEIGHBORHOOD SERVICES DOWNTOWN PARKING SYSTEM FUND
FUND MISSION STATEMENT To create and maintain a viable downtown area for the greater Holland community by providing a parking system that has adequate spaces for customers, employees, downtown residents, and visitors. Such parking must remain cost effective, be well designed, and be well distributed and located so as not to act as a barrier between the retail core and surrounding neighborhoods.
ACTION PLAN
Pursue new enforcement methods and tools to most effectively manage the Downtown parking system. Ideas to pursue include, but are not limited to, a Downtown parking ordinance, time limited spaces and electronic parking software. The downtown parking study will inform recommendations on this action item. Recommendations will be pursued late spring/early summer of 2016.
Working with the part-time Downtown Parking Officer, consider additional part-time staffing and other creative programs that could supplement enforcement. Again, this will be informed by the downtown parking study.
Evaluate the possibility of additional overnight parking locations, including the upper level
of the parking deck, and changes to the overnight parking system that will improve resident perception of the overnight parking policies. New locations were added in 2015 (18); however, additional locations will be considered as a part of the downtown parking study.
Explore the viability of a Downtown parking kiosk to aid in issuing permits to overnight guests of Downtown residents, temporary overnight passes and those needing to park overnight unexpectedly. Staff has met with representatives of various kiosk companies to learn more about this technology and how it might be applied in downtown Holland. Staff is looking into installing such kiosk at the downtown parking deck ($13,000).
Continue to focus on Downtown Parking Strategic Plan (DPSP) education programs for
Downtown employees, business owners and customers. Staff created new brochures to highlight the importance of appropriate employee parking, became authorized to enforce parking ordinances in downtown and made additional in-person outreach efforts to educate employees and residents.
Coordinate with the Streets and Transportation Department to develop a thorough maintenance and improvement plan for the Downtown parking lots and parking deck. Improvements to the downtown parking deck are expected this spring with larger parking lot projects being considered as a part of a larger downtown streetscape/infrastructure improvement effort.
Enforcement costs budgeted in technology and personnel services ($30,000 for enforcement technology and $6,000 for personnel)
-241-

COMMUNITY & NEIGHBORHOOD SERVICES
DOWNTOWN PARKING FUND
FY-14 FY-15 FY-16 FY-17
Actual Actual Projected Projected
Overnight Parking Permits Issued
Lots
Number 150 135 115 150
Revenue $12,060 $10,420 $10,000 $15,000
Deck
Number 19 10 0 0
Revenue $5,030 $3,600 $0 $0
Public Off-Street Parking Supply Downtown
Lots 17 17 18 18
Spaces 1,011 1,011 1,105 1,105
Deck Spaces 256 256 256 456
Spaces Available 24/7 10 10 0 0
PERFORMANCE MEASURES
Work
load
-242-

FY-2014 FY-2015 FY-2016 FY-2017
Final Final Final Adopted
Description Actual Actual Revised Est. Budget
FUNDING SOURCES -
Taxes & Special Assessments 188,183$ 193,846$ 199,510$ 226,000$
Charges for Services 15,910 14,270 13,850 18,850
Interest & Rents 7,026 5,395 1,800 1,800
Other - 0 - - 0 - - 0 - - 0 -
Transfers In - 0 - - 0 - - 0 - - 0 -
TOTAL SOURCES 211,119$ 213,511$ 215,160$ 246,650$
FUNDING USES -
Personnel Services -
* Salaries & Wages - Working 63,118$ 52,687$ 69,625$ 69,399$
* Benefits - Incl. NonWorking Wages 4,194 4,322 4,719 5,243
* Mandatory Employer Costs 5,686 4,771.00 6,725.00 6,522.00
Other Current Expenditures
* Supplies / Maintenance 46,020 37,271 48,500 47,350
* Contractual 5,032 1,943 6,500 5,500
* Other 61,375 56,414 154,699 102,475
Capital Outlay - 0 - - 0 - - 0 - - 0 -
Transfers Out 8,550 8,900 9,345 - 0 -
Contingencies - 0 - - 0 - - 0 - - 0 -
TOTAL USES 193,975$ 166,308$ 300,113$ 236,489$
INCREASE (DECREASE) 17,144$ 47,203$ (84,953)$ 10,161$
ENDING BALANCE -
Designated / Reserved (Deck O&M) 30,000 30,000 30,000 30,000
Undesignated / Unreserved 172,949 220,152 135,199 145,360
TOTAL FUND EQUITY 202,949$ 250,152$ 165,199$ 175,360$
Personnel Services Total Amount 72,998$ 61,780$ 81,069$ 81,164$
Full-Time Positions 0.15 0.15 0.15 0.20
Part-Time Positions @ F.T.E. 0.85 0.90 0.85 0.85
-NOTE: The time of several positions listed under General Fund - Street O&M Dept "Staffing" is charged to this fund.
- - S T A F F I N G - -
COMMUNITY & NEIGHBORHOOD SERVICES
DOWNTOWN PUBLIC PARKING FUND
- - F U N D I N G S O U R C E S & U S E S - -
- - F U N D E Q U I T Y - -
-243-

COMMUNITY & NEIGHBORHOOD SERVICES DOWNTOWN DEVELOPMENT AUTHORITY FUND (COMPONENT UNIT FUND)
FUND MISSION STATEMENT To create and maintain a viable downtown area for the greater Holland community through effective organization, design, business recruitment and retention, new development, parking, traffic patterns and land use.
ACTION PLAN
Complete the Housing Target Market Analysis that was initiated in late fall/early winter of 2015. Using the results of the report, develop a Downtown housing strategy that will meet the housing needs and objectives identified by City staff and approved by the DDA Board. (Summer 2015) Housing TMA has been completed and data shared with area property owners and developers.
With the assistance of the City Parks and Recreation and Streets and Transportation Departments develop a comprehensive Streetscape Improvement Plan that will identify a structured program for on-going maintenance of Downtown streetscape, opportunities for streetscape expansion and new amenities. This plan will identify any substantial costs that may be associated with new or significant changes to streetscape, snowmelt, or other infrastructure that might seek possible inclusion in a TIF or other larger funding effort. (Fall 2015) Inventory of necessary maintenance has been completed. Estimated costs and financing methods are currently under review. Annual maintenance is estimated at $45,000 up from $25,000 in previous years.
Develop a plan for expanding upon the successful Downtown holiday décor plan to include
new and exciting lighting elements. This plan will also identify other possible community partners. New holiday lights and garland were added in the winter of 2015. Additional concepts for expanding the lighting program are currently being explored with outside holiday lighting firms for the winter of 2016. $10,000
Work with the Board, Strategic Planning Committee, and Streetscape Infrastructure Group
and any new committees to develop and implement projects and programming that support the Downtown strategic plan. Several initiatives from the plan have started including working on key development projects in the western end of Downtown Holland, downtown parking study, 6th Street visioning, etc. (Summer/Fall 2016)
Working with the 6th Street neighborhood and a hired consultant support the established vision for this corridor of downtown by developing streetscape amenity standards and creating a plan for updating streetscape. (Spring/Summer of 2016) $5,000
Review ordinances for the C-3 zoning district related to signage, awnings and outdoor cafes and offer recommendations for updating these ordinances to ensure that they not only meet the character of downtown Holland but are not barriers to development. (Spring 2016)
-244-

COMMUNITY & NEIGHBORHOOD SERVICES
DOWNTOWN DEVELOPMENT AUTHORITY
FY-14 FY-15 FY-16 FY-17
Actual Actual Projected Projected
Building Improvement Expenditures $3,600,000 $17,205,000 $3,000,000 $4,000,000
Net New Downtown Businesses Recruited 10 8 10 8
Street Performer Permits 214 195 180 180
Number of businesses Downtown 183 185 186 189
Square Footage Total * 1,248,667 1,248,667 1,318,667 1,334,667
Square Footage Use:
Office 383,427 383,427 383,427 383,427
Retail 802,783 802,783 802,783 818,783
Vacant / Storage / Other / Hotel 62,457 62,457 122,457 122,457
(FY10 & FY11 reflect entire SF of district; beginning with FY12, SF will
reflect commercial uses only.)
Amenities:
Public Benches (Victor Stanley & Porter) 36 36 40 45
Private Benches 25 25 25 25
Trash Cans 53 53 53 56
Trees total in tree management district 196 186 191 200
Trees replaced 0 0 4 9
Bike Racks 10 10 10 13
Bikes Accommodated 76 76 76 84
* Square footage reflects the C-3 district.
PERFORMANCE MEASURES
Work
load
-245-

FY-2014 FY-2015 FY-2016 FY-2017
Final Final Final Adopted
Description Actual Actual Revised Est. Budget
FUNDING SOURCES -
Taxes & Special Assessments 181,019$ 182,381$ 190,535$ 190,800$
Licenses & Permits - 0 - - 0 - 2,400 2,700
Intergovernmental - 0 - - 0 - - 0 - - 0 -
Charges for Services 3,685 4,050 2,500 2,000
Interest & Rents 1,832 1,740 2,000 1,500
Other - 0 - 690 1,722 - 0 -
Transfers In - 0 - - 0 - - 0 - - 0 -
TOTAL SOURCES 186,536$ 188,861$ 199,157$ 197,000$
FUNDING USES -
Personnel Services -
* Salaries & Wages - Working 61,198$ 56,769$ 65,025$ 70,268$
* Benefits - To Include NonWorking Wages 10,170 11,560 11,930 16,606
* Mandatory Employer Costs 5,310 4,924 5,600 6,186
Other Current Expenditures -
* Supplies / Maintenance 35,226 47,331 75,150 78,100
* Contractual 2,958 3,448 9,200 7,700
* Other 31,307 36,384 80,580 49,975
Capital Outlay 49 - 0 - - 0 - - 0 -
Transfers Out - 0 - 14,652 - 0 - 55,000
TOTAL USES 146,218$ 175,068$ 247,485$ 283,835$
INCREASE (DECREASE) 40,318$ 13,793$ (48,328)$ (86,835)$
ENDING BALANCE -
Designated / Reserved - 0 - - 0 - - 0 - - 0 -
Undesignated / Unreserved 172,348 186,141 137,813 50,978
TOTAL FUND EQUITY 172,348$ 186,141$ 137,813$ 50,978$
Personnel Services Total Amount 76,678$ 73,253$ 82,555$ 93,060$
Full-Time Positions 0.48 0.48 0.45 0.65
Part-Time Positions @ F.T.E. 0.60 0.65 0.65 0.65
- - S T A F F I N G - -
COMMUNITY & NEIGHBORHOOD SERVICES
DOWNTOWN DEVELOPMENT AUTHORITY FUND
- - F U N D I N G S O U R C E S & U S E S - -
- - F U N D E Q U I T Y - -
-246-

COMMUNITY & NEIGHBORHOOD SERVICES PRINCIPAL SHOPPING DISTRICT FUND
DEPARTMENT MISSION STATEMENT
To increase the awareness and overall appeal of Downtown Holland locally, regionally, and nationally to benefit Principal Shopping District (PSD) members.
ACTION PLAN
Create a new and comprehensive sponsorship program for all existing and new events that will offset expenses for Downtown events allowing PSD revenue for new activities and promotions. To be completed spring of 2016.
Work with the Board, Strategic Planning Committee and any new committees to develop
and implement projects and programming that support the Downtown strategic plan update. The PSD is working with downtown merchants to update all events, create new events and develop new marketing to promote downtown. This was identified as a key goal in the downtown strategic plan.
Evaluate the Downtown PSD Assessment policies to ensure that the existing rates and
policies are equitable to all property owners and, specifically, review policies concerning sidewalk cafes and other retail/restaurant space not currently being assessed Assessment rates have not been changed largely due to timing of significant road work throughout downtown in 2015 and upcoming in 2016.
Implement a Community Partnership Program, Friends of Downtown Holland, which will be
mutually beneficial to Downtown Holland and participating community partners. Revenue generated from this program will support existing Downtown events and programming and new activities. This program has been approved by the PSD Board and a plan for rollout is in the works.
Complete the PSD Strategic Plan and develop work plan to support the goals and priorities that are developed through this process. Spring 2016
Create signage and communication for stakeholders and the public that will provide a positive experience for each during the 9th Street construction. Spring 2016
Develop new spring art event which will support the downtown Holland image and bring people to downtown to enjoy artistic expression as well as bring people into retail stores – spring 2017. ($10,000)
-247-

COMMUNITY & NEIGHBORHOOD SERVICES
PRINCIPAL SHOPPING DISTRICT
FY-14 FY-15 FY-16 FY-17
Actual Actual Projected Projected
Additional Revenue Sources
Associate Membership 2 3 3 3
Corporate Sponsorship 10 8 8 10
Grants Awarded * 1 1 1 1
Revenue-Generating Events & Programs * 4 4 2 3
Marketing & Promotion Initiatives
Calendar of Events 3 3 3 4
Downtown Holland Magazine Spreads * 3 3 3 3
Downtown Holland Map & Directories 8 8 8 8
Social Media Accounts * 16 12 12 15
Event Posters * 13 16 16 17
Installation of Seasonal Décor 1 1 1 1
Press Releases * 75 0 0 0
Restaurant Guide 1 1 1 1
Visiting Groups Coupon Booklet 1 1 1 1
Events Organized 16 16 15 16
Business Advocacy
D-Coffee 6 6 6 6
Member Newsletters 12 12 12 12
Additional Workshops and Seminars * 1 1 0 1
*New program measurement added for FY14
Work
load
PERFORMANCE MEASURES
-248-

FY-2014 FY-2015 FY-2016 FY-2017
Final Final Final Adopted
Description Actual Actual Revised Est. Budget
FUNDING SOURCES -
Taxes & Special Assessments 179,733$ 178,993$ 178,580$ 180,000$
Charges for Services 115,694 103,039 64,734 107,500
Interest & Rents 1,620 890 200 500
Other 30,291 17,339 21,150 53,000
TOTAL SOURCES 327,338$ 300,261$ 264,664$ 341,000$
FUNDING USES -
Personnel Services -
* Salaries & Wages - Working 136,954$ 147,885$ 141,349$ 134,601$
* Benefits - Incl. NonWorking Wages 33,561 41,565 39,850 38,176
* Mandatory Employer Costs 11,480 12,770 12,475 12,236
Other Current Expenditures
* Supplies / Maintenance 7,169 7,108 9,500 3,400
* Contractual 15,926 15,530 18,793 15,500
* Other 135,687 149,346 143,306 109,950
Capital Outlay - 0 - - 0 - - 0 - - 0 -
Contingencies - 0 - - 0 - - 0 - - 0 -
TOTAL USES 340,777$ 374,204$ 365,273$ 313,863$
INCREASE (DECREASE) (13,439)$ (73,943)$ (100,609)$ 27,137$
ENDING BALANCE -
Designated / Reserved - 0 - - 0 - - 0 - - 0 -
Undesignated / Unreserved 190,877 116,934 16,325 43,462
TOTAL FUND EQUITY 190,877$ 116,934$ 16,325$ 43,462$
Personnel Services Total Amount 181,995$ 202,220$ 193,674$ 185,013$
Full-Time Positions 2.38 2.53 2.15 1.90
Part-Time Positions @ F.T.E. 1.40 1.35 1.35 1.35
‐ ‐ S T A F F I N G ‐ ‐
COMMUNITY & NEIGHBORHOOD SERVICES
DOWNTOWN PRINCIPAL SHOPPING DISTRICT FUND
- - F U N D I N G S O U R C E S & U S E S - -
- - F U N D E Q U I T Y - -
-249-

COMMUNITY & NEIGHBORHOOD SERVICES DANGEROUS STRUCTURE FUND
FUND MISSION STATEMENT To proceed with the repair or demolition of dangerous structures in an efficient manner as one of many methods employed to protect the health, safety, and welfare of occupants, neighbors, and the general public.
ACTION PLAN Respond per state statute.
-250-

COMMUNITY & NEIGHBORHOOD SERVICES
DANGEROUS STRUCTURES
FY-14 FY-15 FY-16 FY-17
Actual Actual Projected Projected
Number of Dangerous Structures Public Hearings 2 1 6 0
Number of Housing Board of Appeals Public Hearings 1 0 6 0
Number Repaired by the Owner 2 0 1 0
Number Repaired by the City 0 1 5 0
City Cost of Repairs/Demolition $1,707 $2,334 $65,500 $10,000
Number of Vacant Properties 2 0 0 0
Non-Rental Properties 2 0 0 0
Residential 2 0 0 0
PERFORMANCE MEASURES
Work
load
-251-

FY-2014 FY-2015 FY-2016 FY-2017
Final Final Final Adopted
Description Actual Actual Revised Est. Budget
FUNDING SOURCES -
Charges for Services - 0 -$ - 0 -$ 67,900$ 11,800$
Interest & Rents - 0 - - 0 - - 0 - - 0 -
Transfers In 1,707 4,260 400 1,000
TOTAL SOURCES 1,707$ 4,260$ 68,300$ 12,800$
FUNDING USES -
Other Current Expenses -
* Supplies / Maintenance 135$ 361$ 200$ 200$
* Contractual 794 1,565 2,600 2,600
* Other 778 2,334 65,500 10,000
Contingencies - 0 - - 0 - - 0 - - 0 -
TOTAL USES 1,707$ 4,260$ 68,300$ 12,800$
INCREASE (DECREASE) - 0 -$ - 0 -$ - 0 -$ - 0 -$
ENDING BALANCE -
Designated / Reserved - 0 - - 0 - - 0 - - 0 -
Undesignated / Unreserved - 0 - - 0 - - 0 - - 0 -
TOTAL FUND EQUITY - 0 -$ - 0 -$ - 0 -$ - 0 -$
Positions: Not Applicable
COMMUNITY & NEIGHBORHOOD SERVICES
DANGEROUS STRUCTURES FUND
- - F U N D I N G S O U R C E S & U S E S - -
- - F U N D E Q U I T Y - -
- - S T A F F I N G - -
-252-

COMMUNITY & NEIGHBORHOOD SERVICES SOLID WASTE RECYCLING FUND
FUND MISSION STATEMENT To provide methods, programs, education, and resources to allow for the cost efficient and environmentally responsible disposal of solid waste for all city residents and businesses.
ACTION PLAN
Create and implement a new administrative plan given the current leadership retirement.
(No budget Impact)
Create a monthly reporting process that highlights certain performance metrics to better measure work output and better allocate limited resources as it relates to our Solid Waste and Recycling Program. (No budget Impact)
-253-

COMMUNITY & NEIGHBORHOOD SERVICES
SOLID WASTE / RECYCLING
FY-14 FY-15 FY-16 FY-17
Actual Actual Projected Projected
PROJECT PRIDE
Est. Pnds trash collected through coupons redeemed 441,340 865,860 875,000 890,000
Coupons redeemed 1,134 1,300 1,320 1,350
RECYCLABLE MATERIALS
Tons of recyclable materials not sent to landfill* 1,238 1,275 1,300 1,300
CURB SIDE RECYCLING
Type of Waste Recycles - In Pounds
Total Fiber 2,810,210 2,504,316 2,685,699 2,766,270
Newsprint 1,880,560 1,596,956 1,712,619 1,763,997
Corrugated 945,100 907,361 973,080 1,002,272
Total Commingle 1,354,036 719,023 602,166 741,179
Dairy plastic / #1 & #2 Colored 498,440 372,562 212,475 218,850
Aluminum 17,090 13,181 4,335 4,465
Tin 198,031 1,288,671 84,675 87,215
Glass 641,000 544,413 300,681 309,702
Total Pounds Collected Curbside 4,164,246 3,223,339 3,287,865 3,507,449
REFUSE
1 Bag/month 201 194 195 197
2 Bag/month 126 122 120 121
32 Gallon weekly 2,696 2,618 2,673 2,680
65 Gallon weekly 3,297 3,271 3,300 3,315
90 Gallon weekly 2,434 2,497 2,655 2,650
Subtotal Recycle 8,754 8,702 8,943 8,963
Multi Family - 2 Yard 5 6 6 7
Multi Family - 4 Yard 1 0 0 1
Multi Family - 6 Yard 1 1 1 1
Subtotal Multi-Family 7 7 7 9
Multi Family - 4 Units 3 3 3 3
Multi Family - 8 Units 3 3 3 3
Multi Family - 16 Units 1 1 1 1
Subtotal Multi-Family 7 7 7 7
* This number is reported directly to Finance
PERFORMANCE MEASURES
Work
load
-254-

FY-2014 FY-2015 FY-2016 FY-2017
Final Final Final Adopted
Description Actual Actual Revised Est. Budget
FUNDING SOURCES -
Charges for Services 1,562,621$ 1,565,585$ 1,749,100$ 1,621,300$
Interest & Rents 2,238 1,039 1,500 1,000
Other 200 - 0 - - 0 - - 0 -
Transfers In - 0 - - 0 - - 0 - - 0 -
TOTAL SOURCES 1,565,059$ 1,566,624$ 1,750,600$ 1,622,300$
FUNDING USES -
Personal Services -
* Salaries & Wages - Working 61,067$ 65,507$ 68,245$ 70,043$
* Benefits - Incl. NonWorking Wages 45,036 32,341 24,616 16,807
* Mandatory Employer Costs 4,517 4,733 5,675 5,787
Other Current Expenses -
* Supplies / Maintenance 43,803 64,799 69,645 75,600
* Contractual 1,275,246 1,493,485 1,329,370 1,356,600
* Other (121) (2,813) 1,684 1,260
Capital Outlay - 0 - - 0 - - 0 - - 0 -
TOTAL USES 1,429,548$ 1,658,052$ 1,499,235$ 1,526,097$
INCREASE (DECREASE) 135,511$ (91,428)$ 251,365$ 96,203$
ENDING BALANCE -
Designated / Reserved - 0 - - 0 - - 0 - - 0 -
Undesignated / Unreserved 541,377 449,949 701,314 797,517
TOTAL FUND EQUITY 541,377$ 449,949$ 701,314$ 797,517$
INCREASE (DECREASE) 135,511$ (91,428)$ 251,365$ 96,203$
ENDING BALANCE 541,377$ 449,949$ 701,314$ 797,517$
Personnel Services Total Amount 110,620$ 102,581$ 98,536$ 92,637$
Full-Time Positions 0.67 0.67 0.67 0.67
Part-Time Positions @ F.T.E. 0.70 0.70 0.70 0.70
- - F U N D E Q U I T Y - -
- - W O R K I N G C A P I T A L - -
- - S T A F F I N G - -
COMMUNITY & NEIGHBORHOOD SERVICES
SOLID WASTE RECYCLING FUND
- - F U N D I N G S O U R C E S & U S E S - -
-255-

COMMUNITY & NEIGHBORHOOD SERVICES BROWNFIELD REDEVELOPMENT AUTHORITY FUND
(COMPONENT UNIT FUND)
FUND MISSION STATEMENT
To provide a fund to receive Brownfield Redevelopment tax increment financing revenues and to distribute these revenues to the various Brownfield projects.
ACTION PLAN
To transfer Brownfield tax increment financing revenues as generated to eligible project capital costs.
To transfer Brownfield tax increment financing revenues as generated to pay-off the bond
for the Downtown Parking Deck project.
To facilitate process to consider approval of two new Brownfield project applications in FY17 (Washington School and 8th/9th Street redevelopment) as well as any other projects to be presented.
-256-

COMMUNITY & NEIGHBORHOOD SERVICES
BROWNFIELD REDEVELOPMENT AUTHORITY
FY-14 FY-15 FY-16 FY-17
Actual Actual Projected Projected
Number of Active Projects (Capturing Taxes) 10 10 9 9
Number of Active Projects (Not Capturing Taxes) 1 1 1 1
Total Number of Active Projects 11 11 10 10
Taxable Valuation Capture (IFT at Equivalency) $19,945,731 $19,945,731 $23,636,069 $30,098,350
PERFORMANCE MEASURES
Work
load
-257-

FY-2014 FY-2015 FY-2016 FY-2017
Final Final Final Adopted
Description Actual Actual Revised Est. Budget
FUNDING SOURCES -
Taxes & Special Assessments 784,821$ 869,094$ 970,593$ 1,273,958$
Intergovernmental - 0 - - 0 - 10,966 8,750
Interest & Rents 2,163 2,694 2,825 3,739
Transfers In 66,734 68,123 73,940 82,259
TOTAL SOURCES 853,718$ 939,911$ 1,058,324$ 1,368,706$
FUNDING USES -
Other Current Expenses -
* Contractual - 0 - - 0 - - 0 - - 0 -
* Other 487,026 569,249 595,934 876,505
Transfers Out 318,759 330,182 343,814 368,097
TOTAL USES 805,785$ 899,431$ 939,748$ 1,244,602$
INCREASE (DECREASE) 47,933$ 40,480$ 118,576$ 124,104$
ENDING BALANCE -
Designated / Reserved - 0 - - 0 - - 0 - - 0 -
Undesignated / Unreserved 96,435 136,915 255,491 379,595
TOTAL FUND EQUITY 96,435$ 136,915$ 255,491$ 379,595$
Positions: Not Applicable
COMMUNITY & NEIGHBORHOOD SERICES
BROWNFIELD REDEVELOPMENT AUTHORITY FUND
- - F U N D I N G S O U R C E S & U S E S - -
- - F U N D E Q U I T Y - -
- - S T A F F I N G - -
-258-

PARKS & RECREATION INTRODUCTION
GROUP MISSION STATEMENT The Parks & Recreation Group has responsibility for the coordination and quality of all recreational and cultural opportunities for City residents, and for the maintenance of all associated public facilities. The overall objective is to provide safe, functional and beautiful facilities for the pursuit of leisure time activities, and to continue the development of such facilities for the presentation of the natural beauty of the City and the enjoyment of all age groups.
GROUP ORGANIZATIONAL STRUCTURE
-259-

PARKS & RECREATION
$-
$300,000
$600,000
$900,000
$1,200,000
$1,500,000
$1,800,000
$2,100,000
Use
s D
oll
ars
Total Uses by Department $7,939,109
Other3.9%
Taxes16.2% Governmental
1.0%
Charges for Services19.4%
Interest & Rents2.2%
Transf from Other Funds18.4%
General Revenues38.9%
Funding Sources
Working Wages26.7%
Benefits & NonWorking Wages6.7%
Mandatory Employer Costs2.7%
Other12.5%Library Tax Pass-Thru
15.8%
Capital Outlay15.2%
Transfers to Other Funds1.7%
Contractual8.0%
Depreciation3.1%
Suppl/Maint.7.6% Funding Uses
-260-

FY-2014 FY-2015 FY-2016 FY-2017
Final Final Final Adopted
Description Actual Actual Revised Est. Budget
FUND TYPES -
General 3,239,816$ 3,745,481$ 3,765,469$ 3,848,683$
Permanent 21,072 11,485 11,000 31,000
Special Revenue 1,247,634 1,251,468 1,300,471 1,253,100
Enterprise 1,502,295 895,748 898,137 2,034,055
Component Unit 926,425 918,084 668,973 772,271
TOTAL - ALL FUND TYPES 6,937,242$ 6,822,266$ 6,644,050$ 7,939,109$
FUNDING SOURCES -
Taxes & Special Assessments 1,247,366$ 1,251,454$ 1,305,974$ 1,253,100$
Intergovernmental 50,000 100,000 50,000 80,000
Charges for Services 1,234,884 1,445,787 1,248,595 1,494,980
Interest & Rents 276,071 173,559 163,249 172,569
Other 261,015 358,876 348,894 299,656
Transfers In 811,042 439,323 333,066 1,418,000
TOTAL SOURCES 3,880,377$ 3,768,999$ 3,449,778$ 4,718,305$
FUNDING USES -
Personnel Services - 341
* Salaries & Wages - Working 1,856,696$ 2,004,159$ 2,036,348$ 2,124,293$
* Benefits - Incl. NonWorking Wages 456,516 490,682 532,775 530,906
* Mandatory Employer Costs 198,561 191,172 202,707 216,667
Other Current Expenditures -
* Supplies / Maintenance 579,504 632,977 630,920 601,550
* Contractual 399,680 465,825 575,269 638,050
* Other 2,335,807 2,412,393 2,262,516 2,243,858
Capital Outlay 743,369 111,795 70,242 1,210,500
Depreciation Expense 248,361 252,178 233,273 242,285
Transfers Out 118,747 261,085 100,000 131,000
TOTAL USES 6,937,242$ 6,822,266$ 6,644,050$ 7,939,109$
Personnel Services Total Amount 2,511,773$ 2,686,013$ 2,771,830$ 2,871,866$
* Full-Time Positions 25.90 23.90 25.30 26.30
* Part-Time Positions @ F.T.E. 31.71 34.73 35.93 34.78
PARKS & RECREATION
SUMMARY OF DEPTS, FUNCTIONS & RELATED FUNDS
- - G R O U P S T A F F I N G T O T A L S - -
- - G R O U P F U N D I N G U S E S A C R O S S F U N D S - -
- - G R O U P F U N D I N G S O U R C E S & U S E S T O T A L S - -
-261-

PARKS & RECREATION RECREATION/CIVIC CENTER
MISSION STATEMENT
Provide diverse and coordinated recreational, cultural and leisure time activities which appeal to and are enjoyed by citizens of all ages and interests; assure outdoor recreation facilities are properly and adequately supervised and maintained in good working condition; and provide an indoor facility which accommodates the residents of Holland for recreational and leisure time activities and special community events, along with a traditional outdoor market and special event venue that is a focal point for the central City area for the enjoyment of all.
ACTION PLAN
Increase sponsorship opportunities for the Holland Recreation programs and events. Develop a form to market to companies that clearly shows all opportunities for sponsorships. Goal of $15,000 total. (Targeted Completion date of August 2016)
Continue to work towards a world-class, 3-gym Recreation Facility and have a plan in place
for operation, fundraising, etc. (Targeted Completion date of June 2017)
Evaluate and determine the needs of the existing sports complexes that Recreation actively uses for its programs, (Matt Urban Sports Complex, Maplewood Youth Complex, Moran Park, Holland Heights Park, Smallenburg Park, Rosa Parks Green, Riverview Park, Window- on-the-Waterfront). Update equipment, regrade fields, make safety recommendations, etc. (Targeted Completion date of May 2017)
Develop a plan for Lakeview School Park. Work with Laketown Township officials to evaluate collaboration of this park. $5,000 in the Municipal Capital Improvement Fund (MCIF) to plan on a potential 50/50 cost basis with Lakeview Township. (Targeted Completion date of December 2016)
Continue to work with the Convention of Visitors Bureau (CVB) to bring sporting events to Holland. (Targeted Completion date of June 2017)
Determine where the Recreation offices will operate out of when Civic Center is under construction. Increase the use of online registration for programs to help this process.
Add a full-time Recreation program person is in the budget ($27,000). (To go into effect July 2016)
Evaluate staffing and operations of the Civic Center and Recreation Department. Plan for future operations of the Civic Center Place (staffing vs. contractual cleaning, Events Coordinator for Civic Center rentals and Recreation events). (Targeted Completion date of February 2017)
Research a ski club collaboration and/or one new program per year (like Lacrosse was last year) and evaluate if any programs need to be phased out. (Targeted Completion date of December 2016)
-262-

PARKS & RECREATION PARKS & CEMETERIES
DEPARTMENT MISSION STATEMENT
Enhance the community by providing outstanding services and safe, functional, beautiful parks and cemeteries facilities as efficiently as possible; continue development of facilities for the preservation of the natural beauty of the City and the enjoyment of all age groups; and pursue excellence in all areas of facilities and services.
ACTION PLAN
Continue to remove ash trees. Forestry staff will remain ramped up for the upcoming fiscal year. (Additional part time staff will again be hired for this effort) ($30,000) Ash tree removal is nearing completion along rights of way. Continuing in Parks and other City properties. PTB employee ramp up will be winding down in November 2016.
Collaborate with Hope College, Macatawa Area Coordinating Council, and Grand Valley
State University on a city wide tree inventory. Possible grants and other assistance will be explored. (The total cost for inventory could be $100-$125,000) Received grant for planting trees ($100,000), hoping to use City tree funds plus granting to accomplish inventory by fall 2016. Realistic number will be $30-$40,000.
Complete an updated inventory of assets at each of our park properties. This will include items such as signage, hard scape, and amenities. Out of date items will be removed. Underway. Completion date of June 2016.
Purchase and install new outdoor columbarium niche units, for Pilgrim Home. (Cost for these units would be close to $15,000 each) Units are currently being prepared for bidding. Completion date of summer 2016.
Implement the newly developed strategic plan for the Parks and Recreation Department. Continue to pursue ways to cross train employees between our department and the Transportation Department. Plan is currently being implemented.
Continue repairs to Van Raalte Farm. Items in need of attention include the lighting on the 24th Street side, the barns need to be cleaned out, and the garage needs painting. Some signage needs updating as well. (Repairs needed would be approximately $100,000) Lighting and barns completed. Interior of house being painted currently. Other projects will continue throughout the summer with a completion date June 2016.
Begin to study Lakeview School Park, and investigate fully what is needed there, and
avenues to finance it; grants, etc. Staff met with Laketown Township Manager to begin this process. Plans will continue to develop with hopes to apply for the next granting cycle in 2017.
Continue to work with the newly put together Water Trails Team, to find ways to allow
people of all abilities to have access to Lake Macatawa, through the installation of kayak launches.
-263-

PARKS & RECREATION PARKS & CEMETERIES
Engaging with Ottawa County Parks Dept. and the LIAA to create a water trail system throughout the Greenway. Seeking funding for a kayak launch at Kollen Park (ADA accessible).
Continue to fundraise and seek out grants for improvements to the entrance of the DeGraaf Nature Center. (Total estimates are nearly $300,000 for total project. Many donations have already been received, and more to hopefully come.) Applying for a Trust Fund Grant, April 1, 2016. $73,000 has been raised so far for this effort.
The Park Department will play a major role in hosting the national America In Bloom symposium. Efforts will be needed in the late summer of 2015 to insure that the city is prepared for the event. This may mean purchasing some plant material, and other landscaping items. Items to be included in FY16 budget. (Holland In Bloom, and many sponsors are funding this effort.) Symposium was held in September 2015. Very Successful.
Develop a plan for adding splash pads or other water features to parks in conjunction with
the study below ($10,000 in Municipal Capital Improvement Fund). Completion date of July 2017.
Continue to investigate locations for a new World Class, 3-gym Recreation Center. Funding options, programming, and size will also be studied. Completion date of July 2017.
Create and install new directional signage throughout the cemeteries (Perpetual Care funds available, $5,000). Completion date of November 2016.
Research, consider alternatives, and maximize cemetery rates to have a completion date of December 2016.
Plant an impactful urban tree corridor along 9th Street, due to the construction planned for 2016.
Work with the Schneider Energy Team to make sure we have a seamless construction season throughout our parks system, and ensure that staff is trained on how to operate all new equipment and lighting systems.
Develop detailed building plans for a new Greenhouse and begin construction at end of FY
17.
Complete the Myrtle Street end and Thomas street end ($5,000 in Municipal Capital Improvement Fund), by July 2017.
Supervise the start of construction for Windmill Island Gardens path and bridge starting with November bids.
-264-

PARKS & RECREATION SERVICES
CEMETERIES
FY-14 FY-15 FY-16 FY-17
Actual Actual Projected Projected
Lot Sales:
Pilgrim Home Cemetery 78 75 100 85
Graafschap Cemetery 17 26 35 29
Burials:
Pilgrim Home Cemetery - Annual
Graveside Services 106 121 120 120
Drop Services 66 81 60 70
Witness Services 11 2 0 0
183 204 180 190
Full Body Burial 137 160 120 145
Cremation Burial 46 44 60 45
183 204 180 190
% of Cremation Burial to Full Body Burial 33.58% 27.50% 50.00% 31.03%
Graafschap Cemetery - Annual
Graveside Services 26 37 50 43
Drop Services 13 22 20 21
Witness Services 4 0 0 0
43 59 70 64
Full Body Burial 37 42 50 47
Cremation Burial 6 17 20 17
43 59 70 64
% of Cremation Burial to Full Body Burial 16.22% 40.48% 40.00% 36.17%
Marker Foundation Installations:
Pilgrim Home Cemetery 130 150 150 140
Graafschap Cemetery 40 55 45 40
Niche Sales
Pilgrim Home Cemetery 3 0 4 2
Work
load
PERFORMANCE MEASURES
-265-

FY-2014 FY-2015 FY-2016 FY-2017
Final Final Final Adopted
Description Actual Actual Revised Est. Budget
FUNDING SOURCES -
Charges for Services 198,808$ 240,392$ 224,600$ 221,600$
Interest & Rents - 0 - - 0 - - 0 - - 0 -
Transfers In 13,582 11,085 11,000 11,000
General Fund Operating Revenues 253,282 197,274 230,623 259,532
TOTAL SOURCES 465,672$ 448,751$ 466,223$ 492,132$
FUNDING USES -
Personnel Services -
* Salaries & Wages - Working 162,895$ 162,870$ 172,225$ 178,450$
* Benefits - Incl. NonWorking Wages 71,873 51,083 57,910 59,611
* Mandatory Employer Costs 17,424 15,914 17,500 18,656
Other Current Expenditures -
* Supplies / Maintenance 43,278 45,512 50,450 52,450
* Contractual 52,595 57,976 60,200 67,200
* Other 117,607 109,956 102,696 110,265
Capital Outlay - 0 - 5,440 5,242 5,500
TOTAL USES 465,672$ 448,751$ 466,223$ 492,132$
Personnel Services Total Amount 252,192$ 229,867$ 247,635$ 256,717$
Full-Time Positions 2.35 2.35 2.35 2.35
Part-Time Positions @ F.T.E. 2.30 2.65 3.05 3.05
- - S T A F F I N G - -
- - F U N D I N G S O U R C E S & U S E S - -
PARKS & RECREATION
GENERAL FUND - CEMETERIES
-266-

FY-2014 FY-2015 FY-2016 FY-2017
Final Final Final Adopted
Description Actual Actual Revised Est. Budget
FUNDING SOURCES -
No Funding Sources - 0 -$ - 0 -$ - 0 -$ - 0 -$
General Fund Operating Revenues 59,901 52,367 58,093 59,174
TOTAL SOURCES 59,901$ 52,367$ 58,093$ 59,174$
FUNDING USES -
Personnel Services -
* Salaries & Wages - Working 37,639$ 31,906$ 34,850$ 35,450$
* Benefits - Incl. NonWorking Wages 15,361 12,103 15,065 15,507
* Mandatory Employer Costs 3,495 2,858 3,228 3,417
Other Current Expenditures -
* Supplies / Maintenance 914 1,707 2,050 2,100
* Other 2,491 3,793 2,900 2,700
Capital Outlay - 0 - - 0 - - 0 - - 0 -
TOTAL USES 59,901$ 52,367$ 58,093$ 59,174$
Personnel Services Total Amount 56,496$ 46,867$ 53,143$ 54,374$
Full-Time Positions 0.70 0.50 0.50 0.50
Part-Time Positions @ F.T.E. - 0 - - 0 - - 0 - - 0 -
- - S T A F F I N G - -
- - F U N D I N G S O U R C E S & U S E S - -
PARKS & RECREATION
GENERAL FUND - PARKS & RECREATION ADMINISTRATION
-267-

PARKS & RECREATION SERVICES
RECREATION
FY-14 FY-15 FY-16 FY-17
Actual Actual Projected Projected
Youth Athletic Programs 2,766 3,262 3,500 4,000
Adult Athletic Programs 5,486 5,902 6,500 6,800
Family Special Events 10,370 10,568 10,700 11,000
Non-Athletic Youth Programs 2,084 1,980 2,125 2,125
Bouws Pool Attendance 11,068 17,000 17,000 17,000
PERFORMANCE MEASURES
Work
load
-268-

FY-2014 FY-2015 FY-2016 FY-2017
Final Final Final Adopted
Description Actual Actual Revised Est. Budget
FUNDING SOURCES -
Charges for Services 284,466$ 321,221$ 310,885$ 348,800$
Interest & Rents 16,367 13,923 14,000 15,000
Other 1,074 922 750 2,000
General Fund Operating Revenues 501,783 551,549 611,942 607,310
TOTAL SOURCES 803,690$ 887,615$ 937,577$ 973,110$
FUNDING USES -
Personnel Services
* Salaries & Wages - Working 308,562$ 356,948$ 322,508$ 345,185$
* Benefits - Incl. NonWorking Wages 81,124 82,560 82,625 98,413
* Mandatory Employer Costs 30,203 33,081 31,274 34,621
Other Current Expenditures
* Supplies / Maintenance 124,895 121,836 142,200 137,900
* Contractual 122,411 153,687 200,281 202,400
* Other 136,495 139,503 158,689 154,591
Capital Outlay - 0 - - 0 - - 0 - - 0 -
TOTAL USES 803,690$ 887,615$ 937,577$ 973,110$
Personnel Services Total Amount 419,889$ 472,589$ 436,407$ 478,219$
Full-Time Positions 3.45 3.50 3.50 4.50
Part-Time Positions @ F.T.E. 1.20 1.20 1.20 1.10
- - S T A F F I N G - -
- - F U N D I N G S O U R C E S & U S E S - -
PARKS & RECREATION
GENERAL FUND - RECREATION
-269-

PARKS & RECREATION SERVICES
PARKS
FY-14 FY-15 FY-16 FY-17
Actual Actual Projected Projected
Forestry Activities
Trees Planted 148 119 375 500
Trees Trimmed 889 860 1,006 1,000
Trees Removed 592 602 368 250
Stump Removal 433 551 304 200
Tulip Beds & Lanes - Annual Tulip Plantings 297,500 298,500 306,500 305,000
Greenhouse Plantings (Greenhouse is Currently at Capacity.) 100,000 100,000 100,000 100,000
Total Area Maintained by Park Personnel 402.35 acres 402.35 acres 385 acres 385 acres
Number of Events in Park Facilities: 70 97 93 95
PERFORMANCE MEASURES
Work
load
-270-

FY-2014 FY-2015 FY-2016 FY-2017
Final Final Final Adopted
Description Actual Actual Revised Est. Budget
FUNDING SOURCES -
Charges for Services 28,779$ 31,180$ 29,000$ 29,000$
Interest & Rents 8,416 13,491 7,700 7,600
General Fund Operating Revenues 1,283,854 1,529,645 1,617,016 1,649,664
TOTAL SOURCES 1,321,050$ 1,574,316$ 1,653,716$ 1,686,264$
FUNDING USES -
Personnel Services
* Salaries & Wages - Working 499,016$ 575,124$ 645,750$ 715,700$
* Benefits - Incl. NonWorking Wages 131,747 175,300 204,850 211,137
* Mandatory Employer Costs 48,944 56,095 66,050 73,905
Other Current Expenditures
* Supplies / Maintenance 189,641 217,639 212,650 188,530
* Contractual 58,710 81,670 84,500 102,400
* Other 379,310 448,369 439,916 394,592
Capital Outlay 13,681 20,119 - 0 - - 0 -
TOTAL USES 1,321,050$ 1,574,316$ 1,653,716$ 1,686,264$
Personnel Services Total Amount 679,707$ 806,519$ 916,650$ 1,000,742$
Full-Time Positions 8.15 8.15 9.55 9.55
Part-Time Positions @ F.T.E. 11.70 14.15 14.50 14.20
ADDITIONAL INFORMATION REGARDING POSITIONS ABOVE:
- - S T A F F I N G - -
- - F U N D I N G S O U R C E S & U S E S - -
PARKS & RECREATION
GENERAL FUND - PARKS
Small portion of these positions are charged directly to the two Motor Vehicle Highway Funds in the 'Transportation
Group'.
-271-

PARKS & RECREATION DEGRAAF NATURE CENTER
ACTIVITY MISSION STATEMENT To provide nature, environmental, conservation and historical learning experiences in an outdoor classroom to supplement and enhance classroom teaching. To plan and implement a wide variety of classes, lectures, field trips, natural history tours and special events for the Holland community. To foster a greater appreciation of the natural world and our relationship to it, and to provide a place for people to relax and enjoy the beauty of nature.
ACTION PLAN
Begin construction of the new entry way and parking area in December of 2016. Grant funding and private fundraising are underway. A donor brick program has been successful to this point ($8,000 has been raised to this point), and will continue beyond the construction phase to help support ongoing maintenance at the Center.
Requesting new Ford Transit van. Vehicle will be used primarily by the Nature Center, but will be available as a general fleet vehicle. City Council trips and tours, staff conferences, etc. could use the van. Purchase is being handled through the Motor Pool.
We will be seeking additional hours for a current Part-time B employee and expand the number of weeks per year in our internship program to help us grow the educational programs and nature tours, both of which generate revenue for the center. Increase of $20,000 to annual budget.
-272-

PARKS & RECREATION SERVICES
DEGRAAF NATURE CENTER
FY-14 FY-15 FY-16 FY-17
Actual Actual Projected Projected
ATTENDANCE
Summer Recreation Department Classes 339 443 388* 400
School Classroom Programs 8,117 7,804 8,500 9,000
Public Program (Special Events, Classes, etc.) 5,569 5,047 5,500 6,000
After School Programs (Birthday Parties, Scouts, etc.) 200 300 325 350
Natural History Tour Participants 40 51 50 55
Outside Groups Utilizing the Nature Center 350 350 350 350
*Expanding summer one day classes offered outside of the
recreation programs to accommodate summer cottagers.
PERFORMANCE MEASURES
Work
load
-273-

FY-2014 FY-2015 FY-2016 FY-2017
Final Final Final Adopted
Description Actual Actual Revised Est. Budget
FUNDING SOURCES -
Charges for Services 86,482$ 92,394$ 157,489$ 184,000$
Other 16,987 9,358 12,300 12,300
General Fund Operating Revenues 143,379 167,213 145,692 157,382
TOTAL SOURCES 246,849$ 268,965$ 315,481$ 353,682$
FUNDING USES -
Personnel Services
* Salaries & Wages - Working 130,739$ 137,409$ 140,365$ 148,000$
* Benefits - Incl. NonWorking Wages 38,447 38,052 40,660 42,007
* Mandatory Employer Costs 12,310 13,375 13,875 15,189
Other Current Expenditures
* Supplies / Maintenance 17,408 23,550 21,350 24,350
* Contractual 28,566 32,866 73,288 99,150
* Other 19,378 23,713 25,943 24,986
Capital Outlay - 0 - - 0 - - 0 - - 0 -
TOTAL USES 246,849$ 268,965$ 315,481$ 353,682$
Personnel Services Total Amount 181,496$ 188,836$ 194,900$ 205,196$
Full-Time Positions 1.95 1.95 1.95 1.95
Part-Time Positions @ F.T.E. 1.80 1.80 1.85 2.10
- - S T A F F I N G - -
- - F U N D I N G S O U R C E S & U S E S - -
PARKS & RECREATION
GENERAL FUND - DE GRAAF NATURE CENTER
-274-

FY-2014 FY-2015 FY-2016 FY-2017
Final Final Final Approved
Description Actual Actual Revised Est. Budget
FUNDING SOURCES -
No Funding Sources - 0 -$ - 0 -$ - 0 -$ - 0 -$
General Fund Operating Revenues 97,589 258,685 98,093 109,200
TOTAL SOURCES 97,589$ 258,685$ 98,093$ 109,200$
FUNDING USES -
Other Current Expenditures
* Contractual - 0 -$ - 0 -$ - 0 -$ - 0 -$
* Other 8,589 8,685 9,093 9,200
Transfers Out 89,000 250,000 89,000 100,000
TOTAL USES 97,589$ 258,685$ 98,093$ 109,200$
Positions: Not Applicable
- - S T A F F I N G - -
- - F U N D I N G S O U R C E S & U S E S - -
PARKS & RECREATION
CULTURAL ACTIVITIES ASSISTANCE
-275-

PARKS & RECREATION SERVICES
CIVIC CENTER
FY-14 FY-15 FY-16 FY-17
Actual Actual Projected Projected
Building Use
Entire Facility 287 327 325 325
Gymnasium Only 505 544 500 500
North Hall 32 10 45 45
PERFORMANCE MEASURES
Work
load
-276-

FY-2014 FY-2015 FY-2016 FY-2017
Final Final Final Adopted
Description Actual Actual Revised Est. Budget
FUNDING SOURCES -
Charges for Services 463$ 411$ 500$ 250$
Interest & Rents 55,406 42,054 38,000 10,000
General Fund Operating Revenues 189,197 212,317 197,786 164,871
TOTAL SOURCES 245,066$ 254,782$ 236,286$ 175,121$
FUNDING USES -
Personnel Services -
* Salaries & Wages - Working 98,171$ 104,236$ 99,550$ 77,450$
* Benefits - Incl. NonWorking Wages 34,731 44,127 38,826 29,672
* Mandatory Employer Costs 9,772 9,959 9,950 8,125
Other Current Expenditures -
* Supplies / Maintenance 44,794 38,336 41,239 31,400
* Contractual 1,474 2,920 2,900 1,500
* Other 56,125 55,204 43,821 26,974
Capital Outlay - 0 - - 0 - - 0 - - 0 -
TOTAL USES 245,066$ 254,782$ 236,286$ 175,121$
Personnel Services Total Amount 142,674$ 158,322$ 148,326$ 115,247$
Full-Time Positions 1.30 1.45 1.45 1.45
Part-Time Positions @ F.T.E. 1.85 2.10 1.80 0.80
- - S T A F F I N G - -
- - F U N D I N G S O U R C E S & U S E S - -
PARKS & RECREATION
GENERAL FUND - CIVIC CENTER
-277-

FY-2014 FY-2015 FY-2016 FY-2017
Final Final Final Adopted
Description Actual Actual Revised Est. Budget
FUNDING SOURCES -
Charges for Services 27,335$ 26,200$ 31,600$ 31,600$
Interest & Rents 13,582 11,085 11,000 11,000
Transfers In - 0 - - 0 - - 0 - - 0 -
TOTAL SOURCES 40,917$ 37,285$ 42,600$ 42,600$
FUNDING USES -
Other Current Expenditures
* Other - 0 -$ 400$ - 0 -$ - 0 -$
Transfers Out 21,072 11,085 11,000 31,000
TOTAL USES 21,072$ 11,485$ 11,000$ 31,000$
INCREASE (DECREASE) 19,845$ 25,800$ 31,600$ 11,600$
ENDING BALANCE -
Designated / Reserves 1,530,437$ 1,554,087$ 68,643$ 70,243$
Undesignated / Unreserved 64,893 67,043 1,584,087 1,594,087
TOTAL FUND EQUITY 1,595,330$ 1,621,130$ 1,652,730$ 1,664,330$
Positions: Not Applicable
- - S T A F F I N G - -
- - F U N D I N G S O U R C E S & U S E S - -
- - F U N D E Q U I T Y - -
PARKS & RECREATION
CEMETERY PERPETUAL CARE FUND
-278-

FY-2014 FY-2015 FY-2016 FY-2017
Final Final Final Adopted
Description Actual Actual Revised Est. Budget
FUNDING SOURCES -
Taxes 1,247,366$ 1,251,454$ 1,305,974$ 1,253,100$
TOTAL SOURCES 1,247,366$ 1,251,454$ 1,305,974$ 1,253,100$
FUNDING USES -
Other Current Expenditures -
* Other - Tax Payments to Library 1,247,634$ 1,251,468$ 1,300,471$ 1,253,100$
TOTAL USES 1,247,634$ 1,251,468$ 1,300,471$ 1,253,100$
INCREASE (DECREASE) (268)$ (14)$ 5,503$ - 0 -$
ENDING BALANCE -
Designated / Reserves - 0 - - 0 - - 0 - - 0 -
Undesignated / Unreserved 68 54 5,557 5,557
TOTAL FUND EQUITY 68$ 54$ 5,557$ 5,557$
Positions: Not Applicable
- - S T A F F I N G - -
- - F U N D I N G S O U R C E S & U S E S - -
- - F U N D E Q U I T Y - -
PARKS & RECREATION
HERRICK DISTRICT LIBRARY TAXATION FUND
-279-

PARKS & RECREATION WINDMILL ISLAND GARDENS
MISSION STATEMENT
To maintain a high quality tourist attraction, which reflects the Dutch heritage of the City of Holland. Windmill Island Gardens supports the Tulip Time Festival as well as the local tourism economy while connecting visitors and community members to the area’s authentic Dutch heritage and natural resources.
ACTION PLAN
Establish a more robust web presence for Windmill Island Gardens. (January 2017)
Monthly events and make self-sufficient and grow to contribute to the capital cost bottom line over time.
To grow programming on the Island including one or more new large events. (October 2016)
Complete the refurbishment of the Street Organ and Carousel (repainting, etc.) (April 2017)
Secure and accomplish an Interpretive Plan from Municipal Capital Improvement Fund.
$15,000.
Bid out a Landscape Plan and budget for accomplishment in FY 18.
Achieve active support by all of the units of government in the 107,000 population region.
Promote the Island as the center of natural recreation by virtue of its geographic location
and be viewed as equally welcoming to all from the region.
Ensure the Island bustles with monthly activities year-round that celebrate our culture, our environment, our history/heritage as per the Strategic Plan in a manner that breaks even or earns funds for reinvestment.
No longer rely on a subsidy by the General Fund (with the exception of another StemFest)
and otherwise contribute $100,000 per year to a Capital Reinvestment Fund for the Island as per the Business Plan.
Ensure DeZwaan turns for every major public event via a cadre of professional/volunteer
team members.
-280-

PARKS & RECREATION SERVICES
WINDMILL ISLAND GARDENS
FY-14 FY-15 FY-16 FY-17
Actual Actual Projected Projected
REGULAR PAID VISITORS
Total Number of Paid Visitors (Excluding Spec. Events) 65,659 78,256 75,000 77,000
Total Number of Bus Groups (Includes Student Groups) 175 175 175 175
Visitors during Tulip Time Dates Only 26,721 38,471 35,000 35,000
Percent of Visitors during Tulip Time 41% 49% 47% 45%
Friends of WIG Memberships Sold N/A 5 10 15
UNPAID VISITORS
Total Local Visitors, Free Admission during Opening Hours 11,378 10,334 10,500 11,000
Visitors Community Day (Rotates between Hope College & WIG) 200 1,729 200 2,000
WEDDING & FACILITY RENTAL
Number of Weddings 25 25 28 30
Number of Hosted Events 7 13 10 12
Number of Guest Visits to Windmill Island through Rentals 5,048 8,711 8,500 8,750
OTHER
Horticultural Volunteer Hours N/A 487 500 550
Run of the Mill: Total Registrants 250 150 100 150
PERFORMANCE MEASURES
Wo
rklo
ad
0
10000
20000
30000
40000
50000
60000
70000
80000
90000
1996 1997 1998 1999 2000 2001 2002 2003 2004 2005 2006 2007 2008 2009 2010 2011 2012 2013 2014 2015
Windmill Island Gardens Yearly Attendance
-281-

FY-2014 FY-2015 FY-2016 FY-2017
Final Final Final Adopted
Description Actual Actual Revised Est. Budget
FUNDING SOURCES -
Charges for Services 483,464$ 637,802$ 403,946$ 512,750$
Interest & Rents 80,330 68,780 80,814 90,000
Other 11,400 39,973 10,844 - 0 -
Transfers In - Specified Donations Fund 616,648 78,238 20,000 - 0 -
Transfers In - Capital Project Funds 29,066 - 0 - 40,000 1,197,000
Transfers In - General Fund 62,745 100,000 173,066 110,000
TOTAL SOURCES 1,283,653$ 924,793$ 728,670$ 1,909,750$
FUNDING USES -
Personnel Services:
* Salaries & Wages - Working 331,305$ 365,352$ 369,100$ 371,800$
* Benefits - Incl. NonWorking Wages 51,623 52,542 50,189 48,699
* Mandatory Employer Costs 31,520 34,010 34,530 35,706
Other Current Expenses:
* Supplies / Maintenance 99,860 101,466 102,831 88,950
* Contractual 51,940 45,896 63,000 63,400
* Other 87,734 90,384 93,337 93,350
Capital Outlay 729,688 86,236 65,000 1,202,000
Transfers Out 8,675 - 0 - - 0 - - 0 -
Depreciation Expense 109,767 119,862 120,000 130,000
TOTAL USES 1,502,112$ 895,748$ 897,987$ 2,033,905$
PARKS & RECREATION
WINDMILL ISLAND GARDENS FUND
- - F U N D I N G S O U R C E S & U S E S - -
( T h i s F u n d C o n t i n u e s O n N e x t P a g e )
-282-

FY-2014 FY-2015 FY-2016 FY-2017
Final Final Final Adopted
Description Actual Actual Revised Est. Budget
INCREASE (DECREASE) 511,229$ 115,281$ (104,317)$ 1,077,845$
ENDING BALANCE -
Designated / Reserved: - 0 - - 0 - - 0 - - 0 -
Undesignated / Unreserved: 2,018,178 2,133,459 2,029,142 3,106,987
UND EQUITY - END OF YEAR 2,018,178$ 2,133,459$ 2,029,142$ 3,106,987$
INCREASE (DECREASE) - 0 - 151,388$ (49,317)$ 8,836$
ENDING BALANCE - 0 -$ 151,388$ 102,071$ 110,907$
Personnel Services Total Amount 414,448$ 451,904$ 453,819$ 456,205$
Full-Time Positions 2.00 2.00 2.00 2.00
Part-Time Positions @ F.T.E. 11.10 11.40 11.70 11.70
..
PARKS & RECREATION
WINDMILL ISLAND GARDENS FUND
- - S T A F F I N G - -
- - W O R K I N G C A P I T A L - -
( T h i s F u n d C o n t i n u e s F r o m P r e v i o u s P a g e )
- - F U N D E Q U I T Y - -
-283-

FY-2014 FY-2015 FY-2016 FY-2017
Final Final Final Adopted
Description Actual Actual Revised Est. Budget
FUNDING SOURCES -
Charges for Services - 0 -$ 100$ 375$ 350$
Interest & Rents 4 3 5 5
TOTAL SOURCES 4$ 103$ 380$ 355$
FUNDING USES -
Other Current Expenditures -
* Supplies / Maintenance 182$ - 0 -$ 150$ 150$
* Other - 0 - - 0 - - 0 - - 0 -
TOTAL USES 182$ - 0 -$ 150$ 150$
INCREASE (DECREASE) (179)$ 103$ 230$ 205$
ENDING BALANCE -
Designated / Reserves - 0 - - 0 - - 0 - - 0 -
Undesignated / Unreserved 296 399 629 834
TOTAL FUND EQUITY 296$ 399$ 629$ 834$
INCREASE (DECREASE) (179)$ 103$ 230$ 205$
ENDING BALANCE 296$ 399$ 629$ 834$
Positions: Not Applicable
PARKS & RECREATION
PARK & CEMETERY EMPLOYEES BENEFIT FUND
- - S T A F F I N G - -
- - F U N D I N G S O U R C E S & U S E S - -
- - F U N D E Q U I T Y - -
- - W O R K I N G C A P I T A L - -
-284-

PARKS & RECREATION SERVICES
HOLLAND HISTORICAL TRUST
FY-14 FY-15 FY-16 FY-17
Actual Actual Projected Projected
Total Attendance at Museums 16,294 19,360 21,000 24,000
Rentals - All Sites 1,254 1,897 3,500 7,000
Education Tours Participation 1,270 834 1,500 2,000
Memberships 498 450 525 600
PERFORMANCE MEASURES
Work
load
-285-

FY-2014 FY-2015 FY-2016 FY-2017
Final Final Final Adopted
Description Actual Actual Revised Est. Budget
FUNDING SOURCES -
Intergovernmental 50,000$ 100,000$ 50,000$ 80,000$
Charges for Services 125,086 96,087 90,200 166,630
Rental Income:
* Armory 4,645 10,163 - 0 - 20,000
* Other Than Armory 3,224 6,950 1,500 8,000
Investment Income (Net of Market) 94,097 7,110 10,230 10,964
Other:
* Other Private Contributions 231,554 295,751 325,000 285,356
* Gain on Sale of Property - 0 - 12,872 - 0 - - 0 -
Transfers In - City of Holland Gen Fd 89,000 250,000 89,000 100,000
TOTAL SOURCES 597,606$ 778,933$ 565,930$ 670,950$
FUNDING USES -
Personnel Services -
* Salaries & Wages - Working 288,368$ 270,314$ 252,000$ 252,258$
* Benefits - Incl. NonWorking Wages 31,609 34,915 42,650 25,860
* Mandatory Employer Costs 44,894 25,880 26,300 27,048
Other Current Expenditures -
* Supplies / Maintenance 58,531 82,931 58,000 75,720
* Contractual 83,984 90,810 91,100 102,000
* Other 280,445 280,918 85,650 174,100
Capital Outlay - 0 - - 0 - - 0 - 3,000
Depreciation Expense 138,594 132,316 113,273 112,285
TOTAL USES 926,425$ 918,084$ 668,973$ 772,271$
CURRENT OPERATIONS:
* Holland Historical Trust 705,900$ 818,789$ 567,360$ 670,658$
* Armory 19,531 21,295 33,213 33,213
OTHER APPLIED PURPOSES:
* Capital / Collections / Donated Facil. 200,994 78,000 68,400 68,400
TOTAL USES 926,425$ 918,084$ 668,973$ 772,271$
PARKS & RECREATION
HOLLAND HISTORICAL TRUST FUND
- - F U N D I N G S O U R C E S & U S E S - -
ALTERNATIVE PRESENTATION OF FUNDING USES
( T h i s F u n d C o n t i n u e s O n N e x t P a g e )
-286-

FY-2014 FY-2015 FY-2016 FY-2017
Final Final Final Adopted
Description Actual Actual Revised Est. Budget
INCREASE (DECREASE) (328,819)$ (139,151)$ (103,043)$ (98,321)$
ENDING BALANCE -
Non-Expendable 110,000 110,000 110,000 110,000
Investment in Fixed Assets 1,632,024 1,402,103 1,288,832 1,176,547
Expendable:
* Designated Restrictions -
Temporary (Legal Restrictions) 292,372 310,242 226,855 266,072
Board of Directors (Board Action) 436,193 286,956 292,695 438,816
* Reserves - 0 - - 0 - - 0 - - 0 -
* Unreserved / Undesignated (37,780) 184,357 272,233 100,859
TOTAL FUND EQUITY 2,432,809$ 2,293,658$ 2,190,615$ 2,092,294$
Personnel Services Total Amount 364,871$ 331,109$ 320,950$ 305,166$
Full-Time Positions 6.00 4.00 4.00 4.00
Part-Time Positions @ F.T.E. 1.76 1.43 1.83 1.83
PARKS & RECREATION
HOLLAND HISTORICAL TRUST FUND
- - S T A F F I N G - -
- - F U N D E Q U I T Y - -
( T h i s F u n d C o n t i n u e s F r o m P r e v i o u s P a g e )
-287-

UTILITY SERVICES INTRODUCTION
OPERATIONSERVICES
BUSINESSSERVICES
FINANCESERVICES
TECHNOLOGY
SERVICES
BOARD OF PUBLIC WORKS
GENERAL MANAGER
Sustainability Committee
BOARD OF DIRECTORS
UTILITY SERVICES
Human Resources
Planning
Safety
Accounting
Materials & Facilities
Power Production
Water Filtration
Wastewater Treatment
IT
Broadband & Networking
Customer Service
Electric Transmission &
Distribution
Water & Wastewater
Services
GROUP MISSION STATEMENT The Utilities Services Group seeks to produce and deliver safe, reliable and efficient electric power and communication services; and to operate water and wastewater treatment plants and distribution and collection facilities at optimum performance and efficiency in order to provide the quality of service demanded by customers.
GROUP ORGANIZATIONAL STRUCTURE
-288-

BOARD OF PUBLIC WORKS UTILITIES SERVICES
$-
$40,000,000
$80,000,000
$120,000,000
$160,000,000
Use
s D
oll
ars
Total Uses by Departments $162,945,572
Charges for Services99.3%
Other0.4%
Interest & Rents0.4%
Funding Sources
Working Wages8.0%
Benefits & NonWorking Wages2.8%
Mandatory Employer Costs0.7%
Supplies/Maint.3.2%
Contractual3.0%
Production34.4%
Other1.8%
Debt Svc7.5%
Transfers to Other Funds4.0%
Capital Outlay34.7%
Funding Uses
-289-

FY-2014 FY-2015 FY-2016 FY-2017
Final Final Final Adopted
Description Actual Actual Revised Est. Budget
FUND TYPES -
Enterprise 139,313,560$ 215,468,515$ 258,636,481$ 162,945,572$
FUNDING SOURCES -
Charges for Services 116,399,089$ 119,806,494$ 123,788,222$ 127,875,278$
Interest & Rents 748,932 1,093,965 833,175 488,101
Other (125,384) 2,025,443 805,615 462,275
Bond Proceeds - 0 - 174,508,000 9,500,000 - 0 -
TOTAL SOURCES 117,022,637$ 297,433,902$ 134,927,012$ 128,825,654$
FUNDING USES -
Personnel Services -
* Salaries & Wages - Working 10,159,598$ 10,507,670$ 11,360,574$ 11,880,451$
* Benefits - Incl NonWorking Wages 4,630,415 5,010,481 3,983,063 4,097,294
* Mandatory Employer Costs 925,326 945,244 1,004,965 1,088,851
Other Current Expenses -
* Supplies / Maintenance 3,160,526 3,324,597 3,581,280 4,706,785
* Contractual 2,568,926 3,032,778 3,477,101 4,484,740
* Utility Production 63,718,394 60,139,973 56,730,869 50,891,214
* Other 2,197,148 2,203,758 2,317,076 2,604,480
Capital Outlays 33,031,575 113,440,919 158,782,853 51,390,979
Debt Service Payments -
* Principal Maturities 2,157,924 1,105,650 1,118,263 7,429,566
* Interest & Fee Payments 1,953,178 460,775 652,895 3,649,406
Transfers Out 4,990,800 5,344,000 5,535,000 5,850,000
Depreciation Expense 9,789,568 9,952,670 10,092,542 14,871,806
Amortization Expense 30,182 - - -
TOTAL USES 139,313,560$ 215,468,515$ 258,636,481$ 162,945,572$
Personnel Services Total Amount 15,715,339$ 16,463,395$ 16,348,602$ 17,066,596$
* Full-Time Positions 178.00 171.00 178.00 177.00
UTILITY SERVICES
- - - - - G R O U P S T A F F I N G T O T A L S - - - - -
- - - - - G R O U P F U N D I N G U S E S A C R O S S F U N D S - - - - -
- - - - - G R O U P F U N D I N G S O U R C E S & U S E S T O T A L S - - - - -
SUMMARY OF DEPTS, FUNCTIONS & RELATED FUNDS
-290-

BOARD OF PUBLIC WORKS UTILITIES SERVICES ELECTRIC TRANSMISSION & DISTRIBUTION & FIBER OPTICS
MISSION STATEMENT POWER SUPPLY To provide electrical energy to meet the requirements of electric system customers; and to provide that energy at the lowest cost possible at a high level of reliability as needed by those customers. ELECTRIC TRANSMISSION & DISTRIBUTION To provide a reliable delivery system for electricity utilizing a team of individuals who are leaders in the delivery of safe, reliable, and efficient electric power and are committed to customer satisfaction.
ACTION PLAN
POWER SUPPLY
To start use of the new natural gas fired combined cycle power plant to meet the demand
growth of customers’ load and to provide clean and efficient energy. Upgrade control systems on two of the peaking duty combustion turbine generators to
improve reliability and efficiency of the units.
Optimize the workforce, dispatching of internal generation sources, and maintenance and capital expenditures to reflect the changing market supplied power prices.
BROADBAND
To provide broadband services to HBPW and City departments and to customers
throughout the local community that is cost effective and reliable.
To continue to expand the broadband distribution system working with the business community.
ELECTRIC TRANSMISSION & DISTRIBUTION
To generate and maintain the electric transmission and distribution systems to ensure a
superior level of reliability to our customers. To continue to improve the ability of our employees to respond promptly and effectively to
problems affecting our customers. To install new meters which are compatible with the Advanced Metering Infrastructure (AMI.)
To provide responsible management of capital investment and operational expenses to
ensure that our customers and community are served by the most reasonable cost provider of utility services while investing in a reliable system, supported by an efficient and productive workforce. Upgrade various distribution circuits to provide reliable distribution to new commercial enterprises.
-291-

UTILITY SERVICES
HOLLAND BOARD OF PUBLIC WORKS - ELECTRIC FUND
FY-14 FY-15 FY-16 FY-17
Actual Actual Projected Projected
ELECTRIC PRODUCTION AND DISTRIBUTION
Peak kW 229,715 220.8 225 228
Total Number of Customers 27,990 28,208 28,220 28,235
kWh Sales Total 1,048,830,770 1,049,754,679 1,047,408,051 1,071,613,444
Revenue per Unit $0.08920 $0.09501 $0.09812 $0.09941
Cost per Unit $0.07910 $0.07699 $0.07419 $0.07320
Res. Avg.Usage - kWh per Month 631.4 600.1 612.8 621.4
KWH SALES
Residential 177,495,613 170,027,264 173,619,559 176,227,879
Commercial 327,127,845 324,327,100 322,042,178 327,038,424
Industrial 540,465,440 551,287,537 547,959,508 564,518,438
Street Lighting 3,741,872 4,112,778 3,786,806 3,828,703
Total 1,048,830,770 1,049,754,679 1,047,408,051 1,071,613,444
FY-16 Projected FY-17 Projected PERCENT DIFFERENCE
COST COST COST
MWH COST MWH MWH COST MWH MWH COST MWH
ENERGY
JDY 101,934 5,412,781 53.10 - - - -100.00% -100.00% -100.00%
Holland Energy Park - - - 296,288 7,622,787 25.73
Purchases
Renewable 141,564 8,807,325 62.21 150,382 9,546,832 63.48 6.23% 8.40% 2.04%
Non-Reneable 517,679 18,416,149 35.57 261,913 7,772,472 29.68 -49.41% -57.80% -16.58%
CT #6,7,8,9 30,658 1,592,535 51.95 60,897 2,516,984 41.33 98.63% 58.05% -20.43%
Belle River 204,912 5,073,624 24.76 225,504 6,968,839 30.90 10.05% 37.35% 24.81%
Campbell 62,083 2,346,207 37.79 77,285 2,311,399 29.91 24.49% -1.48% -20.86%
Fremont 21,554 818,499 37.97 19,218 668,593 34.79 -10.84% -18.31% -8.39%
Subtotal 1,080,384 42,467,120$ 39.31$ 1,091,487 37,407,906$ 34.27$ 1.03% -11.91% -12.81%
CAPACITY
Belle River 8,318,888 7,504,325 -9.79%
Campbell 2,263,629 2,099,845 -7.24%
Fremont 291,422 410,129 40.73%
TOTAL 1,080,384 53,341,059$ 49.37$ 1,091,487 47,422,205$ 43.45$ 1.03% -11.10% -12.00%
Work
loa
d
PERFORMANCE MEASURES
Operational
Activity
-292-

FY-2014 FY-2015 FY-2016 FY-2017
Final Final Final Adopted
Description Actual Actual Revised Est. Budget
FUNDING SOURCES -
Charges for Services 97,539,619$ 100,816,653$ 103,933,552$ 107,740,361$
Interest & Rents 646,427 1,001,438 730,943 420,000
Other 25,661 (30,771) 88,646 95,004
Bond Proceeds - 0 - 165,008,000 - 0 - - 0 -
TOTAL SOURCES 98,211,707$ 266,795,320$ 104,753,141$ 108,255,365$
FUNDING USES -
Personnel Services -
* Salaries & Wages - Working 6,379,070$ 6,828,109$ 7,508,102$ 7,798,703$
* Benefits - Incl NonWorking Wages 2,982,000 3,318,530 2,654,112 2,732,444
* Mandatory Employer Costs 565,384 600,501 648,318 703,404
Other Current Expenses -
* Supplies / Maintenance 1,778,170 1,997,916 1,926,282 3,312,577
* Contractual 1,970,501 2,377,300 2,738,277 3,667,412
* Electric Utility Production 60,914,622 57,348,299 53,701,072 47,926,431
* Other 1,848,370 1,914,374 1,940,215 2,097,369
Capital Outlays 26,737,357 104,303,610 134,385,156 42,827,236
Debt Service Payments -
* Principal Maturity Payments - 0 - - 0 - - 0 - 5,446,245
* Interest & Fee Payments 1,427,843 250 170,852 2,981,528
Transfers Out 4,990,800 5,344,000 5,535,000 5,850,000
Depreciation Expense 6,480,527 6,430,984 6,586,346 10,201,935
TOTAL USES 116,074,644$ 190,463,873$ 217,793,732$ 135,545,284$
UTILITY SERVICES
- - F U N D I N G S O U R C E S & U S E S - -
( T h i s F u n d C o n t i n u e s O n N e x t P a g e )
BOARD OF PUBLIC WORKS - ELECTRIC UTILITY FUND
-293-

FY-2014 FY-2015 FY-2016 FY-2017
Final Final Final Adopted
Description Actual Actual Revised Est. Budget
INCREASE (DECREASE) 8,874,420$ 15,627,057$ 21,344,565$ 20,983,562$
ENDING BALANCE -
Designated / Reserved 16,668,000 109,373,361 52,519,169 51,221,513
Undesignated / Unreserved 188,728,194 102,362,890 180,561,647 202,842,865
TOTAL FUND EQUITY 205,396,194$ 211,736,251$ 233,080,816$ 254,064,378$
INCREASE (DECREASE) (22,703,108)$ (9,942,930)$ (49,600,053)$ (15,790,328)$
ENDING BALANCE 105,809,863$ 95,866,933$ 46,266,880$ 30,476,552$
Personnel Services Total Amount 9,926,454$ 10,747,140$ 10,810,532$ 11,234,551$
* Full-Time Positions 100.00 93.00 98.00 97.00
- - W O R K I N G C A P I T A L - -
- - S T A F F I N G - -
- - F U N D E Q U I T Y - -
UTILITY SERVICES
BOARD OF PUBLIC WORKS - ELECTRIC UTILITY FUND
-294-

BOARD OF PUBLIC WORKS UTILITIES SERVICES WASTEWATER
MISSION STATEMENT WASTEWATER TREATMENT To ensure that the wastewater treatment plant is adequate to serve the needs of its customers and to support the sustainability and growth of the community at large and; to maintain all facilities to assure optimum performance and longevity, and to operate efficiently to increase the quality of service and reduce the cost of resources used. WASTEWATER COLLECTION To ensure that wastewater collection facilities are adequate to serve the needs of all customers; and to operate efficiently to increase the quality of service and reduce the cost of resources used.
ACTION PLAN
WASTEWATER TREATMENT
To meet or exceed all standards of wastewater effluent quality.
To be involved with community-wide efforts to improve the water quality of Lake Macatawa.
To complete improvements to bio-solids handling and disposal processes. To make improvements to efficiently and safely handle the processing of wastewater.
WASTEWATER COLLECTION
To replace sanitary sewer mains in coordination with City street improvements. - 9th St.
To plan and construct necessary sanitary sewer improvements to meet customer needs.
To make improvements to Lift Stations to upgrade operations and reliability.
-295-

UTILITY SERVICES
HOLLAND BOARD OF PUBLIC WORKS - WASTEWATER FUND
FY-14 FY-15 FY-16 FY-17
Actual Actual Projected Projected
Total Gallons Treated (mg) 3,338 3,279 3,150 3,200
Total Number of Customers 12,326 123,360 12,365 12,370
CCF Sales (Retail Only) 1,593,223 1,591,674 1,600,780 1,600,780
Revenue per Unit (Retail) $3.38 $3.57 $3.72 $3.95
Cost per Unit (All Units) $2.26 $2.29 $2.43 $2.67
Residential. Avg. Usage- CCF per Month 5.2 5.1 5.0 5.0
CCF Sales (Wholesale) 2,139,445 2,172,804 2,131,489 2,128,427
Revenue per Unit (Wholesale) $1.23 $1.18 $1.24 $1.15
CCF Sales
Residential 655,944 646,048 638,287 638,287
Commercial 673,134 681,970 689,844 689,844
Industrial 264,145 263,656 272,649 272,649
Wholesale 2,139,445 2,172,804 2,131,489 2,128,427
Total 3,732,668 3,764,478 3,732,269 3,729,207
Work
load
PERFORMANCE MEASURES
-296-

FY-2014 FY-2015 FY-2016 FY-2017
Final Final Final Adopted
Description Actual Actual Revised Est. Budget
FUNDING SOURCES -
Charges for Services 10,038,375$ 10,305,015$ 10,650,106$ 10,862,683$
Interest & Rents 46,432 37,497 56,092 27,972
Other 222,163 2,125,357 619,024 267,271
Bond Proceeds - 0 - 9,500,000 9,500,000 - 0 -
TOTAL SOURCES 10,306,970$ 21,967,869$ 20,825,222$ 11,157,926$
FUNDING USES -
Personnel Services -
* Salaries & Wages - Working 2,093,077$ 2,059,588$ 2,085,199$ 2,248,355$
* Benefits - Incl NonWorking Wages 898,248 922,783 722,447 752,239
* Mandatory Employer Costs 205,873 189,604 189,076 207,944
Other Current Expenses -
* Supplies / Maintenance 762,099 727,513 1,168,673 846,184
* Contractual 315,109 331,888 391,846 420,961
* Wastewater Utility Production 2,147,682 2,232,170 2,369,857 2,296,065
* Other 215,101 176,646 223,176 290,745
Capital Outlays 4,323,828 6,659,850 19,522,618 4,727,682
Debt Service Payments -
* Principal Maturity Payments 682,500 - 0 - - 0 - 635,116
* Interest & Fee Payments 52,961 72,463 49,149 238,221
Transfers Out - 0 - - 0 - - 0 - - 0 -
Depreciation Expense 1,815,330 1,974,058 1,913,838 2,878,823
TOTAL USES 13,511,808$ 15,346,563$ 28,635,879$ 15,542,335$
( T h i s F u n d C o n t i n u e s O n N e x t P a g e )
UTILITY SERVICES
- - F U N D I N G S O U R C E S & U S E S - -
BOARD OF PUBLIC WORKS - WASTEWATER UTILITY FUND
-297-

FY-2014 FY-2015 FY-2016 FY-2017
Final Final Final Adopted
Description Actual Actual Revised Est. Budget
INCREASE (DECREASE) 1,801,490$ 3,781,156$ 2,211,961$ 978,389$
ENDING BALANCE -
Designated / Reserved 6,273,822 12,765,239 11,038,854 9,628,814
Undesignated / Unreserved 46,695,687 41,311,426 45,249,772 47,638,201
UND EQUITY - END OF YEAR 52,969,509$ 54,076,665$ 56,288,626$ 57,267,015$
INCREASE (DECREASE) (1,389,508)$ 2,103,947$ (4,170,434)$ (95,546)$
ENDING BALANCE 11,007,790$ 13,111,737$ 8,941,303$ 8,845,757$
Personnel Services Total Amount 3,197,198$ 3,171,975$ 2,996,722$ 3,208,538$
* Full-Time Positions 43.00 43.00 44.00 44.00
- - W O R K I N G C A P I T A L - -
- - S T A F F I N G - -
- - F U N D E Q U I T Y - -
UTILITY SERVICES
BOARD OF PUBLIC WORKS - WASTEWATER UTILITY FUND
-298-

BOARD OF PUBLIC WORKS UTILITIES SERVICES WATER
MISSION STATEMENT WATER TREATMENT To ensure that water plant facilities are adequate to serve the needs of all customers and to support the sustainability and growth of the community; to maintain facilities to achieve optimum performance and longevity; and to operate efficiently to increase the quality of service and reduce the cost of resources used. WATER TRANSMISSION AND DISTRIBUTION To ensure that water distribution facilities are adequate to serve the needs of all customers; to maintain facilities to achieve optimum performance and longevity; and to operate efficiently to increase the quality of service.
ACTION PLAN
WATER TREATMENT
To continue the development of a long-range plan for future water supply capacity. To ensure compliance with all aspects of the Safe Drinking Water Act and other pertinent
environmental and safety regulations. To rebuild or replace various aging equipment to provide more efficient production of water.
To rebuild sedimentation basin to maintain reliability.
To rebuild Program Logic Controller.
WATER TRANSMISSION AND DISTRIBUTION
To replace water mains in coordination with City street improvements: - Central, 3rd Street to State Street & 19th. - 9th, Kollen Park to 8th - 28th, Central to Lincoln
To plan and construct necessary water main improvements to meet customer needs.
Replace Hydrants and water meters.
-299-

UTILITY SERVICES
HOLLAND BOARD OF PUBLIC WORKS - WATER FUND
FY-14 FY-15 FY-16 FY-17
Actual Actual Projected Projected
Peak (MG) 28,132 24.953 26.185 26.968
Gallons Treated (MG) 4,291 4,089 4,345 4,389
Total number of Customers 13,399 13,433 13,440 13,450
CCF Sales (Retail Only) 2,837,393 2,466,642 2,619,210 2,619,210
Revenue per Unit (Retail Only) $2.23 $2.53 $2.53 $2.62
Cost per Unit $1.04 $1.10 $1.00 $1.07
Residential Avg. Usage - CCF per Month 8.34 7.39 7.72 7.72
CCF Sales (Wholesale) 2,697,719 2,721,056 3,189,783 3,203,670
Revenue per Unit (Wholesale) $0.76 $0.72 $0.65 $0.62
CCF Sales
Residential 1,066,905 947,371 990,697 990,697
Commercial/Industrial 1,213,313 1,092,524 1,095,109 1,095,109
Industrial 557,175 426,747 533,404 533,404
Resales 2,697,719 2,721,056 3,189,783 3,203,670
Total 5,535,112 5,187,698 5,808,993 5,822,880
PERFORMANCE MEASURES
Work
load
-300-

FY-2014 FY-2015 FY-2016 FY-2017
Final Final Final Adopted
Description Actual Actual Revised Est. Budget
FUNDING SOURCES -
Charges for Services 8,821,095$ 8,684,826$ 9,204,564$ 9,272,234$
Interest & Rents 56,073 55,030 46,140 40,129
Other (373,208) (69,143) 97,945 100,000
Bond Proceeds - 0 - - 0 - - 0 - - 0 -
Transfers In - 0 - - 0 - - 0 - - 0 -
TOTAL SOURCES 8,503,960$ 8,670,713$ 9,348,649$ 9,412,363$
FUNDING USES -
Personnel Services -
* Salaries & Wages - Working 1,687,451$ 1,619,973$ 1,767,273$ 1,833,393$
* Benefits - Incl NonWorking Wages 750,167 769,168 606,504 612,611
* Mandatory Employer Costs 154,069 155,139 167,571 177,503
Other Current Expenses -
* Supplies / Maintenance 620,257 599,168 486,325 548,024
* Contractual 283,316 323,590 346,978 396,367
* Water Utility Production 656,090 559,504 659,940 668,718
* Other 133,677 112,738 153,685 216,366
Capital Outlays 1,970,390 2,477,459 4,875,079 3,836,061
Debt Service Payments -
* Principal Maturity Payments 1,475,424 1,105,650 1,118,263 1,348,205
* Interest & Fee Payments 472,374 388,062 432,894 429,657
Transfers Out - 0 - - 0 - - 0 - - 0 -
Depreciation Expense 1,493,711 1,547,628 1,592,358 1,791,048
Amortization Expense 30,182 - 0 - - 0 - - 0 -
TOTAL USES 9,727,108$ 9,658,079$ 12,206,870$ 11,857,953$
( T h i s F u n d C o n t i n u e s O n N e x t P a g e )
UTILITY SERVICES
- - F U N D I N G S O U R C E S & U S E S - -
BOARD OF PUBLIC WORKS - WATER UTILITY FUND
-301-

FY-2014 FY-2015 FY-2016 FY-2017
Final Final Final Adopted
Description Actual Actual Revised Est. Budget
INCREASE (DECREASE) 2,222,666$ 2,595,743$ 3,135,121$ 2,738,676$
ENDING BALANCE -
Designated / Reserved 3,166,865 4,235,406 4,284,617 4,441,984
Undesignated / Unreserved 30,949,554 30,365,756 33,451,666 36,032,975
TOTAL FUND EQUITY 34,116,419$ 34,601,162$ 37,736,283$ 40,474,959$
INCREASE (DECREASE) 332,241$ (508,279)$ (1,265,863)$ (811,909)$
ENDING BALANCE 5,055,938$ 4,547,659$ 3,281,796$ 2,469,887$
Personnel Services Total Amount 2,591,687$ 2,544,280$ 2,541,348$ 2,623,507$
* Full-Time Positions 35.00 35.00 36.00 36.00
- - F U N D E Q U I T Y - -
- - W O R K I N G C A P I T A L - -
- - S T A F F I N G - -
UTILITY SERVICES
BOARD OF PUBLIC WORKS - WATER UTILITY FUND
-302-

INTERNAL SERVICES INTRODUCTION
Geographic Information System (GIS)
Computers & Networks
TECHNOLOGY SERVICES FISCAL SERVICES
Photocopying
INTERNAL SERVICE FUNDS
Communications System
Automated Postage
Fuel Dispensing System
Risk Management
GROUP MISSION STATEMENT Internal Service Funds are maintained for the purpose of accounting for the financing of services provided by one department or agency to other departments or agencies of the city, or to other governmental units, on a cost-reimbursement basis. The overall objective of this group is to accurately account for such transactions, and to record revenues and expenditures in a fair an accurate manner, and to provide quality equipment for employees to use in carrying out their responsibilities.
GROUP ORGANIZATIONAL STRUCTURE
-303-

INTERNAL SERVICES
$-
$1,000,000
$2,000,000
$3,000,000
$4,000,000
$5,000,000
$6,000,000
Use
s D
oll
ars
Total Uses by Departments $8,299,771
Charges for Services20.7%
Interest & Rents0.4%
Transfers In1.5%
Other (Incl. Premiums)77.4%
Funding Sources
Working Wages3.6% Benefits &
NonWorking Wages2.2%
Mandatory Employer Costs0.3%
Other (Incl Insurance Claims/Prem)
78.1%
Contractual0.7%
Suppl/Maint.12.6%
Depreciation1.1%
Capital Outlay1.4%Funding Uses
-304-

FY-2014 FY-2015 FY-2016 FY-2017
Final Final Final Adopted
Description Actual Actual Revised Est. Budget
FUND TYPES -
Internal Service 8,500,153$ 7,390,180$ 8,135,126$ 8,299,771$
FUNDING SOURCES -
Charges for Services 1,738,707$ 1,440,260$ 1,280,113$ 1,715,090$
Interest & Rents 25,593 22,643 28,370 29,020
Other 7,122,317 5,901,951 5,909,990 6,383,100
Transfers In 323,997 100,000 179,500 120,000
TOTAL SOURCES 9,210,614$ 7,464,854$ 7,397,973$ 8,247,210$
FUNDING USES -
Personnel Services -
* Salaries & Wages - Working 209,269$ 227,126$ 241,443$ 296,813$
* Benefits - Incl. NonWorking Wages 232,331 138,466 138,121 180,028
* Mandatory Employer Costs 19,504 18,545 20,844 24,873
Other Current Expenditures -
* Supplies / Maintenance 1,318,504 946,569 739,106 1,048,120
* Contractual Expenditures 193,932 33,134 53,000 57,800
* Other 6,379,090 5,710,501 6,658,562 6,486,987
Capital Outlay 66,616 215,104 199,400 117,000
Depreciation Expense 80,907 81,735 84,650 88,150
Transfers Out - 0 - 19,000 - 0 - - 0 -
Contingencies - 0 - - 0 - - 0 - - 0 -
TOTAL USES 8,500,153$ 7,390,180$ 8,135,126$ 8,299,771$
Personnel Services Total Amount 461,104$ 384,137$ 400,408$ 501,714$
* Full-Time Positions 3.80 3.60 3.60 4.60
* Part-Time Positions @ F.T.E. - 0 - - 0 - - 0 - - 0 -
INTERNAL SERVICES
SUMMARY OF DEPTS, FUNCTIONS & RELATED FUNDS
- - G R O U P S T A F F I N G T O T A L S - -
- - G R O U P F U N D I N G U S E S A C R O S S F U N D S - -
- - G R O U P F U N D I N G S O U R C E S & U S E S T O T A L S - -
-305-

INTERNAL SERVICES TECHNOLOGY SERVICES
FUND MISSION STATEMENT The mission of the Technology Services Department is to provide computing and communications technology strategy, as well as effective tools and service, to anticipate and meet the ever changing informational needs of the City.
ACTION PLAN
Implement modern data storage solution for entire city. Improve the computing speed and efficiency of our server environment. (December 2016 - $90,000)
Work with the Clerk’s office to address Electronic Document Retention schedules and
disposal of outdated and unnecessary digital files. (December 2016 - $20,000)
Continue to embrace marketing the City of Holland online and on social media, reworking the enjoyholland.com site and increasing its marketing (January 2017 - $18,000)
-306-

INTERNAL SERVICES
TECHNOLOGY SERVICES
FY-14 FY-15 FY-16 FY-17
Actual Actual Projected Projected
Equipment Maintained:
Servers 48 42 43 43
Desktop & Mobile Computers 278 280 280 280
Printers 75 75 74 74
Scanning Devices 18 18 18 18
Surveillance Cameras 116 121 130 136
Help Desk Tickets Addressed 827 595 591 600
City of Holland Website Visitors 916,846 742,210 1,146,396 1,250,000
Tax Bills Viewed via Internet 11,628 90,318 69,037 75,000
Work
load
PERFORMANCE MEASURES
-307-

INTERNAL SERVICES
TECHNOLOGY SERVICES FUND
FY-2014 FY-2015 FY-2016 FY-2017
Final Final Final Adopted
Description Actual Actual Revised Est. Budget
FUNDING SOURCES -
Charges for Services 516,317$ 520,890$ 623,830$ 731,290$
Interest & Rents 759 465 - 0 - - 0 -
Other - 0 - (11,059) - 0 - - 0 -
Transfers In 100,000 100,000 100,000 120,000
TOTAL SOURCES 617,076$ 610,296$ 723,830$ 851,290$
FUNDING USES -
Personnel Services -
* Salaries & Wages - Working 186,988$ 203,279$ 215,600$ 269,175$
* Benefits - Incl. NonWorking Wages 88,474 95,913 104,208 130,093
* Mandatory Employer Costs 15,933 17,170 18,519 23,723
Other Current Expenditures -
* Supplies / Maintenance 230,174 191,927 228,606 243,120
* Contractual 21,159 4,266 4,000 4,000
* Other 32,732 38,567 45,800 42,800
Capital Outlay 66,616 110,621 119,900 117,000
Transfers Out - 0 - - 0 - - 0 - - 0 -
Depreciation Expense 78,102 79,665 80,000 80,000
Contingencies - 0 - - 0 - - 0 - - 0 -
TOTAL USES 720,178$ 741,408$ 816,633$ 909,911$
- - F U N D I N G S O U R C E S & U S E S - -
T h i s F u n d C o n t i n u e s O n N e x t P a g e
-308-

INTERNAL SERVICES
TECHNOLOGY SERVICES FUND
FY-2014 FY-2015 FY-2016 FY-2017
Final Final Final Adopted
Description Actual Actual Revised Est. Budget
INCREASE (DECREASE) (36,486) (20,491)$ 27,097$ 58,379$
ENDING BALANCE -
Reserved for Asset Replacement 138,800$ 128,300$ 100,000$ 100,000$
Reserved for Copiers & Printers 30,000 - 0 - - 0 - - 0 -
Undesignated / Unreserved 288,914 308,923 364,320 422,699
TOTAL FUND EQUITY 457,714$ 437,223$ 464,320$ 522,699$
INCREASE (DECREASE) (800)$ 110$ 15,497$ 21,379$
ENDING BALANCE 4,969$ 5,079$ 20,576$ 41,955$
Personnel Services Total Amount 291,395$ 316,362$ 338,327$ 422,991$
* Full-Time Positions 3.80 3.60 3.60 4.60
* Part-Time Positions @ F.T.E. - 0 - - 0 - - 0 - - 0 -
- - S T A F F I N G - -
- - F U N D E Q U I T Y - -
- - W O R K I N G C A P I T A L - -
T h i s F u n d C o n t i n u e s F r o m P r e v i o u s P a g e
-309-

INTERNAL SERVICES FUEL DISPENSING FUND
FUND MISSION STATEMENT
To provide for an efficient and environmentally sound fuel dispersion system at the Holland Public School Waverly Road maintenance facility for all City, Macatawa Area Express Transportation Authority and Holland Public Schools vehicles, equipment and school buses.
ACTION PLAN
To maintain the fuel system to meet all environmental requirements.
To continue to build a reserve for equipment replacement from per gallon surcharges assessed. The per gallon surcharge was increased in October 2010 from $0.01 to $0.11 per gallon in order to escalate the accumulation of reserves anticipated to be needed for replacement of the underground fuel storage tanks. Tanks were replaced summer 2015.
To provide timely and informational reporting on fuel consumption and charges to all
participating departments.
Per gallon overhead charge established at $0.06 throughout FY 17 which will be adjusted to final actual overhead costs at fiscal year end.
Historical actual per gallon overhead charge:
FY 15 $0.116667 FY 14 $0.050004 FY 13 $0.056535 FY 12 $0.051511 FY 11 $0.068885 FY 10 $0.057317 FY 09 $0.050585 FY 08 $0.068258 FY 07 $0.035692 FY 06 $0.033134
-310-

FY-2014 FY-2015 FY-2016 FY-2017
Final Final Final Adopted
Description Actual Actual Revised Est. Budget
FUNDING SOURCES -
Charges for Services 1,089,848$ 772,765$ 505,600$ 808,300$
Interest & Rents 834 1,031 (200) (200)
TOTAL SOURCES 1,090,682$ 773,796$ 505,400$ 808,100$
FUNDING USES -
Personnel Services -
* Salaries & Wages - Working 3,624$ 4,172$ 4,219$ 4,338$
* Benefits - Incl. NonWorking Wages 1,944 2,246 2,271 2,335
Other Current Expenditures -
* Supplies / Maintenance 1,044,964 722,555 471,000 766,000
* Contractual 954 862 1,800 1,800
* Other 153 9,067 5,570 5,487
Capital Outlay - 0 - 104,483 - 0 - - 0 -
Depreciation Expense 1,108 1,108 1,150 1,150
TOTAL USES 1,052,747$ 844,493$ 486,010$ 781,110$
INCREASE (DECREASE) 37,935$ 33,786$ 19,390$ 26,990$
ENDING BALANCE -
Designated / Reserves 212,801$ 171,587$ 190,977$ 217,967$
Undesignated / Unreserved - 0 - 75,000 75,000 75,000
TOTAL FUND EQUITY 212,801$ 246,587$ 265,977$ 292,967$
INCREASE (DECREASE) 1,108 (28,375) 1,150 1,150
ENDING BALANCE 37,656$ 9,281$ 10,431$ 11,581$
Positions: Not Applicable
ADDITIONAL NOTE:
The time of certain positions listed under "Staffing" for General Fund - Finance and General Fund - Treasurer
is charged, in small part, to this fund.
INTERNAL SERVICES
FUEL DISPENSING FUND
- - S T A F F I N G - -
- - F U N D I N G S O U R C E S & U S E S - -
- - F U N D E Q U I T Y - -
- - W O R K I N G C A P I T A L - -
-311-

INTERNAL SERVICES POSTAGE SERVICES FUND
FUND MISSION STATEMENT
Provide a centralized and efficient automated postage application system to be used by departments for applying proper postal rates to envelopes and packages which are mailed through the U.S. Postal Service; together with efficient and easy-to-use procedures for departments to record use of the system.
ACTION PLAN
To implement anticipated changes to postal rates in a timely manner.
To deliver the mail to the U.S. Post Office in a timely manner, at least once daily (and whenever feasible, twice daily).
To utilize savings by discounting postage of 1st class mail pieces that are picked up daily by a mailing service courier.
-312-

INTERNAL SERVICES
POSTAGE SERVICES
FY-14 FY-15 FY-16 FY-17
Actual Actual Projected Projected
Mail Piece Count
City Hall 29,899 33,304 34,500 36,000
Transportation Center 627 0 0 0
Total 30,526 33,304 34,500 36,000
Total Cost of Postage for All Fund Types $16,520 $18,674 $20,000 $21,500
PERFORMANCE MEASURES
Work
load
-313-

FY-2014 FY-2015 FY-2016 FY-2017
Final Final Final Adopted
Description Actual Actual Revised Est. Budget
FUNDING SOURCES -
Charges for Services 16,520$ 18,675$ 20,000$ 21,500$
Interest & Rents 15 13 20 20
Transfers In - 0 - - 0 - - 0 - - 0 -
TOTAL SOURCES 16,535$ 18,688$ 20,020$ 21,520$
FUNDING USES -
Other Current Expenditures -
* Supplies / Maintenance 14,703$ 16,885$ 18,000$ 19,000$
* Other 1,920 1,737 1,800 1,800
Capital Outlay - 0 - - 0 - - 0 - - 0 -
TOTAL USES 16,623$ 18,622$ 19,800$ 20,800$
INCREASE (DECREASE) (88)$ 66$ 220$ 720$
ENDING BALANCE -
Designated / Reserves - 0 - - 0 -$ - 0 -$ - 0 -$
Undesignated / Unreserved 6,687 6,753 6,973 7,693
TOTAL FUND EQUITY 6,687$ 6,753$ 6,973$ 7,693$
INCREASE (DECREASE) (88)$ 66$ 220$ 720$
ENDING BALANCE 6,687$ 6,753$ 6,973$ 7,693$
Positions: Not Applicable
INTERNAL SERVICES
POSTAGE SERVICES FUND
- - S T A F F I N G - -
- - F U N D I N G S O U R C E S & U S E S - -
- - F U N D E Q U I T Y - -
- - W O R K I N G C A P I T A L - -
-314-
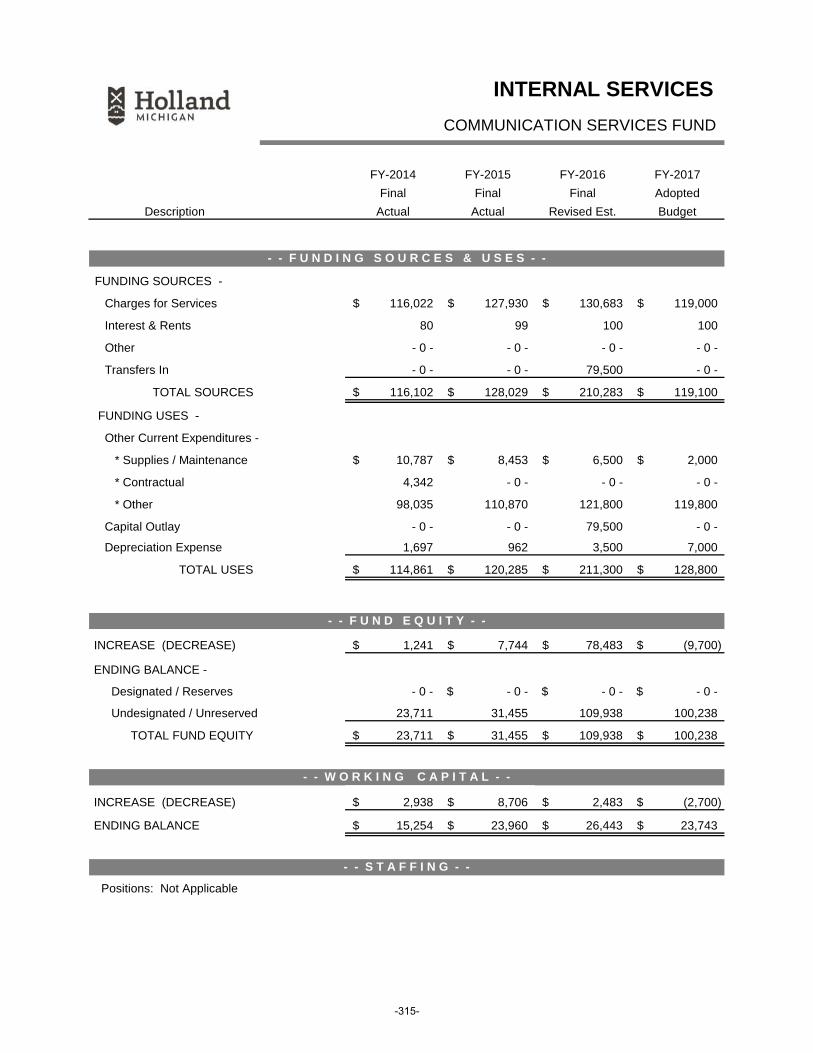
INTERNAL SERVICES
COMMUNICATION SERVICES FUND
FY-2014 FY-2015 FY-2016 FY-2017
Final Final Final Adopted
Description Actual Actual Revised Est. Budget
FUNDING SOURCES -
Charges for Services 116,022$ 127,930$ 130,683$ 119,000$
Interest & Rents 80 99 100 100
Other - 0 - - 0 - - 0 - - 0 -
Transfers In - 0 - - 0 - 79,500 - 0 -
TOTAL SOURCES 116,102$ 128,029$ 210,283$ 119,100$
FUNDING USES -
Other Current Expenditures -
* Supplies / Maintenance 10,787$ 8,453$ 6,500$ 2,000$
* Contractual 4,342 - 0 - - 0 - - 0 -
* Other 98,035 110,870 121,800 119,800
Capital Outlay - 0 - - 0 - 79,500 - 0 -
Depreciation Expense 1,697 962 3,500 7,000
TOTAL USES 114,861$ 120,285$ 211,300$ 128,800$
INCREASE (DECREASE) 1,241$ 7,744$ 78,483$ (9,700)$
ENDING BALANCE -
Designated / Reserves - 0 - - 0 -$ - 0 -$ - 0 -$
Undesignated / Unreserved 23,711 31,455 109,938 100,238
TOTAL FUND EQUITY 23,711$ 31,455$ 109,938$ 100,238$
INCREASE (DECREASE) 2,938$ 8,706$ 2,483$ (2,700)$
ENDING BALANCE 15,254$ 23,960$ 26,443$ 23,743$
Positions: Not Applicable
- - S T A F F I N G - -
- - F U N D I N G S O U R C E S & U S E S - -
- - F U N D E Q U I T Y - -
- - W O R K I N G C A P I T A L - -
-315-

INTERNAL SERVICES COMPENSATED ABSENCES FUND
FUND MISSION STATEMENT
Provide funding for expenditures related to annual adjustment of compensated absences for full-time employees that are reported in governmental funds. Compensated absences include:
- Comp time - Payments in lieu of holiday (Fire Union) - Paid Time Off (Non-Union) - Unused sick leave payoff (Police Union) - Vacation (Police and Fire Union)
Mandatory employer costs and pension contribution costs that apply are also financed.
ACTION PLAN
Maintain funding for each of the individual compensated absences at the annually calculated amount.
To stay updated on additional requirements concerning compensated absences, as determined by the Government Accounting Standards Board (GASB).
-316-

FY-2014 FY-2015 FY-2016 FY-2017
Final Final Final Adopted
Description Actual Actual Revised Est. Budget
FUNDING SOURCES -
Charges for Services 131,865$ 29,712$ 20,000$ 35,000$
TOTAL SOURCES 131,865$ 29,712$ 20,000$ 35,000$
FUNDING USES -
Personnel Services -
* Salaries & Wages - Working - 0 -$ - 0 -$ - 0 -$ - 0 -$
* Benefits - Incl. NonWorking Wages 131,865 29,712 20,000 35,000
* Mandatory Employer Costs - 0 - - 0 - - 0 - - 0 -
TOTAL USES 131,865$ 29,712$ 20,000$ 35,000$
INCREASE (DECREASE) - 0 -$ - 0 -$ - 0 -$ - 0 -$
ENDING BALANCE -
Designated / Reserves - 0 - - 0 -$ - 0 -$ - 0 -$
Undesignated / Unreserved - 0 - - 0 - - 0 - - 0 -
TOTAL FUND EQUITY - 0 -$ - 0 -$ - 0 -$ - 0 -$
INCREASE (DECREASE) - 0 -$ - 0 -$ - 0 -$ - 0 -$
ENDING BALANCE - 0 -$ - 0 -$ - 0 -$ - 0 -$
Positions: Not Applicable
INTERNAL SERVICES
COMPENSATED ABSENCES FUND
- - S T A F F I N G - -
- - F U N D I N G S O U R C E S & U S E S - -
- - F U N D E Q U I T Y - -
- - W O R K I N G C A P I T A L - -
-317-

INTERNAL SERVICES RISK MANAGEMENT
FUND MISSION STATEMENT Provide a comprehensive insurance protection program for City of Holland employees, City owned vehicles and property and indemnification against liability claims; through a combination of self-insurance and commercial insurance policies.
ACTION PLAN
A. Workers Compensation Insurance Fund Maintain a self-funded reserve balance sufficient to meet the cost of commercial
premiums and costs associated with claims occurring while the City was self-insured. This will be accomplished by assessing premiums to individual department budgets using rates provided by the insurance carrier (currently Accident Fund).
Approve a contractual arrangement with the insurance agency and a third party administrator to provide claims services for claims occurring while self-insured.
B. Disability Insurance Fund
Maintain a self-funded reserve balance sufficient to meet the cost of short-term disability claims resulting from employee illness or non-occupational injury; within the limitations established by City Council or the applicable union contract.
Purchase a commercial insurance policy providing long-term disability coverage for eligible employees beyond the benefit provided by the self-funded short-term disability plan.
C. Health and Dental Insurance Fund
Maintain a self-funded reserve balance sufficient to meet the costs of health and dental claims incurred by City of Holland, Board of Public Works and Macatawa Area Express Transportation Authority employees, retirees, and family members.
Purchase specific and aggregate stop-loss commercial insurance coverage for health and prescription drug claims.
Continue the contractual arrangement with Priority Health (third-party administrator) to provide claims services.
Provide a comprehensive wellness program for employees that will help improve their overall health.
D. Vehicle Insurance Fund
Maintain a self-funded reserve balance sufficient to meet the cost of repairs or replacements resulting from damage to city-owned vehicles. A $200 per vehicle surcharge will continue to be levied to all departments with vehicles covered by insurance, as a means of increasing fund balance. The surcharge will be reduced to $150 for vehicles with physical damage coverage.
Renew a commercial insurance policy by July 2016 that provides:
- First-dollar liability protection for personal injury and collision, as well as catastrophic coverage for damage and/or destruction to multiple vehicles.
- Physical damage coverage for fire trucks and other specified vehicles.
-318-

INTERNAL SERVICES RISK MANAGEMENT
E. Property Insurance Fund
Maintain a self-funded reserve balance sufficient to meet the cost of repairs or replacement claims resulting from physical damages to city-owned facilities and equipment, up to the established stop-loss risk retention threshold.
Renew a commercial insurance program by July 2016 that:
- Indemnifies for individual claim occurrences, to the extent the established self-insured retention is exceeded.
- Indemnifies for multiple losses in the same fiscal year by establishing an aggregate threshold, adding protection against the total amount of risk retentions in a single year, regardless of the number of individual property loss occurrences.
F. Liability Insurance Fund
Maintain a self-funded reserve balance considered sufficient to meet the potential cost of approved claims resulting from oversight, carelessness, neglect, errors and omissions on the part of the city government officials and employees, up to the established stop-loss threshold.
Renew a commercial insurance program by July 2016 that:
- Indemnifies for individual claim occurrences, to the extent the established self-insured retention is exceeded.
- Indemnifies for multiple losses within the same fiscal year by establishing an aggregate threshold, adding protection against the total amount of risk retentions in a single year, regardless of the number of individual loss occurrences.
Approve a contractual arrangement with the insurance agent and a third-party claims administrator to provide claims services on behalf of the City of Holland.
-319-

FY-2014 FY-2015 FY-2016 FY-2017
Final Final Final Adopted
Description Actual Actual Revised Est. Budget
FUNDING SOURCES -
Interest & Rents 23,905$ 21,035$ 28,450$ 29,100$
Other 6,990,452 5,883,298 5,889,990 6,383,100
Transfers In 223,997 - 0 - - 0 - - 0 -
TOTAL SOURCES 7,238,354$ 5,904,333$ 5,918,440$ 6,412,200$
FUNDING USES -
Personnel Services -
* Salaries & Wages - Working 18,657$ 19,675$ 21,624$ 23,300$
* Benefits - Incl. NonWorking Wages 10,048 10,595 11,642 12,600
* Mandatory Employer Costs 3,571 1,375 2,325 1,150
Other Current Expenditures -
* Supplies / Maintenance 17,876 6,749 20,200 22,500
* Contractual 167,477 28,006 42,000 47,500
* Other 6,246,250 5,550,260 6,483,592 6,317,100
Transfers Out - 0 - 19,000 - 0 - - 0 -
Contingencies - 0 - - 0 - - 0 - - 0 -
TOTAL USES 6,463,879$ 5,635,660$ 6,581,383$ 6,424,150$
INCREASE (DECREASE) 774,475$ 268,673$ (662,943)$ (11,950)$
ENDING BALANCE -
Designated / Reserves 30,000 15,000 15,000 15,000
Undesignated / Unreserved 3,456,974 3,740,647 3,077,704 3,065,754
TOTAL FUND EQUITY 3,486,974$ 3,755,647$ 3,092,704$ 3,080,754$
INCREASE (DECREASE) - - - - - - 283,673$ (662,943)$ (11,950)$
ENDING BALANCE 3,456,974$ 3,740,647$ 3,077,704$ 3,065,754$
Positions: Not Applicable
INTERNAL SERVICES
SUMMARY OF RISK MANAGEMENT
- - S T A F F I N G - -
- - F U N D I N G S O U R C E S & U S E S - -
- - F U N D E Q U I T Y - -
- - W O R K I N G C A P I T A L - -
-320-

FY-2014 FY-2015 FY-2016 FY-2017
Final Final Final Adopted
Description Actual Actual Revised Est. Budget
FUNDING SOURCES -
Interest & Rents 4,251$ 3,438$ 4,525$ 4,600$
Other 309,247 332,995 346,725 354,000
TOTAL SOURCES 313,498$ 336,433$ 351,250$ 358,600$
FUNDING USES -
Other Current Expenditures -
* Contractual - 0 -$ - 0 -$ - 0 -$ - 0 -$
* Other 314,456 312,711 374,850 386,000
Transfers Out - 0 - - 0 - - 0 - - 0 -
Contingencies - 0 - - 0 - - 0 - - 0 -
TOTAL USES 314,456$ 312,711$ 374,850$ 386,000$
INCREASE (DECREASE) (958)$ 23,722$ (23,600)$ (27,400)$
ENDING BALANCE -
Designated / Reserves 15,000 - 0 -$ - 0 -$ - 0 -$
Undesignated / Unreserved 524,540 563,262 539,662 512,262
TOTAL FUND EQUITY 539,540$ 563,262$ 539,662$ 512,262$
INCREASE (DECREASE) (958)$ 38,722$ (23,600)$ (27,400)$
ENDING BALANCE 524,540$ 563,262$ 539,662$ 512,262$
Positions: Not Applicable
INTERNAL SERVICES
EMPLOYEE WORKERS COMPENSATION INSURANCE FUND
- - S T A F F I N G - -
- - F U N D I N G S O U R C E S & U S E S - -
- - F U N D E Q U I T Y - -
- - W O R K I N G C A P I T A L - -
-321-

FY-2014 FY-2015 FY-2016 FY-2017
Final Final Final Adopted
Description Actual Actual Revised Est. Budget
FUNDING SOURCES -
Interest & Rents 716$ 860$ 1,550$ 1,600$
Other 106,060 103,487 107,650 107,000
TOTAL SOURCES 106,776$ 104,347$ 109,200$ 108,600$
FUNDING USES -
Personnel Services -
* Mandatory Employer Costs 3,518$ 1,305$ 2,200$ 1,000$
Other Current Expenditures -
* Other 85,550 53,809 106,180 84,000
Contingencies - 0 - - 0 - - 0 - - 0 -
TOTAL USES 89,068$ 55,114$ 108,380$ 85,000$
INCREASE (DECREASE) 17,708$ 49,233$ 820$ 23,600$
ENDING BALANCE -
Designated / Reserves - 0 - - 0 -$ - 0 -$ - 0 -$
Undesignated / Unreserved 101,637 150,870 151,690 175,290
TOTAL FUND EQUITY 101,637$ 150,870$ 151,690$ 175,290$
INCREASE (DECREASE) 17,708$ 49,233$ 820$ 23,600$
ENDING BALANCE 101,637$ 150,870$ 151,690$ 175,290$
Positions: Not Applicable
INTERNAL SERVICES
EMPLOYEE DISABILITY INSURANCE FUND
- - S T A F F I N G - -
- - F U N D I N G S O U R C E S & U S E S - -
- - F U N D E Q U I T Y - -
- - W O R K I N G C A P I T A L - -
-322-
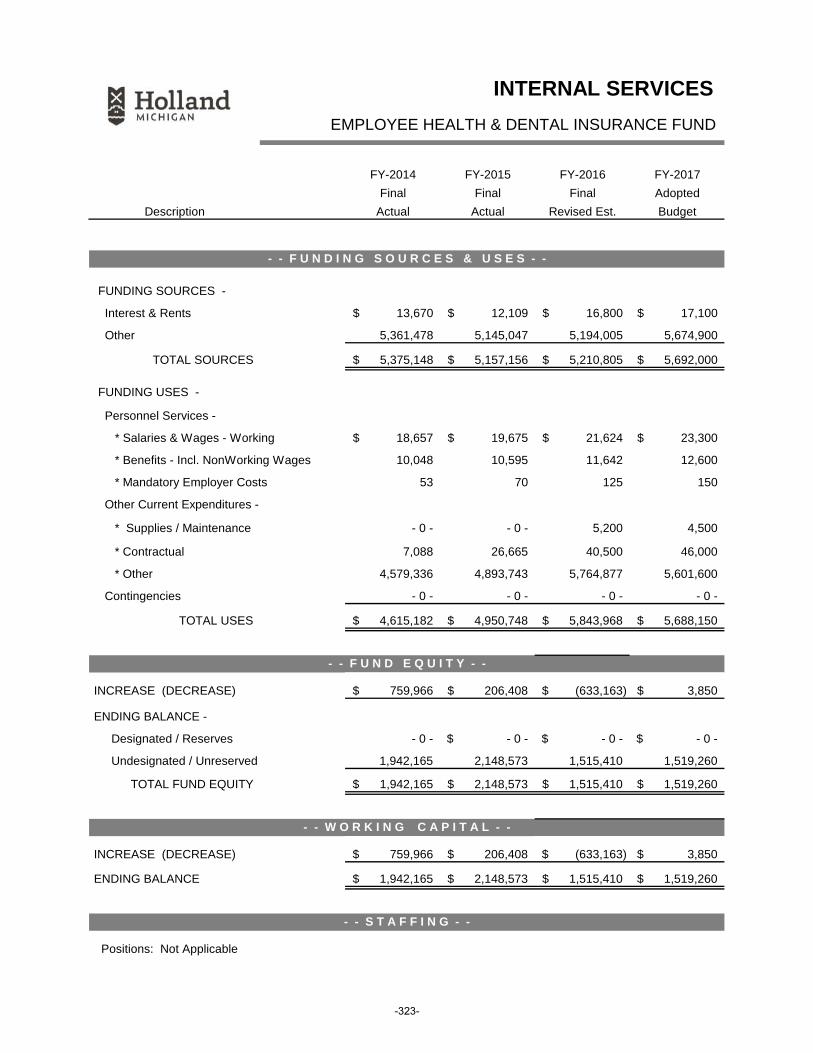
FY-2014 FY-2015 FY-2016 FY-2017
Final Final Final Adopted
Description Actual Actual Revised Est. Budget
FUNDING SOURCES -
Interest & Rents 13,670$ 12,109$ 16,800$ 17,100$
Other 5,361,478 5,145,047 5,194,005 5,674,900
TOTAL SOURCES 5,375,148$ 5,157,156$ 5,210,805$ 5,692,000$
FUNDING USES -
Personnel Services -
* Salaries & Wages - Working 18,657$ 19,675$ 21,624$ 23,300$
* Benefits - Incl. NonWorking Wages 10,048 10,595 11,642 12,600
* Mandatory Employer Costs 53 70 125 150
Other Current Expenditures -
* Supplies / Maintenance - 0 - - 0 - 5,200 4,500
* Contractual 7,088 26,665 40,500 46,000
* Other 4,579,336 4,893,743 5,764,877 5,601,600
Contingencies - 0 - - 0 - - 0 - - 0 -
TOTAL USES 4,615,182$ 4,950,748$ 5,843,968$ 5,688,150$
INCREASE (DECREASE) 759,966$ 206,408$ (633,163)$ 3,850$
ENDING BALANCE -
Designated / Reserves - 0 - - 0 -$ - 0 -$ - 0 -$
Undesignated / Unreserved 1,942,165 2,148,573 1,515,410 1,519,260
TOTAL FUND EQUITY 1,942,165$ 2,148,573$ 1,515,410$ 1,519,260$
INCREASE (DECREASE) 759,966$ 206,408$ (633,163)$ 3,850$
ENDING BALANCE 1,942,165$ 2,148,573$ 1,515,410$ 1,519,260$
Positions: Not Applicable
INTERNAL SERVICES
EMPLOYEE HEALTH & DENTAL INSURANCE FUND
- - S T A F F I N G - -
- - F U N D I N G S O U R C E S & U S E S - -
- - F U N D E Q U I T Y - -
- - W O R K I N G C A P I T A L - -
-323-

FY-2014 FY-2015 FY-2016 FY-2017
Final Final Final Adopted
Description Actual Actual Revised Est. Budget
FUNDING SOURCES -
Interest & Rents 1,834$ 1,468$ 1,500$ 1,600$
Other 118,702 122,654 107,305 109,400
TOTAL SOURCES 120,536$ 124,122$ 108,805$ 111,000$
FUNDING USES -
Other Current Expenditures -
* Supplies / Maintenance 17,876$ 6,749$ 15,000$ 18,000$
* Other 92,326 96,054 81,455 83,000
Transfers Out - 0 - 19,000 - 0 - - 0 -
Contingencies - 0 - - 0 - - 0 - - 0 -
TOTAL USES 110,202$ 121,803$ 96,455$ 101,000$
INCREASE (DECREASE) 10,334$ 2,319$ 12,350$ 10,000$
ENDING BALANCE -
Designated / Reserves - 0 - - 0 - - 0 - - 0 -
Undesignated / Unreserved 253,985 256,304 268,654 278,654
TOTAL FUND EQUITY 253,985$ 256,304$ 268,654$ 278,654$
INCREASE (DECREASE) 10,334$ 2,319$ 12,350$ 10,000$
ENDING BALANCE 253,985$ 256,304$ 268,654$ 278,654$
Positions: Not Applicable
INTERNAL SERVICES
VEHICLE INSURANCE FUND
- - S T A F F I N G - -
- - F U N D I N G S O U R C E S & U S E S - -
- - F U N D E Q U I T Y - -
- - W O R K I N G C A P I T A L - -
-324-

FY-2014 FY-2015 FY-2016 FY-2017
Final Final Final Adopted
Description Actual Actual Revised Est. Budget
FUNDING SOURCES -
Interest & Rents 3,217$ 2,501$ 2,900$ 3,000$
Other 28,376 44,556 23,195 24,300
TOTAL SOURCES 31,593$ 47,057$ 26,095$ 27,300$
FUNDING USES -
Personnel Services -
* Salaries & Wages - Working - 0 -$ - 0 -$ - 0 -$ - 0 -$
* Benefits - Incl. NonWorking Wages - 0 - - 0 - - 0 - - 0 -
* Mandatory Employer Costs - 0 - - 0 - - 0 - - 0 -
Other Current Expenditures -
* Supplies / Maintenance - 0 -$ - 0 -$ - 0 -$ - 0 -$
* Contractual - 0 - - 0 - - 0 - - 0 -
* Other 31,012 49,234 25,120 29,000
Transfers Out - 0 - - 0 - - 0 - - 0 -
Contingencies - 0 - - 0 - - 0 - - 0 -
TOTAL USES 31,012$ 49,234$ 25,120$ 29,000$
INCREASE (DECREASE) 581$ (2,177)$ 975$ (1,700)$
ENDING BALANCE -
Designated / Reserves - 0 - - 0 - - 0 - - 0 -
Undesignated / Unreserved 386,060 383,883 384,858 383,158
TOTAL FUND EQUITY 386,060$ 383,883$ 384,858$ 383,158$
INCREASE (DECREASE) 581$ (2,177)$ 975$ (1,700)$
ENDING BALANCE 386,060$ 383,883$ 384,858$ 383,158$
Positions: Not Applicable
INTERNAL SERVICES
PROPERTY INSURANCE FUND
- - S T A F F I N G - -
- - F U N D I N G S O U R C E S & U S E S - -
- - F U N D E Q U I T Y - -
- - W O R K I N G C A P I T A L - -
-325-

FY-2014 FY-2015 FY-2016 FY-2017
Final Final Final Adopted
Description Actual Actual Revised Est. Budget
FUNDING SOURCES -
Interest & Rents 217$ 659$ 1,175$ 1,200$
Other 1,066,589 134,559 111,110 113,500
Transfers In 223,997 - 0 - - 0 - - 0 -
TOTAL SOURCES 1,290,803$ 135,218$ 112,285$ 114,700$
FUNDING USES -
Other Current Expenditures -
* Contractual 160,389$ 1,341$ 1,500$ 1,500$
* Other 1,143,570 144,709 131,110 133,500
Contingencies - 0 - - 0 - - 0 - - 0 -
TOTAL USES 1,303,959$ 146,050$ 132,610$ 135,000$
INCREASE (DECREASE) (13,156)$ (10,832)$ (20,325)$ (20,300)$
ENDING BALANCE -
Designated / Reserves 15,000 15,000 15,000 15,000
Undesignated / Unreserved 248,587 237,755 217,430 197,130
TOTAL FUND EQUITY 263,587$ 252,755$ 232,430$ 212,130$
INCREASE (DECREASE) (13,156)$ (10,832)$ (20,325)$ (20,300)$
ENDING BALANCE 248,587$ 237,755$ 217,430$ 197,130$
Positions: Not Applicable
INTERNAL SERVICES
LIABILITY INSURANCE FUND
- - S T A F F I N G - -
- - F U N D I N G S O U R C E S & U S E S - -
- - F U N D E Q U I T Y - -
- - W O R K I N G C A P I T A L - -
-326-

CAPITAL PROJECTS INTRODUCTION
GROUP MISSION STATEMENT The Capital Projects Group accounts for all the City’s Capital Improvement projects over $25,000. The purpose of this group is to assure the City plans and appropriates funds for maintaining, expanding and constructing new infrastructure and facilities which will assure the City will be a quality place to live, work and play; and can compete as an economic base locally, regionally, nationally and internationally.
GROUP ORGANIZATIONAL STRUCTURE
-327-
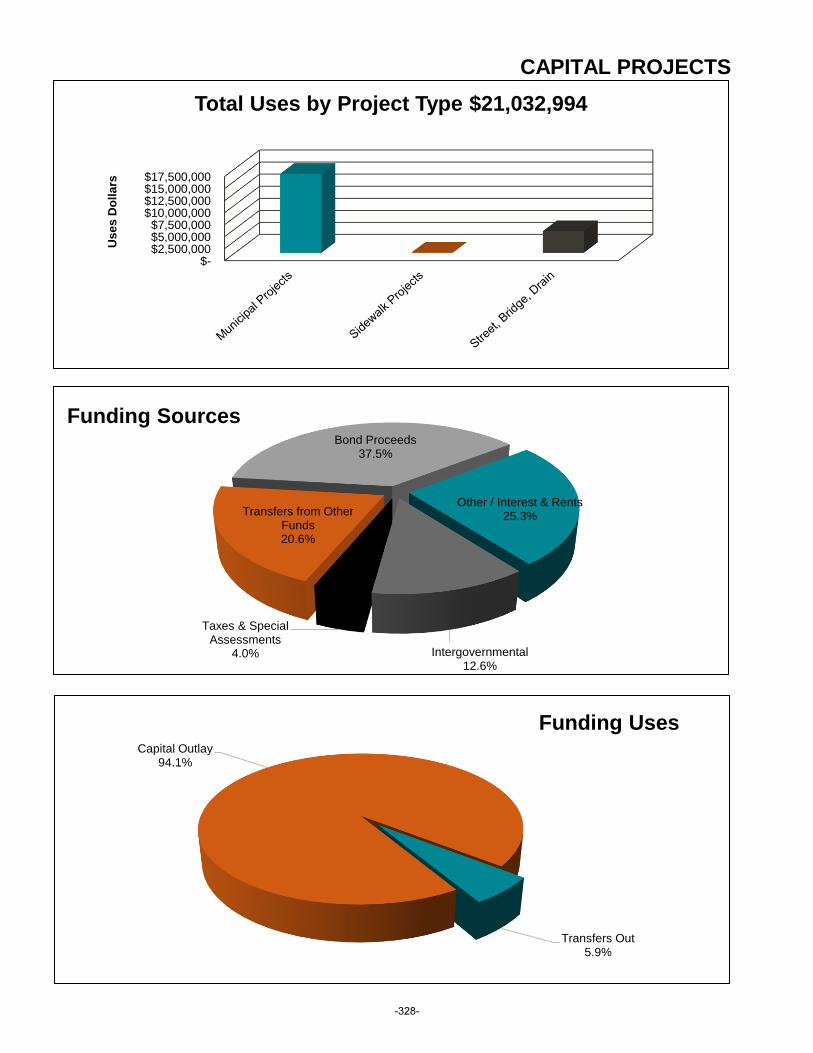
CAPITAL PROJECTS
$- $2,500,000 $5,000,000 $7,500,000
$10,000,000 $12,500,000 $15,000,000 $17,500,000
Use
s D
oll
ars
Total Uses by Project Type $21,032,994
Capital Outlay94.1%
Transfers Out5.9%
Funding Uses
Taxes & Special Assessments
4.0%
Transfers from Other Funds20.6%
Bond Proceeds37.5%
Other / Interest & Rents25.3%
Intergovernmental12.6%
Funding Sources
-328-

TOTAL CAPITAL PROJECTS OVERVIEW - ACROSS ALL FUNDS
Smaller capital outlay purchases, such as vehicles, equipment & furniture, which are not considered
as "Capital Projects" are not included in this presentation.
72,298,213$
16,425,400$
2,925,744
1,610,850
71,000
42,617,989
Enterprise - Fund Capital Projects:
See Electric Utility Fund
See Water Utility Fund
See Wastewater Utility Fund
3,886,480
4,760,750
OVERVIEW OF MULTI-YEAR CAPITAL PROJECT BUDGETS
Capital Projects to be Implemented During Fiscal Year 2017
GOVERNMENTAL - TYPE FUNDS
PROPRIETARY - TYPE FUNDS
Municipal Improvements Projects:
Street, Bridge, Signalization, Storm Sewer Projects:
City Share
MDOT, Grants, and Private Share
Sidewalk Improvements Projects
Municipal Projects22.7%
Street, Bridge, Signalization Projects
6.3%
Electric Fund Projects58.9%
Water Fund Projects5.4%
Sidewalk Projects0.1%
Wastewater Fund Projects
6.6%
FY-2017 Capital Projects (29% General City - 71% Utilities)
-329-

CAPITAL PROJECTS
SUMARY OF DEPTS, FUNCTIONS & RELATED FUNDS
FY-2014 FY-2015 FY-2016 FY-2017
Final Final Final Adopted
Description Actual Actual Revised Est. Budget
- - G R O U P F U N D I N G U S E S A C R O S S F U N D S - -
FUND TYPES -
Capital Projects 2,247,492$ 5,123,727$ 11,702,338$ 21,032,994$
- - G R O U P F U N D I N G S O U R C E S & U S E S T O T A L S - -
FUNDING SOURCES -
Taxes & Special Assessments 282,757$ 554,309$ 1,136,853$ 751,761$
Intergovernmental 704,364 1,020,726 580,125 2,350,677
Interest & Rents 17,585 22,489 31,117 21,203
Other 28,709 14,053 1,695,805 4,696,073
Bond Proceeds - 0 - - 0 - 3,000,000 7,000,000
Transfers In 1,575,929 3,960,734 8,660,921 3,855,172
TOTAL SOURCES 2,609,344$ 5,572,311$ 15,104,821$ 18,674,886$
FUNDING USES -
Other Current Expenditures -
Capital Outlay 2,168,236$ 5,081,146$ 11,451,461$ 19,800,994$
Transfers Out 79,256 42,581 250,877 1,232,000
TOTAL USES 2,247,492$ 5,123,727$ 11,702,338$ 21,032,994$
- - G R O U P S T A F F I N G T O T A L S - -
Positions: Not Applicable
-330-

CAPITAL PROJECTS MUNICIPAL CAPITAL IMPROVEMENTS
FUND MISSION STATEMENT
Develop a comprehensive capital improvement budget that addresses short and long-term improvements to the City's infrastructure, public facilities and buildings, in order to assure the City will maximize its return on its investment and provide citizens with public facilities that improve the economic, social, and environmental quality of life in the City.
ACTION PLAN
Use the existing .3155 millage to fund new municipal capital projects as approved by City
Council; .2585 will be dedicated to building a reserve for Fire Station Renovation/Replacement projected to take place in FY-2018.
To complete the design and/or construction of all capital projects outlined in the section of the Municipal Capital Projects Fund. Major projects include: - Civic Center Reconstruction - Energy Upgrades - Greenhouse Renovation - Wayfinding Signage - VanRaalte Farm Improvements
-331-

MUNICIPAL CAPITAL IMPROVEMENTS FUND FY-2017 PROJECT DESCRIPTION
MUNICIPAL CAPITAL IMPROVEMENT PROJECTS: Although other (non-street) capital improvement projects were discussed and prioritized in the annual budget process in the past, a detailed listing of projects was compiled and ranked in order of priority by staff based on need, financial resources, historical value and grant availability, as part of the FY2017 budget. This document included funding sources and uses over a five year period. Much of this information was discussed with the City Council and staff at their Annual Retreat, which took place on January 30, 2016. The strategic plan and goals for Council lists the projects, and includes the ranking for each one.
PUBLIC INPUT: Coffee with Council (& HBPW) was held on January 16, 2016 to provide citizens with an opportunity for share ideas, remarks and concerns regarding current issues relating to the City of Holland with elected and appointed officials as well as longer-term capital needs and projects; during an interactive and relaxed open house. In addition, three budget study sessions open to the public with the City Council were conducted in April (12th, 13th and 18th), as well as the budget Public Hearing on May 4, 2016.
APPROVAL OF THE CAPITAL IMPROVEMENT PLAN: The Municipal Capital Improvement Plan was approved on May 4, 2016, as part of the annual budget.
MANAGEMENT & ADMINISTRATIVE SERVICES PROJECTS:
Special Waterfront Planning Funds $25,000: For realization of waterfront redevelopment planning. Fiber Marketing $25,000: For the City’s share of marketing efforts for the HBPW fiber to the premise project. Redevelopment Ready Community Planning $25,000: For marketing/land use planning for obsolete commercial strips on US-31 and Washington Avenue.
DOWNTOWN PROJECTS:
Streetscape Refreshment $20,000: For updated plan for Downtown Streetscape and Landscaping. Snowmelt Refurbishment $500,000: For the City’s share of refurbishing or replacing snowmelt valves and flushing the system. Broadcast System $25,000: The downtown portion of the Broadcast System for the downtown. Parking & Wayfinding Signage $10,000: This will begin the build out of the downtown wayfinding signage.
COMMUNITY ENERGY STRATEGIES PROJECTS: Contribution to Holland Energy Fund $280,000: To pay for the contribution to the Holland Energy Fund from the HBPW dividend; the City’s share of $25,000 is included.
-332-

MUNICIPAL CAPITAL IMPROVEMENTS FUND FY-2017 PROJECT DESCRIPTION
PUBLIC SAFETY PROJECTS: Broadcast System $25,000: To pay for the Public Safety share of the Downtown Broadcast System. Fire Station Planning $25,000: Building on the 0.2585 millage, preparation for Waverly Road Fire Station Replacement/Rebuilding will begin in this fiscal year, with future debt service to come from the dedicated millage. Kollen Park Fire Station Kitchen Remodel $25,000: To pay for updates to the kitchen in crew living quarters. Kollen Park Fire Station Repaint of living quarters $11,600: To pay for painting to the crew living quarters. Kollen Park Fire Station Tile $14,000: To pay for the replacement of tile in the crew area of the fire station. Parking Garage Repairs $20,000: To pay for repairs to the parking deck and garage at the Public Safety building on 8th Street.
PARKS, RECREATION AND TRANSPORTATION SERVICES PROJECTS:
Windmill Island Gardens Water Line Replacement $410,000: The original 6-inch line to provide fire protection to the DeZwaan Windmill still exists at 50 years old but is galvanized and corroded to only enable 1-inch of water flow when 6-inches is necessary. Windmill Island Gardens Strategic Plan Implementation $15,000: To pay for the creation and implementation of the Gardens Interpretative Plan. Windmill Island Bridge to the North $787,000: To pay the City’s potential share of a joint project with Holland Charter Township to accomplish a $2.3 million bridge and pathway safety and tourism project. The City’s Legacy Fund share will likely equal $238,000 (10% of total); the rest is grant and donation funded. Civic Center Stage Two Design: $500,000 To pay for final design and bid documents for the Civic Center Place Project. Civic Center Project Manager: $500,000 To pay for Project management of the Civic Center Place Construction Manager to oversee the entire project. Civic Center Construction $10,000,000: To pay for the complete renovation and construction of Civic Center Place including the building, Farmer’s Market and Park improvements. An amendment was approved on July 6, 2016 to increase the construction budget to $12,000,000, which will be funded by donations. Cemetery Signs $5,000: To pay for new signage at the Pilgrim Home and Graafschap Cemeteries. Energy Upgrades $2,250,000: To pay for Energy savings across City buildings, including building sealing, lighting upgrades, HVAC upgrades and centralization and new windows in City Hall as part of the Schneider guaranteed energy savings project. Transportation Services Building Sealing $19,000: To pay for building envelope sealing to improve energy efficiency. Central and Decentralized Splash Pads $10,000: To pay for conceptual design of a centralized splash pad at Bouws Pool and smaller splash pads at Holland Heights and Kollen Park. This improvement was suggested in the Community Recreation Plan.
-333-

MUNICIPAL CAPITAL IMPROVEMENTS FUND FY-2017 PROJECT DESCRIPTION
PARKS, RECREATION AND TRANSPORTATION SERVICES PROJECTS:
Dog Parks $25,000: For ancillary facilities at a west side Dog Park (near West Middle School on 24th Street) once environmental studies are done; if not concluded, then for matching grant for Van Raalte Dog Park. Citywide Tree Planting $50,000: To get 35% tree canopy and recover from ash borer losses; to be coordinated at some locations with Project Clarity. Lake Macatawa Street End $25,000: For City’s match for a grant to construct neighborhood-led improvements at each of 12 street ends providing community access. Lakeview Park $10,000: To pay for planning in coordination with Laketown Township for park improvements at Lakeview Park and the City Property North of 32nd Street where the former Lakeview School was located. VanRaalte Farm Improvements $120,000: To be used for updates to the Farmhouse itself including exterior painting, flooring and barn improvements. Kollen Park Railing $60,000: To pay for refurbishing and painting of the railings along the boardwalk at Kollen Park. Greenhouse Renovation $250,000: To build a new grow house near the existing Parks and Cemetery building to replace the Greenhouse that was recently sold to Freedom Village; with an additional $250,000 to be budgeted in FY-2018. Pilgrim Home Outdoor Niches $15,000: To purchase two (2) new outdoor niche units. Leaf Recycling Land/Facility $3,800: To review alternative locations and collaborate with Holland Board of Public Works on 40th Street. Paw Paw Park $25,000: Funding for the 35-year lease to Ottawa County Parks. Baseline Fix It First Costs - Parks $75,000: To pay for fixes to maintenance issues in the parks that have been delayed or postponed in the past, without having to wait for the next budget cycle.
COMMUNITY & NEIGHBORHOOD SERVICES PROJECTS:
Cappon and Settlers Home Improvements $5,000: To be determined by the Holland Historic Trust. Cappon Irrigation $7,000: To repair the irrigation system at the Cappon House. City Hall Carpet/Chairs/Blinds/Security $50,000: To replace chairs that were purchased as part of the City Hall renovations in the mid 90’s, add blinds and address security issues. Downtown Neighborhoods Enhancement Program $35,000: These small grants need to be defined according to a policy to be developed. Similar programs are used elsewhere to enable gap financing for small business growth and location. Gateway/Wayfinding Signs & Message Boards $90,000: This is the third year’s cost for a comprehensive wayfinding, entryway signage and community value signage program. Phased implementation costs will begin with four entry signs and one community communications board at a later point. Bicycle Highway/Macatawa Greenway I.D. signs $5,000: These signs are needed to unify signage for regional bike routes and pathways. These signs are important for economic vitality, multi-modal transportation and tourism.
-334-

CAPITAL PROJECTS
MUNICIPAL CAPITAL IMPROVEMENTS FUND
FY-2014 FY-2015 FY-2016 FY-2017
Final Final Final Adopted
Description Actual Actual Revised Est. Budget
FUNDING SOURCES -
Taxes 233,214$ 504,204$ 605,433$ 320,361$
Special Assessments - 0 - - 0 - - 0 - - 0 -
Intergovernmental - 0 - 4,000 280,125 1,115,610
Interest & Rents 16,983 21,985 30,911 21,000
Other 28,209 13,153 1,260,805 4,696,073
Bond Proceeds - 0 - - 0 - 3,000,000 7,000,000
Transfers In 631,351 609,001 2,017,908 914,428
TOTAL SOURCES 909,757$ 1,152,343$ 7,195,182$ 14,067,472$
FUNDING USES -
Capital Outlay 489,607$ 660,227$ 3,553,637$ 15,193,400$
Transfers Out 79,256 - 0 - 212,077 1,232,000
TOTAL USES 568,863$ 660,227$ 3,765,714$ 16,425,400$
INCREASE (DECREASE) 340,894$ 492,116$ 3,429,468$ (2,357,928)$
ENDING BALANCE -
Reserved - Fire Station - 0 - 254,678 452,394 592,859
Reserved - Civic Center - 0 - - 0 - 376,927 - 0 -
Assigned - Legacy Projects 1,327,926 1,099,175 593,624 857,942
Undesignated / Unreserved 657,005 1,123,194 4,860,497 2,097,786
TOTAL FUND EQUITY 1,984,931$ 2,477,047$ 5,906,515$ 3,548,587$
Positions: Not Applicable
- - S T A F F I N G - -
- - F U N D E Q U I T Y - -
- - F U N D I N G S O U R C E S & U S E S - -
-335-

FY-2017 FY-2018 FY-2019 FY-2020 FY-2021
Budgeted Potential Potential Potential Potential
Reserved:
- Fire Station Renovation / Replacement 452,394 592,859 859,145 - 277,044
- Civic Center Place 376,927 - - - -
- Windmill Island Projects 593,624 - - - -
Assigned - Legacy Funds 1,259,942 857,942 772,942 772,942 772,942
Unassigned 3,223,628 2,097,786 70,268 (58,040) (1,415,114)
Total 5,906,515 3,548,587 1,702,355 714,902 (365,128)
PROPERTY TAX & ASSESSMENTS:
General Millage 59,296 60,482 61,692 62,926 64,185
Fire Station Renovation Millage 261,065 266,286 271,612 277,044 282,585
Personal Property Tax Reimbursement 13,610 10,000 2,000 2,000 2,000
Assessment - Washington Blvd LED - 12,000 12,000 12,000 12,000
GRANTS:
MI DNR - DeGraaf Nature Center 165,000 - - - -
MI DNR - Street Ends - 50,000 50,000 50,000 50,000
MI DNR - Lakeview Park - - - - 200,000
MI DNR - Windmill Island Gardens 300,000 - - - -
MDOT - Windmill Island Gardens 637,000 187,000 - - -
Recreation - Various - 25,000 25,000 25,000 -
Macatawa Greenway - - - - 250,000
BONDS:
Civic Center 7,000,000 - - - -
Fire Station Renovation - - 4,869,243 - -
Parking Deck (West 9th Street) - - - 6,000,000 -
Smallenburg Recreation Center (3 Gym) - - - - 10,000,000
PRIVATE DONATIONS:
Civic Center Anchor Donor 1,300,000 - - - -
Civic Center Place 2,323,073 200,000 - - -
TRANSFERS IN FROM:
BPW - PILOT 655,000 400,000 400,000 400,000 400,000
Downtown Development Authority 55,000 - 90,000 - -
General Fund - 200,000 275,000 275,000 275,000
Perpetual Care Fund 20,000 - - - -
Specified Donations - WIG 75,000 - - - -
Specified Donations - DeGraaf 70,000 - - - -
Brownfield - Crescent Shores 4,428 - - - -
- - E S T I M A T E D B E G I N N I N G F U N D B A L A N C E A T J U L Y 1 - -
- - F I N A N C I N G S O U R C E S - -
MUNICIPAL CAPITAL PROJECTS
FIVE YEAR PROJECTION SUMMARY
-336-

FY-2017 FY-2018 FY-2019 FY-2020 FY-2021
Budgeted Potential Potential Potential Potential
MUNICIPAL CAPITAL PROJECTS
FIVE YEAR PROJECTION SUMMARY
Holland Charter Township - WIG Projects 318,000 - - - -
Loan from BPW - Snowmelt Refurbishment 500,000 - - - -
Donations - WIG @ CFHZ 250,000 320,000 - - -
Investment Income 20,000 10,000 10,000 10,000 10,000
Laketown Twp - Lakeview School Planning 5,000 - - - -
Rent-Agricultural Land Lease 1,000 1,000 1,000 1,000 1,000
Streetscape (TIF) - - - 500,000 500,000
TOTAL FINANCING SOURCES 14,032,472 1,741,768 6,067,547 7,614,970 12,046,770
MANAGEMENT & ADMINISTRATIVE SERVICES PROJECTS:
Special Planning Funds: Waterfront 25,000 25,000 - - -
Fiber Marketing 25,000 - - - -
Redevelopment Ready Community Funds 25,000 - - - -
Land Acquisition (via Land Contracts) - 25,000 - 25,000 -
Total 75,000 50,000 - 25,000 -
DOWNTOWN PROJECTS:
Ice Rink Planning - 18,000 - - -
Streetscape Refreshment 20,000 - - 500,000 500,000
Snowmelt Refurbishment (Valves, Flushing) 500,000 - - - -
Parking Deck (West 9th Street) - - - 6,000,000 -
Downtown Broadcast System - 50% 25,000 - - - -
Parking and Wayfinding Signage 10,000 20,000 30,000 30,000 30,000
Connections to Waterfront & Kollen Park - - 25,000 - -
Total 555,000 38,000 55,000 6,530,000 530,000
PUBLIC SAFETY PROJECTS:
Downtown Broadcast System - 50% 25,000 - - - -
Fire Station Planning 25,000 - - - -
Kollen Park Kitchen Remodel 25,000 - - - -
Kollen Park Repaint of Living Quarters 11,600 - - - -
Kollen Park Tile Replacement 14,000 - - - -
Fire Station Addition/Renovation (Waverly) - - 6,000,000 - -
Public Safety/Court Parking Garage Repairs 20,000 - - - -
Total 120,600 - 6,000,000 - -
- - F I N A N C I N G U S E S - -
- - F I N A N C I N G S O U R C E S - -
-337-

FY-2017 FY-2018 FY-2019 FY-2020 FY-2021
Budgeted Potential Potential Potential Potential
MUNICIPAL CAPITAL PROJECTS
FIVE YEAR PROJECTION SUMMARY
PARKS, RECREATION & TRANSPORTATION SERVICES PROJECTS:
WIG - Water Line Replacement 410,000 - - - -
WIG - Bandshell/Concert Venue - - 200,000 - -
WIG - Interpretive Plan 15,000 - - - -
WIG - Landscape Plan - 50,000 - - -
WIG - Business Plan Implementation - - - 200,000 -
WIG - Bridge to North - Legacy Project 787,000 1,775,000 - - -
Window-on-the-Waterfront Renovation - 50,000 - - -
Civic Center - Stage Two Design 500,000 - - - -
Civic Center - Project Manager 500,000 200,000 - - -
Civic Center - Construction 10,000,000 - - - -
Civic Center - Market Awnings - - - - 500,000
Civic Center - Maintenance - - 25,000 25,000 25,000
Cemetery Signs 5,000 - - - -
Energy Upgrades 2,250,000 - - - -
- Windows, Lighting Upgrades, HVAC, Building Automations Systems & Bouws Pool Renovations
Transportation Services Building, Sealing 19,000 - - - -
Central and Decentralized Splash Pads (3) 10,000 - - 1,000,000 500,000
DeGraaf Nature Center Entrance Improvement - 330,000 - - -
Dog Parks - West and East Side 25,000 - - - -
City-Wide Tree Planting 50,000 50,000 50,000 50,000 50,000
Lake Macatawa Street Ends 25,000 25,000 25,000 - 25,000
Lakeview Park adjacent to Laketown Township 10,000 25,000 - - 300,000
Moran Park Improvements - - 200,000 - -
Tennis Court Resurfacing - - - 50,000 50,000
VanRaalte Farm Improvements - Legacy 120,000 60,000 - - -
Barrier-Free Trail - Van Raalte - Legacy - 25,000 - - -
Heinz Boardwalk - New Pier & Dock - - - 100,000 -
Kollen Park Railing 60,000 100,000 - - -
Kollen Park - Outdoor Performing Facility - - - - 100,000
Greenhouse Renovation / Combination 250,000 250,000 - - -
Pickle ball Courts - - 35,000 - -
Pilgrim Homes Outdoor Niches 15,000 - - - -
Smallenburg Recreation Center Planning - - - 150,000 -
Smallenburg Recreation Center (3 Gym) - - - - 10,000,000
Salt Storage Building & Transportation Site - 90,000 - - -
Repaving at Transportation Building - - 75,000 75,000 75,000
Leaf Recycling Land/Facility 48th St 3,800 25,000 25,000 25,000 25,000
Paw Paw Park (Funding per 35 year lease) 25,000 - - - -
Baseline Fix It First Costs - Parks 75,000 75,000 50,000 50,000 -
Macatawa Greenway - - - - 250,000
Total 15,154,800 3,130,000 685,000 1,725,000 11,900,000
- - F I N A N C I N G U S E S - -
-338-

FY-2017 FY-2018 FY-2019 FY-2020 FY-2021
Budgeted Potential Potential Potential Potential
MUNICIPAL CAPITAL PROJECTS
FIVE YEAR PROJECTION SUMMARY
COMMUNITY & NEIGHBORHOOD SERVICES PROJECTS:
Cappon & Settlers Homes Improvements 5,000 5,000 5,000 5,000 5,000
Cappon Irrigation 7,000 - - - -
City Float - 25,000 - - -
City Hall Carpet/Chairs/Blinds/Security 50,000 25,000 25,000 - -
Neighborhoods Enhancement Program 1
35,000 50,000 50,000 50,000 50,000
Museum Repairs 13,000 10,000 - 10,000 10,000
Kensington Park Planning - - - - 20,000
Montello Park Rain Garden - 5,000 - - -
Washington Blvd LED Street Lights - 120,000 120,000 - -
JDY Waterfront Planning - 25,000 - - -
Gateway/Wayfinding Signs & Message Boards 90,000 90,000 90,000 - -
Bicycle Highway/Macatawa Greenway ID Signs 5,000 - - - -
Chicago D. Entryway Streetscape Collaboration - 15,000 - 300,000 -
Holland Heights Neighborhood Initiative - - - 50,000 -
Total 205,000 370,000 290,000 415,000 85,000
COMMUNITY ENERGY STRATEGIES PROJECTS:
Contribution to Holland Energy Fund 280,000 - 25,000 - 25,000
Total 280,000 - 25,000 - 25,000
TOTAL FINANCING USES 16,390,400 3,588,000 7,055,000 8,695,000 12,540,000
Reserved:
- Fire Station Renovation / Replacement 592,859 859,145 - 277,044 559,629
- Civic Center Place - - - - -
- Windmill Island - - - - -
Assigned - Legacy Funds 857,942 772,942 772,942 772,942 772,942
Unassigned 2,097,786 70,268 (58,040) (1,415,114) (2,190,929)
Total 3,548,587 1,702,355 714,902 (365,128) (858,358)
1Project funded from Transer-In from BPW - PILOT.
- - E S T I M A T E D E N D I N G F U N D B A L A N C E A T J U N E 3 0 - -
- - F I N A N C I N G U S E S - -
-339-

CAPITAL PROJECTS STREET, BRIDGE AND DRAIN PROJECTS
FUND MISSION STATEMENT To provide a five (5) year construction and financial plan for City capital projects that help preserve or enhance the City’s street system, alleys, and storm drain system; and to assure the City will maintain and expand the street network to serve residential traffic needs; commercial neighborhoods; and a network which will serve existing and provide expansion of the industrial sector of the City.
ACTION PLAN
To plan, design and construct the following street, sidewalk, and storm drainage
improvement projects in the 2016 construction season: - Finish Central Avenue, 3rd Street to State Street - 9th Street, Washington to 8th Street with an extension to snowmelt - MDOT M-40 Safety Project - MDOT US31, 8th to Quincy
To develop a resurfacing program for the summer of 2016 and 2017, using street ratings developed through asset management techniques.
To develop a crack sealing program for the summer of 2016 and 2017, using street ratings
developed through asset management techniques.
To continue planning and engineering for the following projects, in anticipation of construction in calendar years 2017 or 2018.
To identify planning needs for identified projects in future years (2019-2022).
Continue implementation of City’s Stormwater Management Master Plan; and to work with
County Drain Commissions and Inter-County Drain Boards on identifying issues and sources of funding for significant drainage courses that cross the community.
To develop the next phase of the asphalt pathways and Sidewalk Improvement program to be funded from a .05 mill tax levy for sidewalk improvements.
-340-

CAPITAL PROJECTS
STREET, BRIDGE AND DRAIN CAPITAL PROJECTS FUND
FY-2014 FY-2015 FY-2016 FY-2017
Final Final Final Adopted
Description Actual Actual Revised Est. Budget
FUNDING SOURCES -
Taxes & Special Assessments - 0 -$ - 0 -$ 478,811$ 380,850$
Intergovernmental 704,364 1,016,726 300,000 1,230,000
Interest & Rents - 0 - - 0 - - 0 - - 0 -
Other 500 900 435,000 - 0 -
Transfers In 944,578 3,351,733 6,578,013 2,925,744
TOTAL SOURCES 1,649,442$ 4,369,359$ 7,791,824$ 4,536,594$
FUNDING USES -
Capital Outlay 1,649,442$ 4,378,007$ 7,791,824$ 4,536,594$
Transfers Out - 0 - - 0 - - 0 - - 0 -
TOTAL USES 1,649,442$ 4,378,007$ 7,791,824$ 4,536,594$
INCREASE (DECREASE) - 0 -$ (8,648)$ - 0 -$ - 0 -$
ENDING BALANCE -
Designated / Reserved - 0 - - 0 - - 0 - - 0 -
Undesignated / Unreserved 62,424 53,776 53,776 53,776
TOTAL FUND EQUITY 62,424$ 53,776$ 53,776$ 53,776$
Positions: Not Applicable
NOTE:
- - S T A F F I N G - -
- - F U N D I N G S O U R C E S & U S E S - -
- - F U N D E Q U I T Y - -
Electric, Water and Wastewater Fund portions of these projects are included in the Utility Services Group.
-341-

Fiscal Year 2016
Actual Fund Balance - July 1, 2015 2,498,987$ 483,036$ -$ 797,915$ 3,779,938$
FUNDING SOURCES -
Property Taxation & Assessments - - - 1,498,578 1,498,578
Intergovernmental 2,675,083 450,000 330,000 26,215 3,481,298
Fees 20,000 - - - 20,000
Investment Income 20,000 4,000 500 - 24,500
Transfer from Other Funds - - - 3,869,000 3,869,000
TOTAL SOURCES 2,715,083 454,000 330,500 5,393,793 8,893,376
FUNDING USES -
Trunkline Maintenance 8,000 - - - 8,000
Admin, Engineering & Recordkeeping 18,900 - - - 18,900
Street Maintenance 1,389,743 - - - 1,389,743
Transfer to Other Funds 3,783,928 867,074 330,000 6,180,939 11,161,941
TOTAL USES 5,200,571 867,074 330,000 6,180,939 12,578,584
Estimated Fund Balance - June 30, 2016 13,499$ 69,962$ 500$ 10,769$ 94,730$
Fiscal Year 2017
FUNDING SOURCES -
Property Taxation & Assessments - - - 1,437,845 1,437,845
Intergovernmental 2,836,600 450,000 330,000 289,047 3,905,647
Fees 25,000 - - - 25,000
Investment Income 5,000 4,000 1,000 - 10,000
Transfer from Other Funds - - - 620,000 620,000
TOTAL SOURCES 2,866,600 454,000 331,000 2,346,892 5,998,492
FUNDING USES -
Trunkline Maintenance 8,000 - - - 8,000
Admin, Engineering & Recordkeeping 20,000 - - - 20,000
Street Maintenance 1,515,035 - - - 1,515,035
Transfer to Other Funds 1,336,054 375,000 330,000 2,245,744 4,286,798
TOTAL USES 2,879,089 375,000 330,000 2,245,744 5,829,833
Estimated Fund Balance - June 30, 2017 1,010$ 148,962$ 1,500$ 111,917$ 263,389$
SUMMARY OF PROJECTED ACTIVITY
STREET CAPITAL PROJECTS
FISCAL YEARS JULY 1, 2015 - JUNE 30, 2017
MVH Major
Street Fund
Allegan County
Road Tax
Fund
Ottawa County
Road Tax
Fund
Street
Improvement
Reserve Fund Total
-342-

Fiscal Year 2018
Estimated Fund Balance - July 1, 2017 1,010$ 148,962$ 1,500$ 111,917$ 263,389$
FUNDING SOURCES -
Property Taxation & Assessments - - - 1,473,791 1,473,791
Intergovernmental 2,827,364 450,000 338,250 - 3,615,614
Fees 25,000 - - - 25,000
Investment Income 8,000 2,000 1,000 - 11,000
Transfer from Other Funds - - - 500,000 500,000
TOTAL SOURCES 2,860,364 452,000 339,250 1,973,791 5,625,405
FUNDING USES -
Trunkline Maintenance 8,000 - - - 8,000
Admin, Engineering & Recordkeeping 21,000 - - - 21,000
Street Maintenance 1,525,000 - - - 1,525,000
Transfer to Other Funds 1,125,000 397,000 330,000 2,065,000 3,917,000
TOTAL USES 2,679,000 397,000 330,000 2,065,000 5,471,000
Estimated Fund Balance - June 30, 2018 182,374$ 203,962$ 10,750$ 20,708$ 417,794$
Fiscal Year 2019
FUNDING SOURCES -
Property Taxation & Assessments - - - 1,510,636 1,510,636
Intergovernmental 3,017,202 450,000 346,706 - 3,813,908
Fees 20,000 - - - 20,000
Investment Income 10,000 2,000 1,000 - 13,000
Transfer from Other Funds - - - 1,000,000 1,000,000
TOTAL SOURCES 3,047,202 452,000 347,706 2,510,636 6,357,544
FUNDING USES -
Trunkline Maintenance 8,000 - - - 8,000
Admin, Engineering & Recordkeeping 21,500 - - - 21,500
Street Maintenance 1,530,000 - - - 1,530,000
Transfer to Other Funds 1,625,000 600,000 330,000 2,060,000 4,615,000
TOTAL USES 3,184,500 600,000 330,000 2,060,000 6,174,500
Estimated Fund Balance - June 30, 2019 45,076$ 55,962$ 28,456$ 471,344$ 600,838$
Ottawa County
Road Tax
Fund
Street
Improvement
Reserve Fund Total
SUMMARY OF PROJECTED ACTIVITY
MVH Major
Street Fund
Allegan County
Road Tax
Fund
STREET CAPITAL PROJECTS
FISCAL YEARS JULY 1, 2017 - JUNE 30, 2019
-343-

Fiscal Year 2020
Estimated Fund Balance - July 1, 2019 45,076$ 55,962$ 28,456$ 471,344$ 600,838$
FUNDING SOURCES -
Property Taxation & Assessments - - - 1,548,402 1,548,402
Intergovernmental 3,237,765 450,000 355,374 - 4,043,139
Fees 15,000 - - - 15,000
Investment Income 10,000 1,000 1,000 - 12,000
Transfer from Other Funds - - - 1,000,000 1,000,000
TOTAL SOURCES 3,262,765 451,000 356,374 2,548,402 6,618,541
FUNDING USES -
Trunkline Maintenance 8,000 - - - 8,000
Admin, Engineering & Recordkeeping 22,000 - - - 22,000
Street Maintenance 1,540,000 - - - 1,540,000
Transfer to Other Funds 1,625,000 - 330,000 2,110,000 4,065,000
TOTAL USES 3,195,000 - 330,000 2,110,000 5,635,000
Estimated Fund Balance - June 30, 2020 112,841$ 506,962$ 54,830$ 909,746$ 1,584,379$
Fiscal Year 2021
FUNDING SOURCES -
Property Taxation & Assessments - - - 1,587,112 1,587,112
Intergovernmental 3,582,202 450,000 364,258 - 4,396,460
Fees 15,000 - - - 15,000
Investment Income 12,000 3,500 1,500 - 17,000
Transfer from Other Funds - - - 1,000,000 1,000,000
TOTAL SOURCES 3,609,202 453,500 365,758 2,587,112 7,015,572
FUNDING USES -
Trunkline Maintenance 8,000 - - - 8,000
Admin, Engineering & Recordkeeping 22,550 - - - 22,550
Street Maintenance 1,550,000 - - - 1,550,000
Transfer to Other Funds 1,875,000 70,000 350,000 3,845,000 6,140,000
TOTAL USES 3,455,550 70,000 350,000 3,845,000 7,720,550
Estimated Fund Balance - June 30, 2021 266,493$ 890,462$ 70,588$ (348,142)$ 879,401$
SUMMARY OF PROJECTED ACTIVITY
STREET CAPITAL PROJECTS
FISCAL YEARS JULY 1, 2019 - JUNE 30, 2021
Street
Improvement
Reserve Fund Total
MVH Major
Street Fund
Allegan County
Road Tax
Fund
Ottawa County
Road Tax
Fund
-344-

Project: Central Avenue
Estimated Budget: $9.67 million
Project Description: This project, spearheaded by the City of Holland and the Board of Public
Works, contracted to Kaminga & Roodvoets, and entails limited watermain, sanitary sewer,
snowmelt and storm sewer work, ADA sidewalk ramps and reconstruction of the roadway itself.
Historical Fun Fact - Central Avenue currently has what we called Zuidema curbs. They are
called that since they were constructed in the 1920's when the City Engineer was Jacob
Zuidema. Prior to the 1920's Central Avenue was a narrow 20 feet wide. In order to widen the
road, the existing curb head was cut off and an additional 4-5 feet of cement gutter pan was
added. An economical solution at the time!
Construction Limits -
Central Ave from 3rd St to State Street; 19th St from Central to Columbia Avenues and 13th St
from Central to River Avenues.
Phases – (Start Date: Approximately March, 2015) – (Completion Date: October 31, 2016)
*Construction will be done in Four Phases to minimize disruption to residents and businesses.*
1. Central Ave starting just north of 7th Street and north to the Macatawa River north of 3rd
Street.
2. Central Ave from 6th to 9th Street.
3. Central Ave from 9th to 16th Street, including 13th Street from River to Central Avenues.
4. Central Ave from 16th Street to State Street including 19th Street from Central to
Columbia Avenues and 20th Street from State to Central.
-345-

Project: 9th Street Construction
Project Budget: The 9th Street Construction project has a total budget of $8.2 million
Project Description:
This project, presented and controlled by the City of Holland and contracted to Kaminga & Roodvoets,
aims at improving public utilities that include a new water main, some sanitary sewer and storm sewer
improvements, snowmelt distribution between River and Columbia Ave. and snowmelt transmission
between Maple Ave. and the railroad tracks east of Columbia Ave. This project is headlined by the
reconstruction of 9th Street starting west of Washington Avenue and transitioning back to 8th Street by
Fairbanks Ave. Shown below is a map of phases and specific target areas included in this project.
Construction Limits:
This project begins at 9th St. branching off from 8th Street. 9th St. construction continues through up to
the end where 9th St. intersects Van Raalte Ave. Construction is also taking place on College Ave.
running south from 8th to 10 St. intersections.
The map above lists the three phases of the construction project to be executed:
1. Phase one begins at the intersection of Lincoln Ave. and 9th St. and follows 9th all the way to
River Ave.
2. Phase two takes place in two smaller segments. One segment starts at the intersection of
River Ave. and 9th St. and follows East until the intersection of Pine Ave. and 9th St.
3. Phase three take place in two smaller segments as well. The first is the section of 9th St. that
branches off of 8th St. and stops at the intersection of 9th St. and Lincoln Ave. The second
section is from the intersection of 9th St. and Pine Ave. following East up to the end of 9th St. at
Van Raalte Ave.
Time Frame: This Project is expected to start in the middle of May. An expected completion date has
been set for the middle of October, barring any setbacks.
*With the public and their convenience in mind, the City of Holland has segmented this project into
three phases in order to limit accessibility issues. Everyone is encouraged to visit Downtown while
improvements are made.*
-346-

CAPITAL PROJECTS
SIDEWALK IMPROVEMENTS FUND
FY-2014 FY-2015 FY-2016 FY-2017
Final Final Final Adopted
Description Actual Actual Revised Est. Budget
FUNDING SOURCES -
Taxes & Special Assessments 49,543$ 50,105$ 52,609$ 50,550$
Intergovernmental - 0 - - 0 - - 0 - 5,067
Interest & Rents 602 504 206 203
Other - 0 - - 0 - - 0 - - 0 -
Transfers In - 0 - - 0 - 65,000 15,000
TOTAL SOURCES 50,145$ 50,609$ 117,815$ 70,820$
FUNDING USES -
SIDEWALKS - REPAIRS
Capital Outlay 26,884$ 27,106$ 40,000$ 20,000$
SIDEWALKS - ASPHALT WALKS
Capital Outlay 632 15,033 65,000 50,000
SIDEWALKS - BRICK MAINT/REPAIRS
Capital Outlay 1,671 773 1,000 1,000
SIDEWALKS - PROJECTS
Capital Outlay - 0 - - 0 - - 0 - - 0 -
Transfers Out - Resurface HMA Pathways - 0 - 42,581 38,800 - 0 -
TOTAL USES 29,187$ 85,493$ 144,800$ 71,000$
INCREASE (DECREASE) 20,958$ (34,884)$ (26,985)$ (180)$
ENDING BALANCE -
Designated / Reserved - 0 - - 0 - - 0 - - 0 -
Undesignated / Unreserved 65,364 30,480 3,495 3,315
TOTAL FUND EQUITY 65,364$ 30,480$ 3,495$ 3,315$
Positions: Not Applicable
- - S T A F F I N G - -
- - F U N D E Q U I T Y - -
- - F U N D I N G S O U R C E S & U S E S - -
-347-

FY-2017 FY-2018 FY-2019 FY-2020 FY-2021
Budgeted Projected Projected Projected Projected
ELECTRIC UTILITY PROJECTS (Further Informatiuon on Various Pages in Utilities Service Group):
Financing Sources:
Electric Fund - Net Revenues & Earnings 20,983,652 17,124,542 20,324,785 21,766,457 23,966,036
Financed from Cash Reserves 21,634,337 (9,817,632) (14,874,785) (16,446,457) (20,941,036)
Bond Issue Proceeds - - - -
42,617,989 7,306,910 5,450,000 5,320,000 3,025,000
Financing Uses:
Power Resources 33,938,289 1,691,910 1,900,000 2,050,000 -
Electric Transmission and Distribution
& Allocated Admin Projects 8,679,700 5,615,000 3,550,000 3,270,000 3,025,000
42,617,989 7,306,910 5,450,000 5,320,000 3,025,000
WATER UTILITY PROJECTS (Further Informatiuon on Various Pages in Utilities Service Group):
Financing Sources:
Water Fund - Net Revenues & Earnings 2,738,676 2,725,514 2,980,163 3,061,877 3,163,261
Financed from Cash Reserves 1,147,804 296,986 593,837 (497,076) 17,739
3,886,480 3,022,500 3,574,000 2,564,801 3,181,000
Financing Uses:
Water Plant 664,630 577,000 575,000 512,000 296,000
Water Distribution & Allocated Admin 3,221,850 2,445,500 2,999,000 2,052,801 2,885,000
3,886,480 3,022,500 3,574,000 2,564,801 3,181,000
WASTEWATER UTILITY PROJECTS (Further Informatiuon on Various Pages in Utilities Service Group):
Financing Sources:
Wastewater Fund - Net Revenues & Earnings 978,389 302,802 287,769 376,643 443,128
Financed from Cash Reserves (5,717,639) 4,131,498 2,494,831 1,973,510 7,093,189
Bond Issue Proceeds 9,500,000 - - - -
4,760,750 4,434,300 2,782,600 2,350,153 7,536,317
Financing Uses:
Wastewater Plant 2,043,900 993,000 905,000 757,000 5,705,000
Wastewater Collection & Allocated Admin 2,716,850 3,441,300 1,877,600 1,593,153 1,831,317
4,760,750 4,434,300 2,782,600 2,350,153 7,536,317
MUNICIPAL UTILITIES CAPITAL PROJECTS
FIVE YEAR CAPITAL IMPROVEMENT PROGRAM
- - F U N D I N G S O U R C E S & U S E S - -
ELECTRIC - WATER - WASTEWATER
-348-

Holland Energy Park
What began in 2006 as a project to explore energy capacity expansion for the HBPW energy plant
became a sustainability journey unique in the utility industry. After concluding a Sustainable
Return on Investment (SROI) in 2011, and assembling a community stakeholder panel to
collaborate on the architectural design in 2012, a vision came together that will make this an
architecturally distinctive energy plant and park.
HBPW began planning for extensive materials reuse from the demolition site and collaborated
with local charities to re-purpose building materials from vacated properties at the 26-acre site.
On April 21, 2015, a groundbreaking ceremony at Holland Energy Park kicked off the project and
Barton Malow; a Michigan-based firm began construction.
In July of 2016, a prestigious award was handed out by the Institute for Sustainable Infrastructure.
This organization gave Holland Energy Park the Envision Platinum award recognizing the
sustainability and public infrastructure the park will provide. This park is the first-in-the-country
power generating plant to receive an Envision rating. This award validates the Board of Public
Work’s dedication and commitment to sustainable energy and its community.
The Energy Park, when complete in 2017, will include walking paths through the park that will
connect to the Macatawa Greenway trail system. Environmentally sensitive landscaping and
water retention features will also reduce runoff to the wetlands surrounding the Energy Park.
Budget: $240 Million
Current Status: On schedule and within budget
Major Milestones:
Demolition complete October, 2014
Engineer, Procure, Construct (EPC) contract signed: January, 2015
Groundbreaking ceremony April, 2015
Major equipment deliveries:
Combustion turbine delivery (CTG): July, 2015
Heat Recovery Steam Generators (HRSG’s) August, 2015
Steam Turbine Generator (STG) September, 2015
Building structural steel complete January, 2016
First fire November, 2016
Guaranteed substantial completion February, 2017
Projected public open house Summer, 2017
-349-

Cooling Towers (2016)
Administration Area (2016)
-350-

Heat Recovery Steam Generator (HRSG) Room (2016)
-351-

WRF Improvements Project
The Holland Area Water Reclamation Facility (WRF) is in the midst of major improvements that
will substantially increase its efficiency in handling waste and reducing energy consumption.
New equipment and processes are being integrated into the existing treatment infrastructure,
eliminating the need for facility expansion.
Leading edge bio solids dewatering and thickening technologies are being installed to allow the
dewatered solids to be hauled to a local landfill and help augment methane gas production
(which in turn is used for power generation). High purity oxygen is also being added to the
aeration process and will eliminate the need for electric power that is currently used for this
process.
By replacing outdated equipment with newer, more efficient technologies and processes the
WRF is ensuring effective treatment for years to come.
Budget: $20 Million
Current Status: On schedule and within budget
Major Milestones:
Design Completion: December 2014
Construction Start: April 2015
Major Equipment Deliveries: June-October 2015
Biosolids Substantial Completion: November 2015
Secondary Treatment Substantial Completion: November 2016
-352-

Installation of a screw press for sludge dewatering
Spray jets and drum of screw press equipment
-353-

Amount
Lake Macatawa Street Ends 1,000$
- Grounds Maintenance
Dog Parks 1,500
- Grounds Maintenance
Energy Upgrades (99,000)
- Utility Costs
Windmill Island Bridge 5,000
- Grounds Maintenance (to be shared by Holland Towhship)
Central Avenue (1,500)
- Grounds Maintenance
9th Street & Central Avenue 500
- Additional snowmelt utility costs due to expansion
The majority of the projects are one time expenditures and will not financially impact operating budgets.
IMPACT OF CAPITAL PROJECTS ON OPERATING BUDGETS
Project Description
Municipal Capital Improvement Projects
Street Projects
-354-

> FULL-TIME EMPLOYEE TRENDS AT FTE
> PART-TIME EMPLOYEE TRENDS AT FTE
> FULL-TIME SUMMARY BY DEPARTMENT
> FULL-TIME SUMMARY BY GROUP AND FUND
> PART-TIME SUMMARY BY DEPARTMENT
> PART-TIME SUMMARY BY GROUP AND FUND
> DETAIL BY POSITION WITHIN DEPARTMENT
APPENDIX A
PERSONNEL SCHEDULE
-355-

PERSONNEL SUMMARY __________________________________________________________ State Revenue Sharing is projected to increase 21.6%, with an increase in Gas & Weight Tax revenue and reimbursement for the loss of personal property tax. The additional revenue will help offset the 3.1% drop in tax revenue due to a decrease in taxable value. The increased revenue allows three (3) full-time positions that have not been funded for several years to be re-instated. The number of full-time employees for FY-2017 is budgeted to increase by 6.0 FTE. Below is a summary of the departments/funds that will experience a change in staff. General Fund Departments Positions Recreation + 1.00 Streets Division + 1.00 Other Funds Utilities + 3.00 Technology Services + 1.00 A retirement in the Assessor’s Office (General Fund) reduced the FTE from 5.1 to 4.1 in FY-2016. This position remains vacant and unfunded, Various employees have time allocated to more than one (1) department/fund and the distribution may be adjusted each year without changing the total number of positions, depending on departmental needs. There are additional full time positions for grants that are not included in the budget or on the Personnel Worksheets. The CDBG Entitlement Grant funds .95 FTE and the Public Safety Grants fund 3.0 FTE for FY-2017.
-356-

FY-08 FY-09 FY-10 FY-11 FY-12 FY-13 FY-14 FY-15 FY-16 FY-17
City Council 0.25 0.24 0.24 0.25 0.25 0.25 0.25 0.20 0.20 0.20
City Manager 2.70 2.60 2.60 2.50 2.50 2.50 2.35 2.05 1.97 1.97
Finance 6.00 5.90 5.90 6.15 6.15 6.20 6.00 4.50 5.00 5.00
Property Assessing 5.05 5.10 5.10 5.10 5.10 4.10 5.10 5.10 4.10 4.10
City Clerk 3.25 2.25 2.25 2.25 2.25 2.00 2.00 2.00 2.00 2.00
Human Resources 2.25 2.24 2.24 2.25 2.25 1.25 1.25 1.60 1.60 1.60
Procurement 0.45 0.45 0.45 0.00 0.00 0.00 0.00 0.00 0.00 0.00
Treasurer 2.85 2.85 1.90 1.90 1.90 1.85 1.85 2.35 2.80 2.80
City Hall & Grounds 1.00 1.00 1.00 1.00 1.00 1.00 1.00 1.00 0.60 0.60
Cemeteries 4.15 3.15 3.15 2.40 2.90 2.90 2.35 2.35 2.35 2.35
Volunteer Services 0.25 0.24 0.24 0.10 0.10 0.10 0.10 0.10 0.10 0.10
Planning & Zoning 3.10 3.20 3.20 2.67 2.60 2.40 1.90 2.10 1.60 1.60
Public Safety - Management 0.00 0.00 0.00 0.00 6.00 6.00 6.00 6.00 6.00 6.00
Public Safety - Police Division 71.50 69.50 67.00 66.00 59.00 59.00 58.00 58.00 58.00 58.00
Public Safety - Fire Division 28.00 27.00 26.00 25.00 22.00 19.00 19.00 19.00 19.00 19.00
Fire (Part-Paid) 30.00 30.00 30.00 30.00 30.00 30.00 30.00 30.00 30.00 30.00
Environmental Health & Insp 5.48 5.38 5.38 5.48 5.28 4.11 3.31 4.51 4.51 4.51
Construction Inspections 4.62 4.62 4.57 3.17 3.37 3.37 3.42 3.42 5.47 5.47
Streets Division 19.81 19.90 19.90 17.90 18.15 16.10 15.65 15.65 15.65 16.65
Transp. Mgmt & Engineering 2.90 3.00 3.00 2.90 2.60 2.58 2.35 2.35 3.35 3.35
Community Social Services 0.05 0.05 0.05 0.05 0.05 0.00 0.00 0.00 0.00 0.00
Housing & Neighborhood Svcs 2.05 2.05 2.05 1.05 1.05 1.05 1.50 1.90 1.87 1.87
Economic Development 0.50 0.44 0.44 0.90 0.90 0.90 1.10 0.10 0.10 0.10
Human Relations 1.75 1.75 1.75 1.75 1.75 1.00 0.00 1.00 1.00 1.00
Parks & Recreation Admin 0.60 0.60 0.60 0.60 1.25 0.39 0.70 0.50 0.50 0.50
Recreation 4.00 4.00 4.00 4.00 3.50 3.45 3.45 3.50 3.50 4.50
Parks 10.40 10.40 9.40 9.15 8.20 7.00 8.15 8.15 9.55 9.55
Municipal Stadium 0.30 0.30 0.30 0.30 0.75 0.00 0.00 0.00 0.00 0.00
DeGraaf Nature Center 1.95 1.95 1.95 1.95 1.95 1.95 1.95 1.95 1.95 1.95
8th Street Market 0.15 0.10 0.10 0.10 0.10 0.10 0.10 0.15 0.40 0.40
Civic Center 1.50 1.50 1.50 1.50 1.30 1.30 1.30 1.45 1.45 1.45
General Fund Total 216.86 211.76 206.26 198.37 194.20 181.85 180.13 180.98 184.62 186.62
PERSONNEL WORKSHEET
FULL TIME EMPLOYEE TRENDS - GENERAL FUND
-357-

FY-08 FY-09 FY-10 FY-11 FY-12 FY-13 FY-14 FY-15 FY-16 FY-17
Downtown Public Parking 0.30 0.30 0.20 0.20 0.20 0.30 0.15 0.15 0.15 0.20
Downtown Develop. Authority 1.00 1.00 1.10 1.10 1.10 1.45 0.475 0.475 0.45 0.65
Principal Shopping District 0.85 0.90 0.90 1.90 1.90 1.45 2.375 2.525 2.15 1.90
CATV Public Access Television 0.01 0.01 0.01 0.01 0.02 0.20 0.20 2.20 2.20 2.20
Solid Waste Recycling 0.10 0.20 0.20 0.20 0.20 0.87 0.67 0.67 0.67 0.67
Windmill Island Gardens 2.00 2.00 2.00 2.00 2.05 2.00 2.00 2.00 2.00 2.00
Municipal Airport Fac & Mgmt 0.00 0.24 0.24 0.00 0.00 0.00 0.00 0.20 0.16 0.16
Public Transp Facilities & Mgmt 2.75 2.75 4.50 0.00 0.00 0.00 0.00 0.00 0.00 0.00
Technology Services 4.00 4.00 4.00 3.99 3.98 3.80 3.80 3.60 3.60 4.60
Centralized Vehicle / Equipment 8.93 8.94 8.44 7.75 7.80 7.78 7.00 7.00 7.00 7.00
Other Funds Total 19.94 20.34 21.59 17.15 17.25 17.85 16.67 18.82 18.38 19.38
General City Total 236.80 232.10 227.85 215.52 211.45 199.70 196.80 199.80 203.00 206.00
Board of Public Works 185.00 186.00 183.00 182.00 179.00 177.00 178.00 173.00 174.00 177.00
Holland Historical Trust 6.00 6.00 6.00 4.00 4.00 4.00 6.00 4.00 4.00 4.00
Grand Total 427.80 424.10 416.85 401.52 394.45 380.70 380.80 376.80 381.00 387.00
PERSONNEL WORKSHEET
FULL TIME EMPLOYEE TRENDS - OTHER FUNDS
-358-

0
25
50
75
100
125
150
175
200
225
250
275
'08 '09 '10 '11 '12 '13 '14 '15 '16 '17
N
U
M
B
E
R
O
F
E
M
P
L
O
Y
E
E
S
CITY OF HOLLANDEMPLOYMENT TREND
Total General City Board of Public Works
NOTE: THE EMPLOYMENT TREND INCLUDES FULL-TIME AND PART-TIME "A" EMPLOYEES.
-359-

FY-08 FY-09 FY-10 FY-11 FY-12 FY-13 FY-14 FY-15 FY-16 FY-17
City Manager 0.00 0.00 0.00 0.00 0.00 0.05 0.10 1.05 1.00 1.15
Election 0.00 0.00 0.00 0.00 0.00 1.20 0.75 1.50 1.50 1.25
Finance 0.05 0.10 0.00 0.00 0.00 0.05 0.00 0.45 0.60 0.60
Property Assessing 0.50 0.50 0.50 0.50 0.70 0.70 0.00 0.00 0.00 0.50
City Clerk 0.55 0.50 0.40 0.45 0.50 0.50 0.70 1.50 1.75 2.50
Treasurer 0.10 0.50 1.00 1.00 0.60 0.60 0.60 0.70 0.00 0.00
City Hall & Grounds 0.10 0.05 0.05 0.05 0.05 0.10 0.00 0.00 0.00 0.00
Cemeteries 1.60 1.95 2.25 2.80 2.80 2.95 2.30 2.65 3.05 3.05
Planning & Zoning 0.30 0.25 0.20 0.20 0.20 1.00 0.30 0.30 0.30 0.30
Public Safety - Management 0.00 0.00 0.00 0.00 0.65 0.65 0.65 0.65 0.65 0.65
Public Safety - Police Division 8.85 9.45 9.60 9.55 8.50 8.15 8.20 9.25 8.90 8.90
Environmental Health & Insp. 0.05 0.20 0.10 0.10 0.10 0.35 0.30 0.10 0.00 0.00
Construction Inspections 0.05 0.10 0.15 0.65 0.65 0.85 0.75 0.75 1.00 1.25
Streets Division 0.05 0.45 1.15 0.95 1.10 1.20 1.20 1.10 1.10 1.10
Transp. Mgmt & Engineering 0.10 0.10 0.10 0.50 0.45 0.35 0.30 0.30 0.30 0.35
Housing & Neighborhoods 0.05 0.60 0.60 0.65 0.65 0.40 0.65 0.65 0.05 0.10
Economic Development 0.00 0.00 0.00 0.20 0.45 0.60 0.40 0.00 0.00 0.00
Human Relations 0.50 0.50 0.50 0.50 0.50 0.50 1.10 0.50 0.50 0.50
Recreation 0.95 0.95 0.95 0.95 0.70 0.90 1.20 1.20 1.20 1.10
Parks 10.70 11.25 11.45 11.45 11.55 11.40 11.70 14.15 14.50 14.20
DeGraaf Nature Center 2.30 2.30 2.25 2.15 2.20 2.20 1.80 1.80 1.85 2.10
Kollen Park Boat Launch 0.00 0.00 0.00 0.00 0.00 0.00 0.00 0.00 0.00 0.00
8th Street Market 0.85 0.80 0.80 0.85 0.90 0.90 1.00 1.05 0.75 0.90
Civic Center 2.00 2.00 2.00 2.00 1.90 1.90 1.85 2.10 1.80 0.80
General Fund Total 29.65 32.55 34.05 35.50 35.15 37.50 35.85 41.75 40.80 41.30
Downtown Public Parking 0.55 0.75 0.55 0.60 0.60 0.75 0.85 0.90 0.85 0.85
Downtown Develop. Authority 0.15 0.25 0.40 0.40 0.40 0.45 0.60 0.65 0.65 0.65
Principal Shopping District 0.70 1.15 1.20 0.70 0.95 2.50 1.40 1.35 1.35 1.35
CATV Public Access Television 0.00 0.00 0.00 0.00 0.00 1.40 1.40 0.20 0.20 0.20
Solid Waste Recycling 0.80 0.80 0.70 0.70 0.70 0.70 0.70 0.70 0.70 0.70
Windmill Island Gardens 11.95 12.15 12.15 11.55 11.10 11.10 11.10 11.40 11.70 11.70
Railroad Depot 0.00 0.00 0.00 0.00 0.00 0.00 0.00 0.00 0.00 0.00
Municipal Airport Fac & Mgmt 0.00 0.00 0.00 0.00 0.00 0.00 0.00 0.35 0.35 0.35
Public Transp Facilities & Mgmt 2.10 2.85 1.85 0.35 0.35 0.15 0.00 0.00 0.00 0.00
Centralized Vehicle / Equipment 1.00 1.00 1.00 1.05 1.00 1.15 1.15 1.70 1.75 1.85
Other Funds Total 17.25 18.95 17.85 15.35 15.10 18.20 17.20 17.25 17.55 17.65
General City Total 46.90 51.50 51.90 50.85 50.25 55.70 53.05 59.00 58.35 58.95
Holland Historical Trust 2.23 2.23 2.23 4.11 2.36 2.36 1.76 1.43 1.83 1.83
Grand Total 49.13 53.73 54.13 54.96 52.61 58.06 54.81 60.43 60.18 60.78
PERSONNEL WORKSHEET
PART TIME EMPLOYEE TRENDS
-360-

DEPARTMENT FY 14 FY 15 FY 16 POSITIONS PERCENT
City Council 0.25 0.20 0.20 0.20 0.05%
City Manager 2.35 2.05 1.97 1.97 0.51%
Finance 6.00 4.50 5.00 5.00 1.29%
Property Assessing 5.10 5.10 4.10 4.10 1.06%
City Clerk 2.00 2.00 2.00 2.00 0.52%
Human Resources 1.25 1.60 1.60 1.60 0.41%
Treasurer 1.85 2.35 2.80 2.80 0.72%
City Hall & Grounds 1.00 1.00 0.60 0.60 0.16%
Cemeteries 2.35 2.35 2.35 2.35 0.61%
Volunteer Services 0.10 0.10 0.10 0.10 0.03%
Planning & Zoning 1.90 2.10 1.60 1.60 0.41%
Public Safety - Management 6.00 6.00 6.00 6.00 1.55%
Public Safety - Police Division 58.00 58.00 58.00 58.00 14.99%
Public Safety Fire Division 49.00 49.00 49.00 49.00 12.66%
Environmental Health & Inspections 3.31 4.51 4.51 4.51 1.17%
Construction Inspections 3.42 3.42 5.47 5.47 1.41%
Streets Division 15.65 15.65 15.65 16.65 4.30%
Transportation Management & Engineering 2.35 2.35 3.35 3.35 0.87%
Housing & Neighborhoods 1.50 1.90 1.87 1.87 0.48%
Economic Development 1.10 0.10 0.10 0.10 0.03%
Human Relations 0.00 1.00 1.00 1.00 0.26%
Parks & Recreation Administration 0.70 0.50 0.50 0.50 0.13%
Recreation 3.45 3.50 3.50 4.50 1.16%
Parks 8.15 8.15 9.55 9.55 2.47%
DeGraaf Nature Center 1.95 1.95 1.95 1.95 0.50%
8th Street Market 0.10 0.15 0.40 0.40 0.10%
Civic Center 1.30 1.45 1.45 1.45 0.37%
Downtown Public Parking 0.15 0.15 0.15 0.20 0.05%
Downtown Development Authority 0.475 0.475 0.45 0.65 0.17%
Downtown Principal Shopping District 2.375 2.525 2.15 1.90 0.49%
CATV Public Access Television 0.20 2.20 2.20 2.20 0.57%
Solid Waste Recycling 0.67 0.67 0.67 0.67 0.17%
Windmill Island Gardens 2.00 2.00 2.00 2.00 0.52%
Municipal Airport Facilities Management 0.00 0.20 0.16 0.16 0.04%
Board of Public Works:
- Power Supply 43.00 36.00 37.00 38.00 9.83%
- Electric Transmission & Distribution 27.00 27.00 27.00 27.00 6.98%
- Wastewater Treatment 19.00 19.00 19.00 19.00 4.91%
- Water Treatment 11.00 11.00 11.00 11.00 2.84%
- Water Distribution / Wastewater Collection 19.00 19.00 19.00 19.00 4.91%
- Administration 4.00 4.00 4.00 4.00 1.03%
- Accounting & Collections 11.00 12.00 12.00 12.00 3.10%
- Business Services 11.00 11.00 11.00 11.00 2.84%
- Information Technology 11.00 11.00 10.00 11.00 2.84%
- Customer Svc, Marketing & Engery Optimizatn 13.00 14.00 15.00 16.00 4.13%
- Purchasing, Facilities, Warehousing & Meters 9.00 9.00 9.00 9.00 2.33%
Technology Services 3.80 3.60 3.60 4.60 1.19%
Centralized Vehicle / Equipment 7.00 7.00 7.00 7.00 1.81%
Holland Historic Trust 6.00 4.00 4.00 4.00 1.03%
TOTAL 380.80 376.80 381.00 387.00 100.00%
PERSONNEL WORKSHEET
POSITIONS FY 17
FULL TIME POSITIONS - BY DEPARTMENT
-361-

GROUP FY 14 FY 15 FY 16 POSITIONS PERCENT
Management & Administration 6.15 9.15 9.07 9.07 2.34%
Fiscal Services 12.95 11.95 11.90 11.90 3.07%
Public Safety 113.00 113.00 113.00 113.00 29.20%
Transportation 25.00 25.20 26.16 27.16 7.02%
Community & Neighborhood Services 16.00 17.00 17.97 17.97 4.64%
Parks & Recreation 25.90 23.90 25.30 26.30 6.80%
BPW - Utility Services 178.00 173.00 174.00 177.00 45.74%
Internal Services 3.80 3.60 3.60 4.60 1.19%
TOTAL 380.80 376.80 381.00 387.00 100.00%
FUND FY 14 FY 15 FY 16 POSITIONS PERCENT
General Operating 180.13 180.98 184.62 186.62 48.22%
Downtown Public Parking 0.15 0.15 0.15 0.20 0.05%
Mainstreet/DDA 0.48 0.475 0.450 0.65 0.17%
Principal Shopping District 2.38 2.525 2.150 1.90 0.49%
CATV Public Access Television 0.20 2.20 2.20 2.20 0.57%
Solid Waste Recycling 0.67 0.67 0.67 0.67 0.17%
Windmill Island Gardens 2.00 2.00 2.00 2.00 0.52%
Municipal Airport Facilities Management 0.00 0.20 0.16 0.16 0.04%
Board of Public Works Utilities 178.00 173.00 174.00 177.00 45.74%
Technology Services 3.80 3.60 3.60 4.60 1.19%
Centralized Vehicle / Equipment 7.00 7.00 7.00 7.00 1.81%
Holland Historic Trust 6.00 4.00 4.00 4.00 1.03%
TOTAL 380.80 376.80 381.00 387.00 100.00%
FY 17POSITIONS
PERSONNEL WORKSHEET
FULL TIME POSITIONS - BY SERVICE GROUP & FUND
POSITIONS FY 17
-362-

PERSONNEL CHART PRESENTATION
TOTAL FULL-TIME POSITIONS WITHIN GROUPS
0
50
100
150
200
Ma
nag
em
ent
&A
dm
inis
tra
tio
n
Fis
cal S
erv
ice
s
Public
Safe
ty
Tra
nspo
rtation
Co
mm
unity &
Ne
igh
borh
ood S
erv
ices
Park
s &
Recre
atio
n
BP
W -
Utilit
y S
erv
ice
s
Inte
rnal S
erv
ices
Positio
ns
Division
FY-14 thru FY-17 Full Time Positions Summary Across All Groups
FY 14 FY 15 FY 16 FY 17
Management & Administration
2.34%
Fiscal Services3.07%
Public Safety 29.20%
Transportation7.02%
Community & Neighborhood Services
4.64% Parks & Recreation6.80%
BPW - Utility Services45.74%
Internal Services1.19%
FY-17 Full Time Positions Percentage Summary Across All Groups
-363-

DEPARTMENT FY 14 FY 15 FY 16 POSITIONS PERCENT
City Manager 0.10 1.05 1.00 1.15 1.89%
Election 0.75 1.50 1.50 1.25 2.06%
Finance 0.00 0.45 0.60 0.60 0.99%
Property Assessing 0.00 0.00 0.00 0.50 0.82%
Clerk 0.70 1.50 1.75 2.50 4.11%
Treasurer 0.60 0.70 0.00 0.00 0.00%
City Hall & Grounds 0.00 0.00 0.00 0.00 0.00%
Cemeteries 2.30 2.65 3.05 3.05 5.02%
Planning & Zoning 0.30 0.30 0.30 0.30 0.49%
Public Safety - Management 0.65 0.65 0.65 0.65 1.07%
Public Safety - Police Division 8.20 9.25 8.90 8.90 14.64%
Environmental Health & Inspections 0.30 0.10 0.00 0.00 0.00%
Construction Inspections 0.75 0.75 1.00 1.25 2.06%
Streets Division 1.20 1.10 1.10 1.10 1.81%
Transportation Management & Engineering 0.30 0.30 0.30 0.35 0.58%
Housing & Neighborhoods 0.65 0.65 0.05 0.10 0.16%
Economic Development 0.40 0.00 0.00 0.00 0.00%
Human Relations 1.10 0.50 0.50 0.50 0.82%
Recreation 1.20 1.20 1.20 1.10 1.81%
Parks 11.70 14.15 14.50 14.20 23.36%
DeGraaf Nature Center 1.80 1.80 1.85 2.10 3.46%
8th Street Market 1.00 1.05 0.75 0.90 1.48%
Civic Center 1.85 2.10 1.80 0.80 1.32%
Downtown Public Parking 0.85 0.90 0.85 0.85 1.40%
Downtown Development Authority 0.60 0.65 0.65 0.65 1.07%
Downtown Principal Shopping District 1.40 1.35 1.35 1.35 2.22%
CATV Public Access Television 1.40 0.20 0.20 0.20 0.33%
Solid Waste Recycling 0.70 0.70 0.70 0.70 1.15%
Windmill Island Gardens 11.10 11.40 11.70 11.70 19.25%
Municipal Airport Facilities Mgmt 0.00 0.35 0.35 0.35 0.58%
Public Transportation Facilities & Mgmt 0.00 0.00 0.00 0.00 0.00%
Centralized Vehicle / Equipment 1.15 1.70 1.75 1.85 3.04%
Holland Historic Trust 1.76 1.43 1.83 1.83 3.01%
TOTAL 54.81 60.43 60.18 60.78 100.00%
PERSONNEL WORKSHEET
PART TIME POSITIONS - BY DEPARTMENT
POSITIONS FY 17
-364-

GROUP FY 14 FY 15 FY 16 POSITIONS PERCENT
Management & Administration 4.05 4.75 4.95 5.60 9.21%
Fiscal Services 0.60 1.15 0.60 1.10 1.81%
Public Safety 8.85 9.90 9.55 9.55 15.71%
Transportation 2.65 3.45 3.50 3.65 6.01%
Community & Neighborhood Services 6.95 6.45 5.65 6.10 10.04%
Parks & Recreation 31.71 34.73 35.93 34.78 57.22%
TOTAL 54.81 60.43 60.18 60.78 100.00%
FUND FY 14 FY 15 FY 16 POSITIONS PERCENT
General Operating 35.85 41.75 40.80 41.30 67.95%
Downtown Public Parking 0.85 0.90 0.85 0.85 1.40%
Downtown Development Authority 0.60 0.65 0.65 0.65 1.07%
Downtown Principal Shopping District 1.40 1.35 1.35 1.35 2.22%
CATV Public Access Television 1.40 0.20 0.20 0.20 0.33%
Solid Waste Recycling 0.70 0.70 0.70 0.70 1.15%
Windmill Island Gardens 11.10 11.40 11.70 11.70 19.25%
Municipal Airport Facilities Mgmt 0.00 0.35 0.35 0.35 0.58%
Public Transportation Facilities & Mgmt 0.00 0.00 0.00 0.00 0.00%
Centralized Vehicle / Equipment 1.15 1.70 1.75 1.85 3.04%
Holland Historic Trust 1.76 1.43 1.83 1.83 3.01%
TOTAL 54.81 60.43 60.18 60.78 100.00%
POSITIONS FY 17
PERSONNEL WORKSHEET
PART TIME POSITIONS - BY SERVICE GROUP & FUND
POSITIONS FY 17
-365-

PERSONNEL CHART PRESENTATION
TOTAL PART-TIME POSITIONS WITHIN GROUPS
0
8
16
24
32
40
Ma
nag
em
ent
&A
dm
inis
tra
tio
n
Fis
cal S
erv
ice
s
Public
Safe
ty
Tra
nspo
rtation
Co
mm
unity &
Ne
igh
borh
ood S
erv
ices
Park
s &
Recre
atio
n
Positio
ns
Division
FY-14 thru FY-17 Part-Time Positions Summary Across All Groups
FY 14 FY 15 FY 16 FY 17
Management & Administration
9.21%
Fiscal Services1.81%
Public Safety 15.71%
Transportation6.01%
Community & Neighborhood Services10.04%
Parks & Recreation 57.22%
FY-17 Part-Time Positions Percentage Summary Across All Groups
-366-

APPROVED
DEPARTMENT / POSITION FY 14 FY 15 FY 16 FY 17
CITY COUNCIL
*** FULL TIME ***
Executive Assistant I 0.25 0.20 0.20 0.20
*** ELECTED OFFICIALS ***
Mayor 1.00 1.00 1.00 1.00
Council Member:
At-Large Representatives 2.00 2.00 2.00 2.00
Ward Representatives 6.00 6.00 6.00 6.00
Total Elected Officials 9.00 9.00 9.00 9.00
Total Full Time & Elected Officials 9.25 9.20 9.20 9.20
CITY MANAGER
*** FULL TIME ***
City Manager 0.95 0.95 0.85 0.85
Assistant City Manager 0.35 0.00 0.00 0.00
Assistant to City Manager 0.00 0.20 0.20 0.20
Executive Assistant IV 0.00 0.80 0.82 0.82
Executive Assistant II 0.90 0.00 0.00 0.00
Executive Assistant I 0.15 0.10 0.10 0.10
Total Full Time 2.35 2.05 1.97 1.97
*** PART TIME ***
Technical Assistant 0.10 1.05 1.00 1.15
Total Full & Part Time FTE 2.45 3.10 2.97 3.12
ELECTION
*** PART TIME ***
Clerical Assistant 0.75 1.50 1.50 1.25
CITY CLERK
*** FULL TIME ***
Deputy City Clerk 1.00 1.00 1.00 1.00
Administrative Aide I 0.00 0.00 1.00 1.00
Departmental Assistant I 1.00 1.00 0.00 0.00
Total Full Time 2.00 2.00 2.00 2.00
MANAGEMENT & ADMINISTRATION
ACTUAL
-367-

APPROVED
DEPARTMENT / POSITION FY 14 FY 15 FY 16 FY 17
CITY CLERK
*** PART TIME ***
Clerical Assistant 0.70 1.50 1.75 2.50
Total Full & Part Time FTE 2.70 3.50 3.75 4.50
HUMAN RESOURCES
*** FULL TIME ***
Director of Human Resources 1.00 1.00 1.00 1.00
Executive Assistant I 0.25 0.60 0.60 0.60
Total Full Time 1.25 1.60 1.60 1.60
VOLUNTEER SERVICES
*** FULL TIME ***
Executive Assistant I 0.10 0.10 0.10 0.10
HUMAN RELATIONS
*** FULL TIME ***
Human/International Relations Coord 0.000 1.000 1.000 1.000
Total Full Time 0.000 1.000 1.000 1.000
*** PART TIME ***
Youth Services Coordinator 0.500 0.500 0.500 0.500
International Relations Coordinator 0.300 0.000 0.000 0.000
Human Relations Coordinator 0.300 0.000 0.000 0.000
Total Part-Time 1.100 0.500 0.500 0.500
CATV PUBLIC ACCESS TELEVISION
*** FULL TIME ***
Technology Services Coordinator 0.20 0.20 0.20 0.20
Multi-Media Specialist 0.00 2.00 2.00 2.00
Total Full Time 0.20 2.20 2.20 2.20
*** PART TIME ***
Multi-Media Specialist 1.40 0.20 0.20 0.20
Total Full & Part Time FTE 1.60 2.40 2.40 2.40
MANAGEMENT & ADMINISTRATION
ACTUAL
-368-

APPROVED
DEPARTMENT / POSITION FY 14 FY 15 FY 16 FY 17
MANAGEMENT & ADMINISTRATIVE SERVICES TOTAL
Full Time 6.15 9.15 9.07 9.07
Part Time 4.05 4.75 4.95 5.60
Elected Officials 9.00 9.00 9.00 9.00
Total Full & Part Time FTE 19.20 22.90 23.02 23.67
ACTUAL
MANAGEMENT & ADMINISTRATION
-369-

APPROVED
DEPARTMENT / POSITION FY 14 FY 15 FY 16 FY 17
FINANCE
*** FULL TIME ***
Director of Finance 0.80 0.80 0.80 0.80
Assistant Finance Director 0.95 0.95 0.95 0.95
Assistant Treasurer 0.50 0.50 0.50 0.50
Municipal Accountant I 0.00 0.50 0.50 0.50
Accountant / Special Projects 0.50 0.00 0.00 0.00
Account Clerk / Payables 2.00 0.50 1.00 1.00
Payroll Benefits Clerk 1.00 1.00 1.00 1.00
Account Clerk / Cashier 0.25 0.25 0.25 0.25
Department Assistant I 0.00 0.00 0.00 0.00
Total Full Time 6.00 4.50 5.00 5.00
*** PART TIME ***
Municipal Accountant II 0.00 0.45 0.60 0.60
Total Full & Part Time FTE 6.00 4.95 5.60 5.60
TREASURER
*** FULL TIME ***
Director of Finance 0.10 0.10 0.10 0.10
Assistant Finance Director 0.05 0.05 0.05 0.05
Assistant Treasurer 0.50 0.50 0.50 0.50
Municipal Accountant I 0.00 0.50 0.50 0.50
Accountant / Special Projects 0.50 0.50 0.00 0.00
Account Clerk / Cashier 0.70 0.70 1.65 1.65
Total Full Time 1.85 2.35 2.80 2.80
*** PART TIME ***
Clerical Assistant 0.60 0.70 0.00 0.00
Total Full & Part Time FTE 2.45 3.05 2.80 2.80
FISCAL SERVICES
ACTUAL
-370-

APPROVED
DEPARTMENT / POSITION FY 14 FY 15 FY 16 FY 17
PROPERTY ASSESSING
*** FULL TIME ***
Director of Finance 0.10 0.10 0.10 0.10
Assessing Administrator 1.00 1.00 1.00 1.00
Appraiser Analyst 0.00 0.00 0.00 0.00
Appraiser Analyst-Personal Property 1.00 1.00 0.00 0.00
Appraiser II 0.00 0.00 0.00 0.00
Appraiser 2.00 2.00 2.00 2.00
Departmental Assistant I 1.00 1.00 1.00 1.00
Total Full Time 5.10 5.10 4.10 4.10
*** PART TIME ***
Clerical Assistant 0.00 0.00 0.00 0.50
Total Full & Part Time FTE 5.10 5.10 4.10 4.60
FISCAL SERVICES TOTAL
Full Time 12.95 11.95 11.90 11.90
Part Time 0.60 1.15 0.60 1.10
Total Full & Part Time FTE 13.55 13.10 12.50 13.00
FISCAL SERVICES
ACTUAL
-371-

APPROVED
DEPARTMENT / POSITION FY 14 FY 15 FY 16 FY 17
PUBLIC SAFETY MANAGEMENT
*** FULL TIME ***
Director of Public Safety 1.00 1.00 1.00 1.00
Public Safety Captain 4.00 4.00 4.00 4.00
Department Assistant II 1.00 1.00 1.00 1.00
Total Full Time 6.00 6.00 6.00 6.00
*** PART TIME ***
Department Assistant III 0.65 0.65 0.65 0.65
Total Full & Part Time FTE 0.65 0.65 0.65 0.65
POLICE DIVISION
*** FULL TIME ***
Police Sergeant 14.00 14.00 14.00 14.00
Computer Crimes investigator 1.00 1.00 1.00 1.00
Police Officer 35.00 35.00 35.00 35.00
Officer Manager 1.00 1.00 1.00 1.00
Police Desk Assistant 5.00 5.00 5.00 5.00
Civilian Booking Officer 1.00 1.00 1.00 1.00
Building Custodian 1.00 1.00 1.00 1.00
Total Full Time 58.00 58.00 58.00 58.00
*** PART TIME ***
Police Desk Assistant 0.70 0.70 0.70 0.70
Police Cadet 4.30 4.30 4.75 4.75
Police Reserve Officer 1.50 2.55 1.75 1.75
School Crossing Guards 1.10 1.10 1.10 1.10
General Maintenance Worker 0.60 0.60 0.60 0.60
Total Part Time 8.20 9.25 8.90 8.90
Total Full & Part Time FTE 66.20 67.25 66.90 66.90
PUBLIC SAFETY GRANTS (Fund Summary not included in Budget Document)
*** FULL TIME ***
Police Officer 3.00 3.00 3.00 3.00
Total Full Time 3.00 3.00 3.00 3.00
PUBLIC SAFETY
ACTUAL
-372-

APPROVED
DEPARTMENT / POSITION FY 14 FY 15 FY 16 FY 17
FIRE DIVISION
*** FULL TIME ***
Fire Sergeant 7.00 7.00 7.00 7.00
Firefighter 12.00 12.00 12.00 12.00
Part-Paid Firefighter 27.00 27.00 27.00 27.00
Part-Paid Firefighter Sergeant 3.00 3.00 3.00 3.00
Total Full Time 49.00 49.00 49.00 49.00
PUBLIC SAFETY SERVICES TOTAL
Full Time 116.00 116.00 116.00 116.00
Part Time 8.85 9.90 9.55 9.55
Total Full & Part Time FTE 124.85 125.90 125.55 125.55
PUBLIC SAFETY
ACTUAL
-373-

APPROVED
DEPARTMENT / POSITION FY 14 FY 15 FY 16 FY 17
STREETS DIVISION
*** FULL TIME ***
Director of Transportation Services 0.00 0.00 0.00 0.00
Departmental Assistant II 0.65 0.65 0.65 0.65
Street Superintendent 1.00 1.00 1.00 1.00
Lead Streets Supervisor 0.00 0.00 0.00 1.00
Supervisor 2.00 2.00 2.00 2.00
Coordinator - Sign & Paint 1.00 1.00 1.00 1.00
Coordinator - Storm Sewers 1.00 1.00 1.00 1.00
Heavy Equipment Operator 9.00 9.00 9.00 9.00
Equipment Operator 1.00 1.00 1.00 1.00
Total Full Time 15.65 15.65 15.65 16.65
*** PART TIME ***
Maintenance 1.20 1.10 1.10 1.10
Total Full & Part Time FTE 16.85 16.75 16.75 17.75
TRANSPORTATION MANAGEMENT & ENGINEERING
*** FULL TIME ***
Director of Transportation Services 0.00 0.00 0.00 0.00
Transportation Services Director 1.00 1.00 1.00 1.00
Project Engineer 0.00 0.00 1.00 1.00
Engineering Assistant 1.00 1.00 1.00 1.00
Departmental Assistant II 0.35 0.35 0.35 0.35
Total Full Time 2.35 2.35 3.35 3.35
*** PART TIME ***
Technical Assistant 0.30 0.30 0.30 0.35
Total Full & Part Time FTE 2.65 2.65 3.65 3.70
MUNICIPAL AIRPORT FACILITIES MANAGEMENT FUND
*** FULL TIME ***
Community & Nghbr Svcs Director 0.00 0.10 0.08 0.08
Executive Assistant IV 0.00 0.10 0.08 0.08
Total Full Time 0.00 0.20 0.16 0.16
*** PART TIME ***
Communications Assistant 0.00 0.35 0.35 0.35
Total Full & Part Time FTE 0.00 0.55 0.51 0.51
TRANSPORTATION
ACTUAL
-374-

APPROVED
DEPARTMENT / POSITION FY 14 FY 15 FY 16 FY 17
CENTRALIZED VEHICLE / EQUIPMENT FUND
*** FULL TIME ***
Director of Transportation Services 0.00 0.00 0.00 0.00
Lead Mechanic 2.00 2.00 2.00 2.00
Mechanic / Fabricator 1.00 1.00 1.00 1.00
Equipment Mechanic II 4.00 4.00 4.00 4.00
Department Assistant 0.00 0.00 0.00 0.00
Total Full Time 7.00 7.00 7.00 7.00
*** PART TIME ***
Administrative Aide I 0.00 0.70 0.70 0.70
Mechanic Assistant 1.15 1.00 1.05 1.15
Total Part Time 1.15 1.70 1.75 1.85
Total Full & Part Time FTE 8.15 8.70 8.75 8.85
TRANSPORTATION SYSTEM & SERVICES TOTAL
Full Time 25.00 25.20 26.16 27.16
Part Time 2.65 3.45 3.50 3.65
Total Full & Part Time FTE 27.65 28.65 29.66 30.81
TRANSPORTATION
ACTUAL
-375-

APPROVED
DEPARTMENT / POSITION FY 14 FY 15 FY 16 FY 17
CITY HALL & GROUNDS
*** FULL TIME ***
Sr Building Custodian 1.000 1.000 0.50 0.50
Irrigation Tech/Facilities Coordinator 0.00 0.00 0.10 0.10
Total Full Time 1.00 1.00 0.60 0.60
PLANNING & ZONING
*** FULL TIME ***
Community & Nghbr Svcs Director 0.700 0.700 0.00 0.00
Municipal Planner II 1.000 1.000 1.00 1.00
Departmental Assistant II 0.200 0.200 0.20 0.20
Departmental Assistant I 0.000 0.200 0.40 0.40
Total Full Time 1.900 2.100 1.60 1.60
*** PART TIME ***
Preservation Planner 0.200 0.200 0.30 0.30
Intern 0.100 0.100 0.00 0.00
Total Part Time 0.300 0.300 0.30 0.30
Total Full & Part Time FTE 2.200 2.400 1.90 1.90
ENVIRONMENTAL HEALTH & INSPECTIONS
*** FULL TIME ***
Asst Community & Nghbr Svcs Director 0.500 0.500 0.50 0.50
Building Inspector / Zoning Administrator 0.100 0.100 0.10 0.10
Housing Inspector II 1.880 1.880 1.88 1.88
Housing Inspector I 0.000 1.000 1.00 1.00
Departmental Assistant II 0.200 0.200 0.20 0.20
Departmental Assistant I 0.330 0.530 0.53 0.53
Community Development Specialist 0.300 0.300 0.30 0.30
Total Full Time 3.310 4.510 4.51 4.51
ENVIRONMENTAL HEALTH & INSPECTIONS
*** PART TIME ***
Clerical Assistant 0.30 0.100 0.000 0.00
Total Full & Part Time FTE 3.61 4.61 4.510 4.51
COMMUNITY & NEIGHBORHOOD SERVICES
ACTUAL
-376-

APPROVED
DEPARTMENT / POSITION FY 14 FY 15 FY 16 FY 17
CONSTRUCTION INSPECTIONS
*** FULL TIME ***
City Manager 0.050 0.050 0.05 0.05
Asst Community & Nghbr Svcs Director 0.300 0.300 0.30 0.30
Building Inspector/Zoning Administrator 0.900 0.900 0.90 0.90
Plumbing Inspector 1.000 1.000 1.00 1.00
Electrical Inspector 0.000 0.000 1.00 1.00
Housing Inspector II 0.120 0.120 0.12 0.12
Permit Technician 0.000 0.000 1.00 1.00
Departmental Assistant II 0.400 0.400 0.40 0.40
Departmental Assistant I 0.600 0.600 0.60 0.60
Account Clerk / Cashier 0.050 0.050 0.10 0.10
Total Full Time 3.420 3.420 5.47 5.47
*** PART TIME ***
Electrical Inspector 0.500 0.500 0.15 0.00
Clerical Assistant 0.200 0.200 0.85 1.25
Account Clerk / Cashier 0.050 0.050 0.00 0.00
Total Part-Time 0.750 0.750 1.00 1.25
Total Full & Part Time FTE 4.170 4.170 6.47 6.72
HOUSING & NEIGHBORHOODS
*** FULL TIME ***
Community & Nghbr Svcs Director 0.050 0.050 0.47 0.47
Municipal Planner II 0.450 0.450 0.00 0.00
Housing & Neighborhood Specialist 1.000 1.000 1.00 1.00
Department Assistant I 0.000 0.400 0.40 0.40
Total Full Time 1.500 1.900 1.87 1.87
*** PART TIME ***
Clerical Assistant 0.500 0.500 0.00 0.00
Graffiti Removal 0.150 0.150 0.05 0.10
Total Part-Time 0.650 0.650 0.05 0.10
Total Full & Part Time FTE 2.15 2.55 1.92 1.97
COMMUNITY & NEIGHBORHOOD SERVICES
ACTUAL
-377-

APPROVED
DEPARTMENT / POSITION FY 14 FY 15 FY 16 FY 17
ECONOMIC DEVELOPMENT
*** FULL TIME ***
Assistant City Manager 0.650 0.000 0.000 0.00
Municipal Planner II 0.100 0.000 0.000 0.00
Executive Assistant IV 0.000 0.100 0.100 0.10
Executive Assistant II 0.100 0.000 0.000 0.00
Executive Assistant I 0.250 0.000 0.000 0.00
Total Full Time 1.100 0.100 0.100 0.10
*** PART TIME ***
Communications Assistant 0.400 0.000 0.000 0.00
Total Full & Part Time FTE 1.500 0.100 0.100 0.10
8th STREET MARKET
*** FULL TIME ***
PSD Marketing & Promotions Coordinator 0.10 0.10 0.10 0.10
Event Coordinator 0.00 0.05 0.30 0.30
Total Full Time 0.10 0.15 0.40 0.40
*** PART TIME ***
Market Master 0.45 0.45 0.45 0.55
Event Staff 0.25 0.45 0.00 0.00
Intern 0.10 0.10 0.30 0.35
Event Maintenance 0.20 0.05 0.00 0.00
Market Ambassador 0.00 0.00 0.00 0.00
Total Part Time 1.00 1.05 0.75 0.90
Total Full & Part Time FTE 1.10 1.20 1.15 1.30
DOWNTOWN PUBLIC PARKING
*** FULL TIME ***
Downtown Manager 0.100 0.100 0.100 0.15
Skilled Plumber/Irrigation Technician 0.050 0.000 0.000 0.00
Irrigation Tech/Facilities Coordinator 0.000 0.050 0.050 0.05
Total Full Time 0.150 0.150 0.150 0.20
COMMUNITY & NEIGHBORHOOD SERVICES
ACTUAL
-378-

APPROVED
DEPARTMENT / POSITION FY 14 FY 15 FY 16 FY 17
DOWNTOWN PUBLIC PARKING
*** PART TIME ***
Clerical Assistant 0.500 0.550 0.50 0.50
Parking Enforcement 0.250 0.250 0.25 0.25
Maintenance 0.100 0.100 0.10 0.10
Total Part-Time 0.850 0.900 0.85 0.85
Total Full & Part Time FTE 1.000 1.050 1.00 1.05
DOWNTOWN DEVELOPMENT AUTHORITY
*** FULL TIME ***
City Manager 0.000 0.000 0.10 0.10
Community & Nghbr Svcs Director 0.125 0.125 0.00 0.00
Downtown Manager 0.350 0.350 0.35 0.55
Total Full Time 0.475 0.475 0.45 0.65
*** PART TIME ***
Clerical Assistant 0.500 0.550 0.55 0.55
Maintenance 0.100 0.100 0.10 0.10
Total Part-Time 0.600 0.650 0.65 0.65
Total Full & Part Time FTE 1.075 1.125 1.10 1.30
DOWNTOWN PRINCIPAL SHOPPING DISTRICT
*** FULL TIME ***
Community & Nghbr Svcs Director 0.125 0.125 0.00 0.00
Downtown Manager 0.550 0.550 0.55 0.30
PSD Marketing & Promotions Coordinator 0.900 0.900 0.90 0.90
Event Coordinator 0.800 0.950 0.70 0.70
Total Full Time 2.375 2.525 2.15 1.90
*** PART TIME ***
Clerical Assistant 0.150 0.200 0.20 0.20
Event Employees 0.450 0.350 0.35 0.35
Social Media Coordinator 0.500 0.500 0.50 0.50
Intern 0.300 0.300 0.30 0.30
Total Part-Time 1.400 1.350 1.35 1.35
Total Full & Part Time FTE 3.775 3.875 3.50 3.25
COMMUNITY & NEIGHBORHOOD SERVICES
ACTUAL
-379-

APPROVED
DEPARTMENT / POSITION FY 14 FY 15 FY 16 FY 17
SOLID WASTE RECYCLING
*** FULL TIME ***
Asst Community & Nghbr Svcs Director 0.200 0.200 0.20 0.20
Chief Sanitarian 0.000 0.000 0.00 0.00
Community Development Specialist 0.200 0.200 0.20 0.20
Departmental Assistant II 0.200 0.200 0.20 0.20
Departmental Assistant I 0.070 0.070 0.07 0.07
Total Full Time 0.670 0.670 0.67 0.67
*** PART TIME ***
Recycle Education Coordinator 0.700 0.700 0.70 0.70
Total Part Time 0.70 0.70 0.70 0.70
Total Full & Part Time FTE 1.37 1.37 1.37 1.37
CDBG ENTITLEMENT GRANT (Fund Summary not included in Budget Document)
*** FULL TIME ***
Community & Nghbr Svcs Director 0.000 0.000 0.45 0.45
Municipal Planner II 0.450 0.450 0.00 0.00
Community Development Specialist 0.500 0.500 0.50 0.50
Total Full Time 0.95 0.95 0.95 0.95
COMMUNITY & NEIGHBORHOOD SERVICES TOTAL
Full Time 16.95 17.95 18.92 18.92
Part Time 6.95 6.45 5.65 6.10
Total Full & Part Time FTE 23.90 24.40 24.570 25.02
COMMUNITY & NEIGHBORHOOD SERVICES
ACTUAL
-380-

APPROVED
DEPARTMENT / POSITION FY 14 FY 15 FY 16 FY 17
CEMETERIES
*** FULL TIME ***
Parks & Recreation Director 0.20 0.20 0.20 0.20
Skilled Plumber/Irrigation Technician 0.15 0.00 0.00 0.00
Irrigation Tech/Facilities Coordinator 0.00 0.15 0.15 0.15
Cemetery Maintenance II 1.00 1.00 1.00 1.00
Laborer II 0.50 0.50 0.50 0.50
Department Assistant I 0.50 0.50 0.50 0.50
Total Full Time 2.35 2.35 2.35 2.35
*** PART TIME ***
Clerical Assistant 0.70 0.70 0.70 0.70
Grounds Maintenance 1.60 1.95 2.35 2.35
Total Part Time 2.30 2.65 3.05 3.05
Total Full & Part Time FTE 4.65 5.00 5.40 5.40
PARKS & RECREATION ADMINISTRATION
*** FULL TIME ***
Parks & Recreation Director 0.40 0.40 0.40 0.40
Departmental Assistant II 0.30 0.10 0.10 0.10
Total Full Time 0.70 0.50 0.50 0.50
RECREATION PROGRAMS
*** FULL TIME ***
Recreation & Civic Center Manager 1.00 1.00 1.00 1.00
Recreation Coordinator 0.00 0.00 0.00 1.00
Departmental Assistant II 0.40 0.45 0.45 0.45
Skilled Recreation Worker 1.00 1.00 1.00 1.00
Recreation Maintenance Assistant 1.00 1.00 1.00 1.00
Skilled Plumber/Irrigation Technician 0.05 0.00 0.00 0.00
Irrigation Tech/Facilities Coordinator 0.00 0.05 0.05 0.05
Total Full Time 3.45 3.50 3.50 4.50
PARKS & RECREATION
ACTUAL
-381-

APPROVED
DEPARTMENT / POSITION FY 14 FY 15 FY 16 FY 17
RECREATION PROGRAMS
*** PART TIME ***
Maintenance/Grounds 0.35 0.35 0.35 0.35
Recreation Program Assistant 0.40 0.40 0.40 0.40
Recreation Officials Assistant 0.10 0.10 0.10 0.00
Clerical Assistant 0.35 0.35 0.35 0.35
Total Part Time 1.20 1.20 1.20 1.10
Total Full & Part Time FTE 4.65 4.70 4.70 5.60
PARKS
*** FULL TIME ***
Parks & Recreation Director 0.40 0.40 0.40 0.40
Supervisor 2.00 2.00 3.00 3.00
Tree Trimmer I 1.00 1.00 1.00 1.00
Greenhouse Operator 1.00 1.00 1.00 1.00
Heavy Equipment Operator 1.00 1.00 1.00 1.00
Skilled Plumber/Irrigation Technician 0.75 0.00 0.00 0.00
Irrigation Tech/Facilities Coordinator 0.00 0.75 0.65 0.65
Laborer II 0.50 0.50 0.50 0.50
Skilled Grounds Keeper 1.00 1.00 1.00 1.00
Department Assistant I 0.50 0.50 0.50 0.50
Sr Building Custodian 0.00 0.00 0.50 0.50
Total Full Time 8.15 8.15 9.55 9.55
*** PART TIME ***
Grounds Maintenance 9.90 11.75 12.00 11.70
Tree Trimmer 0.70 1.00 1.10 1.10
Gardener 0.70 1.00 1.00 1.00
Security Maintenance 0.40 0.40 0.40 0.40
Total Part Time 11.70 14.15 14.50 14.20
Total Full & Part Time FTE 19.85 22.30 24.05 23.75
PARKS & RECREATION
ACTUAL
-382-

APPROVED
DEPARTMENT / POSITION FY 14 FY 15 FY 16 FY 17
DEGRAAF NATURE CENTER
*** FULL TIME ***
Nature Center Coordinator 1.00 1.00 1.00 1.00
Staff Naturalist 0.95 0.95 0.95 0.95
Total Full Time 1.95 1.95 1.95 1.95
*** PART TIME ***
Grounds Maintenance 0.35 0.35 0.35 0.30
Intern 0.20 0.20 0.20 0.45
Educational Assistant 0.65 0.65 0.65 0.70
Outdoor Assistant 0.60 0.60 0.65 0.65
Total Part Time 1.80 1.80 1.85 2.10
Total Full & Part Time FTE 3.75 3.75 3.80 4.05
CIVIC CENTER
*** FULL TIME ***
Departmental Assistant II 0.30 0.45 0.45 0.45
Sr Building Custodian 1.00 1.00 1.00 1.00
Total Full Time 1.30 1.45 1.45 1.45
*** PART TIME ***
Clerical Assistant 0.35 0.60 0.35 0.30
Custodian 1.50 1.50 1.45 0.50
Total Part Time 1.85 2.10 1.80 0.80
Total Full & Part Time FTE 3.15 3.55 3.25 2.25
PARKS & RECREATION
ACTUAL
-383-

APPROVED
DEPARTMENT / POSITION FY 14 FY 15 FY 16 FY 17
WINDMILL ISLAND GARDENS
*** FULL TIME ***
Windmill Island Manager 1.00 1.00 0.00 0.00
Windmill Island Gardens Coordinator 0.00 0.00 1.00 1.00
Events Coordinator/Miller 1.00 1.00 1.00 1.00
Total Full Time 2.00 2.00 2.00 2.00
*** PART TIME ***
Tulip Time Worker 0.60 0.60 0.60 0.60
Klompen Dancer/Tour Guide 2.50 2.50 2.50 2.50
Ticket Taker 0.70 0.70 0.70 0.70
Tour Guide 0.80 0.80 0.80 0.80
Assistant Event Organizer 0.20 0.20 0.20 0.20
Grounds Maintenance 5.30 5.60 5.90 5.90
Clerical Assistant 1.00 1.00 1.00 1.00
Total Part Time 11.10 11.40 11.70 11.70
Total Full & Part Time FTE 13.10 13.40 13.70 13.70
HOLLAND HISTORIC TRUST
*** FULL TIME ***
Director 1.00 1.00 1.00 1.00
Registrar 1.00 0.00 0.00 0.00
Operations Manager 1.00 1.00 1.00 1.00
Facilities / Maintenance 1.00 1.00 0.00 0.00
Museum and Gallery Manager 1.00 1.00 1.00 1.00
Education Manager 0.00 0.00 1.00 1.00
Archivist 1.00 0.00 0.00 0.00
Total Full Time 6.00 4.00 4.00 4.00
*** PART TIME ***
Media Relations 0.00 0.00 0.00 0.00
Museum Attendant 0.86 0.37 0.50 0.50
Facility Manager 0.30 0.20 0.20 0.20
Facilities / Maintenance 0.00 0.00 0.38 0.38
Volunteer & Tour Coodinator 0.00 0.86 0.75 0.75
Education Manager 0.60 0.00 0.00 0.00
Total Part Time 1.76 1.43 1.83 1.83
Total Full & Part Time FTE 7.76 5.43 5.83 5.83
PARKS & RECREATION
ACTUAL
-384-

APPROVED
DEPARTMENT / POSITION FY 14 FY 15 FY 16 FY 17
LEISURE & CULTURAL SERVICES TOTAL
Full Time 25.90 23.90 25.30 26.30
Part Time 31.71 34.73 35.93 34.78
Total Full & Part Time FTE 57.61 58.63 61.23 61.08
PARKS & RECREATION
ACTUAL
-385-

ELECTRIC UTILITY
APPROVED
DEPARTMENT / POSITION FY 14 FY 15 FY 16 FY 17
POWER SUPPLY
*** FULL TIME ***
Auxiliary Operator 4.00 4.00 4.00 4.00
Electric Production Engineer 2.00 1.00 1.00 1.00
Electric Instrumentation & Controls Lead 1.00 1.00 1.00 1.00
Electric Production Maintenance Supervisor 1.00 1.00 1.00 1.00
Electric Production Mechanical Lead 1.00 1.00 1.00 1.00
Electric Production Operations Supervisor 1.00 1.00 1.00 1.00
Electric Production Services Supervisor 1.00 1.00 1.00 1.00
Electric Production Superintendent 1.00 1.00 1.00 1.00
Environmental Regulatory Specialist 1.00 1.00 1.00 1.00
Instrumentation & Controls Technician - Operator1
1.00 1.00 2.00 3.00
Lead Plant Operator 4.00 4.00 4.00 4.00
Maintenance Planner 1.00 1.00 1.00 1.00
Mechanical Maintenance1
1.00 1.00 3.00 3.00
Plant Operator 8.00 8.00 8.00 8.00
Stockkeeper 1.00 1.00 1.00 1.00
Utility I (apprentice) & II 6.00 3.00 4.00 5.00
Utility Operator 1.00 1.00 2.00 1.00
Coal & Ash Handler 3.00 1.00 0.00 0.00
Instrumentation & Controls Technician 1.00 1.00 0.00 0.00
Mechanical Maintenance B 3.00 2.00 0.00 0.00
Total Full Time 43.00 36.00 37.00 38.00
1 Includes apprentices in this job classification.
BOARD OF PUBLIC WORKS - UTILITY SERVICES
ACTUAL
-386-

ELECTRIC UTILITY
APPROVED
DEPARTMENT / POSITION FY 14 FY 15 FY 16 FY 17
ELECTRIC TRANSMISSION & DISTRIBUTION
*** FULL TIME ***
Administrative Coordinator 1.00 1.00 1.00 1.00
Electric Distribution Engineer 1.00 1.00 1.00 1.00
Electric Distribution Engineering Specialist 2.00 3.00 3.00 3.00
Electric Distribution Technician1
3.00 3.00 3.00 4.00
Electric Engineering Supervisor 1.00 1.00 1.00 1.00
Electric Transmission & Distrib Superintendent 1.00 1.00 1.00 1.00
Lead Lineworker 2.00 2.00 3.00 2.00
Line Crew Supervisor 1.00 1.00 1.00 1.00
Lineworker1
8.00 8.00 7.00 7.00
Operations & Metering Supervisor 1.00 1.00 1.00 1.00
System Operations Technician 5.00 5.00 5.00 5.00
Utility Engineering Aide2
1.00 0.00 0.00 0.00
Total Full Time 27.00 27.00 27.00 27.00
ELECTRIC UTILITY TOTAL 70.00 63.00 64.00 65.00
1 Includes apprentices in this job classification.
2 Transferred to Electric Distribution Engineering Specialist
BOARD OF PUBLIC WORKS - UTILITY SERVICES
ACTUAL
-387-

WATER & WASTEWATER UTILITY
APPROVED
DEPARTMENT / POSITION FY 14 FY 15 FY 16 FY 17
WASTEWATER TREATMENT
*** FULL TIME ***
Administrative Assistant 1.00 1.00 1.00 1.00
Environmental Compliance Supervisor 1.00 1.00 1.00 1.00
Industrial Electrician 1.00 1.00 1.00 1.00
Laboratory Analyst 1.00 1.00 1.00 1.00
Lead Maintenance - WWTP 1.00 1.00 1.00 1.00
Maintenance II - WWTP1
2.00 2.00 2.00 2.00
Operations & Maintenance Supervisor - WWTP 1.00 1.00 1.00 1.00
Plant Operator - WWTP 6.00 6.00 6.00 6.00
Pollution Control Technician 2.00 2.00 2.00 2.00
Utility II - WWTP2
1.00 1.00 1.00 1.00
Utility - WWTP O&M3
1.00 1.00 1.00 1.00
Wastewater Treatment Plant Superintendent 1.00 1.00 1.00 1.00
Total Full Time 19.00 19.00 19.00 19.00
WATER TREATMENT
*** FULL TIME ***
Industrial Electrician 1.00 1.00 1.00 1.00
Lead Maintenance - WTP 1.00 1.00 1.00 1.00
Maintenance - WTP4
1.00 1.00 1.00 1.00
Operations & Maintenance Supervisor - WTP 1.00 1.00 1.00 1.00
Plant Operator - WTP 5.00 5.00 5.00 5.00
Utility I - WTP 1.00 1.00 1.00 1.00
Water Treatment Plant Superintendent 1.00 1.00 1.00 1.00
Total Full Time 11.00 11.00 11.00 11.00
1 Title changed from "Maintenance II" in FY16, includes apprentices in this classification.
2 Title changed from "Utility II - Custodian" in FY16.
3 Title changed from "Utility II - Operator Assistant" in FY16.
4 Includes Maintenance I and apprentices in this classification.
BOARD OF PUBLIC WORKS - UTILITY SERVICES
ACTUAL
-388-

WATER & WASTEWATER UTILITY
APPROVED
DEPARTMENT / POSITION FY 14 FY 15 FY 16 FY 17
WATER DISTRIBUTION / WASTEWATER COLLECTION
*** FULL TIME ***
Asset Management Specialist1
0.00 0.00 0.00 1.00
Engineering Field Technician 2.00 2.00 2.00 3.00
GIS Specialist 1.00 1.00 1.00 1.00
Lead Service and Maintenance 3.00 3.00 3.00 3.00
Service and Maintenance2
7.00 7.00 7.00 6.00
Services & Maintenance Supervisor 1.00 1.00 1.00 1.00
W / WW Civil Engineer 1.00 1.00 1.00 1.00
W / WW Services Coordinator 1.00 1.00 1.00 1.00
W / WW Engineering Specialist 2.00 2.00 2.00 1.00
W / WW Services Superintendent 1.00 1.00 1.00 1.00
Total Full Time 19.00 19.00 19.00 19.00
WATER & WASTEWATER UTILITY TOTAL 49.00 49.00 49.00 49.00
1 Revised from W/WW Services Engineering Specialist job classification in FY16.
2 Includes apprentices in this job classification.
BOARD OF PUBLIC WORKS - UTILITY SERVICES
ACTUAL
-389-

ADMINISTRATION & GENERAL
APPROVED
DEPARTMENT / POSITION FY 14 FY 15 FY 16 FY 17
ADMINISTRATION
*** FULL TIME ***
Administrative Specialist 1.00 1.00 1.00 1.00
General Manager 1.00 1.00 1.00 1.00
Operations Director 1.00 1.00 1.00 1.00
Utility Services Director 1.00 1.00 1.00 1.00
Total Full Time 4.00 4.00 4.00 4.00
BUSINESS SERVICES
*** FULL TIME ***
Administrative Assistant - Business Services 1.00 1.00 1.00 1.00
Business Services Director 1.00 1.00 1.00 1.00
Human Resources Manager 1.00 1.00 1.00 1.00
Human Resources Specialist 1.00 1.00 1.00 1.00
Planning Engineer 2.00 3.00 3.00 3.00
Planning Engineering Manager 1.00 1.00 1.00 1.00
Planning Specialist 1.00 1.00 1.00 1.00
Records Management Coordinator 1.00 1.00 1.00 1.00
Safety Specialist 1.00 1.00 1.00 1.00
Regulatory Compliance Program Manager1
1.00 0.00 0.00 0.00
Total Full Time 11.00 11.00 11.00 11.00
CUSTOMER SERVICE, MARKETING & ENERGY OPTIMIZATION
*** FULL TIME ***
Administrative Assistant - Conservation Programs 0.00 1.00 1.00 1.00
Communications Supervisor 0.00 0.00 0.00 1.00
Community Energy Services Manager2
1.00 1.00 1.00 1.00
Conservation Programs Specialist 1.00 1.00 1.00 1.00
Customer Accounts Representative 1.00 1.00 1.00 1.00
Customer Communications Specialist 1.00 1.00 1.00 1.00
Customer Service Manager 1.00 1.00 1.00 1.00
Customer Services Representative 7.00 6.00 6.00 6.00
Energy Efficiency Engineer 0.00 1.00 1.00 1.00
Key Accounts Analyst / Coordinator 1.00 1.00 1.00 1.00
Meter Information Systems Specialist 0.00 0.00 1.00 1.00
Total Full Time 13.00 14.00 15.00 16.00
1 Position was not filled.
2 Title changed from "Communications & Customer Programs Manager" in FY16.
ACTUAL
BOARD OF PUBLIC WORKS - UTILITY SERVICES
-390-

ADMINISTRATION & GENERAL
APPROVED
DEPARTMENT / POSITION FY 14 FY 15 FY 16 FY 17
FINANCE & ACCOUNTING
*** FULL TIME ***
Accounting Manager 1.00 1.00 1.00 1.00
Accounts Payable Clerk 2.00 2.00 2.00 2.00
Billing Coordinator 2.00 1.00 2.00 2.00
Finance Director 1.00 1.00 1.00 1.00
Finance System Specialist 1.00 1.00 1.00 1.00
Financial Analyst 1.00 1.00 1.00 1.00
General Accountant 0.00 3.00 3.00 3.00
Payroll Specialist 1.00 1.00 1.00 1.00
General Accountant I 1.00 0.00 0.00 0.00
Meter Information System Specialist1
0.00 1.00 0.00 0.00
Senior Accountant 1.00 0.00 0.00 0.00
Total Full Time 11.00 12.00 12.00 12.00
INFORMATION TECHNOLOGY
*** FULL TIME ***
Boardbank Services Manager 0.00 0.00 0.00 1.00
Computer Systems Specialist 1.00 1.00 1.00 1.00
Database Administrator 1.00 1.00 1.00 1.00
Information Systems Analyst 1.00 1.00 1.00 1.00
Inforamtion Technology Manager 1.00 1.00 1.00 1.00
Information Technology Security Specialist 1.00 1.00 1.00 1.00
Network Engineer 1.00 1.00 1.00 1.00
Network Specialist 2.00 2.00 2.00 2.00
Programmer / Analyst 2.00 2.00 1.00 1.00
Technology Director 1.00 1.00 1.00 1.00
Total Full Time 11.00 11.00 10.00 11.00
1 Transitioned into Utility Services in FY15.
BOARD OF PUBLIC WORKS - UTILITY SERVICES
ACTUAL
-391-

ADMINISTRATION & GENERAL
APPROVED
DEPARTMENT / POSITION FY 14 FY 15 FY 16 FY 17
PURCHASING, FACILITIES, WAREHOUSING AND METER READING
*** FULL TIME ***
Buyer 1.00 1.00 1.00 1.00
Courier 1.00 1.00 1.00 1.00
Facility Maintenance1
1.00 1.00 1.00 1.00
Inventory & Facilities Specialist 1.00 1.00 1.00 1.00
Materials & Facilities Manager 1.00 1.00 1.00 1.00
Procurement Specialist 1.00 1.00 1.00 1.00
Utility I2
1.00 1.00 1.00 1.00
Utility I - Warehouse & Facilities 1.00 1.00 1.00 1.00
Utility II - Warehouse 1.00 1.00 1.00 1.00
Total Full Time 9.00 9.00 9.00 9.00
ADMIN & MARKETING TOTAL 59.00 61.00 61.00 63.00
UTILITY SERVICES TOTAL 178.00 173.00 174.00 177.00
1 Title changed from "Maintenance I - Warehouse/Facilities & Grounds in FY16.
2 Title changed from "Grounds & Utility I" in FY16.
ACTUAL
BOARD OF PUBLIC WORKS - UTILITY SERVICES
-392-

APPROVED
DEPARTMENT / POSITION FY 14 FY 15 FY 16 FY 17
TECHNOLOGY SERVICES
*** FULL TIME ***
Technology Services Coordinator 0.80 0.60 0.60 0.60
Sr Network Systems Specialist 1.00 1.00 1.00 1.00
Network Systems Specialist 1.00 1.00 1.00 1.00
Technical Support - GIS 0.00 0.00 0.00 1.00
Technology Specialist 1.00 1.00 1.00 1.00
Total Full Time 3.80 3.60 3.60 4.60
INTERNAL SERVICES
ACTUAL
-393-

> CAPITAL OUTLAY BY SERVICE GROUP
> CAPITAL OUTLAY - CONTROLLED ITEMS BY SERVICE GROUP
APPENDIX B
CAPITAL OUTLAY
-394-

New
or Approved
Department Type Description Replacement Amount
Machinery & Equipment
Black Magic 4K camera (lens, storage,case, mo New 8,000
and accessories)
ATT Encoder - GOV CH New 6,000
Training Room LCD Replace 5,000
Total - Machinery & Equipment 19,000
Total Cable TV Public Access Television Fund 19,000
TOTAL MANAGEMENT & ADMINISTRATION 19,000$
CAPITAL OUTLAYMANAGEMENT & ADMINISTRATION
CABLE TV PUBLIC
ACCESS
TELEVISION FUND
-395-

New
or Approved
Department Type Description Replacement Amount
Machinery & Equipment
(65/15) Duty handguns w/holsters & magazine Replace 16,250
pouches - training handguns also includes
clearing barrels and red imitation handguns
(3) X26E Taser with Holster and 5 year warranty Replace 4,660
Sage less lethal launchers w/training rounds New 2,000
Total - Machinery & Equipment 22,910
Total Public Safety - Police Services 22,910
TOTAL PUBLIC SAFETY 22,910$
CAPITAL OUTLAYPUBLIC SAFETY
PUBLIC SAFETY
POLICE SERVICES
(General Fund)
-396-
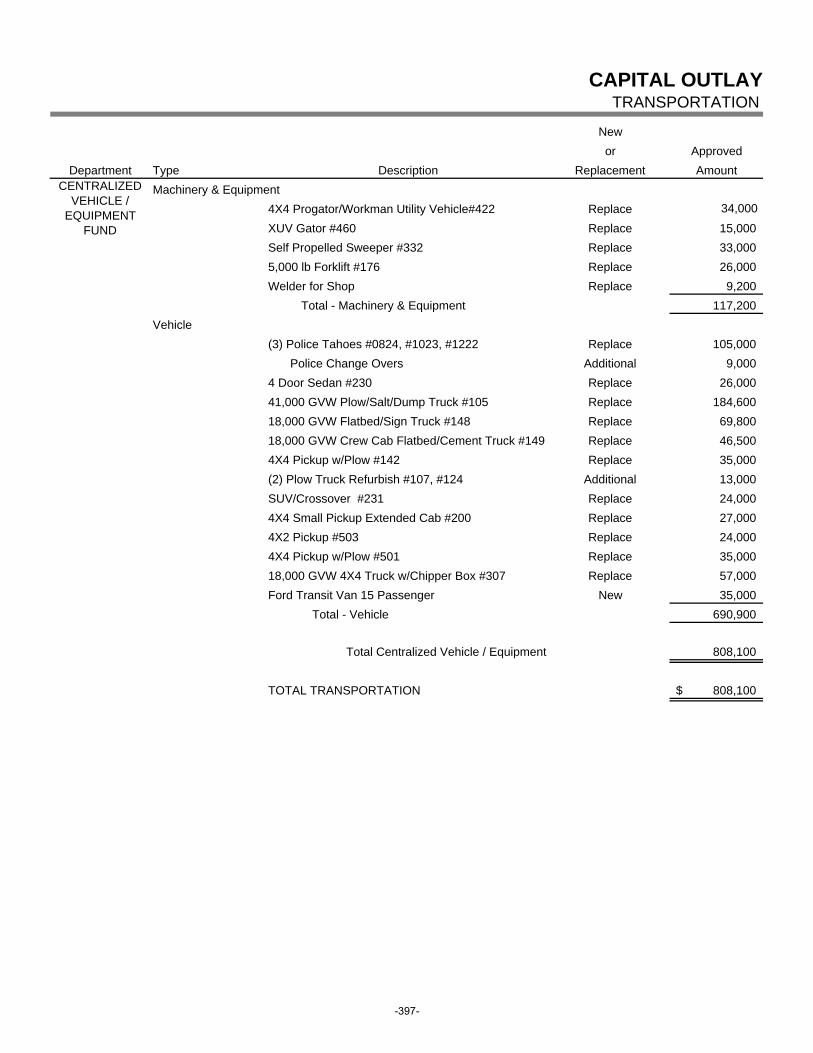
New
or Approved
Department Type Description Replacement Amount
Machinery & Equipment
4X4 Progator/Workman Utility Vehicle#422 Replace 34,000
XUV Gator #460 Replace 15,000
Self Propelled Sweeper #332 Replace 33,000
5,000 lb Forklift #176 Replace 26,000
Welder for Shop Replace 9,200
Total - Machinery & Equipment 117,200
Vehicle
(3) Police Tahoes #0824, #1023, #1222 Replace 105,000
Police Change Overs Additional 9,000
4 Door Sedan #230 Replace 26,000
41,000 GVW Plow/Salt/Dump Truck #105 Replace 184,600
18,000 GVW Flatbed/Sign Truck #148 Replace 69,800
18,000 GVW Crew Cab Flatbed/Cement Truck #149 Replace 46,500
4X4 Pickup w/Plow #142 Replace 35,000
(2) Plow Truck Refurbish #107, #124 Additional 13,000
SUV/Crossover #231 Replace 24,000
4X4 Small Pickup Extended Cab #200 Replace 27,000
4X2 Pickup #503 Replace 24,000
4X4 Pickup w/Plow #501 Replace 35,000
18,000 GVW 4X4 Truck w/Chipper Box #307 Replace 57,000
Ford Transit Van 15 Passenger New 35,000
Total - Vehicle 690,900
Total Centralized Vehicle / Equipment 808,100
TOTAL TRANSPORTATION 808,100$
CAPITAL OUTLAYTRANSPORTATION
CENTRALIZED
VEHICLE /
EQUIPMENT
FUND
-397-

New
or Approved
Department Type Description Replacement Amount
Machinery & Equipment
Aluminum 15' X 15' Roll Around Tent Replace 5,500
Total Machinery & Equipment 5,500
Total Cemetery 5,500$
Machinery & Equipment
'Molenwinkel' sales area in windmill New 5,000
Total Machinery & Equipment 5,000
Total Windmill Island Gardens Fund 5,000$
Machinery & Equipment
2-3, Computers Replace 3,000
Total Machinery & Equipment 3,000
Total Holland Historical Trust Fund 3,000$
TOTAL PARKS & RECREATION 13,500$
HOLLAND
HISTORICAL
TRUST FUND
CAPITAL OUTLAYPARKS & RECREATION
CEMETERY
(General Fund)
WINDMILL
ISLAND
GARDENS FUND
-398-

Approved
FY2017 Multi-Year
Department Description Amount Budget
Power Plant New combined cycle 32,340,789 228,884,766
Snowmelt Valve Upgrades 500,000 500,000
Snowmelt Lines Support 450,000 3,500,000
HEP Procedure and Operator Qualification Program 125,000 125,000
Combustible gas Detection (Units 7, 8 & 9) 100,000 100,000
Unit 7 & 8 Station Power Relays 75,000 75,000
Electric Forklift 65,000 65,000
All Remaining projects 282,500 282,500
Total Power Plant 33,938,289 233,532,266
Pine Ave Substation 3,000,000 7,000,000
AMI Metering Project 1,800,000 6,000,000
Underground Line and Equipment 700,000 700,000
Township LED Replacement 350,000 350,000
New Distribution Lines for Pine Ave Substation 300,000 300,000
Smart Grid Updates 250,000 250,000
Replace Bucket Truck #65 245,000 245,000
Transformer Upgrade and Replacement 225,000 225,000
Ottawa Circuit 131 to back up 4 circuits 200,000 200,000
Overhead Lines and Equipment 200,000 200,000
Lincoln Ave. UG Conversion 9th - 14th St. 180,000 180,000
James St. Cables Replaced Recloser and Riser 100,000 100,000
Porcelain Cutout Upgrades 100,000 100,000
All Remaining projects 260,000 260,000
Total Electric Transmission and Distribution 7,910,000 16,110,000
Broadband Jmaes St. Overhead to Underground Conversion 100,000 150,000
Southshore Drive Distribution 80,000 80,000
16th, Waverly and Country Club Distribution 75,000 75,000
Upgrade Backbone to 40 Gbps 50,000 50,000
Lakewood Analine Distribution 50,000 50,000
Roosevelt - Zeeland Distribution 50,000 50,000
HEP Cabinet 20,000 20,000
All Remaining projects 81,000 81,000
Total Broadband 506,000 556,000
CAPITAL OUTLAYBoard of Public Works Utilities
Electric
Transmission and
Distribution
-399-

Approved
FY2017 Multi-Year
Department Description Amount Budget
CAPITAL OUTLAYBoard of Public Works Utilities
Water Plant Rebuild Program Logic Controller 120,000 120,000
Rebuild Basin 100,000 100,000
Replace High Service Valve 90,000 90,000
Wonerware Upgrade 74,330 212,000
All Remaining projects 280,300 280,300
Total Water Plant 664,630 802,300
Wastewater Plant Bio-Solids 1,136,900 15,194,000
Optimization Project 67,800 5,510,700
Replace Disinfection Chemical Storage Tanks 100,000 100,000
Multi-Spectral Analyzer 90,000 90,000
New Mixing System for Thickener 3 80,000 80,000
Wonerware Upgrades 74,200 317,500
Replace Drive on Clarifier 6 60,000 60,000
Replace 2 Return Activated Sludge Pumps 60,000 60,000
Programmable Logi Controller Upgrade CP-600 45,000 45,000
All Remaining projects 330,000 370,000
Total Wastewater Plant 2,043,900 21,827,200
Water Distribution Water Main Replacement 9th, Kollen Pk. - 8th 1,400,000 1,900,000
Water Main Replacement 28th, Central to Lincoln 700,000 700,000
Replace Electric service MCC, Valves and Pump Waverly Pump Station 400,000 450,000
Tank Repairs and Painting at Sothside Pump Station 200,000 200,000
Water Main Replacement Central 3rd - State and 19th 150,000 2,550,000
Water System Upgrades 125,000 125,000
New Hydrants 50,000 50,000
Repace Vehicle # 70 35,000 35,000
New Meters 30,000 30,000
Total Water Distribution 3,090,000 6,040,000
-400-

Approved
FY2017 Multi-Year
Department Description Amount Budget
CAPITAL OUTLAYBoard of Public Works Utilities
Sewer Main Linig and Manhole Rehab 1,200,000 1,500,000
3 Pneumatic Lifgt Staions converted to Conventenial Lift stations 450,000 450,000
Highland Lift Station Improvements 300,000 300,000
Sanitary Sewer Improvements 150,000 150,000
16th St. Nad Crescent Lift Station Improvements 150,000 600,000
9th St. Sewer Improvements 100,000 100,000
Manhole Abdandonemet and adjustments 50,000 50,000
New Meters 50,000 50,000
Convert Lift Stations form Analog to Fiber 50,000 50,000
Camera Truck Upgrade 50,000 50,000
Replace Vehicle 84 35,000 35,000
Total Wastewater Collection 2,585,000 3,335,000
Administration Deploy New DAS/SAN storage backup system 200,000 250,000
Replace Garage MakeUp Air Unit 78,000 78,000
20 Additional User Licenses for Infor 60,000 60,000
Sharepoint/Office upgrade 30,000 30,000
Replace Courier Vehicle 28,000 28,000
RFD Integration with bar Coding 25,000 25,000
Shelter switch Stack Upgrade 20,000 20,000
Replace crew chairs 14,000 14,000
Fire Suppression for Communications Room 12,000 12,000
Install SCADA Fire Protection 12,000 12,000
Replace Halon System - Service center 12,000 12,000
Replace service center Fire Panel 10,000 10,000
Replace Lights in Garage and water Shop 10,000 10,000
All Remaining projects 16,400 16,400
Total Administration 527,400 577,400
TOTAL BOARD OF PUBLIC WORKS UTILITIES 51,265,219$ 282,780,166$
Wastewater
Collection
-401-

New
or Approved
Department Type Description Replacement Amount
Machinery & Equipment
HPD IDENTIX Computer Replace 7,000
SAN Project New 90,000
Laserfiche Replace 15,000
Total - Machinery & Equipment 112,000
Total Technology Services Fund - Data Processing 112,000
Machinery & Equipment
Assessing MFP Replace 5,000
Total - Machinery & Equipment 5,000
Total Technology Services Fund - Duplicating/Photocopying 5,000
TOTAL INTERNAL SERVICES 117,000$
CAPITAL OUTLAYINTERNAL SERVICES
TECHNOLOGY
SERVICES FUND -
DATA PROCESSING
TECHNOLOGY
SERVICES FUND -
DUPLICATING/
PHOTOCOPYING
-402-

New
or Approved
Department Description Replacement Amount
(16) Vinyl Pocker Table Signs SG560 New 472
(6) US Flag w/Base New 834
(2) Table Top Plastic Voting Booth (8 per pack) Replace 370
Total Elections 1,676
CITY CLERK (5) HON Office Chairs Replace 1,750
(2) Skycams New 2,600
Black Magic Production Switcher Replace 2,100
Edelkrone Slider PLUS New 2,000
LED Light New 1,300
DSL Monitor/Recorder (storage) New 2,000
DSLR Gimble Stableizer New 1,300
DSLR Body and Bag New 1,200
Shoe Mount Mics New 500
Total Cable TV Public Access Fund 13,000
TOTAL MANAGEMENT & ADMINISTRATION 16,426
(2) Kustom Signal Golden Eagle Dual Antenna Radar Units Replace 3,090
Evidence Technician Equipment Handheld UV Light Replace 950
Honor Guard Equipment Replace 1,000
(4) Report writing digital recorders Replace 2,000
(2) Brother in car printers Replace 1,000
Radio System Replacement Brackets & Belt Clips Replace 4,050
Total Public Safety - Police Services 12,090
(21) Sterling F4 Escape Kits for PPE for existing
turnout ensembles New 7,700
(10) NFPA Compliant Turnout Coat & Pant Replace 26,650
Ensembles, with integrated safety harness to
include Sterling F4 Escape Kit with Purchase
(2) Tempest Direct Drive Positive Pressure Fan Replace 5,300
Ventilation Saw w/Depth Guage Replace 2,000
Total Public Safety - Fire Services 41,650
TOTAL PUBLIC SAFETY 53,740
CAPITAL OUTLAYCONTROLLED ITEMS
MANAGEMENT & ADMINISTRATION
ELECTIONS
CABLE TV PUBLIC
ACCESS FUND
PUBLIC SAFETY
PUBLIC SAFETY -
POLICE SERVICES
PUBLIC SAFETY -
FIRE SERVICES
-403-

New
or Approved
Department Description Replacement Amount
CAPITAL OUTLAYCONTROLLED ITEMS
(2) 3/4 Air Wrench Replace 1,300
Storage Units / Shelving Replace 3,500
Air Conditioning Machine/Shop Replace 4,000
Diagnostic Machine Replace 3,600
Metal Pipe Bender/Shop New 2,600
(20) GPS units (includes annual fees) New 5,000
#156 Hedge Trimmer Replace 300
(2) #158/#160 20" Chain Saws Replace 1,200
#202 14" Chain Saw Replace 400
Total Centralized Vehicle / Equipment Fund 21,900
TOTAL TRANSPORTATION 21,900
(2) Vari Desk Adjustable Desks New 1,000
(6) Downtown Benches New 9,000
Refuse Containers New/Replace 65,000
TOTAL COMMUNITY & NEIGHBORHOOD SERVICES 75,000
CEMETERIES (6) Stihl FS110 Trimmer Replace 1,800
(2) Little Wonder Optimax Blower Honda GX270 Replace 2,800
(2) BR600 Backpack Blower Replace 1,000
Ariens Walk Behind Edger New 350
HS82T 24" Hedger Replace 400
(3) Alturnamats Polyethylene Boards New 360
(20) Cemetery Section Signs New 4,000
Total Cemeteries 10,710
HOUSING &
NEIGHBORHOODS
TRANSPORTATION
CENTRALIZED
VEHICLE / EQUIPMENT
FUND
COMMUNITY & NEIGHBORHOOD SERVICES
DOWNTOWN
DEVELOPMENT
AUTHORITY FUND
SOLID WASTE
RECYCLING FUND
PARKS & RECREATION
-404-

New
or Approved
Department Description Replacement Amount
CAPITAL OUTLAYCONTROLLED ITEMS
RECREATION Matt Urban Soccer/Football Scoreboard (w/installation) Replace 5,000
Trailer 7' X 12' New 2,700
(2) AED Machines New 4,000
Vertical Power Rake 22" New -
Total Recreation 11,700
PARKS (3) Stihl 110R Trimmers Replace 1,200
(2) Stihl MS201T 14" Arborist Saw Replace 1,460
(2) Stihl BR600 Backpack Blower New/Replace 1,000
Stihl MS261 CM 20" Saw Replace 730
Stihl 130R Combination Motor w/accessories New 840
Climbing gear, Tools, Rigging gear, Safety Equipment New/Replace -
Plumbing and Structural repair to small pond in Repair 1,200
Centennial Park
Roto-Tiller Front Tine Replace -
(3) Alturnamats Polyethylene Boards New 360
Stihl B86 Handheld Blower New 240
Stihl HT131 Pruning Saw Replace 650
Stihl HS82T Hedge Trimmer Replace 400
Toro 721R-C Single Stage Snow Blower New -
Total Parks 8,080
Two Exterior Doors Replace 3,000
Total DeGraaf Nature Center 3,000
CIVIC CENTER (8) Tables Replace 3,600
(45) Chairs Replace 1,400
Total Civic Center 5,000
Hot Water Heater in Shops Replace 800
Desktop Computer for Horticulture staff Replace 500
Backpack Blower Replace 500
Public Address System Replace 750
Total Windmill Island Gardens Fund 2,550
TOTAL PARKS & RECREATION 38,040
PARKS & RECREATION (continued)
DEGRAAF NATURE
CENTER
WINDMILL ISLAND
GARDENS FUND
-405-

New
or Approved
Department Description Replacement Amount
CAPITAL OUTLAYCONTROLLED ITEMS
(36) PC Replacements Replace 57,600
Business Continunity and DR Software New 2,400
(2) CNS 24" LCD Monitors Replace -
EVH Desktop MFP Replace -
CNS MS Surface New 1,700
Ipad CC Terminal for Matt Urban New 800
HR Laptop Replace 1,700
Transportation Computer New 1,600
WIG Computer Replace 1,600
WIG PA System Replace 750
WIG TV and Stand New 1,300
Assessing TV and Stand Replace 1,300
HPD Camera Conversions Replace 3,100
HPD ID Card Upgrade Replace -
HPD New Camera Replace 2,000
HPD Training Software New 2,000
HPD TV New -
HPD Projector/Cart New 1,500
HPD Standup Desk New 500
Finance Check Printer Replace 1,200
Managers Office MS Surface Replace -
(12) Server Licenses Replace 7,800
Total Technology Services Fund 88,850
Various workout equipment for City Facilities Replace 4,500
Total Health Insurance City Wellness 4,500
TOTAL INTERNAL SERVICES FUNDS 93,350
GRAND TOTAL : GENERAL FUND 96,656$
GRAND TOTAL : OTHER FUNDS 204,800
GRAND TOTAL : ALL FUNDS & SERVICE GROUPS 301,456$
INTERNAL SERVICES
TECHNOLOGY
SERVICES FUND
TOTALS
HEALTH INSURANCE
CITY WELLNESS
-406-

> LEGAL DEBT LIMITATION AND LEGAL DEBT MARGIN
> SUMMARY LISTING
> FUND SUMMARIES (see note below)
- ACROSS ALL LTGO BOND ISSUES
- TAXATION & CASH CONTROL
- BUILDING AUTHORITY BONDS
- SPECIAL ASSESSMENT BONDS
- PENSION OBLIGATION BONDS
- ACT 99 INSTALLMENT PURCHASE AGREEMENT
> DETAIL OF REMAINING DEBT REQUIREMENTS
- BY INDIVIDUAL DEBT OBLIGATION
Note -
For further financial debt service summary information on government long-term debt
issued for a specific enterprise-type of purpose (e.g., Electric Generation), reference
the fund financial statements (balance sheet, revenue & expense statement, and cash
flow statement) of the specific enterprise fund. Detail of annual principal and interest
requirements are included in this appendix.
APPENDIX C
DEBT SERVICE
-407-

Total Taxable Value Across All Property Classfications 1,106,701,021$
Percentage Limit of Total Taxable Value (In Accordance with the City Charter) 10%
Debt Limitation 110,670,102$
Total Bonded Debt at July 1, 2016 (excludes Capital Leases) 229,335,000$
Less the Following:
- Debt Items Not Subject to Limitation :
Special Assessment Bonded Debt ( 50,000 )
Revenue Bonded Debt (excludes Sewage Disposal Bond Issue) ( 175,720,000 )
- Amount Available for Repayment of G.O. and L.T.G.O. Bonds at July 1, 2016:
Estimated Fund Balance in G.O. and L.T.G.O. Debt Service Funds ( 259,759 )
Debt Amount Applicable to Debt Limitation 53,305,241$
Debt Limitation Minus Debt Applicable to Limitation Equals Estimated Legal Debt Margin 57,364,861$
governmental jurisdictions based upon an executed Library Support Agreement. This percentage fluctuates annually
based upon taxable values. A uniform millage rate is levied annually across the four (including City of Holland)
participating governmental units to support this debt repayment.
For practical purposes 62.1% of $875,000, or $267,030, should be added to the Legal Debt Margin shown above.
Library Expansion Project. Payment of approximately 62.1% of the debt is committed to be paid by three area local
CITY OF HOLLAND
DEBT LIMITATION AND LEGAL DEBT MARGIN
AT JULY 1, 2016
DEBT LIMITATION AT JULY 1, 2016
DEBT APPLICABLE TO LIMITATION AT JULY 1, 2016
ESTIMATED LEGAL DEBT MARGIN AT JULY 1, 2016
ADDITIONAL NOTE:The City of Holland is legally indebted for the $430.000 Building Authority Bonds issued in 2004 for the Herrick District
0100000002000000030000000400000005000000060000000700000008000000090000000
100000000110000000120000000130000000
FY‐08 FY‐09 FY‐10 FY‐11 FY‐12 FY‐13 FY‐14 FY‐15 FY‐16 FY‐17
Debt Applicable to Limitation Legal Debt Margin
-408-

Net
Schedule of Outstanding Effective Debt Debt Debt Debt
Long-Term Funded Debt Final Interest Principal Interest Principal Interest
Debt Obligations By Issuance Maturity Rate Amount Total Amount Total
Act 34 Capital Improvements Bond Issues
2008 Parking Deck Brownfield Capture 07-31-08 05-01-33 4.504268% 4,000,000 2,939,470 3,465,000 1,650,845
2010 Street Improvements Property Taxation 05-26-10 08-01-19 2.744873% 5,500,000 826,255 2,690,000 171,035
Total Act 34 Capital Improv. Issues 9,500,000 3,765,725 6,155,000 1,821,880
Building Authority Bond Issues
2006 Refunding Police/Transp/W.G. Property Taxation 04-13-06 10-01-21 4.01637% 7,255,000 3,958,445 6,950,000 1,130,206
2010 Refunding Police/Transp/W.G. Property Taxation 09-09-10 10-01-18 2.39586% 7,425,000 1,204,325 2,960,000 99,113
2004 Herrick Dist. Library Refunding Property Taxation 05-13-04 05-01-17 3.84925% 5,400,000 1,560,433 430,000 18,275
Total Building Authority Bond Issues 20,080,000 6,723,203 10,340,000 1,247,594
Special Assessment Issues
Series 2006-A Issue Special Assmts. 06-01-06 06-01-20 5.060000% 155,000 60,720 50,000 6,831
Total Special Assessment Issues 155,000 60,720 50,000 6,831
Pension Obligation, Series 2015 Issue Property Taxation 11-18-15 12-01-25 2.862191% 25,000,000 4,039,168 25,000,000 3,747,426
& Utility Funds
Act 99 Installment Purchase Agrmt Property Taxation 02-25-16 06-01-26 2.190000% 3,000,000 374,331 3,000,000 374,331
Total Governmental Funds 57,735,000 14,963,147 44,545,000 7,198,062
Board of Public Works Issues
Water Series 2012-A Refunding Water Fund 07-01-14 07-01-24 2.81250% 9,740,000 2,635,719 9,355,000 1,731,432
Water Series 2013-A Refunding Water Fund 01-01-14 07-01-17 1.22000% 3,260,000 238,350 2,480,000 113,400
Drinking Water Program Bond Water Fund 09-23-11 04-01-32 2.50000% 6,026,500 1,428,768 5,045,000 1,033,844
Electric Series 2014-A Revenue Bond Electric Fund 04-22-14 07-01-39 4.06000% 158,840,000 95,900,678 158,840,000 102,522,085
Sewage Disposal Series 2015 Bond Wastewater Fund 04-15-15 06-01-35 2.75640% 9,500,000 3,175,265 9,500,000 2,922,444
Total Board of Public Works Issues 187,366,500 103,378,780 185,220,000 108,323,205
Total Enterprise Funds 187,366,500 103,378,780 185,220,000 108,323,205
Grand Total 245,101,500 118,341,927 229,765,000 115,521,267
Date Of Original Issuance Remaining @ 07/01/16
(Existing Issues Across All Governmental Debt Service Funds, Includes Enterprise Funds)
DEBT SERVICE
-409-

FY-2014 FY-2015 FY-2016 FY-2017
Final Final Final Adopted
Description Actual Actual Revised Est. Budget
FUNDING SOURCES -
Taxes 2,830,463$ 2,390,584$ 2,432,854$ 4,060,214$
Special Assessments 88,297 49,664 35,985 7,704
Interest & Rents
* Building Authority Rental Receipts -
from Herrick District Library 529,657 505,488 482,487 448,575
* Special Assesssment Interest 10,683 6,004 3,466 1,695
* Investment Income 5,080 2,888 3,260 3,260
Other - 0 - - 0 - - 0 - 1,619,475
Transfers In 1,281,110 261,566 268,098 279,191
TOTAL SOURCES 4,745,288$ 3,216,194$ 3,226,150$ 6,420,114$
FUNDING USES -
Other Current Expenditures -
* Other Miscellaneous (3,614)$ 760$ 1,001$ 1,001$
Debt Service Payments -
* Principal 3,839,000 2,389,000 2,445,000 5,126,459
* Interest 910,245 775,678 692,883 1,276,539
* Agent Fees 2,138 3,575 3,800 3,800
Transfers Out 50,292 22,136 23,981 1
TOTAL USES 4,798,061$ 3,191,149$ 3,166,665$ 6,407,800$
INCREASE (DECREASE) (52,773)$ 25,046$ 59,485$ 12,314$
ENDING BALANCE -
- for General Municipal Long-term Debt 182,054$ 187,466$ 244,473$ 259,758$
- for Special Assessment Long-term Debt 17,753 37,386 39,864 36,893
TOTAL FUND EQUITY 199,807$ 224,853$ 284,337$ 296,651$
Note - The summary excludes Building Authority and Notes Payable Rental Reciepts & Rental Payments of $2,090,057
for two related bond issues as those Sources & Uses are already included in Taxes (Sources) and Principal/Interest
Maturities (Uses).
- - F U N D I N G S O U R C E S & U S E S - -
- - F U N D E Q U I T Y - -
DEBT SERVICE
SUMMARY ACROSS ALL LTGO BOND ISSUES
LIMITED TAX GENERAL OBLIGATION (LTGO)
-410-

FY-2014 FY-2015 FY-2016 FY-2017
Final Final Final Adopted
Description Actual Actual Revised Est. Budget
FUNDING SOURCES -
Taxes 2,830,463$ 2,390,584$ 2,432,854$ 4,060,214$
Investment Income 4,393 2,530 3,000 3,000
Other - 0 - - 0 - - 0 - 1,619,475
Transfers In 1,214,704 261,565 268,097 279,190
TOTAL SOURCES 4,049,559$ 2,654,679$ 2,703,951$ 5,961,879$
FUNDING USES -
Other Current Expenditures -
* Other
- Miscellaneous (3,615)$ 759$ 1,000$ 1,000$
- Principal - Pension Bond - 0 - - 0 - - 0 - 2,275,000
- Interest - Pension Bond - 0 - - 0 - - 0 - 598,449
- Fees - Pension Bond - 0 - - 0 - 500 500
- Principal - Act 34 Capital Improvement 85,000 100,000 110,000 125,000
- Interest - Act 34 Capital Improvement 163,790 160,815 157,065 152,940
- Fees - Act 34 Capital Improvement 750 750 750 750
- Principal - Act 34 Streets 560,000 585,000 605,000 630,000
- Interest - Act 34 Streets 114,960 102,919 88,624 72,247
- Fees - Act 34 Streets 100 750 750 750
- Principal-Ottawa County Drain 64,000 64,000 - 0 - - 0 -
- Interest-Ottawa County Drain 5,606 2,803 - 0 - - 0 -
- Building Auth. Rent Payments 3,012,337 1,631,631 1,683,344 1,736,856
- Energy Performance Payment - 0 - - 0 - - 0 - 353,201
Transfers Out 1 1 1 1
TOTAL USES 4,002,930$ 2,649,428$ 2,647,034$ 5,946,694$
SOURCES OVER (UNDER) USES 46,629$ 5,252$ 56,917$ 15,185$
ENDING FUND EQUITY 169,309$ 174,561$ 231,478$ 246,663$
3.629 mills
Taxable Value
of $1,038,008,191
(excludes Ren. Zones, includes Brownfields)
DEBT SERVICE
LIMITED TAX GENERAL OBLIGATION (LTGO)
TAXATION & CASH CONTROL
-411-


FY-2014 FY-2015 FY-2016 FY-2017
Final Final Final Adopted
Description Actual Actual Revised Est. Budget
FUNDING SOURCES -
Taxes & Special Assessments:
* Special Assessment Principal 88,297$ 49,664$ 35,985$ 7,704$
Interest & Rents:
* Special Assessment Interest 10,683 6,004 3,466 1,695
* Investment Income 529 198 170 160
Other - 0 - - 0 - - 0 - - 0 -
Transfers In 66,405 - 0 - - 0 - - 0 -
TOTAL SOURCES 165,913$ 55,866$ 39,621$ 9,559$
FUNDING USES -
Debt Service Payments -
* Principal 205,000$ 10,000$ 10,000$ 10,000$
* Interest 9,558 3,823 3,163 2,530
* Agent Fees 625 275 - 0 - - 0 -
Transfers Out 50,291 22,135 23,980 - 0 -
TOTAL USES 265,473$ 36,233$ 37,143$ 12,530$
SOURCES OVER (UNDER) USES (99,560)$ 19,633$ 2,478$ (2,971)$
ENDING FUND EQUITY 17,753$ 37,386$ 39,864$ 36,893$
DEBT SERVICE
LIMITED TAX GENERAL OBLIGATION (LTGO)
SPECIAL ASSESSMENT BONDS
(SUMMARY OF THREE OUTSTANDING ISSUES)
-413-

FY-2014 FY-2015 FY-2016 FY-2017
Final Final Final Adopted
Description Actual Actual Revised Est. Budget
FUNDING SOURCES -
Special Assessments 12,747$ 1,164$ 1,164$ - 0 -$
Special Assessments - Alternates - 0 - - 0 - - 0 - - 0 -
Interest on Special Assessment Installments 980 151 76 - 0 -
Investment Income 199 4 10 - 0 -
Investment Income - Market Adjustment 1 (0) - 0 - - 0 -
FUNDING SOURCES - TOTALS 13,927$ 1,319$ 1,250$ - 0 -$
FUNDING USES -
Principal Retirement 25,000$ - 0 -$ - 0 -$ - 0 -$
Interest Expense 1,463 - 0 - - 0 - - 0 -
Paying Agent Fees 275 275 - 0 - - 0 -
Transfer to G.O. Debt Fund 30,000 - 0 - - 0 - - 0 -
FUNDING USES - TOTALS 56,738$ 275$ - 0 -$ - 0 -$
Excess (Deficiency) of Funding Sources
over Funding Uses (42,810) 1,044 1,250 - 0 -
ENDING FUND EQUITY 333$ 1,377$ 2,626$ 2,626$
DEBT SERVICE
SPECIAL ASSESSMENT BOND SERIES 2000A
-414-

FY-2014 FY-2015 FY-2016 FY-2017
Final Final Final Adopted
Description Actual Actual Revised Est. Budget
FUNDING SOURCES -
Special Assessments 67,583$ 40,042$ 27,117$ - 0 -$
Interest on Special Assessment Installments 6,680 3,262 1,271 - 0 -
Bond Proceeds - 0 - - 0 - - 0 - - 0 -
Investment Income 79 - 0 - - 0 - - 0 -
Investment Income - Market Adjustment - 0 - - 0 - - 0 - - 0 -
Transfer In 66,405 - 0 - - 0 - - 0 -
FUNDING SOURCES - TOTALS 140,747$ 43,304$ 28,388$ - 0 -$
FUNDING USES -
Principal Retirement 170,000$ - 0 -$ - 0 -$ - 0 -$
Interest Expense 4,050 285 127 - 0 -
Paying Agent Fees 350 - 0 - - 0 - - 0 -
Transfer out 20,291 22,135 23,980 - 0 -
FUNDING USES - TOTALS 194,690$ 22,420$ 24,107$ - 0 -$
Excess (Deficiency) of Funding Sources
over Funding Uses (53,944) 20,884 4,281 - 0 -
ENDING FUND EQUITY (8,709)$ 12,175$ 16,456$ 16,456$
DEBT SERVICE
SPECIAL ASSESSMENT BOND SERIES 2002A
-415-

FY-2014 FY-2015 FY-2016 FY-2017
Final Final Final Adopted
Description Actual Actual Revised Est. Budget
FUNDING SOURCES -
Special Assessments 7,967$ 8,458$ 7,704$ 7,704$
Interest on Special Assessment Installments 3,023 2,591 2,119 1,695
Investment Income 177 198 160 160
Investment Income - Market Adjustment 72 (4) - 0 - - 0 -
FUNDING SOURCES - TOTALS 11,239$ 11,243$ 9,983$ 9,559$
FUNDING USES -
Principal Retirement 10,000$ 10,000$ 10,000$ 10,000$
Interest Expense 4,045 3,538 3,036 2,530
Paying Agent Fees - 0 - - 0 - - 0 - - 0 -
Transfer to Capital Project Funds - 0 - - 0 - - 0 - - 0 -
FUNDING USES - TOTALS 14,045$ 13,538$ 13,036$ 12,530$
Excess (Deficiency) of Funding Sources
over Funding Uses (2,806) (2,294) (3,053) (2,971)
ENDING FUND EQUITY 26,129$ 23,835$ 20,782$ 17,811$
DEBT SERVICE
SPECIAL ASSESSMENT BOND SERIES 2006A
-416-

FY-2014 FY-2015 FY-2016 FY-2017
Final Final Final Adopted
Description Actual Actual Revised Est. Budget
FUNDING SOURCES -
Interest & Rents:
from Debt Svcs Cash Control- Taxes - 0 - - 0 - - 0 - 353,201
Investment Earnings - 0 - - 0 - - 0 - - 0 -
Other - 0 - - 0 - - 0 - - 0 -
Transfer In - 0 - - 0 - - 0 - - 0 -
FUNDING SOURCES - TOTALS - 0 -$ - 0 -$ - 0 -$ 353,201$
FUNDING USES -
Debt Service Payments
Principal - 0 - - 0 - - 0 - 271,459
Interest - 0 - - 0 - - 0 - 81,742
Agent Fees - 0 - - 0 - - 0 - - 0 -
Transfer Out - 0 - - 0 - - 0 - - 0 -
FUNDING USES - TOTALS - 0 -$ - 0 -$ - 0 -$ 353,201$
Excess (Deficiency) of Funding Sources
over Funding Uses - 0 - - 0 - - 0 - - 0 -
ENDING FUND EQUITY - 0 -$ - 0 -$ - 0 -$ - 0 -$
DEBT SERVICE
ACT 99 PURCHASE AGREEMENT
ENERGY PERFORMANCE BONDS
-417-

Fiscal Year Principal Interest Total
2016-17 630,000 72,247 702,247
2017-18 660,000 53,850 713,850
2018-19 685,000 33,498 718,498
2019-20 715,000 11,440 726,440
Total 2,690,000 171,035 2,861,035
Fiscal Year Principal Interest Total
2016-17 430,000 18,275 448,275
Total 430,000 18,275 448,275
With Limited Tax General Obligation Pledge (Refunded the Series 1997 Library Bond Issue)
$5,400,000 Non-Voted Bond Issue dated May 13, 2004
Total Original Bond Issue: 13 Annual Serial Maturities from May 1, 2005 to May 1, 2017
Principal & Interest maturities are financed 100% by 'Rental Payments' to the Building Authority
DEBT SERVICE FUNDS - REMAINING ANNUAL REQUIREMENTS
NOTE: LONG-TERM DEBT REQUIREMENTS THAT ARE SUPPORTED FROM REVENUES
OF SPECIFIC PROPRIETARY FUNDS ARE DISPLAYED WITH THAT FUND.
BUILDING AUTHORITY REFUNDING BOND ISSUE, Series 2004
Principal and Interest maturities are financed 100% by Property Taxation
ACT 34 STREET CAPITAL IMPROVEMENT BOND ISSUE, Series 2010
With Limited Tax General Obligation Pledge (Funding for Various Street Projects)$5,500,000 Non-Voted Bond Issue dated May 26, 2010
Total Original Bond Issue: 9 Annual Serial Maturities from August 1, 2011 to August 1, 2019
-418-

Fiscal Year Principal Interest Total
2016-17 35,000 277,156 312,156
2017-18 40,000 275,750 315,750
2018-19 1,450,000 246,000 1,696,000
2019-20 1,735,000 182,300 1,917,300
2020-21 1,810,000 111,400 1,921,400
2021-22 1,880,000 37,600 1,917,600
Total 6,950,000 1,130,206 8,080,206
DEBT SERVICE FUNDS - REMAINING ANNUAL REQUIREMENTS ( continued )
BUILDING AUTHORITY REFUNDING BOND ISSUE, Series 2006
With Limited Tax General Obligation Pledge (Refunded the Series 2002 Police/Transp. Bond Issue)
Total Original Bond Issue: 16 Annual Serial Maturities from October 1, 2006 to October 1, 2021
Principal & Interest maturities are financed 100% by 'Rental Payments' to the Building Authority
$7,255,000 Non-Voted Bond Issue dated April 13, 2006
-419-

Fiscal Year Principal Interest Total
2016-17 125,000 152,940 277,940
2017-18 130,000 147,940 277,940
2018-19 135,000 142,740 277,740
2019-20 120,000 137,340 257,340
2020-21 135,000 132,540 267,540
2021-22 150,000 126,802 276,802
2022-23 165,000 120,427 285,427
2023-24 180,000 113,415 293,415
2024-25 195,000 105,765 300,765
2025-26 215,000 97,478 312,478
2026-27 235,000 88,340 323,340
2027-28 255,000 78,118 333,118
2028-29 275,000 67,025 342,025
2029-30 285,000 54,650 339,650
2030-31 285,000 41,825 326,825
2031-32 290,000 29,000 319,000
2032-33 290,000 14,500 304,500
Total 3,465,000 1,650,845 5,115,845
DEBT SERVICE FUNDS - REMAINING ANNUAL REQUIREMENTS ( continued )
ACT 34 CAPITAL IMPROVEMENT BOND ISSUE, Series 2008
Principal & Interest maturities are financed 100% by Brownfield Redevelopment Tax Capture
With Limited Tax General Obligation Pledge (Funding for the 7th Street Parking Deck)
$4,000,000 Non-Voted Bond Issue dated July 31, 2008
Total Original Bond Issue: 24 Annual Serial Maturities from May 1, 2010 to May 1, 2033
-420-

Fiscal Year Principal Interest Total
2016-17 1,350,000 73,200 1,423,200
2017-18 1,460,000 23,663 1,483,663
2018-19 150,000 2,250 152,250
Total 2,960,000 99,113 3,059,113
Fiscal Year Principal Interest Total
2016-17 10,000 2,530 12,530
2017-18 10,000 2,024 12,024
2018-19 15,000 1,518 16,518
2019-20 15,000 759 15,759
Total 50,000 6,831 56,831
$7,425,000 Non-Voted Bond Issue dated September 9, 2010
Total Original Bond Issue: 8 Annual Serial Maturities from Oct. 1, 2011 to Oct. 1, 2018
DEBT SERVICE FUNDS - REMAINING ANNUAL REQUIREMENTS ( continued )
BUILDING AUTHORITY REFUNDING BOND ISSUE, Series 2010
With Limited Tax General Obligation Pledge (Refunded the Series 2002 Police/Transp. Bond Issue)
Principal and Interest maturities are financed 100% by Special Assessments
Total Original Bond Issue: 14 Annual Serial Maturities from June 1, 2007 to June 1, 2020
Principal & Interest maturities are financed 100% by 'Rental Payments' to the Building Authority
$155,000 Non-Voted Bond Issue dated June 1, 2006
SPECIAL ASSESSMENT BOND ISSUE, Series 2006-A
With Limited Tax General Obligation Pledge
-421-

Fiscal Year Principal Interest Total
2016-17 2,275,000 598,449 2,873,449
2017-18 2,300,000 575,199 2,875,199
2018-19 2,335,000 540,280 2,875,280
2019-20 2,380,000 494,261 2,874,261
2020-21 2,435,000 439,459 2,874,459
2021-22 2,500,000 376,861 2,876,861
2022-23 2,570,000 305,967 2,875,967
2023-24 2,645,000 227,312 2,872,312
2024-25 2,735,000 141,332 2,876,332
2025-26 2,825,000 48,308 2,873,308
Total 25,000,000 3,747,426 28,747,426
Proceeds were utilized to pay down the unfunded accrued actuarial liability (UAL) of the 'closed'
groups within the City of Holland Defined Benefit Pension Plan as administered by the
Michigan Municipal Employee Retirement System (MERS).
Proceeds of bond issue were split between the City of Holland (43.64%) and Holland Board of
Public Works (56.36%). Repayment will be made using the same allocation.
DEBT SERVICE FUNDS - REMAINING ANNUAL REQUIREMENTS ( continued )
PENSION OBLIGATION BOND ISSUE, Series 2015
With Limited Tax General Obligation Pledge
$25,000,000 Non-Voted Bond Issue dated November 18, 2015
Total Original Bond Issue: 11 Annual Serial Maturities from June 1, 2016 to December 1, 2025
HBPW Portion - Principal & Interest maturities are financed 100% by Utility Fund Revenue
City Portion - Principal & Interest maturities are financed 100% by Property Taxation
-422-

Fiscal Year Principal Interest Total
2016-17 271,459 81,742 353,201
2017-18 277,437 58,244 335,681
2018-19 283,546 52,135 335,681
2019-20 289,790 45,892 335,681
2020-21 296,171 39,510 335,681
2021-22 302,692 32,989 335,681
2022-23 309,358 26,324 335,681
2023-24 316,170 19,512 335,681
2024-25 323,132 12,549 335,681
2025-26 330,247 5,434 335,681
Total 3,000,000 374,331 3,374,331
To pay for numerous energy improvements on city facilities described in the scope of work
in the Energy Services contract between Schneider Electric Buildings Americas, Inc.
and the City of Holland, dated January 4, 2016.
DEBT SERVICE FUNDS - REMAINING ANNUAL REQUIREMENTS ( continued )
ACT 99 INSTALLMENT PURCHASE AGREEMENT
With Qualified Tax-Exempt Obligation Pledge
$3,000,000 Non-Voted dated February 25, 2016
Total Original Issue: 10 Annual Serial Maturities from December 1, 2016 to June 1, 2026
Principal & Interest maturities are financed 100% by Property Taxation
-423-

WATER FUND
DETAIL OF ANNUAL PRINCIPAL AND INTEREST REQUIREMENTS
FOR REMAINING MATURITIES
WATER SUPPLY REFUNDING BOND ISSUE, Series 2012-A
Without Limited Tax General Obligation Pledge
$9,740,000 Non-Voted Bond Issue dated June 6, 2012 with 11 Annual Serial Maturities
from July 1, 2014 to July 1, 2024
Principal and Interest maturities are financed 100% by Water Utility Fund Revenues
Refunding
Discount Total
Fiscal Year Principal Interest Amortization Requirements
2016-17 190,000 294,413 (6,845) 477,568
2017-18 190,000 290,613 (6,756) 473,857
2018-19 1,145,000 275,831 (6,153) 1,414,678
2019-20 1,185,000 245,175 (5,321) 1,424,854
2020-21 1,235,000 208,875 (4,454) 1,439,421
2021-22 1,280,000 171,150 (3,556) 1,447,594
2022-23 1,325,000 132,075 (2,626) 1,454,449
2023-24 1,375,000 84,700 (1,339) 1,458,361
2024-25 1,430,000 28,600 0 1,458,600
Total 9,355,000 1,731,432 (37,050) 11,049,382
-424-

WATER FUND
DETAIL OF ANNUAL PRINCIPAL AND INTEREST REQUIREMENTS
FOR REMAINING MATURITIES
WATER SUPPLY REFUNDING BOND ISSUE, Series 2013-A
Without Limited Tax General Obligation Pledge
$3,260,000 Non-Voted Bond Issue dated January 1, 2014 with 5 Annual Serial Maturities
from January 1, 2014 to July 1, 2017
Principal and Interest maturities are financed 100% by Water Utility Fund Revenues
Refunding
Discount Total
Fiscal Year Principal Interest Amortization Requirements
2016-17 795,000 62,475 13,855 871,330
2017-18 830,000 38,100 7,030 875,130
2018-19 855,000 12,825 0 867,825
Total 2,480,000 113,400 20,885 2,614,285
-425-

WATER FUND
DETAIL OF ANNUAL PRINCIPAL AND INTEREST REQUIREMENTS
FOR REMAINING MATURITIES
WATER SUPPLY DRINKING BOND (with City of Wyoming)
Without Limited Tax General Obligation Pledge
$6,026,500 Non-Voted Bond Issue dated September 23, 2011 with 20 Annual Serial Maturities
from April 1, 2014 to April 1, 2032
Principal and Interest maturities are financed 100% by Water Utility Fund Revenues
Refunding
Discount Total
Fiscal Year Principal Interest Amortization Requirements
2016-17 260,000 116,537 379,812
2017-18 265,000 113,312 378,312
2018-19 275,000 106,687 381,687
2019-20 280,000 99,812 379,812
2020-21 290,000 92,812 382,812
2021-22 295,000 85,563 380,563
2022-23 300,000 78,187 378,187
2023-24 310,000 70,687 380,687
2024-25 315,000 62,937 377,937
2025-26 325,000 55,062 380,062
2026-27 335,000 46,937 381,937
2027-28 340,000 38,562 378,562
2028-29 350,000 30,062 380,062
2029-30 360,000 21,312 381,312
2030-31 370,000 12,312 382,312
2031-32 375,000 3,062 378,062
Total 5,045,000 1,033,844 0 6,082,119
Note - BPW makes entire debt payment and is reimbursed in part by the City of Wyoming.
-426-

ELECTRIC FUND
DETAIL OF ANNUAL PRINCIPAL AND INTEREST REQUIREMENTS
FOR REMAINING MATURITIES
ELECTRIC SYSTEM REVENUE BONDS ISSUE, Series 2014A
Without Limited Tax General Obligation Pledge
$158,840,000 Non-Voted Bond Issue dated April 22, 2014 with 26 Annual Serial Maturities
from July 1, 2014 to July 1, 2039
Principal and Interest maturities are financed 100% by Electric Utility Fund Revenues
Total
Fiscal Year Principal Interest Requirements
2016-17 6,621,406 6,621,406
2017-18 4,600,000 6,575,406 11,175,406
2018-19 4,690,000 6,490,513 11,180,513
2019-20 4,770,000 6,391,994 11,161,994
2020-21 4,890,000 6,283,469 11,173,469
2021-22 4,985,000 6,134,869 11,119,869
2022-23 5,185,000 5,949,994 11,134,994
2023-24 5,355,000 5,762,125 11,117,125
2024-25 5,560,000 5,576,031 11,136,031
2025-26 5,725,000 5,399,600 11,124,600
2026-27 5,915,000 5,173,847 11,088,847
2027-28 6,180,000 4,894,613 11,074,613
2028-29 6,470,000 4,607,725 11,077,725
2029-30 6,750,000 4,301,350 11,051,350
2030-31 7,085,000 3,961,444 11,046,444
2031-32 7,430,000 3,616,819 11,046,819
2032-33 7,775,000 3,264,225 11,039,225
2033-34 8,135,000 2,888,300 11,023,300
2034-35 8,525,000 2,523,750 11,048,750
2035-36 8,865,000 2,139,566 11,004,566
2036-37 9,295,000 1,701,841 10,996,841
2037-38 9,740,000 1,243,028 10,983,028
2038-39 10,210,000 762,150 10,972,150
2039-40 10,705,000 258,022 10,963,022
Total 158,840,000 102,522,085 0 254,740,678
-427-

WASTEWATER FUNDSCHEDULE OF PRINCIPAL AND INTEREST REQUIREMENTS
FOR REMAINING MATURITIES
The Wastewater Fund is responsible for 50% (indicated below) of this County of Ottawa Issue
$19,000,000 Non-Voted Bond Issue dated April 15, 2015 with 20 Annual Serial Maturities
from December 1, 2015 to June 1, 2035
Principal and Interest maturities are financed 100% by Wastewater Utility Fund Revenues
Total
Fiscal Year Principal Interest Requirements
2016-17 387,500 232,183 619,683
2017-18 395,000 229,276 624,276
2018-19 405,000 225,129 630,129
2019-20 417,500 220,066 637,566
2020-21 427,500 214,013 641,513
2021-22 437,500 206,959 644,459
2022-23 450,000 198,865 648,865
2023-24 462,500 189,640 652,140
2024-25 472,500 179,465 651,965
2025-26 485,000 168,598 653,598
2026-27 500,000 156,958 656,958
2027-28 512,500 144,208 656,708
2028-29 532,500 130,626 663,126
2029-30 550,000 115,716 665,716
2030-31 570,000 99,766 669,766
2031-32 590,000 82,096 672,096
2032-33 612,500 63,216 675,716
2033-34 635,000 43,310 678,310
2034-35 657,500 22,355 679,855
Total 9,500,000 2,922,444 0 12,422,444
HOLLAND AREA SEWAGE DISPOSAL SYSTEM, Series 2015
-428-

GLOSSARY OF FINANCIAL TERMS
A
Accounting System: The total structure of records and procedures which discover, record, classify, summarize and report upon results of transactions and operations, as well as financial condition/status. Accrual Basis of Accounting: Recognition of transaction when they occur, regardless of the timing of related cash flows. Accrual accounting techniques prevents fiscal period distortions in financial statement presentations that result the timing of cash flows and related economic events near the conclusion of a fiscal period. Adopted Budget: The final operating and capital budget, as approved by the City Council following public hearings and amendments to the proposed budget; that then becomes the legal guidance of the ensuing fiscal year for management and departments. Appropriation: A formally approved and adopted authorization to incur obligations and generate the expenditure of government resources for either a specific item or for a general class of objects. Appropriations for operations and smaller capital outlay items typically relate to a specific fiscal year. Appropriations for grant items most often relate to the specific period as specified by terms of the grant. Appropriations for very large capital outlays and capital projects most often are designated for the projected term of the capital item or capital project.
B
Balanced Budget: For a fiscal year, the total appropriated expenditures & outlays may not exceed total projected financing sources (i.e., estimated revenues plus anticipated drawdown of Reserves and/or Fund Balance). Bonded Debt Instrument: A written promise to pay a specified sum of money (called ‘principal’ or ‘face value’) at a specified future date (called ‘maturity date’), and periodically paying interest (most frequently at a specified ‘fixed rate’, or infrequently at a determinable ‘variable rate’). Bond Ratings: A measure of the quality and safety of a bond, based on the issuer's (City’s) financial condition. More specifically, an evaluation from an independent rating service indicating the likelihood that a debt issuer will be able to meet scheduled interest and principal repayments. Typically, ‘AAA’ is the highest (best), and ‘D’ is the lowest (worst). Brownfield Redevelopment Authority: By authorization of Michigan Public Act 381 of 1996, as amended, a local governmental unit may create a Brownfield Redevelopment Authority. Such an authority provides the opportunity to provide a local financing resource for eligible Brownfield activities, to enhance local economic development capabilities, and to market difficult abandoned sites based on the private investment incentives. Through redevelopment, a municipality can:
focus redevelopment in existing service areas that have become abandoned and/or contaminated
receive participation of multiple taxing units to financially contribute towards redevelopment
enhance local tax base through private sector development
provide financial reimbursement to private sector developers for eligible Brownfield activities thru State of Michigan Single Business Tax credits and local property taxes 'captured' using tax increment financing packages.
The City of Holland established a local Brownfield Redevelopment Authority in 2001. Budget: A fiscal year plan, adopted by the City Council, outlining targeted goals and objectives for the ensuing fiscal period; together with estimates of financial resources and expenditure authorization parameters to carry-out and meet those targets. However, the adopted plan is subject to modifications and adjustments throughout the fiscal year, at the desire and will of the Council. Budget Calendar: A schedule of key dates or milestones that the City follows in the process of preparing and adopting the ensuing fiscal year budget.
C
Capital Expenditures / Capital Outlay: Expenditures which result in acquisition, expansion or substantial rehabilitation of capital asset items. Capital Improvement / Capital Project: Major capital outlays related to the acquisition, expansion, development, and/or substantial rehabilitation to an element of the City’s physical plant; to include land, buildings, facilities, and infrastructure. Capital Improvement Plan (CIP): A multi-year plan, updated annually, that outlines and schedules all of the known major capital projects to be implemented; with each capital project to include a description and anticipated financing sources, and projected cost elements. Charges for Services: Fees assessed by the City to users of various defined government services, such as recreation fees, license fees, permit fees, special agreement fees, admission fees, etc. Component Unit: A legally separate organization for which the elected officials of the primary government are financially accountable. Contingencies Appropriation: A budgetary appropriation set aside for unforeseen and unanticipated expenditure items, and for minor emergencies. Such an appropriation is most often included in the original budget preparation process of various funds, and determined as a specific dollar amount or as a percentage of total budgeted expenditure appropriations.
D Debt Service: The cost of paying principal and interest maturities, and fiscal agent fees, on borrowed money to holders of the governmental unit’s debt instruments. Debt instruments provide specific stipulations concerning repayment; to include interest rate(s), due date intervals for payments of principal and interest, and total length of the debt service schedule (beginning to end).
-429-

GLOSSARY OF FINANCIAL TERMS
Debt Ratio: A measure used to determine total outstanding debt or annual debt service requirement as a percentage of some other item that indicates the ability of the City to repay the debt. Examples include:
Total annual debt service as a percentage of total annual expenditures
Total outstanding general obligation debt as a percentage of total assessed value.
Total outstanding debt as a percentage of total population.
Deficit: An excess of liabilities of a fund over its assets, and/or the excess of a fund’s expenditures over its revenues during an accounting period. In certain instances, an excess of expenditures over revenues is planned and budgeted, for the purpose of drawing the resulting deficit from the existing fund balance. Depreciation: The portion of the cost of a capital (fixed) asset that is charged as a non-cash expense over a scheduled period of years, for the purpose of reflecting assumed physical deterioration and functional obsolescence to the asset.
E
Economic Vitality Incentive Program (EVIP): Public Act 63 of 2011 included the creation of the Economic Vitality Incentive Program (EVIP) that replaced statutory Revenue Sharing that had been in place for many years. The three components of the program include Accountability and Transparency – Dashboard and Citizens Guide (10/1), Consolidation of Services Plan (1/1) and Employee Compensation Plan (5/1). Local units of government must comply with certain specified requirements under the program in order to receive the additional authorized revenue sharing payments. Employee Benefits: Employer provided sponsorship and/or funding of specified personal benefits and aid for designated employees. Some such benefits may be in the form of ‘cash’ paid to the employee, such as for ‘Uniform Allowance’. Others may be in the form of contributions or premiums paid by the employer – on behalf of the employee – for items such as ‘Health Insurance’ or ‘Pension Contribution’. Each one of the individual specific benefits may or may not be taxable to the employee, depending on the structure of an employer’s fringe benefit plan, along with existing federal and state laws. Encumbrance: A reservation of appropriated funds - via either an approved contract or issuance of a purchase order - representing a legal commitment to a vendor or service provider – for a specified future expenditure. Enterprise Fund: A Proprietary-type fund whose budgeting, accounting and financial reporting will mimic that found in a private-sector business; whereby a fee(s) is charged to external users for goods or services. Examples of such enterprise activities might include an Electric Utility Fund, a Water Utility Fund, and the Windmill Island Fund. Expenditure / Expense: Similar in nature, but distinguishable in governmental accounting, as follows:
Expenditure-represents a decrease in a government’s current financial resources due to the immediate or near-term outlay of cash for goods and/or services
o measurement focus application = current
financial resources o basis of accounting application = modified
accrual (combination of cash & accrual accounting)
Expense - represents charges incurred, whether paid immediately or not, for operations, maintenance, interest, or other purposes.
o measurement focus application = flow of economic resources
o basis of accounting application = full accrual
F
Fair Market Value: The price at which a willing seller will sell and a willing buyer will buy, in an arms-length transaction, when neither is under compulsion to sell or buy and both have reasonable knowledge of relevant facts. Financial Accounting Standards Board (FASB): A non-government private organization that sets GAAP in the United States for profit making entities and not-for-profit non-governmental organizations. Fixed Assets: Assets of a longer-term nature that are required for normal conduct of business, and which will not be converted into cash during the ensuring fiscal period. Examples include: furniture & fixtures, machinery & equipment, vehicles, land, facilities, and major improvements to land or facilities. The City of Holland’s current policy indicates that the initial of value, individually (or collectively for certain multiple items that are identical) should be at least $5,000; and the estimated useful economic life cycle of the asset must be at least two years. Fund: A segregated accounting entity with self-balancing accounts to record assets, liabilities, and equity balances; together with changes resulting from revenues and expenditures/expenses. The intent and purpose for establishment of a separate fund is normally to carry on with specific activities or to attain specific objectives. Accounting and reporting by funds is utilized primarily by governments and not-for-profit entities. Fund Balance (Deficit): Fund balance represents the excess of a fund’s assets over its liabilities. As a general rule, fund deficits are not allowed but, in certain cases, sometimes might exist for short and temporary periods of time pending some additional occurrence that eliminates the shortage. Fund Classifications/Types: For governmental purposes, funds will fall into one of three classifications. Within the classifications, funds are categorized into fund types they include: GOVERNMENTAL FUNDS
General Fund
Special Revenue Funds
Debt Service Funds
Capital Projects Funds
Permanent Funds PROPRIETARY FUNDS
Enterprise Funds
Internal Service Funds
-430-

GLOSSARY OF FINANCIAL TERMS
G
General Fund: One of five governmental fund types. It serves as the primary operating fund of a governmental unit; accounting for all financial resources and government services, except those required or mandated for accounting in a separate fund. Generally Accepted Accounting Principles (GAAP): The conventions, rules, and procedures that serve as the uniform minimum standards for accounting and financial statement presentation. For governmental units, Statement of Accounting Standards (SAS) No. 69 - issued by the AICPA – represents the authority delineating the various sources of Generally Accepted Accounting Principles. Governmental Accounting Standards Board (GASB): The ultimate authoritative accounting and financial reporting standard-setting body for state and local governments. Governmental Funds: An upper-level classification of funds that includes five different fund-types, to include: General Fund, Special Revenue Funds, Debt Service Funds, Capital Projects Funds, and Permanent Funds. All governmental funds share a common measurement focus, with the objective of the operating statements reflecting near-term inflows and outflows of spendable resources. To achieve this objective, a modified accrual basis of accounting is used which recognizes revenues in the accounting period in which they become both measurable and available to finance expenditures of the fiscal period; and that expenditures be recognized under the accrual method, but with various exceptions outlined under Governmental GAAP guidelines.
I
Industrial Facilities Tax (IFT) Abatement: Michigan Public Act 198 of 1974, as amended, is the primary economic development tool used by local units of government to provide incentives for industrial manufacturing companies to develop new or expand/renovate existing facilities and/or equipment. The financial incentive takes the form of reduced property taxes assessable to the company on the new or rehabilitated investment: New Facility or Equipment - The new property is assessed in the regular manner based upon true cash value. However, tax rates applied against the assessment are roughly 50% of the regular tax rates, for a specified period of years. Rehabilitated Facility or Equipment - The assessment on the obsolete property is frozen, and the rehabilitated / improved property is exempted from any assessment for a specified period of years. Taxes are levied against the frozen assessed value (of the obsolete property) at the regular tax rates, until the approved IFT abatement period expires. Infrastructure: Public domain capital assets that that are stationary in nature and normally can be preserved over a significant number of years. Examples include roads, bridges, tunnels, sidewalks, drainage systems, water and sewer systems, lighting systems, etc.
Intergovernmental Revenues: Funds received from federal, state, and other local government sources in the form of grants, shared revenues, and payments in lieu of taxes Internal Service Funds: Proprietary fund type used to record and report upon activities that provide goods and/or services to other funds, departments, or agencies of the primary government and its component units; or to other governmental units, on a cost-reimbursement basis.
L Legal Debt Margin: The amount of debt that may be legally authorized compared to the amount of debt that is currently outstanding.
M Macatawa Area Coordinating Council (MACC): An acronym that references a Metropolitan Planning Organization composed of nine adjacent local-area governments under the title 'Macatawa Area Coordinating Council' (MACC). This association was established in 1993, to encourage area-wide planning for topics of mutual concerns. This organization meets monthly to discuss and vote upon various agenda items, especially such items as transportation and watersheds. The MACC applies for and receives several federal and state grants for streets & highway construction, engineering and environmental studies, public transportation items, and watershed improvements.
Major Fund: A governmental fund or enterprise fund that is
reported as a separate column in the basic fund financial
statements. Major funds are those whose revenues,
expenditures/expenses, assets, or liabilities are at least 10%
of corresponding totals for all governmental or enterprise
funds, and at least 5% of the aggregate amount for all
governmental and enterprise funds for the same item. The
General Fund is always classified as a major fund; and any
other governmental or enterprise fund may be reported as a
major fund if government officials believe it to be particularly
important to financial statement users.
Measurement Focus: The objective of what is being expressed in the reporting of an entity’s financial performance and financial position. A particular measurement focus considers not only which resources are measured, but also when the effects of transactions or events that involve those resources are recognized. The specific methodology of financial reporting that places emphasis upon the types of transactions and events reflected in the operating statement of a fund:
For Governmental-Fund types - the focus is upon current financial resources.
For Proprietary-Fund types - the focus is upon total economic resources.
Modified Accrual Basis of Accounting: A methodology used for accounting and financial reporting of Governmental Type Funds whereby revenues are recognized in the accounting period in which they become available and measurable; and expenditures are recognized in the accounting period in which the liability is incurred, if measurable (exceptions include: unmatured interest on long-term debt and certain similar accrued obligations, which are recognized when due). Note:.
-431-

GLOSSARY OF FINANCIAL TERMS
The ‘basis of accounting’ methodology used is critical because the timing used to recognize transactions will, in turn, reflect the desired ‘measurement focus’ on the financial statement.
N Neighborhood Enterprise Zone (NEZ): The Neighborhood Enterprise Zone (NEZ) Program was established by Michigan Public Act 147 of 1992, as amended. A qualifying local unit of government may designate one or more specific areas as a NEZ. The program provides incentives for neighborhood revitalization through the development of new or rehabilitated owner-occupied residences in areas where it may not otherwise occur. The financial incentives primarily take the form of reduced property taxes for a specified number of years.
O Objectives: A statement that quantifies the desired outcome of an activity or policy. Objectives are focused at the budget unit level, but encompass the issue and mission of the department. Other Post-Employment Benefits (OPEB): An acronym that references Other Post-Employment Benefits which are most typically retiree medical benefits. The obligation for any post-employment medical costs must be disclosed under GASB Statement No. 45.
P
Performance Measurers: Quantitative and/or qualitative objective measurement of result by a department or division, as a means of determining the effectiveness in meeting goals and objectives. The ‘output’, ‘quality’ and ‘efficiency’ measurements that are used to assess how well an objective has been achieved. Permanent Funds: A fiduciary fund type used to report legally restricted resources which are legally restricted to the extent that only earnings, and not principal, may be used to support the government’s programs. Personal Services: Expenditures representing compensation for direct labor of persons in the employ of the government unit (to include those hired via independent employment services). Typical expenditures include salaries, wages, fringe benefits, and mandatory employer costs (e.g. Social Security, Medicare, Unemployment Compensation, and Workers Compensation). Primary Government Unit: A term that defines the financial reporting entity, such as the general purpose local government. It is the main focus of the financial statements. Proprietary Funds: A category of funds that focus on the determination of operating income, changes in net assets (or cost recovery), financial position, and cash flows. In many ways, the budgeting, accounting and financial reporting simulates that found in a ‘for-profit’ private-sector organization. There are basically two different types of proprietary funds: ‘Enterprise Funds’ and ‘Internal Service Funds’.
R Refunding: The issuance of new debt whose proceeds are used to repay previously issued debt that is currently outstanding. The proceeds may be used immediately for this
purpose (current refunding), or the proceeds may be placed into escrow and invested until used to pay principal and interest on the old debt at a designated future date (advance refunding). Reserved Fund Balance: An equity account indicating that a certain portion of a fund’s equity is legally restricted. As a result, net assets equivalent to the reserved amount are not available for appropriation because the designated amount is set aside for a unique future purpose.
S
Special Assessment: For Capital Improvements - A compulsory government levy made against specifically designated properties to defray all or a part of the cost of a specific capital improvement, such as street paving, curb & gutter replacement, sanitary sewer, watermain, etc. Such properties are considered to receive primary benefit and enhancement to property value as the result of the improvement. For Operating & Maintenance - A compulsory government levy made against specifically designated properties to defray all or a part of the ongoing operations & maintenance costs of a specific program. Such properties are considered to receive primary benefit as a result of the program. Special Revenue Funds: One of five governmental fund types. Special Revenue Funds account for the proceeds of specific revenue sources (other than for major capital projects) that are legally restricted to expenditure for specified purposes. The nature of the revenue source, together with the nature of the restricted spending of the revenue source, determines whether a unique special revenue fund should be established.
T Tax Increment Financing: Financing of capital improvements to a designated redevelopment area or district, achieved by “capturing” incremental increases in taxable values (and accordingly, tax revenues). The captured taxes must be dedicated towards ‘pay-as-you-go’ capital improvements and/or towards debt service on capital improvements debt obligations of the tax increment financing district. Normally, a specific term (number of years) is specified upon establishment of a tax increment financing district. Tool & Dies Renaissance (Recovery) Zone: Program initially established by Michigan Public Act 376 of 1996, and amended by MI P. A. 276 of 2005 and MI P.A. 93 of 2006. A local unit of government may designate specific property parcels as recovery zones, thereby entitling a tool & die manufacturer (which has entered into a 'collaborative agreement' with other tool & die manufacturers) to exemption from property taxes for a specified period of years. Transfers In / Out: A legally authorized conveyance of money between funds, in which the donor fund provides either a subsidy or other form of donation to the recipient fund. Stipulations and conditions are frequently attached regarding applied use of the transferred money by the recipient fund.
-432-

GLOSSARY OF FINANCIAL TERMS
U
Undesignated Unreserved Fund Balance: Available expendable financial resources in a governmental fund that are not the object of tentative management plans.
W Working Capital: The excess of current assets over current liabilities. As a general rule, the working capital of any individual fund should never be negative (negative = deficiency of current assets to current liabilities).
Acronyms CAFR – Comprehensive Annual Financial Report CATV – Cable Access Television CCF – Cubic Foot CDBG – Community Development Block Grant DDA – Downtown Development Authority EBT – Electronic Benefit Transfer FEMA – Federal Emergency Management Agency FTE – Full Time Equivalent FY – Fiscal Year (July 1 – June 30) GO – General Obligation HBPW – Holland Board of Public Works HRC – Human Relations Commission IRC – International Relations Commission KWH – Kilowatt Hour LTGO – Long Term General Obligation MAX – Macatawa Area Express MERS – Municipal Employees Retirement System MDOT – Michigan Department of Transportation MG – Million Gallons MML – Michigan Municipal League MSHDA – Michigan State Housing Development Authority MVH – Motor Vehicle Highway MWH – Megawatt Hour PRE – Principal Residence Exemption PSD – Principal Shopping District SEV – State Equalized Value TPA – Third Party Administrator WEMET – West Michigan Enforcement Team WMAA – West Michigan Airport Authority
-433-