FISCAL YEAR JULY 1, 2018-JUNE 30, 2019 - Lehi City
213
LEHI CITY CORPORATION, STATE OF UTAH FISCAL YEAR JULY 1, 2018-JUNE 30, 2019
-
Upload
khangminh22 -
Category
Documents
-
view
1 -
download
0
Transcript of FISCAL YEAR JULY 1, 2018-JUNE 30, 2019 - Lehi City

LEHI CITY CORPORATION, STATE OF UTAH
FISCAL YEAR JULY 1, 2018-JUNE 30, 2019

Cover Photo By: Marie Maddalone
LEHI CITYSTATE OF UTAH
Approved Annual BudgetFiscal Year 2018 - 2019
Jason Walker, City AdministratorCameron Boyle, Assistant City Administrator
Dean Lundell , Finance DirectorAlyson Alger, Treasurer
Karma Bentson, Assistant Finance DirectorBeau Thomas, Assistant to the City Administrator
Shaye Simkins, Management AnalystPublic Relations and Special Projects Division
Prepared by:

The Government Finance Officers Association of the United States and Canada (GFOA) presented a Distinguished Budget Presentation Award to Lehi City Corporation, Utah for its annual budget for the fiscal year beginning July 1, 2017. In order to receive this award, a governmental unit must publish a budget document that meets program criteria as a policy document, as an operations guide, as a financial plan, and as a communications device.
The award is valid for a period of one year only. We believe our current budget continues to conform to program requirements, and we are submitting to GFOA to determine its eligibility for another award.
Min
utem
anDr
400 S
2300
W 700 S
Pony
Expr
ess
Rd
Suncre st Dr
1700
W
Hig
hlan
d
Blvd
300
W
1200
E
Sunc
rest
Dr
850E
900
EW
est Frontage Rd
300 N
Club House Dr
600
E
Airport
DrTraverse
MountainBlvd
200 S
1200
E900 N
East Frontage Rd
1500 N
900 N
1100
W
Trinnaman Ln
3600
W
1900 S
300 N
600 N
500
E
500 N
Main St
600
E1500 N
Cent
erSt
DryCr
eek
Way
300
E
3200 N12
00W
2600 N
3200 N
Ash
tonBlvd
State St
State St
SR 73
Red
woo
d R
d
500
W
Timpanogos Hwy
Thanksgiving Way
600
W
300
W
Main St
2100 N
2300
W
Pioneer Crossing
Sara
toga
Rd
1100
W
500
W
1700
W
Cen
terS
t
300
E40
0E
100
E
Cabela's Blvd
Digital Dr
East Fron t age Rd
Tr iu
mph
Blv
d
2600 N
3600
W
Morning
V ista Rd
500
W
1500 N
Utah Lake
Jordan River
Jordan River
Jordan River
Jord
an R
iver
UnincorporatedUtah County
Lehi
Draper
SaratogaSprings
AmericanFork
Highland
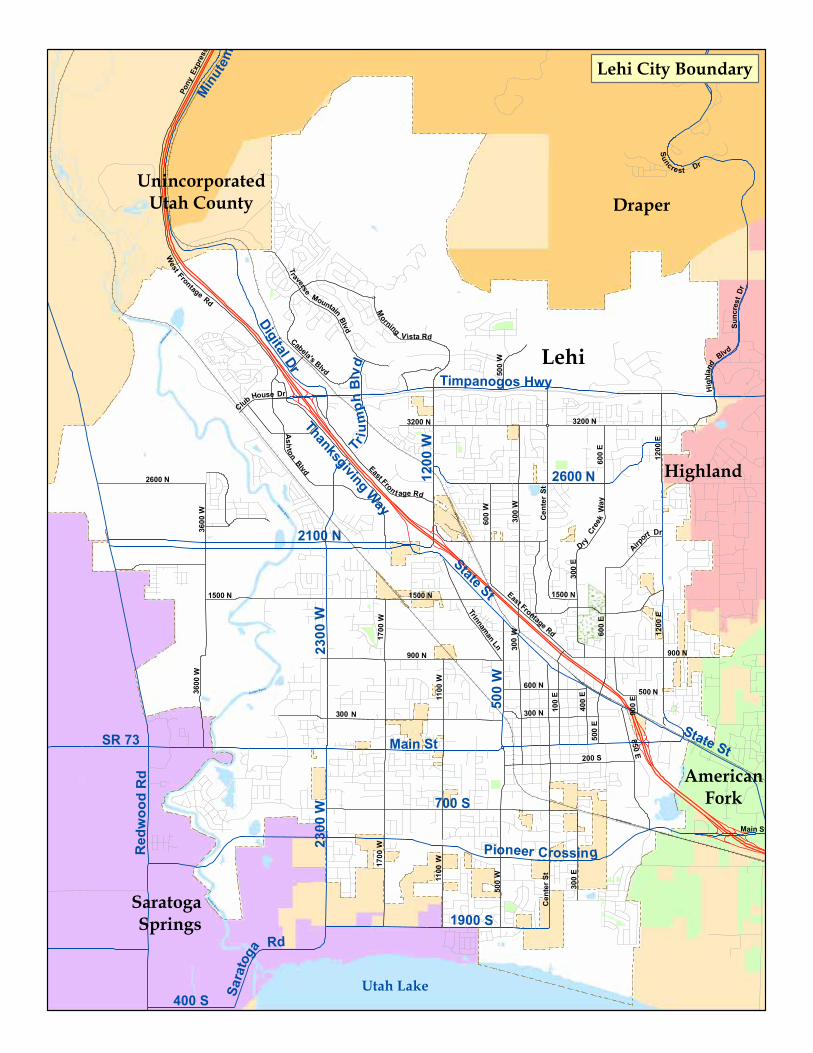
Lehi City Boundary

FY2019 ANNUAL BUDGET - 6
MayorMark Johnson
CouncilpersonPaige Albrecht
CouncilpersonChris Condie
CouncilpersonPaul Hancock
CouncilpersonJohnny Revill
CouncilpersonMike Southwick
APPOINTED OFFICIALSCity Administrator........................................................................................................................................................Jason WalkerCity Treasurer..................................................................................................................................................................Alyson AlgerCity Recorder............................................................................................................................................................Marilyn Banasky
DEPARTMENT DIRECTORSDevelopment Services..................................Kim Struthers Economic Development...............................Marlin EldredEngineering.........................................................Lorin PowellFinance................................................................Dean LundellFire..............................................................Chief Jeremy CraftJustice Court.........................................Morgan Cummings
Legal Services.......................................................Ryan WoodLeisure Services........................................... Cameron BoylePolice...........................................................Chief Darren PaulPower............................................................................Joel EvesPublic Works.....................................................Todd MungerWater...................................................................Dave Norman
ELECTED OFFICIALS & CITY STAFF

FY2019 ANNUAL BUDGET - 7
CITY
AD
MIN
ISTR
ATO
R
Jaso
n W
alke
r
MAY
OR
Mar
k Jo
hnso
n
CITY
CO
UN
CIL
LEH
I RES
IDEN
TS
Paig
e A
lbre
cht
Chri
s Co
ndie
Paul
Han
cock
John
ny R
evill
Mik
e So
uthw
ick
OFF
ICE
OF
THE
CITY
A
DM
INIS
TRA
TOR
Exec
utiv
e A
ssis
tant
Hum
an R
esou
rces
Risk
Man
agem
ent
Info
rmat
ion
Tech
nolo
gy
LEG
AL
SERV
ICES
Ryan
Woo
d
FIN
AN
CE
Dea
n Lu
ndel
l
POW
ER
Joel
Eve
s
ASS
ISTA
NT
CITY
A
DM
INIS
TRA
TOR
Cam
eron
Boy
le
FIRE
Chie
f Jer
emy
Craf
t
ASS
ISTA
NT
TO T
HE
CITY
A
DM
INIS
TRA
TOR
Beau
Tho
mas
POLI
CE
Chie
f Dar
ren
Paul
PUBL
IC
WO
RKS
Todd
Mun
ger
ECO
NO
MIC
D
EVEL
OPM
ENT
Mar
lin E
ldre
d
ENG
INEE
RIN
G
Lore
n Po
wel
l
ART
S &
CU
LTU
RE
LIA
ISO
N
SPEC
IAL
PRO
JECT
S
JUST
ICE
COU
RT
Mor
gan
Cum
min
gs
LEIS
URE
SERV
ICES
COM
MU
NIT
YD
EVEL
OPM
ENT
Kim
Str
uthe
rs
WAT
ER
Dav
e N
orm
an
PR &
SPE
CIA
LEV
ENTS

FY2019 ANNUAL BUDGET - 8
TABLE OF CONTENTS
INTRODUCTIONTitle Page .................................................................................................................................................................................................................. 3GFOA Award ............................................................................................................................................................................................................ 4Elected Officials and City Staff .......................................................................................................................................................................... 6Citywide Organization Chart............................................................................................................................................................................. 7
BUDGET SUMMARYExecutive Summary ............................................................................................................................................................................................11Combined Fund Summary ...............................................................................................................................................................................14General Fund Summary ....................................................................................................................................................................................17
BUDGET OVERVIEWCommunity Profile ..............................................................................................................................................................................................22Citywide Goals & Objectives ...........................................................................................................................................................................25Budget Process .....................................................................................................................................................................................................29Guiding Financial Principles ............................................................................................................................................................................30Financial Structure ..............................................................................................................................................................................................31Fund Balance & Reserves ..................................................................................................................................................................................35Basis of Budgeting ..............................................................................................................................................................................................36Revenue & Taxation ............................................................................................................................................................................................37Debt..........................................................................................................................................................................................................................40Long-Term Financial Outlook ..........................................................................................................................................................................43
CAPITAL EXPENDITURESCapital Policies .....................................................................................................................................................................................................46Capital Planning Process...................................................................................................................................................................................46Non-Routine Capital Budget Summary.......................................................................................................................................................50Impact on the Operating Budget ..................................................................................................................................................................55
GENERAL FUND (DEPARTMENT DETAIL)Mayor & City Council ..........................................................................................................................................................................................57Office of the City Administrator .....................................................................................................................................................................59Community Development ...............................................................................................................................................................................65Economic Development ...................................................................................................................................................................................74Engineering ...........................................................................................................................................................................................................76Finance ....................................................................................................................................................................................................................79Fire ............................................................................................................................................................................................................................84Justice Court..........................................................................................................................................................................................................92Legal Services .......................................................................................................................................................................................................95Leisure Services ....................................................................................................................................................................................................99Police ..................................................................................................................................................................................................................... 108Public Works ....................................................................................................................................................................................................... 114Non-Departmental .......................................................................................................................................................................................... 126Class C Roads Fund .......................................................................................................................................................................................... 127Liquor Allotment Fund ................................................................................................................................................................................... 128Community Development Block Grant (CDBG) Fund ......................................................................................................................... 129

FY2019 ANNUAL BUDGET - 9
GOVERNMENTAL CAPITAL PROJECTS & IMPACT FEE FUNDSGovernmental Capital Projects Fund ........................................................................................................................................................ 131Fire Impact Fee Fund ....................................................................................................................................................................................... 133Parks Impact Fee Fund ................................................................................................................................................................................... 134Police Impact Fee Fund .................................................................................................................................................................................. 135Road Impact Fee Fund .................................................................................................................................................................................... 136Culinary Impact Fee Fund ............................................................................................................................................................................. 137Waste Water Impact Fee Fund ..................................................................................................................................................................... 138Power Impact Fee Fund ................................................................................................................................................................................. 139Pressurized Irrigation Impact Fee Fund .................................................................................................................................................... 140Storm Drain Impact Fee Fund ...................................................................................................................................................................... 141
SPECIAL REVENUE FUNDSRecreation Division - Legacy Center & Outdoor Pool .......................................................................................................................... 143
ENTERPRISE FUNDSWater Division.................................................................................................................................................................................................... 157
Storm Drain .................................................................................................................................................................................................. 159 Culinary Water ............................................................................................................................................................................................. 162Pressurized Irrigation ................................................................................................................................................................................ 165Waste Water .................................................................................................................................................................................................. 168
Power Department .......................................................................................................................................................................................... 171Waste Collection ............................................................................................................................................................................................... 179
INTERNAL SERVICE FUNDSInformation Technology ................................................................................................................................................................................ 182Fleet ...................................................................................................................................................................................................................... 183Risk Management ............................................................................................................................................................................................ 184Buildings & Grounds ........................................................................................................................................................................................ 185
REDEVELOPMENT AGENCY FUNDSMillpond Area RDA .......................................................................................................................................................................................... 187Xactware .............................................................................................................................................................................................................. 187IM Flash Area RDA ............................................................................................................................................................................................ 188Thanksgiving Park EDA .................................................................................................................................................................................. 188Adobe EDA .......................................................................................................................................................................................................... 189Outlets at Traverse Mountain CDA ............................................................................................................................................................. 189
APPENDIXAppendix A: Comprehensive Staffing Document ................................................................................................................................ 191Appendix B: Glossary of Terms..................................................................................................................................................................... 202

BUDGET SUMMARY

BU
DG
ET
SU
MM
AR
Y
FY2019 ANNUAL BUDGET - 11
During the budget retreat in February, the City Council identified their one, long-term goal as creating a family-centric community. In turn, each department created a singular goal that supports this vision. As we have prepared the FY 2019 budget, we have made special effort to fund projects and requests that will help us become an innovative and forward-thinking city while creating a family-centric community. That effort has resulted in utilizing our conservative revenue growth to maintain core services, continue to develop infrastructure for our rapidly growing community, assess fair and reasonable fees, and encourage a motivated workforce. This year’s proposal represents a 3.0% decrease from FY 2018. This budget represents $192,224,894 in overall spending down from FY 2018’s $198,137,459.
Some highlights of the budget are as follows:
CONSERVATIVE REVENUE ESTIMATESWe estimate neither a major increase nor decrease in General Fund revenues for FY 2019. As a community, we are experiencing stable building permit fees, court fines and forfeitures, and franchise fees. Though most of our revenue streams appear to be trending upward, we would rather err on the side of caution in our forecasts, thus protecting the City should there be any changes in the economic climate. See the graph below for revenue trends.
EXECUTIVE SUMMARY
0
$5 Million
$10 Million
$15 Million
$20 Million
$25 Million
$30 Million
$35 Million
$40 Million
FY 2012
FY 2013
FY2014
FY2015
FY 2016
FY 2017
FY2018
FY2019
$36,
737,
357
$34,
348,
717
$30,
787,
901
$36,
678,
228
FOCUS ON PUBLIC SAFETYOne of the core functions of the City is to provide both fire and police services to our residents. Lehi’s population has increased over 23% since 2010. As Lehi continues to grow, it has become necessary to start looking at developing a new Police Station. Public Safety expenditures include $1,080,710 for the design of the new Police Station. This money will be reimbursed to the General Fund through the issuance of bonds in the 2020 fiscal year. This new space will help the Police Department better serve the residents of Lehi. the new police station will break ground in FY 2020.

BU
DG
ET
SU
MM
AR
Y
FY2019 ANNUAL BUDGET - 12
PARK DEVELOPMENTWhile parks development continues to be a priority for the City, the Parks Impact Fee Fund must be replenished before we are able to take on new major projects. Park impact fees are collected on new development to account for the demand on services from that particular development. We forecast approximately $2 million a year in park impact fees. During FY 2019 we are funding these two new parks: Shadow Ridge Park and Monument Park. With the exception of some trail development and improvements funded partially by grants, any additional projects will be on hold until impact fee funds are available. Included in the trail development is a mountain bike trail.
CAPITAL PROJECTS In addition to the Police Station and parks development, several other capital projects are included in thisbudget. We are funding a substation upgrade, four water storage or delivery support facilities, and four transportation improvement projects (not including the I-15 Technology Corridor). This includes beginning Dry Creek Reservoir which will become a fishing and family facility. Our capital projects are focused on infrastructure, and most of these projects are in response to growth.
The Lehi Power building was completed in FY 2018. Additional generators may be purchased in future years.
STAFFING LEVELSThe FY 2019 budget includes an overall increase of 4 full-time employees. The majority of the increase is to provide additional employees for Inspections. Lehi’s growth rate over the last few years has caused dramatic changes in the infrastructure and utilities provided to our residents. These positions are required to meet the demands created from the growth. Additional part-time employees will be added as well.
The new positions include one (1) recreation employee, two (2) building employees, and one (1) water employee. A complete staffing document is available in Appendix A in this document. These positions are important for the residents for multiple reasons. The recreation program coordinator and building inspectors are needed as a result of growth, and the storm water employee is needed for storm water pollution prevention.
TAX AND RATE INCREASESThis budget proposes no increase in property tax rates or utility fees. However, we are currently examining culinary water and pressurized irrigation rates to determine their adequacy in meeting the current demands of capital projects.

BU
DG
ET
SU
MM
AR
Y
FY2019 ANNUAL BUDGET - 13
PROPOSED REVENUE BONDSWhile we have been able to maintain our current infrastructure in the face of our rapid growth, the City is faced with mounting infrastructure needs for both culinary water and pressurized irrigation. We are proposing revenue bonds to help pay for the construction and development of these necessary projects. We will not need to increase fees to service the debt associated with this bond.
CONCLUSIONIt is a wonderful time to live in Lehi and to be at the forefront of the growth along the Wasatch Front. With all of our success comes the pains associated with growth. However, we believe this budget will address our most pressing needs without overburdening the citizens and businesses in Lehi.
Respectfully,
Mayor Mark Johnson

BU
DG
ET
SU
MM
AR
Y
FY2019 ANNUAL BUDGET - 14
COMBINED FUND REVENUES
FUND ACTUALFY 2016
ACTUALFY 2017
ESTIMATEDFY2018
APPROVEDFY2019
PERCENT CHANGE
General $ 30,787,901 $ 33,789,008 $ 36,737,358 $ 36,678,228 -0.16%Capital Projects 4,249,414 6,610,007 3,464,015 1,165,962 -66%Class C Roads 1,790,053 2,169,616 1,952,500 2,150,000 10%Liquor 46,924 51,674 60,000 60,000 0%CDBG 670,257 102,942 225,000 160,000 -29%Payment In-Lieu 361,341 294,543 450,000 450,000 0%Buildings & Grounds 455,440 1,143,957 719,020 1,540,622 114%IT 697,309 956,553 1,078,461 1,068,442 -1%Fleet 2,153,735 2,633,561 2,224,747 1,919,518 -14%Risk Management 619,479 1,452,362 1,031,403 1,037,654 1%Legacy Center 5,292,499 4,084,977 5,246,675 5,759,297 10%Outdoor Pool 401,464 531,397 339,780 324,980 -4%Culinary Water 5,693,116 9,139,915 6,365,000 5,165,000 -19%Sewer 10,828,119 12,760,970 7,825,000 8,025,000 3%Electric 33,299,411 37,040,506 35,650,000 36,199,846 2%Garbage 2,208,785 2,312,697 2,418,000 2,418,000 0%Pressurized Irrigation 5,706,380 8,415,568 6,364,751 2,876,374 -55%Drainage 3,290,355 6,318,791 1,762,899 1,692,211 -4%Fire Impact Fees 546,961 256,886 5,401,000 401,000 -93%Parks Impact Fees 3,153,116 5,253,169 2,101,850 2,596,700 24%Police Impact Fees 200,487 752,624 300,000 1,380,710 360%Road Impact Fees 2,045,264 2,283,624 23,015,000 25,445,000 11%Culinary Water Impact Fees 762,256 1,135,867 4,025,000 7,125,000 77%Sewer Impact Fees 343,934 419,623 620,000 620,000 0%Electric Impact Fees 2,979,837 2,468,216 21,035,000 6,870,000 -67%Pressurized Irrigation Impact Fees 687,129 975,958 3,325,000 15,125,000 355%Drainage Impact Fees 347,597 354,763 955,000 1,085,000 14%Millpond RDA 438,649 349,061 950,000 342,500 -64%IM Flash RDA 9,161,503 10,879,090 20,000,000 20,000,000 0%Thanksgiving Park EDA 172,703 273,508 300,000 300,000 0%Adobe EDA 651,679 653,773 675,000 675,000 0%Outlets at Traverse CDA 959,469 603,965 1,195,000 1,195,000 0%Xactware 168,764 305,692 325,000 325,000 0%TOTAL REVENUES $ 131,171,321 $ 156,774,863 $ 198,137,459 $ 192,177,044 -3%
Description of Major Changes: • Buildings & Grounds: The increase in this fund resulted from the General Government Buildings Fund being
rolled into the Buildings & Grounds Fund.• Police Impact Fees: The increase in this fund is due to the design of a new Public Safety building.• Pressurized Irrigation Impact Fees: The increase in this fund represents estimated bond proceeds for a
proposed revenue bond. This bond will complete major infrastructure that is needed because of the City’srapid growth.

BU
DG
ET
SU
MM
AR
Y
FY2019 ANNUAL BUDGET - 15
COMBINED FUND EXPENDITURES
FUND ACTUALFY 2016
ACTUALFY 2017
ESTIMATEDFY 2018
APPROVEDFY 2019
PERCENT CHANGE
General $ 31,160,013 $ 34,656,745 $ 36,737,358 $ 36,678,228 -0.16%Capital Projects 2,203,528 3,661,019 3,585,538 1,165,962 -67%Class C Roads 1,933,812 2,804,048 1,952,500 2,150,000 10%Liquor 46,924 51,674 60,000 60,000 0%CDBG - 102,942 225,000 160,000 -29%Payment In-Lieu - - 450,000 450,000 0%Buildings & Grounds 610,515 762,993 719,020 1,540,622 114%
IT 727,696 731,257 1,078,461 1,068,442 -1%Fleet 1,802,206 1,998,480 2,224,747 1,919,518 -14%Risk Management 777,873 902,127 1,031,403 1,037,654 1%Legacy Center 4,760,239 4,820,530 5,246,675 5,759,297 10%Outdoor Pool 275,548 415,751 339,780 324,980 -4%Culinary Water 4,267,297 6,150,574 6,365,000 5,165,000 -19%Sewer 8,325,768 9,473,700 7,825,000 8,025,000 3%Electric 27,012,499 28,409,168 35,650,000 36,199,846 2%Garbage 2,133,488 2,310,261 2,418,000 2,418,000 0%Pressurized Irrigation 2,985,979 3,347,561 6,439,751 2,876,374 -55%Drainage 1,671,113 1,965,193 1,762,899 1,692,211 -4%Fire Impact Fees 132,450 5,426,608 5,401,000 401,000 -93%Parks Impact Fees 5,355,095 8,708,841 2,101,850 2,596,700 24%Police Impact Fees 70,510 1,429,510 300,000 1,380,710 360%Road Impact Fees 1,902,352 3,123,889 23,015,000 25,445,000 11%Culinary Water Impact Fees 17,477 82,716 4,025,000 7,125,000 77%Sewer Impact Fees 12,413 58,732 620,000 620,000 0%Electric Impact Fees 18,855 4,193 21,035,000 6,870,000 -67%Pressurized Irrigation Impact Fees 11,977 64,877 3,325,000 15,125,000 355%Drainage Impact Fees 5,141 3,653 955,000 1,085,000 14%Millpond RDA 70,000 822,786 950,000 342,500 -64%IM Flash RDA 9,186,379 10,879,090 20,000,000 20,000,000 0%Thanksgiving Park EDA 172,703 273,508 300,000 300,000 0%Adobe EDA 651,679 653,773 675,000 675,000 0%Outlets at Traverse CDA 959,469 603,965 1,195,000 1,195,000 0%Xactware 168,764 305,692 325,000 325,000 0%TOTAL EXPENDITURES $ 109,429,762 $ 135,005,856 $ 198,333,982 $ 192,177,044 -3%
TOTAL SURPLUS (DEFICIT) $ 21,741,559 $ 21,769,007 $ (196,523) - -

BU
DG
ET
SU
MM
AR
Y
FY2019 ANNUAL BUDGET - 16
Photo Credit: Julie Loveridge
Impact Fees - 31.6%
General Fund - 19.1%
Electric - 18.8%
Redevelopment Agency - 11.9%
Water Services - 9.2%
Legacy Center/ Outdoor Pool - 3.2%
Internal Services - 2.9%
Capital Projects - 0.6% Garbage - 1.3%
Grants and Other Funds - 1.5%
COMBINED FUND SUMMARY

BU
DG
ET
SU
MM
AR
Y
FY2019 ANNUAL BUDGET - 17
GENERAL FUND SUMMARYACTUALFY 2016
ACTUALFY 2017
ESTIMATEDFY 2018
APPROVEDFY 2019
PERCENT CHANGE
Revenues: Taxes $ 21,936,402 $ 23,851,693 $ 24,505,000 $ 25,175,000 3%License & Permits 4,196,642 4,539,888 4,910,000 4,910,000 0%Intergovernmental 132,548 183,044 557,546 393,000 -30%Charges for Service 1,105,505 1,813,100 1,526,500 1,737,100 14%Fines & Forfeitures 668,151 629,104 657,500 655,000 -0.4%Miscellaneous 720,877 556,664 566,083 493,000 -13%
Contributions & Transfers 2,027,776 2,215,515 4,014,729 3,315,128 -17%TOTAL REVENUES $ 30,787,901 $33,789,008 $ 36,737,358 $ 36,678,228 -0.16%Expenditures:
Justice Court $ 682,495 $ 699,828 $ 661,000 579,702 -12%City Recorder 228,282 155,529 261,905 177,263 -32%Administration 712,105 855,413 1,064,060 1,072,862 1%Human Resources 235,208 214,625 273,698 279,686 2%Treasury 441,396 405,173 493,844 510,441 3%Finance 483,744 513,186 557,658 570,326 2%Mayor & City Council 273,301 291,525 302,382 349,541 16%Legal Services 500,680 492,525 582,477 602,250 3%Emergency Management 11,805 38,131 66,250 66,250 0%General Government Buildings 507,028 638,237 752,363 - -100%Code Enforcement 120,244 105,959 125,758 136,308 8%Police 5,993,433 6,655,365 7,387,454 7,647,368 4%Fire 4,286,101 4,954,510 6,058,090 7,037,977 16%Planning & Zoning 705,864 639,187 776,579 810,788 4%Animal Control 155,431 167,471 169,245 186,997 10%Development Services 669,603 760,534 916,682 1,064,841 16%Economic Development 169,691 178,091 177,952 190,950 7%Streets & Public Improvements 1,181,072 1,292,859 1,479,430 1,568,313 6%Public Works Administration 169,267 238,281 248,772 259,446 4%Engineering 572,099 695,822 700,066 747,547 7%Parks 2,015,136 1,951,101 2,266,149 2,346,471 4%Community Events 325,376 361,226 482,700 474,700 -1%Senior Services 135,676 176,170 238,513 310,922 30%Library 1,149,020 1,245,178 1,271,961 1,336,277 5%Literacy Center 261,601 256,913 317,236 339,222 7%Cemetery 415,614 385,537 463,589 459,637 -1%Museum 270,580 312,110 320,431 299,750 -6%Non-Departmental 8,488,161 9,976,259 8,321,114 7,252,394 -13%
TOTAL EXPENDITURES $ 31,160,013 $ 34,656,745 $ 36,737,358 $ 36,678,228 -0.16%
TOTAL SURPLUS (DEFICIT) $ (791,687) $ (867,737) $ - $ - -

BU
DG
ET
SU
MM
AR
Y
FY2019 ANNUAL BUDGET - 18
GENERAL FUND REVENUE DETAIL
GENERAL FUND REVENUE DETAILACTUALFY 2016
ACTUALFY 2017
ESTIMATEDFY 2018
APPROVEDFY 2019
Taxes:Current Property Taxes $ 8,007,053 $ 8,850,629 $ 8,600,000 $ 9,000,000911 Tax (pass through) 334,967 335,808 325,000 325,000General Sales Tax 8,707,741 10,114,232 10,900,000 11,120,000Franchise Taxes 4,131,334 3,781,066 4,000,000 4,000,000Cell Phone Taxes 600,761 581,831 500,000 550,000Innkeeper Taxes 154,546 188,127 180,000 180,000
TOTAL TAXES $ 21,963,402 $ 23,851,693 $ 24,505,000 $ 25,175,000
License & Permits:Business Licenses $ 109,007 $ 112,871 $ 115,000 $ 115,000Building Permits 2,137,871 2,225,329 2,500,000 2,500,000Plan Review 1,368,827 1,449,598 1,500,000 1,500,000Micron Plan Review & Inspection - 75,000 75,000 75,000Inspection Fees 576,273 672,894 700,000 700,000State 1% Building Permit Fees 4,664 4,196 20,000 20,000
TOTAL LICENSE & PERMITS $ ,196,642 $ 4,539,888 $ 4,910,000 $ 4,910,000 Intergovernmental Revenues:
Grants $ 12,400 12,900 $ 70,000 $ 70,000 Fire Department Grant 3,200 9,723 254,546 80,000County Recreation Grant 9,600 - 30,000 30,000State Grant 22,113 46,678 75,000 75,000Senior Citizen Building Rental Income 4,307 2,775 5,000 5,000Senior Citizen Income 29,992 27,786 40,000 50,000Alpine District/Police Reimbursement 34,000 68,000 68,000 68,000County Fire Allocation 16,936 15,182 15,000 15,000
TOTAL INTERGOVERNMENTAL REVENUES $ 132,548 $ 183,044 $ 557,546 $ 393,000Charges For Services:
Library Receipts $ 68,108 $ 57,035 $ 70,000 $ 70,000Library Video Rental Fees 24,186 21,176 25,000 25,000Special Police Revenue 46,279 75,289 50,000 50,000Sale of Cemetery Lots 180,205 151,550 130,000 130,000Headstone Setting Fee 4,305 4,515 4,500 4,500Cemetery Burial Fees 55,775 63,000 52,000 52,000Fire Fees 74,736 134,738 185,000 195,600Passport - - 10,000 10,000Ambulance Fees 651,911 1,305,797 1,000,000 1,200,000
TOTAL CHARGES FOR SERVICES $ ,105,505 $ 1,813,100 $ 1,526,500 $ 1,737,100

BU
DG
ET
SU
MM
AR
Y
FY2019 ANNUAL BUDGET - 19
GENERAL FUND REVENUE DETAIL (CONTINUED)
GENERAL FUND REVENUE DETAIL ACTUALFY 2016
ACTUALFY 2017
ESTIMATEDFY 2018
APPROVEDFY2019
Fines & Forfeitures:Court Fines & Forfeitures $ 664,311 $ 628,434 $ 650,000 $ 650,000 Enforcement Fees 3,840 670 7,500 5,000
TOTAL FINES & FORFEITURES $ 668,151 $ 629,104 $ 657,500 $ 655,000 Miscellaneous Revenues:
Interest Earnings $ 70,272 $ 96,891 $ 60,000 $ 60,000 Traffic School 32,435 23,550 33,000 33,000Park Rental 30,450 23,290 42,000 42,000Portable Stage Rental - 2,690 5,500 5,500Cellular One Tower/Park Fee 79,668 66,916 65,000 65,000Sale of Fixed Assets 47,450 13,577 28,024 10,000Sale of Materials 148 128 500 500Sale of History Books 107 89 500 500Frances Comer Trust Donations 245 - 2,750 2,750Literacy Center Revenue 7,000 537 3,250 3,250Miss Lehi Revenue 8,898 11,505 21,000 21,000Lehi Roundup Revenue 43,129 29,677 64,500 64,500Miscellaneous Revenue Contractors 61,938 94,292 50,000 50,000Museum Receipts 33,008 39,916 1,884 -Alpine School District Rec Fee 13,174 - 31,677 15,000Office Building Rental Fee 28,539 56,486 40,000 40,000Miscellaneous Revenue 264,416 97,120 116,498 80,000
TOTAL MISCELLANEOUS REVENUES $ 720,877 $ 556,664 $ 566,083 $ 493,000 Contributions & Transfers:
Allocation from Water & Sewer $ 465,000 $ 465,000 $ 465,000 $ 465,000Allocation from Electric 265,920 265,920 266,000 266,000Transfer from RDAs 1,296,856 1,484,595 1,500,000 1,500,000Fund Balance Re-appropriation - - 1,783,729 1,084,128
TOTAL CONTRIBUTIONS & TRANSFERS $ 2,027,776 $ 2,215,515 $ 4,014,729 $ 3,315,128
TOTAL GENERAL FUND REVENUES $ 30,787,901 $ 33,789,008 $ 36,737,358 $ 36,678,228
BU
DG
ET
SU
MM
AR
Y
FY2019 ANNUAL BUDGET - 20
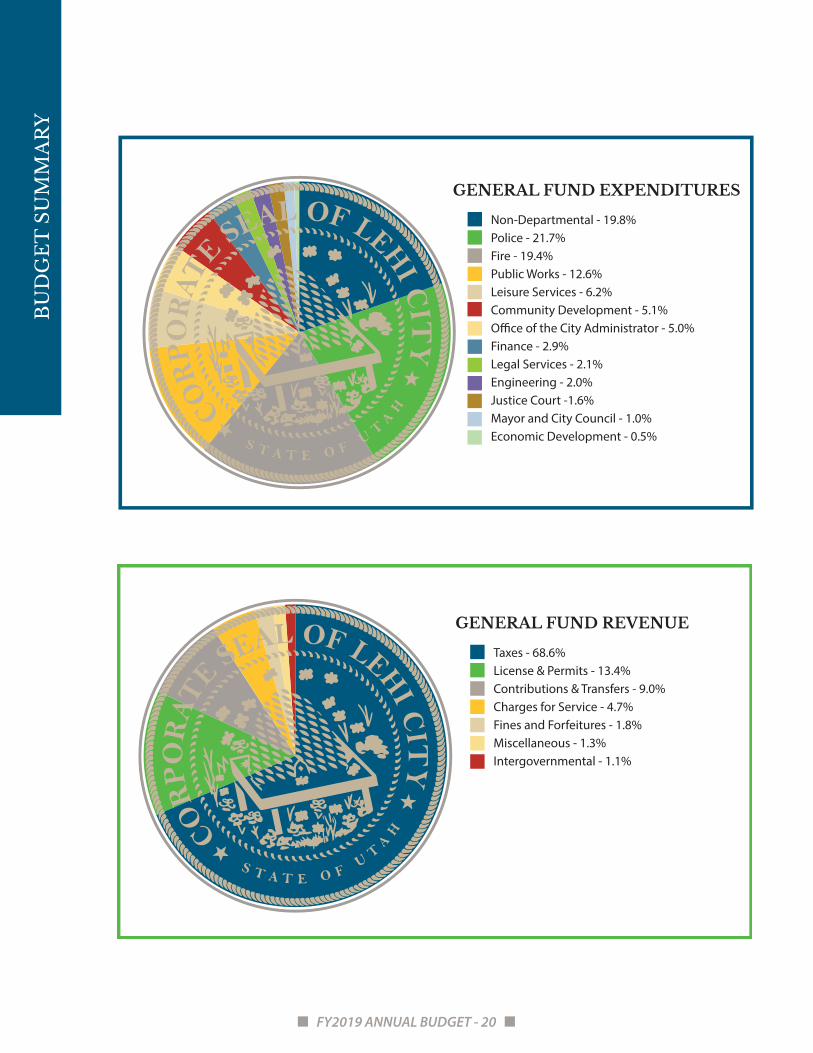
Non-Departmental - 19.8%Police - 21.7%Fire - 19.4%Public Works - 12.6%Leisure Services - 6.2%Community Development - 5.1%O�ce of the City Administrator - 5.0%Finance - 2.9%Legal Services - 2.1%Engineering - 2.0%Justice Court -1.6%Mayor and City Council - 1.0%Economic Development - 0.5%
GENERAL FUND EXPENDITURES
Taxes - 68.6%License & Permits - 13.4%Contributions & Transfers - 9.0%Charges for Service - 4.7%Fines and Forfeitures - 1.8%Miscellaneous - 1.3%Intergovernmental - 1.1%
GENERAL FUND REVENUE

BUDGET OVERVIEW

BU
DG
ET
OV
ER
VIE
W
FY2019 ANNUAL BUDGET - 22
AS UTAH’S SIXTH OLDEST CITY, LEHI IS RICH IN PIONEER AND OLD WEST HISTORY.
Originally settled by Mormon pioneers, Lehi has been known as Sulphur Springs, Snow’s Springs, Dry Creek, and Evansville. It was incorporated as Lehi City in 1852. The Overland Stagecoach Route, the Pony Express Trail, and the Transcontinental Telegraph all passed through or near Lehi during the peak of their use.
According to the U.S. Census Bureau, Lehi is the 5th fastest growing city in Utah County since the 2010 census. Lehi has more than doubled in size since 2000, with population estimates approaching 63,000 residents. Lehi is quickly becoming a premier technology and commercial center along the Wasatch Front. Several landmark companies call Lehi home, including Adobe, I.M. Flash, Xactware, Microsoft, Vivint, and Xango. Lehi is also home to a wide variety of retail stores and restaurants. Thanksgiving Point, a unique destination offering museums, botanical gardens, shopping, restaurants, and other entertainment options highlights all that Lehi has to offer.
Lehi is a beautiful place to live and work. Utah Lake is located just to the south, with the picturesque Jordan River running through the City. Lehi is surrounded by the Wasatch Mountains on the East and the White Mountains and Oquirrh Mountains on the West. Lehi’s beautiful natural surroundings provide easy access to hiking, mountain biking, fishing, camping, skiing, hunting, and many other outdoor activities.
Lehi operates under a six-member council form of government. Policy making and legislative authority are vested in a governing council consisting of the mayor and five city council members, each elected at large to serve four-year, staggered terms. The governing council is responsible, among other things, for passing ordinances and resolutions, adopting the budget, appointing committees, and hiring the City’s administrator, recorder, and treasurer. The City’s administrator is responsible for working with the mayor to carry out the policies and ordinances of the governing council, overseeing the day-to-day operations of the government, and appointing heads of the City’s operational departments.
The City provides a full range of services, including police and fire protection, construction and maintenance of roads, parks, commercial and residential building inspection, recreational opportunities (including a recreation center, indoor pool, and outdoor pool), and many cultural events. The City also owns and operates a culinary water system, a secondary water system, a wastewater system, a storm water system, an electrical distribution system, solid waste collection, and an emergency medical service.
Indeed, Lehi City is pioneering Utah’s future!
BU
DG
ET
OV
ER
VIE
W
FY2019 ANNUAL BUDGET - 23
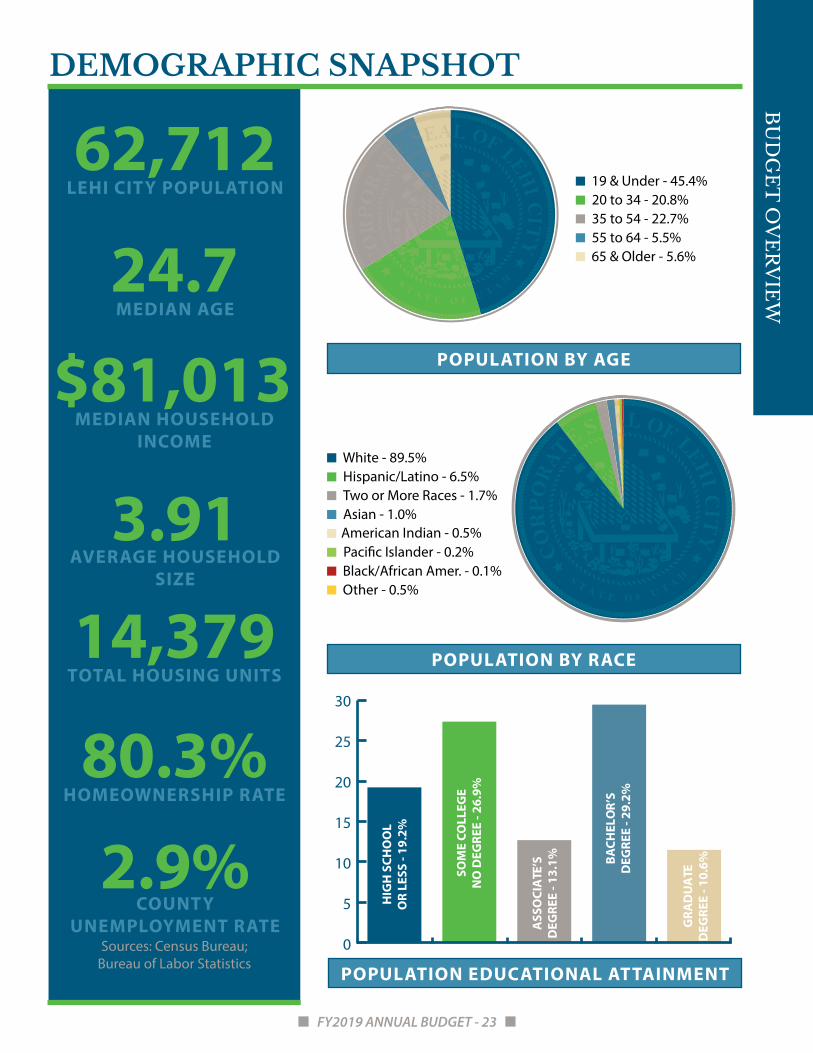
62,712LEHI CITY POPULATION
24.7MEDIAN AGE
$81,013MEDIAN HOUSEHOLD
INCOME
3.91AVERAGE HOUSEHOLD
SIZE
14,379TOTAL HOUSING UNITS
80.3%HOMEOWNERSHIP RATE
2.9%COUNTY
UNEMPLOYMENT RATESources: Census Bureau;
Bureau of Labor Statistics
White - 89.5%Hispanic/Latino - 6.5%
Asian - 1.0%Two or More Races - 1.7%
Pacific Islander - 0.2%Black/African Amer. - 0.1%
American Indian - 0.5%
Other - 0.5%
19 & Under - 45.4%20 to 34 - 20.8%
55 to 64 - 5.5%35 to 54 - 22.7%
65 & Older - 5.6%
DEMOGRAPHIC SNAPSHOT
POPULATION BY RACE
POPULATION BY AGE
POPULATION EDUCATIONAL ATTAINMENT
0
5
10
15
20
25
30
HIG
H S
CHO
OL
OR
LESS
- 19
.2%
SOM
E CO
LLEG
EN
O D
EGRE
E - 2
6.9%
ASS
OCI
ATE
’SD
EGRE
E - 1
3.1% BA
CHEL
OR’
SD
EGRE
E - 2
9.2%
GRA
DU
ATE
DEG
REE
- 10.
6%

BU
DG
ET
OV
ER
VIE
W
FY2019 ANNUAL BUDGET - 24
EMPLOYER RANGE OF EMPLOYEESIM Flash 1,000-1,999Adobe 1,000-1,999
Young Living 1,000-1,999Vivint Solar 1,000-1,999
Alpine School District 850-1,800Ancestry 500-999Xactware 500-999Younique 500-999Workfront 500-999
Solutionreach 500-999Entrata 500-999 TAXPAYER
Audi LehiCabela’sCostco
Harmon’sJack B Parson Co.
Lehi CityLowe’s
Macey’sSmith’s
USTC Motor VehicleCOMBINED % OF TOTAL LEHI SALES TAX
39.89%
Not in Labor Force - 30.5%
Employed (Civilian) - 67.0%
Unemployed (Civilian) - 2.2%
Armed Forces - 0.2%
ECONOMIC PROFILE
CLASS OF WORKEREMPLOYMENT STATUS
PRINCIPAL EMPLOYERS
PRINCIPAL SALES TAX PAYERS
Government - 13.2%
Private Wage - 81.6%
Self-Employed - 5.0%
Unpaid Family Worker - 0.2%
BU
DG
ET
OV
ER
VIE
W
FY2019 ANNUAL BUDGET - 25
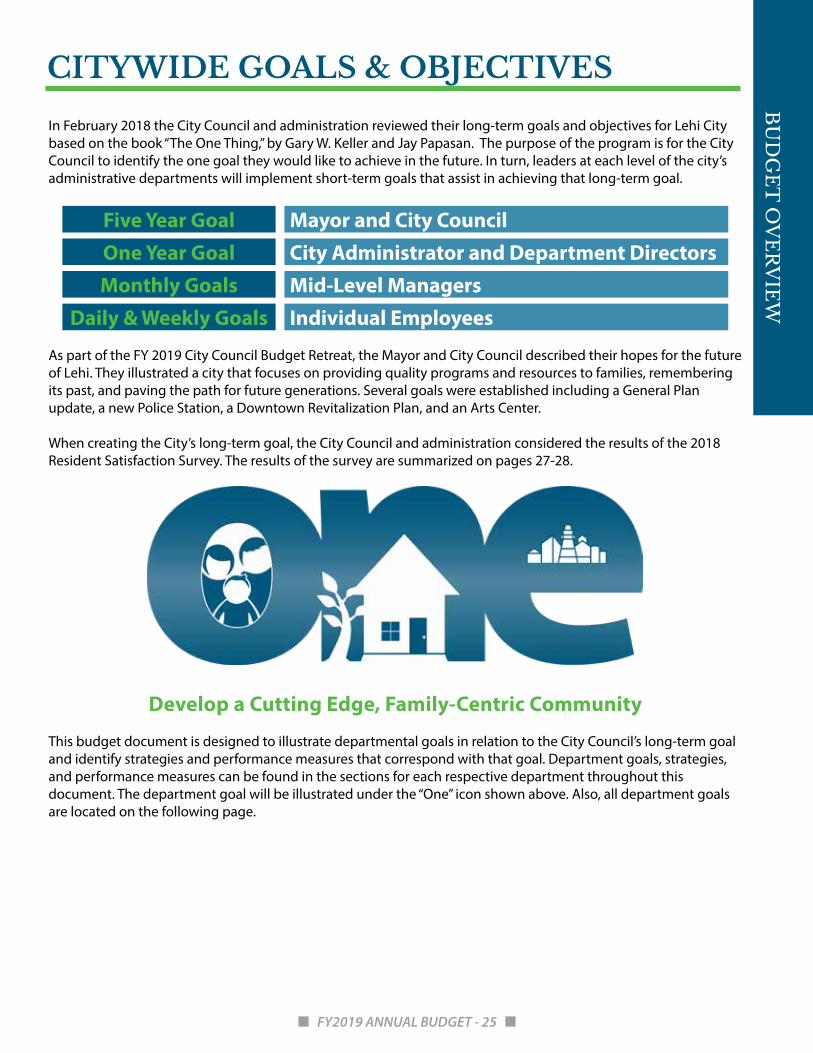
In February 2018 the City Council and administration reviewed their long-term goals and objectives for Lehi City based on the book “The One Thing,” by Gary W. Keller and Jay Papasan. The purpose of the program is for the City Council to identify the one goal they would like to achieve in the future. In turn, leaders at each level of the city’s administrative departments will implement short-term goals that assist in achieving that long-term goal.
Five Year Goal Mayor and City CouncilOne Year Goal City Administrator and Department DirectorsMonthly Goals Mid-Level Managers
Daily & Weekly Goals Individual Employees
As part of the FY 2019 City Council Budget Retreat, the Mayor and City Council described their hopes for the future of Lehi. They illustrated a city that focuses on providing quality programs and resources to families, remembering its past, and paving the path for future generations. Several goals were established including a General Plan update, a new Police Station, a Downtown Revitalization Plan, and an Arts Center.
When creating the City’s long-term goal, the City Council and administration considered the results of the 2018 Resident Satisfaction Survey. The results of the survey are summarized on pages 27-28.
Develop a Cutting Edge, Family-Centric Community
This budget document is designed to illustrate departmental goals in relation to the City Council’s long-term goal and identify strategies and performance measures that correspond with that goal. Department goals, strategies, and performance measures can be found in the sections for each respective department throughout this document. The department goal will be illustrated under the “One” icon shown above. Also, all department goals are located on the following page.
CITYWIDE GOALS & OBJECTIVES

BU
DG
ET
OV
ER
VIE
W
FY2019 ANNUAL BUDGET - 26
Develop a Cutting Edge, Family-Centric Community
OFFICE OF THE CITYADMINISTRATOR
Create a more e�cient organization through the use
of improved technologyand data-driven decisions.
COMMUNITY DEVELOPMENT
Update the Land Use Element of the General Plan.
ECONOMIC DEVELOPMENTPromote Lehi City as the #1 location for high-wage jobs, retail shopping
experience, entertainment opportunities, and a�ordable housing to facilitate
growth and a higher quality of life for Lehi residents.
ENGINEERING
Convert the Jordan RiverReservoir into a family, �shingfacility while augmenting the water resources of Lehi City.
FINANCEE�ectively manage and safeguard the
resources and assets by providing accurate and timely information in
accordance with generally accepted principles and the Government
Accounting Standards Board.
FIRE
Deliver a high level of professionalservice to the community while
enhancing public educationand community relations.
JUSTICE COURTImplement evidence-based sentencing
practices and utilize e�ective communityresources for convicted defendants in ane�ort to reduce recidivism in the criminal
justice system and e�ect positivechange and reparation.
LEGAL SERVICESSafeguard the rights and interests of Lehi
families by (1) vigorously prosecuting crime, (2) managing claims and litigationto protect tax dollars, and (3) defending
public policies advanced by Lehi’selected representatives.
LEISURE SERVICES
Provide high-quality programsand services designed
for Lehi families.
POLICE
Provide professional policeservices focused on citizen
engagement and transparency.
POWER
Use technology and improvedinfrastructure to provide safe,
reliable power.
PUBLIC WORKS
Maintain the city’s infrastructure and facilities at the lowest cost and highest
level of e�ciency through cutting-edge technology, innovative solutions,
and strong leadership.
WATER
Complete the new JordanWillow P.I. Reservoir and stock
it with �sh for recreational use.

BU
DG
ET
OV
ER
VIE
W
FY2019 ANNUAL BUDGET - 27
Lehi City conducts an official resident survey annually to collect valuable feedback on City operations and input on the policy direction of the City. The City conducted its most recent resident survey in March 2018. The results of this survey were an integral part of the strategic planning retreat held at the beginning of the budget process in February 2018.
The FY 2018 survey was completed by Y2 Analytics. The survey was conducted via email and gathered information regarding resident satisfaction and perceptions of the management and maintenance of the City. A sample of the survey results are included below.
WHY LEHI?Residents were asked questions about why they choose to live in Lehi. The majority of those surveyed enjoy most the location of Lehi and it’s proximity to other areas of the Wasatch Front. Residents believe Lehi offers work opportunities, and feel Lehi is a great place to raise a family.
WHAT DO YOU LIKE MOST ABOUT LIVING IN LEHI?
Lehi residents on average rated quality of life in Lehi City 80
(on a scale of 0-100).
The percent of Lehi residents who feel safe living in Lehi.
The percent of Lehi residents who feel Lehi is a great place to
raise a family.
RESIDENT PRIORITIES
80 89%92%

BU
DG
ET
OV
ER
VIE
W
FY2019 ANNUAL BUDGET - 28
CITY SERVICESResidents rated the services they receive in our community based on the value received for their tax dollars, the quality of services provided, satisfaction with specific programs, and overall management. The highest rates service provided is Fire and Emergency Medical and the lowest rated service is Planning and Zoning. Overall, 74 percent of residents feel they receive a good value for their tax dollars and the City does a good job managing those services.
The percent of Lehi residents who rate the service received for their tax dollar as good or
excellent.
The percent of Lehi residents that believe Lehi provides the
right city services.
The percent of Lehi residents who think Lehi does a good job
managing city services.
Lehi residents rated city services on a scale of 0 to 100, with 0 meaning they are completely dissatisfied, and 100 meaning completely satisfied. The average rating is listed below.
Police Services ............................................................................83Fire and Emergency Medical Services ...............................86Animal Control Services ..........................................................72Garbage Collection ...................................................................84Recycling Program ....................................................................75Snow Removal Services ..........................................................69Surface Maintenance on City Streets .................................59Utility Billing ................................................................................80Sidewalk Maintenance ............................................................65Street Lighting ............................................................................64City Code Enforcement ...........................................................62
Parks and Open Spaces ...........................................................66Community Events ...................................................................75Aquatic and Fitness Center ....................................................73Water Conservation Efforts ....................................................65Culinary (drinking) Water .......................................................78Adult Recreation Programs ....................................................67Youth Recreation Programs ...................................................75Senior Citizen Programs ..........................................................73Planning and Zoning ...............................................................49Emergency Preparedness .......................................................70
ISSUES FACING LEHI CITYResidents were asked about the major issues facing Lehi City, both today and in the future. The majority of residents feel growth and traffic are the most important issues for the City to address.
WHAT IS THE MOST IMPORTANT ISSUE FACING LEHI TODAY?
WHAT IS THE MOST IMPORTANT ISSUE FACING LEHI IN THE FUTURE?
The complete FY 2018 Resident Survey can be found on Lehi City’s website at www.lehi-ut.gov/government/administration/pr/.
69% 73%74%

BU
DG
ET
OV
ER
VIE
W
FY2019 ANNUAL BUDGET - 29
Lehi City’s budget operates on a fiscal year, from July 1 to June 30 of each year. The City Council approves the final budget in June and it takes effect on July 1. The process begins in December when the Finance Department issues budget guidelines and instructions to each department, including overall goals, priorities, and budget limits. The Citizen Survey process also begins annually in December to determine service satisfaction levels and what residents are willing to pay for regarding specific services (price of government). This allows residents to have a voice in creating spending priorities for the City.
In January, the City Council amends the budget to readjust spending priorities for any unforeseen budgetary issues. In February, each department submits personnel requests, capital improvements, and replacement budget items to the Finance Department. In March, the budget team, consisting of the Mayor, City Administrator, Assistant City Administrator, Assistant to the City Administrator, and the Finance Department, begin meeting with each department to review personnel requests, capital improvements, and replacement budget items. These budget requests are then prioritized by the budget team to determine inclusion in the tentative budget.
The Finance Department drafts a tentative budget in April. The tentative budget is presented to the City Council and citizens of Lehi during the last City Council meeting in May. The City Council then holds public work sessions with City staff to review the tentative budget and make amendments as necessary. After necessary changes have been made and the numbers are finalized, the final budget is presented to the City Council. The final budget must be adopted by the last City Council meeting in June for the following fiscal year.
BUDGET PROCESS
DECEMBER1. Citizen Survey
2. Budget guidelines & instructions to departments
JANUARY3. Amend current budget
as necessary
FEBRUARY4. Compile capital &
replacement budget items
5. Review Citizen Survey
MARCH6. Set goals for upcoming
year
7. Hold budget worksessions
APRIL8. Proposed budget to City
Council
9. Tentative budget public hearing
MAY10. Adopt tentative
budget
JUNE11. Amend budget as
necessary
12. Adopt final budget
JULY13. Fiscal year begins
14. Final budget takeseffect

BU
DG
ET
OV
ER
VIE
W
FY2019 ANNUAL BUDGET - 30
GUIDING FINANCIAL PRINCIPLESWhile the City’s long-term goals and objectives guide what the budget accomplishes, the accomplishment of these goals and objectives through the budget process is based on the following guiding principles:
• Lehi City exists only to serve the needs of its residents.Since these needs are continually changing, the City shouldconsistently receive resident feedback based on both long-term and current needs.
• Lehi City should strive for inter-generational fairness. Thus,each generation of taxpayers should pay its fair share of thelong-range cost of city services.
• Lehi City should finance services rendered to the generalpublic, such as police, fire, streets, and parks, from revenuesimposed on the general public, such as property andsales taxes. Special services rendered to specific groupsof residents should be financed by user fees, impact fees,license and permit fees, or special assessments.
• Lehi City should balance all budgets annually, inaccordance with Utah law, which states the following:
• The total of the anticipated revenues shall equal thetotal of appropriated expenditures (Section 10-6-110, U.C.A.).
• The governing body of any city may not make any appropriation in the final budget of any fund in excessof the estimated expendable revenue for the budget period of the fund (Section 10-6-117, U.C.A.).
• Lehi City should allow for a reasonable surplus (fund balance) to accumulate for the following purposes: • To provide sufficient working capital. • To provide a cushion to absorb emergencies such as floods, earthquakes, etc. • To provide for unavoidable shortfalls in revenues.
The City conducts its financial affairs with policies that are based on these guiding principles. The principles are reviewed by the budget team and City Council in making all budgetary decisions. These policies are stated in the following sections discussing the budget process, financial structure, revenue, debt, and capital projects.
BUDGET AMENDMENTS AND MANAGEMENTOnce adopted, the budget can be amended by subsequent City Council action. The City Council can approve reductions in or reallocations of departmental appropriations upon recommendation of the City Administrator and Finance Director; however, appropriations cannot be increased in a governmental fund without a public hearing. The Finance Director can approve the transfer of unexpended appropriations from one expenditure account to another in the same department.
The Finance Department prepares and distributes a monthly budget report by the 15th day of the following month. The report mirrors the financial schedules contained in this budget book and includes current month expenditures, year-to-date expenditures, encumbrances, year-to-date budget, year-to-date variances, the annual budget, and the remaining budget.
The departmental budget within a given fund, as determined by Utah State law, is the level for which expenditures may not legally exceed appropriations. The City Council must also approve any expenditure exceeding appropriations for all capital projects. All unexpended budget appropriations lapse at the end of the budget year.
Photo Credit: Paul Baird

BU
DG
ET
OV
ER
VIE
W
FY2019 ANNUAL BUDGET - 31
FINANCIAL STRUCTURE
The backbone of City operations is the various departments within the City. The departments are organized groups with similar functions or programs to manage operations more efficiently. The City’s financial structure is organized into various funds within departments used for accounting and reporting. This provides a framework for the budget that is conceptually easier to understand. The majority of this document is organized by department to provide budgetary information.
The following is a brief description of the funds that make up the City’s financial structure:
GOVERNMENTAL FUNDS PROPRIETARY FUNDS
GENERAL FUND
CAPITAL PROJECT
FUND
SPECIAL REVENUE
FUND
REDEV. AGENCY
FUNDENTERPRISE FUNDS
INTERNAL SERVICE FUNDS
Department Funds
Fire Impact Fee Legacy Center Adobe Area Culinary Water
FundCulinary Impact
FeeBuilding & Grounds
Class C Roads Parks Impact Fee Outdoor Pool IM Flash Micron Drainage Fund Drainage Impact Fee Fleet
Liquor Allotment Police Impact Fee Millpond Area In Lieu Fee Garbage Fund Information
Technology
CDBG Fund Roads Impact Fee
Outlets at Traverse Area Electric Fund Electric Impact
FeeRisk
Management
Thanksgiving Park Area Sewer Fund Sewer Impact
Fee
Pressurized Irrigation Fund P.I. Impact Fee
Museum Fund
A matrix showing the relationship between the funds outlined above and the operational departments can be found on pages 33 and 34.

BU
DG
ET
OV
ER
VIE
W
FY2019 ANNUAL BUDGET - 32
GOVERNMENTAL FUNDSGeneral Fund: This fund accounts for all financial resources necessary to carry out basic governmental activities for the City that are not accounted for in another fund. The General Fund supports essential city services such as police and fire protection, street maintenance, libraries and parks and open space maintenance. General Fund revenue is collected from taxes (property, sales, and franchise), license and permits, service fees, fines, grants, and other various sources. The Class C Roads and Liquor Allotment funds account for the State’s excise taxes, which are restricted for street maintenance and DUI enforcement.
Community Development Block Grant (CDBG) Fund: The CDBG program is federally awarded program that provides grants for local community development activities. CDBG funds can be used for affordable housing, anti-poverty programs, and infrastructure development. The city prioritizes projects and improvements to determine how to use these funds. Capital Project and Impact Fee Funds: These funds provide financial resources for the acquisition or construction of major capital improvement projects for governmental-type activities. Special Revenue Funds: These funds are used when revenue is legally restricted to expenditures for specified purposes. The Legacy Center Fund and the Outdoor Pool Fund have legally restricted revenue and are categorized as special revenue funds. Redevelopment Agency Funds: Community redevelopment and economic development project areas are financed by incremental taxes collected for the properties in development. Redevelopment Agency Funds account for the tax revenue that is used to pay debt from improving project infrastructure. Currently there are five RDA Funds in Lehi City.
PROPRIETARY FUNDSEnterprise Funds: These funds are used for specific operations that provide goods and services primarily financed with user fee revenue. These operations are similar to private business enterprises. Lehi City’s seven enterprise funds include: Culinary Water, Pressurized Irrigation (PI), Sewer, Electric, Garbage, Drainage, and the Museum. Water, PI, Sewer, Electric, and Drainage also have associated Impact Fee Funds for the acquisition and construction of new capital improvement projects. Internal Service Funds: These funds finance commodities or services provided by one program that benefit other programs within the City. Costs are reimbursed by those programs and departments that use the services through these funds. The City’s four Internal Service Funds account for fleet, IT, buildings and grounds, and risk management activities.

BU
DG
ET
OV
ER
VIE
W
FY2019 ANNUAL BUDGET - 33
FUND - OPERATIONAL DEPARTMENT RELATIONSHIP MATRIXThe following matrix shows the relationship between funds and operational departments. Specifically, departments that are funded by each fund have an “X” marked in the fund’s corresponding row. Often, the funds will be associated with specific divisions or sections within operational departments. These relationships are shown in more detail within the budget document.
DEVELOPMENT SERVICES POWER FINANCE LEGAL
SERVICESJUSTICE COURT
LEISURE SERVICES
OFFICE OF THE CITY ADMIN. PLANNING ENGINEERING PUBLIC
WORKS WATER POLICE FIRE
GOVERNMENTAL FUNDS GOVERNMENTAL FUNDS
General Fund X X X X X X General Fund X X X X X X
Class “C” Roads Class “C” Roads X
Liquor Allotment Liquor Allotment X
CDBG X CDBG X X
GOVERNMENTAL PROJECTS AND IMPACT FEE FUNDS GOVERNMENTAL PROJECTS AND IMPACT FEE FUNDS
Capital Projects X X X X X X Capital Projects X X X X X X X
Fire Impact Fee Fire Impact Fee X
Parks Impact Fee Parks Impact Fee X
Police Impact Fee Police Impact Fee X
Roads Impact Fee Roads Impact Fee X
SPECIAL REVENUE FUNDS SPECIAL REVENUE FUNDS
Legacy Center X Legacy Center
Outdoor Pool X Outdoor Pool
REDEVELOPMENT AGENCY FUNDS REDEVELOPMENT AGENCY FUNDS
Adobe Area EDA X Adobe Area EDA
IM Flash Micron RDA X IM Flash Micron RDA
Millpond Area RDA X Millpond Area RDA
Outlets at Traverse CDA X Outlets at Traverse CDA
Thanksgiving Park EDA X Thanksgiving Park EDA
PROPRIETARY FUNDS PROPRIETARY FUNDS
ENTERPRISE FUNDS ENTERPRISE FUNDS
Culinary Water Culinary Water X
Culinary Water Impact Fee Culinary Water Impact Fee X
Drainage Drainage X
Drainage Impact Fee Drainage Impact Fee X
In Lieu Fee In Lieu Fee X
Pressurized Irrigation Pressurized Irrigation X
PI Impact Fee PI Impact Fee X
Electric X Electric
Electric Impact Fee X Electric Impact Fee
Garbage X Garbage
Museum X Museum
Sewer Sewer X
Sewer Impact Fee Sewer Impact Fee X
INTERNAL SERVICE FUNDS INTERNAL SERVICE FUNDS
Building & Grounds Building & Grounds X
Fleet Fleet X
IT IT X
Risk Management X Risk Management

BU
DG
ET
OV
ER
VIE
W
FY2019 ANNUAL BUDGET - 34
DEVELOPMENT SERVICES POWER FINANCE LEGAL
SERVICESJUSTICE COURT
LEISURE SERVICES
OFFICE OF THE CITY ADMIN. PLANNING ENGINEERING PUBLIC
WORKS WATER POLICE FIRE
GOVERNMENTAL FUNDS GOVERNMENTAL FUNDS
General Fund X X X X X X General Fund X X X X X X
Class “C” Roads Class “C” Roads X
Liquor Allotment Liquor Allotment X
CDBG X CDBG X X
GOVERNMENTAL PROJECTS AND IMPACT FEE FUNDS GOVERNMENTAL PROJECTS AND IMPACT FEE FUNDS
Capital Projects X X X X X X Capital Projects X X X X X X X
Fire Impact Fee Fire Impact Fee X
Parks Impact Fee Parks Impact Fee X
Police Impact Fee Police Impact Fee X
Roads Impact Fee Roads Impact Fee X
SPECIAL REVENUE FUNDS SPECIAL REVENUE FUNDS
Legacy Center X Legacy Center
Outdoor Pool X Outdoor Pool
REDEVELOPMENT AGENCY FUNDS REDEVELOPMENT AGENCY FUNDS
Adobe Area EDA X Adobe Area EDA
IM Flash Micron RDA X IM Flash Micron RDA
Millpond Area RDA X Millpond Area RDA
Outlets at Traverse CDA X Outlets at Traverse CDA
Thanksgiving Park EDA X Thanksgiving Park EDA
PROPRIETARY FUNDS PROPRIETARY FUNDS
ENTERPRISE FUNDS ENTERPRISE FUNDS
Culinary Water Culinary Water X
Culinary Water Impact Fee Culinary Water Impact Fee X
Drainage Drainage X
Drainage Impact Fee Drainage Impact Fee X
In Lieu Fee In Lieu Fee X
Pressurized Irrigation Pressurized Irrigation X
PI Impact Fee PI Impact Fee X
Electric X Electric
Electric Impact Fee X Electric Impact Fee
Garbage X Garbage
Museum X Museum
Sewer Sewer X
Sewer Impact Fee Sewer Impact Fee X
INTERNAL SERVICE FUNDS INTERNAL SERVICE FUNDS
Building & Grounds Building & Grounds X
Fleet Fleet X
IT IT X
Risk Management X Risk Management

BU
DG
ET
OV
ER
VIE
W
FY2019 ANNUAL BUDGET - 35
FUND BALANCE & RESERVESUtah state law allows cities to accumulate retained earnings or fund balances as appropriate in any fund (see U.C.A 10-6-116). However, the law restricts balances in the General Fund as follows: 1) Any fund balance lessthan 5 percent of estimated revenue may be used for working capital, certain emergency expenditures, or tocover an unexpected revenue shortfall that would result in a year-end excess of expenditures over revenues; 2)Fund balance greater than 5 percent but less than 25 percent may be used for budget purposes; and 3) Any fundbalance in excess of 25 percent must be included in the appropriations of the next fiscal year.
Lehi City accumulates fund balances in its various funds for the following purposes: • To avoid short-term debt that might be needed to provide working capital • To meet unexpected expenditures as the result of an emergency • To secure the City’s debt and its bond rating • To accumulate funding for planned capital expenditures including the replacement of capital assets • To meet the reserve requirements for liabilities already incurred but not yet paid (e.g. Risk Management Fund)
All excess funds are invested consistent with the State Money Management Act. The resultant interest income is used as an additional revenue source in each fund. The chart below shows the history of the fund balance in the General Fund.
GOVERNMENTAL FUND BALANCES
FUND ENDFY 2016
ENDFY 2017
ESTFY 2018
APPROVED FY 2019
INCREASE (DECREASE)
General $ 8,737,859 $ 6,293,553 $ 6,532,306 $ 6,532,306 $ 0 Redevelopment Agency 1,497,467 1,023,742 1,023,742 1,023,742 0 Capital Projects 7,959,639 1,090,972 2,915,034 2,570,384 (344,350)TOTAL GOVERNMENTAL FUNDS $ 18,194,965 $ 8,408,267 $ 10,471,082 $ 10,126,432 $ 765,458
$2 Million
$4 Million
$6 Million
$8 Million
$10 Million
FY2019(est)
FY2018(est)
FY2017FY2016 FY2015FY2014FY2013FY2012FY2011FY2010FY2009
ENDING GENERAL FUND BALANCE - 10-YEAR TREND

BU
DG
ET
OV
ER
VIE
W
FY2019 ANNUAL BUDGET - 36
BASIS OF BUDGETINGBudgetary basis is the basis of accounting used to estimate financing sources and uses in the budget. There are three types of budgetary basis accounting: (1) cash basis, (2) accrual basis, and (3) modified accrual basis. These are explained below:
Cash Basis: Transactions are recognized only when cash is increased or decreased.
Accrual Basis: Revenues are recorded when they are earned (regardless of when cash increases) and expenditures are recorded when goods and services are received (regardless of when cash disbursements are made).
Modified Accrual Basis: Accounting method that is a mixture of cash basis and accrual basis accounting. Revenues are recognized when they become measurable and “available” as net current assets. “Available” means collectible in the current period or soon enough thereafter to be used to pay against liabilities in the current period. Expenditures are recognized when the related fund liability is incurred, except for principal and interest on general long-term debt, which is recognized when due.
General Government Funds follow the modified accrual basis of accounting. Sales taxes are recognized when intermediary collecting agencies have received them. All other intergovernmental revenues are recorded as revenue when received. Property tax revenues are recognized in the fiscal year for which they were levied. Licenses and permits, charges for services, fines and forfeitures, and other revenues are recorded as revenue when received cash.
The Enterprise Funds are prepared on an accrual basis. Expenditures are recognized as encumbrances when services are received or a commitment is made (e.g. through a purchase order). Revenues, on the other hand, are recognized when they are obligated to the City (for example, power user fees are recognized as revenue when service is provided).
In both Enterprise Funds and General Governmental Funds, the encumbrances will lapse when goods and services are not received by year-end.
The Comprehensive Annual Financial Report (CAFR) shows the status of the City’s finances on the basis of “generally accepted accounting principles” (GAAP). In most cases this conforms to the way the City prepares its budget. Exceptions include:
• Compensated absences liabilities that are expected to be liquidated with expendable available financialresources are accrued as earned by employees (GAAP) as opposed to being expended when paid (Budget).
• General staff and administrative charges are recognized as direct expenses of the Power Enterprise Fund on aGAAP basis as opposed to being accounted for and funded by operating transfers into the General Fund fromthe Power Fund on the Budget basis.
• Principal payments on long-term debt within the Enterprise Funds are applied to the outstanding liability on aGAAP basis, as opposed to being expended on a Budget basis.
• Capital outlay within the Enterprise Funds are recorded as assets on a GAAP basis and expended on a Budgetbasis.
• Depreciation expense is recorded on a GAAP basis only.
The Comprehensive Annual Financial Report shows fund expenditures and revenues on both a GAAP basis and Budget basis for comparison purposes. The most recent financial report is available online at www.lehi-ut.gov/departments/finance.
BU
DG
ET
OV
ER
VIE
W
FY2019 ANNUAL BUDGET - 37
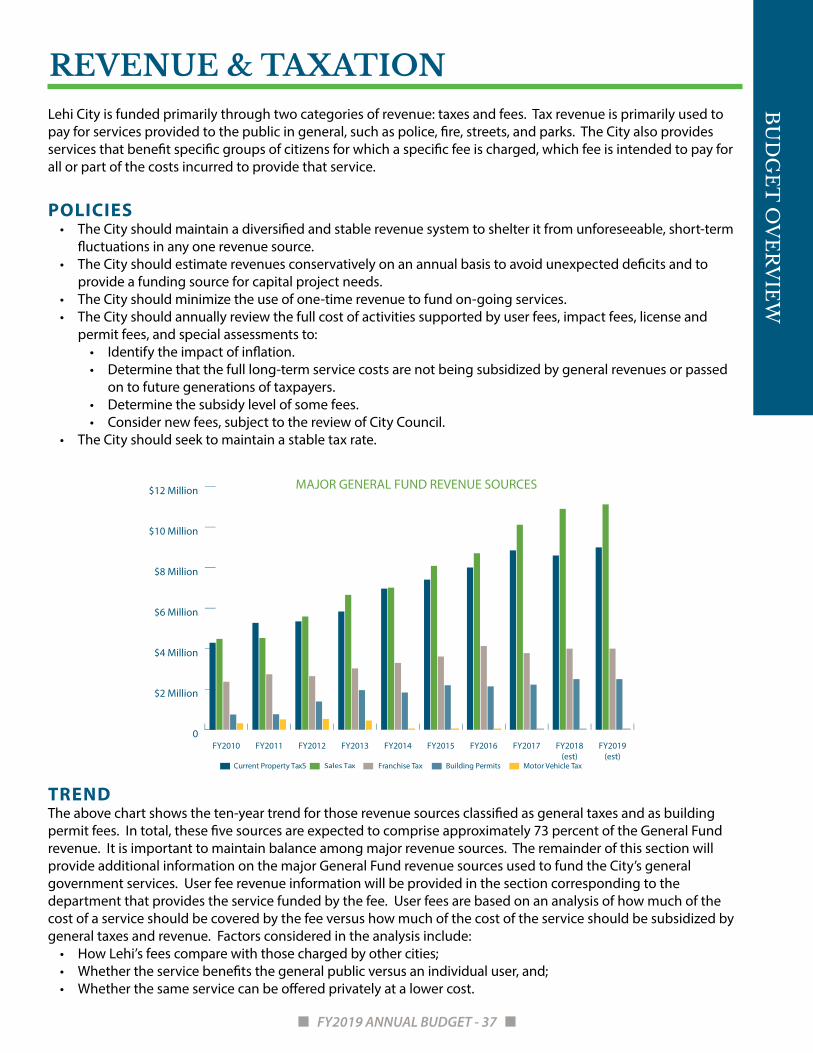
REVENUE & TAXATIONLehi City is funded primarily through two categories of revenue: taxes and fees. Tax revenue is primarily used to pay for services provided to the public in general, such as police, fire, streets, and parks. The City also provides services that benefit specific groups of citizens for which a specific fee is charged, which fee is intended to pay for all or part of the costs incurred to provide that service.
POLICIES • The City should maintain a diversified and stable revenue system to shelter it from unforeseeable, short-term
fluctuations in any one revenue source. • The City should estimate revenues conservatively on an annual basis to avoid unexpected deficits and to
provide a funding source for capital project needs. • The City should minimize the use of one-time revenue to fund on-going services. • The City should annually review the full cost of activities supported by user fees, impact fees, license and
permit fees, and special assessments to: • Identify the impact of inflation. • Determine that the full long-term service costs are not being subsidized by general revenues or passed
on to future generations of taxpayers. • Determine the subsidy level of some fees. • Consider new fees, subject to the review of City Council.
• The City should seek to maintain a stable tax rate.
TRENDThe above chart shows the ten-year trend for those revenue sources classified as general taxes and as building permit fees. In total, these five sources are expected to comprise approximately 73 percent of the General Fund revenue. It is important to maintain balance among major revenue sources. The remainder of this section will provide additional information on the major General Fund revenue sources used to fund the City’s general government services. User fee revenue information will be provided in the section corresponding to the department that provides the service funded by the fee. User fees are based on an analysis of how much of the cost of a service should be covered by the fee versus how much of the cost of the service should be subsidized by general taxes and revenue. Factors considered in the analysis include:
• How Lehi’s fees compare with those charged by other cities; • Whether the service benefits the general public versus an individual user, and; • Whether the same service can be offered privately at a lower cost.
0
$2 Million
$4 Million
$6 Million
$8 Million
$10 Million
$12 Million
FY2019(est)
FY2018(est)
FY2017FY2016FY2015FY2014FY2013FY2012FY2011FY2010
Current Property TaxS Franchise Tax Building Permits Motor Vehicle Tax
MAJOR GENERAL FUND REVENUE SOURCES
Sales Tax

BU
DG
ET
OV
ER
VIE
W
FY2019 ANNUAL BUDGET - 38
SALES TAXGeneral sales tax is one of Lehi City’s largest revenue sources at 30 percent of the estimated General Fund revenue for FY 2019. State law authorizes cities to receive sales tax revenue based on the process described in the chart shown to the right.
Normally, sales tax revenue fluctuates more with the economy than the other major tax revenue sources. However, commercial growth has continued to hold steady with the addition of Class A office space and several commercial developments, including Blender Bottle and Marshalls.
The City has also seen the opening and announcement of national and local restaurants like Strap Tank, Taqueria 27, Chick-fil-A, and PDQ. Lehi continues to have some of the best undeveloped commercial frontage along the Wasatch Front, and the City is in continual negotiation with several developers and site selectors.
The economic viability on a statewide level accounts for about half of the City’s sales tax revenue. In that regard, Utah continues to excel, with Forbes Magazine ranking Utah 3rd in its list of “Best States for Business” and 2nd in “Labor Supply Rank” in 2017. Further, CNBC ranked Utah 8th in its list of “America’s Top States for Business 2017” and 4th in the Economy ranking for 2017. In light of Lehi’s prominence in Utah’s strong state economy, as well as the new commercial development reaching completion during the upcoming fiscal year, the City conservatively forecasts its FY 2019 sales tax revenue to increase by 2 percent from FY 2018 estimates.
PROPERTY TAXProperty tax is another one of Lehi’s largest revenue sources, accounting for approximately 25 percent of General Fund revenue. In Fiscal Year 2014, Lehi’s Finance Department started combining current property taxes, motor vehicle taxes, and delinquent taxes into one property tax line item. This accounts for the increase in the property tax revenue line item from previous budgets. Utah County assesses the taxable value of property in Lehi and collects all property tax. Lehi City’s FY 2019 certified property tax rate is 0.001678.
Primary residences are taxed at 55 percent of the property’s assessed value, while secondary residences are taxed at 100 percent of the property’s value. Lehi receives approximately 17 percent of what residents pay in property taxes. Maintaining an average rate for many years, property tax revenues have stayed relatively stable. This trend will stay consistent in FY 2019, with the previously-discussed reclassification of motor vehicle tax and delinquent tax into the current property tax line item. The projected property tax revenue growth in FY 2019 is largely due to the success the City has experienced in both commercial and residential development.
4.70%State
0.50%Lehi
0.55%Mass Transit
0.50%County
0.50%Statewide
Pool
Lehi’s Portion
<2.5% Admin.
Fees
+
-
Total Received by Lehi
The graphic above shows how sales tax is divided among several
.50% is placed in a statewide pool and disbursed based on popula-tion, of which Lehi receives a portion.
0.0000
0.0005
0.0010
0.0015
0.0020
0.0025
0.0030
0.0035
MidvaleMurrayRoyAmericanFork
LoganPleasantGrove
SouthJordan
SaratogaSprings
LehiLaytonDraperHighland
PROPERTY TAX COMPARISON - TAX YEAR FY2019
.001
678

BU
DG
ET
OV
ER
VIE
W
FY2019 ANNUAL BUDGET - 39
FRANCHISE TAXFranchise taxes are the third largest source of revenue for the General Fund, accounting for approximately 11 percent of total General Fund revenues. State law authorizes cities to collect up to 6 percent in utilities operating within city boundaries. Since franchise taxrevenues are determined by the number of service connections, as well as the sales from those connections, growth in franchise tax revenue is directly related to new construction. Franchise tax revenue is estimated to remain consistent from FY 2018 to FY 2019. The total projected revenue of $4,000,000 represents a consistent recovery of this revenue source after a significant decrease in FY 2010.
MOTOR VEHICLE TAXA statewide fee is assessed on motor vehicles in lieu of property taxes. The motor vehicle fee is assessed basedon the age and type of the vehicle. Historically, the motor
vehicle tax accounts for approximately 3 percent of all General Fund revenues; however, as stated previously, Lehi’s Finance Department has decided to begin combining motor vehicle tax revenue with property tax and delinquent taxes into one line item. Therefore, the motor vehicle tax will no longer be tracked as an individual line item. A breakdown of how the motor vehicle tax is assessed for passenger vehicles is provided in the table to the left.
BUILDING PERMIT FEESCompanies or individuals that construct buildings in Lehi are
charged building permit fees. Thus, building permit fee revenue is a good indicator of the amount of growth occurring in the City. As can be seen in the graph, Lehi has experienced continual growth over the last few years. Lehi is projecting to continue the rebound that began in FY 2012, which saw an 83 percent increase from FY 2011 levels. Lehi experienced another significant revenue increase in FY 2013 of about 40 percent from FY 2012. This trend continues to look encouraging. Accordingly, the City is conservatively projecting revenues above FY 2012 levels moving forward.
MODEL YEARS AGE-BASED FEE2018-2016 $1502015-2013 $1102012-2010 $802009-2007 $502006 & older $10*Source: Utah State Tax Commission
The graphic above shows how property tax is divided among several di�erent entities. Primary residences are taxed at 55% of the assessed
value. Lehi City’s FY 2019 certi�ed tax rate is 0.1678%.
0%
10%
20%
30%
40%
50%
60%
70%
80%
Other Special Districts
Assess & Collect
Central Utah Water
District
Utah County
Lehi CityAlpine School District
69.98%
16.70%
7.28% 3.98% 1.78% 0.28%
Property Taxes by Collecting Entity
Where do your property taxes go?
0
$500,000
$1,000,000
$1,500,000
$2,000,000
$2,500,000
FY2019(est)
FY2018(est)
FY2017FY2016FY2015FY2014FY2013FY2012FY2011FY2010

BU
DG
ET
OV
ER
VIE
W
FY2019 ANNUAL BUDGET - 40
DEBTConsistent with the policies listed below, Lehi City uses debt judiciously. Currently, the City has a AA- bond rating from Standard and Poor’s for general obligation bonds. The schedules in this section include the general long-term debt pertaining to both the governmental and proprietary funds.
POLICIES • When applicable, Lehi City will review its outstanding debt annually for the purpose of determining if the
financial marketplace will afford the City the opportunity to refund, issue, and lessen its debt service costs(minimum 3 percent savings over the life of an issue).
• Lehi City will confine long-term borrowing to capital improvements or projects that cannot be financed fromcurrent revenues.
• When Lehi City finances capital projects by issuing bonds, it will pay back the bonds within a period not toexceed the estimated useful life of the project.
• Lehi City should have the final maturity of general obligation bonds at or below thirty years. • Capital improvements, equipment, and facility projects shall be classified into “pay-as-you-go” and “debt
financing” classifications. Pay-as-you-go capital items will be $5,000 or less with short lives (less than fouryears) or replacement of existing equipment where depreciation has been paid to a sinking fund. Debtfinancing will be used for major, non-recurring items with a minimum of four years of useful life.
• Whenever possible, Lehi City will use special assessment, revenue, or other self-supporting bonds instead ofgeneral obligation bonds, so those benefiting from the improvements will bear all or part of the cost of theproject financed.
• Lehi City will not use long-term debt for current operations. • Lehi City will maintain good communications with bond rating agencies regarding its financial condition.
COMPUTATION OF LEGAL DEBT MARGIN - JUNE 30, 2018
Assessed Valuation $ 5,722,848,822Estimated Actual Value 7,867,355,872Debt Limit - 4% of Estimated Actual Value 314,694,235Less Outstanding General Obligation Bonds -Total Amount of Debt Applicable to Debt Limit -LEGAL DEBT MARGIN $ 314,694,235
Photo credit: Stefanie Eskander

BU
DG
ET
OV
ER
VIE
W
FY2019 ANNUAL BUDGET - 41
OUTSTANDING GENERAL LONG-TERM DEBT: GOVERNMENTAL ACTIVITIES
DESCRIPTIONEND BALANCEFY 2017
ADDITIONS DELETIONS
ESTIMATEDEND BALANCE FY 2018
PRINCIPAL DUEFY 2019
INTEREST DUEFY 2019
ESTIMATEDEND BALANCE FY 2019
2018 Sales Tax Bonds $ - $ 5,000,000 $ - $ 5,000,000 $ 145,000 $ 243,313 $ 4,855,000
2014 Sales Tax Bonds 5,220,000 - 700,000 4,520,000 710,000 103,960 3,810,000
2004 Subordinated Sales Tax Revenue Bonds
7,955,000 - - 7,955,000 - 377,863 7,955,000
Tax Increment Micron 56,935,296 - 3,042,033 53,893,263 Contingent on Tax Increment 50,893,263
Tax Increment Thanksgiving Park 1,635,391 - 242,115 1,393,276 Contingent on Tax Increment 1,153,276
Tax Increment Traverse Mountain 10,496,369 - - 10,496,369 Contingent on Tax Increment 10,496,369
Tax Increment Alpine Highway West 14,856,648 - 467,507 14,389,141 Contingent on Tax Increment 13,929,141
Tax Increment West Timpanogos 19,153,923 - 319,548 18,834,375 Contingent on Tax Increment 18,514,375
Compensated Absences 2,204,751 - - 2,204,751 - - 2,204,751
Net Pension Liability 5,845,925 - - 5,845,925 - - 5,845,925
Landfill Closure & Post-Closure Liability
250,917 - - 250,917 - - 250,917
Other Notes Payable 4,091,442 - 2,869,192 1,222,250 - - 1,222,250
TOTAL LONG-TERM DEBT $ 128,645,662 $ 5,000,000 $ 7,640,396 $ 126,005,266 $ 855,000 $ 725,136 $ 121,130,267
A brief description of Lehi City’s debt issues (as of June 30, 2018) is included below. • 2018 Sales Tax Bonds - $5,000,000 sales tax bonds issued to construct a fire station and for road
improvements. Annual principal payments and semi-annual interest payments are due through June 2038. Interest is at coupon rates varying from 4.00% to 5.25%.
• 2014 Sales Tax Bonds - $7,210,000 sales tax bonds that refunded the 2003 Sales Tax Revenue Bonds and 2004 Sales Tax Revenue and Refunding Bonds. Due serially through June 1, 2024 with interest at 2.3 percent.
• 2004 Subordinated Sales Tax Revenue Bonds - $9,000,000 authorized, $9,000,000 issued through June 30, 2007 sales tax revenue bonds with interest of 4.75 percent payable from 87.5 percent of the local sales and use tax and 100 percent of the transient room tax collected from the Cabela’s Retail Store Project Area, due in 2024.
• Tax Increment Note Micron - Due in annual installments equal to 70 percent of the tax increment received by the Redevelopment Agency from the Alpine Highway Project, including interest at 6.6 percent, due in 2009. Used to finance economic development associated with IM Flash Technologies.
• Tax Increment Note Thanksgiving Park - Due in annual installments equal to 95 percent of the tax increment received by the Redevelopment Agency from the Thanksgiving Park Economic Development Project Area. Non-interest bearing note.
• Tax Increment Note Traverse Mountain - Due in annual installments equal to 100 percent of the property tax increment received by the Redevelopment Agency from the Traverse Mountain Community Development Project Area, as well as varying levels of the sales tax collected from business within the project area, over a ten-year tax increment period. Non-interest bearing note.
• Tax Increment Note Alpine Highway West - Due in annual installments equal to 93.33 percent of the tax increment received by the Redevelopment Agency from the Alpine Highway West Economic Development Project Area. Non-interest bearing note.
• Tax Increment Note West Timpanogos - Due in annual installments equal to 97 percent of the tax increment received by the Redevelopment Agency from the West Timpanogos Community Development Project Area. Non-interest bearing note.
• Compensated Absences - Some employees carry balances of sick leave and vacation leave greater than what they earn in a given year. The cost of compensating such balances are reported as long-term debt. Balances for compensated absences are capped at 160 hours for vacation leave and 240 hours for sick leave.
• Landfill Closure and Post-closure Care Liability - This represents an escrow fund used for costs associated with the landfill closure and post-closure care liability. The escrow fund is funded via the Garbage Fund.
• Other Notes Payable - Noninterest bearing notes payable to developers and for land acquisition.

BU
DG
ET
OV
ER
VIE
W
FY2019 ANNUAL BUDGET - 42
OUTSTANDING GENERAL LONG-TERM DEBT: BUSINESS-TYPE ACTIVITIES
DESCRIPTIONEND BALANCEFY 2017
ADDITIONS DELETIONS
ESTIMATED END BALANCEFY 2018
PRINCIPALDUEFY 2019
INTEREST DUEFY 2019
ESTIMATED END BALANCEFY 2019
2018 Electric Revenue Bonds $ - $ 15,640,000 - $ 15,640,000 $ 475,000 $ 777,250 $ 15,165,000
2014 Electric Refunding Bonds 2,320,000 - 760,000 1,560,000 775,000 31,995 785,000
2010 Drainage Bonds 1,455,000 - 160,000 1,295,000 165,000 45,454 1,130,000
Provo Reservoir Water Co. Note 419,011 - 14,191 404,820 14,750 15,329 390,070
Provo River Water Assoc. Note 1,061,277 - 30,679 1,030,598 31,894 40,381 998,704
Compensated Absences 688,173 - - 688,173 - - 688,173
Net Pension Liability 2,528,126 - - 2,528,126 - - 2,528,126
TOTAL LONG-TERM DEBT $ 8,471,587 $ 15,640,000 $ 964,870 $ 23,146,717 $ 1,461,644 $ 910,409 $ 21,685,073
A brief description of Lehi City’s debt issues (as of June 30, 2018) is included below. • 2018 Electric Revenue Bonds - $15,640,000 electric revenue bonds issued to construct a power generation
facility and electric utility building. Annual principal payments and semi-annual payments are due through June 2038. Interest is at coupon rates varying from 4.00% to 5.00%.
• 2014 Electric Refunding Bonds - Revenue refunding bonds that refunded the 2009 Electric Refunding & Revenue Bonds which were used to build two new electrical substations. Due serially through June 1, 2020 with interest at 0.8 percent to 2.2 percent.
• 2010 Drainage Revenue Bonds - $2,500,000 in drainage revenue bonds due serially through 2025 with interest rates ranging from 3.51 percent.
• Note Payable to Provo Reservoir Water Users Company - Payable in annual installments through 2035. Payments include interest at 4 percent and range from $34,813 to $33,439.
• Note Payable to Provo River Water Users Association - Payable in annual installments through 2035. Approximately 81 percent of the total obligation bears interest at 4 percent. The balance of the obligation will mirror a line of credit issued by a bank to the Provo River Water Users Association. The line of credit will have a variable interest rate which is estimated to average 4.5 percent.
• Compensated Absences - Some employees carry balances of sick leave and vacation leave greater than what they earn in a given year. The cost of compensating such balances are reported as long-term debt. Balances for compensated absences are capped at 160 hours for vacation leave and 240 hours for sick leave.
• Net Pension Liability - The difference between the total pension liability (present value of projected benefit payments to employees based on their past service) and the assets (mostly investments reported at fair value) set aside to pay current employees, retirees, and beneficiaries.
Ninety two percent of the City’s long-term governmental debt relates to economic-incentive agreements. The repayment of this debt is solely dependent upon the economic performance of the developers. Total remaining governmental debt equals $747.08 per Lehi household. The remaining governmental debt was used for the construction of public safety and recreation facilities in the City. These bonds are not general obligations of this, but rather will be repaid from the City’s annual sales tax revenues.
Total enterprise fund debt represents $1,159.89 per utility rate customer. Enterprise fund debt will be repaid through user fees.
Outside of the Lehi Redevelopment Agency, Lehi’s annual governmental debt service is relatively low, representing just over 1% Lehi’s general fund budgeted expenditures. Debt service for enterprise equals 5% of budgeted operating expenditures.

BU
DG
ET
OV
ER
VIE
W
FY2019 ANNUAL BUDGET - 43
LONG-TERM FINANCIAL OUTLOOKWhen forecasting future revenues and expenditures, Lehi City uses trend analysis, national economic indicators, local economic indicators, and city-specific issues to help determine the most accurate financial forecasting as possible. Throughout this document, discussions of the City’s financial policies, past revenue and expenditure trends, and various economic indicators are presented. These include:
• City Revenue Policies: Page 37; • General Fund Balance Trend: Page 35; • Trends for Major General Fund Revenues: Pages 37-38; • Debt Policies and Debt Position: Pages 39-41; • Five-Year Capital Improvement Plan: Pages 50-54; and • Impact of Five-Year Capital Improvement Plan on Operating Budget: Page 55.
All of these factors impact the City’s long-term financial outlook. Following is a discussion of major factors that will also impact the City’s long-term financial outlook.
POPULATION GROWTHAccording to the U.S. Census Bureau, Lehi is the 5th fastest growing city in Utah County since the 2010 census. This population growth is expected to bring significant opportunities to the City. However, there will also be increased financial burdens on the City as there is more need for infrastructure construction and improvement and an increased demand for City services. The City monitors population growth trends and forecasts as it determines its infrastructure needs, particularly as it pertains to the five-year capital improvement plan, and fees for various City services.
0
20,000
40,000
60,000
80,000
100,000
120,000
2000 2005 2010 2015 2020 2030 2040
19,028
31,958
47,407
58,48667,812
82,589
103,610
LEHI CITY HISTORIC & PROJECTED POPULATION GROWTH
Sources: U.S. Census Bureau; Mountainland Association of Governments

BU
DG
ET
OV
ER
VIE
W
FY2019 ANNUAL BUDGET - 44
REVENUE TREND ANALYSISLehi City has a policy of conservativelyestimating revenues on an annual basisto avoid unexpected deficits. As can beseen in the chart on the right showingthe percent change for the four majorrevenue sources for the General Fund,the major General Fund revenue sourcesare each unique with regards to financialforecasting. Property tax, sales tax, andfranchise tax revenues are relatively stablefunding sources. However, they tend tolag a bit behind macro-economic trendsin terms of the effect felt by the City. Thiswas true during the financial crisis of 2008and 2009.
Building permits, which are an important indicator of the local growth and the local economy’s reaction to national economic factors, are much more volatile than the City’s other primary General Fund revenue sources. However, building permit revenues tend to predicate an increase or decrease in property tax, sales tax, and franchise tax revenues. The City uses these trends, combined with other factors such as national economic indicators, state economic indicators, and local indicators such as development specific to the City to estimate future revenue. Below is a three-year revenue forecast for the major General Fund revenue sources based on these factors and past revenue trends.
THREE-YEAR GENERAL FUND FORECASTFY 2016ACTUAL
FY 2017ACTUAL
FY 2018ESTIMATED
FY 2019APPROVED
FY 2020FORECAST
FY2021FORECAST
PROPERTY TAX REVENUE $ 8,007,053 $ 8,850,629 $ 8,600,000 $ 9,000,000 $ 9,450,000 $ 9,922,500
SALES TAXREVENUE 8,707,741 10,114,232 10,900,000 11,120,000 11,676,000 12,259,800
FRANCHISE TAXREVENUE 4,131,334 3,781,066 4,000,000 4,000,000 4,140,000 4,284,900
BUILDING PERMIT REVENUE
2,137,871 2,225,329 2,500,000 2,500,000 2,537,500 2,575,563
-40%
-20%
0%
20%
40%
60%
80%
100%
Property TaxSales TaxFranchise TaxBuilding Permits
MAJOR GENERAL FUND REVENUE TRENDS
FY 2010 FY 2011 FY 2012 FY 2013 FY 2014 FY 2015 FY 2016 FY 2019 (est.)
FY 2018(est.)
FY 2017

CAPITAL EXPENDITURES

CA
PIT
AL
EX
PE
ND
ITU
RE
S S
UM
MA
RY
FY2019 ANNUAL BUDGET - 46
CAPITAL EXPENDITURESThe FY 2019 budget includes just over $65.70 million for all capital improvement expenditures. To allow a more accurate picture of how the coming fiscal year’s Capital Budget might impact the operating budget, the capital expenditures are summarized into two categories: routine capital expenditures and non-routine capital expenditures.
• ROUTINE CAPITAL EXPENDITURES are expenditures that occur on a regular basis and have no significantimpact on the operating budget. The capital expenditures classified into the capital replacement budget areconsidered routine. Examples include the regular replacement of vehicles and equipment and the regularup-sizing of pipes, streets, and power systems. The cost of these capital expenditures are captured as lineitems in the budget information portion of each department’s section throughout this book, totaling a littleover $7.10 million.
• NON-ROUTINE CAPITAL EXPENDITURES are expenditures that do not happen on a regular basis and impactthe operating budget either in terms of additional personnel, maintenance, utility, or other costs; or in termsof additional revenue or operating savings. Although the expenditures of these projects may span over a fewyears, the projects add to the asset base of the City and often result from policy decisions. Capital projectsdefined as non-routine total just under $58.60 million. A summary schedule of the non-routine capital budgetcan be found later in this section of the budget document.
CAPITAL POLICIES • Lehi City’s Capital Budget shall be revised each year, including anticipated fund sources. • When Capital Budget appropriations lapse at the end of the fiscal year they shall be re-budgeted until the
project is complete. • Inventories in the proprietary funds, which shall consist of materials used in the construction and repair of the
transmission, distribution, collection, and treatment systems shall be valued at the lower cost or market on aweighted average basis. Supplied inventories, consisting principally of office supplies, shall be valued at thelower of cost or market on a first-in, first-out basis. Transformers shall be valued at the lower of cost or marketon a specific identification basis.
• Capital expenditures shall be defined as assets purchased or acquired with the capitalization thresholdsdefined in the table below.
ASSET CATEGORY CAPITALIZATION THRESHOLD
USEFUL LIFE (IN YEARS)
Land $ 0 N/ABuildings $ 5,000 10-50Improvements of than buildings, including infrastructure $ 5,000 10-50Machinery, equipment, and vehicles $ 5,000 5-15Office furniture and equipment $ 5,000 5-15
CAPITAL PLANNING PROCESSOften, the justification for capital improvement projects are derived during master planning efforts done in conjunction with third-party entities. The City Council reviews and approves all of the City’s master plans. The following two pages contain a summary of the planning processes that influence the Capital Budget, and the general time line associated with the finalizing of the 5-Year Capital Budget itself.

CA
PIT
AL
EX
PE
ND
ITU
RE
S S
UM
MA
RY
FY2019 ANNUAL BUDGET - 47
CITY PLANS - FY 2019PLAN ORIGIN OF PLAN ELEMENTS OF PLAN
Mayor and City Council Strategic Visioning
The Mayor & City Council annually hold a planning session. See pages 25-28 for more information.
The strategic vision and planning done by the Mayor and City Council set the priorities for the City budget. The planning sessions includes input from the annual citizen survey, staff recommendations, and the planning documents listed below.
Budget 5-Year Capital Improvement Plan
See pages 50-54 for more information.
As part of the annual budget process, and with input from all other planning processes, a 5-year capital improvement plan is incorporated into the budget document. Potential funding sources are also discussed and estimated at this time.
General Plan
The Land Use Element Plan was updated & adopted in October 2011. It will be updated again beginning in July 2018.
The General Plan provides a general framework of goals and guidelines for a number of the City’s master plans, including:Economic Development; Parks and Recreational Facilities; Transportation; and Community Facilities and Services.
Economic Development Strategic Plan
Originally adopted in September 2008. This plan will be updated in FY 2019.
The plan identifies key economic development areas throughout the City in order to project where and what types of future infrastructure improvements will be necessary to meet the associated new growth. Thus, this plan has an indirect effect on the capital budgeting process.
Downtown Revitalization Plan
Originally adopted in 2007, the Downtown Revitalization Plan will be updated in FY 2019.
The plan played a major part in the Main Street reconstruction project. The City’s downtown is identified as the Main Street & State Street corridors. The stated goals of this plan are to:Guide development or redevelopment for the City’s downtown area; remove blight and revitalize the downtown businesses; andPromote community spirit by maintaining historic feel and providing a community gathering place.
Parks Master Plan
Original plan adopted in 1998. Significantly updated in 2009. Second update completed in 2015. Will again be updated in FY 2020.
The main priorities is the 5, 10, and 20-year plans include:Focus short-term development of new parks in the northeast area of the City, primarily through a “mini” park system;Update, remodel, and refurbish current parks in the central area; and acquire land for community-wide parks in the west and north areas.
Pavement & Sidewalks Management Plan
Public Works Administration & Streets Division maintain & perpetually update a pavement management database.
The policy of the plan is to: • Maintain at least 65 percent of roads & sidewalks in good or
better condition; and • Have no more than 10 percent of roads and sidewalks in
substandard condition.

CA
PIT
AL
EX
PE
ND
ITU
RE
S S
UM
MA
RY
FY2019 ANNUAL BUDGET - 48
CITY PLANS - FY 2019 (CONT.)PLAN ORIGIN OF PLAN ELEMENTS OF PLAN
Information Technology Capital Plan
Generated by the IT Division.
The plan includes the next four fiscal years of planned replacements. The IT Division calculates a charge to City departments sufficient to replace the main network, core software systems, computer systems, and the telephone system. Data used in the calculation include: an inventory of all equipment; the estimated useful life & projected replacement date; and the replacement cost.
City Facilities Capital Plan
Generated by the Buildings & Grounds Division. Funding is included by departmental budgets under Building & Grounds O&M.
The plan calculates: • An inventory of all major systems in City buildings; • The estimated useful life or maintenance schedule; and • The related costs.
Fleet Replacement Plan
The Public Works Administration & Fleet Division maintain & perpetually update a fleet & equipment database.
The plan calculates a charge to City departments sufficient to replace the vehicles & motorized & mobile equipment. Data used in the calculation include:An analysis of all equipment;The estimated useful life & projected replacement date;A maintenance schedule & costs; andThe replacement cost.
Master Plans & Impact Fee Analysis for Culinary Water, Pressurized Irrigation, Drainage, Electric, Sewer, Parks, & Transportation.
Significant updates to master plans & impact fee analyses completed in FY 2018.
Capital projects associated with these types of projects were identified in the City’s Impact Fee Study completed in January 2008 & the 5-year Capital Improvement Plan (updated annually as noted above). Monies were set aside in FY 2012 for the creation and significant update of these master plans. These master plans will:
• Recommend & prioritize short-, medium-, and long-term projects;
• Project & analyze growth & build-out data; and • Provide impact fee rate recommendations for funding.

CA
PIT
AL
EX
PE
ND
ITU
RE
S S
UM
MA
RY
FY2019 ANNUAL BUDGET - 49
5-YEAR CAPITAL IMPROVEMENT PLAN TIME LINE
1. In the fall and spring of each year, the progress on all authorized capital projects is monitored on a project-by-project basis. Project financial records are reviewed with the department heads tasked with overseeing the given project. Projects approved by the City Council, but not previously included in the Capital Improvement Plan, are reviewed at the same time.
2. In the winter of each year, department heads review previously-submitted projects to determine if the need, time frame, or project scope have changed. If changes are needed, the Finance Department is notified and the Requested Capital Improvement and Capital Projects Summary are updated. The department heads also submit new capital projects for consideration in both the next fiscal year and future years.
3. Also in the winter of each year, the City’s capital needs are identified before preparation begins on the operating budget. First year operating expenses are formulated and refined through discussions with the department most closely impacted by the project. Future years’ operating costs are established after the projects in operation and the estimated expenses can be refined.
4. In May of each year, the requested Capital Improvement and Capital Projects list is reviewed, and the most critical projects are recommended to the City Council as part of the City’s recommended budget. This is done at the same time the recommended operating budget is presented. Alternate mechanisms for financing the projects are also discussed at this time.
5. In the budget document, the Non-Routine Capital Budget Summary lists all FY 2019 projects that have been approved.

CA
PIT
AL
EX
PE
ND
ITU
RE
S S
UM
MA
RY
FY2019 ANNUAL BUDGET - 50
NON-ROUTINE CAPITAL BUDGET SUMMARYPROJECT TITLE DEPT/
DIVISIONFUNDING SOURCE FY 2018* FY 2019 FY 2020 FY 2021 FY 2022 FY 2023 TOTAL
New Shed @ Vets Park Parks
CapitalProjects Fund
- 20,000 - - - - 20,000
Shadow Ridge ParksParkImpact Fees
51,720 1,100,000 - - - - 1,151,720
Monument Park ParksParkImpact Fees
126,573 1,290,000 - - - - 1,416,573
Storage Building @ Ivory Ridge Park
ParksParkImpact Fees
- 46,000 - - - - 46,000
Expansion of Material Holding Area
ParksParkImpact Fees
- 20,700 - - - - 20,700
Mountain Bike Trails Parks
Park Impact Fees
1,316 130,000 - - - - 131,316
New Police Building Design Police
Police Impact Fees
142,428 1,080,710 - - - - 1,223,138
Land Purchase PolicePolice Impact Fees
535,245 300,000 - - - - 835,245
New Police Building Police
Police Impact Fees
- - 16,776,862 - - - 16,776,862
Spring Line Replacement Water
Culinary Water Fund
- 300,000 - - - - 300,000
Springs Rehabilitation
WaterCulinary Water Fund
- 270,000 - - - - 270,000
600 E Tank EngineeringCulinary Impact Fees
- 1,200,000 - - - - 1,200,000
Traverse Source EngineeringCulinary Impact Fees
483 1,800,000 - - - - 1,800,483
West Side Facilities Engineering
Culinary Impact Fees
519,151 800,000 - - - - 1,319,151
Sandpit Tank/Pump Engineering
Culinary Impact Fees
- 2,000,000 - - - - 2,000,000
South East Interties Engineering Millpond
RDA - 250,000 - - - - 250,000
Thanksgiving Point Booster Pumps
EngineeringCulinary Impact Fees
- - 250,000 - - - 250,000
CWP Booster Pumps Engineering
Culinary Impact Fees
- - 240,000 - - - 240,000
900 North &600 East Lines Engineering
Culinary Impact Fees
- - - - 1,800,000 - 1,800,000
*Funding reported as of August 20, 2018

CA
PIT
AL
EX
PE
ND
ITU
RE
S S
UM
MA
RY
FY2019 ANNUAL BUDGET - 51
PROJECT TITLE DEPT/DIVISION
FUNDING SOURCE FY 2018* FY 2019 FY 2020 FY 2021 FY 2022 FY 2023 TOTAL
Jordan Willow Pump Station Add
EngineeringSewer Impact Fees
7,720 250,000 - - - - 257,720
Allred River Crossing Engineering
Sewer Impact Fees
- 210,000 - - - - 210,000
1700 West Sewer Engineering
Sewer Impact Fees
- - - - - 2,800,000 2,800,000
West Side Drains Engineering
Storm DrainImpact Fees
- 600,000 200,000 200,000 200,000 200,000 1,400,000
Jordan River Drain Engineering UDOT - 80,000 - - - - 80,000
Traverse Mountain Drains
Engineering
Storm Drain Impact Fees
264,354 50,000 50,000 50,000 50,000 50,000 514,354
Cedar Hollow Detention Basin Engineering Payment
In Lieu - - - - - 320,000 320,000
Lambert Detention Basin Engineering Payment
In Lieu - - - - 300,000 - 300,000
Jordan Narrows Second Basin Engineering Payment
In Lieu - 100,000 - - - - 100,000
Utah Highland Basin Engineering Payment
In Lieu - - - - - 280,000 280,000
West Side Detention Facilities
Engineering Payment In Lieu - 250,000 - - - - 250,000
400 WestDetention Basin Engineering Payment
In Lieu - - 330,000 - - - 330,000
North Lake Repairs PI Water PI Water
Fund - 30,000 - - - - 30,000
Brooks Reservoir Rehab PI Water PI Water
Fund - 150,000 - - - - 150,000
Low Hills Expansion & Piping
Pressurized Irrigation
P.I. Impact Fees
19,798 370,000 - - - - 389,798
Traverse Booster w/Piping
EngineeringP.I.Impact Fees
99,097 380,000 - - - - 479,097
Dry Creek Reservoir & Piping
Engineering P.I. Impact Fees - 10,000,000 - - - - 10,000,000
Railroad Well & Piping Engineering
P.I.Impact Fees
6,476 80,000 - - - - 86,476
West Side P.I. Facilities Engineering
P.I.Impact Fees
137,020 1,300,000 - - - - 1,437,020
Jordan River Pump Station & Piping
EngineeringP.I. Impact Fees
8,991 380,000 - - - - 388,991
*Funding reported as of August 20, 2018

CA
PIT
AL
EX
PE
ND
ITU
RE
S S
UM
MA
RY
FY2019 ANNUAL BUDGET - 52
PROJECT TITLE DEPT/DIVISION
FUNDING SOURCE FY 2018* FY 2019 FY 2020 FY 2021 FY 2022 FY 2023 TOTAL
Jordan River Reservoir Engineering
P.I. Impact Fees
5,868 25,000 - - - - 30,868
Jordan River Well Engineering
P.I. Impact Fees
- 230,000 - - - - 230,000
Allred Well & Booster Pump Engineering
P.I. Impact Fees
- 200,000 - - - - 200,000
Vialetto Storage EngineeringP.I. Impact Fees
- - 800,000 - - - 800,000
Vialetto Pumps EngineeringP.I. Impact Fees
- - 100,000 - - - 100,000
Cedar Hollow Reservoir & Pump
EngineeringP.I. Impact Fees
- - - - 500,000 - 500,000
Cedar HollowWell Engineering
P.I. Impact Fees
- - - - - 250,000 250,000
Pilgram Well Upgrade Engineering
P.I. Impact Fees
- - - - - 115,000 115,000
West Side PI Reservoir Engineering
P.I. Impact Fees
- 1,600,000 - - - - 1,600,000
Center Street & SR 92 Engineering
Road Impact Fees
2,052 2,200,000 - - - - 2,202,052
SE Industrial By-Pass Road Engineering Millpond
RDA 232,328 20,000 - - - - 252,328
Ashton Blvd Relocation Engineering UDOT - 2,320,000 - - - - 2,320,000
1200 East Project Engineering RDA - - - - - 1,700,000 1,700,000
Main Street 2300 W to Crossroads
Engineering MAG 149,034 12,000,000 - - - - 12,149,034
1200 West Engineering MAG 1,729,638 6,045,000 - - - - 7,774,638
1200 West EngineeringRoad Impact Fees
- 455,000 - - - - 455,000
I15/SE Frontage Relocation Engineering
Road Impact Fees
- 200,000 - - - - 200,000
Triumph Boulevard TRAX to Frontage Road
EngineeringRoad impact Fees
45,916 400,000 - - - - 445,916
*Funding reported as of August 20, 2018
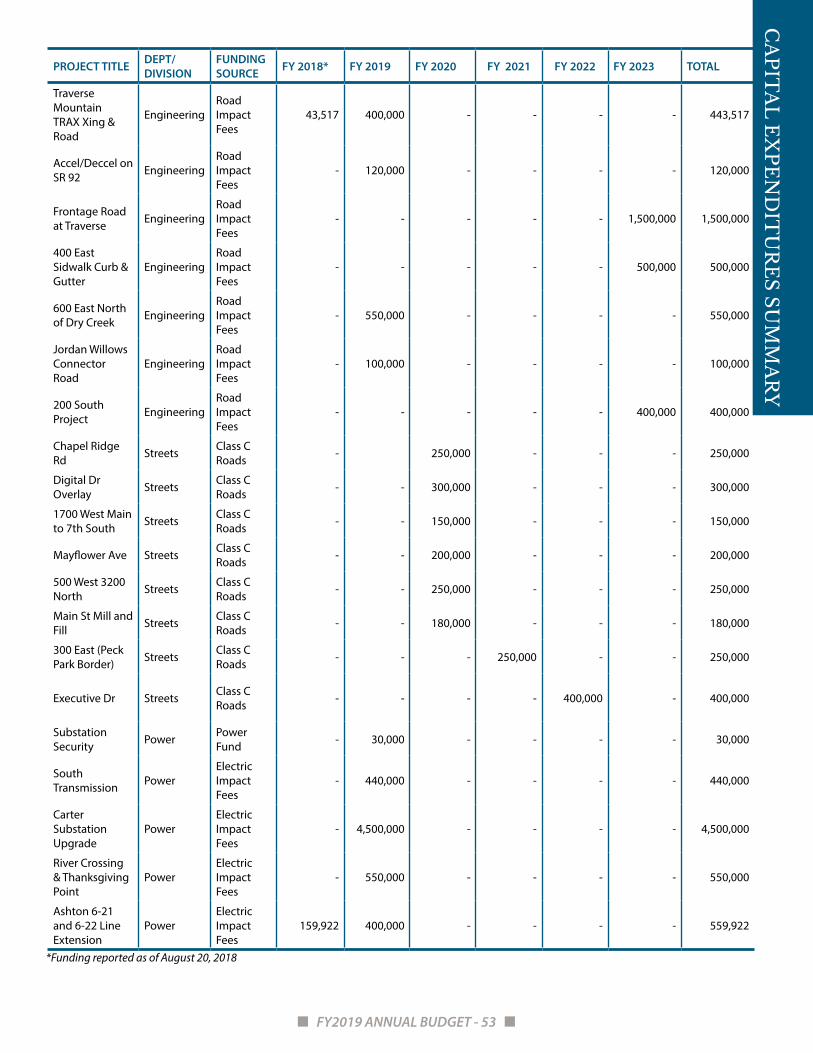
CA
PIT
AL
EX
PE
ND
ITU
RE
S S
UM
MA
RY
FY2019 ANNUAL BUDGET - 53
PROJECT TITLE DEPT/DIVISION
FUNDING SOURCE FY 2018* FY 2019 FY 2020 FY 2021 FY 2022 FY 2023 TOTAL
Traverse Mountain TRAX Xing & Road
EngineeringRoadImpact Fees
43,517 400,000 - - - - 443,517
Accel/Deccel on SR 92 Engineering
RoadImpact Fees
- 120,000 - - - - 120,000
Frontage Road at Traverse Engineering
RoadImpact Fees
- - - - - 1,500,000 1,500,000
400 East Sidwalk Curb & Gutter
EngineeringRoad Impact Fees
- - - - - 500,000 500,000
600 East North of Dry Creek Engineering
Road Impact Fees
- 550,000 - - - - 550,000
Jordan Willows Connector Road
EngineeringRoadImpact Fees
- 100,000 - - - - 100,000
200 South Project Engineering
Road Impact Fees
- - - - - 400,000 400,000
Chapel Ridge Rd Streets Class C
Roads - 250,000 - - - 250,000
Digital Dr Overlay Streets Class C
Roads - - 300,000 - - - 300,000
1700 West Main to 7th South Streets Class C
Roads - - 150,000 - - - 150,000
Mayflower Ave Streets Class C Roads - - 200,000 - - - 200,000
500 West 3200 North Streets Class C
Roads - - 250,000 - - - 250,000
Main St Mill and Fill Streets Class C
Roads - - 180,000 - - - 180,000
300 East (Peck Park Border) Streets Class C
Roads - - - 250,000 - - 250,000
Executive Dr Streets Class C Roads - - - - 400,000 - 400,000
Substation Security Power Power
Fund - 30,000 - - - - 30,000
South Transmission Power
Electric Impact Fees
- 440,000 - - - - 440,000
Carter Substation Upgrade
PowerElectric Impact Fees
- 4,500,000 - - - - 4,500,000
River Crossing & Thanksgiving Point
PowerElectric Impact Fees
- 550,000 - - - - 550,000
Ashton 6-21 and 6-22 Line Extension
PowerElectricImpact Fees
159,922 400,000 - - - - 559,922
*Funding reported as of August 20, 2018

CA
PIT
AL
EX
PE
ND
ITU
RE
S S
UM
MA
RY
FY2019 ANNUAL BUDGET - 54
PROJECT TITLE DEPT/DIVISION
FUNDING SOURCE FY 2018* FY 2019 FY 2020 FY 2021 FY 2022 FY 2023 TOTAL
2300 West Overhead Power
ElectricImpact Fees
- 50,000 - - - - 50,000
Milpond Upgrades Power
ElectricImpact Fees
- 530,000 - - - - 530,000
1300 East Tie PowerElectricImpact Fees
- 400,000 - - - - 400,000
Power Generators Power
Electric Impact Fees
- - 2,672,137 2,726,670 2,782,316 - 8,181,123
TOTAL CAPITAL SPENDING $ 4,288,647 $58,602,410 $ 22,748,999 $ 3,226,670 $ 6,032,316 $ 8,115,000 $ 103,014,042
SUMMARY OF CAPITAL SPENDING IMPACT BY FUNDFUND FY 2018* FY 2019 FY 2020 FY 2021 FY 2022 FY 2023 TOTAL
Capital Projects $ - $ 20,000 $ - $ - $ - $ - $ 20,000
Fire Impact Fee - - - - - - -
Parks Impact Fee 179,609 2,586,700 - - - - 2,766,309
Police Impact Fee 677,673 1,380,710 16,776,862 - - - 18,835,245
Culinary Water - 570,000 - - - - 570,000
Culinary Impact Fee 519,634 5,800,000 490,000 - 1,800,000 - 8,609,634
Sewer Impact Fee 7,720 460,000 - - - 2,800,000 3,267,720
Storm Drain Impact Fee 264,354 650,000 250,000 250,000 250,000 250,000 1,914,354
Payment In Lieu - 350,000 330,000 - 300,000 600,000 1,580,000
Pressurized Irrigation - 180,000 - - - - 180,000
P.I. Impact Fee 277,250 14,565,000 900,000 - 500,000 365,000 16,607,250
UDOT - 2,400,000 - - - - 2,400,000
RDA Funds 232,328 270,000 - - - 1,700,000 2,202,328
MAG 1,878,672 18,045,000 - - - - 19,923,672
Roads Impact Fee 91,485 4,425,000 - - - 2,400,000 6,916,485
Class C Roads - - 1,330,000 250,000 400,000 - 1,980,000
Electric Impact Fee 159,922 6,870,000 2,672,137 2,726,670 2,782,316 - 15,211,045
Power Fund - 30,000 - - - - 30,000
TOTAL $ 4,288,647 $ 58,602,410 $ 22,748,999 $ 3,226,670 $ 6,032,316 $ 8,115,000 $ 103,014,042
*Funding reported as of August 20, 2018
*Funding reported as of August 20, 2018
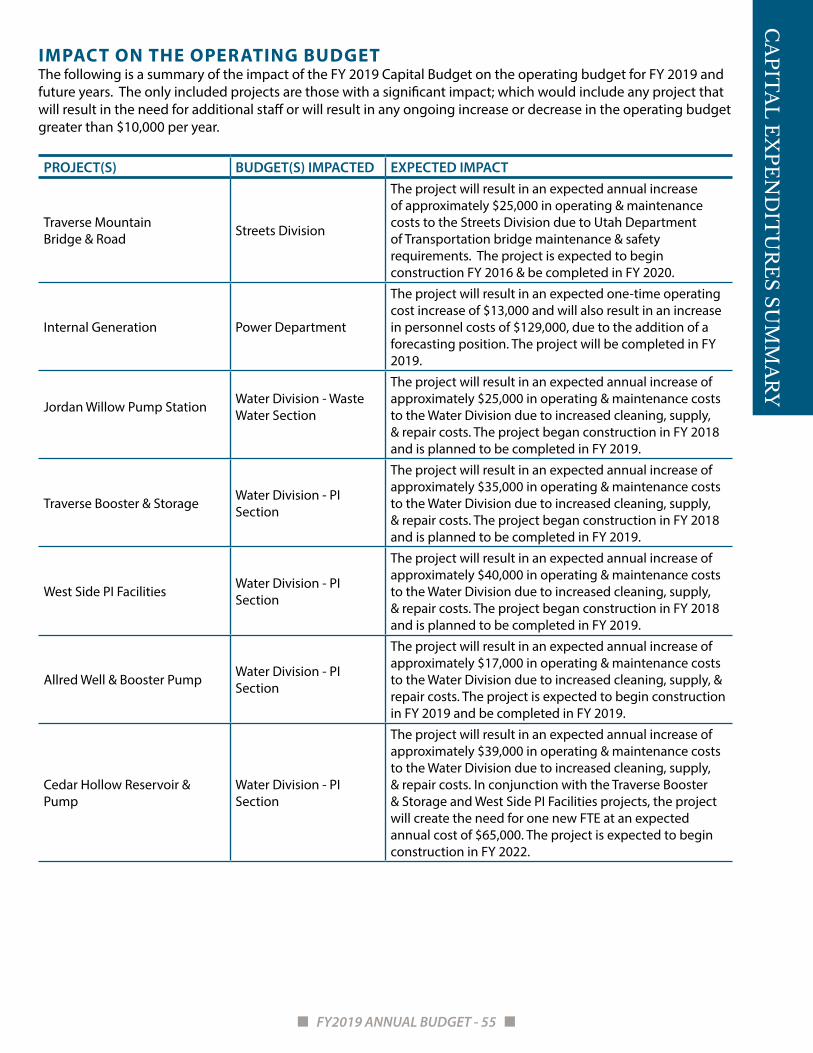
CA
PIT
AL
EX
PE
ND
ITU
RE
S S
UM
MA
RY
FY2019 ANNUAL BUDGET - 55
IMPACT ON THE OPERATING BUDGETThe following is a summary of the impact of the FY 2019 Capital Budget on the operating budget for FY 2019 and future years. The only included projects are those with a significant impact; which would include any project that will result in the need for additional staff or will result in any ongoing increase or decrease in the operating budget greater than $10,000 per year.
PROJECT(S) BUDGET(S) IMPACTED EXPECTED IMPACT
Traverse Mountain Bridge & Road Streets Division
The project will result in an expected annual increase of approximately $25,000 in operating & maintenance costs to the Streets Division due to Utah Department of Transportation bridge maintenance & safety requirements. The project is expected to begin construction FY 2016 & be completed in FY 2020.
Internal Generation Power Department
The project will result in an expected one-time operating cost increase of $13,000 and will also result in an increase in personnel costs of $129,000, due to the addition of a forecasting position. The project will be completed in FY 2019.
Jordan Willow Pump Station Water Division - Waste Water Section
The project will result in an expected annual increase of approximately $25,000 in operating & maintenance costs to the Water Division due to increased cleaning, supply, & repair costs. The project began construction in FY 2018 and is planned to be completed in FY 2019.
Traverse Booster & Storage Water Division - PI Section
The project will result in an expected annual increase of approximately $35,000 in operating & maintenance costs to the Water Division due to increased cleaning, supply, & repair costs. The project began construction in FY 2018 and is planned to be completed in FY 2019.
West Side PI Facilities Water Division - PI Section
The project will result in an expected annual increase of approximately $40,000 in operating & maintenance costs to the Water Division due to increased cleaning, supply, & repair costs. The project began construction in FY 2018 and is planned to be completed in FY 2019.
Allred Well & Booster Pump Water Division - PI Section
The project will result in an expected annual increase of approximately $17,000 in operating & maintenance costs to the Water Division due to increased cleaning, supply, & repair costs. The project is expected to begin construction in FY 2019 and be completed in FY 2019.
Cedar Hollow Reservoir & Pump
Water Division - PI Section
The project will result in an expected annual increase of approximately $39,000 in operating & maintenance costs to the Water Division due to increased cleaning, supply, & repair costs. In conjunction with the Traverse Booster & Storage and West Side PI Facilities projects, the project will create the need for one new FTE at an expected annual cost of $65,000. The project is expected to begin construction in FY 2022.

GENERALFUND

GE
NE
RA
L F
UN
D - D
EP
T. D
ET
AIL
FY2019 ANNUAL BUDGET - 57
MAYOR & CITY COUNCIL
THE MISSION OF THE MAYOR AND CITY COUNCIL IS TO ENHANCE THE HEALTH, SAFETY, AND WELFARE OF EACH PERSON WITHIN THE COMMUNITY (BOTH RESIDENT AND VISITOR). THIS IS ACCOMPLISHED BY DEVELOPING, REVIEWING, AND IMPLEMENTING ORDINANCES, RESOLUTIONS, AND POLICIES.
DEPARTMENT DESCRIPTIONThe Mayor and City Council are elected to office by the citizens of Lehi and serve four-year terms. The Mayor acts as the Chief Executive Officer of the City and is responsible for upholding and executing the laws and ordinances adopted by the City Council. The City Council is responsible for creating and modifying ordinances for the betterment of the community.
POSITION ACTUALFY 2015
ACTUALFY 2016
ACTUALFY 2017
ACTUALFY2018
PLANNED FY 2019
Elected:Mayor 1.00 1.00 1.00 1.00 1.00City Council 5.00 5.00 5.00 5.00 5.00
TOTAL FTE 6.00 6.00 6.00 6.00 6.00
Percent of General Fund Budget
1%
MAYOR
Mark Johnson
LEHI RESIDENTS
CITY COUNCIL
Paige AlbrechtChris CondiePaul HancockJohnny Revill
Mike Southwick

GE
NE
RA
L F
UN
D -
DE
PT
. DE
TA
IL
FY2019 ANNUAL BUDGET - 58
BUDGET INFORMATION
DEPARTMENT 47 ACTUALFY 2016
ACTUALFY 2017
ESTIMATEDFY 2018
PLANNEDFY 2019
Expenditures: 10 Salaries & Wages $ 94,500 $ 94,500 $ 94,500 $ 116,312 13 Employee Benefits 97,459 95,781 109,882 126,229 21 Books, Subscriptions, & Memberships 30,467 35,019 35,000 35,000 23 Travel & Training 4,134 5,118 6,000 15,000 24 Office Supplies 3,669 299 3,000 3,000 25 Reimbursements 313 350 5,000 5,000 26 IT Fund Charges 5,000 2,000 2,000 2,000 29 Risk Management Fund Charges 2,000 5,000 5,000 5,000 31 Professional & Technical 23,330 29,783 25,000 25,000 45 Miscellaneous 12,429 23,675 17,000 17,000TOTAL EXPENDITURES $ 273,301 $ 291,525 $ 302,382 $ 349,541

GE
NE
RA
L F
UN
D - D
EP
T. D
ET
AIL
FY2019 ANNUAL BUDGET - 59
OFFICE OF THE CITY ADMINISTRATOR
THE MISSION OF THE OFFICE OF THE CITY ADMINISTRATOR IS TO PROVIDE GENERAL OVERSIGHT AND DIRECTION FOR ALL CITY SERVICES AND OPERATIONS AND TO PROVIDE MANAGEMENT ASSISTANCE TO THE MAYOR AND CITY COUNCIL.
Create a more efficient organization through the use of improved technology and data-driven decisions.
DEPARTMENT DESCRIPTIONThe Office of the City Administrator is responsible for the management of community and employee relations throughout the organization. The department is organized into five divisions: Public Relations & Special Events, Special Projects, Human Resources, Information Technology, and Risk Management.
The Public Relations & Special events and Special Projects Divisions are responsible for public and community relations, management analysis, and special events.
The Human Resources Division is responsible for maintaining employee records, coordinating employee benefit and education programs, communicating personnel policies and procedures, and ensuring quality recruitment.
The Information Technology Department is responsible for managing the technology and network infrastructure, maintaining information system security, promoting technology education, and overseeing data disaster recovery planning.
Risk Management is designed to (1) assist City departments in the implementation of effective safety and other loss-prevention programs to protect the employees and assets of the City from injury, damage, or loss; (2) minimize loss or injury when incidents do occur; and (3) appropriately finance or insure the cost of claims, injuries, and losses. Risk Management is funded through an internal service fund.
Percent of General Fund Budget
5%

GE
NE
RA
L F
UN
D -
DE
PT
. DE
TA
IL
FY2019 ANNUAL BUDGET - 60
POSITION ACTUALFY 2015
ACTUALFY 2016
ACTUAL FY 2017
ACTUALFY 2018
PLANNEDFY 2019
Appointed:City Administrator 1.00 1.00 1.00 1.00 1.00
Full-time:Assistant City Administrator 1.00 1.00 1.00 1.00 1.00Assistant to the City Administrator 1.00 1.00 1.00 1.00 1.00Senior Management Analyst - - - 1.00 1.00Management Analyst 1.50 1.00 1.00 1.00 1.00Events Coordinator 0.50 1.00 1.00 1.00 1.00Intern - - 0.50 0.50 0.50Executive Assistant 1.00 1.00 1.00 1.00 1.00Human Resource Manager 1.00 1.00 1.00 1.00 1.00Human Resource Technician - 1.00 1.00 1.00 1.00Part-time Receptionist (2) 1.00 1.00 1.00 1.00 1.00Risk Manager 1.00 1.00 1.00 1.00 1.00Emergency Management Coordinator - - 0.50 0.50 0.50Passport Technician/Receptionist - - - 1.00 1.00
*IT Manager - - - - 1.00 *IT Technician II - - - - 1.00 *IT Technician I - - - - 2.00Part-time Non-benefited:
Lehi Area Chamber President 0.50 0.50 0.50 0.50 0.50TOTAL FTE 9.50 10.50 11.50 13.50 17.50
*IT was previously under Finance, but as of FY2019 will be under the Office of the City Administrator.
IT TECHNICIAN II
EXECUTIVE ASSISTANT
Teisha Wilson
ASSISTANT CITY ADMINISTRATOR
Cameron Boyle
HUMAN RESOURCES MANAGER
David Kitchen
ASSISTANT TO THE CITY ADMINSTRATOR
Beau Thomas
CITY ADMINISTRATOR
Jason Walker
HRTECHNICIAN
PART-TIME RECEPTIONISTS
SPECIAL EVENTS & PR
RISK MANAGEMENT
Scott Sampson
IT TECHNICIAN I
(2)
INFORMATIONTECHNOLOGY
Tyler Kelsey
MANAGMENT ANALYST
SPECIAL PROJECTS

GE
NE
RA
L F
UN
D - D
EP
T. D
ET
AIL
FY2019 ANNUAL BUDGET - 61
BUDGET INFORMATION
DEPARTMENT 44 ACTUALFY 2016
ACTUAL FY 2017
ESTIMATEDFY 2018
PLANNEDFY 2019
Expenditures: 10 Salaries & Wages $ 425,648 $ 519,282 $ 553,062 $ 585,194 13 Employee Benefits 184,364 210,720 294,899 271,568 21 Books, Subscriptions, & Memberships 3,960 5,459 6,500 6,500 22 Public Notices - - 1,000 1,000 23 Travel & Training 22,026 17,202 27,000 27,000 24 Office Supplies 10,568 14,420 21,700 21,700 25 Fleet Fund Charges 2,000 2,000 2,000 2,000 26 IT Fund Charges 8,000 8,000 8,000 8,000 27 Utilities 1,100 1,167 12,000 12,000 29 Risk Management Fund Charges 2,000 2,000 2,000 2,000 30 Electricity - Lehi City Power - - 10,000 10,000 31 Professional & Technical 45,943 63,609 119,000 119,000 45 Miscellaneous 6,496 11,554 6,900 6,900 62 Bond Fees - - - -TOTAL EXPENDITURES $ 712,105 $ 855,413 $ 1,064,060 $ 1,072,862
PUBLIC RELATIONS & SPECIAL PROJECTS
PERFORMANCE MEASURES
DEPARTMENT/DIVISION OBJECTIVE: Strive to make city information readily available so residents are informed regarding city news, announcements, special events, etc.
PERFORMANCE MEASURE QUICK VIEW
ACTUAL FY 2016
ACTUAL FY 2017
TARGETFY 2018
ACTUALFY 2018
TARGET FY 2019
Number of Facebook Page “Likes” 6,740 7,825 9,000 8,727 9,200
Number of Twitter Followers 2,633 2,956 3,300 3,271 3,500
Number of Instagram Followers 992 1,391 1,800 1,572 1,800
Email List Subscribers 2,161 2,404 2,600 2,324 2,500
Email Open Rate - 41% 60% 44% 48%
Implement Performance Management Software - - 25% 25% 100%
Implement Government 101 Video Course - - 100% 0% 50%
Average Views Per Facebook Live Video* - - - 1786 2,000Lehi City Chat Facebook Group Members* - - - 1941 3,000
*These are new measures that will be calculated from FY 2019 forward.

GE
NE
RA
L F
UN
D -
DE
PT
. DE
TA
IL
FY2019 ANNUAL BUDGET - 62
BUDGET INFORMATION - COMMUNITY EVENTS
DEPARTMENT 67 ACTUALFY 2016
ACTUALFY 2017
ESTIMATED FY 2018
PLANNED FY 2019
Expenditures: 34 Cultural Arts Council $ 76,000 $ 76,500 $ 78,000 $ 78,000 36 Boys State Contribution 1,500 750 800 800 37 Miss Lehi Pageant 26,741 26,309 22,000 22,000 38 Lehi Float 13,000 12,171 16,000 16,000 39 Lehi Parade & Events Committee 89,267 84,219 112,500 102,500 40 Youth Council 845 - 5,000 4,000 41 Family Week 3,329 979 5,000 5,000 44 Foam Day 13,414 9,293 18,000 18,000 45 Lehi Silver Band 2,500 3,587 2,500 2,500 47 Community Beautification 20,654 9,404 11,000 11,000 51 Brochures Published - - 3,000 3,000 54 Santa Parade 280 424 1,500 1,500 59 Special Projects 18,583 51,856 90,000 90,000
77 Teen Event - - - 2,500
78 National Night Out Event - - - 5,000
79 Outdoor Movies - - - 12,200
80 Archives Donation - 25,000 25,000 28,000 81 Fireworks Show 25,000 25,000 25,000 25,000 82 Parks & Trails Committee - - 1,700 1,700 83 Christmas in Lehi 218 200 1,000 1,000 84 Easter Egg Hunt 3,450 4,261 4,000 7,000 85 My Lehi Program 1,982 627 5,000 - 86 Miscellaneous Special Events 6,919 6,031 7,000 10,000 87 Just for Kids 20,000 20,000 20,000 20,000 88 Volunteer Celebration 406 1,226 4,000 4,000 89 Veteran’s Day Celebration 1,288 3,389 5,000 5,000TOTAL EXPENDITURES $ 325,376 $ 361,226 $ 482,700 $ 475,700

GE
NE
RA
L F
UN
D - D
EP
T. D
ET
AIL
FY2019 ANNUAL BUDGET - 63
FEES
DEPARTMENT 67 APPROVEDFY 2016
APPROVED FY 2017
APPROVED FY 2018
APPROVED FY 2019
Stage Rental - 1st Day $ 1,000 $ 1,000 $ 1,000 $ 1,000Each additional day 750 750 750 750Hourly transportation fee 190 190 190 190
S. Legacy Center Overflow Parking ReservationResident 100 100 100 100Non-Resident 125 125 125 125
Special Event Permit Base 20 20 20 20+ Police Service/officer (2 min)/hour 50 50 50 50+Fire & EMS/person/hour 50 50 50 50+Ambulance or brush truck/event 100 100 100 100+Engine or tower/event 200 200 200 200+Streets Service/hour 25 25 25 25+Parks Service/hour 25 25 25 25
RISK MANAGEMENT
PERFORMANCE MEASURESDEPARTMENT/DIVISION OBJECTIVE: Reduce as much as possible the risk to city personnel, equipment, buildings, & other assets.
PERFORMANCE MEASURE QUICK VIEW
ACTUAL FY 2016
ACTUAL FY 2017
TARGET FY 2018
ACTUALFY 2018
TARGET FY 2019
Days missed due to accident or injury. 7 0 <5 0 2
Days reassigned to light duty work due to accident or injury. 14 3 <10 0 2
Number of risk management trainings conducted. 18 27 30 25 20
See page 184 for detailed budget information regarding the Risk Management Fund.
INFORMATION TECHNOLOGY
PERFORMANCE MEASURESDEPARTMENT/DIVISION OBJECTIVE: Reduce as much as possible the risk to city personnel, equipment, buildings, & other assets.
PERFORMANCE MEASURE QUICK VIEW
ACTUAL FY 2016
ACTUAL FY 2017
TARGET FY 2018
ACTUALFY 2018
TARGET FY 2019
Days missed due to accident or injury. 7 0 <5 0 2
Days reassigned to light duty work due to 14 3 <10 0 2
Number of risk management trainings 18 27 30 25 20
See page 182 for detailed budget information regarding the Information Technology Fund.

GE
NE
RA
L F
UN
D -
DE
PT
. DE
TA
IL
FY2019 ANNUAL BUDGET - 64
HUMAN RESOURCES
PERFORMANCE MEASURESDEPARTMENT/DIVISION OBJECTIVE: Assist the city administrator in keeping the cost of employment at a reasonable level.
PERFORMANCE MEASURE QUICK VIEW
ACTUAL FY 2016
ACTUAL FY 2017
TARGET FY 2018
ACTUALFY 2018
TARGET FY 2019
Benefits Expense per FTE $21,852 $20,977 $22,997 $19,695 $25,494
Healthcare Expense per FTE $8,416 $8,393 $10,908 $8,468 $11,905
Average Merit Increase per FTE 2.8% 2.89% 2.75% 2.88% 2.80%
DEPARTMENT/DIVISION OBJECTIVE: Keep the employee turnover rate low and employee satisfaction high.
PERFORMANCE MEASURE QUICK VIEW
ACTUAL FY 2016
ACTUAL FY 2017
TARGET FY 2018
ACTUALFY 2018
TARGET FY 2019
Full-time Employee Turnover Rate 6.5% 8% 8% 9.06% 8.0%
Part-Time Employee Turnover Rate 53.7% 80% 60% 80.45% 60.0%
BUDGET INFORMATION
DEPARTMENT 41 ACTUALFY 2016
ACTUALFY 2017
ESTIMATEDFY 2018
PLANNED FY 2019
Expenditures: 10 Salaries & Wages $ 123,506 $ 123,035 $ 157,109 $ 160,647 13 Employee Benefits 53,315 59,061 76,789 79,239 21 Books, Subscriptions, & Memberships 380 630 1,500 1,500 23 Travel & Training 643 1,454 3,000 3,000 24 Office Supplies 1,261 1,144 2,750 2,750 26 IT Fund Charges 14,000 14,000 14,000 14,000 27 Utilities - - 750 750 28 Equipment Maintenance - - 800 800 29 Risk Management Fund Charges - 1,000 1,000 1,000 31 Professional & Technical 40,517 14,053 15,000 15,000 45 Miscellaneous 1,586 248 1,000 1,000TOTAL EXPENDITURES $ 235,208 $ 214,625 $ 273,698 $ 279,686

GE
NE
RA
L F
UN
D - D
EP
T. D
ET
AIL
FY2019 ANNUAL BUDGET - 65
COMMUNITY DEVELOPMENT
THE COMMUNITY DEVELOPMENT DEPARTMENT GUIDES AND DIRECTS THE DEVELOPMENT OF LAND TO ACHIEVE A BALANCE BETWEEN THE DESIRES OF THE INDIVIDUAL PROPERTY OWNER, THE WELFARE OF THE RESIDENTS OF LEHI, AND THE NEEDS OF THE COMMUNITY.
Update the Land Use Element of the General Plan.
DEPARTMENT DESCRIPTIONThe Community Development Department consists of two separate divisions: Planning and Development Services.
The Planning Division works closely with the Planning Commission and City Council to ensure that the City’s general plan, development code, and design standards are adopted and followed in all developmental issues. The department is also responsible for coordinating the efforts of developers with the duties of the city engineer, public works director, and utility departments.
The Development Services Division inspects newly-constructed buildings to ensure code compliance, inspects existing buildings to ensure safety requirements are met, and reviews plans for additions to new and existing buildings.
5%
Percent of General Fund Budget

GE
NE
RA
L F
UN
D -
DE
PT
. DE
TA
IL
FY2019 ANNUAL BUDGET - 66
POSITION ACTUALFY 2015
ACTUALFY 2016
ACTUALFY 2017
ACTUALFY 2018
PLANNED FY 2019
Full-Time:Community Development Director 1.00 1.00 1.00 1.00 1.00Planner III 1.00 1.00 1.00 1.00 1.00Planner II 1.00 2.00 1.00 1.00 2.00Planner I 2.00 1.00 1.00 1.00 -Administrative Assistant 1.00 1.00 1.00 1.00 1.00Planning Intern (2) - - - - 1.00Chief Building Official - 1.00 1.00 1.00 1.00Assistant Building Official 1.00 - - - -Plans Examiner 1.00 1.00 1.00 1.00 1.00Lead Building Inspector 1.00 1.00 1.00 1.00 1.00Building Inspector I - - - - 1.00Building Inspector II 4.00 3.00 3.00 3.00 1.00Building Inspector III - - - - 3.00Permit Technician 2.00 2.00 2.00 2.00 2.00
TOTAL FTE 15.00 14.00 13.00 13.00 16.00
Building Inspector III (3)
Plans Examiner
Lead Building Inspector
Planner I
Planner III
ADMINISTRATIVE ASSISTANT
Permit Technician (2)
PLANNING CHIEF BUILDING
OFFICIAL
Gary Smith
COMM. DEVELOPMENT DIRECTOR
Kim Struthers
Planner II
Building Inspector II
Building Inspector I
Intern (2)

GE
NE
RA
L F
UN
D - D
EP
T. D
ET
AIL
FY2019 ANNUAL BUDGET - 67
PLANNING
PERFORMANCE MEASURESDEPARTMENT/DIVISION OBJECTIVE: Efficiently & effectively serve the development needs of the city.
PERFORMANCE MEASURE QUICK VIEW
ACTUAL FY 2016
ACTUAL FY 2017
TARGET FY 2018
ACTUAL FY 2018
TARGET FY 2019
Planning Commission & City Council reports prepared per FTE. 73.5 47.2 50 73.4 70
Total single-family lots recorded per FTE. 46.2 95.8 80 107 100Total multi-family residential units recorded per FTE. 6 47.2 50 31.4 50
DEPARTMENT/DIVISION OBJECTIVE: Implement the city’s development plans.
PERFORMANCE MEASURE QUICK VIEW
ACTUAL FY 2016
ACTUAL FY 2017
TARGET FY 2018
ACTUAL FY 2018
TARGET FY 2019
General Plan Implemented 30% 30% 35% 35% 45%
DEPARTMENT/DIVISION OBJECTIVE: Encourage ongoing training among planning staff.
PERFORMANCE MEASURE QUICK VIEW
ACTUAL FY 2016
ACTUAL FY 2017
TARGET FY 2018
ACTUAL FY 2018
TARGET FY 2019
Training Hours per FTE 26.6 13 20 25.8 20
Photo Credit: Ethan Michaelis

GE
NE
RA
L F
UN
D -
DE
PT
. DE
TA
IL
FY2019 ANNUAL BUDGET - 68
BUDGET INFORMATION
DEPARTMENT 56 ACTUALFY 2016
ACTUALFY 2017
ESTIMATEDFY 2018
PLANNEDFY 2019
Expenditures: 10 Salaries & Wages $ 436,095 $ 366,758 $ 412,736 $ 424,194 13 Employee Benefits 190,040 172,180 186,228 188,624 21 Books, Subscriptions, & Memberships 1,846 1,673 3,000 3,000 22 Public Notices 5,015 4,748 9,000 9,000 23 Travel & Training 6,154 5,572 12,000 12,000 24 Office Supplies 7,951 6,241 12,500 15,250 25 Fleet Fund Charges 4,000 4,000 4,000 4,000 26 Buildings & Grounds O & M 492 500 500 - 27 Utilities 2,309 15,859 3,000 3,000 28 Equipment Maintenance 2,740 3,060 4,295 4,295 31 Professional & Technical 21,804 34,568 32,320 112,320 32 IT Fund Charges 14,000 14,550 14,000 14,000 33 Risk Management Fund Charges 4,000 4,000 4,000 4,000 34 Recording Fees 3,793 3,052 3,500 3,500 35 Standards Update 333 - 1,000 1,000 46 Miscellaneous 2,732 2,426 2,500 2,500 54-000 Capital Outlay 2,560 - 72,000 10,105TOTAL EXPENDITURES $ 705,864 $ 639,187 $ 776,579 $ 810,788

GE
NE
RA
L F
UN
D - D
EP
T. D
ET
AIL
FY2019 ANNUAL BUDGET - 69
FEES
DEPARTMENT 56 APPROVEDFY 2016
APPROVED FY 2017
APPROVED FY 2018
APPROVED FY 2019
Annexation base $ 200 $ 200 $ 200 $ 200 + / Acre <50 acres 20 20 20 20 + / Acre >50 acres 5 5 5 5Area plan base 3,000 3,000 3,000 3,000 + / Acre 10 10 10 10Area plan amendment Minor (affecting 3 pages or less) 400 400 400 400 Intermediate (affecting 4 pages or more) 1,000 1,000 1,000 1,000 Major (addition of new property) base 1,500 1,500 1,500 1,500 + / Acre 10 10 10 10Amendments to: General plan 400 400 400 400 Zone district maps 400 400 400 400 Development code 400 400 400 400Concept PC base 500 500 500 500 + / Acre 2 2 2 2Concept (Charge applies as a credit to preliminary subdivision or site plan): Residential / lot or unit 20 20 20 - Non-residential base 100 100 100 - + / Acre 10 10 10 -Concept (Charge applies as a credit to preliminary subdivision or site plan): Single family residential / lot 20 20 20 20 Multi-family residential base 100 100 100 100 + / Unit 5 5 5 5 Non-residential base 100 100 100 100 + / Acre 10 10 10 10Preliminary subdivision plat Res. single family detached lots base 250 250 250 250 + / lot 60 60 60 60 Res. multi-family attached units base 250 250 250 250 + / unit 50 50 50 50 Non-residential base 250 250 250 250 + / lot or unit 75 75 75 75Final subdivision plat Res. single family detached lots base 350 350 350 350 + / lot 75 75 75 75 Res. multi-family attached units base 350 350 350 350 + / unit 65 65 65 65

GE
NE
RA
L F
UN
D -
DE
PT
. DE
TA
IL
FY2019 ANNUAL BUDGET - 70
FEES (CONT.)
DEPARTMENT 56 APPROVEDFY 2016
APPROVED FY 2017
APPROVED FY 2018
APPROVED FY 2019
Non-residential base 350 350 350 350 + / lot or unit 100 100 100 100Site plan Single family residential base 350 350 350 - +/ lot or unit 75 75 75 - Multi-family residential base 500 500 500 500 + / lot or unit 10 10 10 10 Non-residential / acre 350 350 350 350 or / 1,000 bldg. sq. ft. (if greater) 50 50 50 50Two-lot subdivision with an existing home 350 350 350 350Permitted use (existing buildings only) 50 50 50 50Conditional use 300 300 300 300Modification of existing conditional use 150 150 150 150Temporary uses 40 40 40 50Zoning Verification Letters - 50 50 50Home occupation - 25 25 25 Major 75 - - - Minor 25 - - -Sign permits: Temporary special event 25 25 25 25 On premise project sign 100 100 100 100 Directional sign for project 100 100 100 100 Temporary weekend directional sign 10 10 10 10Hearing Examiner 200 200 200 200Lot line adjustments (not requiring a plat) 200 200 200 200Final plat revision, amend, vacation base 200 200 200 200 + / lot or unit 100 100 100 100Construction drawing rev. / revised page (1st pg) 100 100 100 100 +/each subsequent page 20 20 20 20Revision to approved dev. agreement 2,500 2,500 2,500 2,500Replacement of development bonds / bond 350 350 350 350Pub. improvement inspect. base (% of bond) 1.4% 1.4% 1.4% 1.4% + / linear ft. T.V. fee for sewer lines 0.42 0.42 0.45 0.45 + / linear ft. T.V. fee for storm drain lines 0.42 0.42 0.45 0.45First extension of development approval 250 250 250 250 If made after original expiration date 500 500 500 500 + additional extension requests 500 500 500 500Grading permit first 20 acres 100 100 100 100 + / each additional 20 acres 100 100 100 100GIS maps: 24” x 36” color 10 10 10 10

GE
NE
RA
L F
UN
D - D
EP
T. D
ET
AIL
FY2019 ANNUAL BUDGET - 71
FEES (CONT.)
DEPARTMENT 56 APPROVEDFY 2016
APPROVED FY 2017
APPROVED FY 2018
APPROVED FY 2019
17” X 24” color 11” x 17” color
53
53
53
53
>24” x 36” / linear foot 2 2 2 2Copies: 11” x 17” color 0.25 0.25 0.25 0.25 11” x 17” black & white 0.10 0.10 0.10 0.10 8.5” x 11” color 0.25 0.25 0.25 0.25 8.5” x 11” black & white 0.10 0.10 0.10 0.10 Flash Drive (For pre-construction plans copies only)
- - - 75
Books: Design standards 10 10 10 10 Development code 10 10 10 10 Downtown revitalization plan 20 20 20 20Business License Home-Occupied Business (no impact) - - - - Home-Occupied Business (impact) - - - 40 Home-occupied business 40 40 40 - Base fee 80 80 80 80 Fireworks 40 40 40 40
Seasonal (Christmas tree lot, snow cone shack, etc.)
40 40 40 40
Beer license 150 150 150 150 Single event alcohol 50 50 50 50 Alcohol license 300 300 300 300 Late fee 25% of the renewal
if not paid by Feb. 15th
25% of the renewal if not paid by
Feb. 15th
25% of the renewal if not paid by
Feb. 15th
25% of the renewal fee if not paid by
February 15th

GE
NE
RA
L F
UN
D -
DE
PT
. DE
TA
IL
FY2019 ANNUAL BUDGET - 72
BUILDING & PERMITTING
PERFORMANCE MEASURESDEPARTMENT/DIVISION OBJECTIVE: Provide timely building permits and inspections.
PERFORMANCE MEASURE QUICK VIEW
ACTUAL FY 2016
ACTUAL FY 2017
TARGET FY 2018
ACTUAL FY 2018
TARGET FY 2019
Total Building Permits Issued per FTE 196 136 125 181 150
Total Building Inspections per FTE 3,398 2,673 2,500 3,064 2,700
Inspections Completed within 24 Hours of Request (%) 90% 90% 90% 90% 90%
Final & Four-way Inspections Completed within 24 hours (%) 90% 90% 90% 90% 90%
BUDGET INFORMATION
DEPARTMENT 58 ACTUALFY 2016
ACTUALFY 2017
ESTIMATEDFY 2018
PLANNEDFY 2019
Expenditures: 10 Salaries & Wages $ 404,514 $ 439,506 $ 511,246 592,060 11 Overtime - 4,379 3,000 3,000 13 Employee Benefits 206,844 234,245 284,076 335,704 14 Uniforms 1,063 554 2,400 2,400 21 Books, Subscriptions, & Memberships 1,065 9,738 6,500 6,500 23 Travel & Training 1,961 5,896 17,000 17,000 24 Office Supplies 9,194 7,907 9,000 26,750 25 Fleet Fund Charges 18,000 18,000 18,000 18,000 26 Buildings & Grounds O & M 1,266 1,269 1,000 - 27 Utilities 1,781 3,190 2,500 2,500 28 Equipment Maintenance 20 1,698 1,500 2,200 29 Risk Management Fund Charges 5,000 5,000 5,000 5,000 31 Professional & Technical 213 498 - - 34 IT Fund Charges 18,000 18,000 18,000 18,000 46 Miscellaneous 682 1,201 4,210 4,210 54-000 Capital Outlay - 9,453 33,250 31,517TOTAL EXPENDITURES $ 669,603 $ 760,534 $ 916,682 $ 1,064,841

GE
NE
RA
L F
UN
D - D
EP
T. D
ET
AIL
FY2019 ANNUAL BUDGET - 73
FEES
DEPARTMENT 58 APPROVEDFY 2016
APPROVED FY 2017
APPROVED FY 2018
APPROVED FY 2019
Building permits (established by ICBO Building Standards): Total valuation of $100 - $500 $ 23.50 $ 23.50 $ 23.50 $ 23.50 +/ $100 increase ($501 - $2,000) 3.05 3.05 3.05 3.05 The first $2,000 of the total valuation 69.25 69.25 69.25 69.25 +/ $1,000 increase ($2,001 - $25,000) 14 14 14 14 The first $25,000 of the total valuation 391.75 391.75 391.75 391.75 +/ $1,000 increase ($25,001 - $50,000) 10.10 10.10 10.10 10.10 The first $50,000 of the total valuation 643.75 643.75 643.75 643.75 +/ $1,000 increase ($50,001 - $100,000) 7 7 7 7 The first $100,000 of the total valuation 993.75 993.75 993.75 993.75 +/ $1,000 increase ($100,001 - $500,000) 5.60 5.60 5.60 5.60 The first $500,000 of the total valuation 3,233.75 3,233.75 3,233.75 3,233.75 +/ $1,000 increase ($500,001 - $1,000,000) 4.75 4.75 4.75 4.75 The first $1,000,000 of the total valuation 5,608.75 5,608.75 5,608.75 5,608.75 +/ $1,000 increase (above $1,000,001) 3.65 3.65 3.65 3.65Plan review: Residential (as % of permit fee) 40% 40% 40% 40% Non-residential (as % of permit fee) 65% 65% 65% 65% +State charge (as % of permit fee) 1% 1% 1% 1%Building inspections: Single family residential (/ sq. ft.) Main floor 91.36 101.39 101.39 104.54 Second floor 91.36 101.39 101.39 104.54 Unfinished basement 22.84 25.35 25.35 26.14 Semi-finished basement 22.84 25.35 25.35 26.14 Finished basement 45.68 50.70 50.70 52.27 Garage - masonry 45.47 45.47 45.47 - Garage - Wood Frame - - - 41.33 Open carports 29.94 33.82 33.82 34.80 Re-inspection Fee - 100 100 100Temporary power setup 80 80 80 80

GE
NE
RA
L F
UN
D -
DE
PT
. DE
TA
IL
FY2019 ANNUAL BUDGET - 74
ECONOMIC DEVELOPMENT
THE ECONOMIC DEVELOPMENT DEPARTMENT WILL FACILITATE THE DEVELOPMENT OF A DYNAMIC REGIONAL COMMERCIAL CENTER THAT WILL PROVIDE QUALITY EMPLOYMENT, OFFICE SPACE, RETAIL SHOPPING AND ENTERTAINMENT EXPERIENCES FOR RESIDENTS OF LEHI AND THE SURROUNDING MARKET AREA.
Promote Lehi City as the #1 location for high wage jobs, retail shopping experience, entertainment
opportunities, and affordable housing to facilitate growth and a higher quality of life for Lehi residents.
DEPARTMENT DESCRIPTIONThe Economic Development Department manages the various urban renewal, economic development, and community development areas (see pages 187-189 for more information) and works in cooperation with other public and private sector groups to promote new capital investment and quality job creation in the City. The department focuses on attracting new businesses to the community to create a diversified tax base and help reduce the tax burden on the residential property owner.
POSITION ACTUALFY 2015
ACTUALFY 2016
ACTUALFY 2017
ACTUALFY 2018
PLANNED FY 2019
Full-Time:Economic Development Director 1.00 1.00 1.00 1.00 1.00
TOTAL FTE 1.00 1.00 1.00 1.00 1.00
Percent of General Fund Budget
1%
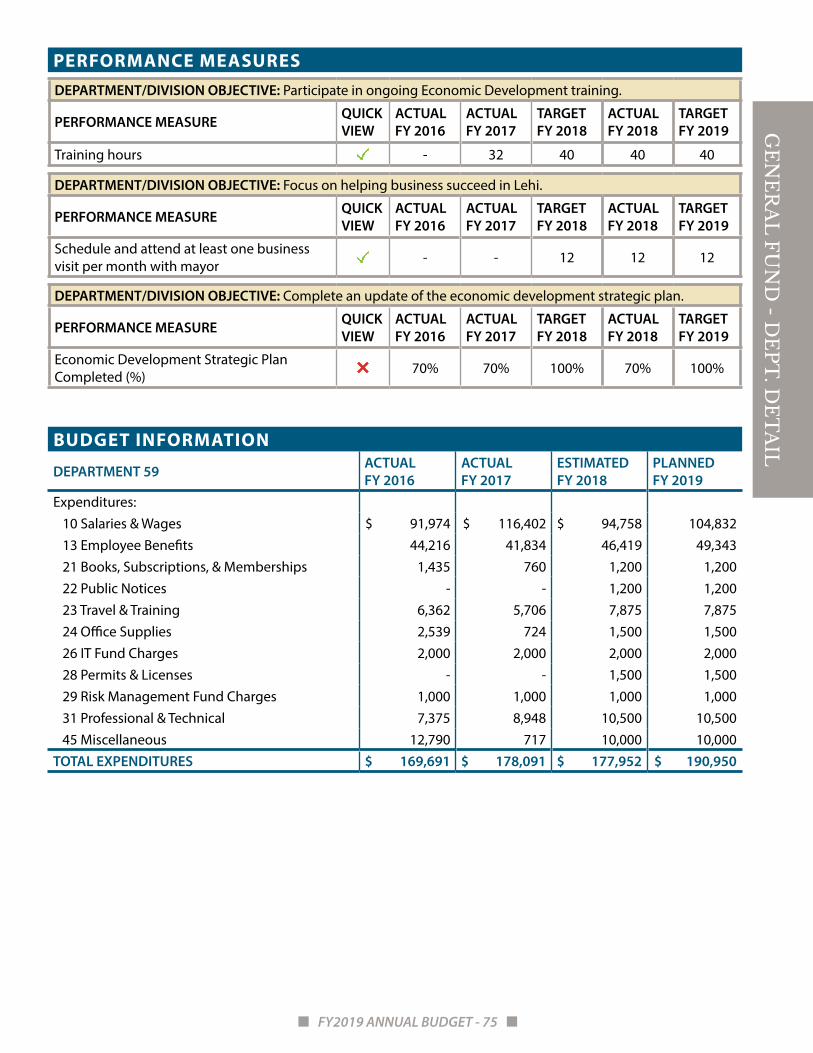
GE
NE
RA
L F
UN
D - D
EP
T. D
ET
AIL
FY2019 ANNUAL BUDGET - 75
PERFORMANCE MEASURESDEPARTMENT/DIVISION OBJECTIVE: Participate in ongoing Economic Development training.
PERFORMANCE MEASURE QUICK VIEW
ACTUAL FY 2016
ACTUAL FY 2017
TARGET FY 2018
ACTUAL FY 2018
TARGET FY 2019
Training hours - 32 40 40 40
DEPARTMENT/DIVISION OBJECTIVE: Focus on helping business succeed in Lehi.
PERFORMANCE MEASURE QUICK VIEW
ACTUAL FY 2016
ACTUAL FY 2017
TARGET FY 2018
ACTUAL FY 2018
TARGET FY 2019
Schedule and attend at least one business visit per month with mayor - - 12 12 12
DEPARTMENT/DIVISION OBJECTIVE: Complete an update of the economic development strategic plan.
PERFORMANCE MEASURE QUICK VIEW
ACTUAL FY 2016
ACTUAL FY 2017
TARGET FY 2018
ACTUAL FY 2018
TARGET FY 2019
Economic Development Strategic Plan Completed (%) 70% 70% 100% 70% 100%
BUDGET INFORMATION
DEPARTMENT 59 ACTUALFY 2016
ACTUALFY 2017
ESTIMATEDFY 2018
PLANNED FY 2019
Expenditures: 10 Salaries & Wages $ 91,974 $ 116,402 $ 94,758 104,832 13 Employee Benefits 44,216 41,834 46,419 49,343 21 Books, Subscriptions, & Memberships 1,435 760 1,200 1,200 22 Public Notices - - 1,200 1,200 23 Travel & Training 6,362 5,706 7,875 7,875 24 Office Supplies 2,539 724 1,500 1,500 26 IT Fund Charges 2,000 2,000 2,000 2,000 28 Permits & Licenses - - 1,500 1,500 29 Risk Management Fund Charges 1,000 1,000 1,000 1,000 31 Professional & Technical 7,375 8,948 10,500 10,500 45 Miscellaneous 12,790 717 10,000 10,000TOTAL EXPENDITURES $ 169,691 $ 178,091 $ 177,952 $ 190,950

GE
NE
RA
L F
UN
D -
DE
PT
. DE
TA
IL
FY2019 ANNUAL BUDGET - 76
ENGINEERING
THE ENGINEERING DEPARTMENT WILL PROVIDE ENGINEERING AND GIS SUPPORT FOR CITY ADMINISTRATION, OPERATING DEPARTMENTS, AND CITIZENS IN ACCORDANCE WITH APPLICABLE REQUIREMENTS AND REGULATIONS.
Convert the Jordan River Reservoir into a family, fishing facility while augmenting the water resources of Lehi City.
DEPARTMENT DESCRIPTIONThe Engineering Department coordinates all city engineering services including consultation, design, project management, survey, and inspection. The city engineer plays an integral part of all reviews done for new developments within the City. The geographical information system (GIS) coordinator provides map data for various levels of infrastructure and general city services.
Percent of General Fund Budget
2%

GE
NE
RA
L F
UN
D - D
EP
T. D
ET
AIL
FY2019 ANNUAL BUDGET - 77
ASSISTANT CITY ENGINEER ENGINEER III
CITY ENGINEER
Lorin Powell
GIS COORDINATOR
ENGINEERING TECHNICIAN
POSITION ACTUALFY 2015
ACTUALFY 2016
ACTUALFY 2017
ACTUALFY 2018
PLANNED FY 2019
Full-time:City Engineer 1.00 1.00 1.00 1.00 1.00Assistant City Engineer 1.00 1.00 1.00 1.00 1.00Engineer III 1.00 1.00 1.00 1.00 1.00GIS Coordinator 1.00 1.00 1.00 1.00 1.00Engineering Technician - - 1.00 1.00 1.00
TOTAL FTE 4.00 4.00 5.00 5.00 5.00
PERFORMANCE MEASURESDEPARTMENT/DIVISION OBJECTIVE: Participate in the design, development, and construction of infrastructure throughout the City.
PERFORMANCE MEASURE QUICK VIEW
ACTUAL FY 2016
ACTUAL FY 2017
TARGET FY 2018
ACTUAL FY 2018
TARGET FY 2019
Percent Completed of Major Projects
Jordan River Reservoir (PI) 75% 95% 100% 100% -
Make the reservoir accessible. - 20% 100% 60% 100%
Work with Fish and Game to make the reservoir a fishery. - 20% 100% 25% 100%
Traverse Blvd TRAX Xing & Road - - 100% 15% 75%
Main Street 2300 W to Crossroads - - 15% 2% 35%
1200 West, I-15 to SR92 - - 20% 15% 100%
West Side Tank - - 100% 95% 100%
Traverse Booster with Piping - - 100% 16% 100%
West Side Sedimentation Basin - - 100% 13% 100%
Dry Creek Reservoir & Piping - - 20% 10% 25%
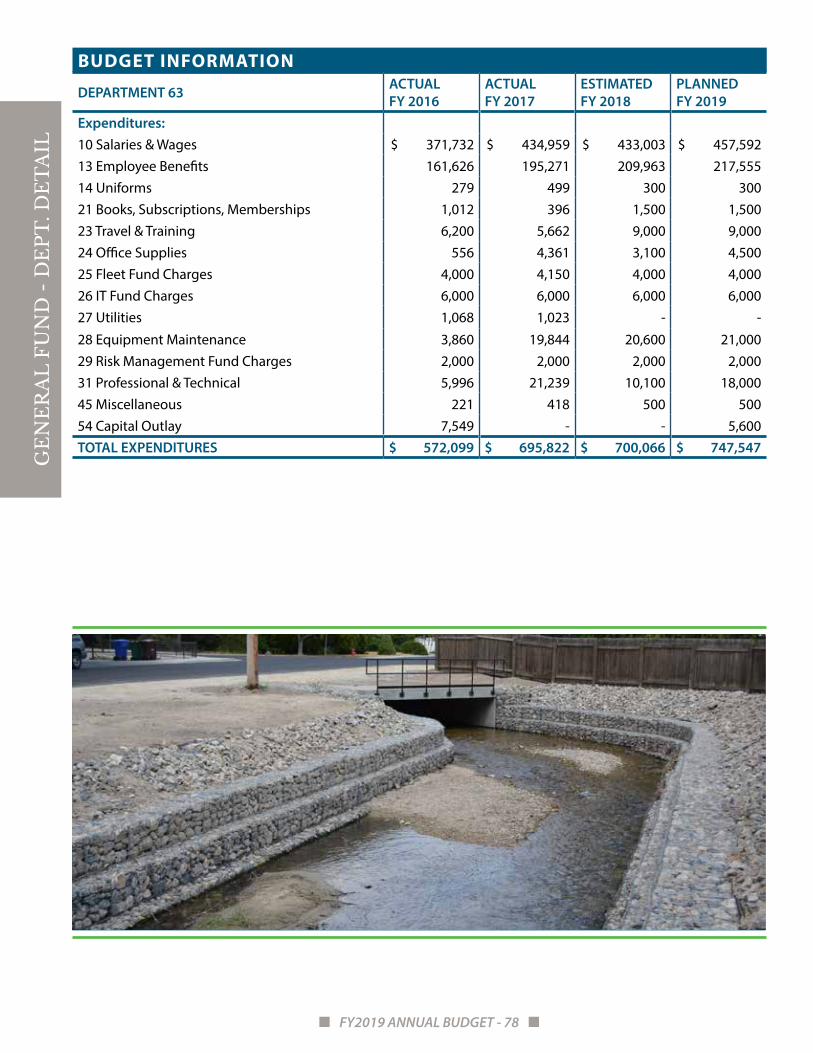
GE
NE
RA
L F
UN
D -
DE
PT
. DE
TA
IL
FY2019 ANNUAL BUDGET - 78
BUDGET INFORMATION
DEPARTMENT 63 ACTUALFY 2016
ACTUAL FY 2017
ESTIMATEDFY 2018
PLANNEDFY 2019
Expenditures:10 Salaries & Wages $ 371,732 $ 434,959 $ 433,003 $ 457,59213 Employee Benefits 161,626 195,271 209,963 217,55514 Uniforms 279 499 300 30021 Books, Subscriptions, Memberships 1,012 396 1,500 1,50023 Travel & Training 6,200 5,662 9,000 9,00024 Office Supplies 556 4,361 3,100 4,50025 Fleet Fund Charges 4,000 4,150 4,000 4,00026 IT Fund Charges 6,000 6,000 6,000 6,00027 Utilities 1,068 1,023 - -
28 Equipment Maintenance 3,860 19,844 20,600 21,00029 Risk Management Fund Charges 2,000 2,000 2,000 2,00031 Professional & Technical 5,996 21,239 10,100 18,00045 Miscellaneous 221 418 500 50054 Capital Outlay 7,549 - - 5,600TOTAL EXPENDITURES $ 572,099 $ 695,822 $ 700,066 $ 747,547

GE
NE
RA
L F
UN
D - D
EP
T. D
ET
AIL
FY2019 ANNUAL BUDGET - 79
FINANCE
THE MISSION OF THE FINANCE DEPARTMENT IS TO EFFECTIVELY MANAGE AND SAFEGUARD THE CITY’S FINANCIAL RESOURCES AND ASSETS BY PROVIDING ACCURATE AND TIMELY INFORMATION IN ACCORDANCE WITH GENERALLY ACCEPTED ACCOUNTING PRINCIPLES (GAAP) AND THE GOVERNMENTAL ACCOUNTING STANDARDS BOARD (GASB).
Effectively manage and safeguard the resources and assets by providing accurate and timely information in accordance with generally accepted principles (GAAP)
and the Government Accounting Standards Board (GASB).
DEPARTMENT DESCRIPTIONThe Finance Department is responsible for the financial operations of the City. The Department provides budgeting, purchasing, accounting, and funding direction for the City.
The Treasury and Utility Billing Division has custody of Lehi City’s cash and investments. The Treasurer maintains a system for cash management and is responsible for reporting the cash position to the Mayor and City Council. The Treasurer also oversees the billing process and responds to customers’ questions and complaints. Additionally, the Finance Department, through the Treasury Division, oversees the third-party waste collection contract (see Waste Collection Fund on page 179).
Percent of General Fund Budget
3%

GE
NE
RA
L F
UN
D -
DE
PT
. DE
TA
IL
FY2019 ANNUAL BUDGET - 80
POSITION ACTUALFY 2015
ACTUALFY 2016
ACTUALFY 2017
ACTUALFY 2018
PLANNED FY 2019
FINANCEAppointed:
City Treasurer 1.00 1.00 1.00 1.00 1.00Full-time:
Finance Director 1.00 1.00 1.00 1.00 1.00Assistant Finance Director 1.00 1.00 1.00 1.00 1.00Customer Service Lead 1.00 1.00 1.00 1.00 1.00Accounting/Payroll Technician 1.00 1.00 1.00 1.00 1.00Accounts Payable Technician 1.00 1.00 1.00 1.00 1.00Customer Service Representative II 1.00 1.00 2.00 2.00 2.00Customer Service Representative I 2.00 2.00 2.00 2.00 2.00*IT Manager 1.00 1.00 1.00 1.00 -Senior IT Technician 1.00 1.00 1.00 - -IT Technician II 1.00 1.00 1.00 - -IT Technician I - - - 3.00 -
Part-time Non-benefited:Customer Service Technician I 0.25 0.50 - - -
TOTAL FTE 12.25 12.50 13.00 14.00 10.00*Beginning in FY2019, IT will be under the Office of the City Administrator and not Finance.
Accounting/Payroll Tech.
Accounts Payable Clerk
Customer Service
Clerk I (2)
Customer Service
Clerk II (2)
Customer Service Lead
TREASURYUTILITY BILLING
Alyson Alger
ACCOUNTING
Karma Bentson
FINANCE DIRECTOR
Dean Lundell

GE
NE
RA
L F
UN
D - D
EP
T. D
ET
AIL
FY2019 ANNUAL BUDGET - 81
ACCOUNTING
PERFORMANCE MEASURESDEPARTMENT/DIVISION OBJECTIVE: Properly monitor and report the City’s finances.
PERFORMANCE MEASURE QUICK VIEW
ACTUAL FY 2016
ACTUAL FT 2017
TARGET FY 2018
ACTUAL FY 2018
TARGET FY 2019
1099 Errors 10 8 5 2 1
Percent of monthly financial reports completed by the 20th business day after the end of the month
100% 100% 100% 100% 100%
DEPARTMENT/DIVISION OBJECTIVE: Limit the amount of payroll errors.
PERFORMANCE MEASURE QUICK VIEW
ACTUAL FY 2016
ACTUAL FT 2017
TARGET FY 2018
ACTUAL FY 2018
TARGET FY 2019
Percent of payroll errors compared to the average number of employees 1% 1% 1% 1% 1%
BUDGET INFORMATION
DEPARTMENT 46 ACTUALFY 2016
ACTUAL FY 2017
ESTIMATEDFY 2018
PLANNEDFY 2019
Expenditures: 10 Salaries & Wages $ 272,110 $ 290,594 $ 309,375 $ 318,682 13 Employee Benefits 139,405 141,423 161,487 164,848 21 Books, Subscriptions, & Memberships 855 355 2,246 2,246 23 Travel & Training 3,864 5,547 6,500 6,500 24 Office Supplies 5,272 4,872 10,000 10,000 26 IT Fund Charges 10,000 10,000 10,000 10,000 27 Utilities 460 440 500 500 28 Equipment Maintenance 1,368 - 1,500 1,500 29 Risk Management Fund Charges 1,000 1,000 1,000 1,000 31 Professional & Technical 4,326 9,702 5,000 5,000 34 Auditor Expense 42,000 48,000 46,000 46,000 35 Budget Expense 505 580 550 550 45 Miscellaneous 2,579 673 3,500 3,500TOTAL EXPENDITURES $ 483,744 $ 513,186 $ 557,658 $ 570,326

GE
NE
RA
L F
UN
D -
DE
PT
. DE
TA
IL
FY2019 ANNUAL BUDGET - 82
TREASURY & UTILITY BILLING
PERFORMANCE MEASURESDEPARTMENT/DIVISION OBJECTIVE: Closely monitor the city’s utility revenues.
PERFORMANCE MEASURE QUICK VIEW
ACTUAL FY 2016
ACTUAL FY 2017
TARGET FY 2018
ACTUAL FY 2018
TARGET FY 2019
Number of Active Utility Accounts 18,580 19,236 20,000 20,287 21,395
Utility Billing Accounts over 60 Days (%) 6.5% 6% 5% 6.5% 6.1%
BUDGET INFORMATION
DEPARTMENT 45 ACTUALFY 2016
ACTUALFY 2017
ESTIMATEDFY 2018
PLANNEDFY 2019
Expenditures: 10 Salaries & Wages $ 262,985 $ 222,836 $ 276,527 $ 293,210 13 Employee Benefits 145,537 137,734 179,617 179,531 21 Books, Subscriptions, & Memberships 251 100 1,000 1,000 23 Travel & Training 1,980 3,876 4,000 4,000 24 Office Supplies 2,912 3,101 3,200 3,200 26 IT Fund Charges 16,000 16,000 16,000 16,000 27 Utilities - - 1,000 1,000 28 Equipment Maintenance 12 - 500 500 29 Risk Management Fund Charges 10,000 10,000 10,000 10,000 31 Professional & Technical 1,167 11,320 1,000 1,000 45 Miscellaneous 552 206 1,000 1,000TOTAL EXPENDITURES $ 441,396 $ 405,173 $ 493,844 $ 510,441

GE
NE
RA
L F
UN
D - D
EP
T. D
ET
AIL
FY2019 ANNUAL BUDGET - 83
FEES
DEPARTMENT 45 APPROVEDFY 2016
APPROVED FY 2017
APPROVED FY 2018
APPROVED FY 2019
Utility sign-up processing $ 30 $ 30 $ 30 $ 30Disconnect/connect fee (Water & Power) 50 50 50 50Utility verification 50 50 50 50Dumpster rental/dumpster 150 150 150 150 +1 additional trip to dump 100 100 100 100Landfill transfer station punch card: First card within the year Free Free Free Free Second card within the year 10 10 10 10 Third card within the year 30 30 30 30 Fourth card within the year 50 50 50 50Overdue charge/month (if past 30 days) 1.5% 1.5% 1.5% 1.5%Returned check 20 20 20 20Bankruptcy deposit 500 500 500 500Temporary power meter deposit 200 200 200 200

GE
NE
RA
L F
UN
D -
DE
PT
. DE
TA
IL
FY2019 ANNUAL BUDGET - 84
FIRE
THE LEHI FIRE DEPARTMENT IS COMMITTED TO PROVIDING A WIDE RANGE OF SERVICES TO THE COMMUNITY DESIGNED TO PROTECT AND PRESERVE LIFE, PROPERTY, AND THE ENVIRONMENT THROUGH PLANNING, PREVENTION, EDUCATION, AND RESPONSE.
Deliver a high level of professional service to the community while enhancing public education and
community relations.
DEPARTMENT DESCRIPTIONThe Fire Department is responsible for protecting the lives and possessions of the people living within the Lehi service area, which includes Lehi City and parts of Utah County. All members of the Fire Department are expected to maintain current fire prevention skills and training and at least intermediate level EMT skills and training. The Department is also actively engaged in educating the community about fire prevention and fire safety.
Percent of General Fund Budget
19%

GE
NE
RA
L F
UN
D - D
EP
T. D
ET
AIL
FY2019 ANNUAL BUDGET - 85
FIRE DOG
Blaze
Each Batallion Chief supervises a full staff at each of our fire stations: Station 81 (Center Street), Station 82 (2600 North) and Station 83 (Traverse Mountain). The department employs an additional 20 part-time staff, which equal 10 full-time equivalents, that cover available shifts as needed.
ADMINISTRATIVE ASSISTANT
C PLATOON BATTALION CHIEF
Jake Beck
FIRE MARSHAL
Kerry Evans
B PLATOON BATALLION CHIEF
Tim Robinson
A PLATOON BATTALION CHIEF
Kim Beck
FIRE CHIEF
Jeremy Craft
Engineer (3)
Paramedic (7)
CAPTAIN (3)
Engineer (3)
Paramedic (6)
Part-Time (2) Part-Time (1)
CAPTAIN (3)
Engineer (3)
Paramedic (6)
CAPTAIN (3)
Angie Reynolds
DEPUTY FIREMARSHALL
Mathew Sacco
Part-Time (1)

GE
NE
RA
L F
UN
D -
DE
PT
. DE
TA
IL
FY2019 ANNUAL BUDGET - 86
POSITION ACTUALFY 2015
ACTUALFY 2016
ACTUALFY 2017
ACTUAL FY 2018
PLANNED FY 2019
Full-time:Fire Chief 1.00 1.00 1.00 1.00 1.00Battalion Chief 1.00 3.00 3.00 3.00 3.00Fire Marshal 1.00 1.00 1.00 1.00 1.00Deputy Fire Marshal - - 1.00 1.00 1.00Fire Captain 6.00 6.00 6.00 9.00 9.00Fire Engineer 6.00 6.00 6.00 9.00 9.00Firefighter/Paramedic 6.00 6.00 13.00 19.00 19.00Firefighter/EMT-I 12.00 12.00 5.00 8.00 8.00Administrative Assistant 1.00 1.00 1.00 1.00 1.00
Part-timer Non-benefited:Firefighter/Paramedic 6.90 9.90 9.90 9.90 9.90Firefighter/EMT-I 2.45 2.45 2.45 2.45 2.45Office Assistant - - - - 0.50
TOTAL FTE 43.35 48.35 49.35 64.35 64.85
PERFORMANCE MEASURESDEPARTMENT/DIVISION OBJECTIVE: Provide quality fire and EMS services through efficient response times, proactive preventative maintenance, and quality public education.
PERFORMANCE MEASURE QUICK VIEW
ACTUAL FY 2016
ACTUAL FY 2017
TARGET FY 2018
ACTUAL FY 2018
TARGET FY 2019
Total Calls 2,711 2,794 3,100 3,198 3,518
Average EMS Response Time (minutes) 7:52 7:04 7:00 5:43 4-6 Min
*Average Fire Response Time (minutes) - 6:24 6:00 4:23 4-6 MinAverage “Out of Chute” Time (minutes) 1:36 1:32 1:30 2:58 1-3 Min
Total Fire Inspections 687 698 770 800 800
ISO Rating (updated annually) 3 3 3 3 3
Total Public Education Class Hours 451 522 500 589 600**Resident Satisfaction with Fire Services 84.2 84.5 80.0 85.7 80.0*Average Fire Response Time was previously combined with Average EMS Response Time. Calculation is separate moving forward.**Resident Satisfaction with Fire Services was previously based on a 5-point scale. A 10-point scale will be used moving forward.
DEPARTMENT/DIVISION OBJECTIVE: Train and utilize CERT volunteers to properly assist with city functions.
PERFORMANCE MEASURE QUICK VIEW
ACTUAL FY 2016
ACTUAL FY 2017
TARGET FY 2018
ACTUAL FY 2018
TARGET FY 2019
Total Firefighter Training Hours 4,200 4,300 4,500 12,451 13,000

GE
NE
RA
L F
UN
D - D
EP
T. D
ET
AIL
FY2019 ANNUAL BUDGET - 87
BUDGET INFORMATION
DEPARTMENT 55 ACTUALFY 2016
ACTUAL FY 2017
ESTIMATED FY 2018
PLANNEDFY 2019
Expenditures:10 Salaries & Wages $ 2,388,728 $ 2,616,658 $ 3,429,244 $ 4,123,34711 Overtime 144,906 163,737 167,729 177,72913 Employee Benefits 1,151,275 1,242,911 1,668,686 1,932,94714 Uniforms 51,880 30,055 153,905 87,90721 Books, Subscriptions, Memberships 8,344 5,718 7,000 8,00023 Travel & Training 29,139 29,154 44,462 44,46224 Office Supplies 7,881 6,560 22,400 24,90025 Fleet Fund Charges 100,000 100,000 100,000 125,00026 Buildings & Grounds O&M 15,438 13,337 12,675 12,67527 Utilities 18,187 23,187 32,000 32,00029 Equipment Maintenance 65,850 54,172 55,000 74,50030 Electricity - Lehi City Power 25,851 25,609 19,000 19,000
31 Professional & Technical 90,926 85,437 70,200 70,20032 IT Fund Charges 20,000 20,000 20,000 20,00033 Risk Management Fund Charges 10,000 10,000 10,000 10,00036 Education 7,377 3,148 20,000 26,650Dispatch Fee - County Comm 10,500 7,938 - -41 First Aid Supplies 77,157 68,351 67,950 82,95046 Miscellaneous 33,835 129,686 157,839 155,11054 Capital Outlay 28,827 318,852 - 10,600TOTAL EXPENDITURES $ 4,286,101 $ 4,954,510 $ 6,058,090 $ 7,037,977
BUDGET INFORMATION - EMERGENCY MANAGEMENT FUND
DEPARTMENT 49 ACTUALFY 2016
ACTUALFY 2017
ESTIMATEDFY 2018
PLANNEDFY 2019
Expenditures:10 Salaries & Wages $ - $ 1,716 $ 18,500 $ 18,50013 Employee Benefits - 873 1,500 1,50023 Travel & Training 354 - 3,500 3,50021 Books, Subscriptions, Memberships 1,214 317 - -24 Office Supplies 24 16 500 50031 Professional & Technical 6,825 - 10,000 10,00033 Miscellaneous 2,827 13,173 32,250 32,25054 Capital Outlay 561 12,036 - -TOTAL EXPENDITURES $ 11,805 $ 38,131 $ 66,250 66,250

GE
NE
RA
L F
UN
D -
DE
PT
. DE
TA
IL
FY2019 ANNUAL BUDGET - 88
FEES
DEPARTMENT 55 APPROVEDFY 2016
APPROVEDFY 2017
APPROVED FY 2018
APPROVED FY 2019
Ambulance: (Established by UT Bureau of Emergency Medical Services) Basic Ground Ambulance / transport $ 655 $ 655 $ 746 $ 746 Intermediate Ground Ambulance / trans. 865 865 984 984 Paramedic Ground Ambulance / transport 1,265 1,265 1,440 1,440 Standard Mileage Rate / mile 31.65 31.65 31.65 31.65 + Off-Road / mile (if >10 mi. traveled) 1.50 1.50 1.50 1.50 Fuel Fluctuation / mile (if > $4.25 / gal.) 0.25 0.25 0.25 0.25 AOS Assessment / treatment w/out trans. 225 225 225 225 Waiting time (per quarter hour) 22.05 22.05 22.05 22.05False Alarm: Fire/Smoke/CO2 (if>3 / yr. at bus.) / alarm 150 150 150 150 Fire/Smoke/CO2 (if>3 / yr. at res.) / alarm 50 50 50 50Impact Fee: Residential / unit 375 198 198 198 Non-Residential / building sq. ft. 0.246 - - -Annual Operational Permits: Single Use Permit: Agricultural Burn Permit 10 10 10 10 Fireworks Display (ground) 125 125 125 125 Aerial Fireworks Display: < 250 devices 140 140 140 140 > 250 devices 215 215 215 215 Pyrotechnics (other) 110 110 110 110 Candles and open flames 60 60 60 60 Carnivals: < 10 attractions 60 60 60 60 > 10 attractions 100 100 100 100 Tent: 200 - 2000 sq. ft. 60 60 60 60 > 2000 sq. ft. 100 100 100 100 Canopy: 400 - 2000 sq. ft. 60 60 60 60 > 2000 sq. ft. 100 100 100 100 Air Supported Structure 100 100 100 100 Fire Stand-by at Special Events 80 80 80 80Inspections & Enforcement: Exempt Child Care Facility 25 25 25 25 Daycare/Pre-School 25 25 25 25
Nursing Homes 50 50 50 50

GE
NE
RA
L F
UN
D - D
EP
T. D
ET
AIL
FY2019 ANNUAL BUDGET - 89
FEES (CONT.)
DEPARTMENT 55 APPROVEDFY 2016
APPROVED FY 2017
APPROVED FY 2018
APPROVED FY 2019
Assisted Living Facilities 50 50 50 50 Boarding School 100 100 100 100 Outpatient Provider 75 75 75 75 Hospital 200 200 200 200 Final for Occupancy 60 60 60 60Flammable Finish Operations: Spray Booth 150 150 150 150 Powder Coating 150 150 150 150 Electrostatic Apparatus 150 150 150 150 Dipping Tank / tank 150 150 150 150 Amusement Building 100 100 100 100 Combustible Fiber Storage 60 60 60 60 Cutting and Welding 60 60 60 60 Dry Cleaning Plant 60 60 60 60 High Piled Storage 60 60 60 60 Hot Work Operations 60 60 60 60 Industrial Ovens / oven 60 60 60 60 LPG Dispensing 60 60 60 60 Spray Booths & Auto Painting 60 60 60 60 Lumber Yards 75 75 75 75 Woodworking Plants 75 75 75 75 Alarm User Permit 25 25 25 25 Fireworks Sales / location 60 60 60 60Fire Protection Systems: Automatic Fire Sprinkler Systems: Plan Review: < 100 heads 125 125 125 125 100 - 199 heads 175 175 175 175 200 - 299 heads 225 225 225 225 > 300 heads 275 275 275 275 + / head 0.50 0.50 0.50 0.50 Acceptance Testing: Underground Flush 60 60 60 60 Hydrostatic (2 hour maximum) 60 60 60 60 Acceptance (2 hour maximum) 60 60 60 60 Any Acceptance (2 hour maximum) 60 60 60 60 Other Fire Protection Systems: Additional Riser 50 50 50 50 Standpipe (2 hour maximum) 100 100 100 100

GE
NE
RA
L F
UN
D -
DE
PT
. DE
TA
IL
FY2019 ANNUAL BUDGET - 90
FEES (CONT.)
DEPARTMENT 55 APPROVEDFY 2016
APPROVED FY 2017
APPROVED FY 2018
APPROVED FY 2019
Automatic Fire Sprinkler System Remodel or Tenant Finish:
Plan Review: < 5 heads 65 65 65 65 5 - 50 heads 125 125 125 125 > 50 heads 150 150 150 150 + / head 0.50 0.50 0.50 0.50 Acceptance Testing: Hydrostatic (2 hour maximum) 60 60 60 60 Acceptance (2 hour maximum) 60 60 60 60Fire Alarm Systems: Plan Review: New System 115 115 115 115 Remodel 65 65 65 65 Additional Floors 60 60 60 60 Acceptance (2 hour maximum) 60 60 60 60Commercial Hood Systems: Plan Review / hood 115 115 115 115 Acceptance (2 hour maximum) 60 60 60 60Fire Hydrant Installation and Testing: Underground Flush 60 60 60 60 Acceptance Testing 60 60 60 60 Fire Hydrant Single Usage 110 110 110 110 Fire Hydrant Multi Usage 100 100 100 100 Fire Hydrant Flow Test 60 60 60 60LPG and Hazardous Materials: LPG Storage Tanks and Gas Systems: Plan Review 50 50 50 50 < 500 gallons (private use) 140 140 140 140 < 500 gallons (retail use) 140 140 140 140 > 500 gallons (private use) 165 165 165 165 > 500 gallons (retail use) 215 215 215 215 > 2000 gallons (plans) 215 215 215 215 > 4000 gallons (plans) 265 265 265 265 Hazardous Materials Storage Annual Permit: Minimal Storage 80 80 80 80 Haz Mat Storage 165 165 165 165 Haz Mat Dispensing 215 215 215 215 Manufacturing 265 265 265 265 Haz Mat Production 265 265 265 265

GE
NE
RA
L F
UN
D - D
EP
T. D
ET
AIL
FY2019 ANNUAL BUDGET - 91
FEES (CONT.)
DEPARTMENT 55 APPROVEDFY 2016
APPROVED FY 2017
APPROVED FY 2018
APPROVED FY 2019
Waste Production 300 300 300 300 Multiple-Use Site 315 315 315 315 Liquid Storage Tank / tank (installation and
closure) Plan Review 50 50 50 50 Underground: < 500 gallons 115 115 115 115 501 - 1000 gallons 165 165 165 165 > 1000 gallons 265 265 265 265 Above Ground: < 500 gallons 115 115 115 115 501 - 1000 gallons 165 165 165 165 > 1000 gallons 265 265 265 265 Explosives and Blasting / project 75 75 75 75 Explosives and Blasting annually 365 365 365 365 Compressed Gas Systems: Compressed Gas 115 115 115 115 Medical Gas 115 115 115 115 Combustible and Flammable Liquid Systems: Plan Review 50 50 50 50 If not UST or AST 215 215 215 215Miscellaneous: + / additional hour for reviews, inspections,
approvals, etc. > 2 hours60 60 60 60
Fire Report Copy 15 15 15 15 Plan Review Rush - Alarm 100 100 100 100 Plan Review Rush - Sprinkler 200 200 200 200 Stop Work Removal 100 100 100 100 After-Hrs. Inspection / hour (2 hour min.) 75 75 75 75 Installation without PermitOpen Burning: (for violations only) Type 1 Equipment / hour 230 230 230 230 Type 2 Equipment / hour 150 150 150 150 Type 6 Equipment / hour 120 120 120 120 Fire Chief or Marshal / day 95 95 95 95 EMT-Paramedic / hour 25 25 25 25 EMT-Intermediate / hour 22 22 22 22Community Emergency Response Team Training Resident 35 35 35 35 Nonresidents 40 40 40 40

GE
NE
RA
L F
UN
D -
DE
PT
. DE
TA
IL
FY2019 ANNUAL BUDGET - 92
JUSTICE COURT
THE JUSTICE COURT WILL SIT IN JUDGMENT OF CRIMINAL AND COMMON LAW PROCEEDINGS, RESOLVE LEGAL ISSUES, AND ENSURE JUSTICE; THEREBY IMPROVING THE EQUALITY OF LIFE IN THE COMMUNITY BY PROVIDING AN OPEN, FAIR, EFFICIENT, AND INDEPENDENT SYSTEM FOR THE ADVANCEMENT OF JUSTICE UNDER THE LAW.
Implement evidence-based sentencing practices and utilize effective community resources for convicted
defendants in an effort to reduce recidivism in the criminal justice system and effect positive change and reparation.
DEPARTMENT DESCRIPTIONThe Lehi City Judge is trained in the operation of the Utah court system and court procedures. This training makes it possible for the judge to hand down judgments on all citations, summons, and small claims. The judge is responsible for all procedures that take place in the Justice Court. The court clerk enters citations for the Lehi Police Department, Utah Highway Patrol, and the Utah County Sheriff Department. The clerk is also responsible for recording summons and small claims information.
Percent of General Fund Budget
2%

GE
NE
RA
L F
UN
D - D
EP
T. D
ET
AIL
FY2019 ANNUAL BUDGET - 93
In-Court Clerk (1)
Court Clerk Part-Time Clerk (1.3)
COURT CLERK SUPERVISOR
JoDee Neer
JUSTICE COURT JUDGE
Morgan Cummings
POSITION ACTUALFY 2015
ACTUALFY 2016
ACTUALFY 2017
ACTUAL FY 2018
PLANNED FY 2019
Appointed:Justice Court Judge 1.00 1.00 1.00 1.00 1.00
Full-Time:Court Clerk Supervisor 1.00 1.00 1.00 1.00 1.00In-Court Clerk 1.00 1.00 1.00 1.00 1.00Court Clerk 2.00 2.00 2.00 1.00 1.00
Part-Time Non-benefited:Clerk 1.30 1.30 1.30 1.30 1.30
TOTAL FTE 6.30 6.30 6.30 5.30 5.30
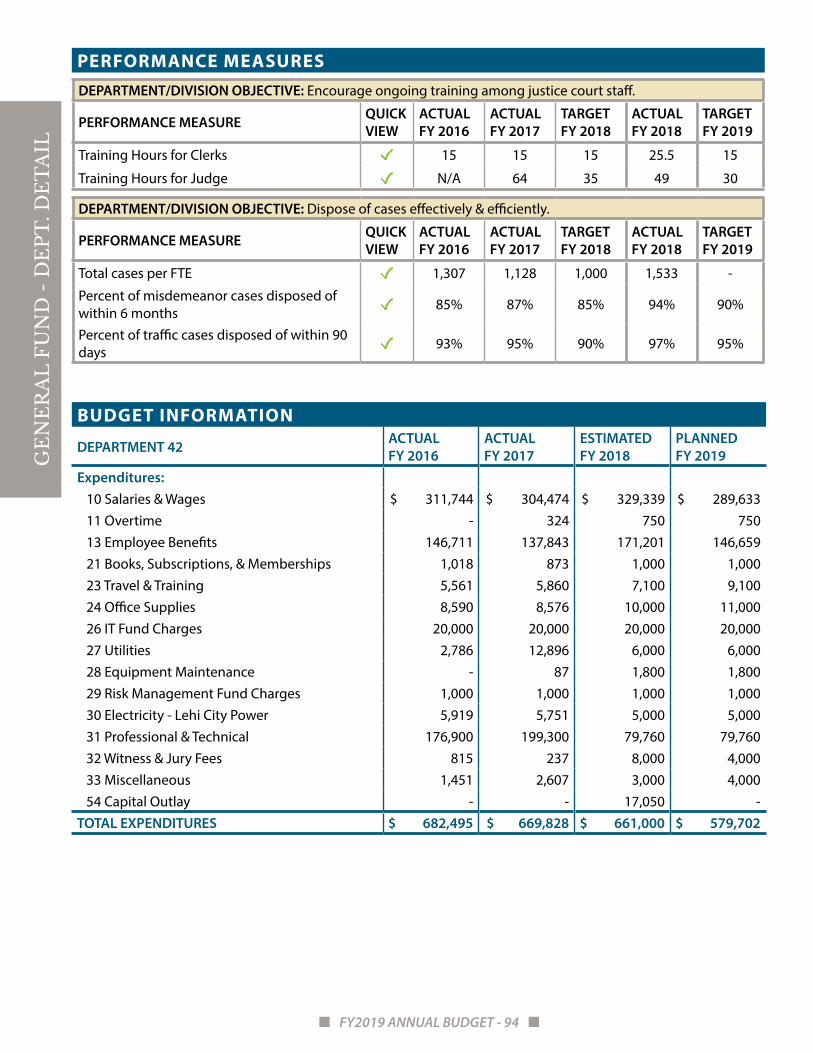
GE
NE
RA
L F
UN
D -
DE
PT
. DE
TA
IL
FY2019 ANNUAL BUDGET - 94
PERFORMANCE MEASURESDEPARTMENT/DIVISION OBJECTIVE: Encourage ongoing training among justice court staff.
PERFORMANCE MEASURE QUICK VIEW
ACTUAL FY 2016
ACTUAL FY 2017
TARGET FY 2018
ACTUAL FY 2018
TARGET FY 2019
Training Hours for Clerks 15 15 15 25.5 15
Training Hours for Judge N/A 64 35 49 30
DEPARTMENT/DIVISION OBJECTIVE: Dispose of cases effectively & efficiently.
PERFORMANCE MEASURE QUICK VIEW
ACTUAL FY 2016
ACTUAL FY 2017
TARGET FY 2018
ACTUAL FY 2018
TARGET FY 2019
Total cases per FTE 1,307 1,128 1,000 1,533 -
Percent of misdemeanor cases disposed of within 6 months 85% 87% 85% 94% 90%
Percent of traffic cases disposed of within 90 days 93% 95% 90% 97% 95%
BUDGET INFORMATION
DEPARTMENT 42 ACTUALFY 2016
ACTUALFY 2017
ESTIMATED FY 2018
PLANNEDFY 2019
Expenditures: 10 Salaries & Wages $ 311,744 $ 304,474 $ 329,339 $ 289,633 11 Overtime - 324 750 750 13 Employee Benefits 146,711 137,843 171,201 146,659 21 Books, Subscriptions, & Memberships 1,018 873 1,000 1,000 23 Travel & Training 5,561 5,860 7,100 9,100 24 Office Supplies 8,590 8,576 10,000 11,000 26 IT Fund Charges 20,000 20,000 20,000 20,000 27 Utilities 2,786 12,896 6,000 6,000 28 Equipment Maintenance - 87 1,800 1,800 29 Risk Management Fund Charges 1,000 1,000 1,000 1,000 30 Electricity - Lehi City Power 5,919 5,751 5,000 5,000 31 Professional & Technical 176,900 199,300 79,760 79,760 32 Witness & Jury Fees 815 237 8,000 4,000 33 Miscellaneous 1,451 2,607 3,000 4,000 54 Capital Outlay - - 17,050 -TOTAL EXPENDITURES $ 682,495 $ 669,828 $ 661,000 $ 579,702

GE
NE
RA
L F
UN
D - D
EP
T. D
ET
AIL
FY2019 ANNUAL BUDGET - 95
LEGAL SERVICES
THE LEGAL SERVICES DEPARTMENT WILL SERVE LEHI CITY THROUGH THE PRACTICE OF LAW ACCORDING TO THE HIGHEST PROFESSIONAL STANDARDS AND THROUGH MAINTAINING RECORDS OF THE CITY’S ACTION IN A PROFESSIONAL AND HIGHLY-ORGANIZED MANNER.
Safeguard the rights and interests of Lehi families by (1) vigorously prosecuting crime, (2) managing claims and
litigation to protect tax dollars, and (3) defending public policies advanced by Lehi’s elected representatives.
DEPARTMENT DESCRIPTIONThe Legal Services Department is responsible for the proper execution of all legal affairs of the City. The Legal Services Department consists of three divisions: Civil Division, Criminal Division, and Records and Elections.
The Civil Division advises elected officials and City staff on legal issues, prepares all legal documents, defends the City against all civil claims, and conducts all other non-criminal legal services for Lehi City.
The Criminal Division prosecutes all misdemeanor crimes that occur within Lehi City.
The Records and Elections Division is managed by the city recorder and is responsible for the records, minutes, ordinances, and resolutions of the City. The division also oversees annexations, elections, and cemetery records.
Percent of General Fund Budget
2%

GE
NE
RA
L F
UN
D -
DE
PT
. DE
TA
IL
FY2019 ANNUAL BUDGET - 96
Part-Time Prosecutor
Legal Secretary
CIVIL DIVISIONCITY
RECORDER
Marilyn Banasky
CRIMINAL DIVISION(CITY PROSECUTOR)
Craig Chambers
CITY ATTORNEY
Ryan Wood
Doug Ahlstrom
POSITION ACTUALFY 2015
ACTUALFY 2016
ACTUALFY 2017
ACTUALFY 2018
PLANNED FY 2019
Appointed:Recorder 1.00 1.00 1.00 1.00 1.00
Full-time:City Attorney 1.00 1.00 1.00 1.00 1.00Assistant City Attorney/City Prosecutor 1.00 1.00 1.00 1.00 1.00Secretary - Legal - - - - 1.00
Part-Time Non-benefited:Assistant City Prosecutor 0.50 0.50 0.50 0.50 0.50Secretary - Legal 1.80 1.80 1.80 1.80 0.80
TOTAL FTE 5.30 5.30 5.30 5.30 5.30
CIVIL DIVISION
PERFORMANCE MEASURESDEPARTMENT/DIVISION OBJECTIVE: Responsibly provide internal support to the city’s civil legal issues when possible.
PERFORMANCE MEASURE QUICK VIEW
ACTUAL FY 2016
ACTUAL FY 2017
TARGET FY 2018
ACTUAL FY 2018
TARGET FY 2019
Total Liability Claims Filed 15 11 5 13 5
Total Lawsuits Filed 6 1 1 1 1

GE
NE
RA
L F
UN
D - D
EP
T. D
ET
AIL
FY2019 ANNUAL BUDGET - 97
CRIMINAL DIVISION
PERFORMANCE MEASURESDEPARTMENT/DIVISION OBJECTIVE: Effectively and efficiently prosecute those charged with crimes in Lehi City.
PERFORMANCE MEASURE QUICK VIEW
ACTUAL FY 2016
ACTUAL FY 2017
TARGET FY 2018
ACTUAL FY 2018
TARGET FY 2019
Criminal Informations filed by Prosecution N/A - 1,777 1,977 1,898 1,977Criminal Informations closed N/A - 1,441 1,641 1,637 1,641
*These are new measures that will be tracked moving forward.
BUDGET INFORMATION
DEPARTMENT 48 ACTUALFY 2016
ACTUALFY 2017
ESTIMATEDFY 2018
PLANNEDFY 2019
Expenditures: 10 Salaries & Wages $ 302,732 $ 301,703 $ 345,860 $ 364,692 13 Employee Benefits 115,943 115,458 136,617 137,558 21 Books, Subscriptions, & Memberships 7,079 5,671 6,500 6,500 23 Travel & Training 2,426 2,479 5,500 5,500 24 Office Supplies 1,926 1,678 5,000 5,000 26 IT Fund Charges 8,000 8,000 8,000 8,000 27 Utilities 607 783 500 500 29 Risk Management Fund Charges 2,000 2,000 2,000 2,000 31 Professional & Technical 29,345 28,162 40,000 40,000 32 Prosecutor Outside Counsel 30,000 24,704 30,000 30,000 33 Miscellaneous 622 1,887 2,500 2,500TOTAL EXPENDITURES $ 500,680 $ 492,525 $ 582,477 $ 602,250
RECORDS AND ELECTIONS
PERFORMANCE MEASURES
DEPARTMENT/DIVISION OBJECTIVE: Accurately keep records in accordance with legal requirements and make them available to the public.
PERFORMANCE MEASURE QUICK VIEW
ACTUAL FY 2016
ACTUAL FY 2017
TARGET FY 2018
ACTUAL FY 2018
TARGET FY 2019
Percent of department’ records officers trained on Open Meetings Act 30% 100% 100% 100% 100%
Percent of departments’ records officers trained on GRAMA & records retention 30% 30% 50% 50% 100%

GE
NE
RA
L F
UN
D -
DE
PT
. DE
TA
IL
FY2019 ANNUAL BUDGET - 98
BUDGET INFORMATION
DEPARTMENT 43 ACTUALFY 2016
ACTUAL FY 2017
ESTIMATEDFY 2018
PLANNEDFY 2019
Expenditures: 10 Salaries & Wages $ 74,615 $ 76,850 $ 77,948 $ 82,052 13 Employee Benefits 32,785 34,089 36,308 37,560 21 Books, Subscriptions, & Memberships 295 555 5,000 5,000 22 Public Notices 935 370 7,500 7,500 23 Travel & Training 160 1,200 4,000 4,000 24 Office Supplies 491 4,917 2,500 2,500 26 IT Fund Charges 4,000 4,000 4,000 4,000 27 Utilities - - 750 750 28 Equipment Maintenance - 25,530 20,800 20,800 29 Risk Management Fund Charges 1,000 1,000 1,000 1,000 31 Professional & Technical 2,119 7,018 12,100 12,100 45 Miscellaneous - - - - 46 Election Expense 88,474 - 90,000 - 47 Ordinance Book Update 3,710 - - - 54 Capital Outlay 19,698 - - -TOTAL EXPENDITURES $ 228,282 $ 155,529 $ 261,905 $ 177,263
FEES
DEPARTMENT 43 APPROVEDFY 2016
APPROVED FY 2017
APPROVED FY 2018
APPROVED FY 2019
Election registration $ 35 $ 35 $ 35 35Audio recording CD/meeting 5 5 5 5GRAMA request rates/hour: Department heads 55 55 55 55 Supervisory staff 45 45 45 45 Professional staff 35 35 35 35 Support staff 25 25 25 25GRAMA request copies: GIS maps: 24” x 36” color 10 10 10 10 17” x 24” color 5 5 5 5 11” x 17” color 3 3 3 3 >24” x 36”/linear foot 2 2 2 2 Other GRAMA copies: Up to 11” x 17” color 0.25 0.25 0.25 0.25 Up to 11” x 17” black & white 0.10 0.10 0.10 0.10Business License: Solicitor 50/solicitor 50/solicitor 50/solicitor 50/solicitor

GE
NE
RA
L F
UN
D - D
EP
T. D
ET
AIL
FY2019 ANNUAL BUDGET - 99
LEISURE SERVICES
THE MISSION OF THE LEISURE SERVICES DEPARTMENT IS TO ENRICH THE LIVES OF LEHI’S RESIDENTS BY PROVIDING HIGH-QUALITY RECREATIONAL AND EDUCATIONAL OPPORTUNITIES AT A MINIMUM COST.
Provide high-quality programs and services designed for Lehi families.
DEPARTMENT DESCRIPTIONThe Leisure Services Department, managed directly by the assistant city administrator, is composed of three divisions: the Recreation Division, the Library Division, and the Literacy Center Division.
The Recreation Division is responsible for offering health, recreation, aquatic, and social activities to residents in the Lehi community at the lowest possible cost. The division includes sports, aquatics, the Legacy Center (Lehi’s recreation center), senior services, and community programs. While senior services are funded through the general fund, the remaining sections of the Recreation Division, with the accompanying outdoor pool, is funded through a Special Revenue Fund. See pages 143-155 for detailed budget information regarding the Outdoor Pool and Recreation Special Revenue Funds.
The Library Division is responsible for managing and controlling book and document circulation and purchasing. The Library is also responsible for updating and maintaining all information services, providing Internet access to users, computer use, and responding to the needs of the residents.
The Literacy Center Division is responsible for managing the Lehi-Rippy Literacy Center, which was founded by William and Hesther Rippy in 1998. Lehi City supports the Literacy Center by providing staff and facilities. The Literacy Center specializes in teaching reading, mathematics, computer skills, and language skills to all ages on a personal level at no cost.
Percent of General Fund Budget
6%

GE
NE
RA
L F
UN
D -
DE
PT
. DE
TA
IL
FY2019 ANNUAL BUDGET - 100
POSITION ACTUALFY 2015
ACTUALFY 2016
ACTUALFY 2017
ACTUALFY 2018
PLANNEDFY 2019
Recreation Division (21, 22, 68) 80.15 80.65 81.65 81.65 81.55Library Division (74) 20.43 21.43 21.00 21.00 21.93Literacy Center Division (75) 6.25 6.25 9.00 9.00 9.00TOTAL FTE 106.83 108.33 111.65 111.95 112.48Detailed staffing information is found under each division description.
RIPPY LITERACY CENTER
Nancy Weitzel
LIBRARYDIVISION
Kristi Seely
RECREATION DIVISION
Dan Harrison
ASSISTANT TO THE CITY ADMINISTRATOR
Cameron Boyle

GE
NE
RA
L F
UN
D - D
EP
T. D
ET
AIL
FY2019 ANNUAL BUDGET - 101
RECREATION
Information about the Recreation Division Special Revenue Fund can be found on page 143.
SENIOR SERVICES
POSITION ACTUALFY 2015
ACTUALFY 2016
ACTUALFY 2017
ACTUALFY 2018
PLANNEDFY 2019
Full-time:Senior Citizen Manager 1.00 1.00 1.00 1.00 1.00Senior Services Program Coordinator - - - 1.00 1.00
Part-Time Non-benefited:Senior Services Program Coordinator - - 0.50 - -Senior Citizen Aide 1.00 1.00 1.00 1.50 1.50
TOTAL FTE 2.00 2.00 2.50 3.50 3.50
PERFORMANCE MEASURESDEPARTMENT/DIVISION OBJECTIVE: Provide the highest quality of services to the senior residents of Lehi City and the surrounding community.
PERFORMANCE MEASURE QUICK VIEW
ACTUAL FY 2016
ACTUAL FY 2017
TARGET FY 2018
ACTUAL FY 2018
TARGET FY 2019
Average Daily Attendance - 28 30 26 30
Lunches Served per FTE - 3,240 3,300 3,232 3,300
Senior Citizen Aide (3)
Program Coordinator
SENIOR CENTER MANAGER
Jan Kirkham-Jonsson
RECREATIONMANAGER
Dan Harrison

GE
NE
RA
L F
UN
D -
DE
PT
. DE
TA
IL
FY2019 ANNUAL BUDGET - 102
BUDGET INFORMATION
DEPARTMENT 68 ACTUALFY 2016
ACTUALFY 2017
ESTIMATEDFY 2018
PLANNED FY 2019
Expenditures: 10 Salaries & Wages $ 83,794 $ 103,599 $ 129,718 $ 155,870 13 Employee Benefits 25,857 28,198 52,145 55,252 23 Travel & Training 362 4,632 8,000 52,150 24 Office Supplies 1,133 4,478 4,000 4,000 26 Buildings & Grounds O & M 371 2,500 2,500 1,500 27 Utilities - - 2,000 2,000 30 Electricity - Lehi City Power - - 6,500 6,500 31 Professional & Technical - - 1,650 1,650 38 Meal Management 23,564 21,960 23,000 23,000 45 Miscellaneous 595 969 9,000 9,000 54 Capital Outlay - 9,834 - -Total Expenditures $ 135,676 $ 176,170 $ 238,513 $ 310,922
FEES
DEPARTMENT 68 APPROVEDFY 2016
APPROVED FY 2017
APPROVED FY 2018
APPROVED FY 2019
Membership - Annual $ - $ - $ 5 $ 5Lunch (Mountainland Association of Govts.): Over 60 (suggested donation) 3 3 3 3 + salad 0.25 - - - + case of 24 Ensure 20 20 20 20 Under 60 4.90 6 6 6 + salad 0.75 - - -Facility rental: Small room rental 25 25 25 25 Over 60 / hour (birthday or anniversary) 25 25 25 25 Other / hour 50 50 50 50 Non-resident / hour 60 60 60 60 + deposit 500 500 500 500
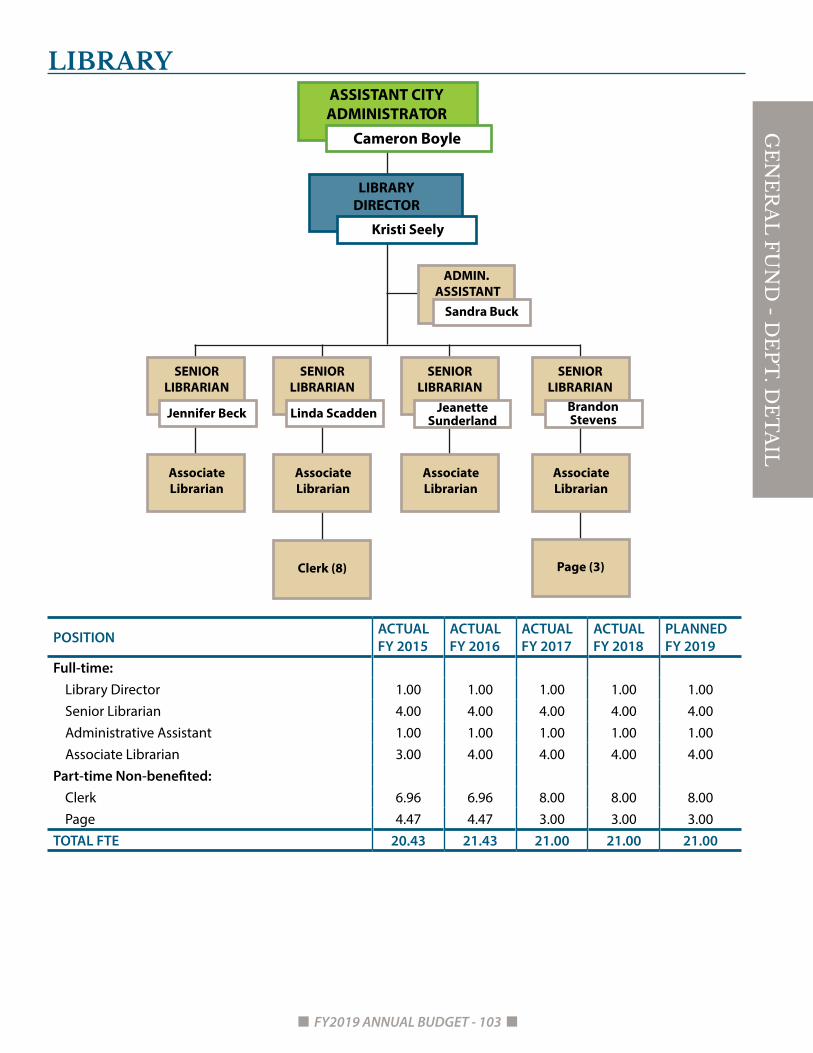
GE
NE
RA
L F
UN
D - D
EP
T. D
ET
AIL
FY2019 ANNUAL BUDGET - 103
LIBRARY
POSITION ACTUALFY 2015
ACTUALFY 2016
ACTUALFY 2017
ACTUALFY 2018
PLANNED FY 2019
Full-time:Library Director 1.00 1.00 1.00 1.00 1.00Senior Librarian 4.00 4.00 4.00 4.00 4.00Administrative Assistant 1.00 1.00 1.00 1.00 1.00Associate Librarian 3.00 4.00 4.00 4.00 4.00
Part-time Non-benefited:Clerk 6.96 6.96 8.00 8.00 8.00Page 4.47 4.47 3.00 3.00 3.00
TOTAL FTE 20.43 21.43 21.00 21.00 21.00
LIBRARY DIRECTOR
Kristi Seely
ASSISTANT CITY ADMINISTRATOR
Cameron Boyle
Page (3)
Associate Librarian
Associate Librarian
Clerk (8)
Associate Librarian
Associate Librarian
SENIORLIBRARIAN
Jennifer Beck
SENIORLIBRARIAN
SENIORLIBRARIAN
Jeanette Sunderland
SENIORLIBRARIAN
Brandon Stevens
ADMIN. ASSISTANT
Sandra Buck
Linda Scadden

GE
NE
RA
L F
UN
D -
DE
PT
. DE
TA
IL
FY2019 ANNUAL BUDGET - 104
PERFORMANCE MEASURESDEPARTMENT/DIVISION OBJECTIVE: Increase the number of online resources for our community and provide quarterly activities for families.
PERFORMANCE MEASURE QUICK VIEW
ACTUAL FY 2016
ACTUAL FY 2017
TARGET FY 2018
ACTUAL FY 2018
TARGET FY 2019
Total Holdings Per Capita 2.00 1.71 2.00 1.96 1.92
Number of E-Holdings 5,270 6,283 6,500 7,076 7,600
Number of E-Checkouts 64,589 95,048 100,000 54,824 55,000
Number of Family-Related Activities - 4 4 4 4
Circulation Rate per Patron 21 22 23 20.928 22
BUDGET INFORMATION
DEPARTMENT 74 ACTUALFY 2016
ACTUAL FY 2017
ESTIMATEDFY 2018
PLANNEDFY 2019
Expenditures: 10 Salaries & Wages $ 587,285 $ 639,124 $ 630,170 $ 664,034 13 Employee Benefits 224,638 246,146 267,894 287,346 21 Books 173,016 170,312 175,000 185,000 22 Subscriptions 9,982 5,126 10,000 10,000 23 Travel & Training 1,160 1,945 7,000 7,000 24 Office Supplies 12,750 17,349 22,000 22,000 25 Equipment Maintenance 39,955 43,633 50,317 50,317 26 Buildings & Grounds O & M 1,008 1,079 1,000 2,000 27 Utilities 5,155 6,270 10,000 10,000 28 Story Hour Expense 8,852 8,071 8,250 8,250 29 Risk Management Fund Charges 5,000 5,000 5,000 5,000 30 Electricity - Lehi City Power 19,737 18,598 18,000 18,000 31 Professional & Technical 2,843 3,082 5,000 5,000 34 Collections 1,924 826 2,000 2,000 36 IT Fund Charges 50,000 50,000 50,000 50,000 45 Miscellaneous 711 11,696 10,330 10,330 54 Capital Outlay 5,004 16,921 - -
TOTAL EXPENDITURES $ 1,149,020 $ 1,245,178 1 ,271,961 1 ,336,277

GE
NE
RA
L F
UN
D - D
EP
T. D
ET
AIL
FY2019 ANNUAL BUDGET - 105
FEES
DEPARTMENT 74 APPROVEDFY 2016
APPROVEDFY 2017
APPROVED FY 2018
APPROVED FY 2019
Library Card: Resident Free Free Free Free Non-resident / year $ 80 $ 80 $ 80 $ 80 Non-resident / 6 months 40 40 40 40 Internet Only / year 25 25 25 25 Replacement of card 3 3 3 3Check Out Fees DVD / week 1 1 1 1 Video / week 1 1 1 1 Inter-library loan materials - 5 5 5 Inter-library loan kits - 10 10 10Copies: Letter size 0.10 0.10 0.10 0.10 Legal size 0.15 0.15 0.15 0.15Printing - 0.10 0.10 0.10Opaque projector use / hour 1 1 1 1Inter-library loan 5 5 4.50 5Internet use: Resident Free Free Free Free Non-resident / hour 1 1 1 1Fines: Overdue book / day / book 0.10 0.10 0.10 0.10 Inter-library loan overdue book / day / book 1 2 2 2 Overdue video / day / video 1 1 1 1 Minor damage (in some cases / page) 1 - 10 2-14 2-14 2-14 Major Damage (not repairable) full cost full cost full cost full cost

GE
NE
RA
L F
UN
D -
DE
PT
. DE
TA
IL
FY2019 ANNUAL BUDGET - 106
LITERACY CENTER
POSITION ACTUALFY 2015
ACTUALFY 2016
ACTUALFY 2017
ACTUALFY 2018
PLANNED FY 2019
Full-time:Literacy Center Manager 1.00 1.00 1.00 1.00 1.00Program Specialist 1.00 1.00 1.00 1.00 1.00
Part-time Non-benefited:Staff - 25 Hours/Week - - - 1.875 1.875Staff - 10-15 Hours/Week - - - 4.125 4.125Teacher 1.25 1.25 2.00 - -
Seasonal/Temporary:Staff 3.00 3.00 5.00 - -
TOTAL FTEs 6.25 6.25 9.00 8.00 8.00
LITERACY CENTERMANAGER
Nancy Weitzel
ASSISTANT CITY ADMINISTRATOR
Cameron Boyle
VolunteersLiteracyProgram
Specialist

GE
NE
RA
L F
UN
D - D
EP
T. D
ET
AIL
FY2019 ANNUAL BUDGET - 107
PERFORMANCE MEASURESDEPARTMENT/DIVISION OBJECTIVE: Provide the highest quality educational opportunities to Lehi residents and increase the overall education of Lehi children.
PERFORMANCE MEASURE QUICK VIEW
ACTUAL FY 2016
ACTUAL FY 2017
TARGET FY 2018
ACTUAL FY 2018
TARGET FY 2019
Total Literacy Center Participants 1,012 656 800 946 1040
Hours of Literacy Center Service Provided - - - 161,620 177,782
DEPARTMENT/DIVISION OBJECTIVE: Provide quality volunteer opportunities to qualified individuals.
PERFORMANCE MEASURE QUICK VIEW
ACTUAL FY 2016
ACTUAL FY 2017
TARGET FY 2018
ACTUAL FY 2018
TARGET FY 2019
Literacy Center Volunteer Hours 5,497 5,969 6,100 6,243 6300
Literacy Center Volunteer Tutors 274 342 400 717 788
Presidential Awards for Volunteerism Awarded 84 98 100 125 137
BUDGET INFORMATION
DEPARTMENT 75 ACTUALFY 2016
ACTUALFY 2017
ESTIMATEDFY 2018
PLANNEDFY 2019
Expenditures: 10 Salaries & Wages $ 173,292 $ 177,597 $ 235,420 242,550 13 Employee Benefits 58,474 66,566 66,566 68,422 22 Books, Subscriptions, & Memberships 795 - 500 500 23 Travel & Training 598 - 1,000 1,000 24 Office Supplies 6,329 7,303 3,500 5,000 26 Buildings & Grounds O & M - - - 1,500 27 Utilities 466 5,136 1,000 1,000 28 Equipment Maintenance 416 - 750 750 29 Risk MGMT Fund Charges - - - 5,000 31 Professional & Technical - 1,463 2,500 2,500 Literacy Foundation Expenses 19,160 6,377 - - 36 IT Fund Charges - - - 5,000 45 Miscellaneous 2,071 3,437 6,000 6,000TOTAL EXPENDITURES $ 261,601 $ 256,913 $ 317,236 $ 339,222

GE
NE
RA
L F
UN
D -
DE
PT
. DE
TA
IL
FY2019 ANNUAL BUDGET - 108
POLICE
THE POLICE DEPARTMENT WILL PROVIDE A SAFE AND SECURE COMMUNITY BY DELIVERING PROFESSIONAL AND COURTEOUS SERVICES AS DETERMINED IN PARTNERSHIP WITH LEHI RESIDENTS. THE DEPARTMENT IS DEDICATED TO THE FOLLOWING FIVE VALUES: (1) FOSTERING THE PUBLIC TRUST, (2) ETHICAL JUDGMENTS, (3) PROACTIVE PREVENTION AND ENFORCEMENT, (4) CREATIVE SERVICE DELIVERY, AND (5) FAIRNESS IN ENFORCEMENT OF THE LAW.
Provide professional police services focused on citizen engagement and transparency.
DEPARTMENT DESCRIPTIONThe Police Department’s function is to serve and protect all people and property within the City limits. This is done through the coordinated efforts of patrol officers, detectives, code enforcement officers, and animal control officers. Detectives are responsible for investigating and solving crimes that are carried out by criminals in a covert manner. Patrol officers are responsible for enforcing traffic laws and ensuring the safety of persons within the City limits. Code enforcement officers are responsible for ensuring that properties in Lehi are maintained according to ordinance. Animal control officers are responsible for enforcing the animal control ordinance of the City and protecting residents from violent and destructive animals.
Percent of General Fund Budget
22%

GE
NE
RA
L F
UN
D - D
EP
T. D
ET
AIL
FY2019 ANNUAL BUDGET - 109
Onyx
K-9 PARTNERS
DjangoMokiKuli
POLICE CHIEF
Darren Paul
RECORDS & DISPATCH
Kim Street
RecordsClerk (3) Dispatcher (2)
DEPUTY POLICE CHIEF
PATROLPROFESSIONAL
STANDARDSINVESTIGATIONS
Lt. Toby Peterson Lt. Kenny Rose
Crossing Guards
Sergeant (5)
Victim Services (1.5)
VIPS (9)
EvidenceTechnician
Sergeant (2)
SWAT
Sergeant (4)
Corporal (4)Corporal (5)
Sergeant

GE
NE
RA
L F
UN
D -
DE
PT
. DE
TA
IL
FY2019 ANNUAL BUDGET - 110
POSITION ACTUALFY 2015
ACTUALFY 2016
ACTUALFY 2017
ACTUALFY 2018
PLANNED FY 2019
Full-time:Police Chief 1.00 1.00 1.00 1.00 1.00Deputy Police Chief 1.00 1.00 1.00 1.00 1.00Police Lieutenant 2.00 2.00 3.00 3.00 3.00Police Sergeant 7.00 8.00 10.00 10.00 10.00Police Corporal - - 10.00 10.00 9.00Police Officer III 7.00 13.00 1.00 5.00 5.00Police Officer II 4.00 1.00 9.00 7.00 11.00Police Officer I 21.00 19.00 16.00 17.00 14.00Code Enforcement Officer 2.00 2.00 - - -Victim Advocate Coordinator 1.00 1.00 1.00 1.00 1.00Animal Control Officer 1.00 1.00 1.00 1.00 1.00Administrative Assistant 1.00 1.00 1.00 1.00 1.00Evidence Technician 1.00 1.00 1.00 1.00 1.00Records Clerk 1.00 1.00 1.00 1.00 1.00Front Desk Secretary/Dispatcher 2.00 2.00 2.00 2.00 2.00
Part-Time Non-benefited:Reports Clerk/Records Assistant 0.50 1.00 1.00 0.50 0.50Front Desk Secretary/Dispatcher - - - 1.50 1.50Victim Advocate - - - 0.50 0.50Crossing Guard Coordinator - - 0.50 0.50 0.50Crossing Guard 12.95 12.45 12.45 12.45 12.45
TOTAL FTE 65.45 67.45 71.95 76.45 76.45
PERFORMANCE MEASURESDEPARTMENT/DIVISION OBJECTIVE: Maintain a low crime rate compared to other Utah cities and improve community safety through traffic enforcement and crime prevention.
PERFORMANCE MEASURE QUICK VIEW
ACTUAL FY 2016
ACTUAL FY 2017
TARGET FY 2018
ACTUAL FY 2018
TARGET FY 2019
Total Estimated Crime Index 749 695 700 847 750
Crimes per 1,000 Residents 14.60 18.33 12.00 14.10 -
Average Response Time - Priority 1 (minutes) 7:52 8:52 6:00 7:53 7:30
Average Response Time - Excluding Priority 1 (minutes) 15:28 12:11 12:00 11:59 11:30
Community Events - 4 4 9 10
Resident Satisfaction: Police services (out of a score of 100) 81.8 82.5 85 82.9 84
Resident Satisfaction: Feel safe in their neighborhood (out of a score of 100) 94 90 96 92 94
Cases Reaching Disposition - 18,368 5,750 12,344 13,000
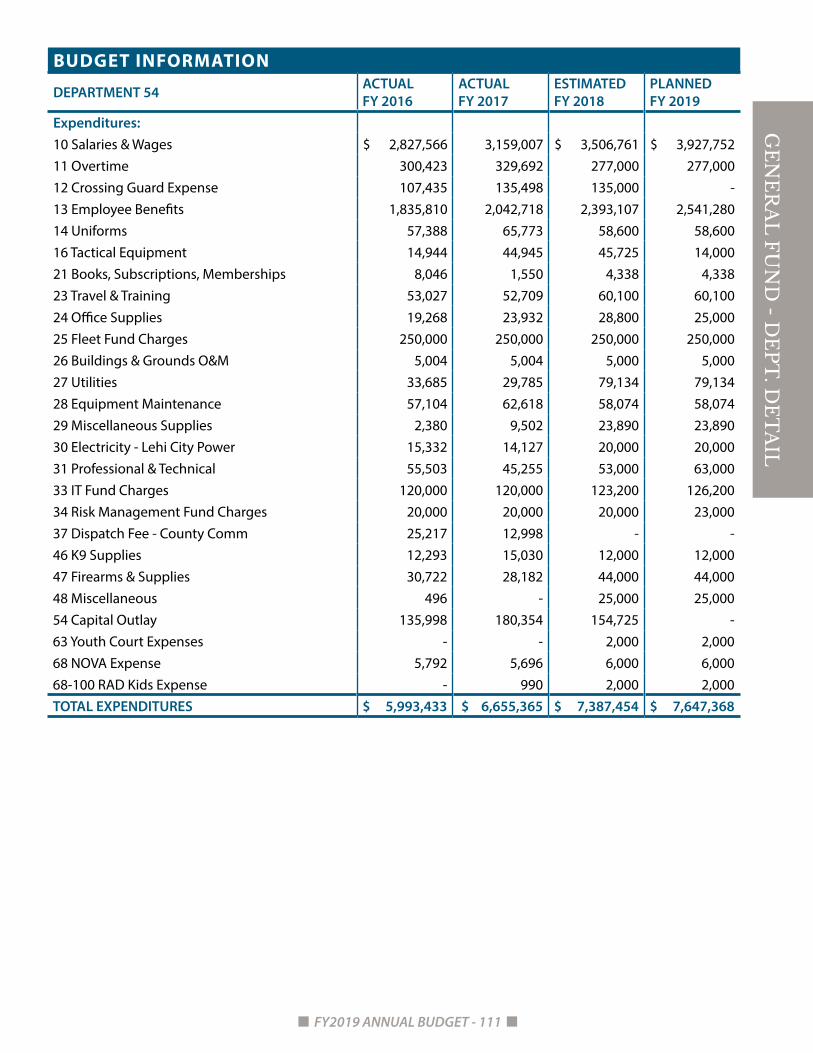
GE
NE
RA
L F
UN
D - D
EP
T. D
ET
AIL
FY2019 ANNUAL BUDGET - 111
BUDGET INFORMATION
DEPARTMENT 54 ACTUALFY 2016
ACTUALFY 2017
ESTIMATEDFY 2018
PLANNED FY 2019
Expenditures:10 Salaries & Wages $ 2,827,566 3,159,007 $ 3,506,761 $ 3,927,75211 Overtime 300,423 329,692 277,000 277,00012 Crossing Guard Expense 107,435 135,498 135,000 -13 Employee Benefits 1,835,810 2,042,718 2,393,107 2,541,28014 Uniforms 57,388 65,773 58,600 58,60016 Tactical Equipment 14,944 44,945 45,725 14,00021 Books, Subscriptions, Memberships 8,046 1,550 4,338 4,33823 Travel & Training 53,027 52,709 60,100 60,10024 Office Supplies 19,268 23,932 28,800 25,00025 Fleet Fund Charges 250,000 250,000 250,000 250,00026 Buildings & Grounds O&M 5,004 5,004 5,000 5,00027 Utilities 33,685 29,785 79,134 79,13428 Equipment Maintenance 57,104 62,618 58,074 58,07429 Miscellaneous Supplies 2,380 9,502 23,890 23,89030 Electricity - Lehi City Power 15,332 14,127 20,000 20,00031 Professional & Technical 55,503 45,255 53,000 63,00033 IT Fund Charges 120,000 120,000 123,200 126,20034 Risk Management Fund Charges 20,000 20,000 20,000 23,00037 Dispatch Fee - County Comm 25,217 12,998 - -46 K9 Supplies 12,293 15,030 12,000 12,00047 Firearms & Supplies 30,722 28,182 44,000 44,00048 Miscellaneous 496 - 25,000 25,00054 Capital Outlay 135,998 180,354 154,725 -63 Youth Court Expenses - - 2,000 2,00068 NOVA Expense 5,792 5,696 6,000 6,00068-100 RAD Kids Expense - 990 2,000 2,000TOTAL EXPENDITURES $ 5,993,433 $ 6,655,365 $ 7,387,454 $ 7,647,368

GE
NE
RA
L F
UN
D -
DE
PT
. DE
TA
IL
FY2019 ANNUAL BUDGET - 112
BUDGET INFORMATION - CODE ENFORCEMENT
DEPARTMENT 53 ACTUALFY 2016
ACTUAL FY 2017
ESTIMATEDFY 2018
PLANNEDFY 2019
Expenditures:10 Salaries & Wages $ 56,881 $ 48,608 $ 57,864 63,00411 Overtime 4,463 3,574 - 3,00013 Employee Benefits 41,900 35,765 45,600 48,01025 Fleet Fund Charges 12,000 12,000 12,000 12,00026 IT Fund Charges 4,000 4,000 4,000 4,00029 Risk Management Fund Charges 1,000 1,000 1,000 1,00031 Professional & Technical - 425 5,000 5,00033 Miscellaneous - 587 294 294TOTAL EXPENDITURES $ 120,244 $ 105,959 $ 125,758 $ 136,308
BUDGET INFORMATION - ANIMAL CONTROL
DEPARTMENT 57 ACTUALFY 2016
ACTUALFY 2017
ESTIMATEDFY 2018
PLANNEDFY 2019
Expenditures:10 Salaries & Wages $ 43,533 $ 48,419 $ 47,795 $ 51,67011 Overtime 268 175 4,000 4,00013 Employee Benefits 37,449 28,817 41,350 43,22714 Uniforms 1,200 1,200 1,800 1,80025 Fleet Fund Charges 4,000 4,000 4,000 4,00027 IT Fund Charges 2,000 2,000 2,000 2,00028 Equipment Maintenance 100 262 300 30031 Professional & Technical 66,631 82,598 68,000 80,00054 Capital Outlay - - - -TOTAL EXPENDITURES $ 155,431 $ 167,471 $ 169,244 $ 186,997

GE
NE
RA
L F
UN
D - D
EP
T. D
ET
AIL
FY2019 ANNUAL BUDGET - 113
FEES
DEPARTMENT 54 APPROVEDFY 2016
APPROVED FY 2017
APPROVED FY 2018
APPROVED FY 2019
Traffic School (+ Plea in Abeyance Fine) $ 65 $ 65 $ 65 $ 65Small Claims (Est. by Utah State Code): Up to $2,000 60 60 60 60 $2,001-$7,499 100 100 100 100 $7,500-$10,000 185 185 185 185 Counterclaim up to $2,000 50 50 50 50 Counterclaim $2,001-$7,499 70 70 70 70 Counterclaim $7,500-$10,000 120 120 120 120 Appeal 10 10 10 10Police Report Copies: Resident 5 5 5 5 Or / Page (Whichever is Greater) 0.25 0.25 0.25 0.25 Non-Resident 15 15 15 15 Or / Page (Whichever is Greater) 0.25 0.25 0.25 0.25Video Tape or CD / Copy 30 30 30 30Processed Color Photo 25 25 25 25Digital Color Photo Printout / Page 5 5 5 5Fingerprinting: Resident 10 10 10 10 Non-Resident 25 25 25 25False Alarm: Intrusion/Burglar (If > 3/Year) / Alarm 100 100 100 100 Duress/Hold-Up (If > 3/Year) / Alarm 100 100 100 100Impact Fee: Residential / Unit 220 98 98.35 98 Non-Residential / Bldg. Sq. Ft. (1 ERU min) 0.045 - - -Animal Shelter (Established by NUVAS) Dog License (Spayed or Neutered) 15 15 15 15 Dog License (Not Spayed or Neutered) 30 30 30 35

GE
NE
RA
L F
UN
D -
DE
PT
. DE
TA
IL
FY2019 ANNUAL BUDGET - 114
PUBLIC WORKS
THE PUBLIC WORKS DEPARTMENT PROVIDES QUALITY SERVICES TO LEHI RESIDENTS THROUGH (1) STRONG LEADERSHIP, (2) EXCELLENT TECHNICAL SKILLS, AND (3) EXPERIENCEDADMINISTRATIVE SUPPORT. THE DEPARTMENT WILL MAINTAINFACILITIES, PROPERTY, AND EQUIPMENT WHILE PROVIDING ANAESTHETICALLY PLEASING AND SAFE COMMUNITY.
Maintain the city’s infrastructure and facilities at the lowest cost and highest level of efficiency through cutting-edge technology, innovative solutions, and
strong leadership.
DEPARTMENT DESCRIPTIONThe Public Works Department is responsible for the general supervision of the Parks and Facilities, Streets, and Fleet Divisions. The department is also responsible for clerical services, long-range planning and short-term coordination among these divisions.
The Parks and Facilities Division is responsible for the maintenance of all open recreation and leisure spaces and City buildings within Lehi. The division performs park improvements and maintenance, building improvements and janitorial services, public grounds maintenance, and cemetery service and maintenance. The Buildings and Grounds fund information can be found on page 185.
The Streets Division is responsible for the repair of streets, sidewalk, curbs, and gutters. It is also responsible for the removal of snow and ice from streets and roads in the winter.
The Fleet Division is responsible for the acquisition and maintenance of all City-owned vehicles. The Fleet Fund is an internal service fund that charges fees for each vehicle and the costs associated with maintenance of such vehicles. The revenue collected from these fees is intended to cover both the full operating and long-term capital costs of the services provided. A description of this fund is found on page 183.
Percent of General Fund Budget
13%

GE
NE
RA
L F
UN
D - D
EP
T. D
ET
AIL
FY2019 ANNUAL BUDGET - 115
ADMINISTRATIVE ASSISTANT
PUBLIC WORKS DIRECTOR
Todd Munger
MechanicStreet Inspections
Street Maintenance
Pavement Management
Sign Maintenance
Grading
Parks Maintenance
Physical Facilities
Cemetery
STREETS DIVISION
Wade Allred
FLEET DIVISION
Jeremy Estes
PARKS & FACILITIES DIVISION
Steve Marchbanks
POSITION ACTUALFY 2015
ACTUALFY 2016
ACTUALFY 2017
ACTUAL FY 2018
PLANNED FY 2019
Full-time:Public Works Director 1.00 1.00 1.00 1.00 1.00Administrative Assistant 1.00 0.50 1.00 1.00 1.00
Parks (64) 30.00 33.00 29.00 29.00 32.00Streets (61) 14.75 14.75 15.75 17.75 17.75Fleet (64) 2.00 2.50 4.00 4.00 4.00TOTAL FTE 48.75 52.25 56.75 58.75 61.75Detailed staffing information is found under each division description.

GE
NE
RA
L F
UN
D -
DE
PT
. DE
TA
IL
FY2019 ANNUAL BUDGET - 116
PUBLIC WORKS ADMINISTRATION
BUDGET INFORMATION
DEPARTMENT 62 ACTUALFY 2016
ACTUALFY 2017
ESTIMATEDFY 2018
PLANNEDFY 2019
Expenditures: 10 Salaries & Wages $ 97,542 $ 144,440 $ 147,126 $ 155,175 13 Employee Benefits 47,314 75,175 81,546 84,171 21 Books, Subscriptions, Memberships 1,020 - - - 23 Travel & Training 3,455 2,809 3,000 3,000 24 Office Supplies 2,912 1,360 2,600 2,600 25 Fleet Fund Charges 4,000 4,000 4,000 4,000 26 IT Fund Charges 6,000 6,000 6,000 6,000 27 Utilities 2,684 583 - - 28 Equipment Maintenance 619 - 500 500 29 Risk Management Fund Charges 1,500 1,500 1,500 1,500 31 Professional & Technical 2,121 1,761 2,500 2,500 45 Miscellaneous 100 653 - -Total Expenditures $ 169,267 $ 238,281 $ 248,772 $ 259,446

GE
NE
RA
L F
UN
D - D
EP
T. D
ET
AIL
FY2019 ANNUAL BUDGET - 117
PARKS
Spor
ts P
ark
Wor
ker (
2)
Leis
ure
Park
s W
orke
r (5)
PT L
abor
er (2
.5)
Leis
ure
Park
s Le
ad W
orke
rM
echa
nica
l H
VAC
Wor
ker
Mai
nten
ance
W
orke
r
Cem
eter
y W
orke
r
Cem
eter
y Le
ad
Spor
ts P
ark
Lead
Wor
ker
Adm
inis
trat
ive
Ass
ista
nt
PARK
S &
FA
CILI
TIES
SU
PERI
NTE
ND
ENT
Stev
e M
arch
bank
s
PUBL
IC W
ORK
S D
IREC
TOR
Todd
Mun
ger
Cust
odia
l W
orke
r (2)
Ass
ista
nt P
arks
Supe
rint
ende
nt
Jaso
n Bo
nd
Lead
Elec
tric
ian
Dax
Pec
k
Cust
odia
l Lea
d
Kirk
Bar
ratt
Mai
nten
ance
Le
ad
Jaso
n A
shle
y
Mec
hani
cal
HVA
C Le
ad
Russ
ell C
lark
Cem
eter
y Se
xton
Shaw
n W
inte
rs
Irri
gati
on
Wor
ker
Trai
ls, T
rees
, &
Ope
n Sp
ace
Lead
Wor
ker
Trai
ls, T
rees
, &
Ope
n Sp
ace
Wor
ker
Faci
lity
Insp
ecto
r/Pr
ojec
t Mgr
Pest
icid
e &
Ir
riga
tion
Sp
ecia
list

GE
NE
RA
L F
UN
D -
DE
PT
. DE
TA
IL
FY2019 ANNUAL BUDGET - 118
POSITION ACTUALFY 2015
ACTUALFY 2016
ACTUALFY 2017
ACTUAL FY 2018
PLANNED FY 2019
Full-time:Parks & Facilities Superintendent 1.00 1.00 1.00 1.00 1.00Assistant Parks & Facilities Superintendent - - 1.00 1.00 1.00Custodial Lead - - - - 1.00Custodial Worker 1.00 1.00 2.00 2.00 2.00Facility Inspector/Project Manager 1.00 1.00 1.00 1.00 1.00Sports Park Lead - - - - 1.00Sports Park Worker - - - - 2.00Leisure Parks Lead - - - - 1.00Leisure Parks Worker - - - - 5.00Lead Electrician - - - - 1.00Mechanical HVAC Lead 1.00 1.00 1.00 1.00 1.00Mechanical HVAC Worker - - - - 2.00Maintenance Lead 2.00 2.00 1.00 1.00 1.00Maintenance Worker - - - - 1.00Pesticide & Irrigation Specialist 1.00 1.00 1.00 1.00 1.00Irrigation Worker - - - - 1.00Trails, Trees, and Open Space Lead - - - - 1.00Trails, Trees, and Open Space Worker - - - - 2.00Cemetery Sexton 1.00 1.00 1.00 1.00 1.00Cemetery Lead 1.00 1.00 1.00 1.00 1.00Cemetery Worker 1.00 1.00 1.00 1.00 1.00Facilities Maintenance Worker II 2.00 2.00 - - -Facilities Maintenance Worker I - - 2.00 2.00 -Lead Park Maintenance Worker 1.00 1.00 2.00 2.00 -Park Maintenance Worker II 2.00 2.00 1.00 1.00 -Park Maintenance Worker I 5.00 6.00 4.00 4.00 -
Part-time benefited:Cemetery Secretary 0.50 0.50 0.50 0.50 0.50
Seasonal/Temporary:Laborer 7.50 7.50 7.50 7.50 2.50
TOTAL FTE 30.00 33.00 29.00 29.00 32.00*FY 2019 uses updated job titles to more accurately reflect staffing
PERFORMANCE MEASURESDEPARTMENT/DIVISION OBJECTIVE: Ensure the city’s parks, open space, public facilities, and cemetery are maintained at the highest levels of quality and efficiency.
PERFORMANCE MEASURE QUICK VIEW
ACTUAL FY 2016
ACTUAL FY 2017
TARGET FY 2018
ACTUAL FY 2018
TARGET FY 2019
Large Open Space hours/week 35 35 40 36.5 36
Sports Fields hours/week 42 42 40 42 42
Total Building Square Footage per FTE 32,500 32,500 32,500 42,366 42,366
Total Cemetery Acres Maintained per FTE 13 13 13 13 13

GE
NE
RA
L F
UN
D - D
EP
T. D
ET
AIL
FY2019 ANNUAL BUDGET - 119
BUDGET INFORMATION
DEPARTMENT 64 - PARKS MAINTENANCE ACTUALFY 2016
ACTUALFY 2017
ESTIMATEDFY 2018
PLANNEDFY 2019
Expenditures: 10 Salaries & Wages $ 964,851 $ 866,509 $ 1,157,359 $ 1,216,233 11 Overtime 53,360 61,575 30,000 35,000 13 Employee Benefits 366,408 432,810 432,810 468,858 14 Uniforms 3,974 4,618 5,030 7,030 23 Travel & Training 7,503 12,496 5,000 8,000 24 Office Supplies 1,828 6,521 2,000 2,000 25 Fleet Fund Charges 25,000 25,132 25,000 25,000 26 Buildings & Grounds O&M 135,622 121,466 84,500 84,500 27 Utilities 10,864 10,574 7,500 7,500 28 Equipment Maintenance 15,830 39,032 40,000 40,000 29 Risk Management Fund Charges 5,000 5,000 5,000 5,000 30 Electricity - Lehi City Power 60,734 38,027 48,000 48,000 31 Professional & Technical 70,267 120,885 165,500 197,500 32 IT Fund Charges 6,000 6,000 6,000 6,000 38 Tree Trimming 6,968 17,830 20,000 20,000 45 Purchase of Trees 14,844 9,065 20,000 20,000 46 Miscellaneous 14,995 15,501 12,850 12,850 48 Park Maintenance 179,206 16,136 130,000 160,000 49 Park Pavilion & Playground Updates 14,452 55,000 55,000 55,000 54 Capital Outlay 57,430 43,799 14,600 -TOTAL EXPENDITURES $ 2,015,136 $ 1,951,101 $ 2,266,149 $ 2,418,471
DEPARTMENT 51 - PHYSICAL FACILITIES ACTUALFY 2016
ACTUALFY 2017
ESTIMATEDFY 2018
PLANNEDFY 2019*
Expenditures: 10 Salaries & Wages $ 232,577 $ 348,229 $ 436,638 - 11 Overtime 5,396 7,054 - - 13 Employee Benefits 114,358 108,238 105,825 - 14 Uniforms 587 2,088 3,400 - 21 Books, Subscriptions, Memberships - - - - 23 Travel & Training 120 303 - - 24 Office Supplies - 142 1,500 - 25 Fleet Fund Charges 10,000 10,000 10,000 - 26 Buildings & Grounds O&M 125,752 128,032 137,500 - 27 Utilities 2,845 450 3,500 - 28 Equipment Maintenance 189 12,272 13,000 - 32 Risk Management Fund Charges 2,500 2,500 2,500 - 45 Building Beautification Expense 11,753 16,500 16,500 - 46 Miscellaneous 951 5,000 5,000 - 54 Capital Outlay - - 17,000 -TOTAL EXPENDITURES $ 507,028 $ 638,237 $ 752,363 -
*This department’s expenditures have been moved to the Internal Service Fund - Buildings & Grounds

GE
NE
RA
L F
UN
D -
DE
PT
. DE
TA
IL
FY2019 ANNUAL BUDGET - 120
DEPARTMENT 76 - CEMETERY ACTUALFY 2016
ACTUALFY 2017
ESTIMATEDFY 2018
PLANNEDFY 2019
Expenditures: 10 Salaries & Wages $ 242,171 $ 208,661 $ 240,104 $ 251,455 11 Overtime 6,165 1,354 3,500 3,500 13 Employee Benefits 90,381 94,610 114,906 117,325 14 Uniforms 856 811 1,000 1,300 21 Newspaper Expense - - 357 357 24 Office Supplies 1,715 2,097 2,000 2,000 25 Fleet Fund Charges 10,000 10,018 10,000 10,000 26 Cemetery Maintenance 25,098 32,972 24,000 24,000 27 Utilities 7,926 5,315 6,200 6,200 28 Equipment Maintenance 2,182 5,765 16,000 16,000 29 Risk Management Fund Charges 2,000 2,000 2,000 2,000 30 Electricity - Lehi City Power 3,109 3,386 3,000 3,000 31 Professional & Technical 2,480 - 5,000 5,000 32 IT Fund Charges 4,000 4,000 4,000 4,000 45 Purchase of Trees - - 8,500 8,500 46 Miscellaneous 3,044 2,444 5,000 5,000 54 Capital Outlay 14,487 12,104 18,022 -TOTAL EXPENDITURES $ 415,614 $ 385,537 $ 463,589 $ 459,637
FEES
DEPARTMENT 76 - CEMETERY APPROVEDFY 2016
APPROVED FY 2017
APPROVED FY 2018
APPROVED FY 2019
Non-Resident Resident Non-
Resident Resident Non-Resident Resident Non-
Resident Resident
Spaces $1,100 $ 550 $1,100 $ 550 $1,100 $ 550 1,100 550Headstone setting 35 35 35 35 35 35 35 35Interment:
Adult 700 350 700 350 700 350 700 350 Infant 300 200 300 200 300 200 300 200 Cremation 300 200 300 200 300 200 300 200 + on Saturdays and Holidays 250 250 250 250Perpetual care spaces (all 8-space lots sold before 1950)
425 425 425 425
Title/Certificate transfer 50 50 50 50Disinterment: With a standard vault 1,000 1,000 1,200 1,200 Without a vault 1,400 1,400 (Discontinue) - With an air-sealed vault 1,400 1,400 (Discontinue) -

GE
NE
RA
L F
UN
D - D
EP
T. D
ET
AIL
FY2019 ANNUAL BUDGET - 121
FEESDEPARTMENT 64 - PARKS MAINTENANCE
APPROVEDFY 2016
APPROVEDFY 2017
APPROVED FY 2018
APPROVED FY 2019
Pavilion Reservation: Non-Resident Resident Non-
Resident Resident Non-Resident Resident Non-
Resident Resident
Allred Park / full day $ 80 $ 55 $ 80 $ 55 $ 80 $ 55 $ 80 $ 55 Allred Park / half day 55 40 55 40 55 40 55 40 Bandwagon Park East / full day 55 40 55 40 55 40 55 40 Bandwagon Park East / half day 40 25 40 25 40 25 40 25 Bandwagon Park West / full day 55 40 55 40 55 40 55 40 Bandwagon Park West / half day 40 25 40 25 40 25 40 25 Dry Creek Park / full day - - - - 80 55 80 55 Dry Creek Park / half day - - - - 55 40 55 40 Eagle Summit Park / full day - - - - 80 55 80 55 Eagle Summit Park / half day - - - - 55 40 55 40 Outdoor Pool Park / full day 80 55 80 55 80 55 80 55 Outdoor Pool Park / half day 55 40 55 40 55 40 55 40 Sports Complex West / full day - - - - 55 40 55 40 Sports Complex West / half day - - - - 55 40 40 25 Wines Park #1 / full day 80 55 80 55 80 55 80 55 Wines Park #1 / half day 55 40 55 40 55 40 55 40 Wines Park #2 / full day 80 55 80 55 80 55 80 55 Wines Park #2 / half day 55 40 55 40 55 40 55 40 Wines Park #3 / full day 55 40 55 40 55 40 55 40 Wines Park #3 / half day 40 25 40 25 40 25 40 25 Wines Park #4 / full day 55 40 55 40 55 40 55 40 Wines Park $4 / half day 40 25 40 25 40 25 40 25 Olympic Park / full day 80 55 80 55 80 55 80 55 Olympic Park / half day 55 40 55 40 55 40 55 40 Special events maintenance fee / hour 150 125 150 125 150 125 150 125Impact Fee: Residential / dwelling unit 2,600 2,600 2,600 2,600 Multi-family / dwelling unit 2,170 2,170 2,170 2,170

GE
NE
RA
L F
UN
D -
DE
PT
. DE
TA
IL
FY2019 ANNUAL BUDGET - 122
STREETS
POSITION ACTUALFY 2015
ACTUALFY 2016
ACTUALFY 2017
ACTUALFY 2018
PLANNEDFY 2019
Full-time:Streets Superintendent 1.00 1.00 1.00 1.00 1.00Street Maintenance Foreman 1.00 1.00 1.00 1.00 1.00Pavement Management Supervisor 1.00 1.00 1.00 1.00 1.00Street Inspector 1.00 1.00 2.00 2.00 2.00Crew Foreman 1.00 1.00 1.00 1.00 1.00Sign Maintenance Technician 1.00 1.00 1.00 1.00 1.00Grading Supervisor 1.00 1.00 - - -Street Maintenance Worker III 1.00 1.00 1.00 1.00 1.00Street Maintenance Worker II 2.00 2.00 2.00 2.00 3.00Street Maintenance Worker I 4.00 4.00 5.00 7.00 5.00
Seasonal/Temporary:Laborer 0.75 0.75 0.75 0.75 0.00
TOTAL FTE 14.75 14.75 15.75 17.75 16.00
STREETS
SUPERINTENDENT
Wade Allred
PUBLIC WORKS DIRECTOR
Todd Munger
Maintenance Development
Sign Manager Streets Inspector
Pavement Manager
Assistant Inspector
Assistant Superintendent
Streets Crew Foreman
StreetsMaintenance Worker I (5)
StreetsMaintenance Worker II (3)
Streets Maintenance
Worker III

GE
NE
RA
L F
UN
D - D
EP
T. D
ET
AIL
FY2019 ANNUAL BUDGET - 123
PERFORMANCE MEASURES
DEPARTMENT/DIVISION OBJECTIVE: Maintain the city’s streets at the lowest reasonable cost to taxpayers and the highest level of quality and efficiency.
PERFORMANCE MEASURE QUICK VIEW
ACTUAL FY 2016
ACTUAL FY 2017
TARGET FY 2018
ACTUAL FY 2018
TARGETFY 2019
Actual Crack Seal Expenditure $80,000 $30,000 $100,000 $60,000 $80,000-$100,000
Actual Slurry Seal Expenditure $140,000 $90,000 $100,000 $70,000 $150,000-$200,000
Actual Reconstruction Expenditure $750,000 $860,000 $1,500,000 $1,528,000 $75,000
Training Hours per FTE 20 30 30 30 30
Lane Miles Maintained per FTE 33 37 33 32.8 30
Times Street Swept (Annually) 1.5 1 1 .08 .08
Road Maintenance Completed In-House (%) 45% 30% 30% 30% 30%
BUDGET INFORMATION
DEPARTMENT 61 ACTUALFY 2016
ACTUALFY 2017
ESTIMATEDFY 2018
PLANNEDFY 2019
Expenditures: 10 Salaries & Wages $ 613,224 $ 672,313 $ 773,048 $818,596 11 Overtime 47,908 49,957 35,000 50,000 13 Employee Benefits 358,891 403,286 499,166 517,501 14 Uniforms 6,437 7,872 7,000 7,000 21 Books, Subscriptions, & Memberships - - 200 200 23 Travel & Training 31,094 26,849 25,000 25,000 24 Office Supplies 1,995 5,190 5,500 5,500 25 Fleet Fund Charges 45,000 45,000 45,000 45,000 27 Utilities 5,018 8,315 5,000 5,000 28 Equipment Maintenance 16,362 15,640 20,000 25,000 29 Risk Management Fund Charges 10,000 10,000 10,000 10,000 30 Electricity - Lehi City Power 4,543 11,390 4,000 4,000 31 Professional & Technical 15,000 6,455 20,094 25,094 32 IT Fund Charges 8,000 8,000 8,000 8,000 45 Department Supplies 17,600 22,592 19,922 19,922 49 Landfill Closure/Post-closure - - 2,500 2,500TOTAL EXPENDITURES $ 1,181,072 $ 1,292,859 $ 1,479,430 $ 1,568,313

GE
NE
RA
L F
UN
D -
DE
PT
. DE
TA
IL
FY2019 ANNUAL BUDGET - 124
FEES
DEPARTMENT 61 APPROVEDFY 2016
APPROVEDFY 2017
APPROVED FY 2018
APPROVED FY 2019
Road cut administration $ 100 $ 100 $ 100 $ 100Asphalt, concrete removal and repair Minimum base refundable fees: 2,000 2,000 2,000 2,000 Charge per sq. ft. for area >200 sq. ft. 10 10 10 10 Charge per sq. ft. for sidewalk 20 20 20 20 Charge per linear ft. or curb 20 20 20 20Impact Fee: Single family residential/ unit 1,435 1,163 1,163 1,163 Multi family residential (per dwelling unit) - 708 708 708 General office - 363 363 363 Hotel - 318 318 318 Industry - 73 73 73 Light industry - 266 266 266 Specialty retail - 878 878 878 Supermarket - 1,556 1,556 1,556 Superstore - 469 469 469 Warehousing - 197 197 197 Medical / Dental Bldg - 920 920 920 Drive in Bank - 2,710 2,710 2,710 Drugstore w/Drive - 1,477 1,477 1,477 Auto Parts - 1,407 1,407 1,407 Tire Store - 756 756 756 Gas Station w/Convenience Store - 1,983 1,983 1,983 High Turnover Restaurant - 1,939 1,939 1,939 Fast Food w/Drive - 7,558 7,558 7,558 Church - 212 212 212 Elementary School - 169 169 169 Middle School - 214 214 214 High School - 252 252 252 Industrial / building sq. ft. 0.20 - - - All other uses / building sq. ft. 0.988 - - -

GE
NE
RA
L F
UN
D - D
EP
T. D
ET
AIL
FY2019 ANNUAL BUDGET - 125
FLEET
POSITION ACTUALFY 2015
ACTUALFY 2016
ACTUALFY 2017
ACTUALFY 2018
PLANNED FY 2019
Full-time:Fleet Manager 1.00 1.00 1.00 1.00 1.00Shop Supervisor - - - 1.00 1.00Journey Fleet Mechanic 1.00 1.00 1.00 1.00 1.00Fleet Small Engine Mechanic - - 1.00 - -
Part-time Non-Benefited: Shop Worker - 0.50 1.00 1.00 1.00
FLEET TOTAL 2.00 2.50 4.00 4.00 4.00
Details on the Fleet Division operational revenue and expenditures can be found under the Internal Service Funds on page 183.
Journey Fleet Mechanic
Shop Supervisor
Part-time Shop Worker (2)
FLEETMANAGER
Jeremy Estes
PUBLIC WORKS DIRECTOR
Todd Munger

GE
NE
RA
L F
UN
D -
DE
PT
. DE
TA
IL
FY2019 ANNUAL BUDGET - 126
NON-DEPARTMENTAL
BUDGET INFORMATION
DEPARTMENT 80 ACTUALFY 2016
ACTUALFY 2017
ESTIMATEDFY 2018
PLANNEDFY 2019
Expenditures:27 Utilities $ 188,838 $ 36,673 $ 135,000 $ 245,00031 Credit Card Charges 20,652 12,213 20,000 20,00060-002 Document Imaging 27,925 22,525 30,000 30,00060-005 Contribution to Fleet Fund 900,000 1,400,000 400,000 400,00060-008 Employee Appreciation 33,050 36,741 25,000 25,00060-011 Contrib to Legacy Center/Outdoor Pool 2,039,163 2,360,675 2,360,675 2,617,29760-012 Museum Project Thanksgiving PT 50,000 100,000 100,000 100,00060-013 Cont. to Chamber of Commerce 22,000 22,000 22,000 22,00060-014 Fox Hollow Golf Course 273,055 275,589 275,000 275,00060-015 Contingency 89,438 12,750 100,000 100,00060-017 MAG Contribution 23,085 34,178 25,000 25,00060-018 Branding 16,011 24,141 20,000 20,00060-019 Mayor/Council Special Projects 8,220 25,093 50,000 50,00060-020 Contribution to IT Fund 225,000 475,000 308,500 308,50060-021 Contribution to Capital Projects Fund 3,720,567 5,110,500 2,684,015 -
60-024 Intergovernmental Relations 68,000 36,400 50,000 50,00060-026 Employee Wellness 545 49,134 60,000 60,00060-029 UVSSD Dispatch Costs 344,112 365,086 663,332 385,89060-010 Contributions to Building/Grounds Fund 100,000 616,924 397,592 1,043,49760- 911 Fees Pass-through to UVDSSD 334,967 365,086 325,000 325,00060-034 Youth Council - - 5,000 5,00060-035 Information Fair 2,720 1,271 10,000 10,00060- Market Adjustment - - 250,000 -60-041 Contributions to Police Impact Fee - - - 1,130,21030-036 VIPS 813 4,995 5,000 5,000TOTAL EXPENDITURES $ 8,488,161 $ 9,976,259 $ 8,321,114 $ 7,252,394

GE
NE
RA
L F
UN
D - D
EP
T. D
ET
AIL
FY2019 ANNUAL BUDGET - 127
CLASS “C” ROADS FUNDS
FUND DESCRIPTIONThe Class “C” Roads Fund was established through the State of Utah to provide assistance to counties and municipalities for the improvement of roads. The revenue comes from the Utah Department of Transportation (UDOT) through the State’s excise tax on fuel purchases. The amount received is determined by the miles of roads and sidewalks in Lehi, which is assessed each calendar year, and the City’s population.
For more information on how the Class “C” Roads Fund is used, see the Public Works Department section on page 114 and the Non-Routine Capital Budget Summary on pages 50-54.
BUDGET INFORMATION
FUND 11 ACTUALFY 2016
ACTUALFY 2017
ESTIMATEDFY 2018
PLANNEDFY 2019
Capital Revenues: 10 Class “C” Road Allotment $ 1,785,860 $ 2,169,616 $ 1,600,000 $ 2,150,000
20 Re-Appropriation of Class Balance - - 344,000 - 30 Interest Earnings 4,193 - 8,500 -TOTAL REVENUES $ 1,790,053 $ 2,169,616 $ 1,952,500 $ 2,150,000Capital Expenditures:
09-010 Road Maintenance $ 1,519,901 $ 1,238,677 $ 1,557,500 $ 1,563,00010-002 Snow Removal & Salt 103,176 191,420 110,000 132,00012-001 Striping 184,671 108,808 175,000 200,00015-001 600 N Curb & Gutter Project 3,042 - - -15-006 Equipment Rental 16,351 10,550 50,000 60,00016-003 Street Signs 21,815 61,627 60,000 85,00017-001 Ashton Boulevard - 880,468 - -17-002 Traffic Signal 3200 N & 1200 E - 312,498 - -19-001 Traffic Control Updates - - - 20,00019-001 Oil Distributor - - - 90,00050-002 Transfer to Fleet Fund 84,856 - - -
TOTAL EXPENDITURES $ 1,933,812 $ 2,804,048 $ 1,952,500 $ 2,150,000
CAPITAL SURPLUS (DEFICIT) $ (143,759) $ - $ - $ -

GE
NE
RA
L F
UN
D -
DE
PT
. DE
TA
IL
FY2019 ANNUAL BUDGET - 128
LIQUOR ALLOTMENT FUND
FUND DESCRIPTIONThe Liquor Allotment Fund was established through the State of Utah to provide assistance to municipalities for the enforcement of alcohol-impaired driving. The revenue comes from the Utah Alcoholic Beverage Control Administration through the State’s excise tax on liquor purchases. The amount received is determined by the amount of the tax collected in Lehi.
BUDGET INFORMATION
FUND 12 ACTUALFY 2016
ACTUALFY 2017
ESTIMATEDFY 2018
PLANNED FY 2019
Capital Revenues:36-20 Liquor Fund Allotment $ 46,924 $ 51,674 $ 60,000 60,00036-30 Re-appropriate Fund Balance - - - -
TOTAL REVENUES $ 46,924 $ 51,674 $ 60,000 $ 60,000Capital Expenditures:
50-10 Wages - DUI Enforcement $ 38,838 $ 26,730 $ 18,000 18,00050-13 Employee Benefits 3,543 9,355 6,500 6,50050-45 Miscellaneous 4,543 15,589 35,500 35,50036-30 Fund Balance - - - -
TOTAL EXPENDITURES $ 46,924 $ 51,674 $ 60,000 $ 60,000

GE
NE
RA
L F
UN
D - D
EP
T. D
ET
AIL
FY2019 ANNUAL BUDGET - 129
COMMUNITY DEVELOPMENTBLOCK GRANT (CDBG)
FUND DESCRIPTION The CDBG program is a federally awarded program that provides grants for local community development activities. CDBG funds can be used for affordable housing, anti-poverty programs, and infrastructure development. The city prioritizes projects and improvements to determine how to use these funds. Each year there is a public hearing to allow public comment on how these funds are distributed.
BUDGET INFORMATION
FUND 13 ACTUALFY 2016
ACTUAL FY 2017
ESTIMATEDFY 2018
PLANNED FY 2019
Revenues:Interest Income $ - $ - $ - $ -General Fund Seed Money 100,000 - - -CDBG 570,257 102,942 225,000 160,000TOTAL REVENUES $ 670,257 $ 102,942 $ 225,000 $ 160,000Expenditures:Project Improvements $ - $ 102,942 $ 225,000 160,000TOTAL EXPENDITURES $ - $ 102,94 $ 225,000 160,000
SURPLUS (DEFICIT) $ 670,257 $ - $ - $ -

CAPITAL PROJECTS & IMPACT FEE FUNDS

CA
PIT
AL
PR
OJE
CT
S/IM
PA
CT
FE
ES
FY2019 ANNUAL BUDGET - 131
CAPITAL PROJECTS FUND
FUND DESCRIPTIONThe Capital Projects Fund accounts for funds that are used as the financial resources for the acquisition or construction of major capital projects. More information on the Capital Projects Budget can be found on page 45.
BUDGET INFORMATION
FUND 32 ACTUALFY 2016
ACTUALFY 2017
ESTIMATEDFY 2018
PLANNEDFY 2019
36 Miscellaneous Revenues: 10 Interest Income $ 13,353 $ 43,894 $ 500 $ 500 30 Appropriation from Fund Balance - 1,000,000 273,627 319,500 31 Sales Tax 515,494 455,613 429,500 820,81238 Contributions & Transfers: 10 Transfer from General Fund 3,720,567 5,110,500 2,760,388 - 20 Sale of Fixed Assets - - - -TOTAL CAPITAL REVENUES $ 4,249,414 $ 6,610,007 $ 3,464,015 $ 1,140,81270 Capital Expenditures:
40-000 Developtment Expenditures $ - $ 1,000,000 $ - $ -61-000 CDBG Seed Money 100,000 - - -70-100 Debt Service - Cabela’s 377,862 455,612 427,500 427,50070-101 Debt Service - Fire Station - - 76,373 388,31270-108 Bond Costs 3,600 3,600 2,500 5,00070-111 Pavilion Upgrades - - - -70-112 Mid-Size Tractor - - - -70-114 Veterans Park LED Sign - - - -70-123 Public Works Campus Build Out 208,751 699,960 165,000 -70-138 800 MHZ Portable Radios 87,977 - - -70-142 Website Upgrades & Re-Design 15,215 - - -70-145 Structural Firefighting Gear 27,920 - - -70-146 Parks Irrigation Truck 46,054 - - -70-148 Bandwagon Park Playground
Replacement137,900 - - -
70-155 Cemetery Road Project Repair 25,681 - - -70-162 CERT Trailer 15,000 - - -70-163 Edraulic Extrication Equipment 20,821 - - -70-164 Station 82 Concrete 56,535 - - -70-165 GPS Unit 26,558 - - -70-166 Library/Literacy Area Remodel - 34,608 - -70-167 Remodel Bank Building 155,651 57,018 - -

CA
PIT
AL
PR
OJE
CT
S/I
MP
AC
T F
EE
S
FY2019 ANNUAL BUDGET - 132
BUDGET INFORMATION (CONT.)
FUND 32 ACTUALFY 2016
ACTUALFY 2017
ESTIMATEDFY 2018
PLANNEDFY 2019
70-168 Veterans Honor Wall 7,464 6,972 - - 70-169 Infield Surfaces at Sports Park 65,661 - - - 70-170 Sidewalks 376,800 250,949 300,000 300,000 70-174 Home Demo/Parking Lot 310,042 - - - 70-175 Storage Canopy 33,419 - - - 70-176 Centennial Park Playground 99,300 - - - 70-177 Trencher 16,200 - - - 70-178 Pioneer Sculpture - Legacy Park 30,000 - - - 70-179 Club Car & Equipment Fox Hollow 9,300 - - - 70-181 Seal Coat & Fog Seal for Roads - 41,089 - - 70-183 Addt’l Shelving & Rearrangement - 81,437 - - 70-184 New Roof on 99 W Main Building - 38,573 - - 70-185 Snow Plow (2) - 182,738 - - 70-187 Fire Apparatus & Equipment - - 398,625 - 70-188 HR Rover GPS - - 26,000 - 70-189 Toro 30” Stand-on Aerators (2) - - 17,000 - 70-190 Property Purchases - 808,463 - - 70-191 Point Meadows Park Playground - - 90,000 - 70-192 Building Maintenance & Repairs - - 60,000 - 70-193 Cabelas Blvd - - 1,514,700 - 70-194 Traverse Mountain Blvd - - 181,440 - 70-195 4-Door Crew Truck - - 21,250 - 70-196 Hot Box Asphalt Containment - - 20,000 - 70-197 Side Winder Asphalt - - 20,000 - 70-198 Parking Lot Repairs & Landscaping - - 110,000 - 70-199 Master Plan Facilities - - 50,000 - 70-200 Additional Office Space - - 60,000 - 70-202 Shed @ Vets Ball Park - - 20,000 20,000 70-203 Remodel Vets park Bathrooms - - 25,150 -TOTAL CAPITAL EXPENDITURES $ 2,203,528 $ 3,661,019 $ 3,585,538 $ 1,140,812
CAPITAL SURPLUS (DEFICIT) $ 2,045,886 $ 2,948,988 $ (121,523) $ -

CA
PIT
AL
PR
OJE
CT
S/IM
PA
CT
FE
ES
FY2019 ANNUAL BUDGET - 133
FUND DESCRIPTION Impact fees are charges for services that are imposed on new construction in order to support specific new demands on a given service (e.g. transportation, schools, parks, and fire protection). The budget information in these funds details how the fees collected are used to provide necessary services.
FIRE IMPACT FEES
IMPACT FEE INFORMATION
FUND 46 ACTUAL FY 2016
ACTUAL FY 2017
ESTIMATEDFY 2018
PLANNEDFY 2019
36 Capital Revenues: 10 Interest Income $ 8,286 $ - $ 1,000 $ 1,000 20 Fire Impact Fees 538,675 256,886 400,000 400,00037 Other Revenues: 10 Fund Balance Appropriation - - - - 20 Bond Proceeds - - 5,000,000 -TOTAL CAPITAL REVENUES $ 546,961 $ 256,886 $ 5,401,000 $ 401,00070 Capital Expenditures:
70-001 Reserves $ - $ - $ - $ 401,00070-100 Future Fire Station - - - -70-101 Fire Station 83 132,450 4,377,375 5,401,000 -70-102 Fire Apparatus - 1,049,233 - -
TOTAL CAPITAL EXPENDITURES $ 132,450 $ 5,426,608 $ 5,401,000 $ 401,000
CAPITAL SURPLUS (DEFICIT) $ 414,511 $ (5,169,722) $ - $ -
IMPACT FEE FUNDS

CA
PIT
AL
PR
OJE
CT
S/I
MP
AC
T F
EE
S
FY2019 ANNUAL BUDGET - 134
PARKS IMPACT FEES
IMPACT FEE INFORMATION
FUND 47 ACTUALFY 2016
ACTUALFY 2017
ESTIMATEDFY 2018
PLANNEDFY 2019
36 Capital Revenues:33-10 Utah State Parks Grant $ 1,038,459 $ 839,697 $ - $ -10 Interest Income 20,598 - 30,000 30,00020 Park Impact Fees 1,514,280 1,844,280 2,050,000 2,050,00030 Reappropriation of Fund Balance - - 21,850 516,70040 Developer Contributions 579,779 - - -37-20 Proceeds from Issuance of Debt - 2,569,192 - -
TOTAL CAPITAL REVENUES $ 3,153,116 $ 5,253,169 $ 2,101,850 $ 2,596,70070 Capital Expenditures:
70-100 Peck Property $ 65,766 $ 4,215,377 $ - $ -70-101 Traverse Mountain Park 709 - - -70-102 Herbicide Holding Bay 8,028 595 - -70-103 Ivory Ridge Park 2,312,416 37,756 - -70-109 Spring Creek Park 956,662 79,205 - -70-111 Net for Veterans Ballpark Tower - - - -70-112 Forrest Mellor Park 756,557 2,612,967 - -70-113 Skate Park/Bike Park - 619,512 - -70-114 Sulphur Springs Park 11,845 138,838 - -70-117 Shadow Ridge - 24,580 1,100,000 1,100,00070-118 Monument Park - 103,014 890,000 1,290,00070-119 Storage Building at Ivory Ridge Park - - 46,000 46,00070-123 Expansion of Material Holding Area - - 20,700 20,70070-125 Veterans Park 6,950 - - -70-130 Dry Creek 24,500 - - -70-150 Parks Master Plan 6,080 - - -70-170 Rail Trail 7,256 - - -70-180 Up-Sizing Trails 1,198,326 859,904 - 10,00070-181 Trail Extension - - - 130,00061-200 Interest Expense - 17,093 - -
TOTAL CAPITAL EXPENDITURES $ 5,355,095 $ 8,708,841 $ 2,056,700 $ 2,596,700
CAPITAL SURPLUS (DEFICIT) $ (2,201,979) $ (3,455,672) $ 45,150 $ -

CA
PIT
AL
PR
OJE
CT
S/IM
PA
CT
FE
ES
FY2019 ANNUAL BUDGET - 135
POLICE IMPACT FEES
IMPACT FEE INFORMATION
FUND 48 ACTUALFY 2016
ACTUALFY 2017
ESTIMATEDFY 2018
PLANNEDFY 2019
36 Capital Revenues: 10 Interest Income $ 6,013 $ 6,394 $ 500 $ 500 20 Police Impact Fees 194,474 146,230 250,000 250,000 30 Re-Appropriation of Fund Balance - - 49,500 -
38-15 Proceeds from Issuance of Debt - 600,000 - -38-20 Contribution from General Fund - - - 1,130,210
TOTAL CAPITAL REVENUES $ 200,487 $ 752,624 $ 300,000 $ 1,380,710 70 Capital Expenditures:
70-001 Reserves $ - $ - $ - $ -70-100 Land Purchase - 1,425,715 300,000 300,00070-101 Building Renovation - 3,795 - -70-102 New Police Building Design - - - 1,080,71070-700 Capital & Impact Fee Study $ 70,510 - - -
TOTAL CAPITAL EXPENDITURES $ 70,510 $ 1,429,510 $ 300,000 $ 1,380,710
CAPITAL SURPLUS (DEFICIT) $ 129,977 $ (676,886) $ - $ -

CA
PIT
AL
PR
OJE
CT
S/I
MP
AC
T F
EE
S
FY2019 ANNUAL BUDGET - 136
ROAD IMPACT FEES
IMPACT FEE INFORMATION
FUND 49 ACTUALFY 2016
ACTUALFY 2017
ESTIMATEDFY 2018
PLANNEDFY 2019
36 Capital Revenues: 10 Interest Earnings $ 6,133 $ 2,540 $ - $ - 20 Road Impact Fees 2,039,131 1,205,375 2,000,000 2,000,000 30 Reappropriate Fund Balance - - 315,000 760,000 40 UDOT Contributions - 1,075,709 2,200,000 4,640,000 41 County Contributions - - 18,500,000 18,045,000TOTAL CAPITAL REVENUES $ 2,045,264 $ 2,283,624 $ 23,015,000 $ 25,445,000 70 Capital Expenditures:
70-104 Accel/Decel at SR-92 & 500 W $ - $ - $ 120,000 $ 120,00070-106 Traverse Blvd TRAX Crossing & Road 17,672 48,268 400,000 400,00070-107 Triumph (Frontage Road to TRAX) 547,322 430,971 20,000 400,00070-108 Center Street 1700 N to 2600 N 92,417 801,215 25,000 -70-109 600 E North of Dry Creek - - 550,000 550,00070-111 Jordan Willows Connection Road 6,962 2,580 100,000 100,00070-112 Center Street & SR92 - 3,182 - 2,200,00070-113 Waste Ditch 500 W to 200 W - 1,252,553 100,000 -70-115 Signals 295,284 - 700,000 450,00070-116 Main Street 2300 W to Crossroads - - 12,000,000 12,000,00070-117 1200 W - - 6,500,000 6,500,00070-118 Ashton Blvd Relocation - - 2,200,000 2,320,00070-130 Streets Widening 939,980 580,160 300,000 205,00070-170 2100 N Frontage Relocation 2425 - - -70-171 I-15 & 300 W Enhancement - - - 200,00070-180 Salt Building - 4,960 - -70-195 Master Plan & Impact Fee Analysis 290 - - -
TOTAL CAPITAL EXPENDITURES $ 1,902,352 $ 3,123,889 $ 23,015,000 $ 25,445,000
CAPITAL SURPLUS (DEFICIT) $ 142,912 $ (840,265) $ - $ -

CA
PIT
AL
PR
OJE
CT
S/IM
PA
CT
FE
ES
FY2019 ANNUAL BUDGET - 137
CULINARY IMPACT FEES
IMPACT FEE INFORMATION
FUND 71 - CULINARY IMPACT FEE ACTUALFY 2016
ACTUALFY 2017
ESTIMATEDFY 2018
PLANNEDFY 2019
37 Capital Revenues: 10 Interest Income $ - $ - $ 25,000 $ 25,000 20 Bond Proceeds - - 900,000 3,200,000 30 Re-Appropriation of Fund Balance - - - - 40 Contributions from Developers - - 1,800,000 2,600,000 50 Water Impact Fees 762,256 1,135,867 1,300,000 1,300,000TOTAL FUND REVENUES $ 762,256 $ 1,135,867 $ 4,025,000 $ 7,125,000 50 Capital Expenses:
00-100 Impact Fee Refund $ 4,431 $ 11,114 $ - $ -09-001 Interest Expense 12,646 31,837 - -09-002 Pipe Oversizing - - 70,000 70,00011-003 Master Plan and Impact Fee Study - 39,765 - -16-002 Traverse Source 400 - 1,800,000 1,800,00016-003 West Side Facilities - - 800,000 800,00018-001 600 E Tank - - 900,000 1,200,00019-001 Sandpit Tank/Pump - - - 2,000,00050-001 Reserves - - 455,000 1,255,000
TOTAL FUND EXPENSES $ 17,477 $ 82,716 $ 4,025,000 $ 7,125,000
FUND SURPLUS/ (DEFICIT) $ 744,779 $ 1,053,151 $ - $ -
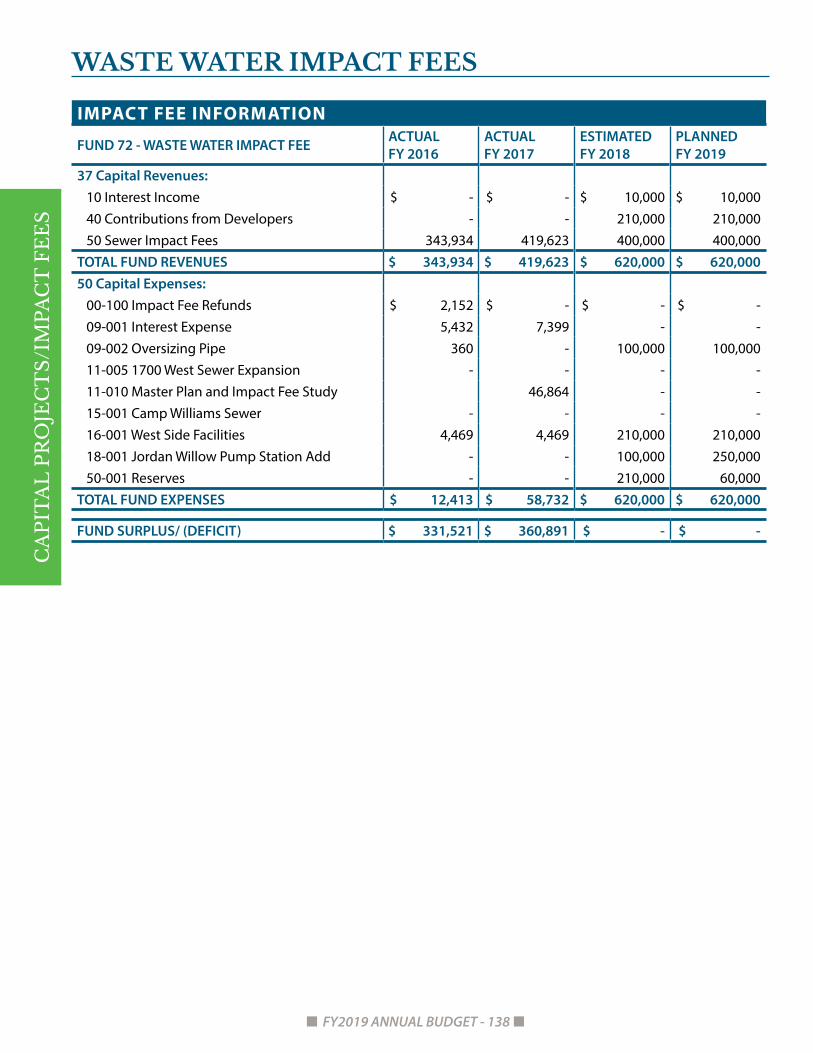
CA
PIT
AL
PR
OJE
CT
S/I
MP
AC
T F
EE
S
FY2019 ANNUAL BUDGET - 138
WASTE WATER IMPACT FEES
IMPACT FEE INFORMATION
FUND 72 - WASTE WATER IMPACT FEE ACTUAL FY 2016
ACTUALFY 2017
ESTIMATEDFY 2018
PLANNEDFY 2019
37 Capital Revenues: 10 Interest Income $ - $ - $ 10,000 $ 10,000 40 Contributions from Developers - - 210,000 210,000 50 Sewer Impact Fees 343,934 419,623 400,000 400,000TOTAL FUND REVENUES $ 343,934 $ 419,623 $ 620,000 $ 620,000 50 Capital Expenses:
00-100 Impact Fee Refunds $ 2,152 $ - $ - $ -09-001 Interest Expense 5,432 7,399 - -09-002 Oversizing Pipe 360 - 100,000 100,00011-005 1700 West Sewer Expansion - - - -11-010 Master Plan and Impact Fee Study 46,864 - -15-001 Camp Williams Sewer - - - -16-001 West Side Facilities 4,469 4,469 210,000 210,00018-001 Jordan Willow Pump Station Add - - 100,000 250,00050-001 Reserves - - 210,000 60,000
TOTAL FUND EXPENSES $ 12,413 $ 58,732 $ 620,000 $ 620,000
FUND SURPLUS/ (DEFICIT) $ 331,521 $ 360,891 $ - $ -

CA
PIT
AL
PR
OJE
CT
S/IM
PA
CT
FE
ES
FY2019 ANNUAL BUDGET - 139
POWER IMPACT FEES
IMPACT FEE INFORMATION
FUND 73 - POWER IMPACT FEES ACTUALFY 2016
ACTUALFY 2017
ESTIMATEDFY 2018
PLANNEDFY 2019
37 Capital Revenues: 10 Interest Income $ 22,913 $ 23,199 $ 35,000 $ 35,000 30 Re-Appropriation of Fund Balance - - - 3,835,000 45 Bond Proceeds - - 18,000,000 - 50 Electric Impact Fees 2,956,924 2,445,017 3,000,000 3,000,000TOTAL CAPITAL REVENUES $ 2,979,837 $ 2,468,216 $ 21,035,000 $ 6,870,00050 Capital Expenditures:
10-006 Generation Plant Land Purchase - - - -11-010 Master Plan 18,530 4,193 - -16-001 Generation Air Permit 325 - - -17-001 Internal Generation - - 18,000,00017-004 1300 East Tie - - 400,000 400,00017-005 Ashton 6-21 & 6-22 Line Extension - - 400,000 400,00018-001 2300 W Overhead - - 50,000 50,00018-002 Millpond Improvements - - 530,000 530,00019-001 South Transmission - - - 440,00019-002 Carter Substation Upgrade - - - 4,500,00019-003 River Crossing & Thanksgiving Point - - - 550,00050-002 Reserves - - 1,655,000 -
TOTAL CAPITAL EXPENDITURES $ 18,855 $ 4,193 $ 21,035,000 $ 6,870,000
CAPITAL SURPLUS / (DEFICIT) $ 2,960,982 $ 2,464,023 $ - $ -

CA
PIT
AL
PR
OJE
CT
S/I
MP
AC
T F
EE
S
FY2019 ANNUAL BUDGET - 140
PRESSURIZED IRRIGATION IMPACT FEES
IMPACT FEE INFORMATION
FUND 75 - P.I. IMPACT FEE ACTUALFY 2016
ACTUALFY 2017
ESTIMATEDFY 2018
PLANNEDFY 2019
37 Capital Revenues: 10 Interest Income $ - $ - $ 25,000 $ 25,000 20 Bond Proceeds - - - 10,000,000 40 Contributions from Developers - - 1,650,000 3,450,000 50 PI Impact Fees 687,129 975,958 1,650,000 1,650,000TOTAL FUND REVENUES $ 687,129 $ 975,958 $ 3,325,000 $ 15,125,00050 Capital Expenses:
00-001 Impact Fee Refund $ 4,557 $ 34,608 $ - -09-002 Interest Expense 5,711 11,482 - -09-001 Pipe Oversizing - - 90,000 85,00016-001 Low Hills Expansion & Piping - - 370,000 370,00016-002 West Side PI Facilities 1,709 - 1,300,000 1,300,00016-003 Jordan River Pump Station & Piping - - 380,000 380,00016-004 Jordan River Reservoir - - 25,000 25,00016-005 Dry Creek Reservoir & Piping - - - 10,000,00015-001 Traverse Booster with Piping - - 380,000 380,00015-002 Railroad Well & Piping - - 15,000 80,00017-001 Jordan River Reservoir Well - - 230,000 230,00018-001Low Hills Reservoir Enlargement - - - -19-001 West Side PI Reservoir - - - 1,600,00019-002 Allred Well w/Booster Pump - - - 200,00050-001 Reserves - - 535,000 475,00050-005 Master Plan & Impact Fee Study - 18,787 - -
TOTAL FUND EXPENSES $ 11,977 $ 64,877 $ 3,325,000 $ 15,125,000
FUND SURPLUS/ (DEFICIT) $ 675,152 $ 911,081 $ - $ -
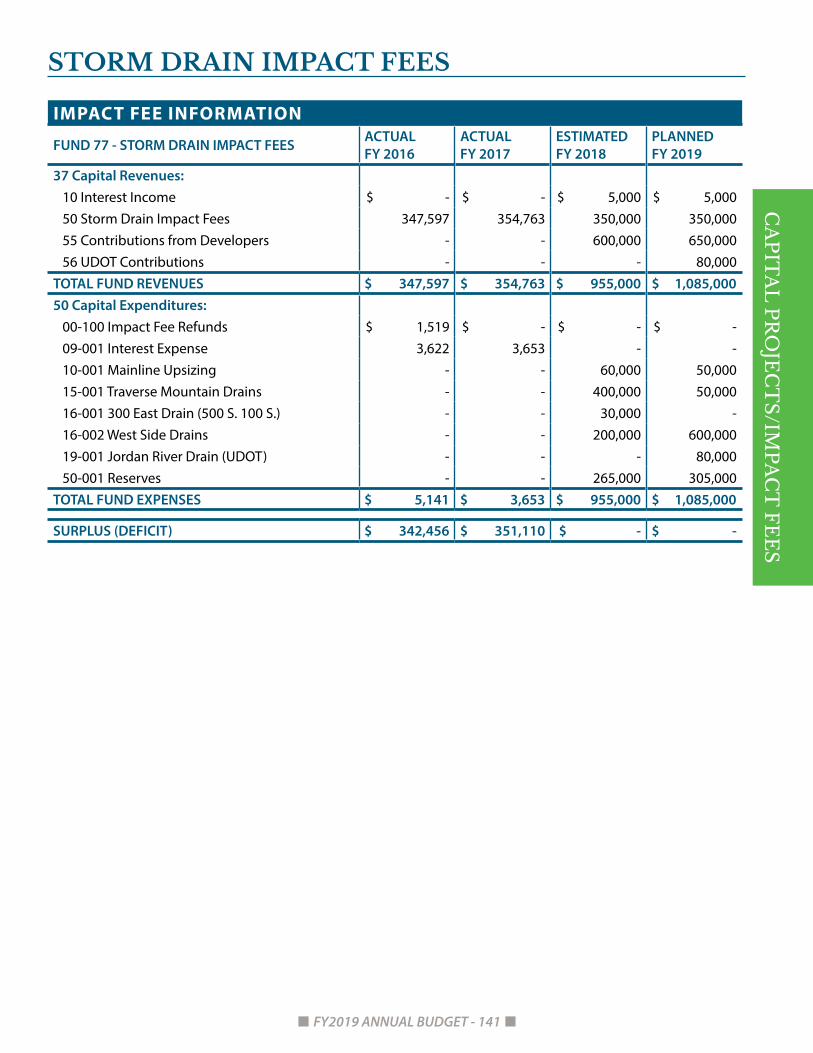
CA
PIT
AL
PR
OJE
CT
S/IM
PA
CT
FE
ES
FY2019 ANNUAL BUDGET - 141
STORM DRAIN IMPACT FEES
IMPACT FEE INFORMATION
FUND 77 - STORM DRAIN IMPACT FEES ACTUALFY 2016
ACTUALFY 2017
ESTIMATEDFY 2018
PLANNEDFY 2019
37 Capital Revenues: 10 Interest Income $ - $ - $ 5,000 $ 5,000 50 Storm Drain Impact Fees 347,597 354,763 350,000 350,000 55 Contributions from Developers - - 600,000 650,000 56 UDOT Contributions - - - 80,000TOTAL FUND REVENUES $ 347,597 $ 354,763 $ 955,000 $ 1,085,00050 Capital Expenditures:
00-100 Impact Fee Refunds $ 1,519 $ - $ - $ -09-001 Interest Expense 3,622 3,653 - -10-001 Mainline Upsizing - - 60,000 50,00015-001 Traverse Mountain Drains - - 400,000 50,00016-001 300 East Drain (500 S. 100 S.) - - 30,000 -16-002 West Side Drains - - 200,000 600,00019-001 Jordan River Drain (UDOT) - - - 80,00050-001 Reserves - - 265,000 305,000
TOTAL FUND EXPENSES $ 5,141 $ 3,653 $ 955,000 $ 1,085,000
SURPLUS (DEFICIT) $ 342,456 $ 351,110 $ - $ -

SPECIAL REVENUE FUNDS

SP
EC
IAL
RE
VE
NU
E
FY2019 ANNUAL BUDGET - 143
DIVISION DESCRIPTIONAs part of the Leisure Services Department, the Recreation Division, which manages the Legacy Center (the City’s recreation center) and the outdoor pool, is funded by two special revenue funds. Special Revenue Fund 21 funds the Legacy Center, and Special Revenue Fund 22 funds the outdoor pool. Specific budget and fee information for both funds are included in this section.
RECREATION SPECIAL REVENUE FUNDS
Legacy Center Pool
OutdoorPool
Assistant Pool Managers
Swim Teams & Programs
Preschool
Day Care
Ballpark Concessions
Birthday Parties
VolunteerTrades
Center Court
Fitness
Gymnastics
Registration
Dance
Programs & Events
LeagueAssistants
Seasonal Sports Sta�
Brittany Crumback Abby HaveaLori Thomas
ASSIST. LEGACY CENTER DIRECTOR - AQUATICS
Suzanne McBee
RECREATION DIRECTOR
Dan Harrison
ASSIST. RECREATIONMANAGER
Kim Cooper
Outdoor PoolCashiers
Aquatics Maintenance
Operator
Lifeguards
BuildingManagers
Front Desk
ClimbingWall
Martial Arts
Cheer
Other Seasonal Sta�
ADMINISTRATIVE ASSISTANT
MEMBERSHIP SECRETARY
ASSIST. LEGACY CENTER DIRECTOR - OPERATIONS
ASSIST. LEGACY CENTER DIRECTOR - LEAGUES
ASSIST. LEGACY CENTER DIRECTOR - PROGRAMS

SP
EC
IAL
RE
VE
NU
E
FY2019 ANNUAL BUDGET - 144
POSITION ACTUALFY 2016
ACTUALFY 2017
PLANNED FY 2018
ACTUAL FY 2018*
PLANNED FY 2019*
Full-time:Recreation/Legacy Ctr. Manager 1.00 1.00 1.00 1.00 1.00Recreation/Legacy Ctr. Assistant Manager - 1.00 1.00 1.00 1.00Legacy Ctr. Supervisor/Aquatics 1.00 1.00 1.00 1.00 1.00Legacy Ctr. Supervisor/Operations 1.00 1.00 1.00 1.00 1.00Legacy Ctr. Supervisor/Programs 1.00 1.00 1.00 1.00 1.00Legacy Ctr. Supervisor/Leagues 1.00 1.00 1.00 1.00 1.00Recreation Coordinator 1.00 1.00 1.00 1.00 1.00Assistant Aquatics Supervisor 1.00 1.00 1.00 1.00 1.00Aquatics Maintenance Manager 1.00 1.00 1.00 1.00 1.00Head of Registration 1.00 1.00 1.00 1.00 1.00Program Coordinator - - - - 1.00
Part-time Non-benefited:Membership Secretary 0.91 0.91 0.91 0.69 0.69Administrative Assistant 0.55 0.55 0.55 0.69 0.69Fitness Director 0.03 0.03 0.03 0.30 0.30Fitness Instructor 2.07 2.07 2.07 2.22 2.24Kids Fitness Instructor Assistant 0.23 0.23 0.23 0.19 0.20Slim to Win 0.09 0.09 0.09 0.04 0.04LC Pool Maintenance 2.05 2.05 2.05 0.77 0.90LC Assistant Pool Manager 3.05 3.05 3.05 2.63 3.0LC Lifeguard Head 2.60 2.60 2.60 2.69 2.70LC Lifeguard 14.15 14.15 14.15 11.18 13.00LC Lifeguard Instructor 0.10 0.22 0.20 0.19 0.19USA Head Swim Coach 0.32 0.32 0.32 0.25 0.35USA Swim Coach 0.08 0.08 0.08 1.42 1.31Head Swim Coach 0.06 0.06 0.06 0.12 0.15Swim Coach 0.42 0.42 0.42 0.35 0.40WSI Coordinator 0.02 0.02 0.02 0.005 0.00WSI (Swim Lesson Instructor) 1.73 1.73 1.73 2.26 2.50Private Swim Lesson Instructor 0.03 0.03 0.03 .38 0.50Building Manager 1.32 1.32 1.32 1.32 1.31Center Court Manager 0.08 0.08 0.08 0.77 0.82Center Court Personnel 3.19 3.19 3.19 3.24 3.24Outdoor Concession Manager 0.24 0.24 0.24 0.32 0.35Outdoor Concession Site Supvr. 0.35 0.35 0.35 0.18 0.20Outdoor Concessions 1.68 1.68 1.68 1.30 1.30Front Desk Head Manager 0.54 0.54 0.54 0.44 0.50Front Desk Manager 3.10 3.10 3.10 3.20 3.65Front Desk Staff 5.10 5.10 5.10 4.43 4.45Preschool Head 0.48 0.48 0.48 0.84 0.84
*Numbers in 2018 moving forward have been reevaluated with new labor codes added to create a more accurate representation of staffing.

SP
EC
IAL
RE
VE
NU
E
FY2019 ANNUAL BUDGET - 145
POSITION ACTUALFY 2016
ACTUALFY 2017
PLANNED FY 2018
ACTUAL FY 2018*
PLANNED FY 2019*
Preschool Assistant 1.53 1.25 0.78 0.78 0.90Day Care Manager 0.39 0.39 0.39 0.50 0.50Day Care Staff 1.08 1.08 1.08 0.97 2.65Program Coordinator 0.78 0.78 0.78 0.96 0.30Head Cheer 0.02 0.02 0.02 0.005 0.10Cheer Instructor 0.09 0.09 0.09 0.18 0.25Head Dance 0.16 0.16 0.16 0.19 0.20Dance Instructor 0.29 0.29 0.29 0.40 0.40Other Instructors 0.06 0.06 0.06 0.005 0.05Registration Staff 2.39 2.39 2.39 2.53 2.53Rock Wall Attendant 0.45 0.45 0.45 0.47 0.53Itty Bitty 0.50 0.50 0.50 0.79 0.80League Supervisor 2.05 2.05 2.05 1.18 0.68Official 3.05 3.05 3.05 4.86 5.0Scorekeeper 1.18 1.18 1.18 1.73 1.75Site Supervisor 1.18 1.18 1.18 1.76 1.80Sports Instructor 0.49 1.62 1.00 0.09 0.00Gymnastic Head Instructor 0.73 0.73 0.73 0.76 0.90Gymnastic Instructor 3.90 3.90 3.90 4.46 4.40Gymnastic Instructor Aid 1.11 1.11 1.11 1.65 1.70Private Gymnastic Instructor 0.02 0.02 0.02 0.01 0.01Equipment Personnel Gymnastic - - - 0.01 1.44Gymnastic Trade Supervisor 0.27 0.27 0.27 0.97 0.60Gymnastic Trade Head Supervisor 0.15 0.15 0.15 0.15 0.15
OD Pool Maintenance 0.28 0.28 0.28 0.82 0.82
OD Pool Manager 0.54 0.54 0.54 0.78 0.80OD Pool Cashier 0.42 0.42 0.42 1.30 1.30OD Lifeguard 2.96 2.96 2.96 3.81 3.80
TOTAL FTE 80.65 81.65 81.65 85.56 91.68*Numbers in 2018 moving forward have been reevaluated with new labor codes added to create a more accurate representation of staffing.
PERFORMANCE MEASURESDEPARTMENT/DIVISION OBJECTIVE: Ensure that Lehi City residents and non-residents are taking advantage of the recreation programs Lehi City offers.
PERFORMANCE MEASURE QUICK VIEW
ACTUAL FY 2016
ACTUAL FY 2017
TARGET FY 2018
ACTUAL FY 2018
TARGET FY 2019
Legacy Center Admittance 385,112 360,357 400,000 361,330 360,000
Total Pass Holders 14,019 17,012 18,000 19,024 18,500
Total Memberships 4,055 4,409 4,500 5,883 5,700
Pass Holders who are Lehi Residents (%) - 73% 75% 69% 72%

SP
EC
IAL
RE
VE
NU
E
FY2019 ANNUAL BUDGET - 146
LEGACY CENTER FUND
FUND 21 ACTUALFY 2016
ACTUALFY 2017
ESTIMATEDFY 2018
PLANNEDFY 2019
36 Miscellaneous Revenues: 10 Interest Income $ 7,656 $ 16,560 $ 1,000 $ 1,00037 Operating Revenues: 10 Legacy Center Pass Sales 1,440,895 1,415,157 1,400,000 1,421,000 15 Charges for Services 1,170,575 1,260,151 940,000 1,100,000 16 Merchandise Sales 59,323 23,716 45,000 45,000 45 Offsite Concession Sales 73,389 76,670 50,000 50,000 50 Center Court Receipts 190,498 189,197 200,000 200,000 70 Swim Program Revenue 311,000 324,288 250,000 325,00038 Contributions & Transfers: 10 Contribution from General Fund 2,039,163 779,238 2,360,675 2,617,297TOTAL FUND REVENUES $ 5,292,499 $ 4,084,977 $ 5,246,675 $ 5,759,29740 Operating Expenses: 10 Salaries & Wages $ 1,768,056 $ 1,869,621 $ 1,985,118 $ 2,501,398 10-001 Center Court Salaries* 71,670 26,062 126,062 - 11 Overtime 112 164 1,000 1,000 13 Employee Benefits 356,437 372,025 449,918 470,763 14 Uniforms 3,314 3,714 3,600 3,700 18 Fleet Fund Charges 2,000 2,000 2,000 2,000 19 IT Fund Charges 46,000 46,000 53,000 53,000 20 Risk Management Fund Charges 65,000 65,000 65,000 65,000
21 Books, Subscriptions, & Memberships 532 435 2,500 2,500 22 Recreation Public Notices 2,933 2,027 7,500 5,000 23 Travel & Training 7,989 7,810 14,800 14,800 24 Office Supplies 25,989 26,638 32,000 32,000 26 Buildings & Grounds O & M 83,892 94,413 92,000 92,000 27 Utilities 71,755 68,219 120,000 120,000 29-101 Offsite Concession Expenses 54,810 63,382 53,000 64,000 29-102 Center Court Expenses 161,613 154,951 169,000 169,000 30 Electricity - Lehi City Power 194,527 187,819 205,000 205,000 31 Professional & Technical 39,081 41,865 48,100 68,100 32 Program Expenditures 174,822 183,998 153,500 184,000 32-100 Gymnastics 72,646 74,500 80,000 76,000 32-200 Dance 9,341 9,970 9,900 10,500 32-300 Itty Bitty Ball 5,330 4,703 13,000 10,000 32-400 Birthday Parties 2,756 2,368 3,500 3,500 32-500 Facilities Stations 16,621 10,101 14,400 14,400 33 Pool Operation & Maintenance 128,871 119,329 149,400 140,000 33-500 Miscellaneous 16,811 10,612 23,000 23,000
*Moved to Salaries & Wages line item.

SP
EC
IAL
RE
VE
NU
E
FY2019 ANNUAL BUDGET - 147
FUND 21 (CONT.) ACTUALFY 2016
ACTUALFY 2017
ESTIMATEDFY 2018
PLANNEDFY 2019
34 Swimming Program 87,460 102,530 86,000 88,000 36 Tennis 1,169 1,967 6,000 6,000 37 Golf 9,196 4,063 6,800 6,800 42 Soccer Program Expense 15,844 23,746 24,700 25,000 43 Volleyball Expense 7,067 5,737 10,200 10,200 44 Baseball Expense 52,702 53,652 76,000 66,000 45 Girls Softball 17,128 17,826 19,000 19,000 46 Basketball Expense 75,428 113,269 85,000 123,800 47 Flag Football Expense 7,307 8,077 7,400 8,000 49 Wrestling Program Expense 1,696 1,840 2,000 2,000 60 Debt Service Principal 810,880 815,700 815,832 815,832 91 Contribution to Outdoor Pool 101,345 94,345 135,345 120,54541 Capital Expenditures: 54 Capital Outlay 78,405 117,084 85,100 126,459 57 Pool Capital Outlay 111,704 12,968 11,000 11,000TOTAL FUND EXPENDITURES $ 4,760,239 $ 4,820,530 $ 5,246,675 $ 5,759,297
FUND SURPLUS/ (DEFICIT) $ 532,260 $ (735,553) $ - $ -
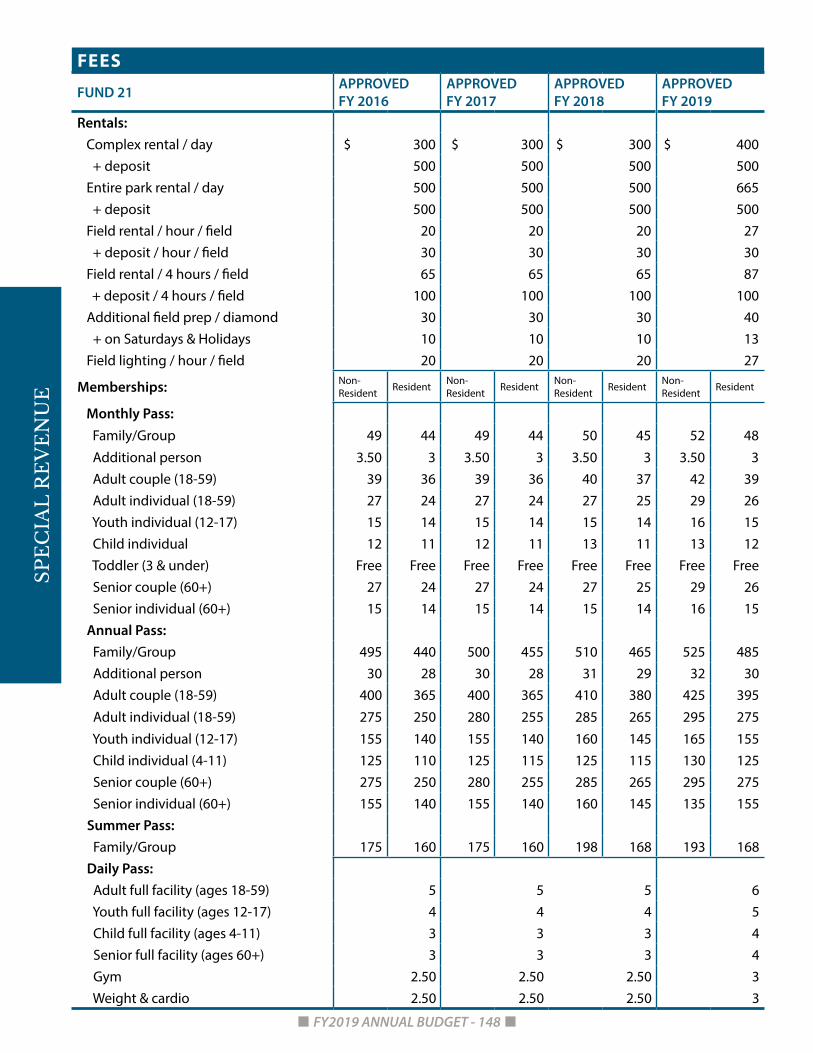
SP
EC
IAL
RE
VE
NU
E
FY2019 ANNUAL BUDGET - 148
FEES
FUND 21 APPROVEDFY 2016
APPROVEDFY 2017
APPROVED FY 2018
APPROVED FY 2019
Rentals: Complex rental / day $ 300 $ 300 $ 300 $ 400 + deposit 500 500 500 500 Entire park rental / day 500 500 500 665 + deposit 500 500 500 500 Field rental / hour / field 20 20 20 27 + deposit / hour / field 30 30 30 30 Field rental / 4 hours / field 65 65 65 87 + deposit / 4 hours / field 100 100 100 100 Additional field prep / diamond 30 30 30 40 + on Saturdays & Holidays 10 10 10 13 Field lighting / hour / field 20 20 20 27
Memberships: Non-Resident Resident Non-
Resident Resident Non-Resident Resident Non-
Resident Resident
Monthly Pass: Family/Group 49 44 49 44 50 45 52 48 Additional person 3.50 3 3.50 3 3.50 3 3.50 3 Adult couple (18-59) 39 36 39 36 40 37 42 39 Adult individual (18-59) 27 24 27 24 27 25 29 26 Youth individual (12-17) 15 14 15 14 15 14 16 15 Child individual 12 11 12 11 13 11 13 12 Toddler (3 & under) Free Free Free Free Free Free Free Free Senior couple (60+) 27 24 27 24 27 25 29 26 Senior individual (60+) 15 14 15 14 15 14 16 15 Annual Pass: Family/Group 495 440 500 455 510 465 525 485 Additional person 30 28 30 28 31 29 32 30 Adult couple (18-59) 400 365 400 365 410 380 425 395 Adult individual (18-59) 275 250 280 255 285 265 295 275 Youth individual (12-17) 155 140 155 140 160 145 165 155 Child individual (4-11) 125 110 125 115 125 115 130 125 Senior couple (60+) 275 250 280 255 285 265 295 275 Senior individual (60+) 155 140 155 140 160 145 135 155 Summer Pass: Family/Group 175 160 175 160 198 168 193 168 Daily Pass: Adult full facility (ages 18-59) 5 5 5 6 Youth full facility (ages 12-17) 4 4 4 5 Child full facility (ages 4-11) 3 3 3 4 Senior full facility (ages 60+) 3 3 3 4 Gym 2.50 2.50 2.50 3 Weight & cardio 2.50 2.50 2.50 3

SP
EC
IAL
RE
VE
NU
E
FY2019 ANNUAL BUDGET - 149
FEES (CONT.)
FUND 21 APPROVEDFY 2016
APPROVEDFY 2017
APPROVED FY 2018
APPROVED FY 2019
Aerobics class 3 3 3 4 Water aerobics 3 3 3 4 Cycling class 3 3 3 4 Track 0.50 0.50 0.50 0.75 Day care, first child / hour 2.50 2.50 2.50 2.50 + / additional child / hour 1.50 1.50 1.50 1.50 Punch Card: Adult full facility (ages 18-59) 90 90 90 108 Youth full facility (ages 12-17) 72 72 72 90 Child full facility (ages 4-11) 54 54 54 72 Senior full facility (ages 60+) 54 54 54 63 Gym 45 45 45 54 Weight & cardio 45 45 45 54 Aerobics class 54 54 54 63 Water aerobics 54 54 54 63 Cycling class 54 54 54 63 Track 9 9 9 13.50 Day care 36 36 36 36
Programs: Non-Resident Resident Non-
Resident Resident Non-Resident Resident Non-
Resident Resident
Team Sports: Women’s volleyball 280 245 300 250 300 250 320 265 Men’s basketball 770 710 860 715 870 725 910 760 Youth Sports: Wrestling 54 40 49 41 50 42 54 45 (if member) 48 36 44 37 45 38 49 41 Girls volleyball 53 46 63 47 65 48 68 50 (if member) 47 42 57 42 59 43 61 45 Volleyball camp 54 40 55 41 55 41 59 44 Flag football 48 44 59 44 61 45 63 47 (if member) 43 39 53 40 55 41 57 42 Indoor soccer 41 35 47 35 49 36 50 37 (if member) 37 31 42 32 44 32 45 33 Kids sports camp 68 46 56 47 56 47 50 37 (if member) 61 41 50 42 50 42 45 33 Outdoor soccer (K-6th 41 35 47 35 49 36 50 37 (If member) 37 31 42 32 44 32 45 33 Outdoor soccer (7th-9th 41 35 47 35 49 36 60 47 (if member) 37 31 42 32 44 32 54 42 Track & field 73 55 76 56 76 56 80 59 7 yrs & under golf 43 35 42 35 43 36 44 37 8 yrs & up golf 74 61 74 62 76 63 79 66

SP
EC
IAL
RE
VE
NU
E
FY2019 ANNUAL BUDGET - 150
FEES (CONT.)
FUND 21 APPROVEDFY 2016
APPROVEDFY 2017
APPROVED FY 2018
APPROVED FY 2019
Advanced golf 99 81 98 82 100 83 104 87 Tennis 69 52 70 52 65 53 76 56 (if member) 62 46 63 47 65 48 68 50 Kids Sports Camp 68 46 56 47 56 47 60 50 (If member) 61 41 50 42 50 42 54 54 Basketball Camp - 3 Day (Skyridge) K-2nd - - - - 55 55 74 74
Basketball Camp - 3 Day (Skyridge) 3rd-6th - - - - 90 90 96 96
Basketball Camp - 3 Day (Skyridge) 7th-11th - - - - 90 90 96 96
Basketball Camp - 4 Day (LC) 1st-5th - - 109 109 109 109 118 118 Basketball Camp - 4 Day (LC) 6th-9th - - 109 109 109 109 118 118 Jr. Jazz Basketball (K - 4th grade) 54 40 55 41 55 41 59 44 (if member) 48 36 50 37 50 37 53 40 Jr. Jazz Basketball (5th - 6th grade) 58 52 70 52 72 53 76 56 (if member) 52 46 63 47 65 48 68 50 Jr. Jazz Basketball (7th - 10th grade) 72 63 86 64 86 64 92 68 (if member) 65 56 77 58 77 58 83 61 Jr. Jazz Basketball (11th - 12th grade) -teams only 575 505 610 510 625 520 655 545
Baseball (3rd - 8th grade) 106 78 119 79 122 81 128 85 (if member) 95 71 107 71 110 73 115 77 Baseball (2nd grade) 53 46 63 47 63 47 68 50 (if member) 47 41 57 42 57 42 61 45 Baseball (t-ball & coach pitch) 39 35 47 35 49 36 50 37 (if member) 35 31 42 32 44 32 45 33 Softball (3rd - 11th grade) 106 78 107 79 109 81 115 85 (if member) 95 71 96 71 98 73 104 77 Swimming: Summer swimming lessons 49 32 50 33 50 33 53 35 (if member) 44 29 45 30 45 30 48 32 School year swimming lessons 49 32 50 33 50 33 53 35 (if member) 44 29 45 30 45 30 48 32 Summer rec swim team 124 99 150 100 152 101 159 106 Summer rec swim camp 25 18 27 18 27 18 29 19 Sessions: Babysitter certification 64 56 77 57 77 57 81 60 CPR & first aid 64 56 68 57 68 57 72 60 Rock climbing merit badge 29 26 39 26 39 26 42 28 Hunter safety 9 7 11 7 11 7 11 7 Itty Bitty Baseball 40 36 43 36 44 37 47 39

SP
EC
IAL
RE
VE
NU
E
FY2019 ANNUAL BUDGET - 151
FEES (CONT.)
FUND 21 APPROVEDFY 2016
APPROVEDFY 2017
APPROVED FY 2018
APPROVED FY 2019
(if member) 36 32 39 32 40 33 42 35 Itty Bitty Soccer 40 36 43 36 44 37 47 39 (if member) 36 32 39 32 40 33 42 35 Itty Bitty Basketball 40 36 43 36 44 37 47 39 (if member) 36 32 39 32 40 33 42 35 Itty Bitty Football 40 36 43 36 44 37 47 39 (if member) 36 32 39 32 40 33 42 35 Itty Bitty Ball 40 36 43 36 44 37 47 39 (if member) 36 32 39 32 40 33 42 35 Parenting with love & logic 38 34 41 34 42 35 42 35 Scrapbooking 13 11 13 11 14 12 14 12 Scrapbooking sleepover 25 20 24 20 25 21 26 22 Sign language 48 43 52 43 53 44 55 46 Women on weights - members only 150 125 170 125 150 125 160 135 Summer youth camp 54 47 58 48 58 48 59 49 Princess/Superhero party 12 10 16 13 14 12 16 13 Cheer “mock” tryouts 16 13 - - - - - - Adult triathlon training 99 83 113 84 115 85 120 89 (if member) 89 75 102 76 104 77 108 80 RAD women 31 31 38 32 38 32 41 34 Private gymnastics lessons / half hour 22 22 22 22 22 22 25 25 Gym-Cross Training for Youth (5 week) 60 50 60 50 60 40 52 43 Gym-Cross Training for Youth (6 week) - - 72 60 72 60 76 63 Dance Camp: 5 & 6 years old 37 37 44 37 46 38 47 39 7 - 14 years old 68 68 69 69 70 70 72 72 Dance: 30 minutes 36 31 43 32 43 32 46 34 40 minutes 38 34 41 34 42 35 43 36 50 minutes 43 37 44 37 46 38 47 39 Gymnastics: 45 minutes 1 day per week 45 34 46 34 47 35 49 36 45 minutes 2 days per week 75 56 77 56 77 57 81 60 1 hour 1 day per week 50 37 50 37 51 38 54 40 1 hour 2 days per week 84 63 86 64 86 64 92 68 1 hour 2 days per week (pre-team) - - 70 64 70 64 75 68 1 1/2 hours 1 day per week 54 47 58 48 58 48 85 77 1 1/2 hours 2 days per week 94 83 101 84 102 85 61 51 1 1/2 hours 2 days per week (pre-team) - - 92 84 94 85 107 89 1 1/2 hours 3 days per week 141 124 151 126 151 126 158 132 2 hours 1 day per week 58 55 67 56 - - - -

SP
EC
IAL
RE
VE
NU
E
FY2019 ANNUAL BUDGET - 152
FEES (CONT.)
FUND 21 APPROVEDFY 2016
APPROVEDFY 2017
APPROVED FY 2018
APPROVED FY 2019
2 hours 2 days per week 101 94 114 95 100 95 102 97 2 hours 3 days per week 143 134 163 136 163 136 163 139 2 hours 4 days per week 175 164 199 166 199 166 199 169 2 1/2 hours 1 day per week 64 59 72 60 72 60 72 61 2 1/2 hours 2 days per week 114 106 130 108 130 108 130 110 2 1/2 hours 3 days per week 162 152 185 154 185 154 185 157 3 hours 1 day per week 76 72 77 73 - - - - 3 hours 2 days per week 143 134 143 136 143 136 146 139 3 hours 3 days per week 179 170 182 173 182 173 185 176 3 hours 4 days per week 224 209 223 212 - - - - Level 6 extra class 45 40 43 41 43 41 44 42Gymnastics - Summer (June, July & Aug) 45 minutes 1 day per week - - - - 59 44 62 46 45 minutes 2 days per week - - - - 96 71 101 75 1 hour 1 day per week - - 62 46 63 47 66 49 1 hour 2 days per week - - 108 80 109 80 112 83 1 hour 2 days per week (PreTeam) - - 88 80 88 80 91 83 1 1/2 hours 1 day per week - - 72 60 73 61 77 64 1 1/2 hours 2 days per week - - 126 105 126 105 132 110 1 1/2 hours 2 days per week (PreTeam) - - 116 105 116 105 121 110 1 1/2 hours 3 days per week - - 188 157 188 157 197 164 2 hours 1 day per week - - 84 70 - - - - 2 hours 2 days per week - - 143 119 125 119 127 121 2 hours 3 days per week - - 204 170 204 170 204 172 2 hours 4 days per week - - 248 207 248 207 248 211 2 1/2 hours 1 day per week - - 90 75 90 75 90 76 2 1/2 hours 2 days per week - - 162 135 162 135 162 137 2 1/2 hours 3 days per week - - 230 192 230 192 230 194 3 hours 1 day per week - - 95 90 - - - - 3 hours 2 days per week - - 176 168 179 170 182 173 3 hours 3 days per week - - 223 212 227 216 230 219 3 hours 4 days per week - - 274 261 - - - - Level 6 Extra Class - - 54 51 54 51 55 52 Cheer (Fall): 30 minutes 38 34 41 34 42 35 42 35 50 minutes 43 37 44 37 46 38 47 39 Cheer (Summer): 30 minutes - - 64 59 64 59 73 61 50 minutes - - 74 69 74 69 86 72 Preschool:

SP
EC
IAL
RE
VE
NU
E
FY2019 ANNUAL BUDGET - 153
FEES (CONT.)
FUND 21 APPROVEDFY 2016
APPROVEDFY 2017
APPROVED FY 2018
APPROVED FY 2019
2 days / week 79 70 84 70 86 72 91 76 3 days / week 99 87 104 87 107 89 113 94 Summer preschool 156 137 164 137 169 141 178 148 Hap Ki-Do 65 55 65 55 65 55 65 55 Other Programs: Slim-to-Win 250 250 250 250 250 250 260 260 Adaptive Volleyball 16 16 35 35 35 35 35 35 Adaptive Bowling - - 35 35 45 45 45 45 Adaptive Basketball 16 16 16 16 26 26 26 26 Private swim lessons 22 22 22 22 22 22 25 25 Ski & snowboarding school (with American Fork City) 210 210 215 215 215 215 225 225
Special Olympics swim team 28 28 38 28 49 39 49 39 USA swim - starfish 31 31 43 32 - - - - USA swim - dolphins 34 34 47 35 47 35 50 37 USA swim - sharks 36 36 50 37 50 37 53 39 USA swim - jr. silver 41 41 55 41 55 41 59 44 USA swim - jr. gold 46 46 63 47 63 47 68 50 USA swim - senior (Sep-Feb) 35 35 49 36 49 36 51 38 USA swim - senior (Mar-Aug) 60 60 82 61 84 62 88 65 USA yearly equipment fee 25 25 25 25 26 26 28 28 USA yearly membership fee 67 67 70 70 75 75 85 85 WSI 170 170 160 160 160 160 170 170 Lifeguard class 170 170 200 200 200 200 200 200 Masters Swimming - - - - 20 20 22 22 Canyons bus only (with American Fork City) 101 101 101 101 101 101 - -
Gymnastics meet fees 435 435 435 435 435 435 445 445 Concealed weapons 45 45 45 45 45 45 48 48 Facility Services: Body fat testing 9 12 12 12 Personal Training: Per Trainer Per Trainer Per Training Per Training Birthday Party Packages: Package 1 - room 70 75 75 80 Package 2 - gym 75 80 80 85 Package 3 - rock wall 85 90 90 95 Package 4 - pool 95 100 100 105 Kid Fit - 1st Child 3 3 3 2.50 Kid Fit - Each Additional Child 1.50 1.50 1.50 1.50 Facility Rentals: Pool rental (2 hour rental) 300 350 350 350

SP
EC
IAL
RE
VE
NU
E
FY2019 ANNUAL BUDGET - 154
FEES (CONT.)
FUND 21 APPROVEDFY 2016
APPROVEDFY 2017
APPROVED FY 2018
APPROVED FY 2019
Pool rental- Alpine School Dist. meet - 450 450 450 Lap Lanes - Short Course - Alpine S.D.) - - - 10 Lap Lanes - Long Course (Alpine S.D.) - - - 12 Lap Lanes - Short Course - - - 12 Lap Lanes - Long Course - - - 12 Full gymnasium / hour 50 50 50 55 each additional after 3 hours 20 20 20 22 all day 225 225 225 225 Half gymnasium 35 35 35 40 each additional after 3 hours 15 15 15 17 all day 160 160 160 160 Full multi-purpose room 50 50 50 55 each additional after 3 hours 20 20 20 22 all day 225 225 225 225 Half multi-purpose room 35 35 35 40 each additional after 3 hours 15 15 15 17 all day 160 160 160 160 Small conference room 35 35 35 40 each additional after 3 hours 15 15 15 17 all day 160 160 160 160 Climbing wall / hour 40 40 40 40 Small lock rental / month 7 8 8 8 Large lock rental / month 9 10 10 11

SP
EC
IAL
RE
VE
NU
E
FY2019 ANNUAL BUDGET - 155
OUTDOOR POOL FUND
FUND 22 ACTUALFY 2016
ACTUALFY 2017
ESTIMATEDFY 2018
PLANNEDFY 2019
34 Operating Revenues: 71 Outdoor Pool Revenue $ 230,119 $ 240,611 $ 204,435 $ 204,43538 Contributions & Transfers: 10 Legacy Center Contribution 101,345 94,345 135,345 120,545 40 County Recreation Grant - - - - 20 Transfer from RDA 70,000 196,441 - -TOTAL FUND REVENUES $ 401,464 $ 531,397 $ 339,780 $ 324,98041 Expenses: 10 Salaries & Wages $ 121,680 $ 131,862 $ 154,912 $ 154,912 13 Employee Benefits 9,354 9,688 11,851 11,851 27 Utilities - - 23,000 - 30 Electricity - Lehi City Power - - 6,000 - 33-101 Operations & Maintenance 143,331 132,634 103,017 132,017 57-100 Capital Outlay 1,183 141,567 41,000 26,200TOTAL FUND EXPENSES $ 275,548 $ 415,751 $ 339,780 $ 324,980
FUND SURPLUS / (DEFICIT) $ 125,916 $ 115,646 $ - $ -
FEES
FUND 22 APPROVEDFY 2016
APPROVEDFY 2017
APPROVED FY 2018
APPROVED FY 2019
Season Pass: Non-Resident Resident Non-
Resident Resident Non-Resident Resident Non-
Resident Resident
Family (up to 6 people) $ 175 $ 160 $ 175 $ 160 $ 198 $ 168 $ 193 $ 168 + each additional family member 25 25 25 25 30 30 30 30 If Legacy Center Annual pass holder 123 112 123 112 138.6 117.6 135 118 Individual 100 80 100 80 110 110 110 84Pool Rental 300 300 400 400Daily Admission: Ages 12 - 59 5 5 6 6 Ages 4 - 11 4 4 5 5 Ages 3 and under Free Free Free Free Seniors (60+) 1.50 1.50 2 2 Water aerobics 3 3 3 3 Lap swimming 2 2 3 3Group Rate Discounts: 5 - 9 people (discount / person) 0.50 0.50 0.50 0.50 10 or more (discount / person) 1 1 1 1 Monday family night (up to 8 people) 20 20 25 25

ENTERPRISE FUNDS

EN
TE
RP
RIS
E F
UN
DS
FY2019 ANNUAL BUDGET - 157
WATER
THE WATER DEPARTMENT AIMS TO PROVIDE SAFE AND RELIABLE WATER RESOURCES TO LEHI RESIDENTS THROUGH DEVELOPING AND MAINTAINING QUALITY FACILITIES AND INFRASTRUCTURE.
Complete the new Jordan Willow P.I. Reservoir and stock it with fish for recreational use.
DEPARTMENT DESCRIPTION
The Water Department administers four of the City’s enterprise operations: (1) Storm Drain, (2) Culinary Water, (3) Pressurized Irrigation (PI), and (4) Waste Water. The department is responsible for the maintenance of distribution lines, wells, storage tanks, and facilities for these operations. The division ensures the adequate supply of potable and irrigation water, the improvement of storm water conveyance, and the maintenance of the City’s sewage collection system.

EN
TE
RP
RIS
E F
UN
DS
FY2019 ANNUAL BUDGET - 158
POSITION ACTUALFY 2015
ACTUALFY 2016
ACTUALFY 2017
ACTUAL FY 2018
PLANNED FY 2019
Full-time:Storm Drain (57) 3.65 4.65 5.65 6.00 7.00Culinary Water (51) 9.00 9.00 11.00 12.00 12.00Pressurized Irrigation (55) 5.65 4.65 4.00 5.00 5.00Waste Water (52) 4.00 5.00 6.00 6.00 6.00Senior Water Systems Inspector (52) - - 1.00 1.00 1.00Water Systems Inspector (52) - - 1.00 1.00 1.00TOTAL FTE 22.30 23.30 28.65 31.00 32.00Detailed staffing information is found under each division description.
WATER SYSTEMS ASSISTANT DIRECTOR
Gary Thomas
CULINARY LEAD
Devan Peterson
STORM DRAIN LEAD
Curtis Chatwin
WATER SYSTEMS DIRECTOR
Dave Norman
ADMINISTRATIVE ASSISTANT
Cindy Stone
WASTE WATER LEAD
Weston Winters
PRESSURIZED IRRIGATION LEAD
Matt Dalton
Water Systems Operator IV
Water Systems Operator II
Water Systems Operator I (2)
Water Sampling Technician
Water Systems Operator IIII
Water Systems Operator III (2)
Water Systems Operator I
Lead Water Meter
Technician
Water Meter Technician
Senior Water Systems
Inspector
Water Systems Inspector
Water Systems Operator III
Water Systems Operator II
Water Systems Operator I
Blue Stakes Technician
Water Systems Operator IV (2)
Water Systems Operator II (3)
S.W.P.P. Inspector (2)

EN
TE
RP
RIS
E F
UN
DS
FY2019 ANNUAL BUDGET - 159
STORM DRAIN
POSITION ACTUALFY 2015
ACTUALFY 2016
ACTUALFY 2017
ACTUALFY 2018
PLANNED FY 2019
Storm Drain (57)Full-time:
Storm Water Systems Supervisor 1.00 1.00 1.00 1.00 1.00Storm Water Systems Operator IV - - 1.00 2.00 1.00Storm Water Systems Operator II 1.00 1.00 1.00 2.00 1.00Storm Water Systems Operator I 1.00 2.00 2.00 1.00 2.00Storm Water Systems S.W.P.P. Inspector - - - - 2.00
Seasonal/Temporary:Water Laborer 0.65 0.65 0.65 - -
TOTAL FTE 3.65 4.65 5.65 6.00 7.00
PERFORMANCE MEASURESDEPARTMENT/DIVISION OBJECTIVE: Provide excellent maintenance of the City’s storm drain system.
PERFORMANCE MEASURE QUICK VIEW
ACTUAL FY 2016
ACTUAL FY 2017
TARGET FY 2018
ACTUAL FY 2018
TARGET FY 2019
Storm Drains Cleaned (%) 18% 33% 40% 2% 30%
SWPP Permits Issued 58 79 50 110 -
Active SWPP Permits 144 119 120 176 -
BUDGET INFORMATION
FUND 57 ACTUAL FY 2016
ACTUALFY 2017
ESTIMATEDFY 2018
PLANNED FY 2019
30 Operating Revenues: 10 Interest Income $ 25,508 $ 37,607 $ 4,000 $ 4,000 31 Drainage Service Charges 1,018,434 1,098,866 1,100,000 1,100,00036 Miscellaneous Revenues: 00 Miscellaneous Revenue 35,550 - 20,049 20,049 01 Reappropriate Fund Balance - - 638,850 -37 Capital Revenues: 25 Captial Contribution - 5,182,318 - - 80 Fund Balance Appropriation - - - 568,162TOTAL FUND REVENUES $ 1,671,113 $ 6,318,791 $ 1,762,899 $ 1,692,211

EN
TE
RP
RIS
E F
UN
DS
FY2019 ANNUAL BUDGET - 160
BUDGET INFORMATION - CONTINUED
FUND 57 ACTUALFY 2016
ACTUALFY 2017
ESTIMATEDFY 2018
PLANNED FY 2019
40 Operating Expenses: 10 Salaries & Wages $ 169,227 $ 275,733 $ 281,801 $342,129 11 Overtime 11,198 13,674 20,000 20,000 13 Employee Benefits 105,804 157,704 178,035 214,170 14 Uniforms 1,078 2,369 4,200 4,800 21 Books, Subscriptions, & Memberships 341 310 2,250 2,500 23 Travel & Training 550 1,853 7,000 9,000 24 Office Supplies 244 1,854 800 800 25 Fleet Fund Charges 25,000 25,000 25,000 25,000 26 Buildings & Grounds O & M 11,009 10,812 10,000 10,000 29 Risk Management Fund Charges 15,000 15,000 15,000 15,000 31 Professional & Technical 22,408 36,760 45,000 45,000 32 IT Fund Charges 6,000 6,000 7,000 7,000 36 Bond Fees 1,500 1,625 2,750 2,750 42 Billing Expense - 9,175 7,895 7,895 44 Bad Debt Expense 5,750 484 7,000 7,000 45 Supplies & Maintenance 2,207 10,855 10,000 10,000 48 System Maintenance 26,282 3,869 35,000 70,000 49 Detention Basin Maintenance 52,531 58,210 42,000 42,000 55 Capital Outlay - - 240,000 20,000 60 Debt Service 61,663 56,394 222,657 222,657 70 Allocation to General Fund 65,610 65,610 65,520 65,520 96 Depreciation/Amortization 1,087,711 1,211,902 - -50 Capital Expenses: 16-004 Pipe Rehabilitation - - 300,000 315,000 55-110 Remedial Drainage - - 233,991 233,991TOTAL FUND EXPENSES $ 1,671,113 $ 1,965,193 $ 1,762,899 $ 1,692,211
SURPLUS (DEFICIT) $ 1,619,242 $ 4,353,598 $ - $ -

EN
TE
RP
RIS
E F
UN
DS
FY2019 ANNUAL BUDGET - 161
PAYMENT IN LIEU INFORMATION
FUND 78 ACTUALFY 2016
ACTUALFY 2017
ESTIMATEDFY 2018
PLANNEDFY 2019
36 Capital Revenues: 10 Interest Earnings $ - $ - $ - $ - 50 Developers/Bonds Contributions 361,341 294,543 450,000 450,000TOTAL FUND REVENUES $ 361,341 $ 294,543 $ 450,000 $ 450,00050 Capital Expenditures: 09-003 Jordan Narrow Detention Basin $ - $ - $ 100,000 $ 100,000 14-001 Utah Highlands - - - - 15-001 2100 N Detention by River - - - - 15-002 500 W & Pioneer Crossing - - - - 17-001 West Side Detention Facilities - - 250,000 250,000 50-001 Contribution to Fund Balance - - 100,000 100,000TOTAL FUND EXPENSES $ - $ - $ 450,000 $ 450,000
SURPLUS (DEFICIT) $ 361,341 $ 294,543 $ - $ -
FEES
DEPARTMENT 57 - STORM DRAIN APPROVEDFY 2016
APPROVEDFY 2017
APPROVED FY 2018
APPROVED FY 2019
Impact fee / acre (.25 acre minimum) $ 1,300 $ 1,391 $ 1,391 $ 1,391Service Charge: Residential / month 3 3 3 3 Commercial / 1,000 sq. ft. of impervious surface 1 1 1 1

EN
TE
RP
RIS
E F
UN
DS
FY2019 ANNUAL BUDGET - 162
CULINARY WATER
POSITION ACTUALFY 2015
ACTUALFY 2016
ACTUALFY 2017
ACTUAL FY 2018
PLANNED FY 2019
Full-time:Water Systems Director 1.00 1.00 1.00 1.00 1.00Asst. Water Systems Director 1.00 1.00 1.00 1.00 1.00Water Sampling Technician 1.00 1.00 1.00 1.00 1.00Water Systems Supervisor 1.00 1.00 1.00 1.00 1.00Senior Water Meter Technician 1.00 1.00 1.00 1.00 1.00Water Systems Operator IV - - - - 1.00Water Systems Operator III 1.00 1.00 1.00 2.00 2.00Water Systems Operator II - - - 1.00 -Water Systems Operator I 1.00 1.00 2.00 2.00 1.00Water Meter Technician 1.00 1.00 2.00 1.00 2.00Administrative Assistant 1.00 1.00 1.00 1.00 1.00
TOTAL FTE 9.00 9.00 11.00 12.00 12.00
PERFORMANCE MEASURESDEPARTMENT/DIVISION OBJECTIVE: Provide excellent maintenance of the City’s culinary water system.
PERFORMANCE MEASURE QUICK VIEW
ACTUAL FY 2016
ACTUAL FY 2017
TARGET FY 2018
ACTUAL FY 2018
TARGET FY 2019
Service Connections per FTE 1,712 1,449 <3,500 1,431 <3,500
Total Culinary Connections 15,411 15,944 16,500 17,170 16,500
Residential Culinary Connections 12,590 12,845 13,000 16,368 13,000

EN
TE
RP
RIS
E F
UN
DS
FY2019 ANNUAL BUDGET - 163
BUDGET INFORMATION
FUND 51 - CULINARY FUND ACTUALFY 2016
ACTUALFY 2017
ESTIMATEDFY 2018
PLANNEDFY 2019
30 Operating Revenues: 00 Miscellaneous Revenue $ 92,253 140,547 $ 90,000 $ 90,000 10 Interest Earnings 10,325 37,268 - - 11 Water Service Charges 3,871,295 5,165,256 4,750,000 4,750,000 21 Water Hook Up Fees 410,979 411,014 325,000 325,000 40 CWP Water Revenues - 1,047,310 - - 36-40 Gain/Loss on Sale Fixed Assets 11,032 14,870 - - 70 Bond Proceeds - - 1,200,000 -37 Capital Revenues: 30 Contributions from Developers 1,297,232 2,323,650 - - 35 Reappropriation of Fund Balance - - - -TOTAL FUND REVENUES $ 5,693,116 $ 9,139,915 $ 6,365,000 $ 5,165,00040 Operating Expenses: 10 Salaries & Wages $ 506,391 $ 621,351 $ 650,638 $ 698,539 11 Overtime 25,187 21,357 30,000 30,000 13 Employee Benefits 427,722 373,343 388,230 415,231 14 Uniforms 2,993 3,407 6,600 6,600 21 Books, Subscriptions, & Memberships 5,493 5,423 10,250 10,250 23 Travel & Training 11,470 28,068 27,000 27,000 24 Office Supplies 1,772 3,354 8,500 8,500 25 Fleet Fund Charges 111,240 111,240 111,240 111,240 26 Buildings & Grounds O & M 48,875 14,724 55,000 55,000 27 Utilities 18,171 24,706 40,000 40,000 28 Supplies & Maintenance 3,278 33,798 108,000 108,000 29 Risk Management Fund Charges 60,000 60,000 60,000 60,000 30 Electricity - Lehi City Power 436,581 614,439 350,000 500,000 31 Professional & Technical 110,456 207,645 153,000 153,000 32 IT Fund Charges 32,000 32,000 37,000 37,000 36 Bond Fees - - 6,500 6,500 38 Water Purchase 267,551 146,721 200,000 405,000 42 Billing Expense 67,548 60,714 50,000 50,000 44 Bad Debt Expense 20,310 5,782 15,000 15,000 45 Special Department Supplies 3,108 10,378 12,000 12,000 47 Annual Meter Maintenance - - 25,000 35,000 48 System Maintenance 5,948 1,158,197 793,000 570,480 49 Tools 705,984 10,061 20,000 20,000 63 Debt Service 31,242 30,440 - - 71 Allocation to General Fund 174,500 174,500 174,500 174,500 95 Depreciation 1,189,459 1,351,616 - - 76 CWP Water Purchase - 1,047,310 1,170,000 -
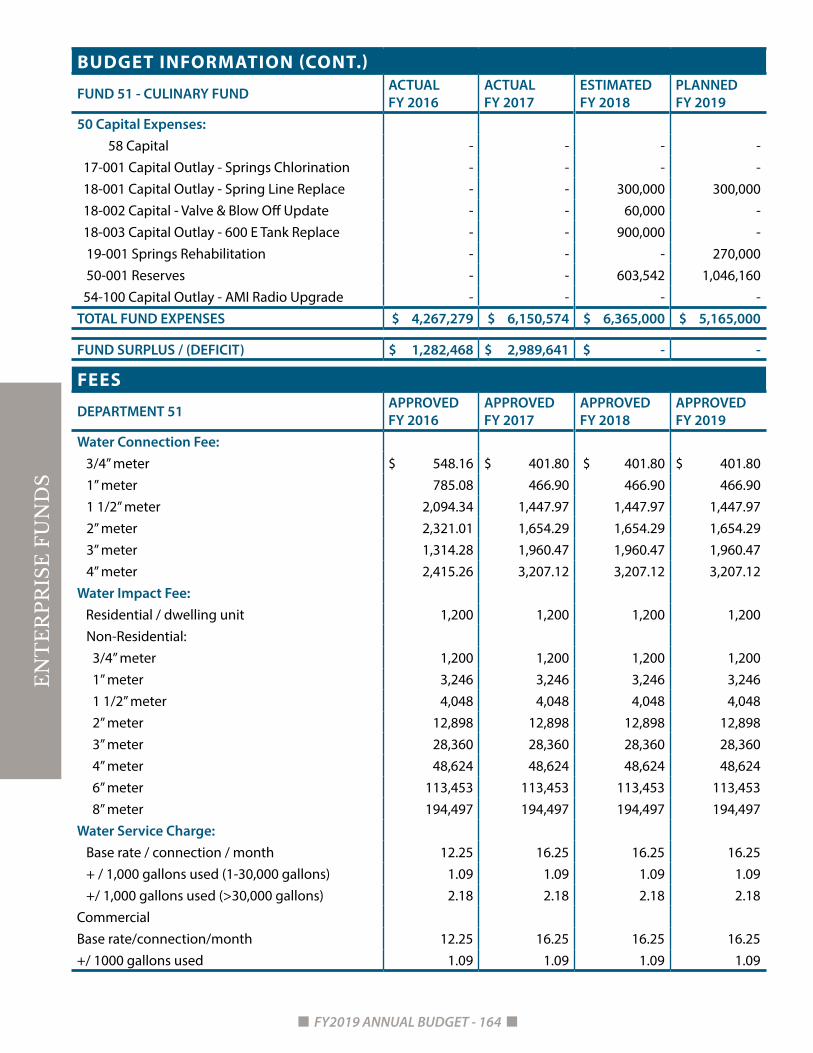
EN
TE
RP
RIS
E F
UN
DS
FY2019 ANNUAL BUDGET - 164
BUDGET INFORMATION (CONT.)
FUND 51 - CULINARY FUND ACTUALFY 2016
ACTUALFY 2017
ESTIMATEDFY 2018
PLANNEDFY 2019
50 Capital Expenses: 58 Capital - - - - 17-001 Capital Outlay - Springs Chlorination - - - - 18-001 Capital Outlay - Spring Line Replace - - 300,000 300,000 18-002 Capital - Valve & Blow Off Update - - 60,000 - 18-003 Capital Outlay - 600 E Tank Replace - - 900,000 - 19-001 Springs Rehabilitation - - - 270,000 50-001 Reserves - - 603,542 1,046,160 54-100 Capital Outlay - AMI Radio Upgrade - - - - TOTAL FUND EXPENSES $ 4,267,279 $ 6,150,574 $ 6,365,000 $ 5,165,000
FUND SURPLUS / (DEFICIT) $ 1,282,468 $ 2,989,641 $ - -
FEES
DEPARTMENT 51 APPROVEDFY 2016
APPROVEDFY 2017
APPROVEDFY 2018
APPROVEDFY 2019
Water Connection Fee: 3/4” meter $ 548.16 $ 401.80 $ 401.80 $ 401.80 1” meter 785.08 466.90 466.90 466.90 1 1/2” meter 2,094.34 1,447.97 1,447.97 1,447.97 2” meter 2,321.01 1,654.29 1,654.29 1,654.29 3” meter 1,314.28 1,960.47 1,960.47 1,960.47 4” meter 2,415.26 3,207.12 3,207.12 3,207.12Water Impact Fee: Residential / dwelling unit 1,200 1,200 1,200 1,200 Non-Residential: 3/4” meter 1,200 1,200 1,200 1,200 1” meter 3,246 3,246 3,246 3,246 1 1/2” meter 4,048 4,048 4,048 4,048 2” meter 12,898 12,898 12,898 12,898 3” meter 28,360 28,360 28,360 28,360 4” meter 48,624 48,624 48,624 48,624 6” meter 113,453 113,453 113,453 113,453 8” meter 194,497 194,497 194,497 194,497Water Service Charge: Base rate / connection / month 12.25 16.25 16.25 16.25 + / 1,000 gallons used (1-30,000 gallons) 1.09 1.09 1.09 1.09 +/ 1,000 gallons used (>30,000 gallons) 2.18 2.18 2.18 2.18CommercialBase rate/connection/month 12.25 16.25 16.25 16.25+/ 1000 gallons used 1.09 1.09 1.09 1.09

EN
TE
RP
RIS
E F
UN
DS
FY2019 ANNUAL BUDGET - 165
BUDGET INFORMATION (CONT.)
FUND 51 - CULINARY FUND ACTUALFY 2016
ACTUALFY 2017
ESTIMATEDFY 2018
PLANNEDFY 2019
50 Capital Expenses: 58 Capital - - - - 17-001 Capital Outlay - Springs Chlorination - - - - 18-001 Capital Outlay - Spring Line Replace - - 300,000 300,000 18-002 Capital - Valve & Blow Off Update - - 60,000 - 18-003 Capital Outlay - 600 E Tank Replace - - 900,000 - 19-001 Springs Rehabilitation - - - 270,000 50-001 Reserves - - 603,542 1,046,160 54-100 Capital Outlay - AMI Radio Upgrade - - - - TOTAL FUND EXPENSES $ 4,267,279 $ 6,150,574 $ 6,365,000 $ 5,165,000
FUND SURPLUS / (DEFICIT) $ 1,282,468 $ 2,989,641 $ - -
FEES
DEPARTMENT 51 APPROVEDFY 2016
APPROVEDFY 2017
APPROVEDFY 2018
APPROVEDFY 2019
Water Connection Fee:3/4” meter $ 548.16 $ 401.80 $ 401.80 $ 401.80
1” meter 785.08 466.90 466.90 466.90 1 1/2” meter 2,094.34 1,447.97 1,447.97 1,447.97 2” meter 2,321.01 1,654.29 1,654.29 1,654.29 3” meter 1,314.28 1,960.47 1,960.47 1,960.47 4” meter 2,415.26 3,207.12 3,207.12 3,207.12Water Impact Fee:
Residential / dwelling unit 1,200 1,200 1,200 1,200 Non-Residential: 3/4” meter 1,200 1,200 1,200 1,200 1” meter 3,246 3,246 3,246 3,246 1 1/2” meter 4,048 4,048 4,048 4,048 2” meter 12,898 12,898 12,898 12,898 3” meter 28,360 28,360 28,360 28,360 4” meter 48,624 48,624 48,624 48,624 6” meter 113,453 113,453 113,453 113,453 8” meter 194,497 194,497 194,497 194,497Water Service Charge: Base rate / connection / month 12.25 16.25 16.25 16.25 + / 1,000 gallons used (1-30,000 gallons) 1.09 1.09 1.09 1.09 +/ 1,000 gallons used (>30,000 gallons) 2.18 2.18 2.18 2.18CommercialBase rate/connection/month 12.25 16.25 16.25 16.25+/ 1000 gallons used 1.09 1.09 1.09 1.09
PRESSURIZED IRRIGATION
POSITION ACTUALFY 2015
ACTUALFY 2016
ACTUALFY 2017
ACTUAL FY 2018
PLANNEDFY 2019
Full-time:Water Systems Supervisor 1.00 1.00 1.00 1.00 1.00Water Systems Operator III 1.00 1.00 1.00 1.00 1.00Water Systems Operator II - 1.00 - - 1.00Water Systems Operator I 2.00 - 1.00 2.00 1.00Blues Stakes Technician 1.00 1.00 1.00 1.00 1.00
Seasonal/Temporary:Water Education Specialist 0.65 0.65 - - -
TOTAL FTE 5.65 4.65 4.00 5.00 5.00
PERFORMANCE MEASURESDEPARTMENT/DIVISION OBJECTIVE: Provide excellent maintenance of the City’s pressurized irrigation system.
PERFORMANCE MEASURE QUICK VIEW
ACTUAL FY 2016
ACTUAL FY 2017
TARGET FY 2018
ACTUAL FY 2018
TARGET FY 2019
Service Connections per FTE 3,082 3,501 <5,000 2916 3120
BUDGET INFORMATION
FUND 55 ACTUALFY 2016
ACTUALFY 2017
ESTIMATED FY 2018
PLANNED FY 2019
30 Operating Revenues: 00 Miscellaneous Revenue $ 512 $ 1,205 $ 35,000 $ 35,000 10 Interest Earnings 12,190 19,844 1,500 1,500 21 Secondary Water Hook Up Fees 182,649 194,242 165,000 165,000 30 Contributions from Developers 2,990,221 5,745,210 - - 31 Pressurized Irrigation Service Charges 2,514,786 2,455,067 2,400,000 2,500,000
36-40 Gain/Loss of Fixed Assets 6,022 - - -36-70 Bond Proceeds - - 3,763,251 -
37 Capital Revenues 35 Reappropriated Fund Balance - - - 174,874TOTAL FUND REVENUES $ 5,706,380 $ 8,415,568 $ 6,364,751 $ 2,876,374

EN
TE
RP
RIS
E F
UN
DS
FY2019 ANNUAL BUDGET - 166
BUDGET INFORMATION - CONTINUED
FUND 55 ACTUALFY 2016
ACTUALFY 2017
ESTIMATEDFY 2018
PLANNEDFY 2019
40 Operating Expenses: 10 Salaries & Wages $ 156,157 $ 167,294 $ 245,184 $ 265,499 11 Overtime 10,743 6,030 15,000 15,000 13 Employee Benefits 141,561 108,610 161,087 167,395 14 Uniforms 1,090 3,279 3,000 3,000 21 Books, Subscriptions, & Memberships - 335.00 500 500 23 Travel & Training 721 1,227 6,000 6,000 24 Office Supplies 1,355 984 8,000 8,000 25 Fleet Fund Charges 25,000 25,000 25,000 25,000 26 Buildings & Grounds O & M 24,258 21,678 20,000 20,000 27 Utilities 1,517 1,728 - - 29 Risk Management Fund Charges 50,000 50,000 50,000 50,000 30 Electricity - Lehi City Power 113,395 209,511 150,000 200,000 31 Professional & Technical 31,476 33,116 40,000 40,000 36 Bond Fees - - 3,000 3,000 42 Billing Expense 16,333 12,978 15,000 15,000 44 Bad Debt Expense 12,531 - 15,000 15,000 45 Supplies & Maintenance 9,416 18,814 16,000 16,000 46 Water Share Assessments 308,010 915,624 1,080,000 1,080,000 46-100 Re-Sale Water Purchase 461,813 - - - 47 Shop Expense - - 2,000 2,000 48 System Maintenance 200,411 231,090 200,000 200,000 61-200 Interest Expense - - - - 63 Debt Service 31,242 30,440 - - 71 Allocation to General Fund 64,890 64,890 64,980 64,980 95 Depreciation 1,324,060 1,444,933 - -50 Capital Expenses: 10-001 Fire Hydrant / Mainline Replacement - - 300,000 300,000 10-002 SCADA Upgrades - - - 20,000 10-003 Reserves - - - - 18-001 Center Street Transmission Line - - 600,000 - 18-003 Murdock Canal Balloon Payment - - 180,000 180,000 18-002 Meter Project - - 3,150,000 - 19-001 Brooks Reservoir Rehabilitation - - - 150,000 19-002 North Lake Repairs - - - 30,000 Capital - - 90,000 -TOTAL FUND EXPENSES $ 2,985,979 $ 3,347,561 $ 6,439,751 $ 2,876,374
FUND SURPLUS/ (DEFICIT) $ 2,720,401 $ 5,068,007 $ (75,000) $ -

EN
TE
RP
RIS
E F
UN
DS
FY2019 ANNUAL BUDGET - 167
FEES
DEPARTMENT 55 APPROVEDFY 2016
APPROVEDFY 2017
APPROVED FY 2018
APPROVED FY 2019
PI Connection Fee:1” lateral $ 319.16 $ 466.90 $ 466.90 466.901 1/4” lateral 423.42 - - -1 1/2” lateral 524.48 1,110.96 1,110.96 1,110.962” lateral 752.84 1,258.43 1,258.43 1,258.43
PI Impact Fee:Residential (single & multi-family) / acre (.25 acre minimum) 4,270 4,270 4,270 4,270
Non-Residential / pervious acre (.25 acre minimum) 6,703 6,703 6,703 6,703
PI Service Charge:Base rate / connection / month 3.14 2.14 2.14 2.14+ / sq. ft. lot divided by 43,560 41.67 41.67 41.67 41.67Minimum / month charge 10.47 10.47 10.47 10.47Pre-construction water permit base 85 85 85 85+ / 1,000 sq. ft. of lot 1 1 1 1or + / lot (whichever is less) 25 25 25 25Fire hydrant non-metered usage 110 110 110 110 Additional cost per lot (if greater than 1) - 25 25 25Metered fire hydrant permit processing 45 45 45 45(+ / utility sign-up processing) 30 30 30 30Hydrant Meter Deposit - 1,550 1,550 1,550Base rate / metered fire hydrant connection / month 4.14 4.14 4.14 4.14
+ / 1,000 gallons used 0.40 0.80 0.80 0.80Minimum / month charge 12.47 12.47 12.47 12.47
Shareholder charge base 4.14 4.14 4.14 4.14+ / month / share 5.84 5.84 5.84 5.84
Penalty for violation of PI water system conservation code:
First violation Written Notice Written Notice Written Notice Written Notice
Second violation 100 100 100 100
Third violation Class C Misdemeanor
Class C Misdemeanor
Class C Misdemeanor
Class C Misdemeanor

EN
TE
RP
RIS
E F
UN
DS
FY2019 ANNUAL BUDGET - 168
WASTE WATER
POSITION ACTUALFY 2015
ACTUALFY 2016
ACTUALFY 2017
ACTUALFY 2018
PLANNEDFY 2019
Full-time:Water Systems Supervisor 1.00 1.00 1.00 1.00 1.00Water Systems Operator IV - - - 2.00 2.00Water Systems Operator III - - 1.00 - -Water Systems Operator II 2.00 2.00 2.00 3.00 3.00Water Systems Operator I **1.00 2.00 2.00 - -
TOTAL FTE 4.00 5.00 6.00 6.00 6.00**Funded, but unfilled position.
PERFORMANCE MEASURESDEPARTMENT/DIVISION OBJECTIVE: Provide excellent maintenance of the City’s waste water system.
PERFORMANCE MEASURE QUICK VIEW
ACTUAL FY 2016
ACTUAL FY 2017
TARGET FY 2018
ACTUAL FY 2018
TARGET FY 2019
Sewer Mains Cleaned (yearly) 72.5% 72% 73% 74% 70% - 75%
Sewer Backups per Year 0 0 0 0 0
Service Connections per FTE 3,912 2,657 <5,000 2794 -
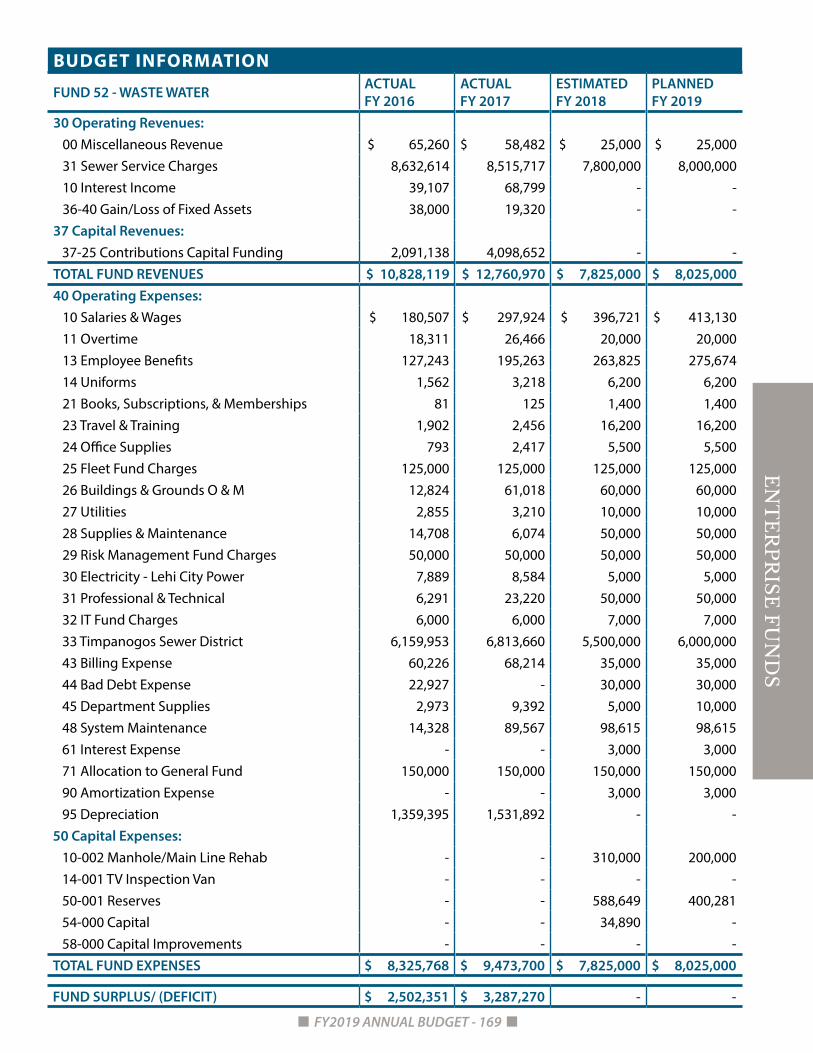
EN
TE
RP
RIS
E F
UN
DS
FY2019 ANNUAL BUDGET - 169
BUDGET INFORMATION
FUND 52 - WASTE WATER ACTUALFY 2016
ACTUALFY 2017
ESTIMATEDFY 2018
PLANNEDFY 2019
30 Operating Revenues: 00 Miscellaneous Revenue $ 65,260 $ 58,482 $ 25,000 $ 25,000 31 Sewer Service Charges 8,632,614 8,515,717 7,800,000 8,000,000 10 Interest Income 39,107 68,799 - - 36-40 Gain/Loss of Fixed Assets 38,000 19,320 - -37 Capital Revenues: 37-25 Contributions Capital Funding 2,091,138 4,098,652 - -TOTAL FUND REVENUES $ 10,828,119 $ 12,760,970 $ 7,825,000 $ 8,025,00040 Operating Expenses: 10 Salaries & Wages $ 180,507 $ 297,924 $ 396,721 $ 413,130 11 Overtime 18,311 26,466 20,000 20,000 13 Employee Benefits 127,243 195,263 263,825 275,674 14 Uniforms 1,562 3,218 6,200 6,200 21 Books, Subscriptions, & Memberships 81 125 1,400 1,400 23 Travel & Training 1,902 2,456 16,200 16,200 24 Office Supplies 793 2,417 5,500 5,500 25 Fleet Fund Charges 125,000 125,000 125,000 125,000 26 Buildings & Grounds O & M 12,824 61,018 60,000 60,000 27 Utilities 2,855 3,210 10,000 10,000 28 Supplies & Maintenance 14,708 6,074 50,000 50,000 29 Risk Management Fund Charges 50,000 50,000 50,000 50,000 30 Electricity - Lehi City Power 7,889 8,584 5,000 5,000 31 Professional & Technical 6,291 23,220 50,000 50,000 32 IT Fund Charges 6,000 6,000 7,000 7,000 33 Timpanogos Sewer District 6,159,953 6,813,660 5,500,000 6,000,000 43 Billing Expense 60,226 68,214 35,000 35,000 44 Bad Debt Expense 22,927 - 30,000 30,000 45 Department Supplies 2,973 9,392 5,000 10,000 48 System Maintenance 14,328 89,567 98,615 98,615 61 Interest Expense - - 3,000 3,000 71 Allocation to General Fund 150,000 150,000 150,000 150,000 90 Amortization Expense - - 3,000 3,000 95 Depreciation 1,359,395 1,531,892 - -50 Capital Expenses: 10-002 Manhole/Main Line Rehab - - 310,000 200,000 14-001 TV Inspection Van - - - - 50-001 Reserves - - 588,649 400,281 54-000 Capital - - 34,890 - 58-000 Capital Improvements - - - -TOTAL FUND EXPENSES $ 8,325,768 $ 9,473,700 $ 7,825,000 $ 8,025,000
FUND SURPLUS/ (DEFICIT) $ 2,502,351 $ 3,287,270 - -

EN
TE
RP
RIS
E F
UN
DS
FY2019 ANNUAL BUDGET - 170
FEES
DEPARTMENT 52 APPROVEDFY 2016
APPROVED FY 2017
APPROVEDFY 2018
APPROVEDFY 2019
Impact Fee:Residential / dwelling unit $ 460 $ 460 $ 460 460Non-Residential:
3/4” meter 460 460 460 4601” meter 1,230 1,230 1,230 1,2301 1/2” meter 1,534 1,534 1,534 1,5342” meter 4,914 4,914 4,914 4,9143” meter 10,745 10,745 10,745 10,7454” meter 18,424 18,424 18,424 18,4246” meter 42,987 42,987 42,987 42,9878” meter 73,694 73,694 73,694 73,694
Service Charge:Base rate / connection / month 22 19 19 19+ / 1,000 gallons used 2 2 2 2
Timpanogos Special Service District (Regional Sewer Treatment Plant):
Impact Fee:Single family housing / house 2,563 2,563 2,563 1,708Multi unit residential / dwelling unit 2,563 2,563 2,563 1,110Commercial, industrial, institutional See TSSD See TSSD See TSSD See TSSD

EN
TE
RP
RIS
E F
UN
DS
FY2019 ANNUAL BUDGET - 171
POWER
THE LEHI CITY POWER DEPARTMENT PROVIDES RELIABLE ELECTRICAL SERVICE TO OUR CUSTOMERS WITH LOCAL CONTROL AND COMPETITIVE RATES.
Use technology and improved infrastructure to provide safe, reliable power.
DEPARTMENT DESCRIPTIONThe Power Department manages power operations under three department divisions: Planning & Engineering, Operations, and Metering & Substations. Linemen and operators are responsible for the construction and maintenance of overhead and underground lines. Operators also provide maintenance to the power system, install and repair meters, troubleshoot voltage problems, and maintain streetlights.

EN
TE
RP
RIS
E F
UN
DS
FY2019 ANNUAL BUDGET - 172
AMINISTRATIVE ASSISTANT
WAREHOUSEMANAGER
Kenny Norris
OPERATIONSMANAGER
Ken Bringhurst
PLANNING &ENGINEERING MGR
Brent Thomas
POWER DIRECTOR
Joel Eves
MeteringSystem
Supervisor
Power Line Field
Supervisor (3)
Apprentice PowerLineman (5)
Journey Power Lineman (3)
Power FieldTechnician
Meter SystemTechnician
AssistantPlanner
PowerLine Field
Supervisor
SubstationSupervisor
Blue StakesTechnician
Groundsman
Inspector
Laborer
SubstationTechnician
Melanie Hansen

EN
TE
RP
RIS
E F
UN
DS
FY2019 ANNUAL BUDGET - 173
POSITION ACTUALFY 2015
ACTUALFY 2016
ACTUALFY 2017
ACTUALFY 2018
PLANNEDFY 2019
Full-time:Power Director 1.00 1.00 1.00 1.00 1.00Administrative Assistant - - 1.00 1.00 1.00Engineering Manager 1.00 1.00 1.00 1.00 1.00Assistant Power Planner/System Design - 1.00 1.00 1.00 1.00Operations Manager 1.00 1.00 1.00 1.00 1.00Metering System Supervisor 1.00 1.00 1.00 1.00 1.00Power Line Field Supervisor 3.00 4.00 4.00 4.00 4.00Substation Technician Foreman - 1.00 1.00 1.00 1.00Journey Power Lineman 7.00 7.00 3.00 3.00 3.00Metering System Technician 1.00 1.00 1.00 1.00 1.00Warehouse Manager 1.00 1.00 1.00 1.00 1.00Apprentice Lineman - 1.00 5.00 6.00 6.00Substation Technician - 1.00 1.00 1.00 1.00Power/Fiber Inspector 1.00 1.00 1.00 1.00 1.00Warehouse/Maintenance Worker - - - - -URD Laborer 1.00 1.00 1.00 1.00 1.00Service Laborer 1.00 1.00 1.00 1.00 1.00Blue Stakes Technician 1.00 1.00 1.00 1.00 1.00Draftsman - - - 1.00 1.00Forecast Manager - - - 1.00 1.00Meter Reader - - 1.00 1.00 1.00
Part-Time Benefited:Meter Reader 0.67 0.67 - - -Mapping Auditor - - - - .5
Part-Time Non-Benefited:Administrative Assistant 0.75 0.75 - - .5
Seasonal/Temporary:Laborer **0.68 **0.68 **0.68 **0.68 0.68GIS Intern **1.50 **1.50 **1.50 **1.50 -
TOTAL FTE 23.60 28.60 29.18 32.18 31.68**Funded, but unfilled position.

EN
TE
RP
RIS
E F
UN
DS
FY2019 ANNUAL BUDGET - 174
PERFORMANCE MEASURESDEPARTMENT/DIVISION OBJECTIVE: Maintain a functional and reliable power infrastructure.
PERFORMANCE MEASURE QUICK VIEW
ACTUAL FY 2016
ACTUAL FY 2017
TARGET FY 2018
ACTUAL FY 2018
TARGET FY 2019
Street Lights Audited per Year (%) 9% 9% 25% 0%* 10%
Non-Operational Street Lights (%) 10% 1.8% 10% 0%* 10%
SAIFI (Average Number of Interruptions/Customer) 0.843 1.19 0.300 0.763 0.75
SAIDI (Average Outage Duration/Customer; in minutes) 45.05 52.00 20.00 45.03 45
Megawatt Hours Billed to Used (%) 91.3% 92% 96% 95% 95%
Decrease in power usage per household from previous year (%) 0.5% 4% 5% 0% 1%
*Due to project workload, audits were not completed for FY 2018. Audits will resume in FY 2019.
BUDGET INFORMATION
FUND 53 ACTUALFY 2016
ACTUALFY 2017
ESTIMATEDFY 2018
PLANNEDFY 2019
30 Operating Revenues: 11 Electric Sales Taxable $ 25,391,035 $ 27,711,384 $ 28,000,000 $ 28,549,846 12 Electric Sales Tax Exempt 3,055,079 3,081,830 3,300,000 3,300,000 25 Electric Hook Up Fees 295,050 289,263 275,000 275,00036 Miscellaneous Revenues: 00 Miscellaneous Revenue 381,697 124,430 175,000 175,000 03 Temporary Power Charges 71,411 72,401 75,000 75,000 05 Revenue from Damages 32,996 21,718 25,000 25,000 10 Interest Income 39,165 114,110 40,000 40,000 15 Salvage Revenue - 36,864 25,000 25,000 20 Gain/Loss Sales of Fixed Assets 11,960 4,423 - - 25 Contribution Capital Funding 1,023,153 1,600,630 - - 50 Late Payment Penalties 154,825 148,302 185,000 185,000 60 Pole Attachment Revenue 43,110 66,337 50,000 50,000 37 Capital Revenues: 60 Subdivision Development Reimbursement 2,799,930 3,768,814 3,500,000 3,500,000 TOTAL FUND REVENUES $ 33,299,411 $ 37,040,506 $ 35,650,000 $ 36,199,846 40 Operating Expenses: 10 Salaries & Wages $ 1,527,904 $ 1,427,990 $ 2,213,809 $ 2,440,633 11 Overtime 92,556 112,622 135,047 135,047 13 Employee Benefits 1,095,763 827,441 1,220,640 1,299,632 14 Uniforms 15,271 18,541 19,250 19,600 21 Books, Subscriptions, & Memberships 366 1,305 3,000 3,000 23 Travel & Training 37,394 48,042 53,600 59,200 24 Office Supplies 11,677 6,162 26,200 20,375

EN
TE
RP
RIS
E F
UN
DS
FY2019 ANNUAL BUDGET - 175
BUDGET INFORMATION - CONTINUED
FUND 53 ACTUALFY 2016
ACTUALFY 2017
ESTIMATEDFY 2018
PLANNEDFY 2019
25 Fleet Fund Charges 367,773 455,009 455,000 455,000 26 Buildings & Grounds O & M 37,220 136,729 129,325 150,000 27 Utilities 50,933 18,079 52,000 56,000 28 Supplies & Maintenance 685 - 2,000 3,500 29 Risk Management Fund Charges 200,000 300,000 300,000 300,000 30 Electricity - Lehi City Power 16,673 16,270 17,333 17,333 31 Professional & Technical 70,706 105,017 291,300 291,300 32 IT Fund Charges 20,000 20,000 23,000 23,000 33 Computer Maintenance - 612 5,000 5,000 36 Bond Fees / Admin Fees 1,650 1,650 2,500 2,500 38 Tree Trimming Expense 86,819 70,741 79,000 79,000 40 Safety 17,745 26,393 44,750 36,650 42 Delinquent Collection Expense 34,196 - 22,031 22,031 43 Billing Expense 179,073 205,650 150,000 200,000 44 Bad Debt Expense 202,561 34,502 65,000 65,000 45 System Maintenance 780,534 1,032,257 27,300 20,000 45-100 Miscellaneous 9,186 21,754 29,500 29,800 46 Resale Power Purchase 19,583,064 20,536,153 23,276,800 24,794,265 47 Supplies & Maintenance 143,167 44,598 61,000 61,000 48 Substation Maintenance 38,427 48,003 49,200 53,500 49 Power Locating 3,263 4,813 3,500 5,500 60 Debt Service 93,731 341,590 804,000 2,056,250 71 Allocation to General Fund 265,920 265,920 266,000 266,000 85 Depreciation 2,028,242 2,281,325 - - 50 Capital Expenses:
50-001 Reserves - - 4,647,415 1,777,730 53 Improvement to System - - 400,000 400,000 54 Capital Outlay - - 75,000 160,000 55 Street Light Project - - 150,000 250,000 56 Subdivision Construction - - 250,000 300,000 57 Power Line Purchases - - 150,000 150,000 59-100 New Equipment - - 20,500 112,000 59-101 Veyo Project Prepayment - - - - 59-102 Substation Security - - 30,000 30,000 59-120 Designated City Projects - - 50,000 50,000 59-130 Equipment Storage - - 50,000 -TOTAL FUND EXPENSES $ 27,012,499 $ 28,409,168 $ 35,650,000 $ 36,199,846
FUND SURPLUS / (DEFICIT) $ 6,286,912 $ 8,631,338 $ - $ -

EN
TE
RP
RIS
E F
UN
DS
FY2019 ANNUAL BUDGET - 176
FEES
DEPARTMENT 53 - POWER APPROVEDFY 2016
APPROVED FY 2017
APPROVEDFY 2018
APPROVED FY 2019
Connection Fee:Single Phase Single Meter:
Up to 200 AMPS $ 325 $ 325 $ 325 $ 325201-400 AMPS 450 450 450 450
Three Phase Single Meter:Up to 200 AMPS 350 350 350 350201-400 AMPS 275 275 275 275401-800 AMPS 975 975 975 975801-1,600 AMPS 1,250 1,250 1,250 1,2501,601-2,500 AMPS 1,500 1,500 1,500 1,5002,501-4,000 AMPS 1,900 1,900 1,900 1,900
Single Phase Multimeter/meter 60 60 60 60(AMPS cost schedule same as single meter)
Three Phase Multimeter/meter 200 200 200 200(AMPS cost schedule same as single meter)Net Meter - 500 500 500
Impact Fee:Residential Single Phase Service Sizes:
AMPS KVA Peak Demand100 24 5 $ 1,135 $ 1,135 $ 1,135 1,135125 30 6 1,362 1,362 1,362 1,362150 36 7 1,589 1,589 1,589 1,589200 48 8 1,816 1,816 1,816 1,816225 54 10 2,270 2,270 2,270 2,270400 96 14 3,177 3,177 3,177 3,177
Commercial Single Phase Service Sizes:AMPS KVA Peak Demand
100 24 5 1,135 1,135 1,135 1,135125 30 7 1,589 1,589 1,589 1,589150 36 9 2,043 2,043 2,043 2,043200 48 14 3,177 3,177 3,177 3,177400 96 19 4,312 4,312 4,312 4,312
Commercial/Residential 3-Phase (120/240) Service Sizes:
AMPS KVA Peak Demand125 52 16 3,631 3,631 3,631 3,631150 62 24 5,447 5,447 5,447 5,447200 83 31 7,035 7,035 7,035 7,035400 166 63 14,298 14,298 14,298 14,298600 249 94 21,333 21,333 21,333 21,333

EN
TE
RP
RIS
E F
UN
DS
FY2019 ANNUAL BUDGET - 177
FEES - CONTINUED
DEPARTMENT 53 - POWER APPROVEDFY 2016
APPROVEDFY 2017
APPROVEDFY 2018
APPROVED FY 2019
AMPS KVA Peak Demand
800 333 126 28,596 28,596 28,596 28,596
1000 416 157 35,631 35,631 35,631 35,631
1200 499 189 42,894 42,894 42,894 42,894
1600 665 252 57,191 57,191 57,191 57,191
2000 831 312 71,035 71,035 71,035 71,035
2500 1039 394 89,418 89,418 89,418 89,418
Commercial/Residential 3-Phase (120/208) Service Sizes:
AMPS KVA Peak Demand
125 45 16 3,631 3,631 3,631 3,631
150 54 24 5,447 5,447 5,447 5,447
200 72 31 7,035 7,035 7,035 7,035
400 144 63 14,298 14,298 14,298 14,298
600 216 94 21,333 21,333 21,333 21,333
800 288 126 28,596 28,596 28,596 28,596
1000 360 157 35,631 35,631 35,631 35,631
1200 432 189 42,894 42,894 42,894 42,894
1600 576 252 57,191 57,191 57,191 57,191
2000 721 315 71,489 71,489 71,489 71,489
2500 901 394 89,418 89,418 89,418 89,418
Commercial/Residential 3-Phase (277/480V) Service Sizes:
AMPS KVA Peak Demand
125 104 35 7,943 7,943 7,943 7,943
150 125 52 11,801 11,801 11,801 11,801
200 166 73 16,567 16,567 16,567 16,567
400 333 145 32,908 32,908 32,908 32,908
600 499 219 49,702 49,702 49,702 49,702
800 665 290 65,816 65,816 65,816 65,816
1000 831 364 82,610 82,610 82,610 82,610
1200 998 436 98,950 98,950 98,950 98,950
1600 1330 583 132,312 132,312 132,312 132,312
2000 1663 728 165,220 165,220 165,220 165,220
2500 2078 910 206,524 206,524 206,524 206,524
3000 2494 1092 247,829 247,829 247,829 247,829
3500 2910 1272 228,680 228,680 228,680 228,680
3750 3118 1363 309,333 309,333 309,333 309,333

EN
TE
RP
RIS
E F
UN
DS
FY2019 ANNUAL BUDGET - 178
FEES - CONTINUED
DEPARTMENT 53 - POWER APPROVEDFY 2016
APPROVED FY 2017
APPROVEDFY 2018
APPROVED FY 2019
4000 3326 1454 329,985 329,985 329,985 329,985
Service Charge: Residential/kWh ($4.50 minimum bill) 0.08761 0.08761 0.08761 0.08761
Commercial base/month 9 9 9 9
+/kWh. 1st 1,000 kWh (if no demand) 0.0980 0.0980 0.0980 0.098
+/kWh. >1st 1,000 kWh (if no demand) 0.0661 0.0661 0.0661 0.0661
+/kWh. 1st 1,000 kWh (if demand) 0.0980 0.09890 0.09890 0.098
+/kWh, > 1st 1,000 kWh (if demand) 0.0661 0.0661 0.0661 0.0661
+Demand/kW 7.75 7.75 7.75 7.75
Net Meter kWh 0.08761 0.08761 0.08761 0.08761
kWh if Generated by Customer Exceeds Consumption -
- 0.08761 credit 0.08761 credit 0.08761 credit
Meter Tampering 100 100 100 100
Pole Attachment/year 18 18 18 18
Banner Installation and Removal 150 150 150 150
+ each additional week 50 50 50 50

EN
TE
RP
RIS
E F
UN
DS
FY2019 ANNUAL BUDGET - 179
WASTE COLLECTION
FUND DESCRIPTIONSolid waste collection is managed by the Finance Department (see page 79) and is contracted to Waste Management of Utah. The contractor supplies solid waste collection containers and collects the waste. The Finance Department is responsible for educating residents about dump passes, spring cleanup, and cleanup dumpsters that are accessible year-round and located throughout the City.
BUDGET INFORMATION
FUND 54 ACTUALFY 2016
ACTUALFY 2017
ESTIMATEDFY 2018
PLANNEDFY 2019
30 Operating Revenues: 20 Garbage Service Charges $ 2,196,940 $ 2,300,452 $ 2,410,000 $ 2,410,000 22 Dump Pass Receipts 9,590 8,580 7,500 7,50036 Miscellaneous Revenues: 10 Interest Income 2,255 3,665 500 50037 Other Revenues: 35 Re-Appropriation of Fund Balance - - - -TOTAL OPERATING REVENUES $ 2,208,785 $ 2,312,697 $ 2,418,000 $ 2,418,00040 Operating Expenses: 11 Garbage Contract Payment $ 1,440,276 $ 1,548,692 $ 1,653,000 $ 1,653,000 38 Operation Expenses by Ton / Month 651,423 720,232 600,000 700,000 39 Glass Recyling - - 10,000 10,000 42 Billing Expense 12,391 24,135 25,000 25,000 43 Bad Debt Expense 12,128 93 10,000 10,000 45 City Clean-up Expense 7,270 7,109 10,000 10,000 71 Allocation to General Fund 10,000 10,000 10,000 10,000 72 Reserves - - 100,000 -TOTAL OPERATING EXPENSES $ 2,133,488 $ 2,310,261 $ 2,418,000 $ 2,418,000
FUND SURPLUS / (DEFICIT) $ 75,297 $ 2,436 $ - $ -
FEES
DEPARTMENT 54 APPROVEDFY 2016
APPROVEDFY 2017
APPROVEDFY 2018
APPROVED FY 2019
First garbage tote/month $ 10.50 $ 10.50 $ 10.50 $ 10.50Additional garbage tote(s) each / month 10 10 10 10Recyclables tote (bi-weekly collect) / month Free Free Free FreeGreen waste tote / month (April - November only) 6.50 6.50 6.50 6.50

INTERNAL SERVICE FUNDS

INT
ER
NA
L S
ER
VIC
E F
UN
DS
FY2019 ANNUAL BUDGET - 181
INTERNAL SERVICE FUNDS
FUND DESCRIPTIONInternal service funds are used to fund divisions and sections within departments that provide services to internal city entities. As a result, they receive revenues through charges to other departments and their associated funds. The city has four internal service funds: Information Technology, Fleet, Risk Management, and Building/Grounds.

INT
ER
NA
L S
ER
VIC
E F
UN
DS
FY2019 ANNUAL BUDGET - 182
INFORMATION TECHNOLOGY FUND
FUND 63 ACTUALFY 2016
ACTUALFY 2017
ESTIMATEDFY 2018
PLANNEDFY 2019
36 Miscellaneous Revenues: 10 Interest Income $ 2,766 $ 5,124 $ 7,500 $ 7,500 90 Miscellaneous Revenue - 7,429 - -37 Other Revenues: 80 Reserves - - 274,811 259,59238 Operating Revenues: 30 Charge to General Fund 567,000 817,000 656,500 661,700 31 Charge to Legacy Center Fund 46,000 46,000 53,000 53,000 32 Charge to Water Fund 32,000 32,000 37,000 37,000 33 Charge to Sewer Fund 6,000 6,000 7,000 7,000 34 Charge to Electric Fund 20,000 20,000 23,000 23,000 35 Charge to Drainage Fund 6,000 6,000 7,000 7,000 36 Charge to Museum Fund 6,000 6,000 - - 39 Charge to Fleet Fund 2,000 2,000 2,300 2,300 40 Charge to Risk Management Fund 4,000 4,000 4,600 4,600 41 Charge to Buildings & Grounds Fund - 5,000 5,750 5,750TOTAL OPERATING REVENUES $ 697,309 $ 956,553 $ 1,078,461 $ 1,068,44240 Operating Expenses: 10 Salaries & Wages $ 242,494 220,577 $ 270,508 $ 263,569 13 Employee Benefits 134,366 121,909 153,245 150,166 21 Books, Subscriptions, & Memberships 765 36 2,000 2,000 23 Travel & Training 7,186 11,157 15,000 15,000 24 Office Supplies 141 1,358 1,500 1,500 25 Fleet Fund Charges 3,000 3,000 3,000 3,000 27 Utilities 2,838 2,732 5,000 5,000 28 Supplies & Maintenance 63,759 119,075 178,483 178,483 29 Risk Management Fund Charges 5,000 5,000 5,000 5,000 31 Professional & Technical 5,489 5,967 15,000 15,000 45 Miscellaneous 3,354 2,858 43,049 43,049 46 Software Licensing 69,988 71,318 41,676 41,676 47 Software Maintenance 76,138 73,712 45,000 45,000 55 Hardware Replacement 74,394 47,415 200,000 200,000 56 Software Upgrade - - 100,000 100,000 70 Reserves - - - - 95 Depreciation 38,784 45,143 - - TOTAL OPERATING EXPENSES $ 727,696 $ 731,257 $ 1,078,461 $ 1,068,442
FUND SURPLUS/ (DEFICIT) $ (30,387) $ 225,296 $ - $ -

INT
ER
NA
L S
ER
VIC
E F
UN
DS
FY2019 ANNUAL BUDGET - 183
FLEET FUND
FUND 64 ACTUALFY 2016
ACTUALFY 2017
ESTIMATEDFY 2018
PLANNEDFY 2019
36 Miscellaneous Revenues: 10 Interest Income $ 2,250 $ 1,283 $ 20,840 $ 20,840 40 Gain/Loss on Disposal of Fixed Assets - (13,959) - -37 Other Revenues: 80 Reserves - - 559,667 229,438 90 Miscellaneous 16,437 1,987 - -38 Operating Revenues: 30 Charge to General Fund 1,388,000 1,888,000 888,000 903,000 31 Charge to Legacy Center Fund 2,000 2,000 2,000 2,000 32 Charge to Water Fund 111,240 111,240 111,240 111,240 33 Charge to Sewer Fund 125,000 125,000 125,000 125,000 34 Charge to Electric Fund 365,952 455,010 455,000 455,000 35 P.I. Fund 25,000 25,000 25,000 25,000 36 Charge to Drainage Fund 25,000 25,000 25,000 25,000 37 Charge to Buildings & Grounds Fund - 5,000 5,000 15,000 39 Charge to IT Fund 3,000 3,000 3,000 3,000 40 Charge to Risk Management Fund 5,000 5,000 5,000 5,000TOTAL OPERATING REVENUES $ 2,153,735 $ 2,633,561 $ 2,224,747 $ 1,919,51840 Operating Expenses: 10 Salaries & Wages $ 134,161 205,497 $ 204,629 $ 210,506 11 Overtime 12,913 28,900 - - 13 Employee Benefits 78,270 112,228 107,833 109,916 21 Books, Subscriptions, & Memberships 7,546 7,591 7,500 7,500 23 Travel & Training 12,197 8,710 10,000 10,000 24 Office Supplies 305 3,300 1,200 1,200 25 Operating Expenses 450,625 479,588 375,000 375,000
25-100 Fuel 451,454 423,586 485,800 485,80026 IT Fund Charges 2,050 2,000 2,300 2,30027 Utilities 1,913 2,297 - -28 Supplies & Maintenance 58,856 55,513 100,000 100,00029 Risk Management Fund Charges 5,000 5,000 5,000 5,00031 Professional and Technical 1,468 65 - -45 Miscellaneous 24,216 12,622 12,296 12,29654 Equipment Replacement - - 913,189 600,00070 Reserves/Depreciation 561,232 651,583 - -
TOTAL OPERATING EXPENSES $ 1,802,206 $ 1,998,480 $ 2,224,747 $ 1,919,518
FUND SURPLUS/ (DEFICIT) $ 351,529 $ 635,081 $ - $ -
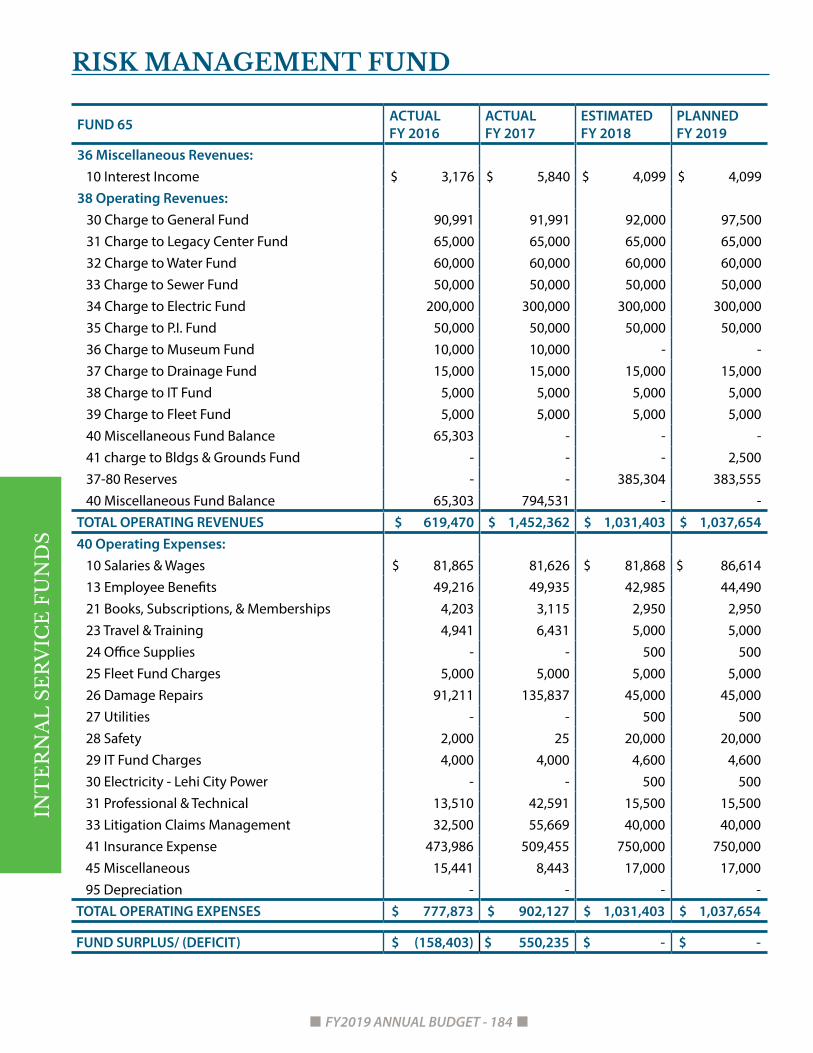
INT
ER
NA
L S
ER
VIC
E F
UN
DS
FY2019 ANNUAL BUDGET - 184
RISK MANAGEMENT FUND
FUND 65 ACTUALFY 2016
ACTUALFY 2017
ESTIMATEDFY 2018
PLANNEDFY 2019
36 Miscellaneous Revenues: 10 Interest Income $ 3,176 $ 5,840 $ 4,099 $ 4,099 38 Operating Revenues: 30 Charge to General Fund 90,991 91,991 92,000 97,500 31 Charge to Legacy Center Fund 65,000 65,000 65,000 65,000 32 Charge to Water Fund 60,000 60,000 60,000 60,000 33 Charge to Sewer Fund 50,000 50,000 50,000 50,000 34 Charge to Electric Fund 200,000 300,000 300,000 300,000 35 Charge to P.I. Fund 50,000 50,000 50,000 50,000 36 Charge to Museum Fund 10,000 10,000 - - 37 Charge to Drainage Fund 15,000 15,000 15,000 15,000 38 Charge to IT Fund 5,000 5,000 5,000 5,000 39 Charge to Fleet Fund 5,000 5,000 5,000 5,000 40 Miscellaneous Fund Balance 65,303 - - - 41 charge to Bldgs & Grounds Fund - - - 2,500
37-80 Reserves - - 385,304 383,55540 Miscellaneous Fund Balance 65,303 794,531 - -
TOTAL OPERATING REVENUES $ 619,470 $ 1,452,362 $ 1,031,403 $ 1,037,65440 Operating Expenses: 10 Salaries & Wages $ 81,865 81,626 $ 81,868 $ 86,614 13 Employee Benefits 49,216 49,935 42,985 44,490 21 Books, Subscriptions, & Memberships 4,203 3,115 2,950 2,950 23 Travel & Training 4,941 6,431 5,000 5,000 24 Office Supplies - - 500 500 25 Fleet Fund Charges 5,000 5,000 5,000 5,000 26 Damage Repairs 91,211 135,837 45,000 45,000 27 Utilities - - 500 500 28 Safety 2,000 25 20,000 20,000 29 IT Fund Charges 4,000 4,000 4,600 4,600 30 Electricity - Lehi City Power - - 500 500 31 Professional & Technical 13,510 42,591 15,500 15,500 33 Litigation Claims Management 32,500 55,669 40,000 40,000 41 Insurance Expense 473,986 509,455 750,000 750,000 45 Miscellaneous 15,441 8,443 17,000 17,000 95 Depreciation - - - -TOTAL OPERATING EXPENSES $ 777,873 $ 902,127 $ 1,031,403 $ 1,037,654
FUND SURPLUS/ (DEFICIT) $ (158,403) $ 550,235 $ - $ -

INT
ER
NA
L S
ER
VIC
E F
UN
DS
FY2019 ANNUAL BUDGET - 185
BUILDINGS & GROUNDS FUND
FUND 69 ACTUALFY 2016
ACTUALFY 2017
ESTIMATEDFY 2018
PLANNEDFY 2019
30 Operating Revenues: 30 Charge to General Fund $ 295,184 $ 814,616 $ 397,695 1,153,622 31 Charge to Legacy Center Fund 80,000 92,009 92,000 92,000 32 Charge to Water Fund 9,996 9,996 10,000 55,000 33 Charge to Sewer Fund 9,996 60,000 60,000 60,000 34 Charge to Electric Fund 27,324 134,396 129,325 150,000 35 Charge to P.I. Fund 20,004 20,004 20,000 20,000 36 Charge to Museum Fund 2,940 2,940 - - 37 Charge to Drainage Fund 9,996 9,996 10,000 10,000 70 Reserves - - - -TOTAL OPERATING REVENUES $ 455,440 $ 1,143,957 $ 719,020 $ 1,540,622 40 Operating Expenses: 10 Salaries & Wages $ 136,790 194,599 $ 255,918 $ 734,515 11 Overtime 875 8,897 - - 12 Uniforms 1,415 1,242 1,000 4,400 13 Employee Benefits 91,379 130,715 145,599 281,918 21 Books, Subscriptions, & Memberships - 80 500 500 23 Travel & Training 4,357 3,216 2,500 2,500 24 Office Supplies 24 313 500 2,000 25 Fleet Fund Charges - 5,004 5,000 15,000 26 Repairs 257,168 249,457 193,825 205,825 27 Utilities - - 500 4,000 28 Supplies & Maintenance 86,967 125,307 50,000 50,000 29 IT Fund Charges - 5,004 5,750 5,750 30 Risk Management fund Charges - - - 2,500 33 Equipment Maintenance - - - 13,000 40 Building Beautification Expenses - - - 16,500 45 Miscellaneous 17,795 4,815 7,653 12,653 54 Capital Outlay - - 50,275 68,500 70 Reserves - - - 121,061 95 Depreciation 13,745 34,344 - -TOTAL OPERATING EXPENSES $ 610,515 $ 762,993 $ 719,020 $ 1,540,622
FUND SURPLUS/ (DEFICIT) $ (155,075) $ 380,964 $ - $ -*Physical Facilities was added to the Buildings & Grounds fund in FY 2019

REDEVELOPMENTAGENCY FUNDS

RE
DE
VE
LO
PM
EN
T A
GE
NC
Y
FY2019 ANNUAL BUDGET - 187
REDEVELOPMENT AGENCY FUNDS
FUND DESCRIPTIONRedevelopment Areas (RDAs) (now called Urban Renewal Areas), Economic Development Areas (EDAs), and Community Development Areas (CDAs) are established by the Lehi Redevelopment Agency in certain areas of the City identified for redevelopment and economic development. The creation of an RDA is based primarily on blight reduction and job creation, the creation of an EDA is based on job creation, and the creation of a CDA is based on broad economic development factors. RDAs, EDAs, and CDAs allow the City to utilize tax increment financing (TIF) to stimulate development within the area. Additional information on redevelopment and economic development efforts within the City can be found on page 74.
MILLPOND AREA RDA
FUND 60 ACTUALFY 2016
ACTUALFY 2017
ESTIMATEDFY2018
APPROVEDFY2019
Revenues:31-10 Property Tax $ 429,496 $ 334,265 $ 335,000 $ 335,000 36-10 Interest Income 9,153 14,796 7,500 7,50038-10 Reserves - - 607,500 -TOTAL REVENUE $ 438,649 $ 349,061 $ 950,000 $ 342,500 40 Expenses:
71 Reserves $ - $ - $ - $ 72,500
72 Millpond RDA Engineering - 311,152 - -
73 Millpond RDA Streets - 315,193 700,000 20,000
78 Millpond RDA Water - - 250,000 250,000
76 Transfer to Outdoor Pool 70,000 196,441 - -TOTAL EXPENSES $ 70,000 $ 822,786 $ 950,000 $ 342,500
FUND SURPLUS/ (DEFICIT) $ 368,649 $ (473,725) $ - $ -
XACTWARE
FUND 62 ACTUALFY 2016
ACTUALFY 2017
ESTIMATEDFY 2018
APPROVEDFY 2019
Revenue: 31-10 Property Tax $ 168,764 $ 305,692 $ 325,000 $ 325,000TOTAL REVENUE $ 168,764 $ 305,692 $ 325,000 $ 325,00040 Expenses:
32 Administration $ 5,063 $ - $ 9,750 $ 9,750
80 Taxing Entities 163,701 305,692 315,250 315,250 TOTAL EXPENSES $ 168,764 $ 305,692 $ 325,000 $ 325,000
FUND SURPLUS/ (DEFICIT) $ - $ - $ - $ -

RE
DE
VE
LO
PM
EN
T A
GE
NC
Y
FY2019 ANNUAL BUDGET - 188
IM FLASH AREA RDAFUND 61 ACTUAL
FY 2016ACTUALFY 2017
ESTIMATEDFY 2018
APPROVEDFY 2019
Revenues: 31-10 Property Tax $ 9,161,503 $ 10,879,090 $ 11,000,000 $ 11,000,000 38-91 Micro Loan Proceeds - - 9,000,000 9,000,000 TOTAL REVENUE $ 9,161,503 $ 10,879,090 $ 20,000,000 $ 20,000,000 40 Expenses:
70 Contribution to Alpine School District $ 1,214,815 $ 1,442,568 $ 1,458,600 $ 1,458,600 71 TSSD 107,189 127,285 128,700 128,700 72 Contribution to Utah County 211,630 251,306 254,100 254,100 75 Transfer to Lehi City 1,239,692 1,442,568 1,458,600 1,458,600 90 Debt Service - Micron Note - 7,615,363 7,700,000 7,700,000 91 IM Flash Construction Projects/ Misc. 6,413,053 - 9,000,000 9,000,000 TOTAL EXPENSES $ 9,186,379 $ 10,879,090 $ 20,000,000 $ 20,000,000
FUND SURPLUS/ (DEFICIT) $ (24,876) $ - $ - $ -
THANKSGIVING PARK EDA
FUND 66 ACTUALFY 2016
ACTUALFY 2017
ESTIMATEDFY 2018
APPROVEDFY 2019
Revenue: 31-10 Property Tax $ 172,703 $ 273,508 $ 300,000 $ 300,00038-91 Contribution/ Loan - - - - TOTAL REVENUE $ 172,703 $ 273,508 $ 300,000 $ 300,00040 Expenses:
31 Administration Charges $ 8,635 $ 13,575 $ 15,000 $ 15,00070 Thanksgiving Park Distribution 164,068 259,933 285,000 285,000TOTAL EXPENSES $ 172,703 $ 273,508 $ 300,000 $ 300,000
FUND SURPLUS/ (DEFICIT) $ - $ - $ - $ -

RE
DE
VE
LO
PM
EN
T A
GE
NC
Y
FY2019 ANNUAL BUDGET - 189
ADOBE EDA
FUND 67 ACTUALFY 2016
ACTUALFY 2017
ESTIMATEDFY 2018
APPROVEDFY 2019
Revenue: 31-10 Property Tax $ 651,679 $ 653,773 $ 675,000 $ 675,00038-91 Note Proceeds - - - -TOTAL REVENUE $ 651,679 $ 653,773 $ 675,000 $ 675,00040 Expenses:
31 EDA Costs $ - $ - $ - $ -32 Administration 43,467 43,607 45,022 45,02280 Taxing Entities 608,212 610,166 629,978 629,97881 Aid to Construction Impact Fee - - - -82 Redevelopment Expenditures - - - -TOTAL EXPENSES $ 651,679 $ 653,773 $ 675,000 $ 675,000
FUND SURPLUS/ (DEFICIT) $ - $ - $ - $ -
OUTLETS AT TRAVERSE MOUNTAIN CDA
FUND 68 ACTUALFY 2016
ACTUAL FY 2017
ESTIMATEDFY 2018
APPROVEDFY 2019
Revenue: 31-10 Property Tax $ 352,111 $ 464,993 $ 375,000 $ 375,00031-20 Sales Tax 607,385 138,972 820,000 820,000TOTAL REVENUE $ 959,469 $ 603,695 $ 1,195,000 $ 1,195,00040 Expenses:
80 Sales Tax Reimbursement $ 607,358 $ 464,993 $ 820,000 $ 820,00080 Property Tax Reimbursement 352,111 138,972 375,000 375,000 TOTAL EXPENSES $ 959,469 $ 603,965 $ 1,195,000 $ 1,195,000
FUND SURPLUS/ (DEFICIT) $ - $ - $ - $ -

APPENDIX A
COMPREHENSIVE STAFFING
DOCUMENT

AP
PE
ND
IX
FY2019 ANNUAL BUDGET - 191
STAFFING DOCUMENT
POSITION ACTUALFY 2015
ACTUALFY 2016
ACTUALFY 2017
ACTUALFY 2018
PLANNED FY 2019
MAYOR & CITY COUNCILElected:
Mayor 1.00 1.00 1.00 1.00 1.00City Council 5.00 5.00 5.00 5.00 5.00
TOTAL FTE 6.00 6.00 6.00 6.00 6.00
OFFICE OF THE CITY ADMINISTRATORAppointed:
City Administrator 1.00 1.00 1.00 1.00 1.00Full-time:
Assistant City Administrator 1.00 1.00 1.00 1.00 1.00Assistant to the City Administrator 1.00 1.00 1.00 1.00 1.00Senior Management Analyst - - - 1.00 1.00Management Analyst 1.50 1.00 1.00 1.00 1.00Events Coordinator 0.50 1.00 1.00 1.00 1.00Intern - - 0.50 0.50 0.50Executive Assistant 1.00 1.00 1.00 1.00 1.00Human Resource Manager 1.00 1.00 1.00 1.00 1.00Human Resource Technician - 1.00 1.00 1.00 1.00Part-time Receptionist (2) 1.00 1.00 1.00 1.00 1.00Risk Manager 1.00 1.00 1.00 1.00 1.00Emergency Management Coordinator - - 0.50 0.50 0.50Passport Technician/Receptionist - - - 1.00 1.00
**IT Manager - - - - 1.00 **IT Technician II - - - - 1.00 **IT Technician I - - - - 2.00Part-time Non-benefited:
Lehi Area Chamber President 0.50 0.50 0.50 0.50 0.50TOTAL FTE 9.50 10.50 11.50 13.50 17.50*Approved but unfunded position. **IT was previously under Finance, but as of FY2019 will be under the Office of the City Administrator
COMMUNITY DEVELOPMENTFull-Time:
Community Development Director 1.00 1.00 1.00 1.00 1.00Planner III 1.00 1.00 1.00 1.00 1.00Planner II 1.00 2.00 1.00 1.00 2.00Planner I 2.00 1.00 1.00 1.00 -Administrative Assistant 1.00 1.00 1.00 1.00 1.00
Planning Intern - - - - 1.00
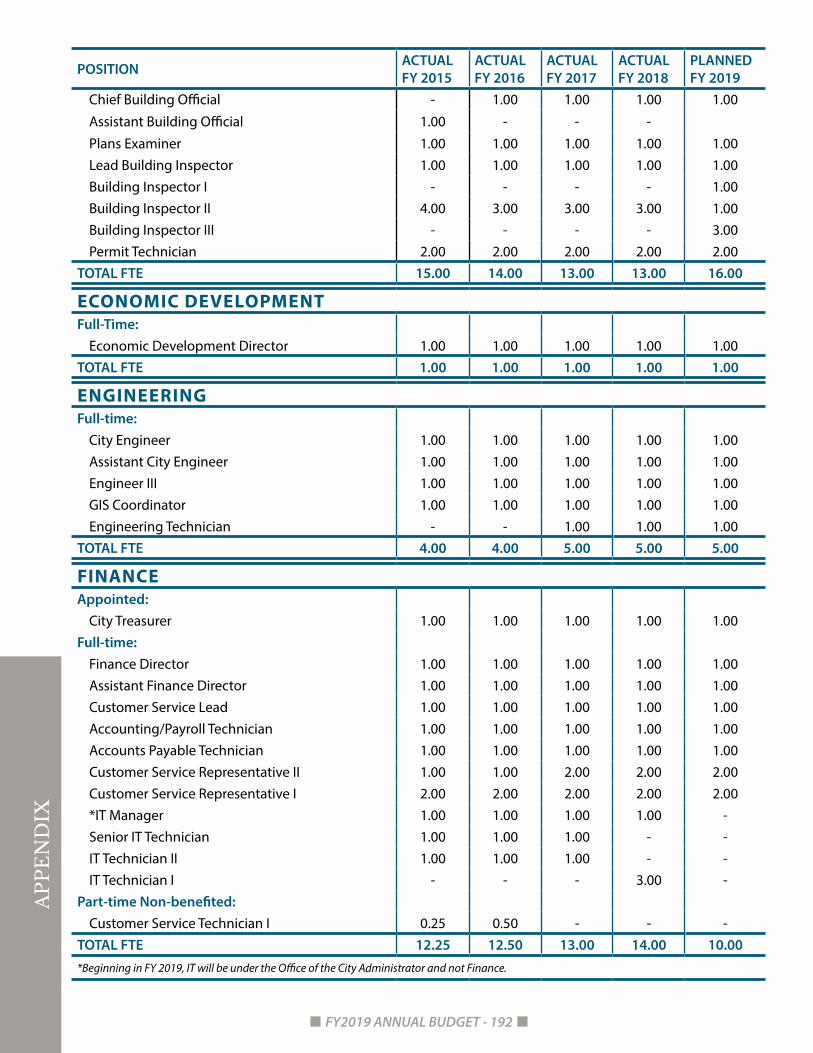
AP
PE
ND
IX
FY2019 ANNUAL BUDGET - 192
POSITION ACTUALFY 2015
ACTUALFY 2016
ACTUALFY 2017
ACTUALFY 2018
PLANNED FY 2019
Chief Building Official - 1.00 1.00 1.00 1.00
Assistant Building Official 1.00 - - -
Plans Examiner 1.00 1.00 1.00 1.00 1.00Lead Building Inspector 1.00 1.00 1.00 1.00 1.00Building Inspector I - - - - 1.00Building Inspector II 4.00 3.00 3.00 3.00 1.00Building Inspector III - - - - 3.00Permit Technician 2.00 2.00 2.00 2.00 2.00
TOTAL FTE 15.00 14.00 13.00 13.00 16.00
ECONOMIC DEVELOPMENTFull-Time:
Economic Development Director 1.00 1.00 1.00 1.00 1.00TOTAL FTE 1.00 1.00 1.00 1.00 1.00
ENGINEERINGFull-time:
City Engineer 1.00 1.00 1.00 1.00 1.00Assistant City Engineer 1.00 1.00 1.00 1.00 1.00Engineer III 1.00 1.00 1.00 1.00 1.00GIS Coordinator 1.00 1.00 1.00 1.00 1.00Engineering Technician - - 1.00 1.00 1.00
TOTAL FTE 4.00 4.00 5.00 5.00 5.00
FINANCEAppointed:
City Treasurer 1.00 1.00 1.00 1.00 1.00Full-time:
Finance Director 1.00 1.00 1.00 1.00 1.00Assistant Finance Director 1.00 1.00 1.00 1.00 1.00Customer Service Lead 1.00 1.00 1.00 1.00 1.00Accounting/Payroll Technician 1.00 1.00 1.00 1.00 1.00Accounts Payable Technician 1.00 1.00 1.00 1.00 1.00Customer Service Representative II 1.00 1.00 2.00 2.00 2.00Customer Service Representative I 2.00 2.00 2.00 2.00 2.00*IT Manager 1.00 1.00 1.00 1.00 -Senior IT Technician 1.00 1.00 1.00 - -IT Technician II 1.00 1.00 1.00 - -IT Technician I - - - 3.00 -
Part-time Non-benefited:Customer Service Technician I 0.25 0.50 - - -
TOTAL FTE 12.25 12.50 13.00 14.00 10.00*Beginning in FY 2019, IT will be under the Office of the City Administrator and not Finance.

AP
PE
ND
IX
FY2019 ANNUAL BUDGET - 193
POSITION ACTUALFY 2015
ACTUALFY 2016
ACTUALFY 2017
ACTUALFY 2018
PLANNED FY 2019
FIREFull-time:
Fire Chief 1.00 1.00 1.00 1.00 1.00Battalion Chief 1.00 3.00 3.00 3.00 3.00Fire Marshal 1.00 1.00 1.00 1.00 1.00Deputy Fire Marshal - - 1.00 1.00 1.00Fire Captain 6.00 6.00 6.00 9.00 9.00Fire Engineer 6.00 6.00 6.00 9.00 9.00Firefighter/Paramedic 6.00 6.00 13.00 19.00 19.00Firefighter/EMT-I 12.00 12.00 5.00 8.00 8.00Administrative Assistant 1.00 1.00 1.00 1.00 1.00
Part-timer Non-benefited:Firefighter/Paramedic 6.90 9.90 9.90 9.90 9.90Firefighter/EMT-I 2.45 2.45 2.45 2.45 2.45Office Assistant - - - - 0.50
TOTAL FTE 43.35 48.35 49.35 64.35 64.85
JUSTICE COURTAppointed:
Justice Court Judge 1.00 1.00 1.00 1.00 1.00Full-Time:
Court Clerk Supervisor 1.00 1.00 1.00 1.00 1.00In-Court Clerk 1.00 1.00 1.00 1.00 1.00Court Clerk 2.00 2.00 2.00 1.00 1.00
Part-Time Non-benefited:Clerk 1.30 1.30 1.30 1.30 1.30
TOTAL FTE 6.30 6.30 6.30 5.30 5.30
LEGAL SERVICESAppointed:
Recorder 1.00 1.00 1.00 1.00 1.00Full-time:
City Attorney 1.00 1.00 1.00 1.00 1.00Assistant City Attorney/City Prosecutor 1.00 1.00 1.00 1.00 1.00Secretary - Legal - - - - 1.00
Part-Time Non-benefited:Assistant City Prosecutor 0.50 0.50 0.50 0.50 0.50Secretary - Legal 1.80 1.80 1.80 1.80 0.80
TOTAL FTE 5.30 5.30 5.30 5.30 5.30

AP
PE
ND
IX
FY2019 ANNUAL BUDGET - 194
POSITION ACTUALFY 2015
ACTUALFY 2016
ACTUALFY 2017
ACTUALFY 2018
PLANNED FY 2019
LEISURE SERVICESRecreation Division (21, 22)Full-time:Recreation/Legacy Ctr. Manager 1.00 1.00 1.00 1.00 1.00Recreation/Legacy Ctr. Assistant Manager - 1.00 1.00 1.00 1.00Legacy Ctr. Supervisor/Aquatics 1.00 1.00 1.00 1.00 1.00Legacy Ctr. Supervisor/Operations 1.00 1.00 1.00 1.00 1.00Legacy Ctr. Supervisor/Programs 1.00 1.00 1.00 1.00 1.00Legacy Ctr. Supervisor/Leagues 1.00 1.00 1.00 1.00 1.00Recreation Coordinator 1.00 1.00 1.00 1.00 1.00Assistant Aquatics Supervisor 1.00 1.00 1.00 1.00 1.00Aquatics Maintenance Manager 1.00 1.00 1.00 1.00 1.00Head of Registration 1.00 1.00 1.00 1.00 1.00Program Coordinator - - - - 1.00
Part-time Non-benefited:Membership Secretary 0.91 0.91 0.91 0.69 0.69Administrative Assistant 0.55 0.55 0.55 0.69 0.69Fitness Director 0.03 0.03 0.03 0.30 0.30Fitness Instructor 2.07 2.07 2.07 2.22 2.24Kids Fitness Instructor Assistant 0.23 0.23 0.23 0.19 0.20Slim to Win 0.09 0.09 0.09 0.04 0.04LC Pool Maintenance 2.05 2.05 2.05 0.77 0.90LC Assistant Pool Manager 3.05 3.05 3.05 2.63 3.0LC Lifeguard Head 2.60 2.60 2.60 2.69 2.70LC Lifeguard 14.15 14.15 14.15 11.18 13.00LC Lifeguard Instructor 0.10 0.22 0.20 0.19 0.19USA Head Swim Coach 0.32 0.32 0.32 0.25 0.35USA Swim Coach 0.08 0.08 0.08 1.42 1.31Head Swim Coach 0.06 0.06 0.06 0.12 0.15Swim Coach 0.42 0.42 0.42 0.35 0.40WSI Coordinator 0.02 0.02 0.02 0.005 0.00WSI (Swim Lesson Instructor) 1.73 1.73 1.73 2.26 2.50Private Swim Lesson Instructor 0.03 0.03 0.03 .38 0.50Building Manager 1.32 1.32 1.32 1.32 1.31Center Court Manager 0.08 0.08 0.08 0.77 0.82Center Court Personnel 3.19 3.19 3.19 3.24 3.24Outdoor Concession Manager 0.24 0.24 0.24 0.32 0.35Outdoor Concession Site Supvr. 0.35 0.35 0.35 0.18 0.20Outdoor Concessions 1.68 1.68 1.68 1.30 1.30Front Desk Head Manager 0.54 0.54 0.54 0.44 0.50Front Desk Manager 3.10 3.10 3.10 3.20 3.65

AP
PE
ND
IX
FY2019 ANNUAL BUDGET - 195
POSITION ACTUALFY 2015
ACTUALFY 2016
ACTUALFY 2017
ACTUALFY 2018
PLANNED FY 2019
Preschool Head 0.48 0.48 0.48 0.84 0.84Preschool Assistant 1.53 1.25 0.78 0.78 0.90Day Care Manager 0.39 0.39 0.39 0.50 0.50Day Care Staff 1.08 1.08 1.08 0.97 2.65Program Coordinator 0.78 0.78 0.78 0.96 0.30Head Cheer 0.02 0.02 0.02 0.005 0.10Cheer Instructor 0.09 0.09 0.09 0.18 0.25Head Dance 0.16 0.16 0.16 0.19 0.20Dance Instructor 0.29 0.29 0.29 0.40 0.40Other Instructors 0.06 0.06 0.06 0.005 0.05Registration Staff 2.39 2.39 2.39 2.53 2.53Rock Wall Attendant 0.45 0.45 0.45 0.47 0.53Itty Bitty 0.50 0.50 0.50 0.79 0.80League Supervisor 2.05 2.05 2.05 1.18 0.68Official 3.05 3.05 3.05 4.86 5.0Scorekeeper 1.18 1.18 1.18 1.73 1.75Site Supervisor 1.18 1.18 1.18 1.76 1.80Sports Instructor 0.49 1.62 1.00 0.09 0.00Gymnastic Head Instructor 0.73 0.73 0.73 0.76 0.90Gymnastic Instructor 3.90 3.90 3.90 4.46 4.40Gymnastic Instructor Aid 1.11 1.11 1.11 1.65 1.70Private Gymnastic Instructor 0.02 0.02 0.02 0.01 0.01Equipment Personnel Gymnastic - - - 0.01 1.44Gymnastic Trade Supervisor 0.27 0.27 0.27 0.97 0.60Gymnastic Trade Head Supervisor 0.15 0.15 0.15 0.15 0.15OD Pool Maintenance 0.28 0.28 0.28 0.82 0.82OD Pool Manager 0.54 0.54 0.54 0.78 0.80OD Pool Cashier 0.42 0.42 0.42 1.30 1.30OD Lifeguard 2.96 2.96 2.96 3.81 3.80
Recreation Total 80.65 81.65 81.65 85.56 91.68Senior Services (68)Full-time:
Senior Citizen Manager 1.00 1.00 1.00 1.00 1.00Senior Services Program Coordinator - - - 1.00 1.00
Part-Time Non-benefited:Senior Services Program Coordinator - - 0.50 - -Senior Citizen Aide 1.00 1.00 1.00 1.50 1.50
Senior Services Total 2.00 2.00 2.50 3.50 3.50Library Division (74)Full-time:
Library Director 1.00 1.00 1.00 1.00 1.00Senior Librarian 4.00 4.00 4.00 4.00 4.00

AP
PE
ND
IX
FY2019 ANNUAL BUDGET - 196
POSITION ACTUALFY 2015
ACTUALFY 2016
ACTUALFY 2017
ACTUALFY 2018
PLANNED FY 2019
Administrative Assistant 1.00 1.00 1.00 1.00 1.00Associate Librarian 3.00 4.00 4.00 4.00 4.00
Part-time Non-benefited:Clerk 6.96 6.96 8.00 8.00 8.00Page 4.47 4.47 3.00 3.00 3.00
Library Total 20.43 21.43 21.00 21.00 21.00Literacy Center Division (75)Full-time:Literacy Center Manager 1.00 1.00 1.00 1.00 1.00Program Specialist 1.00 1.00 1.00 1.00 1.00
Part-time Non-benefited:Staff - 25 Hours/Week - - - 1.875 1.875Staff - 10-15 Hours/Week - - - 4.125 4.125Teacher 1.25 1.25 2.00 - -
Seasonal/Temporary:Staff 3.00 3.00 5.00 - -
Literacy Center Total 6.25 6.25 9.00 8.00 8.00TOTAL LEISURE SERVICES FTE 109.33 111.33 114.15 118.06 124.18
POLICEFull-time:
Police Chief 1.00 1.00 1.00 1.00 1.00Deputy Police Chief 1.00 1.00 1.00 1.00 1.00Police Lieutenant 2.00 2.00 3.00 3.00 3.00Police Sergeant 7.00 8.00 10.00 10.00 10.00Police Corporal - - 10.00 10.00 9.00Police Officer III 7.00 13.00 1.00 5.00 5.00Police Officer II 4.00 1.00 9.00 7.00 11.00Police Officer I 21.00 19.00 16.00 17.00 14.00Code Enforcement Officer 2.00 2.00 - - -Victim Advocate Coordinator 1.00 1.00 1.00 1.00 1.00Animal Control Officer 1.00 1.00 1.00 1.00 1.00Administrative Assistant 1.00 1.00 1.00 1.00 1.00Evidence Technician 1.00 1.00 1.00 1.00 1.00Records Clerk 1.00 1.00 1.00 1.00 1.00Front Desk Secretary/Dispatcher 2.00 2.00 2.00 2.00 2.00
Part-Time Non-benefited:Reports Clerk/Records Assistant 0.50 1.00 1.00 0.50 0.50Front Desk Secretary/Dispatcher - - - 1.50 1.50Victim Advocate - - - 0.50 0.50Crossing Guard Coordinator - - 0.50 0.50 0.50Crossing Guard 12.95 12.45 12.45 12.45 12.45
TOTAL FTE 65.45 67.45 71.95 76.45 76.45

AP
PE
ND
IX
FY2019 ANNUAL BUDGET - 197
POSITION ACTUALFY 2015
ACTUALFY 2016
ACTUALFY 2017
ACTUALFY 2018
PLANNED FY 2019
POWERFull-time:
Power Director 1.00 1.00 1.00 1.00 1.00Administrative Assistant - - 1.00 1.00 1.00Engineering Manager 1.00 1.00 1.00 1.00 1.00Assistant Power Planner/System Design - 1.00 1.00 1.00 1.00Operations Manager 1.00 1.00 1.00 1.00 1.00Metering System Supervisor 1.00 1.00 1.00 1.00 1.00Power Line Field Supervisor 3.00 4.00 4.00 4.00 4.00Substation Technician Foreman - 1.00 1.00 1.00 1.00Journey Power Lineman 7.00 7.00 3.00 3.00 3.00Metering System Technician 1.00 1.00 1.00 1.00 1.00Warehouse Manager 1.00 1.00 1.00 1.00 1.00Apprentice Lineman - 1.00 5.00 6.00 6.00Substation Technician - 1.00 1.00 1.00 1.00Power/Fiber Inspector 1.00 1.00 1.00 1.00 1.00Warehouse/Maintenance Worker - - - - -URD Laborer 1.00 1.00 1.00 1.00 1.00Service Laborer 1.00 1.00 1.00 1.00 1.00Blue Stakes Technician 1.00 1.00 1.00 1.00 1.00Draftsman - - - 1.00 1.00Forecast Manager - - - 1.00 1.00Meter Reader - - 1.00 1.00 1.00
Part-Time Benefited:Meter Reader 0.67 0.67 - - -Mapping Auditor - - - - 0.50
Part-Time Non-Benefited:Administrative Assistant 0.75 0.75 - - 0.50
Seasonal/Temporary:Laborer **0.68 **0.68 **0.68 **0.68 0.68GIS Intern **1.50 **1.50 **1.50 **1.50 -
TOTAL FTE 23.60 28.60 29.18 32.18 31.68**Funded, but unfilled position
PUBLIC WORKSPublic Works Administration (62)Full-time:Public Works Director 1.00 1.00 1.00 1.00 1.00Administrative Assistant 1.00 1.00 0.50 1.00 1.00
Public Works Administration Total 2.00 2.00 1.50 2.00 2.00

AP
PE
ND
IX
FY2019 ANNUAL BUDGET - 198
POSITION ACTUALFY 2015
ACTUALFY 2016
ACTUALFY 2017
ACTUALFY 2018
PLANNED FY 2019*
Parks (62)Full-time:
Parks & Facilities Superintendent 1 1 1 1 1Assistant Parks & Facilities Superintendent - - 1 1 1Custodial Lead - - - - 1Custodial Worker 1 1 2 2 2Facility Inspector/Project Manager 1 1 1 1 1Sports Park Lead - - - - 1Sports Park Worker - - - - 2Leisure Parks Lead - - - - 1Leisure Parks Worker - - - - 5Lead Electrician - - - - 1Mechanical HVAC Lead 1 1 1 1 1Mechanical HVAC Worker - - - - 2Maintenance Lead 2 2 1 1 1Maintenance Worker - - - - 1Pesticide & Irrigation Specialist 1 1 1 1 1Irrigation Worker - - - - 1Trails, Trees, and Open Space Lead - - - - 1Trails, Trees, and Open Space Worker - - - - 2Cemetery Sexton 1 1 1 1 1Cemetery Lead 1 1 1 1 1Cemetery Worker 1 1 1 1 1Facilities Maintenance Worker II 2 2 - - -Facilities Maintenance Worker I - - 2 2 -Lead Park Maintenance Worker 1 1 2 2 -Park Maintenance Worker II 2 2 1 1 -Park Maintenance Worker I 5 6 4 4 -
Part-time benefited:Cemetery Secretary 0.50 0.50 0.50 0.50 0.50
Seasonal/Temporary:Laborer 7.50 7.50 7.50 7.50 2.5
TOTAL FTE 30.00 33.00 29.00 29.00 32.00*FY 2019 uses updated job titles to more accurately reflect staffing, which is the cause for the shift in positions.
Streets (61)Full-time:
Streets Superintendent 1.00 1.00 1.00 1.00 1.00Street Maintenance Foreman 1.00 1.00 1.00 1.00 1.00Pavement Management Supervisor 1.00 1.00 1.00 1.00 1.00Street Inspector 1.00 1.00 2.00 2.00 2.00Crew Foreman 1.00 1.00 1.00 1.00 1.00Sign Maintenance Technician 1.00 1.00 1.00 1.00 1.00

AP
PE
ND
IX
FY2019 ANNUAL BUDGET - 199
POSITION ACTUALFY 2015
ACTUALFY 2016
ACTUALFY 2017
ACTUALFY 2018
PLANNED FY 2019
Grading Supervisor 1.00 1.00 - - -Street Maintenance Worker III 1.00 1.00 1.00 1.00 1.00Street Maintenance Worker II 2.00 2.00 2.00 2.00 3.00Street Maintenance Worker I 4.00 4.00 5.00 7.00 5.00
Seasonal/Temporary:Laborer 0.75 0.75 0.75 0.75 0.00
TOTAL FTE 14.75 14.75 15.75 17.75 16.00Fleet (64)Full-time:
Fleet Manager 1.00 1.00 1.00 1.00 1.00Shop Supervisor - - - 1.00 1.00Journey Fleet Mechanic 1.00 1.00 1.00 1.00 1.00Fleet Small Engine Mechanic - - 1.00 - -
Part-time Non-Benefited: Shop Worker - 0.50 1.00 1.00 1.00
FLEET TOTAL 2.00 2.50 4.00 4.00 4.00TOTAL PUBLIC WORKS FTE 48.75 52.25 50.25 52.75 54.00
WATERCulinary Water (51)Full-time:
Water Systems Director 1.00 1.00 1.00 1.00 1.00Asst. Water Systems Director 1.00 1.00 1.00 1.00 1.00Water Sampling Technician 1.00 1.00 1.00 1.00 1.00Water Systems Supervisor 1.00 1.00 1.00 1.00 1.00Senior Water Meter Technician 1.00 1.00 1.00 1.00 1.00Water Systems Operator IV - - - - 1.00Water Systems Operator III 1.00 1.00 1.00 2.00 2.00Water Systems Operator II - - - 1.00 -Water Systems Operator I 1.00 1.00 2.00 2.00 1.00Water Meter Technician 1.00 1.00 2.00 1.00 2.00Administrative Assistant 1.00 1.00 1.00 1.00 1.00
TOTAL FTE 9.00 9.00 11.00 12.00 12.00Waste Water (52)Full-time:
Water Systems Supervisor 1.00 1.00 1.00 1.00 1.00Water Systems Operator IV - - - 2.00 2.00Water Systems Operator III - - 1.00 - -Water Systems Operator II 2.00 2.00 2.00 3.00 3.00Water Systems Operator I 1.00 2.00 2.00 - -
TOTAL FTE 4.00 5.00 6.00 6.00 6.00

AP
PE
ND
IX
FY2019 ANNUAL BUDGET - 200
POSITION ACTUALFY 2015
ACTUALFY 2016
ACTUALFY 2017
ACTUALFY 2018
PLANNED FY 2019
WATERPressurized Irrigation (55)Full-time:
Water Systems Supervisor 1.00 1.00 1.00 1.00 1.00Water Systems Operator III 1.00 1.00 1.00 1.00 1.00Water Systems Operator II - 1.00 - - 1.00Water Systems Operator I 2.00 - 1.00 2.00 1.00Blues Stakes Technician 1.00 1.00 1.00 1.00 1.00
Seasonal/Temporary:Water Education Specialist 0.65 0.65 - - -
TOTAL FTE 5.65 4.65 4.00 5.00 5.00Storm Drain (57)Full-time:
Storm Water Systems Supervisor 1.00 1.00 1.00 1.00 1.00Storm Water Systems Operator IV - - 1.00 2.00 1.00Storm Water Systems Operator II 1.00 1.00 1.00 2.00 1.00Storm Water Systems Operator I 1.00 2.00 2.00 1.00 2.00Storm Water Systems S.W.P.P. Inspector - - - - 2.00
Seasonal/Temporary:
Water Laborer 0.65 0.65 0.65 - -TOTAL FTE 3.65 4.65 5.65 6.00 7.00TOTAL WATER FTE 22.30 23.30 22.65 29.00 30.00
OVERALL STAFFING TOTALGeneral Government 59.35 60.60 61.60 63.10 64.35Public Safety 108.80 115.80 121.30 140.80 141.30Leisure Services 110.83 112.33 115.65 118.06 124.18Public Works 48.75 52.25 56.75 52.75 55.75Enterprise 45.90 51.90 57.83 61.18 61.68OVERALL TOTAL FTE 372.13 390.88 398.63 435.89 447.26

APPENDIX B
GLOSSARY

AP
PE
ND
IX
FY2019 ANNUAL BUDGET - 202
GLOSSARY
AACCOUNTING PERIOD:A period of time, (month, quarter, year), for which a financial statement is produced.
ACCOUNTING SYSTEM:The total structure of records and procedures which discover, record, classify, and report information on the financial position and operations of a governmental unit or any of its funds, balanced account groups, and organizational components.
ACCRUAL BASIS:Accounting method in which revenues and expenses are accounted for as they are earned or incurred, although they may not have been received or paid yet. The alternative is cash-basis accounting, in which revenues and expenses are recognized only when cash is received or paid.
ACTUAL:Actual, as used in the fund summaries and department and division summaries within the budget document, represents the actual costs results of operations. This category is presented on a GAAP basis, with the exception that depreciation and amortization are not budgeted and principal payments on debt in the enterprise funds are budgeted as expenses.
ADOPTED:Adopted, as used in the fund summaries and department and division summaries within the budget document, represents the budget as approved by the City Council.
ADOPTED BUDGET:The financial plan for the fiscal year beginning July 1.
ALLOCATED COST:A method for allocating overhead time and other expenses to activities that provide direct services.
ALLOTMENT:To divide an appropriation into amounts that may be encumbered or expended during an allotment period.
AMENDED OR REVISED BUDGET:The current year adopted budget adjusted to reflect all budget amendments approved by the City Council through the date indicated.
AMORTIZATION:The deduction of capital expenses over a specific period of time. Similar to depreciation, it is a method of measuring the consumption of the value of long-term assets like equipment or buildings.
APPROPRIATION:A legal authorization that permits the City to make expenditures and to incur obligations and expend resources for specific purposes.

AP
PE
ND
IX
FY2019 ANNUAL BUDGET - 203
ASSESSED VALUATION:A valuation set upon real estate or other property by a government body basis for levying taxes.
ASSESSMENT ROLL:A document prepared by the county establishing assessed valuation of real estate and other property with the amount of ad valorem tax owed.
AUDIT:A systematic examination of resource utilization concluding in a written report. It is a test of management’s internal accounting controls and is intended to: (1) ascertain whether financial statements fairly present financial positions and results of operations; (2) test whether transactions have been legally performed; (3) identify areas for possible improvements in accounting practices and procedures; and (4) ascertain officials responsible for governmental resources.
BBALANCED BUDGET: A financial plan of operation in which revenues equal expenditures for the fiscal year. A balanced budget is required of municipalities by the State law.
BALANCE SHEET: A statement presenting the financial position of an entity by disclosing the value of its assets, liabilities and equities at a specified date.
BASE BUDGET:Those resources necessary to meet an established and existing service level.
BASIS OF BUDGETING:Basis of budgeting refers to the method used for recognizing revenues and expenditures in the budget. The City uses the modified accrual basis of accounting for budgetary purposes, which is in compliance with Generally Accepted Accounting Principles.
BEGINNING FUND BALANCE:The Ending Fund Balance of the previous period. (See ENDING FUND BALANCE)
BOND:A written promise to pay (debt) a specified sum of money (called principal or face value) at a specified future date (called the maturity date(s)) along with periodic interest paid at a specified percentage of principal (interest rate). Bonds are typically used for long-term debt.
BUDGET: A plan of financial operation embodying an estimate of proposed means of financing them. Used without a modifier, the term usually indicates a financial plan for a single fiscal year. The term “budget” is used in two senses in practice. Sometimes it designates the financial plan presented to the appropriating body for adoption and sometimes it designates the plan finally approved by that body. It is usually necessary to specify whether the budget under consideration is preliminary and tentative or whether it has been approved by the appropriating body.
BUDGET CALENDAR:The schedule of essential dates or milestones which a government follows in the preparation and adoption of the budget.

AP
PE
ND
IX
FY2019 ANNUAL BUDGET - 204
BUDGET DOCUMENT:The official written statement prepared by the budget office and supporting staff which presents the proposed budget to the legislative body.
BUDGET MESSAGE:A general discussion of the proposed budget presentation in writing as part of or supplement to the budget document. The budget message explains principal budget issues against the background of financial experience in recent years and presents recommendations made by the Chief Executive.
BUDGET MODIFICATION:A change in expenditure levels and corresponding resources needed to accomplish an existing service level or unanticipated service. All budget modifications are reflected in the current year budget and have been approved by City Council.
BUDGET RETREAT:A meeting scheduled for the Mayor and Council with Administration to discuss important issues to be addressed in the budget. The place of the meeting is at a location away from City Hall and is usually at least a one-day event.
BUDGET SUPPLEMENT:A request for an increase or decrease in an existing service level (over and above the base budget).
BUDGETARY BASIS:Budgets are adopted on a basis consistent with Generally Accepted Accounting Principles (GAAP), with the exception that (1) encumbrances are considered to be an expenditure chargeable to appropriations; (2) no depreciation is budgeted for proprietary funds; and (3) bond principal in the enterprise funds is subject to appropriation.
BUDGETING (APPROPRIATING):The City prepares its budget in conformity with practices prescribed or permitted by the applicable statutes of the State of Utah.
CCAPITAL BUDGET:A plan of proposed capital expenditures and the means of financing them. The capital budget is usually enacted as part of the complete annual budget, which includes both operating and capital outlays. The capital budget should be based on a capital improvement plan (CIP).
CAPITAL IMPROVEMENT PLAN:A plan for capital expenditures to be incurred each year over a fixed period of several future years which sets forth each expenditure.
CAPITAL OUTLAYS (EXPENDITURES):Expenditures for the acquisition of capital assets.
CAPITAL PROJECT:Any improvement or acquisition of major facilities with a useful life of at least five years such as roads, bridges, buildings, or land.
CAPITAL PROJECTS FUND:Funds that are used to account for financial resources to be used for the acquisition or construction of major capital projects (other than those financed by proprietary funds).

AP
PE
ND
IX
FY2019 ANNUAL BUDGET - 205
CASH BASIS:The method of accounting where revenues and expenditures are recognized as cash is received and disbursed.
CASH FLOW BUDGET:A projection of the cash receipts and disbursements anticipated during a given time period. Typically, this projection covers a year and is broken down into separate projections for each month, week, and/or day during the year.
CERTIFIED TAX RATE (C.T.R.):A tax rate that will provide the same ad valorem property tax revenue for each taxing entity as was levied for the prior year by that entity, plus new growth, less the amount of increase to locally assessed real property taxable values resulting from factoring, reappraisal, or any other adjustment.
CIP:See CAPITAL IMPROVEMENT PROGRAM.
COMMODITIES:Commodities are expendable items purchased through the City-approved centralized purchasing process. This classification includes supplies, repair and replacement parts, small tools, and maintenance and repair materials that are not of a capital nature.
CONSUMER PRICE INDEX (CPI):A statistical description of price levels provided by the U.S. Department of Labor. The index is used as a measure of the increase in the cost of living (i.e., economic inflation).
CONTINGENCY:A budgetary reserve set aside for emergencies or unforeseen expenditures not otherwise budgeted.
CONTINUATION BUDGET:A level of funding which enables an organization to provide the same amount of services in the following fiscal year as the organization provides in the current fiscal year. A continuation level budget does not necessarily provide funding for growth in demand of services.
CONTRACTS PAYABLE:Contracts payable represents a liability reflecting amounts due on contracts of goods or services furnished to the City.
CONTRACTUAL SERVICES:Includes expenditures for services performed by firms, individuals, or other City departments. Supplies are not included in the contractual services accounts.
CURRENT LEVEL OF SERVICE:A term used to describe amount of service provided to the community in each service area with the current resources available.
DDEBT SERVICE:Payment of interest and repayment of principal to holders of a government’s debt instruments.

AP
PE
ND
IX
FY2019 ANNUAL BUDGET - 206
DEBT SERVICE FUNDS:Established to account for the accumulation of resources and for the payment of general long-term debt principal and interest that are not serviced by the General, Special Revenue, and Enterprise Funds. It does not include contractual obligations accounted for in the individual funds.
DEMAND:A type of measurement category. Demand represents the external factors that demonstrate the needs for the service(s) or program(s), i.e., population, service area, complaints, and waiting lists.
DEPARTMENT:A major unit of organization in the City comprised of sub-units called Divisions.
DEPRECIATION:A decrease or loss in value, as because of age, wear, or market conditions. Used in accounting as an allowance made for a loss in the value of property.
DIRECT SALES:Gross retail sales that are collected from local businesses.
DIVISION:A sub-unit of a Department organization.
EELEMENT (GENERAL PLAN):There are four main elements of the General Plan which assist the City in delivering high quality services to its constituency. These four elements are (1) Land Use, (2) Parks Open Space and Recreational Facilities, (3) Moderate Income Housing, and (4) Transportation.
ENCUMBRANCE:Includes obligations in the form of purchase orders, contracts, or other commitments. They cease to be encumbrances when paid, canceled, or when the actual liability is established.
ENDING FUND BALANCE:Funds carried over at the end of the fiscal year. Within a fund, the revenue on hand at the beginning of the fiscal year, plus revenues received during the year, less expenses equals ending fund balance.
ENTERPRISE FUND:A fund used to account for operations that are financed and operated in a manner similar to private business enterprises, wherein the stated intent is that the costs (including depreciation) of providing goods and services be financed from revenues recovered primarily through user fees.
EXPENDITURES:Decreases in net financial resources. Expenditures include current operating expenses, which require the current or future use of net current assets, debt service, and capital outlays.
FFEES:Charges for specific services.

AP
PE
ND
IX
FY2019 ANNUAL BUDGET - 207
FINANCIAL POLICY:A government’s directive with respect to revenues, spending, reserves, and debt management as these relate to government services, programs, and capital investment. Financial policy provides an agreed upon set of principles for the planning and programming of government budgets and its funding.
FISCAL YEAR:Any period at the end of which a governmental unit determines its financial condition and the result of its operations and closes its books. NOTE: It is usually a year, though not necessarily a calendar year.
FORECAST:A prediction of future outcome based on known and unknown factors.
FULL-TIME EQUIVALENT (FTE):One position funded for a full year. For example, a permanent employee funded and paid for 40 hours/week and 52 weeks/year or 2 employees funded and paid for 20 hours/week and 52 weeks/year would be equal to one full-time equivalent.
FUND:An independent fiscal and accounting entity with a self-balancing set of accounts recording cash and/or other resources together with all related liabilities, obligations, reserves, and equities which are segregated for the purpose of carrying on specific activities or attaining certain objectives.
FUND BALANCE (EQUITY):The excess of an entity’s assets over its liabilities. A negative fund balance is sometimes called a deficit.
FUNDING SOURCES:A term referring to the type or origination of funds to finance recurring or non-recurring expenditures. Examples include revenues such as ad valorem taxes, user fees, licenses, permits, and grants and non-revenues such as fund balance and inter-fund transfers.
FUND SUMMARY:A combined statement of revenues, expenditures, and changes in fund balance for the prior year’s actual, adopted, estimated budgets, and the current year’s adopted budgets.
GGAAP ADJUSTMENTS:Differences arising from the use of a basis of accounting for budgetary purposes that differs from the basis of accounting applicable when reporting on operations in conformity with Generally Accepted Accounting Principles (GAAP). For example, depreciation and amortization in Enterprise Funds are not considered expenses on the budget basis of accounting, but are considered expenses on the GAAP basis.
GASB 34:A new accounting standard used by the Governmental Accounting Standards Board that is applicable to state and local governments. Compliance with GASB Statement 34 is necessary for the preparation of financial statements in accordance with Generally Accepted Accounting Principles. A significant provision of this new standard includes the preparation of government-wide financial statements that summarize the information of the government as a whole using the accrual basis of accounting (in addition to the continuing requirements for fund financial statements using the modified accrual basis of accounting). Infrastructure assets such as streets, bridges, and sidewalks are also to be included in the government-wide financial statements. There are also expanded disclosure requirements.

AP
PE
ND
IX
FY2019 ANNUAL BUDGET - 208
GENERALLY ACCEPTED ACCOUNTING PRINCIPLES (GAAP):Uniform minimum standards of guidelines to financial accounting and reporting. They govern the form and content of the basic financial statements of an entity. GAAP encompass the conventions, rules and procedures necessary to define accepted accounting practices at a particular time. They include not only broad guidelines of general application, but also detailed practices and procedures. GAAP proved a standard by which to measure financial presentations. The primary authoritative statement on the application of GAAP to state and local governments is the National Council on Governmental Accounting=s Statement 1. Every government should prepare and publish financial statements in conformity with GAAP. The objectives of governmental GAAP financial reports are different from, and much broader than, the objectives of business enterprise GAAP financial reports.
GENERAL FUND:A fund that accounts for all financial resources necessary to carry out basic governmental activities of the City that are not accounted for in another fund. The General Fund supports essential City services such as police and fire protection, street maintenance, libraries, and parks and open space maintenance. Revenues to support the General Fund are derived from sources such as property tax, sales tax, franchise fees, and service fees.
GENERAL LONG-TERM DEBT:Represents any non-matured debt not considered to be a fund liability.
GENERAL OBLIGATION BONDS (G.O. BONDS):Bonds secured by the full faith and credit of the issuer. G.O. bonds issued by local units of government are secured by a pledge of the issuer’s property taxing power (secondary portion). They are usually issued to pay for general capital improvements such as parks and roads.
GOVERNMENTAL FUNDS:Account for most governmental functions. Governmental Funds include the General Fund, Special Revenue Funds, and Capital Project Funds.
GRANT:A contribution of assets (usually cash) by one governmental unit or other organization to another. Typically, these contributions are made to local governments from the state and federal governments. Grants are usually made for specific purposes.
IIMPACT FEES:A type of charge for services imposed on new construction in order to support specific new demands on a given service, e.g., transportation, schools, parks and fire protection.
IMPROVEMENT DISTRICTS:Consists of property owners desiring improvements to their property. Bonds are issued to finance these improvements, which are repaid by assessments on affected property. Improvement District debt is paid for by a compulsory levy (special assessment) made against certain properties to defray all or part of the cost of a specific capital improvement or service deemed to benefit primarily those properties.
INFRASTRUCTURE:A permanent installation such as a building, road, or water transmission system that provides public services.
IN-LIEU PROPERTY TAX:A statewide fee is assessed on motor vehicles “in lieu of property taxes” in the event a citizen does not otherwise pay property taxes on house they own. The fee is assessed based on the age of the vehicle. This is also commonly called the Motor Vehicle Tax.

AP
PE
ND
IX
FY2019 ANNUAL BUDGET - 209
INTER-FUND TRANSFER:Amounts transferred from one fund to another.
INTERGOVERNMENTAL REVENUES:Levied by one government but shared on a predetermined basis with another government or class of governments.
INTERNAL SERVICE FUND:Established to account for the financing, on a cost-reimbursement basis, of commodities or services provided by one program for the benefit of other programs within the City. The City maintains three Internal Service Funds to account for Fleet, Information Technology and Self-Insurance activities.
ISO:The Insurance Service Organization is used to rate the level of risk with the City for varies services provided.
LLEGISLATIVE ISSUES:Major policy decisions made by the City Council such as General Plan Sub-Elements, ordinances, and resolutions requiring study that need to be scheduled on Council’s calendar.
MMEASURE:A term referring to any one of four different types of measure: a count, a ratio, a percentage, and a dollar amount. Before developing any measure, it is necessary to identify something that can be counted. In order to identify what is to be counted, the event being assessed must be determined, i.e. days spent in the hospital, certificates of occupancy issued, gallons of water treated, etc.
MISCELLANEOUS (FUNDING SOURCE):Revenues other than those received from standard sources such as taxes, licenses and permits, grants, and user fees.
MISSION STATEMENT:A broad statement of purpose derived from an organization’s and/or community’s values and goals.
MODIFIED ACCRUAL BASIS:The modified accrual basis of accounting is a mixture of both cash and accrual basis concepts. All funds are accounted for using the modified accrual basis of accounting. Revenues are recognized when they become measurable and available as net current assets. Sales taxes are recognized when in the hands of intermediary collecting agencies. All other intergovernmental revenues are recorded as revenue when received. Property tax revenues are recognized in the fiscal year for which they were levied. Licenses and permits, charges for services, fines and forfeitures, and other revenues are recorded as revenue when received in cash.Expenditures are generally recognized under the modified accrual basis of accounting when the related fund liability is incurred. However, an exception to this general rule would include principal and interest on general long-term debt which is recognized when due.
NNET ASSETS:The term is used to describe the difference between assets and liabilities to show total fund equity of the fund.

AP
PE
ND
IX
FY2019 ANNUAL BUDGET - 210
NET INCOME:Proprietary fund excess of operating revenues, non-operating revenues, and operating transfers in over operating expenses, non-operating expenses, and operating transfer-out.
OOBJECTIVE:A statement specifying achievements to be attained within a prescribed time frame. An objective is exchanged/superseded by another objective at the expiration of the time frame. An objective is directly connected to how the resources of an organization will be used. An objective statement begins with an action verb and includes the quantified statement of the results expected as an outcome of the action.
OPERATING BUDGET:Plans of current expenditures and the proposed means of financing them. The annual operating budget (or, in the case of some state governments, the biennial operating budget) is the primary means by which most of the financing acquisition, spending, and service delivery activities of a government are controlled. The use of annual operating budgets is usually required by law. Even where not required by law, however, annual operating budgets are essential to sound financial management and should be adopted by every government. (See BUDGET)
OPERATING REVENUE:Funds that the government receives as income to pay for ongoing operations. It includes such items as taxes, fees from specific services, interest earnings, and grant revenues. Operating revenues are used to pay for day–to–day services.
ORDINANCE:A formal legislative enactment by the governing board of a municipality. If it is not in conflict with any higher form or law, such as a state statute or constitutional provision, it has the full force and effect of law within the boundaries of the municipality to which is applies.
OTHER FISCAL ACTIVITY:Refers to various trust and agency funds used to account for assets held by the City in a trustee capacity or as an agent for individuals, other governmental units, and other funds.
OUTSTANDING DEBT:The balance due at any given time resulting from the borrowing of money or from the purchase of goods and services.
PPAY-AS-YOU-GO FINANCING:Pay-as-you-go is the financing of improvement projects from current revenues. Such revenues may come from general taxation, fees, charges for services, special funds, or special assessments.
PERFORMANCE BUDGET:A budget wherein expenditures are based primarily upon measurable performance of activities.
PERFORMANCE INDICATOR:A performance indicator is a measurement designed by a reasoning process to determine whether or not a service objective has been met. It measures the effectiveness of achieving the objective or how well the objective has been accomplished.

AP
PE
ND
IX
FY2019 ANNUAL BUDGET - 211
PERFORMANCE MEASURE:Data collected to determine how effective or efficient a program is in achieving its objectives.
PERSONAL SERVICES:Include the salaries and wages paid to employees plus the City’s contribution for fringe benefits such as retirement, social security, health, and workers’ compensation insurance.
PROGRAM:A group of related activities performed by one or more organizational units for the purpose of accomplishing a function for which the City is responsible. A program differs from a division from the standpoint that cost centers from different departments may make up a program while cost centers from the same department to make up a division.
PROGRAM BUDGET:A budget, which allocates money to the functions or activities of a government rather than to specific items of cost or to specific departments.
PROJECT COSTS:All the costs associated with a project. These costs include prior year actual expenditures, current year budgeted expenditures and future year planned expenditures.
PROPERTY TAX:Based according to value of property and is used as the source of monies to pay general obligation debt (secondary property tax) and to support the general fund (primary property tax).
RRDA:See REDEVELOPMENT AGENCY.
RE-BUDGET:Carryover represents encumbered and committed funds carried forward to the next fiscal year budget.
REDEVELOPMENT AGENCY:An agency of the City created to administer and account for community redevelopment and economic development project areas, which are financed by incremental taxes collected on the properties in the development. The taxes are used to pay back debt created from improving the infrastructure for the project.
REFUNDING:A procedure whereby an issuer refinances an outstanding bond issue by issuing new bonds. There are generally two major reasons for refunding: (1) to reduce the issuer’s interest costs or (2) to remove a burdensome or restrictive covenant imposed by the terms of the bonds being refinanced. The proceeds of the new bonds are either deposited into escrow to pay the debt service on the outstanding obligations when due, or they are used to immediately retire the outstanding obligations. The new obligations are referred to as the refunding bonds and the outstanding obligations being refinanced are referred to as the refunded bonds or the prior issue.
REPLACEMENT SCHEDULE:A schedule used to document information for vehicles and equipment currently used in operations. The information includes description of assets, year of purchase, useful life, amount of original purchase, year to be replaced, and estimated future cost of replacement.

AP
PE
ND
IX
FY2019 ANNUAL BUDGET - 212
RESERVE:An account which records a portion of the fund balance which must be segregated for some future use and which is, therefore, not available for further appropriation or expenditure.
RESIDUAL EQUITY:A transfer of net assets to another fund when separating a function or service from a combined function or service.
RESTRICTED REVENUES:Funds collected for limited or specific expenditure purposes. These funds are earmarked for specific purposes by requirements within the resource origin, such as: regulations found in bond covenants; grant contracts; local ordinances; donations for a specific purpose; state statute; and federal law or administrative guidelines.
REVENUE:The term designates an increase to a fund’s assets which: increase a liability (e.g., proceeds from a loan); represent a repayment of an expenditure already made; represent a cancellation of certain liabilities; and represent an increase in contributed capital.
REVENUE BONDS:Bonds payable from a specific source of revenue, which do not pledge the full faith, and credit of the issuer. Revenue bonds are payable from identified sources of revenue and do not affect the property tax rate. Pledged revenues may be derived from operation of the financed project, grants, excise, or other specified non-property tax.
RETAINED EARNINGS:Accumulation of net income closed to the balance sheet at the end of the fiscal year. Also known as net assets and used only in the enterprise funds.
SSELF INSURANCE:The retention by an entity of a risk of loss arising out of the ownership of property or from some other cause instead of transferring that risk through the purchase of an insurance policy.
SERVICE LEVELS:Describe the present services provided by a City department and/or division within the department.
SPECIAL REVENUE FUNDS:Established to account for the proceeds of specific revenue sources that are legally restricted to expenditures for specified purposes.
TTAX INCREMENT FINANCING:The collection of the incremental tax increase from economic development of a project area where debt has been issued as part of a Redevelopment Agency.
TAX RATE:The amount of tax levied for each $100 of assessed valuation.
TAX RATE LIMIT:The maximum legal rate at which a municipality may levy a tax. The limit may apply to taxes raised for particular purposes or for general purposes.

AP
PE
ND
IX
FY2019 ANNUAL BUDGET - 213
TAXES:Compulsory charges levied by a government for the purpose of financing services performed for the common benefit. This term does not include specific charges made against particular persons or property for current or permanent benefits such as special assessments. Neither does the term include charges for services rendered only to those paying such charges as sewer services.
TENTATIVE BUDGET:A preliminary budget created for review of Mayor and Council in the first meeting in May of each year. It is to be available for public inspection 10 days before the final adoption of the budget.
TRANSFERS:A term referring to monies moved from one budgetary fund or sub-fund to another. Because of legal or other restrictions, monies collected in one fund may need to be expended in other funds. A transfer is accomplished through Transfers-In (a source of funds) for the recipient fund and an equal Transfer-Out (a use of funds) for the donor fund. When this movement occurs between different funds, it is known as an Inter-fund Transfer. When it occurs between the restricted and unrestricted portions of the same fund, it is known as an Intra-fund Transfer.
UUSER FEES:Charges for specific governmental services. These fees cover the cost of providing that service to the user (e.g., building permits, animal licenses, park fees).
ZZERO -BASE BUDGETING (ZBB):A method of detailed budget analysis and justification that combines elements of management by objectives and program evaluation. It is a vehicle to link management and planning to the budget process. ZBB starts with an examination of an agency’s basic programs and services by the lowest management level, and continues up the organization as funding packages are prioritized at each level in accordance with available resources and desired outcomes. ZBB is a tool for objectively directing the allocation of funds among activities and programs. Its basis is the consideration of the efficiency and effectiveness of activities and programs.